UNITED STATES
SECURITIES AND EXCHANGE COMMISSION
Washington, D.C. 20549
FORM N-CSR
CERTIFIED SHAREHOLDER REPORT OF REGISTERED MANAGEMENT
INVESTMENT COMPANIES
Investment Company Act file number 811-21515
TS&W / Claymore Tax-Advantaged Balanced Fund
(Exact name of registrant as specified in charter)
2455 Corporate West Drive, Lisle, IL 60532
(Address of principal executive offices) (Zip code)
Kevin M. Robinson, Chief Executive Officer
2455 Corporate West Drive, Lisle, IL 60532
(Name and address of agent for service)
Registrant's telephone number, including area code: (630) 505-3700
Date of fiscal year end: December 31
Date of reporting period: January 1, 2010 - December 31, 2010
Form N-CSR is to be used by management investment companies to file reports with the Commission not later than 10 days after the transmission to stockholders of any report that is required to be transmitted to stockholders under Rule 30e-1 under the Investment Company Act of 1940 (17 CFR 270.30e-1). The Commission may use the information provided on Form N-CSR in its regulatory, disclosure review, inspection, and policymaking roles.
A registrant is required to disclose the information specified by Form N-CSR, and the Commission will make this information public. A registrant is not required to respond to the collection of information contained in Form N-CSR unless the Form displays a currently valid Office of Management and Budget ("OMB") control number. Please direct comments concerning the accuracy of the information collection burden estimate and any suggestions for reducing the burden to Secretary, Securities and Exchange Commission, 100 F Street, NE, Washington, DC 20549-0609. The OMB has reviewed this collection of information under the clearance requirements of 44 U.S.C. Section 3507.
Item 1. Reports to Stockholders.
The registrant's annual report transmitted to shareholders pursuant to Rule 30e-1 under the Investment Company Act of 1940, as amended (the “Investment Company Act”) is as follows:
www.guggenheimfunds.com/tyw
... home port for the LATEST,
most up-to-date INFORMATION about the
TS&W/Claymore Tax-Advantaged Balanced Fund
The shareholder report you are reading right now is just the beginning of the story. Online at www.guggenheimfunds.com/tyw, you will find:
| · | Daily, weekly and monthly data on share prices, distributions and more |
| · | Portfolio overviews and performance analyses |
| · | Announcements, press releases and special notices |
| · | Fund and adviser contact information |
Thompson, Siegel &Walmsley LLC, SMC Fixed Income Management, LP and Guggenheim Funds Investment Advisors LLC are continually updating and expanding shareholder information services on the Fund’s website, in an ongoing effort to provide you with the most current information about how your Fund’s assets are managed, and the results of our efforts. It is just one more way we are working to keep you better informed about your investment in the Fund.
2 l Annual Report l December 31, 2010
TYW l TS&W/Claymore Tax-Advantaged Balanced Fund
Dear Shareholder l
We thank you for your investment in the TS&W/Claymore Tax-Advantaged Balanced Fund (the “Fund”).This report covers the Fund’s performance for the fiscal year ended December 31, 2010.
The Fund’s investment objective is to provide a high level of total after-tax return, including attractive tax-advantaged income.The Fund focuses its investments mainly on (i) municipal securities, the interest on which is exempt from regular Federal income tax, and which is not a preference item for purposes of the alternative minimum tax (such securities referred to generally as “municipal securities”) and (ii) common stocks and preferred securities that are eligible to pay dividends which, for individual shareholders, qualify for the long-term capital gains rate.The portfolio is comprised primarily of municipal securities, equity securities, preferred securities, high-yield debt securities and real estate investment trusts.
Guggenheim Funds Investment Advisors, LLC (“Guggenheim Funds” or the “Adviser”), formerly known as Claymore Advisors, LLC (“Claymore”), serves as the Adviser to the Fund, with responsibility for managing the Fund’s overall asset allocation.The name change, effective September 24, 2010, marks the next phase of business integration following the acquisition of Claymore by Guggenheim Partners, LLC (“Guggenheim Partners”), announced on October 15, 2009. Guggenheim Partners is a global diversified financial services firm with more than $100 billion in assets under management and supervision.
Two investment sub-advisers are responsible for day-to-day management of the Fund’s investments.Thompson, Siegel & Walmsley LLC (“TS&W”) manages the Fund’s equity portfolio and other non-municipal income-producing securities.As of December 31, 2010,TS&W managed or supervised approximately $8.0 billion in assets. SMC Fixed Income Management, LP (“SMCFIM”) is responsible for the Fund’s portfolio of municipal bonds.As of December 31, 2010, SMCFIM managed or supervised approximately $1.3 billion in assets. Collectively,TS&W and SMCFIM are also referred to as the “Sub-Advisers.”
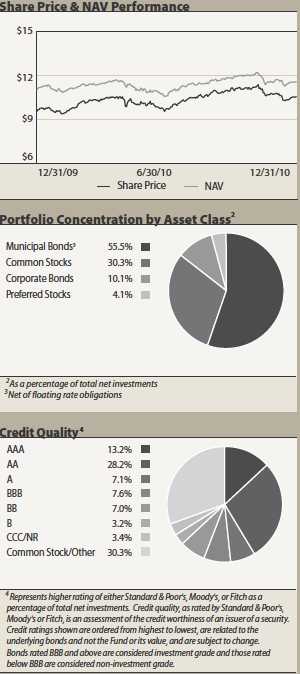
All Fund returns cited—whether based on net asset value (“NAV”) or market price—assume the reinvestment of all distributions. For the 12 months ended December 31, 2010, the Fund provided a total return based on market price of 18.72% and a total return based on NAV of 12.03%.As of December 31, 2010, the Fund’s market price of $10.54 per share represented a discount of 8.67% to its NAV of $11.54 per share.The market value of the Fund’s shares fluctuates from time to time and it may be higher or lower than the Fund’s NAV. Past performance is not a guarantee of future results.
During 2010, the Fund paid quarterly dividends of $0.1800 on March 31 and June 30, and dividends of $0.20 on September 30 and December 31.The most recent dividend represents an annualized distribution rate of 7.59% based on the Fund’s closing market price of $10.54 on December 31, 2010.This translates to a tax-advantaged distribution rate of 10.42% for investors in the 35% federal income tax bracket, based on the 2010 tax characteristics of distributions paid. However, there is no guarantee that this level of income will be maintained.
The Fund from time to time may purchase shares of its common stock in open market or private transactions.The Fund’s Board ofTrustees has authorized the share repurchase program in the belief that share repurchases may at times represent an opportunistic investment option for the Fund. Under the terms of the program, the Fund is authorized to purchase up to 5% of its outstanding common shares in the open market on a quarterly basis, subject to applicable regulatory and legal restrictions and in consideration of certain operational and market factors, including the size of the market price discount to net asset value of the Fund.There is no assurance that the Fund will purchase shares in open market or private transactions.
Annual Report l December 31, 2010 l 3
TYW l TS&W/Claymore Tax-Advantaged Balanced Fund l Dear Shareholder continued
We encourage shareholders to consider the opportunity to reinvest their distributions from the Fund through the Dividend Reinvestment Plan (“DRIP”), which is described in detail on page 31 of the Fund’s annual report.When shares trade at a discount to NAV, the DRIP takes advantage of the discount by reinvesting the quarterly dividend distribution in common shares of the Fund purchased in the market at a price less than NAV. Conversely, when the market price of the Fund’s common shares is at a premium above NAV, the DRIP reinvests participants’ dividends in newly-issued common shares at NAV, subject to an IRS limitation that the purchase price cannot be more than 5% below the market price per share.The DRIP provides a cost-effective means to accumulate additional shares and enjoy the benefits of compounding returns over time. Since the Fund endeavors to maintain a steady quarterly distribution rate, the DRIP effectively provides an income averaging technique, which causes shareholders to accumulate a larger number of Fund shares when the market price is depressed than when the price is higher.
To learn more about the Fund’s performance and investment strategy, we encourage you to read the Questions & Answers section of this report, which begins on page 5.You will find information about what impacted the performance of the Fund during 2010 and the Investment Adviser’s and Sub-Advisers’ views on the market environment.
We appreciate your investment and look forward to serving your investment needs in the future. For the most up-to-date information on your investment, please visit the Fund’s website at www. guggenheimfunds.com/tyw.
Sincerely,
Kevin M. Robinson
Chief Executive Officer
TS&W/ClaymoreTax-Advantage Balanced Fund
4 l Annual Report l December 31, 2010
TYW l TS&W/Claymore Tax-Advantaged Balanced Fund
Questions & Answers l
The TS&W/Claymore Tax-Advantaged Balanced Fund (the “Fund”) is managed jointly by Thompson, Siegel & Walmsley LLC (“TS&W”) and SMC Fixed Income Management, LP (“SMCFIM”).The portfolio management teams apply their specialized experience to different sleeves within the Fund, but work closely with one another to collectively guide the overall operations of the Fund.The individuals named below are responsible for managing the Fund.
Vincent R. Giordano, Portfolio Manager, Managing Member
SMC Fixed Income Management, LP
Mr. Giordano is a Managing Member of SMCFIM. He leads SMCFIM’s municipal fixed-income investment management team and co-manages the Fund’s municipal securities portfolio. Prior to joining SMCFIM, Mr. Giordano was employed by Claymore Advisors, LLC (“Claymore”) and Merrill Lynch. He has more than 30 years of investment experience.
Roberto W. Roffo, Portfolio Manager, Managing Director
SMC Fixed Income Management, LP
Mr. Roffo co-manages the Fund’s municipal securities portfolio. He has more than 15 years of investment management experience focused on the municipal securities market and has worked closely with Mr. Giordano throughout his career. He holds a Bachelor’s Degree from the University of Massachusetts.
Paul A. Ferwerda, CFA, Portfolio Manager, SeniorVice President –Domestic Equity and Research
Thompson, Siegel &Walmsley LLC
Mr. Ferwerda is responsible for the day-to-day management of the Fund’s common stock portfolio. He has been with TS&W for over 20 years and has more than 25 years of investment experience. Mr. Ferwerda has extensive equity research experience within the financial sector and holds an MBA from Duke University.
William M. Bellamy, CFA, Portfolio Manager,Vice President
Thompson, Siegel &Walmsley LLC
Mr. Bellamy joined TS&W in 2002. He has over 20 years of investment industry experience focused on the fixed-income markets. Mr. Bellamy is responsible for managing the Fund’s taxable fixed-income securities. He holds an MBA from Duke University.
In the following interview,TS&W and SMCFIM share their thoughts on the market and discuss the factors that influenced the Fund’s performance for the 12 months ended December 31, 2010.
Please remind us of this Fund’s objective and strategy.
The Fund’s investment objective is to provide a high level of total after-tax return, including attractive tax-advantaged income.The Fund seeks to achieve its objective by investing in a portfolio of assets consisting primarily of (i) municipal securities, the interest on which is exempt from regular Federal income tax, and which is not a preference item for purposes of the alternative minimum tax (such securities referred to generally as “municipal securities”) and (ii) common stocks and preferred securities that are eligible to pay dividends which, for individual shareholders, qualify for the long-term capital gains rate.The portfolio is comprised primarily of municipal securities, equity securities, preferred securities, high-yield debt securities and real estate investment trusts.
How did the Fund perform during 2010?
All Fund returns cited—whether based on net asset value (“NAV”) or market price—assume the reinvestment of all distributions. For the 12 months ended December 31, 2010, the Fund provided a total return based on market price of 18.72% and a total return based on NAV of 12.03%.As of December 31, 2010, the Fund’s market price of $10.54 per share represented a discount of 8.67% to its NAV of $11.54 per share.The market value of the Fund’s shares fluctuates from time to time and it may be higher or lower than the Fund’s NAV. Past performance is not a guarantee of future results.
For NAV performance comparison purposes, the municipal bond market, as measured by the Barclays Capital U.S. Municipal Long Bond Index (“Barclays Municipal Index”), a widely used measure of the municipal bond market as a whole, returned 1.12% for the 12 months ended December 31, 2010.The broad equity market, as measured by the Standard & Poor’s 500 Index (“S&P 500”), returned 15.06%.The high-yield bond market, as measured by the Merrill Lynch HighYield Master II Index (the “HighYield Index”), returned 15.19% for the period, and the Merrill Lynch Fixed Rate Preferred Stock Index returned 13.66%.
The Fund paid quarterly dividends of $0.1800 per share on March 31 and June 30, 2010, and $0.2000 on September 30 and December 31, 2010.The most recent dividend represents an annualized distribution rate of 7.59% based on the Fund’s closing market price of $10.54 on December 31, 2010.
Annual Report l December 31, 2010 l 5
TYW l TS&W/Claymore Tax-Advantaged Balanced Fund l Questions & Answers continued
How are assets allocated among the various asset classes?
The Fund invests at least 50%, and may invest up to 60%, of its total assets in municipal securities.As of December 31, 2010, approximately 55.5% of the Fund’s portfolio was invested in municipal securities. Of the remaining assets in the Fund’s portfolio as of December 31, 2010, approximately 30.3% were invested in equity securities consisting primarily of large-cap dividend-paying stocks, and approximately 14.2% were invested in other taxable income-producing securities, which include but are not limited to high-yield bonds, preferred stocks and real estate investment trusts. From time to time, assets are rebalanced to maintain at least 50% of the Fund’s total assets in municipal securities.
How has the Fund’s leverage strategy affected performance?
The Fund utilizes leverage as part of its investment strategy, to finance the purchase of additional securities that provide increased income and greater appreciation potential to common shareholders than could be achieved from a portfolio that is not leveraged. Of course, leverage results in greater NAV volatility and entails more downside risk than an unleveraged portfolio. Leverage adds to performance only when the cost of leverage is less than the total return generated by investments. During the 12 months ended December 31, 2010, the cost of leverage was less than the return of the Fund’s investments; accordingly, leverage contributed to the Fund’s total return.
As of December 31, 2010, the Fund had $105 million of leverage outstanding in the form of Auction Market Preferred Shares (“AMPSSM”).The Fund has two series of AMPS, one 7-day series and one 28-day series.AMPS holders receive a dividend that is reset every 7 or 28 days, depending on the tranche.1 The broad auction-rate preferred securities market remains essentially frozen, as it has been since February 2008.The auctions for nearly all auction-rate preferred shares, including those issued by the Fund, continue to fail. Investors need to be aware that a failed auction is not a default, nor does it require the redemption of a fund’s auction-rate preferred shares. Provisions in the offering documents of the Fund’s AMPS provide a mechanism to set a maximum rate in the event of a failed auction, and, thus, investors will continue to be entitled to receive dividend payments for holding these AMPS.This maximum rate is determined based upon a multiple of or a spread to LIBOR2, whichever is greater. During 2010, established maximum rates were based on a spread of 125 basis points over the applicable LIBOR rates, with the maximum rates ranging from 1.46% to 1.60%.
There is no guarantee that the Fund’s leverage strategy will be successful, and the Fund’s use of leverage may cause the Fund’s NAV and market price of common shares to be more volatile. Leverage adds value only when the return on securities purchased exceeds the cost of leverage.
The following questions are related to the municipal securities portfolio and are answered by Portfolio Managers Vincent R. Giordano and Roberto W. Roffo, who have managed the municipal securities portfolio since the Fund’s inception.
Please provide an overview of the municipal bond market during the first six months of 2010.
In the Fund’s last annual report, dated December 31, 2009, SMCFIM pointed out that it did not seem reasonable to expect the unusually strong overall performance of municipal bonds in 2009 to be repeated in 2010.As expected, during most of 2010, municipal bonds continued to provide positive returns, but the returns were lower than returns on taxable bonds.
For the 12 months ended December 31, 2010, return of the Barclays Municipal Index, which measures performance of the U.S. municipal market, was 1.12%. For comparison, return of the Barclays Capital U.S.Aggregate Bond Index, which measures performance of the U.S. taxable bond market, was 6.54%, and return of the Barclays U.S.Treasury Index was 5.87%.
A major influence on the market for municipal bonds in 2010 was the creation of taxable municipal securities known as “Build America Bonds” (or “BABs”) by the American Reinvestment and Recovery Act of 2009. BABs are taxable municipal securities issued by state and local governments to finance capital projects such as public schools, roads and public buildings. In contrast to traditional municipal bonds, interest received on BABs is subject to federal income tax and may be subject to state income tax. However, issuers of Direct Payment BABs are eligible to receive a subsidy from the U.S.Treasury of up to 35% of the interest paid on the bonds, allowing such issuers to issue BABs that pay interest rates that are competitive with the rates typically paid by private bond issuers in the taxable fixed-income market.
BABs represented approximately 25% of the municipal bonds issued in 2010.The success of the Build America Bond Program caused a substantial decline in the issuance of long-dated tax
| 1 | The term tranche is used to describe a specific series of AMPS. The Fund has issued two tranches of AMPS. |
| 2 | LIBOR is the interest rate that banks charge one another in the short-term international interbank market. |
| 6 l Annual Report l December 31, 2010 |
TYW l TS&W/Claymore Tax-Advantaged Balanced Fund l Questions & Answers continued
exempt bonds, causing prices to rise and yields to decline on tax-exempt bonds during the year.
In the fourth quarter of 2010, there was a significant sell-off in the tax-exempt segment of the municipal market.There were several reasons for this drop: supply overwhelmed demand in an environment of economic uncertainty; concern about a possible increase in federal tax rates began to surface following the mid-term elections; and, for much of the period, the future of the Build America Bond Program was in doubt because of conflict in the Senate and House of Representatives. Many had hoped that the BAB program would be extended beyond its scheduled expiration date of December 31, 2010, but it was not extended.
How did the municipal bond portion of the Fund perform in this environment, and what decisions drove that performance?
The Fund’s municipal bond portfolio performed exceptionally well during 2010, generating a return of 4.72% on an unlevered basis, and the positive impact of leverage made the total return to investors in the Fund even higher.This return was 350 basis points (3.5 percentage points) higher than the return of the Barclays Municipal Index.There was considerable volatility in the market for municipal bonds during 2010, and that volatility created some opportunities that were very positive for the Fund.
A major reason for the strong performance was the Fund’s positioning with regard to duration. (Duration is a measure of a bond’s price sensitivity to changes in interest rates. It is a weighted average of the times that interest payments and the final return of principal are received.The weights are the amounts of the payments discounted by the yield to maturity of the bond.) Early in the year, duration was shortened in the expectation that interest rates, which were near historic lows, were likely to rise at some point.The duration of the portfolio is approximately seven years, much shorter than the duration of the Barclays Municipal Index, which is approximately 14 years.
At the same time, just in case rates did move a little lower, the income of the portfolio was increased by focusing on bonds with high coupons. In addition, the Fund was under-represented in high yield bonds, which are bonds of lower credit quality, relative to the Barclays Municipal Index.This positioning, with short duration, a high income stream, and minimal representation in lower quality bonds was especially valuable in the fourth quarter, when the municipal bond market weakened significantly and spreads widened.
A major strength of the management team is credit analysis. SMCFIM’s practice of carefully analyzing each bond under consideration has made it possible to achieve a high level of income while also maintaining high credit quality. In a market environment that is challenging for issuers, some bonds have been offered at what might seem to be a higher than normal coupon for reasons that really have little to do with credit quality.A good example is City of Detroit Sewer Disposal bond with a 7.0% coupon maturing in 2027. SMCFIM considers this a very solid underlying credit, since the bonds cover essential services in Detroit and its outskirts, including some very wealthy suburbs. In addition, the bonds are insured by Assured Guaranty, which has a AA credit rating. Just because the issuer is a Detroit entity, and investors mentally connect Detroit with the rust belt and the troubled automotive industry, the 7% coupon was necessary to get the deal done.The portfolio includes a number of bonds with attractive income streams and similar situations.
Most of the bonds in the portfolio performed well.The very few high yield bonds in the portfolio (less than 10% of the municipal bond portion of the portfolio at year end) detracted marginally from performance as spreads widened in the fourth quarter.
How are municipal securities selected for the Fund?
SMCFIM begins by analyzing broad macroeconomic trends and developments affecting the fixed-income markets, including the economic outlook, market conditions and perceived effects on interest rates and yield curves. From there, a bottom-up and top-down analysis is incorporated to help construct a portfolio that SMCFIM believes optimizes federally tax-exempt income while seeking to avoid undue credit risk and market timing risk.While SMCFIM monitors interest rates very closely and acts quickly to adjust the portfolio to changing market rates, positions in the portfolio are not traded in search of incremental gains that could be achieved by active trading based on daily changes in rates. SMCFIM’s proprietary unbiased research makes it possible to identify undervalued sectors that are considered to have the potential for ratings upgrades and capital appreciation; however, there is no guarantee that such events will occur.
What is the outlook for the municipal bond market, and what does this mean for the Fund?
Since interest rates on municipal bonds rose significantly in the fourth quarter of 2010, SMCFIM believes that they will remain in a trading range for the immediate future, with no pronounced
Annual Report l December 31, 2010 l 7
TYW l TS&W/Claymore Tax-Advantaged Balanced Fund l Questions & Answers continued
trend. Overall, it seems likely that rates will rise somewhat over the next 12 months for several reasons.There has been a huge amount of government stimulus, there are many signs of improvement in the economy, and rates still low relative to historic experience. Issuance of tax-exempt bonds is likely to increase in 2011, with issuance concentrated in longer-term bonds, causing yields to rise.The expiration of the BAB program is a further reason that issuance of traditional muni bonds is likely to rise; if some form of a BAB program is re-instituted, that could create further questions about muni bond market trends.
With the Fund’s relatively short duration and high income stream, it is well positioned for the current environment of modest economic growth with slowly rising interest rates. Since bond prices generally move in the opposite directions of interest rates, SMCFIM does not expect that bond prices will move significantly higher.Accordingly, the current focus is on income and increasing the average coupon of the portfolio while maintaining high credit quality.
The Fund’s equity portfolio and taxable fixed-income securities portfolio are managed by TS&W. The following questions are related to those portions of the portfolio and are answered by Portfolio Managers Paul A. Ferwerda and William M. Bellamy.
Please provide an overview of the U.S. equity and high-yield bond markets during 2010.
As the year began, there was a fair amount of enthusiasm, and the rally that started in 2009 continued in the first quarter of the year. Investors exhibited high hopes that the economic recovery was well underway and was becoming more entrenched as the government stimulus had a positive impact.Then in April, sentiment shifted to a more sober view, as investors seemed to lose confidence that there would be a smooth transition from a stimulus-fueled recovery to sustained economic growth driven by the private sector.The considerable uncertainty about the strength of the economy created substantial volatility in capital markets in the second quarter of the year.
Most equity indices reached their low points in early July. In the second half of 2010, there was dramatic improvement in capital markets, as the positive tone of U.S. economic data, along with continued stimulus from both monetary and fiscal policy, bolstered expectations of economic growth.
For the 12-month period ended December 31, 2010, the broad equity market, as measured by the S&P 500, returned 15.06%; this strong return is especially impressive considering that the market was down for the first half of the year.As investors once again embraced risk, small to mid-cap stocks were stronger than large-cap stocks, and growth indices generally performed better than value.
In the bond market, as in the stock market, riskier securities delivered the best performance. Return of the Merrill Lynch HighYield Master II Index, was 15.19%.Within the high yield category, bonds with lower credit ratings generally performed better than higher rated bonds.The Barclays U.S.Aggregate Index, which measures performance of the taxable bond market as a whole, returned 6.54% for the same period, and return of the Barclays U.S.Treasury Index was 5.87% for the 12 months ended December 31, 2010.
Please describe how equity and high-yield securities are selected for the Fund.
TS&W’s investment process is value-driven and team-oriented. On the equity side, a proprietary quantitative valuation model is applied to more than 400 stocks.This directs TS&W’s review process toward companies believed to have the highest expected return potential over a multi-year period.TS&W’s in-house research analysts are responsible for validating the model inputs for companies under their coverage and monitoring them over the holding period. Buys and sells are discussed at weekly research meetings or more frequently as needed.TS&W’s fixed-income team is responsible for overall bond market strategy as well as security selection. In-house analysts are used to support the credit review process.
How did the equity portfolio perform over this period, and what were the main determinants of this performance?
The common equity portion of the portfolio (“equity portfolio”), including some perpetual preferreds, had a return of approximately 15.44% (excluding the effect of leverage) for the 12 months ended December, 2010.This was in line with the Fund’s equity benchmarks, the Russell 1000Value Index, which returned 15.51%, and the S&P 500, which returned 15.06%. Since the equity portfolio is managed with a yield-oriented strategy, it is a considerable accomplishment to capture essentially all of the double-digit return of the benchmarks while also delivering a higher yield.The yield of the equity portion of the portfolio is approximately 3.13% as of December 31, 2010, compared with a yield of 1.81% for the S&P 500.This performance is particularly satisfying considering that the tone of the
8 l Annual Report l December 31, 2010
TYW l TS&W/Claymore Tax-Advantaged Balanced Fund l Questions & Answers continued
market in 2010 was not really in tune with the equity portfolio’s four basic characteristics.
The first of these basic characteristics is dividend yield. Since inception, the equity portfolio has generally had a 95% to 100% yield premium over the S&P 500.Around the middle of 2010, the equity portfolio’s yield premium was lowered a bit in order to take advantage of some growth-oriented opportunities for total return.This decision contributed to return, as the market moved up sharply in the last half of the year. But, in general, it was not a yield-oriented market. However, the Fund’s performance was helped by the fact that the market exhibited no bias against dividends.
The second characteristic is market capitalization.This is a large-capitalization equity portfolio, with a median market capitalization much higher than either the S&P 500 or the Russell 1000 Value Index. In a period of higher performance by smaller capitalization stocks, the equity portfolio’s large-cap bias detracted from performance.
The third characteristic is beta, a measure of sensitivity to broad market trends. Since the Fund’s inception, the equity portfolio’s beta has generally been maintained at .8 to .85, meaning that it could be expected to participate in 80% to 85% of the market’s movements, either up or down. In a strong market, a beta of less than 1.00 means that the portfolio would likely move up less than the market.
The final factor, related to the other three, is that the strong market of the last half of 2010 was more oriented to growth than to value, while the equity portfolio, with its focus on dividends, is more oriented to value.
The equity portfolio’s performance benefited from sector selection, particularly underweights relative to the S&P 500 in technology and utilities. In the communication and industrials sectors, performance benefited from some good timing of moves into and out of certain securities.
The equity portfolio has a significant position in health care, largely because it is a relatively stable sector with good yield characteristics. Despite the passage of the health care act, which removed some of the uncertainty that had been plaguing this sector, health care did not perform very well, and that hurt the portfolio’s performance.
Positioning with regard to the consumer discretionary sector was also negative.This is a sector that is generally highly sensitive to market movements, and most of the stocks do not pay high dividends.Accordingly, the equity portfolio has been underweight consumer discretionary for most of its history.This underweight was negative for performance as consumer discretionary stocks performed well in the last half of 2010.
Positioning in the energy sector had a mixed effect on the equity portfolio’s performance.An overweight position in the sector contributed to performance, but the single biggest detractor from performance was a large position in BP PLC (not held in the portfolio at period end), an international oil company that is now known for the massive oil spill in the Gulf of Mexico and its missteps in handling the aftermath of the spill.Also negative was a position in Noble Corp. (not held in the portfolio at period end), an offshore drilling company that had nothing to do with the oil spill disaster, although the drilling moratorium will have some impact. Both of these stocks were sold, with the proceeds invested in other energy companies.Three energy positions were among the top five performers in the portfolio: Royal Dutch Shell PLC and Chevron Corp, both of which are large international oil companies; and National OilwellVarco, Inc., a provider of drilling equipment (1.2%, 0.8% and 0.7% of total net investments).
Other holdings that contributed strongly to performance include economically sensitive companies, as forecasts of an acceleration in economic growth began to emerge.These include Siemens AG, an integrated technology company; General Electric Co., a diversified technology, media and financial services company; E. I. du Pont de Nemours and Co., a diversified chemical company; and Freeport-McMoRan Copper & Gold Inc., a mining company (0.5%, 1.0%, 0.7% and 0.2% of total net investments). In the financial sector, a top contributor was MetLife, Inc., a life insurance company that also provided some additional exposure to the equity market (1.2% of total net investments).
How did the portfolio’s high-yield bonds and preferred stocks perform?
As the high-yield bond market continued to recover, this portion of the Fund’s portfolio had a return of 14.06% in 2010, below the 15.19% return of the HighYield Index. Since this portion of the portfolio includes both high yield bonds and preferred stock (the “high yield portfolio”), a blended benchmark which is 67% the HighYield Index and 33% the Merrill Lynch U.S Fixed Rate Preferred Stock Index (the “Preferred Index”) is helpful in
Annual Report l December 31, 2010 l 9
TYW l TS&W/Claymore Tax-Advantaged Balanced Fund l Questions & Answers continued
evaluating performance.The Preferred Index returned 13.66% for the six-month period, and the return of the blended benchmark was 14.67%.
While the high yield portfolio’s return was very close to that of the blended benchmark, the slight underperformance resulted mainly from a bias toward higher quality during a period when lower rated credits generally performed better than higher rated issues.This was the case with both high yield bonds and preferred stocks.While it is always desirable to outperform the benchmark, TS&W is more concerned about being confident that the holdings in the high yield portfolio have the financial strength and staying power to pay the interest and principal than about short-term performance.
Among the better performing holdings were some of the higher yielding names such as Netflix, Inc. (0.2% of total net investments), a movie subscription service, and auto manufacturer Ford Motor Co. (not held in the portfolio at period end). Other important contributors were REIT (real estate investment trust) preferreds such as Brandywine Realty Trust, CBL & Associates Properties, Inc., Capital Automotive REIT and First Industrial Realty Trust, Inc. (0.2%, 0.1%, 0.1% and less than 0.1% of total net investments, respectively).
The only major negative in the high yield portfolio was a bond of Dean Foods Co., a processor and distributor of dairy products (0.2% of total net investments).This bond performed poorly after the company announced pressure from higher input costs and lower sales volume. On the positive side, the high yield portfolio’s position in this bond was reduced by about 1/3 the week before this announcement was made.
What is the outlook for the equity and high-yield markets in the months ahead, and what is the portfolio’s strategy for that outlook?
Among the most positive trends for the equity portfolio and high yield portfolio are recent dividend increases. In many cases, companies are just restoring dividends that were cut during the recession of 2008 and 2009, but the increases also reflect cash balances that companies have been able to build over the past two years. General Electric is a perfect example of this kind of activity. Other companies, such as technology leader Microsoft Corp. (1.0% of total net investments) are adopting new higher payout policies. Based on forecasts of 2011 earnings for the S&P 500, the current payout level is low relative to history, and that bodes well for further increases during 2011.
Among high yield issuers, balance sheets are generally healthy and that is positive for future performance.With yields on U.S. Treasury securities still near historic lows, investors are likely to look to high yield securities for income.
With an improving economy and the prospect of dividend increases and the ability of companies to refinance their balance sheets as needed, conditions are generally positive for the equity portfolio and high yield portfolio, and TS&W believes it is well positioned to take advantage of these conditions.
Index Definitions
Indices are unmanaged and it is not possible to invest directly in an index.
Barclays Capital U.S. Municipal Long Bond Index is a rules-based, market-value-weighted index engineered for the long-term (22+ years) tax-exempt bond market.
The S&P 500 is an unmanaged, capitalization-weighted index of 500 stocks.The index is designed to measure performance of the broad domestic economy through changes in the aggregate market value of 500 stocks representing all major industries.
The Merrill Lynch HighYield Master II Index is a commonly used benchmark index for high yield corporate bonds and is a measure of the broad high yield market.
The Merrill Lynch Fixed Rate Preferred Securities Index is designed to replicate the total return of a diversified group of investment-grade preferred securities.The Index is rebalanced on a monthly basis.
Russell 1000® Growth Index measures the performance of the 1,000 largest companies in the Russell 3000 Index, which represents approximately 92% of the total market capitalization of the Russell 3000 Index. Russell 2000® Index measures the performance of the 2,000 smallest companies in the Russell 3000 Index, which represents approximately 8% of the total market capitalization of the Russell 3000 Index.
The Russell 1000®Value Index measures the performance of those Russell 1000 companies with lower price-to-book ratios and lower forecasted growth values, while the Russell 1000 Growth Index measures the performance of those Russell 1000 companies with higher price-to-book ratios and higher forecasted growth values.
10 l Annual Report l December 31, 2010
TYW l TS&W/Claymore Tax-Advantaged Balanced Fund l Questions & Answers continued
Barclays Capital U.S. Government Bond/Credit Index measures performance of U.S. dollar denominated U.S.Treasuries, government-related, and investment grade U.S. corporate securities that have a remaining maturity of greater than or equal to 1 year. In Addition, the securities have $250 million or more of outstanding face value, and must be fixed rate and non-convertible.
Barclays U.S.Aggregate Bond Index represents securities that are U.S. domestic, taxable, and dollar denominated.The index covers the U.S. investment grade fixed rate bond market, with index components for government and corporate securities, mortgage pass-through securities, and asset-backed securities.
Barclays U.S. Corporate HighYield Index is comprised of issues that meet the following criteria: at least $150 million par value outstanding, maximum credit rating of Ba1 (including defaulted issues) and at least one year to maturity.
TYW Risks and Other Considerations
The views expressed in this report reflect those of the portfolio managers only through the report period as stated on the cover. These views are subject to change at any time, based on market and other conditions and should not be construed as a recommendation of any kind.The material may also include forward looking statements that involve risk and uncertainty, and there is no guarantee that any predictions will come to pass.There can be no assurance that the Fund will achieve its investment objectives. The value of the Fund will fluctuate with the value of the underlying securities. Historically, closed-end funds often trade at a discount to their net asset value. There can be no assurance that the Fund will achieve its investment objective. The value of the Fund will fluctuate with the value of the underlying securities. Historically, closed-end funds often trade at a discount to their net asset value. The Fund is subject to investment risk, including the possible loss of the entire amount that you invest.
Municipal Securities Market Risk. The yields on and market prices of municipal securities are dependent on a variety of factors, including general conditions of the municipal securities market, the size of a particular offering, the maturity of the obligation and the rating of the issue. The value of outstanding municipal securities will vary as a result of changing evaluations of the ability of their issuers to meet interest and principal payments. Such values will also change in response to changes in the interest rates payable on new issues of municipal securities and changes in general interest rate levels. Changes in the value of the municipal securities held in the Fund’s portfolio arising from these or other factors will cause changes in the Fund’s net asset value per share.
Income and Interest Rate Risk. The income shareholders receive from the Fund is based primarily on the dividends and interest earned by the Fund from its investments, which can vary widely over the short and long term. The dividend income from the Fund’s investment in equity securities will be influenced by both general economic activity and issuer-specific factors. In the event of a recession or adverse events effecting a specific industry or issuer, the issuers of the common stocks held by the Fund may reduce the dividends paid on such common stocks. Interest rate risk is the risk that municipal securities and other debt (and, in certain cases, equity) securities in which the Fund invests (and the Fund’s net assets) will decline in value because of changes in interest rates.
Lower Grade Securities. Investment in fixed income securities of below-investment grade quality (commonly known as“Junk bonds”) involves substantial risk of loss.They are considered predominantly speculative with respect to the issuer’s ability to pay interest and repay principal and are susceptible to default or decline in market value due to adverse economic and business developments. Debt securities in the lowest investment grade category may also be considered to have speculative characteristics by certain ratings agencies.The market values for fixed income securities of below investment grade quality tend to be more volatile, and these securities are less liquid, than investment grade debt securities.
Common Stock Risk. The common stocks and other equity securities in which the Fund invests may experience substantial volatility in their market value. Although common stocks typically provide higher returns than debt securities, they are also more susceptible to adverse changes in market value due to issuer-specific events. The market values of common stocks are also sensitive to changes in investor perceptions as well as general movements in the equities markets.
State Concentration Risk. To the extent the Fund concentrates its investments in a particular state’s municipal bonds, the Fund may be significantly impacted by political, economic, or regulatory developments that affect issuers and their ability to pay principal and interest on their obligations. The information below was obtained from publicly available official documents and statements and has not been independently verified by the Fund. Recent broad-based market declines and volatility may have a significant adverse effect on the state’s economy. To the extent that industries which account for significant portions of the state’s economy are affected to a greater extent than the broader market, the state’s economy may be more adversely affected. As a result, recent market and economic developments may adversely affect municipal securities of state’s issuers. The information below is intended only as a general summary and is not intended as a discussion of any specific factor that may affect any particular obligation or issuer.
Leverage Risk. Certain risks are associated with the leveraging of common stock. Both the net asset value and the market value of shares of common stock may be subject to higher volatility and a decline in value.
AMPS Risk. There also risks associated with investing in Auction Market Preferred Shares or AMPS. The AMPS are redeemable, in whole or in part, at the option of the Fund on any dividend payment date for the AMPS, and will be subject to mandatory redemption in certain circumstances. The AMPS will not be listed on an exchange. You may only buy or sell AMPS through an order placed at an auction with or through a broker-dealer that has entered into an agreement with the auction agent and the Fund or in a secondary market maintained by certain broker dealers.These broker-dealers are not required to maintain this market, and it may not provide you with liquidity. The broad auction-rate preferred securities market, including the Fund’s AMPS, has experienced considerable disruption since February 2008.The result has
Annual Report l December 31, 2010 l 11
TYW l TS&W/Claymore Tax-Advantaged Balanced Fund l Questions & Answers continued
been failed auctions on nearly all auction-rate preferred shares, including the Fund’s AMPS. A failed auction is not a default, nor does it require the redemption of the Fund’s AMPS. Provisions on the offering documents of the Fund’s AMPS provide a mechanism to set a maximum rate in the event of a failed auction.The maximum rate is LIBOR + 1.25% or LIBOR x 125%, whichever is greater.
Equity Risk. A principal risk of investing in the Fund is equity risk, which is the risk that the value of the securities held by the Fund will fall due to general market and economic conditions, perceptions regarding the industries in which the issuers of securities held by the Fund participate, or factors relating to specific companies in which the Fund invests. For example, an adverse event, such as an unfavorable earnings report, may depress the value of equity securities of an issuer held by the Fund; the price of common stock of an issuer may be particularly sensitive to general movements in the stock market; or a drop in the stock market may depress the price of most or all of the common stocks and other equity securities held by the Fund. In addition, common stock of an issuer in the Fund’s portfolio may decline in price if the issuer fails to make anticipated dividend payments because, among other reasons, the issuer of the security experiences a decline in its financial condition. Common stock is subordinated to preferred stocks, bonds and other debt instruments in a company’s capital structure, in terms of priority to corporate income, and therefore will be subject to greater dividend risk than preferred stocks or debt instruments of such issuers. In addition, while broad market measures of common stocks have historically generated higher average returns than fixed income securities, common stocks have also experienced significantly more volatility in those returns.
Preferred Securities RiskThese securities are inherently more risky than the bonds and other debt instruments of the issuer, but typically less risky than its common stock. They may be significantly less liquid than many other securities, such as U.S. Government securities, corporate debt and common stock.
Taxable Debt Securities.The value of debt securities, including corporate debt securities, can be expected to vary inversely with interest rates. Income payments received by the Fund on debt securities will not be eligible for treatment as tax-qualified dividends.
High Yield Risk: Funds that invest in high yield securities and unrated securities of similar credit quality (commonly known as“junk bonds”) may be subject to greater levels of credit and liquidity risk than funds that do not invest in such securities.These securities are considered predominately speculative with respect to the issuer’s continuing ability to make principal and interest payments. An economic downturn or period of rising interest rates could adversely affect the market for these securities and reduce the fund’s ability to sell these securities. If the issuer of a security is in default with respect to interest or principal payments, the fund may lose its entire investment.
In addition to the risks described above, the Fund is also subject to: Investment Risk, Common Share Market Risk, Tax Risk, Credit Risk, Geographical and Sector Risk, Interest Rate and Hedging Transactions Risk, Value Investing Risk, Illiquid Investments Risk, Foreign Securities Risk, Small- and Medium-Sized Company Risk, Fund Distribution Risk, Market Discount Risk, Portfolio Turnover, and Current Developments. Please see www.guggenheimfunds.com/tyw for a more detailed discussion about Fund risks and considerations.
12 l Annual Report l December 31, 2010
TYW l TS&W/Claymore Tax-Advantaged Balanced Fund
Fund Summary l As of December 31, 2010 (unaudited)
| Fund Statistics | | |
| Share Price | | $10.54 |
| Common Share Net Asset Value | | $11.54 |
| Premium/(Discount) to NAV | | -8.67% |
| Net Asset Applicable to Common Shareholders ($000) | $177,868 |
| Total Returns | | |
| (Inception 4/28/04) | Market | NAV |
| One Year | 18.72% | 12.03% |
| Three Year - average annual | 1.74% | -0.59% |
| Five Year - average annual | 3.85% | 1.81% |
| Since Inception - average annual | 2.63% | 3.91% |
| Top Ten Holdings | % of Total |
Municipal Portfolio1 | Net Investments |
| Hudson County Improvement Authority Revenue Refunding | |
| Solid Waste System, County Guaranteed, | |
| Series A, NR, Aa3, 6.00%, 1/1/2040 | 3.6% |
| Frisco Texas Independent School District School Improvements, | |
| Series A, PSF Guaranteed, NR, Aaa, 6.00%, 8/15/2038 | 2.7% |
| State of California, Refunding General Obligation Note, AAA, A1 | |
| 5.25%, 12/1/2033 (Prerefunded @ 6/1/14) | 2.6% |
| Birmingham Special Care Facilities Financing Authority | |
| Health Care Facilities Revenue, ASSURED Insured, AA+, | |
| Aa3, 6.00%, 6/1/2039 | 2.6% |
| Forney Independent School District Unlimited Tax School | |
| Building Bonds, Series A, PSF Guaranteed, AAA, NR, | |
| 6.00%, 8/15/2037 | 2.5% |
| Detroit Michigan Sewer Disposal Revenue Rols RR II R 11841-1, | |
| AGM Insured, AA+, NR, 6.67%, 7/1/2017 | 2.3% |
| Rhode Island State Health & Educational Building Corp. | |
| Revenue Hospital Financing Lifespan Obligation, | |
| ASSURED Insured, Series A, AA+, NR, 11.24%, 5/15/2017 | 2.3% |
| Louisiana State Citizens Property Insurance Corp. | |
| Assessment Revenue Series C-2-RMKT, ASSURED Insured, | |
| AA+, Aa3, 6.75%, 6/1/2026 | 2.0% |
| Detroit Michigan Sewer Disposal Revenue Refunding-Senior | |
| Lien-Series C-1-RMKT, AGM Insured, AA+, Aa3, 7.00%, | |
| 7/1/2027 | 2.0% |
| Metropolitan Transportation Authority Revenue Transportation - |
| Series 2008C, A, A2, 6.50%, 11/15/2028 | 1.9% |
1 Excludes short-term | |
| Top Ten Holdings | % of Total |
| Equity and Income Portfolio | Net Investments |
| ITT Corp. | 1.2% |
| Royal Dutch Shell PLC, ADR - Class B (United Kingdom) | 1.2% |
| AT&T, Inc. | 1.2% |
| MetLife, Inc. | 1.2% |
| Pfizer, Inc. | 1.1% |
| JPMorgan Chase & Co. | 1.1% |
| Target Corp. | 1.0% |
| Microsoft Corp. | 1.0% |
| Intel Corp. | 1.0% |
| Travelers Cos., Inc. | 1.0% |
Securities and holdings are subject to change daily. For more current information, please visit www.guggenheimfunds.com/tyw.The above summaries are provided for informational purposes only and should not be viewed as recommendations. Past performance does not guarantee future results.
| | % of Total |
| Top Ten Sectors | Net Investments |
| Health Care | 11.0% |
| General Obligation | 10.4% |
| Water & Sewer | 9.4% |
| Special Tax | 5.6% |
| Oil & Gas | 5.1% |
| Telecommunications | 4.9% |
| Higher Education | 4.4% |
| Diversified Financial Services | 4.1% |
| Insurance | 3.9% |
| Pharmaceuticals | 3.9% |
Annual Report l December 31, 2010 l 13
TYW l TS&W/Claymore Tax-Advantaged Balanced Fund
Portfolio of Investments l December 31, 2010
| | | | | |
| Principal | | | Optional Call | |
| Amount | | Description | Provisions* | Value |
| | | Long-Term Municipal Bonds — 92.6% | |
| | | Alabama — 4.1% | | |
| $ 7,000,000 | | Birmingham Special Care Facilities Financing Authority, | | |
| | | Health Care Facilities Revenue, ASSURED Insured, AA+, Aa3 | |
| | | 6.00%, 6/1/2039 | 6/1/19 @ 100.00 | $ 7,351,190 |
| | | Arizona — 1.8% | | |
| 3,000,000 | | Glendale Western Loop 101, Public Facilities Corp., | | |
| | | Third Lien Excise Tax Revenue, Series A, AA, A1 | | |
| | | 7.00%, 7/1/2033 | 1/1/14 @ 100.00 | 3,153,330 |
| | | California — 8.9% | | |
| 4,395,000 | | Alhambra Certificates of Participation, | | |
| | | Police Facilities 91-1-RMK, AMBAC Insured, NR, NR | | |
| | | 6.75%, 9/1/2023 | N/A | 4,964,724 |
| 2,000,000 | | California Statewide Communities Development Authority, | |
| | | American Baptist Homes West, BBB-, NR | | |
| | | 6.25%, 10/1/2039 | 10/1/19 @ 100.00 | 1,878,360 |
| 4,600,000 | | Manhattan Beach California Unified School District, | | |
| | | Capital Appreciation-Election 2008, Series B, AA, Aa2 | | |
| | | 6.50%, 9/1/2045 (a) | 9/1/35 @ 100.00 | 1,476,232 |
| 6,670,000 | | State of California, Refunding General Obligation Note, | | |
| | | AAA, A1, 5.25%, 12/1/2033 | | |
| | | (Prerefunded @ 6/1/14) (b) | 6/1/14 @ 100.00 | 7,572,785 |
| | | | | 15,892,101 |
| | | Connecticut — 1.2% | | |
| 2,075,000 | | Connecticut State Health & Educational Facility Authority Revenue, | |
| | | Yale University, Series A-2, AAA, Aaa | | |
| | | 5.00%, 7/1/2040 | 7/1/18 @ 100.00 | 2,117,911 |
| | | District of Columbia — 3.0% | | |
| 5,000,000 | | District of Columbia Water & Sewer Authority, | | |
| | | Public Utility Revenue, Series A, AA, Aa2 | | |
| | | 6.00%, 10/1/2035 | 10/1/18 @ 100.00 | 5,407,600 |
| | | Kentucky — 1.1% | | |
| 2,000,000 | | Kentucky Economic Development Finance Authority, | | |
| | | Owensboro Medical Health System, Series B, NR, Baa2 | | |
| | | 6.375%, 3/1/2040 | 6/1/20 @ 100.00 | 1,975,000 |
| | | Louisiana — 3.2% | | |
| 4,980,000 | | Louisiana State Citizens Property Insurance Corp. Assessment Revenue, | |
| | | Series C-2-RMKT, ASSURED Insured, AA+, Aa3 | | |
| | | 6.75%, 6/1/2026 | 6/1/18 @ 100.00 | 5,632,131 |
| | | Massachusetts — 3.2% | | |
| 2,000,000 | | Massachusetts Development Finance Agency Revenue, | | |
| | | Harvard University, Series B-1, AAA, Aaa | | |
| | | 5.00%, 10/15/2040 | 10/15/20 @ 100.00 | 2,051,240 |
| 3,500,000 | | Massachusetts Health and Education Facilities Authority Revenue, | |
| | | Harvard University, Series B, AAA, Aaa | | |
| | | 5.00%, 10/1/2038 | 10/1/17 @ 100.00 | 3,561,915 |
| | | | | 5,613,155 |
| | | | | |
| Principal | | | Optional Call | |
| Amount | | Description | Provisions* | Value |
| | | Michigan — 15.1% | | |
| $ 5,150,000 | | Detroit Michigan Sewer Disposal Revenue, | | |
| | | Rols RR II R 11841-1, AGM Insured, AA+, NR | | |
| | | (Underlying Obligor: Detroit Michigan Sewer Disposal) | | |
| | | 6.67%, 7/1/2017 (c) | N/A | $ 6,726,518 |
| 5,000,000 | | Detroit Michigan Sewer Disposal Revenue, | | |
| | | Refunding-Senior Lien-Series C-1-RMKT, AGM Insured, AA+, Aa3 | |
| | | 7.00%, 7/1/2027 | 7/1/19 @ 100.00 | 5,630,300 |
| 5,000,000 | | Detroit Michigan Water Supply System Revenue, | | |
| | | Refunding-Senior Lien-Series C-RMKT, BHAC/FGIC Insured, AA+, Aa1 | |
| | | 5.75%, 7/1/2026 | 7/1/18 @ 100.00 | 5,216,300 |
| 2,265,000 | | Detroit Michigan Water Supply System Revenue, | | |
| | | Second Lien-Series B-RMKT, AGM Insured, AA+, NR | | |
| | | 7.00%, 7/1/2036 | 7/1/19 @ 100.00 | 2,537,298 |
| 4,000,000 | | Michigan Finance Authority Educational Facility Revenue, | |
| | | Senior Lien, St. Catherine Siena, Series A, NR, NR | | |
| | | 8.50%, 10/1/2045 | 10/1/19 @ 100.00 | 4,252,520 |
| 2,500,000 | | Michigan Public Educational Facilities Authority Revenue, | |
| | | Refunding-Limited, Obligation-Landmark Academy, BBB-, NR | |
| | | 7.00%, 12/1/2039 | 6/1/20 @ 100.00 | 2,415,800 |
| | | | | 26,778,736 |
| | | New Jersey — 8.4% | | |
| 10,000,000 | | Hudson County Improvement Authority Revenue, | | |
| | | Refunding Solid Waste System, County Guaranteed, Series A, NR, Aa3 | |
| | | 6.00%, 1/1/2040 | 1/1/20 @ 100.00 | 10,344,000 |
| 4,150,000 | | Newark Housing Authority Revenue, | | |
| | | South Ward Police Facility, ASSURED Insured, NR, Aa3 | | |
| | | 6.75%, 12/1/2038 | 12/1/19 @ 100.00 | 4,613,472 |
| | | | | 14,957,472 |
| | | New York — 19.5% | | |
| 3,000,000 | | Long Island Power Authority Revenue, | | |
| | | Electrical Light and Power Improvements, Series A, A-, A3 | |
| | | 6.25%, 4/1/2033 | 4/1/19 @ 100.00 | 3,240,180 |
| 5,000,000 | | Metropolitan Transportation Authority Revenue, | | |
| | | Transportation, Series 2008C, A, A2 | | |
| | | 6.50%, 11/15/2028 | 11/15/18 @ 100.00 | 5,530,750 |
| 2,000,000 | | New York Liberty Development Corp. Revenue, | | |
| | | Refunding Bonds - 2nd Priority - Bank of America, BBB-, NR | |
| | | 6.375%, 7/15/2049 | 1/15/20 @ 100.00 | 2,050,000 |
| 5,000,000 | | New York State Dormitory Authority Income Tax Revenue, | |
| | | PIT Education, Series B, AAA, NR | | |
| | | 5.75%, 3/15/2036 | 3/15/19 @ 100.00 | 5,339,600 |
| 1,000,000 | | New York State Dormitory Authority Revenue, | | |
| | | The Bronx-Lebanon Hospital Center, NR, Aa2 | | |
| | | 6.50%, 8/15/2030 | 2/15/19 @ 100.00 | 1,078,980 |
| 2,500,000 | | New York State Dormitory Authority Revenue, | | |
| | | The New School, AGM Insured, AA+, Aa3 | | |
| | | 5.50%, 7/1/2043 | 7/1/20 @ 100.00 | 2,514,700 |
See notes to financial statements.
14 l Annual Report l December 31, 2010
TYW l TS&W/Claymore Tax-Advantaged Balanced Fund l Portfolio of Investments continued
| | | | | |
| Principal | | | Optional Call | |
| Amount | | Description | Provisions* | Value |
| | | New York (continued) | | |
| | | New York State Dormitory Authority Revenue, Health, | | |
| | | Hospital & Nursing Home Improvements, FHA, AAA, Aa2 | | |
| $ 4,500,000 | | 6.25%, 8/15/2034 | 8/15/19 @ 100.00 | $ 4,840,830 |
| 2,500,000 | | 6.00%, 8/15/2038 | 8/15/19 @ 100.00 | 2,628,525 |
| 2,220,000 | | New York State Dormitory Authority Revenue, | | |
| | | School Districts Financing Program, ASSURED Insured, | | |
| | | Series A, AA+, Aa3 5.625%, 10/1/2029 | 10/1/19 @ 100.00 | 2,298,077 |
| 5,000,000 | | Port Authority of New York & New Jersey, | | |
| | | Special Obligation Revenue JFK International Airport Terminal, | |
| | | BBB-, Baa3 6.50%, 12/1/2028 | 12/1/15 @ 100.00 | 5,179,050 |
| | | | | 34,700,692 |
| | | Pennsylvania — 0.9% | | |
| 2,500,000 | | Allegheny County Hospital Development Authority | | |
| | | Health System Revenue, West Penn, Series 2007A, BB-, B1 | |
| | | 5.375%, 11/15/2040 | 11/15/17 @ 100.00 | 1,676,500 |
| | | Puerto Rico — 2.4% | | |
| 2,000,000 | | Puerto Rico Sales Tax Financing Revenue, | | |
| | | Public Improvements, First Sub-Series A, A+, A1 | | |
| | | 6.00%, 8/1/2042 | 8/1/19 @ 100.00 | 2,038,800 |
| 2,000,000 | | Puerto Rico Sales Tax Financing Revenue, | | |
| | | Public Improvements, First Sub-Series C, A+, A1 | | |
| | | 6.50%, 8/1/2035 | 8/1/20 @ 100.00 | 2,175,280 |
| | | | | 4,214,080 |
| | | Rhode Island — 4.1% | | |
| 5,500,000 | | Rhode Island State Health & Educational Building Corp. Revenue, Hospital Financing Lifespan Obligation, ASSURED Insured, Series A, AA+, NR (Underlying Obligor: Rhode Island State Health and Educational Building Corp.) | |
| | | 11.24%, 5/15/2017 (c) | N/A | 6,707,910 |
| 500,000 | | Rhode Island State Health & Educational Building Corp. Revenue, | |
| | | Hospital Financing Lifespan Obligation, A-, A3 | | |
| | | 6.375%, 8/15/2021 | 8/15/12 @ 100.00 | 512,115 |
| | | | | 7,220,025 |
| | | South Carolina — 0.8% | | |
| 1,535,000 | | City of Spartanburg South Carolina Revenue, | | |
| | | Waterworks, ASSURED Insured, AA+, Aa3 | | |
| | | 5.00%, 6/1/2039 | 6/1/19 @ 100.00 | 1,512,036 |
| | | Texas — 12.0% | | |
| 6,700,000 | | Forney Independent School District, | | |
| | | Unlimited Tax School Building Bonds, Series A, PSF Guaranteed, AAA, NR | |
| | | 6.00%, 8/15/2037 (d) | N/A | 7,303,804 |
| 7,000,000 | | Frisco Texas Independent School District, | | |
| | | School Improvements, Series A, PSF Guaranteed, NR, Aaa | |
| | | 6.00%, 8/15/2038 (d) | N/A | 7,630,700 |
| 1,200,000 | | North Texas Tollway Authority Revenue, | | |
| | | Refunding Bonds - 1st Tier, Series A, BHAC Insured, AA+, Aa1 | |
| | | 5.75%, 1/1/2040 | 1/1/18 @ 100.00 | 1,226,316 |
| | | | | |
| Principal | | | Optional Call | |
| Amount | | Description | Provisions* | Value |
| | | Texas (continued) | | |
| $ 5,000,000 | | North Texas Tollway Authority Revenue, | | |
| | | Rols RR II R-11392-1, BHAC Insured, NR, Aa1 | | |
| | | (Underlying Obligor: North Texas Tollway Authority) | | |
| | | 4.96%, 1/1/2016 (c) | N/A | $ 5,219,300 |
| | | | | 21,380,120 |
| | | West Virginia — 1.4% | | |
| 2,500,000 | | West Virginia Higher Education Policy Commission Revenue, | |
| | | Higher Education Facility, Series A, A+, Aa3 | | |
| | | 5.00%, 4/1/2026 | 4/1/20 @ 100.00 | 2,497,175 |
| | | Wisconsin — 1.5% | | |
| 1,930,000 | | Wisconsin State Health & Educational Facilities Authority Revenue, | |
| | | Aurora Health Care, Series A, NR, A3 | | |
| | | 5.60%, 2/15/2029 | 2/4/11 @ 100.00 | 1,910,372 |
| 750,000 | | Wisconsin State Health & Educational Facilities Authority Revenue, | |
| | | Blood Center Southeastern Project, A-, NR | | |
| | | 5.75%, 6/1/2034 | 6/1/14 @ 100.00 | 752,258 |
| | | | | 2,662,630 |
| | | Total Long-Term Municipal Bonds — 92.6% | | |
| | | (Cost $161,997,810) | | 164,741,884 |
| Number | | | | |
| of Shares | | | | Value |
| | | Common Stocks — 49.0% | | |
| | | Aerospace & Defense — 2.6% | | |
| 15,000 | | General Dynamics Corp. | | 1,064,400 |
| 67,500 | | ITT Corp. | | 3,517,425 |
| | | | | 4,581,825 |
| | | Capital Markets — 0.9% | | |
| 10,000 | | Goldman Sachs Group, Inc. (The) | | 1,681,600 |
| | | Chemicals — 1.1% | | |
| 40,000 | | EI du Pont de Nemours & Co. | | 1,995,200 |
| | | Commercial Banks — 0.7% | | |
| 37,500 | | Wells Fargo & Co. | | 1,162,125 |
| | | Commercial Services & Supplies — 0.3% | | |
| 30,000 | | RR Donnelley & Sons Co. | | 524,100 |
| | | Communications Equipment — 1.1% | | |
| 100,000 | | Cisco Systems, Inc. (e) | | 2,023,000 |
| | | Diversified Financial Services — 2.3% | | |
| 200,000 | | Citigroup, Inc. (e) | | 946,000 |
| 75,000 | | JPMorgan Chase & Co. | | 3,181,500 |
| | | | | 4,127,500 |
See notes to financial statements.
Annual Report l December 31, 2010 l 15
TYW l TS&W/Claymore Tax-Advantaged Balanced Fund l Portfolio of Investments continued
| | | | |
| Number | | | |
| of Shares | | Description | Value |
| | | Diversified Telecommunication — 4.0% | |
| 115,000 | | AT&T, Inc. | $ 3,378,700 |
| 42,500 | | BCE, Inc. (Canada) | 1,507,050 |
| 60,000 | | Verizon Communications, Inc. | 2,146,800 |
| | | | 7,032,550 |
| | | Electronic Equipment & Instruments — 1.9% | |
| 100,000 | | Corning, Inc. | 1,932,000 |
| 75,000 | | Jabil Circuit, Inc. | 1,506,750 |
| | | | 3,438,750 |
| | | Energy Equipment & Services — 1.1% | |
| 30,000 | | National Oilwell Varco, Inc. | 2,017,500 |
| | | Food Products — 1.6% | |
| 50,000 | | Kraft Foods, Inc. - Class A | 1,575,500 |
| 40,000 | | Unilever NV (Netherlands) | 1,256,000 |
| | | | 2,831,500 |
| | | Hotels, Restaurants & Leisure — 0.3% | |
| 10,000 | | Darden Restaurants, Inc. | 464,400 |
| | | Household Products — 1.0% | |
| 28,500 | | Kimberly-Clark Corp. | 1,796,640 |
| | | Industrial Conglomerates — 2.4% | |
| 150,000 | | General Electric Co. | 2,743,500 |
| 12,500 | | Siemens AG, ADR (Germany) | 1,553,125 |
| | | | 4,296,625 |
| | | Insurance — 4.0% | |
| 37,500 | | Hartford Financial Services Group, Inc. | 993,375 |
| 75,000 | | MetLife, Inc. | 3,333,000 |
| 50,000 | | Travelers Cos., Inc. (The) | 2,785,500 |
| | | | 7,111,875 |
| | | Metals & Mining — 0.4% | |
| 5,000 | | Freeport-McMoRan Copper & Gold, Inc. | 600,450 |
| | | Multiline Retail — 1.7% | |
| 50,000 | | Target Corp. | 3,006,500 |
| | | Multi-Utilities — 0.8% | |
| 67,500 | | Centerpoint Energy, Inc. | 1,061,100 |
| 10,000 | | Dominion Resources, Inc. (e) | 427,200 |
| | | | 1,488,300 |
| | | Oil, Gas & Consumable Fuels — 5.8% | |
| 25,000 | | Chevron Corp. | 2,281,250 |
| 16,000 | | ConocoPhillips | 1,089,600 |
| 25,000 | | Devon Energy Corp. | 1,962,750 |
| 22,500 | | Exxon Mobil Corp. | 1,645,200 |
| 50,719 | | Royal Dutch Shell PLC, ADR - Class B (United Kingdom) | 3,381,436 |
| | | | 10,360,236 |
| | | | | |
| Number | | | | |
| of Shares | | Description | | Value |
| | | Pharmaceuticals — 7.4% | | |
| 105,000 | | Bristol-Myers Squibb Co. | | $ 2,780,400 |
| 75,000 | | Eli Lilly & Co. | | 2,628,000 |
| 30,000 | | Johnson & Johnson | | 1,855,500 |
| 75,000 | | Merck & Co., Inc. | | 2,703,000 |
| 185,000 | | Pfizer, Inc. | | 3,239,350 |
| | | | | 13,206,250 |
| | | Semiconductors — 1.6% | | |
| 137,500 | | Intel Corp. | | 2,891,625 |
| | | Software — 2.8% | | |
| 107,500 | | Microsoft Corp. | | 3,001,400 |
| 113,500 | | Symantec Corp. (e) | | 1,899,990 |
| | | | | 4,901,390 |
| | | Specialty Retail — 1.4% | | |
| 50,000 | | Best Buy Co., Inc. | | 1,714,500 |
| 13,040 | | GameStop Corp. - Class A (e) | | 298,355 |
| 10,000 | | TJX Cos., Inc. | | 443,900 |
| | | | | 2,456,755 |
| | | Tobacco — 0.9% | | |
| 50,000 | | Reynolds American, Inc. | | 1,631,000 |
| | | Wireless Telecommunication Services — 0.9% | |
| 57,500 | | Vodafone Group PLC, ADR (United Kingdom) | | 1,519,725 |
| | | Total Common Stocks — 49.0% | | |
| | | (Cost $78,812,936) | | 87,147,421 |
| Principal | | | Optional Call | |
| Amount | | Description | Provisions | Value |
| | | Corporate Bonds — 16.4% | | |
| | | Aerospace & Defense — 0.5% | | |
| $ 550,000 | | Alliant Techsystems, Inc., BB-, Ba3 | | |
| | | 6.75%, 4/1/2016 | 4/1/11 @ 103.38 | 569,938 |
| 350,000 | | Triumph Group, Inc., B+, B1 | | |
| | | 8.00%, 11/15/2017 | 11/15/13 @ 104.00 | 364,000 |
| | | | | 933,938 |
| | | Airlines — 0.4% | | |
| 600,000 | | Air Canada (Canada), B+, B2 | | |
| | | 9.25%, 8/1/2015 (f) | 8/1/12 @ 106.94 | 630,000 |
| | | Auto Manufacturers — 0.6% | | |
| 1,000,000 | | Oshkosh Corp., BB-, B2 | | |
| | | 8.25%, 3/1/2017 | 3/1/14 @ 104.13 | 1,087,500 |
| | | Auto Parts and Equipment — 1.1% | | |
| 525,000 | | Cooper Tire & Rubber Co., BB-, B3 | | |
| | | 8.00%, 12/15/2019 | N/A | 543,375 |
| 1,300,000 | | Goodyear Tire & Rubber Co. (The), B+, B1 | | |
| | | 8.25%, 8/15/2020 | 8/15/15 @ 104.13 | 1,345,500 |
| | | | | 1,888,875 |
See notes to financial statements.
16 l Annual Report l December 31, 2010
TYW l TS&W/Claymore Tax-Advantaged Balanced Fund l Portfolio of Investments continued
| | | | | |
| Principal | | | Optional Call | |
| Amount | | Description | Provisions | Value |
| | | Commercial Services — 0.7% | | |
| $ 600,000 | | Hertz Corp. (The), B-, B2 | | |
| | | 8.875%, 1/1/2014 | 1/1/12 @ 100.00 | $ 613,500 |
| 668,000 | | Valassis Communications, Inc., BB-, Ba3 | | |
| | | 8.25%, 3/1/2015 | 3/1/11 @ 104.13 | 698,895 |
| | | | | 1,312,395 |
| | | Containers & Packaging — 0.4% | | |
| 600,000 | | Greif, Inc., BB+, Ba2 | | |
| | | 7.75%, 8/1/2019 | N/A | 657,000 |
| | | Diversified Financial Services — 0.7% | | |
| 780,000 | | Capital One Capital V, BB, Baa3 | | |
| | | 10.25%, 8/15/2039 | N/A | 834,600 |
| 500,000 | | Goldman Sachs Capital II, BBB-, Baa2 | | |
| | | 5.793%, 6/1/2043 (g) (h) | 6/1/12 @ 100.00 | 423,750 |
| | | | | 1,258,350 |
| | | Diversified Telecommunications — 0.9% | | |
| 1,000,000 | | NII Capital Corp., BB-,B2 | | |
| | | 10.00%, 8/15/2016 | 8/15/13 @ 105.00 | 1,107,500 |
| 500,000 | | Windstream Corp., B+, Ba3 | | |
| | | 8.625%, 8/1/2016 | 8/1/11 @ 104.31 | 526,250 |
| | | | | 1,633,750 |
| | | Entertainment — 0.6% | | |
| 975,000 | | Regal Entertainment Group, B-, B3 | | |
| | | 9.125%, 8/15/2018 | 8/15/14 @ 104.56 | 1,038,375 |
| | | Food — 0.8% | | |
| 665,000 | | Dean Foods Co., B-, B2 | | |
| | | 7.00%, 6/1/2016 | N/A | 610,138 |
| 835,000 | | SUPERVALU, Inc., B+, B2 | | |
| | | 8.00%, 5/1/2016 | N/A | 799,512 |
| | | | | 1,409,650 |
| | | Forest Products & Paper — 0.6% | | |
| 1,000,000 | | Neenah Paper, Inc., BB-, B1 | | |
| | | 7.375%, 11/15/2014 | 11/15/11 @ 101.23 | 1,022,500 |
| | | Health Care-Services— 0.7% | | |
| 1,200,000 | | Community Health Systems, Inc., B, B3 | | |
| | | 8.875%, 7/15/2015 | 7/15/11 @ 104.44 | 1,260,000 |
| | | Household Products & Housewares — 0.1% | | |
| 185,000 | | Jarden Corp., B, B2 | | |
| | | 7.50%, 1/15/2020 | 1/15/15 @ 103.75 | 192,863 |
| | | Independent Power Producers — 0.6% | | |
| 1,105,000 | | NRG Energy, Inc., BB-, B1 | | |
| | | 8.50%, 6/15/2019 | 6/15/14 @ 104.25 | 1,140,912 |
| | | Insurance — 0.5% | | |
| 500,000 | | Genworth Financial, Inc., BB+, Ba1 | | |
| | | 6.15%, 11/15/66 (g) | 11/15/16 @ 100.00 | 393,750 |
| 445,000 | | White Mountain Re Group Ltd. (Bermuda), BBB-, Baa3 | | |
| | | 6.375%, 3/20/17 (f) | N/A | 432,149 |
| | | | | 825,899 |
| | | | | |
| Principal | | | Optional Call | |
| Amount | | Description | Provisions | Value |
| | | Internet & Catalog Retail — 0.3% | | |
| $ 500,000 | | NetFlix, Inc., BB+, Ba2 | | |
| | | 8.50%, 11/15/2017 | 11/15/13 @ 104.25 | $ 562,500 |
| | | Iron/Steel — 0.7% | | |
| 650,000 | | AK Steel Corp., BB, Ba3 | | |
| | | 7.625%, 5/15/2020 | 5/15/15 @ 103.81 | 651,625 |
| 350,000 | | Allegheny Technologies, Inc., BBB-, Baa3 | | |
| | | 9.375%, 6/1/2019 | N/A | 408,886 |
| 250,000 | | Steel Dynamics, Inc., BB+, Ba2 | | |
| | | 7.75%, 4/15/2016 | 4/15/12 @ 103.88 | 263,125 |
| | | | | 1,323,636 |
| | | IT Services — 0.3% | | |
| 425,000 | | Unisys Corp., B+, B2 | | |
| | | 12.50%, 1/15/2016 | 1/15/12 @ 106.25 | 471,750 |
| | | Office/Business Equipment — 0.6% | | |
| 1,000,000 | | Xerox Capital Trust I, BB, Baa3 | | |
| | | 8.00%, 2/1/2027 | 2/1/12 @ 101.23 | 1,017,500 |
| | | Oil, Gas & Consumable Fuels — 1.4% | | |
| 1,115,000 | | Bill Barrett Corp., BB-, B1 | | |
| | | 9.875%, 7/15/2016 | 7/15/13 @ 104.94 | 1,223,712 |
| 650,000 | | EXCO Resources, Inc., B, B3 | | |
| | | 7.50%, 9/15/2018 | 9/15/14 @ 103.75 | 637,000 |
| 500,000 | | McMoRan Exploration Co., B, Caa1 | | |
| | | 11.875%, 11/15/2014 | 11/15/11 @ 105.94 | 552,500 |
| | | | | 2,413,212 |
| | | Real Estate — 0.3% | | |
| 525,000 | | CB Richard Ellis Services, Inc., B+, Ba2 | | |
| | | 11.625%, 6/15/2017 | 6/15/13 @ 105.81 | 608,344 |
| | | Retail — 1.6% | | |
| 700,000 | | Dillards, Inc., B+, B3 | | |
| | | 7.13%, 8/1/2018 | N/A | 693,000 |
| 1,290,000 | | Foot Locker, Inc., B+, B1 | | |
| | | 8.50%, 1/15/2022 | N/A | 1,235,175 |
| 900,000 | | Macy’s Retail Holdings, Inc., BB+, Ba1 | | |
| | | 7.60%, 6/1/2025 | N/A | 911,250 |
| | | | | 2,839,425 |
| | | Semiconductors — 0.6% | | |
| 1,100,000 | | Advanced Micro Devices, Inc., B+, Ba3 | | |
| | | 7.75%, 8/1/2020 (f) | 8/1/15 @ 103.88 | 1,141,250 |
| | | Transportation — 1.1% | | |
| 500,000 | | Kansas City Southern Railway, BB-, B1 | | |
| | | 8.00%, 6/1/2015 | 6/1/12 @ 104.00 | 537,500 |
| | | Overseas Shipholding Group, Inc., BB-, Ba3 | | |
| 850,000 | | 8.75%, 12/1/2013 | N/A | 911,625 |
| 500,000 | | 8.125%, 3/30/2018 | N/A | 501,250 |
| | | | | 1,950,375 |
See notes to financial statements.
Annual Report l December 31, 2010 l 17
TYW l TS&W/Claymore Tax-Advantaged Balanced Fund l Portfolio of Investments continued
| | | | | |
| Principal | | | Optional Call | |
| Amount | | Description | Provisions | Value |
| | | Trucking & Leasing — 0.3% | | |
| $ 450,000 | | Aircastle Ltd. (Bermuda), BB+, Ba3 | | |
| | | 9.75%, 8/1/2018 | 8/1/14 @ 104.88 | $ 491,625 |
| | | Total Corporate Bonds — 16.4% | | |
| | | (Cost $28,514,201) | | 29,111,624 |
| Number | | | | |
| of Shares | | | | Value |
| | | Preferred Stocks — 6.5% | | |
| | | Diversified Financial Services — 2.0% | | |
| 7,500 | | Ameriprise Financial, Inc., 7.75%, A, A3 | | 199,875 |
| 56,000 | | Bank of America Corp., Series MER, 8.625%, BB+, Ba3 | | 1,447,040 |
| 23,060 | | BB&T Capital Trust VI, 9.60%, BBB, Baa1 | | 666,434 |
| 18,800 | | HSBC Holdings PLC, Series 2 (United Kingdom), 8.00%, A-, A3 | 501,020 |
| 60,000 | | RBS Capital Funding Trust VII, Series G, 6.08%, CC, B3 | | 771,000 |
| | | | | 3,585,369 |
| | | Electric — 0.3% | | |
| 20,000 | | Dominion Resources, Inc., Series A, 8.375%, BBB, Baa3 | | 566,800 |
| | | Insurance — 1.9% | | |
| 64,505 | | Allianz SE (Germany), 8.375%, A+, A3 | | 1,695,275 |
| 37,300 | | Aspen Insurance Holdings Ltd. (Bermuda), 7.401%, BBB-, Ba1 (g) | 902,660 |
| 33,200 | | ING Groep NV (Netherlands), 7.375%, BB, Ba1 | | 769,576 |
| | | | | 3,367,511 |
| | | Real Estate Investment Trusts — 2.3% | | |
| 15,480 | | Apartment Investment & Management Co., Series T, 8.00%, B+, Ba3 | 388,703 |
| 19,000 | | Brandywine Realty Trust, Series C, 7.50%, NR, NR | | 472,720 |
| 11,000 | | Capital Automotive REIT, Series A, 7.50%, NR, NR | | 198,000 |
| 10,000 | | CBL & Associates Properties, Inc., Series C, 7.75%, NR, NR | | 243,600 |
| 5,000 | | First Industrial Realty Trust, Inc., Series J, 7.25%, CCC+, B2 | | 102,000 |
| 6,700 | | Health Care REIT, Inc., Series D, 7.875%, BB, Baa3 | | 171,060 |
| 13,000 | | Kimco Realty Corp., Series G, 7.75%, BBB-, Baa2 | | 343,200 |
| 12,500 | | PS Business Parks, Inc., Series R, 6.875%, BBB-, NR | | 304,750 |
| 12,000 | | PS Business Parks, Inc., Series H, 7.00%, BBB-, Baa3 | | 294,120 |
| 35,500 | | Public Storage, Series M, 6.625%, BBB+, Baa1 | | 886,080 |
| 15,200 | | Regency Centers Corp., Series D, 7.25%, BB+, Baa3 | | 375,896 |
| 15,000 | | Vornado Realty Trust, Series E, 7.00%, BBB-, Baa3 | | 370,500 |
| | | | | 4,150,629 |
| | | Total Preferred Stocks — 6.5% | | |
| | | (Cost $12,174,104) | | 11,670,309 |
| | | Total Long-Term Investments - 164.5% | | |
| | | (Cost $281,499,051) | | 292,671,238 |
| | | | | |
| Principal | | | | |
| Amount | | | | Value |
| | | Short-Term Investments — 0.9% | | |
| | | Municipal Bonds — 0.9% | | |
| | | Missouri— 0.9% | | |
| $ 1,600,000 | | Missouri Development Finance Board Cultural Facilities Revenue, | |
| | | Nelson Gallery Foundation, Series A, AAA, Aaa | | |
| | | 0.30%, 12/1/2033 (i) | 1/4/11 @ 100.00 | |
| | | (Cost $1,600,000) | | $ 1,600,000 |
| | | Total Investments — 165.4% | | |
| | | (Cost $283,099,051) | | 294,271,238 |
| | | Floating Rate Note Obligations — (3.8%) | | |
| (6,850,000) | | Notes with interest rates ranging from 0.35% to 0.37% on December 31, 2010, | |
| | | and contractual maturities of collateral from 2016 to 2037. | |
| | | (Cost ($6,850,000)) | | (6,850,000) |
| | | Total Net Investments — 161.6% | | |
| | | (Cost $276,249,051) | | 287,421,238 |
| | | Liabilities in excess of Other Assets — (2.6%) | | (4,553,557) |
| | | Preferred Shares, at Liquidation Value — (-59.0% of Net Assets | |
| | | Applicable to Common Shareholders or -35.7% of Total Investments) | (105,000,000) |
| | | Net Assets Applicable to Common Shareholders — 100.0% | $177,867,681 |
| * | Date and price of the earliest optional call or put provision. There may be other call provisions at varying prices at later dates. |
ADR AG AGM AMBAC ASSURED BHAC FGIC FHA N/A NV PLC PSF REIT | American Depositary Receipt Stock Corporation Assured Guaranty Municipal Corporation Ambac Assurance Corporation Assured Guaranty Corporation Berkshire Hathaway Assurance Corporation Financial Guaranty Insurance Company Guaranteed by Federal Housing Administration Not Applicable Publicly Traded Company Public Limited Company Permanent School Fund (Texas) Real Estate Investment Trust |
| (a) | Security has a step coupon and a convertible feature effective after September 1, 2026 . |
| (b) | This bond is prerefunded. U.S. government or U.S. government agency securities, held in escrow, are used to pay interest on this security, as well as to retire the bond in full at the date and price indicated under the Optional Call Provisions. |
| | |
| (c) | Inverse floating rate investment. Interest rate shown is that in effect at December 31, 2010. |
| (d) | Underlying security related to inverse floating rate investment entered into by the Fund. |
| (e) | Non-income producing security. |
| (f) | Securities are exempt from registration under Rule 144A of the Securities Act of 1933. These securities may be resold in transactions exempt from registration, normally to qualified institutional buyers. At December 31, 2010, these securities amounted to $2,203,399, which represents 1.24% of net assets applicable to common shares. |
| | |
| (g) | Floating or variable rate coupon.The rate shown is as of December 31, 2010. |
| (h) | Security is a hybrid bond that will convert to a preferred stock on the first call date. |
| (i) | Security has a maturity of more than one year, but has variable rate and demand features which qualify it as a short- term security.The rate shown is that earned by the Fund as of December 31, 2010. |
| | |
| | Ratings (unaudited) shown are per Standard & Poor’s and Moody’s. Securities classified as NR are not rated. |
| | |
| | The ratings apply to the credit worthiness of the issuers of the underlying securities and not to the Fund or its shares. |
| | |
| | All percentages shown in the Portfolio of Investments are based on Net Assets Applicable to Common Shareholders unless otherwise noted. |
See notes to financial statements.
18 l Annual Report l December 31, 2010
TYW l TS&W/Claymore Tax-Advantaged Balanced Fund
Statement of Assets and Liabilities l December 31, 2010
| Assets | | | |
| Investments in securities, at value (cost $283,099,051) | | $ | 294,271,238 | |
| Cash | | | 47,414 | |
| Interest receivable | | | 3,479,207 | |
| Dividends receivable | | | 235,877 | |
| Other assets | | | 4,552 | |
| Total assets | | | 298,038,288 | |
| Liabilities | | | | |
| Payable for securities purchased | | | 7,937,904 | |
| Floating rate note obligations | | | 6,850,000 | |
| Advisory fee payable | | | 167,994 | |
| Dividends payable - preferred shares | | | 44,599 | |
| Administration fee payable | | | 6,074 | |
| Accrued expenses | | | 164,036 | |
| Total liabilities | | | 15,170,607 | |
| Preferred Shares, at Redemption Value | | | | |
| $.01 par value per share; 4,200 Auction Market Preferred Shares authorized, | | | | |
| issued and outstanding at $25,000 per share liquidation preference | | | 105,000,000 | |
| Net Assets Applicable to Common Shareholders | | $ | 177,867,681 | |
| Composition of Net Assets Applicable to Common Shareholders | | | | |
| Common stock, $.01 par value per share; unlimited number of shares authorized, 15,407,000 shares issued and outstanding | | $ | 154,070 | |
| Additional paid-in capital | | | 216,846,103 | |
| Accumulated net realized loss on investments and swaps | | | (50,263,429 | ) |
| Net unrealized appreciation on investments | | | 11,172,187 | |
| Accumulated distributions in excess of net investment income | | | (41,250 | ) |
| Net Assets Applicable to Common Shareholders | | $ | 177,867,681 | |
Net Asset Value Applicable to Common Shareholders (based on 15,407,000 common shares outstanding) | | $ | 11.54 | |
See notes to financial statements.
Annual Report l December 31, 2010 l 19
TYW l TS&W/Claymore Tax-Advantaged Balanced Fund
Statement of Operations l For the Year Ended December 31, 2010
| Investment Income | | | | | | |
| Interest | | $ | 9,963,213 | | | | |
| Dividends (net of foreign withholding taxes of $11,522) | | | 4,200,912 | | | | |
| Total income | | | | | | $ | 14,164,125 | |
| Expenses | | | | | | | | |
| Advisory fee | | | 1,961,020 | | | | | |
| Professional fees | | | 320,598 | | | | | |
| Printing expenses | | | 200,691 | | | | | |
| Preferred share maintenance | | | 171,377 | | | | | |
| Trustees’fees and expenses | | | 148,110 | | | | | |
| Fund accounting | | | 82,283 | | | | | |
| Administration fee | | | 71,029 | | | | | |
| Miscellaneous | | | 65,556 | | | | | |
| Custodian fee | | | 57,316 | | | | | |
| NYSE listing fee | | | 21,170 | | | | | |
| Transfer agent fee | | | 19,591 | | | | | |
| Insurance | | | 19,325 | | | | | |
| Interest expense on floating rate note obligations | | | 19,398 | | | | | |
| Total expenses | | | | | | | 3,157,464 | |
| Net investment income | | | | | | | 11,006,661 | |
| Realized and Unrealized Gain on Investments | | | | | | | | |
| Net realized gain on Investments | | | | | | | 2,782,369 | |
| Net change in unrealized appreciation on Investments | | | | | | | 7,723,719 | |
| Net realized and unrealized gain on investments | | | | | | | 10,506,088 | |
| Distributions to Preferred Shareholders from | | | | | | | | |
| Net investment income | | | | | | | (1,609,957 | ) |
| Net Increase in Net Assets Applicable to Common Shareholders Resulting from Operations | | | | | | $ | 19,902,792 | |
See notes to financial statements.
20 l Annual Report l December 31, 2010
TYW l TS&W/Claymore Tax-Advantaged Balanced Fund
Statement of Changes in Net Assets
Applicable to Common Shareholders l
| | | For the | | | For the | |
| | | Year Ended | | | Year Ended | |
| | | December 31, 2010 | | | December 31, 2009 | |
| Increase in Net Assets Applicable to Common Shareholders | | | | | | |
| Resulting from Operations | | | | | | |
| Net investment income | | $ | 11,006,661 | | | $ | 11,549,549 | |
| Net realized gain (loss) on investments and swaps | | | 2,782,369 | | | | (21,464,737 | ) |
| Net change in unrealized appreciation on investments and swaps | | | 7,723,719 | | | | 63,093,469 | |
| Distributions to Preferred Shareholders | | | | | | | | |
| From net investment income | | | (1,609,957 | ) | | | (1,739,505 | ) |
| Net increase in net assets applicable to common shareholders resulting from operations | | | 19,902,792 | | | | 51,438,776 | |
| Distributions to Common Shareholders: | | | | | | | | |
| From and in excess of net investment income | | | (11,709,320 | ) | | | (12,210,048 | ) |
| Total increase in net assets applicable to common shareholders | | | 8,193,472 | | | | 39,228,728 | |
| Net Assets | | | | | | | | |
| Beginning of period | | | 169,674,209 | | | | 130,445,481 | |
| End of period (including accumulated undistributed net investment income (loss) | | | | | | | | |
| of ($41,250) and $693,120, respectively) | | $ | 177,867,681 | | | $ | 169,674,209 | |
See notes to financial statements.
Annual Report l December 31, 2010 l 21
TYW l TS&W/Claymore Tax-Advantaged Balanced Fund
Financial Highlights l
| | | For the | | | For the | | | For the | | | For the | | | For the | |
| | | Year Ended | | | Year Ended | | | Year Ended | | | Year Ended | | | Year Ended | |
| Per share operating performance | | December 31, | | | December 31, | | | December 31, | | | December 31, | | | December 31, | |
| for a common share outstanding throughout the period | | 2010 | | | 2009 | | | 2008 | | | 2007 | | | 2006 | |
| Net asset value, beginning of period | | $ | 11.01 | | | $ | 8.47 | | | $ | 14.94 | | | $ | 16.83 | | | $ | 15.44 | |
| Income from investment operations | | | | | | | | | | | | | | | | | | | | |
Net investment income(a) | | | 0.71 | | | | 0.75 | | | | 0.92 | | | | 0.92 | | | | 0.91 | |
Net realized and unrealized gain (loss) on investments, options and swaps | | | 0.68 | | | | 2.69 | | | | (6.07 | ) | | | (1.08 | ) | | | 1.79 | |
| Distributions to preferred shareholders | | | | | | | | | | | | | | | | | | | | |
From and in excess of net investment income (common share equivalent basis) | | | (0.10 | ) | | | (0.11 | ) | | | (0.31 | ) | | | (0.30 | ) | | | (0.37 | ) |
| From realized gains (common share equivalent basis) | | | – | | | | – | | | | – | | | | (0.11 | ) | | | – | |
| Total distributions to Preferred Shareholders | | | (0.10 | ) | | | (0.11 | ) | | | (0.31 | ) | | | (0.41 | ) | | | (0.37 | ) |
| Total from investment operations | | | 1.29 | | | | 3.33 | | | | (5.46 | ) | | | (0.57 | ) | | | 2.33 | |
| Distributions to common shareholders | | | | | | | | | | | | | | | | | | | | |
| From and in excess of net investment income | | | (0.76 | ) | | | (0.79 | ) | | | (1.01 | ) | | | (0.95 | ) | | | (0.94 | ) |
| From realized gains | | | – | | | | – | | | | – | | | | (0.37 | ) | | | – | |
| Total distributions to common shareholders | | | (0.76 | ) | | | (0.79 | ) | | | (1.01 | ) | | | (1.32 | ) | | | (0.94 | ) |
| Net asset value, end of period | | $ | 11.54 | | | $ | 11.01 | | | $ | 8.47 | | | $ | 14.94 | | | $ | 16.83 | |
| Market value, end of period | | $ | 10.54 | | | $ | 9.54 | | | $ | 6.65 | | | $ | 13.10 | | | $ | 15.77 | |
Total investment return (b) | | | | | | | | | | | | | | | | | | | | |
| Net asset value | | | 12.03 | % | | | 41.34 | % | | | -37.97 | % | | | -3.60 | % | | | 15.50 | % |
| Market value | | | 18.72 | % | | | 57.57 | % | | | -43.70 | % | | | -8.97 | % | | | 25.98 | % |
| Ratios and supplemental data | | | | | | | | | | | | | | | | | | | | |
| Net assets applicable to common shareholders, end of period (thousands) | | $ | 177,868 | | | $ | 169,674 | | | $ | 130,445 | | | $ | 230,202 | | | $ | 259,334 | |
| Preferred shares, at liquidation value ($25,000 per share liquidation | | | | | | | | | | | | | | | | | | | | |
| preference) (thousands) | | $ | 105,000 | | | $ | 105,000 | | | $ | 120,000 | | | $ | 120,000 | | | $ | 120,000 | |
| Preferred shares asset coverage per share | | $ | 67,349 | | | $ | 65,399 | | | $ | 52,176 | | | $ | 72,959 | | | $ | 79,028 | |
| Ratios to average net assets applicable to common shareholders: | | | | | | | | | | | | | | | | | | | | |
Total expenses (excluding interest expense on floating rate note obligations) | | | 1.79 | % | | | 1.93 | % | | | 1.67 | % | | | 1.44 | % | | | 1.46 | % |
Total expenses (including interest expense on floating rate note obligations) (c) | | | 1.80 | % | | | 1.94 | % | | | 1.72 | % | | | 1.53 | % | | | 1.50 | % |
Net investment income, prior to effect of dividends to preferred shares | | | 6.28 | % | | | 7.92 | % | | | 7.48 | % | | | 5.60 | % | | | 5.70 | % |
Net investment income, after effect of dividends to preferred shares | | | 5.37 | % | | | 6.73 | % | | | 4.97 | % | | | 3.81 | % | | | 3.41 | % |
| Portfolio turnover rate | | | 156 | % | | | 151 | % | | | 181 | % | | | 114 | % | | | 159 | % |
Asset coverage per $1,000 unit of indebtedness(d) | | $ | 42,295 | | | $ | 41,098 | | | $ | – | | | $ | 74,727 | | | $ | 29,902 | |
| (a) | Based on average shares outstanding during the period. |
| (b) | Total investment return is calculated assuming a purchase of a common share at the beginning of the period and a sale on the last day of the period reported either at net asset value (“NAV”) or market price per share. Dividends and distributions are assumed to be reinvested at NAV for NAV returns or the prices obtained under the Fund’s Dividend Reinvestment Plan for market value returns. Total investment return does not reflect brokerage commissions. |
| (c) | See note 2(d) of the Notes to Financial Statements for more information on floating rate note obligations. |
| (d) | Calculated by subtracting the Fund’s total liabilities (not including the floating rate note obligations) from the Fund’s total assets and dividing by the total number of indebtedness units, where one unit equals $1,000 of indebtedness. |
See notes to financial statements.
22 l Annual Report l December 31, 2010
TYW l TS&W/Claymore Tax-Advantaged Balanced Fund
Notes to Financial Statements l December 31, 2010
Note 1 – Organization:
TS&W/Claymore Tax-Advantaged Balanced Fund (the“Fund”) was organized as a Delaware statutory trust on February 12, 2004. The Fund is registered as a diversified, closed-end management investment company under the Investment Company Act of 1940, as amended.
Under normal market conditions, the Fund will invest at least 50%, but less than 60%, of its total assets in debt securities and other obligations issued by or on behalf of states, territories and possessions of the United States and the District of Columbia and their political subdivisions, agencies and instrumentalities, the interest on which is exempt from regular federal income tax and which is not a preference item for purposes of the alternative minimum tax (the“Municipal Securities Portfolio”) and at least 40%, but less than 50%, of its total assets in common stocks, preferred securities and other income securities (the“Equity and Income Securities Portfolio”).
On September 24, 2010, Claymore Advisors, LLC changed its name to Guggenheim Funds Investment Advisors, LLC. Also, Claymore Securities, Inc. changed its name to Guggenheim Funds Distributors, Inc.
Note 2 – Accounting Policies:
The preparation of the financial statements in accordance with U.S. generally accepted accounting principles (“GAAP”) requires management to make estimates and assumptions that affect the reported amounts and disclosures in the financial statements. Actual results could differ from these estimates.
The following is a summary of significant accounting policies consistently followed by the Fund.
(a) Valuation of Investments
The Fund values equity securities at the last reported sale price on the principal exchange or in the principal over-the-counter (“OTC”) market in which such securities are traded, as of the close of regular trading on the New York Stock Exchange (“NYSE”) on the day the securities are being valued or, if there are no sales, at the mean between the last available bid and asked prices on that day. Securities traded on the NASDAQ are valued at the NASDAQ Official Closing Price. Preferred stocks are valued at their sales price as of the close of the exchange on which they are traded. Preferred stocks for which the last sales price is not available are valued at the last available bid price. Debt securities are valued at the last available bid price for such securities or, if such prices are not available, at prices for securities of comparable maturity, quality and type. Foreign securities are translated from the local currency into U.S. dollars using the current exchange rate. The Fund’s securities that are primarily traded in foreign markets may be traded in such markets on days that the NYSE is closed. As a result, the net asset value of the Fund may be significantly affected on days when holders of common shares have no ability to trade common shares on the NYSE. Investment companies are valued at the last available closing price. For those securities where quotations or prices are not available, valuations are determined in accordance with procedures established in good faith by management and approved by the Board of Trustees. Short-term securities with remaining maturities of 60 days or less are valued at amortized cost, which approximates market value.
For those securities whose quotations or prices are not available, the valuations are determined in accordance with procedures established in good faith by management and approved by the Board of Trustees. Valuations in accordance with these procedures are intended to reflect each security’s (or asset’s)“fair value.”Such“fair value”is the amount that the Fund might reasonably expect to receive for the security (or asset) upon its current sale. Each such determination should be based on a consideration of all relevant factors, which are likely to vary from one pricing context to another. Examples of such factors may include, but are not limited to: (i) the type of security, (ii) the initial cost of the security, (iii) the existence of any contractual restrictions on the security’s disposition, (iv) the price and extent of public trading in similar securities of the issuer or of comparable companies, (v) quotations or evaluated prices from broker-dealers and/or pricing services, (vi) information obtained from the issuer, analysts, and/or the appropriate stock exchange (for exchange traded securities), (vii) an analysis of the company’s financial statements, and (viii) an evaluation of the forces that influence the issuer and the market(s) in which the security is purchased and sold (e.g. the existence of pending merger activity, public offerings or tender offers that might affect the value of the security).
Fair value is defined as the price that the Fund would receive to sell an investment or pay to transfer a liability in an orderly transaction with an independent buyer in the principal market, or in the absence of a principal market the most advantageous market for the investment or liability. There are three different categories for valuations. Level 1 valuations are those based upon quoted prices in active markets. Level 2 valuations are those based upon quoted prices in inactive markets or based upon significant observable inputs (e.g. yield curves; benchmark interest rates; indices). Level 3 valuations are those based upon unobservable inputs (e.g. discounted cash flow analysis; non-market based methods used to determine fair valuation).
The Fund has adopted the Accounting Standard Update, Fair Value Measurements and Disclosures (Topic 820): Improving Disclosures about Fair Value Measurements which provides guidance on how investment assets and liabilities are to be valued and disclosed. Specifically, the amendment requires reporting entities to disclose i) the input and valuation techniques used to measure fair value for both recurring and nonrecurring fair value measurements, for Level 2 or Level 3 positions ii) transfers between all levels (including Level 1 and Level 2) on a gross basis (i.e. transfers out must be disclosed separately from transfers in) as well as the reasons(s) for the transfer and iii) purchases, sales, issuances and settlements on a gross basis in the Level 3 rollforward rather than as one net number. The effective date of the amendment is for interim and annual periods beginning after December 15, 2009 however, the requirement to provide the Level 3 activity for purchases, sales, issuances and settlements on a gross basis will be effective for interim and annual periods beginning after December 15, 2010. The Fund adopted the disclosures required by this amendment, which did not have a material impact on the financial statements.
The Fund values Level 1 securities using readily available market quotations in active markets.
The Fund values Level 2 fixed income securities using independent pricing providers who employ matrix pricing models utilizing market prices, broker quotes and prices of securities with comparable maturities and qualities. The Fund values Level 2 equity securities using various observable market inputs in accordance with procedures established in good faith by management and approved by the Board of Trustees as described above. The Fund did not have any Level 3 securities at December 31, 2010. There were no transfers between Level 1 and Level 2 during the year ended December 31, 2010.
The following table represents the Fund’s investments carried on the Statement of Assets and Liabilities by caption and by level within the fair value hierarchy at December 31, 2010:
| Description ($000) | | Level 1 | | | Level 2 | | | Level 3 | | | Total | |
| Assets: | | | | | | | | | | | | |
| Municipal Bonds | | $ | – | | | $ | 166,342 | | | $ | – | | | $ | 166,342 | |
| Common Stocks | | | 87,147 | | | | – | | | | – | | | | 87,147 | |
| Corporate Bonds | | | – | | | | 29,112 | | | | – | | | | 29,112 | |
| Preferred Stocks | | | 11,670 | | | | – | | | | – | | | | 11,670 | |
| Total | | $ | 98,817 | | | $ | 195,454 | | | $ | – | | | $ | 294,271 | |
(b) Investment Transactions and Investment Income
Investment transactions are accounted for on the trade date. Realized gains and losses on investments are determined on the identified cost basis. Dividend income is recorded net of
Annual Report l December 31, 2010 l 23
TYW l TS&W/Claymore Tax-Advantaged Balanced Fund l Notes to Financial Statements continued
applicable withholding taxes on the ex-dividend date and interest income is recorded on an accrual basis. Discounts or premiums on debt securities purchased are accreted or amortized to interest income over the lives of the respective securities using the effective interest method.
(c) Distributions to Shareholders
The Fund declares and pays quarterly dividends to common shareholders. These dividends consist of tax-exempt income and investment company taxable income, which generally includes qualified dividend income, ordinary income and short-term capital gains. Any net realized long-term capital gains are distributed annually to common shareholders.
Distributions to shareholders are recorded on the ex-dividend date. The amount and timing of distributions are determined in accordance with federal income tax regulations, which may differ from GAAP.
(d) Inverse Floating Rate Investments and Floating Rate Note Obligations
Inverse floating rate instruments are notes whose coupon rate fluctuates inversely to a predetermined interest rate index. These instruments typically involve greater risks than a fixed rate municipal bond. In particular, the holder of these inverse floating rate instruments retain all credit and interest rate risk associated with the full underlying bond and not just the par value of the inverse floating rate instrument. As such, these instruments should be viewed as having inherent leverage and therefore involve many of the risks associated with leverage. Leverage is a speculative technique that may expose the Fund to greater risk and increased costs. Leverage may cause the Fund’s net asset value to be more volatile than if it had not been leveraged because leverage tends to magnify the effect of any increases or decreases in the value of the Fund’s portfolio securities. The use of leverage may also cause the Fund to liquidate portfolio positions when it may not be advantageous to do so in order to satisfy its obligations with respect to inverse floating rate instruments. The Fund may invest in inverse floating rate securities through either a direct purchase or through the transfer of bonds to a dealer trust in exchange for cash and/or residual interests in the dealer trust.
For those inverse floating rate securities purchased directly, the instrument is included in the Portfolio of Investments with income recognized on an accrual basis.
For those inverse floating rate securities purchased through a transfer of a fixed rate bond to a dealer trust in exchange for cash and/or residual interests in the dealer trusts’assets and cash flows, ASC 860, Transfers and Servicing (“ASC 860”) calls for this transaction to be accounted for as a financing by the dealer trust of the transferred fixed rate bond. In these transactions, the dealer trusts fund the purchases of the fixed rate bonds by issuing floating rate notes to third parties and allowing the Fund to retain residual interests in the bonds. The residual interests held by the Fund (the inverse floating rate investments) include the right of the Fund to cause the holders of the floating rate notes to tender their notes at par at the next interest rate reset date and to transfer the municipal bond from the dealer trusts to the Fund, thereby collapsing the dealer trusts. The Fund accounts for the transfer of bonds to the dealer trusts as secured borrowings, with the securities transferred remaining in the Fund’s Portfolio of Investments, and the related floating rate notes reflected as a liability under the caption ‘’Floating rate note obligations’’on the Statement of Assets and Liabilities. The Fund records the interest income from the fixed rate bonds under the caption‘’Interest’’and records the expenses related to floating rate note obligations and any administrative expenses of the dealer trusts under the caption‘’Interest expense on floating rate note obligations’’on the Fund’s Statement of Operations. The notes issued by the dealer trusts have interest rates that reset weekly and the floating rate note holders have the option to tender their notes to the dealer trusts for redemption at par at each reset date. At December 31, 2010, Fund investments with a par value of $13,700,000 (market value of $14,934,504) are held by the dealer trusts and serve as collateral for the $6,850,000 in floating rate notes outstanding at that date. Contractual maturities of the floating rate notes and interest rates in effect at December 31, 2010 are presented on the Portfolio of Investments. The average floating rate notes balance and average annual interest rate during the year ended December 31, 2010 were $6,850,000 and 0.28%, respectively.
Note 3 – Investment Advisory Agreement, Investment Sub-Advisory Agreement and Other Agreements:
Pursuant to an Investment Advisory Agreement (the“Advisory Agreement”) between the Fund and Guggenheim Funds Investment Advisors, LLC (the“Adviser”), the Adviser is responsible for managing, either directly or through others selected by it, the investment activities of the Fund and the Fund’s business affairs and other administrative matters. The Adviser receives a fee, payable monthly, at an annual rate equal to 0.70% of the Fund’s average daily managed assets (total assets including the assets attributable to the proceeds from any financial leverage but excluding the assets attributable to floating rate note obligations, minus liabilities, other than debt representing financial leverage).
The Fund and the Adviser have entered into an Investment Sub-Advisory Agreement (the “TS&W Sub-Advisory Agreement”) with Thompson, Siegel & Walmsley LLC (“TS&W”). TS&W is responsible for day-to-day portfolio management of the Fund’s assets allocated to the Equity and Income Securities Portfolio. Under the terms of the TS&W Sub-Advisory Agreement between the Adviser and TS&W, the Adviser pays monthly to TS&W a fee at the annual rate of 0.42% of the Fund’s average daily managed assets attributable to the Equity and Income Securities Portfolio.
The Fund and the Adviser have also entered into an Investment Sub-Advisory Agreement (the “SMC Sub-Advisory Agreement”) with SMC Fixed Income Management, LP (“SMC”). SMC is responsible for day-to-day portfolio management of the Fund’s assets allocated to the Municipal Securities Portfolio. Under the terms of the SMC Sub-Advisory Agreement between the Adviser and SMC, the Adviser pays monthly to SMC a fee at the annual rate of 0.30% of the Fund’s average daily managed assets attributable to the Municipal Securities Portfolio. Prior to July 11, 2006, the Adviser was responsible for the day-to-day portfolio management for the Municipal Securities Portfolio.
Certain officers and trustees of the Fund may also officers be directors and/or employees of the Adviser, TS&W and SMC. The Fund does not compensate its officers or trustees who are officers, directors and/or employees of the aforementioned firms.
The Bank of New York Mellon (“BNY”) acts as the Fund’s custodian, accounting agent, auction agent and transfer agent. As custodian, BNY is responsible for the custody of the Fund’s assets. As accounting agent, BNY is responsible for maintaining the books and records of the Fund’s securities and cash. As auction agent, BNY is responsible for conducting the auction of the preferred shares. As transfer agent, BNY is responsible for performing transfer agency services for the Fund.
Under a separate Fund Administration agreement, the Adviser provides fund administration services to the Fund. The Adviser receives an administration fee payable monthly at the annual rate set forth below as a percentage of the average daily managed assets of the Fund:
| Managed Assets | Rate |
| First $200,000,000 | 0.0275% |
| Next $300,000,000 | 0.0200% |
| Next $500,000,000 | 0.0150% |
| Over $1,000,000,000 | 0.0100% |
24 l Annual Report l December 31, 2010
TYW l TS&W/Claymore Tax-Advantaged Balanced Fund l Notes to Financial Statements continued
For the year ended December 31, 2010, the Fund recognized expenses of $71,029 for these services.
Note 4 – Federal Income Taxes:
The Fund intends to comply with the requirements of Subchapter M of the Internal Revenue Code of 1986, as amended, applicable to regulated investment companies. Accordingly, no provision for U.S. federal income taxes is required. In addition, by distributing substantially all of its ordinary income and long-term capital gains, if any, during each calendar year, the Fund intends not to be subject to U.S. federal excise tax.
Information on the tax components of investments and net assets at December 31, 2010 is as follows:
| Cost of | | | Net Tax |
| Investments | Gross Tax | Gross Tax | Unrealized |
| for Tax | Unrealized | Unrealized | Appreciation |
| Purposes | Appreciation | Depreciation | on Investments |
| $283,964,819 | $15,972,535 | ($5,666,116) | $10,306,419 |
Tax components of the following balances as of December 31, 2010, are as follows:
| Undistributed | Undistributed |
| Ordinary | Long-Term |
| Income/ | Gains/ |
| (Overdistribution | (Accumulated |
| of ordinary income) | Capital Loss) |
| $— | ($49,438,911) |
The differences between book basis and tax basis unrealized appreciation/(depreciation) is attributable to additional income accrued for tax purposes on certain preferred stocks and investments in real estate investment trusts.
Due to inherent differences in the recognition of income, expense and realized gain/losses under GAAP and federal income tax purposes, permanent differences between book and tax basis reporting have been identified and appropriately reclassified on the Statement of Assets and Liabilities. At December 31, 2010, the following reclassifications were made to the capital accounts of the Fund which are primarily due to the differences between book and tax treatment of investments in real estate trusts and partnerships. Net investment income, net realized gains and net assets were not affected by these changes.
| Undistributed | Accumulated | |
| Net Investment | Net Realized | |
| Income/ | Gain/ | Paid in |
| (Loss) | (Loss) | Capital |
| $1,578,246 | $133,044 | ($1,711,290) |
As of December 31, 2010, for federal income tax purposes, the Fund anticipates utilizing $2,804,922 of capital loss carryforward. The Fund had a remaining carryforward of $49,438,911 available to offset possible future capital gains. Of the capital loss carryforward, $20,511,616 is set to expire on December 31, 2016 and $28,927,295 is set to expire on December 31, 2017.
For the years ended December 31, 2010 and 2009, the tax character of distributions paid to common and preferred shareholders as reflected in the Statement of Changes in Net Assets was as follows:
| Distributions paid from: | 2010 | 2009 |
| Ordinary income* | $6,330,380 | $4,736,647 |
| Tax-exempt income | $6,988,897 | $9,212,906 |
| Total Distributions | $13,319,277 | $13,949,553 |
*For the year ended December 31, 2010 and 2009 the Fund received approximately $3.9 million and $4.2 million, respectively, of qualified dividend income. During 2010, ordinary income distributions for federal income tax purposes included distributions, of $1,690,305, from realized gains.
For all open tax years and all major jurisdictions, management of the Fund has concluded that there are no significant uncertain tax positions that would require recognition in the financial statements. Open tax years are those that are open for examination by taxing authorities (i.e. generally the last four tax year ends and the interim tax period since then). Furthermore, management of the Fund is also not aware of any tax positions for which it is reasonably possible that the total amounts of unrecognized tax benefits will significantly change in the next twelve months.
Note 5 – Investment in Securities:
For the year ended December 31, 2010, purchases and sales of investments, excluding short-term securities, were $433,206,088 and $427,327,742, respectively.
Note 6– Capital:
Common Shares
The Fund has an unlimited amount of common shares, $0.01 par value, authorized and 15,407,000 issued and outstanding at December 31, 2010. In connection with the Fund’s dividend reinvestment plan, the Fund did not issue any shares during the years ended December 31, 2010 or 2009.
Preferred Shares
On April 29, 2004, the Fund’s Board of Trustees authorized the issuance of preferred shares, in addition to the existing common shares, as part of the Fund’s leverage strategy. The Fund may also borrow or issue debt securities collectively with preferred shares for leveraging purposes. Preferred shares issued by the Fund have seniority over the common shares.
On July 1, 2004, the Fund issued 2,400 shares of Preferred Shares Series M7 and 2,400 shares of Preferred Shares Series T28 each with a net asset and liquidation value of $25,000 per share plus accrued dividends. Dividends are accumulated daily at an annual rate set through auction procedures. Distribution of net realized capital gains, if any, are paid annually. On February 27, 2009, the Fund announced the redemption of 100 shares of each series of Auction Market Preferred Shares (“AMPS”). On March 10, 2009, the Fund announced the redemption of 200 shares of each series of AMPS. BNY is the auction agent and provides administrative, transfer agency, and dividend distribution services for the preferred shares.
The broad auction-rate preferred securities market, including the Fund’s AMPS, has experienced considerable disruption since February 2008. The result has been failed auctions on nearly all auction-rate preferred shares, including the Fund’s AMPS. A failed auction is not a default, nor does it require the redemption of the Fund’s AMPS. Provisions on the offering documents of the Fund’s AMPS provide a mechanism to set a maximum rate in the event of a failed auction. The maximum rate is LIBOR + 1.25% or LIBOR x 125%, whichever is greater.
Annual Report l December 31, 2010 l 25
TYW l TS&W/Claymore Tax-Advantaged Balanced Fund l Notes to Financial Statements continued
For the year ended December 31, 2010, the annualized dividend rates ranged from:
| | High | Low | At December 31, 2010 |
| Series M7 | 1.58% | 1.46% | 1.50% |
| Series T28 | 1.60% | 1.48% | 1.51% |
The Fund is subject to certain limitations and restrictions while preferred shares are outstanding. Failure to comply with these limitations and restrictions could preclude the Fund from declaring any dividends or distributions to common shareholders or repurchasing common shares and/or could trigger the mandatory redemption of Preferred Shares at their liquidation value.
Preferred shares, which are entitled to one vote per share, generally vote with the common stock but vote separately as a class to elect two trustees and on any matters affecting the rights of the preferred shares.
Note 7 – Indemnifications:
In the normal course of business, the Fund enters into contracts that contain a variety of representations, which provide general indemnifications. The Fund’s maximum exposure under these arrangements is unknown, as this would require future claims that may be made against the Fund that have not yet occurred. However, the Fund expects the risk of loss to be remote.
Note 8 – Subsequent Events
The Fund evaluated subsequent events through the date the financial statements were available for issue and determined there were no additional material events that would require disclosure in the Fund’s financial statements.
26 l Annual Report l December 31, 2010
TYW l TS&W/Claymore Tax-Advantaged Balanced Fund
Report of Independent Registered Public Accounting Firm |
To the Board of Trustees and Shareholders of
TS&W/Claymore Tax-Advantaged Balanced Fund
We have audited the accompanying statement of assets and liabilities of TS&W/Claymore Tax-Advantaged Balanced Fund (the Fund), including the portfolio of investments, as of December 31, 2010, and the related statement of operations for the year then ended, the statements of changes in net assets applicable to common shareholders for each of the two years in the period then ended, and the financial highlights for each of the five years in the period then ended. These financial statements and financial highlights are the responsibility of the Fund’s management. Our responsibility is to express an opinion on these financial statements and financial highlights based on our audits.
We conducted our audits in accordance with the standards of the Public Company Accounting Oversight Board (United States). Those standards require that we plan and perform the audit to obtain reasonable assurance about whether the financial statements and financial highlights are free of material misstatement. We were not engaged to perform an audit of the Fund’s internal control over financial reporting. Our audits included consideration of internal control over financial reporting as a basis for designing audit procedures that are appropriate in the circumstances, but not for the purpose of expressing an opinion on the effectiveness of the Fund’s internal control over financial reporting. Accordingly, we express no such opinion. An audit also includes examining, on a test basis, evidence supporting the amounts and disclosures in the financial statements and financial highlights, assessing the accounting principles used and significant estimates made by management, and evaluating the overall financial statement presentation. Our procedures included confirmation of securities owned as of December 31, 2010, by correspondence with the custodian and brokers or by other appropriate auditing procedures where replies from brokers were not received. We believe that our audits provide a reasonable basis for our opinion.
In our opinion, the financial statements and financial highlights referred to above present fairly, in all material respects, the financial position of TS&W/Claymore Tax-Advantaged Balanced Fund at December 31, 2010, and the results of its operations for the year then ended, the changes in its net assets for each of the two years in the period then ended, and the financial highlights for each of the five years in the period then ended, in conformity with U.S. generally accepted accounting principles.
Chicago, Illinois
February 24, 2011
Annual Report l December 31, 2010 l 27
TYW l TS&W/Claymore Tax-Advantaged Balanced Fund
Supplemental Information l (unaudited)
Federal Income Tax Information
Qualified dividend income of as much as $3,884,183 was received by the Fund through December 31, 2010. The Fund intends to designate the maximum amount of dividends that qualify for the reduced tax rate pursuant to the Jobs and Growth Tax Relief Reconciliation Act of 2003.
For corporate shareholders, $3,189,722 of investment income qualifies for the dividends-received deduction.
Subchapter M on the Internal Revenue Code of 1986, as amended, required the Fund to advise shareholders within 60 days of the Fund’s tax year end as to the federal tax status of dividends and distributions received by shareholders during such tax period. The Fund hereby designates $6,989,961 as tax-exempt income according to IRC Section 852(b)(5)(A).
In January 2011, you will be advised on IRS Form 1099 DIV or substitute 1099 DIV as to the federal tax status of the distributions received by you in the calendar year 2010.
Result of Shareholder Votes
The Annual Meeting of Shareholders of the Fund was held on July 19, 2010. Holders of the Fund’s auction market preferred shares, par value $0.01 per share, liquidation preference $25,000 per share (“Preferred Shares”) voted on the election of one Class III Trustee to serve until the Fund’s 2013 Annual Meeting of Shareholders or until a successor shall have been elected and qualified. The Annual Meeting of Shareholders of the Fund was reconvened on August 9, 2010. Holders of the Preferred Shares and holders of the Fund’s common share of beneficial interest, par value $0.01 per share (“Common Shares”) voted together as a single class on the election of one Class III Trustees to serve until the Fund’s 2013 Annual Meeting of Shareholders or until a successor shall have been elected and qualified, and on a proposal that the Board take the necessary steps to declassify the Board so that all Trustees are elected on an annual basis.
Voting results with respect to the election of one Class III Trustee by the holders of Preferred Shares voting as a separate class are set forth below1: | | |
| | # of Shares for | # of Shares for | # of Shares |
| | Ronald E. Toupin, Jr. | Robert A. Wood | Withheld |
| Class III Trustee | 81 | 21 | 4,001 |
Voting results with respect to the election of one Class III Trustee by holders of Preferred Shares and holders of Common Shares voting as a single class are set forth below2: | |
| | # of Shares for | # of Shares for | # of Shares |
| | Steven D. Cosler | Neil Chelo | Withheld |
| Class III Trustee | 3,501,047 | 3,903,919 | 677,143 |
The other Trustees of the Fund whose terms did not expire in 2010 are Matthew J. Appelstein, Randall C. Barnes, Robert M. Hamje, L. Kent Moore and Ronald A. Nyberg.
Voting results with respect to the proposal that the Board take the necessary steps to declassify the Board so that all Trustees are elected on an annual basis by holders of Preferred Shares and holders of Common Shares voting as a single class are set forth below3:
| | # of Shares | # of Shares | # of Shares |
| | In Favor | Against | Abstained |
| | 4,967,647 | 2,831,397 | 263,063 |
| 1 | Neither nominee for election as a Class III Trustee by holders of Preferred Shares voting as a separate class received a majority of the votes of the Preferred Shares present necessary to be elected. As a result, the incumbent Class III Trustee Ronald E. Toupin, Jr. will continue to serve as trustee until such time as his respective successor is duly elected and qualified. It is expected that Mr. Toupin is expected to stand for election again at the Fund’s 2011 annual meeting of shareholders. |
| 2 | With respect to the election of a Class IIITrustee by holders of Common Shares and Preferred Shares voting as a single class, neither nominee received the required majority necessary to be elected. As a result, the incumbent Class IIITrustee Mr. Steven D. Cosler will continue to serve as trustee until such time as his respective successor is duly elected and qualified. It is expected that Mr. Cosler will again stand for election at the Fund’s 2011 annual meeting of shareholders. |
| 3 | The shareholders approved the proposal requesting that the Board of Trustees of TYW take the necessary steps to declassify the Board of Trustees so that all trustees are elected on an annual basis. |
28 l Annual Report l December 31, 2010
TYW l TS&W/Claymore Tax-Advantaged Balanced Fund l Supplemental Information (unaudited) continued
Trustees
The Trustees of the TS&W/Claymore Tax-Advantaged Balanced Fund and their principal occupations during the past five years:
| | | | Number of | |
| Name, Address*, | | | Portfolios in | |
| Year of Birth | Term of | | the Fund | |
and Position(s) | Office** and | | Complex*** | |
| Held with | Length of | Principal Occupations During the Past Five Years | Overseen | Other Directorships |
| Registrant | Time Served | and Other Affiliations | by Trustee | Held by Trustee |
| Independent Trustees: | | | | |
| Randall C. Barnes | Since 2005 | Private Investor (2001-present). Formerly, Senior Vice President & | 53 | None. |
| Year of Birth: 1951 | | Treasurer, PepsiCo., Inc. (1993-1997), President, Pizza Hut International | | |
| Trustee | | (1991-1993) and Senior Vice President, Strategic Planning and New Business Development (1987-1990) of PepsiCo, Inc. (1987-1997). | | |
| Steven D. Cosler | Since 2005 | Retired. Formerly, President, Chief Executive Officer and Director of | 2 | Director, SXC |
| Year of Birth: 1955 | | Priority Healthcare Corp. (2002-2005). Formerly, President and Chief | | Health Solutions. |
| Trustee | | Operating Officer of Priority Healthcare Corp. (2001-2002). Formerly, | |
| | | Executive Vice President and Chief Operating Officer of Priority Healthcare Corp.(2000-2001). | | |
| Robert M. Hamje | Since 2004 | Retired. Formerly, President and Chief Investment Officer of TRW | 2 | Trustee, Old Mutual |
| Year of Birth: 1942 | | Investment Management Co. (1990-2003). | | Advisor Mutual Funds. |
| Trustee | | | | |
| L. Kent Moore | Since 2004 | Owner, Eagle River Ventures, LLC (1999-present) and Chairman | 2 | Trustee, Old Mutual |
| Year of Birth: 1955 | | Foothills Energy Ventures, LLC (2006-present). Formerly, Partner | | Advisor Mutual Funds. |
| Trustee | | at WilSource Enterprise (2005-2006). Managing Director High Sierra Energy L.P., (2004-2005). Portfolio Manager and Vice President of Janus Capital Corp. (2000-2002) and Senior Analyst/ | | |
| | | Portfolio Manager of Marsico Capital Management (1997-1999). | |
| Ronald A. Nyberg | Since 2004 | Partner of Nyberg & Cassioppi, LLC, a law firm specializing in | 55 | None. |
| Year of Birth: 1953 | | corporate law, estate planning and business transactions | | |
| Trustee | | (2000-present). Formerly, Executive Vice President, General Counsel and Corporate Secretary of Van Kampen Investments (1982-1999). | | |
| Ronald E. Toupin, Jr. | Since 2004 | Portfolio Consultant (2010-present). Formerly, Vice President, | 52 | None. |
| Year of Birth: 1958 | | Manager and Portfolio Manager of Nuveen Asset Management | | |
| Trustee | | (1998-1999), Vice President of Nuveen Investment Advisory Corp. (1992-1999), Vice President and Manager of Nuveen Unit Investment | | |
| | | Trusts (1991-1999), and Assistant Vice President and Portfolio Manager of Nuveen Unit Investment Trusts (1988-1999), | | |
| | | each of John Nuveen & Company, Inc. (1982-1999). | | |
| | | | | |
| Interested Trustees: | | | | |
| Matthew J. Appelstein† | Since 2005 | Senior Vice President of Product Strategy and Retirement Solutions | 1 | None. |
| Year of Birth: 1961 | | Planning, Director of Investment Services, Old Mutual Asset | |
| Trustee | | Management (2003-present). Formerly, Senior Vice President of ConsultingRelationships, Fidelity Management Trust Co.(1998-2003). | | |
| * | Address for all Trustees: 2455 Corporate West Drive, Lisle, IL 60532 |
| ** | Each Trustee is expected to serve a three-year term concurrent with the class of Trustees for which he serves. |
| | -Messrs. Barnes and Hamje, as Class I Trustees, are expected to stand for re-election at the Fund’s 2011 annual meeting of shareholders. |
| | -Messrs. Appelstein, Moore and Nyberg, as Class II Trustees, are expected to stand for re-election at the Fund’s 2012 annual meeting of shareholders. |
| | -Messrs. Cosler and Toupin, as Class III Trustees, are expected to stand for re-election at the Fund’s 2011 annual meeting of shareholders to serve a two-year term until the Fund’s 2013 annual meeting of shareholders. |
| *** | The Guggenheim Funds Complex consists of U.S. registered investment companies advised or serviced by Guggenheim Funds Investment Advisors, LLC or Guggenheim Funds Distributors, Inc. The Guggenheim Funds Complex is overseen by multiple Boards of Trustees. |
| † | Mr. Appelstein is an“interested person”(as defined in Section 2(a)(19) of the 1940 Act) of the Fund because of his position as an officer of Old Mutual Asset Management, the parent company of the Fund’s Sub-Adviser. |
Annual Report l December 31, 2010 l 29
TYW l TS&W/Claymore Tax-Advantaged Balanced Fund l Supplemental Information (unaudited) continued
Officers
The Officers of the TS&W/Claymore Tax-Advantaged Balanced Fund and their principal occupations during the past five years:
| Name, Address*, | Term of | |
| Year of Birth and | Office** and | |
| Position(s) Held | Length of Time | Principal Occupations During the Past Five Years |
| with Registrant | Served | and Other Affiliations |
| Officers: | | |
| Kevin Robinson | | Senior Managing Director and General Counsel of Guggenheim Funds Investment Advisors, |
| Year of Birth: 1959 | | LLC, Guggenheim Funds Distributors, Inc. and Guggenheim Funds Services Group, Inc. |
| Chief Executive Officer | Since 2010 | (2007-present). Chief Executive Officer and Chief Legal Officer of certain other funds in the |
| Chief Legal Officer | Since 2008 | Fund Complex. Formerly, Associate General Counsel and Assistant Corporate Secretary of NYSE Euronext, Inc. (2000-2007). |
| John Sullivan | Since 2011 | Senior Managing Director of Guggenheim Funds Investment Advisors, LLC and Guggenheim |
| Year of Birth: 1955 | | Funds Distributors, Inc. Formerly, Chief Compliance Officer, Van Kampen Funds (2004–2010). |
| Chief Accounting Officer, | | Head of Fund Accounting, Morgan Stanley Investment Management (2002–2004). Chief |
| Chief Financial Officer and | | Financial Officer, Treasurer, Van Kampen Funds (1996-2004). |
| Treasurer | | |
| Vincent R. Giordano | Since 2004 | Senior Managing Director of SMC Fixed Income Management, LP. (2006-present). Formerly, |
| Year of Birth: 1948 | | Senior Managing Director of Guggenheim Funds Investment Advisors, LLC (2004-2006). |
| Vice President | | Formerly, Senior Vice President and Portfolio Manager of Merrill Lynch Asset Management, Inc.(1985-2001). |
| Roberto W. Roffo | Since 2004 | Managing Director of SMC Fixed Income Management, LP (2006-present). Formerly, Managing |
| Year of Birth: 1966 | | Director of Guggenheim Funds Investment Advisors, LLC (2004-2006). Formerly, Director and |
| Vice President | | Vice President of Merrill Lynch Investment Managers. |
| Bruce Saxon | Since 2006 | Vice President, Fund Compliance Officer of Guggenheim Funds Services Group, Inc. |
| Year of Birth: 1957 | | (2006-present). Formerly, Chief Compliance Officer/Assistant Secretary of Harris Investment |
| Chief Compliance Officer | | Management, Inc. (2003-2006).Formerly, Director-Compliance of Harrisdirect LLC (1999-2003). |
| Elizabeth H. Hudson | Since 2009 | Assistant General Counsel of Guggenheim Funds Services Group, Inc. (2009-present). |
| Year of Birth: 1980 | | Secretary of certain funds in the Fund Complex. Formerly, Associate at Bell, Boyd & Lloyd |
| Secretary | | LLP (nka K&L Gates LLP) (2007-2008); J.D., Northwestern University (2004-2007). |
| * | Address for all Officers: 2455 Corporate West Drive, Lisle, IL 60532 |
| ** | Officers serve at the pleasure of the Board of Trustees and until his or her successor is appointed and qualified or until his or her earlier resignation or removal. |
30 l Annual Report l December 31, 2010
TYW l TS&W/Claymore Tax-Advantaged Balanced Fund
Dividend Reinvestment Plan l (unaudited)
Unless the registered owner of common shares elects to receive cash by contacting the Plan Administrator, all dividends declared on common shares of the Fund will be automatically reinvested by The Bank of New York Mellon (the“Plan Administrator”), Administrator for shareholders in the Fund’s Dividend Reinvestment Plan (the“Plan”), in additional common shares of the Fund. Participation in the Plan is completely voluntary and may be terminated or resumed at any time without penalty by notice if received and processed by the Plan Administrator prior to the dividend record date; otherwise such termination or resumption will be effective with respect to any subsequently declared dividend or other distribution. Some brokers may automatically elect to receive cash on your behalf and may re-invest that cash in additional common shares of the Fund for you. If you wish for all dividends declared on your common shares of the Fund to be automatically reinvested pursuant to the Plan, please contact your broker.
The Plan Administrator will open an account for each common shareholder under the Plan in the same name in which such common shareholder’s common shares are registered. Whenever the Fund declares a dividend or other distribution (together, a“Dividend”) payable in cash, non-participants in the Plan will receive cash and participants in the Plan will receive the equivalent in common shares. The common shares will be acquired by the Plan Administrator for the participants’accounts, depending upon the circumstances described below, either (i) through receipt of additional unissued but authorized common shares from the Fund (“Newly Issued Common Shares”) or (ii) by purchase of outstanding common shares on the open market (“Open-Market Purchases”) on the New York Stock Exchange or elsewhere. If, on the payment date for any Dividend, the closing market price plus estimated brokerage commission per common share is equal to or greater than the net asset value per common share, the Plan Administrator will invest the Dividend amount in Newly Issued Common Shares on behalf of the participants. The number of Newly Issued Common Shares to be credited to each participant’s account will be determined by dividing the dollar amount of the Dividend by the net asset value per common share on the payment date; provided that, if the net asset value is less than or equal to 95% of the closing market value on the payment date, the dollar amount of the Dividend will be divided by 95% of the closing market price per common share on the payment date. If, on the payment date for any Dividend, the net asset value per common share is greater than the closing market value plus estimated brokerage commission, the Plan Administrator will invest the Dividend amount in common shares acquired on behalf of the participants in Open-Market Purchases.
If, before the Plan Administrator has completed its Open-Market Purchases, the market price per common share exceeds the net asset value per common share, the average per common share purchase price paid by the Plan Administrator may exceed the net asset value of the common shares, resulting in the acquisition of fewer common shares than if the Dividend had been paid in Newly Issued Common Shares on the Dividend payment date. Because of the foregoing difficulty with respect to Open-Market Purchases, the Plan provides that if the Plan Administrator is unable to invest the full Dividend amount in Open-Market Purchases during the purchase period or if the market discount shifts to a market premium during the purchase period, the Plan Administrator may cease making Open-Market Purchases and may invest the uninvested portion of the Dividend amount in Newly Issued Common Shares at net asset value per common share at the close of business on the Last Purchase Date provided that, if the net asset value is less than or equal to 95% of the then current market price per common share; the dollar amount of the Dividend will be divided by 95% of the market price on the payment date.
The Plan Administrator maintains all shareholders’accounts in the Plan and furnishes written confirmation of all transactions in the accounts, including information needed by shareholders for tax records. Common shares in the account of each Plan participant will be held by the Plan Administrator on behalf of the Plan participant, and each shareholder proxy will include those shares purchased or received pursuant to the Plan. The Plan Administrator will forward all proxy solicitation materials to participants and vote proxies for shares held under the Plan in accordance with the instruction of the participants. There will be no brokerage charges with respect to common shares issued directly by the Fund. However, each participant will pay a pro rata share of brokerage commission incurred in connection with Open-Market Purchases. The automatic reinvestment of Dividends will not relieve participants of any Federal, state or local income tax that may be payable (or required to be withheld) on such Dividends.
The Fund reserves the right to amend or terminate the Plan. There is no direct service charge to participants with regard to purchases in the Plan; however, the Fund reserves the right to amend the Plan to include a service charge payable by the participants.
All correspondence or questions concerning the Plan should be directed to the Plan Administrator, BNY Mellon Shareowner Services, P.O. Box 358015, Pittsburgh, Pennsylvania 15252-8015, Attention: Shareholder Services Department, Phone Number: (866) 488-3559.
Annual Report l December 31, 2010 l 31
This Page Intentionally Left Blank.
This Page Intentionally Left Blank.
This Page Intentionally Left Blank.
TYW l TS&W/Claymore Tax-Advantaged Balanced Fund
Fund Information l
| Board of Trustees | Officers | Investment Manager – | Preferred Stock - |
| Matthew J.Appelstein* | Kevin Robinson | Equity and Income | Dividend Paying Agent |
| | Chief Executive Officer and | Thompson, Siegel & | The Bank of |
| Randall C. Barnes | Chief Legal Officer | Walmsley LLC | New York Mellon |
| | | Richmond,Virginia | New York, New York |
| Steven D. Cosler | John Sullivan | | |
| | Chief Financial Officer, | Investment Manager – | Legal Counsel |
| Robert M. Hamje | Chief Accounting Officer | Municipals | |
| | and Treasurer | SMC Fixed Income | Meagher & Flom LLP |
| L. Kent Moore | | Management, LP | New York, New York |
| | Vincent R. Giordano | Princeton, New Jersey | |
| Ronald A. Nyberg | Vice President | | Independent Registered |
| | | Investment Adviser and | Public Accounting Firm |
| Ronald E.Toupin, Jr. | Roberto W. Roffo | Administrator | |
| | Vice President | Guggenheim Funds | |
| * Trustee is an “interested person” of the | | Investment Advisors, LLC | |
| Fund as defined in the Investment | Bruce Saxon | (Formerly known as | |
| Company Act of 1940, as amended. | Chief Compliance Officer | Claymore Advisors, LLC) | |
| | | Lisle, Illinois | |
| | Elizabeth H. Hudson | | |
| | Secretary | Custodian and | |
| | | Transfer Agent | |
| | | The Bank of | |
| | | New York Mellon | |
| | | New York, New York | |
Privacy Principles of TS&W/Claymore Tax-Advantaged Balanced Fund for Shareholders
The Fund is committed to maintaining the privacy of its shareholders and to safeguarding its non-public personal information. The following information is provided to help you understand what personal information the Fund collects, how we protect that information and why, in certain cases, we may share information with select other parties.
Generally, the Fund does not receive any non-public personal information relating to its shareholders, although certain non-public personal information of its shareholders may become available to the Fund. The Fund does not disclose any non-public personal information about its shareholders or former shareholders to anyone, except as permitted by law or as is necessary in order to service shareholder accounts (for example, to a transfer agent or third party administrator).
The Fund restricts access to non-public personal information about the shareholders to Guggenheim Funds Investment Advisors, LLC employees with a legitimate business need for the information. The Fund maintains physical, electronic and procedural safeguards designed to protect the non-public personal information of its shareholders.
Questions concerning your shares of TS&W/Claymore Tax-Advantaged Balanced Fund?
| · | If your shares are held in a Brokerage Account, contact your Broker. |
| · | If you have physical possession of your shares in certificate form, contact the Fund’s Custodian and Transfer Agent: |
| | The Bank of New York Mellon, 101 Barclay 11E,, New York, NY 10286; (866) 488-3559 |
This report is sent to shareholders of TS&W/Claymore Tax-Advantaged Balanced Fund for their information. It is not a Prospectus, circular or representation intended for use in the purchase or sale of shares of the Fund or of any securities mentioned in this report.
A description of the Fund’s proxy voting policies and procedures related to portfolio securities is available without charge, upon request, by calling the Fund at (866)882-0688.
Information regarding how the Fund voted proxies for portfolio securities, if applicable, during the most recent 12-month period ended December 31, is also available, without charge and upon request by calling (866)882-0688, by visiting the Fund’s website at www.guggenheimfunds.com/tyw or by accessing the Fund’s Form N-PX on the U.S. Securities and Exchange Commission’s (“SEC”) website at www.sec.gov.
The Fund files its complete schedule of portfolio holdings with the SEC for the first and third quarters of each fiscal year on Form N-Q. The Fund’s Form N-Q is available on the SEC website at www.sec.gov or by visiting the Fund’s website at www.guggenheimfunds.com/tyw. The Fund’s Form N-Q may also be viewed and copied at the SEC’s Public Reference Room in Washington, DC; information on the operation of the Public Reference Room may be obtained by calling (800) SEC-0330.
Notice to Shareholders
Notice is hereby given in accordance with Section 23(c) of the Investment Company Act of 1940, as amended, that the Fund may from time to time purchase its shares of common stock and preferred stock in the open market.
Effective 7/19/2010, the By-Laws of the Fund were changed as follows: If the Shareholders of any class or series of Shares are entitled separately to elect one or more Trustees, only such persons who are holders of record of such class of series of Shares at the time such person provides notice of nomination to the Fund shall be entitled to nominate persons for election as Trustee by such class or series of Shares voting separately.
Annual Report l December 31, 2010 l 35
TYW l TS&W/Claymore Tax-Advantaged Balanced Fund
About the Fund Managers l
TS&W/ClaymoreTax-Advantaged Balanced Fund (TYW) is managed jointly by seasoned investment professionals from SMC Fixed Income Management, LP andThompson, Siegel &Walmsley LLC.The teams employ their specialized experience to different sleeves within the Fund, but work closely with one another to collectively guide the overall operations of TYW.
Guggenheim Funds Investment Advisors, LLC
Guggenheim Funds Investment Advisors, LLC is a registered investment adviser that provides investment management and research-related services to registered investment companies. Guggenheim Funds Investment Advisors, LLC is responsible for the Fund’s overall asset allocation.
SMC Fixed Income Management, LP
SMC Fixed Income Management, LP (“SMC”) is a subsidiary of Spring Mountain Capital LP (“Spring Mountain”). Spring Mountain is an investment management firm founded in July 2001 that specializes in alternative investments and advisory services for both broad asset allocation and/or focused portfolios.
SMC’s Investment Philosophy and Process
SMC attempts to identify investment grade and below-investment grade municipal securities that are trading at attractive valuations relative to the Firm’s evaluation of the issuer’s creditworthiness, and with respect to private activity bonds, the profit potential of the corporation from which the revenue supporting the bonds is derived.
The municipal management team begins their credit selection process by analyzing broad macroeconomic trends and developments affecting the fixed-income markets.The managers analyze the economic outlook, market conditions and perceived effects on interest rates and yield curves. From there they incorporate a bottom-up and top-down analysis that helps construct a portfolio that the managers believe optimizes federally tax-exempt income while seeking to avoid undue credit risk and market timing risk. SMC’s proprietary, unbiased research helps the managers identify undervalued sectors that they believe have the potential for ratings upgrades and capital appreciation.
Thompson, Siegel & Walmsley LLC (TS&W)
Thompson, Siegel & Walmsley LLC (TS&W) is a registered investment adviser founded in 1969 in Richmond, Virginia and provides investment management services to corporations, pension and profit-sharing plans, 401(k) and thrift plans, open and closed-end mutual funds, trusts, estates and other institutions and individuals.The firm is a majority owned subsidiary of Old Mutual (US) Holdings Inc.TS&W is responsible for the day-today management of the equity and taxable income securities portion of the Fund.
TS&W Investment Philosophy and Process
Thompson, Siegel & Walmsley LLC’s investment process is value-driven and team-oriented.TS&W pursues a relative value-oriented philosophy and focuses its equity selection on the higher dividend paying stocks that meet its investment criteria.TS&W’s investment process uses a combination of quantitative and qualitative methods based on a four-factor screen. Parts one and two of the screen attempt to assess a company’s attractiveness based on cash flows relative to other stocks and as compared to their industry or sector peers.The third factor considers the relative earnings prospects of the company.The fourth factor involves looking at the company’s recent price action.TS&W generally limits its investment universe to those companies with a minimum of three years of sound operating history.
TS&W’s analysts also perform rigorous fundamental analysis, exploring numerous factors that may affect the outlook for a company.They evaluate publicly available information including sell-side research, company filings, and trade periodicals.The analysts may speak with company management to hear their perspectives and outlook on the pertinent business issues.They apply a consistent and disciplined review in a team environment that encourages critical thinking and analysis for each company considered for investment.
Established positions in the portfolio are ranked daily and are reviewed regularly in the same manner to re-examine their fundamental and valuation characteristics.The product team meets periodically to discuss each stock’s place in the portfolio.TS&W employs a consistent sell discipline.
TS&W’s Fixed-Income team is responsible for overall bond market strategy as well as security selection. In-house analysts are used to support the credit review process.
Guggenheim Funds Distributors, Inc.
2455 Corporate West Drive
Lisle, IL 60532
Member FINRA/SIPC (02/11)
NOT FDIC-INSURED l NOT BANK- GUARANTEED l MAY LOSE VALUE
TYW-AR-1210
Item 2. Code of Ethics.
(a) The registrant has adopted a code of ethics (the "Code of Ethics") that applies to its principal executive officer, principal financial officer, principal accounting officer or controller, or persons performing similar functions.
(b) No information need be disclosed pursuant to this paragraph.
(c) The registrant has not amended its Code of Ethics during the period covered by the shareholder report presented in Item 1 hereto.
(d) The registrant has not granted a waiver or an implicit waiver to its principal executive officer, principal financial officer, principal accounting officer or controller, or persons performing similar functions from a provision of its Code of Ethics during the period covered by this report.
(e) Not applicable.
(f) (1) The registrant's Code of Ethics is attached hereto as an exhibit.
(2) Not applicable.
(3) Not applicable.
Item 3. Audit Committee Financial Expert.
The registrant’s Board of Trustees has determined that it has at least one audit committee financial expert serving on its audit committee (the “Audit Committee”), Randall C. Barnes. Mr. Barnes is an “independent” Trustee, as defined in Item 3 of Form N-CSR. Mr. Barnes qualifies as an audit committee financial expert by virtue of his experience obtained as a former Senior Vice President, Treasurer of PepsiCo, Inc.
(Under applicable securities laws, a person who is determined to be an audit committee financial expert will not be deemed an "expert" for any purpose, including without limitation for the purposes of Section 11 of the Securities Act of 1933, as amended, as a result of being designated or identified as an audit committee financial expert. The designation or identification of a person as an audit committee financial expert does not impose on such person any duties, obligations, or liabilities that are greater than the duties, obligations, and liabilities imposed on such person as a member of the audit committee and Board of Trustees in the absence of such designation or identification. The designation or identification of a person as an audit committee financial expert doesn’t affect the duties, obligations or liability of any other member of the audit committee or Board of Trustees.)
Item 4. Principal Accountant Fees and Services.
(a) Audit Fees: the aggregate fees billed for professional services rendered by the principal accountant for the audit of the registrant’s annual financial statements or services that are normally
provided by the accountant in connection with statutory and regulatory filings or engagements were $40,500 and $40,500 for the fiscal years ending December 31, 2010, and December 31, 2009, respectively.
(b) Audit-Related Fees: the aggregate fees billed for assurance and related services by the principal accountant that are reasonably related to the performance of the audit of the registrant’s financial statements and are not reported under paragraph (a) of this Item were $6,300 and $6,300 for the fiscal years ending December 31, 2010, and December 31, 2009, respectively. Specifically, this amount represents the amount paid for the audit of the preferred shares asset coverage test.
The registrant's principal accountant did not bill fees for non-audit services that required approval by the Audit Committee pursuant to paragraph (c)(7)(ii) of Rule 2-01 of Regulation S-X during the Registrant's last two fiscal years.
(c) Tax Fees: the aggregate fees billed for professional services rendered by the principal accountant for tax compliance, tax advice, and tax planning including federal, state and local income tax return preparation and related advice and determination of taxable income and miscellaneous tax advice were $6,900 and $6,900 for the fiscal years ending December 31, 2010 and December 31, 2009, respectively.
The registrant's principal accountant did not bill fees for non-audit services that required approval by the Audit Committee pursuant to paragraph (c)(7)(ii) of Rule 2-01 of Regulation S-X during the Registrant's last two fiscal years.
(d) All Other Fees: the aggregate fees billed for products and services provided by the principal accountant, other than the services reported in paragraphs 4(a) through 4(c) of this Item were $0 and $0 for the fiscal years ending December 31, 2010, and December 31, 2009, respectively.
The registrant’s principal accountant did not bill fees for non-audit services that required approval by the registrant’s audit committee pursuant to paragraph (c)(7)(ii) of Rule 2-01 of Regulation S-X during the Registrant’s last two fiscal years.
| (e) | Audit Committee Pre-Approval Policies and Procedures. |
(i) The Registrant’s audit committee reviews, and in its sole discretion, pre-approves, pursuant to written pre-approval procedures (A) all engagements for audit and non-audit services to be provided by the principal accountant to the registrant and (B) all engagements for non-audit services to be provided by the principal accountant (1) to the registrant’s investment adviser (not including a sub-adviser whose role is primarily portfolio management and is sub-contracted or overseen by another investment adviser) and (2) to any entity controlling, controlled by or under common control with the registrant’s investment adviser that provides ongoing services to the registrant; but in the case of the services described in subsection (B)(1) or (2), only if the engagement relates directly to the operations and financial reporting of the registrant; provided that such pre-approval need not be obtained in circumstances in which the pre-approval requirement is waived under rules promulgated by the Securities and Exchange Commission or New York Stock Exchange listing standards. Sections IV.C.2 and IV.C.3 of the Audit Committee’s revised Audit Committee Charter contain the Audit Committee’s Pre-Approval Policies and Procedures and such sections are included below.
| | IV.C.2 | Pre-approve any engagement of the independent auditors to provide any non-prohibited services to the Trust, including the fees and other compensation to be paid to the |
| | independent auditors (unless an exception is available under Rule 2-01 of Regulation S-X). |
(a) The Chairman or any member of the Audit Committee may grant the pre-approval of services to the Fund for non-prohibited services up to $10,000. All such delegated pre-approvals shall be presented to the Audit Committee no later than the next Audit Committee meeting.
| | IV.C.3 | Pre-approve any engagement of the independent auditors, including the fees and other compensation to be paid to the independent auditors, to provide any non-audit services to the Adviser (or any “control affiliate” of the Adviser providing ongoing services to the Trust), if the engagement relates directly to the operations and financial reporting of the Trust (unless an exception is available under Rule 2-01 of Regulation S-X). |
| (a) | The Chairman or any member of the Audit Committee may grant the pre-approval for non-prohibited services to the Adviser up to $10,000. All such delegated pre-approvals shall be presented to the Audit Committee no later than the next Audit Committee meeting. |
(ii) None of the services described in each of Items 4(b) through Item 4(d) were approved by the audit committee pursuant to paragraph (c)(7)(i)(C) of Rule 2-01 of Regulation S-X.
(f) Not Applicable.
(g) The aggregate non-audit fees billed by the registrant's accountant for services rendered to the registrant, the registrant’s investment adviser (not including a sub-adviser whose role is primarily portfolio management and is sub-contracted with or overseen by another investment adviser) and or any entity controlling, controlled by, or under common control with the adviser that provides ongoing services to the registrant that directly related to the operations and financial reporting of the registrant was $13,200 and $13,200 for the fiscal years ending December 31, 2010, and December 31, 2009, respectively.
(h) Not Applicable.
Item 5. Audit Committee of Listed Registrants.
(a) The registrant has a separately designated standing audit committee established in accordance with Section 3(a)(58)(A) of the Securities Exchange Act of 1934, as amended. The audit committee of the registrant is composed of: Randall C. Barnes, Steven D. Cosler, Robert M. Hamje, L. Kent Moore, Ronald A. Nyberg and Ronald E. Toupin, Jr.
(b) Not Applicable.
Item 6. Schedule of Investments.
The Schedule of Investments is included as part of Item 1.
Item 7. Disclosure of Proxy Voting Policies and Procedures for Closed-End Management Investment Companies.
The registrant has delegated the voting of proxies relating to its voting securities to the investment sub-adviser of its equity portfolio, Thompson, Siegel & Walmsley LLC (“TS&W"). TS&W’s proxy voting polices and procedures are included as an exhibit hereto.
Item 8. Portfolio Managers of Closed-End Management Investment Companies.
(a)(1) TS&W is responsible for the day-to-day management of the equity and income securities portion of the registrant’s portfolio. SMC Fixed Income Management, LP (“SMC”) also serves as investment sub-adviser to the registrant and is responsible for the day-to-day management of the municipal securities portion of the registrant’s portfolio.
TS&W Portfolio Managers
The following individuals at TS&W share primary responsibility for the management of the equity and income securities portion of the registrant’s portfolio:
| Name | Since | Professional Experience |
| William M. Bellamy, CFA, Portfolio Manager | 2004 | Mr. Bellamy is a member of the Investment Policy Committee and has over 17 years of experience working with fixed income securities. Prior to joining Thompson, Siegel & Walmsley LLC in 2002, Mr. Bellamy was with Trusco Capital Management where he served as a Vice President, Fixed Income Portfolio Manager. Prior to Trusco, he was employed with First Union Capital Markets, Clayton Brown & Associates and Merrill Lynch Capital Markets in Institutional Fixed Income Sales. Mr. Bellamy received his Bachelor of Science from Cornell University and his MBA from Duke University. |
| Paul A. Ferwerda, CFA, Portfolio Manager | 2004 | Mr. Ferwerda is a member of the Investment Policy Committee and brings to the investment team 20 years experience with the firm and 24 years overall investment experience. Mr. Ferwerda contributes significant research expertise within the Financial sector. Prior to joining the firm, Mr. Ferwerda was a Portfolio Manager with AmSouth Bank in Birmingham, AL. He received his Bachelor of Science degree from Auburn University and his MBA from Duke University. |
Mr. Ferwerda is responsible for managing the qualified dividend income (“QDI”) portion of the Fund. Mr. Bellamy is responsible for managing the non-QDI portion of the Fund, including high yield bonds, preferred stocks and real estate investment trusts.
SMC Portfolio Managers
The following individuals at SMC share primary responsibility for the management of the municipal securities portion of the registrant’s portfolio:
| Name | Since | Professional Experience |
Vincent R. Giordano | 2004 | Senior Managing Director and Portfolio Manager of SMC Fixed Income Management. Previously, Senior Managing Director of Claymore Advisors, LLC; Senior Vice President and Portfolio Manager of Merrill Lynch Asset Management, Inc. |
| Roberto W. Roffo | 2004 | Senior Managing Director and Portfolio Manager of SMC Fixed Income Management. Previously, Senior Managing Director of Claymore Advisors, LLC; Director and Vice President of Merrill Lynch Investment Managers. |
Mr. Roffo is responsible for identifying investment opportunities and executing transactions on behalf of the municipal securities portion of the registrant’s portfolio. Mr. Giordano oversees Mr. Roffo’s activities and works jointly with Mr. Roffo to formulate investment strategies.
The information disclosed in this paragraph (a)(1) of Item 8 is provided as of December 31, 2010.
(a)(2)
TS&W Other Accounts Managed
TS&W does not manage any accounts for which the advisory fee is based upon the performance of the account. The following table summarizes information regarding each of the other accounts managed by the TS&W portfolio managers as of December 31, 2010:
| | | Registered Investment Companies | | Other Pooled Investment Vehicles | | Other Accounts |
Name | | # of Accounts | | Total Assets | | # of Accounts | | Total Assets | | # of Accounts | | Total Assets |
William M. Bellamy Paul A. Ferwerda | | 1 0 | | | $57.2M 0 | | 0 0 | | | 0 0 | | 30 8 | | | $696.5M $104.9M |
SMC Other Accounts Managed
SMC does not manage any accounts for which the advisory fee is based upon the performance of the account. The following table summarizes information regarding each of the other accounts managed by the SMC portfolio managers as of December 31, 2010:
| | | Registered Investment Companies | | Other Pooled Investment Vehicles | | Other Accounts |
Name | | # of Accounts | | Total Assets | | # of Accounts | | Total Assets | | # of Accounts | | Total Assets |
Vincent R. Giordano Roberto W. Roffo | | 0 0 | | | 0 0 | | 0 0 | | | 0 0 | | 24 24 | | | $67.6M $67.6M |
TS&W Potential Conflicts of Interest
Three of the products TS&W advises are long-short strategies and may sell securities short. Procedures are in place to ensure that no primary security holding in accounts managed by TS&W will be shorted by any account advised by TS&W that utilizes the Four Factor investment process. The term “primary holdings” refer to any core holding in any of the firm’s equity products, including TYW. Primary holdings specifically exclude miscellaneous securities most frequently held in the taxable portfolios of TS&W’s clients.
Mr. Bellamy and Mr. Ferwerda do not manage accounts that can short securities. The portfolio managers responsible for those portfolios that can short securities are not separated from the rest of TS&W’s investment personnel and therefore have access to full information about TS&W’s investment research and the strategies being employed for accounts managed by TS&W.
Some other accounts managed by TS&W pay TS&W management fees at rates comparable to and in some cases lower than those paid by the registrant and other accounts managed by TS&W. Two of the long-short strategies that TS&W manages have performance fee incentives. As a result, TS&W may have a conflict between its own interests and the interests of its other investment advisory clients in managing these long-short accounts. TS&W has adopted various procedures and safeguards to mitigate these potential conflicts.
SMC Potential Conflicts of Interest
At times there may be instances when securities are being purchased or sold by SMC for more than one account. On a daily basis, SMC’s Chief Compliance Officer reviews and approves all trades for all accounts assuring that there has been fair allocation among accounts. When necessary, SMC’s Chief Compliance Officer will question the portfolio managers to assure fair allocation among all accounts managed has taken place.
(a)(3)
TS&W Portfolio Manager Compensation
TS&W compensates Mr. Bellamy and Mr. Ferwerda for their management of the equity and income producing securities portion of the registrant’s portfolio. Compensation is comprised of a fixed base salary and discretionary performance bonus that is based on the overall success of the firm, an individual’s responsibility and his/her performance versus expectations, which are reviewed annually. That evaluation includes the professional's own self-assessment of their years’ work relative to their responsibilities and also includes peer and supervisor evaluations. TS&W’s compensation strategy is to provide reasonable base salaries commensurate with an individual’s responsibility and provide performance bonus awards that can exceed base salary. A summary of the input goes to the Remuneration Committee of TS&W’s Board of Directors and they determine the specific compensation, salary plus bonus, for the individual. Total compensation of TS&W’s portfolio managers is not related to fund performance. In concurrence with Old Mutual (US) Holdings Inc., in May 2007, TS&W began to offer key employees the opportunity to purchase equity interest in TS&W and facilitate the awarding of equity interest to certain key employees as a component of long-term incentive compensation. Old Mutual (US) Holdings Inc. remains a majority owner.
Additionally, there is a qualified profit sharing plan and a long-term incentive plan, which is eligible for participation by all TS&W associates.
SMC Portfolio Manager Compensation
SMC compensates Mr. Giordano and Mr. Roffo for their management of the municipal securities portion of the registrant’s portfolio. Compensation consists of a fixed based salary and is based on the experience and qualifications of each portfolio manager. All SMC employees are also eligible to participate in a 401(k) plan, which does not include matching funds from any other party.
(a)(4)
TS&W Portfolio Manager Securities Ownership
The following table discloses the dollar range of equity securities of the registrant beneficially owned by each TS&W portfolio manager as of December 31, 2010:
| Name of Portfolio Manager | | Dollar Range of Equity Securities in Fund |
William M. Bellamy Paul A. Ferwerda | | None $10,001-$50,000 |
SMC Portfolio Manager Securities Ownership
The following table discloses the dollar range of equity securities of the registrant beneficially owned by each SMC portfolio manager as of December 31, 2010:
Name of Portfolio Manager | | Dollar Range of Equity Securities in Fund |
Vincent R. Giordano Roberto W. Roffo | | $10,001-$50,000 $1-$25,000 |
Item 9. Purchases of Equity Securities by Closed-End Management Investment Company and Affiliated Purchasers.
None.
Item 10. Submission of Matters to a Vote of Security Holders.
The registrant has not made any material changes to the procedures by which shareholders may recommend nominees to the registrant's Board of Trustees.
Item 11. Controls and Procedures.
(a) The registrant's principal executive officer and principal financial officer have evaluated the registrant's disclosure controls and procedures (as defined in Rule 30a3(c) under the Investment Company Act) as of a date within 90 days of this filing and have concluded based on such evaluation as required by Rule 30a-3(b) under the Investment Company Act of 1940, that the registrant's disclosure controls and procedures were effective, as of that date, in ensuring that information required to be disclosed by the registrant in this Form N-CSR was recorded, processed, summarized, and reported within the time periods specified in the Securities and Exchange Commission’s rules and forms.
(b) There were no changes in the registrant’s internal control over financial reporting (as defined in Rule 30a-3(d) under the Investment Company Act of 1940) that occurred during the registrant’s second fiscal quarter of the period covered by this report that have materially affected, or are reasonably likely to materially affect, the registrant’s internal control over financial reporting.
Item 12. Exhibits.
(a)(1) Code of Ethics for Chief Executive and Chief Financial Officer.
(a)(2) Certifications of principal executive officer and principal financial officer pursuant to Rule 30a-2(a) of the Investment Company Act.
(a)(3) Not Applicable.
(b) Certifications of principal executive officer and principal financial officer pursuant to Rule 30a-2(b) of the Investment Company Act and Section 906 of the Sarbanes-Oxley Act of 2002.
(c) Proxy Voting Policies and Procedures.
SIGNATURES
Pursuant to the requirements of the Securities Exchange Act of 1934 and the Investment Company Act of 1940, the registrant has duly caused this report to be signed on its behalf by the undersigned, thereunto duly authorized.
(Registrant) TS&W/Claymore Tax-Advantaged Balanced Fund
By: /s/ Kevin M. Robinson
Name: Kevin M. Robinson
Title: Chief Executive Officer and Chief Legal Officer
Date: March 9, 2011
Pursuant to the requirements of the Securities Exchange Act of 1934 and the Investment Company Act of 1940, this report has been signed by the following persons on behalf of the registrant and in the capacities and on the dates indicated.
By: /s/ Kevin M. Robinson
Name: Kevin M. Robinson
Title: Chief Executive Officer and Chief Legal Officer
Name: John Sullivan
Title: Chief Financial Officer, Chief Accounting Officer and Treasurer