UNITED STATES
SECURITIES AND EXCHANGE COMMISSION
Washington, D.C. 20549
FORM N-CSR
CERTIFIED SHAREHOLDER REPORT OF REGISTERED MANAGEMENT
INVESTMENT COMPANIES
Investment Company Act file number 811-21515
TS&W / Claymore Tax-Advantaged Balanced Fund
(Exact name of registrant as specified in charter)
| | |
2455 Corporate West Drive Lisle, IL | | 60532 |
| (Address of principal executive offices) | | (Zip code) |
Nicholas Dalmaso, Chief Legal and Executive Officer
TS&W / Claymore Tax-Advantaged Balanced Fund
2455 Corporate West Drive
Lisle, IL 60532
(Name and address of agent for service)
Registrant’s telephone number, including area code: (630) 505-3700
Date of fiscal year end: December 31,
Date of reporting period: December 31, 2004
Form N-CSR is to be used by management investment companies to file reports with the Commission not later than 10 days after the transmission to stockholders of any report that is required to be transmitted to stockholders under Rule 30e-1 under the Investment Company Act of 1940 (17 CFR 270.30e-1). The Commission may use the information provided on Form N-CSR in its regulatory, disclosure review, inspection, and policymaking roles.
A registrant is required to disclose the information specified by Form N-CSR, and the Commission will make this information public. A registrant is not required to respond to the collection of information contained in Form N-CSR unless the Form displays a currently valid Office of Management and Budget (“OMB”) control number. Please direct comments concerning the accuracy of the information collection burden estimate and any suggestions for reducing the burden to Secretary, Securities and Exchange Commission, 450 Fifth Street, NW, Washington, DC 20549-0609. The OMB has reviewed this collection of information under the clearance requirements of 44 U.S.C. Section 3507.
| Item 1. | Reports to Stockholders. |
The registrant’s annual report transmitted to shareholders pursuant to Rule 30e-1 under the Investment Company Act of 1940 is as follows: [Provide full text of annual report.]
| | | | |
| | | www.tswclaymore.com ... home port for the LATEST, most up-to-date INFORMATION about the TS&W/Claymore Tax-Advantaged Balanced Fund | | |

The shareholder report you are reading right now is just the beginning of the story. Online at tswclaymore.com, you will find:
| | • | | Daily, weekly and monthly data on share prices, distributions and more |
| | • | | Monthly portfolio overviews and performance analyses |
| | • | | Announcements, press releases and special notices |
| | • | | Fund and advisor contact information |
Thompson, Siegel & Walmsley, Inc. and Claymore Securities LLC, are constantly updating and expanding shareholder information services on the Fund’s website, in an ongoing effort to provide you with the most current information about how your Fund’s assets are managed, and the results of our efforts. It is just one more small way we are working to keep you better informed about your investment in the Fund.
| Annual Report | December 31, 2004
TYW | TS&W/Claymore Tax-Advantaged Balanced Fund
Dear Shareholder
We are pleased to submit our first annual report to the shareholders of TS&W/Claymore Tax-Advantaged Balanced Fund (the “Fund”). The Fund’s investment objective is to provide a high level of total after-tax return, including attractive tax-advantaged income. The Fund focuses its investments on securities that generate income that is either exempt from regular federal income tax or qualifies for federal income taxation at long-term capital gain rates (“tax-advantaged income”), while also offering the potential for capital appreciation through exposure to equity markets. We have constructed, what we feel, is an attractive portfolio of equity, high-yield and municipal securities that we believe is consistent with the Fund’s objective.
The Fund’s total return at net asset value (“NAV”) was 11.42% for the period from inception of the Fund (April 28, 2004) to December 31, 2004, outperforming the Fund’s benchmark. The Fund’s benchmark, which is comprised of 54% of the Lehman Brother’s Municipal Bond Index and 46% of the Russell 1000 Value Index, returned 9.47% during this same period. The Fund’s NAV return represents the portfolio value of the Fund and assumes reinvestment of the approximately $0.47 per common share of dividends that were paid during the period.
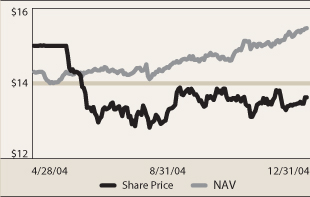
Although the Fund’s NAV rose from $14.33 per common share at the beginning of the period to $15.47 on December 31, 2004, the market price declined from $15.00 to $13.62 over the same period, representing a market price discount from NAV of 11.96%. As a result of this discount, the total return at market price for the period ended December 31, 2004 was -6. 05%. Although the Fund is currently trading at a discount from NAV, this discount over time, tends to provide higher compounded returns for shareholders who take advantage of the Dividend Reinvestment Plan (“DRIP”). When the Fund’s shares are trading at less than NAV, the DRIP reinvests distributions in shares purchased in the market at a price less than NAV. We are confident that, over the long term, the progress of the NAV will determine the performance of Fund shares.
Under normal market conditions, the Fund will invest at least 50%, and may invest up to 60% of its total assets in municipal securities. In addition, the Fund will invest at least 40%, and may invest up to 50% of its total assets in equity securities and other income-producing securities, of which, at least 25% will be invested in equity securities. As a result of this allocation, the common share dividends that were paid during the period had tax advantages. Of the $0.46875 per common share of dividends that were paid during 2004, approximately $0.20 of this dividend represented federally tax-exempt income and was not a preference item for the alternative minimum tax, while an additional $0.16 was comprised of qualified dividend income which is taxed at the favorable federal tax rate of 15%.
The Fund’s quarterly common share dividend of $.234375 per share represents an annualized yield of 6.25% based upon the Fund’s $15.00 initial offering price. Based upon the 2004 tax characteristics, this same yield represents a taxable equivalent yield of 8.36% for shareholders in the maximum 35% federal income tax bracket. However, there can be no assurances that these tax characteristics will remain constant in the future.
As part of its leverage strategy, the Fund issued $120 million of Auction Market Preferred Shares (“AMPS”), each with a par value of $25,000 per share. AMPS are traditionally used as money market alternatives for high-net worth and institutional investors. The proceeds raised by the issuance of the AMPS were pooled and invested together with the Fund’s other assets. Any spread between the portfolio return and the short-term rate paid to the AMPS holders are borne by the common shareholders.
For more specific information on the positioning of the portfolio and our market outlook, please refer to the portfolio management question and answer portion of the report. We appreciate your investment with us and would like to thank you for giving us the opportunity to serve your investment needs. For further information on the Fund, please call 1-800-345-7999 or visit the Fund’s website at www.tswclaymore.com.
Sincerely,
|
|
/s/ Nick Dalmaso |
Nick Dalmaso |
| Senior Managing Director – Claymore Advisors, LLC |
February 11, 2005
| | |
| | | Annual Report | December 31, 2004 | 1 |
TYW | TS&W/Claymore Tax-Advantaged Balanced Fund
Questions & Answers
How did the equity and high-yield markets perform during the period?
For the period April 28, 2004 (the Fund’s inception) through December 31, 2004, the equity market generated an attractive total return of 9.3% as measured by the S&P 500. Style was an important driver over this period as the Russell 1000 Value Index returned 14.5% since April 28, 2004 compared to just 5.1% for the Russell 1000 Growth Index over the same period.
The Merrill Lynch High Yield Master II Index, a proxy for the high-yield allocation of the Fund generated an 8.8% return during the period ended December 31, 2004. 2004 marks the second consecutive year of strong performance by the high yield market. Investors flocked to lower rated companies in search for higher yields as bonds rated CCC or lower returned 13.7% for the period vs. 7.3% for their higher-rated BB counterparts.
Are there any specific sectors which have helped or hindered performance and what is your outlook for the markets?
With the exception of the Health Care sector, nine of ten economic sectors generated a positive return in the Fund’s portfolio. The strongest performing sectors were Financials, Industrials and Energy while in addition to Health Care, the weaker performing sectors included Technology and Consumer Discretionary.
Our outlook for the coming year in financial markets is constructive. We feel interest rates should remain at levels that encourage the continued expansion of economic activity; corporate profits are likely to increase, though at a slower pace than in 2004, and valuation levels are not high enough to discourage sensible investors. The list of risk factors reads much like 2004, headed by the possibility that interest rates increase more than we expect or that corporate profits come in short of the targeted growth rate. On balance, we believe the evidence supports a cautiously optimistic outlook, and we are positioning the portfolio accordingly, emphasizing attractively valued stocks and ones that we feel have a high probability of increasing dividends. We also believe that the year ahead, like the one just past, will reward insightful stock and bond selection, a patient and disciplined attitude toward valuation, and the occasional willingness to lean against the wind of consensus opinion. However, there is no guarantee that past performance will be repeated.
What is the investment process used for selecting securities?
Thompson, Siegel & Walmsley, Inc.’s investment process is value-driven and team-oriented. On the equity side, we have a primary valuation model we apply to over 400 stocks that directs the process toward companies we believe have the highest expected return over a multi-year period. In-house analysts are responsible for determining the appropriate model inputs for companies under their coverage and monitoring them over the holding period. Buys and sells are discussed at weekly research meetings or more frequently as needed. Thompson, Siegel & Walmsley’s Fixed Income team is responsible for overall bond market strategy as well as security selection. In-house analysts are used to support the credit review process.
How did the municipal bond market perform during the period?
The municipal market experienced a volatile trading range during the period from the Fund’s inception on April 28, 2004. Yields, as measured by the Municipal Market Data AAA General Obligation index, dropped from 4.95% at the beginning of the period to 4.63% at December 31, 2004. During this period, the Lehman Brother’s Municipal Bond Index, an unmanaged index of approximately 1, 100 investment-grade, tax-exempt bonds, returned 5.19%, with nearly half this return coming during the last three months of the period.
Are there any specific sectors which have helped or hindered performance and what is your outlook for the municipal market?
When first establishing the municipal portfolio at the Fund’s inception, our analysis indicated that the lower rated health care credits and land-secured housing credits were the most attractive sectors based on yield spreads and potential total return. As municipal bond yields dropped close to historic lows, demand for lower-rated credits increased substantially, as investors looked to add yield to their portfolios. This demand created a scarcity in high yield credits and resulted in a substantial tightening of credit spreads to go along with the precipitous drop in yields. During the period, a few credits in the health care sector had their credit quality ratings upgraded by the rating agencies which added to these credits already strong performance. The rally in municipal bonds during this period was widespread and beneficial to all sectors of the municipal market. As typically occurs in environments in which yields fall, shorter-call bonds tend to have the least total return due to their negative convexity. That is to say, as yields decline, the rise in prices on these callable bonds slows as it becomes increasingly likely that the issuers will call these bonds away.
Our outlook for the coming year for the municipal market focuses on continued strong demand for municipal bonds from various market participants especially non-traditional buyers, due to the relative cheapness of municipals versus other fixed income products. The six interest rate increases by the Federal Reserve thus far should temper growth in 2005 but because interest rates are still historically low the economy should stay on a steady path of growth. Because of this slow but steady growth scenario, we expect municipal yields to trade in a well defined range unless there are consistent signs of above average growth and the Federal Reserve increases interest rates more than expected.
What is the investment process used for selecting municipal bonds?
The investment approach of Claymore Advisors’ municipal group starts with analyzing the broader macroeconomic trends and developments affecting the fixed-income markets. Our team analyzes the economic outlook, market conditions and perceived effects on interest rates and yield curves. From there, we incorporate a bottom-up and top-down analysis to construct a portfolio that optimizes tax-exempt income while seeking to avoid undue credit risk and market timing risk. Through implementing our proprietary, unbiased research, we try to identify undervalued sectors that we believe have the potential for ratings upgrades and capital appreciation, however, there is no guarantee that this will occur.
| | |
2 | Annual Report | December 31, 2004 | | |
TYW | TS&W/Claymore Tax-Advantaged Balanced Fund
Fund Summary | As of December 31, 2004 (unaudited)
| | | | |
Fund Statistics
| | | |
Share Price | | $ | 13.62 | |
Common Share Net Asset Value | | $ | 15.47 | |
Premium/(Discount) to NAV | | | (11.96 | %) |
Net Assets Applicable to | | $ | 238,386 | |
Common Shares ($000) | | | | |
| | | | | | |
Total Returns (non-annualized) | | | | | | |
| | |
(Inception 4/28/04)
| | Market
| | | NAV
| |
Six-months ended 12/31/04 | | 7.58 | % | | 10.95 | % |
Since Inception | | -6.05 | % | | 11.42 | % |
| | | |
Top 10 Holdings – Municipal Portfolio
| | % of Total
Investments
| |
Sayre Health Care Facilities Authority (PA) | | 2.8 | % |
5.875%, 12/1/2031 | | | |
Golden State Tobacco Securitization Corp. (CA) | | 2.5 | % |
5.500%, 6/1/2043 | | | |
Duluth Economic Development Authority (MN) | | 2.0 | % |
5.250%, 2/15/2028 | | | |
Richardson Hospital Authority (TX) | | 2.0 | % |
6.000%, 12/1/2034 | | | |
Camden County Improvement Authority (NJ) | | 1.9 | % |
5.750%, 2/15/2034 | | | |
California Statewide Communities | | 1.8 | % |
Development Authority (CA) | | | |
6.750%, 7/1/2032 | | | |
Missouri State Development Finance Board (MO) | | 1.8 | % |
5.625%, 12/1/2028 | | | |
Saint Johns County Industrial | | 1.6 | % |
Development Authority (FL) | | | |
5.625%, 8/1/2034 | | | |
Northwest Parkway Public Highway Authority (CO) | | 1.5 | % |
7.125%, 6/15/2041 | | | |
Lexington County Health Services District (SC) | | 1.5 | % |
5.500%, 5/1/2037 | | | |
| |
Top 10 Holdings – Equity and Income Portfolio
| | % of Total
Investments
| |
Dow Jones CDX 7.750%, 12/29/2009 | | 1.5 | % |
Citigroup, Inc. | | 1.4 | % |
National City Corp. | | 1.2 | % |
PNC Financial Services Group | | 1.1 | % |
BP PLC ADR | | 1.1 | % |
ING Groep NV ADR | | 1.1 | % |
ChevronTexaco Corp. | | 1.0 | % |
Altria Group, Inc. | | 1.0 | % |
GlaxoSmithKline PLC ADR | | 1.0 | % |
Masco Corp. | | 1.0 | % |
| |
Top Ten Industries
| | % of Total
Investments
| |
Health Care | | 21.3 | % |
Banking & Finance | | 11.4 | % |
Special Tax | | 7.9 | % |
Higher Education | | 7.4 | % |
General funds | | 5.5 | % |
Oil & Gas | | 4.8 | % |
Telecommunications | | 4.1 | % |
Pharmaceuticals | | 2.6 | % |
Special Purpose Entity | | 2.4 | % |
Beverages, Food & Tobacco | | 2.3 | % |
Share Price & NAV Performance
Portfolio Concentration by Asset Class*

| * | As a percentage of total investments |
Credit Quality*
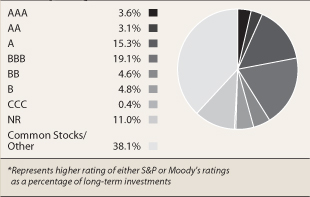
| * | Represents higher rating of either S&P or Moody’s ratings as a percentage of long-term investments |
Past performance does not guarantee future results. Portfolio composition, holdings and sectors are subject to change daily.
| | |
| | | Annual Report | December 31, 2004 | 3 |
TYW | TS&W/Claymore Tax-Advantaged Balanced Fund
Portfolio of Investments | December 31, 2004
| | | | | | | | |
Principal Amount
| | Optional Call
Provisions
| | Value
|
| | | | Long Term Municipal Bonds – 77.7% | | | | | |
| | | | Arizona – 3.4% | | | | | |
| $ | 3,300,000 | | Maricopa County Industrial Development Authority Health Facilities Revenue, Catholic Health Care West-A, BBB+, Baa1
5.375%, 7/1/2023 | | 7/1/14 @ 100 | | $ | 3,417,942 |
| | 4,500,000 | | Maricopa County Pollution Control Corp., Pollution Control Revenue Reference Public Service Co-A-RMK, BBB, Baa2
5.750%, 11/1/2022 | | 5/1/06 @ 101 | | | 4,619,970 |
| | | | | | | |
|
|
| | | | | | | | | 8,037,912 |
| | | | | | | |
|
|
| | | |
| | | | California – 17.6% | | | | | |
| | 6,000,000 | | California Statewide Communities Development Authority Revenue Bentley School, NR, NR
6.750%, 7/1/2032 | | 7/1/10 @ 103 | | | 6,290,520 |
| | | | California Statewide Community Development Authority Eskaton Properties, Inc., ACA Insured | | | | | |
| | 2,950,000 | | 5.150%, 05/15/2029, A, NR (b) | | — | | | 2,950,000 |
| | 250,000 | | 5.150%, 05/15/2029, A, BBB- (b) | | — | | | 250,000 |
| | 1,220,000 | | California Educational Facilities Authority California Lutheran University, Series 2004 C, NR, Baa1
5.000%, 10/1/2029 | | 10/1/140 @ 100 | | | 1,223,648 |
| | 1,395,000 | | Corona-Norco Unified School District, Special Tax Community Facilities District No. 98-1, AMBAC Insured, AAA, Aaa
5.100%, 9/1/2032 | | 9/1/12 @ 100 | | | 1,438,371 |
| | 1,080,000 | | Eastern California Municipal Water District Community Facilities, Special Tax Improvement Area 2-Sheffield/Rancho, NR, NR
5.875%, 9/1/2034 | | 9/1/05 @ 102 | | | 1,101,827 |
| | 8,620,000 | | Golden State Tobacco Securitization Corp., Tobacco Settlement Revenue Enhanced Asset Backed, Series B, A-, Baa1
5.500%, 6/1/2043 | | 6/1/13 @ 100 | | | 9,015,141 |
| | 2,630,000 | | Lincoln Improvement Board Act 1915 Public Finance Authority - Twelve Bridges, NR, NR
6.200%, 9/2/2025 | | 9/2/09 @ 102 | | | 2,781,567 |
| | | | Murrieta Valley Unified School District, Special Tax Community Facilities District No. 2000-2, NR, NR | | | | | |
| | 1,625,000 | | 6.300%, 9/1/2024 | | 3/1/12 @ 101 | | | 1,745,348 |
| | 2,505,000 | | 6.375%, 9/1/2032 | | 3/1/12 @ 101 | | | 2,691,673 |
| | 1,000,000 | | Orange County Community Facilities District, Special Tax No. 03-1-Ladera Ranch, Series A, NR, NR
5.625%, 8/15/2034 | | 8/15/12 @ 101 | | | 1,023,580 |
| | 1,800,000 | | Palm Springs Community Redevelopment Agency Tax Allocation Reference Merged Production No.1, Series A, A-, NR
5.500%, 9/1/2034 | | 9/1/14 @ 100 | | | 1,852,884 |
| | 4,000,000 | | Palm Springs Financing Authority Lease Revenue Convention Center Project, Series A, MBIA Insured, AAA, Aaa
5.500%, 11/1/2035 | | 11/1/14 @ 102 | | | 4,391,960 |
| | | | Poway Unified School District, Special Tax | | | | | |
| | 1,350,000 | | Community Facilities District Number 6-Area-A, NR, NR
6.125%, 9/1/2033 | | 9/1/10 @ 102 | | | 1,414,449 |
| | 915,000 | | Poway Community Facilities District Number 10-Area-E, NR, NR
5.750%, 9/1/2032 | | 9/1/08 @ 102 | | | 927,224 |
| | 820,000 | | Snowline California Joint Union School District Community Facility Special Tax, No. 2002-1, Series A, NR, NR
5.400%, 9/1/2034 | | 9/1/05 @ 103 | | | 824,231 |
| | 1,870,000 | | William S.Hart Joint School Financing Authority Series 2004, BBB+, NR
5.625%, 9/1/2034 | | 9/1/12 @ 100 | | | 1,926,717 |
| | | | | | | |
|
|
| | | | | | | | | 41,849,140 |
| | | | | | | |
|
|
| | | |
| | | | Colorado – 4.2% | | | | | |
| $ | 1,355,000 | | Denver Health & Hospital Authority Health Care Revenue Series 1998 A, ACA Insured, A, NR
5.375%, 12/1/2028 | | 12/1/08 @ 101 | | $ | 1,367,967 |
| | | | Denver Health & Hospital Authority Health Care Revenue Series 2004 A, BBB, Baa3 | | | | | |
| | 1,000,000 | | 6.000%, 12/1/2031 | | 12/1/11 @ 100 | | | 1,042,450 |
| | 2,000,000 | | 6.250%, 12/1/2033 | | 12/1/14 @ 100 | | | 2,152,980 |
| | 5,000,000 | | Northwest Parkway Public Highway Authority Revenue First Tier - Sub-Series D, BB+, Ba1
7.125%, 6/15/2041 | | 6/15/11 @ 102 | | | 5,445,500 |
| | | | | | | |
|
|
| | | | | | | | | 10,008,897 |
| | | | | | | |
|
|
| | | |
| | | | Delaware – 0.2% | | | | | |
| | 500,000 | | Delaware State Health Facilities Authority Beebe Medical Center Project, Series 2004 A, BBB, Baa1
5.500%, 6/1/2024 | | 6/1/14 @ 100 | | | 521,855 |
| | | | | |
| |
|
|
| | | |
| | | | Florida – 2.4% | | | | | |
| | 5,450,000 | | Saint Johns County Industrial Development Authority First Mortgage Revenue Presbyterian Retirement, Series A, NR, NR 5.625%, 8/1/2034 | | 8/1/14 @101 | | | 5,707,404 |
| | | | | |
| |
|
|
| | | |
| | | | Georgia – 5.5% | | | | | |
| | 3,000,000 | | Chatham County Hospital Authority Memorial Health University Medical Center, Series 2004 A, A-, A3
5.500%, 1/1/2034 | | 1/1/14 @ 100 | | | 3,134,190 |
| | | | Milledgeville and Baldwin County Development Authority Georgia College & State University Foundation Student Housing System, BBB, NR | | | | | |
| | 2,500,000 | | 5.625%, 9/1/2030 | | 9/1/14 @ 101 | | | 2,591,875 |
| | 1,000,000 | | 6.000%, 9/1/2033 | | 9/1/14 @ 101 | | | 1,065,400 |
| | | | Richmond County Development Authority ASU Jaguar Student Housing I LLC, Series 2004 A, NR, A3 | | | | | |
| | 2,865,000 | | 5.250%, 2/1/2030 | | 2/1/14 @ 100 | | | 2,906,199 |
| | 3,350,000 | | 5.250%, 2/1/2035 | | 2/1/14 @ 100 | | | 3,397,202 |
| | | | | |
| |
|
|
| | | | | | | | | 13,094,866 |
| | | | | | | |
|
|
| | | |
| | | | Illinois – 2.5% | | | | | |
| | 4,000,000 | | Illinois Educational Facilities Authority Revenue University of Chicago, Series A, AA, Aa1
5.125%, 7/1/2038 | | 7/1/28 @ 101 | | | 4,063,360 |
| | 2,000,000 | | Metropolitan Pier and Exposition Authority McCormick Place Expansion Project, Series 2004 A, AA-, A1
5.500%, 6/15/2027 | | 6/15/06 @ 100 | | | 2,016,040 |
| | | | | |
| |
|
|
| | | | | | | | | 6,079,400 |
| | | | | | | |
|
|
| | | |
| | | | Indiana – 0.9% | | | | | |
| | 2,000,000 | | Indiana Health Facility Financing Authority Hospital Revenue Deaconess Hospital Obligated Group, Series 2004 A, AMBAC Insured, AAA, Aaa
5.375%, 3/1/2034 | | 3/1/14 @ 100 | | | 2,117,500 |
| | | | | |
| |
|
|
| | | |
| | | | Kansas – 1.1% | | | | | |
| | 2,500,000 | | Burlington Pollution Control Revenue Kansas Gas and Electric Co.Project, Series 2004 A MBIA Insured, AAA, Aaa
5.300%, 6/1/2031 | | 6/1/14 @ 100 | | | 2,666,275 |
| | | | | |
| |
|
|
| | | |
| | | | Massachusetts – 0.4% | | | | | |
| | 930,000 | | Massachusetts Development Finance Agency Hampshire College, BBB, Baa2
5.625%, 10/1/2024 | | 10/1/14 @ 100 | | | 971,422 |
| | | | | |
| |
|
|
See notes to financial statements.
| | |
4 | Annual Report | December 31, 2004 | | |
TYW | TS&W/Claymore Tax-Advantaged Balanced Fund | Portfolio of Investments continued
| | | | | | | | |
Principal Amount
| | Optional
Call Provisions
| | Value
|
| | | | Long Term Municipal Bonds (continued) | | | | | |
| | | | Minnesota – 3.4% | | | | | |
| $ | 1,000,000 | | Cohasset Pollution Control Revenue Allete Income Project, Series 2004, A, Baa1
4.950%, 7/1/2022 | | 7/1/14 @ 100 | | $ | 1,020,670 |
| | 7,000,000 | | Duluth Economic Development Authority Benedictine Health Systems, Saint Mary’s Duluth Clinic Health System O.G., Series 2004, A-, NR
5.250%, 2/15/2028 | | 2/15/14 @ 100 | | | 7,110,110 |
| | | | | | | | | 8,130,780 |
| | | |
| | | | Missouri – 4.7% | | | | | |
| | 4,690,000 | | Cole County Industrial Development Authority Senior Living Facilities Revenue Lutheran Senior Services Heisinger Project, NR, NR
5.500%, 2/1/2035 | | 2/1/14 @ 100 | | | 4,847,207 |
| | 6,000,000 | | Missouri State Development Finance Board Branson Landing Project, Series 2004 A, BBB+, Baa1
5.625%, 12/1/2028 | | 6/1/14 @ 100 | | | 6,260,340 |
| | | | | | | | | 11,107,547 |
| | | |
| | | | Nevada – 0.8% | | | | | |
| | 3,000,000 | | Director State of Nevada Department of Business & Industry Capital Appreciation, Las Vegas Monorail, AMBAC Insured, AAA, Aaa Zero Coupon, 1/1/2016 | | — | | | 1,801,200 |
| | | |
| | | | New Jersey – 9.1% | | | | | |
| | 6,400,000 | | Camden County Improvement Authority Revenue Cooper Health System O.G., Series 2004 A, BBB, Baa3
5.750%, 2/15/2034 | | 8/15/14 @ 100 | | | 6,667,840 |
| | | | New Jersey Economic Development Authority Revenue Cigarette Tax, BBB, Baa2 | | | | | |
| | 1,850,000 | | 5.750%, 6/15/2029 | | 6/15/14 @ 100 | | | 1,939,281 |
| | 1,000,000 | | 5.500%, 6/15/2031 | | 6/15/14 @ 100 | | | 1,026,670 |
| | 5,000,000 | | 5.750%, 6/15/2034 | | 6/15/14 @ 100 | | | 5,198,700 |
| | 2,000,000 | | New Jersey Health Care Facilities Financing Authority Revenue Saint Elizabeth Hospital Obligated Group, BBB-, Baa3
6.000%, 7/1/2020 | | 7/1/07 @ 102 | | | 2,086,140 |
| | 3,000,000 | | New Jersey State Educational Facilities Authority Fairleigh Dickinson University, Series 2002 D, NR, NR
6.000%, 7/1/2025 | | 7/1/13 @ 100 | | | 3,165,300 |
| | 1,450,000 | | New Jersey Educational Facilities Authority Stevens Institute of Technology, Series 2004 B, BBB+, Baa2
5.375%, 7/1/2034 | | 7/1/14 @ 100 | | | 1,491,833 |
| | | | | | | | | 21,575,764 |
| | | |
| | | | New York – 2.2% | | | | | |
| | 2,500,000 | | New York, (City of) Fiscal 2005 Series C Subseries C-1, A, A2
5.250%, 8/15/2026 | | 8/15/14 @ 100 | | | 2,643,000 |
| | 1,500,000 | | New York City Industrial Development Agency 2004 St. Francis College Project, A-, NR
5.000%, 10/1/2034 | | 10/1/14 @ 100 | | | 1,516,500 |
| | 1,000,000 | | New York State Dormitory Authority Catholic Health Services of Long Island Obligation Group Series 2004, BBB, Baa1 (St.Francis Hospital Project)
5.100%, 7/1/2034 | | 7/1/14 @ 100 | | | 1,003,140 |
| | 200,000 | | New York State Dormitory Authority White Plains Hospital Medical, FHA-Insured Mortgage, AAA, NR
4.625%, 2/15/2018 | | 8/15/14 @ 100 | | | 208,594 |
| | | | | | | | | 5,371,234 |
| | | |
| | | | Ohio – 4.2% | | | | | |
| $ | 4,560,000 | | Akron Bath Copley Joint Township Hospital District Revenue Hospital Facilities-Summa Health Systems, Series A, RADIAN Insured, NR, Aa3
5.500%, 11/15/2034 | | 11/15/14 @ 100 | | $ | 4,853,755 |
| | 5,000,000 | | Toledo-Lucas County Port Authority Special Assessment Revenue Crocker Park Public Improvement Project Series 2003, NR, NR
5.375%, 12/1/2035 | | 12/1/13 @ 102 | | | 5,154,350 |
| | | | | | | | | 10,008,105 |
| | | |
| | | | Pennsylvania – 5.8% | | | | | |
| | 3,750,000 | | Pennsylvania Higher Educational Facilities Authority Widener University Series 2003, BBB+, NR 5.375%, 7/15/2029 | | 7/15/13 @ 100 | | | 3,865,087 |
| | 9,530,000 | | Sayre Health Care Facilities Authority Guthrie Health, Series 2002 A, A-, NR 5.875%, 12/1/2031 | | 12/1/11 @ 101 | | | 10,076,260 |
| | | | | | | | | 13,941,347 |
| | | |
| | | | Rhode Island – 3.0% | | | | | |
| | | | Rhode Island State Health & Educational Building Corp. Revenue Hospital Financing Lifespan Obligated Group, BBB, Baa1 | | | | | |
| | 3,500,000 | | 6.375%, 8/15/2021 | | 8/15/12 @ 100 | | | 3,841,180 |
| | 3,000,000 | | 6.500%, 8/15/2032 | | 8/15/12 @ 100 | | | 3,246,750 |
| | | | | | | | | 7,087,930 |
| | | |
| | | | South Carolina – 2.8% | | | | | |
| | | | Lexington County Health Services District, Inc. Hospital Revenue Lexington Medical Center, Series 2004, A, A2 | | | | | |
| | 1,430,000 | | 5.500%, 5/1/2032 | | 5/1/14 @ 100 | | | 1,493,220 |
| | 5,000,000 | | 5.500%, 5/1/2037 | | 5/1/14 @ 100 | | | 5,230,950 |
| | | | | | | | | 6,724,170 |
| | | |
| | | | Texas – 3.0% | | | | | |
| | | | Richardson Hospital Authority Hospital Refinance & Improvement | | | | | |
| | 6,780,000 | | Richardson Regional, BBB, Baa2 6.000%, 12/1/2034 | | 12/1/13 @ 100 | | | 7,057,234 |
| | | |
| | | | Wisconsin – 0.5% | | | | | |
| | | | Wisconsin State Health & Educational Facilities Authority Revenue Blood Center Southeastern Project, BBB+, NR | | | | | |
| | 500,000 | | 5.500%, 6/1/2024 | | 6/1/14 @ 100 | | | 517,280 |
| | 750,000 | | 5.750%, 6/1/2034 | | 6/1/14 @ 100 | | | 783,667 |
| | | | | | | | | 1,300,947 |
| | | | Total Long Term Municipal Bonds
(Cost $177,873,289) | | | | | 185,160,929 |
See notes to financial statements.
| | |
| | | Annual Report | December 31, 2004 | 5 |
TYW | TS&W/Claymore Tax-Advantaged Balanced Fund | Portfolio of Investments continued
| | | | | |
Number of Shares
| | Value
|
| | | Common Stocks – 56.4% | | | |
| | | Automotive – 1.2% | | | |
| 60,000 | | DaimlerChrysler AG | | $ | 2,883,000 |
| | | | |
|
|
| | |
| | | Banking and Finance – 16.1% | | | |
| 40,000 | | Australia and New Zealand Banking Group Ltd. ADR | | | 3,236,800 |
| 60,000 | | Bank of America Corp. | | | 2,819,400 |
| 50,000 | | BB&T Corp. | | | 2,102,500 |
| 100,000 | | Citigroup, Inc. | | | 4,818,000 |
| 40,000 | | HSBC Holdings PLC ADR | | | 3,405,600 |
| 125,000 | | ING Groep NV ADR | | | 3,781,250 |
| 110,000 | | National City Corp. | | | 4,130,500 |
| 75,000 | | New York Community Bancorp, Inc. | | | 1,542,750 |
| 70,000 | | PNC Financial Services Group | | | 4,020,800 |
| 100,000 | | U.S. Bancorp | | | 3,132,000 |
| 50,000 | | Wachovia Corp. | | | 2,630,000 |
| 65,000 | | Washington Mutual, Inc. | | | 2,748,200 |
| | | | |
|
|
| | | | | | 38,367,800 |
| | | | |
|
|
| | |
| | | Beverages, Food and Tobacco – 3.4% | | | |
| 60,000 | | Altria Group, Inc. | | | 3,666,000 |
| 107,500 | | Sara Lee Corp. | | | 2,595,050 |
| 40,000 | | UST, Inc. | | | 1,924,400 |
| | | | |
|
|
| | | | | | 8,185,450 |
| | | | |
|
|
| | |
| | | Building and Building Products – 1.5% | | | |
| 96,500 | | Masco Corp. | | | 3,525,145 |
| | | | |
|
|
| | |
| | | Business Equipment and Services – 1.3% | | | |
| 66,500 | | Pitney Bowes, Inc. | | | 3,077,620 |
| | | | |
|
|
| | |
| | | Computers – 0.9% | | | |
| 100,000 | | Hewlett-Packard Co. | | | 2,097,000 |
| | | | |
|
|
| | |
| | | Computer—Software and Peripherals – 0.8% | | | |
| 75,000 | | Microsoft Corp. | | | 2,003,250 |
| | | | |
|
|
| | |
| | | Conglomerates – 1.1% | | | |
| 75,000 | | General Electric Co. | | | 2,737,500 |
| | | | |
|
|
| | |
| | | Consumer Goods and Services – 0.7% | | | |
| 90,000 | | Mattel, Inc. | | | 1,754,100 |
| | | | |
|
|
| | |
| | | Electronics – 0.9% | | | |
| 40,000 | | Hubbell, Inc., Class B | | | 2,092,000 |
| | | | |
|
|
| | |
| | | Forest and Paper Products – 0.8% | | | |
| 60,000 | | MeadWestvaco Corp. | | | 2,033,400 |
| | | | |
|
|
| | |
| | | Household and Personal Care Products – 2.4% | | | |
| 47,500 | | Kimberly-Clark Corp. | | | 3,125,975 |
| 106,500 | | Newell Rubbermaid, Inc. | | | 2,576,235 |
| | | | |
|
|
| | | | | | 5,702,210 |
| | | | |
|
|
| | |
| | | Insurance – 2.3% | | | |
| 65,000 | | Allstate Corp.(The) | | | 3,361,800 |
| 55,000 | | St.Paul Travelers Cos., Inc. (The) | | | 2,038,850 |
| | | | |
|
|
| | | | | | 5,400,650 |
| | | | |
|
|
| | |
| | | Mining – 0.9% | | | |
| 17,500 | | Rio Tinto PLC ADR | | | 2,086,175 |
| | | | |
|
|
| | |
| | | Oil and Gas – 7.1% | | | |
| 65,000 | | BP PLC ADR | | | 3,796,000 |
| 70,000 | | ChevronTexaco Corp. | | | 3,675,700 |
| 80,000 | | KeySpan Corp. | | | 3,156,000 |
| 60,000 | | Shell Transport & Trading Co. PLC ADR | | | 3,084,000 |
| 30,000 | | Total SA ADR | | | 3,295,200 |
| | | | |
|
|
| | | | | | 17,006,900 |
| | | | |
|
|
| | |
| | | Pharmaceuticals – 4.0% | | | |
| 135,000 | | Bristol-Myers Squibb Co. | | $ | 3,458,700 |
| 75,000 | | GlaxoSmithKline PLC ADR | | | 3,554,250 |
| 75,000 | | Merck & Co., Inc. | | | 2,410,500 |
| | | | |
|
|
| | | | | | 9,423,450 |
| | | | |
|
|
| | |
| | | Publishing – 1.3% | | | |
| 85,000 | | R.R. Donnelley & Sons Co. | | | 2,999,650 |
| | | | |
|
|
| | |
| | | Telecommunications – 5.6% | | | |
| 100,000 | | BCE, Inc. | | | 2,413,000 |
| 85,000 | | BellSouth Corp. | | | 2,362,150 |
| 65,000 | | BT Group PLC ADR | | | 2,569,450 |
| 100,000 | | SBC Communications, Inc. | | | 2,577,000 |
| 86,500 | | Verizon Communications, Inc. | | | 3,504,115 |
| | | | |
|
|
| | | | | | 13,425,715 |
| | | | |
|
|
| | |
| | | Utilities – Gas and Electric – 2.7% | | | |
| 55,000 | | DTE Energy Co. | | | 2,372,150 |
| 75,000 | | NiSource, Inc. | | | 1,708,500 |
| 50,000 | | Progress Energy, Inc. | | | 2,262,000 |
| | | | |
|
|
| | | | | | 6,342,650 |
| | | | |
|
|
| | |
| | | Waste Management – 1.4% | | | |
| 110,000 | | Waste Management, Inc. | | | 3,293,400 |
| | | | |
|
|
| | |
| | | Total Common Stocks
(Cost $124,147,803) | | | 134,437,065 |
| | | | |
|
|
| | | | | | | |
Principal Amount
| | Optional Call
Provisions
| | Value
|
| | | | Corporate Bonds – 11.9% | | | | |
| | | | Automotive – 0.5% | | | | |
| $ | 1,000,000 | | Navistar International, BB-, Ba3 7.500%, 6/15/2011 | | 6/15/08 @ 103.75 | | 1,072,500 |
| | | | | |
| |
|
| | | |
| | | | Banking and Finance – 1.0% | | | | |
| | 1,250,000 | | E* Trade Financial Corp., B+, B1 (a) 8.000%, 6/15/2011 | | 6/15/08 @ 104 | | 1,343,750 |
| | 1,000,000 | | Presidential Life Corp., B+, B2 7.875%, 2/15/2009 | | — | | 1,000,000 |
| | | | | |
| |
|
| | | | | | | | 2,343,750 |
| | | | | | | |
|
| | | |
| | | | Building and Building Products – 0.8% | | | | |
| | 1,000,000 | | K Hovnanian Enterprises, BB, Ba2 6.500%, 1/15/2014 | | — | | 1,007,500 |
| | 1,000,000 | | KB Home, BB+, Ba1 5.750%, 2/1/2014 | | — | | 990,000 |
| | | | | |
| |
|
| | | | | | | | 1,997,500 |
| | | | | | | |
|
| | | |
| | | | Entertainment – 1.0% | | | | |
| | 1,500,000 | | Carmike Cinemas, Inc., CCC+, Caa1 7.500%, 2/15/2014 | | 2/15/09 @ 103.75 | | 1,535,625 |
| | 900,000 | | Scientific Games Corp., B+, B1 (a) 6.250%, 12/15/2012 | | 12/15/08 @ 103.13 | | 915,750 |
| | | | | |
| |
|
| | | | | | | | 2,451,375 |
| | | | | | | |
|
| | | |
| | | | Forest Products & Paper – 0.7% | | | | |
| | 400,000 | | Boise Cascade LLC, B+, B2 (a) 7.125%, 10/15/2014 | | 10/15/09 @ 103.56 | | 423,000 |
| | 1,100,000 | | Stone Container Finance, B, B2 7.375%, 7/15/2014 | | 7/15/09 @ 103.69 | | 1,171,500 |
| | | | | |
| |
|
| | | | | | | | 1,594,500 |
| | | | | | | |
|
| | | |
| | | | Food – 0.5% | | | | |
| | 1,000,000 | | Smithfield Foods, Inc., BB, Ba2 7.000%, 8/1/2011 | | — | | 1,067,500 |
| | | | | |
| |
|
See notes to financial statements.
| | |
6 | Annual Report | December 31, 2004 | | |
TYW | TS&W/Claymore Tax-Advantaged Balanced Fund | Portfolio of Investments continued
| | | | | | | |
Principal Amount
| | Optional Call Options
| | Value
|
| | | Corporate Bonds (continued) | | | | | |
| | | |
| | | Health and Medical Facilities – 0.4% | | | | | |
| 1,000,000 | | Triad Hospitals, Inc., B+, B2 7.000%, 5/15/2012 | | 5/15/08 @ 103.5 | | $ | 1,052,500 |
| | | | |
| |
|
|
| | | |
| | | Home Furnishings – 0.4% | | | | | |
| 1,000,000 | | Sealy Mattress Co., B-, Caa1 8.250%, 6/15/2014 | | 6/15/09 @ 104.13 | | | 1,060,000 |
| | | | |
| |
|
|
| | | |
| | | Iron/Steel – 0.4% | | | | | |
| 975,000 | | AK Steel Corp., B+, B3 7.875%, 2/15/2009 | | 3/11/05 @ 102.65 | | | 993,281 |
| | | | |
| |
|
|
| | | |
| | | Office Equipment & Supplies – 0.4% | | | | | |
| 1,000,000 | | Xerox Capital Trust I, B-, Ba3 8.000%, 2/1/2027 | | 2/1/07 @ 102.45 | | | 1,040,000 |
| | | | |
| |
|
|
| | | |
| | | Retail—Apparel and Shoes – 1.0% | | | | | |
| 1,000,000 | | Foot Locker, Inc., BB+, Ba2 8.500%, 1/15/2022 | | — | | | 1,100,000 |
| | | |
| 1,215,000 | | Phillips-Van Heusen Corp., BB, B1 7.750%, 11/15/2023 | | — | | | 1,287,900 |
| | | | |
| |
|
|
| | | | | | | | 2,387,900 |
| | | | | | |
|
|
| | | |
| | | Special Purpose Entity – 3.6% | | | | | |
| 5,350,000 | | Dow Jones CDX, NR, B3 (a) 7.750%, 12/29/2009 | | — | | | 5,500,469 |
| | | |
| 3,000,000 | | Dow Jones CDX, NR, B3 (a) 8.000%, 12/29/2009 | | — | | | 3,076,875 |
| | | | |
| |
|
|
| | | | | | | | 8,577,344 |
| | | | | | |
|
|
| | | |
| | | Telecommunications – 0.5% | | | | | |
| 1,000,000 | | Nextel Communications, Inc., BB, Ba3 6.875%, 10/31/2013 | | 10/31/080 @ 103.44 | | | 1,085,000 |
| | | | |
| |
|
|
| | | |
| | | Transportation – 0.2% | | | | | |
| 500,000 | | General Maritime Corp., B+, B1 10.000%, 3/15/2013 | | 3/15/08 @ 105 | | | 575,000 |
| | | | |
| |
|
|
| | | |
| | | Travel Services – 0.5% | | | | | |
| 1,000,000 | | Royal Caribbean Cruises, Ltd., BB+, Ba2 6.875%, 12/1/2013 | | — | | | 1,080,000 |
| | | | |
| |
|
|
| | | |
| | | Total Corporate Bonds (Cost $27,113,429) | | | | | 28,378,150 |
| | | | | | |
|
|
| | | | | | |
Number of Shares
| | Value
| |
| | | Preferred Stocks – 2.2% | | | | |
| | |
| | | Real Estate Investment Trusts – 2.0% | | | | |
| 10,000 | | CarrAmerica Realty Corp., Series E, 7.500%, BBB-, Baa3 | | | 265,600 | |
| | |
| 20,000 | | CBL & Associates Properties, Series C, 7.750%, NR, NR | | | 525,600 | |
| | |
| 25,000 | | CBL & Associates Properties, Series D, 7.375%, NR, NR | | | 626,562 | |
| | |
| 20,000 | | Developers Diversified Realty, 8.600%, BBB-, Ba1 | | | 537,400 | |
| | |
| 10,000 | | Glenborough Realty Trust, Inc., Series A, 7.750%, NR, Ba3 | | | 255,000 | |
| | |
| 20,000 | | Health Care REIT, Inc., Series D, 7.875%, BB+, Ba1 | | | 519,800 | |
| | |
| 10,000 | | iStar Financial, Inc., Series I, 7.500%, BB, Ba2 | | | 255,100 | |
| | |
| 5,000 | | PS Business Parks, Inc., Series H, 7.000%, BBB-, Ba1 | | | 123,950 | |
| | |
| 20,000 | | Realty Income Corp., 7.375%, BBB-, Baa3 | | | 520,800 | |
| | |
| 18,500 | | Regency Centers Corp., 7.250%, BBB-, Baa3 | | | 487,938 | |
| | |
| 25,000 | | Vornado Realty Trust, Series E, 7.000%, BBB-, Baa3 | | | 651,750 | |
| | | | |
|
|
|
| | | | | | 4,769,500 | |
| | | | |
|
|
|
| | |
| | | Pipelines – 0.2% | | | | |
| 15,000 | | Dominion Consolidated Natural Gas Capital Trust I, 7.800%, BBB-, Baa1 | | | 400,782 | |
| | | | |
|
|
|
| | |
| | | Total Preferred Stocks | | | | |
| | | (Cost $4,958,200) | | | 5,170,282 | |
| | | | |
|
|
|
| | |
| | | Investment Companies – 0.1% | | | | |
| 5,000 | | AEW Real Estate Income Fund | | $ | 95,750 | |
| 5,000 | | Neuberger Berman Real Estate Income Fund, Inc. | | | 107,600 | |
| 7,000 | | Scudder RREEF Real Estate Fund II, Inc. | | | 117,880 | |
| | | | |
|
|
|
| | | Total Investment Companies (Cost $266,359) | | | 321,230 | |
| | | | |
|
|
|
| | |
| | | Total Long Term Investments (Cost $334,359,080)—148.3% | | | 353,467,656 | |
| | | | |
|
|
|
| |
Principal Amount
| | Value
| |
| | | Short-Term Investments – 0.8% | | | | |
| | | New York – 0.8% | | | | |
| 400,000 | | Long Island Power Authority New York Electric Systems Revenue, Sub-Series 2B, AAA/A-1+, Aaa/VMIG1 2.150%, 5/01/2033 (c) | | | 400,000 | |
| | |
| 100,000 | | New York, Adjustable Sub-Series A-4, AA-/A-1+, Aaa/VMIG12.170%, 8/01/2023 (c) | | | 100,000 | |
| | |
| 1,400,000 | | New York City Municipal Water Finance Authority Water & Sewer Systems Revenue, Series A FGIC Insured, AAA/A-1+, Aaa/VMIG1 2.170%, 6/15/2025 (c) | | | 1,400,000 | |
| | | | |
|
|
|
| | |
| | | Total Short-Term Investments (Cost $1,900,000) | | | 1,900,000 | |
| | | | |
|
|
|
| | |
| | | Total Securities (Cost $336,259,080) | | | 355,367,656 | |
| | | | |
|
|
|
| |
Contracts
| | Value
| |
| | | Put Options Purchased – 0.2% | | | | |
| 500 | | U.S.Treasury Note 10 Year Futures, expiring 5/20/2005 @ $ 15.625 (Cost $440,000) | | | 437,500 | |
| | | | |
|
|
|
| | |
| | | Total Investments (Cost $336,699,080)—149.3% | | | 355,805,156 | |
| | | Other assets less liabilities—1.1% | | | 2,580,733 | |
| | | Preferred Shares, at Liquidation Value- (-50.4% of Net Assets Applicable to Common Shares or -33.7% of Total Investments) | | | (120,000,000 | ) |
| | | | |
|
|
|
| | |
| | | Net Assets Applicable to Common Shares – 100.0% | | $ | 238,385,889 | |
| | | | |
|
|
|
| | |
| ACA | | American Capital Access. |
| |
| ADR | | American Depositary Receipt. |
| |
| AMBAC | | American Municipal Bond Assurance Corporation. |
| |
| FGIC | | Financial Guaranty Insurance Company. |
| |
| FHA | | Federal Housing Authority. |
| |
| MBIA | | Municipal Bond Investors Assurance. |
| |
| PLC | | Public Limited Company |
| |
| RADIAN | | Radian Group, Inc. |
| (a) | Securities are exempt from registration under Rule 144A of the Securities Act of 1933. These securities may only be resold in transactions exempt from registration, normally to qualified institutional buyers. At December 31, 2004, these securities amounted to $11,259,844 or 4.7% of net assets applicable to Common Shares. |
| (b) | Variable rate security. The rate shown is as of December 31, 2004. |
| (c) | Security has a maturity of more than one year, but has variable rate and demand features which qualify it as a short-term security. The rate shown is as of December 31, 2004. |
Ratings shown are per Standard & Poor’s and Moody’s; ratings and optional call provisions are unaudited. Securities classified as NR are not rated. All percentages shown in the Portfolio of Investments are based on net assets applicable to Common Shares unless otherwise noted.
See notes to financial statements.
| | |
| | | Annual Report | December 31, 2004 | 7 |
TYW | TS&W/Claymore Tax-Advantaged Balanced Fund
Statement of Assets and Liabilities | December 31, 2004
| | | | |
Assets | | | | |
Investments in securities, at value (cost $336,259,080) | | $ | 355,367,656 | |
Options purchased, at value (premiums paid of $440,000) | | | 437,500 | |
Cash | | | 47,862 | |
Interest receivable | | | 2,992,970 | |
Dividends receivable | | | 359,488 | |
Other assets | | | 10,819 | |
| | |
|
|
|
Total assets | | | 359,216,295 | |
| | |
|
|
|
| |
Liabilities | | | | |
Payable for securities purchased | | | 440,000 | |
Advisory fee payable | | | 210,968 | |
Dividend payable - preferred shares | | | 57,833 | |
Offering costs payable | | | 18,188 | |
Accrued expenses and other liabilities | | | 103,417 | |
| | |
|
|
|
Total liabilities | | | 830,406 | |
| | |
|
|
|
| |
Preferred Shares, at Redemption Value | | | | |
$.01 par value per share; 4,800 Auction Market Preferred Shares authorized, issued and outstanding at $25,000 per share liquidation preference | | | 120,000,000 | |
| | |
|
|
|
| |
Net Assets Applicable to Common Shareholders | | $ | 238,385,889 | |
| | |
|
|
|
| |
Composition of Net Assets Applicable to Common Shareholders | | | | |
Common stock, $.01 par value per share; unlimited number of shares authorized, 15,407,000 shares issued and outstanding | | $ | 154,070 | |
Additional paid-in capital | | | 218,539,205 | |
Undistributed net investment income | | | 1,081,048 | |
Net realized loss on investments and swap transactions | | | (494,510 | ) |
Net unrealized appreciation on investments and options transactions | | | 19,106,076 | |
| | |
|
|
|
| |
Net Assets Applicable to Common Shareholders | | $ | 238,385,889 | |
| | |
|
|
|
| |
Net Asset Value Applicable to Common Shareholders
(based on 15,407,000 common shares outstanding) | | $ | 15.47 | |
| | |
|
|
|
See notes to financial statements.
| | |
8 Annual Report December 31, 2004 | | |
TYW | TS&W/Claymore Tax-Advantaged Balanced Fund
Statement of Operations | For the Period April 28, 2004* through December 31, 2004
| | | | | | | |
Investment Income | | | | | | | |
Interest | | $ | 2,967,098 | | | | |
Dividends (net of foreign withholding taxes of $56,203) | | | 7,104,057 | | | | |
| | |
|
| |
|
|
|
Total income | | | | | $ | 10,071,155 | |
| | | | | |
|
|
|
| | |
Expenses | | | | | | | |
Advisory fee | | | 1,464,996 | | | | |
Auction agent fee - preferred shares | | | 155,635 | | | | |
Administration fee | | | 62,076 | | | | |
Fund accounting fee | | | 57,626 | | | | |
Legal fees | | | 56,700 | | | | |
Trustees’ fees and expenses | | | 52,038 | | | | |
Audit fee | | | 38,999 | | | | |
Insurance | | | 37,067 | | | | |
Printing expense | | | 36,999 | | | | |
Custodian fee | | | 34,080 | | | | |
Transfer agent fee | | | 29,531 | | | | |
NYSE listing fee | | | 16,111 | | | | |
Other | | | 7,000 | | | | |
| | |
|
| |
|
|
|
Total expenses | | | | | | 2,048,858 | |
| | | | | |
|
|
|
| | |
Net Investment Income | | | | | | 8,022,297 | |
| | |
Realized and Unrealized Gain (Loss) on Investments, Options and Swaps | | | | | | | |
Net realized gain (loss) on: | | | | | | | |
Investments | | | | | | 2,969,209 | |
Swaps | | | | | | (2,074,000 | ) |
Net unrealized appreciation (depreciation) on: | | | | | | | |
Investments | | | | | | 19,108,576 | |
Options | | | | | | (2,500 | ) |
| | | | | |
|
|
|
Net realized and unrealized gain on investments | | | | | | 20,001,285 | |
| | | | | |
|
|
|
| | |
Distributions to Preferred Shareholders from Net investment Income | | | | | | (1,108,937 | ) |
| | | | | |
|
|
|
| | |
Net Increase in Net Assets Applicable to Common Shareholders Resulting from Operations | | | | | $ | 26,914,645 | |
| | | | | |
|
|
|
| * | Commencement of investment operations. |
See notes to financial statements.
| | |
| | | Annual Report | December 31, 2004 | 9 |
TYW | TS&W/Claymore Tax-Advantaged Balanced Fund
Statement of Changes in Net Assets Applicable to Common Shares
For the Period April 28, 2004* through December 31, 2004
| | | | |
Increase in Net Assets Applicable to Common Shareholders Resulting from Operations | | | | |
| |
Net investment income | | $ | 8,022,297 | |
| |
Net realized gain on investments and swap transactions | | | 895,209 | |
| |
Net unrealized appreciation on investments and options transactions | | | 19,106,076 | |
| |
Distributions to Preferred Shareholders from Net investment income | | | (1,108,937 | ) |
| | |
|
|
|
| |
Net Increase in Net Assets Applicable to Common Shareholders Resulting from Operations | | | 26,914,645 | |
| | |
|
|
|
| |
Distributions to Common Shareholders from Net Investment Income | | | (7,222,031 | ) |
| | |
|
|
|
| |
Capital Share Transactions | | | | |
| |
Net proceeds from the issuance of Common Shares | | | 220,605,000 | |
| |
Common and preferred shares’ offering expenses charged to paid-in-capital | | | (2,012,000 | ) |
| | |
|
|
|
| |
Net Increase from Capital Share Transactions | | | 218,593,000 | |
| | |
|
|
|
| |
Total increase in net assets applicable to Common Shareholders | | | 238,285,614 | |
| |
Net Assets | | | | |
| |
Beginning of period | | | 100,275 | |
| | |
|
|
|
| |
End of period (including undistributed net investment income of $ 1,081,048) | | $ | 238,385,889 | |
| | |
|
|
|
| * | Commencement of investment operations. |
See notes to financial statements.
| | |
10 | Annual Report | December 31, 2004 | | |
TYW | TS&W/Claymore Tax-Advantaged Balanced Fund
Financial Highlights | For the Period April 28, 2004* through December 31, 2004
| | | | |
Per Share Operating Performance for a Common Share Outstanding Throughout the Period | | | | |
| |
Net Asset Value, Beginning of Period | | $ | 14.33 | (b) |
| | |
|
|
|
| |
Income from Investment Operations | | | | |
Net investment income(a) | | | 0.52 | |
Net realized and unrealized gain on investments | | | 1.29 | |
Distributions to preferred shareholders from net investment income (common share equivalent basis) | | | (0.07 | ) |
| | |
|
|
|
Total from investment operations | | | 1.74 | |
| | |
|
|
|
| |
Distributions to Common Shareholders | | | (0.47 | ) |
| | |
|
|
|
| |
Common and Preferred Shares Offering Expenses Charged to Paid-In Capital | | | (0.13 | ) |
| | |
|
|
|
| |
Net Asset Value, End of Period | | $ | 15.47 | |
| | |
|
|
|
| |
Market Value, End of Period | | $ | 13.62 | |
| | |
|
|
|
| |
Total investment return(c) | | | | |
Net asset value | | | 11.42 | % |
Market value | | | -6.05 | % |
| |
Ratios and Supplemental Data | | | | |
Net assets applicable to Common Shareholders, end of period (thousands) | | $ | 238,386 | |
Preferred Shares, at liquidation value ($25,000 per share liquidation preference) (thousands) | | $ | 120,000 | |
Preferred Shares asset coverage per share | | $ | 74,664 | |
| |
Ratios to Average Net Assets Applicable to Common Shares:(d) | | | | |
Total expenses | | | 1.36 | % |
Net investment income, prior to effect of dividends to preferred shares | | | 5.31 | % |
Net investment income, after effect of dividends to preferred shares | | | 4.58 | % |
| |
Ratios to Average Managed Assets: (d)(e) | | | | |
Total expenses | | | 0.98 | % |
Net investment income, prior to effect of dividends to preferred shares | | | 3.83 | % |
Portfolio turnover rate | | | 75 | % |
| * | Commencement of investment operations. |
| (a) | Based on average shares outstanding during the period. |
| (b) | Before reimbursement of offering expenses charged to capital. |
| (c) | Total investment return is calculated assuming a purchase of a Common Share at the beginning of the period and a sale on the last day of the period reported either at net asset value (“NAV”) or market price per share. Dividends and distributions are assumed to be reinvested at NAV for NAV returns or the prices obtained under the Fund’s Dividend Reinvestment Plan for market value returns. Total investment return does not reflect brokerage commissions. A return calculated for a period of less than one year is not annualized. |
| (e) | Managed assets is equal to net assets applicable to Common Shareholders plus outstanding leverage, such as the liquidation value of preferred shares. |
See notes to financial statements.
| | |
| | | Annual Report | December 31, 2004 | 11 |
TYW | TS&W/Claymore Tax-Advantaged Balanced Fund
Notes to Financial Statements | December 31, 2004
Note 1 – Organization:
TS&W/Claymore Tax-Advantaged Balanced Fund (the “Fund”) was organized as a Delaware statutory trust on February 12, 2004. The Fund is registered as a diversified, closed-end management investment company under the Investment Company Act of 1940, as amended, and Securities Act of 1933, as amended.
Under normal market conditions, the Fund will invest at least 50%, but less than 60%, of its total assets in debt securities and other obligations issued by or on behalf of states, territories and possessions of the United States and the District of Columbia and their political subdivisions, agencies and instrumentalities, the interest on which is exempt from regular federal income tax and which is not a preference item for purposes of the alternative minimum tax (the “Municipal Securities Portfolio”) and at least 40%, but less than 50%, of its total assets in common stocks, preferred securities and other income securities (the “Equity and Income Securities Portfolio”).
Note 2 – Significant Accounting Policies:
The preparation of the financial statements in accordance with U.S. generally accepted accounting principles requires management to make estimates and assumptions that affect the reported amounts and disclosures in the financial statements. Actual results could differ from these estimates.
The following is a summary of significant accounting policies consistently followed by the Fund.
(a) Valuation of Investments
Readily marketable portfolio securities listed on an exchange are valued at their sales price as of the close of such securities exchange. Listed securities for which the last sales price is not available are valued at the last available bid price. Securities traded in the over-the-counter market are valued at the NASDAQ Official Closing Price. Preferred stocks are valued at their sales price as of the close of the exchange in which they are traded. Preferred stocks for which the last sales price is not available are valued at the mean of the bid and asked prices. Debt securities are valued at the last available bid price. Option contracts are valued at the closing price on the exchange which they are traded. Foreign securities are translated from the local currency into U.S.dollars using current exchange rates. The Fund’s securities that are primarily traded in foreign markets may be traded in such markets on days that the NYSE is closed. As a result, the net asset value of the Fund may be significantly affected on days when holders of Common Shares have no ability to trade the Common Shares on the NYSE. For those securities where quotations or prices are not available, valuations are determined in accordance with procedures established in good faith by the Board of Trustees. Short- term securities with remaining maturities of less than 60 days are valued at cost which, when combined with interest earned, approximates market value.
(b) Investment Transactions and Investment Income
Investment transactions are accounted for on the trade date. Realized gains and losses on investments are determined on the identified cost basis. Dividend income is recorded net of applicable withholding taxes on the ex-dividend date and interest income is recorded on an accrual basis. Discounts or premiums on debt securities purchased are accreted or amortized to interest income over the lives of the respective securities using the effective interest method.
(c) Swaps
A swap is an agreement to exchange the return generated by one instrument for the return generated by another instrument. The Fund may enter into swap agreements to manage its exposure to interest rates or to manage the duration of its portfolio. The swaps are valued at current market value and any unrealized gain or loss is included in the Statement of Operations. Gain or loss is realized on the termination date of the swap and is equal to the difference between the Fund’s basis in the swap and the proceeds of the closing transaction, including any fees. During the period that the swap agreement is open, the Fund may be subject to risk from the potential inability of the counterparty to meet the terms of the agreement. The swaps involve elements of both market and credit risk in excess of the amounts reflected on the Statement of Assets and Liabilities.
The Fund entered into interest rate swap agreements during the period ended December 31, 2004. The Fund generally invests in these interest rate swap transactions in order to manage the duration of the Municipal Securities Portfolio. There were no swap agreements outstanding as of December 31, 2004.
(d) Options
For hedging and investment purposes, the Fund may purchase put options, put options on futures and write (sell) call options on securities. The risk associated with purchasing an option is that the Fund pays a premium whether or not the option is exercised. Put and call options purchased are accounted for in the same manner as portfolio securities. The cost of securities acquired through the exercise of call options is increased by premiums paid. The proceeds from securities sold through the exercise of put options are decreased by the premiums paid.
During the period ended December 31, 2004, the Fund purchased an option on a futures contract. The Fund generally invests in options on futures contracts in order to seek to hedge interest rate risks. Details of the option purchased as of December 31, 2004, is as follows:
| | | | | | | | | | | | | | |
Put Option Purchased
| | # of
Contracts
| | Par Value
Per Contract
| | Expiration
Date
| | Exercise
Price
| | Unrealized
Depreciation
| |
U.S.Treasury Note 10 Year Future | | 500 | | $ | 100,000 | | 5/20/05 | | $ | 15.625 | | $ | (2,500 | ) |
(e) Indemnifications
In the normal course of business, the Fund enters into contracts that provide general indemnifications. The Fund’s maximum exposure under these arrangements is dependent upon claims that may be made against the Fund in the future, and, therefore cannot be estimated; however, the risk of material loss from such claims is considered remote.
Note 3 – Investment Advisory Agreement, Investment Sub-Advisory Agreement and Other Agreements:
Pursuant to an Investment Advisory Agreement (the “Agreement”) between Claymore Advisors, LLC as the Investment Advisor and the Fund, the Advisor is responsible for managing, either directly or through others selected by it, the investment activities of the Fund and the Fund’s business affairs and other administrative matters. In addition to serving as investment advisor of the Fund, the Advisor will provide day-to-day portfolio management of the Fund’s assets allocated to the Municipal Securities Portfolio. The Advisor will receive a fee, payable monthly, at an annual rate equal to 0.70% of the Fund’s average daily managed assets (total assets, including the assets attributable to the proceeds from any financial leverage, minus liabilities, other than debt representing financial leverage).
The Advisor has entered into an Investment Sub-Advisory agreement with Thompson, Siegel & Walmsley, Inc. (the “Sub-Advisor”) to act as the investment sub-advisor responsible for day-to-day portfolio management of the Fund’s assets allocated to the Equity and Income Securities Portfolio. Under the terms of the investment sub-advisory agreement between the Advisor and the Sub-Advisor, the Advisor pays monthly to the Sub-Advisor a fee at the annual rate of 0.42% of the Fund’s average managed assets attributable to the Equity and Income Securities Portfolio.
| | |
12 | Annual Report | December 31, 2004 | | |
TYW | TS&W/Claymore Tax-Advantaged Balanced Fund | Notes to Financial Statements continued
The Bank of New York (“BNY”) acts as the Fund’s custodian, administrator and transfer agent. As custodian, BNY is responsible for the custody of the Fund’s assets. As administrator, BNY is responsible for maintaining the books and records of the Fund’s securities and cash. As transfer agent, BNY is responsible for performing transfer agency services for the Fund.
Certain officers and trustees of the Fund are also officers and directors of the Advisor or Thompson, Siegel & Walmsley, Inc. The Fund does not compensate its officers or trustees who are officers of the aforementioned firms.
Note 4 – Federal Income Taxes:
The Fund intends to comply with the requirements of Subchapter M of the Internal Revenue Code of 1986, as amended, applicable to regulated investment companies. Accordingly, no provision for U.S. federal income taxes is required. In addition, by distributing substantially all of its ordinary income and long-term capital gains, if any, during each calendar year, the Fund intends not to be subject to U.S. federal excise tax.
Due to inherent differences in the recognition of income, expenses and realized gains/losses under accounting principles generally accepted in the United States of America and federal income tax purposes, permanent differences between book and tax basis reporting have been identified and appropriately reclassified on the Statement of Assets and Liabilities. A permanent book and tax basis difference relating to short-term capital gains in the amount of $1,398,203 was reclassified from accumulated net realized gain/loss to accumulated net investment income. Additionally, permanent book to tax differences relating to the Fund’s investments in Real Estate Investment Trusts totaling $8,484 was reclassified from accumulated net investment income to accumulated net realized gain/loss.
Capital losses incurred after October 31 (“post-October” losses) within the taxable year are deemed to arise on the first business day of the Fund’s next taxable year. The Fund incurred and will elect to defer net capital losses during 2004 in the amount of $494,072.
At December 31, 2004, the cost and related gross unrealized appreciation and depreciation for tax purposes are as follows:
| | | | | | | | | | | | | | | | | | |
Cost of Investments for
Tax Purposes
| | Gross Tax Unrealized
Appreciation
| | Gross Tax Unrealized
Depreciation
| | | Net Tax Unrealized
Appreciation on
Investments
| | Undistributed
Ordinary Income
| | Undistributed Gains/
(Accumulated Capital
Loss)
| |
| $ | 336,701,242 | | $ | 20,774,998 | | $ | (1,668,584 | ) | | $ | 19,106,414 | | $ | 1,080,233 | | $ | (494,071 | ) |
The differences between book basis and tax basis unrealized appreciation/(depreciation) is attributable to the tax deferral of losses on wash sales, additional income accrued for tax purposes on certain convertible preferred stocks and investments in real estate investment trusts.
For the period ended December 31, 2004, the tax character of distributions paid, as reflected in the Statement of Changes in Net Assets, were $4,763,713 of ordinary income, $3,564,213 of tax-exempt income and $3,042 of long-term capital gain.
Note 5 – Investments in Securities:
For the period ended December 31, 2004, purchases and sales of investments, other than short-term securities, were $545,621,034 and $212,151,954, respectively.
Note 6 – Capital:
Common Shares
In connection with its organizational process, the Fund sold 7,000 common shares of beneficial interest to Claymore Securities, Inc., an affiliate of the Advisor, for consideration of $100,275.
The Fund issued 15,000,000 shares of common shares of beneficial interest in its initial public offering. These shares were all issued at $14.325 per share after deducting the sales load but before a reimbursement of expenses to the underwriters of $0.005 per share. In connection with the initial public offering of the Fund’s common shares, the underwriters were granted an option to purchase additional common shares. On May 18, 2004, the underwriters purchased, at a price of $14.325 per common share (after deducting the sales load but before underwriters’ expense reimbursement), 400,000 common shares of the Fund pursuant to this over-allotment option.
Offering costs, estimated at $462,000 or $0.03 per share, in connection with the issuance of the common shares have been borne by the Fund and were charged to paid-in-capital. The Advisor agreed to pay offering expenses (other than the sales load, but including the reimbursement of expenses to the underwriters) in excess of $0.03 per common share. The Advisor also agreed to reimburse the Fund’s organizational expenses, which are estimated at $25,000.
Preferred Shares
On April 29, 2004, the Fund’s Board of Trustees authorized the issuance of preferred shares, in addition to the existing common shares, as part of the Fund’s leverage strategy. The Fund may also borrow or issue debt securities collectively with preferred shares for leveraging purposes. Preferred shares issued by the Fund have seniority over the common shares.
On July 1, 2004, the Fund issued 2,400 shares of Preferred Shares Series M7 and 2,400 shares of Preferred Shares Series T28 each with a net asset and liquidation value of $25,000 per share plus accrued dividends. Dividends are accumulated daily at an annual rate set through auction procedures. Distribution of net realized capital gains, if any, are paid annually.
Offering costs, including the 1% sales charge associated with the issuance of preferred shares, estimated at $1,550,000 were borne by the common shareholders as a direct reduction to paid-in-capital.
For the period ended December 31, 2004, the annualized dividend rates ranged from:
| | | | | | | | | |
| | | High
| | | Low
| | | At 12/31/04
| |
Series M7 | | 2.55 | % | | 1.52 | % | | 2.55 | % |
| | | |
Series T28 | | 2.45 | % | | 1.55 | % | | 2.45 | % |
The Fund is subject to certain limitations and restrictions while Preferred Shares are outstanding. Failure to comply with these limitations and restrictions could preclude the Fund from declaring any dividends or distributions to common shareholders or repurchasing common shares and/or could trigger the mandatory redemption on Preferred Shares at their liquidation value.
Preferred Shares, which are entitled to one vote per share, generally vote with the common stock but vote separately as a class to elect two Trustees and on any matters affecting the rights of the Preferred Shares.
Note 7 – Subsequent Event
On February 1, 2005, the Board of Trustees declared a quarterly dividend of $0.234375 per common share, which is payable on February 28, 2005 to shareholders of record on February 15, 2005.
| | |
| | | Annual Report | December 31, 2004 | 13 |
TYW | TS&W/Claymore Tax-Advantaged Balanced Fund
Report of Independent Registered Public Accounting Firm
To the Shareholders and Board of Trustees of
TS&W/Claymore Tax-Advantaged Balanced Fund
We have audited the accompanying statement of assets and liabilities of TS&W/Claymore Tax-Advantaged Balanced Fund (the “Fund”), including the portfolio of investments, as of December 31, 2004, and the related statement of operations, statement of changes in net assets, and financial highlights for the period from April 28, 2004 (commencement of operations) through December 31, 2004. These financial statements and financial highlights are the responsibility of the Fund’s management. Our responsibility is to express an opinion on these financial statements and financial highlights based on our audit.
We conducted our audit in accordance with the standards of the Public Company Accounting Oversight Board (United States). Those standards require that we plan and perform the audit to obtain reasonable assurance about whether the financial statements and financial highlights are free of material misstatement. An audit includes consideration of internal control over financial reporting as a basis for designing audit procedures that are appropriate in the circumstances, but not for the purpose of expressing an opinion on the Fund’s internal control over financial reporting. Accordingly, we express no such opinion. An audit also includes examining, on a test basis, evidence supporting the amounts and disclosures in the financial statements and financial highlights, assessing the accounting principles used and significant estimates made by management, as well as evaluating the overall financial statement presentation. Our procedures included confirmation of securities owned as of December 31, 2004, by correspondence with the custodian and brokers or by other appropriate auditing procedures where replies from brokers were not received. We believe that our audit provides a reasonable basis for our opinion.
In our opinion, the financial statements and financial highlights referred to above present fairly, in all material respects, the financial position of TS&W/Claymore Tax-Advantaged Balanced Fund at December 31, 2004, and the results of its operations, changes in its net assets, and the financial highlights for the period from April 28, 2004 through December 31, 2004, in conformity with U.S. generally accepted accounting principles.

Chicago, Illinois
February 11, 2005
| | |
14 | Annual Report | December 31, 2004 | | |
TYW | TS&W/Claymore Tax-Advantaged Balanced Fund
Supplemental Information | (unaudited)
Federal Income Tax Information
Qualified dividend income of as much as $2,899,649 was received by the Fund through December 31, 2004. The Fund intends to designate the maximum amount of dividends that qualify for the reduced tax rate pursuant to the Jobs and Growth Tax Relief Reconciliation Act of 2003.
For corporate shareholders, $2,082,676 of investment income (dividend income plus short-term gains, if any) qualifies for the dividends-received deduction.
In January 2005, you will be advised on IRS Form 1099 DIV or substitute 1099 DIV as to the federal tax status of the distributions received by you in the calendar year 2004.
Trustees
The trustees of the TS&W/Claymore Tax-Advantaged Balanced Fund and their principal occupations during the past five years:
| | | | | | |
Name, Address*, Age and Position(s) Held With Registrant
| | Term of Office
and Length of
Time Served
| | Principal Occupation During the Past Five
Years and Other Affiliations
| | Other Directorships Held by Trustee
|
| Independent Trustees: | | | | | | |
| | | |
Robert M. Hamje Age: 61 Trustee | | Since 2004 | | Formerly, Advisor to the Cleveland Foundation Investment Committee. Formerly, President and Chief Investment Officer of TRW Investment Management Company (1990-2003). | | Trustee, Old Mutual Advisor Mutual Funds. |
| | | |
L. Kent Moore Age: 49 Trustee | | Since 2004 | | Managing Director High Sierra Energy L.P., 2004- Present. Formerly, Portfolio Manager and Vice President of Janus Capital Corp. (2000-2002) and Senior Analyst/Portfolio Manager of Marsico Capital Management (1997-1999). | | Trustee, Old Mutual Advisor Mutual Funds. |
| | | |
Ronald A. Nyberg Age: 51 Trustee | | Since 2004 | | Principal of Ronald A. Nyberg, Ltd. a law firm specializing in corporate law, estate planning and business transactions from 2000-present. Formerly, Executive Vice President, General Counsel and Corporate Secretary of Van Kampen Investments (1982-1999). | | Trustee, Advent Claymore Convertible Securities and Income Fund, MBIA Capital/Claymore Managed Duration Investment Grade Municipal Fund, Western Asset/Claymore U.S. Treasury Inflation Protected Securities Fund, Dreman/Claymore Dividend & Income Fund; Western Asset/Claymore U.S. Treasury Inflation Protected Securities Fund 2, Madison/Claymore Covered Call Fund and Fiduciary/Claymore MLP Opportunity Fund. |
| | | |
Ronald E. Toupin, Jr. Age: 46 Trustee | | Since 2004 | | Formerly, Vice President, Manager and Portfolio Manager of Nuveen Asset Management (1998-1999), Vice President of Nuveen Investment Advisory Corporation (1992-1999), Vice President and Manager of Nuveen Unit Investment Trusts (1991-1999), and Assistant Vice President and Portfolio Manager of Nuveen Unit Investment Trusts (1988-1999), each of John Nuveen & Company, Inc. (1982-1999). | | Trustee, Advent Claymore Convertible Securities and Income Fund, MBIA Capital/Claymore Managed Duration Investment Grade Municipal Fund, Western Asset/Claymore U.S. Treasury Inflation Protected Securities Fund, Dreman/Claymore Dividend & Income Fund, Western Asset/Claymore U.S. Treasury Inflation Protected Securities Fund 2, Madison/Claymore Covered Call Fund and Fiduciary/Claymore MLP Opportunity Fund. |
| | | |
| Interested Trustees: | | | | | | |
| | | |
Nicholas Dalmaso† Age: 39 Trustee and Chief Legal and Executive Officer | | Since 2004 | | Senior Managing Director and General Counsel of Claymore Advisors, LLC and Claymore Securities, Inc. (2001-present). Formerly, Assistant General Counsel, John Nuveen and Company, Inc. (1999-2000). Former Vice President and Associate General Counsel of Van Kampen Investments, Inc. (1992-1999). | | Trustee, Advent Claymore Convertible Securities and Income Fund, Dreman/Claymore Dividend & Income Fund, MBIA Capital/Claymore Managed Duration Investment Grade Municipal Fund, Western Asset/Claymore U.S. Treasury Inflation Protected Securities Fund, Flaherty & Crumrine/Claymore Preferred Securities & Income Fund, Flaherty & Crumrine/ Claymore Total Return Fund, Western Asset/Claymore U.S. Treasury Inflation Protected Securities Fund 2, Madison/ Claymore Covered Call Fund and Fiduciary/Claymore MLP Opportunity Fund. |
| * | Address for all Trustees unless otherwise noted: 2455 Corporate West Drive, Lisle, IL 60532 |
| † | Mr. Dalmaso may be deemed an “interested person” because of his position as an officer of Claymore Advisors, LLC, the Fund’s Investment Advisor. |
| | |
| | | Annual Report | December 31, 2004 | 15 |
TYW | TS&W/Claymore Tax-Advantaged Balanced Fund
Dividend Reinvestment Plan
Unless the registered owner of common shares elects to receive cash by contacting the Plan Administrator, all dividends declared on common shares of the Fund will be automatically reinvested by the Bank of New York (the “Plan Administrator”), Administrator for shareholders in the Fund’s Dividend Reinvestment Plan (the “Plan”), in additional common shares of the Fund. Participation in the Plan is completely voluntary and may be terminated or resumed at any time without penalty by notice if received and processed by the Plan Administrator prior to the dividend record date; otherwise such termination or resumption will be effective with respect to any subsequently declared dividend or other distribution. Some brokers may automatically elect to receive cash on your behalf and may reinvest that cash in additional common shares of the Fund for you. If you wish for all dividends declared on your common shares of the Fund to be automatically reinvested pursuant to the Plan, please contact your broker.
The Plan Administrator will open an account for each common shareholder under the Plan in the same name in which such common shareholder’s common shares are registered. Whenever the Fund declares a dividend or other distribution (together, a “Dividend”) payable in cash, non-participants in the Plan will receive cash and participants in the Plan will receive the equivalent in common shares. The common shares will be acquired by the Plan Administrator for the participants’ accounts, depending upon the circumstances described below, either (i) through receipt of additional unissued but authorized common shares from the Fund (“Newly Issued Common Shares”) or (ii) by purchase of outstanding common shares on the open market (“Open-Market Purchases”) on the New York Stock Exchange or elsewhere. If, on the payment date for any Dividend, the closing market price plus estimated brokerage commission per common share is equal to or greater than the net asset value per common share, the Plan Administrator will invest the Dividend amount in Newly Issued Common Shares on behalf of the participants. The number of Newly Issued Common Shares to be credited to each participant’s account will be determined by dividing the dollar amount of the Dividend by the net asset value per common share on the payment date; provided that, if the net asset value is less than or equal to 95% of the closing market value on the payment date, the dollar amount of the Dividend will be divided by 95% of the closing market price per common share on the payment date. If, on the payment date for any Dividend, the net asset value per common share is greater than the closing market value plus estimated brokerage commission, the Plan Administrator will invest the Dividend amount in common shares acquired on behalf of the participants in Open-Market Purchases.
If, before the Plan Administrator has completed its Open-Market Purchases, the market price per common share exceeds the net asset value per common share, the average per common share purchase price paid by the Plan Administrator may exceed the net asset value of the common shares, resulting in the acquisition of fewer common shares than if the Dividend had been paid in Newly Issued Common Shares on the Dividend payment date. Because of the foregoing difficulty with respect to Open-Market Purchases, the Plan provides that if the Plan Administrator is unable to invest the full Dividend amount in Open-Market Purchases during the purchase period or if the market discount shifts to a market premium during the purchase period, the Plan Administrator may cease making Open-Market Purchases and may invest the uninvested portion of the Dividend amount in Newly Issued Common Shares at net asset value per common share at the close of business on the Last Purchase Date provided that, if the net asset value is less than or equal to 95% of the then current market price per common share; the dollar amount of the Dividend will be divided by 95% of the market price on the payment date.
The Plan Administrator maintains all shareholders’ accounts in the Plan and furnishes written confirmation of all transactions in the accounts, including information needed by shareholders for tax records. Common shares in the account of each Plan participant will be held by the Plan Administrator on behalf of the Plan participant, and each shareholder proxy will include those shares purchased or received pursuant to the Plan. The Plan Administrator will forward all proxy solicitation materials to participants and vote proxies for shares held under the Plan in accordance with the instruction of the participants.
There will be no brokerage charges with respect to common shares issued directly by the Fund. However, each participant will pay a pro rata share of brokerage commission incurred in connection with Open-Market Purchases. The automatic reinvestment of Dividends will not relieve participants of any Federal, state or local income tax that may be payable (or required to be withheld) on such Dividends.
The Fund reserves the right to amend or terminate the Plan. There is no direct service charge to participants with regard to purchases in the Plan; however, the Fund reserves the right to amend the Plan to include a service charge payable by the participants.
All correspondence or questions concerning the Plan should be directed to the Plan Administrator, The Bank of New York, 2 Hanson Place, Brooklyn, NY 11217, Attention: Irina Krylov, Phone Number: (718) 315-4818.
| | |
16 | Annual Report | December 31, 2004 | | |
TYW | TS&W/Claymore Tax-Advantaged Balanced Fund
Fund Information
Board of Trustees
Nicholas Dalmaso
Robert M. Hamje
L. Kent Moore
Ronald A. Nyberg
Ronald E.Toupin, Jr.
Officers
Nicholas Dalmaso
Chief Executive and Legal Officer
Steven M. Hill
Chief Financial Officer and
Treasurer
Heidemarie Gregoriev
Secretary
Vincent R. Giordano
Vice President
George Gregorio
Vice President
Anne S. Kochevar
Vice President
Roberto W. Roffo
Vice President
Investment Manager
Thompson, Siegel & Walmsley, Inc.
Richmond,Virginia
Investment Advisor
Claymore Advisors, LLC
Lisle, Illinois
Administrator, Custodian and
Transfer Agent
The Bank of New York
New York, New York
Preferred Stock - Dividend Paying Agent
The Bank of New York
New York, New York
Legal Counsel
Skadden, Arps, Slate, Meagher &
Flom LLP
Chicago, Illinois
Independent Registered Public Accounting Firm
Ernst & Young LLP
Chicago, Illinois
Privacy Principles of TS&W/Claymore Tax-Advantaged Balanced Fund for Shareholders
The Fund is committed to maintaining the privacy of its shareholders and to safeguarding its non-public personal information. The following information is provided to help you understand what personal information the Fund collects, how we protect that information and why, in certain cases, we may share information with select other parties.
Generally, the Fund does not receive any non-public personal information relating to its shareholders, although certain non-public personal information of its shareholders may become available to the Fund. The Fund does not disclose any non-public personal information about its shareholders or former shareholders to anyone, except as permitted by law or as is necessary in order to service shareholder accounts (for example, to a transfer agent or third party administrator).
The Fund restricts access to non-public personal information about the shareholders to Claymore Advisors, LLC employees with a legitimate business need for the information. The Fund maintains physical, electronic and procedural safeguards designed to protect the non-public personal information of its shareholders.
Questions concerning your shares of TS&W/Claymore Tax-Advantaged Balanced Fund?
| | • | | If your shares are held in a Brokerage Account, contact your Broker. |
| | • | | If you have physical possession of your shares in certificate form, contact the Fund’s Administrator, Custodian and Transfer Agent: |
The Bank of New York, 111 Sanders Creek Parkway, East Syracuse, NY 13057 (800) 701-8178
This report is sent to shareholders of TS&W/Claymore Tax-Advantaged Balanced Fund for their information. It is not a Prospectus, circular or representation intended for use in the purchase or sale of shares of the Fund or of any securities mentioned in this report.
A description of the Fund’s proxy voting policies and procedures related to portfolio securities is available without charge, upon request, by calling the Fund at (800) 345-7999 or on the Securities & Exchange Commission’s website at http://www.sec.gov.
Information regarding how the Fund voted proxies for portfolio securities, if applicable, during the most recent 12-month period ended June 30, is also available, without charge and upon request by calling the Fund at (800) 345-7999 or by accessing the Fund’s Form N-PX on the Commission’s website at http://www.sec.gov.
The Fund files its complete schedule of portfolio holdings with the Securities and Exchange Commission for the first and third quarters of each fiscal year on Form N-Q. The Fund’s Form N-Q is available on the SEC website at http://www. sec. gov. The Fund’s Form N-Q may also be reviewed and copied at the Commission’s Public Reference Room in Washington, DC; information on the operation of the Public Reference Room may be obtained by calling (800) SEC-0330.
| | |
| | | Annual Report | December 31, 2004 | 17 |

(a) The registrant has adopted a code of ethics (the “Code of Ethics”) that applies to its principal executive officer, principal financial officer, principal accounting officer or controller, or persons performing similar functions.
(b) No information need be disclosed pursuant to this paragraph.
(c) A provision regarding the procedures for reporting violations under the Code of Ethics was amended during the period covered by the shareholder report presented in Item 1.
(d) The registrant has not granted a waiver or an implicit waiver from a provision of its Code of Ethics during the period covered by the report.
(e) Not applicable.
(f) (1) The registrant’s Code of Ethics is attached hereto as an exhibit.
(2) Not applicable.
(3) Not applicable.
| Item 3. | Audit Committee Financial Expert. |
The registrant’s Board of Trustees has determined that it has at least one audit committee financial expert serving on its audit committee, Ronald E. Toupin, Jr. Mr. Toupin is an “independent” Trustee. Mr. Toupin qualifies as an audit committee financial expert by virtue of his experience obtained as a portfolio manager and research analyst, which included review and analysis of offering documents and audited and unaudited financial statements using GAAP to show accounting estimates, accruals and reserves.
(Under applicable securities laws, a person who is determined to be an audit committee financial expert will not be deemed an “expert” for any purpose, including without limitation for the purposes of Section 11 of the Securities Act of 1933, as a result of being designated or identified as an audit committee financial expert. The designation or identification of a person as an audit committee financial expert does not impose on such person any duties, obligations, or liabilities that are greater than the duties, obligations, and liabilities imposed on such person as a member of the audit committee and Board of Trustees in the absence of such designation or identification.)
| Item 4. | Principal Accountant Fees and Services. |
(a). Audit Fees: the aggregate fees billed for the fiscal period from April 28, 2004 (inception of the Trust) through December 31, 2004, for professional services rendered by the principal accountant for the audit were $34,500. The aggregate fees billed for fiscal year 2003 for professional services rendered by the principal accountant were $0 as this fund was not in existence in 2003.
(b). Audit-Related Fees: the aggregate fees billed for the fiscal period from April 28, 2004 (inception of the Trust) through December 31, 2004, for assurance and related services by the principal accountant that are reasonably related to the performance of the audit of the registrant’s financial statements and are not reported under paragraph (a) of this item were $3,200. Specifically, this amount represents the amount paid for the audit of the preferred shares asset coverage test. The Audit-Related Fees for 2003 were $0 as this fund was not in existence in 2003.
(c). Tax Fees, the aggregate fees billed for the fiscal period from April 28, 2004 (inception of the Trust) through December 31, 2004, for professional services rendered by the principal accountant for tax compliance, tax advice, and tax planning is $2,000. The Tax Fees for 2003 is $0 as this fund was not in existence in 2003.
(d). All Other Fees, the aggregate fees billed for the fiscal period from April 28, 2004 (inception of the Trust) through December 31, 2004, for products and services provided by the principal accountant, other than the services reported in paragraphs (a) and (c) of this Item were $0. The Other Audit Fees for 2003 were $0 as this fund was not in existence in 2003.
(e) Audit Committee Pre-Approval Policies and Procedures.
(i) The Registrant’s audit committee reviews, and in its sole discretion, pre-approves, pursuant to written pre-approval procedures (A) all engagements for audit and non-audit services to be provided by the principal accountant to the registrant and (B) all engagements for non-audit services to be provided by the principal accountant (1) to the registrant’s investment adviser (not including a sub-adviser whose role is primarily portfolio management and is sub-contracted or overseen by another investment adviser) and (2) to any entity controlling, controlled by or under common control with the registrant’s investment adviser that provides ongoing services to the registrant; but in the case of the services described in subsection (B)(1) or (2), only if the engagement relates directly to the operations and financial reporting of the registrant; provided that such pre-approval need not be obtained in circumstances in which the pre-approval requirement is waived under rules promulgated by the Securities and Exchange Commission or New York Stock Exchange listing standards. The pre-approval policies are attached as an exhibit hereto. The policies provide for both “general pre-approval” and “specific pre-approval” as defined therein. During the fiscal period ended December 31, 2004, the registrant utilized only the specific pre-approval method.
(ii) 100% of services described in each of Items 4(b) through (d) were approved by the audit committee pursuant to paragraph (c)(7)(A) of Rule 2-01 of Regulation S-X.
(f) The percentage of hours expended on the principal accountant’s engagement to audit the Fund’s financial statements for the most recent fiscal year attributable to work performed by persons other than the principal accountant’s full-time, permanent employees was 0%.
(g) The aggregate non-audit fees billed by the registrant’s accountant for services rendered to the registrant, the registrant’s investment adviser, and any entity controlling, controlled by, or under common control with the adviser that provides ongoing services to the registrant (not including a sub-adviser whose role is primarily portfolio management and is sub-contracted or overseen by another investment adviser) that directly related to the operations and financial reporting of the registrant for the period from April 28, 2004 to December 31, 2004 were $5,200.
(h) Not Applicable.
| Item 5. | Audit Committee of Listed Registrants. |
(a) The registrant has a separately designated standing audit committee established in accordance with Section 3(a)(58)(A) of the Securities Exchange Act of 1934. The audit committee of the registrant is comprised of: Robert M. Hamje, L. Kent Moore, Ronald A, Nyberg and Ronald E. Toupin. .
(b) Not Applicable.
| Item 6. | Schedule of Investments. |
The Schedule of Investments is included as part of Item 1.
| Item 7. | Disclosure of Proxy Voting Policies and Procedures for Closed-End Management Investment Companies. |
The registrant has delegated the voting of proxies relating to its voting securities to its investment sub-adviser, Thompson, Siegel & Walmsley, Inc. (the “Sub-Adviser”). The Sub-Adviser’s Proxy Voting Policies and Procedures are included as an exhibit hereto.
| Item 8. | Portfolio Managers of Closed-End Management Investment Companies. |
Not Applicable at this reporting period
| Item 9. | Purchases of Equity Securities by Closed-End Management Investment Company and Affiliated Purchasers. |
None.
| Item 10. | Submission of Matters to a Vote of Security Holders. |
During the period covered by this report, the registrant adopted written procedures by which shareholders may recommend nominees to the registrant’s Board of Trustees.
| Item 11. | Controls and Procedures. |
(a) The registrant’s principal executive officer and principal financial officer have evaluated the registrant’s disclosure controls and procedures within 90 days of this filing and have concluded that the registrant’s disclosure controls and procedures were effective, as of that date, in ensuring that information required to be disclosed by the registrant in this Form N-CSR was recorded, processed, summarized, and reported in a timely manner.
(b) There was no change in the registrant’s internal control over financial reporting that occurred during the registrant’s most recent fiscal half-year that has materially affected, or is reasonably likely to materially affect, the registrant’s internal control over financial reporting.
(a)(1) Code of Ethics for Chief Executive and Senior Financial Officer.
(a)(2) Certifications of principal executive officer and principal financial officer pursuant to Rule 30a-2 of the Investment Company Act of 1940.
(b) Certifications of principal executive officer and principal financial officer pursuant to Section 906 of the Sarbanes-Oxley Act of 2002.
(c) Proxy Voting Policies and Procedures.
SIGNATURES
Pursuant to the requirements of the Securities Exchange Act of 1934 and the Investment Company Act of 1940, the registrant has duly caused this report to be signed on its behalf by the undersigned, thereunto duly authorized.
| | |
| TS&W/Claymore Tax-Advantaged Balanced Fund |
| |
| By: | | /s/ Nicholas Dalmaso |
Name: | | Nicholas Dalmaso |
Title: | | Chief Legal and Executive Officer |
| |
Date: | | March 7, 2005 |
Pursuant to the requirements of the Securities Exchange Act of 1934 and the Investment Company Act of 1940, this report has been signed by the following persons on behalf of the registrant and in the capacities and on the dates indicated.
| | |
| |
| By: | | /s/ Nicholas Dalmaso |
Name: | | Nicholas Dalmaso |
Title: | | Chief Legal and Executive Officer |
| |
Date: | | March 7, 2005 |
| |
| By: | | /s/ Steven M. Hill |
Name: | | Steven M. Hill |
Title: | | Treasurer and Chief Financial Officer |
| |
Date: | | March 7, 2005 |