UNITED STATES
SECURITIES AND EXCHANGE COMMISSION
Washington, D.C. 20549
FORM N-CSR
CERTIFIED SHAREHOLDER REPORT OF REGISTERED
MANAGEMENT INVESTMENT COMPANIES
Investment Company Act file number 811-21515
TS&W / Claymore Tax-Advantaged Balanced Fund
(Exact name of registrant as specified in charter)
2455 Corporate West Drive
Lisle, IL 60532
(Address of principal executive offices) (Zip code)
Nicholas Dalmaso, Chief Legal and Executive Officer
TS&W / Claymore Tax-Advantaged Balanced Fund
2455 Corporate West Drive
Lisle, IL 60532
(Name and address of agent for service)
Registrant’s telephone number, including area code: (630) 505-3700
Date of fiscal year end: December 31
Date of reporting period: June 30, 2005
Form N-CSR is to be used by management investment companies to file reports with the Commission not later than 10 days after the transmission to stockholders of any report that is required to be transmitted to stockholders under Rule 30e-1 under the Investment Company Act of 1940 (17 CFR 270.30e-1). The Commission may use the information provided on Form N-CSR in its regulatory, disclosure review, inspection, and policymaking roles.
A registrant is required to disclose the information specified by Form N-CSR, and the Commission will make this information public. A registrant is not required to respond to the collection of information contained in Form N-CSR unless the Form displays a currently valid Office of Management and Budget (“OMB”) control number. Please direct comments concerning the accuracy of the information collection burden estimate and any suggestions for reducing the burden to Secretary, Securities and Exchange Commission, 450 Fifth Street, NW, Washington, DC 20549-0609. The OMB has reviewed this collection of information under the clearance requirements of 44 U.S.C. Section 3507.
Item 1. Reports to Stockholders.
The registrant’s semi-annual report transmitted to shareholders pursuant to Rule 30e-1 under the Investment Company Act of 1940 is as follows:
SemiAnnual
Report
June 30, 2005
TS&W/Claymore
TYW
Tax-Advantaged Balanced Fund
Thompson, Siegel & Walmsley, Inc.
Investment Counsel
www.tswclaymore.com
... home port for the LATEST,
most up-to-date INFORMATION about the
TS&W/Claymore Tax-Advantaged Balanced Fund

The shareholder report you are reading right now is just the beginning of the story. Online at tswclaymore.com, you will find:
| • | | Daily, weekly and monthly data on share prices, distributions and more |
| • | | Monthly portfolio overviews and performance analyses |
| • | | Announcements, press releases and special notices |
| • | | Fund and adviser contact information |
Thompson, Siegel & Walmsley, Inc. and Claymore are continually updating and expanding shareholder information services on the Fund’s website, in an ongoing effort to provide you with the most current information about how your Fund’s assets are managed, and the results of our efforts. It is just one more way we are working to keep you better informed about your investment in the Fund.
2 | SemiAnnual Report | June 30, 2005
TYW | TS&W/Claymore Tax-Advantaged Balanced Fund
Dear Shareholder |
We thank you for your investment in TS&W/Claymore Tax-Advantaged Balanced Fund (TYW). We are pleased to submit the TYW semiannual shareholder report for the six-month period ended June 30, 2005.
As you may know, the Fund’s primary investment objective is to provide a high level of total after-tax return, including attractive tax-advantaged income. The Fund focuses its investments on securities that generate income that is either exempt from regular federal income tax or qualifies for federal income taxation at long-term capital gain rates (“tax-advantaged income”), while also offering the potential for capital appreciation through exposure to equity markets. The portfolio is comprised of municipal securities that are not preference items for purposes of the alternative minimum tax, equity and high-yield securities.
The Fund’s Investment Adviser is Claymore Advisors, LLC. Claymore Advisors is also the Investment Manager of the Fund’s municipal bond portfolio and is responsible for managing the Fund’s overall asset allocation. Thompson, Siegel & Walmsley Inc. (TS&W) serves as Investment Sub-Adviser to the Fund and is responsible for the day-to-day portfolio management of the Fund’s equity portfolio and other non-municipal income-producing securities. TS&W was founded in 1969 and provides investment management services to corporations, pension and profit-sharing plans, 401(k) and thrift plans, trusts, estates and other institutions and individuals. As of June 30, 2005,TS&W had approximately $5.7 billion in assets under management.
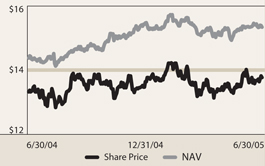
During the six-month period, the Fund generated a total return of 2.14% at net asset value (NAV). This represents a change in NAV from $15.47 at the start of the period to $15.33 on June 30, 2005 plus the reinvestment of the Fund’s quarterly dividends. The Fund’s market price exceeded these returns with a gain of 4.39%, which reflects a market price of $13.75 at the close of the period vs. $13.62 on December 31, 2004 plus the reinvestment of the Fund’s quarterly dividends.
We’d like to encourage shareholders to consider the opportunity to reinvest their dividends from the Fund through the Dividend Reinvestment Plan (DRIP) that is described in detail on page 22 of this report.
If shares should trade at a discount to NAV, the DRIP takes advantage of the discount by reinvesting the quarterly dividend distribution in common shares of the Fund purchased in the market at a price less than NAV. Conversely, when the market price of the Fund’s common shares is at a premium above NAV, the DRIP reinvests participants’ dividends in newly-issued common shares at NAV, subject to an IRS limitation that the purchase price can not be more than 5% below the market price per share. The DRIP provides a cost effective means to accumulate additional shares and enjoy the benefits of compounding returns over time.
To learn more about the Fund’s performance over this fiscal period, we encourage you to read the Portfolio Management Commentary section of the report on page 4. You’ll find information on what impacted the performance of the Fund during the fiscal period and the Investment Adviser’s and Sub-Adviser’s views on the overall market environment.
We appreciate your investment and look forward to serving your investment needs in the future. For the most up-to-date information on your investment, please visit the Fund’s website at www.tswclaymore.com.
|
| Sincerely, |
|
 |
Nicholas Dalmaso Chief Executive Officer,
TS&W/Claymore Tax-Advantaged Balanced Fund |
|
| August 8, 2005 |
SemiAnnual Report | June 30, 2005 | 3
TYW | TS&W/Claymore Tax-Advantaged Balanced Fund
Questions & Answers
TS&W/Claymore Tax-Advantaged Balanced Fund (TYW) is managed jointly by seasoned investment professionals from both Claymore Advisors, LLC and Thompson, Siegel & Walmsley, Inc. The teams employ their specialized experience to different sleeves within the Fund, but work closely with one another to collectively guide the overall operations of TYW.
Vincent R. Giordano
Portfolio Manager, Senior Managing Director,
Claymore Advisors, LLC
Giordano leads Claymore’s municipal fixed-income investment management team and co-manages the Fund’s municipal portfolio. With more than 30 years of investment experience, Giordano joined Claymore in 2003. He holds a degree from Fordham University.
Roberto W. Roffo
Portfolio Manager, Managing Director,
Claymore Advisors, LLC
Roffo co-manages the municipal portfolio. He has more than 12 years of investment management experience focused in the municipal market. Roffo joined Claymore in 2004, and has worked closely with Giordano throughout his career. He holds a Bachelor’s Degree from the University of Massachusetts.
Paul A. Ferwerda, CFA
Portfolio Manager, Senior Vice President-Domestic Equity and Research, Thompson,
Siegel & Walmsley, Inc. (TS&W)
Ferwerda is responsible for the day-to-day management of the Fund’s common stock portfolio. He has been with TS&W for more than 18 years and has 23 years of overall investment experience. Ferwerda has extensive equity research experience within the financial sector and holds an MBA from Duke University.
William M. Bellamy, CFA
Portfolio Manager, Vice President,
Thompson, Siegel & Walmsley, Inc. (TS&W)
Bellamy joined TS&W in 2002. He has more than 16 years of investment industry experience focused on the fixed-income markets. Bellamy is responsible for managing the Fund’s taxable fixed-income securities. He holds an MBA from Duke University.
TS&W/Claymore Tax-Advantaged Balanced Fund is co-managed by Paul A. Ferwerda and William M. Bellamy of Thompson, Siegel & Walmsley, Inc. (TS&W) and Vincent Giordano and Roberto Roffo of Claymore Advisors, LLC. In the following interview, the teams share their thoughts on the market and discuss the factors that influenced performance of the Fund in the semiannual fiscal period ended June 30, 2005.
How did the Fund perform in the six-month period ended June 30, 2005?
We’re very pleased with the Fund’s performance. The Fund generated a total return of 2.14% at net asset value (“NAV”). This represents a change in NAV from $15.47 at the start of the period to $15.33 on June 30, 2005 plus the reinvestment of the Fund’s quarterly dividends. The Fund’s market price exceeded these returns with a gain of 4.39%, which reflects a market price of $13.75 at the close of the period vs. $13.62 on December 31, 2004, plus the reinvestment of the Fund’s quarterly dividends. We’re especially heartened by the rise in market price that occurred during a period when many closed-end funds suffered losses in market value. Of course, we, as managers, cannot control the market price.
For NAV performance comparison purposes, the municipal bond market, as measured by the Lehman Brothers U.S. Municipal Bond Index returned 2.91% for the six-month period ended June 30, 20051. The broad equity market, as measured by the Standard & Poor’s 500 Index (S&P 500), returned -0.81% for that same six-month period.2 The high yield bond market, as measured by the Merrill Lynch High Yield Master II Index, returned 1.14% over the semiannual period.3
The Fund continued to pay an attractive quarterly distribution of $0.234375 per share. The most recent dividend, declared on
August 1, 2005, after the close of this fiscal period will be paid on August 31, 2005 to Fund shareholders of record as of August 15, 2005 with an ex-dividend date of August 11, 2005. This represents a distribution rate of 6.60% based upon the closing market price of $14.20 on July 29, 2005. Given the tax characteristics of the 2004 calendar year, this rate represents a taxable-equivalent distribution rate of 8.83% for a shareholder in the 35% maximum federal income tax bracket. The final determination of the tax characteristics of dividends paid is performed after the end of each calendar year.
Please tell us about the Fund’s asset allocation.
The Fund’s asset allocation remained in a tight range similar to where it was at the Fund’s inception on April, 28, 2004. On June 30, 2005, approximately 54% of the portfolio was invested in municipal securities, which provide, in many cases, income exempt from state and local taxes. About 37% was invested in equity securities which are focused on large-cap dividend-paying stocks. And just about 9% was invested in other taxable income-producing securities, which include high-yield bonds, real estate investment trusts, preferred stocks and other income-producing securities.
This asset allocation has worked well for the Fund and we expect to keep the allocation within a couple percent of this range. We believe this allocation is appropriate for today’s market environment. Of course, we monitor market trends and will adjust the allocation if we think it would be beneficial.
How does the Fund employ leverage?
TYW, like many closed-end funds, utilizes leverage as part of its investment strategy. The purpose of leverage is to fund the purchase of additional securities that provide increased income and potentially greater appreciation potential to shareholders than could be achieved from an unleveraged portfolio. In executing this
4 | SemiAnnual Report | June 30, 2005
TYW | TS&W/Claymore Tax-Advantaged Balanced Fund | Questions & Answers continued
strategy, the Fund issued Auction Market Preferred Shares (“AMPS”). As long as the cost of the AMPS is lower than the yields on our investments, the AMPS should enhance the Fund’s net interest income.
Of course, leverage results in greater NAV volatility and entails more downside risk than an unleveraged portfolio. The use of leverage also makes the Fund more vulnerable to rising interest rates. Approximately 33% of the Fund was leveraged as of June 30, 2005.
Claymore Advisors, LLC manages the Fund’s municipal portfolio. The following questions are related to that portion of the portfolio and are answered by Portfolio Managers Vincent R. Giordano and Roberto W. Roffo.
Will you explain how you select municipal securities for the Fund?
We begin by analyzing broad macroeconomic trends and developments affecting the fixed-income markets. Our team analyzes the economic outlook, market conditions and perceived effects on interest rates and yield curves. From there we incorporate a bottom-up and top-down analysis that helps us construct a portfolio that we believe optimizes tax-exempt income while seeking to avoid undue credit risk and market timing risk. While we monitor interest rates very closely and act quickly to adjust the portfolio to changing market rates, we do not trade the portfolio in search of incremental gains that could be achieved by active trading based on daily changes in rates. Our proprietary, unbiased research helps us identify undervalued sectors that we believe have the potential for ratings upgrades and capital appreciation, however, there is no guarantee that such events will occur.
Which issues or sectors helped the municipal portfolio’s performance and why?
At the Fund’s inception, our analysis indicated that lower-rated health care credits and land-secured housing credits were the most attractive sectors based on yield spreads and potential total return. These sectors remain core areas of the portfolio and both outperformed the overall municipal market during this fiscal period.
Health care credits. The Fund owns a diversified portfolio of municipal health care bonds that represented four of the municipal portfolio’s top-10 holdings and 8.6% of total investments as of June 30, 2005. We initially purchased these securities because of their attractive prices, relatively high yields, and what we believed to be their strong upside potential. Since that time their credit-worthiness has increased substantially and with it their valuations. We continue to hold these securities because they have generated solid income for the portfolio and offer improving risk characteristics.
Land-secured housing credits. These bonds are issued by local municipalities and represent most of the portfolio’s high-yield or non-rated exposure. Many corporate land developers borrow money from local governments to help subsidize the construction of new single- or multi-family housing developments. Bonds from such transactions are called special tax allocation securities. That’s because the bonds are paid off by property taxes assessed on the new homes. At their inception, these securities have higher levels of risk because of the lag time between their issuance and when property taxes are generated. The only collateral for the bonds is the land upon which the homes are being built. We were fortunate enough to purchase issues that have done very well over the last year and in this fiscal period. While externally these credits remain non-rated, our internal ratings analysis suggests to us that their level of credit worthiness has improved as property taxes are now being paid. Like the health care credits, these bonds have generated attractive income and offer improving risk characteristics.
Which issues or sectors hurt performance and why?
We’re pleased to report that there were no fundamental concerns with any of our municipal securities and their related performance. The portfolio’s short-duration bonds, however, muted performance. While we held only a small position in these bonds – about 1.5% of total investments as of June 30 – they hindered performance in a period when longer-duration municipal bonds rallied. Duration is a measure of the interest rate sensitivity of a fixed-income investment or portfolio. Shorter-duration bonds typically underperform longer-duration bonds in a falling interest rate environment, which is what happened with long-term rates in the period. Most of our core holdings – the health care and housing credits we discussed earlier – have longer average durations. However, because of the market’s recent volatility, we believe it is prudent to keep some exposure to shorter-duration bonds to help moderate volatility in the portfolio.
The Fund’s equity portfolio and taxable fixed-income securities are managed by TS&W. The following questions are related to those portions of the portfolio and are answered by Portfolio Managers Paul A. Ferwerda and William M. Bellamy.
Will you provide an overview of the equity and high-yield bond market and discuss how market events impacted the structure of the portfolio?
Equity market overview: As mentioned previously, the broad market as measured by the S&P 500, returned -0.81% in the first half of 2005, with most of the decline taking place early in the year. Large value-style stocks, such as those in which the Fund invests, as measured by the Russell 1000® Value Index, returned 1.77% in the six-month period.4 Some of the disparity in performance of large-value stocks vs. the broad market is due to the relatively strong performance of dividend-paying stocks during the first calendar quarter. As the equity market declined, dividend-paying stocks such as those in which the Fund invests, held up better than the market. That’s because their dividend income can help cushion the impact of declines. The strongest performers this semiannual period were energy stocks that benefited from the high level of commodity prices and, in many cases, from their attractive dividend distributions. In the second calendar quarter the broad market began to rally,
SemiAnnual Report | June 30, 2005 | 5
TYW | TS&W/Claymore Tax-Advantaged Balanced Fund | Questions & Answers continued
led by small-capitalization stocks, while large-cap dividend paying stocks underperformed. Strong gains by value stocks early in the period, however, outweighed any losses incurred in the latter part of the period.
High-yield market overview: High-yield bonds posted positive returns in the six-month period but were weaker than in the previous six-month period. The Merrill Lynch High Yield Master II Index returned 1.14% for the six-months ended June 30, 2005 versus a 9.38% return for the previous six-month period ended December 31, 2004. The relative weakness in the high-yield market was two-fold. First, 2004 was an extremely strong year for high-yield bonds and we saw a good deal of profit taking during the first half of 2005, which resulted in lower security prices. Second, credit ratings agencies downgraded some of auto-mobile giant General Motors’ (GM) most actively-traded bonds to junk status. GM battled for concessions from union employees to cover escalating employee health care and retirement costs as well as higher operational costs due to climbing steel and fuel prices. As a result of these events investors looked for less risky credits and we saw the higher-quality issues within the high yield market perform the best. This was helpful for the Fund as typically we focus our high-yield investments in the highest-quality issues within the sector.
It has been a couple years since U.S. federal tax legislation changed. Are dividend-paying stocks still attractive?
We believe dividend-paying stocks remain attractive. As you may know, the federal tax rate on stock dividends was cut dramatically with the passage of the Jobs and Growth Tax Relief Reconciliation Act of 2003. The federal stock dividend tax rate remains lower than the tax rate on income from taxable bonds, CDs and real estate investment trusts (REITs). As a result of this legislation and due to improving corporate profitability, many companies have increased their distribution rates or declared distributions for the first time. The trend has also appeared in industry sectors – such as technology – in which historically there have been few dividend-paying stocks.
The goal is for the common equity portfolio to generate a dividend yield of about two times that of the S&P 500. During this fiscal period the common stock portfolio yielded approximately 3.5% vs. 1.75% for the S&P 500 as of June 30, 2005. Of course we cannot guarantee this success in the future, but we believe that the pursuit of attractive qualified dividend income will be helped with more companies paying and/or increasing their dividends.
Will you provide a brief overview of your equity and high-yield selection processes?
Thompson, Siegel & Walmsley, Inc.’s investment process is value-driven and team-oriented. On the equity side, we have a proprietary quantitative valuation model that we apply to more than 400 stocks. This directs our review process toward companies that we believe have the highest expected return potential over a multi-year period. Our in-house research analysts are responsible for validating the model inputs for companies under their coverage and monitoring them over the holding period. Buys and sells are discussed at weekly research meetings or more frequently as needed. TS&W’s Fixed-Income team is responsible for overall bond market strategy as well as security selection. In-house analysts are used to support the credit review process.
Which areas of the common equity portfolio most helped performance?
The portfolio’s energy stocks were the clear winners this period. Both an overweight position in the sector relative to the S&P 500 and strong stock performance helped the portfolio. Some of the strongest performers were large integrated oil companies Marathon Oil, British Petroleum, Royal Dutch Shell and French oil company Total. (These issues represented 0.9%, 1.1%, 1.0% and 1.0% of the Fund’s total investments as of June 30.) Not only did these stocks offer attractive dividend yields, they also appreciated in value as commodity prices hovered close to historic highs.
While the portfolio’s financial stocks did not perform strongly as a group, the position in Allstate, a large property and casualty insurance company was the portfolio’s second strongest contributor to overall performance. (Allstate represented 0.8% of the Fund’s total investments as of June 30.) The company benefited from strong pricing in its personal lines of insurance and the successful implementation of new technology. This technology has enabled Allstate to better understand the risk characteristics of its clients and to adjust the pricing of its policies more appropriately, resulting in improved profitability. Allstate has also continued to increase its dividend and we have confidence in company management. Furthermore there have been positive trends in the insurance sector that we believe may continue.
Which areas of the portfolio most disappointed you?
As mentioned previously, the portfolio’s financial stocks, as a sector, held back performance. The financial sector is the largest in the equity portfolio at about 31.2% of equity assets as of June 30, 2005. By comparison, financial stocks represented 32.0% of the Russell 1000® Value Index and 20.2% of the S&P 500 as of June 30, 2005.
The performance in this sector was more of a surprise than a disappointment. There was an unusual shift in interest rates during the first half of 2005. Long-term interest rates declined (good for financial stocks) while short-term interest rates increased (bad for financial stocks). The result was a severe flattening of the yield curve which was primarily responsible for holding back the performance of financial stocks. This occurred despite a strong economy and good loan demand, especially in real estate. Companies in the financial sector, which normally pay above market dividend yields, have also been increasing their dividends faster than the average company.
6 | SemiAnnual Report | June 30, 2005
TYW | TS&W/Claymore Tax-Advantaged Balanced Fund | Questions & Answers continued
The Fund held a large position in financials primarily because of the attractive dividends that these stocks pay. The portfolio is diversified among individual stocks throughout the sector. We also seek to reduce risk by investing in non-U.S. financial stocks, which oftentimes offer more attractive dividend yields and are not subject to the same market risks as U.S. companies.
National City Bank was one of the most disappointing stocks in the financial sector and the overall portfolio during the first half of 2005. (National City represented 1.0% of the Fund’s total investments as of June 30.) National City is an active mortgage originator and rising investor concern over the sustainability of their recent growth rate caused the stock to decline substantially during this period. We would note that over the past year National City’s dividend increased by 9.4% and as of June 30, 2005, it offered an above market dividend yield of 4.10%. National City’s dividend yield on June 30, 2005 was also higher than the 3.91% yield on the 10-year Treasury note. This dividend yield is more attractive than the 10-year bond when factoring in the tax advantage of qualified dividend income versus ordinary income.
Technology stocks, in general, were poor performers in the period. We’re pleased, however, that the technology holdings posted a positive return in such a dismal environment. The portfolio also benefited because it held a significant underweight in technology vs. both the S&P 500 and the Russell 1000® Value Index. Within our portfolio, we were most disappointed by the poor market performance of Microsoft. (Microsoft represented 0.5% of the Fund’s total investments as of June 30.) Microsoft is one of a small group of technology stocks that pay dividends. In late 2004, the company paid out a one-time special dividend, and boosted its regular payout. To date, Microsoft’s dividend policy has not led to a higher stock price.
How did the portfolio’s high-yield securities perform?
High-yield bonds represent the largest position within the 9% allocation to non-qualified dividend income-producing securities. As stated previously, the goal of owning these securities is to generate income that will pay for expenses generated by the Fund. When these securities also appreciate in value, we’re pleased. We focus our investments in the higher-quality segment of the high-yield market, where we believe the relative risks of default are lower. To help further reduce risk, we keep the portfolio diversified across industry sectors and individual securities.
| 1 | The Lehman Brothers U.S. Municipal Bond Index is an unmanaged index of approximately 1,100 investment-grade, tax-exempt bonds. Index returns include the reinvestment of all distributions. It is not possible to invest directly in an index. |
| 2 | The S&P 500 Index is a capitalization-weighted index of 500 stocks designed to measure performance of the broad economy, representing all major industries. Index returns include the reinvestment of all distributions. It is not possible to invest directly in an index. |
| 3 | The Merrill Lynch High Yield Master II Index is an unmanaged index that measures the performance of nonconvertible, U.S. corporate bonds rated below Baa3 by Moody’s or below BBB by Standard & Poor’s ratings agencies. Index returns include the reinvestment of all distributions. It is not possible to invest directly in an index. |
| 4 | The Russell 1000 Value Index measures the performance of large companies with lower forecasted growth values than the overall market. Index returns include the reinvestment of all distributions. It is not possible to invest directly in an index. |
TYW Risks and Other Considerations
Under normal market conditions, the Fund will invest at least 50%, and may invest up to 60%, of its total assets in municipal securities. Additionally, the Fund will invest at least 40%, and may invest up to 50%, of its total assets in equity securities and other income securities. Under normal market conditions, the Fund will invest at least 25% of its total assets in equity securities. There can be no assurance that the Fund will achieve its investment objective. The value of the Fund will fluctuate with the value of the underlying securities. Historically, closed-end funds often trade at a discount to their net asset value. Additionally, any capital gains dividends will be subject to capital gains taxes.
The Investment Adviser may, but is not required to, utilize a variety of strategic transactions to seek to protect the value of the Fund’s assets in the municipal securities portfolio against the volatility of interest rate changes and other market movements. There can be no guarantee that hedging strategies will be employed or will be successful. The premium paid for entering into such hedging strategies will result in a reduction in the net asset value of the Fund and a subsequent reduction of income to the Fund. Any income generated from hedging transactions will not be exempt from income taxes.
The Fund may seek to enhance the level of the Fund’s current income through the use of leverage. Certain risks are associated with the leveraging of common stock. Both the net asset value and the market value of shares of common stock may be subject to higher volatility and a decline in value. There is no assurance that the Fund will utilize leverage or, if leverage is utilized, that it will be successful in enhancing the level of the Fund’s current income.
Fund Distribution Risk: In order to make regular quarterly distributions on its common shares, the fund may have to sell a portion of its investment portfolio at a time when independent investment judgment may not dictate such action. In addition, the Fund’s ability to make distributions more frequently than annually from any net realized capital gains by the Fund is subject to the Fund obtaining exemptive relief from the Securities and Exchange Commission, which cannot be assured. To the extent the total quarterly distributions for a year exceed the Fund’s net investment company income and net realized capital gain for that year, the excess will generally constitute a return of the Fund’s capital to its common shareholders. Such return of capital distributions generally are tax-free up to the amount of a common shareholder’s tax basis in the common shares (generally, the amount paid for the common shares). In addition, such excess distributions will decrease the Fund’s total assets and may increase the Fund’s expense ratio.
NOT FDIC-INSURED Ÿ NOT BANK-GUARANTEED Ÿ MAY LOSE VALUE
SemiAnnual Report | June 30, 2005 | 7
TYW | TS&W/Claymore Tax-Advantaged Balanced Fund
Fund Summary | As of June 30, 2005 (unaudited)
| | | | |
Fund Statistics
| | | |
Share Price | | $ | 13.75 | |
Common Share Net Asset Value | | $ | 15.33 | |
Premium/(Discount) to NAV | | | -10.31 | % |
Net Assets Applicable to Common Shares ($000) | | $ | 236,153 | |
Total Returns
| | | | | | |
(Inception 4/28/03)
| | Market
| | | NAV
| |
Six Month – non-annualized | | 4.39 | % | | 2.14 | % |
One Year | | 12.31 | % | | 13.33 | % |
Since Inception – average annual | | -1.64 | % | | 11.66 | % |
| | | |
Top Ten Holdings Municipal Portfolio
| | % of Total
Investments
| |
Sayre Health Care Facilities Authority (PA) 5.875%, 12/1/2031 | | 2.9 | % |
Golden State Tobacco Securitization Corp. (CA) 5.500%, 6/1/2043 | | 2.3 | % |
Richardson Hospital Authority (TX) 6.000%, 12/1/2034 | | 2.1 | % |
Camden County Improvement Authority (NJ) 5.750%, 2/15/2034 | | 1.9 | % |
California Statewide Communities Development Authority Revenue Bentley School (CA) 6.750%, 7/1/2032 | | 1.8 | % |
Missouri Development Finance Board (MO) 5.625%, 12/1/2028 | | 1.8 | % |
Saint Johns County Industrial Development Authority (FL) 5.625%, 8/1/2034 | | 1.7 | % |
Erie County Convention Center Authority (PA) 5.000%, 1/15/2036 | | 1.5 | % |
New Jersey Economic Development Authority Revenue (NJ) 5.750%, 6/15/2034 | | 1.5 | % |
Toledo-Lucas County Port Authority (OH) 5.375%, 12/1/2035 | | 1.5 | % |
| | | |
Top Ten Holdings Equity and Income Portfolio
| | % of Total Investments
| |
| |
Citigroup, Inc. | | 1.3 | % |
BP PLC ADR | | 1.1 | % |
ChevronTexaco Corp. | | 1.1 | % |
Altria Group, Inc. | | 1.1 | % |
Bank of America Corp. | | 1.1 | % |
PPG Industries, Inc. | | 1.1 | % |
GlaxoSmithKline PLC ADR | | 1.0 | % |
Total SA ADR | | 1.0 | % |
Shell Transport & Trading Co. PLC ADR | | 1.0 | % |
National City Corp. | | 1.0 | % |
| | | |
Top Ten Industries
| | % of Total
Investments
| |
| Health Care | | 20.5 | % |
| Banking and Finance | | 11.1 | % |
| Special Tax | | 8.5 | % |
| Higher Education | | 6.6 | % |
| Oil and Gas | | 6.6 | % |
| General Funds | | 5.4 | % |
| Telecommunications | | 3.7 | % |
| Continuing Care Retirement Center | | 2.7 | % |
| Transportation | | 2.3 | % |
| Pharmaceuticals | | 2.0 | % |
Share Price & NAV Performance
Portfolio Concentration by Asset Class*
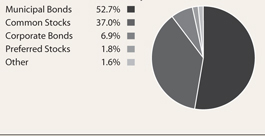
| * | As a percentage of total investments |
Credit Quality*
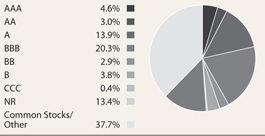
| * | Represents higher rating of either S&P or Moody’s as a percentage of long-term investments |
Past performance does not guarantee future results. Portfolio composition, holdings and sectors are subject to change daily.
8 | SemiAnnual Report | June 30, 2005
TYW | TS&W/Claymore Tax-Advantaged Balanced Fund
Portfolio of Investments | June 30, 2005 (unaudited)
| | | | | | | |
Principal
Amount
| | | | Optional Call
Provisions
| | Value
|
| | | Long-Term Municipal Bonds – 79.6% | | | | | |
| | | Arizona – 3.4% | | | | | |
| $3,300,000 | | Maricopa County Industrial Development Authority Health Facilities Revenue, Catholic Health Care West-A,A-, Baa1
5.375%, 7/1/2023 | | 7/1/14 @ 100 | | $ | 3,516,843 |
| 4,500,000 | | Maricopa County Pollution Control Corp., Pollution Control Revenue Reference Public Service Co-A-RMK, BBB, Baa2
5.750%, 11/1/2022 | | 5/1/06 @ 101 | | | 4,602,150 |
| | | | | | |
|
|
| | | | | | | | 8,118,993 |
| | | | | | |
|
|
| | | California – 19.2% | | | | | |
| 3,500,000 | | California State Public Works Board Various University California Projects, Series 2005 D, AA-, Aa2
5.000%, 5/1/2030 | | 5/1/15 @ 100 | | | 3,714,830 |
| 6,000,000 | | California Statewide Communities Development Authority Revenue Bentley School, NR, NR
6.750%, 7/1/2032 | | 7/1/10 @ 103 | | | 6,527,580 |
| 2,250,000 | | California Statewide Communities Development Authority Revenue Sub-Wildwood Elementary School, NR, NR
7.000%, 11/1/2029 | | 11/1/09 @ 102 | | | 2,438,483 |
| | | California Statewide Community Development Authority Eskaton Properties, Inc., ACA Insured, A, NR (a)
| | | | | |
| 2,900,000 | | 4.450%, 5/15/2029 | | — | | | 2,900,000 |
| 250,000 | | 4.500%, 5/15/2029 | | — | | | 250,000 |
| 1,080,000 | | Eastern California Municipal Water District Community Facilities, Special Tax Improvement Area 2-Sheffield/Rancho, NR, NR
5.875%, 9/1/2034 | | 9/1/05 @102 | | | 1,102,302 |
| 7,620,000 | | Golden State Tobacco Securitization Corp., Tobacco Settlement Revenue Enhanced Asset Backed, Series B, A-, A3
5.500%, 6/1/2043 | | 6/1/13 @ 100 | | | 8,378,190 |
| 2,580,000 | | Lincoln Improvement Board Act 1915 Public Finance Authority - Twelve Bridges, NR, NR
6.200%, 9/2/2025 | | 9/2/09 @ 102 | | | 2,742,488 |
| | | Murrieta Valley Unified School District, Special Tax Community Facilities District No. 2000-2, NR, NR | | | | | |
| 1,625,000 | | 6.300%, 9/1/2024 | | 3/1/12 @ 101 | | | 1,790,457 |
| 2,505,000 | | 6.375%, 9/1/2032 | | 3/1/12 @ 101 | | | 2,732,479 |
| 1,000,000 | | Orange County Community Facilities District, Special Tax No. 03-1-Ladera Ranch, Series A, NR, NR 5.625%, 8/15/2034 | | 8/15/12 @ 101 | | | 1,039,220 |
| 1,800,000 | | Palm Springs Community Redevelopment Agency Tax Allocation Reference Merged Production No. 1, Series A, A-, NR
5.500%, 9/1/2034 | | 9/1/14 @ 100 | | | 1,914,840 |
| 4,000,000 | | Palm Springs Financing Authority Lease Revenue Convention Center Expansion Project, 2004 Series A, MBIA Insured, AAA, Aaa
5.500%, 11/1/2035 | | 11/1/14 @ 102 | | | 4,519,360 |
| 1,350,000 | | Poway Unified School District, Special Tax Community Facilities District Number 6-Area-A, NR, NR
6.125%, 9/1/2033 | | 9/1/10 @ 102 | | | 1,428,556 |
| $915,000 | | Poway Community Facilities District Number 10-Area-E, NR, NR
5.750%, 9/1/2032 | | 9/1/08 @ 102 | | $ | 939,430 |
| 820,000 | | Snowline California Joint Unified School District Community Facility Special Tax, No. 2002-1, Series A, NR, NR
5.400%, 9/1/2034 | | 9/1/05 @ 103 | | | 842,009 |
| 1,870,000 | | William S. Hart Joint School Financing Authority CFD’s No’s 90-1, 99-1 & 2000-1 Series 2004, BBB+, NR
5.625%, 9/1/2034 | | 9/1/12 @ 100 | | | 1,979,133 |
| | | | | | |
|
|
| | | | | | | | 45,239,357 |
| | | | | | |
|
|
| | | Colorado – 2.0% | | | | | |
| 1,355,000 | | Denver Health & Hospital Authority Health Care Revenue Series 1998 A, ACA Insured, A, NR
5.375%, 12/1/2028 | | 12/1/08 @ 101 | | | 1,388,292 |
| | | Denver Health & Hospital Authority Health Care Revenue Series 2004 A, BBB, Baa3
| | | | | |
| 1,000,000 | | 6.000%, 12/1/2031 | | 12/1/11 @ 100 | | | 1,064,500 |
| 2,000,000 | | 6.250%, 12/1/2033 | | 12/1/14 @ 100 | | | 2,217,600 |
| | | | | | |
|
|
| | | | | | | | 4,670,392 |
| | | | | | |
|
|
| | | Delaware – 0.2% | | | | | |
| 500,000 | | Delaware Health Facilities Authority Beebe Medical Center Project, Series 2004 A, BBB, Baa1
5.500%, 6/1/2024 | | 6/1/14 @ 100 | | | 533,730 |
| | | | | | |
|
|
| | | Florida – 2.5% | | | | | |
| 5,450,000 | | Saint Johns County Industrial Development Authority First Mortgage Revenue Presbyterian Retirement, Series A, NR, NR
5.625%, 8/1/2034 | | 8/1/14 @ 101 | | | 5,886,926 |
| | | | | | |
|
|
| | | Georgia – 5.7% | | | | | |
| 3,000,000 | | Chatham County Hospital Authority Memorial Health University Medical Center, Series 2004 A, A-, A3
5.500%, 1/1/2034 | | 1/1/14 @ 100 | | | 3,194,760 |
| | | Milledgeville and Baldwin County Development Authority Georgia College & State University Foundation Property III, LLC Student Housing System, BBB, NR | | | | | |
| 2,500,000 | | 5.625%, 9/1/2030 | | 9/1/14 @ 101 | | | 2,663,700 |
| 1,000,000 | | 6.000%, 9/1/2033 | | 9/1/14 @ 101 | | | 1,092,230 |
| | | Richmond County Development Authority Jaguar Student Housing | LLC, Series 2004 A, NR, A3 | | | | | |
| 2,865,000 | | 5.250%, 2/1/2030 | | 2/1/14 @ 100 | | | 2,991,604 |
| 3,350,000 | | 5.250%, 2/1/2035 | | 2/1/14 @ 100 | | | 3,498,539 |
| | | | | | |
|
|
| | | | | | | | 13,440,833 |
| | | | | | |
|
|
| | | Illinois – 0.9% | | | | | |
| 2,000,000 | | Metropolitan Pier and Exposition Authority McCormick Place Expansion Project, Series 2004 A, AA-, A1
5.500%, 6/15/2027 | | 6/15/06 @ 100 | | | 2,019,640 |
| | | | | | |
|
|
| | | Kansas - 1.2% | | | | | |
| 2,500,000 | | Burlington Pollution Control Revenue Kansas Gas and Electric Co. Project, Series 2004 A, MBIA Insured, AAA, Aaa
5.300%, 6/1/2031 | | 6/1/14 @ 100 | | | 2,736,600 |
| | | | | | |
|
|
See notes to financial statements.
SemiAnnual Report | June 30, 2005 | 9
TYW | TS&W/Claymore Tax-Advantaged Balanced Fund | Portfolio of Investments (unaudited) continued
| | | | | | | | |
Principal
Amount
| | | | Optional Call
Provisions
| | Value
|
| | | | Massachusetts – 1.9% | | | | | |
| $ | 930,000 | | Massachusetts Development Finance Agency Revenue Hampshire College, BBB, Baa2
5.625%, 10/1/2024 | | 10/1/14 @ 100 | | $ | 985,995 |
| | | | Massachusetts Development Finance Agency Revenue Evergreen Center, BBB-, NR | | | | | |
| | 1,505,000 | | 5.500%, 1/1/2020 | | 1/1/15 @ 100 | | | 1,576,442 |
| | 1,820,000 | | 5.500%, 1/1/2035 | | 1/1/15 @ 100 | | | 1,856,018 |
| | | | | | | |
|
|
| | | | Michigan – 1.6% | | | | | 4,418,455 |
| | | | | | | |
|
|
| | | | Michigan State Hospital Finance Authority Revenue Reference Presbyterian Village, NR, NR | | | | | |
| | 1,250,000 | | 5.250%, 11/15/2025 | | 5/15/15 @ 100 | | | 1,265,388 |
| | 2,500,000 | | 5.500%, 11/15/2035 | | 5/15/15 @ 100 | | | 2,558,150 |
| | | | | | | |
|
|
| | | | | | | | | 3,823,538 |
| | | | | | | |
|
|
| | | | Minnesota – 1.6% | | | | | |
| | 3,650,000 | | Duluth Economic Development Authority Benedictine Health System, Saint Mary’s Duluth Clinic Health System, Series 2004, A-, NR 5.250%, 2/15/2028 | | 2/15/14 @ 100 | | | 3,841,041 |
| | | | | | | |
|
|
| | | | Missouri – 4.8% | | | | | |
| | 4,690,000 | | Cole County Industrial Development Authority Senior Living Facilities Revenue Lutheran Senior Services Heisinger Project, NR, NR 5.500%, 2/1/2035 | | 2/1/14 @ 100 | | | 4,964,928 |
| | 6,000,000 | | Missouri Development Finance Board Branson Landing Project, Series 2004 A, BBB+, Baa1 5.625%, 12/1/2028 | | 6/1/14 @ 100 | | | 6,427,860 |
| | | | | | | |
|
|
| | | | | | | | | 11,392,788 |
| | | | | | | |
|
|
| | | | New Jersey – 9.4% | | | | | |
| | 6,400,000 | | Camden County Improvement Authority Cooper Health System, Series 2004 A, BBB, Baa3 5.750%, 2/15/2034 | | 8/15/14 @ 100 | | | 6,854,400 |
| | | | New Jersey Economic Development Authority Revenue Cigarette Tax, BBB, Baa2 | | | | | |
| | 1,850,000 | | 5.750%, 6/15/2029 | | 6/15/14 @ 100 | | | 2,001,904 |
| | 1,000,000 | | 5.500%, 6/15/2031 | | 6/15/14 @ 100 | | | 1,058,670 |
| | 5,000,000 | | 5.750%, 6/15/2034 | | 6/15/14 @ 100 | | | 5,380,150 |
| | 2,000,000 | | New Jersey Health Care Facilities Financing Authority Revenue Saint Elizabeth Hospital Obligated Group, BBB-, Baa3 6.000%, 7/1/2020 | | 7/1/07 @ 102 | | | 2,101,700 |
| | 3,000,000 | | New Jersey Educational Facilities Authority Fairleigh Dickinson University, Series 2002 D, NR, NR 6.000%, 7/1/2025 | | 7/1/13 @ 100 | | | 3,243,090 |
| | 1,450,000 | | New Jersey Educational Facilities Authority Stevens Institute of Technology, Series 2004 B, BBB+, Baa2 5.375%, 7/1/2034 | | 7/1/14 @ 100 | | | 1,538,987 |
| | | | | | | |
|
|
| | | | | | | | | 22,178,901 |
| | | | | | | |
|
|
| | | | New York – 1.4% | | | | | |
| | $3,200,000 | | New York State Dormitory Authority School Districts Revenue Bond Financing Prog., Series 2005 C, MBIA Ins., AAA, Aaa 5.000%, 4/1/2035 | | 4/1/15 @ 100 | | $ | 3,416,128 |
| | | | | | | |
|
|
| | | | Ohio – 4.4% | | | | | |
| | 4,560,000 | | Akron Bath Copley Joint Township Hospital District Revenue Hospital Facilities-Summa Health Systems, Series A, RADIAN Insured, NR, Aa3 5.500%, 11/15/2034 | | 11/15/14 @ 100 | | | 4,956,674 |
| | 5,000,000 | | Toledo-Lucas County Port Authority Special Assessment Revenue Crocker Park Public Improvement Project Series 2003, NR, NR 5.375%, 12/1/2035 | | 12/1/13 @ 102 | | | 5,345,900 |
| | | | | | | |
|
|
| | | | | | | | | 10,302,574 |
| | | | | | | |
|
|
| | | | Pennsylvania – 8.3% | | | | | |
| | 5,100,000 | | Erie County Convention Center Authority Convention Center Hotel Revenue, Ser.of 2005, FGIC Ins., AAA, Aaa 5.000%, 1/15/2036 | | 1/15/15 @ 100 | | | 5,426,196 |
| | 3,750,000 | | Pennsylvania Higher Educational Facilities Authority Widener University Series 2003, BBB+, NR 5.375%, 7/15/2029 | | 7/15/13 @ 100 | | | 3,971,850 |
| | 9,530,000 | | Sayre Health Care Facilities Authority Guthrie Health, Series 2002 A, A-, NR 5.875%, 12/1/2031 | | 12/1/11 @ 101 | | | 10,270,100 |
| | | | | | | |
|
|
| | | | | | | | | 19,668,146 |
| | | | | | | |
|
|
| | | | Rhode Island – 3.1% | | | | | |
| | | | Rhode Island State Health & Educational Building Corp. Revenue Hospital Financing Lifespan Obligated Group, BBB+, Baal | | | | | |
| | 3,500,000 | | 6.375%, 8/15/2021 | | 8/15/12 @ 100 | | | 3,930,920 |
| | 3,000,000 | | 6.500%, 8/15/2032 | | 8/15/12 @ 100 | | | 3,358,200 |
| | | | | | | |
|
|
| | | | | | | | | 7,289,120 |
| | | | | | | |
|
|
| | | | South Carolina – 2.9% | | | | | |
| | | | Lexington County Health Services District, Inc. Hospital Revenue Lexington Medical Center, Series 2004, A, A2 | | | | | |
| | 1,430,000 | | 5.500%, 5/1/2032 | | 5/1/14 @ 100 | | | 1,523,551 |
| | 5,000,000 | | 5.500%, 5/1/2037 | | 5/1/14 @ 100 | | | 5,335,350 |
| | | | | | | |
|
|
| | | | | | | | | 6,858,901 |
| | | | | | | |
|
|
| | | | Texas – 3.1% | | | | | |
| | 6,780,000 | | Richardson Hospital Authority Hospital Refinance & Improvement Richardson Regional, BBB, Baa2 6.000%, 12/1/2034 | | 12/1/13 @ 100 | | | 7,346,537 |
| | | | | | | |
|
|
| | | | Wisconsin – 2.0% | | | | | |
| | 3,350,000 | | Wisconsin State Health & Educational Facilities Authority Revenue Aurora Health Care, Series A, BBB+, NR 5.600%, 2/15/2029 | | 2/15/09 @ 101 | | | 3,473,113 |
| | | | Wisconsin State Health & Educational Facilities Authority Revenue Blood Center Southeastern Project, BBB+, NR | | | | | |
| | 500,000 | | 5.500%, 6/1/2024 | | 6/1/14 @ 100 | | | 533,355 |
| | 750,000 | | 5.750%, 6/1/2034 | | 6/1/14 @ 100 | | | 808,448 |
| | | | | | | |
|
|
| | | | | | | | | 4,814,916 |
| | | | | | | |
|
|
| | | | Total Long-Term Municipal Bonds | | | | | |
| | | | (Cost $176,772,617) | | | | $ | 187,997,516 |
| | | | | | | |
|
|
See notes to financial statements.
10 | SemiAnnual Report | June 30, 2005
TYW | TS&W/Claymore Tax-Advantaged Balanced Fund | Portfolio of Investments (unaudited) continued
| | | | | |
Number
of Shares
| | | | Value
|
| | | Common Stocks – 56.0% | | | |
| | | Automotive – 1.0% | | | |
| 60,000 | | DaimlerChrysler AG (Germany) | | $ | 2,430,600 |
| | | | |
|
|
| | | Banking and Finance – 15.4% | | | |
| 20,000 | | Australia and New Zealand Banking Group Ltd. ADR (Australia) | | | 1,654,000 |
| 85,000 | | Bank of America Corp. | | | 3,876,850 |
| 50,000 | | BB&T Corp. | | | 1,998,500 |
| 100,000 | | Citigroup, Inc. | | | 4,623,000 |
| 25,000 | | HSBC Holdings PLC ADR (United Kingdom) | | | 1,991,250 |
| 70,000 | | ING Groep NV ADR (Netherlands) | | | 1,963,500 |
| 61,500 | | Merrill Lynch & Co., Inc. | | | 3,383,115 |
| 100,000 | | National City Corp. | | | 3,412,000 |
| 150,000 | | New York Community Bancorp, Inc. | | | 2,718,000 |
| 40,000 | | PNC Financial Services Group | | | 2,178,400 |
| 100,000 | | U.S. Bancorp | | | 2,920,000 |
| 50,000 | | Wachovia Corp. | | | 2,480,000 |
| 75,000 | | Washington Mutual, Inc. | | | 3,051,750 |
| | | | |
|
|
| | | | | | 36,250,365 |
| | | | |
|
|
| | | Beverages, Food and Tobacco – 2.4% | | | |
| 60,000 | | Altria Group, Inc. | | | 3,879,600 |
| 90,000 | | Sara Lee Corp. | | | 1,782,900 |
| | | | |
|
|
| | | | | | 5,662,500 |
| | | | |
|
|
| | | Building and Building Products – 0.6% | | | |
| 46,500 | | Masco Corp. | | | 1,476,840 |
| | | | |
|
|
| | | Business Equipment and Services – 1.2% | | | |
| 66,500 | | Pitney Bowes, Inc. | | | 2,896,075 |
| | | | |
|
|
| | | Chemicals – 1.6% | | | |
| 59,800 | | PPG Industries, Inc. | | | 3,753,048 |
| | | | |
|
|
| | | Computers – 1.0% | | | |
| 100,000 | | Hewlett-Packard Co. | | | 2,351,000 |
| | | | |
|
|
| | | Computers – Software and Peripherals – 0.8% | | | |
| 75,000 | | Microsoft Corp. | | | 1,863,000 |
| | | | |
|
|
| | | Conglomerates – 1.1% | | | |
| 75,000 | | General Electric Co. | | | 2,598,750 |
| | | | |
|
|
| | | Entertainment – 0.9% | | | |
| 115,000 | | Regal Entertainment Group, Class A | | | 2,171,200 |
| | | | |
|
|
| | | Household and Personal Care Products – 2.3% | | | |
| 47,500 | | Kimberly-Clark Corp. | | | 2,973,025 |
| 106,500 | | Newell Rubbermaid, Inc. | | | 2,538,960 |
| | | | |
|
|
| | | | | | 5,511,985 |
| | | | |
|
|
| | | Insurance – 2.1% | | | |
| 47,500 | | Allstate Corp. (The) | | $ | 2,838,125 |
| 55,000 | | St. Paul Travelers Cos., Inc. (The) | | | 2,174,150 |
| | | | |
|
|
| | | | | | 5,012,275 |
| | | | |
|
|
| | | Iron/Steel – 1.0% | | | |
| 52,500 | | Nucor Corp. | | | 2,395,050 |
| | | | |
|
|
| | | Metals and Mining – 1.2% | | | |
| 30,000 | | Phelps Dodge Corp. | | | 2,775,000 |
| | | | |
|
|
| | | Oil and Gas – 9.1% | | | |
| 65,000 | | BP PLC ADR (United Kingdom) | | | 4,054,700 |
| 70,000 | | ChevronTexaco Corp. | | | 3,914,400 |
| 80,000 | | KeySpan Corp. | | | 3,256,000 |
| 60,000 | | Marathon Oil Corp. | | | 3,202,200 |
| 60,000 | | Shell Transport & Trading Co. PLC ADR (United Kingdom) | | | 3,483,600 |
| 30,000 | | Total SA ADR (France) | | | 3,505,500 |
| | | | |
|
|
| | | | | | 21,416,400 |
| | | | |
|
|
| | | Pharmaceuticals – 3.0% | | | |
| 135,000 | | Bristol-Myers Squibb Co. | | | 3,372,300 |
| 75,000 | | GlaxoSmithKline PLC ADR (United Kingdom) | | | 3,638,250 |
| | | | |
|
|
| | | | | | 7,010,550 |
| | | | |
|
|
| | | Publishing – 1.3% | | | |
| 85,000 | | R.R. Donnelley & Sons Co. | | | 2,933,350 |
| | | | |
|
|
| | | Telecommunications – 5.2% | | | |
| 115,000 | | BCE, Inc. (Canada) | | | 2,723,200 |
| 60,000 | | BellSouth Corp. | | | 1,594,200 |
| 56,300 | | BT Group PLC ADR (United Kingdom) | | | 2,342,080 |
| 115,000 | | SBC Communications, Inc. | | | 2,731,250 |
| 80,000 | | Verizon Communications, Inc. | | | 2,764,000 |
| | | | |
|
|
| | | | | | 12,154,730 |
| | | | |
|
|
| | | Transportation – 0.7% | | | |
| 25,000 | | United Parcel Service, Inc., Class B | | | 1,729,000 |
| | | | |
|
|
| | | Utilities – Gas and Electric – 2.8% | | | |
| 55,000 | | DTE Energy Co. | | | 2,572,350 |
| 75,000 | | NiSource, Inc. | | | 1,854,750 |
| 50,000 | | Progress Energy, Inc. | | | 2,262,000 |
| | | | |
|
|
| | | | | | 6,689,100 |
| | | | |
|
|
| | | Waste Management – 1.3% | | | |
| 110,000 | | Waste Management, Inc. | | | 3,117,400 |
| | | | |
|
|
| | | Total Common Stocks | | | |
| | | (Cost $127,493,238) | | $ | 132,198,218 |
| | | | |
|
|
See notes to financial statements
SemiAnnual Report | June 30, 2005 | 11
TYW | TS&W/Claymore Tax-Advantaged Balanced Fund | Portfolio of Investments (unaudited) continued
| | | | | | | | |
Principal
Amount
| | | | Optional Call
Provisions
| | Value
|
| | | | Corporate Bonds – 10.5% | | | | | |
| | | | Aerospace/Defense – 0.4% | | | | | |
| | $1,000,000 | | DRS Technologies, Inc., B, B2
6.875%, 11/1/2013 | | 11/1/08 @ 103.44 | | $ | 1,035,000 |
| | | | | | | |
|
|
| | | | Automotive – 0.4% | | | | | |
| | 1,000,000 | | Navistar International, BB-, Ba3
7.500%, 6/15/2011 | | 6/15/08 @ 103.75 | | | 1,020,000 |
| | | | | | | |
|
|
| | | | Banking and Finance – 1.4% | | | | | |
| | 1,250,000 | | E*Trade Financial Corp., B+, B1
8.000%, 6/15/2011 | | 6/15/08 @ 104 | | | 1,315,625 |
| | 1,000,000 | | General Motors Acceptance Corp., BB, Baa2
6.875%, 9/15/2011 | | — | | | 923,088 |
| | 1,000,000 | | Presidential Life Corp., B-, B2
7.875%, 2/15/2009 | | — | | | 1,020,000 |
| | | | | | | |
|
|
| | | | | | | | | 3,258,713 |
| | | | | | | |
|
|
| | | | Building and Building Products – 0.4% | | | | | |
| | 1,000,000 | | K Hovnanian Enterprises, BB, Ba1
6.500%, 1/15/2014 | | — | | | 1,007,500 |
| | | | | | | |
|
|
| | | | Coal – 0.4% | | | | | |
| | 1,000,000 | | Massey Energy Co., BB, Ba3
6.625%, 11/15/2010 | | 11/15/07 @ 103.31 | | | 1,030,000 |
| | | | | | | |
|
|
| | | | Entertainment – 1.0% | | | | | |
| | 1,500,000 | | Carmike Cinemas, Inc., CCC+, Caa1
7.500%, 2/15/2014 | | 2/15/09 @ 103.75 | | | 1,359,375 |
| | 900,000 | | Scientific Games Corp., B+, B1 (b)
6.250%, 12/15/2012 | | 12/15/08 @ 103.13 | | | 909,000 |
| | | | | | | |
|
|
| | | | | | | | | 2,268,375 |
| | | | | | | |
|
|
| | | | Food – 0.4% | | | | | |
| | 1,000,000 | | Smithfield Foods, Inc., BB, Ba2
7.000%, 8/1/2011 | | — | | | 1,052,500 |
| | | | | | | |
|
|
| | | | Forest Products & Paper – 0.6% | | | | | |
| | 400,000 | | Boise Cascade LLC, B+, B2 (b)
7.125%, 10/15/2014 | | 10/15/09 @ 103.56 | | | 393,000 |
| | 1,100,000 | | Stone Container Finance (Canada), B, B2
7.375%, 7/15/2014 | | 7/15/09 @ 103 .69 | | | 1,034,000 |
| | | | | | | |
|
|
| | | | | | | | | 1,427,000 |
| | | | | | | |
|
|
| | | | Health and Medical Facilities – 1.1% | | | | | |
| $ | 1,100,000 | | Community Health Systems, Inc., B, B3
6.500%, 12/15/2012 | | 12/15/08 @ 103.25 | | $ | 1,119,250 |
| | 1,325,000 | | Triad Hospitals, Inc., B+, B2
7.000%, 5/15/2012 | | 5/15/08 @ 103.5 | | | 1,381,313 |
| | | | | | | |
|
|
| | | | | | | | | 2,500,563 |
| | | | | | | |
|
|
| | | | Home Furnishings – 0.4% | | | | | |
| | 1,000,000 | | Sealy Mattress Co., B-, B3 8.250%, 6/15/2014 | | 6/15/09 @ 104.13 | | | 1,010,000 |
| | | | | | | |
|
|
| | | | Iron/Steel – 0.4% | | | | | |
| | 1,125,000 | | AK Steel Corp., B+, B1
7.875%, 2/15/2009 | | 8/18/05 @ 102.65 | | | 1,023,750 |
| | | | | | | |
|
|
| | | | Office Equipment & Supplies – 0.4% | | | | | |
| | 1,000,000 | | Xerox Capital Trust I, B-, Ba3
8.000%, 2/1/2027 | | 2/1/07 @ 102.45 | | | 1,035,000 |
| | | | | | | |
|
|
| | | | Oil and Gas – 0.9% | | | | | |
| | 1,000,000 | | Giant Industries, Inc., B-, B3
8.000%, 5/15/2014 | | 5/15/09 @ 104 | | | 1,042,500 |
| | 1,000,000 | | Stone Energy Corp., B+, B2
6.750%, 12/15/2014 | | 12/15/09 @ 103.38 | | | 972,500 |
| | | | | | | |
|
|
| | | | | | | | | 2,015,000 |
| | | | | | | |
|
|
| | | | Real Estate Investment Trusts - Hotels – 0.4% | | | | | |
| | 850,000 | | Host Marriott LP, B+, Ba3 (b)
6.375%, 3/15/2015 | | 3/15/10 @ 103.19 | | | 841,500 |
| | | | | | | |
|
|
| | | | Retail – Apparel and Shoes – 0.9% | | | | | |
| | 1,000,000 | | Foot Locker, Inc., BB+, Ba2
8.500%, 1/15/2022 | | — | | | 1,097,500 |
| | 1,000,000 | | Phillips-Van Heusen Corp., BB+, B1
7.750%, 11/15/2023 | | — | | | 1,045,000 |
| | | | | | | |
|
|
| | | | | | | | | 2,142,500 |
| | | | | | | |
|
|
| | | | Telecommunications – 0.5% | | | | | |
| | 1,000,000 | | Nextel Communications, Inc., BB, Ba3
6.875%, 10/31/2013 | | 10/31/08 @ 103.44 | | | 1,068,750 |
| | | | | | | |
|
|
| | | | Transportation – 0.5% | | | | | |
| | 1,000,000 | | General Maritime Corp. (Marshall Island), B+, B1
10.000%, 3/15/2013 | | 3 /15/08 @ 105 | | | 1,085,000 |
| | | | | | | |
|
|
| | | | Total Corporate Bonds (Cost $24,570,999) | | | | $ | 24,821,151 |
| | | | | | | |
|
|
See notes to financial statements.
12 | SemiAnnual Report | June 30, 2005
TYW | TS&W/Claymore Tax-Advantaged Balanced Fund | Portfolio of Investments (unaudited) continued
| | | | | | | |
Number of Shares
| | | | Value
| |
| | | | Preferred Stocks – 2.7% | | | | |
| | | | Real Estate Investment Trusts – 2.5% | | | | |
| | 20,000 | | Brandywine Realty Trust, Series C, 7.500%, NR, NR | | $ | 501,000 | |
| | 10,000 | | CarrAmerica Realty Corp., Series E, 7.500%, BBB-, Baa3 | | | 258,700 | |
| | 20,000 | | CBL & Associates Properties, Series C, 7.750%, NR, NR | | | 549,000 | |
| | 25,000 | | CBL & Associates Properties, Series D, 7.375%, NR, NR | | | 633,250 | |
| | 9,000 | | Capital Automotive REIT, Series A, 7.500%, BB+, Ba1 | | | 228,600 | |
| | 20,000 | | Developers Diversified Realty, 8.600%, BBB-, Ba1 | | | 529,400 | |
| | 5,461 | | Glenborough Realty Trust, Inc., Series A, 7.750%, NR, Ba3 | | | 139,938 | |
| | 20,000 | | Health Care REIT, Inc., Series D, 7.875%, BB+, Ba1 | | | 513,600 | |
| | 10,000 | | iStar Financial, Inc., Series I, 7.500%, BB, Ba2 | | | 251,200 | |
| | 5,000 | | PS Business Parks, Inc., Series H, 7.000%, BBB-, Ba1 | | | 123,000 | |
| | 20,000 | | Realty Income Corp., Series D, 7.375%, BBB-, Baa3 | | | 524,000 | |
| | 18,500 | | Regency Centers Corp., 7.250%, BBB-, Baa3 | | | 474,525 | |
| | 20,000 | | The Mills Corp., Series G, 7.875%, NR, NR | | | 514,000 | |
| | 25,000 | | Vornado Realty Trust, Series E, 7.000%, BBB-, Baa3 | | | 639,750 | |
| | | | | |
|
|
|
| | | | | | | 5,879,963 | |
| | | | | |
|
|
|
| | | | Pipelines – 0.2% | | | | |
| | 15,000 | | Dominion Consolidated Natural Gas Capital Trust I, 7.800%, BBB-, Baa1 | | | 392,700 | |
| | | | Total Preferred Stocks (Cost $6,082,385) | | | 6,272,663 | |
| | | | | |
|
|
|
| | | | Investment Companies – 0.1% | | | | |
| | 5,000 | | AEW Real Estate Income Fund | | | 94,000 | |
| | 5,000 | | Neuberger Berman Real Estate Income Fund, Inc. | | | 107,500 | |
| | 7,000 | | Scudder RREEF Real Estate Fund II, Inc. | | | 117,600 | |
| | | | | |
|
|
|
| | | | Total Investment Companies (Cost $266,359) | | $ | 319,100 | |
| | | | | |
|
|
|
| | | | Total Long-Term Investments – 148.9% (Cost $335,185,598) | | $ | 351,608,648 | |
| | | | | |
|
|
|
| | |
Principal Amount
| | | | Value
| |
| | | | Short-Term Investments – 2.2% | | | | |
| | | | New York City Municipal Water Finance Authority
Water & Sewer System Revenue,
FGIC Insured, AAA/A-1+, Aaa/VMIG1 (c) | | | | |
| $ | 800,000 | | Series A 2.170%, 6/15/2025 | | $ | 800,000 | |
| | 4,500,000 | | Series C
2.340%, 6/15/2023 | | | 4,500,000 | |
| | | | | |
|
|
|
| | | | Total Short-Term Investments (Cost $5,300,000) | | $ | 5,300,000 | |
| | | | | |
|
|
|
| | | | Total Investments – 151.1% (Cost $340,485,598) | | $ | 356,908,648 | |
| | | | Liabilities in excess of other assets – (0.3%) | | | (755,515 | ) |
| | | | Preferred Shares, at Liquidation Value – (-50.8% of Net Assets Applicable to Common Shares or – 33.6% of Total Investments) | | | (120,000,000 | ) |
| | | | | |
|
|
|
| | | | Net Assets Applicable to Common Shares – 100.0% | | $ | 236,153,133 | |
| | | | | |
|
|
|
| | |
| ACA | | ACA Financial Guaranty Corporation. |
| ADR | | American Depositary Receipt. |
| FGIC | | Financial Guaranty Insurance Company. |
| LLC | | Limited Liability Corporation. |
| LP | | Limited Partnership. |
| MBIA | | MBIA Insurance Corp. |
| PLC | | Public Limited Company. |
| RADIAN | | Radian Asset Assurance, Inc. |
| (a) | Variable rate security. The rate shown is as of June 30, 2005. |
| (b) | Securities are exempt from registration under Rule 144A of the Securities Act of 1933. These securities may only be resold in transactions exempt from registration, normally to qualified institutional buyers. At June 30, 2005, these securities amounted to $2,143,500 or 0.9% of Net Assets Applicable to Common Shares. |
| (c) | Security has a maturity of more than one year, but has variable rate and demand features which qualify it as a short-term security. The rate shown is as of June 30, 2005. |
Ratings shown are per Standard & Poor’s and Moody’s. Securities classified as NR are not rated.
All percentages shown in the Portfolio of Investments are based on Net Assets Applicable to Common Shares unless otherwise noted.
See notes to financial statements.
SemiAnnual Report | June 30, 2005 | 13
TYW | TS&W/Claymore Tax-Advantaged Balanced Fund
Statement of Assets and Liabilities | June 30, 2005 (unaudited)
| | | | |
Assets | | | | |
Investments in securities, at value (cost $340,485,598) | | $ | 356,908,648 | |
Cash | | | 3,805 | |
Receivable for securities sold | | | 4,921,508 | |
Interest receivable | | | 2,878,978 | |
Dividends receivable | | | 392,920 | |
Other assets | | | 23,026 | |
| | |
|
|
|
Total assets | | | 365,128,885 | |
| | |
|
|
|
| |
Liabilities | | | | |
Payable for securities purchased | | | 8,142,541 | |
Unrealized depreciation on swap transactions | | | 413,019 | |
Advisory fee payable | | | 205,170 | |
Dividend payable - preferred shares | | | 140,183 | |
Accrued expenses and other liabilities | | | 74,839 | |
| | |
|
|
|
Total liabilities | | | 8,975,752 | |
| | |
|
|
|
| |
Preferred Shares, at Redemption Value | | | | |
$.01 par value per share; 4,800 Auction Market Preferred Shares authorized, issued and outstanding at $25,000 per share liquidation preference | | | 120,000,000 | |
| | |
|
|
|
| |
Net Assets Applicable to Common Shareholders | | $ | 236,153,133 | |
| | |
|
|
|
| |
Composition of Net Assets Applicable to Common Shareholders | | | | |
Common stock, $.01 par value per share; unlimited number of shares authorized, 15,407,000 shares issued and outstanding | | $ | 154,070 | |
Additional paid-in capital | | | 218,557,393 | |
Net unrealized appreciation on investments and swap transactions | | | 16,010,031 | |
Accumulated net realized gain on investments, options and swap transactions | | | 2,413,995 | |
Accumulated undistributed net investment income | | | (982,356 | ) |
| | |
|
|
|
| |
Net Assets Applicable to Common Shareholders | | $ | 236,153,133 | |
| | |
|
|
|
| |
Net Asset Value Applicable to Common Shareholders (based on 15,407,000 common shares outstanding) | | $ | 15.33 | |
| | |
|
|
|
See notes to financial statements.
14 | SemiAnnual Report | June 30, 2005
TYW | TS&W/Claymore Tax-Advantaged Balanced Fund
Statement of Operations | For the six months ended June 30, 2005 (unaudited)
| | | | | | | |
Investment Income | | | | | | | |
Interest | | $ | 5,998,255 | | | | |
Dividends (net of foreign withholding taxes of $41,321) | | | 2,592,758 | | | | |
| | |
|
| | | | |
Total income | | | | | $ | 8,591,013 | |
| | | | | |
|
|
|
| | |
Expenses | | | | | | | |
Advisory fee | | | 1,235,799 | | | | |
Preferred share maintenance | | | 157,989 | | | | |
Trustees’ fees and expenses | | | 54,559 | | | | |
Administration fee | | | 50,185 | | | | |
Fund accounting | | | 49,923 | | | | |
Professional fees | | | 38,895 | | | | |
Insurance | | | 27,273 | | | | |
Custodian fee | | | 26,588 | | | | |
Transfer agent fee | | | 24,547 | | | | |
Printing expenses | | | 17,152 | | | | |
NYSE listing fee | | | 16,043 | | | | |
Miscellaneous | | | 4,347 | | | | |
| | |
|
| | | | |
Total expenses | | | | | | 1,703,300 | |
| | | | | |
|
|
|
Net investment income | | | | | | 6,887,713 | |
| | | | | |
|
|
|
| | |
Realized and Unrealized Gain (Loss) on Investments and Swap Transactions | | | | | | | |
Net realized gain (loss) on: | | | | | | | |
Investments | | | | | | 3,932,480 | |
Options | | | | | | 73,125 | |
Swaps | | | | | | (1,097,100 | ) |
Net change in unrealized appreciation (depreciation) on: | | | | | | | |
Investments | | | | | | (2,683,026 | ) |
Swaps | | | | | | (413,019 | ) |
| | | | | |
|
|
|
Net realized and unrealized loss on investments, options and swap transactions | | | | | | (187,540 | ) |
| | | | | |
|
|
|
| | |
Distributions to Preferred Shareholders from | | | | | | | |
Net investment income | | | | | | (1,729,086 | ) |
| | | | | |
|
|
|
| | |
Net Increase in Net Assets Applicable to Common Shareholders Resulting from Operations | | | | | $ | 4,971,087 | |
| | | | | |
|
|
|
See notes to financial statements.
SemiAnnual Report | June 30, 2005 | 15
TVW | TS&W/Claymore Tax-Advantaged Balanced Fund
Statement of Changes in Net Assets |
| | | | | | | | |
| | | For the Six
Months Ended
June 30, 2005
(unaudited)
| | | For the Period
April 28, 2004*
through
December 31, 2004
| |
Increase in Net Assets Applicable to Common Shareholders Resulting from Operations | | | | | | | | |
Net investment income | | $ | 6,887,713 | | | $ | 8,022,297 | |
Net realized gain on investments, options and swap transactions | | | 2,908,505 | | | | 895,209 | |
Net change in unrealized appreciation (depreciation) on investments and swap transactions | | | (3,096,045 | ) | | | 19,106,076 | |
| | |
Distributions to Preferred Shareholders from | | | | | | | | |
Net investment income | | | (1,729,086 | ) | | | (1,108,937 | ) |
| | |
|
|
| |
|
|
|
Net increase in net assets applicable to Common Shareholders resulting from operations | | | 4,971,087 | | | | 26,914,645 | |
| | |
|
|
| |
|
|
|
Distributions to Common Shareholders from Net Investment Income | | | (7,222,031 | ) | | | (7,222,031 | ) |
| | |
|
|
| |
|
|
|
Capital Share Transactions | | | | | | | | |
Net proceeds from the issuance of Common Shares | | | — | | | | 220,605,000 | |
Common and preferred shares’ offering expenses charged to paid-in-capital | | | 18,188 | | | | (2,012,000 | ) |
| | |
|
|
| |
|
|
|
Net Increase from Capital Share Transactions | | | 18,188 | | | | 218,593,000 | |
| | |
|
|
| |
|
|
|
Total increase (decrease) in net assets applicable to Common Shareholders | | | (2,232,756 | ) | | | 238,285,614 | |
Net Assets | | | | | | | | |
Beginning of period | | | 238,385,889 | | | | 100,275 | |
| | |
|
|
| |
|
|
|
End of period (including accumulated undistributed net investment income of ($982,356) and
$1,081,048, respectively) | | $ | 236,153,133 | | | $ | 238,385,889 | |
| | |
|
|
| |
|
|
|
| * | Commencement of investment operations. |
See notes to financial statements.
16 | SemiAnnual Report | June 30, 2005
TYW | TS&W/Claymore Tax-Advantaged Balanced Fund
Financial Highlights |
| | | | | | | | |
Per Share Operating Performance for a Common Share Outstanding Throughout the Period
| | For the Six
Months Ended
June 30, 2005 (unaudited)
| | | For the Period
April 28, 2004*
through
December 31, 2004
| |
Net Asset Value, Beginning of Period | | $ | 15.47 | | | $ | 14.33 | (b) |
| | |
Income from Investment Operations | | | | | | | | |
Net investment income(a) | | | 0.45 | | | | 0.52 | |
Net realized and unrealized gain (loss) on investments, options and swap transactions | | | (0.01 | ) | | | 1.29 | |
Distributions to preferred shareholders from net investment income (common share equivalent basis) | | | (0.11 | ) | | | (0.07 | ) |
| | |
|
|
| |
|
|
|
Total from investment operations | | | 0.33 | | | | 1.74 | |
| | |
|
|
| |
|
|
|
| | |
Distributions to Common Shareholders | | | (0.47 | ) | | | (0.47 | ) |
| | |
|
|
| |
|
|
|
Common and Preferred Shares’ Offering Expenses Charged to Paid-In Capital | | | — | (f) | | | (0.13 | ) |
| | |
|
|
| |
|
|
|
Net Asset Value, End of Period | | $ | 15.33 | | | $ | 15.47 | |
| | |
|
|
| |
|
|
|
Market Value, End of period | | $ | 13.75 | | | $ | 13.62 | |
| | |
|
|
| |
|
|
|
Total investment return(c) | | | | | | | | |
Net asset value | | | 2.14 | % | | | 11.42 | % |
Market value | | | 4.39 | % | | | -6.05 | % |
| | |
Ratios and Supplemental Data | | | | | | | | |
Net assets applicable to Common Shareholders, end of period (thousands) | | $ | 236,153 | | | $ | 238,386 | |
Preferred Shares, at liquidation value ($25,000 per share liquidation preference) (thousands) | | $ | 120,000 | | | $ | 120,000 | |
Preferred Shares asset coverage per share | | $ | 74,199 | | | $ | 74,664 | |
| | |
Ratios to Average Net Assets Applicable to Common Shares:(d) | | | | | | | | |
Total expenses | | | 1.46 | % | | | 1.36 | % |
Net investment income, prior to effect of dividends to preferred shares | | | 5.89 | % | | | 5.31 | % |
Net investment income, after effect of dividends to preferred shares | | | 4.41 | % | | | 4.58 | % |
| | |
Ratios to Average Managed Assets:(d)(e) | | | | | | | | |
Total expenses | | | 0.96 | % | | | 0.98 | % |
Net investment income, prior to effect of dividends to preferred shares | | | 3.90 | % | | | 3.83 | % |
Portfolio turnover rate | | | 54 | % | | | 75 | % |
| * | Commencement of investment operations. |
| (a) | Based on average shares outstanding during the period. |
| (b) | Before reimbursement of offering expenses charged to capital. |
| (c) | Total investment return is calculated assuming a purchase of a Common Share at the beginning of the period and a sale on the last day of the period reported either at net asset value (“NAV”) or market price per share. Dividends and distributions are assumed to be reinvested at NAV for NAV returns or the prices obtained under the Fund’s Dividend Reinvestment Plan for market value returns. Total investment return does not reflect brokerage commissions. A return calculated for a period of less than one year is not annualized. |
| (e) | Managed assets is equal to net assets applicable to Common Shareholders plus outstanding leverage, such as the liquidation value of preferred shares. |
| (f) | Represents less than $0.01 per share. |
See notes to financial statements
SemiAnnual Report | June 30, 2005 | 17
TYW | TS&W/Claymore Tax-Advantaged Balanced Fund
Notes to Financial Statements | June 30, 2005 (unaudited)
Note 1 – Organization:
TS&W/Claymore Tax-Advantaged Balanced Fund (the “Fund”) was organized as a Delaware statutory trust on February 12, 2004. The Fund is registered as a diversified, closed-end management investment company under the Investment Company Act of 1940.
Under normal market conditions, the Fund will invest at least 50%, but less than 60% of its total assets in debt securities and other obligations issued by or on behalf of states, territories and possessions of the United States and the District of Columbia and their political subdivisions, agencies and instrumentalities, the interest on which is exempt from regular federal income tax and which is not a preference item for purposes of the alternative minimum tax (the “Municipal Securities Portfolio”) and at least 40%, but less than 50%, of its total assets in common stocks, preferred securities and other income securities (the “Equity and Income Securities Portfolio”).
Note 2 – Significant Accounting Policies:
The preparation of the financial statements in accordance with U.S. generally accepted accounting principles requires management to make estimates and assumptions that affect the reported amounts and disclosures in the financial statements. Actual results could differ from these estimates.
The following is a summary of significant accounting policies consistently followed by the Fund.
(a) Valuation of Investments
Equity securities listed on an exchange and securities traded over the counter are valued at the last reported sale price on the primary exchange on which they are traded. Equity securities traded on an exchange for which there are no transactions on a given day are valued at the last available bid price. Securities traded on the NASDAQ are valued at the NASDAQ Official Closing Price. Preferred stocks are valued at their sales price as of the close of the exchange on which they are traded. Preferred stocks for which the last sales price is not available are valued at the mean of the bid and asked prices. Debt securities are valued at the last available bid price for such securities or, if such prices are not available, at prices for securities of comparable maturity, quality and type. Foreign securities are translated from the local currency into U.S. dollars using the current exchange rate. The Fund’s securities that are primarily traded in foreign markets may be traded in such markets on days that the New York Stock Exchange is closed. As a result, the net asset value of the Fund may be significantly affected on days when holders of Common Shares have no ability to trade the Common Shares on the New York Stock Exchange. For those securities where quotations or prices are not available, valuations are determined in accordance with procedures established in good faith by the Board of Trustees. Short-term securities with remaining maturities of 60 days or less are valued at amortized cost which, when combined with interest earned, approximates market value.
(b) Investment Transactions and Investment Income
Investment transactions are accounted for on the trade date. Realized gains and losses on investments are determined on the identified cost basis. Dividend income is recorded net of applicable withholding taxes on the ex-dividend date and interest income is recorded on an accrual basis. Discounts or premiums on debt securities purchased are accreted or amortized to interest income over the lives of the respective securities using the effective interest method.
(c) Swaps
A swap is an agreement to exchange the return generated by one instrument for the return generated by another instrument. The Fund may enter into swap agreements to manage its exposure to interest rates or to manage the duration of its portfolio. The swaps are valued at current market value and any unrealized gain or loss is included in the Statement of Operations. Gain or loss is realized on the termination date of the swap and is equal to the difference between the Fund’s basis in the swap and the proceeds of the closing transaction, including any fees. During the period that the swap agreement is open, the Fund may be subject to risk from the potential inability of the counterparty to meet the terms of the agreement. The swaps involve elements of both market and credit risk in excess of the amounts reflected on the Statement of Assets and Liabilities.
(d) Options
For hedging and investment purposes, the Fund may purchase put options, put options on futures and write (sell) call options on securities. The risk associated with purchasing an option is that the Fund pays a premium whether or not the option is exercised. Put and call options purchased are accounted for in the same manner as portfolio securities. The cost of securities acquired through the exercise of call options is increased by premiums paid. The proceeds from securities sold through the exercise of put options are decreased by the premiums paid.
There were no options outstanding as of June 30, 2005.
(e) Distributions to Shareholders
The Fund declares and pays quarterly dividends to common shareholders. These dividends consist of tax-exempt income and investment company taxable income, which generally includes qualified dividend income, ordinary income and short term capital gains. Any net realized long-term gains are distributed annually to common shareholders.
Distributions to shareholders are recorded on the ex-dividend date. The amount and timing of distributions are determined in accordance with federal income tax regulations, which may differ from accounting principles generally accepted in the United States.
Note 3 – Investment Advisory Agreement, Investment Sub-Advisory Agreement and Other Agreements:
Pursuant to an Investment Advisory Agreement (the “Agreement”) between the Fund and Claymore Advisors, LLC (the “Adviser”), the Adviser is responsible for managing, either directly or through others selected by it, the investment activities of the Fund and the Fund’s business affairs and other administrative matters. In addition to serving as investment adviser of the Fund, the Adviser will provide day-to-day portfolio management of the Fund’s assets allocated to the Municipal Securities Portfolio. The Adviser will receive a fee, payable monthly, at an annual rate equal to 0.70% of the Fund’s average daily managed assets (total assets, including the assets attributable to the proceeds from any financial leverage, minus liabilities, other than debt representing financial leverage).
The Adviser has entered into an Investment Sub-Advisory Agreement (the “Sub-Advisory Agreement”) with Thompson, Siegel & Walmsley, Inc. (the “Sub-Adviser”). The Sub-Adviser is responsible for day-to-day portfolio management of the Fund’s assets allocated to the Equity and Income Securities Portfolio. Under the terms of the Sub-Advisory Agreement between the Adviser and the Sub-Adviser, the Adviser pays monthly to the Sub-Adviser a fee at the annual rate of 0.42% of the Fund’s average managed assets attributable to the Equity and Income Securities Portfolio.
The Bank of New York (“BNY”) acts as the Fund’s custodian, accounting agent, administrator and transfer agent. As custodian, BNY is responsible for the custody of the Fund’s assets. As accounting agent and administrator, BNY is responsible for maintaining the books and records of the Fund’s securities and cash. As transfer agent, BNY is responsible for performing transfer agency services for the Fund.
Certain officers and trustees of the Fund are also officers and directors of the Adviser or Sub-Adviser. The Fund does not compensate its officers or trustees who are officers of the aforementioned firms.
18 | SemiAnnual Report | June 30, 2005
TYW | TS&W/Claymore Tax-Advantaged Balanced Fund | Notes to Financial Statements (unaudited) continued
Note 4 – Federal Income Taxes:
The Fund intends to comply with the requirements of Subchapter M of the Internal Revenue Code of 1986, as amended, applicable to regulated investment companies. Accordingly, no provision for U.S. federal income taxes is required. In addition, by distributing substantially all of its ordinary income and long-term capital gains, if any, during each calendar year, the Fund intends not to be subject to U.S. federal excise tax.
Information on the components of investments as of June 30, 2005, excluding swap agreements, is as follows:
| | | | | | | | | |
Cost of
Investments
| | Gross
Unrealized
Appreciation
| | Gross
Unrealized
Depreciation
| | | Net Unrealized
Appreciation
on Investments
|
| $340,485,598 | | $ | 20,482,815 | | $ | (4,059,765 | ) | | $16,423,050 |
For the period ended December 31, 2004, the tax character of distributions paid to common shareholders as reflected in the statement of changes in net assets was as follows:
| | | |
Distributions paid from:
| | 2004
|
Ordinary income | | $ | 4,763,713 |
Tax-exempt income | | | 3,564,213 |
Long-term capital gain | | | 3,042 |
Note 5 – Investment in Securities:
For the six months ended June 30, 2005, purchases and sales of investments, excluding short-term securities, were $191,090,501 and $194,140,323, respectively.
The Fund entered into interest rate swap agreements during the six months ended June 30, 2005. Details of the swap agreements outstanding as of June 30, 2005 were as follows:
| | | | | | | | | | | | | | |
Counterparty
| | Termination
Date
| | Notional
Amount
(000)
| | Fixed
Rate
| | | Floating
Rate*
| | Unrealized
Depreciation
| |
Morgan Stanley | | 12/19/2025 | | $ | 12,000 | | 3.95 | % | | BMA | | $ | (258,730 | ) |
Morgan Stanley | | 12/27/2025 | | | 10,000 | | 3.83 | % | | BMA | | | (51,695 | ) |
JP Morgan Chase & Co. | | 01/01/2026 | | | 20,000 | | 3.82 | % | | BMA | | | (102,594 | ) |
| | | | | | | | | | | | |
|
|
|
| | | | | | | | | | | | | $ | (413,019 | ) |
| | | | | | | | | | | | |
|
|
|
| * | BMA - Bond Market Association Municipal Swap Index. |
| For | each swap noted, the Fund pays a fixed rate and receives a floating rate. |
Note 6 – Capital:
Common Shares
In connection with its organizational process, the Fund sold 7,000 common shares of beneficial interest to Claymore Securities, Inc., an affiliate of the Adviser, for consideration of $100,275 at a price of $14.325. The Fund has an unlimited amount of common shares, $0.01 par value, authorized and 15,407,000 issued and outstanding. Of this amount, the Fund issued 15,000,000 shares of common stock in its initial public offering and issued pursuant to an over allotment option to the underwriters, an additional 400,000 shares on May 18, 2004. These shares were issued at $14.325 per share after deducting the sales load, but before reimbursement of expenses to the underwriters of $0.005 per share. During the six months ended June 30, 2005, there was no common share activity.
Offering costs, of $462,000 or $0.03 per share, in connection with the issuance of the common shares were borne by the Fund and charged to paid-in capital. The Adviser paid offering expenses (other than the sales load, but including the reimbursement of expenses to the underwriters) in excess of $0.03 per common share. The Adviser reimbursed the Fund’s organizational expenses, totaling $25,000.
Preferred Shares
On April 29, 2004, the Fund’s Board of Trustees authorized the issuance of preferred shares, in addition to the existing common shares, as part of the Fund’s leverage strategy. The Fund may also borrow or issue debt securities collectively with preferred shares for leveraging purposes. Preferred shares issued by the Fund have seniority over the common shares.
On July 1, 2004, the Fund issued 2,400 shares of Preferred Shares Series M7 and 2,400 shares of Preferred Shares Series T28 each with a net asset and liquidation value of $25,000 per share plus accrued dividends. Dividends are accumulated daily at an annual rate set through auction procedures. Distribution of net realized capital gains, if any, are paid annually.
Offering costs, including the 1% sales charge associated with the issuance of preferred shares, totaling $1,550,000, were borne by the common shareholders as a direct reduction to paid-in capital.
For the six months ended June 30, 2005, the annualized dividend rates ranged from:
| | | | | | | | | |
| | | High
| | | Low
| | | At 6/30/05
| |
Series M7 | | 3.35 | % | | 2.22 | % | | 3.35 | % |
| Series T28 | | 3.25 | % | | 2.40 | % | | 3.22 | % |
The Fund is subject to certain limitations and restrictions while Preferred Shares are outstanding. Failure to comply with these limitations and restrictions could preclude the Fund from declaring any dividends or distributions to common shareholders or repurchasing common shares and/or could trigger the mandatory redemption on Preferred Shares at their liquidation value.
Preferred Shares, which are entitled to one vote per share, generally vote with the common stock but vote separately as a class to elect two Trustees and on any matters affecting the rights of the Preferred Shares.
Note 7 - Indemnifications:
In the normal course of business, the Fund enters into contracts that contain a variety of representations, which provide general indemnifications. The Fund’s maximum exposure under these arrangements is unknown, as this would require future claims that may be made against the Fund that have not yet occurred. However, the Fund expects the risk of loss to be remote.
Note 8 - Subsequent Event:
On August 1, 2005, the Board of Trustees declared a quarterly dividend of $0.234375 per common share. This dividend is payable August 31, 2005 to shareholders of record on August 15, 2005.
.
SemiAnnual Report | June 30, 2005 | 19
TYW | TS&W/Claymore Tax-Advantaged Balanced Fund
Supplemental Information | (unaudited)
Trustees
The Trustees of the TS&W/Claymore Tax-Advantaged Balanced Fund and their principal occupations during the past five years:
| | | | | | | | |
Name, Address* , Year of Birth, and Position(s) Held with Registrant
| | Term of Office**
and Length of
Time Served
| | Principal Occupation During the Past Five Years and Other Affiliations
| | Portfolios In The
Fund Complex***
Overseen by Trustee
| | Other Directorships
Held by Trustee
|
Independent Trustees: |
Robert M. Hamje Year of birth:1942 Trustee | | Since 2004 | | Advisor to the Cleveland Foundation Investment Committee. Formerly, President and Chief Investment Officer of TRW Investment Management Company (1990-2003). | | 1 | | Trustee, Old
Mutual Advisor
Mutual Funds. |
| | | | |
L. Kent Moore Year of birth:1955 Trustee | | Since 2004 | | Managing Director High Sierra Energy L.P., (2004-Present). Formerly, Portfolio Manager and Vice President of Janus Capital Corp. (2000-2002) and Senior Analyst/Portfolio Manager of Marsico Capital Management (1997-1999). | | 1 | | Trustee, Old
Mutual Advisor
Mutual Funds. |
| | | | |
Ronald A. Nyberg Year of birth:1953 Trustee | | Since 2004 | | Principal of Ronald A. Nyberg, Ltd. a law firm specializing in corporate law, estate planning and business transactions (2000-present). Formerly, Executive Vice President, General Counsel and Corporate Secretary of Van Kampen Investments (1982-1999). | | 10 | | None. |
| | | | |
Ronald E. Toupin, Jr. Year of birth:1958 Trustee | | Since 2004 | | Formerly, Vice President, Manager and Portfolio Manager of Nuveen Asset Management (1998-1999),Vice President of Nuveen Investment Advisory Corporation (1992-1999), Vice President and Manager of Nuveen Unit Investment Trusts (1991-1999), and Assistant Vice President and Portfolio Manager of Nuveen Unit Investment Trusts (1988-1999), each of John Nuveen & Company, Inc. (1982-1999). | | 9 | | None. |
| | | | |
Interested Trustees: | | | | | | | | |
Matthew J. Appelstein† Year of birth:1961 Trustee | | Since 2005 | | Director of Investment Services, Old Mutual Asset Management (2003-present). Formerly, Senior Vice President of Consulting Relationships, Fidelity Management Trust Company(1998-2003). | | 1 | | None. |
| | | | |
Nicholas Dalmaso†† Year of birth: 1965 Trustee; Chief Legal and Executive Officer; Chief Compliance Officer | | Since 2004 | | Senior Managing Director and General Counsel of Claymore Advisors, LLC and Claymore Securities, Inc.(2001- present). Formaly,Assistant General Counsel, John Nuveen and Company, Inc.(1999-2000). Former Vice President and Associate General Counsel of Van Kampen Investments, Inc. (1992-1999). | | 10 | | None. |
| * | Address for all Trustees: 2455 Corporate West Drive, Lisle, IL 60532 |
| ** | After a Trustees’ initial term, each Trustee is expected to serve a three-year term concurrent with the class of Trustees for which he serves: |
| - | Messrs. Dalmaso and Hamje, as Class I Trustees, are expected to stand for re-election at the Fund’s 2005 annual meeting of shareholders. |
| - | Messrs. Moore and Nyberg, as Class II Trustees, are expected to stand for re-election at the Fund’s 2006 annual meeting of the shareholders. |
| - | Messrs. Appelstein and Toupin, as Class III Trustee, are expected to stand for re-election at the Fund’s 2007 annual meeting of the shareholders. |
| *** | The Claymore Fund Complex consists of U.S. registered investment companies advised or serviced by Claymore Advisors, LLC or Claymore Securities, Inc. |
| † | Mr. Appelstein is an “interested person” (as defined in Section 2(a)(19) of the 1940 Act) of the Fund because of his position as an officer of Old Mutual Asset Management, the parent company of the Fund’s Sub-Adviser. |
| †† | Mr. Dalmaso is an “interested person” (as defined in Section 2(a)(19) of the 1940 Act) of the Fund because of his position as an officer of Claymore Advisors, LLC, the Fund’s Investment Adviser. |
20 | SemiAnnual Report | June 30, 2005
TYW | TS&W/Claymore Tax-Advantaged Balanced Fund | Supplemental Information (unaudited) continued
Officers:
The Officers of the TS&W/Claymore Tax-Advantaged Balanced Fund and their principal occupations during the past five years:
| | | | |
Name, Address*, Year
of Birth and Position(s)
Held with Registrant
| | Term of Office
** and Length
of Time
Served
| | Principal Occupation During
the Past Five Years and
Other Affiliations
|
| Officers | | | | |
| | |
Steven M. Hill Year of birth: 1964 Chief Financial Officer, Chief Accounting Officer and Treasurer | | Since 2004 | | Senior Managing Director of Claymore Advisors, LLC and Claymore Securities, Inc. (2003-present) and Chief Financial Officer (2005-present). Previously, Treasurer of Henderson Global Funds and Operations Manager for Henderson Global Investors (North America) Inc., from 2002-2003; Managing Director, FrontPoint Partners LLC (2001-2002); Vice President, Nuveen Investments (1999-2001); Chief Financial Officer, Skyline Asset Management LP,(1999);Vice President, Van Kampen Investments and Assistant Treasurer, Van Kampen mutual funds (1989-1999). |
| | |
Vincent R. Giordano Year of birth: 1948 Vice President | | Since 2004 | | Senior Managing Director of Claymore Advisors, LLC. Previously, Senior Vice President and Portfolio Manager of Merrill Lynch Asset Management, lnc.(1985-2001). |
| | |
Heidemarie Gregoriev Year of birth: 1971 Secretary | | Since 2004 | | Vice President and Assistant General Counsel, Claymore Advisors, LLC and Claymore Securities, Inc.since 2004; Legal Counsel, Henderson Global Investors (North America) Inc. and Assistant Secretary (2001-2004) and Chief Legal Officer (2003-2004) of Henderson Global Funds; Attorney, Gardner, Carton & Douglas (1997-2001). |
| | |
George Gregorio Year of birth: 1949 Vice President | | Since 2004 | | Managing Director of Claymore Advisors, LLC. Previously, Sell Side Analyst for JB Hanauer & Co. |
| | |
Roberto W. Roffo Year of birth: 1966 Vice President | | Since 2004 | | Managing Director of Claymore Advisors, LLC. Previously, Director and Vice President of Merrill Lynch Investment Managers. |
| | |
Richard Sarhaddi Year of birth: 1973 Assistant Secretary | | Since 2005 | | Assistant Vice President of Claymore Advisors, LLC and Claymore Securities, Inc.; Previously, Editor, CCH Inc. |
| * | Address for all Officers: 2455 Corporate West Drive, Lisle, IL 60532 |
| ** | Officers serve at the pleasure of the Board of Trustees and until his or her successor is appointed and qualified or until his or her earlier resignation or removal. |
SemiAnnual Report | June 30, 2005 | 21
TYW | TS&W/Claymore Tax-Advantaged Balanced Fund
Dividend Reinvestment Plan | (unaudited)
Unless the registered owner of common shares elects to receive cash by contacting the Plan Administrator, all dividends declared on common shares of the Fund will be automatically reinvested by the Bank of New York (the “Plan Administrator”), Administrator for shareholders in the Fund’s Dividend Reinvestment Plan (the “Plan”), in additional common shares of the Fund. Participation in the Plan is completely voluntary and may be terminated or resumed at any time without penalty by notice if received and processed by the Plan Administrator prior to the dividend record date; otherwise such termination or resumption will be effective with respect to any subsequently declared dividend or other distribution. Some brokers may automatically elect to receive cash on your behalf and may reinvest that cash in additional common shares of the Fund for you. If you wish for all dividends declared on your common shares of the Fund to be automatically reinvested pursuant to the Plan, please contact your broker.
The Plan Administrator will open an account for each common shareholder under the Plan in the same name in which such common shareholder’s common shares are registered. Whenever the Fund declares a dividend or other distribution (together, a “Dividend”) payable in cash, non-participants in the Plan will receive cash and participants in the Plan will receive the equivalent in common shares. The common shares will be acquired by the Plan Administrator for the participants’ accounts, depending upon the circumstances described below, either (i) through receipt of additional unissued but authorized common shares from the Fund (“Newly Issued Common Shares”) or (ii) by purchase of outstanding common shares on the open market (“Open-Market Purchases”) on the New York Stock Exchange or elsewhere. If, on the payment date for any Dividend, the closing market price plus estimated brokerage commission per common share is equal to or greater than the net asset value per common share, the Plan Administrator will invest the Dividend amount in Newly Issued Common Shares on behalf of the participants. The number of Newly Issued Common Shares to be credited to each participant’s account will be determined by dividing the dollar amount of the Dividend by the net asset value per common share on the payment date; provided that, if the net asset value is less than or equal to 95% of the closing market value on the payment date, the dollar amount of the Dividend will be divided by 95% of the closing market price per common share on the payment date. If, on the payment date for any Dividend, the net asset value per common share is greater than the closing market value plus estimated brokerage commission, the Plan Administrator will invest the Dividend amount in common shares acquired on behalf of the participants in Open-Market Purchases.
If, before the Plan Administrator has completed its Open-Market Purchases, the market price per common share exceeds the net asset value per common share, the average per common share purchase price paid by the Plan Administrator may exceed the net asset value of the common shares, resulting in the acquisition of fewer common shares than if the Dividend had been paid in Newly Issued Common Shares on the Dividend payment date. Because of the foregoing difficulty with respect to Open-Market Purchases, the Plan provides that if the Plan Administrator is unable to invest the full Dividend amount in Open-Market Purchases during the purchase period or if the market discount shifts to a market premium during the purchase period, the Plan Administrator may cease making Open-Market Purchases and may invest the uninvested portion of the Dividend amount in Newly Issued Common Shares at net asset value per common share at the close of business on the Last Purchase Date provided that, if the net asset value is less than or equal to 95% of the then current market price per common share; the dollar amount of the Dividend will be divided by 95% of the market price on the payment date.
The Plan Administrator maintains all shareholders’ accounts in the Plan and furnishes written confirmation of all transactions in the accounts, including information needed by shareholders for tax records. Common shares in the account of each Plan participant will be held by the Plan Administrator on behalf of the Plan participant, and each shareholder proxy will include those shares purchased or received pursuant to the Plan. The Plan Administrator will forward all proxy solicitation materials to participants and vote proxies for shares held under the Plan in accordance with the instruction of the participants.
There will be no brokerage charges with respect to common shares issued directly by the Fund. However, each participant will pay a pro rata share of brokerage commission incurred in connection with Open-Market Purchases. The automatic reinvestment of Dividends will not relieve participants of any Federal, state or local income tax that may be payable (or required to be withheld) on such Dividends.
The Fund reserves the right to amend or terminate the Plan. There is no direct service charge to participants with regard to purchases in the Plan; however, the Fund reserves the right to amend the Plan to include a service charge payable by the participants.
All correspondence or questions concerning the Plan should be directed to the Plan Administrator, The Bank of New York, 2 Hanson Place, Brooklyn, NY 11217, Attention: Irina Krylov, Phone Number: (718) 315-4818.
22 | SemiAnnual Report | June 30, 2005
TYW | TS&W/Claymore Tax-Advantaged Balanced Fund
Fund Information |
| | | | |
| Board of Trustees | | Officers | | Investment Manager |
| Matthew J. Appelstein* | | Nicholas Dalmaso | | Thompson, Siegel & Walmsley, Inc. |
| | | Chief Executive and Legal Officer | | Richmond, Virginia |
| Nicholas Dalmaso* | | | | |
| | | Steven M. Hill | | Investment Adviser |
| Robert M. Hamje | | Chief Financial Officer and Treasurer | | Claymore Advisors, LLC Lisle, Illinois |
| | |
| L. Kent Moore | | Heidemarie Gregoriev | | |
| | | Secretary | | Administrator, Custodian and Transfer Agent |
| Ronald A. Nyberg | | Vincent R. Giordano | | The Bank of New York |
| | | Vice President | | New York, New York |
| Ronald E. Toupin, Jr. | | | | |
| | | George Gregorio | | Preferred Stock - |
| | | Vice President | | Dividend Paying Agent |
| | | | | The Bank of New York |
| | | Roberto W. Roffo | | New York, New York |
| | | Vice President | | |
| | | | | Legal Counsel |
| | | Richard Sarhaddi | | Skadden, Arps, Slate, Meagher & |
| | | Assistant Secretary | | Flom LLP |
| | | | | Chicago, Illinois |
| | | | | |
| | | | | Independent Registered Public Accounting Firm |
| | | | | Ernst & Young LLP |
| | | | | Chicago, Illinois |
| | | | | |
| * | Trustee is an “interested person” of the Fund as defined in the Investment Company Act of 1940, as amended. |
Privacy Principles of TS&W/Claymore Tax-Advantaged Balanced Fund for Shareholders
The Fund is committed to maintaining the privacy of its shareholders and to safeguarding its non-public personal information. The following information is provided to help you understand what personal information the Fund collects, how we protect that information and why, in certain cases, we may share information with select other parties.
Generally, the Fund does not receive any non-public personal information relating to its shareholders, although certain non-public personal information of its shareholders may become available to the Fund. The Fund does not disclose any non-public personal information about its shareholders or former shareholders to anyone, except as permitted by law or as is necessary in order to service shareholder accounts (for example, to a transfer agent or third party administrator).
The Fund restricts access to non-public personal information about the shareholders to Claymore Advisors, LLC employees with a legitimate business need for the information. The Fund maintains physical, electronic and procedural safeguards designed to protect the non-public personal information of its shareholders.
Questions concerning your shares of TS&W/Claymore Tax-Advantaged Balanced Fund?
| • | | If your shares are held in a Brokerage Account, contact your Broker. |
| • | | If you have physical possession of your shares in certificate form, contact the Fund’s Administrator, Custodian and Transfer Agent: |
The Bank of New York, 111 Sanders Creek Parkway, East Syracuse, NY 13057 (800) 701-8178
This report is sent to shareholders of TS&W/Claymore Tax-Advantaged Balanced Fund for their information. It is not a Prospectus, circular or representation intended for use in the purchase or sale of shares of the Fund or of any securities mentioned in this report.
A description of the Fund’s proxy voting policies and procedures related to portfolio securities is available without charge, upon request, by calling the Fund at (800) 345-7999 or on the Securities & Exchange Commission’s (“SEC’s”) website at http://www.sec.gov.
Information regarding how the Fund voted proxies for portfolio securities, if applicable, during the most recent 12-month period ended June 30, is also available, without charge and upon request by calling the Fund at (800) 345-7999 or by accessing the Fund’s Form N-PX on the SEC’s website at http://www.sec.gov.
The Fund files its complete schedule of portfolio holdings with the SEC for the first and third quarters of each fiscal year on Form N-Q. The Fund’s Form N-Q is available on the SEC website at http://www.sec.gov. The Fund’s Form N-Q may also be viewed and copied at the SEC’s Public Reference Room in Washington, DC; information on the operation of the Public Reference Room may be obtained by calling (800) SEC-0330 or at www.claymore.com.
SemiAnnual Report | June 30, 2005 | 23
TYW | TS&W/Claymore Tax-Advantaged Balanced Fund
About the Fund Managers |
TS&W/Claymore Tax-Advantaged Balanced Fund (TYW) is managed jointly by seasoned investment professionals from both Claymore Advisors, LLC and Thompson, Siegel & Walmsley, Inc. The teams employ their specialized experience to different sleeves within the Fund, but work closely with one another to collectively guide the overall operations of TYW.
Claymore Advisors, LLC
Claymore Advisors, LLC is a registered investment adviser that provides investment management and research-related services to registered investment companies and separately managed accounts. Claymore Advisors, LLC is responsible for the Fund’s asset allocation and its municipal portfolio management team is responsible for the day-to-day management of the municipal securities portion of the Fund’s investments.
Claymore’s Investment Philosophy and Process
Claymore Advisors attempts to identify investment grade and below-investment grade municipal securities that are trading at attractive valuations relative to the Firm’s evaluation of the issuer’s creditworthiness, and with respect to private activity bonds, the profit potential of the corporation from which the revenue supporting the bonds is derived.
The municipal management team begins their credit selection process by analyzing broad macroeconomic trends and developments affecting the fixed-income markets. The managers analyze the economic out-look, market conditions and perceived effects on interest rates and yield curves. From there they incorporate a bottom-up and top-down analysis that helps construct a portfolio that the managers believe optimizes tax-exempt income while seeking to avoid undue credit risk and market timing risk.
Claymore’s proprietary, unbiased research helps the managers identify undervalued sectors that they believe have the potential for ratings upgrades and capital appreciation.
Thompson, Siegel & Walmsley, Inc. (TS&W)
Thompson, Siegel & Walmsley, Inc. (TS&W) is a registered investment adviser founded in 1969 in Richmond, Virginia and provides investment management services to corporations, pension and profit-sharing plans, 401 (k) and thrift plans, open and closed-end mutual funds, trusts, estates and other institutions and individuals. The firm is a wholly owned subsidiary of Old Mutual (US) Holdings Inc. TS&W is responsible for the day-to-day management of the equity and taxable income securities portion of the Fund.
TS&W Investment Philosophy and Process
Thompson, Siegel & Walmsley, Inc.’s investment process is value-driven and team-oriented. TS&W pursues a relative value-oriented philosophy and focuses its equity selection on the higher dividend-paying stocks that meet its investment criteria. TS&W employs a proprietary quantitative valuation model that is applied to more than 400 stocks. This directs the managers’ review process toward companies that they believe have the highest expected return potential over a multi-year period. TS&W’s in-house research analysts are responsible for validating the model inputs for companies under their coverage and monitoring them over the holding period. Buys and sells are discussed at weekly research meetings or more frequently as needed. TS&W’s Fixed-Income team is responsible for overall bond market strategy as well as security selection. In-house analysts are used to support the credit review process.
| | |
| Claymore Securities, Inc. | |  |
| 2455 Corporate West Drive | |
| Lisle, IL 60532 | |
Item 2. Code of Ethics.
Not applicable for a semi-annual reporting period.
Item 3. Audit Committee Financial Expert.
Not applicable for a semi-annual reporting period.
Item 4. Principal Accountant Fees and Services.
Not applicable for a semi-annual reporting period.
Item 5. Audit Committee of Listed Registrants.
Not applicable for a semi-annual reporting period.
Item 6. Schedule of Investments.
The Schedule of Investments is included as part of Item 1.
Item 7. Disclosure of Proxy Voting Policies and Procedures for Closed-End Management Investment Companies.
Not applicable for a semi-annual reporting period.
Item 8. Portfolio Managers of Closed-End Management Investment Companies.
Not applicable.
Item 9. Purchases of Equity Securities by Closed-End Management Investment Company and Affiliated Purchasers.
None.
Item 10. Submission of Matters to a Vote of Security Holders.
The registrant has not made any material changes to the procedures by which shareholders may recommend nominees to the registrant’s Board of Trustees.
Item 11. Controls and Procedures.
(a) The registrant’s principal executive officer and principal financial officer have evaluated the registrant’s disclosure controls and procedures within 90 days of this filing and have concluded based on such evaluation, that the registrant’s disclosure controls and procedures were effective, as of that date, in ensuring that information required to be disclosed by the registrant in this Form N-CSR was recorded, processed, summarized, and reported within the time periods specified in the Securities and Exchange Commission’s rules and forms.
(b) There were no changes in the registrant’s internal control over financial reporting (as defined in Rule 30a-3(d) under the Investment Company Act of 1940) that occurred during the registrant’s last fiscal quarter that have materially affected, or are reasonably likely to materially affect, the registrant’s internal control over financial reporting.
Item 12. Exhibits.
| | |
| (a)(1) | | Not applicable. |
| |
| (a)(2) | | Certification of principal executive officer and principal financial officer pursuant to Rule30a-2. |
| |
| (b) | | Certification of principal executive officer and principal financial officer pursuant to Section 906 of the Sarbanes-Oxley Act of 2002. |
SIGNATURES
Pursuant to the requirements of the Securities Exchange Act of 1934 and the Investment Company Act of 1940, the registrant has duly caused this report to be signed on its behalf by the undersigned, thereunto duly authorized.
| | |
| (Registrant) | | TS&W / Claymore Tax-Advantaged Balanced Fund
|
| |
| By: | | /s/ Nicholas Dalmaso
|
| Name: | | Nicholas Dalmaso |
| Title: | | Chief Legal and Executive Officer |
| |
| Date: | | August 26, 2005 |
Pursuant to the requirements of the Securities Exchange Act of 1934 and the Investment Company Act of 1940, this report has been signed by the following persons on behalf of the registrant and in the capacities and on the dates indicated.
| | |
By: | | /s/ Nicholas Dalmaso
|
Name: | | Nicholas Dalmaso |
Title: | | Chief Legal and Executive Officer |
| |
Date: | | August 26, 2005 |
| |
By: | | /s/ Steven M. Hill
|
Name: | | Steven M. Hill |
Title: | | Treasurer and Chief Financial Officer |
| |
Date: | | August 26, 2005 |