UNITED STATES
SECURITIES AND EXCHANGE COMMISSION
Washington, D.C. 20549
FORM N-CSR
CERTIFIED SHAREHOLDER REPORT OF REGISTERED
MANAGEMENT INVESTMENT COMPANIES
Investment Company Act file number 811-21515
TS&W / Claymore Tax-Advantaged Balanced Fund
|
| (Exact name of registrant as specified in charter) |
|
| 2455 Corporate West Drive, Lisle, IL 60532 |
| (Address of principal executive offices) (Zip code) |
Nicholas Dalmaso, Chief Legal and Executive Officer
2455 Corporate West Drive, Lisle, IL 60532
|
| (Name and address of agent for service) |
Registrant’s telephone number, including area code: (630) 505-3700
Date of fiscal year end: December 31
Date of reporting period: December 31, 2006
Form N-CSR is to be used by management investment companies to file reports with the Commission not later than 10 days after the transmission to stockholders of any report that is required to be transmitted to stockholders under Rule 30e-1 under the Investment Company Act of 1940 (17 CFR 270.30e-1). The Commission may use the information provided on Form N-CSR in its regulatory, disclosure review, inspection, and policymaking roles.
A registrant is required to disclose the information specified by Form N-CSR, and the Commission will make this information public. A registrant is not required to respond to the collection of information contained in Form N-CSR unless the Form displays a currently valid Office of Management and Budget (“OMB”) control number. Please direct comments concerning the accuracy of the information collection burden estimate and any suggestions for reducing the burden to Secretary, Securities and Exchange Commission, 450 Fifth Street, NW, Washington, DC 20549-0609. The OMB has reviewed this collection of information under the clearance requirements of 44 U.S.C. Section 3507.
| Item 1. | Reports to Stockholders. |
The registrant’s annual report transmitted to shareholders pursuant to Rule 30e-1 under the Investment Company Act of 1940 is as follows:
| | | | |
| Annual | | TS&W/Claymore | | |
| Report | | | | | TYW |
| December 31, 2006 | | Tax-Advantaged Balanced Fund | | |

www.tswclaymore.com
... home port for the LATEST,
most up-to-date INFORMATION about the
TS&W/Claymore Tax-Advantaged Balanced Fund

The shareholder report you are reading right now is just the beginning of the story. Online at www.tswclaymore.com, you will find:
| | • | | Daily, weekly and monthly data on share prices, distributions and more |
| | • | | Monthly portfolio overviews and performance analyses |
| | • | | Announcements, press releases and special notices |
| | • | | Fund and adviser contact information |
Thompson, Siegel & Walmsley, Inc. and Claymore are continually updating and expanding shareholder information services on the Fund’s website, in an ongoing effort to provide you with the most current information about how your Fund’s assets are managed, and the results of our efforts. It is just one more way we are working to keep you better informed about your investment in the Fund.
2 | Annual Report | December 31, 2006
TYW|TS&W/Claymore Tax-Advantaged Balanced Fund
Dear Shareholder
Thank you for your investment in the TS&W/Claymore Tax-Advantaged Balanced Fund (the “Fund”). We are pleased to submit the Fund’s shareholder report for the fiscal year ended December 31, 2006.
As described in the Fund’s semi-annual report, during the fiscal year, shareholders of the Fund approved a sub-advisory agreement among the Fund, Claymore Advisors, LLC and SMC Fixed Income Management, LP. On July 11, 2006, SMC Fixed Income Management assumed management of the Fund’s municipal bond portfolio. This change, however, did not represent a change in portfolio managers. Vincent Giordano and Roberto Roffo – who have managed the municipal bond portfolio since the Fund’s inception as employees of Claymore Advisors, LLC –continue to manage the portfolio as employees of SMC Fixed Income Management, LP. Thompson, Siegel & Walmsley, Inc. (“TS&W”) continues to serve as an Investment Sub-Adviser and is responsible for the day-to-day portfolio management of the Fund’s equity portfolio and other non-municipal income-producing securities. Claymore Advisors, LLC remains the Investment Adviser to the Fund and is responsible for managing the Fund’s overall asset allocation. We believe this change has had no impact on the Fund’s operations.
The Fund’s primary investment objective is to provide a high level of total after-tax return, including attractive tax-advantaged income. The Fund focuses its investments on securities that generate income that is exempt from regular federal income tax (and which are not preference items for the purposes of the alternative minimum tax) and common stocks and preferred securities that are eligible to pay dividends which, for individual investors, qualify for the long-term capital gain rates (“tax-advantaged income”), while also offering the potential for capital appreciation through exposure to equity markets. The portfolio is comprised primarily of municipal securities, equity securities, preferred securities and high-yield debt securities.
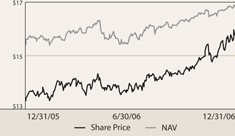
We’re delighted with the Fund’s performance during the fiscal year, which provided both strong market price and net asset value (“NAV”) returns. The Fund produced a total return of 15.50% based on NAV, which includes the reinvestment of dividends. This return closely tracked the 15.79% gain by the all-stock S&P 500 Index. As you may know, municipal securities represented just over 50% of the Fund’s total investments this year. To put the Fund’s NAV return into better perspective, consider that the Lehman Municipal Long Bond Index returned just 4.84% in 2006. The success of the Fund, we believe, is attributable to the disciplined investment strategies employed in both its municipal bond and equity and income portfolios.
The Fund performed even better on a market value basis. In the fiscal year ended December 31, 2006, the Fund generated a total return based on market value of 25.98%, which includes the reinvestment of dividends. The Fund’s strong returns helped substantially narrow its market price discount to NAV in 2006. On December 31, 2006, the Fund’s market price closed at $15.77 and its NAV was $16.83, reflecting a discount of 6.30%. A year earlier, the Fund’s market price was $13.35 and its NAV was $15.44, reflecting a discount of 13.54%.
Annual Report | December 31, 2006|3
TYW|TS&W/Claymore Tax-Advantaged Balanced Fund| Dear Shareholder continued
The Fund paid quarterly dividends of $0.234375 per share during the fiscal year ended December 31, 2006. This represented a distribution rate of 5.94% based upon the closing market price of $15.77 on December 31, 2006. However, there is no guarantee that this level of income will be maintained. Given the tax characteristics of the 2006 calendar year, this rate represents a taxable-equivalent distribution rate of 7.78% for a shareholder in the 35% maximum federal income tax bracket.
We believe that the Fund’s market price discount to NAV represents an opportunity as common shares of the Fund continue to be available in the market at prices below the value of the securities in the underlying portfolio.
Shareholders have the opportunity to reinvest their dividends from the Fund through the Dividend Reinvestment Plan (“DRIP”) that is described in detail on page 26 of this report. If shares trade at a discount to NAV, the DRIP takes advantage of the discount by reinvesting the quarterly dividend distribution in common shares of the Fund purchased in the market at a price less than NAV. Conversely, when the market price of the Fund’s common shares is at a premium above NAV, the DRIP reinvests participants’ dividends in newly-issued common shares at NAV, subject to an IRS limitation that the purchase price cannot be more than 5% below the market price per share. The DRIP provides a cost effective means to accumulate additional shares and to enjoy the benefits of compounding returns over time.
To learn more about the Fund’s performance over this fiscal period, we encourage you to read the Questions & Answers section of the report on page 5. You will find information on what impacted the performance of the Fund during the fiscal period and the Investment Adviser’s and Sub-Advisers’ views on the overall market environment.
We appreciate your investment and look forward to serving your investment needs in the future. For the most up-to-date information on your investment, please visit the Fund’s website at www.tswclaymore.com.
Sincerely

Nicholas Dalmaso
TS&W/Claymore Tax-Advantaged Balanced Fund
4| Annual Report | December 31, 2006
TYW|TS&W/Claymore Tax-Advantaged Balanced Fund
Questions & Answers
From the Fund’s inception through July 10, 2006, TS&W/Claymore Tax-Advantaged Balanced Fund (the “Fund”) was managed jointly by Claymore Advisors, LLC and Thompson, Siegel & Walmsley, Inc. (“TS&W”). Effective July 11, 2006, SMC Fixed Income Management, LP (“SMC”) joined TS&W as a sub-adviser to the Fund. Claymore Advisors, LLC remains the Investment Adviser to the Fund. The teams employ their specialized experience to different sleeves within the Fund, but work closely with one another to collectively guide the overall operations of TYW.
Vincent R. Giordano, Portfolio Manager, Managing Member SMC Fixed Income Management, LP.
Mr. Giordano is a Managing Member of SMC. He leads the SMC’s municipal fixed-income investment management team and co-manages the Fund’s municipal securities portfolio. Prior to joining SMC, Mr. Giordano was employed by Claymore Advisors, LLC and Merrill Lynch. He has more than 30 years of investment experience.
RobertoW. Roffo, Portfolio Manager, Managing Director SMC Fixed Income Management, LP.
Mr. Roffo co-manages the Fund’s municipal portfolio. He has more than 15 years of investment management experience focused on the municipal securities market. Prior to joining SMC, Mr. Roffo was employed by Claymore Advisors, LLC and Merrill Lynch. He has worked closely with Mr. Giordano throughout his career. He holds a Bachelor’s Degree from the University of Massachusetts.
Paul A. Ferwerda, CFA, Portfolio Manager, Senior Vice President –Domestic Equity and Research Thompson, Siegel & Walmsley, Inc.
Mr. Ferwerda is responsible for the day-to-day management of the Fund’s common stock portfolio. He has been with TS&W for more than 18 years and has 25 years of investment experience. Mr. Ferwerda has extensive equity research experience within the financial sector and holds an MBA from Duke University.
William M. Bellamy, CFA, Portfolio Manager, Vice President Thompson, Siegel & Walmsley, Inc.
Mr. Bellamy joined TS&W in 2002. He has 20 years of investment industry experience focused on the fixed-income markets. Mr. Bellamy is responsible for managing the Fund’s taxable fixed-income securities. He holds an MBA from Duke University.
The Fund is co-managed by Paul A. Ferwerda and William M. Bellamy of Thompson TS&W and Vincent Giordano and Roberto Roffo of SMC. In the following interview, TS&W and SMC share their thoughts on the market and discuss the factors that influenced the Fund’s overall performance in the fiscal year ended December 31, 2006.
How did the Fund perform in the fiscal year?
The Fund performed well, providing a total return based on market price of 25.98%, which includes the reinvestment of quarterly dividends for the fiscal year ended December 31, 2006. The Fund also gained on a net asset value basis (“NAV”), generating a total return of 15.50%, which includes the reinvestment of the Fund’s quarterly dividends for the fiscal year ended December 31, 2006.
For NAV performance comparison purposes, the municipal bond market, as measured by the Lehman Brothers U.S. Municipal Long Bond Index, returned 4.84% for the fiscal year ended December 31, 2006. The broad equity market, as measured by the Standard & Poor’s 500 Index (“S&P 500”), returned 15.79% and the high-yield bond market, as measured by the Merrill Lynch High Yield Master II Index, returned 11.74% over the annual period.
The Fund continued to pay a quarterly distribution of $0.234375 per share, which represented a distribution rate of 5.94% based upon the closing market price of $15.77 on December 31, 2006. However there is no guarantee that this level of income will be maintained. Given the tax characteristics of the 2006 calendar year, this rate represents a taxable-equivalent distribution rate of 7.78% for a shareholder in the 35% maximum federal income tax bracket.
Were there any structural changes to the Fund’s asset allocation?
Strong growth within the Fund’s common stock portfolio enabled us to reallocate the Fund’s assets in early May as the equity and taxable income portion of the portfolio appreciated to a level close to the maximum allowable allocation of 50% of assets. Assets within the equity and taxable income portfolio were sold and general obligation municipal securities were purchased with the proceeds. On December 31, 2006, approximately 50.8% of the Fund’s total investments were invested in municipal securities, which provide income that is exempt from regular federal income tax and not a preference item for purposes of the alternative minimum tax. Of the remaining assets in the Fund’s portfolio as of December 31, 2006, approximately 39.4% were invested in equity securities primarily consisting of large-cap dividend-paying stocks and approximately 9.8% were invested in other taxable income-producing securities, which include high-yield bonds, preferred stocks, real estate investment trusts and other income-producing securities.
Additionally, the portfolio was rebalanced again in late January 2007 due to the continued strong equity markets.
How does the Fund employ leverage?
TYW, like many closed-end funds, utilizes leverage as part of its investment strategy. The purpose of leverage is to finance the purchase of additional securities that provide the potential for increased income and capital appreciation to common shareholders than could otherwise be achieved from an unleveraged portfolio. In executing this strategy, the Fund issued Auction Market Preferred Shares (“AMPS”). While the cost of the AMPS increased in 2006 with the rise in short-term interest rates, their expense remained lower than the returns that the Fund generated on its investments and the AMPS. We expect to employ a leverage program as long as it adds value. Of course, leverage results in greater NAV volatility and entails more downside risk than an unleveraged portfolio. The use of leverage also makes the Fund more vulnerable to rising interest rates. Leverage represents just under 32% of the Fund’s Total Net Investments as of December 31, 2006
Annual Report | December 31, 2006| 5
TYW|TS&W/Claymore Tax-Advantaged Balanced Fund| Questions & Answers continued
The following questions are related to the municipal securities portfolio and are answered by Portfolio Managers Vincent R. Giordano and Roberto W. Roffo. These are the same individuals that, as former employees of Claymore Advisors, LLC, have managed the municipal securities portfolio since the Fund’s inception.
Will you provide an overview of the municipal market in the fiscal year?
It was a favorable market for municipal bonds. While short-term rates rose during the year, rates on long-term municipal bonds declined, which was favorable for the Fund. The Lehman Brothers Municipal Long Bond Index returned 4.84% in the fiscal year ended December 31, 2006, and municipal bonds outperformed comparable maturity Treasury bonds across all maturities. New issuance was slightly below projected volume due to concern about the rising interest rate environment and the expenses involved with new issuance. Demand, however, remained very strong. Investors searching for yield continued to favor the high-yield segment of the market and bonds with longer maturities.
In the first half of the year, the Federal Reserve Board (the “Fed”) continued to increase the federal funds target rate to help stave off inflation and temper strong economic growth trends. The Fed paused in the second half, maintaining the federal funds target rate at 5.25% for the remainder of the year. While short-term rates rose in 2006, long-term rates on municipal bonds declined by about 40 basis points, which benefitted the Fund’s municipal securities portfolio.
Will you tell us about how you select municipal securities for the Fund?
We begin by analyzing broad macroeconomic trends and developments affecting the fixed-income markets. Our team analyzes the economic outlook, market conditions and perceived effects on interest rates and yield curves. From there, we incorporate a bottom-up and top-down analysis that helps us construct a portfolio that we believe optimizes federally tax-exempt income while seeking to avoid undue credit risk and market timing risk. While we monitor interest rates very closely and act quickly to adjust the portfolio to changing market rates, we do not trade the portfolio in search of incremental gains that could be achieved by active trading based on daily changes in rates. Our proprietary, unbiased research helps us identify undervalued sectors that we believe have the potential for ratings upgrades and capital appreciation; however, there is no guarantee that such events will occur.
Which issues or sectors contributed to the municipal securities portfolio’s performance?
The high-yield portion of the portfolio continued to add value as the portfolio’s credits strengthened. A number of the portfolio’s health care and housing credits were pre-refunded during the fiscal year. This was positive for the portfolio as the credits increased in quality without sacrificing their income. The pre-refunding also resulted in a shortening of the portfolio’s average duration. The Fund’s high-yield municipal securities are concentrated in land-secured housing and health care credits. These were positions initiated at the Fund’s inception based on our analysis that indicated these were the most attractive sectors based on yield spreads and potential total return. These sectors remain core areas of the portfolio and have experienced tremendous appreciation while outperforming the overall municipal market since their purchase.
Health care credits. The Fund owns a diversified portfolio of municipal health care bonds. We initially purchased these securities because of their attractive prices, relatively high yields and what we believed to be their strong upside potential. Since that time, their credit-worthiness and valuations have improved significantly. However, we did eliminate several BBB-rated bonds as they began to trade in a range that we believed was too tight versus high-grade municipal bonds with less credit risk. We continue to hold the remaining health care securities because they have generated solid income for the portfolio and offer improving risk/reward characteristics. As mentioned previously, some of these securities have also been pre-refunded, enabling the portfolio to realize an attractive income stream with reduced levels of risk.
Land-secured housing credits. These bonds are issued by local municipalities and represent most of the portfolio’s high-yield or non-rated exposure. Many corporate land developers borrow money from local governments to help subsidize the construction of new single- or multi-family housing developments. Bonds from such transactions are called special tax allocation securities and are paid off by property taxes assessed on the new homes. At their inception, these securities have higher levels of risk because of the time lag between their issuance and when property taxes are collected. The only collateral for the bonds is the land upon which the homes are being built. We were fortunate enough to purchase issues that have done very well since our investment. While externally these credits remain non-rated, our internal ratings analysis suggests to us that their level of credit worthiness has improved as property taxes are now being collected. Like the health care credits, these bonds have generated attractive income and offer improving risk/reward characteristics. Similarly, some of these securities have also been pre-refunded, enabling the portfolio to realize an attractive income stream with reduced levels of risk.
Which areas of the municipal securities portfolio hurt performance?
As interest rates on long-term municipal bonds declined, the market rallied and many of the portfolio’s long-duration bonds increased in value. Duration is a measure of the interest rate sensitivity of a fixed-income investment or portfolio. Longer-term duration bonds typically outperform shorter-duration bonds in declining interest rate environments. While the municipal securities portfolio was helped by the decline in long-term municipal bond rates, it was not able to capture the full upside potential of the rally. The pre-refunding of high-yield credits shortened the portfolio’s duration and limited potential gains. While this was
6 |Annual Report | December 31, 2006
TYW|TS&W/Claymore Tax-Advantaged Balanced Fund| Questions & Answers continued
disappointing from a capital appreciation standpoint, the yields and improved credit quality of those pre-refunded issues remain attractive in terms of the income they generate.
What is your outlook for the economy and the municipal market and fund?
It appears that the Fed has been successful in slowing down economic growth to a reasonable and sustainable pace. For that reason, we believe that the Fed is at or close to the end of its current interest rate tightening cycle. When short-term rates begin to stabilize, it should be positive for the municipal market. We believe the municipal bonds are still cheap on a relative basis versus taxable bonds and that demand should remain strong given the municipal securities market’s attractive yields and recent performance relative to Treasuries. All of this provides a favorable backdrop for the Fund’s municipal securities holdings in our opinion.
The Fund’s equity portfolio and taxable fixed-income securities are managed by TS&W. The following questions are related to those portions of the portfolio and are answered by Portfolio Managers Paul A. Ferwerda and William M. Bellamy.
Will you provide an overview of equity and high yield bond markets during the fiscal year?
Equity Market Overview:
The year 2006 provided a strong equity environment. The S&P 500 advanced 15.79%, tripling its 4.91% return in 2005. The advance in stocks was driven by strong corporate earnings, witnessed by the S&P 500’s average earnings growth of approximately 14% in 2006. Large value stocks continued to outperform large growth stocks in the year and stocks with higher dividend yields tended to perform better than stocks with no dividend yields or low dividend yields. These trends provided a favorable environment for the Fund’s income-oriented large-cap value common stock portfolio.
High-Yield Market Overview
Interest rates in the high yield market rose across all maturities in 2006. However, interest rates remained low from an historical standpoint, and investors willingly took on more risk in search of higher yields. This created another favorable year for high-yield bonds, for which returns were strong and defaults remained near historically low levels. The Merrill Lynch High Yield Master II Index gained 11.74% in 2006. Lower-rated, high-yield bonds outperformed their higher-rated counterparts as investors searched for higher levels of income. The Fund is primarily invested in higher-rated, high-yield bonds and this bias limited potential gains in the taxable income portfolio. The purpose of the taxable income portfolio, however, is to offset expenses generated by the Fund, not to serve as a primary means of capital appreciation. We therefore invest in securities that we believe will provide relatively stable income streams, which tend to be the more highly rated high-yield bonds. This strategy was successful as the portfolio generated more than enough income to offset expenses incurred.
Before we discuss the specific performance attributes of the portfolios, will you provide an overview of how you choose equity and high-yield securities?
TS&W’s investment process is value-driven and team-oriented. On the equity side, we have a proprietary quantitative valuation model that we apply to more than 400 stocks. This directs our review process toward companies that we believe have the highest expected return potential over a multi-year period. Our in-house research analysts are responsible for validating the model inputs for companies under their coverage and monitoring them over the holding period. Buys and sells are discussed at weekly research meetings or more frequently as needed. TS&W’s fixed-income team is responsible for overall bond market strategy as well as security selection. In-house analysts are used to support the credit review process.
Please tell us about the dividend income earned on the Fund’s equity investments.
Our informal goal is for the common equity portfolio to generate a dividend yield of about two times the yield on the S&P 500. We were very pleased with the portfolio’s dividend yield in 2006, which maintained a significant premium to the index’s yield. The portfolio’s yield was enhanced as many companies in which the Fund was invested increased their regular dividends and also declared special dividends. This resulted in a 13.5% increase in the common equity portfolio’s yield in 2006. During the year, the U.S. Congress extended the expiration of the 15% tax treatment of certain equity dividends to December 2010 from December 2008. The current environment of strong corporate profitability coupled with the extension of the favorable equity dividend income tax treatment could further support the recent trend of companies initiating dividends and increasing dividends. If that happens, it will help us in our pursuit of a high-yielding portfolio. However there is no guarantee of this occurring.
Which areas of the common equity portfolio helped performance?
The portfolio provided strong performance, generating positive returns in all 10 of the 10 Global Industry Classification Standard (GICS) sector categorizations. The portfolio’s materials, telecommunications and financial sectors had the most profound impact on performance.
Materials. Materials represented the portfolio’s strongest performing sector in 2006. That said, most of the sector’s contribution to performance came in the first half of the year as commodity prices climbed and global economic growth trends remained robust. At the beginning of 2006, the portfolio held a large overweight position in the sector relative to the S&P 500, which was reduced to a modest overweight by year’s end. A number of securities were eliminated from the portfolio due to their high levels of appreciation and our belief that they had reached fair valuations. These issues included Phelps Dodge, a copper company; Nucor, a steel company and PPG Industries, Inc., a manufacturer of coatings, glass and chemicals.
Annual Report | December 31, 2006| 7
TYW|TS&W/Claymore Tax-Advantaged Balanced Fund| Questions & Answers continued
Telecommunications. The telecommunications sector performed well in 2006, buoyed by consolidation in the industry and growing demand for wireless services. The portfolio was helped by its overweight position in the sector versus the S&P 500 and strong performance from several of its holdings. Verizon Communications and AT&T, Inc. (1.4% and 1.2% of long-term investments, respectively) are two global telecommunications companies that benefited from increased revenues resulting from merger and acquisition activity. After a rough start early in 2006, Verizon’s stock advanced in the second half of the year, as investors became comfortable that Verizon’s 2005 purchase of MCI, Inc. would indeed add shareholder value through increased market share and profits. Similarly, the 2005 acquisition of AT&T by telecommunications giant SBC Communications, which subsequently renamed itself AT&T, proved beneficial to investors in terms of increased profits.
Financials. Financials represented the portfolio’s largest sector position and provided robust gains. Performance was led by diversified financials and insurance companies. Merrill Lynch was a strong performer as it benefited from strong growth in the capital markets and brokerage areas of its business. While we continued to like the company, we thought the stock had become fairly valued and we eliminated it to lock in profits for shareholders. We also eliminated a couple holdings on weakness. Higher short-term interest rates and a weakening housing market led us to sell two regional bank holdings – Washington Mutual and BB&T Corp. The issues struggled with a good deal of share price volatility and we were not comfortable keeping them in the portfolio.
Which areas of the common equity portfolio hurt performance?
As mentioned previously, all of the Fund’s investment sectors posted gains. On a relative basis, however, there were a few sectors that underperformed.
Consumer discretionary, information technology and industrials.
While gaining ground, the portfolio’s consumer discretionary, information technology and industrial sectors underperformed their respective S&P 500 sector returns. In all three cases, however, the underperformance was primarily due to the portfolio’s underweight position in the sector, not due to poorly-performing securities. The one exception was the portfolio’s position in Home Depot, Inc., which we eliminated. The home improvement retailer lost ground as the housing market weakened and its competitors increased their market share. The underweight position in these sectors was deliberate as there are relatively few issues within these sectors that provide attractive dividend yields. Given our mandate for high yield, it does not make sense to hold a market-weight position in these sectors.
Energy. The portfolio’s energy sector provided strong relative gains in 2006. As crude oil prices climbed to historic levels, we trimmed the portfolio’s exposure to energy stocks. This was helpful as the sector lost some ground late in the period as crude oil prices retreated. There were two stocks that we purchased late in the period that detracted from performance. Patterson-UTI Energy and Grant Prideco, Inc. (0.5% and 0.4% of long-term investments, respectively) are oil and gas service companies that declined precipitously as a failing hedge fund sold large positions in the stocks to meet redemptions. While we purchased these securities on weakness, they lost additional ground after our investment. We believe that the fundamentals of both businesses remain favorable and that there is a great deal of upside potential for the securities. Patterson-UTI Energy also pays a dividend, so the portfolio will earn income as we wait to see improvement in the valuation of the security.
How did the portfolio’s high-yield bonds, preferred stocks and real estate investment trusts perform?
The Fund’s high-yield bonds, preferred stocks and REITs represented approximately 9.7% of total investments on December 31, 2006. Approximately 5.8% of that allocation was in high-yield bonds, while the remaining assets were invested in preferred stocks and REITs. The portfolio’s REITs and preferred securities provided attractive income and good capital appreciation. The high-yield bonds also provided attractive income and modest gains. As mentioned previously, the goal of owning these securities is to generate income that will pay for expenses incurred by the Fund. We focus our investments in the higher-quality segment of the high-yield market, where we believe the relative risks of default are lower. To help further reduce risk, we keep the portfolio diversified across industry sectors and individual securities.
What is your outlook for the equity and high-yield markets in 2007?
The equity market is likely to show continued strength in 2007, but returns may be less robust than in 2006. We expect to see economic growth strengthen due to a variety of factors – the historically low interest rate environment, lower oil prices and less concern about the impact of the housing market on the overall economy. Mild winter weather trends have supported the construction industry and related businesses, which may also help the economy. The market appears to be split on expectations for interest rates – many believe short-term rates will move lower while others expect a neutral interest rate environment in 2007. This uncertainty may lead to market volatility, which could be favorable for our equity income portfolio. We believe the portfolio is positioned well for the current environment and its
8 | Annual Report | December 31, 2006
TYW|TS&W/Claymore Tax-Advantaged Balanced Fund| Questions & Answers continued
diversification across sectors and securities, along with its above-market dividend yield, should enable it to provide favorable performance in a variety of markets. We will keep a close eye on market events and adjust the portfolio if necessary.
We expect high-yield bonds to perform reasonably well in 2007. While rates have continued to rise, they remain low on a historical basis. This low interest rate environment continues to attract income-oriented investors to the high-yield market. Strong corporate earnings and the market’s low default rate bode well for high-yield bonds. The Fund’s positioning in the more highly-rated bonds within the market should be helpful in terms of limiting portfolio risk and generating a stable stream of income to cover the expenses generated by the equity portfolio.
TYW Risks and Other Considerations
Under normal market conditions, the Fund will invest at least 50%, and may invest up to 60%, of its total assets in municipal securities. Additionally, the Fund will invest at least 40%, and may invest up to 50%, of its total assets in equity securities and other income securities. Under normal market conditions, the Fund will invest at least 25% of its total assets in equity securities. There can be no assurance that the Fund will achieve its investment objective. The value of the Fund will fluctuate with the value of the underlying securities. Historically, closed-end funds often trade at a discount to their net asset value. Additionally, any capital gains dividends will be subject to capital gains taxes.
The Investment Manager may, but is not required to, utilize a variety of strategic transactions to seek to protect the value of the Fund’s assets in the municipal securities portfolio against the volatility of interest rate changes and other market movements. There can be no guarantee that hedging strategies will be employed or will be successful. The premium paid for entering into such hedging strategies will result in a reduction in the net asset value of the Fund and a subsequent reduction of income to the Fund. Any income generated from hedging transactions will not be exempt from income taxes.
The Fund may seek to enhance the level of the Fund’s current income through the use of leverage. Certain risks are associated with the leveraging of common stock. Both the net asset value and the market value of shares of common stock may be subject to higher volatility and a decline in value. There is no assurance that the Fund will utilize leverage or, if leverage is utilized, that it will be successful in enhancing the level of the Fund’s current income.
There are also specific risks associated with investing in municipal bonds. The secondary market for Municipal Bonds is less liquid than many other securities markets, which may adversely affect the Fund’s ability to sell its bonds at prices approximating those at which the Fund currently values them. The ability of municipal issuers to make timely payments of interest and principal may be diminished during general economic downturns. In addition, laws enacted in the future by Congress or state legislatures or referenda could extend the time for payment of principal and/or interest. In the event of bankruptcy of an issuer, the Fund could experience delays in collecting principal and interest.
There also risks associated with investing in Auction Market Preferred Shares or AMPS. The AMPS are redeemable, in whole or in part, at the option of the Fund on any dividend payment date for the AMPS, and will be subject to mandatory redemption in certain circumstances. The AMPS will not be listed on an exchange. You may only buy or sell AMPS through an order placed at an auction with or through a broker-dealer that has entered into an agreement with the auction agent and the Fund or in a secondary market maintained by certain broker-dealers. These broker-dealers are not required to maintain this market, and it may not provide you with liquidity.
Fund Distribution Risk: In order to make regular quarterly distributions on its common shares, the fund may have to sell a portion of its investment portfolio at a time when independent investment judgment may not dictate such action. In addition, the Fund’s ability to make distributions more frequently than annually from any net realized capital gains by the Fund is subject to the Fund obtaining exemptive relief from the Securities and Exchange Commission, which cannot be assured. To the extent the total quarterly distributions for a year exceed the Fund’s net investment company income and net realized capital gain for that year, the excess will generally constitute a return of the Fund’s capital to its common shareholders. Such return of capital distributions generally are tax-free up to the amount of a common shareholder’s tax basis in the common shares (generally, the amount paid for the common shares). In addition, such excess distributions will decrease the Fund’s total assets and may increase the Fund’s expense ratio.
It is important to note that closed-end funds often trade at a discount to their market value.
Annual Report | December 31, 2006| 9
TYW | TS&W/Claymore Tax-Advantaged Balanced Fund
Fund Summary | As of December 31, 2006 (unaudited)
| | | | |
Fund Statistics | | | |
Share Price | | $ | 15.77 | |
Common Share Net Asset Value | | $ | 16.83 | |
Premium/(Discount) to NAV | | | -6.30 | % |
Net Asset Applicable to Common Shareholders ($ 000) | | $ | 259,334 | |
| | | | |
| | | | | | |
Total Returns | | | | | | |
(Inception 4/28/04) | | Market | | | NAV | |
Six Months | | 16.54 | % | | 9.92 | % |
One Year | | 25.98 | % | | 15.50 | % |
Since Inception - average annual | | 8.38 | % | | 12.31 | % |
| | | | | | |
| | | |
Top Ten Industries/Sectors | | % of Total Net
Investments | |
Health Care | | 16.6 | % |
General Funds | | 6.8 | % |
Special Tax | | 6.5 | % |
Oil, Gas & Consumable Fuels | | 5.6 | % |
Diversified Financial Services | | 5.5 | % |
Continuing Care Retirement Center | | 4.4 | % |
Diversified Telecommunication | | 4.4 | % |
General Obligations | | 3.8 | % |
Higher Education | | 3.7 | % |
Real Estate Investment Trusts | | 3.5 | % |
| | | |
| | | |
Top Ten Holdings Municipal Portfolio | | % of Total Net
Investments | |
Hudson Yards Infrastructure Corporation Revenue (NY), Fiscal 2007 Series A, FGIC Insured, Class A, NR, Aaa, 5.275%, 2/15/2047 | | 3.3 | % |
New York City (NY), Fiscal 2007 A, AA-, NR, 5.800%, 8/1/2028 | | 2.8 | % |
California State Department of Veteran Affairs Home Purchase Revenue, Subseries A-3-RMKT, AA-, Aa2, 4.500%, 12/1/2023 | | 2.7 | % |
Richardson Hospital Authority (TX), Hospital Refinance & Improvement, Richardson Regional, BBB, Baa2, 6.000%, 12/1/2034 | | 2.0 | % |
Camden County Improvement Authority (NJ), Cooper Health System, Series 2004 A, BBB, Baa3, 5.750%, 2/15/2034 | | 1.8 | % |
Missouri Development Finance Board (MO), Branson Landing Project, Series 2004 A, BBB+, Baa1, 5.625%, 12/1/2028 | | 1.7 | % |
Alhambra (CA), Certificates of Participation, Police Facilities 91-1-RMK, AMBAC Insured, AAA, Aaa, 6.750%, 9/1/2023 | | 1.6 | % |
Saint Johns County (FL), Industrial Development Authority, First Mortgage Revenue, Presbyterian Retirement, Series A, NR, NR, 5.625%, 8/1/2034 | | 1.5 | % |
New York City (NY) Industrial Developmental Agency Revenue, Rols-RR-II-R-634-1, AMBAC Insured, NR, Aaa, 6.010%, 1/1/2046 | | 1.5 | % |
California Statewide Communities Development Authority Revenue, Bentley School, NR, NR, 6.750%, 7/1/2032 | | 1.4 | % |
| | | |
Top Ten Holdings Equity and Income Portfolio | | % of Total Net
Investments | |
Citigroup, Inc. | | 1.6 | % |
Chevron Corp. | | 1.5 | % |
Bank of America Corp. | | 1.4 | % |
Verizon Communications, Inc. | | 1.3 | % |
General Electric Co. | | 1.3 | % |
AT&T, Inc. | | 1.2 | % |
Plum Creek Timber Co., Inc. | | 1.2 | % |
BP PLC ADR (United Kingdom) | | 1.2 | % |
Altria Group, Inc. | | 1.1 | % |
Nokia Corp. ADR (Finland) | | 1.1 | % |
| | | |
Securities and holdings are subject to change daily. For more current information, please visit www.claymore.com. The above summaries are provided for informational purposes only and should not be viewed as recommendations. Past performance does not guarantee future results.
Share Price & NAV Performance
Portfolio Concentration by Asset Class*
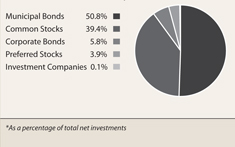
| * | As a percentage of total net investments |
Credit Quality*
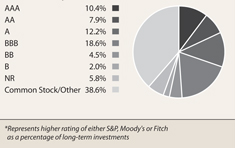
| * | Represents higher rating of either S&P, Moody’s or Fitch as a percentage of long-term investments |
10 | Annual Report | December 31, 2006
TYW | TS&W/Claymore Tax-Advantaged Balanced Fund
Portfolio of Investments | December 31, 2006
| | | | | | | | |
| Principal Amount | | Optional Call
Provisions | | Value |
| | | Long-Term Municipal Bonds – 76.7% | | | | | |
| | | Arizona – 3.1% | | | | | |
| | $3,300,000 | | Maricopa County Industrial Development Authority Health Facilities Revenue, Catholic HealthCare West-A, A, A2 (a) 5.375%, 7/1/2023 | | 7/1/14 @ 100 | | $ | 3,496,185 |
| | | |
| | 4,500,000 | | Maricopa County Pollution Control Corp., Pollution Control Revenue Refunding Public Service Co-A-RMK, BBB, Baa2 5.750%, 11/1/2022 | | 2/8/07 @ 101 | | | 4,551,210 |
| | | | | | | | |
| | | | | | | | 8,047,395 |
| | | | | | | | |
| | | |
| | | California – 17.1% | | | | | |
| | 5,000,000 | | Alhambra Certificates of Participation Police Facilities 91-1-RMK, AMBAC Insured, AAA, Aaa 6.750%, 9/1/2023 | | N/A | | | 6,159,400 |
| | | | | | | | |
| | | |
| | 1,600,000 | | California Municipal Financial Authority Education Revenue American Heritage Education Foundation, Project-A, BBB-, NR 5.250%, 6/1/2036 | | 6/1/16 @ 100 | | | 1,658,912 |
| | | |
| | 5,000,000 | | California Statewide Communities Development Authority Revenue Bentley School, NR, NR (a) 6.750%, 7/1/2032 | | 7/1/10 @ 103 | | | 5,431,400 |
| | | |
| | 2,220,000 | | California Statewide Communities Development Authority Revenue Sub-Wildwood Elementary School, NR, NR 7.000%, 11/1/2029 | | 11/1/09 @ 102 | | | 2,378,219 |
| | | |
| | 10,000,000 | | California State Department of Veterans Affairs Home Purchase Revenue Subseries A-3-RMKT, AA-, Aa2 4.500%, 12/1/2023 | | 11/30/11 @ 101 | | | 10,056,500 |
| | | |
| | 2,515,000 | | Lincoln Improvement Board Act 1915 Public Finance Authority-Twelve Bridges, NR, NR 6.200%, 9/2/2025 | | 9/2/09 @ 102 | | | 2,640,272 |
| | | |
| | | Murrieta Valley Unified School District, Special Tax Community Facilities District No. 2000-2, NR, NR | | | | | |
| | 1,625,000 | | 6.300%, 9/1/2024 | | 3/1/12 @ 101 | | | 1,816,848 |
| | 2,505,000 | | 6.375%, 9/1/2032 | | 3/1/12 @ 101 | | | 2,809,458 |
| | | |
| | 1,800,000 | | Palm Springs Community Redevelopment Agency Tax Allocation Refunding Merged Project No. 1, Series A, A-, NR 5.500%, 9/1/2034 | | 9/1/14 @ 100 | | | 1,903,248 |
| | | |
| | 4,000,000 | | Palm Springs Financing Authority Lease Revenue Convention Center Expansion Project, Series 2004 A, MBIA Insured, AAA, Aaa 5.500%, 11/1/2035 | | 11/1/14 @ 102 | | | 4,447,280 |
| | | |
| | 915,000 | | Poway Community Facilities District Number 10-Area-E, NR, NR 5.750%, 9/1/2032 | | 9/1/08 @ 102 | | | 943,429 |
| | | |
| | 1,350,000 | | Poway Unified School District, Special Tax Community Facilities District Number 6-Area-A, NR, NR 6.125%, 9/1/2033 | | 9/1/10 @ 102 | | | 1,415,624 |
| | | |
| | 820,000 | | Snowline California Joint Union School District Community Facility Special Tax, No. 2002-1, Series A, NR, NR 5.400%, 9/1/2034 | | 3/1/07 @ 103 | | | 841,156 |
| | | |
| | 1,870,000 | | William S. Hart Joint School Financing Authority CFD’s No’s 90-1, 99-1 & 2000-1 Series 2004, BBB+, NR 5.625%, 9/1/2034 | | 9/1/12 @ 100 | | | 1,961,480 |
| | | | | | | | |
| | | | | | | | 44,463,226 |
| | | | | | | | |
| | | |
| | | Colorado – 1.8% | | | | | |
| $ | 1,355,000 | | Denver Health & Hospital Authority Health Care Revenue Series 1998 A, ACA Insured, A, NR 5.375%, 12/1/2028 | | 12/1/08 @ 101 | | $ | 1,391,558 |
| | | |
| | | Denver Health & Hospital Authority Health Care Revenue Series 2004 A, BBB, Baa3 | | | | | |
| | 1,000,000 | | 6.000%, 12/1/2031 | | 12/1/11 @ 100 | | | 1,068,210 |
| | 2,000,000 | | 6.250%, 12/1/2033 | | 12/1/14 @ 100 | | | 2,238,060 |
| | | | | | | | |
| | | | | | | | 4,697,828 |
| | | | | | | | |
| | | |
| | | Delaware – 0.2% | | | | | |
| | 500,000 | | Delaware Health Facilities Authority Beebe Medical Center Project, Series 2004 A, BBB+, Baa1 5.500%, 6/1/2024 | | 6/1/14 @ 100 | | | 535,465 |
| | | |
| | | Florida – 2.6% | | | | | |
| | 5,450,000 | | Saint Johns County Industrial Development Authority First Mortgage Revenue Presbyterian Retirement, Series A, NR, NR 5.625%, 8/1/2034 | | 8/1/14 @ 101 | | | 5,726,751 |
| | | |
| | 1,000,000 | | Saint Johns County Florida Industrial Development Authority Health Care Glenmoor Project, Series 2006A, NR, NR 5.250% 1/1/2026 | | 1/1/16 @ 100 | | | 1,017,220 |
| | | | | | | | |
| | | | | | | | 6,743,971 |
| | | | | | | | |
| | | |
| | | Illinois – 0.8% | | | | | |
| | 2,000,000 | | Metropolitan Pier and Exposition Authority McCormick Place Expansion Project, Series 2004 A, AAA, A1 5.500%, 6/15/2027 | | 2/8/07 @ 100 | | | 2,001,600 |
| | | | | | | | |
| | | |
| | | Indiana – 0.4% | | | | | |
| | 1,000,000 | | Vanderburgh County (Indiana) Redevelopment District, Tax Increment, A-, NR 5.250%, 2/1/2031 | | 8/1/16 @ 100 | | | 1,057,050 |
| | | | | | | | |
| | | |
| | | Iowa – 0.7% | | | | | |
| | 1,650,000 | | Scott County, Iowa Revenue Refunding-Ridgecrest Village, Series 2006, NR, NR 5.250%, 11/15/2027 | | 11/15/16 @ 100 | | | 1,705,143 |
| | | | | | | | |
| | | |
| | | Kansas – 1.0% | | | | | |
| | | Burlington Pollution Control Revenue Kansas Gas and Electric Co. Project, Series 2004 A, MBIA Insured, AAA, Aaa 5.300%, 6/1/2031 | | 6/1/14 @ 100 | | | 2,685,250 |
| | | | | | | | |
| | | |
| | | Massachusetts – 1.7% | | | | | |
| | | Massachusetts Development Finance Agency Revenue Evergreen Center, BBB-, NR | | | | | |
| | 1,505,000 | | 5.500%, 1/1/2020 | | 1/1/15@ 100 | | | 1,565,215 |
| | 1,820,000 | | 5.500%, 1/1/2035 | | 1/1/15@ 100 | | | 1,872,179 |
| | | |
| | 930,000 | | Massachusetts Development Finance Agency Revenue Hampshire College, Series 2004, BBB, Baa2 5.625%, 10/1/2024 | | 10/1/14 @ 100 | | | 998,420 |
| | | | | | | | |
| | | | | | | | 4,435,814 |
| | | | | | | | |
| | | |
| | | Michigan – 1.2% | | | | | |
| | 3,065,000 | | Monroe County Michigan Hospital Finance Authority Hospital Revenue Refunding Mercy Memorial Hospital Corporate Obligation, BBB-, Baa3 5.500%, 6/1/2035 | | 6/1/16 @ 100 | | | 3,238,571 |
| | | | | | | | |
See notes to financial statements.
Annual Report | December 31, 2006|11
TYW|TS&W/Claymore Tax-Advantaged Balanced Fund
| | | | | | | | |
| Principal Amount | | Optional Call
Provisions | | Value |
| | | Minnesota – 2.8% | | | | | |
| | $ 3,650,000 | | Duluth Economic Development Authority Benedictine Health System, O.G., Saint Mary’s Duluth Clinic Health System, Series 2004, A-, NR 5.250%, 2/15/2028 | | 2/15/14 @ 100 | | $ | 3,837,866 |
| | | |
| | 3,000,000 | | Saint Paul Minnesota Housing & Redevelopment Authority Hospital Revenue HealthEast Project, BB+, Baa3 6.000%, 11/15/2035 | | 11/15/15 @ 100 | | | 3,301,050 |
| | | | | | | | |
| | | |
| | | | | | | | 7,138,916 |
| | | | | | | | |
| | | |
| | | Missouri – 5.6% | | | | | |
| | 4,690,000 | | Cole County Industrial Development Authority Senior Living Facilities Revenue Lutheran Senior Services Heisinger Project, NR, NR (a) 5.500%, 2/1/2035 | | 2/1/14 @ 100 | | | 4,954,000 |
| | | |
| | 6,000,000 | | Missouri Development Finance Board Branson Landing Project, Series 2004 A, BBB+, Baa1 (a) 5.625%, 12/1/2028 | | 6/1/14 @ 100 | | | 6,421,680 |
| | | |
| | 3,000,000 | | Missouri State Health & Educational Facilities Authority Revenue Senior Living Facilities Revenue Lutheran Senior, Series A, NR, NR (a) 5.375%, 2/1/2035 | | 2/1/15 @ 100 | | | 3,141,810 |
| | | | | | | | |
| | | | | | | | 14,517,490 |
| | | | | | | | |
| | | |
| | | New Jersey – 10.0% | | | | | |
| | 5,000,000 | | Brick Township Municipal Utilities Authority Series 2006, AMBAC Insured, NR, Aaa 4.125%, 12/1/2027 | | 12/1/16 @ 100 | | | 4,817,050 |
| | | |
| | 6,400,000 | | Camden County Improvement Authority Cooper Health System, Series 2004 A, BBB, Baa3 5.750%, 2/15/2034 | | 8/15/14 @ 100 | | | 6,898,048 |
| | | |
| | | New Jersey Economic Development Authority Revenue | | | | | |
| | | |
| | | Cigarette Tax, BBB, Baa2 | | | | | |
| | 1,850,000 | | 5.750%, 6/15/2029 | | 6/15/14 @ 100 | | | 2,001,608 |
| | 1,000,000 | | 5.500%, 6/15/2031 | | 6/15/14 @ 100 | | | 1,059,710 |
| | 5,000,000 | | 5.750%, 6/15/2034 | | 6/15/14 @ 100 | | | 5,376,900 |
| | | |
| | 2,000,000 | | New Jersey Educational Facilities Authority Fairleigh Dickinson University, Series 2002 D, NR, NR 6.000%, 7/1/2025 | | 7/1/13 @ 100 | | | 2,179,320 |
| | | |
| | 1,450,000 | | New Jersey Educational Facilities Authority Stevens Institute of Technology, Series 2004 B, BBB+, Baa2 5.375%, 7/1/2034 | | 7/1/14 @ 100 | | | 1,530,055 |
| | | |
| | 2,000,000 | | New Jersey Health Care Facilities Financing Authority Revenue Saint Elizabeth Hospital Obligated Group, BBB-, Baa3 6.000%, 7/1/2020 | | 7/1/07 @ 102 | | | 2,056,780 |
| | | | | | | | |
| | | | | | | | 25,919,471 |
| | | | | | | | |
| | | |
| | | New York – 14.1% | | | | | |
| | 11,750,000 | | Hudson Yards Infrastructure Corporation Revenue Fiscal 2007 Series A, FGIC Insured, Class A, NR, Aaa (b) 5.275%, 2/15/2047 | | 2/15/17 @ 100 | | | 12,497,417 |
| | | |
| | 1,625,000 | | Municipal Security Trust Hudson Yards Infrastructure Corporation Revenue Series 7033, FGIC Insured, Class A, NR, Aaa (c) 5.275%, 2/15/2047 | | 2/15/17 @ 100 | | | 1,831,733 |
| | | |
| | 5,000,000 | | New York City Industrial Developmental Agency Revenue Rols-RR-II-R-634-1, AMBAC Insured, NR, Aaa (c) 6.010%, 1/1/2046 | | 1/1/17 @ 100 | | | 5,606,900 |
| | | |
| $ | 10,000,000 | | New York City Fiscal 2007 A, AA-, NR (b) 5.800%, 8/1/2028 | | 8/1/16 @ 100 | | $ | 10,577,200 |
| | | |
| | 4,500,000 | | New York State Dorm Authority Revenue Cabrini of Westchester, GNMA Collateral, AA, NR (b) 5.200%, 2/15/2041 | | 2/15/17 @ 103 | | | 4,910,400 |
| | | |
| | 1,000,000 | | New York State Dorm Authority Revenue New York University Hospitals Center, Series A, BB, Ba2 5.000%, 7/1/2026 | | 7/1/16 @ 100 | | | 1,025,100 |
| | | | | | | | |
| | | | | | | | 36,448,750 |
| | | | | | | | |
| | | |
| | | Ohio – 1.9% | | | | | |
| | 4,560,000 | | Akron Bath Copley Joint Township Hospital District Revenue Hospital Facilities-Summa Health Systems, Series A, RADIAN Insured, AA, Aa3 (a) 5.500%, 11/15/2034 | | | | | |
| | | | | 11/15/14 @ 100 | | | 4,960,277 |
| | | | | | | | |
| | | |
| | | Pennsylvania – 1.5% | | | | | |
| | 3,750,000 | | Pennsylvania Higher Educational Facilities Authority Widener University Series 2003, BBB+, NR 5.375%, 7/15/2029 | | 7/15/13 @ 100 | | | 3,969,000 |
| | | | | | | | |
| | | |
| | | Rhode Island – 2.8% | | | | | |
| | 3,000,000 | | Rhode Island State Health & Educational Building Corporation Revenue Hospital Financing Lifespan Obligated Group, A-, A3 6.500%, 8/15/2032 | | 8/15/12 @ 100 | | | 3,418,170 |
| | | |
| | 3,000,000 | | Rhode Island State Health & Educational Building Corporation Revenue Prerefunded Hospital Financing Lifespan, A-, A3 6.375%, 8/15/2021 | | 8/15/12 @ 100 | | | 3,402,570 |
| | | |
| | 500,000 | | Rhode Island State Health & Educational Building Corporation Revenue Unrefunded Hospital Financing Lifespan, A-, A3 6.375%, 8/15/2021 | | 8/15/12 @ 100 | | | 550,555 |
| | | | | | | | |
| | | | | | | | 7,371,295 |
| | | | | | | | |
| | | |
| | | South Carolina – 2.6% | | | | | |
| | | Lexington County Health Services District, Inc., Hospital Revenue | | | | | |
| | | Lexington Medical Center, Series 2004, A, A2 | | | | | |
| | 1,430,000 | | 5.500%, 5/1/2032 | | 5/1/14 @ 100 | | | 1,521,205 |
| | 5,000,000 | | 5.500%, 5/1/2037 (a) | | 5/1/14 @ 100 | | | 5,312,450 |
| | | | | | | | |
| | | | | | | | 6,833,655 |
| | | | | | | | |
| | | |
| | | Texas – 2.9% | | | | | |
| | 6,780,000 | | Richardson Hospital Authority Hospital Refinance & Improvement Richardson Regional, BBB, Baa2 (a) 6.000%, 12/1/2034 | | 12/1/13 @ 100 | | | 7,400,370 |
| | | | | | | | |
| | | |
| | | Wisconsin – 1.9% | | | | | |
| | 3,350,000 | | Wisconsin State Health & Educational Facilities Authority Revenue Aurora Health Care, Series A, BBB+, NR 5.600%, 2/15/2029 | | 2/15/09 @ 101 | | | 3,472,777 |
| | | |
| | | Wisconsin State Health & Educational Facilities Authority Revenue | | | | | |
| | | Blood Center Southeastern Project, BBB+, NR | | | | | |
| | 500,000 | | 5.500%, 6/1/2024 | | 6/1/14 @ 100 | | | 533,835 |
| | 750,000 | | 5.750%, 6/1/2034 | | 6/1/14 @ 100 | | | 815,767 |
| | | | | | | | |
| | | | | | | | 4,822,379 |
| | | | | | | | |
| | | |
| | | Total Long-Term Municipal Bonds - 76.7% | | | | | |
| | | (Cost $ 189,823,332) | | | | | 198,992,916 |
| | | | | | | | |
See notes to financial statements.
12 | Annual Report | December 31, 2006
TYW|TS&W/Claymore Tax-Advantaged Balanced Fund|Portfolio of Investments continued
| | | | | | |
Number
of Shares | | | | Value |
| | | Common Stocks – 57.3% | | | |
| | |
| | | Beverages – 1.0% | | | |
| | 35,000 | | Molson Coors Brewing Co. - Class B | | $ | 2,675,400 |
| | | | | | |
| | |
| | | Chemicals – 1.3% | | | |
| | 82,500 | | Dow Chemical Co. | | | 3,295,050 |
| | | | | | |
| | |
| | | Commercial Banks – 4.4% | | | |
| | 20,000 | | Australia and New Zealand Banking Group Ltd. ADR (Australia) | | | 2,231,200 |
| | 42,500 | | HSBC Holdings PLC ADR (United Kingdom) | | | 3,895,125 |
| | 50,000 | | Wachovia Corp. | | | 2,847,500 |
| | 70,000 | | Wells Fargo & Co. | | | 2,489,200 |
| | | | | | |
| | | | | | 11,463,025 |
| | | | | | |
| | |
| | | Commercial Services & Supplies – 1.8% | | | |
| | 50,000 | | Avery Dennison Corp. | | | 3,396,500 |
| | 35,000 | | R. R. Donnelley & Sons Co. | | | 1,243,900 |
| | | | | | |
| | | | | | 4,640,400 |
| | | | | | |
| | |
| | | Communications Equipment – 2.4% | | | |
| | 210,000 | | Nokia Corp. ADR (Finland) | | | 4,267,200 |
| | 50,000 | | Telefonaktiebolaget LM Ericsson ADR (Sweden) | | | 2,011,500 |
| | | | | | |
| | | | | | 6,278,700 |
| | | | | | |
| | |
| | | Computers & Peripherals – 0.9% | | | |
| | 90,000 | | Seagate Technology (Cayman Islands) | | | 2,385,000 |
| | | | | | |
| | |
| | | Diversified Financial Services – 7.0% | | | |
| | 100,000 | | Bank of America Corp. | | | 5,339,000 |
| | 105,000 | | Citigroup, Inc. | | | 5,848,500 |
| | 85,000 | | ING Groep N.V. ADR (Netherlands) | | | 3,754,450 |
| | 65,000 | | JPMorgan Chase & Co. | | | 3,139,500 |
| | | | | | |
| | | | | | 18,081,450 |
| | | | | | |
| | |
| | | Diversified Telecommunication – 6.4% | | | |
| | 125,000 | | AT&T, Inc. | | | 4,468,750 |
| | 56,300 | | BT Group PLC ADR (United Kingdom) | | | 3,371,807 |
| | 200,000 | | Deutsche Telekom AG ADR (Germany) | | | 3,640,000 |
| | 135,000 | | Verizon Communications, Inc. | | | 5,027,400 |
| | | | | | |
| | | | | | 16,507,957 |
| | | | | | |
| | |
| | | Electric Utilities – 2.3% | | | |
| | 25,000 | | FirstEnergy Corp. | | | 1,507,500 |
| | 70,000 | | PPL Corp. | | | 2,508,800 |
| | 40,000 | | Progress Energy, Inc. | | | 1,963,200 |
| | | | | | |
| | | | | | 5,979,500 |
| | | | | | |
| | |
| | | Energy Equipment & Services – 1.3% | | | |
| | 40,000 | | Grant Prideco, Inc. (d) | | | 1,590,800 |
| | 80,000 | | Patterson-UTI Energy, Inc. | | | 1,858,400 |
| | | | | | |
| | | | | | 3,449,200 |
| | | | | | |
| | |
| | | Food Products – 1.2% | | | |
| | 35,000 | | Nestle SA ADR (Switzerland) | | | 3,103,751 |
| | | | | | |
| | |
| | | Household Products – 1.6% | | | |
| $ | 60,000 | | Kimberly-Clark Corp. | | $ | 4,077,000 |
| | | | | | |
| | |
| | | Industrial Conglomerates – 1.9% | | | |
| | 135,000 | | General Electric Co. | | | 5,023,350 |
| | | | | | |
| | |
| | | Insurance – 3.4% | | | |
| | 45,000 | | American International Group, Inc. | | | 3,224,700 |
| | 50,000 | | Genworth Financial, Inc., Class A | | | 1,710,500 |
| | 27,500 | | PartnerRe Ltd. (Bermuda) | | | 1,953,325 |
| | 35,000 | | St. Paul Travelers Cos., Inc. (The) | | | 1,879,150 |
| | | | | | |
| | | | | | 8,767,675 |
| | | | | | |
| | |
| | | Media – 1.1% | | | |
| | 6,750 | | Idearc, Inc. (d) | | | 193,387 |
| | 125,000 | | Regal Entertainment Group, Class A | | | 2,665,000 |
| | | | | | |
| | | | | | 2,858,387 |
| | | | | | |
| | |
| | | Metals & Mining – 0.5% | | | |
| | 25,000 | | Freeport-McMoran Copper, Class B | | | 1,393,250 |
| | | | | | |
| | |
| | | Multi-Utilities – 2.1% | | | |
| | 28,000 | | Dominion Resources, Inc. | | | 2,347,520 |
| | 175,000 | | TECO Energy, Inc. | | | 3,015,250 |
| | | | | | |
| | | | | | 5,362,770 |
| | | | | | |
| | |
| | | Oil, Gas & Consumable Fuels – 7.6% | | | |
| | 65,000 | | BP PLC ADR (United Kingdom) | | | 4,361,500 |
| | 75,000 | | Chevron Corp. | | | 5,514,750 |
| | 35,000 | | ConocoPhillips | | | 2,518,250 |
| | 51,719 | | Royal Dutch Shell PLC, Class B ADR (United Kingdom) | | | 3,679,807 |
| | 50,000 | | Total SA ADR (France) | | | 3,596,000 |
| | | | | | |
| | | | | | 19,670,307 |
| | | | | | |
| | |
| | | Pharmaceuticals – 5.0% | | | |
| | 80,000 | | Abbott Laboratories | | | 3,896,800 |
| | 75,000 | | Bristol-Myers Squibb Co. | | | 1,974,000 |
| | 60,000 | | GlaxoSmithKline PLC ADR (United Kingdom) | | | 3,165,600 |
| | 150,000 | | Pfizer, Inc. | | | 3,885,000 |
| | | | | | |
| | | | | | 12,921,400 |
| | | | | | |
| | |
| | | Real Estate Investment Trusts – 1.7% | | | |
| | 110,000 | | Plum Creek Timber Co., Inc. | | | 4,383,500 |
| | | | | | |
| | |
| | | Software – 0.7% | | | |
| | 75,000 | | Sybase, Inc. (d) | | | 1,852,500 |
| | | | | | |
| | |
| | | Tobacco – 1.7% | | | |
| | 50,000 | | Altria Group, Inc. | | | 4,291,000 |
| | | | | | |
| | |
| | | Total Common Stocks - 57.3% | | | |
| | | (Cost $ 126,282,672) | | | 148,460,572 |
| | | | | | |
See notes to financial statements.
Annual Report | December 31, 2006|13
TYW | TS&W/Claymore Tax-Advantaged Balanced Fund | Portfolio of Investments continued
| | | | | | | |
Principal Amount | | Optional Call Provisions | | Value |
| | Corporate Bonds – 8.5% | | | | | |
| | | |
| | Aerospace/Defense – 0.4% | | | | $ | 1,000,000 |
$1,000,000 | | DRS Technologies, Inc., B, B3 6.875%, 11/1/2013 | | 11/1/08 @ 103.44 | | $ | 1,007,500 |
| | | |
| | Apparel – 0.4% | | | | | |
1,000,000 | | Phillips-Van Heusen Corp., BB, Ba3 7.250%, 2/15/2011 | | 2/15/08 @ 103.63 | | | 1,020,000 |
| | | |
| | Auto Manufacturers – 0.4% | | | | | |
1,000,000 | | Navistar International, NR, NR 7.500%, 6/15/2011 | | 6/15/08 @ 103.75 | | | 995,000 |
| | | |
| | Commercial Banks – 0.1% | | | | | |
100,000 | | FCB/NC Capital Trust I, BB+, Baa2 8.050%, 3/1/2028 | | 3/1/08 @ 104.03 | | | 105,140 |
| | | |
| | Computers – 0.2% | | | | | |
575,000 | | Seagate Technology HDD H (Cayman Islands), BB+, Ba1 6.375%, 10/1/2011 | | N/A | | | 575,000 |
| | | |
| | Diversified Financial Services – 0.4% | | | | | |
1,000,000 | | General Motors Acceptance Corp., BB+, Ba1 6.875%, 9/15/2011 | | N/A | | | 1,025,698 |
| | | |
| | Electric – 0.2% | | | | | |
500,000 | | Reliant Energy, Inc., B, B2 9.500%, 7/15/2013 | | 7/15/08 @ 104.75 | | | 536,250 |
| | | |
| | Electronics – 0.2% | | | | | |
700,000 | | IMAX Corp. (Canada), B-, Caa1 9.625%, 12/1/2010 | | 12/1/07 @ 104.81 | | | 597,625 |
| | | |
| | Food – 1.1% | | | | | |
2,465,000 | | Dean Foods Co., BB-, Ba2 7.000%, 6/1/2016 | | N/A | | | 2,489,650 |
235,000 | | Smithfield Foods, Inc., BB, Ba3 7.000%, 8/1/2011 | | N/A | | | 237,350 |
| | | | | | | 2,727,000 |
| | | |
| | Forest Products & Paper – 0.1% | | | | | |
400,000 | | Boise Cascade LLC, B+, B2 7.125%, 10/15/2014 | | 10/15/09 @ 103.56 | | | 387,000 |
| | | |
| | Health Care – 0.3% | | | | | |
640,000 | | Davita, Inc., B, B3 7.250%, 3/15/2015 | | 3/15/10 @ 103.63 | | | 652,800 |
| | | |
| | Home Builders – 0.3% | | | | | |
1,000,000 | | K. Hovnanian Enterprises, BB, Ba1 6.500%, 1/15/2014 | | N/A | | | 970,000 |
| | | |
| | Home Furnishings – 0.4% | | | | | |
1,000,000 | | Sealy Mattress Co., B, B2 8.250%, 6/15/2014 | | 6/15/09 @ 104.13 | | | 1,045,000 |
| | | |
| | Insurance – 1.0% | | | | | |
$ 1,000,000 | | Markel Capital Trust I, NR, Ba1 8.710%, 1/1/2046 | | N/A | | $ | 1,044,800 |
500,000 | | Odyssey RE Holdings, BBB-,Baa3 7.650%, 11/1/2013 | | N/A | | | 530,184 |
| | | | | | | |
1,000,000 | | Presidential Life Corp., B-, B2 7.875%, 2/15/2009 | | N/A | | | 955,000 |
| | | | | | | 2,529,984 |
| | | |
| | Iron/Steel – 0.4% | | | | | |
1,125,000 | | AK Steel Corp., B+, B2 7.875%, 2/15/2009 | | 2/8/07 @ 101.31 | | | 1,125,000 |
| | | |
| | Office/Business Equipment – 0.4% | | | | | |
1,000,000 | | Xerox Capital Trust I, B+, Ba1 8.000%, 2/1/2027 | | 2/8/07 @ 102.45 | | | 1,021,250 |
| | | |
| | Oil & Gas – 0.6% | | | | | |
500,000 | | Chesapeake Energy Corp., BB, Ba2 6.500%, 8/15/2017 | | N/A | | | 488,750 |
1,000,000 | | Giant Industries, Inc., B-, B2 8.000%, 5/15/2014 | | 5/15/09 @ 104.00 | | | 1,081,250 |
| | | | | | | 1,570,000 |
| | | |
| | Real Estate Investment Trusts – 0.4% | | | | | |
750,000 | | Saxon Capital, Inc., NR, NR (e) 12.000%, 5/1/2014 | | N/A | | | 1,071,697 |
| | | |
| | Retail – 0.5% | | | | | |
700,000 | | Dillards, Inc., BB, B2 7.130%, 8/1/2018 | | N/A | | | 694,750 |
475,000 | | Pantry, Inc. (The), B, B3 7.750%, 2/15/2014 | | 2/15/09 @ 103.88 | | | 477,969 |
| | | | | | | 1,172,719 |
| | | |
| | Semiconductors – 0.1% | | | | | |
345,000 | | Advanced Micro Devices, Inc., B+, Ba3 7.750%, 11/1/2012 | | 11/1/08 @ 103.88 | | | 357,938 |
| | | | | | | |
| | | |
| | Telecommunications – 0.2% | | | | | |
500,000 | | American Cellular Corp., CCC, B3 10.000%, 8/1/2011 | | 8/1/07 @ 105.00 | | | 528,750 |
| | | |
| | Transportation – 0.4% | | | | | |
850,000 | | Overseas Ship Holding Group, BB+, Ba1 8.750%, 12/1/2013 | | N/A | | | 918,000 |
| | | |
| | Total Corporate Bonds - 8.5% | | | | | |
| | (Cost $ 21,464,464) | | | | | 21,939,351 |
14 | Annual Report | December 31, 2006
TYW | TS&W/Claymore Tax-Advantaged Balanced Fund | Portfolio of Investments continued
| | | | | |
Number of Shares | | Value |
| | Preferred Stocks – 5.7% | | | |
| | |
| | Capital Markets – 0.5% | | | |
| 50,000 | | Merrill Lynch, 6.375%, A, A2 | | $ | 1,304,000 |
| | | | | |
| | |
| | Diversified Financial Services – 0.6% | | | |
| 60,000 | | ABN Amro Capital Trust VII, 6.080%, A, A2 | | | 1,500,000 |
| | | | | |
| | |
| | Insurance – 1.3% | | | |
| 50,000 | | Aegon NV (Netherlands), 6.500%, A-, A3 | | | 1,289,500 |
| 25,000 | | Aspen Insurance Holdings, Ltd. (Bermuda), 7.401%, BBB-, Ba1 | | | 640,000 |
| 50,000 | | Metlife, Inc., 6.500%, BBB, Baa1 | | | 1,315,500 |
| | | | | |
| | | | | 3,245,000 |
| | | | | |
| | Media – 0.2% | | | |
| 20,000 | | Comcast Corp., 7.000%, BBB+, Baa2 | | | 516,600 |
| | | | | |
| | |
| | Pipelines – 0.1% | | | |
| 15,000 | | Dominion Consolidated Natural Gas Capital Trust I, 7.800%, BB+, Baa2 | | | 380,400 |
| | | | | |
| | |
| | Real Estate Investment Trusts – 3.0% | | | |
| 20,000 | | Apartment Investment & Management Co., 7.750%, B+, Ba3 | | | 505,626 |
| 20,000 | | Brandywine Realty Trust, Series C, 7.500%, NR, NR | | | 507,600 |
| 11,000 | | Capital Automotive REIT, Series A, 7.500%, NR, B1 | | | 247,500 |
| 20,000 | | CBL & Associates Properties, Series C, 7.750%, NR, NR | | | 513,200 |
| 25,000 | | CBL & Associates Properties, Series D, 7.375%, NR, NR | | | 640,000 |
| 20,000 | | Developers Diversified Realty, 8.600%, BBB-, Baa3 | | | 507,800 |
| 25,000 | | First Industrial Realty Trust, 7.250%, BBB-, Baa3 | | | 640,250 |
| 20,000 | | Health Care REIT, Inc., Series D, 7.875%, BB+, Ba1 | | | 518,000 |
| 20,000 | | iStar Financial, Inc., Series I, 7.500%, BB+, Ba1 | | | 508,750 |
| 29,400 | | Mills Corp. (The), Series G, 7.875%, NR, NR | | | 645,330 |
| 12,000 | | PS Business Parks, Inc., 7.000%, BBB-, Baa3 | | | 305,400 |
| 20,000 | | Realty Income Corp., Series D, 7.375%, BBB-, Baa3 | | | 520,000 |
| 18,500 | | Regency Centers Corp., 7.250%, BBB-, Baa3 | | | 472,675 |
| 25,000 | | Taubman Centers, Inc., 8.000%, NR, B1 | | | 657,500 |
| 25,000 | | Vornado Realty Trust, Series E, 7.000%, BBB-, Baa3 | | | 643,875 |
| | | | | |
| | | | | 7,833,506 |
| | | | | |
| | |
| | Total Preferred Stocks | | | |
| | (Cost $14,571,358) | | | 14,779,506 |
| | | | | |
| | |
| | Investment Companies – 0.1% | | | |
| 7,000 | | DWS RREEF Real Estate Fund II (Cost $96,569) | | | 135,240 |
| | | | | |
| | | | | |
| | |
| | Total Long-Term Investments – 148.3% | | | |
| | (Cost $352,238,395) | | | 384,307,585 |
| | | | | |
| | | | | | | | | | |
| Principal Amount | | Optional Call
Provisions | | Value | |
| | | | Short-Term Investments – 2.1% | | | | | | |
| $ | 270,000 | | | New York City, Fiscal 2004 Subseries H-1, AA-, Aa2 (f) 3.900%, 3/1/2034 | | 1/10/07 | | $ | 270,000 | |
| | | |
| | 1,700,000 | | | New York City Transitional Finance Authority, Fiscal 2003 Subseries C2, AAA, Aa1 (f) 3.980%, 8/1/2031 | | N/A | | | 1,700,000 | |
| | | |
| | 3,500,000 | | | Sevier County, Tennessee Public Building Authority Series 6-A1, AA, Aa2 (f) 4.000%, 6/1/2029 | | 1/9/07 | | | 3,500,000 | |
| | | | | | | | | | |
| | | |
| | | | Total Short-Term Investments | | | | | | |
| | | | (Cost $5,470,000) | | | | | 5,470,000 | |
| | | | | | | | | | |
| | | |
| | | | Total Investments - 150.4% | | | | | | |
| | | | (Cost $357,708,395) | | | | | 389,777,585 | |
| | | | | | | | | | |
| | | |
| | | | Floating Rate Note Obligations (5.1%) | | | | | | |
| | (13,125 | ) | | Notes with interest rates ranging from 3.910% to 3.980% at December 31, 2006 and contractual maturities of collateral ranging from 2041 to 2047. See Note 2(f) in the “Notes to the Financial Statements” section in this report. (Cost ($13,125,000)) | | | | | (13,125,000 | ) |
| | | | | | | | | | |
| | | |
| | | | Total Net Investments – 145.3% | | | | | | |
| | | | (Cost $344,583,395) | | | | | 376,652,585 | |
| | | | Other Assets in excess of Liabilities – 1.0% | | | | | 2,681,327 | |
| | | | Preferred Shares, at Liquidation Value - (-46.3% of Net Assets | | | | | | |
| | | | Applicable to Common Shareholders or -31.9% of Total Net Investments) | | | | | (120,000,000 | ) |
| | | | | | | | | | |
| | | | Net Assets Applicable to Common Shareholders – 100.0% | | | | $ | 259,333,912 | |
| | | | | | | | | | |
| ACA | ACA Financial Guaranty Corporation |
| ADR | American Depositary Receipt |
| AMBAC | Ambac Assurance Corporation |
| FGIC | Financial Guaranty Insurance Company |
| GNMA | Government National Mortgage Association |
| LLC | Limited Liability Corporation |
| MBIA | MBIA Insurance Corporation |
| PLC | Public Limited Company |
| RADIAN | Radian Asset Assurance, Inc |
| REIT | Real Estate Investment Trust |
| (a) | All or a portion of these securities have been physically segregated in connection with swap agreements. |
| (b) | Underlying security related to inverse floating rate investments entered into by the Fund. See Note 2(f) in the “Notes to the Financial Statements” section of this report. |
| (c) | Inverse floating rate investment. Interest rate shown is that in effect at December 31, 2006. See Note 2(f) in the “Notes to the Financial Statements” section of this report. |
| (d) | Non-income producing security. |
| (e) | Securities are exempt from registration under Rule 144A of the Securities Act of 1933. These securities may only be resold in transactions exempt from registration, normally to qualified institutional buyers. At December 31, 2006, these securities amounted to $1,071,697 or 0.4% of Net Assets Applicable to Common Shareholders. |
| (f) | Security has a maturity of more than one year, but has variable rate and demand features which qualify it as a short-term security. The rate shown is as of December 31, 2006. |
Ratings shown are per Standard & Poor’s and Moody’s. Securities classified as NR are not rated.
All percentages shown in the Portfolio of Investments are based on Net Assets Applicable to Common Shareholders unless otherwise noted.
See notes to financial statements.
Annual Report | December 31, 2006 | 15
TYW|TS&W/Claymore Tax-Advantaged Balanced Fund
Statement of Assets and Liabilities|December 31, 2006
| | | |
Assets | | | |
Investments in securities, at value (cost $ 357,708,395) | | $ | 389,777,585 |
Cash | | | 36,345 |
Interest receivable | | | 2,995,044 |
Dividends receivable | | | 328,773 |
Other assets | | | 3,506 |
Total assets | | | 393,141,253 |
| |
Liabilities | | | |
Floating rate note obligations | | | 13,125,000 |
Advisory fee payable | | | 225,032 |
Unrealized depreciation on swap transactions | | | 182,414 |
Dividend payable - preferred shares | | | 145,782 |
Administration fee payable | | | 15,488 |
Accrued expenses and other liabilities | | | 113,625 |
Total liabilities | | | 13,807,341 |
| |
Preferred Shares, at Redemption Value | | | |
$.01 par value per share; 4,800 Auction Market Preferred Shares authorized, issued and outstanding at $25,000 per share liquidation preference | | | 120,000,000 |
| |
Net Assets Applicable to Common Shareholders | | $ | 259,333,912 |
| |
Composition of Net Assets Applicable to Common Shareholders | | | |
Common stock, $.01 par value per share; unlimited number of shares authorized, | | | |
15,407,000 shares issued and outstanding | | $ | 154,070 |
Additional paid-in capital | | | 218,557,393 |
Accumulated net unrealized appreciation on investments and swaps | | | 31,886,776 |
Accumulated undistributed net investment income | | | 7,769,994 |
Accumulated net realized gain on investments and swaps | | | 965,679 |
| |
Net Assets Applicable to Common Shareholders | | $ | 259,333,912 |
| |
Net Asset Value Applicable to Common Shareholders (based on 15,407,000 common shares outstanding) | | $ | 16.83 |
16 | Annual Report | December 31, 2006
TYW | TS&W/Claymore Tax-Advantaged Balanced Fund
Statement of Operations | For the year ended December 31, 2006
| | | | | | | |
Investment Income | | | | | | | |
Interest | | $ | 11,598,745 | | | | |
Dividends (net of foreign withholding taxes of $ 62,331) | | | 6,189,188 | | | | |
| | | | | | | |
Total income | | | | | $ | 17,787,933 | |
| | | | | | | |
| | |
Expenses | | | | | | | |
Advisory fee | | | 2,570,029 | | | | |
Auction agent fee-preferred shares | | | 315,648 | | | | |
Professional fees | | | 153,583 | | | | |
Trustees’ fees and expenses | | | 134,986 | | | | |
Fund accounting | | | 101,095 | | | | |
Administration fee | | | 90,854 | | | | |
Printing expenses | | | 58,139 | | | | |
Custodian fee | | | 54,288 | | | | |
Transfer agent fee | | | 50,894 | | | | |
Insurance | | | 31,947 | | | | |
Miscellaneous | | | 23,973 | | | | |
NYSE listing fee | | | 23,065 | | | | |
Interest expense on floating rate note obligations | | | 92,028 | | | | |
| | | | | | | |
Total expenses | | | | | | 3,700,529 | |
| | | | | | | |
Net investment income | | | | | | 14,087,404 | |
| | | | | | | |
| | |
Realized and Unrealized Gain (Loss) on Investments and Swaps | | | | | | | |
Net realized gain (loss) on: | | | | | | | |
Investments | | | | | | 12,880,990 | |
Swaps | | | | | | (1,568,750 | ) |
Net change in unrealized appreciation (depreciation) on: | | | | | | | |
Investments | | | | | | 16,230,574 | |
Swaps | | | | | | (21,210 | ) |
| | | | | | | |
Net realized and unrealized gain on investments and swaps | | | | | | 27,521,604 | |
| | | | | | | |
| | |
Distributions to Preferred Shareholders from | | | | | | | |
Net investment income | | | | | | (5,648,917 | ) |
| | | | | | | |
| | |
Net Increase in Net Assets Applicable to Common Shareholders Resulting from Operations | | | | | $ | 35,960,091 | |
| | | | | | | |
See notes to financial statements.
Annual Report | December 31, 2006 | 17
TYW | TS&W/Claymore Tax-Advantaged Balanced Fund
Statements of Changes in Net Assets | Applicable to Common Shareholders
| | | | | | | | |
| | | For the Year Ended
December 31, 2006 | | | For the Year Ended
December 31, 2005 | |
Increase in Net Assets Applicable to Common Shareholders Resulting from Operations | | | | | | | | |
Net investment income | | $ | 14,087,404 | | | $ | 13,562,059 | |
Net realized gain on investments and swaps | | | 11,312,240 | | | | 7,708,954 | |
Net change in unrealized appreciation (depreciation) on investments and swaps | | | 16,209,364 | | | | (3,428,664 | ) |
| | |
Distributions to Preferred Shareholders | | | | | | | | |
From and in excess of net investment income | | | (5,648,917 | ) | | | (3,984,479 | ) |
| | | | | | | | |
Net increase in net assets applicable to common shareholders resulting from operations | | | 35,960,091 | | | | 13,857,870 | |
| | | | | | | | |
| | |
Distributions to Common Shareholders from and in excess of Net Investment Income | | | (14,444,063 | ) | | | (14,444,063 | ) |
| | | | | | | | |
| | |
Capital Share Transactions | | | | | | | | |
Common and preferred shares’ offering expenses charged to paid-in-capital | | | — | | | | 18,188 | |
| | | | | | | | |
Total increase (decrease) in net assets applicable to common shareholders | | | 21,516,028 | | | | (568,005 | ) |
| | |
Net Assets | | | | | | | | |
Beginning of period | | | 237,817,884 | | | | 238,385,889 | |
| | | | | | | | |
End of period (including accumulated undistributed net investment income of $7,769,994 and $3,191,668, respectively) | | $ | 259,333,912 | | | $ | 237,817,884 | |
| | | | | | | | |
See notes to financial statements.
18 | Annual Report | December 31, 2006
TYW|TS&W/Claymore Tax-Advantaged Balanced Fund
Statement of Assets and LiabilitieslDecember 31, 2006
| | | | | | | | | | | | |
Per share operating performance for a common share outstanding throughout the period | | For the Year Ended
December 31, 2006 | | | For the Year Ended
December 31, 2005 | | | For the Period
April 28, 2004*
through
December 31, 2004 | |
Net asset value, beginning of period | | $ | 15.44 | | | $ | 15.47 | | | $ | 14.33 | (b) |
| | | | | | | | | | | | |
Income from investment operations | | | | | | | | | | | | |
Net investment income (a) | | | 0.91 | | | | 0.88 | | | | 0.52 | |
Net realized and unrealized gain on investments, options and swaps | | | 1.79 | | | | 0.29 | | | | 1.29 | |
Distributions to preferred shareholders from and in excess of net investment income (common share equivalent basis) | | | (0.37 | ) | | | (0.26 | ) | | | (0.07 | ) |
Total from investment operations | | | 2.33 | | | | 0.91 | | | | 1.74 | |
| | | | | | | | | | | | |
Distributions to common shareholders | | | (0.94 | ) | | | (0.94 | ) | | | (0.47 | ) |
| | | | | | | | | | | | |
Common and Preferred Shares’ offering expenses charged to paid-in capital | | | – | | | | – | (g) | | | (0.13 | ) |
| | | | | | | | | | | | |
Net asset value, end of period | | $ | 16.83 | | | $ | 15.44 | | | $ | 15.47 | |
| | | | | | | | | | | | |
Market value, end of period | | $ | 15.77 | | | $ | 13.35 | | | $ | 13.62 | |
| | | | | | | | | | | | |
Total investment return(c) | | | | | | | | | | | | |
Net asset value | | | 15.50 | % | | | 6.02 | % | | | 11.42 | % |
Market value | | | 25.98 | % | | | 4.80 | % | | | -6.05 | % |
| | | |
Ratios and supplemental data | | | | | | | | | | | | |
Net assets applicable to common shareholders, end of period (thousands) | | $ | 259,334 | | | $ | 237,818 | | | $ | 238,386 | |
Preferred shares, at liquidation value ($25,000 per share liquidation preference) (thousands) | | $ | 120,000 | | | $ | 120,000 | | | $ | 120,000 | |
Preferred shares asset coverage per share | | $ | 79,028 | | | $ | 74,545 | | | $ | 74,664 | |
Ratios to average net assets applicable to common shareholders:(d) | | | | | | | | | | | | |
Total expenses (excluding interest expense on floating rate note obligations) | | | 1.46 | % | | | 1.52 | % | | | 1.36 | % |
Total expenses (including interest expense on floating rate note obligations(e)) | | | 1.50 | % | | | – | | | | – | |
Net investment income, prior to effect of dividends to preferred shares | | | 5.70 | % | | | 5.73 | % | | | 5.31 | % |
Net investment income, after effect of dividends to preferred shares | | | 3.41 | % | | | 4.05 | % | | | 4.58 | % |
Ratios to average managed assets:(d)(f ) | | | | | | | | | | | | |
Total expenses (excluding interest expense on floating rate note obligations) | | | 0.98 | % | | | 1.01 | % | | | 0.98 | % |
Total expenses (including interest expense on floating rate note obligations(e)) | | | 1.01 | % | | | – | | | | – | |
Net investment income, prior to effect of dividends to preferred shares | | | 3.84 | % | | | 3.80 | % | | | 3.83 | % |
Portfolio turnover rate | | | 159 | % | | | 103 | % | �� | | 75 | % |
Asset coverage per $ 1,000 unit of indebtedness(h) | | | 29,902 | | | | – | | | | – | |
*Commencementof investment operations. | | | | | | | | | | | | |
| (a) | Based on average shares outstanding during the period. |
| (b) | Before reimbursement of offering expenses charged to capital. |
| (c) | Total investment return is calculated assuming a purchase of a common share at the beginning of the period and a sale on the last day of the period reported either at net asset value (“NAV”) or market price per share. Dividends and distributions are assumed to be reinvested at NAV for NAV returns or the prices obtained under the Fund’s Dividend Reinvestment Plan for market value returns. Total investment return does not reflect brokerage commissions. A return calculated for a period of less than one year is not annualized. |
| (e) | See note 2(f) of the Notes to Financial Statements for more information on floating rate note obligations. |
| (f) | Managed assets is equal to net assets applicable to common shareholders plus outstanding leverage, such as the liquidation value of preferred shares. |
| (g) | Amount is less than $0.01. |
| (h) | Calculated by subtracting the Fund’s total liabilities (not including the floating rate note obligations) from the Fund’s total assets and dividing by the total number of indebtedness units, where one unit equals $1,000 of indebtedness. |
See notes to financial statements.
Annual Report | December 31, 2006 | 19
TYW|TS&W/Claymore Tax-Advantaged Balanced Fund
Notes to Financial Statements | December 31, 2006
Note 1 – Organization:
TS&W/Claymore Tax-Advantaged Balanced Fund (the “Fund”) was organized as a Delaware statutory trust on February 12, 2004. The Fund is registered as a diversified, closed-end management investment company under the Investment Company Act of 1940.
Under normal market conditions, the Fund will invest at least 50%, but less than 60% of its total assets in debt securities and other obligations issued by or on behalf of states, territories and possessions of the United States and the District of Columbia and their political subdivisions, agencies and instrumentalities, the interest on which is exempt from regular federal income tax and which is not a preference item for purposes of the alternative minimum tax (the “Municipal Securities Portfolio”) and at least 40%, but less than 50%, of its total assets in common stocks, preferred securities and other income securities (the “Equity and Income Securities Portfolio”).
Note 2 – Accounting Policies:
The preparation of the financial statement in accordance with U.S. generally accepted accounting principles requires management to make estimates and assumptions that affect the reported amounts and disclosures in the financial statements. Actual results could differ from these estimates.
The following is a summary of significant accounting policies consistently followed by the Fund.
(a) Valuation of Investments
The Fund values equity securities at the last reported sale price on the principal exchange or in the principal Over-the-Counter (“OTC”) market in which such securities are traded, as of the close of regular trading on the New York Stock Exchange (“NYSE”) on the day the securities are being valued or, if there are no sales, at the mean between the last available bid and asked prices on that day. Securities traded on the NASDAQ are valued at the NASDAQ Official Closing Price. Preferred stocks are valued at their sales price as of the close of the exchange on which they are traded. Preferred stocks for which the last sales price is not available are valued at the last available bid price. Debt securities are valued at the last available bid price for such securities or, if such prices are not available, at prices for securities of comparable maturity, quality and type. Foreign securities are translated from the local currency into U.S. dollars using the current exchange rate. The Fund’s securities that are primarily traded in foreign markets may be traded in such markets on days that the NYSE is closed. As a result, the net asset value of the Fund may be significantly affected on days when holders of common shares have no ability to trade common shares on the NYSE. Investment Companies are valued at the last available closing price. For those securities where quotations or prices are not available, valuations are determined in accordance with procedures established in good faith by the Board of Trustees. Short-term securities with remaining maturities of 60 days or less are valued at amortized cost, which approximates market value.
(b) Investment Transactions and Investment Income
Investment transactions are accounted for on the trade date. Realized gains and losses on investments are determined on the identified cost basis. Dividend income is recorded net of applicable withholding taxes on the ex-dividend date and interest income is recorded on an accrual basis. Discounts or premiums on debt securities purchased are accreted or amortized to interest income over the lives of the respective securities using the effective interest method.
(c) Swaps
A swap is an agreement to exchange the return generated by one instrument for the return generated by another instrument. The Fund may enter into swap agreements to manage its exposure to interest rates or to manage the duration of its portfolio. The swaps are valued at current market value and any unrealized gain or loss is included in the Statement of Operations. Gain or loss is realized on the termination date of the swap and is equal to the difference between the Fund’s basis in the swap and the proceeds of the closing transaction, including any fees. During the period that the swap agreement is open, the Fund may be subject to risk from the potential inability of the counterparty to meet the terms of the agreement. The swaps involve elements of both market and credit risk in excess of the amounts reflected on the Statement of Assets and Liabilities. The Fund usually invests in Forward Interest Rate Swaps. Forward interest rate swap transactions involve the Fund’s agreement with a counterparty to pay, in the future, a fixed or variable rate payment in exchange for the counterparty paying the Fund a variable or fixed rate payment, the accruals for which would begin at a specified date in the future (the “effective date”). The Fund may terminate the swap contract prior to the effective date, at which point a realized gain or loss is recognized.
Details of the swap agreements outstanding as of December 31, 2006 were as follows:
| | | | | | | | | | | | | | |
Counterparty | | Termination
Date | | Notional
Amount (000) | | Fixed
Rate | | | Floating Rate | | Unrealized
Appreciation/
(Depreciation) | |
Morgan Stanley | | 4/2/2017 | | $ | 20,000,000 | | 5.189 | % | | LIBOR | | $ | (13,287 | ) |
JP Morgan Chase & Co. | | 3/4/2037 | | | 10,000,000 | | 5.079 | % | | LIBOR | | | 344,416 | |
JP Morgan Chase & Co. | | 3/13/2037 | | | 5,000,000 | | 5.164 | % | | LIBOR | | | 108,914 | |
JP Morgan Chase & Co. | | 8/1/2037 | | | 10,000,000 | | 4.462 | % | | BMA | | | (622,457 | ) |
| | | | | | | | | | | | $ | (182,414 | ) |
BMA - Bond Market Association Municipal Swap Index.
LIBOR - London Interbank Offering Rate
For each swap noted, the Fund pays a fixed rate and receives a floating rate.
(d) Options
For hedging and investment purposes, the Fund may purchase put options, put options on futures and write (sell) call options on securities. The risk associated with purchasing an option is that the Fund pays a premium whether or not the option is exercised. Put and call options purchased are accounted for in the same manner as portfolio securities. The cost of securities acquired through the exercise of call options is increased by premiums paid. The proceeds from securities sold through the exercise of put options are decreased by the premiums paid.
The risk associated with writing an option is that the writer of an option has no control over the time when it may be required to fulfill its obligation. Once an option writer has received an exercise notice, it cannot effect a closing purchase transaction in order to terminate its obligation under the option and must deliver the underlying security at the exercise price.
There were no options outstanding as of December 31, 2006.
(e) Distributions to Shareholders
The Fund declares and pays quarterly dividends to common shareholders. These dividends consist of tax-exempt income and investment company taxable income, which generally includes qualified dividend income, ordinary income and short-term capital gains. Any net realized long-term capital gains are distributed annually to common shareholders.
Distributions to shareholders are recorded on the ex-dividend date. The amount and timing of distributions are determined in accordance with federal income tax regulations, which may differ from U.S. generally accepted accounting principles.
(f) Inverse Floating Rate Investments and Floating Rate Note Obligations
Inverse floating rate instruments are notes whose coupon rate fluctuates inversely to a predetermined interest rate index. The Fund may invest in inverse floating rate securities through either a direct purchase or through the transfer of bonds to a dealer trust in exchange for cash and/or residual interests in the dealer trust.
20 | Annual Report | December 31, 2006
TYW|TS&W/Claymore Tax-Advantaged Balanced Fund | Notes to Financial Statements continued
For those inverse floating rate securities purchased directly, the instrument is included in the Portfolio of Investments with income recognized on an accrual basis.
For those inverse floating rate securities purchased through a transfer of a fixed rate bond to a dealer trust in exchange for cash and/or residual interests in the dealer trusts’ assets and cash flows, FASB Statement No. 140, Accounting for Transfers and Servicing of Financial Assets and Extinguishment of Liabilities (FAS 140) calls for this transaction to be accounted for as a financing by the dealer trust of the transferred fixed rate bond. In these transactions, the dealer trusts fund the purchases of the fixed rate bonds by issuing floating rate notes to third parties and allowing the Fund to retain residual interests in the bonds. The residual interests held by the Fund (the inverse floating rate investments) include the right of the Fund to cause the holders of the floating rate notes to tender their notes at par at the next interest rate reset date and to transfer the municipal bond from the dealer trusts to the Fund, thereby collapsing the dealer trusts. The Fund accounts for the transfer of bonds to the dealer trusts as secured borrowings, with the securities transferred remaining in the Fund’s Portfolio of Investments, and the related floating rate notes reflected as a liability under the caption “Floating rate note obligations” on the Statement of Assets and Liabilities. The Fund records the interest income from the fixed rate bonds under the caption “Interest” and records the expenses related to floating rate note obligations and any administrative expenses of the dealer trusts under the caption “Interest expense on floating rate note obligations” on the Fund’s Statement of Operations. The notes issued by the dealer trusts have interest rates that reset weekly and the floating rate note holders have the option to tender their notes to the dealer trusts for redemption at par at each reset date. At December 31, 2006, Fund investments with a par value of $26.2 million (market value of $28.0 million) are held by the dealer trusts and serve as collateral for the $13,125,000 in floating rate notes outstanding at that date. Contractual maturities of the floating rate notes and interest rates in effect at December 31, 2006 are presented on the Portfolio of Investments.
These instruments typically involve greater risks than a fixed rate municipal bond. In particular, the holder of these inverse floating rate instruments retain all credit and interest rate risk associated with the full underlying bond and not just the par value of the inverse floating rate instrument. As such, these instruments should be viewed as having inherent leverage and therefore involve many of the risks associated with leverage. Leverage is a speculative technique that may expose the Fund to greater risk and increased costs. Leverage may cause the Fund’s net asset value to be more volatile than if it had not been leveraged because leverage tends to magnify the effect of any increases or decreases in the value of the Fund’s portfolio securities. The use of leverage may also cause the Fund to liquidate portfolio positions when it may not be advantageous to do so in order to satisfy its obligations with respect to inverse floating rate instruments.
Note 3 – Investment Advisory Agreement, Investment Sub-Advisory Agreement and Other Agreements:
Pursuant to an Investment Advisory Agreement (the “Agreement”) between the Fund and Claymore Advisors, LLC (the “Adviser”), the Adviser is responsible for managing, either directly or through others selected by it, the investment activities of the Fund and the Fund’s business affairs and other administrative matters. The Adviser received a fee, payable monthly, at an annual rate equal to 0.70% of the Fund’s average daily managed assets (total assets including the assets attributable to the proceeds from any financial leverage but excluding the assets attributable to floating rate note obligations, minus liabilities, other than debt representing financial leverage).
The Adviser has entered into an Investment Sub-Advisory Agreement (the “Sub-Advisory Agreement”) with Thompson, Siegel & Walmsley, Inc. (the “Sub-Adviser”). The Sub-Adviser is responsible for day-to-day portfolio management of the Fund’s assets allocated to the Equity and Income Securities Portfolio. Under the terms of the Sub-Advisory Agreement between the Adviser and the Sub-Adviser, the Adviser pays monthly to the Sub-Adviser a fee at the annual rate of 0.42% of the Fund’s average daily managed assets attributable to the Equity and Income Securities Portfolio.
On July 11, 2006, the Adviser entered into an Investment Sub-Advisory Agreement (the “Sub-Advisory Agreement 2”) with SMC Fixed Income Management, LP (the “Sub-Adviser 2”). The Sub-Adviser 2 is responsible for day-to-day portfolio management of the Fund’s assets allocated to the Municipal Securities Portfolio. Under the terms of the Sub-Advisory Agreement 2 between the Adviser and the Sub-Adviser 2, the Adviser pays monthly to the Sub-Adviser 2 a fee at the annual rate of 0.30% of the Fund’s average daily managed assets attributable to the Municipal Securities Portfolio. Prior to July 11, 2006 the Adviser was responsible for the day-to-day portfolio management for the Municipal Securities Portfolio.
The Bank of New York (“BNY”) acts as the Fund’s custodian, accounting agent and transfer agent. As custodian, BNY is responsible for the custody of the Fund’s assets. As accounting agent, BNY is responsible for maintaining the books and records of the Fund’s securities and cash. As transfer agent, BNY is responsible for performing transfer agency services for the Fund. Prior to March 1, 2006, BNY was the Fund’s administrator.
Under a separate Fund Administration agreement effective March 1, 2006, the Adviser provides fund administration services to the Fund. As compensation for services performed under the Administration Agreement, the Adviser receives an administration fee payable monthly at the annual rate set forth below as a percentage of the average daily managed assets of the Fund:
| | | |
| Managed Net Assets | | Rate | |
First $ 200,000,000 | | 0.0275 | % |
Next $ 300,000,000 | | 0.0200 | % |
Next $ 500,000,000 | | 0.0150 | % |
Over $ 1,000,000,000 | | 0.0100 | % |
Certain officers and trustees of the Fund are also officers and directors of the Adviser or Sub-Adviser. The Fund does not compensate its officers or trustees who are officers of the aforementioned firms.
Note 4 – Federal Income Taxes:
The Fund intends to comply with the requirements of Subchapter M of the Internal Revenue Code of 1986, as amended, applicable to regulated investment companies. Accordingly, no provision for U.S. federal income taxes is required. In addition, by distributing substantially all of its ordinary income and long-term capital gains, if any, during each calendar year, the Fund intends not to be subject to U.S. federal excise tax.
Due to inherent differences in the recognition of income, expenses and realized gains/losses under U.S. generally accepted accounting principles and federal income tax purposes, permanent differences between book and tax basis reporting have been identified and appropriately reclassified on the Statement of Assets and Liabilities. A permanent book and tax basis difference relating to a distribution reclass in the amount of $12,442,419 was reclassified from accumulated undistributed net investment income to accumulated net realized gain. Also, permanent book to tax differences relating to the Fund’s investments in real estate investment trusts totaling $289,767 were reclassified from accumulated undistributed net investment income to accumulated net realized gain. Additionally, a permanent book to tax difference relating to the Fund’s payments on the swap agreements totaling $1,568,750 was reclassified from accumulated net realized gain to accumulated undistributed net investment income.
Annual Report | December 31, 2006 | 21
TYW|TS&W/Claymore Tax-Advantaged Balanced Fund | Notes to Financial Statements continued
Information on the tax components of investments and net assets as of December 31, 2006 is as follows:
| | | | | | | | | | | | | | | | | | | | |
Cost of Investments for Tax Purposes | | Gross Tax
Unrealized
Appreciation | | Gross Tax
Unrealized
Depreciation | | | Net Tax
Unrealized
Appreciation on
Investments | | Net Tax
Unrealized
Depreciation on
Derivatives | | | Undistributed
Ordinary
Income* | | Undistributed
Long-Term
Capital Gains |
$ 357,686,061 | | $ | 33,036,415 | | $ | (944,891 | ) | | $ | 32,091,524 | | ($ | 182,414 | ) | | $ | 7,772,917 | | $ | 940,422 |
| * | Includes tax-exempt income. |
The differences between book basis and tax basis unrealized appreciation/(depreciation) is attributable to additional income accrued for tax purposes on certain preferred stocks and investments in real estate investment trusts.
For the years ended December 31, 2006 and 2005, the tax character of distributions paid to common and preferred shareholders as reflected in the Statement of Changes in Net Assets was as follows:
| | | | | | |
Distributions paid from: | | 2006 | | 2005 |
Ordinary income | | $ | 7,322,467 | | $ | 10,216,359 |
Tax-exempt income | | | 3,092,337 | | | 5,712,065 |
Long-term capital gain | | | 9,678,176 | | | 2,500,118 |
Total Distributions | | $ | 20,092,980 | | $ | 18,428,542 |
Note 5 – Investment in Securities:
For the year ended December 31, 2006, purchases and sales of investments, excluding short-term securities, were $580,155,544 and $590,711,761, respectively.
Note 6 – Capital:
Common Shares
The Fund has an unlimited amount of common shares, $0.01 par value, authorized and 15,407,000 issued and outstanding. In connection with the Fund’s dividend reinvestment plan, the Fund did not issue any shares during the years ended December 31, 2006 and 2005.
Preferred Shares
On April 29, 2004, the Fund’s Board of Trustees authorized the issuance of preferred shares, in addition to the existing common shares, as part of the Fund’s leverage strategy. The Fund may also borrow or issue debt securities collectively with preferred shares for leveraging purposes. Preferred shares issued by the Fund have seniority over the common shares.
On July 1, 2004, the Fund issued 2,400 shares of Preferred Shares Series M7 and 2,400 shares of Preferred Shares Series T28 each with a net asset and liquidation value of $25,000 per share plus accrued dividends. Dividends are accumulated daily at an annual rate set through auction procedures. Distribution of net realized capital gains, if any, are paid annually.
For the year ended December 31, 2006, the annualized dividend rates ranged from:
| | | | | | | | | |
| | | High | | | Low | | | At 12/31/06 | |
Series M7 | | 5.30 | % | | 3.65 | % | | 5.30 | % |
Series T28 | | 5.20 | % | | 4.20 | % | | 5.04 | % |
The Fund is subject to certain limitations and restrictions while Preferred Shares are outstanding. Failure to comply with these limitations and restrictions could preclude the Fund from declaring any dividends or distributions to common shareholders or repurchasing common shares and/or could trigger the mandatory redemption on Preferred Shares at their liquidation value.
Preferred Shares, which are entitled to one vote per share, generally vote with the common stock but vote separately as a class to elect two Trustees and on any matters affecting the rights of the Preferred Shares.
Note 7 – Indemnifications:
In the normal course of business, the Fund enters into contracts that contain a variety of representations, which provide general indemnifications. The Fund’s maximum exposure under these arrangements is unknown, as this would require future claims that may be made against the Fund that have not yet occurred. However, the Fund expects the risk of loss to be remote.
Note 8 – New Accounting Pronouncements:
On July 13, 2006, the Financial Accounting Standards Board (“FASB”) released FASB
Interpretation No. 48, “Accounting for Uncertainty in Income Taxes”(“FIN 48”). FIN 48 provides guidance for how uncertain tax positions should be recognized, measured, presented and disclosed in the financial statements. FIN 48 requires the evaluation of tax positions taken or expected to be taken in the course of preparing the Company’s tax returns to determine whether the tax positions are “more-likely-than-not” of being sustained by the applicable tax authority. Tax positions not deemed to meet the more-likely-than-not threshold would be recorded as a tax benefit or expense in the current year. Adoption of FIN 48 is required for fiscal years beginning after December 15, 2006 and is to be applied to all open tax years as of the effective date. At this time, management is
evaluating the implications of FIN 48 and its impact in the financial statements has not yet been determined.
On September 15, 2006, the FASB released Statement of Financial Accounting Standards No. 157, “Fair Value Measurements” (“FAS 157”) which provides enhanced guidance for measuring fair value. The standard requires companies to provide expanded information about the assets and liabilities measured at fair value and the potential effect of these fair valuations on an entity’s financial performance. The standard does not expand the use of fair value in any new circumstances, but provides clarification on acceptable fair valuation methods and applications. Adoption of FAS 157 is required for fiscal years beginning after November 15, 2007. At this time, management is evaluating the implications of FAS 157 and its impact in the financial statements has not yet been determined.
Note 9 – Subsequent Event:
On February 1, 2007, the Board of Trustees declared a quarterly dividend of $0.234375 per common share. This dividend will be payable February 28, 2007 to shareholders of record on February 15, 2007.
22 | Annual Report | December 31, 2006
TYW|TS&W/Claymore Tax-Advantaged Balanced Fund
Report of Independent Registered Public Accounting Firm |
To the Shareholders and Board of Trustees of TS&W/Claymore Tax-Advantaged Balanced Fund
We have audited the accompanying statement of assets and liabilities of TS&W/Claymore Tax-Advantaged Balanced Fund (the “Fund”), including the portfolio of investments, as of December 31, 2006, and the related statement of operations for the year then ended, the statements of changes in net assets for each of the two years in the period then ended, and the financial highlights for each of the two years in the period then ended and for the period from April 28, 2004 (commencement of investment operations) through December 31, 2004. These financial statements and financial highlights are the responsibility of the Fund’s management. Our responsibility is to express an opinion on these financial statements and financial highlights based on our audits.
We conducted our audits in accordance with the standards of the Public Company Accounting Oversight Board (United States). Those standards require that we plan and perform the audit to obtain reasonable assurance about whether the financial statements and financial highlights are free of material misstatement. We were not engaged to perform an audit of the Fund’s internal control over financial reporting. Our audits included consideration of internal control over financial reporting as a basis for designing audit procedures that are appropriate in the circumstances, but not for the purpose of expressing an opinion on the effectiveness of the Fund’s internal control over financial reporting. Accordingly, we express no such opinion. An audit also includes examining, on a test basis, evidence supporting the amounts and disclosures in the financial statements and financial highlights, assessing the accounting principles used and significant estimates made by management, and evaluating the overall financial statement presentation. Our procedures included confirmation of securities owned as of December 31, 2006, by correspondence with the custodian. We believe that our audits provide a reasonable basis for our opinion.
In our opinion, the financial statements and financial highlights referred to above present fairly, in all material respects, the financial position of TS&W/Claymore Tax-Advantaged Balanced Fund at December 31, 2006, the results of its operations for the year then ended, the changes in its net assets for each of the two years in the period then ended, and the financial highlights for each of the two years in the period then ended and for the period from April 28, 2004 (commencement of investment operations) through December 31, 2004, in conformity with U.S. generally accepted accounting principles.

Chicago, Illinois
February 14, 2007
Annual Report | December 31, 2006 | 23
TYW|TS&W/Claymore Tax-Advantaged Balanced Fund
Supplemental Information | (unaudited)
Federal Income Tax Information
Qualified dividend income of as much as $5,126,694 was received by the Fund through December 31, 2006. The Fund intends to designate the maximum amount of dividends that qualify for the reduced tax rate pursuant to the Jobs and Growth Tax Relief Reconciliation Act of 2003.
For corporate shareholders, $4,667,340 of investment income qualifies for the dividends-received deduction.
In January 2007, you were advised on IRS Form 1099 DIV or substitute 1099 DIV as to the federal tax status of the distributions received by you in the calendar year 2006.
Results of Shareholder Votes
The Annual Meeting of Shareholders (the “Annual Meeting”) of the Fund was held on June 27, 2006. The Meeting was called by the Board of Trustees for the purposes of: (i) approving an investment sub-advisory agreement among the Fund, Claymore Advisors, LLC and SMC Fixed Income Management, LP (the “Sub-advisory Agreement”) by the holders of the Fund’s common shares of beneficial interest (the “Common Shares”) and the holders of the Fund’s Auction Market Preferred Shares (the “Preferred Shares”) voting together as a single class; (ii) electing one Class II Trustee of the Fund by the holders of the Fund’s Common Shares and the holders of the Fund’s Preferred Shares voting together as a single class; and (iii) electing one Class II Trustee of the Fund by the holders of the Fund’s Preferred Shares voting as a separate class.
Voting results with respect to the approval of the Sub-Advisory Agreement are set forth below:
| | | | |
| | | # of Shares In Favor | | # of Shares Withheld |
Approval of Sub-Advisory Agreement | | 6,641,316 | | 151,716 |
Voting results with respect to the election of one Class II Trustee (Ronald A. Nyberg) of the Fund by the holders of the Fund’s Common Shares and the holders of the Fund’s Preferred Shares voting together as a single class are set forth below
| | | | |
| | | # of Shares In Favor | | # of Shares Withheld |
Ronald A. Nyberg | | 9,505,885 | | 295,614 |
The Annual Meeting was adjourned until Tuesday, July 18, 2006 at 11:30 a.m. (central time) to provide additional time to solicit the additional votes needed to constitute a quorum for the election of one Class II Trustee (L. Kent Moore) of the Fund by the holders of the Fund’s Preferred Shares voting as a separate class. The Annual Meeting reconvened on Tuesday, July 18, 2006 at 11:30 a.m. (central time) and was subsequently adjourned until Wednesday, August 16, 2006 at 11:30 a.m. (central time) to provide additional time to solicit the additional votes needed to constitute a quorum for the election of Mr. Moore by the holders of the Fund’s Preferred Shares voting as a separate class. The Annual Meeting reconvened on Wednesday, August 16, 2006 at 11:30 a.m. (central time), at which time it was determined that a quorum was not present for the election of Mr. Moore by the holders of the Fund’s Preferred Shares voting as a separate class. Thereafter, the Annual Meeting was adjourned.
Mr. Moore continues to serve as a Class II Trustee of the Fund. The terms of the following Trustees of the Fund did not expire in 2006: Steven D. Cosler, Nicholas Dalmaso, Robert M. Hamje, Ronald A. Nyberg and Ronald E. Toupin, Jr.
Trustees
The Trustees of the TS&W/Claymore Tax-Advantaged Balanced Fund and their principal occupations during the past five years:
| | | | | | | | |
Name, Address*, Year of Birth and Position(s) held with Registrant | | Term of Office**
and Length of Time Served | | Principal Occupation During the Past Five Years and Other Affiliations | | Number of Portfolios
in Fund Complex*** Overseen by Trustee | | Other Directorships Held by Trustee |
Independent Trustees: | | | | | | | | |
| | | | |
Randall C. Barnes Year of Birth: 1951 Trustee | | Since 2005 | | Formerly, Senior Vice President & Treasurer (1993-1997), President, Pizza Hut International (1991-1993) and Senior Vice President, Strategic Planning and New Business Development (1987-1990) of PepsiCo,Inc. (1987-1997). | | 23 | | None. |
| | | | |
Steven D. Cosler Year of Birth: 1955 Trustee | | Since 2005 | | Formerly, President, Chief Executive Officer and Director of Priority Healthcare Corp. (2002- 2005). Formerly, President and Chief Operating Officer of Priority Healthcare Corp. (2001-2002). Formerly, Executive Vice President and Chief Operating Officer of Priority Healthcare Corp. (2000-2001). | | 2 | | None. |
| | | | |
Robert M. Hamje Year of Birth: 1942 Trustee | | Since 2004 | | Advisor to the Cleveland Foundation Investment Committee. Formerly, President and Chief Investment Officer of TRW Investment Management Co. (1990-2003). | | 2 | | Trustee, Old Mutual Advisor Mutual Funds. |
| | | | |
L. Kent Moore Year of Birth: 1955 Trustee | | Since 2004 | | Partner at WilSource Enterprise (December 2005-present). Managing Director High Sierra Energy L.P., (2004-2005). Formerly, Portfolio Manager and Vice President of Janus Capital Corp. (2000- 2002) and Senior Analyst/Portfolio Manager of Marsico Capital Management (1997-1999). | | 2 | | Trustee, Old Mutual Advisor Mutual Funds. |
| | | | |
Ronald A. Nyberg Year of Birth: 1953 Trustee | | Since 2004 | | Principal of Ronald A. Nyberg, Ltd., a law firm specializing in corporate law, estate planning and business transactions (2000-present). Formerly, Executive Vice President, General Counsel and Corporate Secretary of Van Kampen Investments (1982-1999). | | 26 | | None. |
| | | | |
Ronald E. Toupin, Jr. Year of Birth: 1958 Trustee | | Since 2004 | | Formerly, Vice President, Manager and Portfolio Manager of Nuveen Asset Management (1998-1999), Vice President of Nuveen Investment Advisory Corp. (1992-1999), Vice President and Manager of Nuveen Unit Investment Trusts (1991-1999), and Assistant Vice President and Portfolio Manager of Nuveen Unit Investment Trusts (1988-1999), each of John Nuveen & Co., Inc. (1982-1999). | | 24 | | None. |
24 | Annual Report | December 31, 2006
TYW | TS&W/Claymore Tax-Advantaged Balanced Fund | Supplemental Information (unaudited) continued
| | | | | | | | |
Name, Address*, Year of Birth and Position(s) held with Registrant | | Term of Office** and Length of Time Served | | Principal Occupation During the Past Five Years and Other Affiliations | | Number of Portfolios in Fund Complex*** Overseen by Trustee | | Other Directorships Held by Trustee |
| | | | |
| | | | |
Independent Trustees: | | | | | | | | |
Matthew J. Appelstein† Year of Birth: 1961 Trustee | | Since 2005 | | Director of Investment Services, Old Mutual Asset Management (2003-present). Formerly, Senior Vice President of Consulting Relationships, Fidelity Management Trust Co. (1998-2003). | | 2 | | None. |
| | | | |
| | | | |
Nicholas Dalmaso†† Year of Birth: 1965 Trustee; Chief Executive and Legal Officer | | Since 2004 | | Senior Managing Director and General Counsel of Claymore Advisors, LLC and Claymore Securities, Inc. (2001-present). Formerly, Assistant General Counsel, John Nuveen and Co., Inc. (1999-2001). Former Vice President and Associate General Counsel of Van Kampen Investments, Inc. (1992-1999). | | 26 | | None. |
| | | | |
| | | | |
| | | | |
| * | Address for all Trustees: 2455 Corporate West Drive, Lisle, IL 60532 |
| ** | After a Trustees’ initial term, each Trustee is expected to serve a three-year term concurrent with the class of Trustees for which he serves: |
– Messrs. Barnes, Dalmaso and Hamje, as Class I Trustees, are expected to stand for re-election at the Fund’s 2008 annual meeting of shareholders.
– Messrs. Moore and Nyberg, as Class II Trustees, are expected to stand for re-election at the Fund’s 2009 annual meeting of shareholders.
– Messrs. Applestein, Cosler and Toupin, as Class III Trustees, are expected to stand for re-election at the Fund’s 2007 annual meeting of shareholders.
| *** | The Claymore Fund Complex consists of U.S. registered investment companies advised or serviced by Claymore Advisors, LLC or Claymore Securities, Inc. The Claymore Fund Complex is overseen by multiple Boards of Trustees. |
| † | Mr. Appelstein is an “interested person” (as defined in Section 2(a)(19) of the 1940 Act) of the Fund because of his position as an officer of Old Mutual Asset Management, the parent company of the Fund’s Sub-Adviser. |
| †† | Mr. Dalmaso is an “interested person” (as defined in Section 2(a)(19) of the 1940 Act) of the Fund because of his position as an officer of Claymore Advisors, LLC, the Fund’s Investment Adviser. |
Officers
| | | | |
Name, Address*, Year of Birth and Position(s) held with Registrant | | Term of Office** and Length of Time Served | | Principal Occupation During the Past Five Years and Other Affiliations |
| | |
Officers: | | | | |
Steven M. Hill Year of Birth: 1964 Chief Financial Officer, Chief Accounting Officer and Treasurer | | Since 2004 | | Senior Managing Director and Chief Financial Officer of Claymore Advisors, LLC and Claymore Securities, Inc. (2005-present). Managing Director of Claymore Advisors, LLC and Claymore Securities, Inc. (2003-2005). Formerly, Treasurer of Henderson Global Funds and Operations Manager of Henderson Global Investors (NA) Inc. (2002-2003); Managing Director, FrontPoint Partners LLC (2001-2002); Vice President, Nuveen Investments (1999-2001). |
| | |
| | |
| | |
| | |
Vincent R. Giordano Year of Birth: 1948 Vice President | | Since 2004 | | Senior Managing Director of SMC Fixed Income Management, LP.*** Formerly, Senior Managing Director of Claymore Advisors, LLC (2004-2006); Senior Vice President and Portfolio Manager of Merrill Lynch Asset Management, Inc. (1985-2001). |
| | |
| | |
| | |
George Gregorio Year of Birth: 1949 Vice President | | Since 2004 | | Managing Director of SMC Fixed Income Management, LP.*** Formerly, Managing Director of Claymore Advisors, LLC (2004-2006); Sell Side Analyst for JB Hanauer & Co. |
| | |
| | |
| | |
Roberto W. Roffo Year of Birth: 1966 Vice President | | Since 2004 | | Managing Director of SMC Fixed Income Management, LP.*** Formerly, Managing Director of Claymore Advisors, LLC (2004-2006); Director and Vice President of Merrill Lynch Investment Managers. |
| | |
| | |
| | |
Bruce Saxon Year of Birth: 1957 Chief Compliance Officer | | Since 2006 | | Vice President, Fund Compliance Officer of Claymore Advisors, LLC (Feb. 2006-present). Chief Compliance Officer/Assistant Secretary of Harris Investment Management, Inc. (2003-2006). Director-Compliance of Harrisdirect LLC (1999-2003). |
| | |
| | |
| | |
Matthew Patterson Year of Birth: 1971 Secretary | | Since 2006 | | Vice President, Attorney of Claymore Securities, Inc. (2006- present). Chief Compliance Officer and Clerk, The Preferred Group of Mutual Funds (2005- 2006). Chief Compliance Officer and Secretary, Caterpillar Investment Management Ltd (2005-2006). Securities Counsel, Caterpillar Inc. (2004-2006); Associate, Skadden, Arps, Slate, Meagher & Flom LLP (2002-2004). |
| | |
| | |
| | |
Melissa Nguyen Year of Birth: 1978 Assistant Secretary | | Since 2006 | | Vice President of Claymore Securities, Inc. (2005-present). Formerly, Associate, Vedder, Price, Kaufman & Kammholz, P.C. (2003-2005). |
| | |
| | |
| * | Address for all Officers: 2455 Corporate West Drive, Lisle, IL 60532 |
| ** | Officers serve at the pleasure of the Board of Trustees and until his or her successor is appointed and qualified or until his or her earlier resignation or removal. |
| *** | Effective July 11, 2006. |
Annual Report | December 31, 2006 | 25
TYW|TS&W/Claymore Tax-Advantaged Balanced Fund
Dividend Reinvestment plan | (unaudited)
Unless the registered owner of common shares elects to receive cash by contacting the Plan Administrator, all dividends declared on common shares of the Fund will be automatically reinvested by The Bank of New York (the “Plan Administrator”), Administrator for shareholders in the Fund’s Dividend Reinvestment Plan (the “Plan”), in additional common shares of the Fund. Participation in the Plan is completely voluntary and may be terminated or resumed at any time without penalty by notice if received and processed by the Plan Administrator prior to the dividend record date; otherwise such termination or resumption will be effective with respect to any subsequently declared dividend or other distribution. Some brokers may automatically elect to receive cash on your behalf and may re-invest that cash in additional common shares of the Fund for you. If you wish for all dividends declared on your common shares of the Fund to be automatically reinvested pursuant to the Plan, please contact your broker.
The Plan Administrator will open an account for each common shareholder under the Plan in the same name in which such common shareholder’s common shares are registered. Whenever the Fund declares a dividend or other distribution (together, a “Dividend”) payable in cash, non-participants in the Plan will receive cash and participants in the Plan will receive the equivalent in common shares. The common shares will be acquired by the Plan Administrator for the participants’ accounts, depending upon the circumstances described below, either (i) through receipt of additional unissued but authorized common shares from the Fund (“Newly Issued Common Shares”) or (ii) by purchase of outstanding common shares on the open market (“Open-Market Purchases”) on the New York Stock Exchange or elsewhere. If, on the payment date for any Dividend, the closing market price plus estimated brokerage commission per common share is equal to or greater than the net asset value per common share, the Plan Administrator will invest the Dividend amount in Newly Issued Common Shares on behalf of the participants. The number of Newly Issued Common Shares to be credited to each participant’s account will be determined by dividing the dollar amount of the Dividend by the net asset value per common share on the payment date; provided that, if the net asset value is less than or equal to 95% of the closing market value on the payment date, the dollar amount of the Dividend will be divided by 95% of the closing market price per common share on the payment date. If, on the payment date for any Dividend, the net asset value per common share is greater than the closing market value plus estimated brokerage commission, the Plan Administrator will invest the Dividend amount in common shares acquired on behalf of the participants in Open-Market Purchases.
If, before the Plan Administrator has completed its Open-Market Purchases, the market price per common share exceeds the net asset value per common share, the average per common share purchase price paid by the Plan Administrator may exceed the net asset value of the common shares, resulting in the acquisition of fewer common shares than if the Dividend had been paid in Newly Issued Common Shares on the Dividend payment date. Because of the foregoing difficulty with respect to Open-Market Purchases, the Plan provides that if the Plan Administrator is unable to invest the full Dividend amount in Open-Market Purchases during the purchase period or if the market discount shifts to a market premium during the purchase period, the Plan Administrator may cease making Open-Market Purchases and may invest the uninvested portion of the Dividend amount in Newly Issued Common Shares at net asset value per common share at the close of business on the Last Purchase Date provided that, if the net asset value is less than or equal to 95% of the then current market price per common share; the dollar amount of the Dividend will be divided by 95% of the market price on the payment date.
The Plan Administrator maintains all shareholders’ accounts in the Plan and furnishes written confirmation of all transactions in the accounts, including information needed by shareholders for tax records. Common shares in the account of each Plan participant will be held by the Plan Administrator on behalf of the Plan participant, and each shareholder proxy will include those shares purchased or received pursuant to the Plan. The Plan Administrator will forward all proxy solicitation materials to participants and vote proxies for shares held under the Plan in accordance with the instruction of the participants.
There will be no brokerage charges with respect to common shares issued directly by the Fund. However, each participant will pay a pro rata share of brokerage commission incurred in connection with Open-Market Purchases. The automatic reinvestment of Dividends will not relieve participants of any Federal, state or local income tax that may be payable (or required to be withheld) on such Dividends.
The Fund reserves the right to amend or terminate the Plan. There is no direct service charge to participants with regard to purchases in the Plan; however, the Fund reserves the right to amend the Plan to include a service charge payable by the participants.
All correspondence or questions concerning the Plan should be directed to the Plan Administrator, The Bank of New York, P.O. Box 463, East Syracuse, New York 13057-0463, Attention: Shareholder Services Department, Phone Number: (866) 488-3559.
26 | Annual Report | December 31, 2006
TYW|TS&W/Claymore Tax-Advantaged Balanced Fund
Fund Informationl
| | | | | | |
| Board of Trustees | | Officers | | Investment Manager – Equity and Income | | Preferred Stock – Dividend Paying Agent |
Matthew J. Appelstein* Randall C. Barnes | | Nicholas Dalmaso Chief Executive and Legal Officer | | Thompson, Siegel & Walmsley, Inc. Richmond,Virginia | | The Bank of New York NewYork, NewYork |
Steven D. Cosler Nicholas Dalmaso* Robert M. Hamje L. Kent Moore Ronald A. Nyberg Ronald E. Toupin, Jr. * Trustee is an “interested person” of the Fund as defined in the Investment Company Act of 1940, as amended. | | Steven M. Hill Chief Financial Officer, Chief Accounting Officer and Treasurer James Howley Assistant Treasurer Vincent R. Giordano Vice President George Gregorio Vice President Roberto W. Roffo Vice President Bruce Saxon Chief Compliance Officer Matthew Patterson Secretary Melissa Nyugen Assistant Secretary | | Investment Manager – Municipals** SMC Fixed Income Management, LP Princeton, New Jersey Investment Adviser and Administrator Claymore Advisors, LLC Lisle, Illinois Custodian and Transfer Agent The Bank of New York NewYork, NewYork ** Effective July 11, 2006 | | Legal Counsel Skadden, Arps, Slate, Meagher & Flom LLP Chicago, Illinois Independent Registered Public Accounting Firm Ernst & Young LLP Chicago, Illinois |
Privacy Principles of TS&W/Claymore Tax-Advantaged Balanced Fund for Shareholders
The Fund is committed to maintaining the privacy of its shareholders and to safeguarding its non-public personal information. The following information is provided to help you understand what personal information the Fund collects, how we protect that information and why, in certain cases, we may share information with select other parties.
Generally, the Fund does not receive any non-public personal information relating to its shareholders, although certain non-public personal information of its shareholders may become available to the Fund. The Fund does not disclose any non-public personal information about its shareholders or former shareholders to anyone, except as permitted by law or as is necessary in order to service shareholder accounts (for example, to a transfer agent or third party administrator).
The Fund restricts access to non-public personal information about the shareholders to Claymore Advisors, LLC employees with a legitimate business need for the information. The Fund maintains physical, electronic and procedural safeguards designed to protect the non-public personal information of its shareholders.
Questions concerning your shares of TS&W/Claymore Tax-Advantaged Balanced Fund?
| | • | | If your shares are held in a Brokerage Account, contact your Broker. |
| | • | | If you have physical possession of your shares in certificate form, contact the Fund’s Custodian and Transfer Agent: |
The Bank of New York, 111 Sanders Creek Parkway, East Syracuse, NY 13057 (800) 701-8178
This report is sent to shareholders of TS&W/Claymore Tax-Advantaged Balanced Fund for their information. It is not a Prospectus, circular or representation intended for use in the purchase or sale of shares of the Fund or of any securities mentioned in this report.
A description of the Fund’s proxy voting policies and procedures related to portfolio securities is available without charge, upon request, by calling the Fund at (800) 345-7999 or on the Securities & Exchange Commission’s (“SEC’s”) website at http://www.sec.gov.
Information regarding how the Fund voted proxies for portfolio securities, if applicable, during the most recent 12-month period ended June 30, is also available, without charge and upon request by calling the Fund at (800) 345-7999 or by accessing the Fund’s Form N-PX on the SEC’s website at http://www.sec.gov.
The Fund files it complete schedule of portfolio holdings with the SEC for the first and third quarters of each fiscal year on Form N-Q. The Fund’s Form N-Q is available on the SEC website at http://www.sec.gov. The Fund’s Form N-Q may also be viewed and copied at the SEC’s Public Reference Room in Washington, DC; information on the operation of the Public Reference Room may be obtained by calling (800) SEC-0330 or at www.claymore.com.
In September 2006, the Fund submitted a CEO annual certification to the NYSE in which the Fund’s principal executive officer certified that he was not aware, as of the date of the certification, of any violation by the Fund of the NYSE’s Corporate Governance listing standards. In addition, as required by Section 302 of the Sarbanes-Oxley Act of 2002 and related SEC rules, the Fund’s principal executive and principal financial officers have made quarterly certifications, included in filings with the SEC on Forms N-CSR and N-Q, relating to, among other things, the Fund’s disclosure controls and procedures and internal control over financial reporting.
Annual Report | December 31, 2006 | 27
TYW | TS&W/Claymore Tax-Advantaged Balanced Fund
About the Fund Managers |
TS&W/Claymore Tax-Advantaged Balanced Fund (TYW) is managed jointly by seasoned investment professionals from SMC Fixed Income Management, LP and Thompson, Siegel & Walmsley, Inc. The teams employ their specialized experience to different sleeves within the Fund, but work closely with one another to collectively guide the overall operations of TYW.
Claymore Advisors, LLC
Claymore Advisors, LLC is a registered investment adviser that provides investment management and research-related services to registered investment companies and separately managed accounts. Claymore Advisors, LLC is responsible for the Fund’s overall asset allocation.
SMC Fixed Income Management, LP
SMC Fixed Income Management, LP (“SMC”) is a subsidiary of Spring Mountain Capital LP (“Spring Mountain”). Spring Mountain is an investment management firm founded in July 2001 that specializes in alternative investments and advisory services for both broad asset allocation and/or focused portfolios.
SMC’s Investment Philosophy and Process
SMC attempts to identify investment grade and below-investment grade municipal securities that are trading at attractive valuations relative to the Firm’s evaluation of the issuer’s creditworthiness, and with respect to private activity bonds, the profit potential of the corporation from which the revenue supporting the bonds is derived.
The municipal management team begins their credit selection process by analyzing broad macroeconomic trends and developments affecting the fixed-income markets. The managers analyze the economic outlook, market conditions and perceived effects on interest rates and yield curves. From there they incorporate a bottom-up and top-down analysis that helps construct a portfolio that the managers believe optimizes federally tax-exempt income while seeking to avoid undue credit risk and market timing risk. SMC’s proprietary, unbiased research helps the managers identify undervalued sectors that they believe have the potential for ratings upgrades and capital appreciation.
Thompson, Siegel & Walmsley, Inc. (TS&W)
Thompson, Siegel & Walmsley, Inc. (TS&W) is a registered investment adviser founded in 1969 in Richmond, Virginia and provides investment management services to corporations, pension and profit-sharing plans, 401(k) and thrift plans, open and closed-end mutual funds, trusts, estates and other institutions and individuals. The firm is a wholly owned subsidiary of Old Mutual (US) Holdings Inc. TS&W is responsible for the day-today management of the equity and taxable income securities portion of the Fund.
TS&W Investment Philosophy and Process
Thompson, Siegel & Walmsley, Inc.’s investment process is value-driven and team-oriented. TS&W pursues a relative value-oriented philosophy and focuses its equity selection on the higher dividend-paying stocks that meet its investment criteria. TS&W employs a proprietary quantitative valuation model that is applied to more than 400 stocks. This directs the managers’ review process toward companies that they believe have the highest expected return potential over a multi-year period. TS&W’s in-house research analysts are responsible for validating the model inputs for companies under their coverage and monitoring them over the holding period. Buys and sells are discussed at weekly research meetings or more frequently as needed. TS&W’s Fixed-Income team is responsible for overall bond market strategy as well as security selection. In-house analysts are used to support the credit review process.
| | |
| Claymore Securities, Inc. | | 
|
| 2455 Corporate West Drive | |
| Lisle, IL 60532 | |
| Member NASD/SIPC | |
(a) The registrant has adopted a code of ethics (the “Code of Ethics”) that applies to its principal executive officer, principal financial officer, principal accounting officer or controller, or persons performing similar functions.
(b) No information need be disclosed pursuant to this paragraph.
(c) During the period covered by the annual report, the Code of Ethics was revised to include more detail regarding the procedures to be followed for investigating, enforcing and reporting Code of Ethics issues.
(d) The registrant has not granted a waiver or an implicit waiver to its principal executive officer, principal financial officer, principal accounting officer or controller, or persons performing similar functions from a provision of its Code of Ethics during the period covered by this report.
(e) Not applicable.
(f) (1) The registrant’s Code of Ethics is attached hereto as an exhibit.
| Item 3. | Audit Committee Financial Expert. |
The registrant’s Board of Trustees has determined that it has at least one audit committee financial expert serving on its audit committee, Ronald E. Toupin, Jr. Mr. Toupin is an “independent” Trustee for purposes of Item 3 of Form N-CSR. Mr. Toupin qualifies as an audit committee financial expert by virtue of his experience obtained as a portfolio manager and research analyst, which included review and analysis of offering documents and audited and unaudited financial statements using GAAP to show accounting estimates, accruals and reserves.
(Under applicable securities laws, a person who is determined to be an audit committee financial expert will not be deemed an “expert” for any purpose, including without limitation for the purposes of Section 11 of the Securities Act of 1933, as amended, as a result of being designated or identified as an audit committee financial expert. The designation or identification of a person as an audit committee financial expert does not impose on such person any duties, obligations, or liabilities that are greater than the duties, obligations, and liabilities imposed on such person as a member of the audit committee and Board of Trustees in the absence of such designation or identification. The designation or identification of a person as an audit committee financial expert doesn’t affect the duties, obligations or liability of any other member of the audit committee or Board of Trustees.)
| Item 4. | Principal Accountant Fees and Services. |
(a) Audit Fees: the aggregate fees billed for the fiscal year 2006 for professional services rendered by the principal accountant for the audit of the registrant’s annual financial statements were
approximately $37,000. The aggregate fees billed for the fiscal year 2005 for professional services rendered by the principal accountant for the audit of the registrant’s annual financial statements were $36,000.
(b) Audit-Related Fees: the aggregate fees billed for the fiscal year 2006 for assurance and related services by the principal accountant that are reasonably related to the performance of the audit of the registrant’s financial statements and are not reported under paragraph (a) of this Item were $5,500. The Audit-Related Fees for the fiscal year 2005 were $5,000. Specifically, this amount represents the amount paid for the audit of the preferred shares asset coverage test.
(c) Tax Fees: the aggregate fees billed for the fiscal year 2006, for professional services rendered by the principal accountant for tax compliance, tax advice, and tax planning were $6,000. The Tax Fees for the fiscal year 2005 were $5,000.
(d) All Other Fees: the aggregate fees billed for the fiscal year 2006, for products and services provided by the principal accountant, other than the services reported in paragraphs (a) and (c) of this Item were $0. The Other Audit Fees for the fiscal year 2005 were $0.
The registrant’s principal accountant did not bill fees for services not included in Items 4(b), (c) or (d) above that required pre-approval by the Audit Committee pursuant to paragraph (c)(7)(ii) of Rule 2-01 of Regulation S-X during the Registrant’s last two fiscal years.
(e) Audit Committee Pre-Approval Policies and Procedures.
The Registrant’s audit committee reviews, and in its sole discretion, pre-approves, pursuant to written pre-approval procedures (A) all engagements for audit and non-audit services to be provided by the principal accountant to the registrant and (B) all engagements for non-audit services to be provided by the principal accountant (1) to the registrant’s investment adviser (not including a sub-adviser whose role is primarily portfolio management and is sub-contracted or overseen by another investment adviser) and (2) to any entity controlling, controlled by or under common control with the registrant’s investment adviser that provides ongoing services to the registrant; but in the case of the services described in subsection (B)(1) or (2), only if the engagement relates directly to the operations and financial reporting of the registrant; provided that such pre-approval need not be obtained in circumstances in which the pre-approval requirement is waived under rules promulgated by the Securities and Exchange Commission or New York Stock Exchange listing standards. Sections IV.C.2 and IV.C.3 of the Audit Committee’s revised Audit Committee Charter contain the Audit Committee’s Pre-Approval Policies and Procedures and such sections are included below.
| | |
| IV.C.2 | | Pre-approve any engagement of the independent auditors to provide any non-prohibited services to the Trust, including the fees and other compensation to be paid to the independent auditors (unless an exception is available under Rule 2-01 of Regulation S-X). |
| |
| | (a) The Chairman or any member of the Audit Committee may grant the pre-approval of services to the Fund for non-prohibited services up to $10,000. All such delegated pre-approvals shall be presented to the Audit Committee no later than the next Audit Committee meeting. |
| | |
| IV.C.3 | | Pre-approve any engagement of the independent auditors, including the fees and other compensation to be paid to the independent auditors, to provide any non-audit services to the Adviser (or any “control affiliate” of the Adviser providing ongoing services to the Trust), if the engagement relates directly to the operations and financial reporting of the Trust (unless an exception is available under Rule 2-01 of Regulation S-X). |
| |
| | (a) The Chairman or any member of the Audit Committee may grant the pre-approval for non-prohibited services to the Adviser up to $10,000. All such delegated pre-approvals shall be presented to the Audit Committee no later than the next Audit Committee meeting. |
(ii) None of the services described in each of Items 4(b) through (d) were approved by the audit committee pursuant to paragraph (c)(7)(i)(C) of Rule 2-01 of Regulation S-X.
(f) Not Applicable.
(g) The aggregate non-audit fees billed by the registrant's accountant for services rendered to the registrant, the registrant’s investment adviser and any entity controlling, controlled by, or under common control with the adviser that provides ongoing services to the registrant (not including a sub-adviser whose role is primarily portfolio management and is sub-contracted with or overseen by another investment adviser) that directly related to the operations and financial reporting of the registrant for the fiscal year 2006 were $11,500 and for the fiscal year 2005 were $10,000.
(h) Not Applicable.
| Item 5. | Audit Committee of Listed Registrants. |
(a) The registrant has a separately designated standing audit committee established in accordance with Section 3(a)(58)(A) of the Securities Exchange Act of 1934. The audit committee of the registrant is comprised of: Randall C. Barnes, Steven D. Cosler, Robert M. Hamje, L. Kent Moore, Ronald A. Nyberg and Ronald E. Toupin.
(b) Not Applicable.
| Item 6. | Schedule of Investments. |
The Schedule of Investments is included as part of Item 1.
| Item 7. | Disclosure of Proxy Voting Policies and Procedures for Closed-End Management Investment Companies. |
The registrant has delegated the voting of proxies relating to its voting securities to the investment sub-adviser of its equity portfolio, Thompson, Siegel & Walmsley, Inc. (“TS&W”). TS&W’s Proxy Voting Policies and Procedures are included as an exhibit hereto.
| Item 8. | Portfolio Managers of Closed-End Management Investment Companies. |
(a)(1) TS&W is responsible for the day-to-day management of the equity and income securities portion of the registrant’s portfolio. SMC Fixed Income Management, LP (“SMC”) also serves as investment sub-adviser to the registrant and is responsible for the day-to-day management of the municipal securities portion of the registrant’s portfolio.
TS&W Portfolio Managers
The following individuals at TS&W share primary responsibility for the management of the equity and income securities portion of the registrant’s portfolio:
| | | | |
Name | | Since | | Professional Experience |
| William M. Bellamy, CFA, Vice President and Portfolio Manager | | 2004 | | Mr. Bellamy has over 17 years of experience working with fixed income securities. Prior to joining Thompson, Siegel & Walmsley, Inc. in 2002, Mr. Bellamy was with Trusco Capital Management where he served as a Vice President, Fixed Income Portfolio Manager. Prior to Trusco, he was employed with First Union Capital Markets, Clayton Brown & Associates and Merrill Lynch Capital Markets in Institutional Fixed Income Sales. Mr. Bellamy received his Bachelor of Science from Cornell University and his MBA from Duke University. |
| | |
| Paul A. Ferwerda, CFA, Senior Vice President and Portfolio Manager, Domestic Equity and Research | | 2004 | | Mr. Ferwerda is a member of the Investment Policy Committee and brings to the investment team 20 years experience with the firm and 24 years overall investment experience. Mr. Ferwerda contributes significant research expertise within the Financial sector. Prior to joining the firm, Mr. Ferwerda was a Portfolio Manager with AmSouth Bank in Birmingham, AL. He received his Bachelor of Science degree from Auburn University and his MBA from Duke University. |
Mr. Ferwerda is responsible for managing the qualified dividend income (“QDI”) portion of the Fund. Mr. Bellamy is responsible for managing the non-QDI portion of the Fund, including high yield bonds, preferred stocks and real estate investment trusts.
SMC Portfolio Managers
The following individuals at SMC share primary responsibility for the management of the municipal securities portion of the registrant’s portfolio:
| | | | |
Name | | Since | | Professional Experience |
| Vincent R. Giordano | | 2004 | | Senior Managing Director and Portfolio Manager of SMC Fixed Income Management. Previously, Senior Managing Director of Claymore Advisors, LLC; Senior Vice President and Portfolio Manager of Merrill Lynch Asset Management, Inc. |
| | |
| Roberto W. Roffo | | 2004 | | Senior Managing Director and Portfolio Manager of SMC Fixed Income Management. Previously, Senior Managing Director of Claymore Advisors, LLC; Director and Vice President of Merrill Lynch Investment Managers. |
Mr. Roffo is responsible for identifying investment opportunities and executing transactions on behalf of the municipal securities portion of the registrant’s portfolio. Mr. Giordano oversees Mr. Roffo’s activities and works jointly with Mr. Roffo to formulate investment strategies.
The information disclosed in this paragraph (a)(1) of Item 8 is provided as of March 9, 2007.
(a)(2)
TS&W Other Accounts Managed
TS&W does not manage any accounts for which the advisory fee is based upon the performance of the account. The following table summarizes information regarding each of the other accounts managed by the TS&W portfolio managers as of December 31, 2006:
| | | | | | | | | | | | | | |
| | | Registered Investment
Companies | | Other Pooled
Investment Vehicles | | Other Accounts |
Name | | # of
Accounts | | Total Assets | | # of
Accounts | | Total Assets | | # of
Accounts | | Total Assets |
William M. Bellamy | | 1 | | $ | 35,012,170 | | 0 | | 0 | | 23 | | $ | 362,185,100 |
Paul A. Ferwerda | | 0 | | | 0 | | 0 | | 0 | | 30 | | $ | 320,500,00 |
SMC Other Accounts Managed
SMC does not manage any accounts for which the advisory fee is based upon the performance of the account. The following table summarizes information regarding each of the other accounts managed by the SMC portfolio managers as of December 31, 2006:
| | | | | | | | | | | | | | |
| | | Registered Investment
Companies | | Other Pooled
Investment Vehicles | | Other Accounts |
Name | | # of
Accounts | | Total Assets | | # of
Accounts | | Total Assets | | # of
Accounts | | Total Assets |
Vincent R. Giordano | | 1 | | $ | 17,000,000 | | 0 | | 0 | | 3 | | $ | 19,000,000 |
Roberto W. Roffo | | 1 | | $ | 17,000,000 | | 0 | | 0 | | | | $ | 19,000,000 |
TS&W Potential Conflicts of Interest
Two of the other accounts TS&W advises are long-short accounts and may sell securities short, including securities with respect to which other accounts managed by TS&W hold long positions. Procedures are in place to ensure that no primary holdings in accounts managed by TS&W will be shorted by any other account advised by TS&W. The term “primary holdings” refer to any core holding in any of the firm’s equity products. Primary holdings specifically exclude miscellaneous securities most frequently held in the taxable portfolios of TS&W’s clients.
Mr. Bellamy and Mr. Ferwerda do not manage accounts that can short securities. The portfolio managers responsible for those portfolios that can short securities are not separated from the rest of TS&W’s investment personnel and therefore have access to full information about TS&W’s investment research and the strategies being employed for accounts managed by TS&W.
Some other accounts managed by TS&W pay TS&W management fees at rates comparable to and in some cases lower than those paid by the registrant and other accounts managed by TS&W. The long-short accounts that TS&W manages have performance fee incentives. As a result, TS&W may have a conflict between its own interests and the interests of its other investment advisory clients in managing these long-short accounts. The Sub-Adviser has adopted various procedures and safeguards to mitigate these potential conflicts.
SMC Potential Conflicts of Interest
At times there may be instances when securities are being purchased or sold by SMC for more than one account. On a daily basis, SMC’s Chief Compliance Officer reviews and approves all trades for all accounts assuring that there has been fair allocation among accounts. When necessary, SMC’s Chief Compliance Officer will question the portfolio managers to assure fair allocation among all accounts managed has taken place.
(a)(3)
TS&W Portfolio Manager Compensation
TS&W compensates Mr. Bellamy and Mr. Ferwerda for their management of the equity and income producing securities portion of the registrant’s portfolio. Compensation is comprised of a fixed base salary and discretionary performance bonus that is based on the overall success of the firm, an individual’s responsibility and his/her performance versus expectations, which are reviewed annually. That evaluation includes the professional's own self-assessment of their years’ work relative to their responsibilities and also includes peer and supervisor evaluations. TS&W’s compensation strategy is to provide reasonable base salaries commensurate with an individual’s responsibility and provide performance bonus awards that can exceed base salary. A summary of
the input goes to the Remuneration Committee of TS&W’s Board of Directors and they determine the specific compensation, salary plus bonus, for the individual. Total compensation of TS&W’s portfolio managers is not related to fund performance. Additionally, there is a qualified profit sharing plan and a long-term incentive plan, which is eligible for participation by all TS&W associates.
SMC Portfolio Manager Compensation
SMC compensates Mr. Giordano and Mr. Roffo for their management of the municipal securities portion of the registrant’s portfolio. Compensation consists of a fixed based salary and is based on the experience and qualifications of each portfolio manager. All SMC employees are also eligible to participate in a 401(k) plan, which does not include matching funds from any other party.
(a)(4)
TS&W Portfolio Manager Securities Ownership
The following table discloses the dollar range of equity securities of the registrant beneficially owned by each TS&W portfolio manager as of December 31, 2006:
| | | |
Name of Portfolio Manager | | Dollar Range of Equity
Securities in Fund |
William M. Bellamy | | | None |
Paul A. Ferwerda | | $ | 10,001-$50,000 |
SMC Portfolio Manager Securities Ownership
The following table discloses the dollar range of equity securities of the registrant beneficially owned by each SMC portfolio manager as of December 31, 2006:
| | | |
Name of Portfolio Manager | | Dollar Range of Equity
Securities in Fund |
Vincent R. Giordano | | $ | 10,001-$50,000 |
Roberto W. Roffo | | $ | 1-$10,000 |
Item 9. Purchases of Equity Securities by Closed-End Management Investment Company and Affiliated Purchasers.
None.
Item 10. Submission of Matters to a Vote of Security Holders.
The registrant has not made any material changes to the procedures by which shareholders may recommend nominees to the registrant’s Board of Trustees.
Item 11. Controls and Procedures.
(a) The registrant’s principal executive officer and principal financial officer have evaluated the registrant’s disclosure controls and procedures within 90 days of this filing and have concluded based on such evaluation, that the registrant’s disclosure controls and procedures were effective as of that date in ensuring that information required to be disclosed by the registrant in this Form N-CSR was recorded, processed, summarized, and reported within the time periods specified in the Securities and Exchange Commission’s rules and forms.
(b) There were no changes in the registrant’s internal control over financial reporting (as defined in Rule 30a-3(d) under the Investment Company Act of 1940) that occurred during the registrant’s second fiscal quarter of the period covered by this report that have materially affected, or are reasonably likely to materially affect, the registrant’s internal control over financial reporting.
| | |
| (a)(1) | | Code of Ethics for Chief Executive and Senior Financial Officer. |
| |
| (a)(2) | | Certifications of principal executive officer and principal financial officer pursuant to Rule 30a-2 of the Investment Company Act of 1940. |
| |
| (b) | | Certifications of principal executive officer and principal financial officer pursuant to Section 906 of the Sarbanes-Oxley Act of 2002. |
| |
| (c) | | Proxy Voting Policies and Procedures. |
SIGNATURES
Pursuant to the requirements of the Securities Exchange Act of 1934 and the Investment Company Act of 1940, the registrant has duly caused this report to be signed on its behalf by the undersigned, thereunto duly authorized.
| | |
| (Registrant) TS&W/Claymore Tax-Advantaged Balanced Fund |
| |
| By: | | /s/ Nicholas Dalmaso |
| Name: | | Nicholas Dalmaso |
| Title: | | Chief Legal and Executive Officer |
Date: March 7, 2007
Pursuant to the requirements of the Securities Exchange Act of 1934 and the Investment Company Act of 1940, this report has been signed by the following persons on behalf of the registrant and in the capacities and on the dates indicated.
| | |
| |
| By: | | /s/ Nicholas Dalmaso |
| Name: | | Nicholas Dalmaso |
| Title: | | Chief Legal and Executive Officer |
Date: March 7, 2007
| | |
| |
| By: | | /s/ Steven M. Hill |
| Name: | | Steven M. Hill |
| Title: | | Treasurer and Chief Financial Officer |
Date: March 7, 2007