UNITED STATES
SECURITIES AND EXCHANGE COMMISSION
Washington, D.C. 20549
FORM N-CSR
CERTIFIED SHAREHOLDER REPORT OF REGISTERED MANAGEMENT INVESTMENT COMPANIES
Investment Company Act file number 811-21549
First Trust Energy Income and Growth Fund
(Exact name of registrant as specified in charter)
10 Westport Road Suite C101A
Wilton, CT 06897
(Address of principal executive offices) (Zip code)
W. Scott Jardine, Esq.
First Trust Portfolios L.P.
120 East Liberty Drive, Suite 400
Wheaton, IL 60187
(Name and address of agent for service)
registrant’s telephone number, including area code: 630-765-8000
Date of fiscal year end:November 30
Date of reporting period:May 31, 2019
Form N-CSR is to be used by management investment companies to file reports with the Commission not later than 10 days after the transmission to stockholders of any report that is required to be transmitted to stockholders under Rule 30e-1 under the Investment Company Act of 1940 (17 CFR 270.30e-1). The Commission may use the information provided on Form N-CSR in its regulatory, disclosure review, inspection, and policymaking roles.
A registrant is required to disclose the information specified by Form N-CSR, and the Commission will make this information public. A registrant is not required to respond to the collection of information contained in Form N-CSR unless the Form displays a currently valid Office of Management and Budget (“OMB”) control number. Please direct comments concerning the accuracy of the information collection burden estimate and any suggestions for reducing the burden to Secretary, Securities and Exchange Commission, 100 F Street, NE, Washington, DC 20549. The OMB has reviewed this collection of information under the clearance requirements of 44 U.S.C. § 3507.
Item 1. Reports to Stockholders.
The Report to Shareholders is attached herewith.


| 1 | |
| 2 | |
| 3 | |
| 6 | |
| 9 | |
| 10 | |
| 11 | |
| 12 | |
| 13 | |
| 14 | |
| 22 |
| • | Ninety-eight percent of companies in the S&P 500® Index reported earnings for the first quarter of 2019, and 76% of these companies beat their estimates. |
| • | The Consumer Confidence Index, as reported on May 28, 2019, hit a six-month high at 134.1. |
| • | The U.S. inflation rate hovers near 2% on average, as it has for the last decade. |
| • | The U.S. unemployment rate of 3.6% for May remains at the lowest level since December of 1969. |

| Fund Statistics | |
| Symbol on NYSE American | FEN |
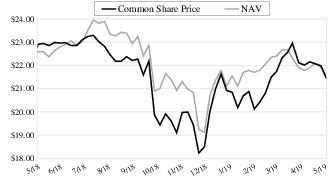
| Common Share Price | $21.44 |
| Common Share Net Asset Value (“NAV”) | $21.45 |
| Premium (Discount) to NAV | (0.05)% |
| Net Assets Applicable to Common Shares | $428,928,064 |
| Current Quarterly Distribution per Common Share(1) | $0.5800 |
| Current Annualized Distribution per Common Share | $2.3200 |
| Current Distribution Rate on Common Share Price(2) | 10.82% |
| Current Distribution Rate on NAV(2) | 10.82% |
| Performance | |||||
| Average Annual Total Returns | |||||
| 6 Months Ended 5/31/19 | 1 Year Ended 5/31/19 | 5 Years Ended 5/31/19 | 10 Years Ended 5/31/19 | Inception (6/24/04) to 5/31/19 | |
| Fund Performance(3) | |||||
| NAV | 6.40% | 6.05% | -1.69% | 10.47% | 8.61% |
| Market Value | 13.27% | 4.88% | -0.87% | 8.79% | 8.27% |
| Index Performance | |||||
| S&P 500® Index | 0.74% | 3.78% | 9.65% | 13.93% | 8.29% |
| Bloomberg Barclays U.S. Credit Index of Corporate Bonds | 8.55% | 7.40% | 3.47% | 5.78% | 5.08% |
| Alerian MLP Total Return Index | 3.29% | -1.12% | -6.61% | 7.74% | 8.43% |
| Wells Fargo Midstream MLP Total Return Index | 4.40% | -1.16% | -4.33% | 10.24% | 9.95% |
| Industry Classification | % of Total Investments |
| Natural Gas Transmission | 33.7% |
| Petroleum Product Transmission | 30.4 |
| Crude Oil Transmission | 17.0 |
| Electric Power & Transmission | 15.1 |
| Coal | 2.6 |
| Other | 0.9 |
| Propane | 0.3 |
| Total | 100.0% |
| Top Ten Holdings | % of Total Investments |
| Enterprise Products Partners, L.P. | 13.8% |
| Magellan Midstream Partners, L.P. | 9.4 |
| Kinder Morgan, Inc. | 7.2 |
| TC PipeLines, L.P. | 7.1 |
| Energy Transfer, L.P. | 5.6 |
| Enbridge, Inc. | 5.4 |
| Williams (The) Cos., Inc. | 5.3 |
| Plains All American Pipeline, L.P. | 5.2 |
| Holly Energy Partners, L.P. | 3.9 |
| NextEra Energy Partners, L.P. | 3.3 |
| Total | 66.2% |
| (1) | Most recent distribution paid or declared through 5/31/2019. Subject to change in the future. |
| (2) | Distribution rates are calculated by annualizing the most recent distribution paid or declared through the report date and then dividing by Common Share Price or NAV, as applicable, as of 5/31/2019. Subject to change in the future. |
| (3) | Total return is based on the combination of reinvested dividend, capital gain, and return of capital distributions, if any, at prices obtained by the Dividend Reinvestment Plan and changes in NAV per share for NAV returns and changes in Common Share Price for market value returns. Total returns do not reflect sales load and are not annualized for periods of less than one year. Past performance is not indicative of future results. |
| 1 | Total return is based on the combination of reinvested dividend, capital gain and return of capital distributions, if any, at prices obtained by the Dividend Reinvestment Plan and changes in NAV per Common Share for NAV returns and changes in Common Share price for market value returns. Total returns do not reflect sales load and are not annualized for periods of less than one year. Past performance is not indicative of future results. |
| Shares/ Units | Description | Value | ||
| MASTER LIMITED PARTNERSHIPS – 77.2% | ||||
| Chemicals – 0.8% | ||||
| 144,100 | Westlake Chemical Partners, L.P. (a) | $3,250,896 | ||
| Gas Utilities – 0.4% | ||||
| 79,500 | Suburban Propane Partners, L.P. (a) | 1,820,550 | ||
| Independent Power and Renewable Electricity Producers – 4.3% | ||||
| 422,211 | NextEra Energy Partners, L.P. (a) (b) | 18,682,837 | ||
| Oil, Gas & Consumable Fuels – 71.7% | ||||
| 849,816 | Alliance Resource Partners, L.P. (a) | 14,625,333 | ||
| 380,974 | BP Midstream Partners, L.P. (a) | 5,554,601 | ||
| 2,277,767 | Energy Transfer, L.P. (a) | 31,296,519 | ||
| 2,790,806 | Enterprise Products Partners, L.P. (a) (c) | 77,835,579 | ||
| 823,547 | Holly Energy Partners, L.P. (a) | 21,898,115 | ||
| 861,354 | Magellan Midstream Partners, L.P. (a) (c) | 52,973,271 | ||
| 292,200 | MPLX, L.P. (a) | 8,935,476 | ||
| 186,400 | Phillips 66 Partners, L.P. (a) | 8,943,472 | ||
| 1,282,901 | Plains All American Pipeline, L.P. (a) (c) | 29,006,392 | ||
| 346,000 | Shell Midstream Partners, L.P. (a) | 7,276,380 | ||
| 395,000 | Tallgrass Energy, L.P. (a) (b) | 9,397,050 | ||
| 1,097,950 | TC PipeLines, L.P. (a) | 39,778,728 | ||
| 307,520,916 | ||||
Total Master Limited Partnerships | 331,275,199 | |||
| (Cost $209,043,553) | ||||
| COMMON STOCKS – 53.6% | ||||
| Electric Utilities – 11.1% | ||||
| 25,700 | American Electric Power Co., Inc. (c) | 2,213,284 | ||
| 3,400 | Duke Energy Corp. (c) | 291,074 | ||
| 110,600 | Emera, Inc. (CAD) (a) | 4,258,378 | ||
| 56,400 | Eversource Energy (c) | 4,164,576 | ||
| 295,000 | Exelon Corp. (c) | 14,183,600 | ||
| 26,900 | Hydro One Ltd. (CAD) (a) (d) | 455,764 | ||
| 51,900 | NextEra Energy, Inc. (c) | 10,287,099 | ||
| 309,600 | PPL Corp. (c) | 9,213,696 | ||
| 300 | Southern (The) Co. | 16,050 | ||
| 46,800 | Xcel Energy, Inc. (c) | 2,683,512 | ||
| 47,767,033 | ||||
| Gas Utilities – 0.2% | ||||
| 3,600 | Atmos Energy Corp. (a) | 366,480 | ||
| 3,699 | Chesapeake Utilities Corp. (a) | 335,795 | ||
| 702,275 | ||||
| Multi-Utilities – 5.3% | ||||
| 69,000 | CMS Energy Corp. (c) | 3,871,590 | ||
| 247,699 | Public Service Enterprise Group, Inc. (c) | 14,554,793 | ||
| 30,700 | Sempra Energy (c) | 4,035,515 | ||
| 22,461,898 | ||||
| Oil, Gas & Consumable Fuels – 37.0% | ||||
| 827,096 | Enbridge, Inc. (a) | 30,495,030 | ||
| 478,280 | Equitrans Midstream Corp. (a) | 9,498,641 | ||
| 362,900 | Inter Pipeline, Ltd. (CAD) (a) | 5,531,030 | ||
| 139,560 | Keyera Corp. (CAD) (a) | 3,361,996 | ||
| 2,034,555 | Kinder Morgan, Inc. (a) (c) | 40,589,372 | ||
| Shares/ Units | Description | Value | ||
| COMMON STOCKS (Continued) | ||||
| Oil, Gas & Consumable Fuels (Continued) | ||||
| 284,784 | ONEOK, Inc. (c) | $18,117,958 | ||
| 74,300 | Targa Resources Corp. (c) | 2,857,578 | ||
| 376,871 | TC Energy Corp. (c) | 18,346,080 | ||
| 1,136,241 | Williams (The) Cos., Inc. (c) | 29,974,038 | ||
| 158,771,723 | ||||
Total Common Stocks | 229,702,929 | |||
| (Cost $204,875,820) | ||||
| REAL ESTATE INVESTMENT TRUSTS – 0.4% | ||||
| Equity Real Estate Investment Trusts – 0.4% | ||||
| 47,336 | CorEnergy Infrastructure Trust, Inc. (a) | 1,826,696 | ||
| (Cost $1,417,211) | ||||
Total Investments – 131.2% | 562,804,824 | |||
| (Cost $415,336,584) (e) | ||||
| Number of Contracts | Description | Notional Amount | Exercise Price | Expiration Date | Value | |||||
| CALL OPTIONS WRITTEN – (0.4)% | ||||||||||
| 257 | American Electric Power Co., Inc. | $2,213,284 | $92.50 | Sep 2019 | (14,906) | |||||
| 690 | CMS Energy Corp. | 3,871,590 | 60.00 | Sep 2019 | (37,950) | |||||
| 34 | Duke Energy Corp. | 291,074 | 92.50 | Jun 2019 | (102) | |||||
| 3,000 | Enterprise Products Partners, L.P. | 8,367,000 | 30.00 | Jun 2019 | (6,000) | |||||
| 5,100 | Enterprise Products Partners, L.P. | 14,223,900 | 30.00 | Sep 2019 | (132,600) | |||||
| 420 | Eversource Energy | 3,101,280 | 75.00 | Jul 2019 | (44,100) | |||||
| 2,050 | Exelon Corp. | 9,856,400 | 50.00 | Jul 2019 | (71,750) | |||||
| 4,300 | Kinder Morgan, Inc. | 8,578,500 | 21.00 | Sep 2019 | (202,100) | |||||
| 2,500 | Magellan Midstream Partners, L.P. (f) | 15,375,000 | 65.00 | Jun 2019 | (25,000) | |||||
| 2,062 | Magellan Midstream Partners, L.P. | 12,681,300 | 65.00 | Jul 2019 | (72,170) | |||||
| 242 | NextEra Energy, Inc. | 4,796,682 | 200.00 | Jun 2019 | (56,870) | |||||
| 277 | NextEra Energy, Inc. | 5,490,417 | 210.00 | Sep 2019 | (62,325) | |||||
| 2,165 | ONEOK, Inc. (f) | 13,773,730 | 72.50 | Jun 2019 | (10,825) | |||||
| 682 | ONEOK, Inc. | 4,338,884 | 70.00 | Jul 2019 | (19,096) | |||||
| 3,600 | Plains All American Pipeline, L.P. (f) | 8,139,600 | 25.00 | Jun 2019 | (18,000) | |||||
| 1,729 | Plains All American Pipeline, L.P. | 3,909,269 | 25.00 | Jul 2019 | (24,206) | |||||
| 92 | PPL Corp. (f) | 273,792 | 32.00 | Jun 2019 | (276) | |||||
| 3,000 | PPL Corp. | 8,928,000 | 34.00 | Jul 2019 | (9,000) | |||||
| 1,200 | Public Service Enterprise Group, Inc. | 7,051,200 | 55.00 | Jun 2019 | (432,000) | |||||
| 1,276 | Public Service Enterprise Group, Inc. | 7,497,776 | 62.50 | Jun 2019 | (3,448) | |||||
| 11 | Sempra Energy | 144,595 | 130.00 | Jun 2019 | (3,091) | |||||
| 296 | Sempra Energy | 3,890,920 | 140.00 | Jul 2019 | (16,280) | |||||
| 743 | Targa Resources Corp. | 2,857,578 | 43.00 | Jun 2019 | (7,430) | |||||
| 1,826 | TC Energy Corp. | 8,888,968 | 50.00 | Jun 2019 | (50,215) | |||||
| 4,020 | Williams (The) Cos., Inc. (f) | 10,604,760 | 30.00 | Jun 2019 | (24,120) | |||||
| 3,842 | Williams (The) Cos., Inc. | 10,135,196 | 28.00 | Jul 2019 | (92,208) | |||||
| 3,500 | Williams (The) Cos., Inc. | 9,233,000 | 29.00 | Jul 2019 | (35,000) | |||||
| 457 | Xcel Energy, Inc. | 2,620,438 | 55.00 | Jun 2019 | (129,103) | |||||
Total Call Options Written | (1,600,171) | |||||||||
| (Premiums received $2,167,297) | ||||||||||
Outstanding Loan – (35.7)% | (153,000,000) | ||
Net Other Assets and Liabilities – 4.9% | 20,723,411 | ||
Net Assets – 100.0% | $428,928,064 |
| (a) | All or a portion of this security serves as collateral on the outstanding loan. |
| (b) | This security is taxed as a “C” corporation for federal income tax purposes. |
| (c) | All or a portion of this security’s position represents cover for outstanding options written. |
| (d) | This security is restricted in the U.S. and cannot be offered for public sale without first being registered under the Securities Act of 1933, as amended. This security is not restricted on the foreign exchange where it trades freely without any additional registration. As such, it does not require the additional disclosure required of restricted securities. |
| (e) | Aggregate cost for federal income tax purposes was $365,688,226. As of May 31, 2019, the aggregate gross unrealized appreciation for all investments in which there was an excess of value over tax cost was $201,302,194 and the aggregate gross unrealized depreciation for all investments in which there was an excess of tax cost over value was $5,785,767. The net unrealized appreciation was $195,516,427. The amounts presented are inclusive of derivative contracts. |
| (f) | This investment is fair valued by the Advisor’s Pricing Committee in accordance with procedures adopted by the Fund’s Board of Trustees, and in accordance with the provisions of the Investment Company Act of 1940, as amended. At May 31, 2019, investments noted as such are valued at $(78,221) or (0.0)% of net assets. |
| CAD | Canadian Dollar - Security is denominated in Canadian Dollars and is translated into U.S. Dollars based upon the current exchange rate. |
| ASSETS TABLE | ||||
| Total Value at 5/31/2019 | Level 1 Quoted Prices | Level 2 Significant Observable Inputs | Level 3 Significant Unobservable Inputs | |
Master Limited Partnerships* | $ 331,275,199 | $ 331,275,199 | $ — | $ — |
Common Stocks* | 229,702,929 | 229,702,929 | — | — |
Real Estate Investment Trusts* | 1,826,696 | 1,826,696 | — | — |
Total Investments | $ 562,804,824 | $ 562,804,824 | $— | $— |
LIABILITIES TABLE | ||||
| Total Value at 5/31/2019 | Level 1 Quoted Prices | Level 2 Significant Observable Inputs | Level 3 Significant Unobservable Inputs | |
Call Options Written | $ (1,600,171) | $ (808,854) | $ (791,317) | $ — |
| * | See Portfolio of Investments for industry breakout. |
| ASSETS: | |
Investments, at value (Cost $415,336,584) | $ 562,804,824 |
Cash | 60,026,392 |
| Receivables: | |
Income taxes | 4,943,933 |
Dividends | 673,823 |
Interest | 290,000 |
Dividend reclaims | 61,097 |
Prepaid expenses | 9,261 |
Total Assets | 628,809,330 |
| LIABILITIES: | |
Outstanding loan | 153,000,000 |
Deferred income taxes | 44,072,092 |
Options written, at value (Premiums received $2,167,297) | 1,600,171 |
| Payables: | |
Interest and fees on loan | 519,470 |
Investment advisory fees | 502,267 |
Audit and tax fees | 92,834 |
Administrative fees | 26,688 |
Custodian fees | 23,829 |
Legal fees | 15,909 |
Shareholder reporting fees | 15,652 |
Transfer agent fees | 5,683 |
Trustees’ fees and expenses | 2,546 |
Financial reporting fees | 771 |
Other liabilities | 3,354 |
Total Liabilities | 199,881,266 |
NET ASSETS | $428,928,064 |
| NET ASSETS consist of: | |
Paid-in capital | $ 383,544,141 |
Par value | 199,954 |
Accumulated distributable earnings (loss) | 45,183,969 |
NET ASSETS | $428,928,064 |
NET ASSET VALUE,per Common Share (par value $0.01 per Common Share) | $21.45 |
Number of Common Shares outstanding (unlimited number of Common Shares has been authorized) | 19,995,360 |
| INVESTMENT INCOME: | ||
Dividends (net of foreign withholding tax of $412,245) | $ 9,625,323 | |
Interest | 173,476 | |
Total investment income | 9,798,799 | |
| EXPENSES: | ||
Interest and fees on loan | 2,976,736 | |
Investment advisory fees | 2,896,011 | |
Administrative fees | 139,879 | |
Shareholder reporting fees | 54,220 | |
Audit and tax fees | 49,924 | |
Custodian fees | 36,972 | |
At the market offering costs | 35,575 | |
Transfer agent fees | 16,215 | |
Legal fees | 16,212 | |
Trustees’ fees and expenses | 8,153 | |
Financial reporting fees | 4,625 | |
Other | 32,098 | |
Total expenses | 6,266,620 | |
NET INVESTMENT INCOME (LOSS) BEFORE TAXES | 3,532,179 | |
Current state income tax benefit (expense) | (981,446) | |
Current federal income tax benefit (expense) | (5,377,120) | |
Deferred federal income tax benefit (expense) | 5,562,786 | |
Deferred state income tax benefit (expense) | 1,124,785 | |
Total income tax benefit (expense) | 329,005 | |
NET INVESTMENT INCOME (LOSS) | 3,861,184 | |
| NET REALIZED AND UNREALIZED GAIN (LOSS): | ||
| Net realized gain (loss) before taxes on: | ||
Investments | 24,526,091 | |
Written options | 1,715,343 | |
Foreign currency transactions | (3,109) | |
Net realized gain (loss) before taxes | 26,238,325 | |
Current federal income tax benefit (expense) | (5,510,049) | |
Current state income tax benefit (expense) | (596,000) | |
Total income tax benefit (expense) | (6,106,049) | |
Net realized gain (loss) on investments, written options and foreign currency transactions | 20,132,276 | |
Net increase from payment by the sub-advisor before taxes | 130,183 | |
Current federal income tax benefit (expense) | (27,338) | |
Current state income tax benefit (expense) | (2,957) | |
Total income tax benefit (expense) | (30,295) | |
Net increase from payment by the sub-advisor | 99,888 | |
| Net change in unrealized appreciation (depreciation) before taxes on: | ||
Investments | 3,125,266 | |
Written options | 1,116,391 | |
Foreign currency translation | 143 | |
Net change in unrealized appreciation (depreciation) before taxes | 4,241,800 | |
Deferred federal income tax benefit (expense) | (1,556,668) | |
Deferred state income tax benefit (expense) | (21,198) | |
Total income tax benefit (expense) | (1,577,866) | |
Net change in unrealized appreciation (depreciation) on investments, written options and foreign currency translation | 2,663,934 | |
NET REALIZED AND UNREALIZED GAIN (LOSS) | 22,896,098 | |
NET INCREASE (DECREASE) IN NET ASSETS RESULTING FROM OPERATIONS | $ 26,757,282 | |
| Six Months Ended 5/31/2019 (Unaudited) | Year Ended 11/30/2018 | ||
| OPERATIONS: | |||
Net investment income (loss) | $ 3,861,184 | $ (3,979,575) | |
Net realized gain (loss) | 20,132,276 | 27,669,981 | |
Net increase from payment by the sub-advisor | 99,888 | — | |
Net change in unrealized appreciation (depreciation) | 2,663,934 | (6,442,747) | |
Net increase (decrease) in net assets resulting from operations | 26,757,282 | 17,247,659 | |
| DISTRIBUTIONS TO SHAREHOLDERS FROM: | |||
Investment operations | (23,181,876) | (40,205,780) | |
Return of capital (See Note 2E) | — | (5,960,091) | |
Total distributions to shareholders | (23,181,876) | (46,165,871) | |
| CAPITAL TRANSACTIONS: | |||
Proceeds from Common Shares sold through at the market offerings | — | 4,111,227 | |
Proceeds from Common Shares reinvested | 240,110 | 534,902 | |
Net increase (decrease) in net assets resulting from capital transactions | 240,110 | 4,646,129 | |
Total increase (decrease) in net assets | 3,815,516 | (24,272,083) | |
| NET ASSETS: | |||
Beginning of period | 425,112,548 | 449,384,631 | |
End of period | $ 428,928,064 | $ 425,112,548 | |
| CAPITAL TRANSACTIONS were as follows: | |||
Common Shares at beginning of period | 19,984,376 | 19,778,270 | |
Common Shares sold through at the market offerings | — | 183,236 | |
Common Shares issued as reinvestment under the Dividend Reinvestment Plan | 10,984 | 22,870 | |
Common Shares at end of period | 19,995,360 | 19,984,376 |
| Cash flows from operating activities: | ||
Net increase (decrease) in net assets resulting from operations | $26,757,282 | |
| Adjustments to reconcile net increase (decrease) in net assets resulting from operations to net cash provided by operating activities: | ||
Purchases of investments | (246,262,972) | |
Sales of investments | 309,809,653 | |
Proceeds from written options | 5,035,433 | |
Amount paid to close written options | (1,066,133) | |
Return of capital received from investment in MLPs | 9,376,671 | |
Net realized gain/loss on investments and written options | (26,241,434) | |
Net change in unrealized appreciation/depreciation on investments and written options | (4,241,657) | |
Net increase from payment by the sub-advisor | (130,183) | |
Decrease in deferred income tax payable | (5,109,706) | |
| Changes in assets and liabilities: | ||
Decrease in income tax receivable | 7,362,227 | |
Increase in interest receivable | (110,000) | |
Increase in dividend reclaims receivable | (61,097) | |
Increase in dividends receivable | (264,655) | |
Decrease in prepaid expenses | 28,013 | |
Increase in interest and fees payable on loan | 31,675 | |
Increase in investment advisory fees payable | 28,628 | |
Decrease in audit and tax fees payable | (7,075) | |
Increase in legal fees payable | 11,078 | |
Decrease in shareholder reporting fees payable | (16,756) | |
Increase in administrative fees payable | 560 | |
Increase in custodian fees payable | 1,387 | |
Increase in transfer agent fees payable | 2,534 | |
Decrease in Trustees’ fees and expenses payable | (146) | |
Decrease in offering costs payable | (78,750) | |
Increase in other liabilities payable | 148 | |
Cash provided by operating activities | $74,854,725 | |
| Cash flows from financing activities: | ||
Proceeds from Common Shares reinvested | 240,110 | |
Distributions to Common Shareholders from investment operations | (23,181,876) | |
Repayment of borrowing | (8,500,000) | |
Proceeds from borrowing | 11,000,000 | |
Cash used in financing activities | (20,441,766) | |
Increase in cash | 54,412,959 | |
Cash at beginning of period | 5,613,433 | |
Cash at end of period | $60,026,392 | |
| Supplemental disclosure of cash flow information: | ||
Cash paid during the period for interest and fees | $2,945,061 | |
Cash paid during the period for taxes | $5,132,683 |
| Six Months Ended 5/31/2019 (Unaudited) | Year Ended November 30, | ||||||||||
| 2018 | 2017 | 2016 | 2014 | 2014 | |||||||
Net asset value, beginning of period | $ 21.27 | $ 22.72 | $ 25.27 | $ 25.41 | $ 38.08 | $ 32.93 | |||||
| Income from investment operations: | |||||||||||
Net investment income (loss) (a) | 0.19 | (0.20) | 0.13 | 0.04 | 0.18 | (0.03) | |||||
Net realized and unrealized gain (loss) | 1.15 (b) | 1.07 | (0.37) (b) | 2.14 (b) | (10.59) | 7.33 | |||||
Total from investment operations | 1.34 | 0.87 | (0.24) | 2.18 | (10.41) | 7.30 | |||||
| Distributions paid to shareholders from: | |||||||||||
Net investment income | (0.32) | (0.38) | — | — | — | — | |||||
Net realized gain | (0.84) | (1.64) | (2.32) | (0.25) | (2.26) | (2.15) | |||||
Return of capital | — | (0.30) | — | (2.07) | — | — | |||||
Total distributions paid to Common Shareholders | (1.16) | (2.32) | (2.32) | (2.32) | (2.26) | (2.15) | |||||
Premiums from shares sold in at the market offering | — | 0.00 (c) | 0.01 | — | — | — | |||||
Net asset value, end of period | $21.45 | $21.27 | $22.72 | $25.27 | $25.41 | $38.08 | |||||
Market value, end of period | $21.44 | $19.97 | $22.24 | $26.30 | $23.12 | $35.47 | |||||
Total return based on net asset value (d) | 6.40% (b) | 3.69% | (1.42)% (b) | 9.61% (b) | (28.30)% | 23.06% | |||||
Total return based on market value (d) | 13.27% | (0.55)% | (7.28)% | 25.39% | (29.96)% | 16.57% | |||||
Net assets, end of period (in 000’s) | $ 428,928 | $ 425,113 | $ 449,385 | $ 489,743 | $ 491,820 | $ 737,135 | |||||
Portfolio turnover rate | 41% | 42% | 40% | 54% | 28% | 21% | |||||
| Ratios of expenses to average net assets: | |||||||||||
Including current and deferred income taxes (e) | 6.37% (f) | (7.20)% | 2.07% | 7.65% | (15.26)% | 13.34% | |||||
Excluding current and deferred income taxes | 2.92% (f) | 2.79% | 2.68% | 2.60% | 2.21% | 2.04% | |||||
Excluding current and deferred income taxes and interest expense | 1.54% (f) | 1.54% | 1.52% | 1.51% | 1.47% | 1.37% | |||||
| Ratios of net investment income (loss) to average net assets: | |||||||||||
Net investment income (loss) ratio before tax expenses | 1.65% (f) | (0.42)% | (0.09)% | (0.77)% | 0.72% | (0.15)% | |||||
Net investment income (loss) ratio including tax expenses (e) | (1.80)% (f) | 9.57% | 0.52% | (5.82)% | 18.18% | (11.46)% | |||||
| Indebtedness: | |||||||||||
Total loan outstanding (in 000’s) | $ 153,000 | $ 150,500 | $ 155,500 | $ 174,500 | $ 183,000 | $ 248,000 | |||||
Asset coverage per $1,000 of indebtedness (g) | $ 3,803 | $ 3,825 | $ 3,890 | $ 3,807 | $ 3,688 | $ 3,972 | |||||
| (a) | Based on average shares outstanding. |
| (b) | During the six months ended May 31, 2019 and the fiscal years ended November 30, 2017 and 2016, the sub-advisor reimbursed the Fund $130,183, $39,539 and $55,570, respectively, in connection with trade errors which each represent less than $0.01 per share. Since the sub-advisor reimbursed the Fund, there was no effect on the total return. |
| (c) | Amount is less than $0.01. |
| (d) | Total return is based on the combination of reinvested dividend, capital gain and return of capital distributions, if any, at prices obtained by the Dividend Reinvestment Plan, and changes in net asset value per share for net asset value returns and changes in Common Share Price for market value returns. Total returns do not reflect sales load and are not annualized for periods of less than one year. Past performance is not indicative of future results. |
| (e) | Includes current and deferred income taxes associated with each component of the Statement of Operations. |
| (f) | Annualized. |
| (g) | Calculated by subtracting the Fund’s total liabilities (not including the loan outstanding) from the Fund’s total assets, and dividing by the outstanding loan balance in 000’s. |
| 1) | the type of security; |
| 2) | the size of the holding; |
| 3) | the initial cost of the security; |
| 4) | transactions in comparable securities; |
| 5) | price quotes from dealers and/or third-party pricing services; |
| 6) | relationships among various securities; |
| 7) | information obtained by contacting the issuer, analysts, or the appropriate stock exchange; |
| 8) | an analysis of the issuer’s financial statements; and |
| 9) | the existence of merger proposals or tender offers that might affect the value of the security. |
| 1) | the value of similar foreign securities traded on other foreign markets; |
| 2) | ADR trading of similar securities; |
| 3) | closed-end fund or exchange-traded fund trading of similar securities; |
| 4) | foreign currency exchange activity; |
| 5) | the trading prices of financial products that are tied to baskets of foreign securities; |
| 6) | factors relating to the event that precipitated the pricing problem; |
| 7) | whether the event is likely to recur; and |
| 8) | whether the effects of the event are isolated or whether they affect entire markets, countries or regions. |
| • | Level 1 – Level 1 inputs are quoted prices in active markets for identical investments. An active market is a market in which transactions for the investment occur with sufficient frequency and volume to provide pricing information on an ongoing basis. |
| • | Level 2 – Level 2 inputs are observable inputs, either directly or indirectly, and include the following: |
| o | Quoted prices for similar investments in active markets. |
| o | Quoted prices for identical or similar investments in markets that are non-active. A non-active market is a market where there are few transactions for the investment, the prices are not current, or price quotations vary substantially either over time or among market makers, or in which little information is released publicly. |
| o | Inputs other than quoted prices that are observable for the investment (for example, interest rates and yield curves observable at commonly quoted intervals, volatilities, prepayment speeds, loss severities, credit risks, and default rates). |
| o | Inputs that are derived principally from or corroborated by observable market data by correlation or other means. |
| • | Level 3 – Level 3 inputs are unobservable inputs. Unobservable inputs may reflect the reporting entity’s own assumptions about the assumptions that market participants would use in pricing the investment. |
Current federal income tax benefit (expense) | $ (10,914,507) |
Current state income tax benefit (expense) | (1,580,403) |
Current foreign income tax benefit (expense) | — |
Deferred federal income tax benefit (expense) | 4,006,118 |
Deferred state income tax benefit (expense) | 1,103,587 |
Total income tax benefit (expense) | $ (7,385,205) |
Federal net operating loss | $— |
State net operating loss | 3,006,069 |
State income taxes | 925,994 |
Capital loss carryforward | — |
Other | 184,226 |
Total deferred tax assets | 4,116,289 |
Less: valuation allowance | (3,006,069) |
Net deferred tax assets | $1,110,220 |
| Deferred tax liabilities: | |
Unrealized gains on investment securities | $(45,182,312) |
Total deferred tax liabilities | (45,182,312) |
Total net deferred tax liabilities | $(44,072,092) |
Application of statutory income tax rate | $ 7,169,851 |
State income taxes, net | 227,540 |
Change in valuation allowance | 149,144 |
Effect of permanent differences | (161,330) |
Total | $ 7,385,205 |
| Asset Derivatives | Liability Derivatives | |||||||||
| Derivative Instrument | Risk Exposure | Statement of Assets and Liabilities Location | Value | Statement of Assets and Liabilities Location | Value | |||||
| Written Options | Equity Risk | — | — | Options written, at value | $ 1,600,171 | |||||
| Statement of Operations Location | |
| Equity Risk Exposure | |
| Net realized gain (loss) before taxes on written options | $1,715,343 |
| Net change in unrealized appreciation (depreciation) before taxes on written options | 1,116,391 |
| Common Shares Sold | Net Proceeds Received | Net Asset Value of Shares Sold | Net Proceeds Received in Excess of Net Asset Value | ||||
| Year ended 11/30/18 | 183,236 | $4,111,227 | $4,039,839 | $71,388 |
| (1) | If Common Shares are trading at or above net asset value (“NAV”) at the time of valuation, the Fund will issue new shares at a price equal to the greater of (i) NAV per Common Share on that date or (ii) 95% of the market price on that date. |
| (2) | If Common Shares are trading below NAV at the time of valuation, the Plan Agent will receive the dividend or distribution in cash and will purchase Common Shares in the open market, on the NYSE or elsewhere, for the participants’ accounts. It is possible that the market price for the Common Shares may increase before the Plan Agent has completed its purchases. Therefore, the average purchase price per share paid by the Plan Agent may exceed the market price at the time of valuation, resulting in the purchase of fewer shares than if the dividend or distribution had been paid in Common Shares issued by the Fund. The Plan Agent will use all dividends and distributions received in cash to purchase Common Shares in the open market within 30 days of the valuation date except where temporary curtailment or suspension of purchases is necessary to comply with federal securities laws. Interest will not be paid on any uninvested cash payments. |
FUND ACCOUNTANT, AND
CUSTODIAN
PUBLIC ACCOUNTING FIRM
Item 2. Code of Ethics.
Not applicable.
Item 3. Audit Committee Financial Expert.
Not applicable.
Item 4. Principal Accountant Fees and Services.
Not applicable.
Item 5. Audit Committee of Listed Registrants.
Not applicable.
Item 6. Investments.
| (a) | Schedule of Investments in securities of unaffiliated issuers as of the close of the reporting period is included as part of the report to shareholders filed under Item 1 of this form. |
| (b) | Not applicable. |
Item 7. Disclosure of Proxy Voting Policies and Procedures for Closed-End Management Investment Companies.
Not applicable.
Item 8. Portfolio Managers of Closed-End Management Investment Companies.
(a) Not applicable.
| (b) | Not applicable. |
Item 9. Purchases of Equity Securities by Closed-End Management Investment Company and Affiliated Purchasers.
Not applicable.
Item 10. Submission of Matters to a Vote of Security Holders.
There have been no material changes to the procedures by which the shareholders may recommend nominees to the Registrant’s board of trustees, where those changes were implemented after the Registrant last provided disclosure in response to the requirements of Item 407(c)(2)(iv) of Regulation S-K (17 CFR 229.407) (as required by Item 22(b)(15) of Schedule 14A (17 CFR 240.14a-101)), or this Item.
Item 11. Controls and Procedures.
| (a) | The Registrant’s principal executive and principal financial officers, or persons performing similar functions, have concluded that the Registrant’s disclosure controls and procedures (as defined in Rule 30a-3(c) under the Investment Company Act of 1940, as amended (the “1940 Act”) (17 CFR 270.30a-3(c))) are effective, as of a date within 90 days of the filing date of the report that includes the disclosure required by this paragraph, based on their evaluation of these controls and procedures required by Rule 30a-3(b) under the 1940 Act (17 CFR 270.30a-3(b)) and Rules 13a-15(b) or 15d-15(b) under the Securities Exchange Act of 1934, as amended (17 CFR 240.13a-15(b) or 240.15d-15(b)). |
| (b) | There were no changes in the registrant's internal control over financial reporting (as defined in Rule 30a-3(d) under the 1940 Act (17 CFR 270.30a-3(d)) that occurred during the period covered by this report that have materially affected, or are reasonably likely to materially affect, the registrant's internal control over financial reporting. |
Item 12. Disclosure of Securities Lending Activities for Closed-End Management Investment Companies.
| (a) | Not applicable. |
| (b) | Not applicable. |
Item 13. Exhibits.
| (a)(1) | Code of ethics, or any amendment thereto, that is the subject of disclosure required by Item 2 is attached hereto. |
| (a)(2) | Certifications pursuant to Rule 30a-2(a) under the 1940 Act and Section 302 of the Sarbanes-Oxley Act of 2002 are attached hereto. |
| (a)(3) | Not applicable. |
| (a)(4) | Not applicable. |
| (b) | Certifications pursuant to Rule 30a-2(b) under the 1940 Act and Section 906 of the Sarbanes- Oxley Act of 2002 are attached hereto. |
SIGNATURES
Pursuant to the requirements of the Securities Exchange Act of 1934 and the Investment Company Act of 1940, the registrant has duly caused this report to be signed on its behalf by the undersigned, thereunto duly authorized.
| (registrant) | First Trust Energy Income and Growth Fund |
| By (Signature and Title)* | /s/ James M. Dykas | |||
| James M. Dykas, President and Chief Executive Officer (principal executive officer) |
| Date | August 5, 2019 |
Pursuant to the requirements of the Securities Exchange Act of 1934 and the Investment Company Act of 1940, this report has been signed below by the following persons on behalf of the registrant and in the capacities and on the dates indicated.
| By (Signature and Title)* | /s/ James M. Dykas | |||
| James M. Dykas, President and Chief Executive Officer (principal executive officer) |
| Date | August 5, 2019 |
| By (Signature and Title)* | /s/ Donald P. Swade | |||
| Donald P. Swade, Treasurer, Chief Financial Officer and Chief Accounting Officer (principal financial officer) |
| Date | August 5, 2019 |
* Print the name and title of each signing officer under his or her signature.