NI 43-101 Technical Report
Veris Gold Corp. Jerritt Canyon Property
Elko County, Nevada
Effective Date: December 31, 2012
Filing Date: July 11, 2013
Prepared For:

Veris Gold Corp. (VG)
900 - 688 West Hastings Street
Vancouver, BC V6B 1P1 Canada
Endorsed by Qualified Professionals:
Primary Author
Todd Johnson P.E., Vice President Exploration, Veris Gold Corp.
Contributing Authors
Mark Odell, P.E., Consulting Mine Engineer, Practical Mining LLC
Karl Swanson, Mining Consultant, SME, MAusIMM
Michele White, Geologic Consultant, CPG#11252 AIPG
John Fox, P. Eng., Consulting Metallurgist
| Veris Gold Corp. | |
| NI 43-101 Technical Report Jerritt Canyon Property, Nevada | ii |
This page intentionally left blank.
| Veris Gold Corp. | |
| NI 43-101 Technical Report Jerritt Canyon Property, Nevada | iii |
Table of Contents
| Table of Contents | iii |
| | | | | |
| List of Tables | vii |
| | | | | |
| List of Figures | ix |
| | | | | |
| 1 | Summary | 1-1 |
| | 1.1 | Mineral Resource estimate | 1-2 |
| | 1.2 | Mineral Reserves estimate | 1-3 |
| | 1.3 | Conclusions | 1-4 |
| | 1.4 | Recommendations | 1-5 |
| | | | | |
| 2 | Introduction | 2-1 |
| | 2.1 | Terms of reference and purpose of the report | 2-1 |
| | 2.2 | Qualifications of consultants and authors | 2-1 |
| | 2.3 | Price strategy | 2-2 |
| | 2.4 | Units of measure | 2-2 |
| | 2.5 | Coordinate system, projections, and topography maps | 2-3 |
| | 2.6 | Calendar | 2-3 |
| | | | | |
| 3 | Reliance on other experts | 3-1 |
| | | | | |
| 4 | Property description and location | 4-1 |
| | 4.1 | Property description | 4-1 |
| | 4.2 | Property location | 4-1 |
| | 4.3 | Status of mineral titles | 4-1 |
| | 4.4 | Location of mineralization | 4-5 |
| | | | | |
| 5 | Accessibility, climate, vegetation, physiography, local resources and infrastructure | 5-1 |
| | 5.1 | Access to the site | 5-1 |
| | 5.2 | Climate | 5-1 |
| | 5.3 | Vegetation | 5-1 |
| | 5.4 | Physiography | 5-1 |
| | 5.5 | Local resources and infrastructure | 5-1 |
| | | | | |
| 6 | History | 6-1 |
| | 6.1 | Mining history | 6-1 |
| | 6.2 | Production history | 6-1 |
| | 6.3 | Historical mineral resource and reserve estimates | 6-3 |
| | | | | |
| 7 | Geological setting and mineralization | 7-1 |
| | 7.1 | Regional geology | 7-1 |
| | 7.2 | Local geology | 7-4 |
| | | | | |
| 8 | Deposit types | 8-1 |
| | 8.1 | Mineralization | 8-1 |
| | | 8.1.1 | SSX-Steer Mine | 8-2 |
| | | 8.1.2 | Saval Mine and Saval 4 | 8-4 |
| | | 8.1.3 | Smith Mine | 8-4 |
| | | 8.1.4 | Murray Mine | 8-5 |
| Veris Gold Corp. | |
| NI 43-101 Technical Report Jerritt Canyon Property, Nevada | iv |
| | | 8.1.5 | Starvation Canyon | 8-6 |
| | | 8.1.6 | West Mahala | 8-6 |
| | | 8.1.7 | Wright Window | 8-6 |
| | | 8.1.8 | Pie Creek | 8-6 |
| | | 8.1.9 | Mill Creek | 8-7 |
| | | 8.1.10 | Road Canyon | 8-7 |
| | | 8.1.11 | Burns Basin | 8-7 |
| | | 8.1.12 | California Mountain | 8-7 |
| | | | | |
| 9 | Exploration | 9-1 |
| | | | | |
| 10 | Drilling and sampling methodology | 10-1 |
| | | | | |
| | 10.1 | Surface drilling | 10-3 |
| | 10.2 | Underground drilling | 10-4 |
| | 10.3 | Core and chips recovery | 10-18 |
| | 10.4 | Security procedures: core and pulps | 10-18 |
| | 10.5 | Logging drilled core and chips observations | 10-18 |
| | 10.6 | Sampling methodology: core and pulps | 10-18 |
| | | | | |
| 11 | Sample preparation, analyses, security, and QAQC | 11-1 |
| | | | | |
| | 11.1 | Jerritt Canyon laboratory sampling procedures | 11-1 |
| | | 11.1.1 | Sample preparation | 11-1 |
| | | 11.1.2 | Sampling analysis protocol | 11-1 |
| | | 11.1.3 | Sample security measures | 11-2 |
| | 11.2 | Commercial laboratory sample preparation, analysis protocol, and security | 11-2 |
| | 11.3 | Quality control measures | 11-3 |
| | | 11.3.1 | Current Jerritt Canyon and commercial laboratory QAQC procedures | 11-3 |
| | | 11.3.2 | Re-assays and duplicates performance | 11-5 |
| | | 11.3.3 | Blank performance | 11-7 |
| | | 11.3.4 | Standards performance: surface core drilling | 11-9 |
| | | 11.3.5 | Standards performance: underground Cubex drilling | 11-13 |
| | 11.4 | Opinion on the adequacy of the sampling methodolgy | 11-16 |
| | | | | |
| 12 | Data verification | 12-1 |
| | | | | |
| | 12.1 | Data vetting prior to August 2008 | 12-1 |
| | 12.2 | Data vetting performed after August 2008 to January 2010 | 12-2 |
| | 12.3 | Data vetting performed on 2011 drilling results | 12-4 |
| | 12.4 | Current data vetting June 18, 2011 to December 31, 2012 | 12-5 |
| | | 12.4.1 | Datasets submitted for evaluation | 12-6 |
| | | 12.4.2 | acQuire to ISIS comparison of assay data | 12-8 |
| | | 12.4.3 | Comparison of intervals versus sample numbers | 12-8 |
| | | 12.4.4 | Checks of format conversions: Au opt-Au ppb-Au ppm-Au best selection | 12-9 |
| | | 12.4.5 | Assay certificates compared to acQuire and ISIS Au values | 12-9 |
| | | 12.4.6 | Lithology checks: formation, rock type, and intervals | 12-10 |
| | 12.5 | Summary of database verification | 12-10 |
| | | | | |
| 13 | Mineral processing and metallurgical testing | 13-1 |
| | | | | |
| 14 | Mineral resource estimates | 14-1 |
| | | | | |
| | 14.1 | Introduction | 14-1 |
| | 14.2 | Drill hole database and compositing | 14-3 |
| | 14.3 | Geology and grade shell modeling | 14-8 |
| | 14.4 | Specific gravity and density | 14-16 |
| Veris Gold Corp. | |
| NI 43-101 Technical Report Jerritt Canyon Property, Nevada | v |
| | 14.5 | Statistics and variography | 14-17 |
| | | 15.4.1 | Grade capping | 14-23 |
| | | 15.4.2 | Variography | 14-23 |
| | 14.6 | Block modeling | 14-35 |
| | 14.7 | Gold grade estimation and block calculations | 14-43 |
| | 14.8 | Mined depletion and sterilization | 14-47 |
| | 14.9 | Mineral resource classification | 14-54 |
| | 14.10 | Block model validation | 14-56 |
| | 14.11 | Mineral resource statement | 14-59 |
| | | 14.11.1 | Underground mineral resources | 14-59 |
| | | 14.11.2 | Open pit mineral resources | 14-62 |
| | 14.12 | Other resource constraints | 14-62 |
| | | | | |
| 15 | Mineral Reserve estimate | 15-1 |
| | | | | |
| | 15.1 | Underground mine reserves | 15-1 |
| | 15.2 | Open pit mine reserves | 15-7 |
| | | | | |
| 16 | Mining methods | 16-1 |
| | | | | |
| | 16.1 | Mining operations | 16-1 |
| | 16.2 | Mining production | 16-1 |
| | 16.3 | Underground mining methods | 16-3 |
| | | 16.3.1 | Mine development | 16-6 |
| | | 16.3.2 | Underground geotechnical considerations | 16-7 |
| | | 16.3.3 | Ventilation | 16-7 |
| | | 16.3.4 | Dewatering | 16-7 |
| | 16.4 | Open pit mining methods | 16-7 |
| | 16.5 | Ore control and sampling procedures (underground) | 16-8 |
| | 16.6 | Jerritt Canyon Stockpiles | 16-8 |
| | | | | |
| 17 | Recovery methods | 17-1 |
| | | | | |
| | 17.1 | Processing facilities, operating parameters, and process flow sheet | 17-1 |
| | 17.2 | Recoverability | 17-4 |
| | 17.3 | Historic processing plant production and cost data | 17-5 |
| | | | | |
| 18 | Project infrastructure | 18-1 |
| | | | | |
| | 18.1 | Road access | 18-1 |
| | 18.2 | Water sources | 18-1 |
| | 18.3 | Power | 18-1 |
| | 18.4 | Sewage and waste disposal | 18-1 |
| | 18.5 | Ore stockpiles | 18-1 |
| | 18.6 | Tailings facilities | 18-1 |
| | | | | |
| 19 | Market studies and contracts | 19-1 |
| | | | | |
| | 19.1 | Market studies | 19-1 |
| | 19.2 | Contracts | 19-2 |
| | | | | |
| 20 | Environmental studies, permitting, and social or community impact | 20-1 |
| | | | | |
| | 20.1 | Environmental issues | 20-3 |
| | 20.2 | Environmental liabilities | 20-3 |
| | | 20.2.1 | Waste rock seepage | 20-4 |
| | | 20.2.2 | Tailings impoundment seepage control | 20-4 |
| Veris Gold Corp. | |
| NI 43-101 Technical Report Jerritt Canyon Property, Nevada | vi |
| | | 20.2.3 | Air emissions control technology | 20-5 |
| | | 20.2.4 | Reclamation bond cost | 20-5 |
| | 20.3 | Permits | 20-5 |
| 21 | Capital and operating costs | 21-1 |
| | 21.1 | Capital costs | 21-1 |
| | 21.2 | Operating costs | 21-1 |
| | 21.3 | Cutoff grades | 21-2 |
| 22 | Economic analysis | 22-1 |
| | 22.1 | LoM plan and economics | 22-1 |
| | 22.2 | Project sensitivity | 22-3 |
| 23 | Adjacent properties | 23-1 |
| 24 | Other relevant data and information | 24-1 |
| 25 | Interpretations and conclusions | 25-1 |
| 26 | Recommendations | 26-1 |
| | 26.1 | Dewatering | 26-1 |
| | 26.2 | 2013 Geological program | 26-1 |
| 27 | References | 27-1 |
| 28 | Glossary | 28-1 |
| 29 | Date and signature page | 29-1 |
| Veris Gold Corp. | |
| NI 43-101 Technical Report Jerritt Canyon Property, Nevada | vii |
List of Tables
| Table 1.1.1: | Jerritt Canyon mineral resources including reserves – December 31, 2012 | 1-3 |
| Table 1.2.1: | Jerritt Canyon mineral reserves – December 31, 2012. | 1-4 |
| Table 2.4.1: | Units of measure. | 2-3 |
| Table 4.3.1: | Land and claim summary for Veris Gold USA’s Jerritt Canyon Project. | 4-2 |
| Table 6.2.1: | Historic open pit and underground mine production at the Jerritt Canyon before recovery losses | 6-2 |
| Table 6.3.1: | Historic measured and indicated mineral resources, including reserves. | 6-3 |
| Table 6.3.2: | Historic inferred mineral resources. | 6-3 |
| Table 6.3.3: | Historic proven and probable mineral reserves | 6-3 |
| Table 10.1: | Jerritt Canyon drilling (2000 through year end 2012). | 10-2 |
| Table 12.4: | Summary of datasets submitted for January 2013 audit. | 12-6 |
| Table 12.4: | Number of drill holes per dataset audited. | 12-7 |
| Table 12.4: | Number of records reviewed per dataset. | 12-7 |
| Table 13.1: | Starvation Canyon ore metallurgy testswork results. | 13-2 |
| Table 14.2.1: | Geology database formation codes. | 14-4 |
| Table 14.5.1: | Summary of statistics by open pit model | 14-17 |
| Table 14.5.2: | Summary of statistics by underground model. | 14-17 |
| Table 14.5.1.1: | Cap grade by open pit model | 14-23 |
| Table 14.5.1.2: | Cap grade by underground model. | 14-23 |
| Table 14.5.2.1: | Vulcan ordinary kriging input parameters by model. | 14-24 |
| Table 14.5.2.2: | Smith variogram parameters. | 14-24 |
| Table 14.5.2.3: | SSX variogram parameters. | 14-26 |
| Table 14.5.2.4: | Starvation variogram parameters | 14-28 |
| Table 14.5.2.5: | Burns Basin variogram parameters. | 14-30 |
| Table 14.5.2.6: | Saval variogram parameters | 14-32 |
| Table 14.6.1: | Burns Basin block model details. | 14-35 |
| Table 14.6.2: | Saval open pit block model details | 14-36 |
| Table 14.6.3: | Smith block model details. | 14-38 |
| Table 14.6.4: | SSX block model details. | 14-39 |
| Table 14.6.5: | Starvation model details. | 14-41 |
| Table 14.6.6: | Block model variables | 14-43 |
| Table 14.7.1: | Burns Basin grade shell search ellipsoid orientations. | 14-44 |
| Table 14.7.2.: | Estimation parameters by block model. | 14-45 |
| Table 14.10.1: | Block model and composite grade comparison by deposit | 14-58 |
| Table 14.11.1: | Jerritt Canyon mineral resources including reserves – December 31, 2012 | 14-59 |
| Table 15.1.1: | Jerritt Canyon mineral reserves – December 31, 2012. | 15-1 |
| Table 16.2.1: | Jerritt Canyon 2010-2012 production | 16-2 |
| Table 16.6.1: | Jerritt Canyon stockpile reserve summary. | 16-9 |
| Table 17.1.1: | Operating parameters for the Jerritt Canyon processing plant. | 17-1 |
| Table 17.2.1: | Jerritt Canyon 2008-2012 gold recovery by month | 17-4 |
| Table 17.3.1: | Jerritt Canyon historic process production and cost data. | 17-5 |
| Table 18.6.1: | Design criteria for the TSF-2 | 18-2 |
| Table 20.3.1: | Operating permits. | 20-6 |
| Table 21.1.1: | Jerritt Canyon Life of Mine (LoM) capital expenditures ($000’s). | 21-1 |
| Table 21.2.1: | Jerritt Canyon Life of Mine (LoM) operating costs (US $/Ore Ton) | 21-2 |
| Table 21.3.1: | Jerritt Canyon resource cut off grades at US $1,620/oz | 21-3 |
| Table 21.3.2: | Jerritt Canyon reserve cut off grades at US $1,490/oz | 21-4 |
| Table 22.1.1: | Life of Mine production schedule (ktpy). | 22-1 |
| Veris Gold Corp. | |
| NI 43-101 Technical Report Jerritt Canyon Property, Nevada | viii |
| Table 22.1.2: | Income statement 2013 to 2018 ($000’s). | 22-2 |
| Table 22.1.3: | Cash flow statement 2013 to 2019 ($000’s). | 22-2 |
| Table 22.1.4: | Key operating and financial statistics. | 22-3 |
| Table 26.2.1: | Proposed 2013 Jerritt Canyon drilling and geology program ($M). | 26-2 |
| Veris Gold Corp. | |
| NI 43-101 Technical Report Jerritt Canyon Property, Nevada | ix |
List of Figures
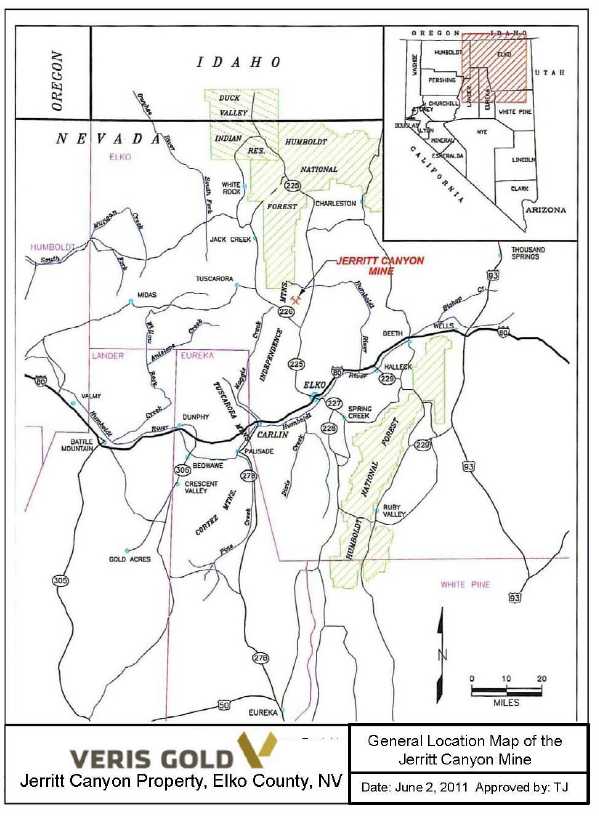
| Figure 4.3.1: General location map of the Jerritt Canyon Mine | 4-3 |
| Figure 4.3.2: General land map of the Jerritt Canyon property with model areas. | 4-4 |
| Figure 7.1.1: General geology map of the Jerritt Canyon District. | 7-3 |
| Figure 7.1.2: General stratigraphic section of the Jerritt Canyon District. | 7-4 |
| Figure 8.1.1.1: Cross-section through the SSX deposit showing general geology. | 8-3 |
| Figure 10.2.1: Burns Basin drill hole plan map. | 10-6 |
| Figure 10.2.2: Mill Creek drill hole plan map (no new drilling) | 10-7 |
| Figure 10.2.3: Pie Creek drill hole plan map | 10-8 |
| Figure 10.2.4: Road Canyon drill hole plan map (no new drilling) | 10-9 |
| Figure 10.2.5: Saval open pit drill hole plan map | 10-10 |
| Figure 10.2.6: Wright Window drill hole plan map (no new drilling) | 10-11 |
| Figure 10.2.7: California Mountain drill hole plan map (no new drilling). | 10-12 |
| Figure 10.2.8: Murray drill hole plan map (no new drilling). | 10-13 |
| Figure 10.2.9: Smith drill hole plan map. | 10-14 |
| Figure 10.2.10: SSX drill hole plan map. | 10-15 |
| Figure 10.2.11: Starvation drill hole plan map. | 10-16 |
| Figure 10.2.12: Winters Creek drill hole plan map (no new drilling). | 10-17 |
| Figure 11.3.2.1: Jerritt lab duplicate results from June 18, 2011- December 31, 2012. | 11-6 |
| Figure 11.3.3.1: ALS lab blanks results from June 18, 2011 – December 31, 2012 | 11-7 |
| Figure 11.3.3.2: Jerritt lab blank results from June 18, 2011 – December 31, 2012. | 11-8 |
| Figure 11.3.4.1: ALS lab JCQ06 standard results from June 18, 2011 – December 31, 2012. | 11-9 |
| Figure 11.3.4.2: ALS lab JCQ07 standard results from June 18, 2011 - December 2012 | 11-10 |
| Figure 11.3.4.3: ALS lab Si54 standard results from June 18, 2011 - December 31, 2012. | 11-11 |
| Figure 11.3.4.4: ALS lab SK52 standard results from June 18, 2011 - December 31, 2012. | 11-12 |
| Figure 11.3.5.1: Jerritt lab JCQ06 standard results from June 18, 2011 - December 31, 2012. | 11-13 |
| Figure 11.3.5.2: Jerritt lab JCQ07 standard results from June 18, 2011 - December 31, 2012. | 11-14 |
| Figure 11.3.5.3: Jerritt lab Si54 standard results from June 18, 2011 - December 31, 2012 | 11-15 |
| Figure 11.3.5.4: Jerritt lab SK52 standard results from June 18, 2011 - December 31, 2012. | 11-16 |
| Figure 14.1.1: Updated open pit model locations. | 14-2 |
| Figure 14.1.2: Updated underground model locations. | 14-3 |
| Figure 14.3.1: Plan view of 0.01 opt grade shells at Burns Basin. | 14-9 |
| Figure 14.3.2: Plan view of 0.01 opt and 0.1 opt grade shells at Saval | 14-10 |
| Figure 14.3.3: Section 400150N of Burns Basin grade shells and formation contacts. | 14-11 |
| Figure 14.3.4: Section 41085N of Saval grade shells and formation contacts. | 14-11 |
| Figure 14.3.5: Plan view of 0.1 opt grade shells at Saval, Steer-SSX, and West Mahala. | 14-12 |
| Figure 14.3.6: Plan view of 0.1 opt grade shells at Smith. | 14-12 |
| Figure 14.3.7: Plan view of 0.1 opt grade shells at Starvation. | 14-13 |
| Figure 14.3.8: Section 406975N of Smith grade shells and formation contacts. | 14-13 |
| Figure 14.3.9: Section 369800E of Starvation grade shells and formation contacts. | 14-14 |
| Figure 14.3.10: Section 393600E of Steer-SSX grade shells and formation contacts | 14-14 |
| Figure 14.3.11: Section 395175E of West Mahala grade shells and formation contacts | 14-15 |
| Figure 14.5.1: Burns Basin gold histogram and cumulative frequency plot | 14-18 |
| Figure 14.5.2: Saval gold histogram and cumulative frequency plot. | 14-19 |
| Figure 14.5.3: Smith gold histogram and cumulative frequency plot | 14-20 |
| Figure 14.5.4: SSX gold histogram and cumulative frequency plot | 14-21 |
| Figure 14.5.5: Starvation gold histogram and cumulative frequency plot. | 14-22 |
| Figure 14.5.1.1: Smith cap grade plot. | 14-23 |
| Figure 14.5.2.1: Smith downhole variogram. | 14-25 |
| Veris Gold Corp. | |
| NI 43-101 Technical Report Jerritt Canyon Property, Nevada | x |
| Figure 14.5.2.2: Smith modeled variogram (120,-15). | 14-25 |
| Figure 14.5.2.3: Smith modeled variogram (270,-45). | 14-26 |
| Figure 14.5.2.4: SSX downhole variogram. | 14-27 |
| Figure 14.5.2.5: SSX modeled variogram (90,0). | 14-27 |
| Figure 14.5.2.6: SSX modeled variogram (180,-30). | 14-28 |
| Figure 14.5.2.7: Starvation downhole variogram. | 14-29 |
| Figure 14.5.2.8: Starvation modeled variogram (270,-15). | 14-29 |
| Figure 14.5.2.9: Starvation modeled variogram (120,-15). | 14-30 |
| Figure 14.5.2.10: Burn Basin downhole variogram. | 14-31 |
| Figure 14.5.2.11: Burns Basin modeled variogram (150,0). | 14-31 |
| Figure 14.5.2.12: Burns Basin modeled variogram (210,-15). | 14-32 |
| Figure 14.5.2.13: Saval downhole variogram. | 14-33 |
| Figure 14.5.2.14: Saval modeled variogram (150,-15) | 14-33 |
| Figure 14.5.2.15: Saval modeled variogram (330,-30) | 14-34 |
| Figure 14.7.1: Jerritt Canyon color legends | 14-45 |
| Figure 14.7.2: Section 406975N of Smith estimated blocks | 14-46 |
| Figure 14.7.3: Section 400150N of Burns Basin estimated blocks | 14-46 |
| Figure 14.7.4: Section 369800E of Starvation estimated blocks. | 14-47 |
| Figure 14.8.1: Plan view of Smith underground asbuilt workings | 14-47 |
| Figure 14.8.2: Plan view of SSX underground asbuilt workings | 14-47 |
| Figure 14.8.3: Plan view of Saval open-pit underground asbuilt workings. | 14-48 |
| Figure 14.8.4: Section view of Smith depleted blocks at 400,150E | 14-49 |
| Figure 14.8.5: Plan view of existing pit at Burns Basin. | 14-50 |
| Figure 14.8.6: Plan view of existing pit at Saval. | 14-51 |
| Figure 14.8.7: Plan view of existing pit at Smith. | 14-51 |
| Figure 14.8.8: Section view of the Smith Dash pit at 404650E. | 14-52 |
| Figure 14.8.9: Plan view of Smith sterilization polygons. | 14-53 |
| Figure 14.8.10: Plan view of SSX sterilization polygons. | 14-53 |
| Figure 14.8.11: Plan view of SSX sterilization detail at the 7370 elevation. | 14-54 |
| Figure 14.9.1: Section 400150E of Smith classified blocks | 14-55 |
| Figure 14.9.2: Section 369800E of Starvation classified blocks | 14-56 |
| Figure 14.10.1: Section view of Smith au_ok blocks and composites at 400150E | 14-57 |
| Figure 14.10.2: Section view of SSX au_ok blocks with composites at 391400E. | 14-57 |
| Figure 14.10.3: Section view of Starvation au_ok blocks with composites at 369800E | 14-58 |
| Figure 14.11.1: Plan view of Smith underground resources, which include reserves displaying “des” and “reso” flagged blocks colored by gold grade. | 14-60 |
| Figure 14.11.2: Section 400,150E Smith underground resources, which include reserves displaying “des” and “reso” flagged blocks colored by gold grade. | 14-61 |
| Figure 14.11.3: Plan view of SSX-Steer underground resources, which include reserves displaying “des” and “reso” flagged blocks colored by gold grade. | 14-61 |
| Figure 14.11.4: Section 393,600E SSX-Steer underground resources, which include reserves displaying “des” and “reso” flagged blocks by gold grade. | 14-62 |
| Figure 15.1.1: Existing and planned workings at the Smith Mine | 15-2 |
| Figure 15.1.2: Section 400,150E Smith Mine underground reserves showing the reserve blocks by gold grade with the design solids. | 15-3 |
| Figure 15.1.3: Existing and planned working in the SSX complex including Saval UG and West Mahala | 15-4 |
| Figure 15.1.4: Section 393,600E SSX-Steer Mine underground reserves showing the reserve blocks by gold grade with the design solids (green) and asbuilts (light blue) | 15-5 |
| Figure 15.1.5: Existing and planned workings at the Murray Mine | 15-6 |
| Figure 15.1.6: Existing and planned workings at the Starvation Mine | 15-7 |
| Veris Gold Corp. | |
| NI 43-101 Technical Report Jerritt Canyon Property, Nevada | xi |
| Figure 15.2.1: Ultimate pit design for Saval mineral reserve area | 15-8 |
| Figure 15.2.2: Ultimate pit design for Mill Creek mineral reserve area | 15-9 |
| Figure 15.2.3: Ultimate pit design for Wright Window mineral reserve area | 15-10 |
| Figure 15.2.4: Ultimate pit design for Burns Basin mineral reserve area. | 15-11 |
| Figure 16.3.1: Long-hole open stope mining. | 16-5 |
| Figure 16.3.2: Drift and fill mining with breasting up the sill. | 16-6 |
| Figure 16.6.1: Stockpile location map. | 16-9 |
| Figure 17.1.1: Simplified ore processing flow sheet for the Jerritt Canyon Mine. | 17-2 |
| Figure 18.6.1: Construction plan for the TSF-2 and WSF | 18-3 |
| Figure 18.6.2: Aerial view looking north: TSF-2 completed December 7, 2012 | 18-4 |
| Figure 18.6.3: Aerial view looking east: TSF-2 completed December 7, 2012. | 18-4 |
| Figure 18.6.4: Aerial view looking west: TSF-2 completed December 7, 2012. | 18-5 |
| Figure 19.1.1: Monthly gold price 2009 – 2012 | 19-1 |
| Figure 22.2.1: NPV sensitivity. | 22-4 |
| Figure 22.2.2: IRR sensitivity. | 22-4 |
List of Appendices
| Appendix A – Certificate of Authors and Consent Forms |
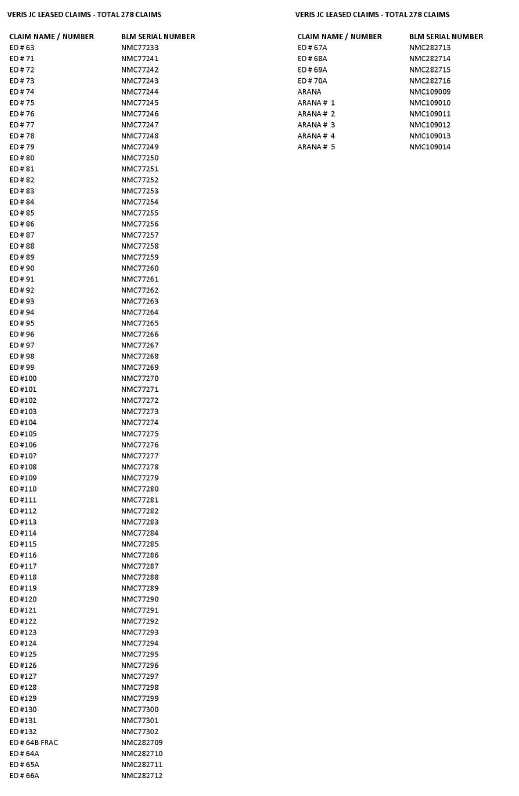
| Appendix B – Claim List |
| Veris Gold Corp. | |
| NI 43-101 Technical Report Jerritt Canyon Property, Nevada | 1-1 |
1 Summary
Veris Gold Corp. (VG, Veris, or the Company) engaged Mark Odell of Practical Mining LLC to assist in the preparation of a Canadian National Instrument 43-101 (NI 43-101) compliant Technical Report update on its 100% owned Jerritt Canyon operating gold mine property north of Elko, Nevada.
Veris ownership of the Jerritt Canyon property began on June 20, 2007, when Queenstake Resources Ltd. merged with YGC Resources Ltd. to form Yukon Nevada Gold Corp (YNG). As part of this merger the latter company (YNG) acquired the wholly-owned subsidiary of Queenstake Resources USA, Inc. (Queenstake), which owns and operates the Jerritt Canyon Mine in northern Nevada. As of October 5, 2012, YNG changed its name to Veris Gold Corp. In January of 2013, Queenstake Resources USA, Inc. changed their name to Veris Gold USA, Inc. (VUSA).
In summary, the Jerritt Canyon Mine is owned and operated by VUSA, a wholly owned subsidiary of Veris. This report is prepared for Veris and reflects the most recent resource and reserves based on data produced through December 31, 2012. The effective date of this report is December 31, 2012. The filing date is July 11, 2013.
The following personnel contributed to the preparation of the report:
| | • | Todd Johnson, Veris Gold Corp., Vice President of Exploration, P.E., Primary Author: Sections 1-10, 18, 20, and 23-29; |
| | | |
| | • | Mark Odell, Practical Mining LLC, P.E., Consulting Mine Engineer: Sections 15, 16, 19, 21 & 22 and the Starvation, Murray, Saval, and Winters Creek underground resources in Section 14.11.1 and Section 14.11.2; |
| | | |
| | • | Karl Swanson, Consulting Mine Engineer, SME, AusIMM: Resources: Section 14.1 – 14.10 and the SSX and Smith Underground Resources in Section 14.11. |
| | | |
| | • | Michele White, C.P.G., All One River Exploration Data Analysis: Sections 4, 11, and 12; and |
| | | |
| | • | John Fox, P.Eng, Laurion Consulting Inc., Consulting Metallurgist: Sections 13 and 17. |
These people are referred throughout this report as “author” with Todd Johnson, Vice President of Exploration for Veris Gold Corp., being the Primary Author.
Jerritt Canyon contains over 22 separately exploited Carlin-Type sediment-hosted deposits that have either been mined from open pit and/or underground methods and, since 1981, processed at the property or are intact and never previously mined and part of the December 31, 2012 Mineral Resources and/or Reserves. The Jerritt Canyon processing plant since July 1981 has produced over 8.0 million ounces of gold primarily from ores originating from the Jerritt Canyon property.
Certain of Newmont’s ores and stockpiles have been processed at the Jerritt Canyon processing plant.
Newmont USA Limited’s (Newmont) original Carlin Deposit discovered in the early 1960’s lies approximately 34 miles (55 km) southwest of the operating SSX-Steer underground mine at Jerritt Canyon.
The Jerritt Canyon Carlin-Type deposits occur in a north-northeast trending mineralized belt called the Independence trend. The primary host rock for the Jerritt Canyon Carlin-Type deposits is the Silurian and Ordovician Hanson Creek Formation with much less mineralization hosted in the overlying Devonian and Silurian Roberts Mountain Formation. Dike rocks locally contain ore grade gold mineralization but are volumetrically insignificant relative to the sedimentary rock hosted ore materials.
The Jerritt Canyon sulfide ores are double refractory in nature because the gold mineralization is both included in solid solution within sulfide minerals (arsenic-rich pyrite), and is also locally associated as free grains with organic carbon in the host rock. The permitted and operating on-site Jerritt Canyon processing facility contains crushing and grinding circuits, two parallel, two-stage oxygen fluid-bed Dorr Oliver roasters (commissioned in 1989), a cyanidation circuit, and a refinery. The processing plant has a maximum capacity of 1.5 million tons per year. The roaster helps oxidize the refractory ores for subsequent cyanidation and has a currently permitted capacity of 250 tons per hour (6,000 tons per day) which is the engineering design capacity.
| Veris Gold Corp. | |
| NI 43-101 Technical Report Jerritt Canyon Property, Nevada | 1-2 |
Underground mining production in 2012 at the property was from the Smith and SSX-Steer mines. Underground mining methods use both long-hole stoping and modified drift and fill. Split set rock bolts and welded wire mesh provide the primary means of ground support with supplementary resin anchor rebar bolts, cable bolts and/or shotcrete where necessary.
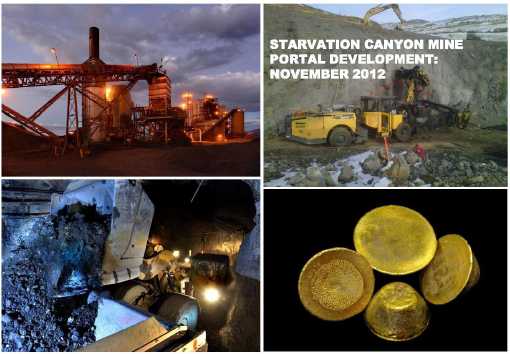
Mining at Smith in 2012 was done by contract miner Small Mine Development LLC (SMD) whereas mining at SSX-Steer was performed by both VUSA staff and separate SMD crews. Exploration and development (resource conversion) drilling was active at Smith and SSX-Steer in 2012 using one contract diamond drill. Development drift and stope drilling and minor exploration using RC Cubex drills were also active at both operating mines in 2012. Initial underground development work (portal excavation and drift development) at Starvation Canyon started in November 2012 and continued through the end of the year and mining production at Starvation Canyon, operated by SMD, commenced in early April 2013.
The December 31, 2012 Mineral Resources and Reserves from 6 underground areas (Smith mine, SSX-Steer mine, Saval, Murray, Starvation Canyon and Winters Creek) and 6 open pits (Burns Basin, Mill Creek, Pie Creek, Road Canyon, Saval, and Wright Window) have been updated in this Technical Report based on additional drilling completed in 2012 and/or based on recent remodeling work. Reserve additions included in this Technical Report relative to the previous report are located at the Smith, SSX-Steer and Starvation underground mines and at the Burns Basin open pit. The Smith and SSX-Steer underground mines comprise the majority of the mineral reserves in the district.
1.1 Mineral Resource estimate
The December 31, 2012 Mineral Resources at Jerritt Canyon are contained within 6 open pits including Burns Basin, Mill Creek, Pie Creek, Road Canyon, Saval, and Wright Window, and 6 underground areas including Murray, Smith, SSX (including West Mahala) , Saval, Starvation Canyon, and Winter’s Creek (Table 1.1.1) . The recently revised underground mineral resource estimates are based on extensive underground and surface drilling data, a strict 0.10 opt grade shell digitized by hand on 50 foot cross-sections, and using geology constrained kriging estimation methods. Block modeling techniques incorporate 5x5x5 ft. block sizes within the digitized grade shells.
Measured Resources as of December 31, 2012 total 4511 ktons averaging 0.198 opt Au containing 891.7 koz. Indicated Resources as of December 31, 2012 total 7,932 ktons averaging 0.171 opt Au containing 1,359.4 koz. Combined Measured and Indicated Resources as of December 31, 2012 total 12,443 ktons at 0.181 opt Au, containing 2,251.1 koz. There is an additional Inferred Resource of 3,845 tons at 0.170 opt Au, containing 653.2 koz. Table 1.1.1 lists the resources by area. Resources were determined using a US$1,620/oz two-year average trailing gold price.
For this Technical Report, new drilling information for the open pit resources has been included for the Saval and Burns Basin open pits. Also for this Technical Report, new drilling information for underground resources has been included for Starvation, Smith and SSX underground mines.
One of the independent contributory authors conducted a January 2013 database audit of assay results from drilled material sampled between June 18, 2011 and December 31, 2012 for underground drilling, and between July 18, 2011 and December 21, 2011 for surface drilling. There was very little surface drilling in 2012. This database audit reviewed between 5 to 25 percent of the actual records and concluded excellent correlation between certified sampling results and the database as discussed in Section 12.2.1. The results of this audit commend the 2013 database for use in the new resource and reserve estimates listed below.
| Veris Gold Corp. | |
| NI 43-101 Technical Report Jerritt Canyon Property, Nevada | 1-3 |
Table 1.1.1: Jerritt Canyon mineral resources including reserves –December 31, 2012.
| | Measured | Indicated | Measured + Indicated | | Inferred |
| Area | kt | opt | koz | kt | opt | koz | kt | opt | koz | | kt | opt | koz |
| Open Pit | | | | | | | | | | | | | |
| Burns Basin | 46 | 0.106 | 4.9 | 430 | 0.096 | 41.4 | 476 | 0.097 | 46.3 | | 5 | 0.061 | 0.3 |
| Mill Creek | 3 | 0.089 | 0.3 | 299 | 0.094 | 28.0 | 302 | 0.094 | 28.3 | | 4 | 0.153 | 0.6 |
| Saval | 51 | 0.148 | 7.6 | 315 | 0.085 | 26.7 | 367 | 0.093 | 34.3 | | 10 | 0.083 | 0.8 |
| Wright Window | 5 | 0.174 | 0.9 | 115 | 0.090 | 10.3 | 120 | 0.094 | 11.2 | | 5 | 0.088 | 0.4 |
| Pie Creek | - | - | - | 225 | 0.086 | 19.2 | 225 | 0.086 | 19.2 | | 5 | 0.089 | 0.5 |
| Road Canyon | - | - | - | 17 | 0.070 | 1.2 | 17 | 0.070 | 1.2 | | 187 | 0.081 | 15.2 |
| Stockpiles | 37 | 0.124 | 4.6 | 254 | 0.049 | 12.4 | 291 | 0.059 | 17.1 | | - | - | - |
| Open Pit Resource | 144 | 0.128 | 18.3 | 1,654 | 0.084 | 139.3 | 1,798 | 0.088 | 157.6 | | 216 | 0.082 | 17.8 |
| | | | | | | | | | | | | | |
| Underground | | | | | | | | | | | | | |
| Smith | 2,980 | 0.200 | 597.3 | 2,214 | 0.204 | 452.1 | 5,193 | 0.202 | 1,049.4 | | 977 | 0.179 | 174.6 |
| SSX Including | | | | | | | | | | | | | |
| West Mahala | 1,205 | 0.201 | 242.6 | 2,438 | 0.198 | 481.7 | 3,643 | 0.199 | 724.3 | | 2,508 | 0.173 | 433.6 |
| Saval | 17 | 0.276 | 4.6 | 160 | 0.247 | 39.6 | 177 | 0.250 | 44.2 | | 51 | 0.238 | 12.2 |
| Murray | 142 | 0.163 | 23.1 | 404 | 0.165 | 66.8 | 545 | 0.165 | 89.9 | | 61 | 0.162 | 10.0 |
| Starvation | 24 | 0.238 | 5.8 | 946 | 0.176 | 166.8 | 970 | 0.178 | 172.6 | | 21 | 0.170 | 3.6 |
| Winters Creek | - | - | - | 117 | 0.112 | 13.1 | 117 | 0.112 | 13.1 | | 10 | 0.145 | 1.5 |
| Underground | | | | | | | | | | | | | |
| Resource | 4,367 | 0.200 | 873.4 | 6,278 | 0.194 | 1,220.1 | 10,645 | 0.197 | 2,093.5 | | 3,629 | 0.175 | 635.4 |
| Resource Total | 4,511 | 0.198 | 891.7 | 7,932 | 0.171 | 1,359.4 | 12,443 | 0.181 | 2,251.1 | | 3,845 | 0.170 | 653.2 |
Notes:
| | (1) | Mineral Resources that are not mineral reserves do not have demonstrated economic viability; |
| | (2) | Open Pit Mineral Resources are contained within Lerch Grossman pit shells constructed at $1,620/oz. gold price and meet the minimum cutoff grade; |
| | (3) | Open Pit Mineral Resources include 5% mining losses and 5% dilution; |
| | (4) | Underground Mineral Resources are constrained to 0.10 opt grade shells and occur outside existing asbuilts workings and sterilized areas, and are deemed by the Qualified Person to be potentially economic; and |
| | (5) | Underground Mineral Resources include 5% mining losses and 5-10% dilution. |
1.2 Mineral Reserves estimate
Mineral Reserves as of December 31, 2012 are listed below in Table 1.2.1. The following parameters were used to determine Mineral Reserves for each area:
- A three-year average trailing gold price of $1,490 per ounce
- Grade dependent gold recoveries varying from 75% to 90%
- $0.40 per ounce refining charges
- Open pit cut off grades vary from a low of 0.043 to 0.046 opt
- Underground cut off grades vary from 0.106 to 0.116 opt.
| Veris Gold Corp. | |
| NI 43-101 Technical Report Jerritt Canyon Property, Nevada | 1-4 |
Table 1.2.1: Jerritt Canyon mineral reserves– December 31, 2012.
| | Proven | Probable | Proven + Probable |
| | | | | | | | | | |
| Area | kt | opt | koz | kt | opt | koz | kt | opt | koz |
| Open Pit | | | | | | | | | |
| Burns Basin | 32 | 0.100 | 3.2 | 391 | 0.101 | 39.6 | 423 | 0.101 | 42.8 |
| Mill Creek | 3 | 0.089 | 0.3 | 194 | 0.090 | 17.4 | 197 | 0.090 | 17.7 |
| Saval | 51 | 0.155 | 7.9 | 32 | 0.089 | 2.9 | 83 | 0.129 | 10.8 |
| Wright Window | 5 | 0.174 | 0.9 | 109 | 0.093 | 10.1 | 114 | 0.096 | 11.0 |
| Stockpiles | 37 | 0.124 | 4.6 | 167 | 0.053 | 8.9 | 204 | 0.066 | 13.5 |
| Open Pit Reserve | 128 | 0.131 | 17.0 | 892 | 0.088 | 78.9 | 1,021 | 0.094 | 95.7 |
| | | | | | | | | | |
| Underground | | | | | | | | | |
| Smith | 1,750 | 0.162 | 283.5 | 1,262 | 0.168 | 211.8 | 3,012 | 0.164 | 495.3 |
| SSX Including West | | | | | | | | | |
| Mahala | 566 | 0.172 | 97.5 | 1,056 | 0.159 | 167.4 | 1,621 | 0.163 | 272.0 |
| Saval | 18 | 0.239 | 4.3 | 150 | 0.203 | 30.4 | 168 | 0.207 | 34.8 |
| Murray | 142 | 0.163 | 23.1 | 354 | 0.166 | 58.6 | 495 | 0.165 | 81.7 |
| Starvation | 24 | 0.238 | 5.8 | 946 | 0.176 | 166.8 | 970 | 0.178 | 172.6 |
| Underground Reserve | 2,499 | 0.166 | 414.3 | 3,766 | 0.169 | 635.0 | 6,266 | 0.167 | 1,049.3 |
| Reserve Total | 2,628 | 0.164 | 431.1 | 4,659 | 0.153 | 713.9 | 7,287 | 0.157 | 1,145.0 |
The reserves listed above are a subset of the resources listed in Table 1.1.1.Dewatering of some of the Smith, West Mahala and Murray reserve areas that lie below the water table will be required. The operating and capital costs at these mines contain provisions for construction and operation of the dewatering systems. The processing plant requires 700 gpm of makeup water which is derived from seepage wells surrounding the existing tailings storage facility (TSF-1) and from fresh water supply wells. With the replacement of TSF-1, the source of seepage water will gradually diminish and ultimately will no longer be available. Mine dewatering operations will replace the TSF-1 seepage over time. A water treatment plant and rapid infiltration basin (RIB) will be required to dispose of dewatering in excess of the 700 gpm process water requirement.
From January 1, 2012 to December 31, 2012 Jerritt Canyon processed 978 ktons of ore containing 127.7 kozs from Smith, SSX and stockpile sources (Hofer, W. 2013). During the year all ores processed at Jerritt Canyon were from onsite sources and no ore from offsite was processed.
Reserve additions net of depletion total 84 koz relative to the previous NI 43-101 report. The gains are concentrated at the Starvation and Smith underground mines with lesser additions at Burns Basin open pit. Stockpile reserves decreased by 44 koz due to depletion and reclassification based on a trenching sampling program conducted in 2012. Reserves at the SSX-Steer underground (including West Mahala) and Murray underground decreased slightly.
1.3 Conclusions
The six year Life of Mine Reserves Plan will produce robust financial results. Achieving sustained ore mining and processing rates of 1.5 million tons per year is critical to the success of the Jerritt Canyon mine operation. In 2013 ore will be sourced from the Smith and SSX underground mines, two new underground mines at Starvation Canyon and Saval, and low grade ore stockpiles.
| Veris Gold Corp. | |
| NI 43-101 Technical Report Jerritt Canyon Property, Nevada | 1-5 |
1.4 Recommendations
Additional ore sources need to be developed at the Saval Underground and Burns Basin Pit during the next two years to enhance production and replace the stockpile ores as they are depleted. Reopening of the Murray underground mine and adding to open pit reserves will be required to maintain processing rates at the desired level over the 6 year reserve life.
Resource conversion near the existing and planned underground workings should remain a drilling priority. Conversion of resources near the planned open pits could also significantly add to the project life and economics.
Dewatering will be necessary to recover 234 koz of the current reserves located in the Smith, SSX and Murray mines. Engineering and permitting of the dewatering facilities must be a high priority to ensure these reserves are available when needed.
Mining operations can implement more economical mining plans including raising the cutoff grade and including inferred resources in the LOM plan. The processing of third party toll milling ores to increase and maximize the mill capacity would also help lower the operating cost per ton and increase revenue but cannot be included in the present Cash flow Analysis due to NI 43-101 rules that limit this work to reserve materials sourced from the Jerritt Canyon property.
| Veris Gold Corp. | |
| NI 43-101 Technical Report Jerritt Canyon Property, Nevada | 2-1 |
2 Introduction
Veris Gold Corp. (VG) engaged Mark Odell, P.E., Consulting Engineer, of Practical Mining LLC; Michele White, C.P.G., Geologic Consultant and Exploration and Mining Data Analyst; Karl Swanson, SME, Mine Engineer Consultant; and John Fox, P.Eng, Consulting Metallurgist, to assist in the preparation of a Canadian National Instrument 43-101 (NI 43-101) compliant Technical Report update on its 100% owned Jerritt Canyon operating gold mine property north of Elko, Nevada.
In June 2007, Queenstake Resources Ltd. merged with YGC Resources Ltd. through a plan of arrangement to create Yukon-Nevada Gold Corp. which subsequently changed its name to Veris Gold Corp on October 5, 2012. Queenstake Resources USA, Inc. changed its name to Veris Gold USA, Inc. in January of 2013. As a result, the Jerritt Canyon Mine is owned and operated by Veris Gold USA, Inc. (VUSA), which is a wholly owned subsidiary of Veris Gold Corp.
This report reflects the most recent resources and reserves based on data produced through December 31, 2012. The effective date of this report is December 31, 2012. All underground and open pit resources and reserves in this report have been modeled in Vulcan software version 8.1.3 and 8.2 (Vulcan).
Veris is considered to be a “producing issuer” for the 2012 year, based on the definition included in the NI 43-101 guidelines. Throughout this document there are “forward-looking” statements with regards to targeted future mill production for 2013, expectations for restarting mines, and for growing the resources at the property.
2.1 Terms of reference and purpose of the report
This report is intended to provide Veris with an updated resource and reserve review and technical report for the Jerritt Canyon property that follows existing regulations in Canada. The report meets the requirements for Canadian National Instrument 43-101 and conforms to Form 43-101F1 for technical reports. The technical report confirms details provided in the Veris Gold Corp’s press release dated June 17, 2013.
Resource and Reserve definitions are as set forth in the back of this Technical Report in accordance with Companion Policy 43-101 CP, “Canadian Institute of Mining, Metallurgy and Petroleum – Definitions Adopted by CIM Council, November 27, 2010.” This report has an effective date of December 31, 2012. The following description and summary of the Jerritt Canyon property is based mostly on the previous
Technical Report (the “Jerritt Canyon Report”) of Mark Odell, P.E., Michele White, CPG, Karl Swanson, SME, MAusIMM and John Fox., P. Eng with a filing date of April 27, 2012. The Jerritt Canyon Report is available atwww.sedar.com. An additional reference for this current Technical Report is: NI 43-101 Technical Report Update by Johnson et al. (2011; 2012) entitled “NI 43-101 Technical Report Update, Yukon-Nevada Gold Corp., Jerritt Canyon property, Elko County, Nevada, USA” dated on June 28, 2011, as amended on January 6, 2012.
2.2 Qualifications of consultants and authors
The report has been prepared based on a technical and economic evaluation by four independent consultants, along with Todd Johnson, a Veris Gold Corp. employee and the primary author. All five persons are occasionally referenced throughout the current report as authors of the Technical Report. The five authors were sourced from various areas of the western United States and British Columbia, Canada. The five authors are specialists in the fields of geology, geological engineering, exploration and mining data management, mineral resource and mineral reserve estimation and classification, metallurgy, and mine engineering including open pit and underground mining.
None of the four consultants employed in the preparation of this report have any beneficial interest in VUSA or Veris or in their assets. The four consultants will be paid a fee for this work in accordance with normal professional consulting practice. Mr. Johnson is currently paid a salary as a Veris employee and has received Company stock options in the recent past.
| Veris Gold Corp. | |
| NI 43-101 Technical Report Jerritt Canyon Property, Nevada | 2-2 |
The individuals who have provided input to the current Technical Report Update are cited as “contributing author” or “primary author” and are listed below. These authors have extensive experience in the mining industry and are members in good standing of appropriate professional institutions. The four consultants are all contributing authors. Mr. Odell was the Underground Mining Manager for Queenstake Resources from July 2003 to June 2005, and again as Mine Superintendent and Chief Engineer from March 2000 to July 2003 for Anglogold as an employee. Mr. Odell visited the property on several occasions in 2009, through 2013 as a Consulting Mine Engineer. Mr. Odell last visited the mine site on December 18, 2012. Ms. White consulted at the Jerritt Canyon Mine site from August 2009 to May 2010, and retained direct hire at the mine from May 2010 to March 2011. Ms. White last visited the mine site January 22-24, 2013. Mr. Swanson visited the property on several occasions in 2010, 2011, and 2012 as a Consulting Engineer and was last at the property on March 20, 2013. Mr. Fox is a former director of Veris and last visited the property on September 1-6, 2012.
Mr. Todd Johnson is the qualified person (QP) for this report and is cited as the Primary Author.Mr. Johnson has visited the property on several occasions in late 2008 to 2013 and last visited the mine site on May 1, 2013.
The key project personnel contributing to this report are listed below. The Certificate and Consent forms are provided in Appendix A.
Table 2.2.1: Key project personnel.
| Company | Name | Title | Discipline |
| Veris Gold Corp. | Todd Johnson | Vice President of Exploration | Geology, Resources |
| Practical Mining, LLC | Mark Odell | Consulting Mine Engineer | Mining, Reserves |
| Independent Consultant | Karl Swanson | Consulting Mine Engineer | Resources, Geology |
| | | Geologic Consultant and | |
| All One River, LLC | Michele White | Exploration and Mining Data | Data Validation, Geology, |
| | | Analyst | Land Status |
| Laurion Consulting Inc. | John Fox | Consulting Metallurgist | Mineral Processing |
2.3 Price strategy
The reserves were determined using a gold price of $1,490 per troy ounce (US) which is the 36-month trailing average price over the three years from January 2010 to December 2012. The revised underground and open pit resources were estimated using a gold price of US$1,620 per troy ounce.
2.4 Units of measure
The units of measure used in this report are shown below. System International (SI) units of measure are used throughout this report unless otherwise noted. A glossary of geological and mining related terms is provided in Section 28.
| Veris Gold Corp. | |
| NI 43-101 Technical Report Jerritt Canyon Property, Nevada | 2-3 |
Table 2.4.1: Units of measure.
| UNITS OF MEASURE |
| Linear Measure |
| 1 inch = 2.54 cm |
| 1 foot = 0.3048 m |
| 1 yard = 0.9144 m |
| 1 mile = 1.6 km |
| Area Measure |
| 1 acre = 0.4047 ha |
| 1 square mile = 640 acres = 259 ha |
| Weight |
| 1 short ton (st) = 2,000 lbs = 0.9071 tonne (t) |
| 1 lb = 0.454 kg = 14.5833 troy oz |
| Assay Values |
| 1 oz per short ton = 34.2857 g/t |
| 1 troy oz = 31.1035 g |
| 1 part per billion = 0.0000292 oz/ton |
| 1 part per million = 0.0292 oz/ton = 1g/t |
2.5 Coordinate system, projections, and topography maps
All of the drill hole data stored in the acQuire drill hole database are projected in Jerritt Grid. All plan map figures and cross-sections presented in this report are also presented in Jerritt Grid. Jerritt Grid is projected in foot units and equivalent to the NAD1927 State Plane, Nevada East, FIPS_2701 system with a difference of 2,000,000 feet subtracted from the northing grid values in order to limit the number of numeric characters to adhere to mining software constraints.
All plan maps in this report have grid north (in Jerritt Grid) oriented straight up. The major grid intervals are labeled with the appropriate values in feet and can be used to determine the scale of the drawing figure
Aerial topography mapping of the property was conducted in July 2004 on 5 foot contour line intervals and was utilized as the base map for most of the current models after close disturbance inspection and local modification. Recent aerial Lidar mapping of the property on 5 foot contour line spacing was conducted by Aero-graphics Geospatial Services from August 29 to September 2, 2011 on square tiles 1,800 ft. by 1,800 ft. in size. Finer 0.5 foot Lidar contour line interval definition in the mill and tailings areas were collected at this same time.
2.6 Calendar
Veris uses a fiscal year calendar that begins on January 1 and ends on December 31.
| Veris Gold Corp. | |
| NI 43-101 Technical Report Jerritt Canyon Property, Nevada | 3-1 |
3 Reliance on other experts
The authors’ opinions contained herein are based on information provided to us by Veris Gold USA and Veris Gold Corp. throughout the course of our investigations. The sources of information include data and reports supplied by Veris, Jerritt Canyon and VUSA personnel, as well as documents cited in Section 27 hereof.
In addition, discussions were held with the following personnel and experts from Veris regarding their field of expertise with the property:
- John Barta, Environmental Manager, Veris Gold USA, Inc. (Sections 18 and 20);
- William Hofer, Chief Mine Geologist, Veris Gold USA, Inc. (Sections 10, 16.6, and 26.2);
- Joel Casburn, Land Manager, Veris Gold USA, Inc. (Section 4); and
- Shaun Heinrichs, Chief Financial Officer (CFO) for Veris Gold Corp. who provided various financial data and operating statistics.
Sources of information are documented within the text and/or in the references (Section 27). The primary author believes the information from these individuals as true based on their work at the Jerritt Canyon Mine from 2009 through 2012. Reliance on the opinions and reports of the staff personnel is based on their better working knowledge of their specific disciplines than the primary author. The primary author asked detailed questions of each of these individuals to help verify and clearly state contributions included in this report:
- The Environmental contributions relied extensively on input from discussion with John Barta.
- The metallurgical content (2011 gold recoveries in the mill) was highly dependent on discussions with Noel Avenido (former Jerritt Metallurgist) and John Fox.
- The technical status for the claims and land holding is highly reliant on discussions with VG Land Manager, Joel Casburn and a 2012 Title Opinion by Richard K. Thompson.
- The extent of reliance for the stockpile discussion and Au reconciliation is based on discussions with William Hofer. Mr. Hofer also contributed the drilling methodology presented in Section 10.
- The construction update for the new tailings storage facility and water storage reservoir was provided by Kevin Kossel.
- Costs for 2012 were provided by Shaun Heinrichs.
The contributions listed above are considered to be accurate by the author.
| Veris Gold Corp. | |
| NI 43-101 Technical Report Jerritt Canyon Property, Nevada | 4-1 |
4 Property description and location
4.1 Property description
The Jerritt Canyon property is located primarily on private land controlled by VUSA, and public land administered mostly by the United States Forest Service (USFS) and some by the United States Bureau of Land Management (BLM). The land position covers over 119 square miles. The Jerritt Canyon Mine has been an operating gold property since 1981 with two currently active underground mines: SSX-Steer and Smith, which have been in production since the end of 2011. Mining at Smith has been conducted by a contract mining service since early 2010. Mining at the SSX-Steer mine has been conducted by Veris staff since the fourth quarter of 2011. The mines produce feed for a process plant located at the site, which includes 2 roasters and a carbon-in-leach (CIL) circuit. The project also consists of three non-operating underground mining areas (Murray, MCE, and West Generator); rock disposal areas (RDAs); related haul roads, maintenance facilities, ancillary structures; and a gold processing circuit, including mill facilities, heap leaching facilities (inactive), tailings facilities, and support facilities. Exploration and drilling is ongoing at the property to add additional resources and reserves.
4.2 Property location
Jerritt Canyon Mine is located in Elko County, Nevada, approximately 50 miles north of Elko in the Independence Mountains at Latitude 41º 23’ North, Longitude 116º West. The property is accessed by paved State Highway 225 going north of Elko for about 45 miles to the paved mine access road. The property lies in ten townships within T39N to T41N and R52E to R54E relative to the Mount Diablo Base Line and Meridian (MDB&M). Figure 4.3.1 is a property location map. The property boundaries are located in the field with wooden stakes and were likely originally measured by tape and compass either from section corners or adjacent claims. All property boundaries have since been located with modern surveying equipment and/or GPS (Trimble 5800 RTK GPS Rover utilizing a Trimble base receiver for reference corrections) with a horizontal accuracy of ±0.5 cm and a vertical accuracy of ±1 cm.
4.3 Status of mineral titles
The property is 100% owned and operated by VUSA, which acquired the mine from the previous owner, a joint venture between Anglo Gold (70%) and Meridian Gold (30%), at the end of June 2003. VUSA is a wholly owned subsidiary of Veris. Claim details were discussed with the VUSA Land Manager as of April 19, 2013.
The operations are located on a combination of public and private lands, with the mines and mining related surface facilities being primarily located on mining claims in United States Forest Service (USFS) land within the Humboldt-Toiyabe National Forest. The process facilities, office, shop, and tailings are located on private land owned by Veris. Additional claims in the southern part of the land package are mostly located on private land with some located on land administered by the United States Bureau of Land Management (BLM). Claim-related fees are annually paid to the BLM and Elko County.
As of December 31, 2012, Veris owns 2,851 claims, 1,011 acres of patented claims, and 12,433 acres of fee land; in addition, Veris leases 278 claims and 11,271 acres of fee land with mineral rights (in the table below and as listed in Appendix B). A generalized land status map depicting the 2012 coverage is shown in Figure . All Jerritt Canyon property claims expire on September 1, 2013 but are always renewed every year by filing the necessary paperwork and claim fees with the BLM and the County. Estimated costs to maintain the 2,851 Veris-owned claims are $400,400 ($140 per claim), whereas the 278 leased claims are $38,920 (also at $140 per claim). Contributing author, Michele White, has reviewed the lease agreements and Jerritt claim map and finds them to be current and in good order. Additionally, a recent Title Opinion by Richard K. Thompson, November 15, 2012, supports a cohesive land package in compliance with Federal and State provisions for claim status with no issues.
| Veris Gold Corp. | |
| NI 43-101 Technical Report Jerritt Canyon Property, Nevada | 4-2 |
Table 4.3.1: Land and claim summary for Veris Gold USA’s Jerritt Canyon Project.
| Land Status | No. Claims | Acres |
| Owned Claims | 2,851 | |
| Leased Claims | 278 | |
| Total Claims | 3,129 | |
| Fee Land Owned | | 12,433 |
| Patented Claims Owned | | 1,011 |
| Fee Land Leased | | 11,271 |
| Total Acres | | 24,715 |
Veris controls more than 119 square miles of ground encompassing the mine area and surrounding acreage. The bulk of this is in the form of contiguous unpatented mining claims which are held in force by production from the mining activities. No production royalties are paid for gold deriving from these claims.
Some property is leased from landowners in the region, and a royalty is paid on production from these lands. The royalty for mined material in 2012 varied by location and was as much as 6 percent of net smelter return (NSR), the total cost of which is dependent upon the gold sale price and the refining results.
| Veris Gold Corp. | |
| NI 43-101 Technical Report Jerritt Canyon Property, Nevada | 4-3 |
Figure 4.3.1: General location map of the Jerritt Canyon Mine.
| Veris Gold Corp. | |
| NI 43-101 Technical Report Jerritt Canyon Property, Nevada | 4-4 |
Figure 4.3.2: General land map of the Jerritt Canyon property with model areas.

| Veris Gold Corp. | |
| NI 43-101 Technical Report Jerritt Canyon Property, Nevada | 4-5 |
4.4 Location of mineralization
The resource and reserve areas and mine facilities are located within Veris owned or leased claims and fee land. Figure is a plan map showing the location of the property and claim boundary along with the model areas which contain the resources and/or reserves. The blue lettered areas are open pit models and the red numbered areas are the underground models.
| Veris Gold Corp. | |
| NI 43-101 Technical Report Jerritt Canyon Property, Nevada | 5-1 |
| 5 | Accessibility, climate, vegetation,physiography, local resources andinfrastructure |
5.1 Access to the site
The Jerritt Canyon Mine is located in Elko County, Nevada, approximately 50 miles north of Elko. Access to the property is by State Road 225 to the mine access road. The roads are paved and in excellent condition all the way to the main gate where the administrative offices, process plant, warehouse, and tailings impoundment are located. The mines are accessed by haul roads on VUSA controlled land.
5.2 Climate
The climate is temperate with winter temperatures between 0º and 40º Fahrenheit and summer temperatures between 35º and 90º. Average annual precipitation at the tailings impoundment is estimated at 14 inches per year with an estimated annual average evaporation of 43 inches. A significant amount of the total precipitation falls as snow and increases with elevation to the mining areas. Mine operations are only rarely halted by weather conditions, although ore haulage from the mines may be slowed. The mill, warehouse, shop, and administrative facilities are at a lower elevation and therefore are less exposed to weather extremes. Snowfall is generally common from the months of December to May.
5.3 Vegetation
The vegetation is typical of the Basin and Range province with sagebrush vegetation dominant at the lower elevations. Small stands of aspen and isolated fir trees grow in canyons and drainages.
5.4 Physiography
Jerritt Canyon Mine is located in the Independence Mountain Range in the Basin and Range province of northern Nevada. The topography ranges from about 6,400 feet at the administrative facilities and mill site to about 8,000 feet at the highest point of the haul road to the mines.
5.5 Local resources and infrastructure
Elko, Nevada with a population of 18,300 is the closest city to the mine. The city is on Interstate 80 and is serviced by daily commercial flights to Salt Lake City, Utah. Elko is a center for the mining operations in northern Nevada and services necessary for the mine are readily available there. The local population, along with the proximity of the other nearby cities (e.g. Salt Lake City in Utah and Battle Mountain, Winnemucca, Fernley, Fallon, Reno in Nevada) is large enough to supply most of the workers and supplies for all of the mines in the area.
Power to the mine site is purchased from Nevada Energy through a 125kV, 3-phase transmission line. Cost of electrical power is approximately US$0.066/kWh.
A new natural gas pipeline has recently been installed to the south of the property by another company. Veris is examining opportunities to use natural gas to help power some of the mine facilities.
There are sufficient supplies of water at the site to allow the processing facility and other mine facilities to efficiently operate. Approximately 700 gallons per minute (gpm) of water is required to operate the mill with two primary water sources: (1) a “dirty” water source consisting of the tailings storage facility 1 (TSF-1) seepage collection system that has contributions from 90 small diameter water wells around the TSF-1, four seepage collection trenches, and three embankment blanket drains that collectively produce 1,000 gpm; and (2) a cleaner water source from two deep water wells that are each capable of producing 500 gpm. A third deep water well exists at the property but is currently not operating. Once the TSF-1 is decommissioned and reclaimed, the additional necessary water sources for the mine facilities will come from the deep well sources and/or underground mine dewatering. All waters used at the Jerritt Canyon Mine are from permitted and certificated water rights held by Veris and regulated by the Nevada Division of Water Resources.
| Veris Gold Corp. | |
| NI 43-101 Technical Report Jerritt Canyon Property, Nevada | 5-2 |
There is sufficient room to place additional wastes on the property from future mining operations based on the existing claims owned by Veris. In addition, there is sufficient space to place the planned Tailings Storage Facility 2 (TSF-2) and Water Storage Reservoir (WSR) to the south of the existing tailings storage facility and existing evaporation pond (see Figure 18.6.1) .
| Veris Gold Corp. | |
| NI 43-101 Technical Report Jerritt Canyon Property, Nevada | 6-1 |
6 History
6.1 Mining history
Prospectors explored for antimony in the 1910’s.Thirty to forty tons of stibnite as antimony ore were reportedly mined and shipped from the Burns Basin mine in the Jerritt Canyon district between 1918 and 1945. In the early 1970’s there was a renewed interest in antimony exploration when its price reached historic highs of $40 per pound. Around 1971, FMC began exploring for antimony in the Independence Mountains. In 1972, FMC, later known as Meridian Gold, discovered a disseminated gold deposit in the Jerritt Canyon area. In 1976, a joint venture was formed with Freeport Minerals Company to explore and develop the area, and mining commenced at Jerritt Canyon in 1981.
Open pit mining was conducted at the site from startup in 1981 until 1999. The first underground operation at Jerritt Canyon started up in 1993 at West Generator. Subsequently, five different underground mines have been operated at Jerritt Canyon over the years. West Generator Murray and MCE are now closed. Underground mining at the SSX-Steer complex started in 1997, was temporarily stopped in August 2008, and was restarted in October 2011. Underground mining at Smith started in 1999, was temporarily stopped in August 2008, and reopened in February 2010. The MCE underground mine was shut down in 2004, whereas the Murray underground mine was shut down in 2006. The new Steer mine portal, now a part of the SSX complex, was constructed in 2004.
6.2 Production history
Historic Jerritt Canyon open pit and underground mining production is shown in Table 6.2.1. Open pit mining was conducted at the site from startup in 1981 until 1999. The first underground operation at Jerritt Canyon started up in 1993 at West Generator. Subsequently Underground Mining was initiated at Murray, SSX, MCE and Smith. Currently only the Smith and SSX mines are operating.
On August 8, 2008, VG management decided to shut down mining operations due to increasing costs associated with the mine plan, required infrastructure expenditures that remained to be completed, and environmental concerns that remained to be addressed. The plan to continue toll milling after the shutdown of the mines was halted to complete repair work at the process mill. As a result, the workforce at Jerritt Canyon was reduced to maintenance levels while the Company undertook discussions with the Nevada Department of Environmental Protection (NDEP) to obtain permission to restart the facility and sought additional financing to fund the recommencement of operations. In order to obtain authorization to restart, the NDEP required detailed plans on how the aforementioned concerns would be addressed. On October 20, 2009, with these detailed plans in place and approved by the NDEP, and many already completed, Queenstake was able to restart operations under a Consent Decree order issued by the Attorney General of the State of Nevada, representing the NDEP. To address the environmental concerns, Queenstake (now VUSA) completed the installation of a calomel emission system on July 20, 2009 which is used to control mercury emissions. Queenstake also carried out significant overhauls and upgrades of many key components of the roaster, leach circuit, thickener, and other sections of the mill. New technical staff was hired in 2009 with directives to design a new mine plan. Underground mining at Smith recommenced in late January 2010 using contract miner Small Mine Development (SMD). Underground mining at SSX-Steer Complex recommenced in early October using Queenstake staff. Ore materials from Jerritt Canyon that currently feed the processing facility include underground ore from the
Smith Mine and stockpile materials that are either called remote or mill. The “remote” stockpiles are located in piles away from the processing facility and require hauling to the process plant while the “mill” stockpiles are located near the processing facilities.
Since its inception from July 1, 1981 to year-end 2012, the Jerritt Canyon Mill has produced 7.97 million ounces of gold. Annual production has historically averaged between 125,000 and 350,000 ounces of gold, at historical cash costs ranging from $240 to $554 per ounce. Veris internal reports indicate the total 2012 and 2011 mill production from Jerritt Canyon ores (including Jerritt Canyon stockpile and Newmont ores at 978,262 and 599,555 dry tons containing 105,627 and 73,823 ounces, respectively.)
| Veris Gold Corp. | |
| NI 43-101 Technical Report Jerritt Canyon Property, Nevada | 6-2 |
Veris records indicate the 2010 and 2008 mill production from Jerritt Canyon ore (including Jerritt sourced stockpiles) at 628,418 and 224,618 tons with 89,238 and 32,131 ounces of recovered gold attributed to the operation respectively. Cash operating costs were high in 2008 due to mill shut downs in the early part of the year and the mine shut down on August 8, 2008.
Table 6.2.1: Historic open pit and underground mine production at the Jerritt Canyon before recovery losses.
Open Pit Deposit
Name | Years in Operation
| Mined Tons
(short) | Gold Grade
(oz/st) | Ounces(2)
(contained) |
| Marlboro Canyon | 1981-1990 | 5,798,600 | 0.241 | 1,400,045 |
| Alchem | 1991-1994 | 1,657,600 | 0.098 | 162,621 |
| L. North Gen. Hill | 1980-1993 | 1,226,000 | 0.192 | 235,461 |
| U. North Gen. Hill | 1980-1993 | 7,636,300 | 0.170 | 1,298,308 |
| West Generator | 1986-1993 | 3,979,000 | 0.155 | 616,647 |
| Burns Basin | 1988-1998 | 2,441,800 | 0.169 | 412,328 |
| Mill Creek | 1992-1994 | 895,700 | 0.121 | 108,270 |
| Pattani Springs | 1988-1990 | 387,000 | 0.108 | 41,896 |
| California Mtn. | 1993-1994 | 410,300 | 0.162 | 66,341 |
| Dash | 1996-1999 | 1,906,100 | 0.221 | 420,789 |
| Winter’s Creek | 1992-1995 | 1,243,700 | 0.126 | 156,317 |
| Steer Canyon | 1994-1997 | 477,300 | 0.132 | 63,004 |
| Saval Canyon | 1994-1997 | 1,741,900 | 0.126 | 218,682 |
| Subtotal | 1980-1999 | 29,801,300 | 0.175 | 5,200,709 |
| | | | | |
Underground Mine
Production | Years in Operation
| Mined Tons
(short) | Gold Grade
(oz/st) | Ounces(2)
(contained) |
| SSX | 1997-2008; 2011; 2012 | 4,715,693 | 0.281 | 1,327,025 |
| Steer | 2004-2006 | 68,174 | 0.233 | 15,879 |
| MCE (formerly Papillion) | 1997-2004 | 258,295 | 0.369 | 95,359 |
| Murray | 1997-2006 | 3,780,795 | 0.330 | 1,248,777 |
| Smith | 1999-2008; Jan. 2010-YE2012 | 2,024,882 | 0.239 | 483,737 |
| West Generator | 1993-1997 | 460,100 | 0.235 | 108,108 |
| Saval | 2004-2006 | 3,500 | 0.495 | 1,730 |
| Subtotal | 1993-YE2012 | 11,311,439 | 0.290 | 3,280,615 |
| | | | | |
| Grand Total | 1980-YE2012 | 41,112,739 | 0.206 | 8,481,324 |
| (1) | Abbreviations: st = short ton; L. = Lower; U = Upper; Mtn. = Mountain; YE = Year-End; |
| (2) | Contained ounces do not include metallurgical recovery; |
| (3) | Gold production from open pit mining at Jerritt Canyon started in July of 1981 at the Marlboro Canyon and North Generator Hill pits; |
| (4) | The last major open pit mine production was from Dash which was mined from 1996 to 1999; |
| (5) | Steer is included in with SSX starting in 2006; |
| (6) | Steer and Saval underground mining time period not discriminated; |
| (7) | Underground test mining began in September 1991 at the Phase 1 Test Project in the high-wall of the West Generator open pit; |
| (8) | The wet mill closed down in February 1997; the fluid-bed roaster started in 3rdquarter of 1989; |
| (9) | Production records above do not show later mining of various low grade stockpile ores; |
| (10) | Data compiled from internal Mine records and Jones (2005). |
| Veris Gold Corp. | |
| NI 43-101 Technical Report Jerritt Canyon Property, Nevada | 6-3 |
6.3 Historical mineral resource and reserve estimates
The measured and indicated mineral resources, including reserves, at Jerritt Canyon during VUSA’s ownership, as documented in NI 43-101 filings are given below.
Table 6.3.1: Historic measured and indicated mineral resources, including reserves.
| | Measured | Indicated | Measured + Indicated |
| Year | | | koz | | | koz | | | koz |
| (Year-End) | kt | opt | Au | kt | opt | Au | kt | opt | Au |
| 2003 | 2,219.3 | 0.306 | 679.7 | 7,277.6 | 0.222 | 1,615.7 | 9,496.9 | 0.242 | 2,295.3 |
| 2004 | 2,263.0 | 0.287 | 650.1 | 7,724.8 | 0.228 | 1,759.5 | 9,987.8 | 0.241 | 2,409.6 |
| 2005 | 3,094.6 | 0.281 | 869.7 | 5,717.4 | 0.212 | 1,209.4 | 8,812.0 | 0.236 | 2,079.1 |
| 2006 | 2,573.9 | 0.272 | 700.1 | 5,629.3 | 0.214 | 1,207.1 | 8,203.2 | 0.232 | 1,907.2 |
| 2007 | 2,626.0 | 0.269 | 706.1 | 5,570.9 | 0.225 | 1,255.0 | 8,196.9 | 0.239 | 1,961.1 |
| 2010 | 4,549.9 | 0.236 | 1,073.1 | 6,459.5 | 0.204 | 1,316.8 | 11,009.4 | 0.217 | 2,389.9 |
| 2011 | 4,906.8 | 0.210 | 1,030.7 | 7,382.7 | 0.175 | 1,288.5 | 12,289.5 | 0.189 | 2,319.2 |
Notes: data relates to historic measured and indicated resources during VUSA’s ownership since 2003 and is from historically published NI 43-101 reports: Odell et al. (2012); Johnson et al. (2011; 2012); Pincock Allen and Holt (2004; 2005) and SRK Consulting (2006; 2007; 2008).
Historic inferred resources are listed below.
Table 6.3.2: Historic inferred mineral resources.
| | Inferred |
| Year | | | koz |
| (Year-End) | kt | opt | Au |
| 2003 | 5,415.4 | 0.191 | 1,034.0 |
| 2004 | 4,058.7 | 0.219 | 888.4 |
| 2005 | 2,646.5 | 0.229 | 605.6 |
| 2006 | 2,414.8 | 0.226 | 545.2 |
| 2007 | 2,319.7 | 0.224 | 520.4 |
| 2010 | 3,872.6 | 0.194 | 751.3 |
| 2011 | 4,115.7 | 0.182 | 748.4 |
Notes: Data relates to historic inferred reserves during VUSA’s ownership since 2003 and is from historically published NI 43-101 reports: Odell et al. (2012); Johnson et al. (2011; 2012); Pincock Allen and Holt (2004; 2005) and SRK Consulting (2006; 2007; 2008).
The historic proven and probable reserves at Jerritt Canyon during VUSA’s ownership, as documented in NI 43-101 filings are given below.
Table 6.3.3: Historic proven and probable mineral reserves.
| | Proven | Probable | Proven + Probable |
| Year (Year- | | | koz | | | koz | | | koz |
| End) | kt | opt | Au | kt | opt | Au | kt | opt | Au |
| 2003 | 932.8 | 0.299 | 279.0 | 2,132.4 | 0.254 | 541.1 | 3,065.3 | 0.268 | 820.1 |
| 2004 | 760.5 | 0.271 | 206.3 | 2,750.1 | 0.243 | 669.1 | 3,510.6 | 0.249 | 875.4 |
| 2005 | 1,211.3 | 0.257 | 311.7 | 2,511.7 | 0.225 | 566.2 | 3,723.0 | 0.236 | 877.9 |
| 2006 | 636.1 | 0.273 | 173.8 | 1,348.8 | 0.231 | 312.0 | 1,984.9 | 0.245 | 485.7 |
| 2007 | 653.4 | 0.229 | 149.9 | 2,501.8 | 0.227 | 567.4 | 3,155.2 | 0.227 | 717.3 |
| 2010 | 1,406.1 | 0.193 | 270.9 | 2,959.7 | 0.151 | 446.0 | 4,365.8 | 0.164 | 717.0 |
| 2011 | 1,980.2 | 0.189 | 374.8 | 4,076.7 | 0.168 | 686.0 | 6,056.9 | 0.175 | 1,060.8 |
Notes: Data relates to historic proven and probable reserves during VUSA’s ownership since 2003 and is from historically published NI 43-101 reports: Odell et al. (2012); Johnson et al. (2011; 2012); Pincock Allen and Holt (2004; 2005) and SRK Consulting (2006; 2007; 2008).
| Veris Gold Corp. | |
| NI 43-101 Technical Report Jerritt Canyon Property, Nevada | 6-4 |
The aforementioned resources and reserves since 2003 have been prepared by Qualified Persons employed by Pincock, Allen and Holt, SRK Consulting, Practical Mining LLC, and Veris and are therefore viewed by the primary author of this report, Todd Johnson (QP), as being reliable and relevant. It is apparent that the historical proven and probable reserves documented every year in the NI 43-101 reports since 2003 range from 1,984.9 to 6,056.9 kt. It is also recognized that the measured and indicated resources documented every year in the NI 43-101 reports since 2003 range from 8,196.9 to 12,289.5 kt.
| Veris Gold Corp. | |
| NI 43-101 Technical Report Jerritt Canyon Property, Nevada | 7-1 |
7 Geological setting and mineralization
7.1 Regional geology
The Jerritt Canyon mining district is located in the Independence Mountain Range in northern Nevada. The range is part of the Basin and Range province of Nevada and is a horst block consisting primarily of Paleozoic sedimentary rocks with lesser Tertiary volcanic rocks and intrusive dikes. A district geologic map is shown in Figure 7.1.1 and a stratigraphic column is shown in Figure 7.1.2. Much of this data was previously presented in other published reports (Jones, 2005; McMillan, 2005; Daly et al., 1991) and is still considered to be relevant.
Contributing author of this report, Michele White, has reviewed the geological information in the drill hole databases and finds the geological determinations in the logs to be adequate for use in geological modeling of the resource areas and also deems them adequate for use in the present resource and reserve work.
There are four distinct Paleozoic sedimentary assemblages in the district characterized by their position relative to the Roberts Mountains thrust, a Devonian to Mississippian structure formed during the Antler orogeny:
The western facies, or upper plate of the thrust, consists of the Cambrian to Ordovician Valmy Group and forms about 70% of the exposed rock. In the Jerritt Canyon district, the Valmy Group consists of the Snow Canyon formation, a chert, argillite, greenstone, and carbonaceous siltstone sequence, and the McAfee Quartzite, a sequence of massive quartzite and shale;
The eastern facies, or lower plate of the thrust, consists of a sequence of Ordovician to Devonian shallow water sedimentary rocks that are exposed in tectonic and erosional windows through the upper plate. The gold mineralization in the district is contained with the eastern facies rocks. The Pogonip Group rock is exposed in the west-central part of the district and is composed of fossiliferous limestone with calcareous shale and dolomite interbeds. The Eureka Quartzite is a massive quartzite with minor interbeds of siltstone. The Hanson Creek Formation is one of two principal ore hosts in the district. It is divided into five units, with the contacts between the units being the favorable sites of gold mineralization. The Hanson Creek consists of interbedded silty limestone, calcareous siltstone, dolomite, chert, and carbonaceous limestone. The Roberts Mountains Formation is the second ore host and consists of calcareous, carbonaceous siltstone and thinly bedded, silty limestone. The Waterpipe Canyon formation is thought to have been deposited in a synkinematic foreland basin that formed during the Antler orogeny; it consists of carbonaceous shale with interbedded greywacke, chert pebble conglomerate, bedded chert, sandstone, and siltstone;
The Schoonover sequence occurs north of the district and consists of basaltic and andesitic greenstone, chert, tuff, volcaniclastics, and siliciclastic and limestone turbidites of Devonian to Permian age; and
The Antler overlap sequence is restricted to the north end of the range and consists of conglomerates, argillite, siltstone and limestone.
The Paleozoic sequences are cross-cut by Pennsylvanian basalt dikes, Eocene basalt-quartz monzonite dikes, and Miocene basalt dikes. The Pennsylvanian and Eocene basaltic dikes are altered and mineralized in most of the mines.
The structural fabric in the district consists of two dominant fault trends, west-northwest trending and north-northeast-trending.
| Veris Gold Corp. | |
| NI 43-101 Technical Report Jerritt Canyon Property, Nevada | 7-2 |
The geological chronology of regional structural event important to deformation and mineralization of rocks in the Jerritt Canyon district is complex with several regional deformation events being evident in the mines. The Devonian to Mississippian Antler orogeny, resulting from west to east compression, is represented in the upper plate Snow Canyon Formation with north-south folds in both the hanging wall and footwall of the thrust. The Permian to Triassic Sonoma orogeny emplaced the Golconda allochthon over parts of the Roberts Mountains allochthon to the north of the district. The northwest to southeast compression associated with this deformation is rarely seen in the district. The Jurassic to Cretaceous Nevadan orogeny resulted in east-west folds that are often associated with mineralization.
| Veris Gold Corp. | |
| NI 43-101 Technical Report Jerritt Canyon Property, Nevada | 7-3 |
Figure 7.1.1: General geology map of the Jerritt Canyon District.
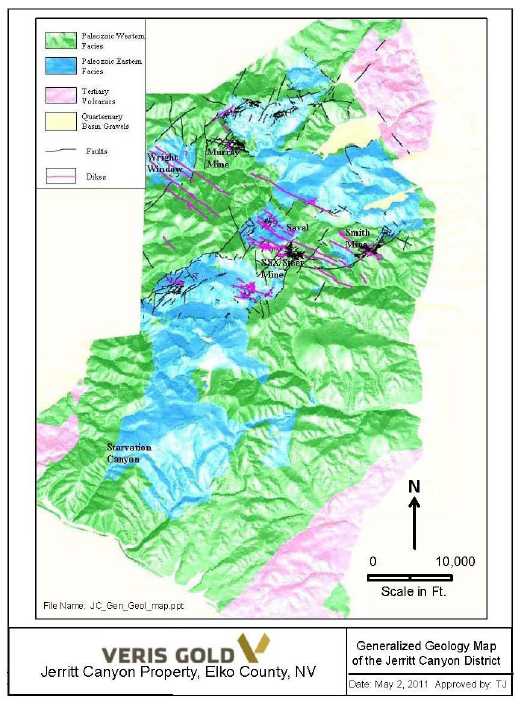
| Veris Gold Corp. | |
| NI 43-101 Technical Report Jerritt Canyon Property, Nevada | 7-4 |
Figure 7.1.2: General stratigraphic section of the Jerritt Canyon District.
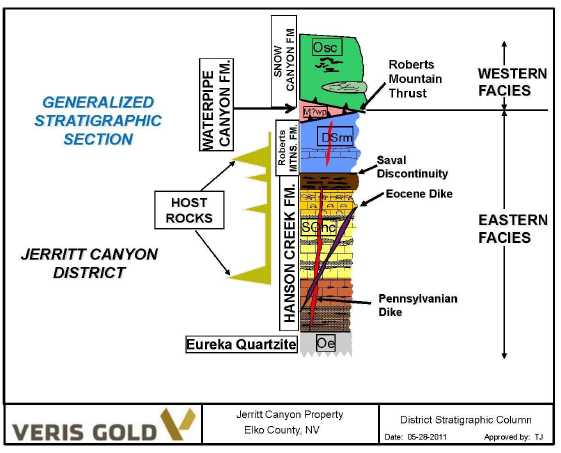
7.2 Local geology
Within the Jerritt Canyon area, gold can locally occur within all sedimentary formations, but is preferentially hosted by the Roberts Mountains and Hanson Creek Formations of the eastern facies in the lower plate of the Roberts Mountains thrust. The Roberts Mountains Formation consists of calcareous to dolomitic siltstones and silty limestones. The Hanson Creek Formation is divided into five members, numbered I through V from the top of the formation to the bottom. Hanson Creek I is a thinly bedded sequence of gray, medium-grained limestones and continuous blocky chert beds; it is typically brecciated. Hanson Creek II is a dark to light gray, irregularly bedded to massive, vuggy, dolomitic limestone. Hanson Creek III consists of intercalated carbonaceous micrites and laminated argillaceous limestones. Hanson Creek IV is a thickly bedded, medium to coarse-grained, carbonaceous limestone with discontinuous black chert nodules. Hanson Creek V consists of laminated, carbonaceous siltstone with chert lenses.
The contact between the Roberts Mountains Formation and the overlying Snow Canyon Formation is a regional thrust fault which transported the Snow Canyon eastward over the Roberts Mountains Formation. The contact between the Roberts Mountain Formation and the underlying Hanson Creek Formation is a discontinuity locally known as the Saval discontinuity. The discontinuity may be an angular unconformity of local extent or a thrust fault. Gold mineralization is typically enriched along this discontinuity. The base of the Hanson Creek is gradational into the Eureka Quartzite. Locally, the stratigraphic section has been repeated by thrust faulting as seen in the interpretive cross-section through the SSX mine in Figure 8.1.1.
| Veris Gold Corp. | |
| NI 43-101 Technical Report Jerritt Canyon Property, Nevada | 8-1 |
8 Deposit types
The Jerritt Canyon deposits are typical of the Carlin-type deposit consisting of micron to submicron-sized gold particles hosted primarily by carbonaceous, Paleozoic calcareous and sulfidic sedimentary rocks. Lesser amounts of ore are hosted by intermediate to mafic intrusive rock. The deposits often consist of several discrete pods or zones of mineralization whose location is controlled by intersections of major west-northwest and north-northeast structures that cut folded, permeable and chemically favorable host rocks. Locally, intrusive dikes that follow the northwest or northeast structures may be important host rocks. The combination of these structural and stratigraphic controls imparts a highly irregular shape to the ore zones, though most have more horizontal than vertical continuity depending upon the orientation of the host rocks.
Gold in the Jerritt Canyon ore deposits occurs as free particles of inter-granular, native gold, on or within pyrite, or in association with sedimentary carbonaceous material. Due to the sulfide and carbonaceous affinities, most of the gold deposits at Jerritt Canyon require fine grinding and oxidation to permit the gold particles to be liberated by standard, carbon-in-leach cyanidation.
The exploration program outlined in this document accounts for all of the previous exploration information that has been conducted in the past which is briefly summarized in Sections 6 and 9. In addition, the planned 2012 exploration program focuses on drilling resource conversion holes both proximal to the Smith and SSX-Steer underground mine infrastructure (underground workings), in the planned Starvation Canyon underground mine, and in open pit resources that have the best potential to advance into potential production. The drilling will be focused along well known mineralized trends (defined by previous drilling, mapping, geophysics, or soil/rock surface sampling) with adjacent in-place infrastructure (underground workings and/or access roads or mining facilities) in order to have the best chance of adding potential new resources and reserves. This will allow the Company to potentially keep feeding ore to the processing facility at Jerritt Canyon well into the foreseeable future. The drilling methods to be employed at Jerritt Canyon incorporate reverse circulation and diamond types which have been proven to work well at other northern Nevada Carlin-Type deposits.
8.1 Mineralization
Gold mineralization at Jerritt Canyon is hosted by the Hanson Creek Formation and the base of the Roberts Mountains Formation in the lower plate of the Roberts Mountains thrust. Gold mineralization is structurally controlled by high angle west-northwest and north-northeast trending structures that acted as conduits for mineralizing fluids. Much of the more continuous gold mineralization occurs within the favorable stratigraphic intervals along the limbs or hinge zones of large anticlinal folds, and at the intersection of the two sets of high angle structures. The ore zones form along well-defined structural and mineralization trends as stratigraphically controlled tabular pods that are locally stacked upon one another resulting from the presence of more than one favorable stratigraphic unit and/or local thrust and/or high-angled fault intersection controls. The deposits are Carlin-type, sediment-hosted gold mineralization within carbonaceous sediments. The gold occurs as very fine-grained micron-sized particles as grain boundaries or inclusions in pyrite, and as free grains in carbonaceous-rich carbonate and fine-grained, calcareous, clastic sedimentary rocks.
Alteration in the Jerritt Canyon district includes silicification, dolomitization, remobilization, and reconstitution of organic carbon, decalcification, argillization, and pyritization (typically containing elevated arsenic). The rocks also exhibit hypogene and supergene oxidation and bleaching. The most important alteration types relative to gold deposition are silicification, remobilization and reconstitution of organic carbon, pyritization, and decalcification.
The resource and reserve areas at Jerritt Canyon are shown on Figure . Drill hole maps and the modeled Au grade shells used to determine the existing resources as of December 31, 2012 in the main work areas are presented in Sections 10 and 14.2, respectively. Mineralization characteristics in the main work areas are described below and shown in figures in Section 14. Zone numbers in the following descriptions refer to mining areas that are presented in the current report or the SRK year-end 2007 Technical Report.
| Veris Gold Corp. | |
| NI 43-101 Technical Report Jerritt Canyon Property, Nevada | 8-2 |
8.1.1 SSX-Steer Mine
The drift connecting the SSX and Steer mines was completed in the latter half of 2005 and the mines have been operated as a single unit referred to as the SSX complex or SSX-Steer complex since then. In 2007, a drift was completed to the Saval 3 portal allowing access to resource extending into the pit wall.
The SSX deposit was discovered in the early 1990’s following the northeast structural trends between the
Burns Basin and California Mountain deposits and the west-northwest trends from the Steer/Saval deposits. Mining at SSX started in 1997.
Figure 14.3.5 shows mineralization at the SSX-Steer, Saval, and West Mahala model and mining areas. The modeled mineralized bodies show a distinct northwest trend in the SSX area but are generally more east-west in the other areas. The mineralized zones are more continuous in the SSX area ranging from 200 to 2000 feet in length along the northwest strike and 50 to 200 feet in width. The thickness of the mineralization at SSX ranges from 10 to 100 feet. The mineralization at Steer is less continuous ranging in strike length from 50 to 500 feet and 50 to 300 feet in width. The ore thickness at Steer ranges from 20 feet to rarely 100 feet. The depth to mineralization ranges from near surface at the west end of Steer to a depth of about 800 feet below the surface for most of SSX. Most of the mineralization is between 600 to 1000 feet below the surface.
Mineralization at the SSX mine occurs mostly in the micritic unit III of the Hanson Creek Formation. A smaller portion of the mineralization occurs in calcareous siltstone at the base of the Roberts Mountains Formation or in the upper two cherty and dolomitic members of the Hanson Creek Formation. Mineralized zones are localized in and near west-northwest trending steeply dipping dikes (e.g. South Boundary Dike); however, dike material is a minor component of the ore at SSX. Mineralization is also localized along cross-cutting northeast trending faults (the Purple Fault in Zones 4 and 6, and the Crestline Fault in Zone 1 see Figure 8.1.1.1 below). Folding of the mineralized horizons is apparent along axes parallel to the west-northwest dike trend and, more prominently, parallel to the northeast fault set. Gold occurs in decarbonitized rock, commonly in association with variable amounts of orpiment and realgar. Silicification with stibnite can also be associated with gold in portions of the upper cherty member of the Hanson Creek Formation.
| Veris Gold Corp. | |
| NI 43-101 Technical Report Jerritt Canyon Property, Nevada | 8-3 |
Figure 8.1.1.1: Cross-section through the SSX deposit showing general geology.
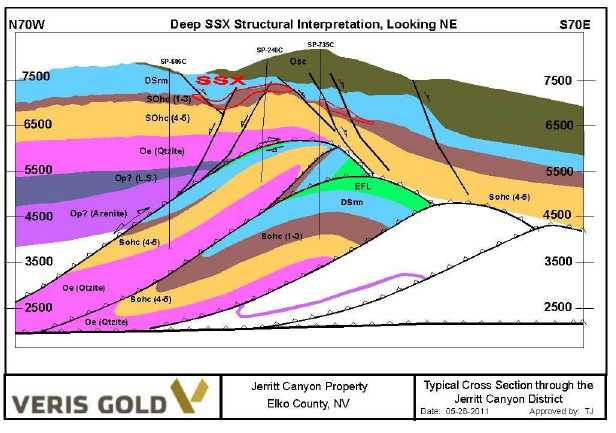
Gold mineralization in the Steer portion of the SSX complex has been identified in an area stretching approximately 3,000 feet east from the old Steer pit to halfway along the connection drift to SSX Zone 5. Most gold mineralization at Steer is associated with gently dipping structures cutting through the Hanson Creek III unit. These structures strike northeast and dip southeast, offsetting individual strata. Typical ore zones follow the structures and tend to be broad and relatively thin. The mineralized zones are usually at the contact between the Hanson Creek units III and IV and occasionally follow the structures up through the Hanson III. Both within the Steer portion and the western side of SSX several low-angle features have been observed. These features are at least partly responsible for the gold mineralization at the contact of the Hanson Creek units III and IV.
In the eastern portion of the Steer area, high-grade mineralization is associated with the Husky fault, a major northeast trending normal fault with at least 300 feet of normal dip-slip displacement to the southeast. Major northwest trending dikes appear to have locally compartmentalized high-grade mineralization. The intersection of these dikes with the Hanson III unit and the Husky fault and its related structures offers excellent exploration potential. One of these dikes is interpreted to be the western extension of the South Boundary dike, which is an important ore-controlling structure at the SSX mine to the east.
At Steer and SSX the structural intersections are the primary targets for resource expansion, as well as the westward extension of the South Boundary dike.
| Veris Gold Corp. | |
| NI 43-101 Technical Report Jerritt Canyon Property, Nevada | 8-4 |
8.1.2 Saval Mine and Saval 4
Previous mining at Saval has included both open pit mining (1994-1997) and small-scale underground mining from 2004 to 2006 in the high wall of the Saval 2 pit. Gold mineralization in the Saval Basin area to the west of the SSX mine is primarily hosted in favorable Hanson Creek Formation unit III where it has been structurally prepared by faulting and has locally been compartmentalized by northwest-trending dike systems. In this area, a series of west-northwest trending structures have been cut by northeast-trending faults. Notable structural features include the west-northwest trending Saval horst and the northeast-trending Husky fault, which cuts across the older Saval horst and down-drops it to the southeast. Mineralization is mostly hosted in the Hanson III unit in the vicinity of structural intersections, often forming relatively steep, narrow, plunging bodies. Dikes, such as the Saval 3 pit dike can be traced for thousands of feet. High-grade gold mineralization has been concentrated along the Saval 3 dike in several locations, most prominently in the Saval 3 pit and in the north part of Zone 5 at SSX.
Mineralization at Saval generally trends east-west from 200 to 1,000 feet. The width ranges from 50 to 200 feet and the thickness from 10 to 50 feet. The depth is from the surface to about 400 feet below the surface. Saval contains gold mineralization that has been recently remodeled with both 0.01 opt Au grade shells and 0.10 opt gold grade shells.
The Saval 4 underground resource is a relatively steep and vertically extensive high-grade zone that lies within the Saval horst beneath a splay fault of the Sheep Tank fault. It is interpreted that the intersection of west-northwest trending faults that bound the horst with northeast trending faults helped form this resource. The Saval 4 underground mine development is targeted to commence in Quarter 3 of 2013.
8.1.3 Smith Mine
The Smith Mine, accessed from near the bottom of the Dash open pit, was started in 1999 as the pit was being mined out. The Smith Mine complex consists of several distinct areas that are accessed from the Smith portal, as well as an area to the east, East Dash, that will be accessed from a separate portal in the Dash pit. During 2006 a separate portal was developed to access mineralization in the east high wall of the Dash pit. Figure 14.3.6 shows the Smith mineralization.
Gold mineralization in the main Smith, Mahala, and West Dash deposits is associated with the northeast trending Coulee Fault and west-northwest trending faults and dikes. In Zone 1, high-grade gold mineralization is hosted in the upper and middle portions of the Hanson Creek Formation unit III within a northwest trending horst block between the South Graben fault and the 170 fault. Mineralization in Zones 2 and 3 is directly associated with west-northwest trending dikes. High-grade mineralization occurs within the Hanson Creek units II and III along the steeply dipping dikes. Lesser amounts of mineralization exist at higher levels where the dikes intersect favorable beds in the Roberts Mountains Formation. An exception to the tight elevation controls on mineralization is at the intersection of the west-northwest trending dikes and Coulee fault. Here, high-grade mineralization blows out into the Hanson Creek unit III along the west plunging intersection of the dikes and the fault for a down-dip depth of 600 ft.
Gold mineralization in the Mahala area is spatially associated with the west-northwest trending Mahala fault and associated dikes and favorable ore-host stratigraphy including units II and III of the Hanson Creek Formation and lower beds of the Roberts Mountains Formation. Mineralization at East Mahala occurs primarily in broad, SE-dipping lenses in Roberts Mountains Formation in the hanging wall of the Coulee Fault.
The B-Pit deposit occurs as gently dipping, thin lenses of mineralized material north of the main Smith deposit. Three of the four lenses occur are stratigraphically bound within the Roberts Mountains Formation. The fourth lens occurs at the top of the Hanson unit III in the wall of a NW-trending horst block just to the south of the other three zones.
| Veris Gold Corp. | |
| NI 43-101 Technical Report Jerritt Canyon Property, Nevada | 8-5 |
The West and East Dash deposits occur at the extreme ends of the west-northwest trending Dash Fault system which formed the mineralization mined in the Dash pit. The West Dash deposit occurs at the intersection of the Coulee fault and the west-northwest trending Dash fault. Most gold mineralization at West Dash occurs in fault-bounded slices of Hanson Creek unit III with minor amounts in the overlying Hanson Creek unit II and Roberts Mountains Formation. West Dash is accessed through the Smith Portal.
The East Dash deposit lies approximately 1,800 feet southeast of the Dash pit. A portion of this deposit has been accessed by a small portal in the pit. At East Dash, most gold occurs in two lenses parallel to the Dash Fault and dipping to the northeast. The largest lens is about 1,100 feet and is 15 feet to 25 feet thick. This mineralization is fairly flat lying and is hosted mostly at the contact between the Hanson Creek II and III units. The north edge of the lens seems to be bounded by a steep east-west trending fault that is locally mineralized with high-grade material. The second lens is smaller at about 350 feet across, but much thicker, up to 120 feet. Some 2011 drill holes tested the mineralization extent of the East Dash deposit.
The mineralization at Smith generally trends northwest with minor northeast trends along minor structures. The mineralization is continuous along the northwest trend ranging from 200 to 2,500 feet. The width of the mineralization ranges from 20 to 400 feet and the thickness ranges from 10 to 100 feet. The depth of the mineralization ranges from near surface at the Dash Pit to 1,200 feet below the surface to the south and east.
8.1.4 Murray Mine
The Murray Mine occurs within the Roberts Mountains Formation and the top three units of the Hanson Creek Formation. A minor amount of mineralization also occurs within the silicified unit IV of the Hanson Creek Formation. It was originally discovered by condemnation drilling for a waste dump for one of the early open pits. Mineralization in the main Murray deposit occurs along the New Deep Fault which is a wrench fault striking west -northwest and dipping 50º to 60º to the northeast. Mineralization in Zone 7 located about 750 feet north of the New Deep Fault occurred within calcareous siltstone beds of the Roberts Mountains Formation. Zone 7 and the main Murray have been largely mined out, with remnant pockets of mineralization remaining.
Mineralization previously mined at Murray generally trends southwest but the southern body trends west-northwest. One strong north-south mineralized trend connects to the southern body on the west side. The main trends are continuous and range from 500 to 2,500 feet in length. The width is generally 50 to 400 feet and the thickness from 20 to 200 feet. The depth ranges from the surface to 750 feet deep. The groundwater table at this former mine currently lies at approximately 6,100 feet in elevation; no dewatering wells are active at Murray today.
Remaining mineralization making up the current resource at Murray has been remodeled as multiple 0.10 opt Au grade shells occurring in an area up to 1,500 feet long immediately west (and south) of the existing underground workings. These grade shells range in size from 100 to 800 feet long, 20 to 230 feet wide, and 5 to 40 feet thick and are located on a sub-horizontal to gently to moderately westerly dipping anticlinal fold limb.
Mineralization in Zone 9 is included in the recently remodeled Murray resource. This mineralization is associated with a westward projection of the New Deep Fault and several northeast trending faults. It was the focus of drilling campaigns in 2002-2005. Although there was no additional drilling in this resource it was removed from reserves in 2006 because of economics and possible water issues; some of this mineralization has been added back to reserves this year based on more favorable mining economics. It consists of two separate areas, a relatively flat-lying zone at the base of the Roberts Mountains Formation and a main zone which is associated with the New Deep fault. Mineralization at Zone 9 is hosted by the Hanson Creek III which is locally overlain by the Snow Canyon Formation.
| Veris Gold Corp. | |
| NI 43-101 Technical Report Jerritt Canyon Property, Nevada | 8-6 |
8.1.5 Starvation Canyon
Starvation Canyon occurs in the southern half of the Jerritt Canyon property. Gold mineralization at Starvation Canyon occurs at the Hanson II-III contact and is localized along a west-northwest fault zone at northeast structural intersections. The majority of the mineralization is within the interbedded micrite and argillaceous limestone unit III of the Hanson Creek Formation, starting at or just beneath the contact. There are instances where mineralization has formed within the massive limestone of the basal Hanson Creek II, but these are rare. Drilling in 2007 and 2008 further defined the resource at Starvation, along its outer edges as well as the internal grade distributions. High angled structures have also been identified. In addition, core drilling has improved sample recovery.
The mineralized zone at Starvation Canyon trends northwest for a length of 1,500 feet and a width ranging from 150 to 400 feet. The mineralized trend has a thickness is 5 to 100 feet and the depth ranges from 300 to 600 feet below the surface. The reserves and resources at Starvation Canyon lie above the groundwater table. Recent surface drilling in 2011 included infill drilling and geotechnical diamond drilling to help update the mine design. The Year-End 2012 Starvation Canyon resources and reserves includes all 2011 drill hole assay results. The Starvation Canyon underground mine development started in November 2012 and the mine was officially opened in early April 2013.
8.1.6 West Mahala
The West Mahala mineralized zone lies between the Smith Mine to the east and the SSX Mine to the west and is hosted at the contact between the Roberts Mountain and Hanson Creek Formations. The West Mahala mineralization is generally 1,000 to 1,200 feet below the surface.
Two main pods of mineralization make up most of the resource at West Mahala. One of the mineralized pods (Zone 1) is located just east of the existing SSX-Steer underground workings that strikes northwest and is approximately 900 feet long. This pod has been modeled with 4 separate, stacked 0.10 opt Au grade shells ranging from 5 to up to 60 feet thick.
The northeastern pods of mineralization (Zone 9) were modeled as two separate, continuous, gently westerly dipping and stacked 0.10 opt Au grade shells and are approximately 1,100 feet long by up to 850 feet wide by 5 to 40 feet thick and are open to the west, east, and south. Mineralization in theses pods trends east-west with continuity ranging from 400 to 1,100 feet in length. The majority of the resources at West Mahala lie below the groundwater table.
8.1.7 Wright Window
Wright Window is a small open pit reserve and resource area located on the west side of the Independence Mountains to the west of the Murray mine. The deposit is hosted by the lower Roberts Mountains and Upper Hanson Creek Formations along the Saval Discontinuity. Mineralization in the resource occurs in several zones. The west zone mineralization outcrops at the surface and is about 50 feet thick. The higher-grade eastern zone is about 200 by 300 feet long and wide, 45 feet thick, and lies about 400 feet below the surface.
8.1.8 Pie Creek
Gold mineralization at Pie Creek occurs in a series of near-surface zones in the head of Pie Creek drainage on the east flank of Wheeler Mountain in the southern half of the Jerritt Canyon property. Indicated and inferred resources have been included in the block model and are shallow enough (<200 feet in depth below the surface) for consideration of open pit mining. The main pod of mineralization is about 800 feet long, dips moderately to the southeast at about 30°, and is 20 to 45 feet in cross-sectional thickness. Mineralization is hosted in the top of unit 3 of the Silurian-Ordovician aged Hanson Creek Formation (SOhc3) and is probably controlled by northeast-trending faults. Three other smaller mineralized pods are also hosted in the same rock unit but strike northwest and dip moderately to the north. The main mineralized pod occurs between two mineralized northwesterly cross structures.
| Veris Gold Corp. | |
| NI 43-101 Technical Report Jerritt Canyon Property, Nevada | 8-7 |
8.1.9 Mill Creek
Gold mineralization at Mill Creek occurs in a small, near-surface zone located just down the hill from a mineralized zone previously mined by a series of small open-pits. The modeled remaining intact mineralized zone is about 400 ft across, dips moderately to the north at about 400, and varies from 20 to 70 ft in cross-sectional thickness. Mineralization is hosted in unit three of the Silurian-Ordovician aged Hanson Creek Formation (SOhc) and is localized in a structural wedge between intersecting east-west and northeast trending faults that down-drop Hanson Creek unit three against unit four. These faults splay off of the nearby major northeast-trending Mill Creek fault. The Mill Creek fault is of high displacement and cuts diagonally across the district, forming the western boundary of three major lower plate carbonate rock windows.
8.1.10 Road Canyon
Potentially economic mineralization at Road Canyon occurs in a thin, near- or at-surface body10 to 25 feet thick hosted in colluvial material. This mineralization occurs over several hundred feet in length on a moderately sloped hillside. The modeled mineralization is interpreted as the weathered remains of a bedrock gold zone with some amount of downslope movement.
This mineralization was modeled in Vulcan as four separate 0.01 opt Au grade shells. A much lighter tonnage factor of 17.5 ft3/ton was used for the grade shell closest to the surface instead of the standard 12.6 ft3/ton in order to better represent swelling and pore space in the unconsolidated material. The unconsolidated material in the near surface mineralization could be potentially scraped or bulldozed in mining.
8.1.11 Burns Basin
The Burns Basin area was previously open pit mined from 1988 to 1998. Gold mineralization that comprises the intact open pit and underground resources is mostly hosted at the contact zone between the Roberts Mountain Formation and the Hanson Creek Formation, and locally between the Hanson Creek III and IV units on a gently easterly dipping anticlinal fold limb. The remodeled 0.01 opt gold grade shells that make up the bulk of the Burns Basin resource are continuous to semi-continuous, locally stacked shapes ranging from 125 to 3,400 feet long, 40 to 1,360 feet wide, and 20 to 100 feet thick. A significant amount of fill has been placed in portions of the Burns Basin pits, some of which is classified as municipal solid waste and debris from crates, cartons, and perhaps demolition of equipment.
A total of 61 surface drill holes were completed at Burns Basin in 2011 to help delineate and extend detection of the gold mineralization. The assays of these 2011 drill holes were not received in time to be included in the Year-End 2011 resource but have been included in the current Year-End 2012 Mineral Resource and Reserve.
8.1.12 California Mountain
Mineralization in the California Mountain area is located north and west of the existing California open pit that was mined from 1993 to 1994. Mineralization is hosted both in the Roberts Mountain Formation near the upper contact with the Hanson Creek Formation, and within unit III of the Hanson Creek Formation. Other mineralization lies on a northeastern mineralized trend. No resources or reserves from California Mountain have been included in the Year-End 2012 tables.
| Veris Gold Corp. | |
| NI 43-101 Technical Report Jerritt Canyon Property, Nevada | 9-1 |
9 Exploration
The Jerritt Canyon district was explored by prospectors looking for antimony in the early 1900’s. FMC Corporation, (exploring for antimony in the 1970’s), discovered gold occurring in similar habit to occurrences observed in the nearby Carlin trend. In 1976, FMC, (then Meridian Mining), formed a joint venture with Freeport Minerals to explore and develop the deposits. Mining commenced in 1981 with the North Generator open pit.
Since then, the operators of Jerritt Canyon have conducted exploration programs for the identification and development of new mineralized areas. Several open pit deposits were discovered, developed, and mined during the 1980’s and 1990’s, including North Generator, Alchem, Marlboro Canyon, Burns, Steer, Saval and Dash. The Dash open-pit was the last significant open pit to be mined on the property in 1999. Underground targets were also identified, and the first to be exploited was the West Generator underground deposit in 1993. Underground mining has dominated at Jerritt Canyon since 1999 and has focused at Murray, Smith, and SSX.
The Murray deposit, originally discovered by condemnation drilling, produced over 1 million ounces. The SSX deposit was discovered in the early 1990’s by geologists following the structural trends between Burns Basin and California Mountain open pits. The SSX mine has also produced over 1 million ounces. The MCE, Smith, and Steer extension of SSX are more recent discoveries.
The Jerritt Canyon operation has had a history of exploration and discovery since the 1970’s. In the last few years until Queenstake’s (now VUSA) acquisition of the property, most of the exploration efforts have been concentrated at and around the existing underground mines. Exploration efforts in the southern part of the range were directed to areas such as Water Pipe, Pie Creek, and Starvation Canyon (Figure 4.3.2) . Queenstake and now VUSA have recently increased the exploration effort near the mine areas and also in the south. As a result, the known mineralization at Starvation Canyon has increased in size and quality so that a portion of it was included in the end of 2005 reserves. Additional drilling at Starvation Canyon in 2007, 2008, and 2011 was targeted toward further definition and expansion of the resource. Surface exploration drilling and underground core drilling, which is also used as an exploration tool, generally decreased from 2000 to 2002, when the former owner, AngloGold, shifted focus from exploration to reserve development. Drilling statistics for these recent years that document this change are presented in Section 10 “Drilling and sampling methodology.” After the acquisition of Jerritt Canyon in mid-2003, Queenstake/VUSA started more aggressive exploration and mine development programs and those programs generally continued after the merger of Queenstake Ltd and YGC in June 2007 up to the August 2008 mine shut down.
Veris has carried out an aggressive program of exploration since it acquired the property in mid-2003. Since then, a number of different contract drilling companies have completed both underground and surface drilling at the property. The drilling companies for each drill hole are listed on the drill logs kept in the digital drill hole databases (in acQuire software) and/or in the paper drill hole log files stored at the mine. Drilling companies that have worked at Jerritt Canyon since 2008 are identified in Section 10 of this report. In addition, since mid-2003 Queenstake owned the underground production drills (e.g. Solo, Secoma and Cubex), which also completed part of the underground drilling prior to the August 2008 mine shut down. The total underground and surface drilling completed since 2003 at the property is summarized below (excluding production drilling):
- 2003: 280,151 feet of underground and surface RC and Core Drilling;
- 2004: 710,896 feet of underground and surface RC and Core Drilling;
- 2005: 450,694 feet of underground and surface RC and Core Drilling;
- 2006: 396,063 feet of underground and surface RC and Core Drilling;
| Veris Gold Corp. | |
| NI 43-101 Technical Report Jerritt Canyon Property, Nevada | 9-2 |
- 2007: 467,242 feet of underground and surface RC and Core Drilling;
- 2008: 237,250 feet of underground and surface RC and Core Drilling;
- 2009: no drilling was completed in 2009;
- 2010: 8,756 feet of underground RC and Core Drilling;
- 2011: 157,769 feet of underground and surface RC and Core Drilling; and
- 2012: 43,188 feet of underground and surface RC and Core Drilling
Authors of this report reviewed the drilled data results stored in multiple datasets from August 2008 to December 31, 2011 for the current analysis. Since the last technical report for this property, (Odell et al.; 2012) additional data derived from 2012 drilling was reviewed in detail by author, Michele White. These new datasets included:
1) the 2012 isis-format dataset used for modeling of the new resource and reserve estimates;
2) the centralized acQuire database;
3) Jerritt lab analysis results for underground production drilling;
4) SMD’s internal dataset used in their daily mine plan; and
5) outside certified lab results from ALS-Minerals commercial assay lab.
Other data reviewed from 2012 drilling included drill hole collar locations, downhole surveys, and geologic identification of lithology. Data sets derived prior to 2012 were in an excellent state of coherency and standardization as of March 2011, as verified by author Michele White – previous Data Manager for the Jerritt Canyon database. Paper drill hole log files, copies of assay certification, and other integral drill hole data information are also in a state of excellent condition for use in the new resource and reserve estimate. The geology logs for the surface drill holes compare well with one another in the local areas suggesting that the stratigraphy of the rock units was well understood by project geologists working at the property. Additional comments regarding the condition of the Jerritt Canyon drill hole data are discussed in Section 12 of this report titled “Data Verification.”
Previous review of technical studies evaluating geophysical, airborne magnetic data, ground gravity, and ground I.P.-Resistivity and soil geochem surveys identified specific important dike sets, clay alteration, silicification and main structures that cross the property. These summaries have been previously cited in Odell, et al., 2012. The most recent geophysical work done in 2011 was completed at Starvation Canyon including the West Starvation target that included a Titan 24 Magnetotellurics (MT) and Induced Polarization/Resistivity (DCIP) ground geophysical survey by Quantec Geoscience.
Exploration expenditures by VUSA in recent years are listed below:
- 2007: $7.23 million;
- 2008: $6.48 million;
- 2009: $0;
- 2010: $1.0 million;
- 2011: $11.4 million, and
- 2012: $7.2 million
Exploration and resource conversion drilling in 2012 focused near the underground mining operations at Smith Mine in Zones 4 and 5 and at SSX-Steer at Zone 1 (West Mahala). Exploration and development surface and underground drilling conducted in 2012 targeted either:
| (1) | locating new areas of resources and reserves away from existing underground development; or |
| (2) | mostly converting existing resources to reserve (near-mine). |
| Veris Gold Corp. | |
| NI 43-101 Technical Report Jerritt Canyon Property, Nevada | 9-3 |
The proposed 2013 Jerritt Canyon geological program totals $12.1 million dollars and is separated into four phases:
- underground resource conversion and exploration drilling at SSX-Steer;
- surface exploration at Mahala, ND and California Mountain;
- surface drilling at Burns Basin, Saval, and Pattani;
- surface drilling at Starvation Canyon, and surface drilling at Pie Creek and Warm Creek in the southern part of the district.
A summary of the recommended drilling program for 2013 is included in Section 26.2.
Some of the future exploration programs at Jerritt Canyon will be devoted to drilling in or around the historic open pits listed in Table 6.2.1. While the open pit resources at Saval, Burns Basin, and Upper West Generator were drilled in 2011 and remodelled using present day gold prices, some of the larger open pits such as Alchem, Marlboro Canyon, and North Generator Hill have only been partially modelled using historical drilling and require additional work to verify and update. Some of these older pit areas were previously modelled and mined at a much lower price per ounce is prevalent today.
| Veris Gold Corp. | |
| NI 43-101 Technical Report Jerritt Canyon Property, Nevada | 10-1 |
10 Drilling and sampling methodology
Numerous drilling campaigns have been executed at Jerritt Canyon since its discovery in the 1970’s. During the early drilling years in the 1970’s and 1980’s when shallow open-pit targets were being pursued, most of the surface drill holes were drilled to a maximum depth of 600 feet below the surface. As a result, the district-wide surface drilling is extensive but only for shallow examination. The potential for deeper targets is yet to be investigated.
In the underground mines from 2011 up to December 31, 2012, definition drilling included core drilling on 50-foot centers from underground stations, using HQ-sized (2.5 inches in diameter) and NQ-sized (1.875 inches in diameter) core. In 2010, underground diamond drilling was used for exploration and resource conversion.
Underground RC drilling (Cubex) is used for resource confirmation and is generally drilled on 20 to 40 foot centers. Underground RC drill holes are generally less than 150 feet in length, but can be as long as 300 feet. Up to August 2008, underground production sample drilling consisted of Cubex and rotary percussion drilling (Solo and Secoma). In 2010 to 2012, a 5,200 DRC Cubex (RC) drill, owned and operated by SMD, was used primarily for underground production sample drilling at the Smith Mine. These production drill holes were generally short, less than 60 feet, and were drilled on close centers of 10 to 20 feet. The majority of drill holes, other than the production holes, have been measured for downhole deviation. A used Cubex drill rig was purchased in 2011 by VUSA to conduct underground production drilling at SSX-Steer.
Tens of thousands of holes have been drilled on the property over the years. As of January 18, 2012, there are a total of 15,058 surface drill holes totaling 8,591,992 feet and 38,031 underground drill holes totaling 3,292,276 feet in the acQuire digital drill hole databases. The Murray mine has over 22,000 holes with more than 2 million feet drilled; the Smith mine has over 7,500 underground drill holes with more than 1.61 million feet; and the SSX mine has nearly 21,700 underground drill holes with 2.75 million feet of drilling. Figures 10.2.1 to 10.2.12 show the drill hole plan maps for all of the models used to determine the updated December 31, 2012 resources and reserves in this report. The additional updated 2011 and/or 2012 drill holes used in this report are symbolized with round red dots for collars. All of the drill hole collar map figures were made by Karl Swanson using Vulcan software and are plan maps with grid north oriented straight up.
Drilling at Jerritt Canyon for the last thirteen years up to Year-End 2012 is shown in Table 10.1. Drilling in 2000 through 2002 for AngloGold and Meridian was conducted either by contract drilling companies or with underground drill rigs owned by AngloGold and Meridian Gold. Since Queenstake purchased the project in 2003 drilling continued to be performed using underground drill rigs owned by the Company or contract drilling companies. The name of the drilling company is listed on each drill hole log stored either in the acQuire digital drill hole database or listed on the paper drill hole log files stored at the mine.
The authors of this report find the drill hole data in the acQuire drill hole database suitable for use for the current resource and reserve work. Additional details of the quality of the drill hole data are discussed in Section 12 of this report.
In 2012, VUSA completed 2,577 feet (2 drill holes) of surface reverse circulation (2 RC drill holes totalling 1,600 ft. and 2 diamond drill holes totalling 977 ft.) from several projects throughout the property; 23,942 feet (7,299.3m) of underground diamond drilling (30 drill holes at the Smith Mine totalling 29,333 ft. and 3 drill holes totalling 2,473 ft from SSX/Steer); 90,115 feet (27,474m) of Cubex production drilling (826 drill holes) and 8,805 feet (2,684m) from the Smith and SSX-Steer underground mines. Drilling in 2012 focused on those areas proximal to existing underground developments above the groundwater table (in Zones 4 and 5 at Smith Mine and Zone 1 at SSX/Steer Mine) to convert inferred resources to measured and indicated resources, better define existing reserves, and expand reserves.
| Veris Gold Corp. | |
| NI 43-101 Technical Report Jerritt Canyon Property, Nevada | 10-2 |
Drilling in 2008 was conducted both underground at the SSX and Smith Mines and throughout the property on the surface. No underground drilling was conducted in 2009. No surface drilling was conducted on the surface in 2009 or 2010; however underground drilling was conducted at the Smith Mine in 2010. All of the recent surface and underground drilling methodologies used in 2010-2012 are similar and are described in previous technical reports and summarized below.
Table 10.1: Jerritt Canyon drilling (2000 through year end 2012).
| Year | Surface RC | Surface Core | UG Core | UG RC | Production |
| | No. | Footage | No. | Footage | No. | Footage | No. | Footage | No. | Footage |
| 2000 | 378 | 444,795 | 2 | * | 292 | 75,799 | ** | ** | 4,982 | 204,182 |
| 2001 | 59 | 65,450 | 0 | 0 | 268 | 86,134 | 914 | 112,129 | 5,086 | 349,157 |
| 2002 | 27 | 18,905 | 0 | 0 | 186 | 53,940 | 2,939 | 245,536 | 3,593 | 135,824 |
| 2003 | 108 | 47,277 | 0 | 0 | 119 | 41,458 | 2,057 | 191,416 | 3,643 | 141,218 |
| 2004 | 377 | 300,226 | 34 | 21,212 | 297 | 126,091 | 2,643 | 263,367 | 2,739 | 108,780 |
| 2005 | 126 | 101,413 | 4 | 1,403 | 179 | 80,251 | 2,618 | 267,627 | 2,414 | 94,793 |
| 2006 | 155 | 135,940 | 0 | 0 | 125 | 53,985 | 2,160 | 206,138 | 724 | 28,251 |
| 2007 | 220 | 216,592 | 15 | 12,495 | 44 | 20,580 | 1,808 | 178,625 | 1,035 | 38,950 |
| 2008 | 100 | 103,300 | 8 | 9,830 | 94 | 41,521 | 230 | 371,169 | 595 | 45,430 |
| 2009 | - | - | - | - | - | - | - | - | - | - |
| 2010 | 0 | 0 | 0 | 0 | 8 | 8,126 | 3 | 630 | 1,140 | 70,935 |
| 2011 | 208 | 120,130 | 12 | 14,147 | 37 | 23,492 | - | - | 809 | 93,753 |
| 2012 | 2 | 1,600 | 2 | 977 | 33 | 31,806 | 59 | 8,805 | 826 | 90,115 |
- *2000 surface core footage is included with surface RC;
- **2000 and underground RC drilling is included with production drilling;
- No drilling was conducted in 2009;
- VUSA and its predecessor company (Queenstake) has owned the Jerritt Canyon property since mid-2003;
- Contract drilling companies have completed almost all of the surface drill holes in Table 10.1;
- Both Contract drill companies and company-owned drill rigs have completed the underground drilling from 2000 to 2008, and in 2011 and 2012; a single contract drilling company conducted the underground drilling in 2010, 2011, and 2012.
| Veris Gold Corp. | |
| NI 43-101 Technical Report Jerritt Canyon Property, Nevada | 10-3 |
10.1 Surface drilling
Reverse circulation (RC) drilling:
The 2011 reverse circulation (RC) drilling was conducted by three separate contract companies (Rimrock, National EWP, and WDC). Down-hole surveys were taken by a contractor (IDS) using a gyroscopic instrument. Drill hole collar locations were surveyed by in-house surveyors. The vast majority of the 2011 drilling targeted conversion of both underground (ug) and open-pit (op) resources in the following areas: Mahala (ug), East Mahala/East Dash (ug), West Mahala (ug), Starvation Canyon (ug), Burns Basin (op), Saval (op), West Generator (op), and Pie Creek (op).
The 2011 surface RC holes ranged from 4 5/8 inches to 5 ½ inches in diameter (dependent upon bit type – hammer vs. tri-cone). Sample collection was conducted on 5 foot intervals, according to the following protocol established by VUSA.
RC drilling operations collected samples in 10 x 17 inch polypropylene bags throughout the entire length of each drill hole.
The wet splitter was thoroughly cleaned prior to drilling at the start of the drill shift. The rotation speed of the splitter was set to collect a continuous split from the bulk sample that is dropped out of the cyclone. The recommended rotation speed was 60 rpm but may have varied due to drilling conditions. The splitter was sprayed clean after each rod change or 5-foot sample interval depending on drilling conditions and thoroughly cleaned and checked during the rod change. The number of “pie covers” used for the upper part of the hole varied significantly due to drilling conditions and was usually determined by the driller and on-site geologist. If more than one pie was open for sample collection, all openings must be symmetrical. Two symmetrical pie division openings are usually sufficient to collect an appropriate volume of material (10 pounds to 15 pounds). Exceptions are: 1) zones of poor return, 2) extreme groundwater production that requires the use of a tri-cone bit, and 3) unique conditions agreed to by the driller and geologist. In these cases a variable number of openings was needed to obtain a continuous split.
Samples were collected in a labeled bag that was placed inside the bucket. Diluted liquid flocculent was added prior to placing the bucket under the splitter. After the interval was drilled the sample was stirred and allowed to set for a brief period to allow clearing of the water, usually 15 seconds to 30 seconds. Excessive clear water was then decanted off.
RC drill chips were collected in a hand sieve from the waste port of the splitter and then put into the sample tray to represent each five-foot interval and sent to the logging facility for the geologist to log formation, alteration, and other minerals. Intervals of no sample return were marked on the tray with “No Sample” or “Void”.
A drill interval that does not return any sample was marked on the sample bag as “No Sample” and placed in the appropriate shipping bag along with the other samples.
VUSA representatives transported the RC samples, on a nearly daily basis, from the drill site to the lay-down area immediately adjacent to the surface core logging facility. Approximately 150-200 samples per day (on average) were handled at the lay-down area and prepared for shipment to the commercial lab. Sample shipments occurred twice a week. American Laboratory Services (ALS) provided transport of samples (RC & Core) to their Elko, NV sample preparation facility. During non-operational business hours the security of samples at the lay-down area was maintained by Jerritt Canyon Mine Security Department.
| Veris Gold Corp. | |
| NI 43-101 Technical Report Jerritt Canyon Property, Nevada | 10-4 |
Diamond drilling:
2011 surface diamond drilling and geotechnical drilling was conducted by American Drilling, Inc. at the Starvation Canyon deposit using HQ diameter (2.5 inches) core. Two contract companies (IDS & COLOG) were utilized to conduct down-hole gyroscopic and tele-viewer surveys, respectively, to enable 3 dimensional orientation of the core. Representatives of Golder & Associates engineering firm conducted core orientation, collection of geotechnical data and photographing the drill core as specified by VUSA. VUSA representatives conducted geologic logging and subsequent sampling of the core. Sampling was conducted by halving the core using a diamond bladed masonry saw. Surface diamond drilling, for resource conversion, was conducted at West Mahala, Mahala, and East Mahala/East Dash. Pre-collared holes were drilled by reverse circulation to a depth of 800 feet and casing was installed. HQ core was drilled from the bottoms of the RC pre-collars to pre-planned total depths. VUSA representatives collected the core from the respective drill sites and delivered it to the Jerritt Canyon core shed. The core was photographed then logged for lithological information and for geotechnical data according to the Jerritt Canyon logging manual at the logging facility. Surface core was cut or split with a diamond saw or hydraulic splitter and half of the core was sent to the lab for analysis while the remaining half core was re-boxed and secured in containers under lock and key. Transport of samples and security during non-operational business hours is as described in Section 11.
10.2 Underground drilling
In 2011 and 2012, underground drilling consisted of Cubex RC drilling for the purpose of ore definition / delineation. Diamond drilling was conducted for the primary purpose of resource conversion with a limited amount of exploration drilling.
Cubex RC drilling:
One Cubex RC drill was used underground in 2011 and 2012 at the Smith Mine and was owned and operated by Small Mine Development LLC (SMD). The Cubex drill performed almost all definition drilling and only 630 feet of resource conversion drilling by utilizing a conventional crossover tube above the down-hole hammer with a 3.94 -inch (100 mm) bit. The air cuttings were run through a cyclone but no splitter was used. Drill hole spacing was targeted at 30 to 50 foot centers throughout the deposit and typically drilled in a ring pattern. The attitude of the drill hole can be at any inclination to the mineralized unit although it was preferred to be as close to normal to the ore-controlling structure as possible.
Drill hole length was generally less than 100 feet but occasionally ranged up to 235 feet. The sample interval was 5 feet. Tyvek 11 x 17 inch sample bags were used for the 2010 Cubex drilling. The sample bag was placed in an open-ended sample bag holding apparatus (not a bucket). Drill station ring locations begin at least 5 feet back from the face and were evenly spaced generally every 15 to 30 feet down the heading, and were surveyed and marked in the drift prior to drilling. A Leica Total Robotic Station, owned and operated by SMD, was used as the main underground survey tool.
The driller measured and recorded the location of the drill hole collar after drilling of the drill hole. Collars were not resurveyed after the drill hole is completed. No down-hole survey was performed on the 2011 Cubex drill holes. The azimuth for each underground Cubex drill hole comes from the original drill station ring survey. The inclination was measured by the driller during setup using a magnetic angle finder that he attached to the drill rods.
A limited amount of Cubex drilling was conducted at the VUSA operated SSX-Steer mine in 2011. Drilling, sampling, and survey operations were coincident with that described above for the Smith mine.
| Veris Gold Corp. | |
| NI 43-101 Technical Report Jerritt Canyon Property, Nevada | 10-5 |
Diamond drilling:
Diamond drilling in 2011 and 2012 was conducted by American Drilling Corp. utilizing a Diamec U8 hydraulic-electric drill and drilled HQ diameter core. The underground core rig was used to drill exploration and resource conversion drill holes. All of the drill holes were surveyed at the collar by SMD after the completion of the drill hole. Magnetic declination used at Smith mine in 2011 was 13° 45’E. Downhole surveys were conducted using a downhole survey instrument (Flexit) either owned by Queenstake or rented by American Drilling Corp.
The diamond drill core was placed in labeled cardboard boxes and transported by the drill contractor to the Jerritt Canyon surface core logging facility. Once the diamond drill core arrived at the core logging facility, the core was stored in this locked facility or supervised by a geotechnician or a geologist during normal operating business hours during the core logging and sampling process. The core was placed on tables in the core logging facility and sample intervals were selected by the geologist at 5 foot intervals or as determined by the geologist based on lithology, mineralogy, or alteration. Photographs were taken of the core for archive purposes. The geologist then logged the geology of the drill hole on paper using a predefined logging scheme specific to the project that includes geology, alteration, mineralization, and geotechnical data if core is being examined.
Once geologically logged, the drill core was sawed into two equal pieces where the rock was competent or equally split where the rock was strongly fractured or broken. One half of the core was typically sent out for analysis at ALS Laboratory and the other half was returned to the core box and stored at the mine typically in a locked truck container for archival purposes. In general, sample lengths were set at a minimum of 6 inches to a maximum of 5 feet. An experienced Jerritt Canyon geologist monitored the progress of the diamond drill by occasionally visiting the underground work site. The 2011 and 2012 sampling procedures, collection, and security for the underground diamond drilling at the Smith mine have been completed under the direction of the Jerritt Canyon Chief Geologist.
| Veris Gold Corp. | |
| NI 43-101 Technical Report Jerritt Canyon Property, Nevada | 10-6 |
Figure 10.2.1: Burns Basin drill hole plan map.
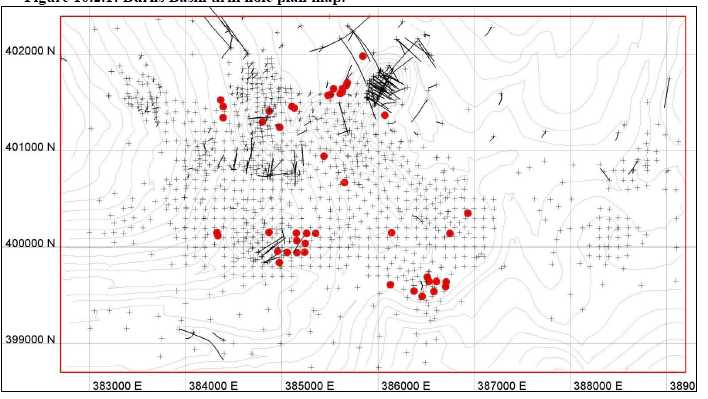
| Veris Gold Corp. | |
| NI 43-101 Technical Report Jerritt Canyon Property, Nevada | 10-7 |
Figure 10.2.2: Mill Creek drill hole plan map (no new drilling).
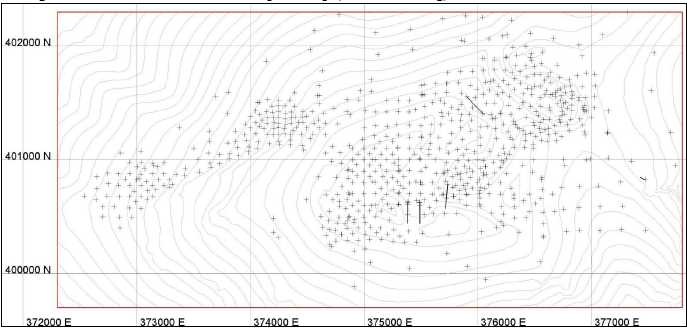
| Veris Gold Corp. | |
| NI 43-101 Technical Report Jerritt Canyon Property, Nevada | 10-8 |
Figure 10.2.3: Pie Creek drill hole plan map.
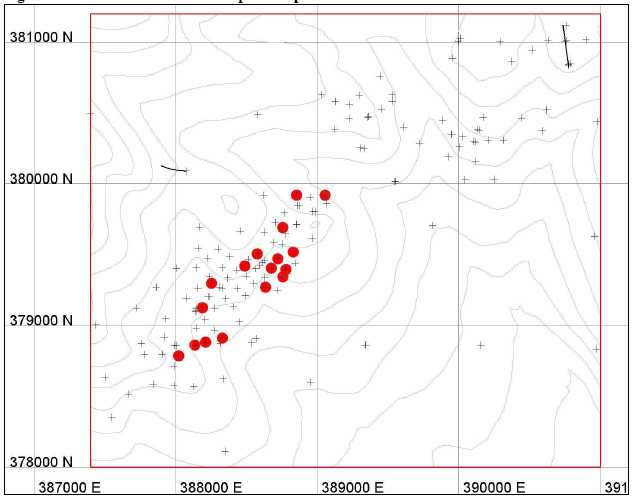
| Veris Gold Corp. | |
| NI 43-101 Technical Report Jerritt Canyon Property, Nevada | 10-9 |
Figure 10.2.4: Road Canyon drill hole plan map (no new drilling).
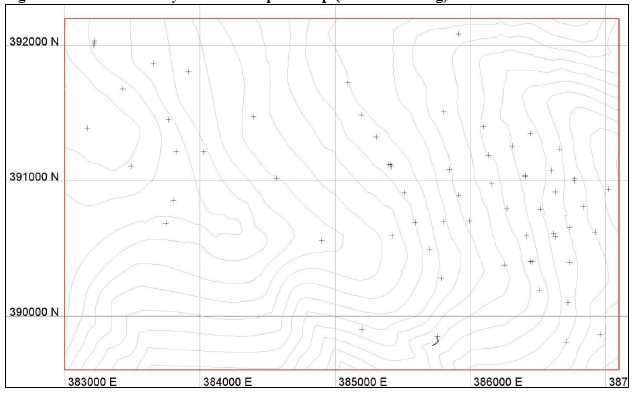
| Veris Gold Corp. | |
| NI 43-101 Technical Report Jerritt Canyon Property, Nevada | 10-10 |
Figure 10.2.5: Saval open pit drill hole plan map.
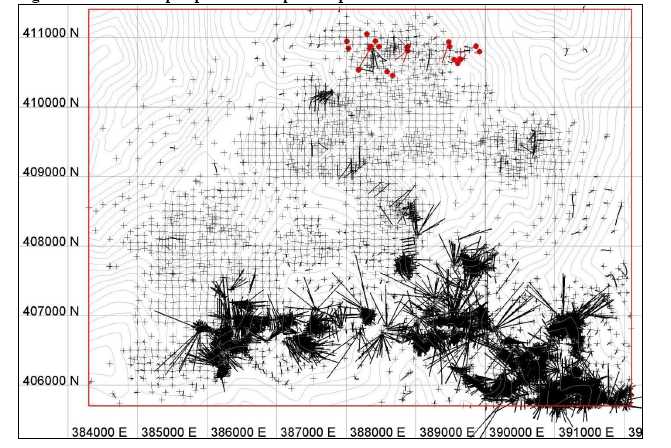
| Veris Gold Corp. | |
| NI 43-101 Technical Report Jerritt Canyon Property, Nevada | 10-11 |
Figure 10.2.6: Wright Window drill hole plan map (no new drilling).
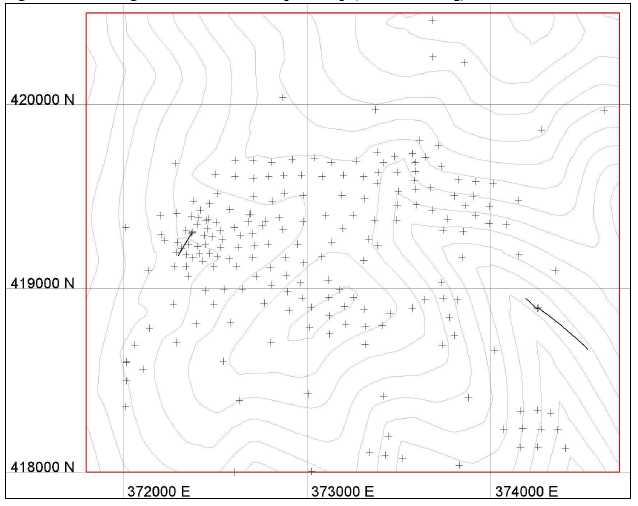
| Veris Gold Corp. | |
| NI 43-101 Technical Report Jerritt Canyon Property, Nevada | 10-12 |
Figure 10.2.7: California Mountain drill hole plan map (no new drilling).

| Veris Gold Corp. | |
| NI 43-101 Technical Report Jerritt Canyon Property, Nevada | 10-13 |
Figure 10.2.8: Murray drill hole plan map (no new drilling).
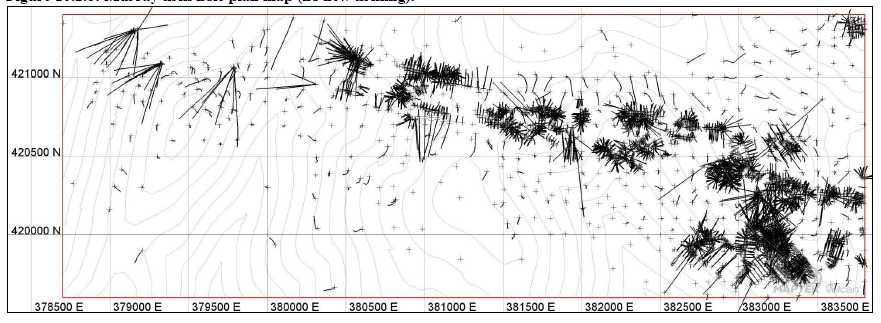
| Veris Gold Corp. | |
| NI 43-101 Technical Report Jerritt Canyon Property, Nevada | 10-14 |
Figure 10.2.9: Smith drill hole plan map.
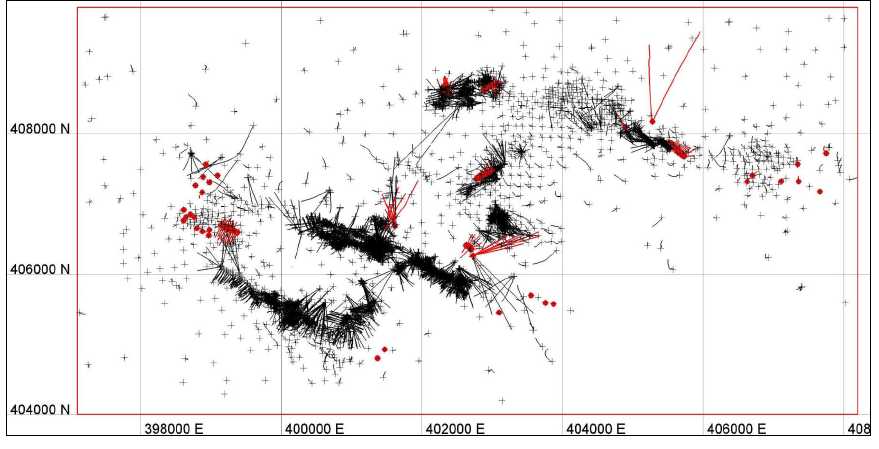
| Veris Gold Corp. | |
| NI 43-101 Technical Report Jerritt Canyon Property, Nevada | 10-15 |
Figure 10.2.10: SSX drill hole plan map.
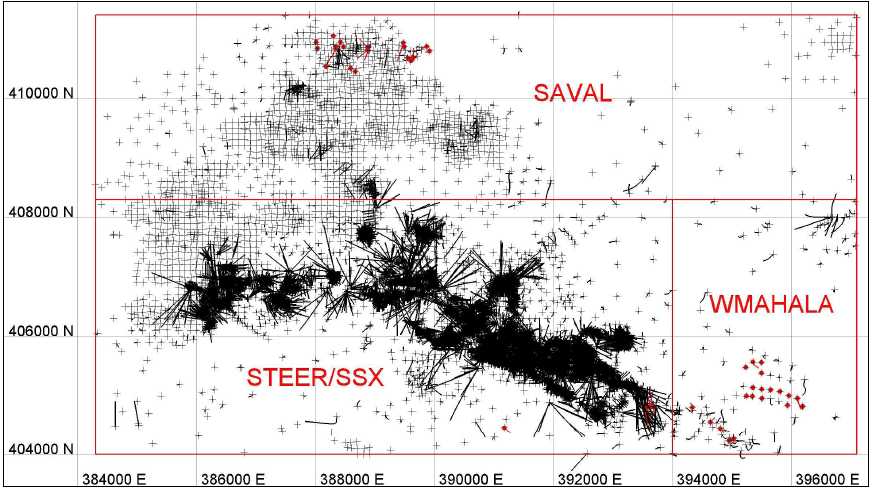
| Veris Gold Corp. | |
| NI 43-101 Technical Report Jerritt Canyon Property, Nevada | 10-16 |
Figure 10.2.11: Starvation drill hole plan map.
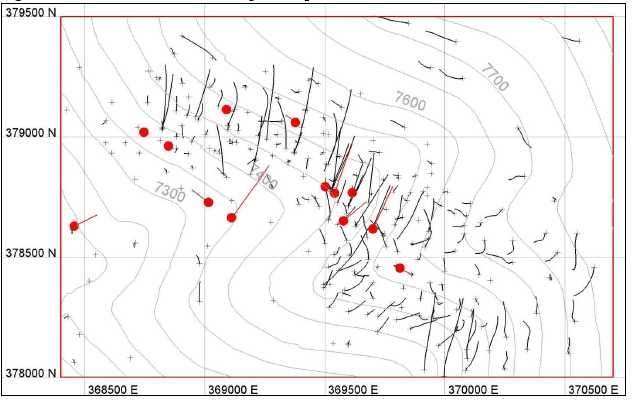
| Veris Gold Corp. | |
| NI 43-101 Technical Report Jerritt Canyon Property, Nevada | 10-17 |
Figure 10.2.12: Winters Creek drill hole plan map (no new drilling).
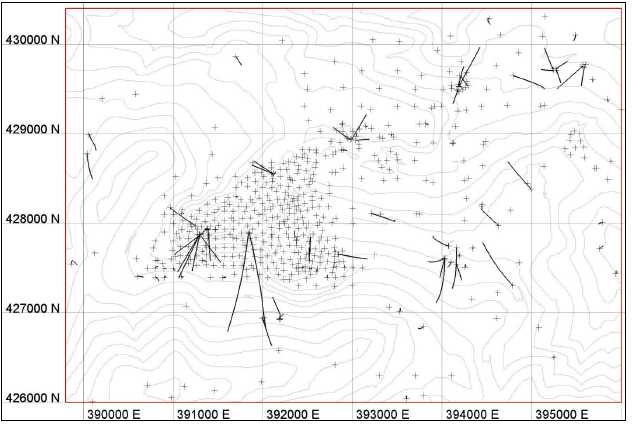
The company’s protocols and procedures for surface and underground drilling, geological drill hole logging, sampling, assaying by the Jerritt Canyon assay lab and other commercial labs, quality assurance and quality control, and digital drill hole data have been reviewed by the primary author, are presented in this report, and have been determined to meet industry standards. All of the aforementioned protocols and procedures are presented in Section 10 and are deemed adequate by the primary author, Todd Johnson (QP), and the contributing authors, Mark Odell (QP), and Michele White (C.P.G.) for use to support the resource and reserve estimates presented in this Technical Report.
| Veris Gold Corp. | |
| NI 43-101 Technical Report Jerritt Canyon Property, Nevada | 10-18 |
10.3 Core and chips recovery
Details as to drilling and sampling methodology were itemized in the previous report (Odell, 2012).
10.4 Security procedures: core and pulps
Core is stored in locked cargo sea cans on site. The RC chips and pulps are stored on site at Jerritt Canyon inside the gated compound inside locked cargo sea cans designated for their storage.
10.5 Logging drilled core and chips observations
Details as to drilling and sampling methodology were itemized in the previous report (Odell, 2012).
10.6 Sampling methodology: core and pulps
Details as to drilling and sampling methodology were itemized in the previous report (Odell, 2012).
| Veris Gold Corp. | |
| NI 43-101 Technical Report Jerritt Canyon Property, Nevada | 11-1 |
11 Sample preparation, analyses, security, and QAQC.
Drill hole samples in 2008, and from 2010 to 2012 were analyzed at both the Jerritt Canyon assay lab and two commercial laboratories: ALS and American Assay Laboratory (AAL). The discussion below details the procedures and protocols used to collect and store the data for the Jerritt Canyon property. The Quality Assurance and Quality Control (QAQC) programs are also detailed below.
11.1 Jerritt Canyon laboratory sampling procedures
11.1.1 Sample preparation
Historical sample preparation methodologies, including details as to fire assay methods for the Jerritt lab ALS lab, and AAL lab were itemized in the previous report (Odell et al., April 2012) and were similar for 2012.
All of the underground samples received at the JC lab in 2008-2012 arrived with bar-coded labels and were transported to the front laydown area in front of the garage door by the drillers, Queenstake staff geologists, drilling support staff, or mine staff working with the contract miner SMD. The labels on the bags correlate to sample logs maintained by samplers and drillers in the Jerritt Canyon Underground Department. Sample bar-codes in 2008 were scanned into the LIMS (an automated sample tracking system that utilizes bar-code scanning devices). As a result of this event, assay lots were auto-created in a database. During the process of bar-code acquisition, in 2009 and the first half of 2010, some labels were manually entered into the database by hand because the LIMS system software was not fully operational. The surface drill hole sample numbers arrived at the lab with labels on the sample bags and then those sample numbers were hand-logged into the LIMS system by the lab technicians. All logged samples in 2008 and 2009 dried for four to six hours at 325°F prior to further preparation for sampling procedures. All logged samples in 2010-2012 were dried for four to eighteen hours at 205°F in ovens at the lab prior to any further sample preparation described below.
From 2008 - 2012, a rotary (automatic) 1:4 split (50 rotary cuts minimum) followed the first stage of crushing. Core samples were first-stage crushed 99% to1-inch prior to the split; all other types are typically crushed to 1/2 inch prior to the first-stage split. Second stage crushing (99% to 3/8 inch) automatically passes through a rotary splitter (50 cut minimum). The assay split from 2008 – 2011 was pulverized in a plate mill to 95%-150 mesh (Tyler) and blended for five minutes on a rotary blending wheel. In 2012 the pulverizing was completed using ring & puck mills to 95% passing -150 mesh. The processed samples are placed in bar-coded sample cups and transferred to fire assay.
11.1.2 Sampling analysis protocol
Historic sampling analysis methodology was discussed in detail in the previous report (Odell, April 2012) and summarized below. The current Jerritt laboratory prepares their samples according to this protocol:
| | 1. | Contracted drillers from Small Mine Development (SMD), puts Cubex-drilled samples into pre- labeled, bar-coded bags, which are ordered ahead of time for specific numeric values. |
| | 2. | SMD drillers write the sample numbers on a cut-sheet to correspond to 5 foot intervals per each drill hole. |
| | 3. | SMD delivers the samples and cut sheet to the Jerritt lab. |
| | 4. | The Jerritt lab has sample numbers previously entered into LIMS by a staff Production Clerk. |
| | 5. | Lab technicians use a bar-code scanner to begin tracking the samples as they enter the laboratory system. |
| Veris Gold Corp. | |
| NI 43-101 Technical Report Jerritt Canyon Property, Nevada | 11-2 |
| | 6. | The samples go through a circuit of different evaluations, such as drying, crushing, splitting, pulverizing, blending, and weighing leading up to Fire Assay methodology of testing for gold. |
| | 7. | A tray of 24 thirty-gram charge crucibles is prepared with a standard litharge flux. Each sample is weighed at one assay ton. The samples in 2008-2012 were fired by the method of fusion/cupellation with a gravimetric finish. The balance used for the final weighing from 2008- 2012 is a Cahn C-30 microbalance that was serviced and calibrated on a semi-annual basis by Microlab Services. During 2012 the JC lab introduced the multi-pour system and the instrument finish for gold determination to increase accuracy and production rate. |
| | 8. | QAQC samples, such as duplicates, blanks, and 4 types of standards (JCQ06, JCQ07, Si52, and SK54) are inserted into the sampling sequence utilizing unique sample numbers based on the previous sample. For example, sample number SC 0022767 might be followed by a blank labeled SC 022767B, and sample SC 0022775 might be followed by a duplicate SC 00775D, and sample SC 0022787 might be followed by the JCQ06 standard labeled SC 022787A and so on. |
| | 9. | The detection values of the samples by the atomic absorption spectrophotometer are automatically uploaded into the LIMS system. |
| | 10. | Au values derived from Fire Assay gravimetric finish are also uploaded into the LIMS system. |
| | 11. | A Production Clerk verifies all the data uploaded into LIMS for consistency and errors, such as sample number verification. The same clerk also supervises data being exported from LIMS for upload to acQuire and to SMD. |
| | 12. | The lab manager regularly checks the results of assaying standards for consistency and isolates samples that are outside the acceptable limit. The lab manager will re-submit control samples to test the validity of the quality assurance system in place. |
| | 13. | LIMS exports Au- fire assay values as opt in CSV format files. One set of these files is made available to SMD for their daily mine plan. The other set is copied to the main server for the Veris staff Data Manager to upload into acQuire. |
Authors accept this protocol as acceptable methodology demonstrating VUSA’s staff’s knowledgeable handling of sampling and quality assurance checks.
Core is sent to an outside commercial certified assay lab for analysis which is discussed further below.
11.1.3 Sample security measures
The pulps processed through the Jerritt lab are stored on skids at the lab within the secure compound of the mine. Processed pulps are then stored in locked cargo sea cans on the property within the compound.
11.2 Commercial laboratory sample preparation, analysis protocol, and security
Samples derived from diamond drilling of core are sent to the primary lab ALS Minerals Laboratory Group (also referred to as ALS Chemex or ALS in this document) and the secondary lab American Assay Laboratories (AAL) in Reno and Sparks, respectively, Nevada. Detailed description of those labs’ sampling preparation, sampling analysis protocol, and security was itemized in the previous report, (Odell, April 2012) and are summarized below.
RC and diamond drilling completed in 2008 were sent to the primary lab ALS Minerals Laboratory Group (also referred to as ALS Chemex or ALS in this document) and the secondary lab American Assay Laboratories (AAL) in Reno and Sparks, respectively, Nevada. For 2008 and 2009, samples above 0.100 opt gold were routinely fire assayed with a gravimetric finish. For 2010, the ALS Chemex lab in Reno, Nevada was used for all of the underground diamond drill hole analyses. Samples above 0.070 opt Au were routinely fire assayed with a gravimetric finish. For all years 2008-2012, blanks, standards, and pulps were routinely inserted into the sample stream for QA/QC, and check assay.
| Veris Gold Corp. | |
| NI 43-101 Technical Report Jerritt Canyon Property, Nevada | 11-3 |
ALS Chemex typically picked up the cut samples (bagged and labeled with bar codes) at the Jerritt Canyon core logging facility and brought them to their lab in Elko for sample preparation. The 2010-2012 sample preparation procedures for ALS Chemex include:
the PREP-31 ALS method code that consists of cataloging the sample number, weighing the sample, fine crushing the sample to better than 70 percent passing a 2mm (Tyler 9 mesh, US Std. No 10) screen, splitting off up to 250 g and pulverizing the split to better than 85% passing a 75 micron (Tyler 200 mesh, US std. No. 200) screen;
Dry-21 ALS method code; and
CRU-21 ALS method code that consists of a primary crush to approximately -6mm.
Once the samples were prepared by Jerritt Canyon geologists (geologically logged and sample intervals defined) and geotechnical staff (split or sawed core into two equal pieces and placing one half of the core into a labeled and sealed sample bags for assay analysis), they were picked up at the Jerritt Canyon mine site by ALS representatives who transported the samples to their sample preparation lab in Elko, Nevada and eventually to their assay lab in Reno, Nevada for analysis. The 2010-2012 assay procedures for ALS Chemex included:
The Au-AA23 ALS method code that consists of a 30g fire assay for gold that uses an aqua regia digest and analysis by atomic absorption spectroscopy (AAS) finish. A prepared sample is fused with a mixture of lead oxide, sodium carbonate, borax, silica, and other reagents as required, with 6 mg of gold-free silver and cupelled to yield a precious metal bead. The bead is digested in 0.5 mL dilute nitric acid in the microwave oven; 0.5 mL concentrated hydrochloric acid is then added and the bead is further digested in the microwave at a lower power setting. The digested solution is cooled, diluted to a total volume of 4 mL with de-mineralized water, and analyzed by atomic absorption spectroscopy against matrix-matched standards. The assay range for this analysis is from 0.005 to 10 ppm; all results >1 ppm were automatically re-analyzed by method Au-GRA21;
The Au-GRA21 ALS method code that consists of a 30g Au fire assay with a gravimetric finish. The sample is fused with a mixture of lead oxide, sodium carbonate, borax, silica, and other reagents in order to produce a lead button; the lead button containing the precious metals is cupelled to remove the lead; the remaining gold (and silver) bead is parted in dilute nitric acid, annealed and weighed as gold. The assay range for this analysis is from 0.05 to 1,000 ppm Au. This assay method is used automatically for over-limit results from the Au-AA23 assay method.
American Assay Lab (AAL) uses similar sample preparation and assay analysis procedures as ALS Chemex. American Assay Laboratory is an ISO noncertified lab and has a sample preparation facility in Elko, Nevada and an assay laboratory in Sparks, Nevada.
Diamond-drilled core was transported from the underground drill stations to the Jerritt Canyon core logging facility by the contract drillers and/or Queenstake geological staff and the diamond-drilled core was stored and logged in a secure (lockable) facility until it was processed for shipment to an assay lab.
11.3 Quality control measures
11.3.1 Current Jerritt Canyon and commercial laboratory QAQC procedures
Sample quality control measures prior to 2011 were discussed in the previous report, (Odell, April 2012). 2012 and current laboratory QAQC procedures are as follows: Jerritt Canyon Laboratory:
| • | One standard sample per 24 samples; |
| • | One blank sample, consisting of silica sand, per 24 samples; |
| • | One triplicate sample per 24 samples; |
| Veris Gold Corp. | |
| NI 43-101 Technical Report Jerritt Canyon Property, Nevada | 11-4 |
| • | Check assays of approximately 1% of the total sample population. |
Commercial Laboratory:
A 2-tiered QAQC protocol for samples sent to commercial labs is summarized below:
Tier 1: initial submittal
| • | A blank sample consisting of silica sand inserted as the second sample for each drill hole; and |
| • | One standard is inserted into the assay sample stream every 20th sample. |
Tier 2: quarterly checks
• On a quarterly basis, part of an original sample (pulp reject, or standard) is re-submitted to the same lab (i.e., if it was assayed at ALS Chemex lab, then it is re-submitted to ALS Chemex) - re-labeled with new sample identification numbers.
• Cross-checks of the same sample are submitted to different labs (i.e., if assayed at ALS lab, then part of the original pulp reject is also submitted to AAL lab.)
All samples submitted to be initially analyzed via Fire Assay with an AA finish. Samples with initial assay result > 0.070 opt Au are re-analyzed via Fire Assay with a Gravimetric Finish. In this instance the database recognizes the result attained from Fire Assay with a Gravimetric Finish as the “best assay.” For the underground drill core, approximately 15% of the original samples assaying > 0.070 opt and 5% of original samples assaying 0.010 -0.069 opt are randomly selected from the total sample population. For the surface drilling (RC & Core) the same percentiles of original samples are randomly selected but from 30% of the total sample population. Blanks and standards (as per Tier 1) are submitted with the pulp rejects.
Standards submitted with each dispatch in 2011 and 2012 to both the Jerritt lab and to the commercial labs are listed below with their sources.
| • | JCQ06 – 0.159opt (Jerritt Canyon Mineralized rock source); |
| • | JCQ07 – 0.241opt (Jerritt Canyon Mineralized rock source); |
| • | Si54 – 0.0519opt (Rocklabs certified standard); and |
| • | SK52 – 0.1198opt (Rocklabs certified standard). |
The Jerritt Canyon sourced standards JCQ06 and JCQ07 consist of low-sulfide bearing carbonaceous limestone material that were collected from the Jerritt Canyon ore-dryer baghouse in early spring 2010 and approximate the size fraction of a pulp generated from a certified commercial lab. A large amount of each sample was submitted to American Assay Laboratory (AAL) Lab in Sparks, Nevada where they used a large blending machine to help homogenize the standards. After homogenization was attained, the standards were submitted to 3 different assay laboratories as random “blind” pulp samples with labeled identification numbers. The assay results of the standards from all of the labs were reviewed together. The recommended ideal Au values were calculated and based on the mean value. The upper and lower acceptable limits for each standard were calculated based on adding and subtracting two standard deviations to the mean value from all three labs.
The RockLab standards were analyzed by over 40 different assay labs around the world, have a 95% confidence level, and lower standard deviations and therefore lower acceptable limits for passing the Jerritt Canyon QA/QC protocol.
In order for an assay batch to pass the QA/QC review, > 90% of the standard assay results must be within two standard deviations (accuracy) of the recommended standard value listed above. Various graphs and a discussion of the results for the 2012 QA/QC program are below.
Results from the standards or duplicates are reviewed by geologists upon receipt from the laboratory. If there is significant deviation from the expected value then the batch of samples is re-fired. If the lab is unable to match the original results within reasonable limits then the sample is re-fired until assay values match or a valid reason for the standard assay discrepancy is determined (e.g. a mislabeled standard or a standard that was inserted out of sequence).
| Veris Gold Corp. | |
| NI 43-101 Technical Report Jerritt Canyon Property, Nevada | 11-5 |
Unfortunately, VUSA was unable to conduct a quarterly reassay of randomly selected pulp samples for QAQC for Quarter 4 of 2012 due to staffing shortfalls. However, analysis of the performance of the blanks, re-assays, and the four standards, combined with past positive quarterly re-assay results, provided examples of acceptable QAQC protocols to this author.
In January, 2013, this author conducted an audit of randomly selected surface QAQC sample results from ALS lab covering a period from July 2011 to August 2012. The protocol for surface and underground core sampling QAQC is to submit blanks and 4 standards into the sample dispatch as ordinary samples.
Randomly selected underground QAQC sample results from the Jerritt lab were provided for the audit covering a period from June 2011 to December 2012. The protocol for underground production Cubex-drilled sampling QAQC is to submit blanks and 4 standards into the sample dispatch every 24thsample and to duplicate every 20th sample in a dispatch.
11.3.2 Re-assays and duplicates performance
Veris’ assay protocol for QAQC at Jerritt Canyon does not include submitting duplicates as part of the regular sampling of exploration core (surface or underground) sent to outside laboratories. However, the in-house Jerritt laboratory does include internal duplication of Cubex-drilled samples per sample submittal.
Core samples from underground drilling are initially submitted to ALS for fire assay with AA finish methodology. Re-assay requests are generated in the sample submittal (dispatch) to the outside lab (ALS or AAL) for samples with an assay value > / = 0.07 Au opt to automatically be re-analyzed using fire assay with gravimetric finish methodology. If a drill hole produces no regular samples with values > / = 0.07 Au opt, then no re-assays are generated. Standards submitted in the original submittal, which generate values over 0.07 Au opt, are re-assayed as duplicates. The Jerritt lab will also re-assay samples with a gravimetric finish for samples with >0.07 Au opt.
Additionally, Jerritt Canyon’s regular QAQC protocol requires randomly re-submitting 15% of the total sample population (by calendar quarter) of > / = 0.070 Au opt for duplicate assaying (fire assay with gravimetric finish) and + / - 5% of the total sample population (by calendar quarter) for all other samples <0.070 opt (fire assay with AA finish).
To meet proprietary QAQC protocol standards, Jerritt usually re-submits bulk and pulp rejects to their primary lab (ALS) as well as to an additional independent lab (AAL) on a quarterly basis. By this means, the lab is unaware of the original assay result. However, Veris was unable to submit quarterly bulk rejects for 2011 surface and 2012 underground core drilling due to staffing shortfalls. This is a temporary situation. As Veris has other QAQC protocols in place which have performed well, such as blanks and standard, this lull in re-assay checking is not considered to impact the integrity of sampling results during this period of time. Jerritt Canyon’s sampling methodology continues to be considered acceptable as a documented protocol for QAQC standards by this author.
There were no duplicates or re-assays of bulk or pulp samples performed on the 2011 surface core drilling program, due to temporary constraints on this phase of quarterly testing.
There were 79 randomly selected duplicated samples with corresponding original samples submitted for review from the Jerritt laboratory population of underground Cubex samples from a population dated between June 18, 2011 and December 31, 2012. The results demonstrated excellent correlation with only 2 samples being within 0.02 and 0.04 Au opt difference, which is acceptable to this author.
| Veris Gold Corp. | |
| NI 43-101 Technical Report Jerritt Canyon Property, Nevada | 11-6 |
Figure 11.3.2.1: Jerritt lab duplicate results from June 18, 2011- December 31, 2012.
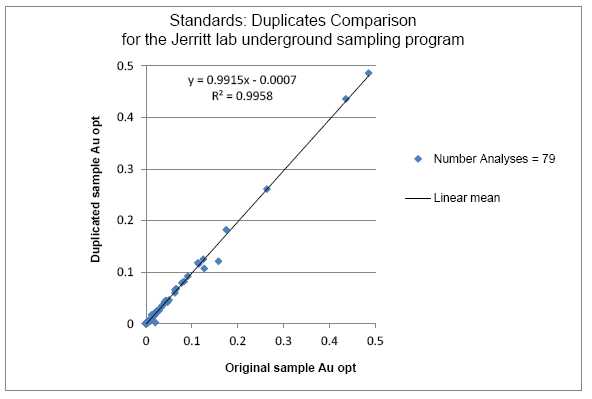
| Veris Gold Corp. | |
| NI 43-101 Technical Report Jerritt Canyon Property, Nevada | 11-7 |
11.3.3 Blank performance
Surface:
The results of 21 randomly selected blank samples from the ALS laboratory were submitted for review of QAQC for surface drilling from a population dated June 18, 2011 to December 31, 2012. There were 2 outliers that were within acceptable means.
Figure 11.3.3.1: ALS lab blanks results from June 18, 2011– December 31, 2012.
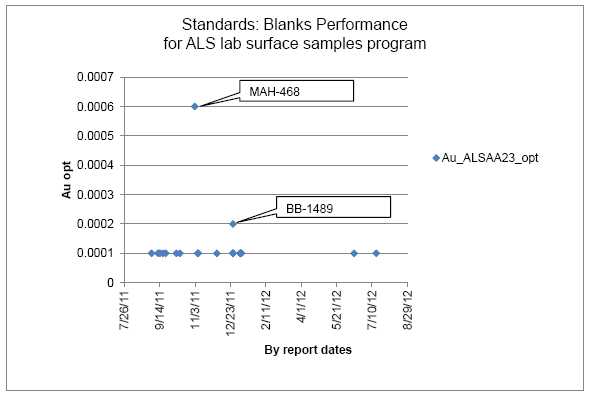
| Veris Gold Corp. | |
| NI 43-101 Technical Report Jerritt Canyon Property, Nevada | 11-8 |
Underground:
The results of 117 randomly selected blank samples from the Jerritt laboratory were submitted for review of QAQC for underground Cubex drilling from a population dated June 18, 2011 to December 31, 2012. There was 1 outlier of 0.002 opt Au.
Figure 11.3.3.2: Jerritt lab blank results from June 18, 2011– December 31, 2012.

| Veris Gold Corp. | |
| NI 43-101 Technical Report Jerritt Canyon Property, Nevada | 11-9 |
11.3.4 Standards performance: surface core drilling
Below is a chart portraying the results of 14 randomly selected samples of the JCQ06 standard from the ALS laboratory reviewed by this author for surface drilling from a population dated June 18, 2011 to December 31, 2012. There was 1 outlier, which the author believes was probably a blank accidentally inserted in the submittal.
Figure 11.3.4.1: ALS lab JCQ06 standard results from June 18, 2011– December 31, 2012.
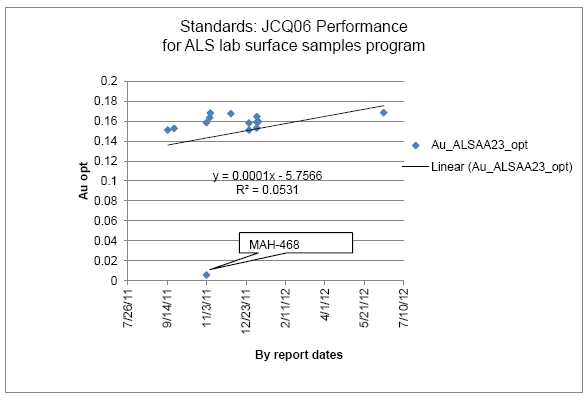
| Veris Gold Corp. | |
| NI 43-101 Technical Report Jerritt Canyon Property, Nevada | 11-10 |
Below is a chart portraying the results of 10 randomly selected samples of the JCQ07 standard from the ALS laboratory reviewed by this author for surface drilling from a population dated June 18, 2011 to December 31, 2012. The results are broadly spaced but within an acceptable spread of 0.035 opt Au.
Figure 11.3.4.2: ALS lab JCQ07 standard results from June 18, 2011 - December 2012.
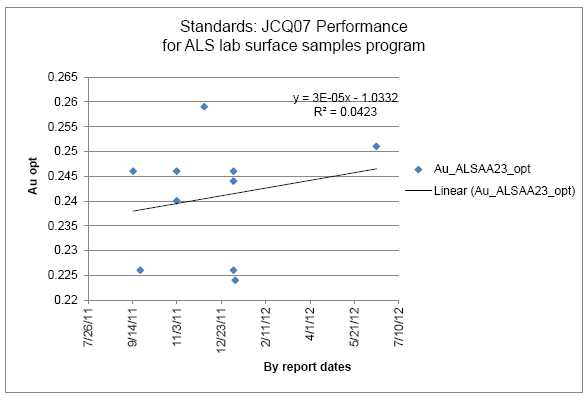
| Veris Gold Corp. | |
| NI 43-101 Technical Report Jerritt Canyon Property, Nevada | 11-11 |
Below is a chart portraying the results of 27 randomly selected samples of the Si54 standard from the ALS laboratory reviewed by this author for surface drilling from a population dated June 18, 2011 to December 31, 2012. The results are broadly spaced but within a spread of 0.094 opt Au. The authors recommend perhaps replacing this standard or testing its performance in more detail with commercial labs (please refer to Qualified Person recommendations and opinions in Section 11.4) .
Figure 11.3.4.3: ALS lab Si54 standard results from June 18, 2011 - December 31, 2012.
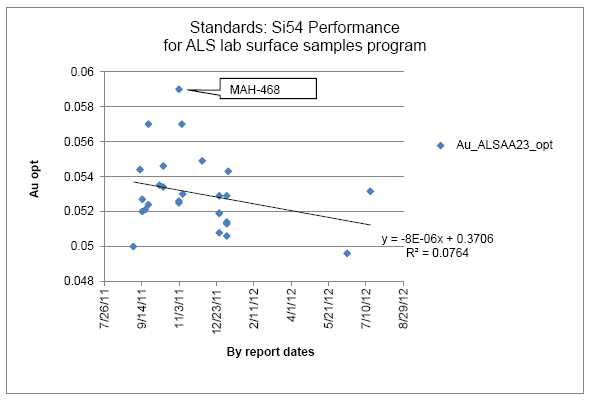
| Veris Gold Corp. | |
| NI 43-101 Technical Report Jerritt Canyon Property, Nevada | 11-12 |
Below is a chart portraying the results of 21 randomly selected samples of the SK52 standard from the ALS laboratory reviewed by this author for surface drilling from a population dated June 18, 2011 to December 31, 2012. The results are broadly spaced but within an acceptable spread of 0.0085 opt Au.
Figure 11.3.4.4: ALS lab SK52 standard results from June 18, 2011 - December 31, 2012.
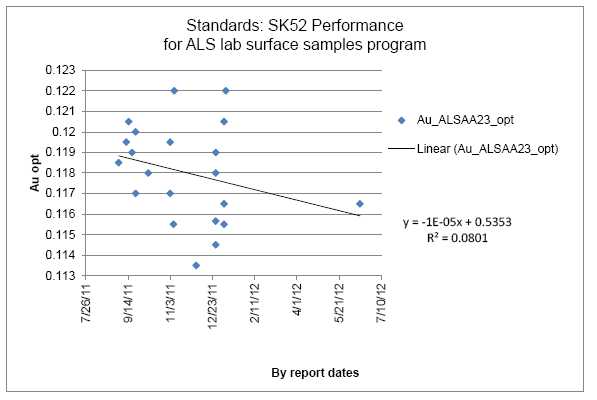
| Veris Gold Corp. | |
| NI 43-101 Technical Report Jerritt Canyon Property, Nevada | 11-13 |
11.3.5 Standards performance: underground Cubex drilling
Below is a chart portraying the results of 41 randomly selected samples of the JCQ06 standard from the Jerritt laboratory reviewed by this author for underground Cubex drilling from a population dated June 18, 2011 to December 31, 2012. There were 2 outliers, which were within acceptable means.
Figure 11.3.5.1: Jerritt lab JCQ06 standard results from June 18, 2011 - December 31, 2012.
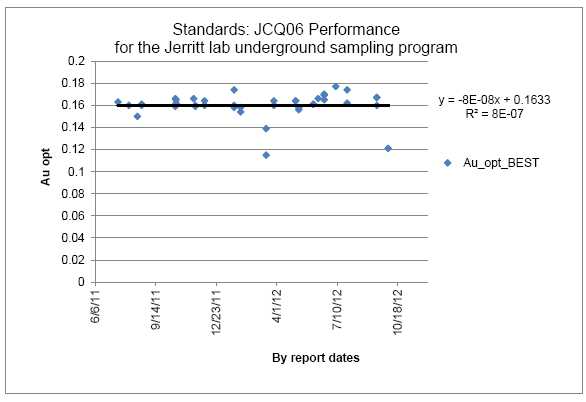
| Veris Gold Corp. | |
| NI 43-101 Technical Report Jerritt Canyon Property, Nevada | 11-14 |
Below is a chart portraying the results of 38 randomly selected samples of the JCQ07 standard from the Jerritt laboratory reviewed by this author for underground Cubex drilling from a population dated June 18, 2011 to December 31, 2012. There was 1 outlier within acceptable means.
Figure 11.3.5.2: Jerritt lab JCQ07 standard results from June 18, 2011 - December 31, 2012.
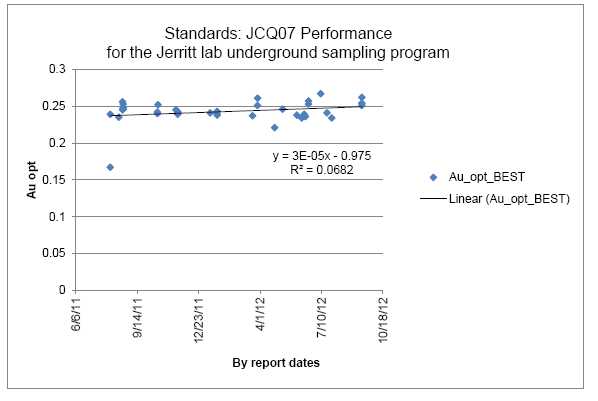
| Veris Gold Corp. | |
| NI 43-101 Technical Report Jerritt Canyon Property, Nevada | 11-15 |
Below is a chart portraying the results of 48 randomly selected samples of the Si54 standard from the Jerritt laboratory reviewed by this author for underground Cubex drilling from a population dated June 18, 2011 to December 31, 2012. The Jerritt lab has good results with this standard, though there was 1 outlier within acceptable means. Due to erratic results for this standard from commercial labs, the authors recommend perhaps replacing this standard or testing its performance in more detail with the commercial labs (please refer to Qualified Person recommendations and opinions in Section 11.4) .
Figure 11.3.5.3: Jerritt lab Si54 standard results from June 18, 2011 - December 31, 2012.
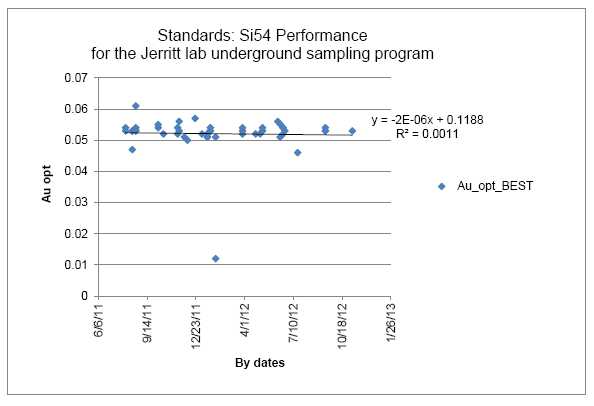
| Veris Gold Corp. | |
| NI 43-101 Technical Report Jerritt Canyon Property, Nevada | 11-16 |
Below is a chart portraying the results of 46 randomly selected samples of the SK52 standard from the Jerritt laboratory reviewed by this author for underground Cubex drilling from a population dated June 18, 2011 to December 31, 2012. The results are broadly spaced but within an acceptable spread of 0.02 opt Au.
Figure 11.3.5.4: Jerritt lab SK52 standard results from June 18, 2011 - December 31, 2012.
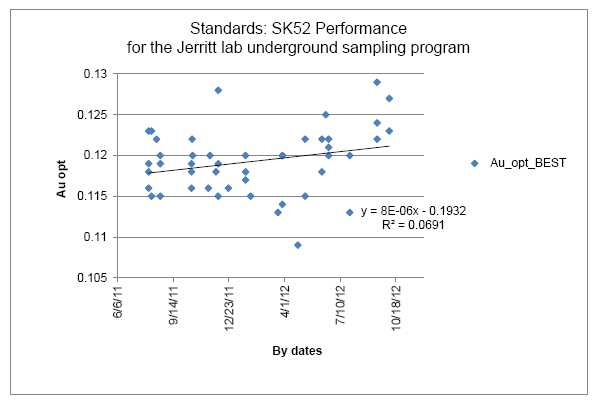
11.4 Opinion on the adequacy of the sampling methodolgy
VUSA’s sampling protocol at Jerritt Canyon for both exploration drilling and production Cubex drilling are ensuring accurate results that demonstrate reliable gold values derived from the underground drilling program.
Further actions to insure the integrity of sampling drilled material and subsequent certified assay results at Jerritt Canyon could include improvements in the area of QAQC. For example, the performance of the standard Si54 is not as consistent with the commercial labs as it is with the Jerritt lab. Also, Jerritt Canyon staff has skipped quarterly check assays for the last quarter of 2012. The QAQC protocol currently in place could be improved by replacing the Si54 material with another more reliable standard that performs well with these ores. Also, it is important that Jerritt resume quarterly check assay samples and not let this gap in testing comprise the otherwise excellent data integrity in their Master database.
This author has confidence in the accuracy of the assayed sampling results compared between certified assays and the master acQuire database for contributing new 2011 to 2012 assay values to future estimates of resource and reserve.
| Veris Gold Corp. | |
| NI 43-101 Technical Report Jerritt Canyon Property, Nevada | 12-1 |
12 Data verification
12.1 Data vetting prior to August 2008
The Jerritt Canyon mine has thousands of completed drill holes throughout the land package in the active mines, mined out areas, and exploration targets, (Table 10.1 and Figure 4.3.2) . Over the years the property has been the subject of many audits in which data verification procedures were carried out.
In 1993, Behre Dolbear & Company conducted an audit of the Independence Mining Company (IMC) February 4, 1993 open pit reserve calculation and methodology by Guarnera (1993) that mostly included Type 1 carbonaceous ores (chlorine amenable normal refractory ores). Results of this early study included:
Drilling and sampling techniques were conducted in accordance with industry standards at the time;
Surface core – rotary reverse circulation drill hole pair comparison studies for the open pit resources and reserves were found to be acceptable for production drilling;
Geologic factors were well understood at the deposits by the project geologists and alteration and structural components were reliably and consistently identified; and
Several cross-sections generated by Behre Dolbear staff found no significant discrepancies with the IMC project geologist’s computer and hand drawn cross sections at Burns Basin, Mill Creek,
Alchem, Winters Creek, California Mountain, and Saval/Steer open pit reserves.
In 2000, Mineral Resources Development Inc. (MRDI) conducted a review and audit of resources and reserves of the Jerritt Canyon operation. MRDI reviewed the database used at Murray and SSX mines, and did not find any significant errors or problems. Their review of the spreadsheets used for Resource and Reserve tabulation found no errors.
In 2003, Pincock, Allen, and Holt (PAH) reviewed a portion of the database as part of its due diligence review of the Jerritt Canyon operations. Checks of several records of the SSX mine database performed against original logs confirmed the assays values and geological-geotechnical codes. Data validation checks identified a few errors in the drill hole database such as duplicate holes and missing intervals in downhole surveys which were then corrected.
In 2004 and 2005 PAH conducted reviews of Jerritt Canyon resources and reserves, during which they performed checks on several drill hole records and original assay certificates against the database. Their focus was new resource and reserve areas. Data validation identified minor errors in 2005 that were then corrected and no errors in 2004.
In 2006, SRK conducted data validation checks as part of its review of the Jerritt Canyon resources and reserves. The database in new reserve areas such as Starvation Canyon and West Dash were checked against the original logs and assay certificates and no errors were found. Spot checks were also performed on the resource and reserve tables for tons and grade and no errors were found.
In 2007, SRK reviewed the Jerritt Canyon assay QA/QC data and found the results within industry standards.
From 2007 to August of 2008, Geological data and assay data were analyzed by geologists using MineSight software and acQuire. The geological block models for both production and resource were generated in MineSight and converted into the Vulcan software environment for use primarily by mine engineers.
| Veris Gold Corp. | |
| NI 43-101 Technical Report Jerritt Canyon Property, Nevada | 12-2 |
12.2 Data vetting performed after August 2008 to January 2010
After mining temporarily stopped in 2008 and the mine and exploration staff was let go, a new Jerritt Geology team was formed under management by Todd Johnson and Vulcan was chosen as the primary geological and mining modeling software for the project. All usable digital project data stored in MineSight and not already in Vulcan were transferred into Vulcan. In most cases, new digitized 0.10 opt Au grade-shells and geological contacts were hand digitized on systematic cross sections in the primary work areas (SSX-Steer, Smith, and Starvation) in order to make 3-D solids for new block models to help support updated resource and reserve estimations. Details of the new geological models are discussed in detail in Section 14.
The acQuire drill hole databases were heavily scrutinized and cleaned up from February 2010 to March 2011. Hua Jin (M Sc. in Geology), the Corporate YNG Geologist at the time who managed the Company’s databases, performed a majority of the acQuire work with the assistance from several acQuire Technical Support staff and other Jerritt geological staff including author Michele White. Data corrections were performed on a record to record basis. The numerous edits are all documented in a January 16, 2011 memo by Ms. Jin entitled “Summary of the Jerritt geological database work”, which resides on the computer server and in the annual QA/QC notebooks at the mine.
Many of the underground mine projects stored in the acquire database were found to have similar underground drill hole identification numbers. In order for Vulcan to work efficiently, all of the underground drill holes in the database needed to have a unique drill hole identification number. This was accomplished by adding a unique three-letter prefix to the 5 major underground mine areas: SMI- for Smith; SSX- for SSX, STR- for Steer, MUR- for Murray, and MCE- for MCE mines.
In the third quarter of 2010, the acQuire software was updated from version 3.9 to 4.2.1.4 and as a result the SQL server software required an update to SQL 2008 R2 to help support the newer acQuire software version. This acQuire upgrade allowed the geology group to migrate the Jerritt drill hole database from the standard model acQuire database management system (ADBS) to the corp model system for all three Jerritt databases: the JC production underground drill hole database, the JC surface drill hole database, and the JC geochem database. This allowed the use of data capture tools (importers) and objects (QA/QC analysis tools) in acQuire to import and help validate all of the captured original raw geological data and assay data as efficiently as possible and to help eliminate human errors as much as possible.
Periodic drill hole data extracts from acQuire are made from both the underground and surface drill holes which consist of .csv files for drill hole collar, drill hole down hole survey, drill hole geology, and drill hole assays. The .csv files are loaded into Vulcan as current .isis drill hole databases which are used for modeling purposes and ultimately for resource and reserve estimations.
In addition, numerous surface geochemical samples and drill hole geological and assay data related to the June to August 2008 Jerritt Canyon mine and exploration drilling programs were imported into the acQuire databases. Some of the drill holes from the Steer underground mine area required geological logging and sampling. Vice President of Exploration for Veris, Todd Johnson, was responsible for securing these drill hole samples in safe locations throughout the mine until financing and geological staff were made available to process them. The securing of the samples mostly meant bagging the samples up in bean bags and properly labeling and securing them with wire ties, then storing them inside secure buildings to keep them away from the harsh winter weather conditions.
The historical Jerritt Canyon drill hole geology logs and assay data for the property were mostly stored in the Elko Exploration office during the mine shut down in August 2008. During that time, Mr. Johnson was also responsible for securing and moving all of the Jerritt Canyon exploration data, including the drill hole geology logs and assay certificates and historic geology maps and claim maps from the Elko office to the Administration Building at the Jerritt Canyon mine. Several of the paper copies of the drill hole logs were also located at the Geology offices at the mine. These binders were properly filed with the other drill hole data into one central drill hole data room location (Drill Hole Library) in the Administration office at the mine. In addition, Mr. Johnson made certain to store all of the relevant hard paper copies of the 2008 drill hole assay certificates and other drill hole data (e.g. geology logs, down hole survey, collar survey, sample transmittals, geotechnical logs, and QA/QC assay data) in the appropriate binders in the main drill hole library.
| Veris Gold Corp. | |
| NI 43-101 Technical Report Jerritt Canyon Property, Nevada | 12-3 |
Numerous duplicate or suspicious geology logs were checked and revised based on visual examination of the hard copy paper geological drill hole logs. It was noticed in mid- to late 2010 that numerous data gaps existed in the surface drill hole database for both Geology and Assay records. A geologist was hired to help collect some of the missing assay and geology records for those areas that were a priority for future exploration or development work. The geological database revisions were documented in internal memos and emails that are stored at the mine site. The addition of the historical geological and assay data to acQuire along with updating all of the 2008 and 2010 drill hole data into acQuire allowed the modeling work at SSX-Steer and Smith to proceed on schedule and also allowed more geological and assay data to be used in the new models.
In addition to the acQuire database work, QA/QC protocols and procedures were reviewed and new guidelines were made which are described in Section 11.3. Other data verification was performed during the modeling work and in the construction of the block models and are described in Section 14.10.
A drill hole data audit was performed on the 2008 to 2010 drill hole assay data by Jerritt Geology staff in May 2010. The drill hole data stored in acQuire for certain drill hole records were compared with original assay certificates from the Jerritt Canyon assay lab and the commercial labs. A total of 16% of the 2008 and 2010 total assay records were reviewed for this data audit. The details of this audit are stored on the computer server at the mine and have been reported in previous NI 43-101 reports.
In this audit, only 132 out of the 11,413 reviewed 2008 to 2010 drill hole assay records reviewed (1.2 percent) were found to contain different assay values in the acQuire database when compared with the original assay certificate. Most of these errors were likely the result of: (1) assay reruns for drill holes that were analyzed at the Jerritt Canyon assay lab which were not documented or copied into the paper drill hole files, or (2) data import errors related to data that was occasionally hand-entered. No conflicting assay data values were found for the 2010 underground exploration (diamond drill hole) assays conducted by ALS. The low amount of data input errors found in the 2008 and 2010 assay data verifies the significant amount of effort that the post-August 2008 Jerritt Geology group expended to create a robust drill hole database to help support a revised geologic model. A total of 4 percent of the reviewed 2008 underground exploration drill holes from the Smith mine contained no original assay certificate and were later requested from the assay labs and imported into acQuire.
Additional results of the 2008 to 2010 drill hole audit indicated that the former Jerritt geology staff (pre-August 2008) did not routinely store paper copies of the original assay certificates for the underground production drill holes. Most of the Jerritt Canyon assays were directly loaded from LIMS output files directly into the acQuire Production drill hole database.
There are several instances where the Jerritt Canyon assay certificates contain formatting errors which do not allow the straight import of the data into acQuire. For these cases, the acQuire data entry person must determine what the error is and physically revise the assay spreadsheet in order to correctly import the data into acQuire. The assay lab reports must follow the protocols and formats that have been defined for the final assay certificates in order to allow the efficient flow of assay data into acQuire.
The Geology department has largely completed the task of storing drill hole logging information and assay data into the acQuire databases. Assay data is directly downloaded from the lab (both commercial and Jerritt Canyon’s) and goes through automatic and visual validations before being recorded, thus eliminating most data entry errors.
| Veris Gold Corp. | |
| NI 43-101 Technical Report Jerritt Canyon Property, Nevada | 12-4 |
12.3 Data vetting performed on 2011 drilling results
In January 2012, Michele White retrieved digital copies of data specific to supporting the updated December 31, 2011 resource and reserve estimate at Jerritt Canyon. Drilled data up to March 2011 had been cleaned and vetted in multiple previous studies accepted for validation by the primary author. As a result, this 2011 data validation was limited to only drill hole data utilized in the Vulcan model and to a term between January and December 2011. The digital files provided original results to compare with the actual dataset utilized in Vulcan including collar locations, downhole surveys, lithology, and assay results.
The 2011 datasets validated included:
The Vulcan-derived isis database used for reserve / resource calculation for collar, survey, assay, alteration, and lithology.
Direct exports from acQuire of drill hole collar, survey, assay, and lithology.
Scanned .PDF files of original assay certificates from the accredited outside laboratory: ALS.
Jerritt Lab direct reporting assay certificates.
Assay results from ALS used for uploading into acQuire.
Small Mine Development (SMD) assay datasets derived from the Jerritt lab and subsequently merged into an edited, centralized database for daily mine development.
Drilling QA/QC protocols including quarterly reports for 2011, standards definitions, statistical analysis and graphs, and other protocol checks.
Issues found with the 2011 drilled data set included:
| | 1. | Utilizing data in Vulcan directly from SMD, which bypasses acQuire. |
| | 2. | Edits to raw data such as using place holders and codes in acQuire and Vulcan. |
| | 3. | Typographical errors in sample ID from the Jerritt lab. |
Details of these issues:
1) The underground drilling data from SMD was more complete than the acQuire database by the end of 2011 due to daily updates to the SMD database, whereas the underground drilling data was last updated in acQuire in late May, 2011. This was due to being understaffed during summer of 2011 drilling. In order to utilize the most up-to-date results for resource modeling in Vulcan, the independent consultant, Karl Swanson, loaded SMD’s underground drill hole database for the period of July 2010 to December 2011 directly into Vulcan. This action over-wrote any previous acQuire data for the underground drill holes in Vulcan for that period. Jerritt staff conducted an audit of the resultant dataset and concluded the data to be almost the same as data in acQuire. The different values were found to be correct in the SMD data based on checks with the source results from the Jerritt lab. (There is no written report on this internal audit).
2) The 2011 assay results used in the December 31, 2011 resource and reserve estimate were derived from two labs: ALS Chemex lab and the Jerritt Lab. The commercial lab reported assay results in .csv file formats for direct upload to acQuire according to standardization built-into the acQuire importers to adhere to business rules of protocol for QA/QC compliance. ALS reported results for Au in ppb and also a calculated field for Au in opt. Results higher than 0.1 opt were re-assayed with Au-GRA21 finish in opt, which automatically superseded the Au ppb results in acQuire as “best sample” for the exports to Vulcan. Deviation from an expected value, (such as a code for a missing sample or place holders for blank spaces), had to be edited for use in Vulcan. Other edits for Vulcan software included removing characters, such as “<” and “>”. As a result, direct correlation between the isis database would be expected to differ from the raw assay results in spreadsheet from the labs.
| Veris Gold Corp. | |
| NI 43-101 Technical Report Jerritt Canyon Property, Nevada | 12-5 |
3) At the time of this audit, the Jerritt lab reported assay results with frequent errors in the sample ID number. The values of the assay results were not suspect because they are derived from the LIMS-monitored system but the sample ID errors were human derived. These errors in sample ID were easy to detect and edit. This situation hindered a direct comparison of raw Jerritt lab results with the clean isis database. The Jerritt lab will eventually rely on an automated LIMS system.
Resolution of these issues:
The Qualified Person, Michele White, accepted the 2011 sequence of events in addressing the listed issues with satisfactory results. The 2011 data was found to be valid for use in the isis database because: 1) the SMD data was more complete and is derived from the same source as acQuire (the Jerritt lab); 2) the insertion of special characters and place holders by acQuire is a track-able procedure that was examined for error propagation in the dataset used for this update and did not incur errors; and 3) the sample ID errors in the Jerritt lab data were predominantly below 0.1 opt and therefore did not impact the resource or reserve.
Summary:
The 2011 drill hole assay data verification analysis produced satisfactory correlations between the source data and the isis database. The underground samples derived from Cubex drilling were submitted to the Jerritt lab for assaying and the underground diamond drilling and surface drilling samples are sent to ALS Chemex for certified results. Both labs produced results that fall within industry standards after QA/QC analysis of results.
There were 14,089 total assay results for 2011 in the isis underground assay database. Assay results >0.1 opt were determined to have an acceptable correlation between the isis database and the Jerritt lab (about 17% of the assay population is >0.1 opt and the direct matches for those values were consistent). The correlation between the isis underground assay database and the ALS lab results for samples >0.1 opt was100%. There was a direct match of 60% records between the isis database and total source data. The result of the data validation for the isis underground drilling database from January to December 2011 was considered acceptable by the primary author at the time (Mark Odell).
The acQuire surface drill hole database was determined to be in an excellent state of verification. Of 37,225 assay records for surface drilling results from ALS, only 17,614 assay results were utilized in the isis surface drilling database. Of these 17,614 isis assay records, there were 1,113 intervals that differed from source data. Of these differences, only 307 samples were >0.1 opt and therefore, only 307 out of 17,614 records could have possibly impacted the resource / reserve estimate. That is a 93% acceptable correlation of matching records between the original source data and the isis database which was considered to be very good.
12.4 Current data vetting June 18, 2011 to December 31, 2012
On January 23, 2013 author, Michele White, commenced an audit of assay data derived from sampling newly drilled material for the Jerritt Canyon property. This audit was performed for verification purposes to contribute this dataset to future evaluations of the December 31, 2012 Jerritt Canyon mineral resource and reserve estimates. This audit addresses assay results from drilled material sampled between June 18, 2011 and December 31, 2012 for underground drilling, and between July 18, 2011 and December 21, 2011 for surface drilling. Assays of samples for this period of time augment the previous data verification also performed by Michele White for the NI 43-101 Technical Report prepared by Practical Mining for YNG for the Jerritt Canyon property, dated December 31, 2011 and filed on April 27, 2012. There was only minor surface drilling in 2012 (2,577 ft); however, numerous assays from surface drill holes completed in 2011 were received after January 2012 and/or after the December 31, 2011 Vulcan models had been updated which were partially included for this current drill hole audit.
| Veris Gold Corp. | |
| NI 43-101 Technical Report Jerritt Canyon Property, Nevada | 12-6 |
12.4.1 Datasets submitted for evaluation
Jerritt Canyon Data Manager, Ling Domenici, provided specific datasets for the audit based on requests by the auditor to analyze a random population representing no less than 5% and optionally up to 25% of the total samples produced from drilled material for these 3 programs:
- Underground Cubex production drilling, which is sampled on-site through the Jerritt production laboratory for minimizing turn-around time, as this data is utilized for daily mine planning and ore control. This material is not logged for lithology and the collar locations are estimated based on surveys provided to assist in setting the drill up on location at the correct orientation. Other surveys contributing to some of the underground collar locations are the mine asbuilt surveys. There are no downhole surveys performed. Drill traces for the production holes are generated from engineering designs for projecting the results in models. This method of locating the collars and traces is considered acceptable due to the short length of the holes and the high density of drilling. Sample results from the underground Cubex drilling are used in the resource estimate.
The audit reviewed the Jerritt lab assay results from daily production samples for consistency and analyzed the Jerritt lab results based on comparison to detection of known values for standards submitted within the sample dispatches. The chain of custody for assay results derived in the Jerritt lab was also examined for consistency in data management procedures.
- Underground core drilling for exploration purposes. Core from underground drilling is sent to an outside laboratory to ensure the results are derived from an accredited laboratory for use in the resource estimates. This drilled material is logged for lithology to contribute to a detailed geological model. The collar locations are surveyed for northing, easting, elevation, azimuth, and dip, and the drill trace is surveyed downhole.
This audit compared the original raw data derived from surveying, logging, and sampling underground- drilled core to electronic data as exists in the 2013 acQuire database and then to data utilized for modeling geology and resource / reserve in the 2013 ISIS database. The data was examined for consistency and accuracy. Assay values in acQuire and ISIS were correlated directly to the original assay certificates derived from accredited laboratories.
- Surface core drilling for exploration purposes. This drilled core material follows the same criteria listed above for underground core drilling.
Summary of all datasets for the total sampled material provided by the Jerritt Canyon Data Manager, Ling Domenici, for this audit include:
Table 12.4: Summary of datasets submitted for January 2013 audit.
Year and type of drilled data available for the
January 2013 audit | Drill holes provided for the January 2013 Audit |
Total drill
holes
available | Drill Holes
Reviewed | % of population
audited |
| 8/2011 – 12/2012 U/G SSX Cubex | 206 | 20 | 10% |
| 6/2011 – 12/2012 U/G Smith Cubex | 934 | 51 | about 5% |
| 10/2011 – 12/2012 U/G Exploration core | 40 | 10 | 25% |
| 2011 Surface core | 221 | 20 | About 10% |
In addition, specific technical datasets related to evaluating the integrity of the assay checks were also audited for purposes of correlation between original source data and the 2013 acQuire database, then cross-checked against the 2013 ISIS database. The number of drill holes reviewed for technical data is lowest in comparing downhole survey and lithology because none of the underground production holes are surveyed downhole or logged for geology due to density of drilling within known geological units. Assay certificates, sample intervals, and collar coordinates reviewed cover between 20% to 85% of all the drill hole data for the entire period under audit. Below is a table itemizing the number of drill holes per dataset audited:
| Veris Gold Corp. | |
| NI 43-101 Technical Report Jerritt Canyon Property, Nevada | 12-7 |
Table 12.4: Number of drill holes per dataset audited.
| Datasets for: | Total drill
holes
available for
audit
| Holes:
Collar XYZ,
Az, Dip, TD
reviewed
| Holes:
Downhole
Survey
reviewed
|
Holes:
lithology
reviewed
| Holes:
cut-
sheets
reviewed
|
Holes:
Assay
certificates
reviewed |
| UG SSX Cubex | 206 | 69 | 0 | 0 | 90 | 87 |
| UG SMITH Cubex | 934 | 183 | 0 | 0 | 0 | 161 |
| UG Core | 40 | 29 | 21 | 10 | 10 | 10 |
| Surface Core | 221 | 101 | 8 | 23 | 20 | 22 |
| Totals | 1401 | 382 | 29 | 33 | 120 | 280 |
| Percent of population reviewed: | | 27% | 2% | 2% | 85% | 20% |
In addition to verifying gold values for sampled material derived from drilling at Jerritt Canyon from June 18, 2011 to December 31, 2012, this audit also reviewed general technical data related to sampling, such as the location of the collars and downhole surveys per sampled interval. Geologic data was also reviewed for the purpose of validating data that would be used in geologic modeling as a premise for shaping and projecting trends of the ore bodies for resource and reserve estimates.
Specific technical datasets audited were compared for direct correlation record-by-record between the original source data and the 2013 acQuire database, then to the 2013 ISIS database for validation purposes. The record-by-record validation produced a detailed examination of between 8% and 37% of the datasets that uphold the integrity of the assay values in Jerritt Canyon’s master acQuire database. The table below lists the number of records actually reviewed per dataset.
Table 12.4: Number of records reviewed per dataset.
Source
data | Number of records reviewed for technical data related to verifying assay values |
acQuire
records:
Collar
XYZ, Az,
Dip, TD | Records of
sources
reviewed:
Collar
XYZ, Az,
Dip, TD | acQuire
records:
Downhole
Survey | Records of
sources
reviewed: Downhole
Survey | acQuire
records:
lithology | Records of
sources
reviewed: lithology | acQuire
records:
sample
intervals | Records of
sources
reviewed:
cut-sheet
intervals | acQuire
records:
Assay
values | Records of
sources
reviewed:
Assay
certificates |
UG SSX
Cubex |
206 |
69 |
0 |
0 |
0 |
0 |
7,469 |
3,502 |
7,469 |
1,043 |
UG
SMITH
Cubex |
934 |
183 |
0 |
0 |
0 |
0 |
21,720 |
0 |
21,720 |
2,255 |
| UG Core | 40 | 40 | 637 | 86 | 1,389 | 282 | 7,331 | 1,784 | 7,331 | 1,784 |
Surface
Core |
221 |
221 |
2,350 |
147 |
2,329 |
220 |
26,405 |
1,282 |
26,405 |
1,315 |
| Totals | 1,401 | 513 | 2,987 | 233 | 3,718 | 502 | 62,925 | 6,568 | 62,925 | 6,397 |
| % totals: | 100% | 37% | 100% | 8% | 100% | 14% | 100% | 10% | 100% | 10% |
| Veris Gold Corp. | |
| NI 43-101 Technical Report Jerritt Canyon Property, Nevada | 12-8 |
12.4.2 acQuire to ISIS comparison of assay data
All assay values for both surface and underground samples in the January 2013 ISIS database utilized by Practical Mining for updating the resource and reserve estimates at Jerritt Canyon were directly correlated to assay values in Jerritt Canyon’s acQuire database in this audit.
Surface Assays
A total of 26,405 assay records occur in both the 2013 acQuire database and the 2013 ISIS database for the 2011 surface-drilled core samples. With the exception of differences due to rounding from 4 to 3 decimal places, the direct correlation between ISIS and acQuire for the 2011 surface core drilling program exactly match for the entire population of assay records.
Results Surface Assay datasets check: Excellent matches between acQuire and ISIS.
There were 3 non-matches in the surface core assays between acQuire and ISIS, none of which contained significant gold grades. (Resource estimates by Practical Mining will use 0.03 opt Au for bulk mineable cut off grades for the open pits.)
Underground Assays
A total of 36,971 individual assay records for all of the 2011 and 2012 underground samples (inclusive of Cubex and core material from SSX and Smith) exist in the January 2013 ISIS database. However, 511 of these assay records in ISIS are empty place holders with a -99 value pending finalization of certified assays imported into acQuire. The 2013 acQuire database reviewed in this audit has 60 assay records for Cubex underground production drill hole SSX-C70057 that were not exported to the January 2013 ISIS database and will not be included in the resource / reserve estimate.
As a result of these differences, the number of assay records in the 2013 ISIS database differs from the number of assay records in the 2013 acQuire database. The acQuire database contains 36,520 assay records for the same period of time as the ISIS database. However, the ISIS database contains 36,970 assay records – of which 783 are empty place holders. The total number of assay results examined between ISIS and acQuire is 37,031 – of which only 36,460 assay records are mutual to both acQuire and ISIS for the period of time covered by this review.
Results Underground Assay datasets Check: Excellent matches between acQuire and ISIS.
Of the 36,460 assay records checked in the 2013 acQuire underground assay database against the 2013 ISIS underground assay database, 36 of the records (or 0.01%) did not match. Of these non-matches, 10 of the errors are in values of significance, that is >0.1 opt. In 8 of the 10 samples with significant Au values (>0.1 opt) that did not match between acQuire and ISIS, the error appears to be switches in intervals within a single sequence in the same hole, which would not impact modeling of the resource.
12.4.3 Comparison of intervals versus sample numbers
To compare the accuracy of locations for assayed sample intercepts in 3-D models for resource / reserve estimates, the sample intervals and corresponding sample numbers from the original cut-sheets of 20 randomly selected surface-drilled core holes and 10 randomly selected underground-drilled core holes were checked against their digital values in acQuire and then again in ISIS. The sample intervals for Cubex-drilled production holes are spaced in regular 5-foot intervals and sample numbers corresponding to these intervals were reviewed from original cut-sheets for 71 randomly selected underground production holes drilled in both the SSX mine and the Smith mine, which included 3,502 interval records in cut-sheets compared to 29,189 total intervals of sample records in the acQuire underground database (about 12% of the underground data population).
All the examined sample intervals and subsequent sample numbers lined up exactly between the source data and acQuire and ISIS for both the surface and underground drilling programs.
| Veris Gold Corp. | |
| NI 43-101 Technical Report Jerritt Canyon Property, Nevada | 12-9 |
12.4.4 Checks of format conversions: Au opt-Au ppb-Au ppm-Au best selection
The gold values in the January 2013 ISIS database are in units of opt. These values are derived from exported gold values of “best selection” in acQuire. The acQuire database includes gold values reported in ppb, ppm, and opt from the Jerritt and the ALS laboratories using fire assay reported in ppm as the primary testing method. Some samples are automatically submitted for re-assay using fire assay with gravimetric finish reported in ppb if the original value is > / = to 0.07 opt Au. AcQuire will convert Au values from a variety of formats into opt values for uniformity. As a result, the “best selected” Au value exported to Vulcan is based on criteria of preferred sampling methodology and sequence of re-assays that may have been converted to opt from original ppm or ppb formats.
All assay values (100%) for both surface and underground samples in the January 2013 acQuire database were tested for conversions reported in ppb, ppm, and opt from the original formats. With the exception of minor discrepancies due to rounding from 4 to 3 decimal places, all (100%) of the converted values in the entire population for surface and underground assay results examined were correct.
12.4.5 Assay certificates compared to acQuire and ISIS Au values
Certified assays of surface-drilled core material sampled at the ALS laboratory between July 2011 and December 2011 were compared by this author to assay values in the January 2013 acQuire database and the January 2013 ISIS database. A random selection of 10% of the total surface-drilled core holes resulted in a review of 1,317 individual assay certificate records which corresponds to 5% of the total population of 26,405 individual assay records in the 2013 acQuire surface drilling database. The assay records in acQuire were directly matched to their corresponding certified assay results from the ALS lab.
There were minor issues in comparing the original assay certificates to the 2013 acQuire database for the surface drilled core assays related to rounding from 4 decimals to 3 decimals – none of which impacted Au values of >0.1 opt. Otherwise, the assay certificates for 5% of the population under audit exactly matched the acQuire database.
Certified assay results for underground-drilled core material sampled at the ALS lab between October 2011 and September 2012 were compared by this author to assay values in the January 2013 acQuire database and the January 2013 ISIS database. A random selection of 10 out of 40 drill holes (25% of the underground core drill holes in this audit) isolated 1,784 assay records out of 7,331 total assay records (about 24%) for direct certificate to assay record verification.
There were no discrepancies between the assay certificates and the acQuire or ISIS databases for the underground core drilling.
Samples from underground production Cubex-drilled holes were sent to the Jerritt laboratory and were not verified by an accredited outside laboratory except for samples re-assayed for QAQC at ALS. The original CSV formatted files of Au values derived by the Jerritt lab’s LIM system were compared to both the January 2013 acQuire database and the January 2013 ISIS database for consistency.
There were minor discrepancies between the Jerritt lab CSV format LIMS reports and the acQuire / ISIS database related to decimal places and rounding. None of the issues were for assays > 0.1 opt Au.
Note: Certified assay values from ALS lab for Au opt GRAV under detection limit are entered as <0.0001 in the certificate. Assay values under detection limit in LIMS reports from the Jerritt lab are entered as either <0.001or as -0.001 in the CSV format exports from LIMS. acQuire does not accept non-numeric characters for assay values. To compensate for this, samples below detection limit from ALS were flagged with the value of 0.0001 in acQuire. Samples under the detection limit from the Jerritt lab were flagged with the value of either 0.0005 or 0. These values of 0.0001 and 0.0005 and 0 were exported to Vulcan. These flagged values could infer Au detected at those levels. The users have to recognize the flagged conventions to model the data correctly.
| Veris Gold Corp. | |
| NI 43-101 Technical Report Jerritt Canyon Property, Nevada | 12-10 |
12.4.6 Lithology checks: formation, rock type, and intervals
Of the 221 surface core holes drilled in 2011, 23 (or about 10%) of the geological logs were reviewed. There was no surface drilling in 2012.
The only errors between original geologic logs reviewed and the January 2013 acQuire / ISIS database, were for drill hole BB-1449. The entire length of that hole mismatched lithological units and intervals. For the 40 underground core holes drilled between October 2011 and December 2012, 10 (25%) of the geological logs were reviewed in this audit. Lithological codes from three of the randomly selected drill hole logs were in the January 2013 ISIS database but were not in the January 2013 acQuire database. However, the lithological codes and intervals in ISIS directly matched the geological logs without error and can be utilized in future modeling of geology.
There were no geological logs recorded for the underground Cubex drilled holes.
12.5 Summary of database verification
The results of the 2011 - 2012 data vetting analysis support the opinion that the ISIS database is based on correct values to within acceptable industry standards. This dataset in conjunction with the previously accepted datasets of drilling results, such as collar location, down-hole survey, lithology, and assay results, form a cohesive, validated database for use by engineers in evaluating and reporting on resources and reserves at Jerritt Canyon for the current Technical Report.
The Qualified Person for data vetting has independently verified the quality of the drill hole data (both collar information and gold assays) used for the current resource and reserve work and finds it adequate for use in the current study. Based on this assessment, the primary author’s opinion is confident that Jerritt Canyon is conducting exploration and development sampling and analysis programs using standard practices and that the data can be effectively used in the estimation of the December 31, 2012 resources and reserves. It is recommended that the logging of geological drill hole data that is currently being done on paper using pencils be done on the computer or hand-held digital device in order to standardize the pick lists and more efficiently process the data in the future.
| Veris Gold Corp. | |
| NI 43-101 Technical Report Jerritt Canyon Property, Nevada | 13-1 |
13 Mineral processing and metallurgical testing
The mineral processing operation at Jerritt Canyon is very complex and is one of only three processing plants in Nevada that uses roasting in its treatment of refractory ores. Initially, Jerritt Canyon was designed to process oxide and mildly refractory gold ores by conventional cyanidation using chlorine gas for pre-oxidation of the refractory ores. The use of the wet mill to help treat the mildly refractory ores, which used chlorine for ore oxidation pre-treatment, was stopped in February of 1987. In 1989, the roasting circuit (a dry milling process) was added to the process flow sheet for the treatment of highly refractory ores which continues to be used at Jerritt Canyon today for processing of the Jerritt Canyon and other second party (purchased or toll mill) ores.
Numerous metallurgical studies have been conducted on the ores by the various mine owners at the property including cyanidation and roasting test work since the late 1970’s. In addition, early metallurgical test work on ores from resource areas, including bottle roll tests for WaterPipe II, have also been conducted. These reports are in the files stored at the mine site. The actual Au recoveries for the various deposits that have been previously mined and processed are also noted in historic documents stored at the mine site.
The Jerritt Canyon ores are double refractory in nature because the gold mineralization is both included in solid solution within sulfide minerals (arsenic-rich pyrite), and is also locally associated with organic carbon in the host rock. Some limited amount of gold mineralization has also been noted in previous mineralogical studies to be within quartz (silicification). The Jerritt Canyon roaster helps oxidize the majority of the refractory ores for subsequent cyanidation.
A significant portion of the Jerritt Canyon ore contains high amounts of clays. During the winter months, the clay-bearing ores can contain elevated moisture contents from snow and ice that can cause serious handling problems in the plugging of chutes in the crushing circuits. As a result of these conditions, the processing plant capacity during the summer and fall is typically 20% to 40% higher than winter, largely because the dry mill capacity is adversely affected by high moisture in the feed.
The processing facilities and flow sheet are presented in Section 17: “Recovery Methods.”
Since mining development of a new underground mine at Starvation Canyon started in November 2012, and since the mine officially opened in April 8, 2013, a summary of the existing Starvation Canyon metallurgy results is described below. Two samples of Starvation Canyon ore were collected from diamond drill core from drill hole TJ-216C and TJ-232C and separately tested in the Jerritt Canyon lab in February 2006. The samples were dried and pulverized to 95% passing 150 mesh. The samples were tested before and after roasting (at 1030°F) according to the standard procedure. The results are listed in Table 13.1 below.
| Veris Gold Corp. | |
| NI 43-101 Technical Report Jerritt Canyon Property, Nevada | 13-2 |
Table 12.5: Starvation Canyon ore metallurgy testswork results.
SampleID
Number | | Fire Avg
Au (opt) | Leach
Extraction
Au (opt) | Carbon
(pct) | TOC
(pct) | Sulfur
(pct) | Sulfide
(pct) | Calc.
Recovery
(pct Au) |
100%
Starvation
TJ-216C | Head | 0.385 | 0.001 | 4.02 | 0.640 | 1.28 | 0.90 | |
Roasted
Head | 0.385 | 0.289 | 3.28 | 0.100 | 0.89 | 0.02 | 86.60 |
| Tails | 0.052 | 0.000 | 3.29 | 0.230 | 0.80 | 0.01 | |
100%
Starvation
TJ-232C | Head | 0.241 | 0.001 | 5.23 | 0.500 | 1.01 | 0.69 | |
Roasted
Head | 0.238 | 0.156 | 4.64 | 0.08 | 0.71 | 0.02 | 86.31 |
| Tails | 0.033 | 0.000 | 4.64 | 0.220 | 0.64 | 0.00 | |
Low leach extractions on the head assays (0.001 opt equivalent) indicate that the ores that were tested were refractory and must be pretreated. The resulting leach extractions over 86% after roasting indicate that Jerritt Canyon roasting is an appropriate pretreatment for the Starvation Canyon refractory ore materials and that the leach recoveries are similar to other refractory ore types at the property.
| Veris Gold Corp. | |
| NI 43-101 Technical Report Jerritt Canyon Property, Nevada | 14-1 |
14 Mineral resource estimates
14.1 Introduction
In 2012, Veris updated the Jerritt Canyon resource estimate incorporating additional drilling from the 2011 and 2012 drill campaigns. An additional 163 surface drill holes and 1,257 underground drill holes were added since the last NI 43-101 report (Odell et al., April 2012). The 2012 year-end resource estimates were calculated by Mark Odell, Owner, Practical Mining, LLC, P.E. and Karl Swanson, Independent Consultant, SME, MAusIMM using the Vulcan Software versions 8.1.3 and 8.2.
The deposits at Jerritt Canyon which were re-estimated and new resources and/or reserves calculated since the last NI 43-101 report (Odell et al., April 2012) are:
Burns Basin
Saval
Smith
Starvation
Steer-SSX-Saval
West Mahala
Open pit and underground block models were built for the respective deposits. The open pit models were based on both 0.01 opt and 0.1 opt gold grade shells whereas the underground models were based on 0.1 opt gold grade shells. All block models include the geologic models of the stratigraphic units within the deposit.
The deposits with updated open pit block models are:
Burns Basin
Saval
The locations of these updated open pit models are shown in Figure 14.1.1.
| Veris Gold Corp. | |
| NI 43-101 Technical Report Jerritt Canyon Property, Nevada | 14-2 |
Figure 14.1.1: Updated open pit model locations.
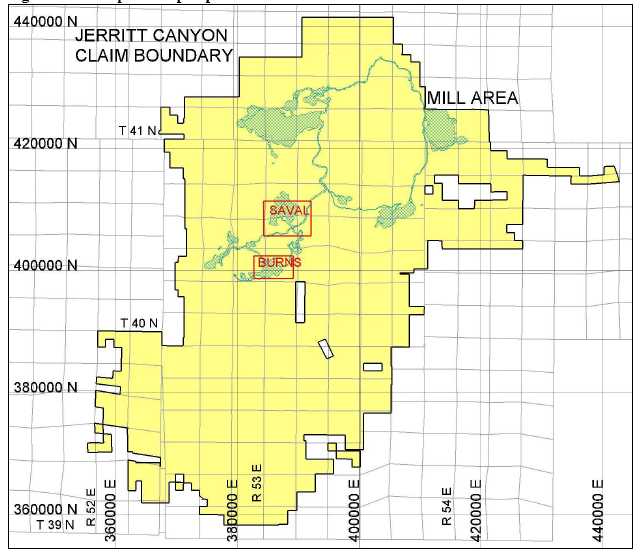
The deposits with updated underground block models are:
Smith
Starvation
Steer-SSX-Saval
West Mahala
Note that only the Saval deposit has both an open pit and underground block model. The locations of the updated underground models that incorporated new drilling are shown below in Figure 14.1.2.
| Veris Gold Corp. | |
| NI 43-101 Technical Report Jerritt Canyon Property, Nevada | 14-3 |
Figure 14.1.2: Updated underground model locations.
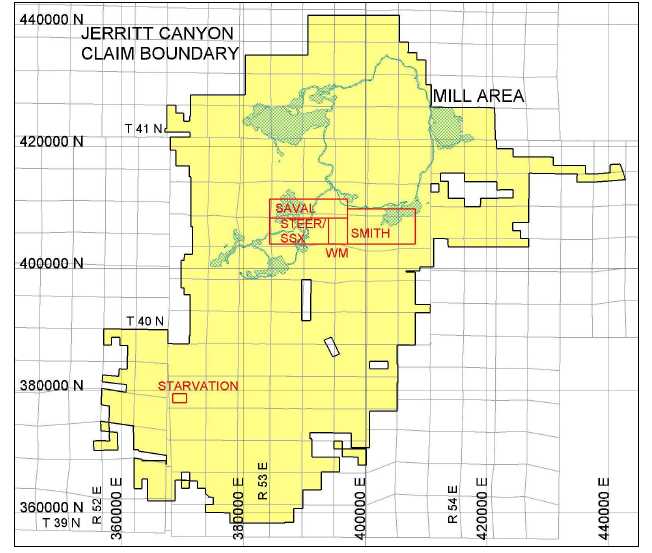
Due to their close proximity to each other, the Saval, Steer-SSX, and West Mahala deposits are included as a single underground block model called SSX.
The stockpiles reposing at the mine portals or remaining from earlier open pit extraction are included in the resource and reserve tables.
14.2 Drill hole database and compositing
The drill hole database is stored in acQuire at Jerritt Canyon in two parts; one for surface drilling and the other for underground or production drilling. The data cutoff date for this NI 43-101 report is December 31, 2012. The surface database contains 15,058 drill holes of which 14,132 have assay data with 500,812 gold assay entries greater than a value of zero and 13,947 drill holes that have geology data with 223,680 geology entries. The underground database contains 38,030 drill holes of which 37,500 have gold assay data with 436,915 gold assay entries greater than zero.
| Veris Gold Corp. | |
| NI 43-101 Technical Report Jerritt Canyon Property, Nevada | 14-4 |
The acQuire data is extracted to .csv tables which are then loaded into Vulcan. There are four tables extracted for each database; surface and underground. The tables are: collar, survey, assay, and geology. The tables contain the following variables:
- Collar - HoleID, Easting, Northing, Elevation and Total Depth;
- Survey - Downhole Depth, Azimuth, and Dip;
- Assay - From, To, Sample ID, gold assay (AuFA), Flag, Zone, and Domain;
- Geology – From, To, Formation Code, Lithology Code, Alteration Code, and Alteration Intensity Code.
The table below lists the formation codes at Jerritt.
Table 14.2.1: Geology database formation codes.
| Code | Formation Name | USGS Description |
| 0 | No Data | n/a |
| 1 | Hanson Creek 1 | SOhc1 |
| 2 | Hanson Creek 2 | SOhc2 |
| 3 | Hanson Creek 3 | SOhc3 |
| 4 | Hanson Creek 4 | SOhc4 |
| 5 | Hanson Creek 5 | SOhc5 |
| 6 | Eastern Facies | EF |
| 7 | Roberts Mountain | DSrm |
| 9 | Alluvium | Qal |
| 10 | Eureka Quartzite | Oe |
| 16 | Pogonip | Op |
| 20 | Snow Canyon | Osc |
| 25 | McAfee Quartzite | Om |
| 30 | Waterpipe | Mwp |
| 40 | Intrusive | Jki |
| 60 | Volcanics | Tv |
| 94 | No Data | n/a |
| 95 | No Data | n/a |
| 97 | No Recovery | n/a |
| 98 | No Data | n/a |
| 99 | Dump | n/a |
All of the surface and underground holes extracted from acQuire and imported into the Vulcan databases were used for modeling. Any holes that were deemed invalid or incomplete were not extracted and therefore, there was no reason to reject any holes which were in the Vulcan databases.
There are 61 new surface holes at Burns Basin, BB-1442 to BB-1502. Saval has 23 new surface holes, SC-1372 to SC-1394. Starvation has 25 new surface holes, TJ-352 to TJ-373 and STV-U and STV-D. Mahala has 33 new surface holes, MAH-443 to MAH-475. Smith has 21 new surface holes, EM-121 to EM-130, and SH-1203 to SH-1213.
There are 1,048 new underground holes at Smith:
SMI-C20443 to SMI-C20555
SMI-C30410 to SMI-C30448
SMI-C40838 to SMI-C40969
SMI-C50367 to SMI-C50717
| Veris Gold Corp. | |
| NI 43-101 Technical Report Jerritt Canyon Property, Nevada | 14-5 |
SMI-C70766 to SMI-C70890
SMI-C80001 to SMI-C80302
SMI-LX-783 to SMI-LX-825
The SSX model has 209 new underground holes:
SSX-C10046 to SSX-C10117
SSX-C50001 to SSX-C50035
SSX-C70001 to SSX-C70102
Therefore, there are a total of 163 new surface holes and 1,257 new underground holes at Jerritt. The location of the drill holes for each deposit with the new drilling in red is shown in Figures 10.2.2.1 to 10.2.2.12 in Section 10, “Drilling and sampling methodology”. Some of these new drill holes were used in the previous 43-101 report as they were drilled then but not all of the logging or assaying was complete.
Tables 14.2.2 to 14.2.8 show the number of holes and total drilled feet per deposit. Sampled intervals are intervals with gold grade values greater than zero. The underground model SSX includes Saval, Steer, and West Mahala.
| Veris Gold Corp. | |
| NI 43-101 Technical Report Jerritt Canyon Property, Nevada | 14-6 |
Table 14.2.2: Summary of surface drill holes at underground model deposits.
| | Unflagged by 0.1 opt Shell | Flagged by 0.1 opt Shell | Total |
| | | | | | | | | | | |
| | No. of | Length | Length | No. of | Length | Length | Length | No. of | Length | Length |
| Area | Holes | Drilled | Sampled | Holes | Drilled | Sampled | Flagged | Holes | Drilled | Sampled |
| SMITH | 724 | 692,168 | 215,499 | 836 | 804,235 | 390,011 | 33,740 | 1,560 | 1,496,403 | 605,510 |
| SSX | 2,163 | 1,394,439 | 378,011 | 1,200 | 892,235 | 342,014 | 36,631 | 3,363 | 2,286,674 | 720,025 |
| STARV | 98 | 60,271 | 59,019 | 190 | 124,302 | 120,513 | 4,148 | 288 | 184,573 | 179,532 |
| Total | 2,985 | 2,146,878 | 437,030 | 2,226 | 1,820,772 | 852,538 | 74,519 | 5,211 | 3,967,650 | 1,505,067 |
Table 14.2.3: Summary of underground production drill holes at underground model deposits.
| | Unflagged by 0.1 opt Shell | Flagged by 0.1 opt Shell | Total |
| | | | | | | | | | | |
| | No. of | Length | Length | No. of | Length | Length | Length | No. of | Length | Length |
| Area | Holes | Drilled | Sampled | Holes | Drilled | Sampled | Flagged | Holes | Drilled | Sampled |
| SMITH | 1,252 | 144,911 | 92,733 | 7,018 | 782,007 | 623,197 | 298,454 | 8,270 | 926,918 | 715,930 |
| SSX | 5,002 | 483,279 | 212,537 | 16,714 | 1,464,176 | 1,041,807 | 546,134 | 21,716 | 1,947,455 | 1,254,344 |
| Total | 6,254 | 628,190 | 305,270 | 23,732 | 2,246,183 | 1,665,004 | 844,588 | 29,986 | 2,874,373 | 1,970,274 |
| Veris Gold Corp. | |
| NI 43-101 Technical Report Jerritt Canyon Property, Nevada | 14-7 |
Table 14.2.4: Summary of surface drill holes at open pit model deposits.
| | Unflagged by 0.01 opt Shell | Flagged by 0.01 opt Shell | Total |
| | | | | | | | | | | |
| | No. of | Length | Length | No. of | Length | Length | Length | No. of | Length | Length |
| Area | Holes | Drilled | Sampled | Holes | Drilled | Sampled | Flagged | Holes | Drilled | Sampled |
| BURNS | 409 | 200,881 | 188,472 | 940 | 408,186 | 391,353 | 56,156 | 1,350 | 609,437 | 580,065 |
| SAVAL | 787 | 523,431 | 511,020 | 1,932 | 1,076,701 | 1,043,850 | 106,802 | 2,719 | 1,600,132 | 1,554,870 |
| Total | 1,196 | 724,312 | 699,492 | 2,872 | 1,484,887 | 1,435,203 | 162,958 | 4,069 | 2,209,569 | 2,134,935 |
Table 14.2.5: Summary of underground production drill holes at open pit model deposits.
| | Unflagged by 0.01 opt Shell | Flagged by 0.01 opt Shell | Total |
| | | | | | | | | | | |
| | No. of | Length | Length | No. of | Length | Length | Length | No. of | Length | Length |
| Area | Holes | Drilled | Sampled | Holes | Drilled | Sampled | Flagged | Holes | Drilled | Sampled |
| SAVAL | 11,234 | 1,049,750 | 1,040,219 | 1,557 | 192,029 | 189,909 | 117,284 | 12,812 | 1,246,324 | 1,234,580 |
| | | | | | | | | | | |
| Total | 11,234 | 1,049,750 | 1,040,219 | 1,557 | 192,029 | 189,909 | 117,284 | 12,812 | 1,246,324 | 1,234,580 |
| Veris Gold Corp. | |
| NI 43-101 Technical Report Jerritt Canyon Property, Nevada | 14-8 |
Table 14.2.6: Summary of new surface drill holes at underground model deposits.
| | Unflagged by 0.1 opt Shell | Flagged by 0.1 opt Shell | Total |
| | | | | | | | | | | |
| | No. of | Length | Length | No. of | Length | Length | Length | No.of | Length | Length |
| Area | Holes | Drilled | Sampled | Holes | Drilled | Sampled | Flagged | Holes | Drilled | Sampled |
| SMITH | 18 | 22,863 | 14,788 | 16 | 19,268 | 11,188 | 580 | 34 | 42,131 | 25,976 |
| SSX | 17 | 10,560 | 9,440 | 26 | 30,083 | 21,013 | 1080 | 43 | 40,643 | 30,453 |
| STARV | 10 | 4,484 | 3,915 | 15 | 7,917 | 7,617 | 670 | 25 | 12,401 | 11,532 |
| Total | 45 | 37,907 | 28,143 | 57 | 57,268 | 39,818 | 2,330 | 102 | 95,175 | 67,961 |
Table 14.2.7: Summary of new underground production drill holes at underground model deposits.
| | Unflagged by 0.1 opt Shell | Flagged by 0.1 opt Shell | | Total | |
| | | | | | | | | | | |
| | No. of | Length | Length | No. of | Length | Length | Length | No.of | Length | Length |
| Area | Holes | Drilled | Sampled | Holes | Drilled | Sampled | Flagged | Holes | Drilled | Sampled |
| SMITH | 247 | 40,941 | 35,832 | 801 | 111,596 | 107,826 | 35,011 | 1,048 | 152,537 | 143,658 |
| SSX | 105 | 18,135 | 16,120 | 104 | 20,351 | 18,516 | 3,533 | 209 | 38,486 | 34,636 |
| Total | 352 | 59,076 | 51,952 | 905 | 131,947 | 126,342 | 38,544 | 1,257 | 191,023 | 178,294 |
Table 14.2.8: Summary of new surface drill holes at open pit model deposits.
| | Unflagged by 0.01 opt Shell | Flagged by 0.01 opt Shell | Total |
| | | | | | | | | | | |
| | No. of | Length | Length | No. of | Length | Length | Length | No.of | Length | Length |
| Area | Holes | Drilled | Sampled | Holes | Drilled | Sampled | Flagged | Holes | Drilled | Sampled |
| BURNS | 14 | 4,570 | 4,545 | 47 | 19,155 | 18,845 | 2,890 | 61 | 23,725 | 23,390 |
| SAVAL | 7 | 2,660 | 2,620 | 16 | 9,460 | 9,345 | 1,035 | 23 | 12,120 | 11,965 |
| Total | 21 | 7,230 | 7,165 | 63 | 28,615 | 28,190 | 3,925 | 84 | 35,845 | 35,355 |
The raw assay data in the drill holes was used to digitize the grade shell polygons on cross section. Once finished the assays were flagged by the grade shell polygons and the flag name stored in the FLAG field in the assay database. This allowed the high-grade assays to be discerned from the low-grade assays outside of the grade shells. Each deposit has its own naming convention.
Composites were calculated down hole on 5 foot intervals with the composite starting and stopping at each change in the FLAG name. Therefore there is no mixing of composite grades between the high-grade and low-grade assays. Tables 14.5.1 and 14.5.2 in Section 14.5 “Statistics and Variography” show the number of composites for each deposit.
14.3 Geology and grade shell modeling
At Jerritt Canyon, most gold mineralization occurs as lenticular bodies with relatively sharp hanging wall and footwall boundaries. These bodies generally follow the Roberts Mountain (DSrm) to Hanson Creek (Ohc) Formation contact as well as the Hanson Creek 3 (Ohc3) to Hanson Creek 4 (Ohc4) contact. The Hanson Creek Formation (Ohc) is the primary host for gold at Jerritt Canyon.
The gold mineralization is controlled by structures crossing these stratigraphic contacts and the favorable bedded geology at the contacts. In addition, shallow anticline structures allow the mineralization to be trapped and "pond" at the change in bedded geology. These important formation contacts were modeled on 100 foot east-west cross sections prior to modeling the mineralized bodies (grade shells).
| Veris Gold Corp. | |
| NI 43-101 Technical Report Jerritt Canyon Property, Nevada | 14-9 |
The grade shells were modeled on 50 foot and locally 25 foot north-south and east-west cross sections based on the geologic contacts and grade continuity. These grade shells were modeled at a 0.10 opt Au cut off for the underground models and 0.01 opt Au cut off for the surface models using Vulcan software. Where necessary, the 0.10 opt Au grade shells were also used in the surface models. From the cross section polygons, 3-D grade shell solids were built. The grade shell polygons are used to flag the drill hole assays and the grade shell solids are used to build the blocks in the block model.
The location of the grade shells for each of the open pit models are shown below. The red boundary in all plan figures is the block model outline.
Figure 14.3.1: Plan view of 0.01 opt grade shells at Burns Basin.

| Veris Gold Corp. | |
| NI 43-101 Technical Report Jerritt Canyon Property, Nevada | 14-10 |
Figure 14.3.2: Plan view of 0.01 opt and 0.1 opt grade shells at Saval.
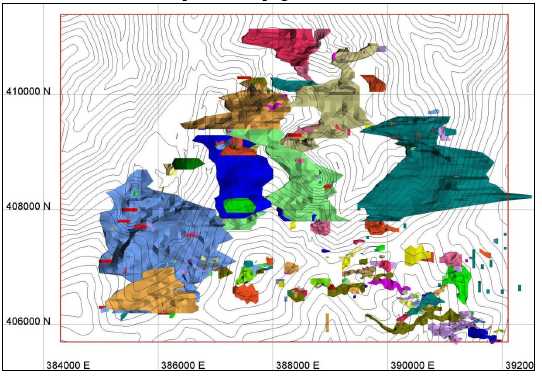
| Veris Gold Corp. | |
| NI 43-101 Technical Report Jerritt Canyon Property, Nevada | 14-11 |
A representative cross section of the 0.01 opt Au grade shell models and the formation contacts for each of the open pit models are shown in figures below.
Figure 14.3.3: Section 400150N of Burns Basin grade shells and formation contacts.
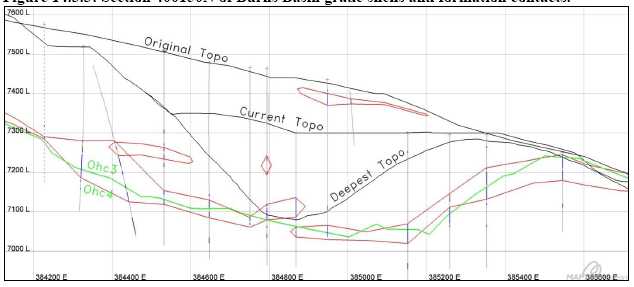
Figure 14.3.4: Section 41085N of Saval grade shells and formation contacts.
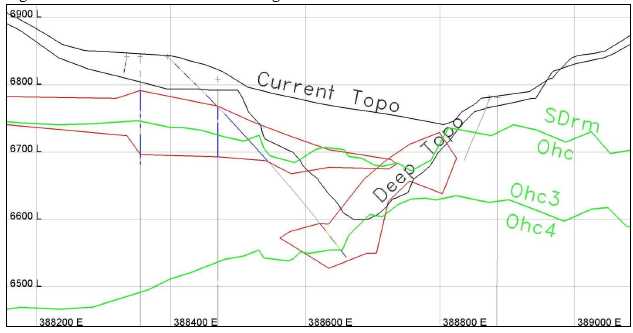
| Veris Gold Corp. | |
| NI 43-101 Technical Report Jerritt Canyon Property, Nevada | 14-12 |
The location of the 0.10 opt Au grade shells for each of the underground models is shown in the figures below.
Figure 14.3.5: Plan view of 0.1 opt grade shells at Saval, Steer-SSX, and West Mahala.
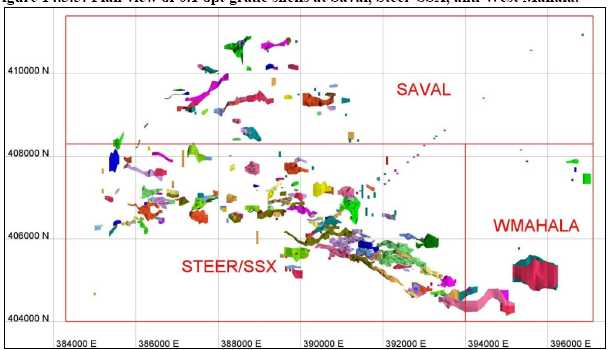
Figure 14.3.6: Plan view of 0.1 opt grade shells at Smith.
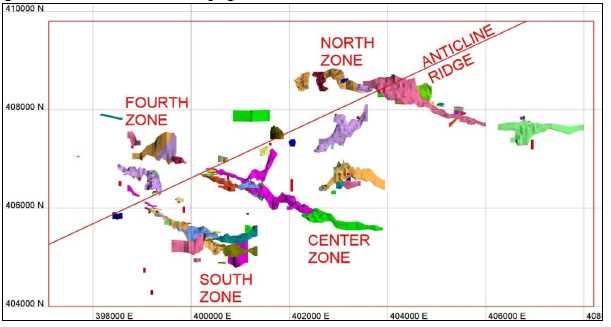
| Veris Gold Corp. | |
| NI 43-101 Technical Report Jerritt Canyon Property, Nevada | 14-13 |
Figure 14.3.7: Plan view of 0.1 opt grade shells at Starvation.
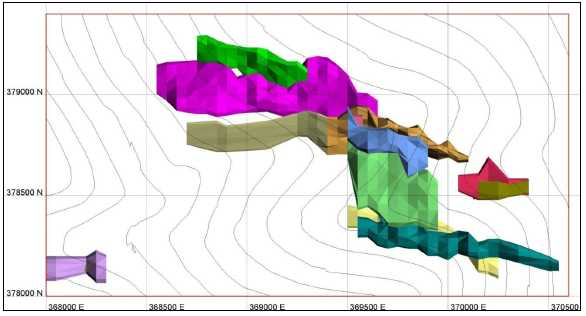
A representative cross section of the 0.1 opt Au grade shell models and the formation contacts for each of the underground models are shown in figures below.
Figure 14.3.8: Section 406975N of Smith grade shells and formation contacts.
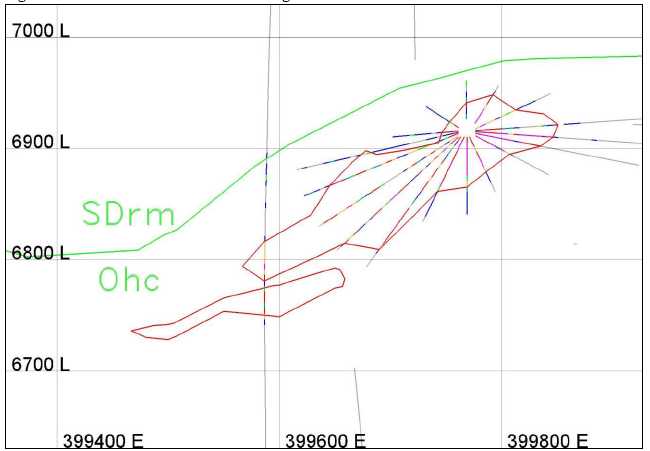
| Veris Gold Corp. | |
| NI 43-101 Technical Report Jerritt Canyon Property, Nevada | 14-14 |
Figure 14.3.9: Section 369800E of Starvation grade shells and formation contacts.
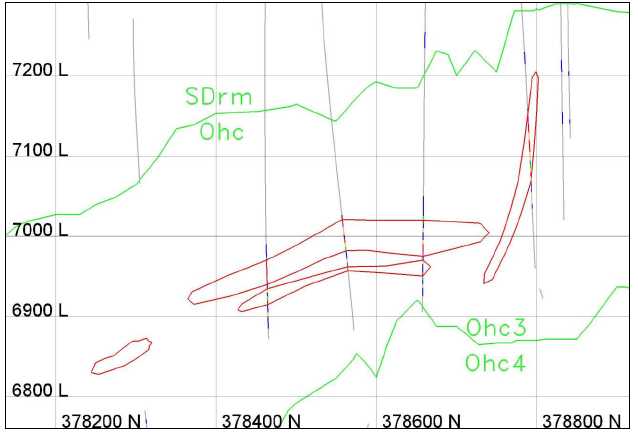
Figure 14.3.10: Section 393600E of Steer-SSX grade shells and formation contacts.
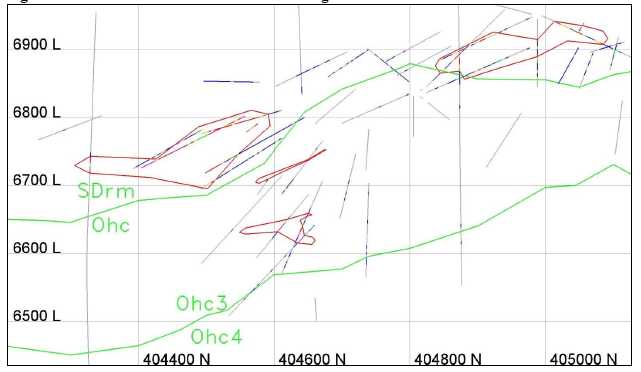
| Veris Gold Corp. | |
| NI 43-101 Technical Report Jerritt Canyon Property, Nevada | 14-15 |
Figure 14.3.11: Section 395175E of West Mahala grade shells and formation contacts.
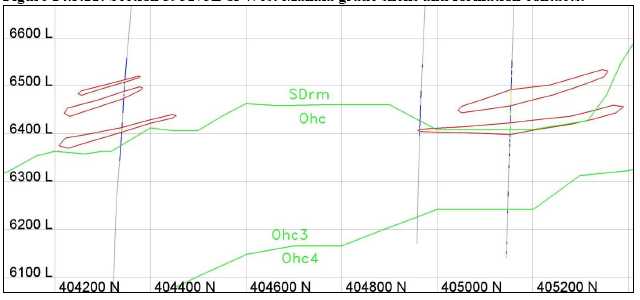
The Burns Basin model consists of 18 major 0.01 opt Au grade shells and a few small shells, which generally trend north-south following the SDrm to Ohc contact and the Ohc3 to Ohc4 contact.
The Saval open pit model consists of 23 main 0.01 opt Au grade shells, which generally trend north-northwest. Internal to the 0.01 opt grade shells are the 0.1 opt grade shells used in the SSX underground model. The grade shells generally follow the DSrm (Roberts Mountain) to Ohc (Hanson Creek) contact and migrate through Ohc to the Ohc3-Ohc4 contact.
The Smith model consists of 123 0.1 opt Au grade shells, which generally trend northwest along three main zones and a fourth smaller zone. An anticline ridge intersects the three zones along a northeast strike. The northern-most zone plunges shallowly away from the anticline ridge intersection and dips gently to the north. The center and southern zones only plunge southeast from the anticline ridge and dip shallowly in all directions. The fourth zone is northwest of the anticline ridge line and between the central and south zones. The fourth zone dips to the north-northwest. Therefore the grade shells all together define an anticline which trends northeast-southwest which intersects three main northwest trending mineralized zones which plunge gently away from the anticline ridge.
The Starvation model consists of 13 main 0.01 opt Au grade shells and 10 main 0.1 opt Au grade shells, which generally trend east-west with a northwest trending structure which contorts and steepens the grade shells on the northern edge and steepens the dip to near vertical in the east. The grade shells generally follow the DSrm (Roberts Mountain) to Ohc (Hanson Creek) contact and exist within Ohc to the Ohc3-Ohc4 contact. The grade shells range in depth from 6,800 to 7,200 feet in elevation.
The SSX model consists of 204 main 0.1 opt Au grade shells, which generally trend east-west with a northwest trending anticline in the SSX deposit. The grade shells generally follow the DSrm (Roberts Mountain) to Ohc (Hanson Creek) contact and migrate through Ohc to the Ohc3-Ohc4 contact
The West Mahala model, which is the SE corner of the SSX mode,l consists of 9 main 0.1 opt Au grade shells, which generally trend east-west following the SDrm to Ohc contact.
All grade shell solids are modeled using all data and are not altered for depletion due to mining. Depletion is accounted for during the block model process.
| Veris Gold Corp. | |
| NI 43-101 Technical Report Jerritt Canyon Property, Nevada | 14-16 |
14.4 Specific gravity and density
The tonnage factor used for all Jerritt Canyon intact rock is 12.6 cubic feet per ton which is a density of 0.0794 tons per cubic foot. No distinction is currently made for variations in lithology, while it is recognized that significant differences may occur within various units at each mine.
The factor is based on testing done in 2000 at the University of Nevada, Reno and Chemex lab on a total of 67 samples. The weighted tonnage factor returned on the samples was 12.616. Since then 50 samples from Smith Zone 4 (Mahala) and 5 samples from Steer were analyzed by Zonge Engineering and Research of Tucson, Arizona. The average for Smith Zone 4 was 12.45 cubic feet per ton, which is slightly heavier than the average used for all the mines and the average for Steer was 13.0 cubic feet per ton, which is slightly lighter.
Additional tests were conducted in 2005 on 22 ore grade samples and 24 waste samples from Starvation Canyon. The results were 11.8 cubic feet per ton for the ore grade samples and 12.2 for the waste samples, both of which are heavier than the 12.6 cubic feet per ton average used at the other mines. However, for the December 31, 2012 resource and reserve calculation, Starvation Canyon intact rock was assigned a conservative density of 0.0794 which is similar to all of the other Jerritt Canyon deposits.
The tonnage factor for dump and stockpile material on the surface is 17.6 cubic feet per ton or a density of 0.0568 tons per cubic foot.
The tonnage factor for cemented rock fill used underground is 15.4 cubic feet per ton or a density of 0.0649 tons per cubic foot.
Resources at Road Canyon hosted in near-surface colluvial material used a tonnage factor of 17.5 ft3/ton to better represent swelling and pore space in the unconsolidated material.
| Veris Gold Corp. | |
| NI 43-101 Technical Report Jerritt Canyon Property, Nevada | 14-17 |
14.5 Statistics and variography
Univariate and basic statistics were calculated for gold for each deposit using the 5-foot composite samples within the grade shells. The statistics for the open pit models are in Table 14.5.1 and the histogram and cumulative frequency plots are in Figures 14.5.1 and 14.5.2. Statistics for the underground models are in Table 14.5.2 and the histogram and cumulative frequency plots are in Figures 14.5.3 to 14.5.5. The Saval, Steer-SSX, and West Mahala statistics were calculated together as they are combined in the same block model named collectively SSX. The composites consist of both surface and underground drilling.
Table 14.5.1: Summary of statistics by open pitmodel.
| Model | #Comps | Min | Max | Mean | Std Dev | Coeff of Var |
| Burns Basin | 9,330 | 0.0005 | 3.2440 | 0.0696 | 0.1597 | 2.2936 |
| Mill Creek | 2,514 | 0.0005 | 1.6000 | 0.0832 | 0.1410 | 1.6951 |
| Pie Creek | 767 | 0.0009 | 0.3550 | 0.0493 | 0.0569 | 1.1552 |
| Road Canyon | 156 | 0.0020 | 0.2600 | 0.0416 | 0.0499 | 1.1984 |
| Saval | 24,482 | 0.0002 | 1.8070 | 0.0404 | 0.0477 | 1.1800 |
| Wright Window | 892 | 0.0010 | 0.9000 | 0.0543 | 0.0722 | 1.3295 |
Table 14.5.2: Summary of statistics by underground model.
| Model | #Comps | Min | Max | Mean | Std Dev | Coeff of Var |
| California Mtn | 17 | 0.0660 | 0.9390 | 0.2741 | 0.2428 | 0.8856 |
| Murray | 3,145 | 0.0006 | 3.4380 | 0.2065 | 0.2420 | 1.1720 |
| Smith | 60,819 | 0.0001 | 7.1900 | 0.2313 | 0.2897 | 1.2527 |
| SSX | 119,834 | 0.0002 | 50.2590 | 0.2574 | 0.3076 | 1.1950 |
| Starvation | 617 | 0.0020 | 1.3350 | 0.2828 | 0.2001 | 0.7074 |
| Winters Creek | 601 | 0.0008 | 1.4720 | 0.2098 | 0.1614 | 0.7691 |
| Veris Gold Corp. | |
| NI 43-101 Technical Report Jerritt Canyon Property, Nevada | 14-18 |
Figure 14.5.1: Burns Basin gold histogram and cumulative frequency plot.
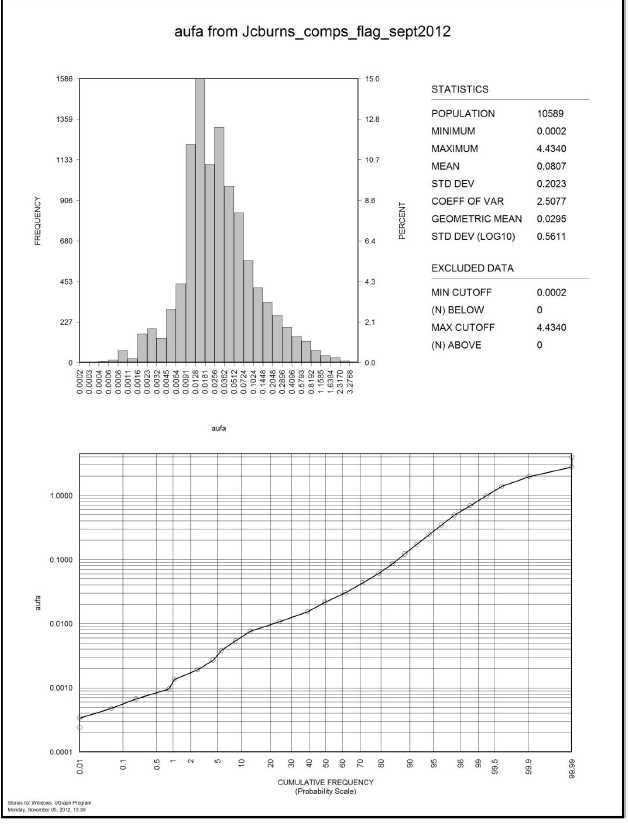
| Veris Gold Corp. | |
| NI 43-101 Technical Report Jerritt Canyon Property, Nevada | 14-19 |
Figure 14.5.2: Saval gold histogram and cumulative frequency plot.
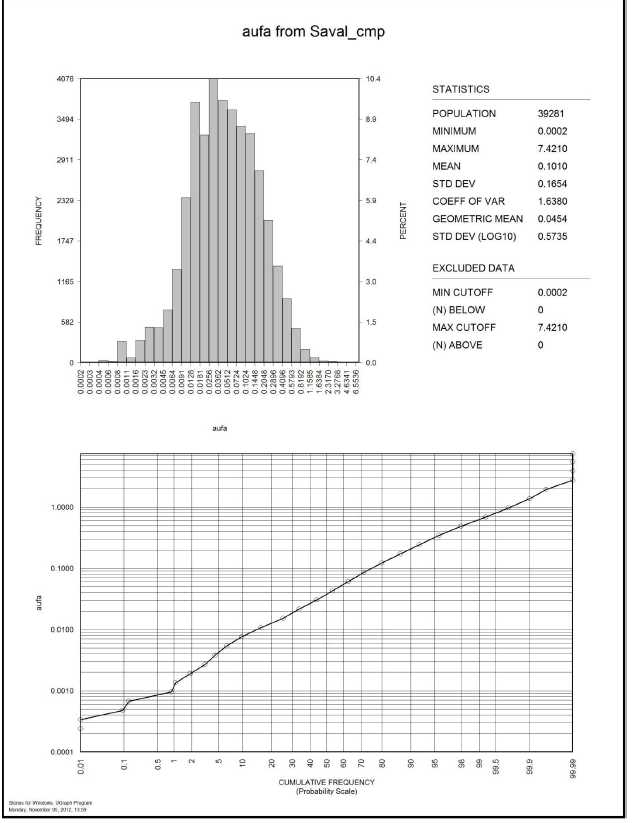
| Veris Gold Corp. | |
| NI 43-101 Technical Report Jerritt Canyon Property, Nevada | 14-20 |
Figure 14.5.3: Smith gold histogram and cumulative frequency plot.
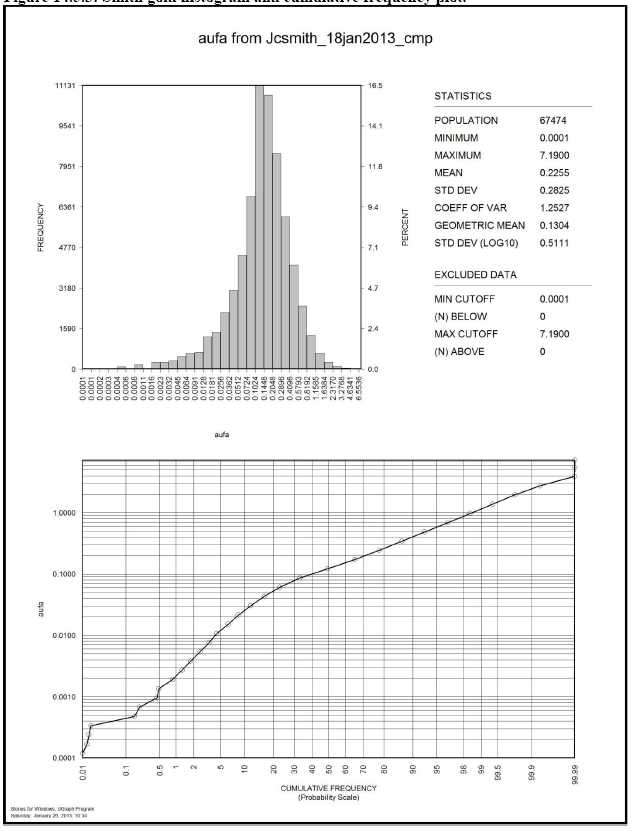
| Veris Gold Corp. | |
| NI 43-101 Technical Report Jerritt Canyon Property, Nevada | 14-21 |
Figure 14.5.4: SSX gold histogram and cumulative frequency plot.

| Veris Gold Corp. | |
| NI 43-101 Technical Report Jerritt Canyon Property, Nevada | 14-22 |
Figure 14.5.5: Starvation gold histogram and cumulative frequency plot.
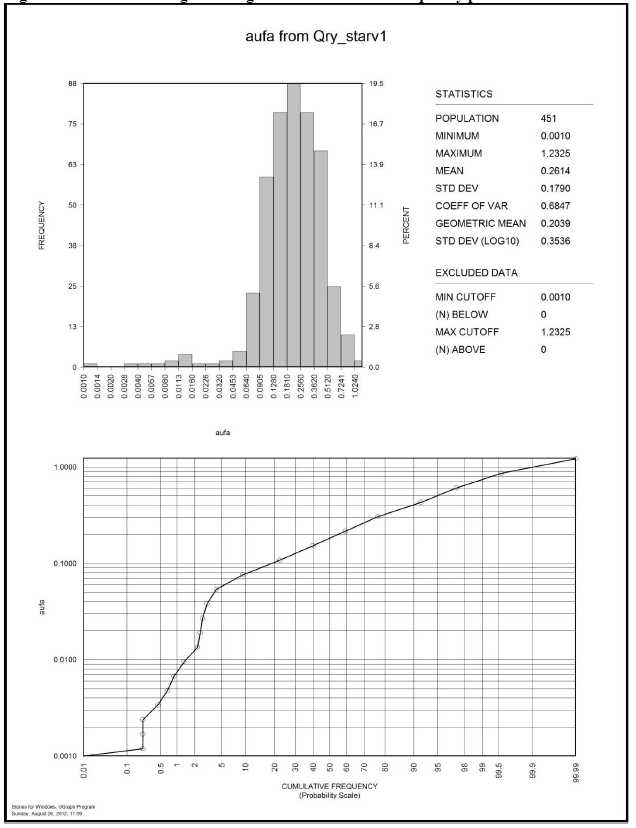
| Veris Gold Corp. | |
| NI 43-101 Technical Report Jerritt Canyon Property, Nevada | 14-23 |
14.5.1 Grade capping
A cap grade was determined from the grade shell composites for each deposit. The composites are plotted in Excel in descending order of grade and the cap grade picked from the graph. The cap grade is used during estimation as described in Section 14.7 “Gold grade estimation and block calculations.” Table 14.5.1.1 shows the cap for the open pit models and Table 14.5.1.2 shows the cap for the underground models. As discussed previously, underground models Saval, Steer-SSX, and West Mahala are all in one SSX block model. Figure 14.5.1.1 shows a representative graph for the Smith model.
Table 14.5.1.1: Cap grade by open pit model.
Model | Cap
Grade | #Comps
Affected | X
Limit | Y
Limit | Z
Limit |
Burns Basin
Saval | 1.80
0.535 | 11
32 | 10
10 | 10
10 | 10
10 |
Table 14.5.1.2: Cap grade by underground model.
Model | Cap
Grade | #Comps
Affected | X
Limit | Y
Limit | Z
Limit |
Smith
SSX
Starvation | 3.50
3.20
0.80 | 31
14
9 | 10
10
10 | 10
10
10 | 10
10
10 |
Figure 14.5.1.1: Smith cap grade plot.
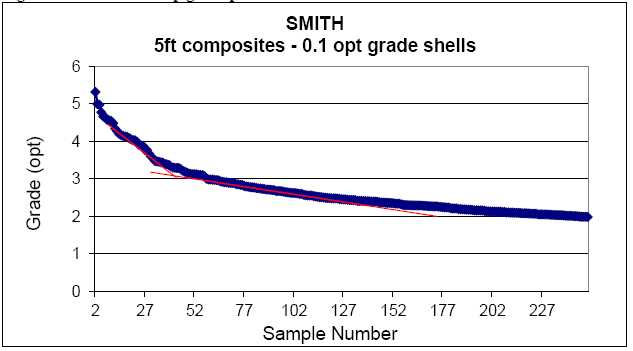
14.5.2 Variography
Variograms were generated in the SAGE2001 software from the 5 foot composites within the grade shells for two open pit models, Burns Basin and Saval, and three underground models, Smith, SSX (Saval, Steer-SSX, West Mahala), and Starvation. These models have production data or otherwise closely spaced data, which warrants variogram calculation and ordinary kriging estimation.
| Veris Gold Corp. | |
| NI 43-101 Technical Report Jerritt Canyon Property, Nevada | 14-24 |
The variograms were modeled in SAGE using the exponential model option with a practical range. The variogram model is output from SAGE using the custom LLL-ZYX option. The model data for the two structures is entered into the Vulcan estimation parameters as the kriging weights for the ordinary kriging estimation of gold. Table 14.5.2.1 below shows the Vulcan kriging estimation parameters per model and Tables 14.5.2.2 to 14.5.2.6 show the variogram parameter output files from SAGE. Figures 14.5.2.1 to 14.5.2.15 contain the variogram plots.
Table 14.5.2.1: Vulcan ordinary kriging input parameters by model.
| Deposit | Structure | Nugget | Sill Diff | Bearing | Plunge | Dip | Major (ft) | Semi (ft) | Minor (ft) |
| Smith | 1 | 0.168 | 0.625 | 64 | 76 | 54 | 25 | 23 | 31 |
| Smith | 2 | 0.168 | 0.207 | 24 | -2 | 55 | 57 | 130 | 508 |
| SSX | 1 | 0.214 | 0.714 | 93 | 76 | -36 | 21 | 23 | 25 |
| SSX | 2 | 0.214 | 0.072 | 118 | -85 | 5 | 164 | 280 | 686 |
| Starv | 1 | 0.034 | 0.625 | 100 | -3 | 132 | 230 | 50 | 37 |
| Starv | 2 | 0.034 | 0.340 | 85 | -42 | 59 | 496 | 154 | 49 |
| Burns | 1 | 0.174 | 0.647 | 145 | 30 | 89 | 63 | 53 | 25 |
| Burns | 2 | 0.174 | 0.179 | 108 | 79 | 137 | 123 | 209 | 689 |
| Saval | 1 | 0.211 | 0.732 | 68 | 0 | 36 | 12 | 24 | 29 |
| Saval | 2 | 0.211 | 0.057 | 40 | -3 | 13 | 312 | 447 | 809 |
Table 14.5.2.2: Smith variogram parameters.
| Nugget ==> 0.168 |
| C1 ==> 0.625 |
| C2 ==> 0.207 |
| |
| First Structure -- Exponential with Practical Range |
| |
| 1st rotation about the Z axis ==> -26 |
| 2nd rotation about the Y' axis ==> 76 |
| 3rd rotation about the X' axis ==> 54 |
| Range along the Z' axis 31.4 Azimuth 299 Dip 8 |
| Range along the Y' axis 22.6 Azimuth 27 Dip -11 |
| Range along the X' axis 25.2 Azimuth 64 Dip 76 |
| |
| Second Structure -- Exponential with Practical Range |
| |
| 1st rotation about the Z axis ==> -66 |
| 2nd rotation about the Y' axis ==> -2 |
| 3rd rotation about the X' axis ==> 55 |
| Range along the Z' axis 508.2 Azimuth 295 Dip 35 |
| Range along the Y' axis 130.4 Azimuth 291 Dip -55 |
| Range along the X' axis 56.6 Azimuth 24 Dip -2 |
| Veris Gold Corp. | |
| NI 43-101 Technical Report Jerritt Canyon Property, Nevada | 14-25 |
Figure 14.5.2.1: Smith downhole variogram.
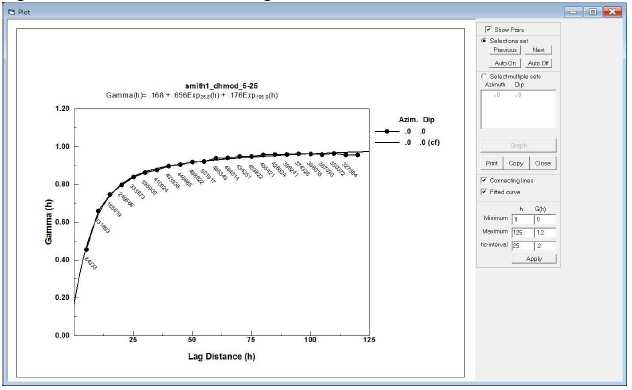
Figure 14.5.2.2: Smith modeled variogram (120,-15).

| Veris Gold Corp. | |
| NI 43-101 Technical Report Jerritt Canyon Property, Nevada | 14-26 |
Figure 14.5.2.3: Smith modeled variogram (270,-45).
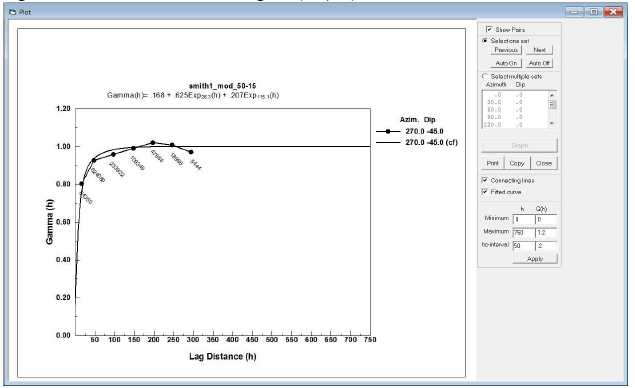
Table 14.5.2.3: SSX variogram parameters.
| Nugget ==> 0.214 |
| C1 ==> 0.714 |
| C2 ==> 0.072 |
| |
| First Structure -- Exponential with Practical Range |
| |
| 1st rotation about the Z axis ==> 3 |
| 2nd rotation about the Y' axis ==> 76 |
| 3rd rotation about the X' axis ==> -36 |
| Range along the Z' axis 25.2 Azimuth 236 Dip 11 |
| Range along the Y' axis 23.0 Azimuth 328 Dip 8 |
| Range along the X' axis 20.8 Azimuth 93 Dip 76 |
| |
| Second Structure -- Exponential with Practical Range |
| |
| 1st rotation about the Z axis ==> 28 |
| 2nd rotation about the Y' axis ==> -85 |
| 3rd rotation about the X' axis ==> 5 |
| Range along the Z' axis 685.7 Azimuth 113 Dip 5 |
| Range along the Y' axis 280.4 Azimuth 23 Dip -0 |
| Range along the X' axis 164.4 Azimuth 118 Dip -85 |
| Veris Gold Corp. | |
| NI 43-101 Technical Report Jerritt Canyon Property, Nevada | 14-27 |
Figure 14.5.2.4: SSX downhole variogram.
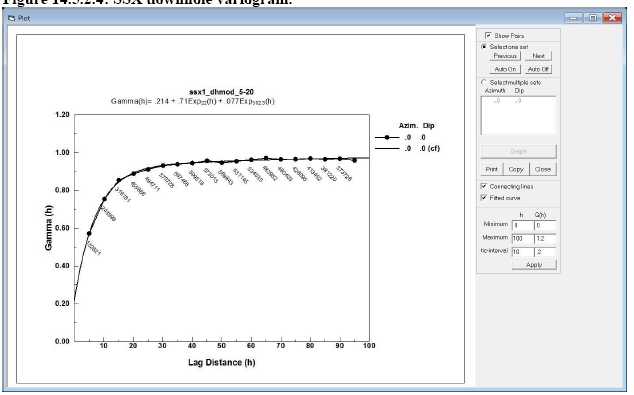
Figure 14.5.2.5: SSX modeled variogram (90,0).
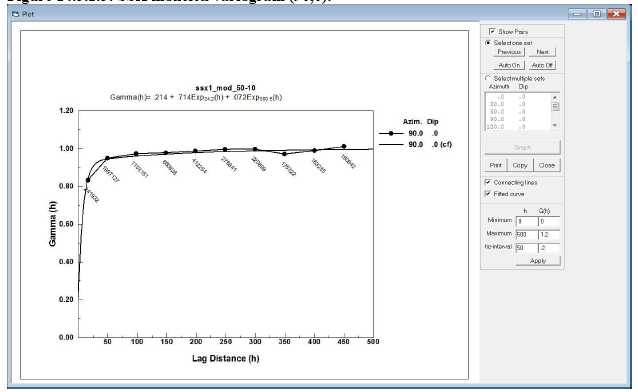
| Veris Gold Corp. | |
| NI 43-101 Technical Report Jerritt Canyon Property, Nevada | 14-28 |
Figure 14.5.2.6: SSX modeled variogram (180,-30).
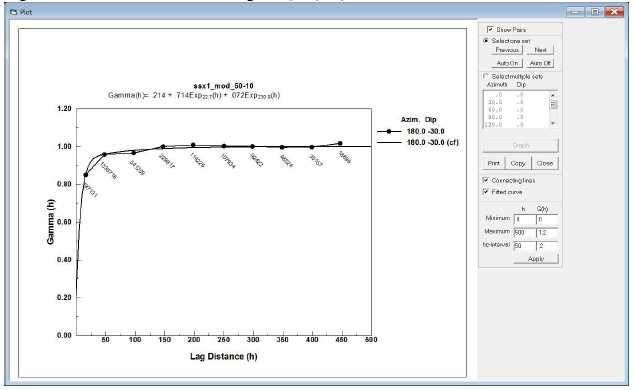
Table 14.5.2.4: Starvation variogram parameters.
| Nugget ==> 0.034 |
| C1 ==> 0.625 |
| C2 ==> 0.340 |
| |
| First Structure -- Exponential with Practical Range |
| |
| 1st rotation about the Z axis ==> 10 |
| 2nd rotation about the Y' axis ==> -3 |
| 3rd rotation about the X' axis ==> 132 |
| Range along the Z' axis 37.4 Azimuth 7 Dip -42 |
| Range along the Y' axis 50.6 Azimuth 193 Dip -48 |
| Range along the X' axis 229.7 Azimuth 100 Dip -3 |
| |
| Second Structure -- Exponential with Practical Range |
| |
| 1st rotation about the Z axis ==> -5 |
| 2nd rotation about the Y' axis ==> -42 |
| 3rd rotation about the X' axis ==> 59 |
| Range along the Z' axis 48.8 Azimuth 17 Dip 22 |
| Range along the Y' axis 154.1 Azimuth 306 Dip -39 |
| Range along the X' axis 496.4 Azimuth 85 Dip -42 |
| Veris Gold Corp. | |
| NI 43-101 Technical Report Jerritt Canyon Property, Nevada | 14-29 |
Figure 14.5.2.7: Starvation downhole variogram.
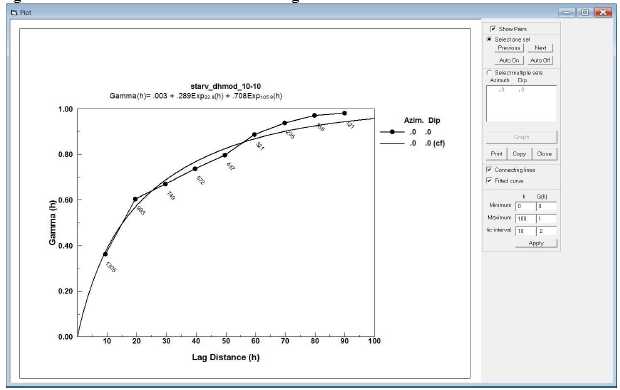
Figure 14.5.2.8: Starvation modeled variogram (270,-15).
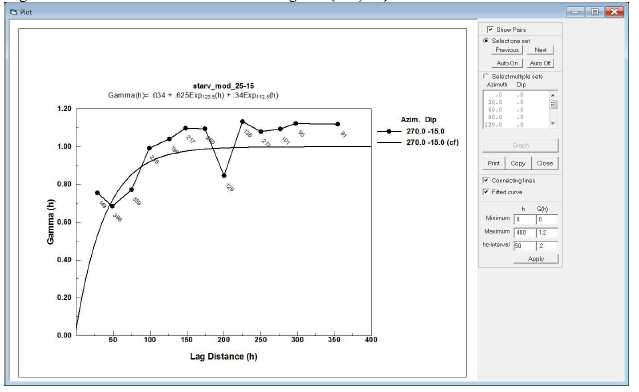
| Veris Gold Corp. | |
| NI 43-101 Technical Report Jerritt Canyon Property, Nevada | 14-30 |
Figure 14.5.2.9: Starvation modeled variogram (120,-15).
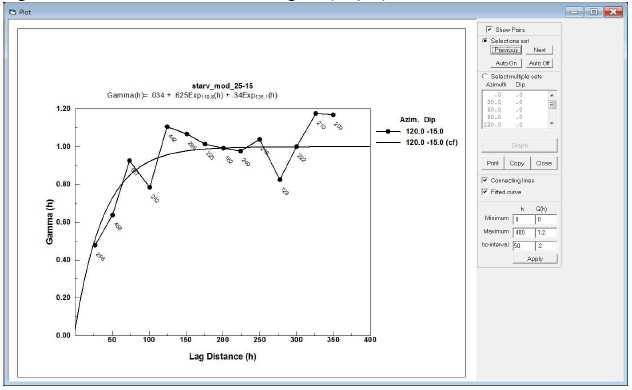
Table 14.5.2.5: Burns Basin variogram parameters.
| Nugget ==> 0.174 |
| C1 ==> 0.647 |
| C2 ==> 0.179 |
| |
| First Structure -- Exponential with Practical Range |
| |
| 1st rotation about the Z axis ==> 55 |
| 2nd rotation about the Y' axis ==> 30 |
| 3rd rotation about the X' axis ==> 89 |
| Range along the Z' axis 24.9 Azimuth 55 Dip 1 |
| Range along the Y' axis 53.2 Azimuth 144 Dip -60 |
| Range along the X' axis 63.4 Azimuth 145 Dip 30 |
| |
| Second Structure -- Exponential with Practical Range |
| |
| 1st rotation about the Z axis ==> 18 |
| 2nd rotation about the Y' axis ==> 79 |
| 3rd rotation about the X' axis ==> 137 |
| Range along the Z' axis 689.5 Azimuth 64 Dip -8 |
| Range along the Y' axis 209.4 Azimuth 155 Dip -8 |
| Range along the X' axis 122.6 Azimuth 108 Dip 79 |
| Veris Gold Corp. | |
| NI 43-101 Technical Report Jerritt Canyon Property, Nevada | 14-31 |
Figure 14.5.2.10: Burn Basin downhole variogram.
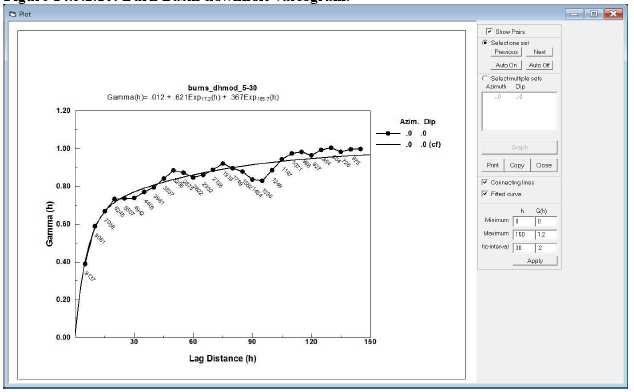
Figure 14.5.2.11: Burns Basin modeled variogram (150,0).

| Veris Gold Corp. | |
| NI 43-101 Technical Report Jerritt Canyon Property, Nevada | 14-32 |
Figure 14.5.2.12: Burns Basin modeled variogram (210,-15).
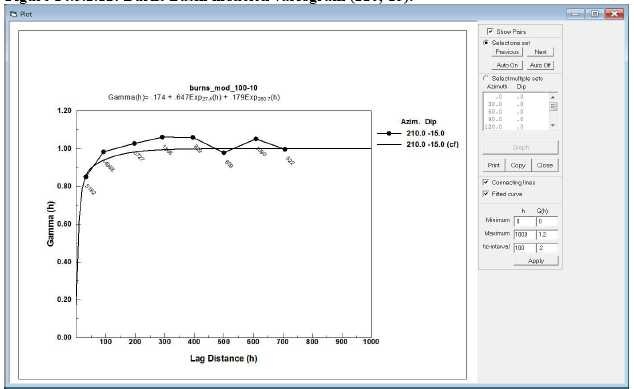
Table 14.5.2.6: Saval variogram parameters.
| Nugget ==> 0.211 |
| C1 ==> 0.732 |
| C2 ==> 0.057 |
| |
| First Structure -- Exponential with Practical Range |
| |
| 1st rotation about the Z axis ==> -22 |
| 2nd rotation about the Y' axis ==> -0 |
| 3rd rotation about the X' axis ==> 36 |
| Range along the Z' axis 28.8 Azimuth 338 Dip 54 |
| Range along the Y' axis 24.3 Azimuth 338 Dip -36 |
| Range along the X' axis 11.8 Azimuth 68 Dip -0 |
| |
| Second Structure -- Exponential with Practical Range |
| |
| 1st rotation about the Z axis ==> -50 |
| 2nd rotation about the Y' axis ==> -3 |
| 3rd rotation about the X' axis ==> 13 |
| Range along the Z' axis 808.7 Azimuth 321 Dip 77 |
| Range along the Y' axis 447.1 Azimuth 309 Dip -13 |
| Range along the X' axis 312.5 Azimuth 40 Dip -3 |
| Veris Gold Corp. | |
| NI 43-101 Technical Report Jerritt Canyon Property, Nevada | 14-33 |
Figure 14.5.2.13: Saval downhole variogram.
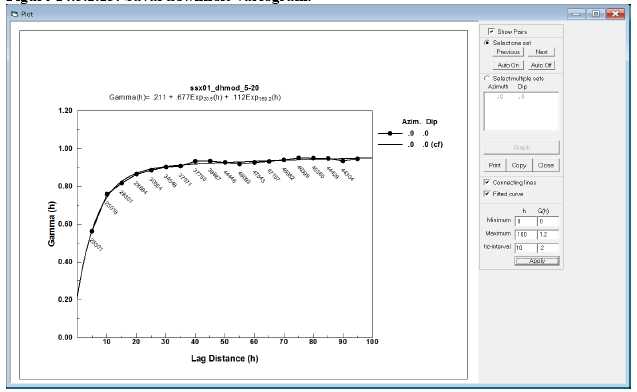
Figure 14.5.2.14: Saval modeled variogram (150,-15).
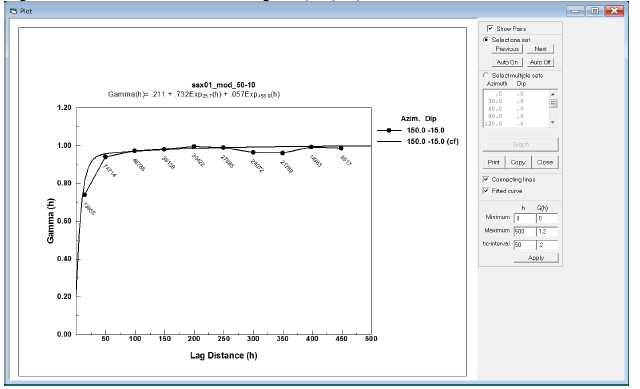
| Veris Gold Corp. | |
| NI 43-101 Technical Report Jerritt Canyon Property, Nevada | 14-34 |
Figure 14.5.2.15: Saval modeled variogram (330,-30).
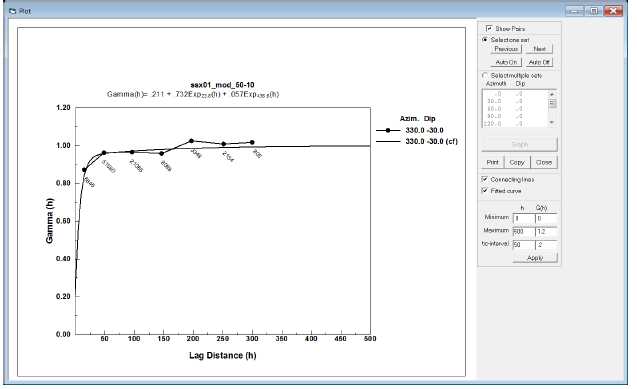
| Veris Gold Corp. | |
| NI 43-101 Technical Report Jerritt Canyon Property, Nevada | 14-35 |
14.6 Block modeling
New block models were created for each of the two open pit deposits. Three block models were also created for the underground deposits with the SSX block model encompassing the Saval, Steer-SSX, and West Mahala underground deposits. All of the block models were created in Vulcan Software for this NI 43-101.
The block model file names for the open pit models are:
jcburns_eng_sept2012.bmf
jcsaval_eng_sept2012.bmf
The block model file names for the underground models are:
jcsmith_eng_jan2013.bmf
jcssx_eng_jan2013.bmf
jcstarv_final_aug2012.bmf
Details from the header files of the 5 block models are given in tables below.
Table 14.6.1: Burns Basin block model details.
| Model name : jcburns_eng_sept2012 |
| History list : jcburns2026Sep2012.bhst |
| Format : extended |
| Structure : regular |
| Smooth : no |
| Number of blocks : 4509375 |
| Number of variables : 5 |
| Origin : 0.000000 0.000000 0.000000 |
| Number of schemas : 1 |
| Origin : 0.000000 0.000000 0.000000 |
| Bearing/Dip/Plunge : 90.000000 0.000000 0.000000 |
| Created on : Wed Sep 26 22:55:43 2012 |
| Last modified on : Wed Sep 26 23:44:14 2012 |
| Model is indexed. |
| |
| Variables Default Type Description |
| ------------------------------------------------------ |
| au_ok -99.0 float average au_ok / denvar density |
| density -99.0 float average density |
| zone none name zone |
| fm none name fm |
| classname none name class |
| volume - predefined |
| xlength - predefined |
| ylength - predefined |
| zlength - predefined |
| xcentre - predefined |
| ycentre - predefined |
| zcentre - predefined |
| xworld - predefined |
| yworld - predefined |
| zworld - predefined |
| Veris Gold Corp. | |
| NI 43-101 Technical Report Jerritt Canyon Property, Nevada | 14-36 |
| Translation Tables : |
| -------------------- |
| |
| zone : |
| none = 0 |
| bb01 = 1 |
| dump = 2 |
| air = 3 |
| |
| fm : |
| none = 0 |
| oe = 1 |
| ohc4 = 2 |
| ohc3 = 3 |
| sdrm = 4 |
| dump = 5 |
| air = 6 |
| osc = 7 |
| |
| classname : |
| none = 0 |
| inf = 1 |
| ind = 2 |
| meas = 3 |
| |
| Schema <parent> |
| Offset minimum : 382700.000000 398700.000000 6700.000000 |
| maximum : 389200.000000 402400.000000 8200.000000 |
| Blocks minimum : 20.000000 20.000000 20.000000 |
| maximum : 20.000000 20.000000 20.000000 |
| No of blocks : 325 185 75 |
Table 14.6.2: Saval open pit block model details.
| Model name : jcsaval_eng_sept2012 |
| History list : saval2025Sep2012.bhst |
| Format : extended |
| Structure : regular |
| Smooth : no |
| Number of blocks : 12226500 |
| Number of variables : 5 |
| Number of schemas : 1 |
| Origin : 384300.000000 405700.000000 6200.000000 |
| Bearing/Dip/Plunge : 90.000000 0.000000 0.000000 |
| Created on : Tue Sep 25 08:33:24 2012 |
| Last modified on : Tue Sep 25 09:51:48 2012 |
| Model is indexed. |
| |
| Variables Default Type Description |
| ------------------------------------------------------ |
| Veris Gold Corp. | |
| NI 43-101 Technical Report Jerritt Canyon Property, Nevada | 14-37 |
| au_ok -99.0 double average au_ok / denvar density |
| density -99.0 float average density |
| zone none name zone |
| fm none name fm |
| classname none name class |
| volume - predefined |
| xlength - predefined |
| ylength - predefined |
| zlength - predefined |
| xcentre - predefined |
| ycentre - predefined |
| zcentre - predefined |
| xworld - predefined |
| yworld - predefined |
| zworld - predefined |
| |
| Translation Tables : |
| -------------------- |
| |
| zone : |
| none = 0 |
| au01 = 1 |
| au1 = 2 |
| asb = 3 |
| |
| fm : |
| none = 0 |
| oe = 1 |
| ohc4 = 2 |
| osc = 3 |
| ohc3 = 4 |
| sdrm = 5 |
| dump = 6 |
| air = 7 |
| |
| classname : |
| none = 0 |
| ind = 1 |
| inf = 2 |
| meas = 3 |
| |
| Schema <parent> |
| Offset minimum : 0.000000 0.000000 0.000000 |
| maximum : 7800.000000 5700.000000 2200.000000 |
| Blocks minimum : 20.000000 20.000000 20.000000 |
| maximum : 20.000000 20.000000 20.000000 |
| No of blocks : 390 285 110 |
| Veris Gold Corp. | |
| NI 43-101 Technical Report Jerritt Canyon Property, Nevada | 14-38 |
Table 14.6.3: Smith block model details.
| Model name : C:\jcsmith_eng_jan2013 |
| History list : jcsmith_add3_fmshellasb_topo23Jan2013.bhst |
| Format : extended |
| Structure : non-regular |
| Smooth : no |
| Number of blocks : 3836035 |
| Number of variables : 6 |
| Number of schemas : 2 |
| Origin : 0.000000 0.000000 0.000000 |
| Bearing/Dip/Plunge : 90.000000 0.000000 0.000000 |
| Created on : Wed Jan 23 14:18:56 2013 |
| Last modified on : Wed Jan 23 22:49:10 2013 |
| Model is indexed. |
| |
| Variables Default Type Description |
| ------------------------------------------------------ |
| zone none name ore zone |
| mined none name intact or asb |
| classname none name meas ind inf |
| au_ok -99.0 float ordinary kriging |
| density -99.0 float density |
| class -99.0 float 1=meas 2=ind 3=inf |
| volume - predefined |
| xlength - predefined |
| ylength - predefined |
| zlength - predefined |
| xcentre - predefined |
| ycentre - predefined |
| zcentre - predefined |
| xworld - predefined |
| yworld - predefined |
| zworld - predefined |
| |
| Translation Tables : |
| -------------------- |
| |
| zone : |
| none = 0 |
| au1 = 1 |
| au01 = 2 |
| asb = 3 |
| dump = 4 |
| air = 5 |
| |
| mined : |
| none = 0 |
| asb = 1 |
| intact = 2 |
| steril = 3 |
| Veris Gold Corp. | |
| NI 43-101 Technical Report Jerritt Canyon Property, Nevada | 14-39 |
| classname : |
| none = 0 |
| inf = 1 |
| ind = 2 |
| meas = 3 |
| |
| Schema <parent> |
| Offset minimum : 397100.000000 404000.000000 6100.000000 |
| maximum : 408200.000000 409800.000000 8000.000000 |
| Blocks minimum : 100.000000 100.000000 100.000000 |
| maximum : 100.000000 100.000000 100.000000 |
| No of blocks : 111 58 19 |
| |
| Schema <subblocking_2> |
| Offset minimum : 397100.000000 404000.000000 6100.000000 |
| maximum : 408200.000000 409800.000000 8000.000000 |
| Blocks minimum : 5.000000 5.000000 5.000000 |
| maximum : 100.000000 100.000000 100.000000 |
| No of blocks : 2220 1160 380 |
Table 14.6.4: SSX block model details.
| Model name : C:\jcssx_eng_jan2013 |
| History list : jcssx_add3_fmshellasb_topo20Jan2013.bhst |
| Format : extended |
| Structure : non-regular |
| Smooth : no |
| Number of blocks : 12343063 |
| Number of variables : 6 |
| Number of schemas : 2 |
| Origin : 0.000000 0.000000 0.000000 |
| Bearing/Dip/Plunge : 90.000000 0.000000 0.000000 |
| Created on : Sun Jan 20 13:34:15 2013 |
| Last modified on : Wed Jan 23 06:34:34 2013 |
| Model is indexed. |
| |
| Variables Default Type Description |
| ------------------------------------------------------ |
| zone none name ore zone |
| mined none name intact or mined |
| classname none name meas ind inf |
| au_ok -99.0 float ordinary kriging |
| density -99.0 float density |
| class -99.0 float 1=meas 2=ind 3=inf |
| volume - predefined |
| xlength - predefined |
| ylength - predefined |
| zlength - predefined |
| xcentre - predefined |
| ycentre - predefined |
| Veris Gold Corp. | |
| NI 43-101 Technical Report Jerritt Canyon Property, Nevada | 14-40 |
| zcentre - predefined |
| xworld - predefined |
| yworld - predefined |
| zworld - predefined |
| |
| Translation Tables : |
| -------------------- |
| |
| zone : |
| none = 0 |
| au01 = 1 |
| au1 = 2 |
| dump = 3 |
| air = 4 |
| asb = 5 |
| |
| mined : |
| none = 0 |
| asb = 1 |
| intact = 2 |
| steril = 3 |
| |
| classname : |
| none = 0 |
| ind = 1 |
| inf = 2 |
| meas = 3 |
| |
| Schema <parent> |
| Offset minimum : 384300.000000 404000.000000 6200.000000 |
| maximum : 397100.000000 411400.000000 8400.000000 |
| Blocks minimum : 100.000000 100.000000 100.000000 |
| maximum : 100.000000 100.000000 100.000000 |
| No of blocks : 128 74 22 |
| |
| Schema <subblocking_2> |
| Offset minimum : 384300.000000 404000.000000 6200.000000 |
| maximum : 397100.000000 411400.000000 8400.000000 |
| Blocks minimum : 5.000000 5.000000 5.000000 |
| maximum : 100.000000 100.000000 100.000000 |
| No of blocks : 2560 1480 440 |
| Veris Gold Corp. | |
| NI 43-101 Technical Report Jerritt Canyon Property, Nevada | 14-41 |
Table 14.6.5: Starvation model details.
| Model name : jcstarv_final_aug2012 |
| History list : jcstarv_aug201223Aug2012.bhst |
| Format : extended |
| Structure : non-regular |
| Smooth : no |
| Number of blocks : 992162 |
| Number of variables : 6 |
| Number of schemas : 2 |
| Origin : 0.000000 0.000000 0.000000 |
| Bearing/Dip/Plunge : 90.000000 0.000000 0.000000 |
| Created on : Thu Aug 23 19:47:08 2012 |
| Last modified on : Sun Aug 26 11:57:28 2012 |
| Model is indexed. |
| |
| Variables Default Type Description |
| ------------------------------------------------------ |
| zone none name ore zone |
| fm none name rock formation |
| classname none name meas ind inf |
| class -99 integer class |
| au_ok -99.0 float ordinary kriging |
| density -99.0 float density |
| volume - predefined |
| xlength - predefined |
| ylength - predefined |
| zlength - predefined |
| xcentre - predefined |
| ycentre - predefined |
| zcentre - predefined |
| xworld - predefined |
| yworld - predefined |
| zworld - predefined |
| |
| Translation Tables : |
| -------------------- |
| |
| zone : |
| none = 0 |
| starv01 = 1 |
| starv1 = 2 |
| |
| fm : |
| none = 0 |
| ohc3 = 1 |
| sdrm = 2 |
| ohc4 = 3 |
| oe = 4 |
| osc = 5 |
| |
| classname : |
| Veris Gold Corp. | |
| NI 43-101 Technical Report Jerritt Canyon Property, Nevada | 14-42 |
| none = 0 |
| inf = 1 |
| ind = 2 |
| meas = 3 |
| |
| Schema <parent> |
| Offset minimum : 368000.000000 378000.000000 6600.000000 |
| maximum : 370600.000000 379400.000000 7500.000000 |
| Blocks minimum : 20.000000 20.000000 20.000000 |
| maximum : 20.000000 20.000000 20.000000 |
| No of blocks : 130 70 45 |
| |
| Schema <sub> |
| Offset minimum : 368000.000000 378000.000000 6600.000000 |
| maximum : 370600.000000 379400.000000 7500.000000 |
| Blocks minimum : 5.000000 5.000000 5.000000 |
| maximum : 20.000000 20.000000 20.000000 |
| No of blocks : 520 280 180 |
The Burns Basin estimated block model was constructed using a 10x10x10 foot block size (XYZ) with no sub-blocking. The block model origin (lower left corner) is 382700E, 398700N, 6700EL and the upper right hand corner is 389200E, 402400N, 8200EL. The X length is 6500 feet, Y length is 3700 feet and the Z length is 1500 feet. The final model used by engineering was regularized to 20x20x20 foot blocks. The Saval block model is a subset of the SSX model that is regularized to a 20x20x20 foot block size (XYZ). The Saval block model origin (lower left corner) is 384300E, 405700N, 6200EL and the upper right hand corner is 392100E, 411400N, 8400EL. The X length is 7800 feet, Y length is 5700 feet and the Z length is 2200 feet.
After grade estimation, the open pit block models are re-blocked (or regularized) so that all of the blocks are the same size, 20x20x20 feet. The re-blocking allows a Lerchs-Grossman to run and calculate optimized pit shells given certain constraints.
The Smith block model was constructed using a 100x100x100 foot parent block size (XYZ), and sub-blocking down to 5x5x5 feet at the edges and all blocks within the 0.10 opt grade shells. The as-built underground solids and pit surfaces were also defined at a 5x5x5 foot resolution. The low grade blocks also have a maximum size of 5x5x5 feet. The block model origin (lower left corner) is 397100E, 404000N, 6100EL and the upper right hand corner is 408200E, 409800N, 8000EL. The X length is 11100 feet, Y length is 5800 feet and the Z length is 1900 feet.
The SSX block model is constructed using a 100x100x100 foot parent block size (XYZ), and sub-blocking down to 5x5x5 feet at the edges and all blocks within the 0.10 opt grade shells. The as-built underground solids and pit surfaces were also defined at a 5x5x5 foot resolution. The low grade blocks also have a maximum size of 5x5x5 feet. The block model origin (lower left corner) is 384300E, 404000N, 6200EL and the upper right hand corner is 397100E, 411400N, 8400EL. The X length is 12800 feet, Y length is 7400 feet and the Z length is 2200 feet.
The Starvation block model was constructed using a 20x20x20 foot parent block size (XYZ), and sub-blocking down to 5x5x5 feet at the edges of the triangulations. All blocks within the 0.10 and 0.01 opt grade shells are 5x5x5 feet. The topographical surface was also defined at a 5x5x5 foot resolution. The block model origin (lower left corner) is 368000E, 378000N, 6600EL and the upper right hand corner is 370600E, 379400N, 7500EL. The X length is 2600 feet, Y length is 1400 feet and the Z length is 900 feet.
| Veris Gold Corp. | |
| NI 43-101 Technical Report Jerritt Canyon Property, Nevada | 14-43 |
Triangulations are used to create the block models. The modeled geologic formation surfaces were used and the names stored in the FM field. The names in the FM field are sdrm, ohc3, ohc4, osc, oe, air, and dump. Grade shell solid names were stored in the SHELL field as well as "low" for the low-grade blocks outside of the grade shells. At Smith and SSX, the asbuilt underground solids were used to name blocks "asb" in the ZONE and MINED fields. The ZONE field is the same as SHELL except that the individual grade shell names for the blocks within the grade shells are replaced by a single name, "au01" or "au1". At Jerritt Canyon, the current topography surface (July 2004 aerial survey) was used to define air blocks. In areas where surface mining has occurred, two topographical surfaces were used to define air and dump blocks. The dump blocks are any blocks between the deepest pit topography and the current topography, which would define backfill in the pit or between original topography and current topography where a current dump exists.
The block model variables are listed in the table below.
Table 14.6.6: Block model variables.
| Variable | Default | Type | Description |
| shell | none | name | grade shell |
| zone | none | name | hi or low name |
| domain | none | name | geology domain |
| fm | none | name | formation |
| mined | none | name | ug depletion |
| classname | none | name | meas ind inf |
| au_ok | -99.0 | float | ordinary kriging |
| au_id3 | -99.0 | float | inverse distance cubed |
| au_nn | -99.0 | float | nearest neighbor |
| density | -99.0 | float | inverse tonnage factor |
| nsamp | -99.0 | float | number of samples |
| nhole | -99.0 | float | number of holes |
| avgdist | -99.0 | float | average distance |
| neardist | -99.0 | float | nearest distance |
| class | -99 | integer | 1=meas 2=ind 3=inf |
| kvar | -99.0 | float | kriging variance |
| flag_au | -99.0 | float | estimation flag |
| volume | | predefined | |
| xlength | | predefined | |
| ylength | | predefined | |
| zlength | | predefined | |
| xcentre | | predefined | |
| ycentre | | predefined | |
| zcentre | | predefined | |
| xworld | | predefined | |
| yworld | | predefined | |
| zworld | | predefined | |
14.7 Gold grade estimation and block calculations
Three estimation methods were run on the gold grade on all of the block models at Jerritt Canyon. These estimation methods are ordinary kriging (au_ok), inverse distance cubed (au_id3), and nearest neighbor (au_nn). The ordinary kriging estimation was used to report resources and reserves.
| Veris Gold Corp. | |
| NI 43-101 Technical Report Jerritt Canyon Property, Nevada | 14-44 |
For the Jerritt Canyon block model estimations, each of the grade shell solids had individual estimation orientations and the blocks within the grade shells were estimated using these individual search orientations with multiple passes. Table 14.7.1 shows the estimation ellipse orientations and ranges for the grade shells at Burns Basin. Due to the large number of grade shells used in all of the block models, it is deemed unnecessary to show them all.
Table 14.7.1: Burns Basin grade shell search ellipsoid orientations.
| Grade shell | Est ID | Bearing | Plunge | Dip |
| shell_au01_burns01_sept2012.00t | burn01 | 90 | -13 | 0 |
| shell_au01_burns02.00t | burn02 | 90 | -12 | 0 |
| shell_au01_burns03.00t | burn03 | 90 | -6 | 0 |
| shell_au01_burns04_sept2012.00t | burn04 | 90 | -13 | 0 |
| shell_au01_burns05.00t | burn05 | 180 | -30 | 0 |
| shell_au01_burns06.00t | burn06 | 180 | -25 | 25 |
| shell_au01_burns07.00t | burn07 | 0 | -35 | 0 |
| shell_au01_burns08_sept2012.00t | burn08 | 0 | -20 | 0 |
| shell_au01_burns09.00t | burn09 | 90 | 0 | 0 |
| shell_au01_burns10_sept2012.00t | burn10 | 140 | -10 | 0 |
| shell_au01_burns11_sept2012.00t | burn11 | 90 | -30 | 0 |
| shell_au01_burns12.00t | burn12 | 90 | -20 | 26 |
| shell_au01_burns13.00t | burn13 | 90 | -20 | 26 |
| shell_au01_burns14.00t | burn14 | 90 | -6 | -10 |
| shell_au01_burns15.00t | burn15 | 90 | -30 | 10 |
| shell_au01_burns16_sept2012.00t | burn16 | 90 | -20 | 0 |
| shell_au01_burns17_sept2012.00t | burn17 | 40 | -7 | -28 |
| shell_au01_burns18_sept2012.00t | burn18 | 40 | 0 | -28 |
| shell_au01_burns99_sept2012.00t | burn99 | 90 | -20 | 0 |
Three estimation passes were performed for each of the models. The first pass has conservative parameters that classify the estimated blocks as measured with a search distance of 40x40x20 feet. The second pass uses a larger search, 100x100x50 feet, and requires less samples, which classifies the estimated blocks as indicated. The third and last pass uses either 300x300x150 or 500x500x250 feet and is the least restrictive and classifies the blocks as inferred. The extent of the last pass ensures that all of the blocks within the grade shells are estimated.
During the estimations, only the composites flagged as inside the grade shells (0.1 opt or 0.01 opt Au) were used to estimate the blocks inside the grade shells.
A parent block size of 10x10x10 feet was used for estimation. This means that the estimation is done at the center of a 10x10x10 foot block grid and the result assigned to all blocks within the parent block. If the sub-block size is 5x5x5 feet, then 8 blocks would be assigned the same estimated grade.
The cap grade determined for each deposit is used in the estimations by restricting the range that the composites with values greater than the cap can influence. The range used for all of the block models is 10 feet in the major orientation, 10 feet in the semi-major orientation, and 10 feet in the minor orientation for gold composites higher than the cap grade. This means that a block centroid must be within 10 feet of the high-grade composite in order for it to be used as one of the composites used in that estimate. The cap grades for each model are shown in Tables 14.5.1 and 14.5.2 in Section 14.5, “Statistics and variography”.
A different number of composites (samples) were used for each estimation pass for each block model. The minimum number of samples for the measured pass is 8, for the indicated pass is 5, and for the inferred pass is 2. The maximum number of samples is 12 for all three passes.
| Veris Gold Corp. | |
| NI 43-101 Technical Report Jerritt Canyon Property, Nevada | 14-45 |
In addition, a maximum number of composites per drill hole are used during the estimations. All models use a maximum of 3 samples per drill hole. Table 14.7.2 shows the estimation parameters for each deposit and pass.
Table 14.7.2: Estimation parameters by block model.
| Area | Pass | Parent | Min
Samp | Max
Samp | Maj
(ft) | Semi
(ft) | Min
(ft) | Cap
Grade | Cap X
Limit | Cap Y
Limit | Cap Z
Limit | Max/
DH |
| X | Y | Z |
| Burns | meas | 10 | 10 | 10 | 8 | 12 | 40 | 40 | 20 | 1.7 | 10 | 10 | 10 | 3 |
| Burns | ind | 10 | 10 | 10 | 5 | 12 | 100 | 100 | 50 | 1.7 | 10 | 10 | 10 | 3 |
| Burns | inf | 10 | 10 | 10 | 2 | 12 | 300 | 300 | 150 | 1.7 | 10 | 10 | 10 | 3 |
| Saval | meas | 10 | 10 | 10 | 8 | 12 | 40 | 40 | 20 | 0.535 | 10 | 10 | 10 | 3 |
| Saval | ind | 10 | 10 | 10 | 5 | 12 | 100 | 100 | 50 | 0.535 | 10 | 10 | 10 | 3 |
| Saval | inf | 10 | 10 | 10 | 2 | 12 | 300 | 300 | 150 | 0.535 | 10 | 10 | 10 | 3 |
| Smith | meas | 10 | 10 | 10 | 8 | 12 | 40 | 40 | 20 | 3.5 | 10 | 10 | 10 | 3 |
| Smith | ind | 10 | 10 | 10 | 5 | 12 | 100 | 100 | 50 | 3.5 | 10 | 10 | 10 | 3 |
| Smith | inf | 10 | 10 | 10 | 2 | 12 | 500 | 500 | 250 | 3.5 | 10 | 10 | 10 | 3 |
| SSX | meas | 10 | 10 | 10 | 8 | 12 | 40 | 40 | 20 | 3.2 | 10 | 10 | 10 | 3 |
| SSX | ind | 10 | 10 | 10 | 5 | 12 | 100 | 100 | 50 | 3.2 | 10 | 10 | 10 | 3 |
| SSX | inf | 10 | 10 | 10 | 2 | 12 | 500 | 500 | 250 | 3.2 | 10 | 10 | 10 | 3 |
| Starv | meas | 10 | 10 | 10 | 8 | 12 | 40 | 40 | 20 | 0.8 | 10 | 10 | 10 | 3 |
| Starv | ind | 10 | 10 | 10 | 5 | 12 | 100 | 100 | 50 | 0.8 | 10 | 10 | 10 | 3 |
| Starv | inf | 10 | 10 | 10 | 2 | 12 | 500 | 500 | 250 | 0.8 | 10 | 10 | 10 | 3 |
After the estimations are run, block calculations are run with scripts to assign or calculate values to additional fields in the block models. Text names are assigned to the ZONE, CLASSNAME, and MINED variables in the block models. A density of 0.0794 tons per cubic foot is applied to all intact rock blocks for all models. The density for dumps is 0.0568 tons per cubic foot and 0.0649 tons per cubic foot for all rock within the underground workings.
The color legend for the Jerritt Canyon deposit plots is shown below.
Figure 14.7.1: Jerritt Canyon color legends.
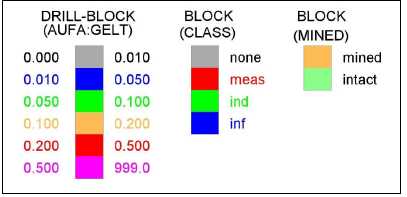
A few representative cross sections of the estimated gold grades from select models are in the figures below. The modeled grade shells are the red polygon outlines. The color schemes are shown in Figure 14.7.1 above.
| Veris Gold Corp. | |
| NI 43-101 Technical Report Jerritt Canyon Property, Nevada | 14-46 |
Figure 14.7.2: Section 406975N of Smith estimated blocks.
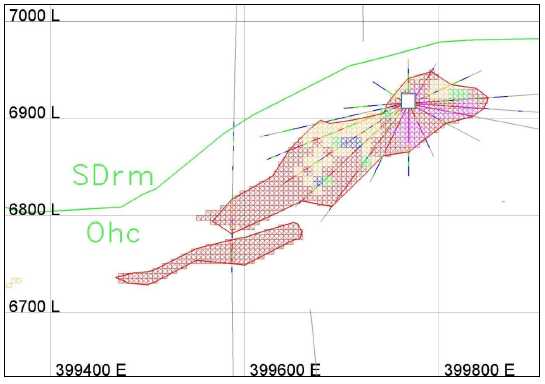
Figure 14.7.3: Section 400150N of Burns Basin estimated blocks.
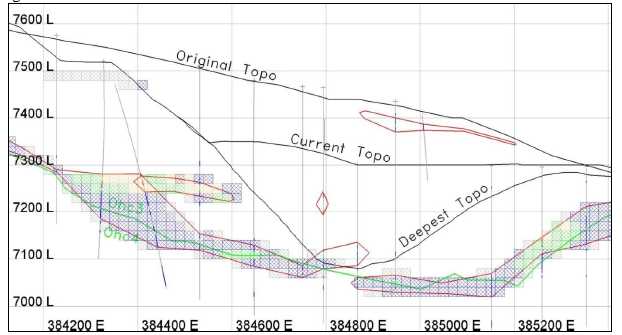
| Veris Gold Corp. | |
| NI 43-101 Technical Report Jerritt Canyon Property, Nevada | 14-47 |
Figure 14.7.4: Section 369800E of Starvation estimated blocks.
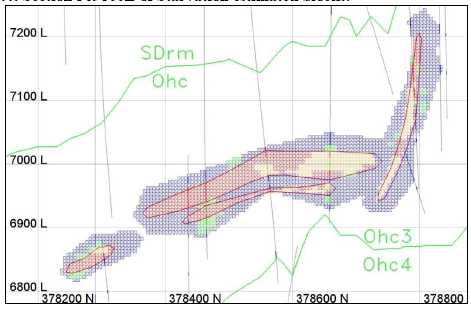
14.8 Mined depletion and sterilization
The block models which have underground workings within their limits are Smith (Figure 14.8.1), SSX (Saval and Steer-SSX; Figure 14.8.2), and Saval open pit (Figure 14.8.3) . These mined out areas have been depleted by renaming the blocks "asb", which is short for asbuilt. During the block model construction, the underground drift and stope triangulations are defined by 5x5x5 foot block resolution and flagged "asb" in the SHELL, ZONE, and MINED variables. These blocks are not estimated and therefore have no grade. The "asb" blocks are assumed to be backfilled and therefore have a density of 0.0649 tons per cubic foot. The figures below show the underground workings in plan view for the Smith, SSX, and Saval models. Figure 14.8.4 shows a cross-section at Smith of blocks named "intact" in light green and "asb" in light orange.
Figure 14.8.1: Plan view of Smith underground asbuilt workings.
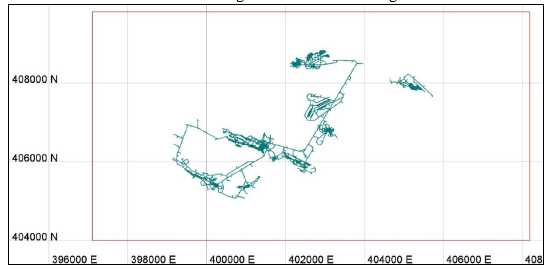
Figure 14.8.2: Plan view of SSX underground asbuilt workings.
| Veris Gold Corp. | |
| NI 43-101 Technical Report Jerritt Canyon Property, Nevada | 14-48 |
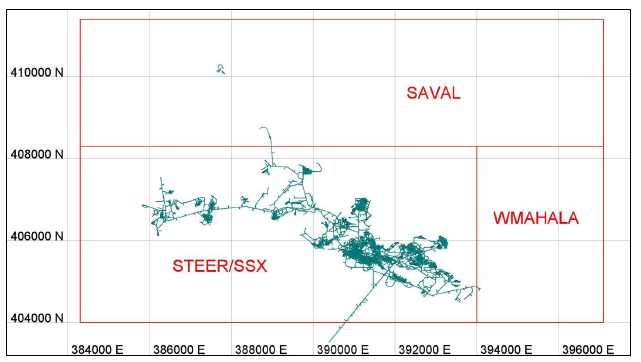
Figure 14.8.3: Plan view of Saval open-pit underground asbuilt workings.
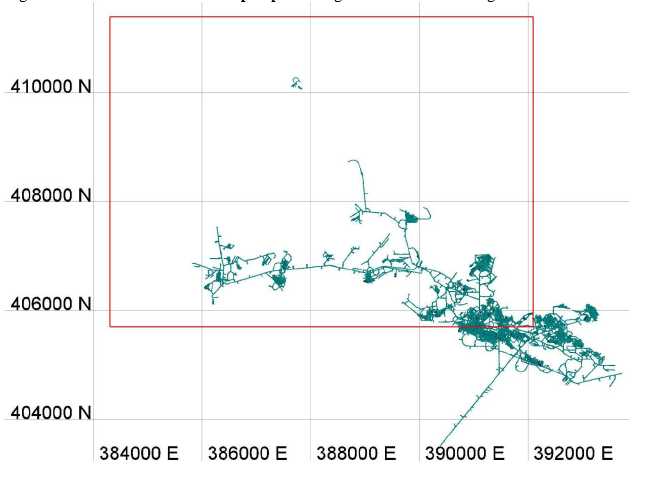
| Veris Gold Corp. | |
| NI 43-101 Technical Report Jerritt Canyon Property, Nevada | 14-49 |
Figure 14.8.4: Section view of Smith depleted blocks at 400,150E.
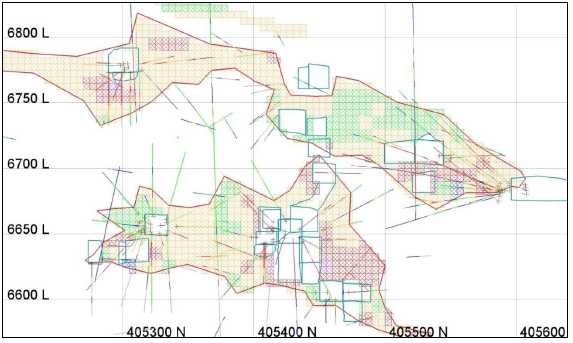
In addition to underground workings, some models have open pit mines within their boundaries. Open pits exist at Burns Basin, Saval, and Smith. Most of these pits are backfilled to some degree and ensuring that an accurate deepest mined pit bottom is used in the block model is important. In areas where the ground surface has been disturbed, three topography surfaces are created. These are:
| | 1. | Original Topography |
| | 2. | Current Topography |
| | 3. | Deepest Topography |
If these three topographical surfaces are accurate, then the air, dump, and intact rock can be confidently modeled. In some areas, new drilling is necessary to accurately model the contact between dump and intact rock as survey maps of the disturbed surface do not exist.
In the block models the topographic surfaces are defined by a 5x5x5 foot block resolution. The blocks are named "air", "dump", or the correct formation name in the FM variable. No blocks named "air" or "dump" are estimated and therefore are not included in either the resource or reserve report. The density for the dump blocks is 0.0568 tons per cubic foot.
The locations of the existing pits (current topography) in each of the models are shown below. Figure 14.8.10 shows a cross-section of the Dash Pit in the Smith model showing the three topographical surfaces. In each of these models, care has been taken to ensure that mineralization has been properly depleted with the deepest topography surface.
| Veris Gold Corp. | |
| NI 43-101 Technical Report Jerritt Canyon Property, Nevada | 14-50 |
Figure 14.8.5: Plan view of existing pit at Burns Basin.
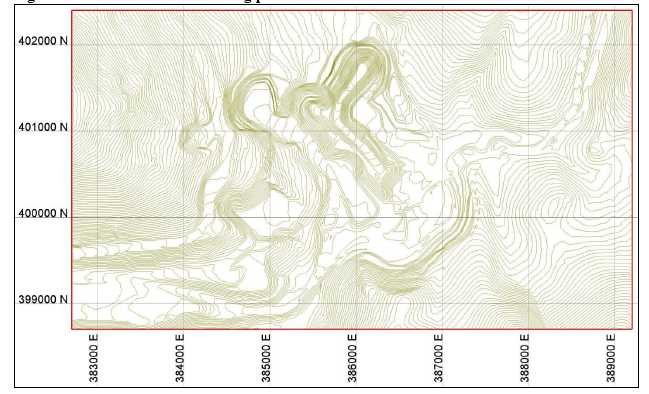
| Veris Gold Corp. | |
| NI 43-101 Technical Report Jerritt Canyon Property, Nevada | 14-51 |
Figure 14.8.6: Plan view of existing pit at Saval.
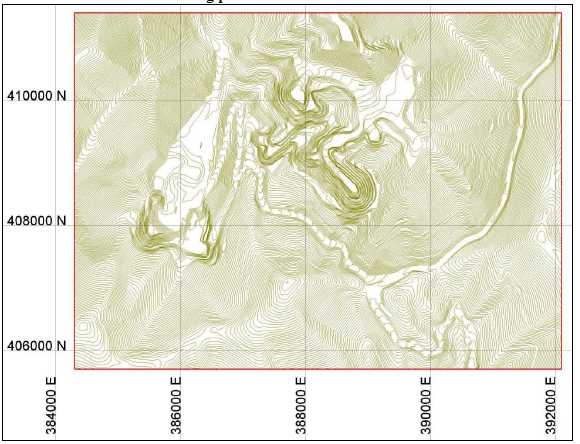
Figure 14.8.7: Plan view of existing pit at Smith.
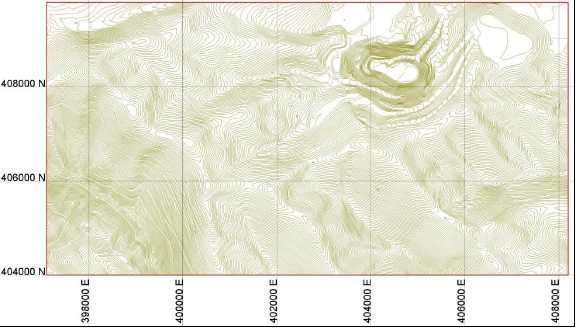
| Veris Gold Corp. | |
| NI 43-101 Technical Report Jerritt Canyon Property, Nevada | 14-52 |
Figure 14.8.8: Section view of the Smith Dash pit at 404650E.
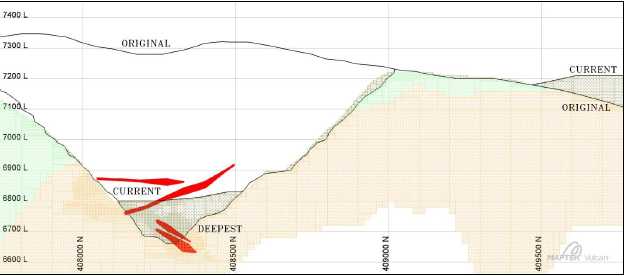
The grade shells shown in the section above colored red are in air, dump, and intact rock. Only the portion of the grade shells that are in intact rock have grade estimated. All air and dump blocks have a zero grade. The blocks above the original and current topographical surfaces are air. The blocks between current and deepest and between current and original surfaces are dump.
In addition to depletion by the underground asbuilt workings and the open pits, some blocks within the grade shells, especially around the underground workings, shouldn't always be included in the resource. These blocks have been flagged with the name "steril" in the MINED variable in the Smith and SSX block models. This means that the blocks are "sterilized" and are not used for reporting even though they exist and have estimated grades. Blocks are sterilized if they are next to or between underground workings and therefore considered un-mineable by current methods.
Only the Smith and SSX model require sterilization as the grade shells are in and around current underground workings, which leaves isolated blocks after depletion that can't be accessed and mined by underground methods.
The method used to flag the sterilized blocks was to view the estimated blocks within the grade shells on 10 foot bench (plan) sections and draw polygons around the blocks that would not be included in the resource or reserve. The blocks inside the polygons were then flagged as "steril".
Figure 14.8.9 shows the sterilization polygons for Smith, which encompass blocks that are close to current underground workings and therefore are considered un-mineable. Figure 14.8.10 shows them for SSX. Even though the solids are shown together in a general plan view, each solid is at a different elevation in order to encompass the correct blocks to be flagged as "steril". Figure 14.8.11 is a detailed view of a single 10 foot slice at elevation 7340 at SSX showing the current underground workings in teal, the sterilization polygon in magenta, and the estimated blocks within the red grade shell.
Sterilization of mineralization around the underground workings is an ongoing process. Many areas look mineable when viewed on the screen in the computer but need verification of actual extraction from direct inspection in the mine. Once a decision is made underground in the mine, then the model can be accurately updated.
| Veris Gold Corp. | |
| NI 43-101 Technical Report Jerritt Canyon Property, Nevada | 14-53 |
Figure 14.8.9: Plan view of Smith sterilization polygons.
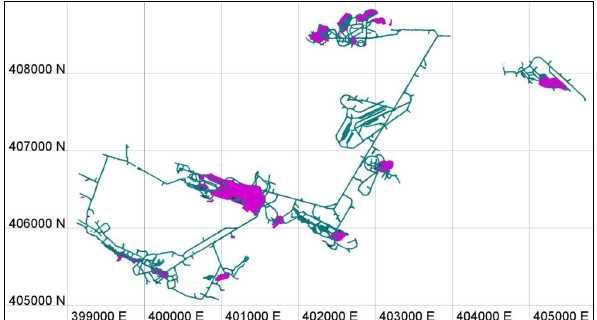
Figure 14.8.10: Plan view of SSX sterilization polygons.
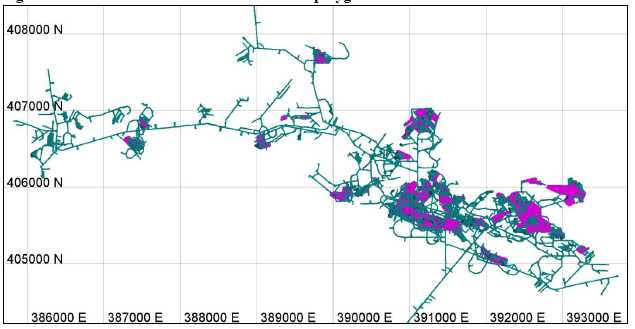
| Veris Gold Corp. | |
| NI 43-101 Technical Report Jerritt Canyon Property, Nevada | 14-54 |
Figure 14.8.11: Plan view of SSX sterilization detail at the 7370 elevation.
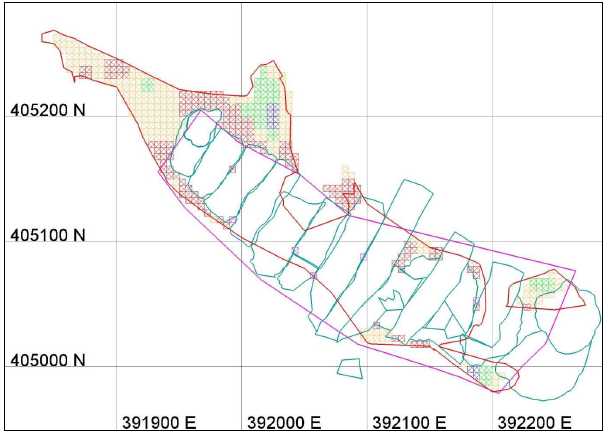
14.9 Mineral resource classification
All blocks that have an estimated gold grade are subsequently classified based on the confidence in the estimation. The confidence is based on the number of composites used in the estimation, the distance to these composites, and the number of drill holes for the selected composites. The Jerritt Canyon mineral resource was classified into Measured, Indicated and Inferred categories using logic consistent with the CIM (2005) definitions referred to in Canadian National Instrument 43-101 and described in the glossary. The highest confidence is called Measured (CLASSNAME = "meas" or CLASS = 1), the next is Indicated (CLASSNAME = "ind" or CLASS = 2), and the lowest confidence is "Inferred" (CLASSNAME = "inf" or CLASS = 3).
Based on the drill hole spacing distance at each of the deposits, distances were chosen which define the classification of the estimated block. At Smith and SSX, underground production drilling is spaced between 10 and 25 feet apart. The variograms show a sill range just over 50 feet, so a slightly conservative range was chosen. The measured classification for all models are blocks that were estimated with an ellipse range of 40x40x20 feet with a minimum of 8 and a maximum of 12 composites, which requires a minimum of three drill holes using a maximum of three composites per drill hole.
The indicated classification for all models are blocks that were estimated with an ellipse range of 100x100x50 feet with a minimum of 5 and a maximum of 12 composites, which requires a minimum of two drill holes using a maximum of three composites per drill hole.
The inferred classification for all models are blocks that were estimated with an ellipse range of 300x300x150 feet or 500x500x250 feet with a minimum of 2 and a maximum of 12 composites, which requires a minimum of one drill hole using a maximum of three composites per drill hole. The large increase in range is to ensure that all of the blocks within the grade shells that were not estimated with the measured or indicated estimations get estimated and are called inferred.
| Veris Gold Corp. | |
| NI 43-101 Technical Report Jerritt Canyon Property, Nevada | 14-55 |
Figure 14.9.1 is a north-south cross section showing the classification of blocks for the Smith model at 400150E. The color scheme (shown previously in Figure 14.7.1) uses red for measured, green for indicated and blue for inferred. The areas within the grade shells that are void of blocks are un-estimated "asb" blocks, which have no grade and therefore no classification.
Figure 14.9.1: Section 400150E of Smith classified blocks.
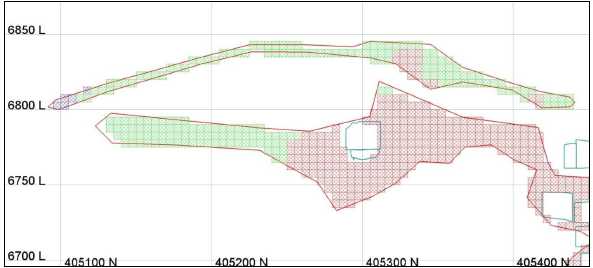
| Veris Gold Corp. | |
| NI 43-101 Technical Report Jerritt Canyon Property, Nevada | 14-56 |
The following figure shows the classification of blocks on cross-section 369800E at Starvation.
Figure 14.9.2: Section 369800E of Starvation classified blocks.
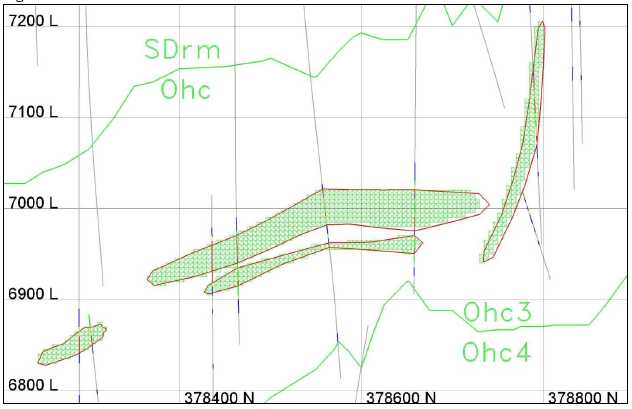
14.10 Block model validation
The drill hole composites were displayed with cross section views of the block models (Figures 14.10.1, 14.10.2, and 14.10.3) to visually inspect the local estimations of the gold grade by comparing the composite grades to the block grades. Those areas inspected for each block model, especially where high-grade composites exist, looked appropriate and correlated well given the search distance and number of samples used. The modeling method itself ensured that mineralization and the estimate were constrained within the 0.10 opt and/or 0.01 opt Au grade shells created in Vulcan.
The block models at Jerritt Canyon have been created with standard modeling practices and can be considered reasonable predictors of resources within the modeled areas.
Drill hole composite statistics were compared to the block statistics for each block model (Table 14.10.1) . All of the estimated blocks at a zero cut off and all classes, measured, indicated, and inferred were used to calculate the average block grade. All composites flagged as inside the grade shells with a grade greater than zero were used to calculate the average composite grade.
Results from this comparison on this global scale were acceptable. In addition, ongoing reconciliation studies conducted in 2012 that compare actual mined grade and tonnage against the mined grade and tonnage predicted in the block model for the Smith mine compare very well.
| Veris Gold Corp. | |
| NI 43-101 Technical Report Jerritt Canyon Property, Nevada | 14-57 |
Figure 14.10.1: Section view of Smith au_ok blocks and composites at 400150E.
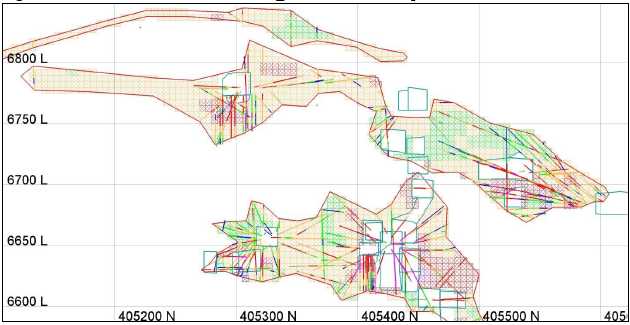
Figure 14.10.2: Section view of SSX au_ok blocks with composites at 391400E.
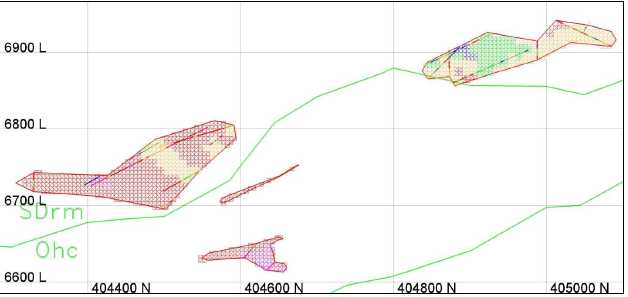
| Veris Gold Corp. | |
| NI 43-101 Technical Report Jerritt Canyon Property, Nevada | 14-58 |
Figure 14.10.3: Section view of Starvation au_ok blocks with composites at 369800E.
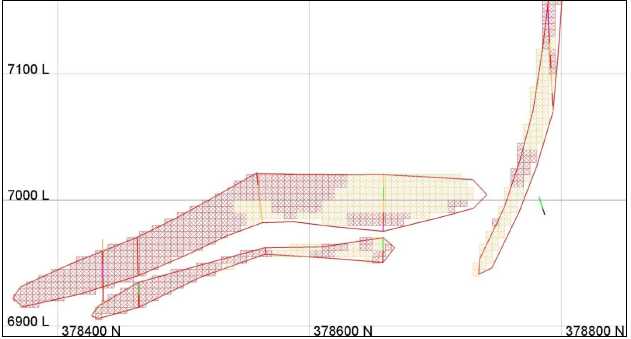
Table 14.10.1: Block model and composite grade comparison by deposit.
Model | bmf
auok | bmf
auid3 | bmf
aunn | comps
aufa |
Burns Basin
Saval | 0.037
0.030 | 0.038
| 0.036
| 0.0807
0.1010 |
Smith
SSX
Starvation | 0.192
0.196
0.248 | 0.194
0.197
0.258 | 0.192
0.191
0.252 | 0.2255
0.2567
0.2614 |
In Table 14.10.1, the average estimated grade is lower than the average composite grade as is expected.
| Veris Gold Corp. | |
| NI 43-101 Technical Report Jerritt Canyon Property, Nevada | 14-59 |
14.11 Mineral resource statement
The Jerritt Canyon mineral resources, including reserves, as of December 31, 2012 are listed below.
Table 14.11.1: Jerritt Canyon mineral resources including reserves– December 31, 2012.
Area | Measured | Indicated | Measured + Indicated | | Inferred |
| kt | opt | koz | kt | opt | koz | kt | opt | koz | | kt | opt | koz |
| Open Pit | | | | | | | | | | | | | |
| Burns Basin | 46 | 0.106 | 4.9 | 430 | 0.096 | 41.4 | 476 | 0.097 | 46.3 | | 5 | 0.061 | 0.3 |
| Mill Creek | 3 | 0.089 | 0.3 | 299 | 0.094 | 28.0 | 302 | 0.094 | 28.3 | | 4 | 0.153 | 0.6 |
| Saval | 51 | 0.148 | 7.6 | 315 | 0.085 | 26.7 | 367 | 0.093 | 34.3 | | 10 | 0.083 | 0.8 |
| Wright Window | 5 | 0.174 | 0.9 | 115 | 0.090 | 10.3 | 120 | 0.094 | 11.2 | | 5 | 0.088 | 0.4 |
| Pie Creek | - | - | - | 225 | 0.086 | 19.2 | 225 | 0.086 | 19.2 | | 5 | 0.089 | 0.5 |
| Road Canyon | - | - | - | 17 | 0.070 | 1.2 | 17 | 0.070 | 1.2 | | 187 | 0.081 | 15.2 |
| Stockpiles | 37 | 0.124 | 4.6 | 254 | 0.049 | 12.4 | 291 | 0.059 | 17.1 | | - | - | - |
| Open Pit Resource | 144 | 0.128 | 18.3 | 1,654 | 0.084 | 139.3 | 1,798 | 0.088 | 157.6 | | 216 | 0.082 | 17.8 |
| | | | | | | | | | | | | | |
| Underground | | | | | | | | | | | | | |
| Smith | 2,980 | 0.200 | 597.3 | 2,214 | 0.204 | 452.1 | 5,193 | 0.202 | 1,049.4 | | 977 | 0.179 | 174.6 |
| SSX Including | | | | | | | | | | | | | |
| West Mahala | 1,205 | 0.201 | 242.6 | 2,438 | 0.198 | 481.7 | 3,643 | 0.199 | 724.3 | | 2,508 | 0.173 | 433.6 |
| Saval | 17 | 0.276 | 4.6 | 160 | 0.247 | 39.6 | 177 | 0.250 | 44.2 | | 51 | 0.238 | 12.2 |
| Murray | 142 | 0.163 | 23.1 | 404 | 0.165 | 66.8 | 545 | 0.165 | 89.9 | | 61 | 0.162 | 10.0 |
| Starvation | 24 | 0.238 | 5.8 | 946 | 0.176 | 166.8 | 970 | 0.178 | 172.6 | | 21 | 0.170 | 3.6 |
| Winters Creek | - | - | - | 117 | 0.112 | 13.1 | 117 | 0.112 | 13.1 | | 10 | 0.145 | 1.5 |
| Underground | | | | | | | | | | | | | |
| Resource | 4,367 | 0.200 | 873.4 | 6,278 | 0.194 | 1,220.1 | 10,645 | 0.197 | 2,093.5 | | 3,629 | 0.175 | 635.4 |
| Resource Total | 4,511 | 0.198 | 891.7 | 7,932 | 0.171 | 1,359.4 | 12,443 | 0.181 | 2,251.1 | | 3,845 | 0.170 | 653.2 |
Notes:
| | (1) | Mineral resources that are not mineral reserves do not have demonstrated economic viability; |
| | (2) | Open pit mineral resources are contained within Lerch Grossman pit shells constructed at $1,620/oz. gold price and meet the minimum cutoff grade; |
| | (3) | Open pit mineral resources include 5% mining losses and 5% dilution; |
| | (4) | Underground mineral resources constrained to 0.10 opt grade shells and occur outside existing asbuilt workings and sterilized areas, and are deemed by the Qualified Person to be potentially economic; and |
| | (5) | Underground mineral resources include 5% mining losses and 5-10% dilution. |
14.11.1 Underground mineral resources
The Jerritt underground mineral resources where tabulated using two methodologies.
SSX-Steer and Smith:
Underground resources at SSX-Steer and Smith were calculated by determining which blocks within the 0.10 opt gold grade shells are potentially economic by Karl Swanson, SME; Consulting Mining Engineer. Blocks within the current asbuilt underground workings are named "asb" in the variable named MINED in the block model and blocks within the sterilization solids are named "steril". These blocks were assigned a 0.001 opt gold grade. All other blocks have the name "intact" in the MINED variable.
| Veris Gold Corp. | |
| NI 43-101 Technical Report Jerritt Canyon Property, Nevada | 14-60 |
The resource is determined from the "intact" blocks. Blocks within the design solids and within the 0.10 opt gold grade shells and which are named "intact" are renamed "des" in the MINED variable in the block model. Blocks within grade shells that are large enough to pay for their mining and milling and that are named "intact" are renamed "reso" in MINED variable. In addition, any groups of blocks around the current underground workings that are within the grade shells, are named "intact" and that are determined to be potentially economic are renamed "reso" in the MINED variable.
Only blocks with a gold grade greater than 0.10 opt and named "des" or "reso" in the MINED variable are included in the Smith and SSX resource. A mining recovery factor of 5% and dilution factor of 5% was applied to these two underground resources.
Figures 14.11.1 and 14.11.3 show the plan views of the resources which include reserves at Smith and SSX-Steer, respectively. Figures 14.11.2 and 14.11.4 show the resources which include reserves in cross-section at Smith and SSX-Steer, respectively, including blocks above the mine cutoff grade; the gold grade using the color legend as shown previously in Figure 14.7.1; the 0.10 opt grade shell (in red outline); asbuilts (in dark blue color); and the underground mine design (in light blue on plan maps and bright green on sections).
Figure 14.11.1: Plan view of Smith underground resources, which include reservesdisplaying “des” and “reso” flagged blocks colored by gold grade.
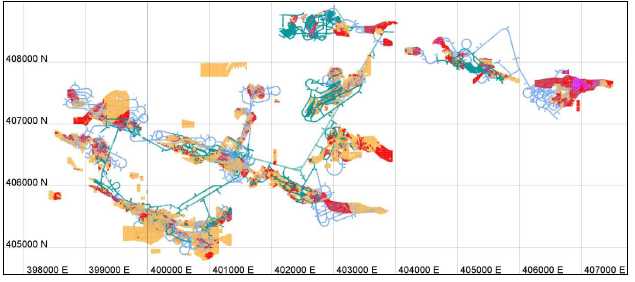
| Veris Gold Corp. | |
| NI 43-101 Technical Report Jerritt Canyon Property, Nevada | 14-61 |
Figure 14.11.2: Section 400,150E Smith underground resources, which include reservesdisplaying “des” and “reso” flagged blocks colored by gold grade.
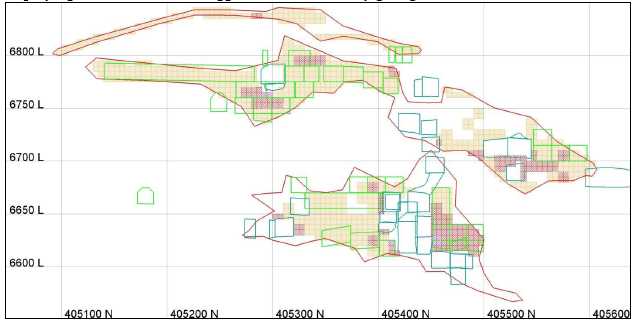
Figure 14.11.3: Plan view of SSX-Steer underground resources, which include reservesdisplaying “des” and “reso” flagged blocks colored by gold grade.
| Veris Gold Corp. | |
| NI 43-101 Technical Report Jerritt Canyon Property, Nevada | 14-62 |
Figure 14.11.4: Section 393,600E SSX-Steer underground resources, which include reservesdisplaying “des” and “reso” flagged blocks bygold grade.
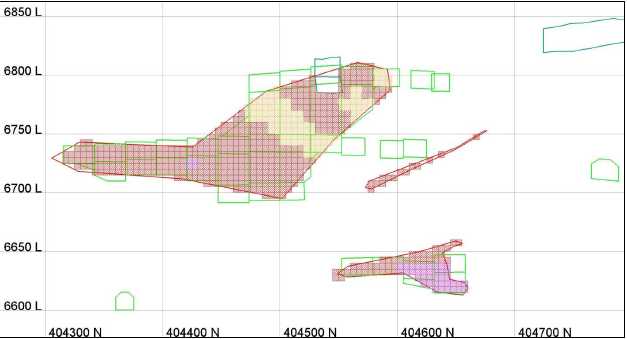
Starvation, Murray, Saval, and Winters Creek:
Underground mineral resources at Saval, Murray, Starvation, and Winters Creek were calculated by Mark Odell, Practical Mining LLC. Resources at these mines are contained within designed mine excavations that meet the respective cut off grades calculated at $1,620 per ounce. All of the resource designs can be developed from nearby existing or planned excavations. A mining loss factor of 5% and a dilution factor of 10% have been applied to the resource. These factors are reasonable for the type and scale of underground mining practiced at the Jerritt Canyon Mines.
14.11.2 Open pit mineral resources
Open pit resources were estimated by creating a Lerch Grossman optimized $1,620/ ounce pit shell using measured, indicated and inferred blocks, all other blocks are considered waste. The operating costs used in the analysis are those given in section 21.2. Metallurgical recovery is a function of grade and is estimated using the equation listed in section 17.2. Finally the pit slope conditions of section 16.2 are honored. The resultant pit only mines those ore blocks which will provide a positive value when including the cost of mining all the overlying waste blocks. The resource only includes the measured, indicated and inferred blocks that are inside the $1,620 pit shell and exceed the minimum cutoff grades listed in Table 21.3.1. The reported open pit resources also include 5% mining dilution and 5% mining losses. These factors are reasonable for the scale and scope of the resource pits.
14.12 Other resource constraints
Dewatering will be required to recover portions of the Murray, Smith Mine, SSX and West Mahala resources. Veris plans to construct dewatering wells, treatment and disposal facilities to handle all dewatering water that cannot be consumed in the process plant.
We are not aware of any possible adverse or unusual restrictions on mining resulting from legal or title issues, taxation, socio-economic, environmental, political, or others that would affect the Jerritt Canyon operation. The mine has or expects to receive the permits necessary for operation.
| Veris Gold Corp. | |
| NI 43-101 Technical Report Jerritt Canyon Property, Nevada | 15-1 |
15 Mineral Reserve estimate
Mineral reserves were estimated by Practical Mining LLC under the direction of Mark Odell (P.E.), Consulting Mine Engineer.
Table 15.1.1: Jerritt Canyon mineral reserves– December 31, 2012.
| | Proven | Probable | Proven + Probable |
| | | | | | | | | | |
| Area | kt | opt | koz | kt | opt | koz | kt | opt | koz |
| Open Pit | | | | | | | | | |
| Burns Basin | 32 | 0.100 | 3.2 | 391 | 0.101 | 39.6 | 423 | 0.101 | 42.8 |
| Mill Creek | 3 | 0.089 | 0.3 | 194 | 0.090 | 17.4 | 197 | 0.090 | 17.7 |
| Saval | 51 | 0.155 | 7.9 | 32 | 0.089 | 2.9 | 83 | 0.129 | 10.8 |
| Wright Window | 5 | 0.174 | 0.9 | 109 | 0.093 | 10.1 | 114 | 0.096 | 11.0 |
| Stockpiles | 37 | 0.124 | 4.6 | 167 | 0.053 | 8.9 | 204 | 0.066 | 13.5 |
| Open Pit Reserve | 128 | 0.131 | 17.0 | 892 | 0.088 | 78.9 | 1,021 | 0.094 | 95.7 |
| | | | | | | | | | |
| Underground | | | | | | | | | |
| Smith | 1,750 | 0.162 | 283.5 | 1,262 | 0.168 | 211.8 | 3,012 | 0.164 | 495.3 |
| SSX Including | | | | | | | | | |
| West Mahala | 566 | 0.172 | 97.5 | 1,056 | 0.159 | 167.4 | 1,621 | 0.163 | 272.0 |
| Saval | 18 | 0.239 | 4.3 | 150 | 0.203 | 30.4 | 168 | 0.207 | 34.8 |
| Murray | 142 | 0.163 | 23.1 | 354 | 0.166 | 58.6 | 495 | 0.165 | 81.7 |
| Starvation | 24 | 0.238 | 5.8 | 946 | 0.176 | 166.8 | 970 | 0.178 | 172.6 |
| Underground Reserve | 2,499 | 0.166 | 414.3 | 3,766 | 0.169 | 635.0 | 6,266 | 0.167 | 1,049.3 |
| Reserve Total | 2,628 | 0.164 | 431.1 | 4,659 | 0.153 | 713.9 | 7,287 | 0.157 | 1,145.0 |
15.1 Underground mine reserves
Underground mining accounts for over 90% of the Jerritt Canyon Reserves at year end 2012. The reserves are distributed among 5 underground mines located throughout the district. These are, listed in decreasing order of reserves, the Smith Mine, SSX complex which includes the SSX, Steer and West Mahala reserves, Murray, Starvation and Saval. The Smith and SSX mines are currently operating. Starvation was under development in late 2012 with mine production that started in early April 2013. The Murray Mine operated from 1994 to 2006 while Saval is a planned new mine.
Mine designs for each mine have been created using Vulcan software. Each mine design consists of a collection of individual excavations, each designed in accordance with the parameters outlined in section 16. The excavations are oriented along preferred mining directions in each stoping area and arranged to extract as much of the measured and indicated resource that meets the minimum breakeven cutoff grade requirements discussed in section 21.3 while minimizing the amount of diluting material included.
The stope average grade must exceed the minimum breakeven cutoff grade after the application of 5% mining losses and 10% dilution to be considered for inclusion in mineral reserves. If an excavation is required to access a stope or other development drift and after the application of mining recovery and dilution factors the average grade of the excavation exceeds the incremental cutoff grade, it will be considered for inclusion in mineral reserves. Only the measured and indicated resources within the mine design excavations are used for the calculation of proven and probable reserves.
| Veris Gold Corp. | |
| NI 43-101 Technical Report Jerritt Canyon Property, Nevada | 15-2 |
The cut off grades for underground reserves were determined using a gold price of $1,490 per ounce and the mining, haulage, processing and administrative costs listed in Table 21.3.2. Process recoveries are grade dependent and vary between 75 and 90%. Recoveries were determined using the formula given in section 17.3.
Included in the updated reserve are 234 koz located below the local water table. These include: the eastern portion of the SSX Mine including West Mahala; mine below the 6,600 ft. elevation; the reserves at Murray below the 6,100 ft. elevation; Smith Mine Zones 2, 3 and 4 reserves below the 6,600 ft. elevation; and the Smith East Zone 9 reserves below the 6,300 ft. elevation. The company plans to dewater these reserves by drilling wells from the surface into targeted ground water compartments. This water will either be used in the process or treated and discharged to a rapid infiltration basin. Engineering of the dewatering system is ongoing and the permitting process will be initiated in 2013. The Reserves Life of Mine Plan includes capital spending and schedule allowances for the dewatering operations.
The figures below show the current and planned underground workings.
Figure 15.1.1: Existing and planned workings at the Smith Mine.
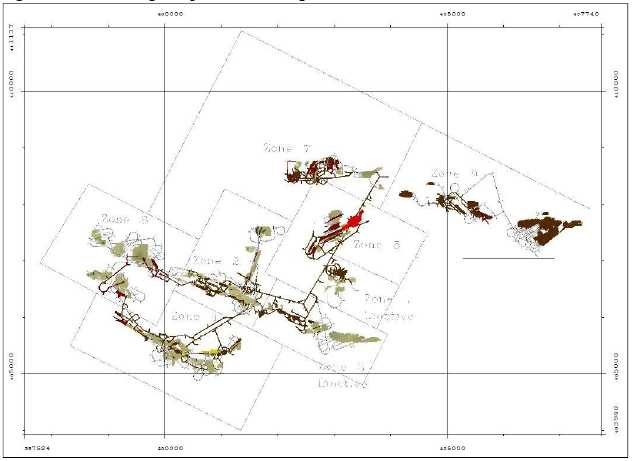
| Veris Gold Corp. | |
| NI 43-101 Technical Report Jerritt Canyon Property, Nevada | 15-3 |
Figure 15.1.2: Section 400,150E Smith Mine underground reserves showing the reserve blocks by gold grade with the design solids.
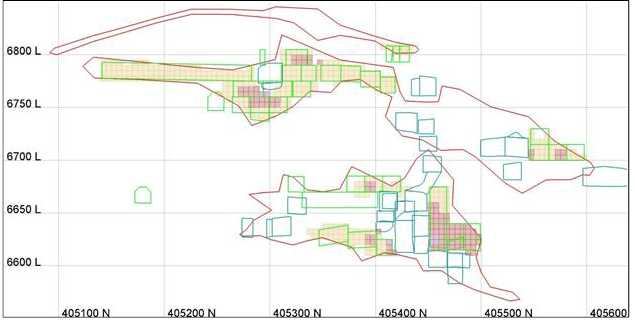
| Veris Gold Corp. | |
| NI 43-101 Technical Report Jerritt Canyon Property, Nevada | 15-4 |
Figure 15.1.3: Existing and planned working in the SSX complex including Saval UG and West Mahala.
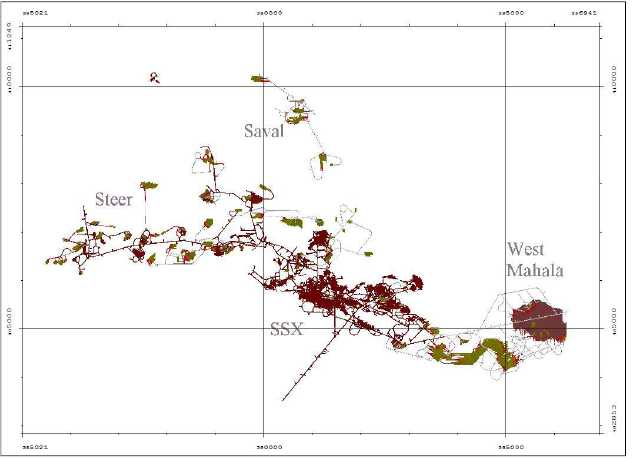
| Veris Gold Corp. | |
| NI 43-101 Technical Report Jerritt Canyon Property, Nevada | 15-5 |
Figure 15.1.4: Section 393,600E SSX-Steer Mine underground reserves showing the reserve blocks by gold grade with the design solids (green) and asbuilts (light blue).

| Veris Gold Corp. | |
| NI 43-101 Technical Report Jerritt Canyon Property, Nevada | 15-6 |
Figure 15.1.5: Existing and planned workings at the Murray Mine.
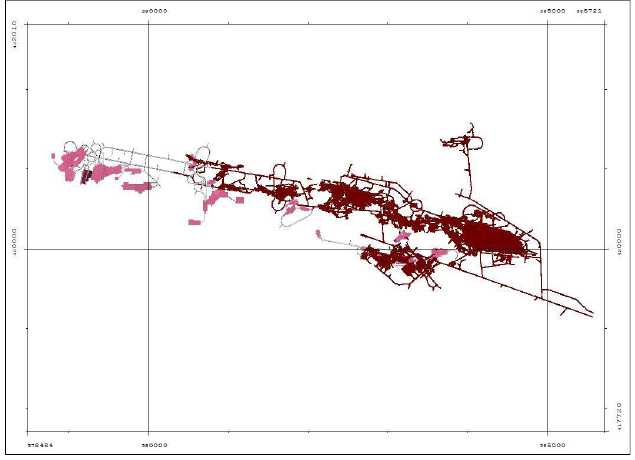
| Veris Gold Corp. | |
| NI 43-101 Technical Report Jerritt Canyon Property, Nevada | 15-7 |
Figure 15.1.6: Existing and planned workings at the Starvation Mine.
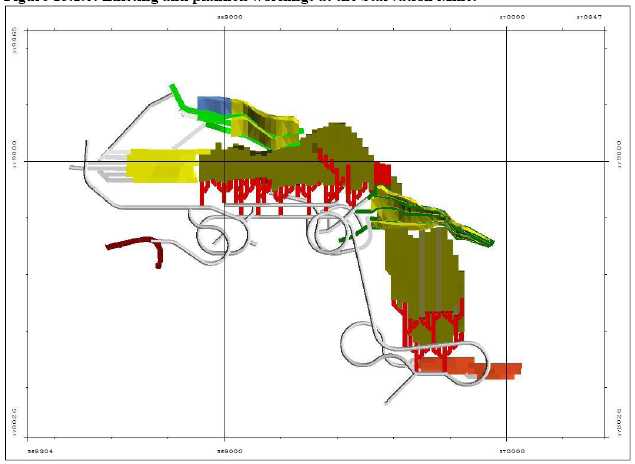
15.2 Open pit mine reserves
Open pit reserves are contained in four different mining areas. These are, in decreasing order of reserves, Burns Basin, Mill Creek, Saval and Wright Window. Open pit reserves were estimated by creating a Lerch Grossman optimized $1,490 per ounce pit shell using only measured and indicated blocks. The operating costs used in the analysis are those given in section 21.2. Metallurgical recovery is a function of grade and is estimated using the equation listed in section 17.2. Finally the pit slope conditions of section 16.2 are honored. The resultant pit only mines those measured and indicated blocks which will provide a positive value when including the cost of mining all the overlying waste blocks.
Using the optimized pit shell as a guide, a final engineered pit was designed with haulage ramps and catch berms. If, after the application of mining recovery and dilution factors, the final pit has positive economic value, then the measured and indicated blocks contained inside the pit design that are greater than the cut offs grades listed in Table 21.3.2 can be considered proven and probable reserves.
The open pits included in the reserve estimation are of limited size and scope. Three of the four are also located in areas previously mined by open pits and none of them will require dewatering. The combination of these factors should allow timely receipt regulatory approvals.
The figures below show the ultimate pit designs for each of the open pit mineral reserve areas.
| Veris Gold Corp. | |
| NI 43-101 Technical Report Jerritt Canyon Property, Nevada | 15-8 |
Figure 15.2.1: Ultimate pit design for Saval mineral reserve area.
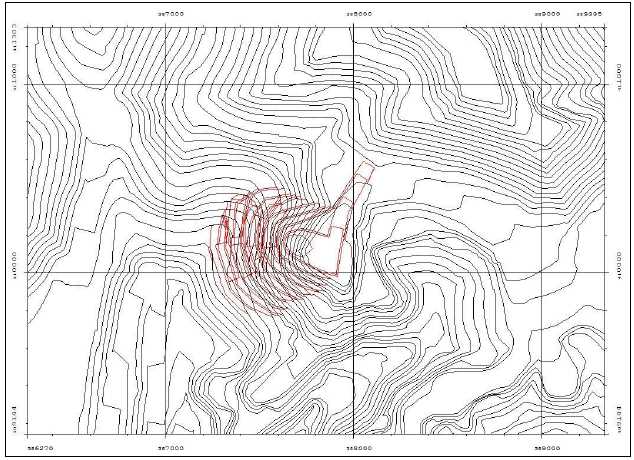
| Veris Gold Corp. | |
| NI 43-101 Technical Report Jerritt Canyon Property, Nevada | 15-9 |
Figure 15.2.2: Ultimate pit design for Mill Creek mineral reserve area.
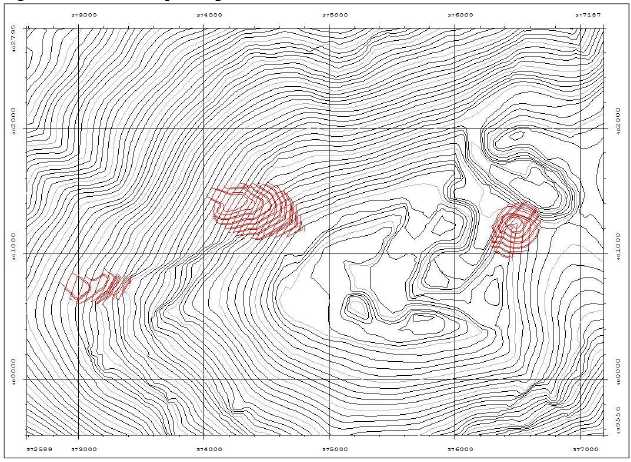
| Veris Gold Corp. | |
| NI 43-101 Technical Report Jerritt Canyon Property, Nevada | 15-10 |
Figure 15.2.3: Ultimate pit design for Wright Window mineral reserve area.
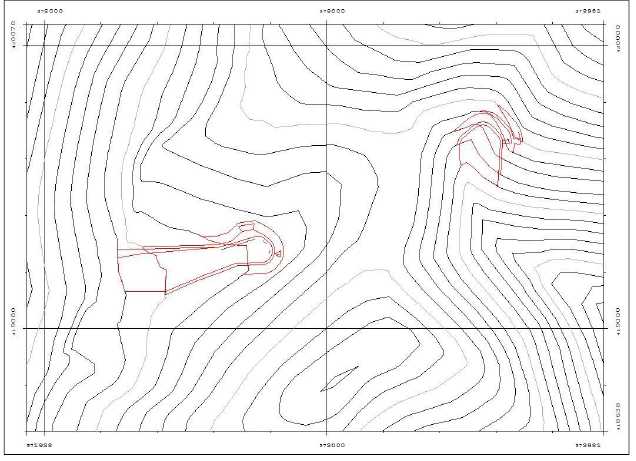
| Veris Gold Corp. | |
| NI 43-101 Technical Report Jerritt Canyon Property, Nevada | 15-11 |
Figure 15.2.4: Ultimate pit design for Burns Basin mineral reserve area.
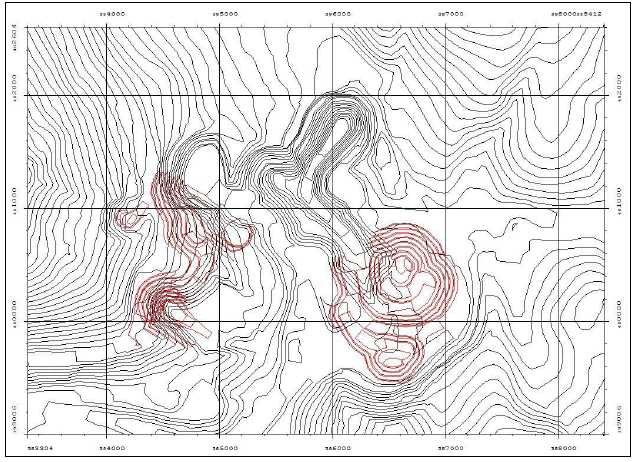
| Veris Gold Corp. | |
| NI 43-101 Technical Report Jerritt Canyon Property, Nevada | 16-1 |
16 Mining methods
Recent operating results, including production costs, of the Jerritt Canyon Mines are presented in this section. In addition, geotechnical parameters, mining methods, ore control, stockpile resources and reserve reconciliation are presented in this section.
16.1 Mining operations
Access to the Smith and SSX-Steer underground mines is through portals, with internal ramps maintained at grades of 12% to 15%. The mines generally follow a drift-and-fill method, operated by trackless equipment. Electric drill jumbos are used in preparation for blasting, and front loaders excavate the broken material into diesel-driven underground mine trucks for hauling to a pad area outside the portals. Mined material is segregated near the portals by placing the rock into several windrows; these are sampled and assays from the laboratory then dictate whether that material is high-grade, low-grade, or waste. The waste is excavated and placed in a waste dump, whereas the high-grade and low-grade ore types may or may not be blended depending on analytical results, and taken either to the process facility or stockpiled in a nearby location for possible future processing, respectively. Because of the distances from the mine portals to the processing plant, 50 - 150-ton off-road haulers are used for surface ore transport.
Typical mine openings measure 15 x 15 to 20 x 25 feet in cross section. All mine openings are primarily supported with bolts and mesh. Shotcrete may also be applied to supplement the bolts and mesh in heavily jointed rock masses or in those areas where raveling has occurred. Ore is generally developed by drifting adjacent to the zone and then cross-cutting through the deposit at specified intervals. Secondary openings are developed either alongside a backfilled stope or underneath a previously-filled excavation. In the latter situation, cost savings are accomplished since the cemented fill does not require artificial support. Extraction of ore-grade material is near 100%, and mining dilution for the most part is confined to the end stopes.
Each mine has its own operational batch plant located outside the mine portal. The backfill is a mixture of screened mine waste rock and cement. These products are blended according to the backfill mix design, water is added, and the mixture placed into the underground haulage trucks for transport back into the mine.
16.2 Mining production
Jerritt Canyon is an operating property with over 20 years of production experience, during which approximately 7.97 million ounces of gold have been produced up to year-end 2012. The Jerritt Canyon Mine complex currently consists of two operating underground mines (Smith and SSX) located several miles southwest of the processing plant and administration facilities which are 50 miles north of Elko, Nevada (Figure 4.3.1 and Figure ). Mining operations resumed at the SSX-Steer complex during the third quarter of 2011. The Murray underground mine was closed in 2006 and the MCE underground mine was closed in 2004.
Recent operating results, including production costs, of the Jerritt Canyon Mines, are presented in this section. In addition, geotechnical parameters, mining fleets and ore control are presented in this section. Stockpile resources and reserves and reconciliation are also presented in this section.
All mines feed the same processing plant, with output from the underground operations and other sources (e.g. remote and mill Jerritt stockpiles) totaling 0.98 million tons in 2012, 0.37 million tons during 2011, and 0.41 million tons in 2010. The producing properties at Jerritt Canyon excluding third party purchased ores (e.g. Newmont), and their annual production rates for years 2010 and 2012, are given in the table below and represent ore materials processed through the mill on a dry ton basis.
| Veris Gold Corp. | |
| NI 43-101 Technical Report Jerritt Canyon Property, Nevada | 16-2 |
Table 16.2.1: Jerritt Canyon 2010-2012 production.
| Property | Annual Production (dry tons) |
| Year | 2010 | 2011 | 2012 |
| SSX Complex | 0 | 9,051 | 281,124 |
| Smith | 176,409 (2) | 269,795 | 405,904 |
| Stockpiles (4) | 233,731 (3) | 95,351 | 291,234 |
| Total | 410,140 | 374,197 | 978,262 |
| Notes: | (1) | Tonnages based on internal mine records; |
| (2) | Dry tonnage processed through the mill; based on 5% moisture content of wet ton delivery published by Veris in the March 31, 2011 MD&A (2011); |
| | (3) | Remote stockpile tonnage processed through the mill based on internal mine records; |
| (4) | Stockpile data only includes those from Jerritt Canyon (mill and remote combined) and excludes Newmont and other third party purchased ores; |
As of October 18, 2012, the processing plant re-attained the maximum permitted processing capacity, treating approximately 6,000 tons/day (125 tph for each roaster). The previous historical processing capacity rate of 4,320 tpd (90tph for each roaster) was limited due to permitting constraints by the State of Nevada imposed as part of the Consent Decree and was attainable in the past when the feed was derived mainly from open pit operations, but was a significant surplus when accepting material from only the underground mines simply because the total mine output alone could not attain this daily rate.
In mid-2007 Veris amended an agreement with Newmont USA Limited to purchase material delivered to Jerritt Canyon by Newmont that continued into 2008, 2010, and 2011 which supplemented mined ores feeding the roasters and thereby reduced certain unit operating costs. There was no Newmont-Veris agreement in place in 2012 so no Newmont ores were processed through the mill that year. Discussions are currently in progress with Newmont regarding a possible ore and/or stockpile purchase contract.
Total 2012 total underground mine production from Smith Mine and SSX-Steer Complex totaled 687,028 tons (405,904 tons from Smith by contract miner Small Mines Development, LLC (SMD) and 281,124 tons from SSX-Steer by Veris Gold USA, Inc. & SMD). From August 1, 2012 to Year-End 2012, total average underground mine production from Smith Mine was 1,261 tons per day and 1,162 tons per day from SSX. A total of 291,234 tons of remote stockpile ore material was mined in 2012. Also in November 2012, development commenced at the new Starvation Canyon underground mine by SMD. The Starvation Canyon mine was officially opened on April 8, 2013 and is being operated by SMD. Total production from the Jerritt Canyon processing plant was 105,626 oz Au from 978,262 tons of processed ore at an average metallurgical recovery of 82.7% . The plant operated for approximately 247 total days in 2012.
The plant processed a total of 628,418 tons in 2011 and operated for 339 total days to achieve an average processing rate of 1,853 tons/day for the year. Gold produced in 2011 from all sources was 76,585 ounces (recovered) from 628,418 tons of processed ore and purchased material at a metallurgical recovery that averaged 85.8% . The Smith underground mine reported production of 269,795 tons of ore containing 46,971 ounces of Au. The daily average ore production rate from the Smith Mine in the fourth quarter of 2011 was approximately 1,169 tons. Underground mining at the SSX-Steer mine Complex started in early October of 2011 and averaged approximately 150 tons of ore per day in the fourth quarter of 2011. A total of 95,351 tons of Jerritt stockpile material containing 7,182 oz of Au was processed through the mill in 2011.
The plant processed a total of 599,555 dry tons in 2010 and operated for 322 total days to achieve an average processing rate of 1,862 tons/day for the year. Gold produced in 2010 from all sources was 65,104 ounces (recovered) from 599,555 tons of processed ore and purchased material at a metallurgical recovery that averaged 88.2% . For 2010, the Smith underground mine reported production of 176,409 dry tons of ore containing 29,278 ounces of Au (Yukon-Nevada Gold Corp, 2011), along with 186,650 waste tons. The daily ore production rate from the Smith Mine in the third quarter of 2010 reached the target of 1,000 ore tons. A total of 233,731 tons of Jerritt stockpile material containing 14,122 oz of Au was processed through the mill in 2010.
| Veris Gold Corp. | |
| NI 43-101 Technical Report Jerritt Canyon Property, Nevada | 16-3 |
The plant processed a total of 338,350 tons in 2008 and only operated for 159 days that year due to the significant amount of down time. The plant therefore processed an average of 2,128 tons/day in 2008. Plant capacity is limited to some extent by the “fuel content” of the ore (principally contained pyrite) which tends to enhance temperatures in the roaster and so must be regulated carefully when this type of rock serves as feedstock. Blending of various mined products is practiced constantly to reduce deleterious impacts from rock types with high fuel content, high arsenic content, and so forth. Also the capacity was somewhat limited because of air permit requirements at that time. Gold produced in 2008 from all sources was 44,732 ounces from 338,350 tons of processed ore and purchased material at a metallurgical recovery that averaged 87.3% .
The Smith and SSX-Steer underground mines reported production of 135,909 tons of ore, along with 136,070 waste tons in 2008. This tonnage figure was significantly less than the 2008 budgeted amount of nearly 336,641 ore tons at a projected mined grade of 0.284 ounces/ton which can be mostly attributed to the August 2008 mine shut down and other mill shut downs in early 2008. In 2008 a total of 88,709 tons of Jerritt Canyon stockpile (remote + mill) was processed through the mill. Of this total, 32,793 tons of remote stockpile material containing an average grade of 0.170 opt Au was delivered to the mill and processed. In addition, a total of 55,916 tons of mill stockpile at a grade of 0.141 opt Au was processed in 2008.
Due to poor record keeping in 2009 by the contract mill operator, Golden Eagle, the total amount of ore tons processed in 2009 was not recorded by YNG but they reportedly produced 9,770 ounces of Au for the year. All ore materials processed in 2009 were not separated by source and were a mixture of Newmont, Hollister, and Jerritt stockpile materials located at the mill. It is assumed that no remote Jerritt Canyon stockpile materials were hauled to the mill in 2009. The mill only operated for 130 days in 2009 as a result of several “stop” orders received from the NDEP.
No significant Newmont ores were purchased or processed in 2012. Newmont ores were purchased and processed by Veris in 2011, 2010 and 2008. In 2011, VUSA processed 254,221 dry tons containing 33,968 ounces. A total of 86,257 wet tons of ore containing 16,905 ounces of Au were purchased from Newmont (all in Quarter 4 in 2010) and delivered to the mill in 2010 (Yukon-Nevada Gold Corp, 2011). During 2008 and 2010, VUSA processed 113,732 and 189,415 dry tons, respectively, of Newmont material. The Newmont stockpile ores processed in 2010 included material delivered to the mine prior to 2010. The amount of Newmont ores processed in 2009 is unknown due to poor record keeping by the contract mill operator.
16.3 Underground mining methods
Underground Mining at Jerritt Canyon consists of two primary mining methods: long-hole open stoping with delayed backfill and modified drift and fill. The preferred sequence for long-hole stopes is to mine from the bottom up and for drift and fill to mine underhand or from the top down. These methods have been employed successfully at Jerritt Canyon since 1993.
The stope development drifts for long-hole open stoping and for drift and fill are typically from 15 to 20 feet high and 15 to 25 feet in width depending on the ground conditions and geometry of the ore. The excavations are created using conventional drill, blast, muck and support techniques. All aspects of the mining cycle are fully mechanized to provide the highest safety standards and productivity levels.
Split set rock bolts and welded wire mesh provide the primary means of ground support. These can be supplemented with resin anchor rebar bolts, cable bolts and/or shotcrete when conditions require additional support.
| Veris Gold Corp. | |
| NI 43-101 Technical Report Jerritt Canyon Property, Nevada | 16-4 |
The development drifts for long-hole stopes are spaced with a minimum back to sill separation of 25 feet vertically. This vertical separation can be increased to as much as 100 feet if the geometry of the deposit will allow. Once the top and bottom stope development drift is completed the intervening ore will be drilled with a mechanized production drill using 2 ¾ inch to 4 in diameter blast holes. The blast holes will be loaded with either ANFO or emulsion explosives and fired in groups of three or four rows progressing from the hanging wall to footwall of the stope. Following each blast the broken ore is removed from the stope by means of a remotely operated load haul dump unit. Remote operation allows the operator to stay at a safe location under bolted ground at all times. Figure 16.3.1 shows a typical long-hole stope arrangement.
Once the stope has been extracted it is backfilled to the level of the top access drift sill. The backfill material used is a cemented rock fill which contains from 4 to 8% cement and will have unconfined compression strengths of 400 to 600 pounds per square inch (psi). The backfill will reach its required strength within three to seven days at which time development of the adjacent stope may begin. If there are no further adjacent stopes to be extracted the stope can be backfilled with unconsolidated waste or left open. If there is another stope immediately above the backfilled stope then the top access drift of the prior stope will serve as the bottom access for the next otherwise it will be backfilled in preparation to mine the adjacent stope.
| Veris Gold Corp. | |
| NI 43-101 Technical Report Jerritt Canyon Property, Nevada | 16-5 |
Figure 16.3.1: Long-hole open stope mining.
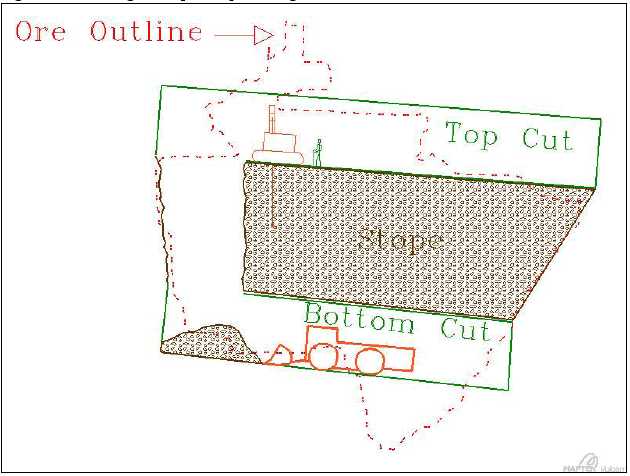
If the vertical thickness of the ore is not great enough to allow long-hole stoping then drift and fill methods are employed. In this method a top access drift will be driven at the upper extent of the ore. Any ore remaining below the access drift is removed by means of breasting up the sill or of the access drift. During breasting the footwall can be ramped at up to a -25% gradient to allow LHD access. The height of the breast can reach up to 40 feet. Upon completion of the stope it will be backfilled similar to a long-hole stope.
| Veris Gold Corp. | |
| NI 43-101 Technical Report Jerritt Canyon Property, Nevada | 16-6 |
Figure 16.3.2: Drift and fill mining with breasting up the sill.
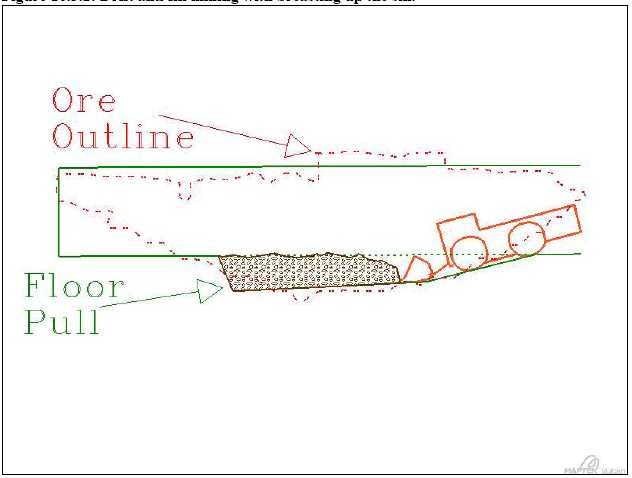
Any underground mining dilution occurs at the fringes of the ore pods or lenses. Within the pods, slices or drifts are extracted and then backfilled with cemented waste material. When the backfill has consolidated, the ore between the primary stopes or drifts is then extracted. In the primary cuts, the interior stope boundaries are surrounded by ore, so little dilution results. Within the secondary cuts, the walls and/or back are cemented backfill, which has less jointing than the ore or enclosing rocks, and thus little dilution takes place. It is primarily on the fringes of the individual ore bodies that dilution occurs, with the amount also being dependent upon the mining method. Historically dilution at Jerritt Canyon has averaged 10% or less for all mines and mining methods. All dilution material is applied at zero ounces per ton. All of the underground reserves have also been adjusted to include a mining recovery factor of 95%.
16.3.1 Mine development
Access drifts to the stoping areas are excavated in a manner similar to stope development drifts. Access drift dimensions are 15 feet wide by 15 feet high to accommodate 30 ton haul trucks and provide a large enough cross sectional area for ventilation. The gradient of access drifts can vary form -15% to +15%. Access drifts are also equipped with compressed air piping, 4160 volt electrical distribution systems, mine water supply piping, water discharge piping and communication systems.
Capital development rates will be as much as 9,800 feet per year at SSX and 8,900 feet per year at Smith in order to achieve the planned ore production levels.
| Veris Gold Corp. | |
| NI 43-101 Technical Report Jerritt Canyon Property, Nevada | 16-7 |
16.3.2 Underground geotechnical considerations
The Hanson Creek host rock at Jerritt Canyon has a fair to poor classification with RMR values typically in the 30 – 40 range. These conditions are managed by limiting the span or hydraulic radius of open excavations through the use of cemented backfill. And by applying the ground support materials mentioned above. On occasion geologic structures are encountered with adverse orientations to the mine workings. These are controlled with the application of the additional ground support materials. Under the most severe conditions the drift will be advanced following the installation of spiling or steel sets.
A geotechnical evaluation program was completed at Starvation Canyon by Golder Associates in 2012 (Golder Associates, 2012). Twelve diamond drill holes were completed using triple tube equipment. The core was logged for geotechnical parameters at the rig and then transported to the core logging facility for additional characterization. At the core shed the core was photographed, reconciled with tele-viewer images to collect structural orientation data, point load tested, and samples were collected for laboratory testing.
The geotechnical program concluded that 75% of the rock mass at Starvation Canyon will have a RMR rating of 61 or higher and 15% has an RMR rating between 41 and 60. The recommended ground support for Starvation Canyon is similar to that used at the other mines in the district and consists of bolts and mesh supplemented by shotcrete when necessary. A kinematic analysis of stope orientations revealed a low potential for wedge failures in the planned excavations.
16.3.3 Ventilation
Underground Mining at Jerritt Canyon relies heavily on diesel equipment to extract the ores. This requires large amounts of fresh ventilation air to remove the diesel exhaust and maintain a healthy environment. A combination of the main access drifts and vertical raises are arranged in a manner to provide a complete ventilation circuit. The mine portals can be either intake or exhaust.
16.3.4 Dewatering
A portion of the reserves and resources located in the Smith and SSX/West Mahala areas are located below the local ground water table and will require dewatering. Dewatering will be accomplished by means of high capacity production wells drilled from the surface and targeted into specific compartmentalized ground water horizons. Each well can have a capacity of up to 500 gallons per minute. Discharge from the wells will be used to provide the 700 gallons per minute of process makeup water required, following the closure of TSF 1, or will be treated and disposed of in a rapid infiltration basin. Water treatment will be required to maintain allowed levels of arsenic, antimony and total dissolved solids.
Dewatering will also be required at the Murray Mine. During its operation the Murray mine was dewatered through a series of small underground wells drilled to target specific water bearing structures. This water did not require treatment and was pumped to 3 injection wells located below the Alchem pit for disposal. The system remains in place and will be rehabilitated with the reopening of the Murray Mine.
The Life of Mine Reserves Plan contains $36M in capital for the design and construction of the dewatering facilities. Production from the areas requiring dewatering is not scheduled to begin until mid-2015. Engineering of these facilities is underway and permitting will commence in late 2013 and is not expected to delay mining.
16.4 Open pit mining methods
Open pit methods will be used to extract some of the reserves at Jerritt Canyon. Three of these areas, Burns Basin, Mill Creek and Saval were mined previously by open pit methods. The fourth area, Wright Window, has not been the site of any previous mining activity. Open pit mining will provide between 100,000 and 350,000 tons of ore per year beginning in 2014. Stripping ratios will vary from a low of 2:1 at Wright Window to a high of 23:1 at Burns.
| Veris Gold Corp. | |
| NI 43-101 Technical Report Jerritt Canyon Property, Nevada | 16-8 |
The open pits will be conventional drill, blast, load and haul operations utilizing 10 to 15 cubic yard loaders and 100 – 150 ton haul trucks. The pits will be worked in 20 foot benches with the ore and waste delineated using blast hole assays. It is anticipated that all open pit mining will be performed by a qualified contractor. Operating and capital costs in the Life of Mine Plan have been adjusted accordingly. Previous open pit mining allowed for a 55 – 65 degree bench face angle and a 45 degree inter-ramp slope angle. These operations resulted in stable pit slopes that remain intact over 10 years following the cessation of mining activity in these areas. Similar allowances have been made in the planned reserve pits.
Mining recovery and dilution factors of 95% and 5%, respectively, have been applied to all open pit reserves. The diluting material is assumed to be waste with no recoverable gold values. These factors are within acceptable industry limits.
Waste Rock will be disposed of in waste rock storage facilities adjacent to the pits, or will be backfilled into previously mined pits. The limited size and scope of the open pits and proximity to previous mining activity does not present any permitting or environmental issues that could delay or prevent exploitation of open pit reserves and resources.
16.5 Ore control and sampling procedures (underground)
Muck from each round is hauled from the portal and piled in discreet windrows at the muck laydown area of each mine. Miners label each pile with a lath including heading, date, and shift. Three samples are collected per round. An ore control technician will walk around the entire pile taking representative scoop samples to fill three 5 pound sample bags. Flagging is tied to the lath to indicate the pile has been sampled. Bags are hand labeled with unique sample identification numbers and transported to the Jerritt Canyon assay lab.
Assay results are issued 24 to 72 hours later. The Geologist or Engineer marks the piles ore or waste by painting the lath orange for ore or blue for waste. Once a pile has been marked ore or waste, it is hauled to its corresponding destination.
16.6 Jerritt Canyon Stockpiles
Stockpile materials are mined with 100- or 150-ton haul trucks and a front-end loader. Muck material to be mined has previously been assayed for grade control and is typically flagged in the field as ore or waste. Stockpile ore is delivered to the ROM whereas waste is delivered to a local waste dump.
The various stockpiles at Jerritt Canyon are categorized based on their spatial distance to the mill. The Remote Stockpile consists of numerous individual stockpiles that reside proximal to their original mined source. These stockpiles are located at varied distances distal to the mill. Prior to Year-End 2009 these stockpiles were inventoried by physical survey then subsequently reconciled to the Year-End 2007 (NI 43-101) stockpile resource (discussion of the reconciliation process can be found in the Jerritt Canyon January 6, 2012 Amended NI 43-101 report). This reconciliation formed the basis for the reported Year-End 2010 reserves/resources. Figure 16.6.1 shows the locations of the various stockpiles comprising the Remote Stockpile resource inventory.
The Mill Stockpile (a.k.a. ROM) consists of numerous individual stockpiles located proximal to the primary crusher facility at the mill. Ores derived from various sources (including the remote stockpiles) are delivered to the ROM prior to processing through the mill. All ROM deliveries are segregated by source.
| Veris Gold Corp. | |
| NI 43-101 Technical Report Jerritt Canyon Property, Nevada | 16-9 |
Figure 16.6.1: Stockpile location map.
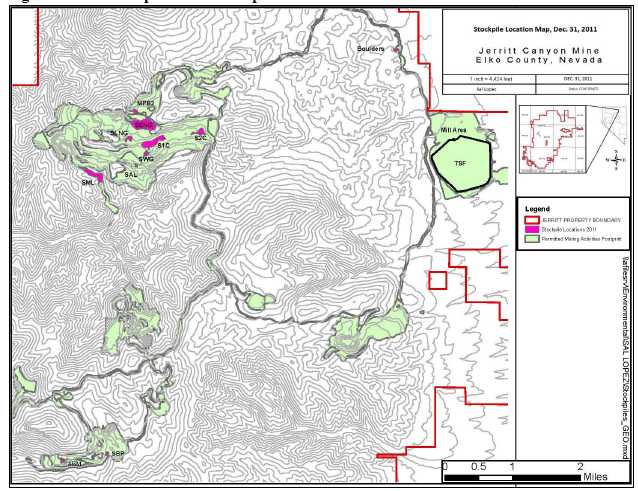
ROM stockpiles are inventoried on a monthly basis via physical survey conducted by the mine Engineering Department. This inventory provides the baseline for the monthly mine/mill reconciliation and subsequent reserve/resource depletions.
The table below summarizes the change to inventory for the Jerritt Canyon stockpiles as of the Year-End 2012. A trenching and sampling program undertaken in 2012 resulted in a grade reduction below cutoff grade in three of the remote stockpile areas and their subsequent removal from reserves at the end of 2012.
Table 16.6.1: Jerritt Canyon stockpile reserve summary.
| | Year-End 2011 | Year-End 2012 | Net Depletions |
| Stockpile | ktons | Grade
(opt) | koz | ktons | Grade
(opt) | koz | ktons | Grade
(opt) | koz |
| Remote | 623 | 0.065 | 40.7 | 167 | 0.053 | 8.9 | -456 | 0.070 | -31.8 |
| Mill | 180 | 0.094 | 17.0 | 37 | 0.124 | 4.6 | -143 | 0.087 | -12.4 |
| TOTAL | 803 | 0.072 | 57.7 | 204 | 0.066 | 13.5 | -598 | 0.074 | -44.2 |
| Veris Gold Corp. | |
| NI 43-101 Technical Report Jerritt Canyon Property, Nevada | 16-10 |
Jerritt Canyon Ore Stockpile assayed sample results were reviewed and verified by Qualified Person, Michele White, based on review of data for assay checking and chain of custody including:
- Raw assay reports from Jerritt lab
- Certified assay results from outside laboratory
- Compilations of sample assays in spreadsheet format from staff: Paul Noland (Chief Geologist, 2009), William Hofer (Chief Geologist, 2010- current), and John Vipham (Staff Surveyor).
The datasets provided were reviewed for chain of custody from 2009 analysis performed by Paul Noland to current 2012 analysis by William Hofer, including additions and editing by John Vipham. The sample results were reviewed for accuracy by comparing assay reports with subsequent eras of compilation spreadsheets between 2009 and December 2011. Some of the initial stockpile samples from 2009 were sent to ALS Chemex lab. Otherwise, all of the samples were and continue to be assayed on-site at the Jerritt lab.
In 2010, a regular sampling program had been initiated for remote stockpiles from which an estimate of the potential for inclusion in site resources is referenced. Of the total assay population used in the stockpile compilations, 22 percent were matched to corresponding records in previous compilations and traced to original assay certificates. This is an acceptable representative population of stockpile assay results.
There is excellent correlation between lab results and corresponding compilation spreadsheets (100%). The chain of custody between sequential copies of stockpile assay assessment is also 100% accurate. Based on excellent correlation between subsequent compilations and assay-checks the Jerritt Canyon Ore Stockpile compilations are considered accurate by the primary author.
| Veris Gold Corp. | |
| NI 43-101 Technical Report Jerritt Canyon Property, Nevada | 17-1 |
17 Recovery methods
Recent operating results, including production costs, of the Jerritt Canyon Mines and processing facilities are presented in this section.In addition, details of the process flow sheet are shown and described.
17.1 Processing facilities, operating parameters, and process flow sheet
The unit operations at the Jerritt Canyon processing plant are comprised of the following circuits:
- Primary crushing;
- Secondary crushing;
- Fine ore drying;
- Tertiary crushing;
- Dry grinding;
- Roasting;
- Carbon-in-leach (“CIL”) with cyanidation and carbon adsorption;
- Carbon stripping;
- Carbon reactivation;
- Electro-winning,
- Merrill-Crowe process using zinc cementation of gold and silver;
- Precipitate refining;
- Oxygen plant;
- Water evaporation pond; and
- Tailing impoundment.
A simplified flow sheet of the mineral processing operation is shown in Figure 17.1.1.An overview of the facility is shown in figures Figure 18.6.1 and Figure 18.6.2. Table 17.1.1 summarizes the operating parameters for the processing plant.
Table 17.1.1: Operating parameters for the Jerritt Canyon processing plant.
| Operating Parameter | Units | Value |
| Processing Capacity Rate | tons/Year | 1,500,000 |
| Processing Capacity Rate | tons/Day | 4,320 |
| Planned Plant Availability | | 95% |
| NDEP Permitted Processing Rate | tons/day | 6,000 |
| Ore Grade | oz Au/ton | 0.175 |
| Gold Recovery | % | 89.1 |
| Operating Cost | $/ton Processed | $39.44 |
| Veris Gold Corp. | |
| NI 43-101 Technical Report Jerritt Canyon Property, Nevada | 17-2 |
Figure 17.1.1: Simplified ore processing flow sheet for the Jerritt Canyon Mine.
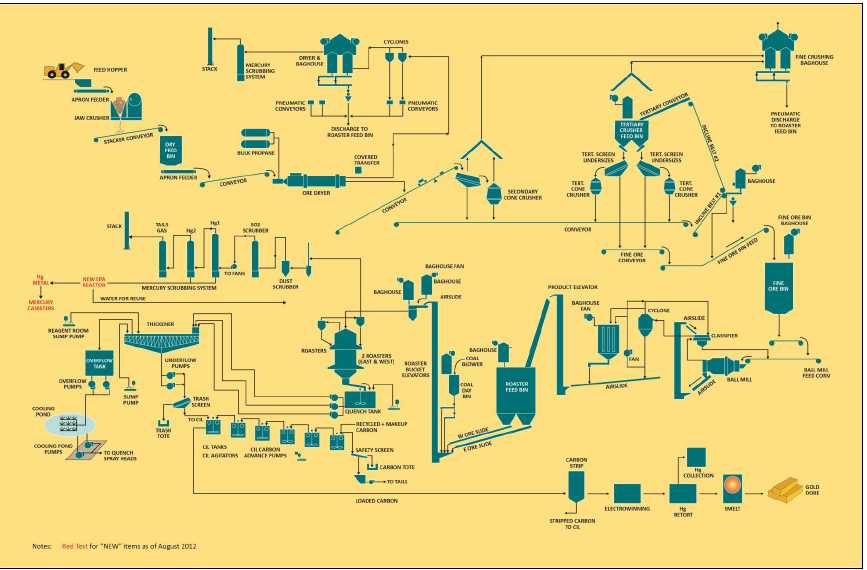
| Veris Gold Corp. | |
| NI 43-101 Technical Report Jerritt Canyon Property, Nevada | 17-3 |
As part of the Consent Decree Agreement noted in section 6.2, stack tests are being conducted on a periodic basis to make sure that VUSA adheres to the emissions thresholds listed in the Consent Decree or agreed to with the NDEP.
The Smith and SSX-Steer underground mines are currently the primary local mine sources feeding the mill with approximately 1,483 (including high grade and low grade ores) and 975 ore tons per day, respectively, in March 2013. Targeted 2013 ore production from Smith and SSX-Steer is 1,250 tons per day from each. An additional 600 ore tons per day will be provided from the new Starvation Canyon Mine by the end of June 2013. The Jerritt Canyon ore stockpiles will continue to be another mill feed source at the site for the first half of 2013. A total of 21,869 tons of remote stockpile material was mined in March 2013.
Development at the Saval 4 mine will commence in Quarter 3 2013 at a targeted rate of 400 ore tons per day. The LoM plan in this report is targeting mill through put of 4,110 tpd. Current production through the mill as of the end of March 2013 is approximately 252,758 tons.
The mill was shut down to complete a winterization and refurbishment program from January 6, 2012 to February 2, 2012. During the shutdown period the following items were addressed:
- constructing a new drying facility;
- reconfiguring the conveying system in fine crushing;
- old dryer was replaced with a new ore dryer closer to the front end of the circuit which includes its own mercury scrubbing system;
- installation of a new Distributed Control System (“DCS”) for the entire plant;
- installation of a new quench tank for the East Roaster which is one of the final requirements for compliance with the Consent Decree;
- realignment of the crushing conveyors;
- rebuild of the thickener rakes;
- rebuild of the OSEPA particle-sizing system;
- replacement of the pinion on the ball mill;
- replacement of the feed-end of the ball mill;
- replacement of portions of the dust-control ventilation system;
- replacement of air-slides feeding the roasters;
- clean-out of the roasters and some refractory repair;
- replacement and repair of the fine ore bin conveyor and belt;
- rebuild of the CIL carbon screens;
- replacement of the retort and furnace in the refinery;
- the Merrill-Crowe precipitation circuit was replaced with an electrowinning circuit; and
- replacement of some key components in the oxygen plant.
The new ore dryer has been placed before the screens and chutes of the secondary cone crusher. The old ore dryer has been eliminated from the processing facility and used to be located after the secondary and tertiary crusher, which allowed wet ore to freeze and result in handling problems. These ore handling problems have now been eliminated with the new ore dryer configuration and are expected to help maintain more consistent ore production throughout the year and through the winter months.
Commissioning of the new ore dryer, fine-crushing conveying, and the DCS commenced on January 23, 2012. The remaining portions of the winterization and refurbishment program were commissioned on February 1, 2012. The mercury scrubbing system associated with the roasting circuit was commissioned in November 2009.
In early March 2012, additional issues with the new ore dryer and bucket elevator were identified. Flights and lifters in the dryer were detaching from the shell and caused downtime from plugging the discharge chute. The bucket elevator experienced problems with buckets detaching and chain pins breaking which caused the bucket elevator to jam and shut down. The chain was replaced in early April and the feed rate was reduced to less than 200tph for crushing. The bucket elevator was replaced with two standard belt conveyors in mid-June and the work was completed on July 11, 2012. During this time, a mobile crusher was installed as a backup to bypass the bucket elevator if more problems were encountered with the bucket elevator before it was replaced. In addition a new dust-extraction ducting was installed in fine crushing. The crushing circuit is now operating at steady state throughput levels well over 300 tons per hour allowing for consistent operation of the roasting and CIL circuits at over 4,000 tons per day.
| Veris Gold Corp. | |
| NI 43-101 Technical Report Jerritt Canyon Property, Nevada | 17-4 |
The wet milling facilities are currently not in use or permitted but include two lines with each containing one 800HP SAG Mill and a 700 HP Ball Mill with a capacity of approximately 1,450 tons/day. The existing wet mill therefore contains a maximum feed capacity for approximately 3,000 t/d. The Jerritt Geology and Mining groups are targeting ores from previously mined open pits and/or new on-site open pit resources within the Jerritt Canyon property that will be considered for feeding the existing wet milling process facilities. In addition, these wet mill facilities could also be utilized for helping process third-party ores originating from off site.
17.2 Recoverability
Gold recovery in 2008 to 2012 is shown below in Table 17.2.1and was recorded by month. For 2012 the gold recovery averaged 82.7% of contained metal delivered to the process plant.
Table 17.2.1: Jerritt Canyon 2008-2012 gold recovery by month.
| | Gold Recovery |
Month
Year |
2008 |
2009 |
2010 |
2011 |
2012 |
| January | 83.3 | n/a | 87.3 | 88.1 | 77.8 |
| February | 85.8 | n/a | 83.9 | 87.3 | 83.4 |
| March | n/a | n/a | 89.6 | 89.4 | 81.7 |
| April | 75.2 | 82.5 | 89.4 | 86.5 | 84.0 |
| May | 83.7 | 89.9 | 87.5 | 85.2 | 84.0 |
| June | 87.6 | n/a | 87.6 | 87.2 | 81.2 |
| July | 87.9 | n/a | 89.9 | 85.9 | 80.4 |
| August | 86.8 | n/a | 89.7 | 87.5 | 81.6 |
| September | n/a | n/a | 87.7 | 84.1 | 83.9 |
| October | n/a | n/a | 87.5 | 85.6 | 80.7 |
| November | n/a | 85.2 | 86.6 | 83.7 | 83.3 |
| December | n/a | 87.7 | 87.4 | 80.0 | 85.4 |
| Average | 87.3 | 86.3 | 88.2* | 85.8 | 82.7 |
Note: The average gold recovery values for 2009 and 2011 are arithmetic whereas the 2008, 2010, and 2012 averages are weighted averages
The average gold recovery for 2012 and 2011 was 82.7 percent and 85.8 percent, respectively, which is lower than previous years listed in Table 17.2.1. Plant recoveries were lower than planned due to a coarser grind of ore feeding the roasters. This was a result of limiting the recirculating load in tertiary crushing to reduce the ore feeding through to the recently replaced bucket elevator to minimize the risk of failure. It is believed that the lower 2011 gold recoveries were related to equipment issues in the CIL circuit, which reduced leaching retention time and thus gold recovery. Future gold recovery for 2013 is forecast at 86% based on the equipment upgrades made in the early 2012 mill shutdown. The gold recovery for 2010 and 2007 was the same at 88.2 percent. The lower gold recoveries attained in 2008 and 2009 are likely a result of the significant down time for the mill and not being able to maintain steady state production. The authors of this report consider these figures acceptable, given the deposit characteristics and the method of extraction.
| Veris Gold Corp. | |
| NI 43-101 Technical Report Jerritt Canyon Property, Nevada | 17-5 |
17.3 Historic processing plant production and cost data
Table 17.3.1 contains historic production and cost data for the Jerritt Canyon processing plant as well as the budgeted figures for 2011. The Jerritt Canyon process plant operated at only 64% of its design capacity in 2007 due to bull gear problems with the grinding mill. The bull gear was replaced in second quarter 2006. The mine shutdown in August 2008 significantly impacted total mill production figures for
2008 and 2009. In addition unaccounted and “lost” ounces in 2009 and 2010, respectively, along with unexpected NDEP charges increased the processing costs and total costs for these years.
In March 2006, an agreement was reached between Veris (formerly Queenstake) and Newmont USA Limited (Newmont) whereby a minimum of 500,000 tons of ore per year from Newmont operations would be purchased by Veris and processed through the Jerritt Canyon processing plant. This agreement was in effect for two years (2006 and 2007) with an option for three additional years (2008-2010). New agreements were made with Newmont on October 25, 2010 that called for the delivery of 2,000 ore tons/day until December 31, 2010. A subsequent agreement with Newmont signed in April 2011, allowed deliveries of Newmont ore, with no specified quantities, to continue to December 31, 2011.
Table 17.3.1: Jerritt Canyon historic process production and cost data.
| | | Actual | Actual | Actual | Actual | Actual |
| Operating Data | Units | 2008 | 2009 | 2010 | 2011 | 2012 |
| Production Data | | | | | | |
| Tons Processed: | | | | | | |
| Annual(1) | 000’s ktons | 338 | UNK | 600 | 628 | 978 |
| Daily Average | tons | 2,128(1) | UNK | 1,862(1) | 1,853(5) | 3,960(7) |
| Ore Grade | oz Au/ton | 0.160 | UNK | 0.123 | 0.142 | 0.130 |
| Recovery | % | 87.3 | 86.3 | 88.2 | 85.8 | 82.7 |
| Gold Production(2) | 000’s oz | 45 | 10 | 65 | 77 | 106 |
| Cost Data | | | | | | |
| Annual Total Cost(3) | $000’s | 17,508 | 10,437 | 22,150 | 40,505 | 46,888 |
| Unit Processing Costs: | | | | | | |
| Ore | $/ton Milled | 51.75 | UNK | 36.94(4) | 64.46(5) | 47.93 |
| Gold | $/oz Au | 391.68 | 1,068.30(6) | 340.23(4) | 528.89 | 443.90 |
| (1) | Includes actual tonnage (dry) for purchased ores in 2008 and 2010; the plant only operated for 159 days in 2008; |
| (2) | Includes purchased ores for actual 2007, 2008, 2010, and 2011; |
| (3) | Annual total cost excludes Newmont inventory cost; |
| (4) | Processing cost for 2010 is high due to the “loss” of approximately 2,700 oz Au in the process circuit and some large NDEP charges; |
| (5) | Delays in implementing the new mine plan for 2011 resulted in reduced mill throughput for 2011 and therefore increased unit processing costs; |
| (6) | The unit processing cost is high due to poor record keeping of tons processed through the mill by the contract mill operator, because of low Au production for the year, and because the plant only operated for 139 days in 2009; |
| (7) | The mill was down for 118 days in 2012 for various reasons including a winterization shutdown from January 6 to February 2, 2012. |
Since open pit mine production is being proposed at Burns Basin and Saval and other sites that contain lower gold grades than current underground ore head grades, the open pit mine models for this Technical Report have used a historic Au recovery equation for roast ores (Type II ore) that was previously used in
| Veris Gold Corp. | |
| NI 43-101 Technical Report Jerritt Canyon Property, Nevada | 17-6 |
historic Jerritt open pit ore reserve estimates (Birak and Cole; 1990). The linear Au recovery equation is listed below:
- Au recovery = 0.9042x +0.75169 with a cutoff grade of 0.053 opt Au.
This equation calculates a 90 percent recovery at 0.164 opt Au head grade. In addition, this recovery equation was calculated using the tons and grade reported at the fine crushing plant.
The authors of this report consider the projected production and cost estimates achievable, especially with the continued increasing underground ore production from the SSX-Steer mine complex, and the recent startup of production from the Starvation Canyon underground mine in early April, 2013.
| Veris Gold Corp. | |
| NI 43-101 Technical Report Jerritt Canyon Property, Nevada | 18-1 |
18 Project infrastructure
Jerritt Canyon has been in production for many years and has well established infrastructure including: office buildings, warehouse facilities, maintenance shops, laboratory facilities, communication networks, and onsite security. The mineral processing facilities have been described in the previous section.
18.1 Road access
The main access road is approximately 7 miles long and is a 22-foot wide paved road between Nevada highway 225 and the mill site. A 100-foot wide haul road provides access between the major ore-producing mines and the mill site. This road network is approximately 17 miles long.
18.2 Water sources
Water for the mill site comes from two sources: deep underground water wells and a connected series of seepage recovery wells and pumps. All pumping wells are permitted through the Nevada Division of Water Resources water rights. Three potable water systems exist on the property and are permitted as public water supplies.
18.3 Power
Power to the mine site is supplied by NV Energy through a 125kV, 3-phase transmission line. Monthly power consumption over the period from January to March 2011 has varied from 7.3 to 8.2 MWh.
18.4 Sewage and waste disposal
Domestic wastewater (sewage) at the mill site is treated in a packaged wastewater treatment plant. Treatment includes primary settling, air-enhanced digestion, and chlorine disinfection. Treated effluent is disposed of in the tailings storage facility where it infiltrates to the ground. Each of the underground mines has an individual sewage disposal system consisting of a collection system, septic tank, and leach field.
18.5 Ore stockpiles
There are a number of ore stockpiles present at the mine site that are included as resources and reserves. The remote stockpiles are located distal to the mill facilities and are spread throughout the property mostly in the area of the North Generator, Alchem, and Marlboro Canyon open pits and the SSX-Steer mine area. There are also several ore stockpiles located in the Run of Mine area adjacent to the mill. The stockpiles are discussed in detail in section 16.6.
18.6 Tailings facilities
The existing tailings storage facility (TSF-1) was initially designed by Sergent Hauskins & Beckwith (SHB) and was commissioned in 1981. Knight Piesold designed the five subsequent raises, including the final raise (Phase VII) that was constructed in 1998. The primary retention structure of the TSF-1, the East Embankment, is a zoned earthen dam with an upstream low-permeability barrier zone, interior chimney drain, and mass random fill shell. Subsequent raise construction incorporated extension of the barrier and drainage zones. The TSF-1 is currently operated as a managed sub-aerial deposition system. VG has been transferring excess supernatant water to the Evaporation Pond and has been actively evaporating this solution, which is expected to continue for the foreseeable future. At current production rates it is anticipated that the TSF-1 will be filled to its maximum operational capacity by August 2013. The company’s goal is to enter the TSF-1 for closure and reclamation at the point of maximum capacity. A new Tailings Storage Facility (TSF-2) has been constructed and Phase 1 was completed in early December 2012. As-built plan and reports were submitted to the State agencies and approval to operate was granted in January 2013 (Figure 18.6.1 through Figure 18.6.4 below). The Phase 1 construction included a 73 acre tailings storage facility (TSF-2) and a 62 acre water storage reservoir (WSR) that has an East Basin (WSR-E) and a West Basin (WSR-W).
| Veris Gold Corp. | |
| NI 43-101 Technical Report Jerritt Canyon Property, Nevada | 18-2 |
TSF-2 is a double-lined facility. An 80 mil AGRU single-sided micro-spike high density polyethylene (HDPE) primary liner was installed over a 60 mil AGRU HDPE drain liner. This phase will provide 4.5 million tons of storage space for tailings deposited at 85 pounds per cubic foot. This is 3 years of storage at an average production rate of 4,100 tons per day.
WSR is also a double-lined facility. An 80 mil AGRU single-sided micro-spike HDPE primary liner was installed over a 60 mil AGRU HDPE drain liner. The WSR was split into two separate basins by a lined earthen embankment. WSR-E has an operating capacity of 216 million gallons. WSR-W has an operating capacity of 186 million gallons. The combined storage is 402 million gallons. The earthen embankment area provides the necessary area and containment to operate 20 evaporators. As the TSF-1 is closed down, the existing evaporators located there will be utilized for the WSR embankment area. Both basins were approved for operation by the State in August 2012.
Originally budgeted at $39 million, Phase 1 of the project was completed for about $30 million in an 18 month period. Phase 2 of the project provides an additional 3 years of storage capacity in TSF-2 by raising the embankment height.
Additional design data for the planned TSF-2 is provided in the table below and taken from Queenstake Resources USA, Inc. and SRK Consulting, Inc. (2010).
Table 18.6.1: Design criteria for the TSF-2.
Embankment
Phase | Outside Toe
Elevation
(ft amsl) |
Inside Toe Elevation
(ft amsl) | Crest
Elevation
(ft amsl) | Final Embankment
Height
(ft) |
| Phase 1 | 6,269 | 6,322 | 6,372 | 103 |
| Phase 2 | 6,260 | 6,322 | 6,403 | 143 |
Notes: Data from Queenstake Resources USA, Inc. and SRK Consulting, Inc. (2010)
| Veris Gold Corp. | |
| NI 43-101 Technical Report Jerritt Canyon Property, Nevada | 18-3 |
Figure 18.6.1: Construction plan for the TSF-2 and WSF.
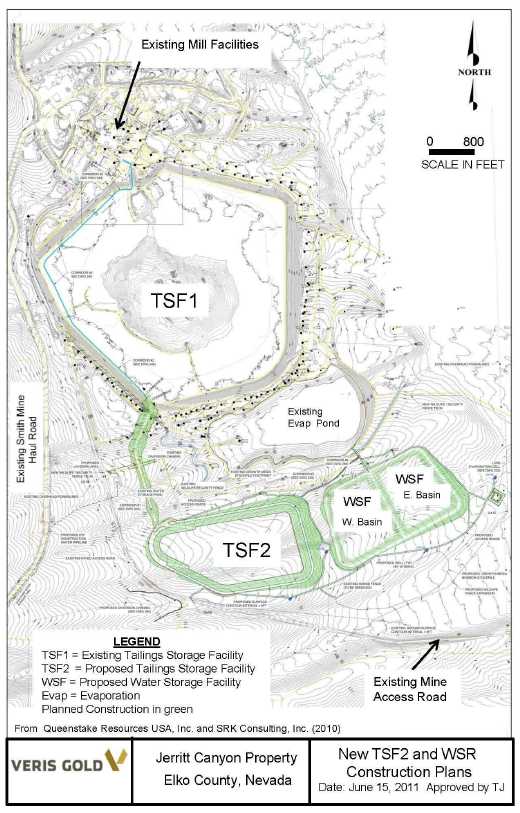
| Veris Gold Corp. | |
| NI 43-101 Technical Report Jerritt Canyon Property, Nevada | 18-4 |
Figure 18.6.2: Aerial view looking north: TSF-2 completed December 7, 2012.
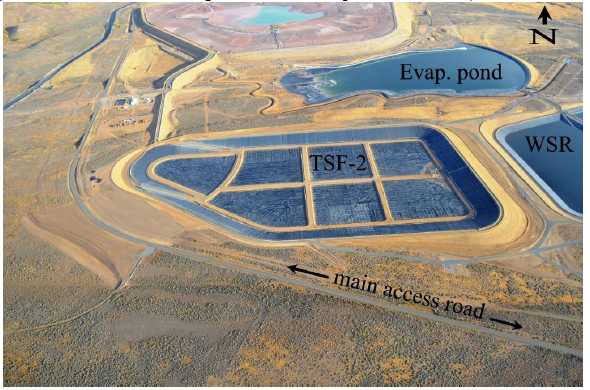
Figure 18.6.3: Aerial view looking east: TSF-2 completed December 7, 2012.
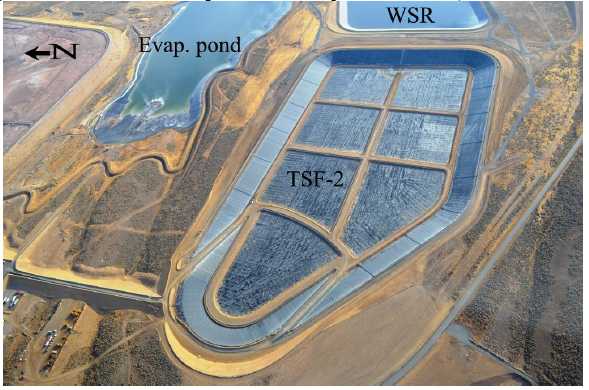
| Veris Gold Corp. | |
| NI 43-101 Technical Report Jerritt Canyon Property, Nevada | 18-5 |
Figure 18.6.4: Aerial view looking west: TSF-2 completed December 7, 2012.
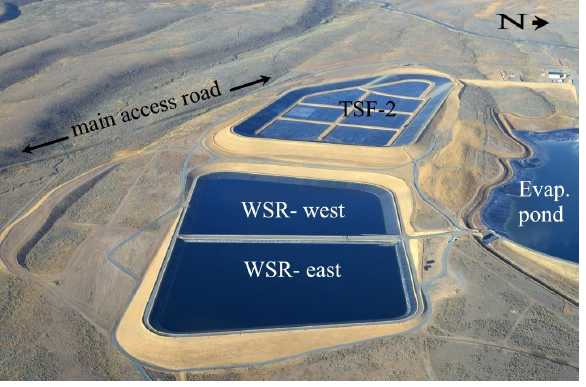
| Veris Gold Corp. | |
| NI 43-101 Technical Report Jerritt Canyon Property, Nevada | 19-1 |
19 Market studies and contracts
19.1 Market studies
Gold markets are mature, global markets with reputable smelters and refiners located throughout the world. Gold prices have increased every year since 2002 and reached record levels in September 2011 when the monthly average price was $1,756 per ounce. The lowest monthly average price in 2012 was recorded in May 2012 at $1,585 per ounce. Gold prices ended the year at $1,689 per ounce. Monthly average gold prices for the past three years and the 36 month trailing average price are shown in Figure 19.1.1. At the end of 2012 the 36 month trailing average price reached $1,490 per ounce while the 24 month trailing price averaged $1,620.
Figure 19.1.1: Monthly gold price 2009– 2012.
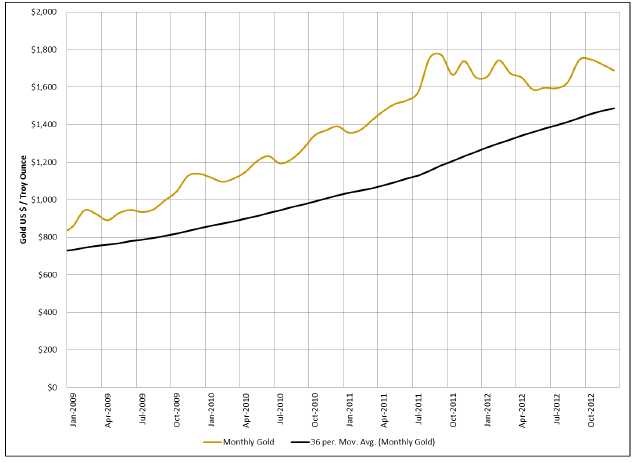
Markets for doré are readily available. Jerritt Canyon ships its doré to the Johnson Matthey refinery in Salt Lake City, Utah.
| Veris Gold Corp. | |
| NI 43-101 Technical Report Jerritt Canyon Property, Nevada | 19-2 |
19.2 Contracts
Jerritt Canyon has operational contracts in place at the present time. Certain exploration drilling activities are under contract. In addition, as of November, 2009, Small Mine Development (SMD) is under contract to perform mining operations at the Smith Mine. The term of the contract is either until 250,000 troy ounces of Au are produced or until September 30, 2012, whichever comes first. Both companies agreed to an extension of this contract in 2012.
Additional contracts with SMD for mining at Starvation Canyon and SSX have been negotiated by the company during 2012.
The company has entered into two gold loan agreements with Duetsche Bank (the first in August 2011 for 173,880 oz and the second in February 2012 for 27,950 oz) to secure the capital funding necessary for the Construction of Tailings Storage Facility 2, replacing the ore dryer, purchasing mining equipment and other capital projects. The terms of these agreements have been incorporated into the financial model used for the evaluation of reserves. As of May 2013, approximately 140,090 oz remained to be delivered over the next 2.5 years.
The company has entered into and is seeking additional toll milling agreements with other mines to process their ores through the Jerritt Canyon Roaster. These ores will be processed using the excess capacity of the Jerritt Roaster and will not interfere with the processing of Jerritt Canyon ores. The costs and cash flows presented in this report exclude any benefit which may be derived from processing third party ores.
These contracts are considered by the primary author to be within industry norms. The Company is focused on restructuring the existing debt facilities through a combination of decreasing monthly commitments under the Senior Secured Gold Forward Facility, and by pursuing options to refinance with extended terms, thereby lowering monthly interest charges and increasing cash flow.
| Veris Gold Corp. | |
| NI 43-101 Technical Report Jerritt Canyon Property, Nevada | 20-1 |
20 Environmental studies, permitting, and social or community impact
Veris has financed the Jerritt Canyon Operations’ reclamation and closure costs by funding a commutation account within a reclamation insurance policy with Chartis Insurance (Chartis). This reclamation insurance policy, and additional cash placed by VUSA in a money market account also with Chartis, collateralizes the surety Chartis provides to government agencies for closure and reclamation. As of early December, 2012, the surety provided to government agencies was US $81,590,537, including the closure and reclamation of the TSF-2, WSR, expanded mining activities, and additional costs mandated by the State for closure of TSF-1.
The Mine Reclamation Plan and Reclamation Cost Estimate dated June 2010 and revised in October 2012 was submitted to the Bureau of Mining Regulation and Reclamation (BMRR) Branch. The required surety to government agencies for reclamation of the private land facilities was $70,015,433. Veris estimates the net present value of its closure and reclamation obligations for the Jerritt Canyon Operations at the end of the mine life to be US $36,407,843.
Permitting activities with the State of Nevada to advance the Starvation Canyon project to an underground mine project have been completed. The Nevada Department of Transportation has been notified of the project ore hauling requirements on state highways.
Environmental management systems are in place and qualified environmental staff on site. Various mitigation programs are in effect as required under the several plans of operations that have been filed and approved for the project. No unusual costs associated with any of these programs were identified.
The surety costs for the agency bond for publically-owned lands are calculated under the U.S. Forest Service bonding guidelines and the surety costs for privately-owned lands are calculated under the requirements of the State of Nevada; this figure includes agency oversight and administration and is described above. The reclamation insurance policy with the Chartis and the additional cash in a money market account with Chartis, provides the collateral for the surety that has been accepted by the regulatory agencies to serve both to fund the physical reclamation and post-closure site management, and meet agency requirements for bonding.
Closure and reclamation will consist of the following actions:
Open pits will be reclaimed by partially backfilling the pits with mine waste rock produced in the underground mining operations. Level areas in the pit bottom will be covered with fine-grained waste rock or growth medium and re-vegetated. Most open pits exist in a near-reclaimed state.
Portals for the underground mines will be sealed by blasting, backfilling or bulk-heading. Raises extending to the surface will be backfilled. Regional groundwater levels are below the elevation of the mine portals or raises, therefore seepage from the mines is not expected.
Waste rock disposal area will be left in a condition meeting slope stability requirements. Portions of the older rock disposal areas will be left with angle of repose side slopes that are covered with durable non-acid generating rock. Other rock disposal areas will have final slopes of 2.5H to 1V. Tops of the rock disposal areas will be graded to route surface water runoff off of the flat surfaces and away from rock disposal area slopes. Level surfaces of the rock disposal areas and the 2.5H to 1V side slopes will be covered with growth media and re-vegetated.
Haul roads and access roads not included in the USFS Travel Management Plan will be re-graded to conform to the original ground contours and re-vegetated. Haul roads that may be left partially reclaimed and permanently open will likely require some level of reclamation to reduce overall road width.
| Veris Gold Corp. | |
| NI 43-101 Technical Report Jerritt Canyon Property, Nevada | 20-2 |
Sediment control structures will be reclaimed by breaching ponds and basins after sediment and erosion control issues are controlled through reclamation of the areas draining to the structures.
TSF-1 will be closed with the construction of a working platform of rock from the spent heap leach and from the DASH East RDA. The working platform will provide the location of forced evaporation of the free surface water and groundwater seepage from TSF-1. The working surface will have a synthetic liner installed with 2 feet of growth medium applied over the liner. Operation of the seepage recovery system will need to continue for a period of time after TSF-1 is closed and seepage ceases. Spent heap leach materials from a leach pad adjacent to the tailings impoundment will be excavated and placed as fill for grading TSF-1.
Solution ponds associated with the heap leach pad and the processing plant will be reclaimed by removing solution from the pond, and disposal of all contained sludge in the tailings impoundment. Pond liners will be folded into the ponds and backfilled. Growth medium will be placed over the backfilled ponds and re-vegetated.
Buildings and structures will be dismantled to the level of foundations and either salvaged or disposed of in an approved landfill. Process piping will be rinsed and neutralized. Disposition of underground piping is not specifically addressed; however SRK would assume it will be necessary to remove all piping.
As the mine life progresses and certain components move to closure, the overall detail of the closure plan may require refinement.
| Veris Gold Corp. | |
| NI 43-101 Technical Report Jerritt Canyon Property, Nevada | 20-3 |
20.1 Environmental issues
Jerritt Canyon has been in operation since 1981. The mine is located primarily on private land controlled by Veris, and public land mostly administered by the United States Forest Service (USFS) and some administered by the Bureau of Land Management (BLM). The project consists of several surface mines; two operating and three non-operating underground mining areas (Murray, MCE, and West Generator); eighteen rock disposal areas (RDAs); related haul roads, maintenance facilities, ancillary structures; and a gold processing circuit, including mill facilities, heap leaching facilities (inactive), tailings facilities, and support facilities.
Major operating permits for the project are in place. Mining and milling are currently operating under a Consent Decree agreement (2009) between VUSA (Formerly Queenstake) and the State of Nevada. Environmental management systems are in place and are managed by an experienced and qualified environmental staff onsite.
Environmental liabilities at the Jerritt Canyon property include:
On July 20, 2009, Queenstake installed a calomel-based scrubber system on the roasters to reduce mercury emissions and to comply with the NDEP and State guidelines. The technology responsible for the calomel-based scrubber system is patent-pending and owned by a senior executive of Veris. Stack tests over the past three years have proven the efficiency of the newly installed emissions control system and meets the requirements in the Consent Decree and/or agreements with the NDEP.
Construction of a new tailings storage facility (TSF-2) and ancillary water storage reservoir (WSR) began in 2011. Construction of the WSR was largely completed in 2012 as was construction of TSF2, with some follow-up corrections to liner systems being required for 2013. Beginning in the second or third quarter of 2013, the TSF-2 will transition as a replacement repository for mill tailings. The existing Tailings Storage Facility (TSF-1) will cease receiving mill tailings no later than January 2014 and will then enter closure and reclamation.
Veris has financed the Jerritt Canyon Operations’ reclamation and closure costs by an insurance policy with Chartis Insurance (Chartis). The capacity of this insurance policy, and additional cash placed by Veris in a money market account also with Chartis, collateralizes the surety Chartis provides to government agencies for closure and reclamation. As of early December 31, 2012, the surety provided to government agencies was US $81,590,537, including the closure and reclamation of the TSF-2, WSR, expanded mining activities, and additional costs mandated by the State for closure of TSF-1. Approximately 40% of the bond costs are related to control and remediation of the seepage from TSF-1. The Mine Reclamation Plan and Reclamation Cost Estimate dated June 2010 and later revised in September 2010 was submitted to the Bureau of Mining Regulation and Reclamation (BMRR) Branch. The bonds costs and the surety placed under this plan are updated annually. The required surety to government agencies for reclamation of the private land facilities was $70,015,433. Queenstake estimates the net present value of to its closure and reclamation obligations for the Jerritt Canyon Operations at the end of the mine life to be US $36,407,843.
20.2 Environmental liabilities
Mr. John Barta, Veris’ Environmental Manager, provided the review of environmental and permitting activities at the Jerritt Canyon Project.
Environmental liabilities at the mine include:
- High sulfate and Total Dissolved Solids (TDS) in surface water seepage from four (RDAs); and
| Veris Gold Corp. | |
| NI 43-101 Technical Report Jerritt Canyon Property, Nevada | 20-4 |
- Site closure and restoration including management of underground seepage from the tailings impoundment.
20.2.1 Waste rock seepage
Since being selected in the 1981 Environmental Impact Statement (EIS), RDA design criteria have resulted in structuring the RDAs to avoid erosion by draining storm water runoff and snowmelt toward the interior of the RDA. These design criteria have resulted in four RDAs that exhibit seepage from the toe of the RDA slope: the Marlboro Canyon, Gracie, Snow Canyon, and DASH East RDAs. The quality of the seepage water does not meet the applicable State water standards. Jerritt Canyon staff has worked with the Nevada Division of Environmental Protection – Bureau of Mining Regulation and Reclamation (NDEP/BMRR) to develop mitigation actions and monitoring plans for these seepages since the late 1990s.
In 1999, the operations tested a biological treatment method for the RDA seepage in a surface sedimentation pond that did not yield sufficient results. In 2003, the operations constructed a test passive treatment works (a biological sulfate reduction trench) for the Marlboro Canyon RDA seepage under the State water pollution control permit. Monitoring of the water from those treatment works has continued since that time. The water from the treatment works has not met applicable water quality standards since late 2004 and the treatment method had not been considered successful. During 2012, the Company evaluated the Marlboro Canyon treatment method and the treatment works. The evaluation showed that the passive biological treatment method was successfully treating the seepage but that the capacity of the treatment works was not sufficient to meet the applicable standards.
During 2012, the Company began testing remedial actions to: 1) diminish the capture and infiltration of precipitation by the RDAs that exhibit seepage and, 2) to diminish RDA seepage to the extent practicable. During 2012, mitigation to diminish seepage was completed on the Gracie RDA; was 90% completed on the Snow Canyon East RDA; and had begun on the Marlboro Canyon RDA. The Company anticipates completing the mitigation on the Snow Canyon East RDA and the Marlboro Canyon RDA during 2013. Monitoring of these seepages will continue to evaluate the success of the mitigation. Permitting requirements for the mitigation to diminish seepage on the DASH East RDA were under review at the end of 2012 and will be scheduled accordingly. The Company anticipates remedial actions that successfully diminish seepage may be incorporated into future designs for RDAs. If the efforts to diminish the flow rates are not sufficient to meet the applicable water quality standards in the RDA seepages, then treatment may become required. During 2012, the Company expanded its efforts to test and evaluate treatment methods.
The Company will test during 2013 the effect of adding a supplement to the inflow to the Marlboro Canyon treatment works in order to improve treatment using the existing treatment works capacity. In 2011 and 2012, a pilot treatment plant was constructed to test on a pilot scale an active chemical treatment method for the DASH East RDA seepage. Testing of this active chemical method is anticipated to begin in the second quarter of 2013. During 2012, and based on the evaluation of the Marlboro Canyon test trench treatment method, the Company submitted plans to the State for pilot treatment works to test biological treatment methods for the DASH East RDA seepage. Testing of biological treatment of the DASH East RDA seepage is anticipated to begin in the second quarter of 2013.
20.2.2 Tailings impoundment seepage control
The first phase of the existing tailings storage facility (TSF-1) was designed in 1979-1980, incorporates an earthen embankment and compacted soil liner, and does not include a synthetic liner as would be typically required today. The first phase of construction was completed in October of 1981. Seepage was first observed in March of 1982 and efforts to control and manage the seepage have continued since that time. The Company expects to initiate the full use of the new Tailings Storage Facility (TSF-2) and ancillary Water Storage Reservoir (WSR) during the second quarter of 2013. The TSF-2 will transition as a replacement repository for TSF-1. It is anticipated that TSF-1 will cease receiving mill tailings no later than January 1, 2014. TSF-1 will then enter closure and reclamation.
| Veris Gold Corp. | |
| NI 43-101 Technical Report Jerritt Canyon Property, Nevada | 20-5 |
20.2.3 Air emissions control technology
In response to requirements under the October 13, 2009 Consent Decree, the Company designed, installed and tested new control technology for mercury emissions for the roasters. The performance tests have proven to be successful, and the technology was installed in all applicable stationary sources of mercury emissions in 2012. New mercury controls for the Refinery were installed in 2012 that do not incorporate the new calomel-based technology as other technology was more appropriate for that unit. Stack tests are being done on a routine basis and monitored by a third party contractor. The new calomel-based controls are performing well and continue surpassing the control limits defined in the Consent Decree and/or agreements with the NDEP. The technology responsible for the calomel-based scrubber system is patent pending and owned by a senior VG executive.
20.2.4 Reclamation bond cost
Approved reclamation and closure plans are in place, and the mine is concurrently reclaiming disturbance when possible. Approximately 25% of the mining disturbances have already been reclaimed and await release of the re-vegetation requirement. Mine staff and the USFS/NDEP update the reclamation bond on an annual basis.
Veris has financed the Jerritt Canyon reclamation and closure costs by funding a commutation account within an insurance policy with Chartis Insurance (Chartis). This insurance policy, and additional cash placed by Queenstake in a money market account also with Chartis, together collateralizes the surety Chartis provides to government agencies for closure and reclamation. As of early December 2012, the surety provided to government agencies was US$73,663,796, including the closure and reclamation of the TSF-2, WSR, expanded mining activities, and additional costs mandated by the State for closure of TSF-1. Approximately 45% of the bond costs are related to control and remedy of the seepage from TSF-1. The Mine Reclamation Plan and Reclamation Cost Estimate dated June 2010, and revised in October 2012, were submitted to the USFS Nevada Bureau of Mining Regulation and Reclamation (BMRR) Branch. The required surety to government agencies for reclamation of the private land facilities was $62,391,120. Veris estimates the net present value of to its closure and reclamation obligations for the Jerritt Canyon Operations at the end of the mine life to be US$33,849,619. Bond increases are a result of more surface disturbance, increased unit costs (labor, equipment, and fuel costs) and increased remedial restoration actions mandated by government agencies.
20.3 Permits
Operating permits for the mine are in place and are presented in Table 20.3.1. The mine is currently operating under a Consent Decree agreement (2009) between Queenstake and the State of Nevada. Environmental management systems are in place and are managed by an experienced and qualified onsite environmental staff. Operating and maintenance staffs are informed of their responsibilities during annual MSHA refresher classes. In addition to MSHA classes, the mine holds leadership classes for the supervisory staff. During these classes, supervisors are informed of their environmental responsibilities.
Permitting activities with the State of Nevada are completed at the Starvation Canyon underground mine project as of the filing date of this report and the mine production commenced in early April 2013. Queenstake has secured the Water Pollution Control Permit for this project and the Reclamation permit, including the bonding. Groundwater monitoring is in progress. The Nevada Highway Department was notified that Starvation Canyon ore is being hauled on State Highways to the Jerritt Canyon Processing Facility.
| Veris Gold Corp. | |
| NI 43-101 Technical Report Jerritt Canyon Property, Nevada | 20-6 |
Table 20.3.1: Operating permits.
Permit/Approval | | Granting Agency | | Comments |
Plan of Operations | | USFS | | Still active. |
Work Plans | | USFS | | Annual work plan submitted to USFS and NDEP |
Clean Water Act Section 404 Permit | | U.S. Army Corps of Engineers | | Expired in 2007. There are no triggers currently identified requiring an update. |
EPA ID Number | | U.S. Environmental Protection Agency | | The Mine, a large-quantity generator, has the typical hazardous wastes found at a mine such as laboratory cupels and crucibles, and cleaners from maintenance operations. Wastes are accumulated and full drums are shipped once every calendar quarter for disposal. |
Air Quality Permit | | Nevada Division of Environmental Protection (NDEP)/ Bureau of Air Pollution Control | | The Mine has a current Title V air permit. Improved pollution controls for mercury emissions and expanded monitoring and management systems developed under the Consent Decree are being incorporated in the permit. |
Reclamation Permit | | USFS and NDEP/ Bureau of Mining Regulation and Reclamation (BMRR) | | The bond estimate is updated annually with the USFS and the NDEP. The bonding includes the construction of the new tailings storage facility (TSF), water storage reservoir, expanded mining activities, and additional costs for the closure of the existing TSF. |
Water Pollution Control Permit | | NDEP-BMRR | | One water pollution control permit covers the entire mine area. The tailings seepage/chloride plume is managed by a recovery system and will be mitigated by closure of the existing TSF; and the high sulfate/total dissolved solids emanating from four rock disposal areas will be diminished by improved reclamation and surface water controls. |
Underground Injection Control | | NDEP/ Bureau of Water Pollution Control | | Addresses dewatering from the underground mines. There is currently no active underground injection. |
Solid Waste Class III Landfill Waiver | | NDEP/ Bureau of Solid Waste | | The Mine has three authorized landfills at the lower mill area, Burns Basin, and Alchem. Employees are instructed during annual MSHA refreshers with regard to what is acceptable to dispose of in the landfill. |
General Stormwater Discharge Permit NVR300000 | | NDEP/Bureau of Water Pollution Control | | Annual reports are submitted to NDEP. No concerns have been noted. A general permit is in place. No concerns were noted. |
Permit to Appropriate Waters | | NV Division of Water Resources | | No concerns were identified. The Mine has sufficient appropriations to cover processing and dewatering needs. |
Permit to Construct Impoundments/Dam Safety | | NV Division of Water Resources | | No concerns identified. |
Industrial Artificial Pond Permits | | Nevada Department of Wildlife | | No concerns identified. |
Liquefied Petroleum Gas License | | NV Board of the Regulation of Liquefied Petroleum Gas | | No concerns identified. |
Potable Water System | | Nevada State Health Division | | Potable water systems are located at the Murray, SSX, and at the mill site. Upgrades are underway in 2012 for the SSX and mill site systems. |
Septic System Permit | | Nevada State Health Division | | The Mine has general permits for five systems: SSX; Steer; Murray; USA; and Smith. The mill site has a package plant that discharges to the tailings impoundment. No concerns identified. |
Mr. John Barta, VUSA Environmental Manager, provided a written update to the Jerritt Canyon Environmental and Permitting status on March 22, 2013. This information has been reviewed by the primary author and judged to be complete.
| Veris Gold Corp. | |
| NI 43-101 Technical Report Jerritt Canyon Property, Nevada | 21-1 |
21 Capital and operating costs
21.1 Capital costs
Jerritt Canyon is forecasting a capital expenditure of $192 million over the coming six year period for mine-related capital items. Underground mine development is the largest capital requirement and accounts for $112M of total capital spending. Mining and processing facilities total $39M and include $38M for dewatering wells, treatment plant and disposal systems. Geology and drilling will require $12.1M. Mining equipment and sustaining capital total $29.2M. A breakdown by area is given in the table below.
Table 21.1.1: Jerritt Canyon Life of Mine (LoM) capital expenditures ($000’s).
| Area | Equipment | Facilities | Mine
Development | Total |
| Smith | $0 | $25,000 | $51,697 | $76,697 |
| SSX Complex | $0 | $8,000 | $29,470 | $37,470 |
| Saval UG | $4,394 | $630 | $10,095 | $15,119 |
| Starvation | $7,593 | $910 | $9,270 | $17,773 |
| Murray | $12,839 | $4,660 | $10,945 | $28,444 |
| Burns Basin | | | $100 | $100 |
| Mill Creek | | | $200 | $200 |
| Saval OP | | | $100 | $100 |
| Wright Window | | | $200 | $200 |
| Process | $2,020 | | | $2,020 |
| Administration | $1,010 | | | $1,010 |
| Geology/Drilling | | | $12,120 | $12,120 |
| TSF | | | | $0 |
| Total | $27,856 | $39,200 | $123,598 | $191,254 |
21.2 Operating costs
Actual operating costs for 2012 were reviewed and form the basis of the processing and administrative cost projections. Processing costs were categorized as variable if it is a function of process throughput or fixed if it is independent of process throughput. Additionally some cost accounts will see an improvement in efficiency with the completion of the plant upgrades and also achieving planned processing rates. As a result of this analysis a linear function relating throughput to processing cost was developed.
Processing Cost US $/Ton= 18.74 + 25,000,000 I tons processed per annum.
An annual plant processing rate of 1,500,000 tons per year yields a unit processing cost of $35.41 / ton.
All administrative costs were classified as fixed and totaled $17,000,000 in 2012. At the planned 1.5M tons/year rate this equates to $11.33/ ore ton.
During 2011 and 2012, off site refining charges averaged $0.40/oz. of recovered gold.
| Veris Gold Corp. | |
| NI 43-101 Technical Report Jerritt Canyon Property, Nevada | 21-2 |
The company began using its own crews and equipment for underground mining at SSX late in 2011 and continued buildup to a steady state production level in 2012 and does not have sufficient cost history to permit the use of actual cost projections. Practical Mining estimated the underground mining costs using local labor rates and consumable costs and applied these to the cutoff grade calculations and financial modeling. Variations in mining costs between the different underground mines is the result of varying proportions of stoping, ore development drifting, backfill volumes, expensed waste drifting and dewatering requirements.
The contract with Small Mine Development for mining at the Smith Mine was extended in 2012.
Open pit mining costs are based on similar operations and include a premium for employing a contractor to exploit the open pit reserves. The base price for open pit mining is $2.75/ton mined.
Finally ore haulage costs to the process facility were estimated for each deposit using the total haulage distance and grade profile. The average costs over the life of mine for each area are shown below.
Table 21.2.1: Jerritt Canyon Life of Mine (LoM) operating costs (US $/OreTon).
Area
|
Mining
| Ore
Haulage |
Processing
| Site
Overhead |
Total
|
| Underground | | | | | |
| Smith | $91.03 | $1.48 | $41.93 | $15.77 | $150.21 |
| SSX Complex | $86.83 | $4.13 | $38.52 | $13.45 | $142.92 |
| Saval UG | $91.02 | $4.62 | $35.89 | $11.66 | $143.20 |
| Starvation | $79.15 | $8.40 | $36.38 | $12.00 | $135.92 |
| Murray | $74.52 | $3.52 | $41.96 | $15.79 | $135.79 |
| Open Pit | | | | | |
| Burns Basin | $66.39 | $4.13 | $35.60 | $11.47 | $117.59 |
| Mill Creek | $35.04 | $6.72 | $36.56 | $12.12 | $90.44 |
| Saval OP | $58.84 | $4.16 | $36.56 | $12.12 | $111.68 |
| Wright Window | $8.03 | $3.48 | $36.56 | $12.12 | $60.19 |
| Stockpiles | - | $2.85 | $38.15 | $13.20 | $54.20 |
| LOM Average | $80.18 | $3.59 | $39.54 | $14.15 | $137.46 |
21.3 Cutoff grades
In order to determine the portion of the Measured and Indicated resources that would qualify for Proven and Probable reserve status, it is necessary to configure the Measured and Indicated resources into mineable shapes for the selected mining method, and then apply economic tests for establishing validity that the reserve blocks will, indeed, show positive economics.
The economic exercise for this reserve study is normally accomplished by calculating a breakeven cutoff grade, stated in ounces of gold per ton (oz Au/ton), which equates the total operating costs at the property with gold recovery from the process plant, and the expected return from gold sales. Total costs include mining, processing, assessed charges, and site administrative costs. Process recovery is a function of grade and is expected to average 8.9 % over the 6 year reserve life of mine plan. Revenues reflect an average gold price experienced during the previous three years, after subtraction of refining charges.
Incremental cut off grades are sometimes employed where certain costs have already been expended (sunk costs), and the block now must cover only the remaining down-stream charges. This material can either be stockpiled for processing later in the mine life or added to the process stream if there is unused capacity. An example is mineralized material which must be mined in order to gain access to stopes that lie beyond. Now that the drilling, blasting, loading and underground haulage have been expended, it may be possible that the rock contains sufficient gold to pay for surface hauling to the process plant or stockpile, and the process costs as well, rather than being carried to a waste dump for disposal. An incremental cutoff grade calculation at this point will be lower than a breakeven grade, but this material should provide a positive contribution to the operations cash flow.
| Veris Gold Corp. | |
| NI 43-101 Technical Report Jerritt Canyon Property, Nevada | 21-3 |
The accepted formulas for calculating cutoff grade are given below:
| Breakeven Cutoff grade | = | Total Costs of Production |
| | | (Gold Price – Deducts) x Process Recovery |
| | | |
| | | |
| Incremental Cutoff grade | = | Remaining Production Costs |
| | | (Gold Price – Deducts) x Process Recovery |
Table 21.3.1 and Table 21.3.2 give the cut off grades calculated for each mining area at both the resource price of $1,620 per ounce and the reserve price of $1,490 per ounce.
Table 21.3.1: Jerritt Canyon resource cut off grades at US $1,620/oz.
Material Source
| Incremental
Cut off
(opt) | Breakeven
Cut off
(opt) |
| Underground | | |
| Smith - Non Royalty | 0.038 | 0.098 |
| Smith - Royalty | 0.040 | 0.103 |
| SSX – Non Royalty | 0.040 | 0.100 |
| SSX - Royalty | 0.042 | 0.105 |
| Saval UG - Royalty | 0.042 | 0.105 |
| Murray | 0.040 | 0.101 |
| Starvation | 0.045 | 0.108 |
| Winters Creek | 0.038 | 0.098 |
| Open Pit | | |
| Burns Basin | 0.040 | |
| Mill Creek | 0.042 | |
| Saval OP | 0.040 | |
| Wright Window | 0.040 | |
| Pie Creek | 0.042 | |
| Road Canyon | 0.042 | |
| Veris Gold Corp. | |
| NI 43-101 Technical Report Jerritt Canyon Property, Nevada | 21-4 |
Table 21.3.2: Jerritt Canyon reserve cut off gradesat US $1,490/oz.
Material Source
| Incremental
Cut off
(opt) | Breakeven
Cut off
(opt) |
| Underground | | |
| Smith - Non Royalty | 0.041 | 0.106 |
| Smith - Royalty | 0.044 | 0.111 |
| SSX – Non Royalty | 0.043 | 0.108 |
| SSX - Royalty | 0.046 | 0.113 |
| Saval UG | 0.046 | 0.113 |
| Murray | 0.043 | 0.109 |
| Starvation | 0.047 | 0.116 |
| Open Pit | | |
| Burns Basin | 0.044 | |
| Mill Creek | 0.046 | |
| Saval OP | 0.044 | |
| Wright Window | 0.043 | |
| Veris Gold Corp. | |
| NI 43-101 Technical Report Jerritt Canyon Property, Nevada | 22-1 |
22 Economic analysis
The LoM plan, technical and economic projections in the LoM model include forward looking statements that are not historical facts and are required in accordance with the reporting requirements of the Canadian Securities and Exchange. These forward looking statements are estimates and involve risks and uncertainties that could cause actual results to differ materially. The LoM plan presented includes proven and probable reserves only.
22.1 LoM plan and economics
The annual production schedule from each mine used as the basis for the life of mine plan and economic analysis is presented in the table below. The Smith Mine will need to increase production from the current rate of 1250 tpd to 1480 tpd for three years beginning in 2015 in order for mining at Smith and SSX to conclude concurrently.
Table 22.1.1: Life of Mine production schedule (ktpy).
| Mine | 2013 | 2014 | 2015 | 2016 | 2017 | 2018 | Total |
| Smith | 434 | 428 | 532 | 569 | 540 | 510 | 3,012 |
| SSX Complex | 396 | 364 | 343 | 174 | 211 | 55 | 1,542 |
| Saval UG | 20 | 102 | 58 | | | | 180 |
| Starvation | 234 | 313 | 308 | 106 | | | 961 |
| Murray | | 13 | 69 | 161 | 210 | 43 | 495 |
| Burns Basin | | 281 | 178 | | | | 458 |
| Mill Creek | | | | 197 | | | 197 |
| Saval OP | | | | 83 | | | 83 |
| Wright Window | | | | 114 | | | 114 |
| Stockpile | 204 | | | | | | 204 |
| Total | 1,288 | 1,500 | 1,453 | 1,403 | 961 | 608 | 7,211 |
| Gold Grade (opt) | 0.155 | 0.150 | 0.162 | 0.141 | 0.183 | 0.168 | 0.157 |
The income statement, cash flow statement and summary statistics are presented in Tables 22.1.2 through 22.1.4. These tables are produced from the capital and operating costs presented in the previous section and the production schedule given above.
The Jerritt Canyon Mine has a positive cash flow in all years except 2013 and 2014 which have significant underground development costs. Other statistics indicate robust economics at the reserve gold price of $1,490/ounce. The average gold sales price net of the gold loans is $1,356 per ounce.
The gold loans entered into in 2011 and 2012 with Deutsche Bank require repayments to follow a specified schedule. When the gold is delivered, Veris Gold will receive the market price less $850 per ounce. The reduction in revenues is reflected as an adjustment to revenue when the gold is delivered to Deutsche Bank. In the financial evaluation the market price is assumed to be the three year trailing average gold price of $1,490 per ounce.
| Veris Gold Corp. | |
| NI 43-101 Technical Report Jerritt Canyon Property, Nevada | 22-2 |
Table 22.1.2: Income statement 2013 to 2018($000’s).
| | 2013 | 2014 | 2015 | 2016 | 2017 | 2018 | Total |
| Gold Sales | $212,581 | $246,765 | $281,721 | $260,351 | $233,574 | $136,057 | $1,371,049 |
| Operating Costs | ($165,602) | ($203,389) | ($188,759) | ($173,890) | ($148,457) | ($111,086) | ($991,182) |
| G & A Costs | ($4,111) | ($5,532) | ($7,759) | ($6,525) | ($6,085) | ($3,161) | ($33,174) |
| EBITDA | 42,867.8 | 37,844.3 | 85,202.5 | 79,936.0 | 79,032.2 | 21,809.8 | $346,693 |
| Reclamation Accrual | ($582) | ($876) | ($841) | ($1,036) | ($481) | ($284) | ($4,100) |
| Depreciation | (10,317) | (26,158) | (36,334) | (38,033) | (51,108) | (29,306) | ($191,254) |
| Pre Tax Income | 31,969 | 10,811 | 48,027 | 40,866 | 27,444 | (7,778) | $151,339 |
| Income Tax | $0 | $0 | $0 | ($334) | ($1,890) | $0 | ($2,224) |
| Net Income | 31,969 | 10,811 | 48,027 | 40,533 | 25,554 | (7,778) | $149,115 |
Veris has previous year tax losses to apply against future federal tax liabilities. These losses will be exhausted by year end 2016. Federal taxes are calculated at the 35% US corporate tax rate. The 5% Nevada Net Proceeds tax is included in G&A costs. Payroll, employment taxes and sales taxes are included with labor and supplies costs.
Table 22.1.3: Cash flow statement 2013 to 2019($000’s).
| | 2013 | 2014 | 2015 | 2016 | 2017 | 2018 | 2019 | Total |
| Net Income | 31,969 | 10,811 | 48,027 | 40,533 | 25,554 | (7,778) | $149,115 | 31,969 |
| Depreciation | $10,317 | $26,158 | $36,334 | $38,033 | $51,108 | $29,306 | $0 | $191,254 |
| Reclamation | ($1,768) | ($74) | $391 | $686 | $481 | $284 | $0 | ($0) |
| Working Capital | ($4,236) | ($4,524) | $1,431 | $1,858 | 2,985 | $4,649 | ($2,164) | $0 |
| Oper. Cash Flow | 36,282 | 32,370 | 86,184 | 81,115 | 80,127 | 26,459 | (2,164) | $340,369 |
| Capital Costs | (53,129) | (57,084) | (28,862) | (32,900) | (15,645) | (3,634) | $0 | ($191,254) |
| Net Cash Flow | (16,847) | (24,713) | 57,322 | 48,210 | 64,482 | 22,825 | (2,164) | $149,114 |
| Veris Gold Corp. | |
| NI 43-101 Technical Report Jerritt Canyon Property, Nevada | 22-3 |
Table 22.1.4: Key operating and financial statistics.
| Description | Value |
| Ore Processed (kt) | 7,211 |
| Avg. Gold Grade (OPT) | 0.157 |
| Contained Gold (koz) | 1,138 |
| Avg. Metallurgical Recovery | 88.9% |
| Recovered Gold (koz) | 1,011 |
| Mine Life (years) | 6 |
| Cash Cost ($/oz) | $1,013 |
| Total Cost ($/oz.) | $1,206 |
| Avg. Gold Sales Price ($/oz.)(1) | $1,356 |
| Payback Period (years) | 2.8 |
| Capital Cost ($ Millions) | $191 |
| Cash Flow ($ Millions) | $149 |
| 5% Discounted Cash Flow ($ Millions) | $123 |
| 10% Discounted Cash Flow ($ Millions) | $101 |
| IRR | 87% |
| Profitability Index | 1.6 |
22.2 Project sensitivity
The sensitivity of NPV and IRR to variations in gold prices, capital and operating costs is shown below. An 8% decrease in gold prices will result in a NPV of zero. However the project is less sensitive to variations in operating or capital costs.
| Veris Gold Corp. | |
| NI 43-101 Technical Report Jerritt Canyon Property, Nevada | 22-4 |
Figure 22.2.1: NPV sensitivity.
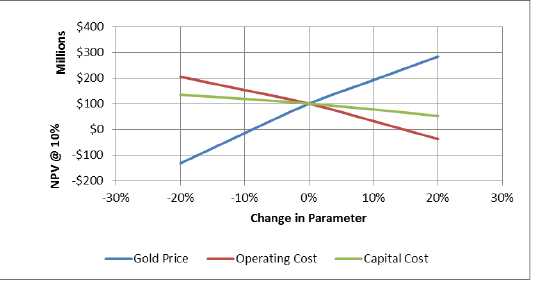
Figure 22.2.2: IRR sensitivity.
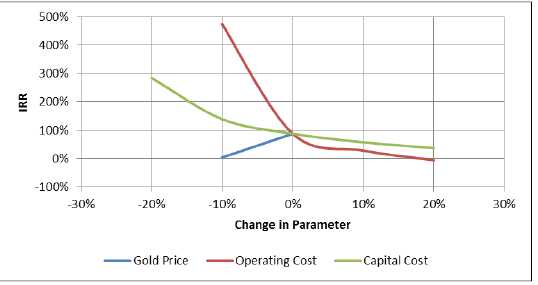
| Veris Gold Corp. | |
| NI 43-101 Technical Report Jerritt Canyon Property, Nevada | 23-1 |
23 Adjacent properties
The Big Springs District is located approximately 10 miles north of the Jerritt Canyon property in the northernmost portion of the Independence Mountains, Elko County, Nevada and contains several small NI 43-101 inferred resources (Big Springs, Dorsey Creek, and Mac Ridge) reportedly totalling 1.2 million ounces using a 0.025 opt Au cu-toff (Peatfield and Rozelle, 2006). These resources are currently owned by MRG Copper LLC which is a US subsidiary of Big Springs Project Pty Ltd. and which is concurrently being acquired by Anova Metals Limited. The Golden Dome and Jack Creek exploration properties are also located near the Big Springs District.
The Big Springs District was previously operated by former owners and operators at Jerritt Canyon and reportedly produced 386,000 ounces of Au from 1987 to 1993 from seven separate open pit deposits that had an average grade of 0.12 opt Au (Adams, 1996). A heap leach facility was constructed in 1987 and the first gold pour occurred in September 1987 (Adams, 1996). A 1000 – tpd mill and fluid bed roaster became operational in May of 1989 (Adams, 1996). The deposits are structurally controlled and occur primarily in allochthonous rocks of the Devonian to Permian Schoonover Sequence (Adams, 1996). There is currently no mining activity at the Big Springs District.
The Qualified Person for this report, Todd Johnson, has not verified the above resource information for the Big Springs District published by Peatfield and Rozelle (2006) or Adams (1996). In addition, the information provided in the Technical Report by Peatfield and Rozelle (2006) and in Adams (1996) is not necessarily indicative of the mineralization on the Jerritt Canyon property.
| Veris Gold Corp. | |
| NI 43-101 Technical Report Jerritt Canyon Property, Nevada | 24-1 |
24 Other relevant data and information
We note that Veris signed an agreement in early 2011 to purchase ore from Newmont that allowed Veris to utilize the full capacity of the mill. Negotiations are currently ongoing with Newmont to finalize a similar agreement for 2013. The mill capacity exceeds the supply of ores from Jerritt Canyon so processing of third party ores sourced outside Jerritt Canyon could provide additional revenues and lower the overall unit cost for processing and administration.
Veris will pursue an aggressive program of resource development in order to convert a large portion of the measured and indicated resources not in reserves into proven and probable reserves. Based on historic conversion rates and exploration success, there is a reasonable expectation of converting a portion of Jerritt Canyon’s resources to reserves. In particular, significant opportunities exist at the Jerritt Canyon property to extend and/or deepen the existing open pits based on exploration potential and higher relative gold prices today relative to when the pits were originally mined. A significant amount of the future drilling will be targeting these open-pit opportunities.
As underground mining develops new resources and reserves, favorable drill platforms are created to explore for and delineate additional resources that were previously cost prohibitive or unreachable from the existing drill platforms. This is evidenced by: (1) the recent start of a 1,080 foot long drift from Zone 1 of the SSX mine that will extend to the Zone 9 West Mahala inferred resource; and (2) the planned reopening of the Murray Mine and subsequent development of new reserves to the west which will provide a platform to explore a potential area extending 2,000 feet along strike that has seen little exploration activity.
As of early April 2013, the Company has recently entered into two toll-milling contracts with other Companies that own adjacent Nevada gold properties that will help maximize Jerritt Canyon mill throughput and lower production costs and increase revenue. Additional toll milling ore and ore concentrate purchase opportunities are currently under review by the Company.
The authors are not aware of any other relevant data or information not already presented in this report.
| Veris Gold Corp. | |
| NI 43-101 Technical Report Jerritt Canyon Property, Nevada | 25-1 |
25 Interpretations and conclusions
Recent improvements to the Jerritt Canyon Roaster Facility have removed some of the limitations on plant throughput and will allow the processing of 1.5M tons per year or more in 2013 and beyond. Production of 1,250 tons per day of ore from each the Smith and SSX mines is the cornerstone of the Life of Mine plan. The additional planned 600 tons per day of ore production from the Starvation Canyon mine starting in June 2013 and the planned start-up of Saval 4 underground mine in Quarter 3 of 2013 will help increase total gold production in 2013.
Additional resources from stockpiles and other mining areas will be required to keep the plant running at designed rates and maintain favorable processing and administration costs. Recently secured contracts to process third-party ores at the Jerritt Canyon processing facility will help Veris maintain desired throughput rates and delay mining and processing high cost high strip ratio open pit ores.
Other potential ore sources not listed above that could feed the Jerritt Canyon mill in the future with additional work or effort includes:
| | 1. | other resources at the Jerritt Canyon property that require drilling to define and convert to reserves (e.g. open pit areas and near-mine resource conversion targets that are being pursued in the 2013 drilling program); |
| | | |
| | 2. | purchased ores; and |
| | | |
| | 3. | toll milling of ores or ore concentrates. |
The authors consider the Jerritt Canyon Mine to be a relatively low-risk project for the next 6 years considering the amount of proven and probable reserves currently defined at the Smith and SSX underground mines, and based on the abundance of Jerritt stockpile ores at the site that currently meet cutoff grade to haul to the mill and process. Existing contracts and discussions with other mining companies are currently in place to allow the purchase of additional ores to help feed the Jerritt Canyon mill and keep it operating at near full capacity. These additional ore sources must be developed and placed in production in a timely manner to provide a constant supply of the ores necessary to keep the plant operating at planned rates and efficiencies.
| Veris Gold Corp. | |
| NI 43-101 Technical Report Jerritt Canyon Property, Nevada | 26-1 |
26 Recommendations
26.1 Dewatering
Approximately 234,000 ounces of reserves lie below the water table at the Smith, SSX and Murray mines. Mining of these reserves is planned to begin in 2015. Exploitation of these reserves will require a water management plan that sources all process make up water from the dewatering wells along with water treatment to achieve levels of arsenic, antimony and total dissolved solids acceptable for disposal in a rapid infiltration basin. Final engineering and permitting of these facilities must begin early in 2013 in order to meet the production requirements of the Life of Mine Plan.
26.2 2013 Geological program
The proposed 2013 Jerritt Canyon geological program will be implemented in one to four separate phases and is summarized in Table 26.2.1. If all four phases are conducted, the total cost of the geological program is estimated at $12.1 million dollars. The four planned phases of work are contingent on the success of the beginning phases and the level of funding that is allocated. The Phase 1 underground diamond drilling at SSX-Steer will include at least one underground drill and will increase to two drills if the planned exploration drift is constructed from SSX Zone 1 to Zone 9. The Phase 1 surface drilling (28,000 feet of reverse-circulation and diamond drilling) will first be undertaken at Mahala and later at the ND fault trend and California Mountain targets. Phase 2 surface drilling will target the West Starvation target and other anomalies adjacent to the Starvation Canyon mine. If Phase 2 is completed with successful results (7,500 feet of surface reverse circulation drilling), then Phase 3 (25,000 feet of surface drilling) will be undertaken. Success will be determined by reviewing the assay results in respect to interpreted geology and mineralization trends. Subsequent analysis will help determine which directions to offset subsequent drilling to target known mineralization.
Drilling will consist of a maximum of 60,000 feet for surface reverse circulation drilling method, and 109,500 feet for underground diamond core drilling method - both of which will target near-mine resource conversion, resource expansion, and exploration. A portion of the surface reverse circulation drilling will focus on stand-alone exploration targets both proximal and distal to existing, and planned, infrastructure. Further exploration drilling at other targets in the southern part of the Jerritt District is targeting the West Starvation target, areas adjacent to the Starvation Canyon Mine, and Pie Creek and Warm Creek. Underground core drilling will continue at the SSX-Steer mine throughout 2013.
| Veris Gold Corp. | |
| NI 43-101 Technical Report Jerritt Canyon Property, Nevada | 26-2 |
Table 26.2.1: Proposed 2013 Jerritt Canyon drilling and geology program ($M).
Description | Drill
Footage | Drilling
Budget ($) | Other
Budget ($) | Total Budget
($) |
| Surface Drilling (Phase 1) | | | | |
| Mahala/ND/Calif. Mtn. | 28,000 | 1.61 | 0.65 | 2.26 |
| | | | | |
| Surface Drilling (Phase 2) | | | | |
| Starvation Canyon | 7,500 | 0.30 | 0.11 | 0.41 |
| | | | | |
| Surface Drilling (Phase 3) | | | | |
| Burns Basin/Saval/Pattani | 25,000 | 1.0 | 0.37 | 1.37 |
| | | | | |
| Surface Drilling (Phase 4) | | | | |
| Pie Creek/Warm Creek | 7,500 | 0.30 | 0.11 | 0.41 |
| Surface Total | 68,000 | 3.21 | 1.24 | 4.45 |
| UG Diamond Drilling-SSX-Steer (Phase 1) | 109,500 | 4.93 | 0.78 | 5.71 |
| Operating Expenses | | | 1.96 | 1.96 |
| | | | | |
| Total (for Phases 1-4) | 177,500 ft | 8.14 | 3.98 | 12.12 |
| (1) | Mahala targeting Zone 1, Zone 9 (West Mahala), East Dash, and ore trend extensions at the Smith Mine; |
| (2) | “Other Budget $” includes costs for: assays, core processing, surface road/pad building, downhole surveys, and supplies |
The Jerritt Canyon 2013 drill program plan is budgeted for both surface and underground drilling with underground drilling being the priority. If moneys allow, the surface program will utilize 1 to 2 drilling rigs and is expected to start in early June or July and last 2 to 6 months until mid-December at the latest. An underground diamond drill rig is currently drilling core at the SSX-Steer mine. In 2013 an exploration drift is planned for construction that will start from the existing SSX Zone 1 drift and eventually end in proximity to the Zone 9 West Mahala resource that is mostly inferred. It is envisioned that a second diamond drill rig will be used to help conduct additional underground drilling in the SSX Zone 1/West Mahala area. This drift will allow drilling to help convert inferred resources at Zone 9 to indicated and in addition be used to establish drill stations for near-mine exploration.
The direct and indirect cost for underground diamond (core) drilling has been budgeted at $45.00 per foot. The direct and indirect surface RC drilling cost on a per foot basis has been budgeted at $40.00 per foot. The direct and indirect surface diamond drilling cost on a per foot basis has been budgeted at $101 per foot. All “other” costs related to the core and RC drilling has been accounted for in the drilling costs noted above. Staffing costs are included in the operating expenses and include 4 to 5 full-time geologists, one database and ARCGIS mapping technical person, one part-time geological modeler, and corporate geological management.
The primary author and Qualified Person for this technical report, Todd Johnson, has reviewed the proposed 2013 geological plan and believe that it is adequate and well planned with estimated costs that are in line with industry standards.
| Veris Gold Corp. | |
| NI 43-101 Technical Report Jerritt Canyon Property, Nevada | 27-1 |
27 References
Adams, O.F., 1996, Stratigraphy, structure, and exploration potential of the Big Springs gold deposits, Northern Independence Range, Nevada, in Coyner, A.R., and Fahey, P.L., eds., Geology and Ore Deposits of the American Cordillera: Geol. Society of Nevada Symposium Proceedings, Reno/Sparks, Nevada, April 1995, p. 1-13.
Barta, John (June 10, 2011), Personal communication with Mr. John Barta (VUSA Environmental Manager at the Jerritt Canyon Mine) and Todd Johnson (VG), June 10, 2011.
Birak, D.J., and Cole, A.P., 1990, Floating recovery function for Cut off grade analysis, internal Independence Mining Company Inc. memorandum, used in the geological and ore reserves, 3 pp. CIM (November 27, 2010), CIM Definition Standards – For Mineral Resources and Mineral Reserves, Prepared by the CIM Standing Committee on Reserve Definitions, Adopted by CIM Council on November 27, 2010,www.cim.org, 10 pp.
Consent Decree, (October 9, 2009), State of Nevada, Department of Conservation and Natural Resources, Division of Environmental Protection (Plaintiff) v. Queenstake Resources USA Inc. (Defendant) – In the Fourth Judicial District Court of the State of Nevada in and for the County of Elko, Attorney General’s Office, Carson City, Nevada, Case No. CV-C-09-86, 43 pp.
Daly, W.E., Doe, T.C., and Loranger, R.J., 1991, Geology of the Northern Independence Mountains, Elko, County, Nevada: in Raines, G.L., Lisle, R.E., Schafer, R.W. Wilkinson, W.H., eds., Geology and Ore Deposits of the Great Basin: Geological Society of Nevada Symposium, Reno, Nevada, Proceedings, p. 583-602.
Eliason, R. and Wilton, T., Relation of Gold Mineralization to Structure in the Jerritt Canyon Mining District, Nevada, in Rhoden, H.N., Steininger, R.C., and Vikre, P.G., eds., Geological Society of Nevada Symposium 2005: Window to the World, Reno, Nevada, May 2005, p. 335-356.
Golder Associates, 2012, Geotechnical Investigation Summary Report, Starvation Canyon Project, Elko County, Nevada, Project # 113-91708, December 5, 2012, 20 pp.
Guarnera, B.J., (December 10, 1993), Audit and review of Independence Mining Co., Inc’s reserve calculation and methodology, Jerritt Canyon District, Nevada, Behre Dolbear & Company, Inc.,76pp.
Hofer, W. (2011), 2011 Jerritt Canyon Geology Exploration budget, file name : Exploration Expenditures 2011 Plan_RevBH010511.xls; finalized by the Jerritt Canyon Chief Mine Geologist; on computer server at Jerritt Mine office.
Hofer, W. (2011b), Year-end 2010 Jerritt stockpile reconciliation worksheets, filename : Jerritt_Stockpiles_2010_yrend_reconciled_bh_Jan27_2011_rev_bh022811.xls; done by the Jerritt Canyon Chief Mine Geologist; on server at Jerritt Mine office.
Hofer, W. (2013), Month End Production Reconciliation, filename: December Month End Reconciliation Revised2.xlsx; done by the Jerritt Canyon Chief Mine Geologist; on server at Jerritt Mine office.
Jin, H., (January, 16, 2011), Summary of the Jerritt geological database work, internal YNG memorandum, 8pp.
Johnson, T.J., Swanson, K., and Odell, M, 2011 and 2012, NI 43-101 Technical Report Update, Yukon-Nevada Gold Corp., Jerritt Canyon property, Elko County, Nevada, USA, dated on June 28, 2011, as amended on January 6, 2012.
| Veris Gold Corp. | |
| NI 43-101 Technical Report Jerritt Canyon Property, Nevada | 27-2 |
Jones, M., Jerritt Canyon District, Independence Mountains, Elko County, Nevada, Gold’s at Fault,inSediment Hosted Gold Deposits of the Independence Range, Nevada, Geological Society of Nevada Symposium 2005, Fieldtrip Guidebook no.8., p.99-122.
McMillin, S.L., 2005, The Discovery, Production, and Continued Exploration of the SSX Mine Area, Jerritt Canyon, Nevada, in Rhoden, H.N., Steininger, R.C., and Vikre, P.G., eds., Geological Society of Nevada Symposium 2005: Window to the World, Reno, Nevada, May, 2005, p. 453-468.
Odell, M., White, M., Swanson, K., and Fox, J., April 2012, NI 43-101 Technical Report Update, Yukon-Nevada Gold Corp., Jerritt Canyon property, Elko County, Nevada, USA, dated on April 27, 2012.
Pincock, Allen & Holt (June 2003), Jerritt Canyon Mine, Elko County, Nevada, Technical Report, prepared for Queenstake Resources Ltd.
Pincock, Allen & Holt (July 26, 2004), Jerritt Canyon Mine, Elko County, Nevada, Technical Report, prepared for Queenstake Resources Ltd., no. 9234.06, 98 pp.
Pincock, Allen & Holt (February 23, 2005), Jerritt Canyon Mine, Elko County, Nevada, Technical Report, prepared for Queenstake Resources Ltd., no. 9234.07, 102 p.
Peatfield, G.R., and Rozelle, J.W., (March 14, 2006), Technical Report on the Big Springs, Mac Ridge, and Dorsey Creek Mineral Properties, Independence Mountains District, Elko County, Nevada, U.S.A., for Gateway Gold Corp., 126 pp.
Queenstake Resources Ltd. (2008) Yukon-Nevada Gold corp. Reports the Receipt of a Stop Order from NDEP, March 12, 2008 Press Release Queenstake Resources US, Inc. and SRK Consulting, Inc., (December 11, 2010), Engineering Design Report – Water Pollution Control Permit NEV0000020 – Major Modification – Jerritt Canyon Mine, Volume 4.
Queenstake Resources USA, Inc., (January 2011), Jerritt Canyon Mine, 2011 budget, Queenstake Staff. SRK Consulting (US), Inc. (August, 29, 2011), Due Diligence Report, Jerritt Canyon Mine, Elko, Nevada, Report prepared for Deutsche Bank, Project no. 132900.050, 132 pages.
SRK Consulting (US), Inc. (April 16, 2008), NI 43-101 Technical Report, Yukon-Nevada Gold Corp., Jerritt Canyon property, Elko County, NV, endorsed by Landy Stinnett (P.E.) as the Qualified Person, 100p.
SRK Consulting (US), Inc. (April 2007), Queenstake Resources Ltd., NI 43-101 Technical Report, Jerritt Canyon Mine, report number 149204, endorsed by Landy Stinnett (P.E.) as the Qualified Person, 110 pp.
SRK Consulting (US), Inc. (April 2006), Queenstake Resources Ltd., Technical Report, Jerritt Canyon Mine, report number 149203, endorsed by Landy Stinnett (P.E.) as the Qualified Person, 101 pp. SRK Consulting (US), Inc. (September 2003) Jerritt Canyon Mine Tentative Plan for Permanent Closure Attachment 7: 2003 Updated WPCP Renewal Application.
Thompson, R. K., (February 16, 2012), Update to Title Opinion Report.
Yukon-Nevada Gold Corp., Management Discussion and Analysis (MDA), August 20, 2008, for the three to six-month period ending June 30, 2008, accessible onhttp://www.sedar.com, 13pp.
Yukon-Nevada Gold Corp., Management Discussion and Analysis (MDA), March 30, 2011, for the year ending December 31, 2010, accessible onhttp://www.sedar.com, 31pp.
| Veris Gold Corp. | |
| NI 43-101 Technical Report Jerritt Canyon Property, Nevada | 27-3 |
Yukon-Nevada Gold Corp., Form 40-F, United States Securities and Exchange Commission, for the fiscal year December 31, 2010; accessible onhttp://www.yukon-nevadagoldcorp.com, 203pp.
| Veris Gold Corp. | |
| NI 43-101 Technical Report Jerritt Canyon Property, Nevada | 28-1 |
28 Glossary
| Assay: | The chemical analysis of mineral samples to determine the metal content. |
| | |
| Capital Expenditure: | All other expenditures not classified as operating costs. |
| | |
| Composite: | Combining more than one sample result to give an average result over a larger distance. |
| | |
| Concentrate: | A metal-rich product resulting from a mineral enrichment process such as gravity concentration or flotation, in which most of the desired mineral has been separated from the waste material in the ore. |
| | |
| Crushing: | Initial process of reducing ore particle size to render it more amenable for further processing. |
| | |
| Cutoff Grade (CoG): | The grade of mineralized rock, which determines as to whether or not it is economic to recover its gold content by further concentration. |
| | |
| Dilution: | Waste, which is unavoidably mined with ore. |
| | |
| Dip: | Angle of inclination of a geological feature/rock from the horizontal. |
| | |
| Fault: | The surface of a fracture along which movement has occurred. |
| | |
| Footwall: | The underlying side of an ore body or stope. |
| | |
| Gangue: | Non-valuable components of the ore. |
| | |
| Grade: | The measure of concentration of gold within mineralized rock. |
| | |
| Hanging wall: | The overlying side of an ore body or slope. |
| | |
| Haulage: | A horizontal underground excavation which is used to transport mined ore. |
| | |
| Igneous: | Primary crystalline rock formed by the solidification of magma. |
| | |
| Kriging: | An interpolation method of assigning values from samples to blocks that minimizes the estimation error. |
| | |
| Level: | Horizontal tunnel the primary purpose is the transportation of personnel and materials. |
| | |
| Lithological: | Geological description pertaining to different rock types. |
| | |
| LoM Plans: | Life-of-Mine plans. |
| | |
| Material Properties: | Mine properties. |
| | |
| Milling: | A general term used to describe the process in which the ore is crushed and ground and subjected to physical or chemical treatment to extract the valuable metals to a concentrate or finished product. |
| | |
| Mineral/Mining Lease: | A lease area for which mineral rights are held. |
| | |
| Mining Assets: | The Material Properties and Significant Exploration Properties. |
| | |
| Ongoing Capital: | Capital estimates of a routine nature, which is necessary for sustaining operations. |
| | |
| Ore Reserve: | See Mineral Reserve. |
| | |
| Pillar: | Rock left behind to help support the excavations in an underground mine. |
| Veris Gold Corp. | |
| NI 43-101 Technical Report Jerritt Canyon Property, Nevada | 28-2 |
| Sedimentary: | Pertaining to rocks formed by the accumulation of sediments, formed by the erosion of other rocks. |
| | |
| Sill: | A thin, tabular, horizontal to sub-horizontal body of igneous rock formed by the injection of magma into planar zones of weakness. |
| | |
| Stope: | Underground void created by mining. |
| | |
| Stratigraphy: | The study of stratified rocks in terms of time and space. |
| | |
| Strike: | Direction of line formed by the intersection of strata surfaces with the horizontal plane, always perpendicular to the dip direction. |
| | |
| Sulfide: | A sulfur bearing mineral. |
| | |
| Tailings: | Finely ground waste rock from which valuable minerals or metals have been extracted. |
| | |
| Thickening: | The process of concentrating solid particles in suspension. |
| | |
| Total Expenditure: | All expenditures including those of an operating and capital nature. |
| | |
| Variogram: | A statistical representation of the characteristics (usually grade). |
| Veris Gold Corp. | |
| NI 43-101 Technical Report Jerritt Canyon Property, Nevada | 28-3 |
Abbreviations
The imperial system has been used throughout this report unless otherwise stated. All currency is in U.S. dollars. Market prices are reported in US$ per troy oz of gold. Tons are imperial containing 2,000 pounds. The following abbreviations are used in this report.
| Abbreviation | Unit or Term |
| AA | atomic absorption |
| Ag | silver |
| amsl | above mean sea level |
| asb | asbuilt |
| Au | gold |
| Au_id3 | Au grade estimated by inverse distance cubed |
| Au_ok | Au grade estimated by ordinary kriging |
| Au_nn | Au grade estimated by nearest neighbor estimation |
| Bmf | block model file |
| °C | degrees Celsius |
| CIL | carbon-in-leach |
| Comp | composite |
| Ddh | diamond drill hole (core) |
| Dh | drill hole |
| Dsrm | Roberts Mountain Formation |
| EL | elevation |
| °F | degrees Farenheit |
| FA | fire assay |
| FM | Formation |
| ft | foot (feet) |
| g | gram |
| G&A | General and administrative (costs) |
| ID | identification |
| Abbreviation | Unit or Term |
| | |
| Ind | indicated |
| Inf | inferred |
| IDW | Inverse distance weight (estimation method) |
| koz | thousand troy ounce |
| kt | thousand tons |
| lb | pound |
| n/a | not applicable |
| LoM | Life of mine |
| Meas | measured |
| NPV | Net present value |
| Ohc | Hanson Creek unit |
| Ohc1 | Hanson Creek unit 1 |
| Ohc2 | Hanson Creek unit 2 |
| Ohc3 | Hanson Creek unit 3 |
| Ohc4 | Hanson Creek unit 4 |
| opt | ounce per short ton |
| oz | ounce |
| Veris Gold Corp. | |
| NI 43-101 Technical Report Jerritt Canyon Property, Nevada | 28-4 |
| PACK | Probability Assigned Constrained Kriging (geostatistical estimation method) |
| QAQC | Quality Assurance/Quality Control |
| RC | reverse circulation drilling |
| RQD | rock quality description |
| Rom | run-of-mine |
| SG | specific gravity |
| tpd | tons per day |
| tph | tons per hour |
| UG | underground |
Mineral Resources
The mineral resources have been classified according to the “CIM Standards on Mineral Resources and Reserves: Definitions and Guidelines” (2010) which are recognized by National Instrument 43-101 Guidelines. Accordingly, the Resources have been classified as Measured, Indicated or Inferred, the Reserves have been classified as Proven, and Probable based on the Measured and Indicated Resources as defined below.
A Mineral Resource is a concentration or occurrence of diamonds, natural solid inorganic material, or natural solid fossilized organic material including base and precious metals, coal, and industrial minerals in or on the Earth’s crust in such form and quantity and of such a grade or quality that it has reasonable prospects for economic extraction. The location, quantity, grade, geological characteristics and continuity of a Mineral Resource are known, estimated or interpreted from specific geological evidence and knowledge.
An ‘Inferred Mineral Resource’ is that part of a Mineral Resource for which quantity and grade or quality can be estimated on the basis of geological evidence and limited sampling and reasonably assumed, but not verified, geological and grade continuity. The estimate is based on limited information and sampling gathered through appropriate techniques from locations such as outcrops, trenches, pits, workings and drill holes.
An ‘Indicated Mineral Resource’ is that part of a Mineral Resource for which quantity, grade or quality, densities, shape and physical characteristics can be estimated with a level of confidence sufficient to allow the appropriate application of technical and economic parameters, to support mine planning and evaluation of the economic viability of the deposit. The estimate is based on detailed and reliable exploration and testing information gathered through appropriate techniques from locations such as outcrops, trenches, pits, workings and drill holes that are spaced closely enough for geological and grade continuity to be reasonably assumed.
A ‘Measured Mineral Resource’ is that part of a Mineral Resource for which quantity, grade or quality, densities, shape, and physical characteristics are so well established that they can be estimated with confidence sufficient to allow the appropriate application of technical and economic parameters, to support production planning and evaluation of the economic viability of the deposit. The estimate is based on detailed and reliable exploration, sampling and testing information gathered through appropriate techniques from locations such as outcrops, trenches, pits, workings and drill holes that are spaced closely enough to confirm both geological and grade continuity.
Mineral Reserves
The mineral reserves have been classified according to the “CIM Standards on Mineral Resources and Reserves: Definitions and Guidelines” (2010) which are recognized by National Instrument 43-101 Guidelines. Accordingly, the Mineral Reserve is the economically mineable part of a Measured or Indicated Mineral Resource demonstrated by at least a Preliminary Feasibility Study. This Study must include adequate information on mining, processing, metallurgical, economic, and other relevant factors that demonstrate, at the time of reporting, that economic extraction can be justified. A Mineral Reserve includes diluting materials and allowances for losses that may occur when the material is mined.
| Veris Gold Corp. | |
| NI 43-101 Technical Report Jerritt Canyon Property, Nevada | 28-5 |
A ‘Probable Mineral Reserve’ is the economically mineable part of an Indicated and, in some circumstances, a Measured Mineral Resource demonstrated by at least a Preliminary Feasibility Study. This Study must include adequate information on mining, processing, metallurgical, economic, and other relevant factors that demonstrate, at the time of reporting, that economic extraction can be justified.
A ‘Proven Mineral Reserve’ is the economically mineable part of a Measured Mineral Resource demonstrated by at least a Preliminary Feasibility Study. This Study must include adequate information on mining, processing, metallurgical, economic, and other relevant factors that demonstrate, at the time of reporting, that economic extraction is justified.
| Veris Gold Corp. | |
| NI 43-101 Technical Report Jerritt Canyon Property, Nevada | 29-1 |
29 Date and signature page
The undersigned prepared this Technical Report, titled:NI 43-101 Technical Report, Veris Gold Corp., Jerritt Canyon property, Elko County, Nevada, USAdated 11thday of July, 2013, with an effective date of 31 December 2012, in support of the public disclosure of Mineral Resource estimates for the Jerritt Canyon property. The format and content of the report are intended to conform to Form 43-101F1 of National Instrument 43-101 (NI 43-101) of the Canadian Securities Administrators.
| Dated this 11thday of July, 2013 | |
| Signed “Todd W Johnson” | No. 16748, Nevada |
| Todd W. Johnson, P.E. | (Sealed) |
| Veris Gold Corp. | |
| 900 – 688 West Hastings Street | |
| Vancouver, B.C. V6B 1P1 Canada | |
| (604) 688-9427 Phone | |
| Email: todd@verisgold.com | |
| | |
| Signed “Mark A. Odell” | No. 13708, Nevada |
| Mark A. Odell, P.E. | (Sealed) |
| Practical Mining LLC | |
| 495 Idaho Street, Suite 205 | |
| Elko, Nevada 89815, USA | |
| (775) 345-3718 | |
| Email: markodell@practicalmining.com | |
| | |
| Signed “Michele White” | AIPG No. 11252 |
| Michele White, C.P.G. | (Sealed) |
| All One River, LLC | |
| 634 Pulver Rd. | |
| Lake George, CO 80827, USA | |
| (719) 748-3270 (phone) | |
| Email: aubassoon@aol.ocm | |
| | |
| Signed “Karl T. Swanson” | AusIMM No. 304871 |
| Karl T. Swanson, M.Eng., SME, MAusIMM | SME No. 4043076 |
| PO Box 86 | (Sealed) |
| Larkspur, CO 80118, USA | |
| Fax: (501) 638-9162 | |
| Email: karl.swanson@yahoo.com | |
| | |
| Signed“John Fox” | No. 12578 |
| John Fox, P. Eng. | (Sealed) |
| Laurion Consulting Inc. | |
| 302 – 304 W. Cordova St. | |
| Vancouver, British Columbia, Canada V6B 1E8 | |
| (604) 681-6355 | |
| Fax: (604) 681-4415 | |
Appendix A
Certificate of Authors and Consent Forms
Todd W. Johnson, P.E.
Veris Gold Corp.
900 – 688 West Hastings St.
Vancouver, BC V6B 1P1 Canada
Phone: (604) 688-9427
Fax: (604) 688-9426
todd@verisgold.com
CERTIFICATE OF AUTHOR
Re: TheNI 43-101 Technical Report, Veris Gold Corp., Jerritt Canyon Property, Elko County, Nevada, USA, and dated 11 July, 2013, with an effective date of 31 December, 2012:
I, Todd W. Johnson, P.E., do hereby certify that:
| 1) | As of July 11, 2013, I am employed as Vice President of Exploration of: Veris Gold Corp. 900 – 688 West Hastings St. Vancouver, BC V6B 1P1 Canada |
| | |
| I was employed as an independent geological consultant with Queenstake Resources USA, Inc. from January 2008 to March 31, 2010. My business address at that time was: 550 N. McCarran Blvd. #254 Sparks, NV 89431 USA |
| | |
| 2) | I am a Registered Professional Geological Engineer in the State of Nevada (P.E. No. 16748). In addition I am a member of the Australian Institute of Mining and Metallurgy (AusIMM No.227374). |
| | |
| 3) | I am a graduate of Washington State University, Pullman, Washington with a Bachelor of Science degree in Geology 1988 and a Masters of Science degree in Geology in 1991. In addition I am a graduate of University of Nevada-Reno, Reno, Nevada, with a second Masters of Science degree in Geological Engineering in 2003. I have practiced Geology and/or Geological Engineering continuously since 1991. |
| | |
| 4) | Since 1991, I have been involved with exploration and/or mining geology for base and precious metals in both surface and underground environments, and/or geological engineering at mine properties and industrial and commercial developments in the western United States, northern Mexico, and Canada. |
| | |
| 5) | I have read the definition of “qualified person” set out in National Instrument 43-101 (“NI 43-101”) and certify that by reason of my experience and qualifications and good standing with proper designation within a recognized professional organization fully meet the criteria as a Qualified Person as defined under the terms of NI 43-101. |
| | |
| 6) | I am employed for the Issuer and landowner Veris Gold Corp. as VP Exploration and have inspected the Jerritt Canyon property site on numerous occasions in 2008, 2009, 2010, 2011, 2012, and 2013. I last visited the Jerritt Canyon Mine site for one day on May 1, 2013. |
| 7) | I am responsible for the preparation of the technical report titledNI 43-101 Technical Report, Jerritt Canyon Property, Elko County, Nevada, USA,and dated 11 July 2013, with an effective date of 31 December, 2012 (“the Technical Report”) relating to the Jerritt Canyon property. |
| | |
| 8) | I have previously worked at the Jerritt Canyon property as a geological consultant for Queenstake Resources USA, Inc. periodically from September 2008 to March 2010 and again as an employee as VP Exploration for Yukon-Nevada Gold Corp. from April 2010 to April 2011. In September 2008 and later I was responsible for helping reorganize the geological data and drill hole data at the Jerritt Mine property, and also at the Jerritt Exploration Departments in Elko, Nevada and Denver, Colorado. During this time at the property I managed and helped build a new Geology Mine team and Land Department. I became Vice President of Exploration and Officer for Veris Gold Corp., on April 1, 2010 to the present. |
| | |
| 9) | I am not independent of the Issuer within the meaning of Section 1.5 of National Instrument 43-101. |
| | |
| 10) | I am currently employed by Veris Gold Corp. (“VG”) and I was granted Company stock options in November 2009, April 2010, and September 2011. I was paid a daily rate from the Company for geological consulting services performed at the Jerritt Canyon property, and other Yukon-Nevada owned projects from January 2008 to March 2010. I have been a salaried employee, Vice President of Exploration, and Officer for VG starting on April 1, 2010 to the present. I do not have any other interests relating to the Jerritt Canyon property. I do not have any other interest in adjoining properties in the Jerritt Canyon project area. |
| | |
| 11) | I have read National Instrument 43-101 and Form 43-101F1, and the sections of the Technical Report for which I am responsible have been prepared in compliance with that instrument and form. |
| | |
| 12) | I consent to the filing of the Technical Report with any stock exchange and other regulatory authority and any publication by them for regulatory purposes, including electronic publication in the public company files on their websites accessible by the public, of the Technical Report. |
| | |
| 13) | As at the effective date of the Technical Report, to the best of my knowledge, information and belief, the Technical Report contains all the scientific and technical information that is required to be disclosed to make the Technical Report not misleading. |
Dated this 11th Day of July 2013.
| “Signed” | |
| Todd W. Johnson, P.E. | |
Veris Gold Corp.
900 – 688 West Hastings St.
Vancouver, BC V6B 1P1 Canada
(604) 688-9427 (phone)
(604) 688-9426 (fax)
E:mail: todd@verisgold.com
Todd W. Johnson, P.E.
Veris Gold Corp.
900 – 688 West Hastings St.
Vancouver, BC, Canada V6B 1P1
(604) 688-9427
Fax: (604) 688-9426
E:mail: todd@verisgold.com
CONSENT OF QUALIFIED PERSON
| TO: | British Columbia Securities Commission |
| | Alberta Securities Commission |
| | Ontario Securities Commission |
I, Todd W. Johnson, P.E., do hereby consent to the public filing of the technical report titledNI 43-101 Technical Report Update, Veris Gold Corp., Jerritt Canyon Property, Elko County, Nevada, USA,dated July 11, 2013, with an effective date of December 31, 2012 (the “Technical Report”) by Veris Gold Corp. (the “Company”) with the Canadian Securities Regulatory Authorities listed above and on SEDAR.
The undersigned consents to the use of any extracts from or a summary of the Technical Report in the news releases of the Company dated June 17, 2013, (the “Written Disclosure”).
The undersigned certifies that he has read the Written Disclosure being filed by the Company and that it fairly and accurately represents the information in the sections of the Technical Report for which the undersigned is responsible.
DATED the 11th day of July, 2013.
| “Signed” | |
| Todd W. Johnson, P.E. | |

Mark A. Odell, P.E.
Practical Mining LLC
495 Idaho Street, Suite 205
Elko, Nevada 89801
775-345-3718
markodell@practicalmining.com
CERTIFICATE OF AUTHOR
Re: TheNI 43-101 Technical Report, Veris Gold Corp., Jerritt Canyon Property, Elko County, Nevada, USA, and dated 11 July, 2013, with an effective date of 31 December, 2012:
I, Mark A. Odell, P.E., do hereby certify that:
| | 1) | As of July 11, 2013, I am a consulting mining engineer at: |
Practical Mining LLC
495 Idaho Street, Suite 205
Elko, Nevada 89801
775-345-3718
| | 2) | I am a Registered Professional Mining Engineer in the State of Nevada (# 13708), and a Registered Member (#2402150) of the Society for Mining, Metallurgy and Exploration (SME). |
| | | |
| | 3) | I am a graduate of The Colorado School of Mines, Golden, Colorado with a Bachelor of Science Degree in Mining Engineering in 1985. I have practiced my profession continuously since 1985. |
| | | |
| | 4) | Since 1985, I have been involved with mine engineering and operations for base and precious metals and coal in both surface and underground environments, in the western United States. |
| | | |
| | 5) | I have read the definition of “qualified person” set out in National Instrument 43-101 (“NI 43- 101”) and certify that by reason of my experience and qualifications and good standing with proper designation within a recognized professional organization fully meet the criteria as a Qualified Person as defined under the terms of NI 43-101. |
| | | |
| | 6) | I am a contract consulting engineer for the Issuer and landowner Veris Gold Corp. and have inspected the Jerritt Canyon property site on numerous occasions in 2009, 2010, 2011 and 2012. I last visited the Jerritt Canyon Mine site for one day on February 29, 2012. |
| | 7) | I am responsible for the preparation of sections 15, 16, 18, 21 and 22 of the technical report titled NI 43-101 Technical Report Veris Gold Corp., Jerritt Canyon property, Elko County, Nevada, USA, and dated July 11, 2013, with an effective date of 31 December, 2012, (“the Technical Report”) relating to the Jerritt Canyon property. |
| | | |
| | 8) | I have previously worked at the Jerritt Canyon Mine as Underground Mining Manager for Queenstake Resources USA, Inc. from July 2003 to June 2005, and again as Mine Superintendent and Chief Engineer from March 2000 to July 2003 for Anglogold Jerritt Canyon Corp.; Most recently I have worked as a consulting Mine Engineer for Queenstake Resources USA, Inc. and Veris Gold USA Inc. working on mine designs from early 2009 to the present. |
| | | |
| | 9) | I am independent of the Issuer within the meaning of Section 1.5 of NI 43-101. |
| | | |
| | 10) | I was paid a daily rate for engineering consulting services performed at the Jerritt Canyon Project and do not have any other interests relating to the project. I do not have any interest in adjoining properties in the Jerritt Canyon project area. |
| | | |
| | 11) | I have read National Instrument 43-101 and Form 43-101F1, and the sections of the Technical Report for which I am responsible have been prepared in compliance with that instrument and form. |
| | | |
| | 12) | I consent to the filing of the Technical Report with any stock exchange and other regulatory authority and any publication by them for regulatory purposes, including electronic publication in the public company files on their websites accessible by the public, of the Technical Report. |
| | | |
| | 13) | As at the effective date of the Technical Report, to the best of my knowledge, information and belief, the Technical Report contains all the scientific and technical information that is required to be disclosed to make the Technical Report not misleading. |
Dated this 11th Day of July 2013.
| “Signed” | |
| Mark A. Odell, P.E. | |
Practical Mining LLC
495 Idaho Street, Suite 205
Elko, Nevada 89801
775-345-3718
markodell@practicalmining.com
Mark A. Odell, P.E.
Practical Mining LLC
495 Idaho Street, Suite 205
Elko, Nevada 89801
775-345-3718
markodell@practicalmining.com
CONSENT OF QUALIFIED PERSON
| TO: | British Columbia Securities Commission |
| | Alberta Securities Commission |
| | Ontario Securities Commission |
I, Mark Odell, P.E., do hereby consent to the public filing of the technical report titledNI 43-101 Technical Report, Veris Gold Corp., Jerritt Canyon property, Elko County, Nevada, USA,dated July11, 2013, with an effective date of December 31, 2012 (the “the Technical Report”) by Veris Gold Corp. (the
“Company”) with the Canadian Securities Regulatory Authorities listed above and on SEDAR.
The undersigned consents to the use of any extracts from or a summary of the Technical Report in the news release of the Company dated June 17, 2013 (the “Written Disclosure”).
The undersigned certifies that he has read the Written Disclosure being filed by the Company and that it fairly and accurately represents the information in the sections of the Technical Report for which the undersigned is responsible.
DATED the 11th Day of July 2013.
| “Signed” | |
| Mark Odell, P.E. | |

Michele White, C.P.G.
#11252, American Institute of Professional Geologists
All One River, LLC
634 Pulver Rd.
Lake George, CO 80827
719-748-3270
Aubassoon@aol.com
CERTIFICATE OF AUTHOR
Re: TheNI 43-101 Technical Report, Veris Gold Corp., Jerritt Canyon Property, Elko County, Nevada, USA, and dated 11 July, 2013, with an effective date of 31 December, 2012:
I, Michele White, C.P.G., do hereby certify that:
| | 1) | As of July 11, 2013, I am a consulting geologist and data analyst at: |
All One River, LLC
634 Pulver Rd.
Lake George, CO 80827, USA
(719) 748-3270
| | 2) | I am a Registered Professional Geologist in the United States (# 11252) with the American Institute of Professional Geologists. |
| | | |
| | 3) | I am a graduate of The University of Colorado, Boulder, Colorado with a Master of Science Degree in Economic Geology in 1997. I have practiced my profession continuously since 1990. |
| | | |
| | 4) | Since 1990, I have been involved with exploration and mine geology for base and precious metals in both surface and underground environments in the western United States and internationally. |
| | | |
| | 5) | I have read the definition of “qualified person” set out in National Instrument 43-101 (“NI 43- 101”) and certify that by reason of my experience and qualifications and good standing with proper designation within a recognized professional organization fully meet the criteria as a Qualified Person as defined under the terms of NI 43-101. |
| | | |
| | 6) | I am a contract consulting geologist for the Issuer and landowner Veris Gold Corp. and have inspected the Jerritt Canyon property site on numerous occasions in 2009, 2010, and 2011. I last visited the Jerritt Canyon Mine site for two days on January 22-24, 2013. |
| | 7) | I am responsible for the preparation of Sections 4, 11, 12, and 16.6 of the Technical Report titled NI 43-101 Technical Report, Veris Gold Corp., Jerritt Canyon property, Elko County, Nevada, USA, and dated July 11, 2013, with an effective date of 31 December, 2012, (“the Technical Report”) relating to the Jerritt Canyon property. |
| | | |
| | 8) | I have previously worked at the Jerritt Canyon Mine as Data Manager for Queenstake Resources USA, Inc. as a consultant from August 2009 to May 2010, and retained direct hire at the mine from May 2010 to March 2011. I last visited the mine site January 22-24, 2013. |
| | | |
| | 9) | I am independent of the Issuer within the meaning of Section 1.5 of NI 43-101. |
| | | |
| | 10) | I was paid a daily rate for data consulting services performed at the Jerritt Canyon property. I do not have any other interests relating to the project. I do not have any interest in adjoining properties in the Jerritt Canyon project area. |
| | | |
| | 11) | I have read National Instrument 43-101 and Form 43-101F1, and the sections of the Technical Report for which I am responsible have been prepared in compliance with that instrument and form. |
| | | |
| | 12) | I consent to the filing of the Technical Report with any stock exchange and other regulatory authority and any publication by them for regulatory purposes, including electronic publication in the public company files on their websites accessible by the public, of the Technical Report. |
| | | |
| | 13) | As at the effective date of the Technical Report, to the best of my knowledge, information and belief, the Technical Report contains all the scientific and technical information that is required to be disclosed to make the Technical Report not misleading. |
Dated this 11th Day of July 2013.
| “Signed” | |
| Michele White, C.P.G. | |
All One River, LLC
634 Pulver Rd.
Lake George, CO 80827, USA
(719) 748-3270
aubassoon@aol.com
Michele White, C.P.G.
#11252, American Institute of Professional Geologists
All One River, LLC
634 Pulver Rd.
Lake George, CO 80827
719-748-3270
Aubassoon@aol.com
CONSENT OF QUALIFIED PERSON
| TO: | British Columbia Securities Commission |
| | Alberta Securities Commission |
| | Ontario Securities Commission |
I, Michele White, C.P.G., do hereby consent to the public filing of the technical report titledNI 43-101 Technical Report, Veris Gold Corp., Jerritt Canyon property, Elko County, Nevada, USA,dated July 11, 2013, with an effective date of December 31, 2012 (the “the Technical Report”) by Veris Gold Corp. (the “Company”) with the Canadian Securities Regulatory Authorities listed above and on SEDAR.
The undersigned consents to the use of any extracts from or a summary of the Technical Report in the news release of the Company dated June 17, 2013 (the “Written Disclosure”).
The undersigned certifies that he has read the Written Disclosure being filed by the Company and that it fairly and accurately represents the information in the sections of the Technical Report for which the undersigned is responsible.
DATED the 11th Day of July 2013.
| “Signed” | |
| Michele White, C.P.G. | |
Karl T. Swanson, SME, MAusIMM
PO Box 86
Larkspur, CO 80118, USA
Fax: (501) 638-9162
E:mail:karl.swanson@yahoo.com
CERTIFICATE OF AUTHOR
Re: TheNI 43-101 Technical Report, Veris Gold Corp., Jerritt Canyon Property, Elko County, Nevada, USA, and dated 11 July, 2013, with an effective date of 31 December, 2012:
I, Karl T. Swanson, SME, MAusIMM, do hereby certify that:
| 1) | As of July 11, 2013, I am an independent geological and mining engineering consultant at:
Karl Swanson
PO Box 86
Larkspur, CO 80118, USA |
| | |
| 2) | I graduated with a Bachelor of Science degree in Geological Engineering from Colorado School of Mines in 1990. In addition, I obtained a Master of Engineering degree in Mining Engineering from Colorado School of Mines in 1994. |
| | |
| 3) | I am a registered member of the Society for Mining, Metallurgy & Exploration (SME) #4043076. I am a member of the Australian Institute of Mining and Metallurgy (AusIMM) #304871. |
| | |
| 4) | I have worked as a geological and mining engineer for a total of 20 years since my 1990 graduation from university. |
| | |
| 5) | I have read the definition of “qualified person” set out in National Instrument 43-101 (“NI 43-101”) and certify that by reason of my education, affiliation with a professional association (as defined in NI 43-101) and past relevant work experience, I fulfill the requirements to be a “qualified person” for the Purposes on NI 43-101. |
| | |
| 6) | I am responsible for the preparation of section 14 of the technical report titledNI 43-101 Technical Report, Jerritt Canyon property, Veris Gold Corp., Elko County, Nevada,USAand dated July 11, 2013, with an effective date of 31 December, 2012 (“the Technical Report”) relating to the Jerritt Canyon property. I visited the property on numerous occasions in 2010, 2011, and 2012 with my last visit being on March 20, 2013. |
| | |
| 7) | I have not had prior involvement with the property that is the subject of the Technical Report. |
| | |
| 8) | I am independent of the Issuer within the meaning of Section 1.5 of National Instrument 43-101. |
| | |
| 9) | I was paid a daily rate for geological consulting services performed at the Jerritt Canyon Project and do not have any other interests relating to the project. I do not have any interest in adjoining properties in the Jerritt Canyon project area. |
| 10) | I have read National Instrument 43-101 and Form 43-101F1, and the Technical Report has been prepared in compliance with that instrument and form. |
| | |
| 11) | I consent to the filing of the Technical Report with any stock exchange and other regulatory authority and any publication by them for regulatory purposes, including electronic publication in the public company files on their websites accessible by the public, of the Technical Report. |
| | |
| 12) | As at the effective date of the Technical Report, to the best of my knowledge, information and belief, the Technical Report contains all the scientific and technical information that is required to be disclosed to make the Technical Report not misleading. |
Dated this 11th Day of July 2013.
| “Signed” | |
| | AusIMM No. 304871 |
| Karl T. Swanson, M.Eng., SME, MAusIMM | SME No. 4043076 |
| | |
| PO Box 86 | |
| Larkspur, CO 80118, USA | |
| Fax: (501) 638-9162 | |
| E:mail: karl.swanson@yahoo.com | |
Karl T. Swanson, SME
PO Box 86
Larkspur, CO 80118, USA
Fax: (501) 638-9162
E:mail: karl.swanson@yahoo.com
CONSENT OF QUALIFIED PERSON
| TO: | British Columbia Securities Commission |
| | Alberta Securities Commission |
| | Ontario Securities Commission |
I, Karl Swanson, SME, MAusIMM, do hereby consent to the public filing of the technical report titledNI 43-101 Technical Report, Veris Gold Corp., Jerritt Canyon property, Elko County, Nevada, USA,July 11, 2013, with an effective date of December 31, 2012 (the “the Technical Report”) by Veris Gold Corp. (the “Company”) with the Canadian Securities Regulatory Authorities listed above and on SEDAR.
The undersigned consents to the use of any extracts from or a summary of the Technical Report in the news release of the Company dated June 17, 2013 (the “Written Disclosure”).
The undersigned certifies that he has read the Written Disclosure being filed by the Company and that it fairly and accurately represents the information in the sections of the Technical Report for which the undersigned is responsible.
DATED the 11th Day of July 2013.
| “Signed” | |
| Karl Swanson, SME, MAusIMM | |
CERTIFICATE of AUTHOR
John R.W. Fox, P.Eng
302 – 304 W. Cordova St.
Vancouver, British Columbia, Canada V6B 1E8
(604) 681-6355
Fax: (604) 681-4415
E:mail:laurion@telus.net
Re: TheNI 43-101 Technical Report, Veris Gold Corp., Jerritt Canyon Property, Elko County, Nevada, USA, and dated 11 July, 2013, with an effective date of 31 December, 2012:
I, John R.W. Fox, P.Eng, do hereby certify that:
| 1) | As of July 11, 2013, I am a consulting metallurgical engineer at:
Laurion Consulting Inc. |
| 302 – 304 W. Cordova St. |
| Vancouver, British Columbia, Canada V6B 1E8 |
| | |
| 2) | I graduated with a Bachelor of Science degree in Applied Minerals Sciences from the University of Leeds (UK) in 1971. |
| | |
| 3) | I am a member in good standing of the Association of Professional Engineers and Geoscientists of the Province of British Columbia (No. 12578). |
| | |
| 4) | I have practiced my profession continuously for a total of 40 years since my 1971 graduation from university. |
| | |
5) | I have read the definition of “qualified person” set out in National Instrument 43-101 (“NI-43-101”) and certify that by reason of my education, affiliation with a professional association (as defined in NI 43-101) and past relevant work experience, I fulfill the requirements to be a “qualified person” for the Purposes on NI 43-101. |
| | |
| 6) | I am responsible for the preparation of section 13 and 17 of the technical report titledNI 43-101 Technical Report, Veris Gold Corp., Jerritt Canyon property, Elko County, Nevada, USA,and dated July 11, 2013, with an effective date of 31 December, 2012 (“the Technical Report”) relating to the Jerritt Canyon property. I last visited the property from September 1-6, 2012. |
| | |
| 7) | I have had prior involvement with the property that is the subject of the Technical Report, as described below. |
| | |
| 8) | I am not aware of any material fact or material change with respect to the subject matter of the Technical Report that is not reflected in the Technical Report, the omission to disclosure which makes the Technical Report misleading. |
| | |
| 9) | I am independent of the issuer applying all of the tests in Section 1.4 of National Instrument 43-101. |
| 10) | I was paid a daily rate for metallurgical consulting services performed at the Jerritt Canyon Project. As a former Director of Veris Gold Corp. (resigned as of May 13, 2010), I received stock options, some of which are still valid. I am a current shareholder of Veris Gold Corp. I do not have any other interests relating to the project. I do not have any interest in adjoining properties in the Jerritt Canyon project area. |
| | |
| 11) | I have read National Instrument 43-101 and Form 43-101F1, and the Technical Report has been prepared in compliance with that instrument and form. |
| | |
| 12) | I consent to the filing of the Technical Report with any stock exchange and other regulatory authority and any publication by them for regulatory purposes, including electronic publication in the public company files on their websites accessible by the public, of the Technical Report. |
| | |
| 13) | As of the date of this certificate, to the best of my knowledge, information and belief, the Technical Report contains all the scientific and technical information that is required to be disclosed to make the Technical Report not misleading. |
Dated this 11th Day of July 2013.
| “Signed’ | |
| John R.W. Fox, P.Eng | |
Laurion Consulting Inc.
302 – 304 W. Cordova St.
Vancouver, British Columbia, Canada V6B 1E8
(604) 681-6355
Fax: (604) 681-4415
E:mail: laurion@telus.net
John R.W. Fox, P.Eng
302 – 304 W. Cordova St.
Vancouver, British Columbia V6B 1E8
(604) 681-6355
Fax: (604) 681-4415
E:mail: laurion@telus.net
CONSENT OF QUALIFIED PERSON
| TO: | British Columbia Securities Commission |
| | Alberta Securities Commission |
| | Ontario Securities Commission |
I, John Fox, P.Eng, do hereby consent to the public filing of the technical report titledNI 43-101 Technical Report, Veris Gold Corp., Jerritt Canyon property, Elko County, Nevada, USA,and dated July 11, 2013, with an effective date of 31 December, 2012 (the “Report”) by Veris Gold Corp. (the “Company”) with the Canadian Securities Regulatory Authorities listed above and on SEDAR.
The undersigned consents to the use of any extracts from or a summary of the Report in the news release of the Company dated June 17, 2013 (the “Written Disclosure”).
The undersigned certifies that he has read the Written Disclosure being filed by the Company and that it fairly and accurately represents the information in the sections of the Report for which the undersigned is responsible.
DATED the 11th Day of July 2013.
Appendix B
Claim List
| Veris Gold Corp. | |
| NI 43-101 Technical Report Jerritt Canyon Property, Nevada | Appendix B – Claim List |
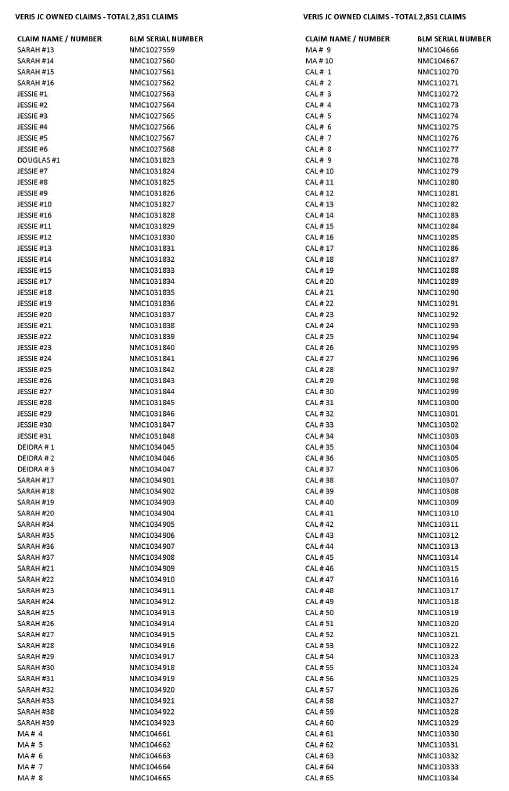
| Veris Gold Corp. | |
| NI 43-101 Technical Report Jerritt Canyon Property, Nevada | Appendix B – Claim List |
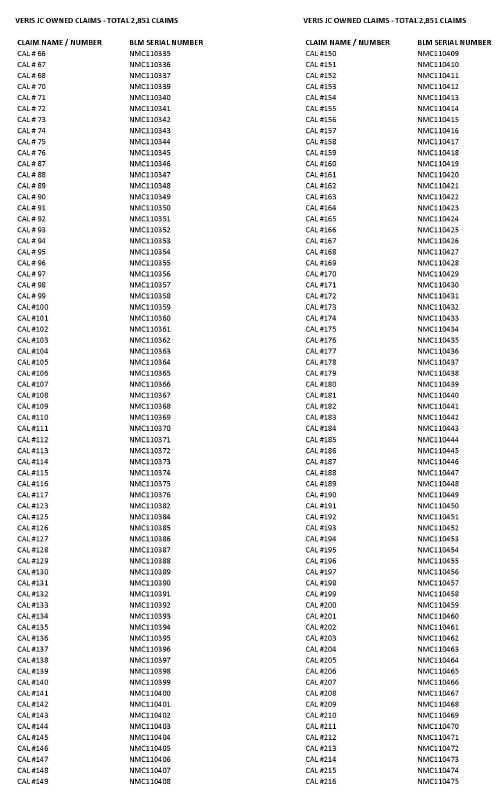
| Veris Gold Corp. | |
| NI 43-101 Technical Report Jerritt Canyon Property, Nevada | Appendix B – Claim List |
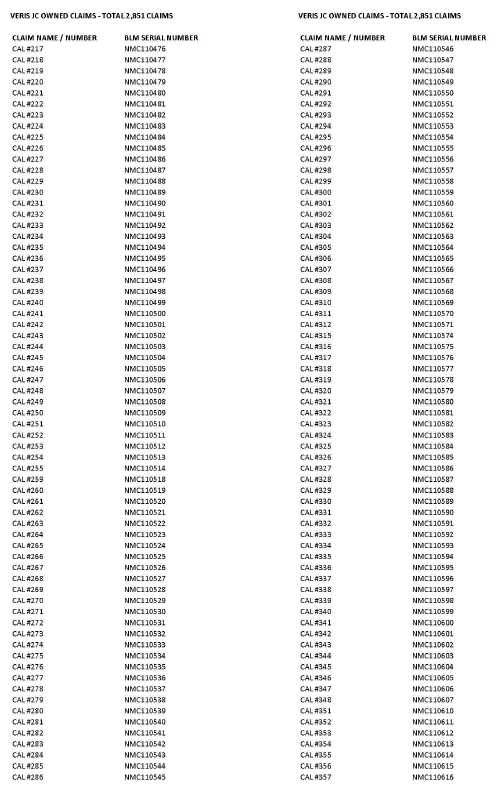
| Veris Gold Corp. | |
| NI 43-101 Technical Report Jerritt Canyon Property, Nevada | Appendix B – Claim List |
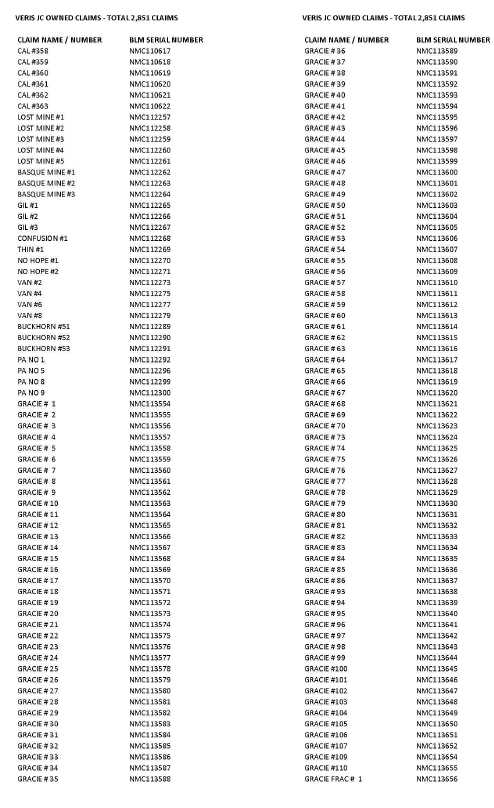
| Veris Gold Corp. | |
| NI 43-101 Technical Report Jerritt Canyon Property, Nevada | Appendix B – Claim List |
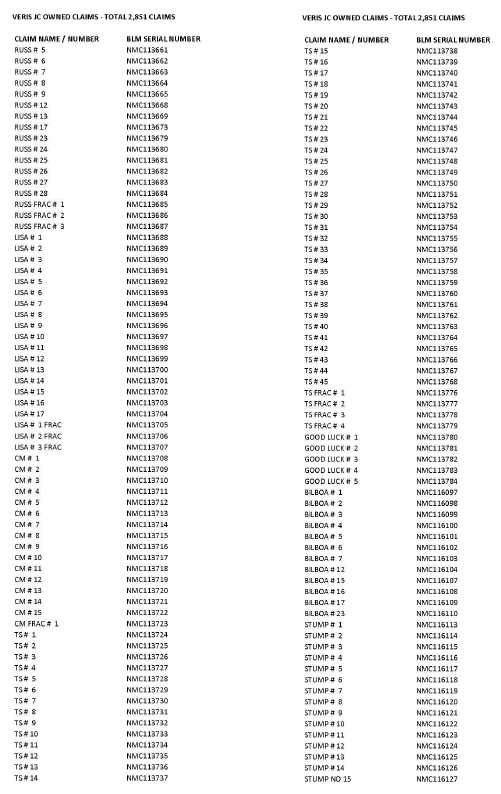
| Veris Gold Corp. | |
| NI 43-101 Technical Report Jerritt Canyon Property, Nevada | Appendix B – Claim List |
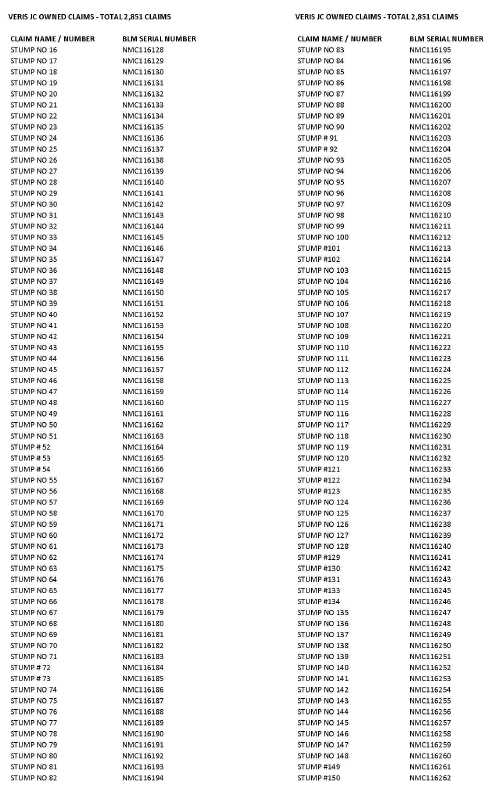
| Veris Gold Corp. | |
| NI 43-101 Technical Report Jerritt Canyon Property, Nevada | Appendix B – Claim List |
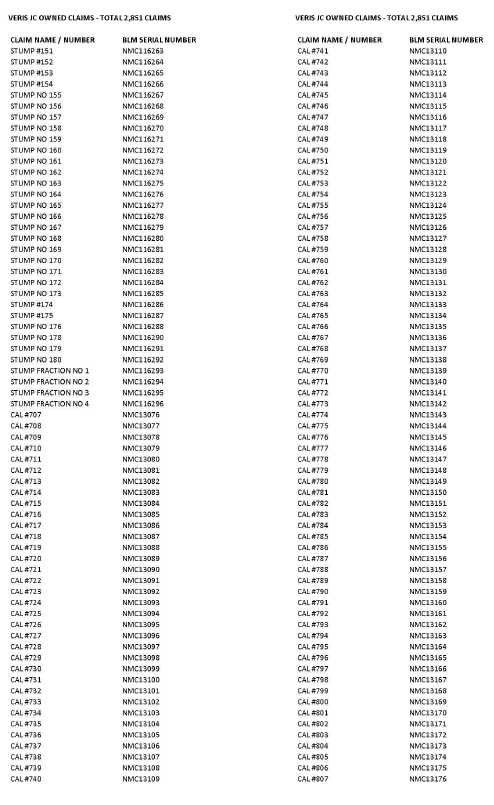
| Veris Gold Corp. | |
| NI 43-101 Technical Report Jerritt Canyon Property, Nevada | Appendix B – Claim List |
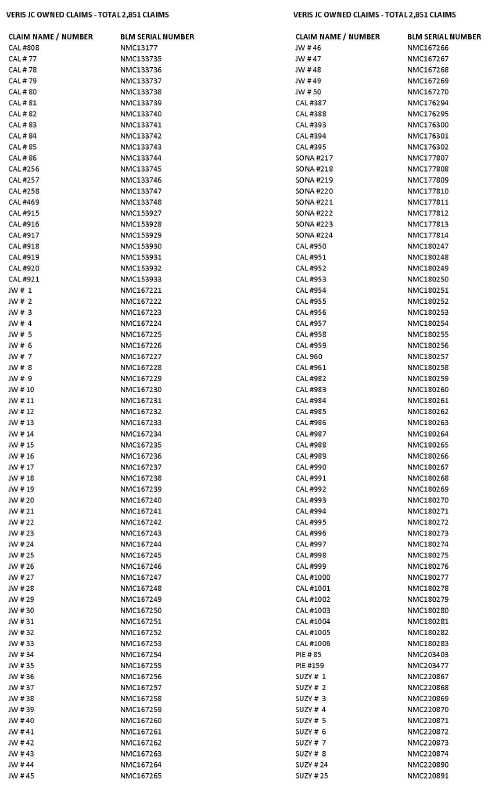
| Veris Gold Corp. | |
| NI 43-101 Technical Report Jerritt Canyon Property, Nevada | Appendix B – Claim List |
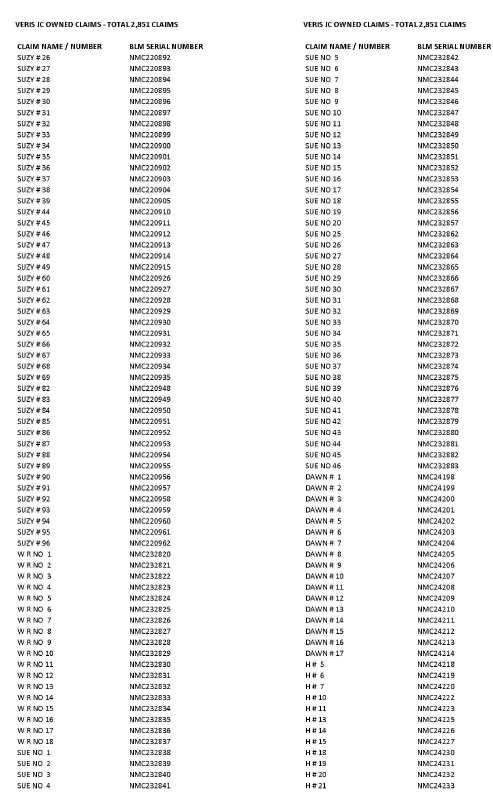
| Veris Gold Corp. | |
| NI 43-101 Technical Report Jerritt Canyon Property, Nevada | Appendix B – Claim List |
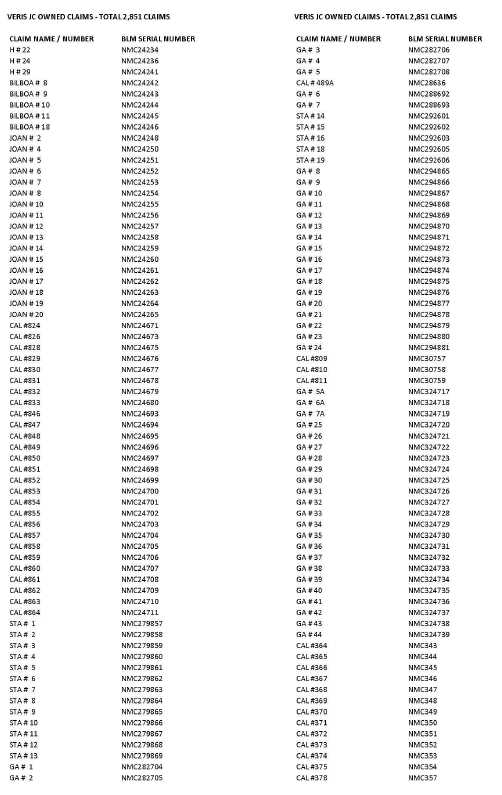
| Veris Gold Corp. | |
| NI 43-101 Technical Report Jerritt Canyon Property, Nevada | Appendix B – Claim List |
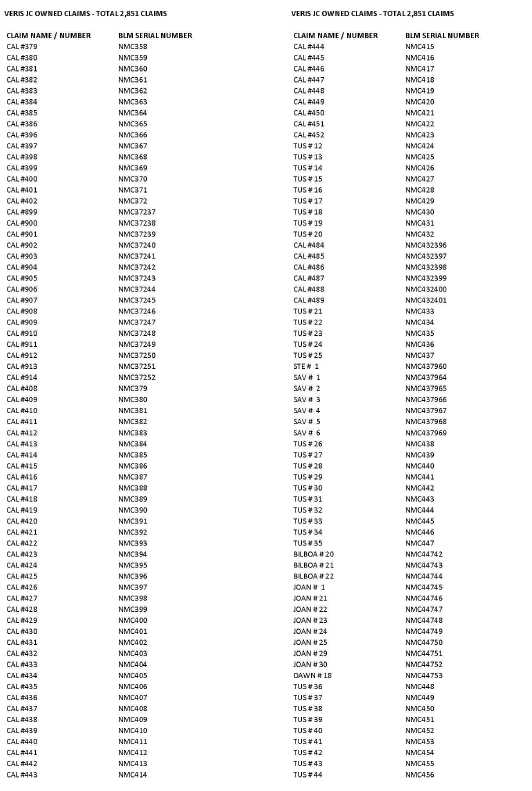
| Veris Gold Corp. | |
| NI 43-101 Technical Report Jerritt Canyon Property, Nevada | Appendix B – Claim List |
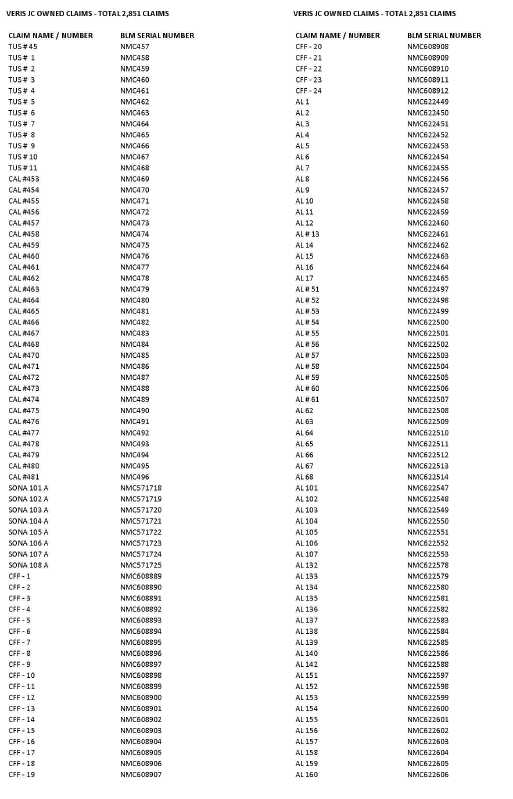
| Veris Gold Corp. | |
| NI 43-101 Technical Report Jerritt Canyon Property, Nevada | Appendix B – Claim List |
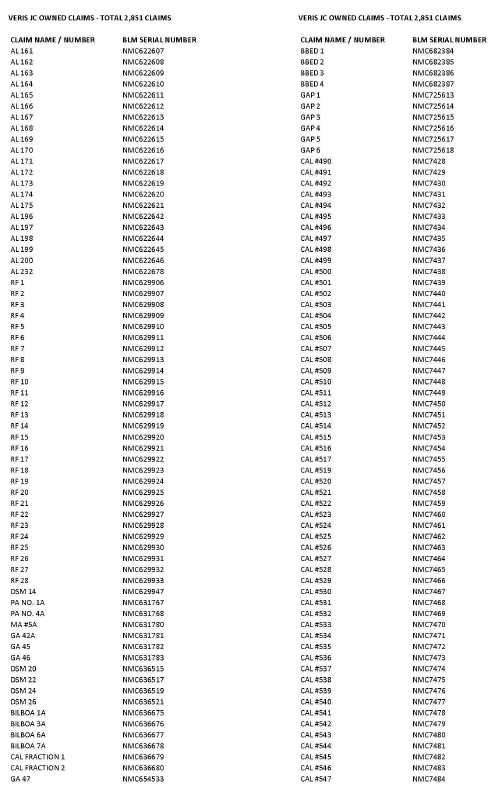
| Veris Gold Corp. | |
| NI 43-101 Technical Report Jerritt Canyon Property, Nevada | Appendix B – Claim List |
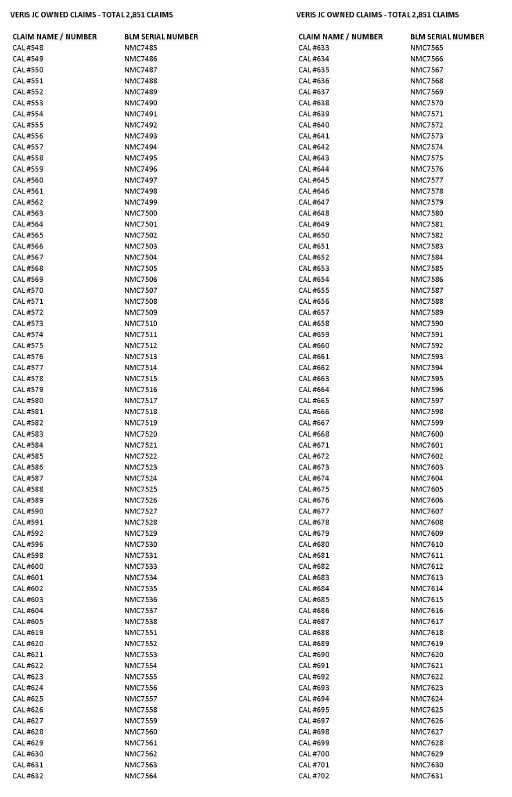
| Veris Gold Corp. | |
| NI 43-101 Technical Report Jerritt Canyon Property, Nevada | Appendix B – Claim List |
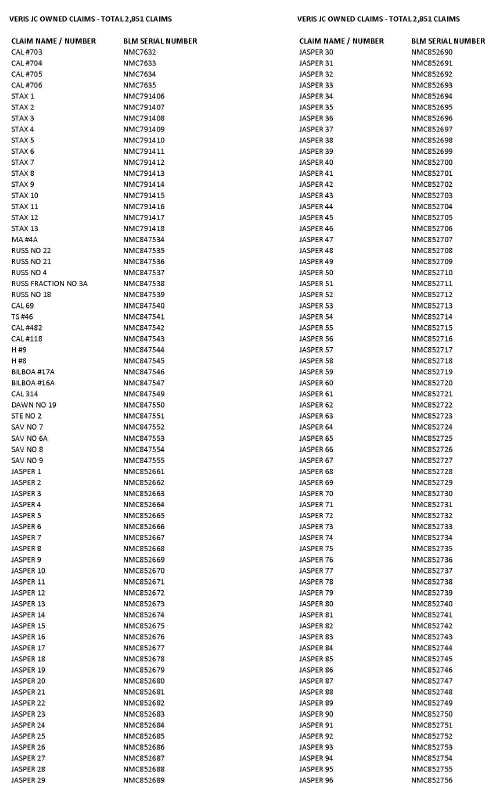
| Veris Gold Corp. | |
| NI 43-101 Technical Report Jerritt Canyon Property, Nevada | Appendix B – Claim List |
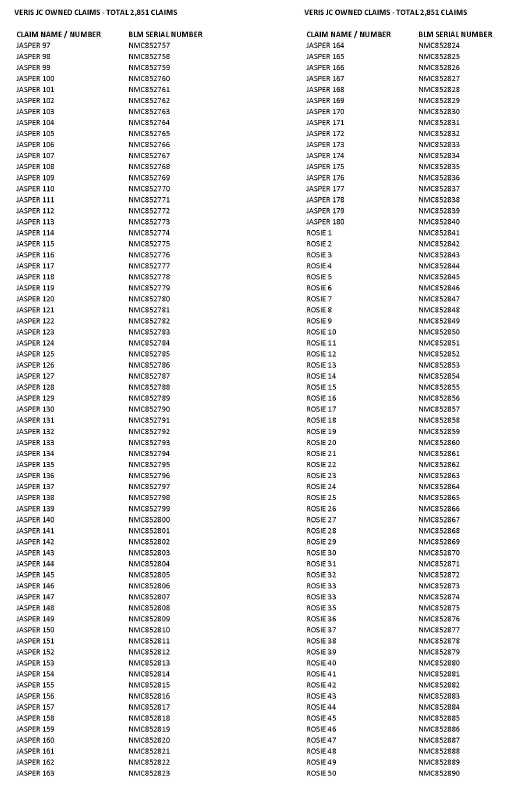
| Veris Gold Corp. | |
| NI 43-101 Technical Report Jerritt Canyon Property, Nevada | Appendix B – Claim List |
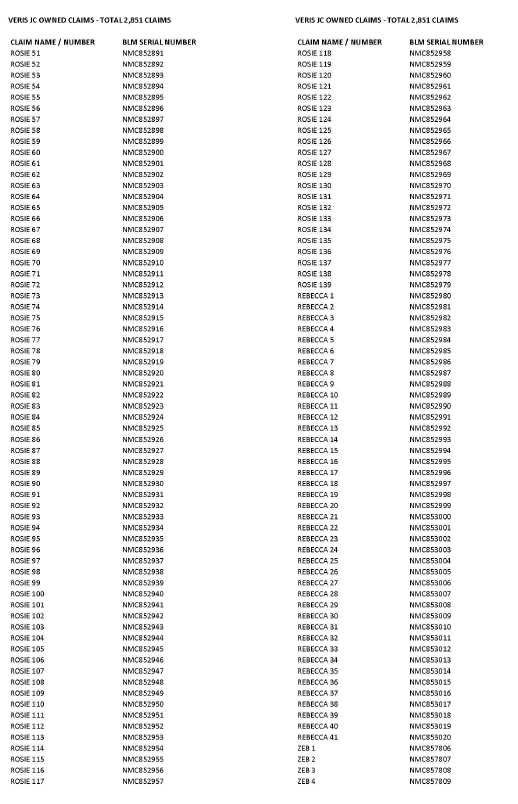
| Veris Gold Corp. | |
| NI 43-101 Technical Report Jerritt Canyon Property, Nevada | Appendix B – Claim List |
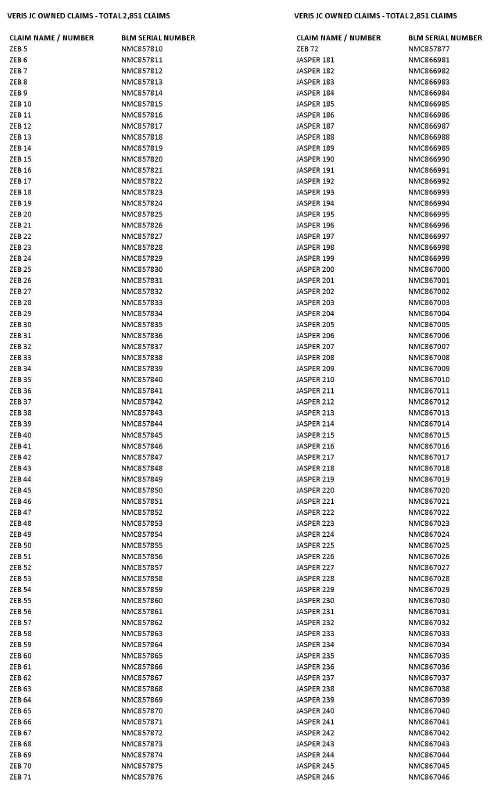
| Veris Gold Corp. | |
| NI 43-101 Technical Report Jerritt Canyon Property, Nevada | Appendix B – Claim List |
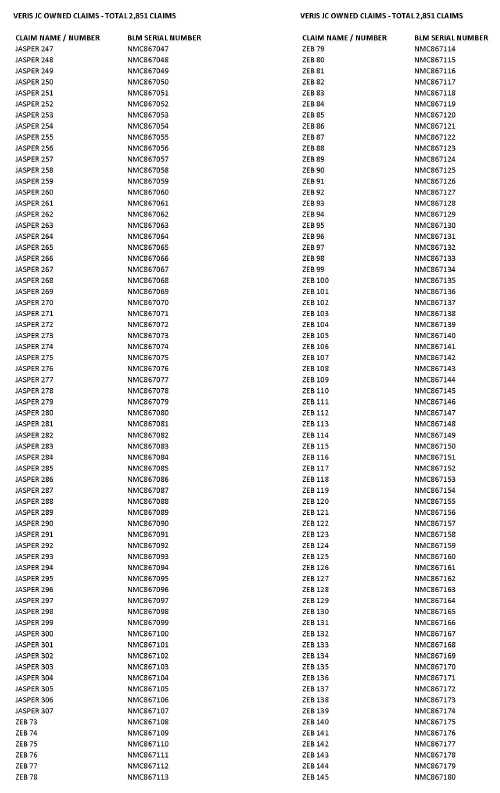
| Veris Gold Corp. | |
| NI 43-101 Technical Report Jerritt Canyon Property, Nevada | Appendix B – Claim List |
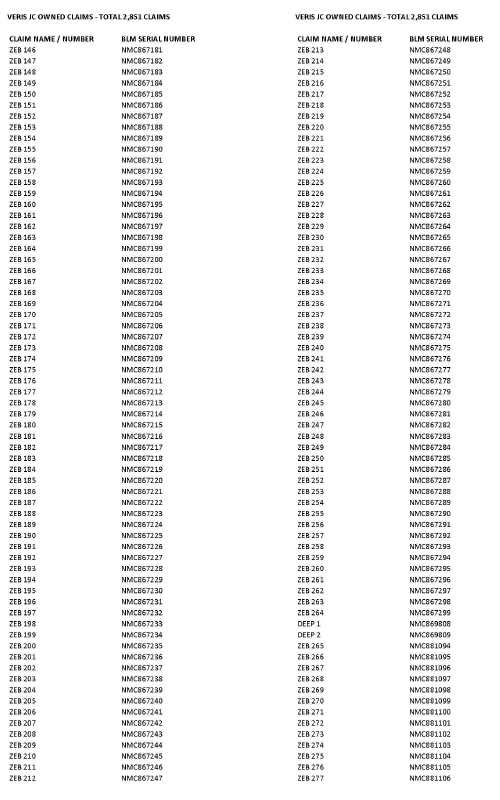
| Veris Gold Corp. | |
| NI 43-101 Technical Report Jerritt Canyon Property, Nevada | Appendix B – Claim List |
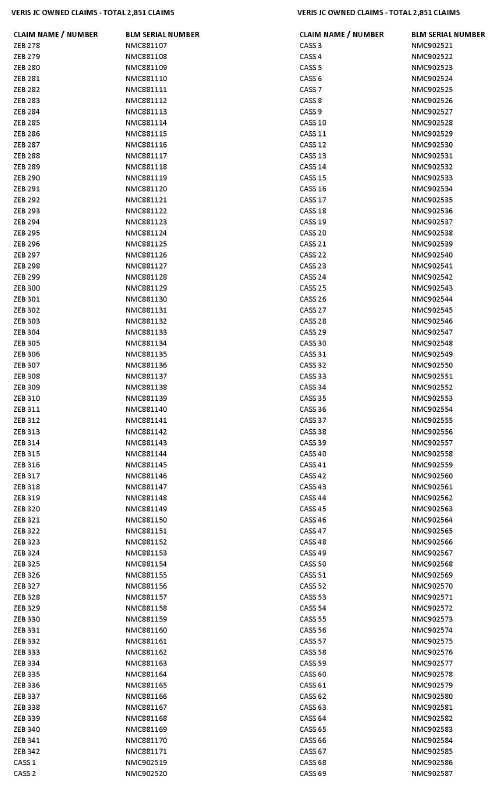
| Veris Gold Corp. | |
| NI 43-101 Technical Report Jerritt Canyon Property, Nevada | Appendix B – Claim List |

| Veris Gold Corp. | |
| NI 43-101 Technical Report Jerritt Canyon Property, Nevada | Appendix B – Claim List |

| Veris Gold Corp. | |
| NI 43-101 Technical Report Jerritt Canyon Property, Nevada | Appendix B – Claim List |