Exhibit 99.1

Disclaimer
Certain statements included or incorporated by reference in this document may constitute forward-looking statements or financial outlooks under applicable securities legislation. Such forward-looking statements or information typically contain statements with words such as "anticipate", "believe", "expect", "plan", "intend", "estimate", "propose", or similar words suggesting future outcomes or statements regarding an outlook. Forward looking statements or information in this document may include, but are not limited to: capital expenditures and Vermilion’s ability to fund such expenditures; Vermilion’s additional debt capacity providing it with additional working capital; the flexibility of Vermilion’s capital program and operations; business strategies and objectives; operational and financial performance; sustainability (Environment, Social, and Governance or ESG) data and performance; estimated volumes of reserves and resources; petroleum and natural gas sales; future production levels and the timing thereof, including Vermilion’s 2022 guidance, and rates of average annual production growth; the effect of changes in crude oil and natural gas prices, changes in exchange rates and significant declines in production or sales volumes due to unforeseen circumstances; the effect of possible changes in critical accounting estimates; statements regarding the growth and size of Vermilion’s future project inventory, and the wells expected to be drilled in 2022; exploration and development plans and the timing thereof; Vermilion’s ability to reduce its debt; statements regarding Vermilion’s hedging program, its plans to add to its hedging positions, and the anticipated impact of Vermilion’s hedging program on project economics and free cash flows; the potential financial impact of climate-related risks; acquisition and disposition plans and the timing thereof; operating and other expenses, including the payment and amount of future dividends; royalty and income tax rates and Vermilion’s expectations regarding future taxes and taxability; and the timing of regulatory proceedings and approvals.
Such forward looking statements or information are based on a number of assumptions, all or any of which may prove to be incorrect. In addition to any other assumptions identified in this document, assumptions have been made regarding, among other things: the ability of Vermilion to obtain equipment, services and supplies in a timely manner to carry out its activities in Canada and internationally; the ability of Vermilion to market crude oil, natural gas liquids, and natural gas successfully to current and new customers; the timing and costs of pipeline and storage facility construction and expansion and the ability to secure adequate product transportation; the timely receipt of required regulatory approvals; the ability of Vermilion to obtain financing on acceptable terms; foreign currency exchange rates and interest rates; future crude oil, natural gas liquids, and natural gas prices; and management’s expectations relating to the timing and results of exploration and development activities.
Although Vermilion believes that the expectations reflected in such forward looking statements or information are reasonable, undue reliance should not be placed on forward looking statements because Vermilion can give no assurance that such expectations will prove to be correct. Financial outlooks are provided for the purpose of understanding Vermilion’s financial position and business objectives, and the information may not be appropriate for other purposes. Forward looking statements or information are based on current expectations, estimates, and projections that involve a number of risks and uncertainties which could cause actual results to differ materially from those anticipated by Vermilion and described in the forward looking statements or information. These risks and uncertainties include, but are not limited to: the ability of management to execute its business plan; the risks of the oil and gas industry, both domestically and internationally, such as operational risks in exploring for, developing and producing crude oil, natural gas liquids, and natural gas; risks and uncertainties involving geology of crude oil, natural gas liquids, and natural gas deposits; risks inherent in Vermilion's marketing operations, including credit risk; the uncertainty of reserves estimates and reserves life and estimates of resources and associated expenditures; the uncertainty of estimates and projections relating to production and associated expenditures; potential delays or changes in plans with respect to exploration or development projects; Vermilion's ability to enter into or renew leases on acceptable terms; fluctuations in crude oil, natural gas liquids, and natural gas prices, foreign currency exchange rates and interest rates; health, safety, and environmental risks; uncertainties as to the availability and cost of financing; the ability of Vermilion to add production and reserves through exploration and development activities; the possibility that government policies or laws may change or governmental approvals may be delayed or withheld; uncertainty and current evolutions with relation to sustainability/ESG reporting methodologies; uncertainty in amounts and timing of royalty payments; risks associated with existing and potential future law suits and regulatory actions against Vermilion; and other risks and uncertainties described elsewhere in this document or in Vermilion's other filings with Canadian securities regulatory authorities.
The forward looking statements or information contained in this document are made as of the date hereof and Vermilion undertakes no obligation to update publicly or revise any forward looking statements or information, whether as a result of new information, future events, or otherwise, unless required by applicable securities laws.
This document contains metrics commonly used in the oil and gas industry. These oil and gas metrics do not have any standardized meaning or standard methods of calculation and therefore may not be comparable to similar measures presented by other companies where similar terminology is used and should therefore not be used to make comparisons. Natural gas volumes have been converted on the basis of six thousand cubic feet of natural gas to one barrel of oil equivalent. Barrels of oil equivalent (boe) may be misleading, particularly if used in isolation. A boe conversion ratio of six thousand cubic feet to one barrel of oil is based on an energy equivalency conversion method primarily applicable at the burner tip and does not represent a value equivalency at the wellhead.
| Vermilion Energy Inc. ■ Page 1 ■ 2022 First Quarter Report |
This document may contain references to sustainability/ESG data and performance that reflect metrics and concepts that are commonly used in such frameworks as the Global Reporting Initiative, the Task Force on Climate-related Financial Disclosures, and the Value Reporting Foundation (Sustainability Accounting Standards Board). Vermilion has used best efforts to align with the most commonly accepted methodologies for ESG reporting, including with respect to climate data and information on potential future risks and opportunities, in order to provide a fuller context for our current and future operations. However, these methodologies are not yet standardized, are frequently based on calculation factors that change over time, and continue to evolve rapidly. Readers are particularly cautioned to evaluate the underlying definitions and measures used by other companies, as these may not be comparable to Vermilion’s. While Vermilion will continue to monitor and adapt its reporting accordingly, the Company is not under any duty to update or revise the related sustainability/ESG data or statements except as required by applicable securities laws.
Financial data contained within this document are reported in Canadian dollars, unless otherwise stated.
| Vermilion Energy Inc. ■ Page 2 ■ 2022 First Quarter Report |
Abbreviations
| $M | thousand dollars |
| $MM | million dollars |
| AECO | the daily average benchmark price for natural gas at the AECO ‘C’ hub in Alberta |
| bbl(s) | barrel(s) |
| bbls/d | barrels per day |
| boe | barrel of oil equivalent, including: crude oil, condensate, natural gas liquids, and natural gas (converted on the basis of one boe for six mcf of natural gas) |
| boe/d | barrel of oil equivalent per day |
| GJ | gigajoules |
| LSB | light sour blend crude oil reference price |
| mbbls | thousand barrels |
| mcf | thousand cubic feet |
| mmcf/d | million cubic feet per day |
| NBP | the reference price paid for natural gas in the United Kingdom at the National Balancing Point Virtual Trading Point |
| NGLs | natural gas liquids, which includes butane, propane, and ethane |
| PRRT | Petroleum Resource Rent Tax, a profit based tax levied on petroleum projects in Australia |
| tCO2e | tonnes of carbon dioxide equivalent |
| TTF | the price for natural gas in the Netherlands, quoted in megawatt hours of natural gas, at the Title Transfer Facility Virtual Trading Point |
| WTI | West Texas Intermediate, the reference price paid for crude oil of standard grade in US dollars at Cushing, Oklahoma |
| Vermilion Energy Inc. ■ Page 3 ■ 2022 First Quarter Report |
Highlights
| • | Q1 2022 fund flows from operations (“FFO”)(1) was $390 million and free cash flow (“FCF”)(2) was $305 million, an increase of 21% and 73%, respectively from the prior quarter. The increases were primarily due to higher commodity prices. |
| • | Pro forma the incremental 36.5% ownership in Corrib, Q1 2022 FFO was $575 million and FCF was $489 million or ~$3.00/share, inclusive of the acquisition hedges put in place as part of the acquisition. As a reminder, all free cash flow from the Corrib acquisition accrues to Vermilion as at January 1, 2022 and will be netted off the approximate $600 million purchase price at the time of closing which remains on track for 2H 2022. |
| • | Cash flow from operating activities was $341 million in Q1 2022, including the impact from asset retirement obligations settled and changes in non-cash operating working capital. |
| • | Generated net earnings of $284 million in Q1 2022 (Q4 2021 - $345 million). Q1 net earnings were supported by an increase in FFO and impairment reversals which were primarily offset by higher unrealized hedged losses, which is accounted for on a mark-to-market basis. |
| • | Cash flow used in investing activities totaled $110 million and included exploration and development (“E&D”) capital expenditures(3) of $85 million in the first quarter. |
| • | Long-term debt decreased by $271 million in Q1 2022 to $1.4 billion and net debt(4) decreased by $280 million in Q1 2022 to $1.4 billion, resulting in a net debt to trailing FFO ratio of 1.2 times(5). |
| • | Production in Q1 2022 averaged 86,213 boe/d(6) an increase of 2% from the previous quarter. The increase was primarily due to higher production in Canada, Germany and Australia. |
| • | Production from our North American assets averaged 56,598 boe/d(6) in Q1 2022, an increase of 2% from the prior quarter primarily as a result of new production added from our Q4 2021 Canadian drilling program. |
| • | Production from our International assets averaged 29,616 boe/d(6) in Q1 2022, an increase of 2% from the prior quarter primarily due to higher production in Germany and Australia. |
| • | On March 28, 2022 we announced an agreement to acquire Leucrotta Exploration Inc. (“Leucrotta”) for a net purchase price of $477 million. This is a strategic acquisition of fully delineated, Montney assets in Northeast British Colombia and Northwest Alberta, which is expected to add 20+ years of free cash flow generating Tier 1 drilling inventory, and positions us for sustainable long-term shareholder returns. We anticipate the closing date to be in the second half of May 2022. |
| • | Vermilion reinstated a quarterly cash dividend of $0.06 CDN per share in Q1 2022 which was paid on April 18, 2022. In conjunction with our Q1 2022 release, we announced a quarterly cash dividend of $0.06 CDN per share payable on July 15, 2022 to all shareholders of record on June 30, 2022. The ex-dividend date for this payment is June 29, 2022. We expect to achieve our $1.2 billion net debt target in 2H 2022, at which time we will provide more details on our go forward return of capital framework. |
| • | Subsequent to the quarter, we issued US$400 million of eight-year senior unsecured notes at a coupon of 6.875% (priced at 99.241%). We also negotiated an extension of our credit facility with our banking syndicate to May 2026. As a result of our projected liquidity requirements and the proceeds from the debt issuance, we elected to reduce our bank facility to $1.6 billion from $2.1 billion. These transactions increase the weighted average tenor of our debt from 2.4 years to 5.3 years. |
| (1) | Fund flows from operations (FFO) is a total of segment measures comparable to cash flows from operating activities that is comprised of sales less royalties, transportation, operating, G&A, corporate income tax, PRRT, interest expense, and realized loss on derivatives, plus realized gain on foreign exchange and realized other income. More information and a reconciliation to primary financial statement measures can be found in the “Non-GAAP and Other Specified Financial Measures” section of this document. |
| (2) | Free cash flow (FCF) is a non-GAAP financial measure comparable to cash flows from operating activities and is comprised of FFO less drilling and development and evaluation and exploration expenditures. More information and a reconciliation to primary financial statement measures can be found in the “Non-GAAP and Other Specified Financial Measures” section of this document. |
| Vermilion Energy Inc. ■ Page 4 ■ 2022 First Quarter Report |
| (3) | Capital expenditures is a non-GAAP financial measure that is the measure is the sum of drilling and development costs and exploration and evaluation costs from the Consolidated Statements of Cash Flows. More information and a reconciliation to primary financial statement measures can be found in the “Non-GAAP and Other Specified Financial Measures” section of this document. |
| (4) | Net debt is a capital management measure comparable to long-term debt and is comprised of long-term debt (excluding unrealized foreign exchange on swapped USD borrowings) plus adjusted working capital (see below). More information and a reconciliation to primary financial statement measures can be found in the “Non-GAAP and Other Specified Financial Measures” section of this document. |
| (5) | Net debt to trailing FFO is a supplementary financial measure and is not a standardized financial measure under IFRS. It may not be comparable to similar measures disclosed by other issuers and is calculated using net debt (capital management measure) and FFO (total of segment measure). The measure is used to assess the ability to repay debt. Information in this document is included by reference; refer to the "Non-GAAP and Other Specified Financial Measures" section of this document. |
| (6) | Please refer to Supplemental Table 4 "Production" of the accompanying Management's Discussion and Analysis for disclosure by product type. |
| Vermilion Energy Inc. ■ Page 5 ■ 2022 First Quarter Report |
| ($M except as indicated) | Q1 2022 | Q4 2021 | Q1 2021 |
| Financial | |||
| Petroleum and natural gas sales | 810,179 | 765,915 | 368,137 |
| Cash flows from operating activities | 341,053 | 250,352 | 119,147 |
| Fund flows from operations | 389,868 | 322,173 | 162,051 |
| Fund flows from operations ($/basic share) (1) | 2.40 | 1.99 | 1.02 |
| Fund flows from operations ($/diluted share) (1) | 2.32 | 1.93 | 1.00 |
| Net earnings | 283,954 | 344,588 | 499,964 |
| Net (loss) earnings ($/basic share) | 1.75 | 2.12 | 3.15 |
| Cash flows used in investing activities | 110,330 | 134,873 | 74,659 |
| Capital expenditures (2) | 85,344 | 145,807 | 83,363 |
| Acquisitions | 6,712 | 23,633 | 393 |
| Asset retirement obligations settled | 6,320 | 13,039 | 7,023 |
| Cash dividends ($/share) | 0.06 | — | — |
| Dividends declared | 9,767 | — | — |
| % of fund flows from operations (3) | 3 % | — % | — % |
| Payout (4) | 101,431 | 158,846 | 90,386 |
| % of fund flows from operations | 26 % | 49 % | 56 % |
| Free Cash Flow | 304,524 | 176,366 | 78,688 |
| Long-term debt | 1,380,568 | 1,651,569 | 1,911,466 |
| Net debt (7) | 1,365,014 | 1,644,786 | 1,937,891 |
| Net debt to four quarter trailing fund flows from operations | 1.2 | 1.8 | 3.9 |
| Operational | |||
| Production (8) | |||
| Crude oil and condensate (bbls/d) | 37,090 | 36,264 | 39,204 |
| NGLs (bbls/d) | 8,342 | 8,461 | 8,074 |
| Natural gas (mmcf/d) | 244.69 | 238.16 | 233.98 |
| Total (boe/d) | 86,213 | 84,417 | 86,276 |
| Average realized prices | |||
| Crude oil and condensate ($/bbl) | 120.23 | 96.88 | 71.09 |
| NGLs ($/bbl) | 46.94 | 47.27 | 29.39 |
| Natural gas ($/mcf) | 17.41 | 17.89 | 5.51 |
| Production mix (% of production) | |||
| % priced with reference to WTI | 37 % | 38 % | 38 % |
| % priced with reference to Dated Brent | 17 % | 16 % | 18 % |
| % priced with reference to AECO | 29 % | 28 % | 28 % |
| % priced with reference to TTF and NBP | 17 % | 18 % | 16 % |
| Netbacks ($/boe) | |||
| Operating netback (5) | 59.72 | 48.07 | 25.58 |
| Fund flows from operations ($/boe) (6) | 50.79 | 40.73 | 21.66 |
| Operating expenses | 14.61 | 14.24 | 12.86 |
| General and administration expenses | 1.85 | 2.20 | 1.57 |
| Average reference prices | |||
| WTI (US $/bbl) | 94.29 | 77.19 | 57.84 |
| Dated Brent (US $/bbl) | 101.40 | 79.73 | 60.90 |
| AECO ($/mcf) | 4.74 | 4.66 | 3.15 |
| TTF ($/mcf) | 39.79 | 38.86 | 8.27 |
| Share information ('000s) | |||
| Shares outstanding - basic | 162,784 | 162,261 | 159,349 |
| Shares outstanding - diluted (1) | 169,797 | 168,746 | 166,018 |
| Weighted average shares outstanding - basic | 162,374 | 162,247 | 158,892 |
| Weighted average shares outstanding - diluted (1) | 168,339 | 166,519 | 161,397 |
| (1) | Fund flows from operations per share (basic and diluted) are supplementary financial measures and are not a standardized financial measures under IFRS and may not be comparable to similar measures disclosed by other issuers. They are calculated using FFO (total of segments measure) and basic/diluted shares outstanding. The measure is used to assess the contribution per share of each business unit. More information and a reconciliation to primary financial statement measures can be found in the “Non-GAAP and Other Specified Financial Measures” section of this document. |
| Vermilion Energy Inc. ■ Page 6 ■ 2022 First Quarter Report |
| (2) | Capital expenditures is a non-GAAP financial measure that is the sum of drilling and development costs and exploration and evaluation costs from the Consolidated Statements of Cash Flows. More information and a reconciliation to primary financial statement measures can be found in the “Non-GAAP and Other Specified Financial Measures” section of this document. |
| (3) | Dividends % of FFO is a supplementary financial measure that is not standardized under IFRS and may not be comparable to similar measures disclosed by other issuers, calculated as dividends divided by FFO. The ratio is used by management as a metric to assess the cash distributed to shareholders. Reconciliation to primary financial statement measures can be found in the “Non-GAAP and Other Specified Financial Measures” section of this document. |
| (4) | Payout and payout % of FFO are a non-GAAP financial measure and a non-GAAP ratio respectively that are not standardized under IFRS and may not be comparable to similar measures disclosed by other issuers. Payout is comparable to dividends declared and is comprised of dividends declared plus drilling and development costs, exploration and evaluation costs, and asset retirement obligations settled, while the ratio is calculated as payout divided by FFO. More information and a reconciliation to primary financial statement measures can be found in the “Non-GAAP and Other Specified Financial Measures” section of this document. |
| (5) | Operating netback is a non-GAAP financial measure comparable to net earnings and is comprised of sales less royalties, operating expense, transportation costs, PRRT, and realized hedging gains and losses. More information and a reconciliation to primary financial statement measures can be found in the “Non-GAAP and Other Specified Financial Measures” section of this document. |
| (6) | Fund flows from operations per boe is a supplementary financial measure that is not standardized under IFRS and may not be comparable to similar measures disclosed by other issuers, calculated as FFO by boe production. Fund flows from operations per boe is used by management to assess the profitability of our business units and Vermilion as a whole. More information and a reconciliation to primary financial statement measures can be found in the “Non-GAAP and Other Specified Financial Measures” section of this document. |
| (7) | Net debt is defined as long-term debt (excluding unrealized foreign exchange on swapped USD borrowings) plus adjusted working capital (defined as current assets less current liabilities, excluding current derivatives and current lease liabilities). |
| (8) | Please refer to Supplemental Table 4 "Production" of the accompanying Management's Discussion and Analysis for disclosure by product type. |
Message to Shareholders
We are off to a strong start in 2022 as we continue to make progress on our debt reduction targets while also announcing a strategic acquisition that enhances our long-term inventory and underpins our longer term return of capital strategy. Our Q1 2022 results benefited from strong operational performance across our portfolio along with robust commodity prices that persisted through the quarter. European natural gas prices remained at record levels during the first quarter, averaging near $40 per mmbtu, while global oil prices increased over 20% compared to the previous quarter due to geopolitical tension and concern over future supply constraints. In fact, not only did Q1 2022 commodity prices strengthen, but we have seen the forward curve strengthen across all commodities. Relative to the beginning of the year, the 2023 forward strip price(1) has increased by approximately 28% for oil to US$85/bbl (WTI), 90% for European gas to $32/mmbtu (TTF) and 65% for North American gas to $5.01/mmbtu (AECO).
The tragic events in Ukraine and the resulting impact they have had on commodity markets has increased global awareness and concern around energy security, especially in Europe. Vermilion’s operations in Europe have not been directly impacted by these events; however, we have had increased dialogue with the local governments and regulators in the countries where we operate to discuss how Vermilion can contribute to Europe’s future energy security. We are encouraged by the more constructive conversations around energy security and in particular the role of natural gas in the energy transition. We remain committed to growing our European business over time through organic development and strategic acquisition opportunities as they arise.
We delivered average production of 86,213 boe/d(2) in Q1 2022 which represents a 2% increase over the previous quarter. Strong commodity prices during the quarter, including premium European gas, resulted in an operating netback of $59.72/boe(3), including the impact from hedging. Fund flows from operations (“FFO”) was $390 million (cash flows from operating activities of $341 million), representing a 21% increase over the prior quarter. Exploration and development ("E&D") capital expenditures were $85 million (cash flow used in investing activities totaled $110 million) in Q1 2022, resulting in record quarterly free cash flow (“FCF”) of $305 million. The vast majority of this free cash flow was allocated to debt reduction while the remainder was used to fund acquisitions, asset retirement obligations and our recently reinstated quarterly dividend. Net debt decreased $280 million from year-end 2021 to $1.365 billion (long-term debt of $1.381 billion) at the end of Q1 2022, reflecting a net debt to trailing FFO ratio of approximately 1.2 times. This represents a significant improvement over the previous quarter (1.8 times) and the prior year (3.9 times), and is now within our long-term target range of 0.8 to 1.2 times.
Our pro forma Q1 results incorporating the incremental 36.5% ownership in Corrib provide another data point to reinforce our strong position to further augment shareholder return of capital later this year. We continue to make progress on the Corrib closing and expect to close the acquisition in the second half of this year while noting that the economic benefits of the acquisition accrue to Vermilion as of January 1, 2022. The Q1 2022 pro forma results illustrate the FFO and FCF generating capability of Vermilion, highlighted with FFO and FCF results of $575 million and $489 million respectively. This pro forma Q1 2022 FCF generation positions us uniquely and allows us to take a balanced approach in the near-term balancing net debt reduction with high grading and increasing the depth of the portfolio for the coming decades.
| Vermilion Energy Inc. ■ Page 7 ■ 2022 First Quarter Report |
At the end of the quarter, we announced the strategic acquisition of Leucrotta Exploration Inc., a transaction that will significantly enhance our North American portfolio by adding a fully delineated, multi-decade free cash flow generating, Montney asset. This acquisition, combined with our previously announced Corrib acquisition, will significantly strengthen our free cash flow profile over the near-and-long term. We are now forecasting a 16% increase in our 2022 exit production per share versus our base budget plans. Our objective, as we augment our return of capital plans, is to create more value per Vermilion share over the long-term, which the combination of the Corrib and Leucrotta acquisitions puts us on strong footing to achieve.
Both acquisitions are expected to be funded with internally generated pro forma FCF in 2022, currently estimated at $1.8 billion based on forward commodity prices(4). Inclusive of funding for these two acquisitions, we remain on track to achieve our $1.2 billion debt target in 2H 2022 and currently estimate year-end net debt of $1.1 billion(4), representing a pro forma net debt to trailing FFO ratio of 0.5 times. As we continue to execute our 2022 plan and move closer to achieving our $1.2 billion debt target, we expect to be in a position to increase the return of capital to our shareholders during the second half of 2022.
Our Q2 2022 drilling program is also off to a solid start. We commenced our US drilling program in mid-March and are working closely with Leucrotta on the drilling of a 6-well Montney pad which will transition to Vermilion once the transaction closes. In addition, we are making final preparations to begin our two-well offshore drilling campaign in Australia while also planning for an active maintenance turnaround schedule in several of our other business units in Q2 2022.
Due to planned turnaround activity and limited contribution from the Leucrotta acquisition in Q2 2022, we expect Q2 production to be below Q1 levels but within our initial guidance range of 83,000 to 85,000 boe/d.
Q1 2022 Operations Review
North America
Production from our North American operations averaged 56,598 boe/d(2) in Q1 2022, an increase of 2% from the prior quarter primarily due to new production added from our Canadian drilling program. During the first quarter, we drilled eight (7.2 net) wells and brought on production 18 (15.3 net) condensate-rich Mannville natural gas wells in west-central Alberta, and continued our drilling campaign in south-east Saskatchewan, where we drilled eight (7.6 net) wells and brought on production 10 (9.6 net) wells.
In the United States, we received all necessary permits for our six (5.9 net) well operated Turner drilling program in Wyoming, which will include three (2.9 net) two-mile lateral wells which are significantly more economic than one-mile laterals. Similar to our 2021 program, we moved an experienced drilling crew from Alberta down to Wyoming and completed drilling the first (0.96 net) well prior to the end of Q1 2022, with the remaining wells to be drilled in Q2 2022. In addition, one (0.4 net) two-mile non-operated Turner well is planned for Q4 2022.
International
Production from our International assets averaged 29,616 boe/d(2) in Q1 2022, an increase of 2% from the prior quarter primarily due to higher production in Germany and Australia. In Germany, the increase in production was mainly attributable to the small European gas acquisition announced in Q4 2021 to further consolidate our interest in the region. We also drilled and completed the Vorhop 63 well (1.0 net) and the Vorhop H2a2 injection well (1.0 net). Our Australia operations benefited from the absence of turnaround activities and cyclone downtime in Q1 2022. We continued the detailed engineering and equipment preparation work for the two-well Australia drilling program scheduled for Q2 2022. The increase in Germany and Australia production was slightly offset by natural declines and unplanned downtime in the Netherlands.
Production in France and Ireland was relatively consistent with the prior quarter as we continue to experience strong operational performance from those business units. In Croatia, the SA-07 3D seismic acquisition was completed (365 sq km) and the data has been sent for processing. In SA-10, the 3D seismic acquired in 2021 (292 sq km) continues to be evaluated to high grade prospects, while the regulatory, permitting, engineering and procurement activities continue for the Croatian gas plant.
Return of Capital
Vermilion reinstated a quarterly cash dividend of $0.06 CDN per share in Q1 2022 which was paid on April 18, 2022. In conjunction with our Q1 2022 release, we announced a quarterly cash dividend of $0.06 CDN per share payable on July 15, 2022 to all shareholders of record on June 30, 2022. The ex-dividend date for this payment is June 29, 2022. This dividend is an eligible dividend for the purposes of the Income Tax Act (Canada). As we achieve further debt targets, it is our intention to augment our return of capital to shareholders through one or a combination of base dividend increases, special dividends or share buybacks. We expect to achieve our $1.2 billion net debt target in 2H 2022 at which time we will provide more details on our go forward return of capital framework.
| Vermilion Energy Inc. ■ Page 8 ■ 2022 First Quarter Report |
Commodity Hedging
Vermilion hedges to manage commodity price exposures and increase the stability of our cash flows. In aggregate, as of May 2, 2022, we have 40% of our expected net-of-royalty production hedged for the remainder of 2022. With respect to individual commodity products, we have hedged 63% of our European natural gas production, 27% of our oil production, and 42% of our North American natural gas volumes for the remainder of 2022, respectively. Please refer to the Hedging section of our website under Invest With Us for further details using the following link:
https://www.vermilionenergy.com/invest-with-us/hedging.cfm.
| (Signed “Lorenzo Donadeo”) | (Signed “Dion Hatcher”) | |
| Lorenzo Donadeo | Dion Hatcher | |
| Executive Chairman | President | |
| May 11, 2022 | May 11, 2022 |
| (1) | 2023 full year average reference prices as at May 9, 2022. |
| (2) | Please refer to Supplemental Table 4 "Production" of the accompanying Management's Discussion and Analysis for disclosure by product type. |
| (3) | Operating netback: Is a non-GAAP financial measure most comparable to primary financial measure net earnings and is calculated as sales less royalties, operating expense, transportation costs, PRRT, and realized hedging gains and losses presented on a per unit basis. Management assesses operating netback as a measure of the profitability and efficiency of our field operations. |
| (4) | Forward-looking non-GAAP financial measure, refer to “Non-GAAP and Other Specified Financial Measures” section for the composition and information about this measure. 2022 full year average reference prices as at May 4 2022: Brent US$103.21/bbl; WTI US$98.23/bbl; LSB = WTI less US$3.39/bbl; TTF $40.44/mmbtu; NBP $34.69/mmbtu; AECO $6.86/mmbtu; CAD/USD 1.28; CAD/EUR 1.38 and CAD/AUD 0.92. |
| Vermilion Energy Inc. ■ Page 9 ■ 2022 First Quarter Report |
Non-GAAP and Other Specified Financial Measures
This earnings release and other materials release by Vermilion includes financial measures that are not standardized, specified, defined, or determined under IFRS and are therefore considered non-GAAP or other specified financial measures and may not be comparable to similar measures presented by other issuers. These financial measures include:
Fund flows from operations (FFO): A total of segments measure most directly comparable to net earnings. FFO is comprised of sales excluding royalties, transportation, operating, G&A, corporate income tax, PRRT, interest expense, realized loss on derivatives, realized foreign exchange gain (loss), and realized other income. The measure is used to assess the contribution of each business unit to Vermilion's ability to generate income necessary to pay dividends, repay debt, fund asset retirement obligations and make capital investments.
| Q1 2022 | Q1 2021 | |||
| $M | $/boe | $M | $/boe | |
| Sales | 810,179 | 105.52 | 368,137 | 49.20 |
| Royalties | (71,307) | (9.29) | (36,446) | (4.87) |
| Transportation | (17,269) | (2.25) | (17,021) | (2.27) |
| Operating | (112,183) | (14.61) | (96,241) | (12.86) |
| General and administration | (14,220) | (1.85) | (11,730) | (1.57) |
| Corporate income tax (expense) recovery | (45,672) | (5.95) | 1,345 | 0.18 |
| PRRT | (6,709) | (0.87) | (1,414) | (0.19) |
| Interest expense | (14,823) | (1.93) | (19,235) | (2.57) |
| Realized loss on derivatives | (144,223) | (18.78) | (25,633) | (3.43) |
| Realized foreign exchange gain (loss) | 750 | 0.10 | (5,181) | (0.69) |
| Realized other income | 5,345 | 0.70 | 5,470 | 0.73 |
| Fund flows from operations | 389,868 | 50.79 | 162,051 | 21.66 |
| Equity based compensation | (25,369) | (16,540) | ||
| Unrealized (loss) gain on derivative instruments (1) | (220,794) | 5,442 | ||
| Unrealized foreign exchange gain (loss) (1) | 40,137 | (25,910) | ||
| Accretion | (13,638) | (10,507) | ||
| Depletion and depreciation | (134,240) | (106,013) | ||
| Deferred tax recovery (expense) | 56,093 | (171,228) | ||
| Impairment reversal | 192,094 | 662,866 | ||
| Unrealized other expense | (197) | (197) | ||
| Net earnings | 283,954 | 499,964 | ||
| (1) | Unrealized (loss) gain on derivative instruments, Unrealized foreign exchange gain (loss), and Unrealized other expense are line items from the respective consolidated statements of cash flows. |
Free cash flow (FCF): A non-GAAP financial measure most directly comparable to cash flows from operating activities. FCF is comprised of fund flows from operations less drilling and development costs and exploration and evaluation costs. The measure is used to determine the funding available for investing and financing activities including payment of dividends, repayment of long-term debt, reallocation into existing business units and deployment into new ventures.
| ($M) | Q1 2022 | Q1 2021 |
| Cash flows from operating activities | 341,053 | 119,147 |
| Changes in non-cash operating working capital | 42,495 | 35,881 |
| Asset retirement obligations settled | 6,320 | 7,023 |
| Fund flows from operations | 389,868 | 162,051 |
| Drilling and development | (82,841) | (79,512) |
| Exploration and evaluation | (2,503) | (3,851) |
| Free cash flow | 304,524 | 78,688 |
2023+ FFO and FCF: A forward-looking total of segments measure and a forward-looking non-GAAP measure; the equivalent historical measures FFO and FCF have been disclosed above.
| Vermilion Energy Inc. ■ Page 10 ■ 2022 First Quarter Report |
Capital expenditures: A non-GAAP financial measure that is calculated as the sum of drilling and development costs and exploration and evaluation costs from the Consolidated Statements of Cash Flows and is most directly comparable to cash flows used in investing activities. We consider capital expenditures to be a useful measure of our investment in our existing asset base. Capital expenditures are also referred to as E&D capital.
| ($M) | Q1 2022 | Q1 2021 |
| Drilling and development | (82,841) | (79,512) |
| Exploration and evaluation | (2,503) | (3,851) |
| Capital expenditures | (85,344) | (83,363) |
Net debt: A capital management measure in accordance with IAS 1 "Presentation of Financial Statements" that is most directly comparable to long-term debt. Net debt is comprised of long-term debt (excluding unrealized foreign exchange on swapped USD borrowings) plus adjusted working, capital and represents Vermilion's net financing obligations after adjusting for the timing of working capital fluctuations.
Net debt to four quarter trailing fund flows from operations: A supplementary financial measure that is calculated as net debt (capital measure) over the FFO (total of segments measure) from the preceding four quarters. The measure is used to assess the ability to repay debt.
| As at | ||
| ($M) | Mar 31, 2022 | Dec 31, 2021 |
| Long-term debt | 1,380,568 | 1,651,569 |
| Adjusted working capital | (36,790) | 9,284 |
| Unrealized FX on swapped USD borrowings | 21,236 | (16,067) |
| Net debt | 1,365,014 | 1,644,786 |
| Ratio of net debt to four quarter trailing fund flows from operations | 1.2 | 1.8 |
Adjusted working capital: A non-GAAP financial measure defined as current assets less current liabilities, excluding current derivatives and current lease liabilities. The measure is used to calculate net debt, a capital measure disclosed above.
| As at | ||
| ($M) | Mar 31, 2022 | Dec 31, 2021 |
| Current assets | (551,940) | (472,845) |
| Current derivative asset | 26,099 | 19,321 |
| Current liabilities | 1,054,895 | 746,813 |
| Current lease liability | (14,485) | (15,032) |
| Current derivative liability | (551,359) | (268,973) |
| Adjusted working capital | (36,790) | 9,284 |
Payout and payout % of FFO: A non-GAAP financial measure and non-GAAP ratio respectively most directly comparable to dividends declared. Payout is comprised of dividends declared plus drilling and development costs, exploration and evaluation costs, and asset retirement obligations settled. The measure is used to assess the amount of cash distributed back to shareholders and reinvested in the business for maintaining production and organic growth. The reconciliation of the measure to primary financial statement measure can be found below. Management uses payout and payout as a percentage of fund flows from operations (also referred to as the payout or sustainability ratio).
Dividends % of FFO: A supplementary financial measure that is calculated as dividends declared divided by FFO (total of segments measure). The measure is used by management as a metric to assess the cash distributed to shareholders.
| Vermilion Energy Inc. ■ Page 11 ■ 2022 First Quarter Report |
| ($M) | Q1 2022 | Q1 2021 |
| Dividends declared | 9,767 | — |
| % of fund flows from operations | 3 % | — % |
| Drilling and development | 82,841 | 79,512 |
| Exploration and evaluation | 2,503 | 3,851 |
| Asset retirement obligations settled | 6,320 | 7,023 |
| Payout | 101,431 | 90,386 |
| % of fund flows from operations | 26 % | 56 % |
Operating netback: Is a non-GAAP financial measure most comparable to primary financial measure net earnings and is calculated as sales less royalties, operating expense, transportation costs, PRRT, and realized hedging gains and losses presented on a per unit basis. Management assesses operating netback as a measure of the profitability and efficiency of our field operations.
Fund flows from operations per boe: A supplementary financial measure that is calculated as FFO (total of segments measure) by boe production. Fund flows from operations per boe is used by management to assess the profitability of our business units and Vermilion as a whole.
| Vermilion Energy Inc. ■ Page 12 ■ 2022 First Quarter Report |
Management's Discussion and Analysis
The following is Management’s Discussion and Analysis (“MD&A”), dated May 11, 2022, of Vermilion Energy Inc.’s (“Vermilion”, “we”, “our”, “us” or the “Company”) operating and financial results as at and for the three months ended March 31, 2022 compared with the corresponding periods in the prior year.
This discussion should be read in conjunction with the unaudited condensed consolidated interim financial statements for the three months ended March 31, 2022 and the audited consolidated financial statements for the years ended December 31, 2021 and 2020, together with the accompanying notes. Additional information relating to Vermilion, including its Annual Information Form, is available on SEDAR at www.sedar.com or on Vermilion’s website at www.vermilionenergy.com.
The unaudited condensed consolidated interim financial statements for the three months ended March 31, 2022 and comparative information have been prepared in Canadian dollars, except where another currency has been indicated, and in accordance with IAS 34, "Interim Financial Reporting", as issued by the International Accounting Standards Board ("IASB").
This MD&A includes references to certain financial and performance measures which do not have standardized meanings prescribed by International Financial Reporting Standards ("IFRS"). These measures include:
| • | Fund flows from operations: Fund flows from operations (FFO) is a total of segments measure most directly comparable to net earnings and is comprised of sales excluding royalties, transportation, operating, G&A, corporate income tax, PRRT, interest expense, realized loss on derivatives, realized foreign exchange gain (loss), and realized other income. The measure is used to assess the contribution of each business unit to Vermilion's ability to generate income necessary to pay dividends, repay debt, fund asset retirement obligations and make capital investments. A reconciliation to Net Earnings can be found within the "Non-GAAP and Other Specified Financial Measures" section of this MD&A. |
| • | Free cash flow: Free cash flow (FCF) is a non-GAAP financial measure most directly comparable to cash flows from operating activities and is comprised of FFO less drilling and development costs and exploration and evaluation costs. The measure is used to determine the funding available for investing and financing activities including payment of dividends, repayment of long-term debt, reallocation into existing business units and deployment into new ventures. A reconciliation to primary financial statement measures can be found within the "Non-GAAP and Other Specified Financial Measures" section of this MD&A. |
| • | Net debt: Net debt is a capital management measure in accordance with IAS 1 "Presentation of Financial Statements" and is most directly comparable to long-term debt. Net debt is comprised of long-term debt (excluding unrealized foreign exchange on swapped USD borrowings) plus adjusted working capital (defined as current assets less current liabilities, excluding current derivatives and current lease liabilities), and represents Vermilion's net financing obligations after adjusting for the timing of working capital fluctuations. Net debt excludes lease obligations which are secured by a corresponding right-of-use asset. A reconciliation to primary financial statement measures can be found within the "Financial Position Review" section of this MD&A. |
| • | Operating Netbacks: Operating Netbacks is a non-GAAP financial measure most directly comparable to net earnings and is calculated as sales less royalties, operating expense, transportation costs, PRRT, and realized hedging gains and losses presented on a per unit basis. Management assesses operating netback as a measure of the profitability and efficiency of our field operations. A reconciliation to primary financial statement measures can be found within "Supplemental Table 1: Netbacks" of this MD&A. |
| • | Fund flows from operations per boe: Fund flows from operations per boe also includes general and administration expense. Fund flows from operations netback is used by management to assess the profitability of our business units and Vermilion as a whole. A reconciliation to primary financial statement measures can be found within "Supplemental Table 1: Netbacks" of this MD&A. |
In addition, this MD&A includes references to certain financial measures which are not specified, defined, or determined under IFRS and are therefore considered non-GAAP financial measures. These non-GAAP financial measures are unlikely to be comparable to similar financial measures presented by other issuers. For a full description of these non-GAAP financial measures and a reconciliation of these measures to their most directly comparable GAAP measures, please refer to the “Non-GAAP and Other Specified Financial Measures” section of this MD&A.
Product Type Disclosure
Under National Instrument 51-101 "Standards of Disclosure for Oil and Gas Activities", disclosure of production volumes should include segmentation by product type as defined in the instrument. In this report, references to "crude oil" and "light and medium crude oil" mean "light crude oil and medium crude oil" and references to "natural gas" mean "conventional natural gas".
In addition, in Supplemental Table 4 "Production", Vermilion provides a reconciliation from total production volumes to product type and also a reconciliation of "crude oil and condensate" and "NGLs" to the product types "light crude oil and medium crude oil" and "natural gas liquids".
Production volumes reported are based on quantities as measured at the first point of sale.
| Vermilion Energy Inc. ■ Page 13 ■ 2022 First Quarter Report |
Guidance
On November 29, 2021, we released our 2022 capital budget and associated production guidance. On March 28, 2022, we increased our 2022 capital expenditure guidance to $500 million and our 2022 annual production guidance to 86,000 to 88,000 boe/d to reflect the post-closing impact of the acquisition of Leucrotta Exploration Inc. 2022 guidance does not include contribution from the Corrib Acquisition and will be updated upon close.
The following table summarizes our guidance:
| Date | Capital Expenditures ($MM) | Production (boe/d) | |
| 2022 Guidance | |||
| 2022 Guidance | November 29, 2021 | 425 | 83,000 to 85,000 |
| 2022 Guidance | March 28, 2022 | 500 | 86,000 to 88,000 |
| Vermilion Energy Inc. ■ Page 14 ■ 2022 First Quarter Report |
Vermilion's Business
Vermilion is a Calgary, Alberta-based international oil and gas producer focused on the acquisition, exploration, development, and optimization of producing properties in North America, Europe, and Australia. We manage our business through our Calgary head office and our international business unit offices.

| Vermilion Energy Inc. ■ Page 15 ■ 2022 First Quarter Report |
Consolidated Results Overview
| Q1 2022 | Q1 2021 | Q1/22 vs. Q1/21 | |
| Production (1) | |||
| Crude oil and condensate (bbls/d) | 37,090 | 39,204 | (5)% |
| NGLs (bbls/d) | 8,342 | 8,074 | 3% |
| Natural gas (mmcf/d) | 244.69 | 233.98 | 5% |
| Total (boe/d) | 86,213 | 86,276 | —% |
| Build (draw) in inventory (mbbls) | 81 | 282 | |
| Financial metrics | |||
| Fund flows from operations ($M) (2) | 389,868 | 162,051 | 141% |
| Per share ($/basic share) | 2.40 | 1.02 | 135% |
| Net earnings ($M) | 283,954 | 499,964 | (43)% |
| Per share ($/basic share) | 1.75 | 3.15 | (44)% |
| Cash flows from operating activities ($M) | 341,053 | 119,147 | 186% |
| Free cash flow ($M) (3) | 304,524 | 78,688 | 287% |
| Long-term debt ($M) | 1,380,568 | 1,911,466 | (28)% |
| Net debt ($M) (4) | 1,365,014 | 1,937,891 | (30)% |
| Activity | |||
| Capital expenditures ($M) (5) | 85,344 | 83,363 | 2% |
| Acquisitions ($M) (6) | 6,712 | 393 |
| (1) | Please refer to Supplemental Table 4 "Production" for disclosure by product type. |
| (2) | Fund flows from operations (FFO) and FFO per share are a total of segments measure and supplementary financial measure respectively most directly comparable to net earnings and net earnings per share, the measures do not have a standardized meaning under IFRS and therefore may not be comparable to similar measures presented by other issuers. FFO is comprised of sales excluding royalties, transportation, operating, G&A, corporate income tax, PRRT, interest expense, and realized loss on derivatives, plus realized gain on foreign exchange and realized other income. The measure is used to assess the contribution of each business unit to Vermilion's ability to generate income necessary to pay dividends, repay debt, fund asset retirement obligations and make capital investments. A reconciliation to primary financial statement measures can be found within the "Non-GAAP and Other Specified Financial Measures" section of this MD&A. |
| (3) | Free cash flow (FCF) is a non-GAAP financial measure most directly comparable to cash flows from operating activities; it does not have a standardized meaning under IFRS and therefore may not be comparable to similar measures presented by other issuers. FCF is comprised of funds flows from operations less drilling and development costs and exploration and evaluation costs. The measure is used to determine the funding available for investing and financing activities including payment of dividends, repayment of long-term debt, reallocation into existing business units and deployment into new ventures. A reconciliation to primary financial statement measures can be found within the "Non-GAAP and Other Specified Financial Measures" section of this MD&A. |
| (4) | Net debt is a capital management measure in accordance with IAS 1 "Presentation of Financial Statements" and is most directly comparable to long-term debt. Net debt is comprised of long-term debt (excluding unrealized foreign exchange on swapped USD borrowings) plus adjusted working capital (defined as current assets less current liabilities, excluding current derivatives and current lease liabilities), and represents Vermilion's net financing obligations after adjusting for the timing of working capital fluctuations. Net debt excludes lease obligations which are secured by a corresponding right-of-use asset. A reconciliation to primary financial statement measures can be found within the "Financial Position Review" section of this MD&A. |
| (5) | Capital expenditures is a non-GAAP financial measure that does not have a standardized meaning under IFRS and therefore may not be comparable to similar measures presented by other issuers. The measure is calculated as the sum of drilling and development costs and exploration and evaluation costs from the Consolidated Statements of Cash Flows. We consider capital expenditures to be a useful measure of our investment in our existing asset base. Capital expenditures are also referred to as E&D capital. A reconciliation to primary financial statement measures can be found within the "Non-GAAP and Other Specified Financial Measures" section of this MD&A. |
| (6) | Acquisitions is a non-GAAP financial measure that does not have a standardized meaning under IFRS and therefore may not be comparable to similar measures presented by other issuers. The measure is calculated as the sum of acquisitions from the Consolidated Statements of Cash Flows, Vermilion common shares issued as consideration, the estimated value of contingent consideration, the amount of acquiree's outstanding long-term debt assumed plus or net of acquired working capital deficit or surplus. We believe that including these components provides a useful measure of the economic investment associated with our acquisition activity. A reconciliation to the acquisitions line item in the Consolidated Statements of Cash Flows can be found in "Supplemental Table 3: Capital Expenditures and Acquisitions" section of this MD&A. |
| Vermilion Energy Inc. ■ Page 16 ■ 2022 First Quarter Report |
Financial performance review
Q1 2022 vs. Q1 2021
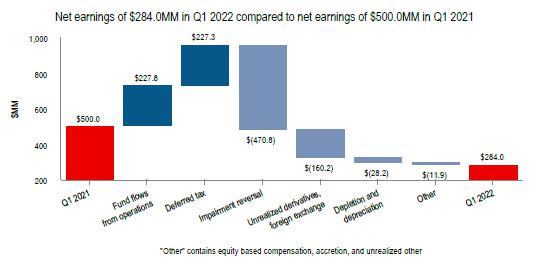
| • | We recorded net earnings of $284.0 million ($1.75/basic share) for Q1 2022 compared to net earnings of $500.0 million ($3.15/basic share) in Q1 2021. The decrease in net earnings was primarily due to a reduction in the magnitude of the impairment reversal and an increase in derivative losses driven by increases in European gas prices. These factors were partially offset by increased FFO driven by higher revenue due to strong commodity prices and deferred tax impacts due to the reduction of impairment reversals in the current year. |
| • | We generated cash flows from operating activities of $341.1 million in Q1 2022 compared to $119.1 million in Q1 2021 and fund flows from operations of $389.9 million in Q1 2022 compared to $162.1 million in Q1 2021. The increases were primarily due to higher commodity prices, which is reflected in our consolidated realized price per boe increasing from $49.20/boe in Q1 2021 to $105.52/boe in Q1 2022. This was partially offset by increased current taxes and royalties, driven by increased pricing. Variances between cash flows from operating activities and funds flow from operations are primarily driven by working capital timing differences. |

| Vermilion Energy Inc. ■ Page 17 ■ 2022 First Quarter Report |
| Production review |
Q1 2022 vs. Q1 2021
| • | Consolidated average production of 86,213 boe/d in Q1 2022 remained relatively flat compared to Q1 2021 production of 86,276 boe/d. Production increased in Germany by 2,506 boe/d and the United States by 641 boe/d due to 2021 acquisition activity which was partially offset by decreases driven by natural decline. |
| Activity review |
| • | For the three months ended March 31, 2022, capital expenditures of $85.3 million were incurred. |
| • | In our North America core region, capital expenditures of $57.5 million were incurred during Q1 2022. In Canada, $49.5 million was incurred primarily related to drilling and completion activity. During the first quarter, we drilled eight (7.2 net) wells and brought on production 18 (15.3 net) condensate-rich Mannville natural gas wells in west-central Alberta, and continued our drilling campaign in south-east Saskatchewan, where we drilled eight (7.6 net) wells and brought on production 10 (9.6 net) wells. |
| • | In our International core region, capital expenditures of $27.8 million were incurred during Q1 2022. Our activities included $9.2 million in Germany mainly related to Vorhop drilling activity and workover activity, $7.5 million incurred in Australia primarily related to pre-planning drilling and facility activities for our Q2 drilling program, and $7.0 million incurred in France on workovers and subsurface maintenance. |
| Financial sustainability review |
Cash flow from operations and free cash flow
| • | Cash flows from operating activities increased by $221.9 million to $341.1 million for the three months ended March 31, 2022 compared to the prior year period which was primarily driven by a 115% increase in consolidated realized prices. |
| • | Free cash flow of $304.5 million increased by $225.8 million for the three months ended March 31, 2022 compared to the prior year period which was primarily driven by an increase of fund flows from operations. |
Long-term debt and net debt
| • | Long-term debt decreased to $1.4 billion as at March 31, 2022 from $1.7 billion as at December 31, 2021 as a result of repayments made in the quarter which were driven by increases in free cash flow, and positive foreign exchange effects on USD borrowings of $44.6 million. |
| • | Net debt decreased to $1.4 billion as at March 31, 2022 from $1.6 billion as at December 31, 2021, mainly due to a decrease in long-term debt as a result of repayments of $226.6 million and positive foreign exchange effects on USD borrowings. |
| • | The ratio of net debt to four quarter trailing fund flows from operations(1) decreased to 1.2 as at March 31, 2022 (December 31, 2021 - 1.8 ) mainly due to lower net debt combined with higher four quarter trailing fund flows from operations. |
| (1) | Net debt to four quarter trailing fund flows from operations is a supplementary financial measure that does not have a standardized meaning under IFRS and therefore may not be comparable to similar measures presented by other issuers. It is calculated as net debt (capital measure) over the FFO from the preceding 4 quarters (total of segments measure). The measure is used to assess our ability to repay debt. |
| Vermilion Energy Inc. ■ Page 18 ■ 2022 First Quarter Report |
Benchmark Commodity Prices
| Q1 2022 | Q1 2021 | Q1/22 vs. Q1/21 | |
| Crude oil | |||
| WTI ($/bbl) | 119.39 | 73.27 | 63% |
| WTI (US $/bbl) | 94.29 | 57.84 | 63% |
| Edmonton Sweet index ($/bbl) | 115.64 | 66.63 | 74% |
| Edmonton Sweet index (US $/bbl) | 91.33 | 52.60 | 74% |
| Saskatchewan LSB index ($/bbl) | 114.39 | 66.91 | 71% |
| Saskatchewan LSB index (US $/bbl) | 90.34 | 52.82 | 71% |
| Canadian C5+ Condensate index ($/bbl) | 121.67 | 73.53 | 66% |
| Canadian C5+ Condensate index (US $/bbl) | 96.09 | 58.04 | 66% |
| Dated Brent ($/bbl) | 128.39 | 77.15 | 66% |
| Dated Brent (US $/bbl) | 101.40 | 60.90 | 67% |
| Natural gas | |||
| AECO ($/mcf) | 4.74 | 3.15 | 51% |
| NBP ($/mcf) | 38.11 | 8.70 | 338% |
| NBP (€/mcf) | 26.84 | 5.69 | 372% |
| TTF ($/mcf) | 39.79 | 8.27 | 381% |
| TTF (€/mcf) | 28.02 | 5.41 | 418% |
| Henry Hub ($/mcf) | 6.27 | 3.41 | 84% |
| Henry Hub (US $/mcf) | 4.96 | 2.69 | 84% |
| Average exchange rates | |||
| CDN $/US $ | 1.27 | 1.27 | —% |
| CDN $/Euro | 1.42 | 1.53 | (7)% |
| Realized prices | |||
| Crude oil and condensate ($/bbl) | 120.23 | 71.09 | 69% |
| NGLs ($/bbl) | 46.94 | 29.39 | 60% |
| Natural gas ($/mcf) | 17.41 | 5.51 | 216% |
| Total ($/boe) | 105.52 | 49.20 | 115% |
As an internationally diversified producer, we are exposed to a range of commodity prices. In our North America core region, our crude oil is sold at benchmarks linked to WTI (including the Edmonton Sweet index, the Saskatchewan LSB index, and the Canadian C5+ index) and our natural gas is sold at benchmarks linked to the AECO index (in Canada) or the Henry Hub index (in the United States). In our International core region, our crude oil is sold with reference to Dated Brent and our natural gas is sold with reference to NBP, TTF, or indices highly correlated to TTF.

| Vermilion Energy Inc. ■ Page 19 ■ 2022 First Quarter Report |
| • | Crude oil prices increased in Q1 2022 relative to Q1 2021. Global crude fundamentals continued to signal a tight market. Year-over-year, Canadian dollar WTI and Brent prices rose 63% and 66%, respectively. |
| • | In Canadian dollar terms, year-over-year, the Edmonton Sweet differential narrowed by $2.89/bbl to a discount of $3.75/bbl against WTI, and the Saskatchewan LSB differential narrowed by $1.36/bbl to a discount of $5.00/bbl against WTI. |
| • | Approximately 35% of Vermilion’s Q1 2022 crude oil and condensate production was priced at the Dated Brent index (which averaged a premium to WTI of US$7.11/bbl), while the remainder of our crude oil and condensate production was priced at the Saskatchewan LSB, Canadian C5+, Edmonton Sweet, and WTI indices. |

| • | In Canadian dollar terms, prices for European natural gas linked to NBP and TTF rose by 338% and 381%, respectively, in Q1 2022 compared to Q1 2021. A drop in Russian supply this past winter, low inventory levels, and competition for LNG in the global market delivered a supply shock to Europe and drove prices higher. High global coal and European carbon prices have also been supportive to natural gas prices by raising fuel substitution economics. |
| • | Natural gas prices at AECO and Nymex HH increased by 51% and 84% respectively in Q1 2022 compared to Q1 2021. NYMEX prices benefited from below average inventories driven by record LNG export demand and a lack of production growth in Q1. Strong Alberta natural gas demand resulting from permanent additions in the power sector and from oil sands production growth, combined with historically low storage levels exiting winter, helped offset high WCSB production growth. |
| • | For Q1 2022, average European natural gas prices represented a $34.21/mcf premium to AECO. Approximately 40% of our natural gas production in Q1 2022 benefited from this premium European pricing. |

| • | For the three months ended March 31, 2022, the Canadian dollar strengthened 7% against the Euro compared to Q1 2021. |
| • | For the three months ended March 31, 2022, the Canadian dollar remained flat against the US Dollar compared to Q1 2021. |
| Vermilion Energy Inc. ■ Page 20 ■ 2022 First Quarter Report |
North America
| Q1 2022 | Q1 2021 | |
| Production (1) | ||
| Crude oil and condensate (bbls/d) | 23,571 | 24,645 |
| NGLs (bbls/d) | 8,342 | 8,074 |
| Natural gas (mmcf/d) | 148.11 | 144.36 |
| Total production volume (boe/d) | 56,598 | 56,780 |
| (1) | Please refer to Supplemental Table 4 "Production" for disclosure by product type. |
| Q1 2022 | Q1 2021 | |||
| $M | $/boe | $M | $/boe | |
| Sales | 335,593 | 65.88 | 220,134 | 43.08 |
| Royalties | (57,263) | (11.24) | (28,080) | (5.49) |
| Transportation | (9,741) | (1.91) | (10,484) | (2.05) |
| Operating | (60,852) | (11.95) | (57,281) | (11.21) |
| General and administration (1) | (6,425) | (1.26) | (6,848) | (1.34) |
| Corporate income tax expense (1) | (119) | (0.02) | (214) | (0.04) |
| Fund flows from operations | 201,193 | 39.50 | 117,227 | 22.95 |
| Drilling and development | (57,513) | (59,113) | ||
| Free cash flow | 143,680 | 58,114 | ||
| (1) | Includes amounts from Corporate segment. |
Production from our North American operations averaged 56,598 boe/d(1) in Q1 2022, an increase of 2% from the prior quarter primarily due to new production added from our Canadian drilling program. During the first quarter, we drilled eight (7.2 net) wells and brought on production 18 (15.3 net) condensate-rich Mannville natural gas wells in west-central Alberta, and continued our drilling campaign in south-east Saskatchewan, where we drilled eight (7.6 net) wells and brought on production 10 (9.6 net) wells.
In the United States, we received all necessary permits for our six (5.9 net) well operated Turner drilling program in Wyoming, which will include three (2.9 net) two-mile lateral wells which are significantly more economic than one-mile laterals. Similar to our 2021 program, we moved an experienced drilling crew from Alberta down to Wyoming and completed drilling the first (0.96 net) well prior to the end of Q1 2022, with the remaining wells to be drilled in Q2 2022. In addition, one (0.4 net) two-mile non-operated Turner well is planned for Q4 2022.
| Sales |
| Q1 2022 | Q1 2021 | |||
| $M | $/boe | $M | $/boe | |
| Canada | 300,865 | 64.81 | 195,808 | 41.51 |
| United States | 34,728 | 76.96 | 24,326 | 61.81 |
| North America | 335,593 | 65.88 | 220,134 | 43.08 |
Sales in North America increased on a dollar and per unit basis for the three months ended March 31, 2022 versus the comparable prior periods due to significantly higher benchmark prices across all products and relatively consistent production volumes with the comparable period.
| Vermilion Energy Inc. ■ Page 21 ■ 2022 First Quarter Report |
| Royalties |
| Q1 2022 | Q1 2021 | |||
| $M | $/boe | $M | $/boe | |
| Canada | (48,249) | (10.39) | (21,774) | (4.62) |
| United States | (9,014) | (19.98) | (6,306) | (16.02) |
| North America | (57,263) | (11.24) | (28,080) | (5.49) |
Royalties in North America increased on a dollar and per unit basis for the three months ended March 31, 2022 versus the comparable prior period primarily due to higher benchmark prices. Royalties as a percentage of sales for the three months ended March 31, 2022 of 17.1% increased versus the comparable prior period primarily due to the effect of higher commodity prices on sliding scale royalties.
| Transportation |
| Q1 2022 | Q1 2021 | |||
| $M | $/boe | $M | $/boe | |
| Canada | (9,454) | (2.04) | (10,236) | (2.17) |
| United States | (287) | (0.64) | (248) | (0.63) |
| North America | (9,741) | (1.91) | (10,484) | (2.05) |
Transportation expense in North America remained relatively consistent on a dollar and per boe basis for the three months ended March 31, 2022 versus the comparable prior period.
| Operating expense |
| Q1 2022 | Q1 2021 | |||
| $M | $/boe | $M | $/boe | |
| Canada | (55,766) | (12.01) | (53,166) | (11.27) |
| United States | (5,086) | (11.27) | (4,115) | (10.46) |
| North America | (60,852) | (11.95) | (57,281) | (11.21) |
Operating expenses in North America for the three months ended March 31, 2022 increased on a dollar basis versus the comparable period primarily due to an increase in normal course maintenance activities in both Canada and the United States. On a per boe basis, operating expenses increased by 6.6% primarily due to the increased costs noted above, combined with fixed costs on relatively consistent production.
| Vermilion Energy Inc. ■ Page 22 ■ 2022 First Quarter Report |
International
| Q1 2022 | Q1 2021 | |
| Production (1) | ||
| Crude oil and condensate (bbls/d) | 13,519 | 14,560 |
| Natural gas (mmcf/d) | 96.58 | 89.62 |
| Total production volume (boe/d) | 29,616 | 29,495 |
| Total sales volume (boe/d) | 28,712 | 26,357 |
| (1) | Please refer to Supplemental Table 4 "Production" for disclosure by product type. |
| Q1 2022 | Q1 2021 | |||
| $M | $/boe | $M | $/boe | |
| Sales | 474,586 | 183.66 | 148,003 | 62.39 |
| Royalties | (14,044) | (5.43) | (8,366) | (3.53) |
| Transportation | (7,528) | (2.91) | (6,537) | (2.76) |
| Operating | (51,331) | (19.86) | (38,960) | (16.42) |
| General and administration | (7,795) | (3.02) | (4,882) | (2.06) |
| Corporate income tax (expense) recovery | (45,553) | (17.63) | 1,559 | 0.66 |
| PRRT | (6,709) | (2.60) | (1,414) | (0.60) |
| Fund flows from operations | 341,626 | 132.21 | 89,403 | 37.68 |
| Drilling and development | (25,328) | (20,399) | ||
| Exploration and evaluation | (2,503) | (3,851) | ||
| Free cash flow | 313,795 | 65,153 | ||
Production from our International assets averaged 29,616 boe/d(1) in Q1 2022, an increase of 2% from the prior quarter primarily due to higher production in Germany and Australia. In Germany, the increase in production was mainly attributable to the small European gas acquisition announced in Q4 2021 to further consolidate our interest in the region. We also drilled and completed the Vorhop 63 well (1.0 net) and the Vorhop H2a2 injection well (1.0 net). Our Australia operations benefited from the absence of turnaround activities and cyclone downtime in Q1 2022. We continued the detailed engineering and equipment preparation work for the two-well Australia drilling program scheduled for Q2 2022. The increase in Germany and Australia production was slightly offset by natural declines and unplanned downtime in the Netherlands.
Production in France and Ireland was relatively consistent with the prior quarter as we continue to experience strong operational performance from those business units. In Croatia, the SA-07 3D seismic acquisition was completed (365 sq km) and the data has been sent for processing. In SA-10, the 3D seismic acquired in 2021 (292 sq km) continues to be evaluated to high grade prospects, while the regulatory, permitting, engineering and procurement activities continue for the Croatian gas plant.
| Sales |
| Q1 2022 | Q1 2021 | |||
| $M | $/boe | $M | $/boe | |
| Australia | 49,581 | 147.16 | 27,382 | 94.50 |
| France | 92,898 | 133.41 | 51,529 | 77.19 |
| Netherlands | 132,572 | 223.57 | 28,551 | 45.28 |
| Germany | 94,558 | 189.55 | 13,095 | 49.82 |
| Ireland | 104,029 | 229.22 | 27,068 | 52.85 |
| Central and Eastern Europe | 948 | 184.80 | 378 | 39.51 |
| International | 474,586 | 183.66 | 148,003 | 62.39 |
As a result of changes in inventory levels, our sales volumes for crude oil in Australia, France, and Germany may differ from our production volumes in those business units. The following table provides the crude oil sales volumes (consisting entirely of "light crude oil and medium crude oil") for those jurisdictions.
| Vermilion Energy Inc. ■ Page 23 ■ 2022 First Quarter Report |
| Crude oil sales volumes (bbls/d) | Q1 2022 | Q1 2021 |
| Australia | 3,743 | 3,219 |
| France | 7,737 | 7,417 |
| Germany | 1,051 | 687 |
| International | 12,531 | 11,323 |
Sales increased on a dollar and per boe basis for the three months ended March 31, 2022 versus the prior year comparable period due to higher realized prices across all business units as a result of significant increases in the commodity markets combined with higher sales volumes due to timing of liftings (Australia) and prior year acquisitions (Germany). These increases were partially offset by lower sales volumes in Ireland, the Netherlands, and Central Eastern Europe driven by natural decline combined with the timing of liftings in France.
| Royalties |
| Q1 2022 | Q1 2021 | |||
| $M | $/boe | $M | $/boe | |
| France | (8,724) | (12.53) | (7,236) | (10.84) |
| Netherlands | — | — | (97) | (0.15) |
| Germany | (5,043) | (10.11) | (955) | (3.63) |
| Central and Eastern Europe | (277) | (54.00) | (78) | (8.15) |
| International | (14,044) | (5.43) | (8,366) | (3.53) |
Royalties in our International core region are primarily incurred in France, where royalties include charges based on a percentage of sales and fixed per boe charges. Our production in Australia and Ireland is not subject to royalties.
Royalties on a dollar and per unit basis for the three months ended March 31, 2022 versus the same period in the prior year increased primarily due to higher sales prices combined with an increase in royalty rates in Germany.
Royalties as a percentage of sales for the three months ended March 31, 2022 decreased to 3.0% compared to 5.7% in the prior year comparative period. This was primarily due to higher sales in business units that are not subject to royalties combined with the impact of RCDM royalties in France, which are levied on units of production and not subject to changes in commodity prices.
| Transportation |
| Q1 2022 | Q1 2021 | |||
| $M | $/boe | $M | $/boe | |
| France | (4,766) | (6.84) | (4,405) | (6.60) |
| Germany | (1,781) | (3.57) | (1,021) | (3.88) |
| Ireland | (981) | (2.16) | (1,111) | (2.17) |
| International | (7,528) | (2.91) | (6,537) | (2.76) |
Transportation expense increased slightly for the three months ended March 31, 2022 versus the comparable prior year period. This increase was primarily due to 2021 acquisition activity in Germany resulting in higher volumes produced and sold requiring transportation in this region. On a per unit basis, transportation expense remained relatively consistent versus prior year.
Our production in Australia, Netherlands and Central and Eastern Europe is not subject to transportation expense.
| Vermilion Energy Inc. ■ Page 24 ■ 2022 First Quarter Report |
| Operating expense |
| Q1 2022 | Q1 2021 | |||
| $M | $/boe | $M | $/boe | |
| Australia | (13,340) | (39.59) | (9,738) | (33.61) |
| France | (15,030) | (21.58) | (11,791) | (17.66) |
| Netherlands | (10,470) | (17.66) | (7,411) | (11.75) |
| Germany | (8,293) | (16.62) | (6,302) | (23.97) |
| Ireland | (3,853) | (8.49) | (3,657) | (7.14) |
| Central and Eastern Europe | (345) | (67.25) | (61) | (6.38) |
| International | (51,331) | (19.86) | (38,960) | (16.42) |
Operating expenses increased in all business units on a dollar basis for the three months ended Q1 2022 versus Q1 2021 by $12.4 million. The primary driver to the increased operating expenses was the impacts of higher electricity prices in Europe.
On a per boe basis, a decrease versus prior year in Germany was driven by increased volumes from 2021 acquisition activity, partially offset by increased fuel and electricity charges. Increased per boe operating expenses in our other International jurisdictions were primarily due to impacts of natural decline on production on stable fixed costs and increased fuel and electricity charges.
| Vermilion Energy Inc. ■ Page 25 ■ 2022 First Quarter Report |
Consolidated Financial Performance Review
| Financial performance |
| Q1 2022 | Q1 2021 | |||
| $M | $/boe | $M | $/boe | |
| Sales | 810,179 | 105.52 | 368,137 | 49.20 |
| Royalties | (71,307) | (9.29) | (36,446) | (4.87) |
| Transportation | (17,269) | (2.25) | (17,021) | (2.27) |
| Operating | (112,183) | (14.61) | (96,241) | (12.86) |
| General and administration | (14,220) | (1.85) | (11,730) | (1.57) |
| Corporate income tax (expense) recovery | (45,672) | (5.95) | 1,345 | 0.18 |
| PRRT | (6,709) | (0.87) | (1,414) | (0.19) |
| Interest expense | (14,823) | (1.93) | (19,235) | (2.57) |
| Realized loss on derivatives | (144,223) | (18.78) | (25,633) | (3.43) |
| Realized foreign exchange gain (loss) | 750 | 0.10 | (5,181) | (0.69) |
| Realized other income | 5,345 | 0.70 | 5,470 | 0.73 |
| Fund flows from operations | 389,868 | 50.79 | 162,051 | 21.66 |
| Equity based compensation | (25,369) | (16,540) | ||
| Unrealized (loss) gain on derivative instruments (1) | (220,794) | 5,442 | ||
| Unrealized foreign exchange gain (loss) (1) | 40,137 | (25,910) | ||
| Accretion | (13,638) | (10,507) | ||
| Depletion and depreciation | (134,240) | (106,013) | ||
| Deferred tax recovery (expense) | 56,093 | (171,228) | ||
| Impairment reversal | 192,094 | 662,866 | ||
| Unrealized other expense (1) | (197) | (197) | ||
| Net earnings | 283,954 | 499,964 | ||
| (1) | Unrealized (loss) gain on derivative instruments, Unrealized foreign exchange gain (loss), and Unrealized other expense are line items from the respective consolidated statements of cash flows. |
Fluctuations in fund flows from operations may occur as a result of changes in production levels, commodity prices, and costs to produce petroleum and natural gas. In addition, fund flows from operations may be affected by the timing of crude oil shipments in Australia and France. When crude oil inventory is built up, the related operating expense, royalties, and depletion expense are deferred and carried as inventory on the consolidated balance sheet. When the crude oil inventory is subsequently drawn down, the related expenses are recognized within profit or loss.
General and administration
| • | General and administration expense increased for the three months ended March 31, 2022 versus the prior year comparable period primarily due to higher acquisition and information technology costs. |
PRRT and corporate income taxes
| • | PRRT increased for the three months ended March 31, 2022 versus the prior year comparable period primarily due to higher sales in Australia. |
| • | Corporate income taxes for the three months ended March 31, 2022 increased versus the prior year comparable period primarily due to higher taxable income as a result of increased commodity prices realized in 2022. |
Interest expense
| • | Interest expense decreased for the three months ended March 31, 2022 versus the prior year comparable period primarily due to lower average drawn balances and a lower pricing grid level on the revolving credit facility. |
Realized gain or loss on derivatives
| • | For the three months ended March 31, 2022, we recorded realized losses on our crude oil and natural gas hedges due to higher commodity pricing compared to the strike prices on our hedges. |
| • | A listing of derivative positions as at March 31, 2022 is included in “Supplemental Table 2” of this MD&A. |
| Vermilion Energy Inc. ■ Page 26 ■ 2022 First Quarter Report |
Realized other income
| • | Realized other income for Q1 2022 and Q1 2021 primarily relates to amounts for funding under the Saskatchewan Accelerated Site Closure program to complete abandonment and reclamation on inactive oil and gas wells and facilities. |
| Net earnings |
Fluctuations in net earnings from period-to-period are caused by changes in both cash and non-cash based income and charges. Cash based items are reflected in fund flows from operations. Non-cash items include: equity based compensation expense, unrealized gains and losses on derivative instruments, unrealized foreign exchange gains and losses, accretion, depletion and depreciation expense, and deferred taxes. In addition, non-cash items may also include gains resulting from business combinations or charges resulting from impairment or impairment reversals.
Equity based compensation
Equity based compensation expense relates primarily to non-cash compensation expense attributable to long-term incentives granted to directors, officers, and employees under security-based arrangements. Equity based compensation expense increased in Q1 2022 versus Q1 2021 primarily due to higher bonuses in Q1 2022 under the employee bonus plan combined with an increase to the performance factor on VIP awards vesting in 2022.
Unrealized gain or loss on derivative instruments
Unrealized gain or loss on derivative instruments arises as a result of changes in forecasts for future prices and rates. As Vermilion uses derivative instruments to manage the commodity price exposure of our future crude oil and natural gas production, we will normally recognize unrealized gains on derivative instruments when future commodity price forecasts decline and vice-versa. As derivative instruments are settled, the unrealized gain or loss previously recognized is reversed, and the settlement results in a realized gain or loss on derivative instruments.
USD-to-CAD cross currency interest rate swaps and foreign exchange swaps may be entered into to hedge the foreign exchange movements on USD borrowings on our revolving credit facility. As such, unrealized gains and losses on our cross currency interest swaps are offset by unrealized losses and gains on foreign exchange relating to the underlying USD borrowings from our revolving credit facility.
For the three months ended March 31, 2022, we recognized a net unrealized loss on derivative instruments of $220.8 million. This consists of unrealized losses of $142.6 million on our European natural gas commodity derivative instruments, $62.6 million on our crude oil commodity derivative instruments, $17.3 million on our North American natural gas commodity derivative instruments, and $37.3 million on our USD-to-CAD foreign exchange swaps, partially offset by unrealized gains of $39.0 million on our equity swaps.
Unrealized foreign exchange gains or losses
As a result of Vermilion’s international operations, Vermilion has monetary assets and liabilities denominated in currencies other than the Canadian dollar. These monetary assets and liabilities include cash, receivables, payables, long-term debt, derivative instruments and intercompany loans. Unrealized foreign exchange gains and losses result from translating these monetary assets and liabilities from their underlying currency to the Canadian dollar.
In 2022, unrealized foreign exchange gains and losses primarily resulted from:
| • | The translation of Euro denominated intercompany loans from Vermilion Energy Inc. to our international subsidiaries. An appreciation in the Euro against the Canadian dollar will result in an unrealized foreign exchange gain (and vice-versa). Under IFRS, the offsetting foreign exchange loss or gain is recorded as a currency translation adjustment within other comprehensive income. As a result, consolidated comprehensive income reflects the offsetting of these translation adjustments while net earnings reflects only the parent company's side of the translation. |
| • | The translation of USD borrowings on our revolving credit facility. The unrealized foreign exchange gains or losses on these borrowings are offset by unrealized derivative gains or losses on associated USD-to-CAD cross currency interest rate swaps (discussed further below). |
| • | The translation of our USD denominated senior unsecured notes prior to June 12, 2019 and from May 5, 2020 onward. During the period between June 12, 2019 and May 5, 2020 the USD senior notes were hedged by a USD-to-CAD cross currency interest rate swap. Subsequent to the termination of these instruments, amounts previously recognized in the hedge accounting reserve will be recognized into earnings through unrealized foreign exchange loss over the period of the hedged cash flows. |
For the three months ended March 31, 2022, we recognized a net unrealized foreign exchange gain of $40.1 million, driven by unrealized gains of $39.2 million on our USD borrowings from our revolving credit facility, as well as an unrealized gain of $5.4 million on our senior unsecured notes resulting from the US dollar weakening 1.4% against the Canadian dollar in Q1 2022. This was partially offset by an unrealized loss of $2.0 million on intercompany loans due to the Euro weakening 3.7% against the Canadian dollar in Q1 2022.
| Vermilion Energy Inc. ■ Page 27 ■ 2022 First Quarter Report |
As at March 31, 2022, a $0.01 appreciation of the Euro against the Canadian dollar would not result in a material change to net earnings as a result of an unrealized gain or loss on foreign exchange. In contrast, a $0.01 appreciation of the US dollar against the Canadian dollar would result in a $1.0 million decrease to net earnings as a result of an unrealized loss on foreign exchange.
Accretion
Accretion expense is recognized to update the present value of the asset retirement obligation balance. For the three months ended March 31, 2022, accretion expense increased versus the comparable period primarily due to the impact of a higher asset retirement obligation balance at the end of 2021 compared to 2020, partially offset by the weakening of the Euro against the Canadian dollar.
Depletion and depreciation
Depletion and depreciation expense is recognized to allocate the cost of capital assets over the useful life of the respective assets. Depletion and depreciation expense per unit of production is determined for each depletion unit (which are groups of assets within a specific production area that have similar economic lives) by dividing the sum of the net book value of capital assets and future development costs by total proved plus probable reserves.
Fluctuations in depletion and depreciation expense are primarily the result of changes in produced crude oil and natural gas volumes, and changes in depletion and depreciation per unit. Fluctuations in depletion and depreciation per unit are the result of changes in reserves, depletable base (net book value of capital assets and future development costs), and relative production mix.
Depletion and depreciation on a per boe basis for the three months ended March 31, 2022 of $17.48 increased from $14.17 in the comparable prior year period primarily due to impairment reversals and increases in asset retirement obligation assets recorded in 2021.
Deferred tax
Deferred tax assets arise when the tax basis of an asset exceeds its accounting basis (known as a deductible temporary difference). Conversely, deferred tax liabilities arise when the tax basis of an asset is less than its accounting basis (known as a taxable temporary difference). Deferred tax assets are recognized only to the extent that it is probable that there are future taxable profits against which the deductible temporary difference can be utilized. Deferred tax assets and liabilities are measured at the enacted or substantively enacted tax rate that is expected to apply when the asset is realized, or the liability is settled.
As such, fluctuations in deferred tax expenses and recoveries primarily arise as a result of: changes in the accounting basis of an asset or liability without a corresponding tax basis change (e.g. when derivative assets and liabilities are marked-to-market or when accounting depletion differs from tax depletion), changes in available tax losses (e.g. if they are utilized to offset taxable income), changes in estimated future taxable profits resulting in a derecognition or recognition of deferred tax assets, and changes in enacted or substantively enacted tax rates.
For the three months ended March 31, 2022, the Company recorded a deferred tax recovery of $56.1 million compared to deferred tax expense of $171.2 million for the comparable period. The deferred tax recovery for the three months ended March 31, 2022 is primarily due to the recognition of non-expiring tax loss pools in Ireland that are expected to be utilized due to an increase in forecast commodity prices, partially offset by deferred taxes on impairment reversals.
Impairment
Impairment losses or reversals of losses are recognized when indicators of impairment or impairment reversal arise and the carrying amount of a cash generating unit ("CGU") is greater than (impairment) or less than (impairment reversal) its recoverable amount, determined as the higher of fair value less costs of disposal or value-in-use.
In the first quarter of 2022, indicators of impairment reversal were present in our Canada - Saskatchewan and France - Neocomian CGUs due to an increase in forecast oil prices. As a result of the indicators of impairment reversal, the Company performed impairment reversal calculations on the identified CGUs and the recoverable amounts were determined using fair value less costs to sell, which considered future after-tax cash flows from proved plus probable reserves and an after-tax discount rate of 12.0%. Based on the results of the impairment reversal calculations completed, recoverable amounts were determined to be greater than the carrying values of the CGUs tested and $144.4 million (net of $47.7 million deferred income tax expense) of impairment reversal was recorded.
Inputs used in the measurement of capital assets are not based on observable market data and fall within level 3 of the fair value hierarchy.
| Vermilion Energy Inc. ■ Page 28 ■ 2022 First Quarter Report |
Financial Position Review
| Balance sheet strategy |
We regularly review whether our forecast of fund flows from operations is sufficient to finance planned capital expenditures, dividends, and abandonment and reclamation expenditures. To the extent that fund flows from operations forecasts are not expected to be sufficient to fulfill such expenditures, we will evaluate our ability to finance any shortfall by reducing some or all categories of expenditures, with issuances of equity, and/or with debt (including borrowing using the unutilized capacity of our existing revolving credit facility). We have a long-term goal of achieving and maintaining a ratio of net debt to fund flows from operations of approximately 1.0.
As at March 31, 2022, we have a ratio of net debt to fund flows from operations of 1.2. We will continue to monitor for changes in forecasted fund flows from operations and, as appropriate, will adjust our exploration and development capital plans (and associated production targets) to target optimal debt levels. We intend to continue to strengthen our balance sheet in 2022 through debt reduction and have announced a quarterly dividend in the first quarter of 2022. We will continue to assess our return of capital strategy as we strengthen our balance sheet and may further augment our return of capital to shareholders as debt targets are achieved.
| Net debt |
Net debt is reconciled to long-term debt, as follows:
| As at | ||
| ($M) | Mar 31, 2022 | Dec 31, 2021 |
| Long-term debt | 1,380,568 | 1,651,569 |
| Adjusted working capital (1) | (36,790) | 9,284 |
| Unrealized FX on swapped USD borrowings | 21,236 | (16,067) |
| Net debt | 1,365,014 | 1,644,786 |
| Ratio of net debt to four quarter trailing fund flows from operations | 1.2 | 1.8 |
| (1) | Adjusted working capital is a non-GAAP financial measure that is not standardized under IFRS and may not be comparable to similar measures disclosed by other issuers. It is defined as current assets less current liabilities, excluding current derivatives and current lease liabilities. The measure is used to calculate net debt capital measure disclosed above. Reconciliation to primary financial statement measures can be found in the “Non-GAAP and Other Specified Financial Measures” section of this document. |
As at March 31, 2022, net debt decreased to $1.4 billion (December 31, 2021 - $1.6 billion) primarily as a result of debt repayments of $226.6 million funded by the $304.5 million of free cash flow generated during the quarter. The ratio of net debt to four quarter trailing fund flows from operations decreased to 1.2 (December 31, 2021 - 1.8) due to the decrease in net debt and higher four quarter trailing fund flows from operations driven by strong commodity prices.
| Long-term debt |
The balances recognized on our balance sheet are as follows:
| As at | ||
| ($M) | Mar 31, 2022 | Dec 31, 2021 |
| Revolving credit facility | 1,007,984 | 1,273,755 |
| Senior unsecured notes | 372,584 | 377,814 |
| Long-term debt | 1,380,568 | 1,651,569 |
| Vermilion Energy Inc. ■ Page 29 ■ 2022 First Quarter Report |
Revolving Credit Facility
As at March 31, 2022, Vermilion had in place a bank revolving credit facility maturing May 31, 2024 with terms and outstanding positions as follows:
| As at | ||
| ($M) | Mar 31, 2022 | Dec 31, 2021 |
| Total facility amount | 2,100,000 | 2,100,000 |
| Amount drawn | (1,007,984) | (1,273,755) |
| Letters of credit outstanding | (11,434) | (11,035) |
| Unutilized capacity | 1,080,582 | 815,210 |
As at March 31, 2022, the revolving credit facility was subject to the following financial covenants:
| As at | |||
| Financial covenant | Limit | Mar 31, 2022 | Dec 31, 2021 |
| Consolidated total debt to consolidated EBITDA | Less than 4.0 | 1.09 | 1.61 |
| Consolidated total senior debt to consolidated EBITDA | Less than 3.5 | 0.80 | 1.24 |
| Consolidated EBITDA to consolidated interest expense | Greater than 2.5 | 19.99 | 14.78 |
Our financial covenants include financial measures defined within our revolving credit facility agreement that are not defined under IFRS. These financial measures are defined by our revolving credit facility agreement as follows:
| • | Consolidated total debt: Includes all amounts classified as “Long-term debt”, “Current portion of long-term debt”, and “Lease obligations” (including the current portion included within "Accounts payable and accrued liabilities" but excluding operating leases as defined under IAS 17) on our balance sheet. |
| • | Consolidated total senior debt: Consolidated total debt excluding unsecured and subordinated debt. |
| • | Consolidated EBITDA: Consolidated net earnings before interest, income taxes, depreciation, accretion and certain other non-cash items, adjusted for the impact of the acquisition of a material subsidiary. |
| • | Total interest expense: Includes all amounts classified as "Interest expense", but excludes interest on operating leases as defined under IAS 17. |
In addition, our revolving credit facility has provisions relating to our liability management ratings in Alberta and Saskatchewan whereby if our security adjusted liability management ratings fall below specified limits in a province, a portion of the asset retirement obligations are included in the definitions of consolidated total debt and consolidated total senior debt. An event of default occurs if our security adjusted liability management ratings breach additional lower limits for a period greater than 90 days. As of March 31, 2022, Vermilion's liability management ratings were higher than the specified levels, and as such, no amounts relating to asset retirement obligations were included in the calculation of consolidated total debt and consolidated total senior debt.
Senior Unsecured Notes
On March 13, 2017, Vermilion issued US $300.0 million of senior unsecured notes at par. The notes bear interest at a rate of 5.625% per annum, paid semi-annually on March 15 and September 15, and mature on March 15, 2025. As direct senior unsecured obligations of Vermilion, the notes rank equally in right of payment with existing and future senior indebtedness of the Company.
The senior unsecured notes were recognized at amortized cost and include the transaction costs directly related to the issuance.
Vermilion may redeem some or all of the senior unsecured notes at the redemption prices set forth in the following table plus any accrued and unpaid interest, if redeemed during the twelve-month period beginning on March 15 of each of the years indicated below:
| Year | Redemption price |
| 2022 | 101.406 % |
| 2023 and thereafter | 100.000 % |
Financing Update
On April 26, 2022, Vermilion closed a private offering of US $400 million 8-year senior unsecured notes (the “New Notes”). The New Notes were priced at 99.241% of par, mature on May 1, 2030, and bear interest at a rate of 6.875% per annum. Interest is to be paid semi-annually on May 1 and November 1, commencing on November 1, 2022. The New Notes are senior unsecured obligations of Vermilion and rank equally with existing and future senior unsecured indebtedness. Net proceeds from the New Notes were used to repay a portion of the amount outstanding on the Company’s revolving credit facility. Contemporaneous with the closing of the New Notes, the maturity date of Vermilion’s revolving credit facility was extended to May 29, 2026 (from May 31, 2024) and the total facility amount was reduced to Vermilion’s targeted level of $1.6 billion (from $2.1 billion).
| Vermilion Energy Inc. ■ Page 30 ■ 2022 First Quarter Report |
| Shareholders' capital |
The following table outlines our dividend payment history:
| Date | Frequency | Dividend per unit or share |
| January 2003 to December 2007 | Monthly | $0.170 |
| January 2008 to December 2012 | Monthly | $0.190 |
| January 2013 to December 2013 | Monthly | $0.200 |
| January 2014 to March 2018 | Monthly | $0.215 |
| April 2018 to February 2020 | Monthly | $0.230 |
| March 2020 | Monthly | $0.115 |
| April 2022 | Quarterly | $0.060 |
In the first quarter of 2022 we announced our plan to distribute a fixed quarterly dividend due to stronger commodity prices and a strengthened balance sheet. Our first $0.06/share quarterly dividend was announced on March 7, 2022 and was paid on April 18, 2022.
The following table reconciles the change in shareholders’ capital:
| Shareholders’ Capital | Number of Shares ('000s) | Amount ($M) |
| Balance at December 31, 2021 | 162,261 | 4,241,773 |
| Vesting of equity based awards | 10 | 180 |
| Equity based compensation | 512 | 12,766 |
| Share-settled dividends on vested equity based awards | 1 | 12 |
| Balance at March 31, 2022 | 162,784 | 4,254,731 |
As at March 31, 2022, there were approximately 6.3 million equity based compensation awards outstanding. As at May 11, 2022, there were approximately 165.2 million common shares issued and outstanding.
Asset Retirement Obligations
As at March 31, 2022, asset retirement obligations were $1,019.9 million compared to $1,000.6 million as at December 31, 2021. The increase in asset retirement obligations is primarily attributable to a decrease in the credit-adjusted risk-free rate from 4.9% at December 31, 2021 to 4.0% at March 31, 2022, partially offset by increases in country-specific risk-free rates and the Euro weakening against the Canadian dollar.
The present value of the obligation is calculated using a credit-adjusted risk-free rate, calculated using a credit spread added to risk-free rates based on long-term, risk-free government bonds. Vermilion's credit spread is determined using the Company's expected cost of borrowing at the end of the reporting period.
The risk-free rates and credit spread used as inputs to discount the obligations were as follows:
| Mar 31, 2022 | Dec 31, 2021 | Change | |
| Credit spread added to below noted risk-free rates | 4.0 % | 4.9 % | (0.9) % |
| Country specific risk-free rate | |||
| Canada | 2.4 % | 1.8 % | 0.6 % |
| United States | 2.5 % | 1.9 % | 0.6 % |
| France | 1.3 % | 0.8 % | 0.5 % |
| Netherlands | 0.5 % | (0.3) % | 0.8 % |
| Germany | 0.6 % | 0.1 % | 0.5 % |
| Ireland | 1.2 % | 0.5 % | 0.7 % |
| Australia | 3.0 % | 1.9 % | 1.1 % |
| Vermilion Energy Inc. ■ Page 31 ■ 2022 First Quarter Report |
Risks and Uncertainties
Vermilion is exposed to various market and operational risks. For a discussion of these risks, please see Vermilion's MD&A and Annual Information Form, each for the year ended December 31, 2021 available on SEDAR at www.sedar.com or on Vermilion’s website at www.vermilionenergy.com.
Critical Accounting Estimates
The preparation of financial statements in accordance with IFRS requires management to make estimates, judgments and assumptions that affect
reported assets, liabilities, revenues and expenses, gains and losses, and disclosures of any possible contingencies. These estimates and assumptions are developed based on the best available information which management believed to be reasonable at the time such estimates and assumptions were made. As such, these assumptions are uncertain at the time estimates are made and could change, resulting in a material impact on Vermilion’s consolidated financial statements. Estimates are reviewed by management on an ongoing basis and as a result may change from period to period due to the availability of new information or changes in circumstances. Additionally, as a result of the unique circumstances of each jurisdiction that Vermilion operates in, the critical accounting estimates may affect one or more jurisdictions. There have been no material changes to our critical accounting estimates used in applying accounting policies for the three months ended March 31, 2022. Further information, including a discussion of critical accounting estimates, can be found in the notes to the Consolidated Financial Statements and annual MD&A for the year ended December 31, 2021, available on SEDAR at www.sedar.com or on Vermilion’s website at www.vermilionenergy.com.
Off Balance Sheet Arrangements
We have not entered into any guarantee or off balance sheet arrangements that would materially impact our financial position or results of operations.
Internal Control Over Financial Reporting
There has been no change in Vermilion’s internal control over financial reporting ("ICFR") during the period covered by this MD&A that materially affected, or is reasonably likely to materially affect, our internal control over financial reporting.
As a result of COVID-19, our global workforce shifted to a primarily work from home environment beginning in March 2020. This change to remote working was rapid and included our employees as well as a large extended workforce across all regions in which we operate. While pre-existing controls were not specifically designed to operate in a work from home operating environment, we believe that our internal controls over financial reporting continue to be effective. We took precautionary actions to re-evaluate and refine our financial reporting process to provide reasonable assurance that we could report our financial results accurately and timely. During 2021 and continuing into 2022, portions of our workforce returned to a work from the office arrangement.
Recently Adopted Accounting Pronouncements
Vermilion did not adopt any new accounting pronouncements as at March 31, 2022.
Disclosure Controls and Procedures
Our officers have established and maintained disclosure controls and procedures and evaluated the effectiveness of these controls in conjunction with our filings.
As of March 31, 2022, we have evaluated the effectiveness of the design and operation of our disclosure controls and procedures. Based on this evaluation, the President, for this specific purpose of acting in the capacity of Chief Executive Officer, and Chief Financial Officer have concluded and certified that our disclosure controls and procedures are effective.
| Vermilion Energy Inc. ■ Page 32 ■ 2022 First Quarter Report |
Supplemental Table 1: Netbacks
The following table includes financial statement information on a per unit basis by business unit. Liquids includes crude oil, condensate, and NGLs. Natural gas sales volumes have been converted on a basis of six thousand cubic feet of natural gas to one barrel of oil equivalent.
| Q1 2022 | Q1 2021 | |||||
| Liquids | Natural Gas | Total | Liquids | Natural Gas | Total | |
| $/bbl | $/mcf | $/boe | $/bbl | $/mcf | $/boe | |
| Canada | ||||||
| Sales | 94.67 | 4.82 | 64.81 | 57.03 | 3.63 | 41.51 |
| Royalties | (16.53) | (0.50) | (10.39) | (7.33) | (0.19) | (4.62) |
| Transportation | (2.71) | (0.20) | (2.04) | (2.86) | (0.22) | (2.17) |
| Operating | (15.84) | (1.23) | (12.01) | (13.89) | (1.32) | (11.27) |
| Operating netback | 59.59 | 2.89 | 40.37 | 32.95 | 1.90 | 23.45 |
| General and administration | (1.47) | (0.95) | ||||
| Fund flows from operations ($/boe) | 38.90 | 22.50 | ||||
| United States | ||||||
| Sales | 93.77 | 4.48 | 76.96 | 58.68 | 12.09 | 61.81 |
| Royalties | (23.86) | (1.40) | (19.98) | (15.03) | (3.24) | (16.02) |
| Transportation | (0.85) | — | (0.64) | (0.82) | — | (0.63) |
| Operating | (11.29) | (1.87) | (11.27) | (10.55) | (1.69) | (10.46) |
| Operating netback | 57.77 | 1.21 | 45.07 | 32.28 | 7.16 | 34.70 |
| General and administration | (3.51) | (2.28) | ||||
| Fund flows from operations ($/boe) | 41.56 | 32.42 | ||||
| France | ||||||
| Sales | 133.41 | — | 133.41 | 77.19 | — | 77.19 |
| Royalties | (12.53) | — | (12.53) | (10.82) | — | (10.84) |
| Transportation | (6.84) | — | (6.84) | (6.60) | — | (6.60) |
| Operating | (21.58) | — | (21.58) | (17.66) | — | (17.66) |
| Operating netback | 92.46 | — | 92.46 | 42.11 | — | 42.09 |
| General and administration | (5.55) | (3.62) | ||||
| Current income taxes | (10.34) | — | ||||
| Fund flows from operations ($/boe) | 76.57 | 38.47 | ||||
| Netherlands | ||||||
| Sales | 78.45 | 37.57 | 223.57 | 37.37 | 7.57 | 45.28 |
| Royalties | — | — | — | — | (0.03) | (0.15) |
| Operating | — | (2.98) | (17.66) | — | (1.99) | (11.75) |
| Operating netback | 78.45 | 34.59 | 205.91 | 37.37 | 5.55 | 33.38 |
| General and administration | (1.36) | (0.42) | ||||
| Current income taxes | (59.47) | — | ||||
| Fund flows from operations ($/boe) | 145.08 | 32.96 | ||||
| Germany | ||||||
| Sales | 128.15 | 33.98 | 189.55 | 71.70 | 7.18 | 49.82 |
| Royalties | (2.07) | (2.00) | (10.11) | (0.48) | (0.77) | (3.63) |
| Transportation | (11.08) | (0.30) | (3.57) | (7.84) | (0.44) | (3.88) |
| Operating | (25.43) | (2.43) | (16.62) | (23.43) | (4.02) | (23.97) |
| Operating netback | 89.57 | 29.25 | 159.25 | 39.95 | 1.95 | 18.34 |
| General and administration | (2.31) | (4.27) | ||||
| Current income taxes | (5.98) | — | ||||
| Fund flows from operations ($/boe) | 150.96 | 14.07 | ||||
| Ireland | ||||||
| Sales | — | 38.20 | 229.22 | — | 8.81 | 52.85 |
| Transportation | — | (0.36) | (2.16) | — | (0.36) | (2.17) |
| Operating | — | (1.41) | (8.49) | — | (1.19) | (7.14) |
| Operating netback | — | 36.43 | 218.57 | — | 7.26 | 43.54 |
| General and administration | (0.50) | 1.39 | ||||
| Fund flows from operations ($/boe) | 218.07 | 44.93 | ||||
| Vermilion Energy Inc. ■ Page 33 ■ 2022 First Quarter Report |
| Q1 2022 | Q1 2021 | |||||
| Liquids | Natural Gas | Total | Liquids | Natural Gas | Total | |
| $/bbl | $/mcf | $/boe | $/bbl | $/mcf | $/boe | |
| Australia | ||||||
| Sales | 147.16 | — | 147.16 | 94.50 | — | 94.50 |
| Operating | (39.59) | — | (39.59) | (33.61) | — | (33.61) |
| PRRT (1) | (19.91) | — | (19.91) | (4.88) | — | (4.88) |
| Operating netback | 87.66 | — | 87.66 | 56.01 | — | 56.01 |
| General and administration | (2.50) | (2.50) | ||||
| Current income taxes | (0.30) | 5.38 | ||||
| Fund flows from operations ($/boe) | 84.86 | 58.89 | ||||
| Total Company | ||||||
| Sales | 106.50 | 17.41 | 105.52 | 63.46 | 5.51 | 49.20 |
| Realized hedging (loss) gain | (7.85) | (5.12) | (18.78) | (4.68) | (0.34) | (3.43) |
| Royalties | (14.69) | (0.56) | (9.29) | (7.85) | (0.25) | (4.87) |
| Transportation | (3.24) | (0.20) | (2.25) | (3.19) | (0.21) | (2.27) |
| Operating | (18.65) | (1.70) | (14.61) | (15.83) | (1.58) | (12.86) |
| PRRT (1) | (1.67) | — | (0.87) | (0.36) | — | (0.19) |
| Operating netback | 60.40 | 9.83 | 59.72 | 31.55 | 3.13 | 25.58 |
| General and administration | (1.85) | (1.57) | ||||
| Interest expense | (1.93) | (2.57) | ||||
| Realized foreign exchange | 0.10 | (0.69) | ||||
| Other income | 0.70 | 0.73 | ||||
| Corporate income taxes | (5.95) | 0.18 | ||||
| Fund flows from operations ($/boe) | 50.79 | 21.66 | ||||
| (1) | Vermilion considers Australian PRRT to be an operating item and, accordingly, has included PRRT in the calculation of operating netbacks. Current income taxes presented above excludes PRRT. |
| Vermilion Energy Inc. ■ Page 34 ■ 2022 First Quarter Report |
Supplemental Table 2: Hedges
The prices in these tables may represent the weighted averages for several contracts with foreign currency amounts translated to the disclosure currency using forward rates as at the month-end date. The weighted average price for the portfolio of options listed below may not have the same payoff profile as the individual contracts. As such, the presentation of the weighted average prices is purely for indicative purposes.
The following tables outline Vermilion’s outstanding risk management positions as at March 31, 2022:
| Unit | Currency | Bought Put Volume | Weighted Average Bought Put Price | Sold Call Volume | Weighted Average Sold Call Price | Sold Put Volume | Weighted Average Sold Put Price | Sold Swap Volume | Weighted Average Sold Swap Price | Bought Swap Volume | Weighted Average Bought Swap Price | |
| Dated Brent | ||||||||||||
| Q2 2022 | bbl | USD | 4,450 | 64.47 | 4,450 | 86.15 | 4,450 | 47.50 | — | — | — | — |
| Q3 2022 | bbl | USD | 3,100 | 64.52 | 3,100 | 89.32 | 3,100 | 47.50 | — | — | — | — |
| Q4 2022 | bbl | USD | 2,600 | 63.94 | 2,600 | 84.35 | 2,600 | 47.50 | — | — | — | — |
| WTI | ||||||||||||
| Q2 2022 | bbl | USD | 13,300 | 62.16 | 11,300 | 80.75 | 11,300 | 45.44 | — | — | — | — |
| Q3 2022 | bbl | USD | 6,000 | 61.86 | 6,000 | 87.96 | 6,000 | 45.00 | — | — | — | — |
| Q4 2022 | bbl | USD | 4,500 | 60.82 | 4,500 | 82.92 | 4,500 | 45.00 | — | — | — | — |
| AECO | ||||||||||||
| Q4 2022 | mcf | CAD | 3,142 | 3.69 | 3,142 | 7.70 | — | — | 18,853 | 4.95 | — | — |
| Q1 2023 | mcf | CAD | 4,739 | 3.69 | 4,739 | 7.70 | — | — | 28,435 | 4.95 | — | — |
| AECO Basis (AECO less NYMEX Henry Hub) | ||||||||||||
| Q2 2022 | mcf | USD | — | — | — | — | — | — | 35,000 | (1.09) | — | — |
| Q3 2022 | mcf | USD | — | — | — | — | — | — | 35,000 | (1.09) | — | — |
| Q4 2022 | mcf | USD | — | — | — | — | — | — | 11,793 | (1.09) | — | — |
| NYMEX Henry Hub | ||||||||||||
| Q2 2022 | mcf | USD | 59,000 | 3.42 | 59,000 | 5.15 | — | — | — | — | — | — |
| Q3 2022 | mcf | USD | 59,000 | 3.42 | 59,000 | 5.15 | — | — | — | — | — | — |
| Q4 2022 | mcf | USD | 35,793 | 3.68 | 35,793 | 6.62 | — | — | — | — | — | — |
| Q1 2023 | mcf | USD | 24,000 | 4.00 | 24,000 | 8.44 | — | — | — | — | — | — |
| NBP | ||||||||||||
| Q2 2022 | mcf | EUR | 30,709 | 7.92 | 30,709 | 10.76 | 27,024 | 3.50 | 4,913 | 4.91 | — | — |
| Q3 2022 | mcf | EUR | 23,339 | 8.85 | 23,339 | 12.61 | 19,654 | 3.66 | 4,913 | 4.91 | — | — |
| Q4 2022 | mcf | EUR | 23,339 | 8.85 | 23,339 | 12.60 | 19,654 | 3.66 | 4,913 | 4.91 | — | — |
| Q1 2023 | mcf | EUR | 18,426 | 11.76 | 18,426 | 19.47 | 14,740 | 4.10 | — | — | — | — |
| Q2 2023 | mcf | EUR | 4,913 | 5.86 | 4,913 | 8.24 | 4,913 | 4.40 | — | — | — | — |
| TTF | ||||||||||||
| Q2 2022 | mcf | EUR | 11,670 | 26.31 | 11,670 | 35.89 | 2,457 | 3.52 | 4,913 | 50.55 | — | — |
| Q3 2022 | mcf | EUR | 11,670 | 26.31 | 11,670 | 35.89 | 2,457 | 3.52 | 4,913 | 50.55 | — | — |
| Q4 2022 | mcf | EUR | 9,827 | 19.16 | 9,827 | 39.88 | 2,457 | 3.52 | — | — | — | — |
| Q1 2023 | mcf | EUR | 9,827 | 19.16 | 9,827 | 39.88 | 2,457 | 3.52 | — | — | — | — |
| VET Equity Swaps | Initial Share Price | Share Volume | |||||
| Swap | Jan 2020 - Apr 2023 | 20.9788 | CAD | 2,250,000 | |||
| Swap | Jan 2020 - Apr 2023 | 22.4587 | CAD | 1,500,000 | |||
| Foreign Currency Swaps | Notional Amount | Notional Amount | Average Rate | ||||
| Swap | April 2022 | 805,046,292 | USD | 1,027,375,000 | CAD | 1.2762 | |
| Vermilion Energy Inc. ■ Page 35 ■ 2022 First Quarter Report |
Supplemental Table 3: Capital Expenditures and Acquisitions
| By classification ($M) | Q1 2022 | Q1 2021 |
| Drilling and development | 82,841 | 79,512 |
| Exploration and evaluation | 2,503 | 3,851 |
| Capital expenditures | 85,344 | 83,363 |
| Acquisitions | 6,712 | 393 |
| Acquisitions | 6,712 | 393 |
| By category ($M) | Q1 2022 | Q1 2021 |
| Drilling, completion, new well equip and tie-in, workovers and recompletions | 70,677 | 68,782 |
| Production equipment and facilities | 7,913 | 12,031 |
| Seismic, studies, land and other | 6,754 | 2,550 |
| Capital expenditures | 85,344 | 83,363 |
| Acquisitions | 6,712 | 393 |
| Total capital expenditures and acquisitions | 92,056 | 83,756 |
| Capital expenditures by country ($M) | Q1 2022 | Q1 2021 |
| Canada | 49,528 | 54,321 |
| United States | 7,985 | 4,792 |
| France | 7,011 | 6,879 |
| Netherlands | 504 | 4,133 |
| Germany | 9,160 | 2,499 |
| Ireland | 316 | 66 |
| Australia | 7,527 | 6,839 |
| Central and Eastern Europe | 3,313 | 3,834 |
| Total capital expenditures | 85,344 | 83,363 |
| Acquisitions by country ($M) | Q1 2022 | Q1 2021 |
| Canada | 2,708 | 50 |
| United States | 20 | — |
| Germany | 3,842 | 343 |
| Ireland | 142 | — |
| Total acquisitions | 6,712 | 393 |
| Vermilion Energy Inc. ■ Page 36 ■ 2022 First Quarter Report |
Supplemental Table 4: Production
| Q1/22 | Q4/21 | Q3/21 | Q2/21 | Q1/21 | Q4/20 | Q3/20 | Q2/20 | Q1/20 | Q4/19 | Q3/19 | Q2/19 | |
| Canada | ||||||||||||
| Light and medium crude oil (bbls/d) | 15,980 | 16,388 | 16,809 | 16,868 | 17,767 | 19,301 | 19,847 | 22,545 | 22,767 | 23,259 | 23,610 | 23,973 |
| Condensate (1) (bbls/d) | 4,892 | 4,785 | 4,426 | 5,558 | 4,556 | 4,662 | 5,200 | 5,047 | 4,634 | 4,140 | 4,072 | 4,872 |
| Other NGLs (1) (bbls/d) | 7,286 | 7,073 | 6,862 | 7,767 | 7,016 | 7,334 | 8,350 | 8,248 | 6,943 | 7,005 | 6,632 | 7,352 |
| NGLs (bbls/d) | 12,178 | 11,858 | 11,288 | 13,325 | 11,572 | 11,996 | 13,550 | 13,295 | 11,577 | 11,145 | 10,704 | 12,224 |
| Conventional natural gas (mmcf/d) | 140.55 | 128.85 | 138.42 | 146.55 | 138.41 | 135.27 | 155.15 | 164.08 | 151.16 | 145.14 | 145.14 | 151.87 |
| Total (boe/d) | 51,584 | 49,720 | 51,168 | 54,618 | 52,407 | 53,840 | 59,256 | 63,187 | 59,537 | 58,593 | 58,504 | 61,507 |
| United States | ||||||||||||
| Light and medium crude oil (bbls/d) | 2,675 | 2,647 | 3,520 | 1,888 | 2,322 | 2,495 | 3,243 | 3,971 | 2,481 | 3,149 | 2,717 | 2,421 |
| Condensate (1) (bbls/d) | 24 | 26 | 2 | 2 | — | 1 | 6 | 6 | 6 | 12 | 4 | 63 |
| Other NGLs (1) (bbls/d) | 1,056 | 1,388 | 1,206 | 928 | 1,058 | 1,294 | 1,158 | 1,340 | 1,079 | 1,156 | 1,140 | 754 |
| NGLs (bbls/d) | 1,080 | 1,414 | 1,208 | 930 | 1,058 | 1,295 | 1,164 | 1,346 | 1,085 | 1,168 | 1,144 | 817 |
| Conventional natural gas (mmcf/d) | 7.56 | 9.09 | 6.75 | 5.51 | 5.95 | 6.87 | 7.94 | 8.35 | 6.72 | 8.20 | 6.38 | 7.06 |
| Total (boe/d) | 5,014 | 5,575 | 5,854 | 3,736 | 4,373 | 4,934 | 5,730 | 6,708 | 4,685 | 5,683 | 4,925 | 4,414 |
| France | ||||||||||||
| Light and medium crude oil (bbls/d) | 8,389 | 8,453 | 8,677 | 9,013 | 9,062 | 9,255 | 9,347 | 7,046 | 9,957 | 10,264 | 10,347 | 9,800 |
| Conventional natural gas (mmcf/d) | — | — | — | — | — | — | — | — | — | — | — | — |
| Total (boe/d) | 8,389 | 8,453 | 8,677 | 9,013 | 9,062 | 9,255 | 9,347 | 7,046 | 9,957 | 10,264 | 10,347 | 9,800 |
| Netherlands | ||||||||||||
| Light and medium crude oil (bbls/d) | 1 | — | 6 | 1 | 6 | 1 | — | 1 | 3 | 4 | 1 | 9 |
| Condensate (1) (bbls/d) | 83 | 97 | 104 | 95 | 92 | 99 | 83 | 86 | 84 | 86 | 81 | 91 |
| NGLs (bbls/d) | 83 | 97 | 104 | 95 | 92 | 99 | 83 | 86 | 84 | 86 | 81 | 91 |
| Conventional natural gas (mmcf/d) | 39.03 | 51.98 | 42.48 | 37.59 | 41.45 | 42.95 | 46.09 | 47.31 | 48.33 | 47.99 | 44.08 | 52.90 |
| Total (boe/d) | 6,589 | 8,761 | 7,190 | 6,362 | 7,006 | 7,257 | 7,764 | 7,972 | 8,143 | 8,088 | 7,429 | 8,917 |
| Germany | ||||||||||||
| Light and medium crude oil (bbls/d) | 1,158 | 1,127 | 1,043 | 1,093 | 911 | 960 | 964 | 1,039 | 909 | 800 | 845 | 1,047 |
| Conventional natural gas (mmcf/d) | 26.95 | 18.00 | 16.19 | 15.60 | 13.40 | 11.50 | 11.25 | 13.23 | 14.64 | 15.44 | 14.54 | 14.56 |
| Total (boe/d) | 5,650 | 4,127 | 3,741 | 3,694 | 3,144 | 2,876 | 2,839 | 3,244 | 3,349 | 3,373 | 3,269 | 3,474 |
| Ireland | ||||||||||||
| Conventional natural gas (mmcf/d) | 30.26 | 30.12 | 22.67 | 30.19 | 34.14 | 34.76 | 35.12 | 38.57 | 41.38 | 42.30 | 43.21 | 49.21 |
| Total (boe/d) | 5,043 | 5,020 | 3,778 | 5,031 | 5,690 | 5,793 | 5,853 | 6,428 | 6,896 | 7,049 | 7,202 | 8,201 |
| Australia | ||||||||||||
| Light and medium crude oil (bbls/d) | 3,888 | 2,742 | 4,190 | 3,835 | 4,489 | 3,781 | 4,549 | 5,299 | 4,041 | 4,548 | 5,564 | 6,689 |
| Total (boe/d) | 3,888 | 2,742 | 4,190 | 3,835 | 4,489 | 3,781 | 4,549 | 5,299 | 4,041 | 4,548 | 5,564 | 6,689 |
| Central and Eastern Europe | ||||||||||||
| Conventional natural gas (mmcf/d) | 0.34 | 0.12 | 0.22 | 0.28 | 0.63 | 0.67 | 0.80 | 2.89 | 3.27 | 1.66 | — | — |
| Total (boe/d) | 57 | 20 | 36 | 46 | 104 | 111 | 132 | 483 | 546 | 276 | — | — |
| Consolidated | ||||||||||||
| Light and medium crude oil (bbls/d) | 32,091 | 31,356 | 34,245 | 32,698 | 34,556 | 35,793 | 37,951 | 39,899 | 40,157 | 42,024 | 43,084 | 43,938 |
| Condensate (1) (bbls/d) | 4,999 | 4,908 | 4,532 | 5,656 | 4,648 | 4,762 | 5,289 | 5,142 | 4,724 | 4,237 | 4,158 | 5,026 |
| Other NGLs (1) (bbls/d) | 8,342 | 8,461 | 8,068 | 8,695 | 8,074 | 8,627 | 9,509 | 9,588 | 8,022 | 8,160 | 7,772 | 8,107 |
| NGLs (bbls/d) | 13,341 | 13,369 | 12,600 | 14,351 | 12,722 | 13,389 | 14,798 | 14,730 | 12,746 | 12,397 | 11,930 | 13,133 |
| Conventional natural gas (mmcf/d) | 244.69 | 238.16 | 226.73 | 235.72 | 233.98 | 232.00 | 256.34 | 274.42 | 265.51 | 260.72 | 253.36 | 275.60 |
| Total (boe/d) | 86,213 | 84,417 | 84,633 | 86,335 | 86,276 | 87,848 | 95,471 | 100,366 | 97,154 | 97,875 | 97,239 | 103,003 |
| Vermilion Energy Inc. ■ Page 37 ■ 2022 First Quarter Report |
| YTD 2022 | 2021 | 2020 | 2019 | 2018 | 2017 | |||||||
| Canada | ||||||||||||
| Light and medium crude oil (bbls/d) | 15,980 | 16,954 | 21,106 | 23,971 | 17,400 | 6,015 | ||||||
| Condensate (1) (bbls/d) | 4,892 | 4,831 | 4,886 | 4,295 | 3,754 | 3,036 | ||||||
| Other NGLs (1) (bbls/d) | 7,286 | 7,179 | 7,719 | 6,988 | 5,914 | 4,144 | ||||||
| NGLs (bbls/d) | 12,178 | 12,010 | 12,605 | 11,283 | 9,668 | 7,180 | ||||||
| Conventional natural gas (mmcf/d) | 140.55 | 138.03 | 151.38 | 148.35 | 129.37 | 97.89 | ||||||
| Total (boe/d) | 51,584 | 51,968 | 58,942 | 59,979 | 48,630 | 29,510 | ||||||
| United States | ||||||||||||
| Light and medium crude oil (bbls/d) | 2,675 | 2,597 | 3,046 | 2,514 | 1,069 | 662 | ||||||
| Condensate (1) (bbls/d) | 24 | 8 | 5 | 18 | 8 | 4 | ||||||
| Other NGLs (1) (bbls/d) | 1,056 | 1,146 | 1,218 | 996 | 452 | 50 | ||||||
| NGLs (bbls/d) | 1,080 | 1,154 | 1,223 | 1,014 | 460 | 54 | ||||||
| Conventional natural gas (mmcf/d) | 7.56 | 6.84 | 7.47 | 6.89 | 2.78 | 0.39 | ||||||
| Total (boe/d) | 5,014 | 4,890 | 5,514 | 4,675 | 1,992 | 781 | ||||||
| France | ||||||||||||
| Light and medium crude oil (bbls/d) | 8,389 | 8,799 | 8,903 | 10,435 | 11,362 | 11,084 | ||||||
| Conventional natural gas (mmcf/d) | — | — | — | 0.19 | 0.21 | — | ||||||
| Total (boe/d) | 8,389 | 8,799 | 8,903 | 10,467 | 11,396 | 11,085 | ||||||
| Netherlands | ||||||||||||
| Light and medium crude oil (bbls/d) | 1 | 3 | 1 | 3 | — | — | ||||||
| Condensate (1) (bbls/d) | 83 | 97 | 88 | 88 | 90 | 90 | ||||||
| NGLs (bbls/d) | 83 | 97 | 88 | 88 | 90 | 90 | ||||||
| Conventional natural gas (mmcf/d) | 39.03 | 43.40 | 46.16 | 49.10 | 46.13 | 40.54 | ||||||
| Total (boe/d) | 6,589 | 7,334 | 7,782 | 8,274 | 7,779 | 6,847 | ||||||
| Germany | ||||||||||||
| Light and medium crude oil (bbls/d) | 1,158 | 1,044 | 968 | 917 | 1,004 | 1,060 | ||||||
| Conventional natural gas (mmcf/d) | 26.95 | 15.81 | 12.65 | 15.31 | 15.66 | 19.39 | ||||||
| Total (boe/d) | 5,650 | 3,679 | 3,076 | 3,468 | 3,614 | 4,291 | ||||||
| Ireland | ||||||||||||
| Conventional natural gas (mmcf/d) | 30.26 | 29.25 | 37.44 | 46.57 | 55.17 | 58.43 | ||||||
| Total (boe/d) | 5,043 | 4,875 | 6,240 | 7,762 | 9,195 | 9,737 | ||||||
| Australia | ||||||||||||
| Light and medium crude oil (bbls/d) | 3,888 | 3,810 | 4,416 | 5,662 | 4,494 | 5,770 | ||||||
| Total (boe/d) | 3,888 | 3,810 | 4,416 | 5,662 | 4,494 | 5,770 | ||||||
| Central and Eastern Europe | ||||||||||||
| Conventional natural gas (mmcf/d) | 0.34 | 0.31 | 1.90 | 0.42 | 1.02 | — | ||||||
| Total (boe/d) | 57 | 51 | 317 | 70 | 169 | — | ||||||
| Consolidated | ||||||||||||
| Light and medium crude oil (bbls/d) | 32,091 | 33,208 | 38,441 | 43,502 | 35,329 | 24,591 | ||||||
| Condensate (1) (bbls/d) | 4,999 | 4,936 | 4,980 | 4,400 | 3,853 | 3,130 | ||||||
| Other NGLs (1) (bbls/d) | 8,342 | 8,325 | 8,937 | 7,984 | 6,366 | 4,194 | ||||||
| NGLs (bbls/d) | 13,341 | 13,261 | 13,917 | 12,384 | 10,219 | 7,324 | ||||||
| Conventional natural gas (mmcf/d) | 244.69 | 233.64 | 256.99 | 266.82 | 250.33 | 216.64 | ||||||
| Total (boe/d) | 86,213 | 85,408 | 95,190 | 100,357 | 87,270 | 68,021 | ||||||
| (1) | Under National Instrument 51-101 "Standards of Disclosure for Oil and Gas Activities", disclosure of production volumes should include segmentation by product type as defined in the instrument. This table provides a reconciliation from "crude oil and condensate", "NGLs" and "natural gas" to the product types. In this report, references to "crude oil" and "light and medium crude oil" mean "light crude oil and medium crude oil" and references to "natural gas" mean "conventional natural gas". Production volumes reported are based on quantities as measured at the first point of sale. |
| Vermilion Energy Inc. ■ Page 38 ■ 2022 First Quarter Report |
Supplemental Table 5: Operational and Financial Data by Core Region
Production volumes (1)
| Q1/22 | Q4/21 | Q3/21 | Q2/21 | Q1/21 | Q4/20 | Q3/20 | Q2/20 | Q1/20 | Q4/19 | Q3/19 | Q2/19 | |
| North America | ||||||||||||
| Crude oil and condensate (bbls/d) | 23,571 | 23,846 | 24,757 | 24,316 | 24,645 | 26,459 | 28,296 | 31,569 | 29,888 | 30,560 | 30,403 | 31,329 |
| NGLs (bbls/d) | 8,342 | 8,461 | 8,068 | 8,695 | 8,074 | 8,628 | 9,508 | 9,588 | 8,022 | 8,161 | 7,772 | 8,106 |
| Natural gas (mmcf/d) | 148.11 | 137.93 | 145.18 | 152.06 | 144.36 | 142.13 | 163.09 | 172.43 | 157.88 | 153.34 | 151.52 | 158.93 |
| Total (boe/d) | 56,598 | 55,295 | 57,022 | 58,354 | 56,780 | 58,774 | 64,986 | 69,895 | 64,222 | 64,276 | 63,429 | 65,921 |
| International | ||||||||||||
| Crude oil and condensate (bbls/d) | 13,519 | 12,419 | 14,020 | 14,037 | 14,560 | 14,096 | 14,943 | 13,471 | 14,994 | 15,702 | 16,838 | 17,636 |
| Natural gas (mmcf/d) | 96.58 | 100.22 | 81.55 | 83.66 | 89.62 | 89.86 | 93.25 | 101.99 | 107.63 | 107.38 | 101.83 | 116.67 |
| Total (boe/d) | 29,616 | 29,123 | 27,612 | 27,981 | 29,495 | 29,073 | 30,484 | 30,472 | 32,932 | 33,598 | 33,811 | 37,081 |
| Consolidated | ||||||||||||
| Crude oil and condensate (bbls/d) | 37,090 | 36,264 | 38,777 | 38,354 | 39,204 | 40,555 | 43,240 | 45,041 | 44,881 | 46,261 | 47,242 | 48,964 |
| NGLs (bbls/d) | 8,342 | 8,461 | 8,068 | 8,695 | 8,074 | 8,627 | 9,509 | 9,588 | 8,022 | 8,160 | 7,772 | 8,107 |
| Natural gas (mmcf/d) | 244.69 | 238.16 | 226.73 | 235.72 | 233.98 | 232.00 | 256.34 | 274.42 | 265.51 | 260.72 | 253.36 | 275.60 |
| Total (boe/d) | 86,213 | 84,417 | 84,633 | 86,335 | 86,276 | 87,848 | 95,471 | 100,366 | 97,154 | 97,875 | 97,239 | 103,003 |
| (1) | Please refer to Supplemental Table 4 "Production" for disclosure by product type. |
Sales volumes
| Q1/22 | Q4/21 | Q3/21 | Q2/21 | Q1/21 | Q4/20 | Q3/20 | Q2/20 | Q1/20 | Q4/19 | Q3/19 | Q2/19 | |
| North America | ||||||||||||
| Crude oil and condensate (bbls/d) | 23,571 | 23,845 | 24,757 | 24,316 | 24,645 | 26,459 | 28,297 | 31,569 | 29,888 | 30,560 | 30,404 | 31,327 |
| NGLs (bbls/d) | 8,342 | 8,461 | 8,068 | 8,695 | 8,074 | 8,628 | 9,508 | 9,588 | 8,022 | 8,161 | 7,772 | 8,106 |
| Natural gas (mmcf/d) | 148.11 | 137.93 | 145.18 | 152.06 | 144.36 | 142.13 | 163.09 | 172.43 | 157.88 | 153.34 | 151.52 | 158.93 |
| Total (boe/d) | 56,598 | 55,295 | 57,022 | 58,354 | 56,780 | 58,774 | 64,986 | 69,895 | 64,222 | 64,276 | 63,429 | 65,921 |
| International | ||||||||||||
| Crude oil and condensate (bbls/d) | 12,615 | 13,985 | 15,227 | 13,859 | 11,421 | 15,359 | 15,689 | 12,202 | 17,090 | 13,864 | 18,575 | 16,009 |
| Natural gas (mmcf/d) | 96.58 | 100.22 | 81.55 | 83.66 | 89.62 | 89.86 | 93.25 | 101.99 | 107.63 | 107.38 | 101.83 | 116.67 |
| Total (boe/d) | 28,712 | 30,689 | 28,820 | 27,802 | 26,357 | 30,336 | 31,229 | 29,201 | 35,028 | 31,760 | 35,547 | 35,454 |
| Consolidated | ||||||||||||
| Crude oil and condensate (bbls/d) | 36,186 | 37,830 | 39,985 | 38,174 | 36,066 | 41,818 | 43,985 | 43,771 | 46,977 | 44,423 | 48,979 | 47,337 |
| NGLs (bbls/d) | 8,342 | 8,461 | 8,068 | 8,695 | 8,074 | 8,627 | 9,509 | 9,588 | 8,022 | 8,160 | 7,772 | 8,107 |
| Natural gas (mmcf/d) | 244.69 | 238.16 | 226.73 | 235.72 | 233.98 | 232.00 | 256.34 | 274.42 | 265.51 | 260.72 | 253.36 | 275.60 |
| Total (boe/d) | 85,310 | 85,984 | 85,841 | 86,156 | 83,138 | 89,111 | 96,217 | 99,096 | 99,250 | 96,037 | 98,976 | 101,377 |
| Vermilion Energy Inc. ■ Page 39 ■ 2022 First Quarter Report |
Financial results
| Q1/22 | Q4/21 | Q3/21 | Q2/21 | Q1/21 | Q4/20 | Q3/20 | Q2/20 | Q1/20 | Q4/19 | Q3/19 | Q2/19 | |
| North America | ||||||||||||
| Crude oil and condensate sales ($/bbl) | 111.42 | 92.99 | 82.23 | 75.43 | 66.31 | 51.06 | 49.79 | 28.94 | 50.25 | 66.31 | 66.67 | 72.40 |
| NGL sales ($/bbl) | 46.94 | 47.26 | 35.55 | 25.43 | 29.39 | 19.20 | 15.04 | 8.94 | 8.92 | 14.63 | 6.14 | 11.25 |
| Natural gas sales ($/mcf) | 4.80 | 5.07 | 3.80 | 2.72 | 3.98 | 2.77 | 2.02 | 1.60 | 1.92 | 2.29 | 1.18 | 1.15 |
| Sales ($/boe) | 65.88 | 59.97 | 50.40 | 42.30 | 43.08 | 32.51 | 28.94 | 18.24 | 29.22 | 38.86 | 35.52 | 38.56 |
| Royalties ($/boe) | (11.24) | (9.26) | (7.14) | (5.98) | (5.49) | (3.64) | (3.58) | (1.67) | (3.54) | (4.98) | (4.93) | (4.22) |
| Transportation ($/boe) | (1.91) | (1.86) | (1.92) | (1.90) | (2.05) | (1.92) | (1.74) | (1.72) | (1.91) | (1.76) | (1.78) | (1.63) |
| Operating ($/boe) | (11.95) | (11.68) | (11.02) | (10.89) | (11.21) | (10.94) | (7.82) | (9.60) | (11.93) | (11.15) | (10.67) | (10.66) |
| General and administration ($/boe) | (1.26) | (2.01) | (1.14) | (0.91) | (1.34) | (1.94) | (0.78) | (1.52) | (0.84) | (0.97) | (0.60) | (1.04) |
| Corporate income taxes ($/boe) | (0.02) | 0.42 | (0.05) | (0.04) | (0.04) | 0.04 | (0.02) | (0.02) | (0.04) | (0.11) | 0.09 | (0.02) |
| Fund flows from operations ($/boe) | 39.50 | 35.58 | 29.13 | 22.58 | 22.95 | 14.11 | 15.00 | 3.71 | 10.96 | 19.89 | 17.63 | 20.99 |
| Fund flows from operations | 201,193 | 180,979 | 152,764 | 119,916 | 117,227 | 76,375 | 89,635 | 23,639 | 64,048 | 117,623 | 102,867 | 125,893 |
| Drilling and development | (57,513) | (89,643) | (35,179) | (38,847) | (59,113) | (33,781) | (9,575) | (23,979) | (197,926) | (69,775) | (91,027) | (42,047) |
| Exploration and evaluation | — | — | — | — | — | — | — | — | — | — | — | — |
| Free cash flow | 143,680 | 91,336 | 117,585 | 81,069 | 58,114 | 42,594 | 80,060 | (340) | (133,878) | 47,848 | 11,840 | 83,846 |
| International | ||||||||||||
| Crude oil and condensate sales ($/bbl) | 136.69 | 103.53 | 94.91 | 85.41 | 81.40 | 62.65 | 58.19 | 50.27 | 73.35 | 82.14 | 84.55 | 93.28 |
| Natural gas sales ($/mcf) | 36.75 | 35.54 | 18.82 | 9.83 | 7.98 | 6.27 | 2.91 | 2.28 | 4.44 | 5.49 | 4.29 | 5.73 |
| Sales ($/boe) | 183.66 | 163.23 | 103.39 | 72.16 | 62.39 | 50.30 | 37.94 | 28.98 | 49.42 | 54.42 | 56.46 | 60.98 |
| Royalties ($/boe) | (5.43) | (4.13) | (4.52) | (3.83) | (3.53) | (3.02) | (3.32) | (2.16) | (3.27) | (3.85) | (3.89) | (3.97) |
| Transportation ($/boe) | (2.91) | (3.40) | (3.47) | (4.64) | (2.76) | (2.40) | (2.28) | (2.04) | (1.94) | (1.77) | (2.76) | (3.40) |
| Operating ($/boe) | (19.86) | (18.86) | (17.55) | (16.56) | (16.42) | (16.99) | (15.18) | (14.35) | (16.13) | (15.28) | (13.13) | (11.76) |
| General and administration ($/boe) | (3.02) | (2.53) | (2.40) | (2.61) | (2.06) | (2.92) | (2.53) | (2.72) | (2.63) | (3.70) | (3.10) | (2.93) |
| Corporate income taxes ($/boe) | (17.63) | (12.17) | 0.64 | (0.19) | 0.66 | 2.25 | 0.04 | (0.02) | (0.11) | 2.22 | (1.55) | (3.63) |
| PRRT ($/boe) | (2.60) | (1.96) | (2.74) | (0.58) | (0.60) | (1.45) | (1.27) | (1.21) | (2.90) | (0.50) | (1.78) | (2.56) |
| Fund flows from operations ($/boe) | 132.21 | 120.18 | 73.35 | 43.75 | 37.68 | 25.77 | 13.40 | 6.48 | 22.44 | 31.54 | 30.25 | 32.73 |
| Fund flows from operations | 341,626 | 339,286 | 194,505 | 110,654 | 89,403 | 71,934 | 38,498 | 17,193 | 71,526 | 92,160 | 98,955 | 105,600 |
| Drilling and development | (25,328) | (29,359) | (27,994) | (38,856) | (20,399) | (19,122) | (20,187) | (18,404) | (29,507) | (27,339) | (26,096) | (33,102) |
| Exploration and evaluation | (2,503) | (26,805) | (3,277) | (1,473) | (3,851) | (6,991) | (1,568) | 109 | (6,271) | (3,511) | (10,756) | (17,458) |
| Free cash flow | 313,795 | 283,122 | 163,234 | 70,325 | 65,153 | 45,821 | 16,743 | (1,102) | 35,748 | 61,310 | 62,103 | 55,040 |
| Q1/22 | Q4/21 | Q3/21 | Q2/21 | Q1/21 | Q4/20 | Q3/20 | Q2/20 | Q1/20 | Q4/19 | Q3/19 | Q2/19 | |
| Consolidated | ||||||||||||
| Crude oil and condensate sales ($/bbl) | 120.23 | 96.88 | 87.05 | 79.06 | 71.09 | 55.31 | 52.79 | 34.89 | 58.66 | 71.25 | 73.45 | 79.46 |
| NGL sales ($/bbl) | 46.94 | 47.26 | 35.55 | 25.43 | 29.39 | 19.20 | 15.04 | 8.94 | 8.92 | 14.63 | 6.14 | 11.25 |
| Natural gas sales ($/mcf) | 17.41 | 17.89 | 9.20 | 5.24 | 5.51 | 4.13 | 2.34 | 1.85 | 2.94 | 3.61 | 2.43 | 3.09 |
| Sales ($/boe) | 105.52 | 96.82 | 68.19 | 51.93 | 49.20 | 38.57 | 31.86 | 21.40 | 36.35 | 44.01 | 43.04 | 46.40 |
| Royalties ($/boe) | (9.29) | (7.43) | (6.26) | (5.29) | (4.87) | (3.43) | (3.50) | (1.81) | (3.45) | (4.60) | (4.56) | (4.13) |
| Transportation ($/boe) | (2.25) | (2.41) | (2.44) | (2.78) | (2.27) | (2.08) | (1.92) | (1.81) | (1.92) | (1.76) | (2.13) | (2.25) |
| Operating ($/boe) | (14.61) | (14.24) | (13.21) | (12.72) | (12.86) | (13.00) | (10.21) | (11.00) | (13.41) | (12.52) | (11.55) | (11.04) |
| General and administration ($/boe) | (1.85) | (2.20) | (1.56) | (1.46) | (1.57) | (2.27) | (1.35) | (1.88) | (1.47) | (1.88) | (1.50) | (1.70) |
| Corporate income taxes ($/boe) | (5.95) | (4.07) | 0.18 | (0.09) | 0.18 | 0.80 | — | (0.02) | (0.06) | 0.66 | (0.50) | (1.28) |
| PRRT ($/boe) | (0.87) | (0.70) | (0.92) | (0.19) | (0.19) | (0.49) | (0.41) | (0.36) | (1.02) | (0.16) | (0.64) | (0.90) |
| Interest ($/boe) | (1.93) | (2.06) | (2.37) | (2.41) | (2.57) | (2.42) | (1.97) | (1.98) | (2.21) | (2.17) | (2.16) | (2.34) |
| Realized derivatives ($/boe) | (18.78) | (23.97) | (9.19) | (5.05) | (3.43) | 0.10 | 0.47 | 6.07 | 5.47 | 2.57 | 4.06 | 1.54 |
| Realized foreign exchange ($/boe) | 0.10 | (0.30) | 0.37 | (0.25) | (0.69) | 0.16 | (0.31) | 0.44 | 0.94 | 0.23 | (0.37) | (0.17) |
| Realized other ($/boe) | 0.70 | 1.29 | 0.48 | 0.35 | 0.73 | 0.56 | 0.29 | 0.03 | (0.37) | 0.03 | 0.04 | 0.02 |
| Fund flows from operations ($/boe) | 50.79 | 40.73 | 33.27 | 22.04 | 21.66 | 16.50 | 12.95 | 9.08 | 18.85 | 24.41 | 23.73 | 24.15 |
| Fund flows from operations | 389,868 | 322,173 | 262,696 | 172,942 | 162,051 | 135,212 | 114,776 | 81,852 | 170,225 | 215,592 | 216,153 | 222,738 |
| Drilling and development | (82,841) | (119,002) | (63,173) | (77,703) | (79,512) | (52,903) | (29,762) | (42,383) | (227,433) | (97,114) | (117,123) | (75,149) |
| Exploration and evaluation | (2,503) | (26,805) | (3,277) | (1,473) | (3,851) | (6,991) | (1,568) | 109 | (6,271) | (3,511) | (10,756) | (17,458) |
| Free cash flow | 304,524 | 176,366 | 196,246 | 93,766 | 78,688 | 75,318 | 83,446 | 39,578 | (63,479) | 114,967 | 88,274 | 130,131 |
| Vermilion Energy Inc. ■ Page 40 ■ 2022 First Quarter Report |
Non-GAAP and Other Specified Financial Measures
This MD&A includes references to certain financial measures which do not have standardized meanings and may not be comparable to similar measures presented by other issuers. These financial measures include fund flows from operations, a total of segments measure of profit or loss in accordance with IFRS 8 “Operating Segments” (please see Segmented Information in the Notes to the Consolidated Interim Financial Statements) and net debt, a capital management measure in accordance with IAS 1 “Presentation of Financial Statements” (please see Capital Disclosures in the Notes to the Consolidated Interim Financial Statements).
In addition, this MD&A includes financial measures which are not specified, defined, or determined under IFRS and are therefore considered non-GAAP financial measures and may not be comparable to similar measures presented by other issuers. These non-GAAP financial measures include:
Acquisitions: The sum of acquisitions from the Consolidated Statements of Cash Flows, Vermilion common shares issued as consideration, the estimated value of contingent consideration, the amount of acquiree's outstanding long-term debt assumed plus or net of acquired working capital deficit or surplus. We believe that including these components provides a useful measure of the economic investment associated with our acquisition activity. A reconciliation to the acquisitions line item in the Consolidated Statements of Cash Flows can be found in Supplemental Table 3 of this MD&A.
Capital expenditures: A non-GAAP financial measure calculated as the sum of drilling and development costs and exploration and evaluation costs from the Consolidated Statements of Cash Flows that is most directly comparable to cash flows used in investing activities. We consider capital expenditures to be a useful measure of our investment in our existing asset base. Capital expenditures are also referred to as E&D capital. Reconciliation to primary financial statement measures can be found below.
| ($M) | Q1 2022 | Q1 2021 |
| Drilling and development | 82,841 | 79,512 |
| Exploration and evaluation | 2,503 | 3,851 |
| Capital expenditures | 85,344 | 83,363 |
Cash dividends per share: A supplementary financial measure that represents cash dividends declared per share that is a useful measure of the dividends a common shareholder was entitled to during the period.
Covenants: The financial covenants on our revolving credit facility contain non-GAAP measures. The definitions for these financial covenants are included in Financial Position Review.
Diluted shares outstanding: The sum of shares outstanding at the period end plus outstanding awards under the VIP, based on current estimates of future performance factors and forfeiture rates.
| ('000s of shares) | Q1 2022 | Q1 2021 |
| Shares outstanding | 162,784 | 159,349 |
| Potential shares issuable pursuant to the VIP | 7,013 | 6,669 |
| Diluted shares outstanding | 169,797 | 166,018 |
Fund flows from operations: A total of segments measure most directly comparable to net earnings. FFO is comprised of sales excluding royalties, transportation, operating, G&A, corporate income tax, PRRT, interest expense, realized loss on derivatives, realized foreign exchange gain (loss), and realized other income. The measure is used to assess the contribution of each business unit to Vermilion's ability to generate income necessary to pay dividends, repay debt, fund asset retirement obligations and make capital investments. Reconciliation to primary financial statement measures can be found below.
| Vermilion Energy Inc. ■ Page 41 ■ 2022 First Quarter Report |
| Q1 2022 | Q1 2021 | |||
| $M | $/boe | $M | $/boe | |
| Sales | 810,179 | 105.52 | 368,137 | 49.20 |
| Royalties | (71,307) | (9.29) | (36,446) | (4.87) |
| Transportation | (17,269) | (2.25) | (17,021) | (2.27) |
| Operating | (112,183) | (14.61) | (96,241) | (12.86) |
| General and administration | (14,220) | (1.85) | (11,730) | (1.57) |
| Corporate income tax (expense) recovery | (45,672) | (5.95) | 1,345 | 0.18 |
| PRRT | (6,709) | (0.87) | (1,414) | (0.19) |
| Interest expense | (14,823) | (1.93) | (19,235) | (2.57) |
| Realized loss on derivatives | (144,223) | (18.78) | (25,633) | (3.43) |
| Realized foreign exchange gain (loss) | 750 | 0.10 | (5,181) | (0.69) |
| Realized other income | 5,345 | 0.70 | 5,470 | 0.73 |
| Fund flows from operations | 389,868 | 50.79 | 162,051 | 21.66 |
| Equity based compensation | (25,369) | (16,540) | ||
| Unrealized (loss) gain on derivative instruments (1) | (220,794) | 5,442 | ||
| Unrealized foreign exchange gain (loss) (1) | 40,137 | (25,910) | ||
| Accretion | (13,638) | (10,507) | ||
| Depletion and depreciation | (134,240) | (106,013) | ||
| Deferred tax recovery (expense) | 56,093 | (171,228) | ||
| Impairment reversal | 192,094 | 662,866 | ||
| Unrealized other expense (1) | (197) | (197) | ||
| Net earnings | 283,954 | 499,964 | ||
| (1) | Unrealized (loss) gain on derivative instruments, Unrealized foreign exchange gain (loss), and Unrealized other expense are line items from the respective consolidated statements of cash flows. |
Free cash flow: A non-GAAP financial measure comparable to cash flows from operating activities that is comprised of funds flows from operations less drilling and development costs and exploration and evaluation costs. The measure is used to determine the funding available for investing and financing activities including payment of dividends, repayment of long-term debt, reallocation into existing business units and deployment into new ventures. Reconciliation to primary financial statement measures can be found below.
| ($M) | Q1 2022 | Q1 2021 |
| Cash flows from operating activities | 341,053 | 119,147 |
| Changes in non-cash operating working capital | 42,495 | 35,881 |
| Asset retirement obligations settled | 6,320 | 7,023 |
| Fund flows from operations | 389,868 | 162,051 |
| Drilling and development | (82,841) | (79,512) |
| Exploration and evaluation | (2,503) | (3,851) |
| Free cash flow | 304,524 | 78,688 |
Fund flows from operations per basic and diluted share: A supplementary financial measure, management assesses fund flows from operations on a per share basis as we believe this provides a measure of our operating performance after taking into account the issuance and potential future issuance of Vermilion common shares. Fund flows from operations per basic share is calculated by dividing fund flows from operations (total of segments measure) by the basic weighted average shares outstanding as defined under IFRS. Fund flows from operations per diluted share is calculated by dividing fund flows from operations by the sum of basic weighted average shares outstanding and incremental shares issuable under the equity based compensation plans as determined using the treasury stock method.
Net debt: A capital management measure in accordance with IAS 1 "Presentation of Financial Statements" that is most directly comparable to long-term debt. Net debt is comprised of long-term debt (excluding unrealized foreign exchange on swapped USD borrowings) plus adjusted working capital (defined as current assets less current liabilities, excluding current derivatives and current lease liabilities), and represents Vermilion's net financing obligations after adjusting for the timing of working capital fluctuations. Net debt excludes lease obligations which are secured by a corresponding right-of-use asset.
Net debt to four quarter trailing fund flows from operations: A supplementary financial measure that is calculated as net debt (capital measure) over the FFO (total of segments measure) from the preceding four quarters. The measure is used to assess the ability to repay debt.
| Vermilion Energy Inc. ■ Page 42 ■ 2022 First Quarter Report |
Adjusted working capital: A non-GAAP financial measure that does not have a standardized meaning under IFRS and therefore may not be comparable to similar measures presented by other issuers, defined as current assets less current liabilities, excluding current derivatives and current lease liabilities. The measure is used to calculate net debt, a capital measure disclosed above.
| As at | ||
| ($M) | Mar 31, 2022 | Dec 31, 2021 |
| Current assets | (551,940) | (472,845) |
| Current derivative asset | 26,099 | 19,321 |
| Current liabilities | 1,054,895 | 746,813 |
| Current lease liability | (14,485) | (15,032) |
| Current derivative liability | (551,359) | (268,973) |
| Adjusted working capital | (36,790) | 9,284 |
Operating netback: A supplementary financial measure most directly comparable to net earnings that is calculated as sales less royalties, operating expense, transportation costs, PRRT, and realized hedging gains and losses presented on a per unit basis. Management assesses operating netback as a measure of the profitability and efficiency of our field operations.
Fund flows from operations per boe: A supplementary financial measure calculated as FFO by boe production. Fund flows from operations netback is used by management to assess the profitability of our business units and Vermilion as a whole.
Payout and payout % of FFO: A non-GAAP financial measure and non-GAAP ratio respectively, most directly comparable to dividends declared. Payout is comprised of dividends declared plus drilling and development costs, exploration and evaluation costs, and asset retirement obligations settled, and payout % of FFO is calculated as payout over FFO . The measure is used to assess the amount of cash distributed back to shareholders and reinvested in the business for maintaining production and organic growth. The reconciliation of the measure to primary financial statement measure can be found below.
| ($M) | Q1 2022 | Q1 2021 |
| Dividends declared | 9,767 | — |
| Drilling and development | 82,841 | 79,512 |
| Exploration and evaluation | 2,503 | 3,851 |
| Asset retirement obligations settled | 6,320 | 7,023 |
| Payout | 101,431 | 90,386 |
| % of fund flows from operations | 26 % | 56 % |
Return on capital employed (ROCE): A non-GAAP ratio, ROCE is a measure that we use to analyze our profitability and the efficiency of our capital allocation process; the comparable primary financial statement measure is NIBT. ROCE is calculated by dividing net earnings before interest and taxes ("EBIT") by average capital employed over the preceding twelve months. Capital employed is calculated as total assets less current liabilities while average capital employed is calculated using the balance sheets at the beginning and end of the twelve-month period.
| Twelve Months Ended | ||
| ($M) | Mar 31, 2022 | Mar 31, 2021 |
| Net earnings | 932,686 | 301,041 |
| Taxes | 58,188 | 59,037 |
| Interest expense | 68,663 | 74,330 |
| EBIT | 1,059,537 | 434,408 |
| Average capital employed | 4,742,770 | 4,103,659 |
| Return on capital employed | 22 % | 11 % |
| Vermilion Energy Inc. ■ Page 43 ■ 2022 First Quarter Report |
Consolidated Interim Financial Statements
Consolidated Balance Sheet
thousands of Canadian dollars, unaudited
| Note | March 31, 2022 | December 31, 2021 | |
| Assets | |||
| Current | |||
| Cash and cash equivalents | 4,544 | 6,028 | |
| Accounts receivable | 396,740 | 328,584 | |
| Crude oil inventory | 23,883 | 20,070 | |
| Derivative instruments | 26,099 | 19,321 | |
| Prepaid expenses | 100,674 | 98,842 | |
| Total current assets | 551,940 | 472,845 | |
| Derivative instruments | 17,666 | — | |
| Deferred taxes | 454,346 | 374,993 | |
| Exploration and evaluation assets | 227,816 | 233,290 | |
| Capital assets | 3 | 4,947,375 | 4,824,195 |
| Total assets | 6,199,143 | 5,905,323 | |
| Liabilities | |||
| Current | |||
| Accounts payable and accrued liabilities | 398,947 | 440,658 | |
| Dividends payable | 7 | 9,767 | — |
| Derivative instruments | 551,359 | 268,973 | |
| Income taxes payable | 94,822 | 37,182 | |
| Total current liabilities | 1,054,895 | 746,813 | |
| Derivative instruments | 14,065 | 51,213 | |
| Long-term debt | 6 | 1,380,568 | 1,651,569 |
| Lease obligations | 55,565 | 60,190 | |
| Asset retirement obligations | 4 | 1,019,916 | 1,000,554 |
| Deferred taxes | 345,620 | 328,839 | |
| Total liabilities | 3,870,629 | 3,839,178 | |
| Shareholders' Equity | |||
| Shareholders' capital | 7 | 4,254,731 | 4,241,773 |
| Contributed surplus | 61,952 | 49,529 | |
| Accumulated other comprehensive (loss) income | (8,720) | 28,467 | |
| Deficit | (1,979,449) | (2,253,624) | |
| Total shareholders' equity | 2,328,514 | 2,066,145 | |
| Total liabilities and shareholders' equity | 6,199,143 | 5,905,323 |
Approved by the Board
| (Signed "Robert Michaleski”) | (Signed “Lorenzo Donadeo”) | |
| Robert Michaleski, Director | Lorenzo Donadeo, Director |
| Vermilion Energy Inc. ■ Page 44 ■ 2022 First Quarter Report |
Consolidated Statements of Net Earnings and Comprehensive Income
thousands of Canadian dollars, except share and per share amounts, unaudited
| Three Months Ended | |||
| Note | Mar 31, 2022 | Mar 31, 2021 | |
| Revenue | |||
| Petroleum and natural gas sales | 810,179 | 368,137 | |
| Royalties | (71,307) | (36,446) | |
| Sales of purchased commodities | 47,730 | 43,764 | |
| Petroleum and natural gas revenue | 786,602 | 375,455 | |
| Expenses | |||
| Purchased commodities | 47,730 | 43,764 | |
| Operating | 112,183 | 96,241 | |
| Transportation | 17,269 | 17,021 | |
| Equity based compensation | 25,369 | 16,540 | |
| Loss on derivative instruments | 365,017 | 20,191 | |
| Interest expense | 14,823 | 19,235 | |
| General and administration | 14,220 | 11,730 | |
| Foreign exchange (gain) loss | (40,887) | 31,091 | |
| Other income | (5,148) | (5,273) | |
| Accretion | 4 | 13,638 | 10,507 |
| Depletion and depreciation | 3 | 134,240 | 106,013 |
| Impairment reversal | 3 | (192,094) | (662,866) |
| 506,360 | (295,806) | ||
| Earnings before income taxes | 280,242 | 671,261 | |
| Income tax (recovery) expense | |||
| Deferred | (56,093) | 171,228 | |
| Current | 52,381 | 69 | |
| (3,712) | 171,297 | ||
| Net earnings | 283,954 | 499,964 | |
| Other comprehensive income | |||
| Currency translation adjustments | (38,819) | (32,936) | |
| Unrealized gain on hedges | 1,632 | 1,633 | |
| Comprehensive income | 246,767 | 468,661 | |
| Net earnings per share | |||
| Basic | 1.75 | 3.15 | |
| Diluted | 1.69 | 3.10 | |
| Weighted average shares outstanding ('000s) | |||
| Basic | 162,374 | 158,892 | |
| Diluted | 168,339 | 161,397 | |
| Vermilion Energy Inc. ■ Page 45 ■ 2022 First Quarter Report |
Consolidated Statements of Cash Flows
thousands of Canadian dollars, unaudited
| Three Months Ended | |||
| Note | Mar 31, 2022 | Mar 31, 2021 | |
| Operating | |||
| Net earnings | 283,954 | 499,964 | |
| Adjustments: | |||
| Accretion | 4 | 13,638 | 10,507 |
| Depletion and depreciation | 3 | 134,240 | 106,013 |
| Impairment reversal | 3 | (192,094) | (662,866) |
| Unrealized loss (gain) on derivative instruments | 220,794 | (5,442) | |
| Equity based compensation | 25,369 | 16,540 | |
| Unrealized foreign exchange (gain) loss | (40,137) | 25,910 | |
| Unrealized other expense | 197 | 197 | |
| Deferred tax (recovery) expense | (56,093) | 171,228 | |
| Asset retirement obligations settled | 4 | (6,320) | (7,023) |
| Changes in non-cash operating working capital | (42,495) | (35,881) | |
| Cash flows from operating activities | 341,053 | 119,147 | |
| Investing | |||
| Drilling and development | 3 | (82,841) | (79,512) |
| Exploration and evaluation | (2,503) | (3,851) | |
| Acquisitions | 3 | (6,712) | (393) |
| Changes in non-cash investing working capital | (18,274) | 9,097 | |
| Cash flows used in investing activities | (110,330) | (74,659) | |
| Financing | |||
| Repayments on the revolving credit facility | 6 | (226,609) | (41,454) |
| Payments on lease obligations | (4,771) | (5,752) | |
| Cash flows used in financing activities | (231,380) | (47,206) | |
| Foreign exchange loss on cash held in foreign currencies | (827) | (583) | |
| Net change in cash and cash equivalents | (1,484) | (3,301) | |
| Cash and cash equivalents, beginning of period | 6,028 | 6,904 | |
| Cash and cash equivalents, end of period | 4,544 | 3,603 | |
| Supplementary information for cash flows from operating activities | |||
| Interest paid | 19,341 | 23,937 | |
| Income taxes refunded | (5,259) | (2,337) | |
| Vermilion Energy Inc. ■ Page 46 ■ 2022 First Quarter Report |
Consolidated Statements of Changes in Shareholders' Equity
thousands of Canadian dollars, unaudited
| Three Months Ended | |||
| Note | Mar 31, 2022 | Mar 31, 2021 | |
| Shareholders' capital | 7 | ||
| Balance, beginning of period | 4,241,773 | 4,181,160 | |
| Vesting of equity based awards | 180 | — | |
| Equity based compensation | 12,766 | 5,715 | |
| Share-settled dividends on vested equity based awards | 12 | — | |
| Balance, end of period | 4,254,731 | 4,186,875 | |
| Contributed surplus | 7 | ||
| Balance, beginning of period | 49,529 | 66,250 | |
| Equity based compensation | 12,603 | 10,825 | |
| Vesting of equity based awards | (180) | — | |
| Balance, end of period | 61,952 | 77,075 | |
| Accumulated other comprehensive income | |||
| Balance, beginning of period | 28,467 | 77,986 | |
| Currency translation adjustments | (38,819) | (32,936) | |
| Hedge accounting reserve | 1,632 | 1,633 | |
| Balance, end of period | (8,720) | 46,683 | |
| Deficit | |||
| Balance, beginning of period | (2,253,624) | (3,399,994) | |
| Net earnings | 283,954 | 499,964 | |
| Dividends declared | (9,767) | — | |
| Share-settled dividends on vested equity based awards | (12) | — | |
| Balance, end of period | (1,979,449) | (2,900,030) | |
| Total shareholders' equity | 2,328,514 | 1,410,603 | |
Description of equity reserves
Shareholders’ capital
Represents the recognized amount for common shares when issued, net of equity issuance costs and deferred taxes.
Contributed surplus
Represents the recognized value of unvested equity based awards that will be settled in shares. Once vested, the value of the awards are transferred to shareholders’ capital.
Accumulated other comprehensive income
Represents currency translation adjustments and hedge accounting reserve.
Currency translation adjustments result from translating the balance sheets of subsidiaries with a foreign functional currency to Canadian dollars at period-end rates. These amounts may be reclassified to net earnings if there is a disposal or partial disposal of a subsidiary.
The hedge accounting reserve represents the effective portion of the change in fair value related to cash flow and net investment hedges recognized in other comprehensive income, net of tax and reclassified to the consolidated statement of net earnings in the same period in which the transaction associated with the hedged item occurs. For the three months ended March 31, 2022, accumulated losses of $1.2 million and $0.4 million were recognized in the consolidated statement of net earnings on the cash flow hedges and net investment hedges, respectively, and will be recognized in net earnings through 2025 when the senior unsecured notes mature.
Deficit
Represents the cumulative net earnings less distributed earnings of Vermilion Energy Inc.
| Vermilion Energy Inc. ■ Page 47 ■ 2022 First Quarter Report |
Notes to the Condensed Consolidated Interim Financial Statements for the three months ended March 31, 2022 and 2021
tabular amounts in thousands of Canadian dollars, except share and per share amounts, unaudited
| 1. Basis of presentation |
Vermilion Energy Inc. (the “Company” or “Vermilion”) is a corporation governed by the laws of the Province of Alberta and is actively engaged in the business of crude oil and natural gas exploration, development, acquisition, and production.
These condensed consolidated interim financial statements are in compliance with International Accounting Standard (“IAS”) 34, “Interim Financial Reporting”. These condensed consolidated interim financial statements have been prepared using the same accounting policies and methods of computation as Vermilion’s consolidated financial statements for the year ended December 31, 2021.
These condensed consolidated interim financial statements should be read in conjunction with Vermilion’s consolidated financial statements for the year ended December 31, 2021, which are contained within Vermilion’s Annual Report for the year ended December 31, 2021 and are available on SEDAR at www.sedar.com or on Vermilion’s website at www.vermilionenergy.com.
These condensed consolidated interim financial statements were approved and authorized for issuance by the Board of Directors of Vermilion on
May 11, 2022.
| Vermilion Energy Inc. ■ Page 48 ■ 2022 First Quarter Report |
| 2. Segmented information |
| Three Months Ended March 31, 2022 | |||||||||
| Canada | USA | France | Netherlands | Germany | Ireland | Australia | Corporate | Total | |
| Drilling and development | 49,528 | 7,985 | 7,011 | 1,352 | 8,968 | 316 | 7,527 | 154 | 82,841 |
| Exploration and evaluation | — | — | — | (848) | 192 | — | — | 3,159 | 2,503 |
| Crude oil and condensate sales | 209,084 | 27,277 | 92,898 | 593 | 12,120 | — | 49,581 | — | 391,553 |
| NGL sales | 30,833 | 4,405 | — | — | — | — | — | — | 35,238 |
| Natural gas sales | 60,948 | 3,046 | — | 131,979 | 82,438 | 104,029 | — | 948 | 383,388 |
| Sales of purchased commodities | — | — | — | — | — | — | — | 47,730 | 47,730 |
| Royalties | (48,249) | (9,014) | (8,724) | — | (5,043) | — | — | (277) | (71,307) |
| Revenue from external customers | 252,616 | 25,714 | 84,174 | 132,572 | 89,515 | 104,029 | 49,581 | 48,401 | 786,602 |
| Purchased commodities | — | — | — | — | — | — | — | (47,730) | (47,730) |
| Transportation | (9,454) | (287) | (4,766) | — | (1,781) | (981) | — | — | (17,269) |
| Operating | (55,766) | (5,086) | (15,030) | (10,470) | (8,293) | (3,853) | (13,340) | (345) | (112,183) |
| General and administration | (6,822) | (1,585) | (3,865) | (804) | (1,154) | (228) | (843) | 1,081 | (14,220) |
| PRRT | — | — | — | — | — | — | (6,709) | — | (6,709) |
| Corporate income taxes | — | — | (7,203) | (35,266) | (2,984) | — | (100) | (119) | (45,672) |
| Interest expense | — | — | — | — | — | — | — | (14,823) | (14,823) |
| Realized loss on derivative instruments | — | — | — | — | — | — | — | (144,223) | (144,223) |
| Realized foreign exchange gain | — | — | — | — | — | — | — | 750 | 750 |
| Realized other income | — | — | — | — | — | — | — | 5,345 | 5,345 |
| Fund flows from operations | 180,574 | 18,756 | 53,310 | 86,032 | 75,303 | 98,967 | 28,589 | (151,663) | 389,868 |
| Three Months Ended March 31, 2021 | |||||||||
| Canada | USA | France | Netherlands | Germany | Ireland | Australia | Corporate | Total | |
| Drilling and development | 54,321 | 4,792 | 6,874 | 4,133 | 2,300 | 66 | 6,839 | 187 | 79,512 |
| Exploration and evaluation | — | — | 5 | — | 199 | — | — | 3,647 | 3,851 |
| Crude oil and condensate sales | 132,502 | 14,574 | 51,529 | 328 | 4,435 | — | 27,382 | — | 230,750 |
| NGL sales | 18,076 | 3,278 | — | — | — | — | — | — | 21,354 |
| Natural gas sales | 45,230 | 6,474 | — | 28,223 | 8,660 | 27,068 | — | 378 | 116,033 |
| Sales of purchased commodities | — | — | — | — | — | — | — | 43,764 | 43,764 |
| Royalties | (21,774) | (6,306) | (7,236) | (97) | (955) | — | — | (78) | (36,446) |
| Revenue from external customers | 174,034 | 18,020 | 44,293 | 28,454 | 12,140 | 27,068 | 27,382 | 44,064 | 375,455 |
| Purchased commodities | — | — | — | — | — | — | — | (43,764) | (43,764) |
| Transportation | (10,236) | (248) | (4,405) | — | (1,021) | (1,111) | — | — | (17,021) |
| Operating | (53,166) | (4,115) | (11,791) | (7,411) | (6,302) | (3,657) | (9,738) | (61) | (96,241) |
| General and administration | (4,459) | (898) | (2,414) | (267) | (1,122) | 712 | (725) | (2,557) | (11,730) |
| PRRT | — | — | — | — | — | — | (1,414) | — | (1,414) |
| Corporate income taxes | — | — | — | — | — | — | 1,559 | (214) | 1,345 |
| Interest expense | — | — | — | — | — | — | — | (19,235) | (19,235) |
| Realized loss on derivative instruments | — | — | — | — | — | — | — | (25,633) | (25,633) |
| Realized foreign exchange loss | — | — | — | — | — | — | — | (5,181) | (5,181) |
| Realized other income | — | — | — | — | — | — | — | 5,470 | 5,470 |
| Fund flows from operations | 106,173 | 12,759 | 25,683 | 20,776 | 3,695 | 23,012 | 17,064 | (47,111) | 162,051 |
| Vermilion Energy Inc. ■ Page 49 ■ 2022 First Quarter Report |
Reconciliation of fund flows from operations to net earnings:
| Three Months Ended | ||
| Mar 31, 2022 | Mar 31, 2021 | |
| Fund flows from operations | 389,868 | 162,051 |
| Equity based compensation | (25,369) | (16,540) |
| Unrealized (loss) gain on derivative instruments | (220,794) | 5,442 |
| Unrealized foreign exchange gain (loss) | 40,137 | (25,910) |
| Accretion | (13,638) | (10,507) |
| Depletion and depreciation | (134,240) | (106,013) |
| Deferred tax recovery (expense) | 56,093 | (171,228) |
| Impairment reversal | 192,094 | 662,866 |
| Unrealized other expense | (197) | (197) |
| Net earnings | 283,954 | 499,964 |
| 3. Capital assets |
The following table reconciles the change in Vermilion's capital assets:
| 2022 | |
| Balance at January 1 | 4,824,195 |
| Acquisitions | 6,712 |
| Additions | 82,841 |
| Increase in right-of-use assets | 218 |
| Impairment reversal | 192,094 |
| Depletion and depreciation | (131,617) |
| Changes in asset retirement obligations | 33,698 |
| Foreign exchange | (60,766) |
| Balance at March 31 | 4,947,375 |
In the first quarter of 2022, indicators of impairment reversal were present in our Canada - Saskatchewan and France - Neocomian cash generating units ("CGUs") due to an increase and stabilization in forecast oil prices. As a result of the indicators of impairment reversal, the Company performed impairment reversal calculations on the identified CGUs and the recoverable amounts were determined using fair value less costs to sell, which considered future after-tax cash flows from proved plus probable reserves and an after-tax discount rate of 12.0%. Based on the results of the impairment reversal calculations completed, recoverable amounts were determined to be greater than the carrying values of the CGUs tested and $144.4 million (net of $47.7 million deferred income tax expense) of impairment reversal was recorded. Inputs used in the measurement of capital assets are not based on observable market data and fall within level 3 of the fair value hierarchy.
The following benchmark price forecasts were used to calculate the recoverable amounts:
| 2022 | 2023 | 2024 | 2025 | 2026 | 2027 | 2028 | 2029 | 2030 | 2031 (2) | |
| Brent Crude ($ US/bbl) (1) | 100.50 | 89.50 | 79.64 | 81.23 | 82.86 | 84.51 | 86.21 | 87.94 | 89.69 | 91.48 |
| WTI Crude ($ US/bbl) (1) | 95.00 | 85.00 | 75.64 | 77.15 | 78.70 | 80.27 | 81.88 | 83.52 | 85.19 | 86.89 |
| Exchange rate (CAD/USD) | 0.80 | 0.80 | 0.80 | 0.80 | 0.80 | 0.80 | 0.80 | 0.80 | 0.80 | 0.80 |
(1) The forecast benchmark prices listed are adjusted for quality differentials, heat content, transportation and marketing costs and other factors specific to the Company’s operations when determining recoverable amounts.
(2) In 2032 and beyond, commodity price forecasts are inflated at a rate of 2.0% per annum. In 2032 and beyond there is no escalation of exchange rates.
The following are the results of tests completed, recoverable amounts, and sensitivity impacts which would decrease impairment reversals taken:
| Operating Segment | CGU | Impairment Reversal (1) | Recoverable Amount | 1% increase in discount rate | 5% decrease in pricing |
| Canada | Saskatchewan | 159,985 | 2,150,936 | — | — |
| France | Neocomian | 32,109 | 166,818 | — | — |
| Total | 192,094 | 2,317,754 | — | — |
(1) Impairment reversals are subject to the lower of the recoverable amount and the carrying value, which includes depletion and depreciation of the CGU had no impairment charges been previously taken.
| Vermilion Energy Inc. ■ Page 50 ■ 2022 First Quarter Report |
| 4. Asset retirement obligations |
The following table reconciles the change in Vermilion’s asset retirement obligations:
| 2022 | |
| Balance at January 1 | 1,000,554 |
| Additional obligations recognized | 887 |
| Obligations settled | (6,320) |
| Accretion | 13,638 |
| Changes in discount rates | 32,812 |
| Foreign exchange | (21,655) |
| Balance at March 31 | 1,019,916 |
Vermilion calculated the present value of the obligations using a credit-adjusted risk-free rate, calculated using a credit spread of 4.0% as at March 31, 2022 (December 31, 2021 - 4.9%) added to risk-free rates based on long-term, risk-free government bonds. Vermilion's credit spread is determined using the Company's expected cost of borrowing at the end of the reporting period.
The country-specific risk-free rates used as inputs to discount the obligations were as follows:
| Mar 31, 2022 | Dec 31, 2021 | |
| Canada | 2.4 % | 1.8 % |
| United States | 2.5 % | 1.9 % |
| France | 1.3 % | 0.8 % |
| Netherlands | 0.5 % | (0.3) % |
| Germany | 0.6 % | 0.1 % |
| Ireland | 1.2 % | 0.5 % |
| Australia | 3.0 % | 1.9 % |
| 5. Capital disclosures |
Vermilion defines capital as net debt (long-term debt (excluding unrealized foreign exchange on swapped USD borrowings) plus adjusted working capital (defined as current assets less current liabilities, excluding current derivatives and current lease liabilities)) and shareholders’ capital. In managing capital, Vermilion reviews whether fund flows from operations is sufficient to fund capital expenditures, dividends, and asset retirement obligations.
The following table calculates Vermilion’s ratio of net debt to four quarter trailing fund flows from operations:
| Mar 31, 2022 | Dec 31, 2021 | |
| Long-term debt | 1,380,568 | 1,651,569 |
| Adjusted working capital (1) | (36,790) | 9,284 |
| Unrealized FX on swapped USD borrowings | 21,236 | (16,067) |
| Net debt | 1,365,014 | 1,644,786 |
| Ratio of net debt to four quarter trailing fund flows from operations | 1.2 | 1.8 |
(1) Adjusted working capital is defined as current assets (excluding current derivatives), less current liabilities (excluding current derivatives and current lease liabilities)
| Vermilion Energy Inc. ■ Page 51 ■ 2022 First Quarter Report |
| 6. Long-term debt |
The following table summarizes Vermilion’s outstanding long-term debt:
| As at | ||
| Mar 31, 2022 | Dec 31, 2021 | |
| Revolving credit facility | 1,007,984 | 1,273,755 |
| Senior unsecured notes | 372,584 | 377,814 |
| Long-term debt | 1,380,568 | 1,651,569 |
The fair value of the revolving credit facility is equal to its carrying value due to the use of short-term borrowing instruments at market rates of interest. The fair value of the senior unsecured notes as at March 31, 2022 was $380.6 million (December 31, 2021 - $387.0 million).
The following table reconciles the change in Vermilion’s long-term debt:
| 2022 | |
| Balance at January 1 | 1,651,569 |
| Repayments on the revolving credit facility | (226,609) |
| Amortization of transaction costs | 197 |
| Foreign exchange | (44,589) |
| Balance at March 31 | 1,380,568 |
Revolving credit facility
As at March 31, 2022, Vermilion had in place a bank revolving credit facility maturing May 31, 2024 with the following terms:
| As at | ||
| Mar 31, 2022 | Dec 31, 2021 | |
| Total facility amount | 2,100,000 | 2,100,000 |
| Amount drawn | (1,007,984) | (1,273,755) |
| Letters of credit outstanding | (11,434) | (11,035) |
| Unutilized capacity | 1,080,582 | 815,210 |
The facility can be extended from time to time at the option of the lenders and upon notice from Vermilion. If no extension is granted by the lenders, the amounts owing pursuant to the facility are due at the maturity date. The facility is secured by various fixed and floating charges against the subsidiaries of Vermilion.
The facility bears interest at a rate applicable to demand loans plus applicable margins.
As at March 31, 2022, the revolving credit facility was subject to the following financial covenants:
| As at | |||
| Financial covenant | Limit | Mar 31, 2022 | Dec 31, 2021 |
| Consolidated total debt to consolidated EBITDA | Less than 4.0 | 1.09 | 1.61 |
| Consolidated total senior debt to consolidated EBITDA | Less than 3.5 | 0.80 | 1.24 |
| Consolidated EBITDA to consolidated interest expense | Greater than 2.5 | 19.99 | 14.78 |
The financial covenants include financial measures defined within the revolving credit facility agreement that are not defined under IFRS. These financial measures are defined by the revolving credit facility agreement as follows:
| • | Consolidated total debt: Includes all amounts classified as “Long-term debt” and “Lease obligations” (including the current portion included within "Accounts payable and accrued liabilities" but excluding operating leases as defined under IAS 17) on the balance sheet. |
| • | Consolidated total senior debt: Consolidated total debt excluding unsecured and subordinated debt. |
| • | Consolidated EBITDA: Consolidated net earnings before interest, income taxes, depreciation, accretion and certain other non-cash items, adjusted for the impact of the acquisition of a material subsidiary. |
| • | Consolidated total interest expense: Includes all amounts classified as "Interest expense", but excludes interest on operating leases as defined under IAS 17. |
| Vermilion Energy Inc. ■ Page 52 ■ 2022 First Quarter Report |
In addition, our revolving credit facility has provisions relating to our liability management ratings in Alberta and Saskatchewan whereby if our security adjusted liability management ratings fall below specified limits in a province, a portion of the asset retirement obligations are included in the definitions of consolidated total debt and consolidated total senior debt. An event of default occurs if our security adjusted liability management ratings breach additional lower limits for a period greater than 90 days. As of March 31, 2022, Vermilion's liability management ratings were higher than the specified levels, and as such, no amounts relating to asset retirement obligations were included in the calculation of consolidated total debt and consolidated total senior debt.
As at March 31, 2022 and December 31, 2021, Vermilion was in compliance with the above covenants.
Senior unsecured notes
On March 13, 2017, Vermilion issued US $300.0 million of senior unsecured notes at par. The notes bear interest at a rate of 5.625% per annum, to be paid semi-annually on March 15 and September 15. The notes mature on March 15, 2025. As direct senior unsecured obligations of Vermilion, the notes rank equally with existing and future senior unsecured indebtedness of the Company.
The senior unsecured notes were recognized at amortized cost and include the transaction costs directly related to the issuance.
Vermilion may redeem some or all of the senior unsecured notes at the redemption prices set forth in the following table plus any accrued and unpaid interest, if redeemed during the twelve-month period beginning on March 15 of each of the years indicated below:
| Year | Redemption price |
| 2022 | 101.406 % |
| 2023 and thereafter | 100.000 % |
| 7. Shareholders' capital |
The following table reconciles the change in Vermilion’s shareholders’ capital:
| 2022 | ||
| Shareholders’ Capital | Shares ('000s) | Amount |
| Balance at January 1 | 162,261 | 4,241,773 |
| Vesting of equity based awards | 10 | 180 |
| Shares issued for equity based compensation | 512 | 12,766 |
| Share-settled dividends on vested equity based awards | 1 | 12 |
| Balance at March 31 | 162,784 | 4,254,731 |
| Vermilion Energy Inc. ■ Page 53 ■ 2022 First Quarter Report |
| 8. Financial instruments |
The following table summarizes the increase (positive values) or decrease (negative values) to net earnings before tax due to a change in the value of Vermilion’s financial instruments as a result of a change in the relevant market risk variable. This analysis does not attempt to reflect any interdependencies between the relevant risk variables.
| Mar 31, 2022 | |
| Currency risk - US dollar to Canadian dollar | |
| $0.01 increase in strength of the Canadian dollar against the US $ | 963 |
| $0.01 decrease in strength of the Canadian dollar against the US $ | (963) |
| Commodity price risk - Crude oil | |
| US $5.00/bbl increase in crude oil price used to determine the fair value of derivatives | (18,266) |
| US $5.00/bbl decrease in crude oil price used to determine the fair value of derivatives | 18,266 |
| Commodity price risk - European natural gas | |
| €0.5/GJ increase in European natural gas price used to determine the fair value of derivatives | (9,534) |
| €0.5/GJ decrease in European natural gas price used to determine the fair value of derivatives | 9,534 |
| Share price risk - Equity swaps | |
| $1.00 increase from initial share price of the equity swap | 3,750 |
| $1.00 decrease from initial share price of the equity swap | (3,750) |
| 9. Subsequent events |
On April 26, 2022, Vermilion closed a private offering of US $400 million 8-year senior unsecured notes (the “New Notes”). The New Notes were priced at 99.241% of par, mature on May 1, 2030, and bear interest at a rate of 6.875% per annum. Interest is to be paid semi-annually on May 1 and November 1, commencing on November 1, 2022. The New Notes are senior unsecured obligations of Vermilion and rank equally with existing and future senior unsecured indebtedness. Net proceeds from the New Notes were used to repay a portion of the amount outstanding on the Company’s revolving credit facility. Contemporaneous with the closing of the New Notes, the maturity date of Vermilion’s revolving credit facility was extended to May 29, 2026 (from May 31, 2024) and the total facility amount was reduced to Vermilion’s targeted level of $1.6 billion (from $2.1 billion).
| Vermilion Energy Inc. ■ Page 54 ■ 2022 First Quarter Report |
DIRECTORS
Lorenzo Donadeo 1 Calgary, Alberta
Larry J. Macdonald 2, 4, 8, 10 Calgary, Alberta
James J. Kleckner Jr. 8, 10 Edwards, Colorado
Carin Knickel 5, 8, 12 Golden, Colorado
Stephen P. Larke 4, 6, 11 Calgary, Alberta
Timothy R. Marchant 7, 10, 12 Calgary, Alberta
Robert Michaleski 3, 6 Calgary, Alberta
William Roby 8, 9, 12 Katy, Texas
Manjit Sharma 4,8 Toronto, Ontario
Judy Steele 6,12 Halifax, Nova Scotia
1 Executive Chairman 2 Lead Director (Independent) 3 Audit Committee Chair (Independent) 4 Audit Committee Member 5 Governance and Human Resources Committee Chair __(Independent) 6 Governance and Human Resources Committee Member 7 Health, Safety and Environment Committee Chair __(Independent) 8 Health, Safety and Environment Committee Member 9 Independent Reserves Committee Chair (Independent) 10 Independent Reserves Committee Member 11 Sustainability Committee Chair (Independent) 12 Sustainability Committee Member
| OFFICERS / CORPORATE SECRETARY
Lorenzo Donadeo * Executive Chairman
Dion Hatcher * President
Lars Glemser * Vice President & Chief Financial Officer
Terry Hergott Vice President Marketing
Yvonne Jeffery Vice President Sustainability
Darcy Kerwin * Vice President International & HSE
Bryce Kremnica * Vice President North America
Geoff MacDonald Vice President Geosciences
Kyle Preston Vice President Investor Relations
Averyl Schraven Vice President People and Culture
Jenson Tan * Vice President Business Development
Gerard Schut * Vice President European Operations
Robert (Bob) J. Engbloom Corporate Secretary
* Executive Committee
| AUDITORS
Deloitte LLP Calgary, Alberta
BANKERS
The Toronto-Dominion Bank
Alberta Treasury Branches
Bank of America N.A., Canada Branch
Canadian Imperial Bank of Commerce
Export Development Canada
National Bank of Canada
Royal Bank of Canada
The Bank of Nova Scotia
Wells Fargo Bank N.A., Canadian Branch
La Caisse Centrale Desjardins du Québec
Citibank N.A., Canadian Branch - Citibank Canada
Canadian Western Bank
JPMorgan Chase Bank, N.A., Toronto Branch
Goldman Sachs Lending Partners LLC
EVALUATION ENGINEERS
GLJ Petroleum Consultants Ltd. Calgary, Alberta
LEGAL COUNSEL
Norton Rose Fulbright Canada LLP Calgary, Alberta
TRANSFER AGENT
Odyssey Trust Company
STOCK EXCHANGE LISTINGS
The Toronto Stock Exchange (“VET”) The New York Stock Exchange (“VET”)
INVESTOR RELATIONS
Kyle Preston Vice President Investor Relations 403-476-8431 TEL 403-476-8100 FAX 1-866-895-8101 IR TOLL FREE investor_relations@vermilionenergy.com
|
| Vermilion Energy Inc. ■ Page 55 ■ 2022 First Quarter Report |