UNITED STATES
SECURITIES AND EXCHANGE COMMISSION
Washington, D.C. 20549
FORM 6-K
REPORT OF FOREIGN PRIVATE ISSUER PURSUANT TO RULE 13A-16 OR 15D-16 UNDER THE
SECURITIES EXCHANGE ACT OF 1934
For the month of August, 2019
Commission File Number 32297
CPFL Energy Incorporated
(Translation of Registrant's name into English)
Rodovia Engenheiro Miguel Noel Nascentes Burnier, km 2,5, parte
CEP 13088-140 - Parque São Quirino, Campinas - SP
Federative Republic of Brazil (Address of principal executive office)
Indicate by check mark whether the registrant files or will file annual reports under cover Form 20-F or Form 40-F. Form 20-F ___X___ Form 40-F _______
Indicate by check mark if the registrant is submitting the Form 6-K in paper as permitted by Regulation S-T Rule 101(b)(1): [ ]
Indicate by check mark if the registrant is submitting the Form 6-K in paper as permitted by Regulation S-T Rule 101(b)(7): [ ]
Indicate by check mark whether the registrant by furnishing the information contained in this Form is also thereby furnishing the information to the Commission pursuant to Rule 12g3-2(b) under the Securities Exchange Act of 1934.
Yes _______ No ___X____
If "Yes" is marked, indicate below the file number assigned to the registrant in connection with Rule 12g3-2(b): 82-_________________
.

Campinas, August 13, 2019 – CPFL Energia S.A. (B3: CPFE3 and NYSE: CPL), announces its2Q19 results.The financial and operational information herein, unless otherwise indicated, is presented on a consolidated basis and is in accordance with the applicable legislation. Comparisons are relative to 2Q18, unless otherwise stated.
CPFL ENERGIA ANNOUNCES ITS 2Q19 RESULTS
Indicators (R$ Million) | 2Q19 | 2Q18 | Var. | 1H19 | 1H18 | Var. |
Load in the Concession Area - GWh | 16,539 | 16,398 | 0.9% | 34,625 | 34,149 | 1.4% |
Sales within the Concession Area - GWh | 16,626 | 16,754 | -0.8% | 34,357 | 33,939 | 1.2% |
Captive Market | 11,021 | 11,285 | -2.3% | 23,429 | 23,269 | 0.7% |
Free Client | 5,604 | 5,469 | 2.5% | 10,928 | 10,670 | 2.4% |
Gross Operating Revenue | 10,804 | 10,501 | 2.9% | 21,592 | 20,138 | 7.2% |
Net Operating Revenue | 7,036 | 6,945 | 1.3% | 14,164 | 13,320 | 6.3% |
EBITDA(1) | 1,505 | 1,370 | 9.9% | 3,036 | 2,736 | 11.0% |
Net Income | 574 | 450 | 27.4% | 1,144 | 870 | 31.6% |
Investments(2) | 521 | 422 | 23.5% | 966 | 848 | 14.0% |
| | | | | | |
Notes:
(1) EBITDA is calculated from the sum of net income, taxes, financial result, depreciation/amortization, as CVM Instruction no. 527/12. See the calculation in item 4.6 of this report;
(2) Does not include special obligations.
2Q19 HIGHLIGHTS
• Increase of0.9% in load in the concession area;
• EBITDA ofR$ 1,505 million, growth of9.9%;
• Net IncomeofR$ 574 million, growth of27.4%;
• Net debt ofR$ 11.0 billionand leverage of1.93x Net Debt/EBITDA;
• Investments ofR$ 521 million, growth of23.5%;
• RGE-RGE Sul tariff adjustment, in jun-19: (i) increase of7.14% of RGE’s parcel B, and (ii) increase of9.10% of RGE Sul’s parcel B;
• CPFL Energia’s Re-IPO, in Jun-19:R$ 3.7 billionR$ 27.50/share; total offering:134.3 million shares; since the offering - price:+22.3%and ADTV:R$ 109.5 MM(from Jun 13 to Aug 13).
Conference Call with Simultaneous Translation into English
(Bilingual Q&A)
· Wednesday, August 14, 2019 – 11:00 a.m. (Brasília), 10:00 a.m. (ET)
( Portuguese: 55-11-3193-1001 or 55-11-2820-4001 (Brazil)
( English: 1-800-492-3904 (USA) and 1-646-828-8246 (Other Countries) | Investor Relations Department
55-19-3756-8458
ri@cpfl.com.br
www.cpfl.com.br/ir |
| 2Q19 Results | August 13, 2019 |
INDEX
| 2Q19 Results | August 13, 2019 |
| 2Q19 Results | August 13, 2019 |
1) MESSAGE FROM THE CEO
The second quarter of 2019 signaled a new moment for the CPFL Energia Group. Three years after its control was acquired by the Chinese company State Grid, CPFL Energia returned to the capital markets to launch a new share offering in order to access funds that may be necessary for the Group’s continued growth. The idea was to keep the Company listed, go back to the market so that investors can once again follow the trajectory of CPFL, which remains as it used to be – a company concerned about transparency, financial discipline and strong governance.
In this regard, the Company disclosed a material fact notice in May 2019, announcing the potential acquisition by CPFL Energia of the entire controlling interest held directly by State Grid in CPFL Renováveis.
As part of this process, in July 2019, work began on integrating the administrative functions of CPFL Renováveis and CPFL Energia, mainly to capture potential synergies between the organizational models of both companies. This measure further underlines the Management’s commitment to growth and creation of value for its shareholders.
Another important event in the second quarter was the change in the dividend payment policy, which fixed a minimum payout ratio of 50%. As such, starting from 2020, a balance will be arrived at between growth and yield.
In terms of economic and financial performance, we delivered significant results once again in the second quarter of 2019. Operating cash generation of the CPFL group, as measured by EBITDA, reached R$1,505 million in 2Q19 (+9.9%). The highlight was the distribution segment, whose EBITDA came to R$873 million in 2Q19 (+13.8%), mainly reflecting the results of the conclusion of the tariff review process at RGE (in June 2018) and tariff adjustments at other distributors: CPFL Piratininga (October 2018) and CPFL Paulista (April 2019).
We continue to work on value creation initiatives and on our investment plan (around R$11.9 billion over the next five years, of which R$2.2 billion in 2019), while relying on financial discipline, as well as the engagement and commitment of our teams. We invested R$521 million in 2Q19.
The capital structure and consolidated financial leverage of CPFL Energia remain at adequate levels. The Company’s net debt to EBITDA ratio was 1.93 at the end of the quarter, as per the measurement criteria of our financial covenants, which is lower than in the previous quarter.
Finally, the management of CPFL remains optimistic about the progress being made in Brazil’s electricity sector and is confident about its business platform, which is increasingly better prepared and well positioned to face the challenges and opportunities arising in the country.
Gustavo Estrella
CEO of CPFL Energia
| 2Q19 Results | August 13, 2019 |
2) ENERGY SALES
2.1) Sales within the Distributors’ Concession Area
Sales within the Concession Area - GWh |
| 2Q19 | 2Q18 | Var. | 1H19 | 1H18 | Var. |
Captive Market | 11,021 | 11,285 | -2.3% | 23,429 | 23,269 | 0.7% |
Free Client | 5,604 | 5,469 | 2.5% | 10,928 | 10,670 | 2.4% |
Total | 16,626 | 16,754 | -0.8% | 34,357 | 33,939 | 1.2% |
In 2Q19, sales within the concession area, achieved by the distribution segment, totaled 16,626 GWh, a decrease of 0.8%. Sales to the captive market totaled 11,021 GWh in 2Q19, a decrease of 2.3%. The quantity of energy, in GWh, which corresponds to the consumption of free clients in the concession area of group’s distributors, billed through the Tariff for the Usage of the Distribution System (TUSD), reached 5,604 GWh in 2Q19, an increase of 2.5%.
In 1H19, sales within the concession area reached 34,357 GWh an increase of 1.2%. Sales to the captive market totaled 23,429 GWh an increase of 0.7% and the quantity of energy, which corresponds to the consumption of free clients totaled 10,928 GWh an increase of 2.4%.
Sales within the Concession Area - GWh |
| 2Q19 | 2Q18 | Var. | Part. | 1H19 | 1H18 | Var. | Part. |
Residential | 4,801 | 4,849 | -1.0% | 28.9% | 10,404 | 10,021 | 3.8% | 30.3% |
Industrial | 6,235 | 6,291 | -0.9% | 37.5% | 12,178 | 12,285 | -0.9% | 35.4% |
Commercial | 2,792 | 2,779 | 0.5% | 16.8% | 5,886 | 5,725 | 2.8% | 17.1% |
Others | 2,798 | 2,835 | -1.3% | 16.8% | 5,888 | 5,908 | -0.3% | 17.1% |
Total | 16,626 | 16,754 | -0.8% | 100.0% | 34,357 | 33,939 | 1.2% | 100.0% |
Note: The tables with sales within the concession area by distributor are attached to this report in item 12.9.
Concession area in 2Q19:
· Residential and Commercial classes (28.9% and 16.8% of total sales, respectively): reduction of 1.0% in residential class and increase of 0.5% in commercial class, impacted by fewer days on the billing calendar and higher temperatures in the South region, in July, which reduced the need for heating energy consumption. In the quarter, RGE registered a decrease of 4.5% in residential class and 4.8% in commercial class.
· Industrial class (37.5% of total sales): reduction of 0.9%, reflecting the weak economic activity and the migration of two large consumer located in the CPFL Piratininga concession area to the basic network. Excluding this effect, the variation of the Industrial class would be +0.9%.
Concession area in 1H19:
· Residential and Commercial classes (30.3% and 17.1% of total sales, respectively): increase of 3.8% and 2.8%, respectively, favored by the high temperature in the first months of the year, which favored the increase in consumption, especially in the state of São Paulo, partially offset by a higher temperature in the South region in the second quarter, which reduced the consumption for heating.
· Industrial class (35.4% of total sales): reduction of 0.9%, reflecting the weak economic performance and the migration of consumers to the basic network.
| 2Q19 Results | August 13, 2019 |
2.1.1) Sales to the Captive Market
Sales to the Captive Market - GWh |
| 2Q19 | 2Q18 | Var. | 1H19 | 1H18 | Var. |
Residential | 4,801 | 4,849 | -1.0% | 10,404 | 10,021 | 3.8% |
Industrial | 1,425 | 1,529 | -6.8% | 2,827 | 3,033 | -6.8% |
Commercial | 2,107 | 2,158 | -2.4% | 4,505 | 4,482 | 0.5% |
Others | 2,688 | 2,749 | -2.2% | 5,692 | 5,733 | -0.7% |
Total | 11,021 | 11,285 | -2.3% | 23,429 | 23,269 | 0.7% |
Note: The tables with captive market sales by distributor are attached to this report in item 12.10.
2.1.2) Free Clients
Free Client - GWh |
| 2Q19 | 2Q18 | Var. | 1H19 | 1H18 | Var. |
Industrial | 4,810 | 4,762 | 1.0% | 9,351 | 9,252 | 1.1% |
Commercial | 684 | 621 | 10.2% | 1,381 | 1,243 | 11.1% |
Others | 110 | 85 | 28.8% | 196 | 175 | 11.9% |
Total | 5,604 | 5,469 | 2.5% | 10,928 | 10,670 | 2.4% |
Free Client by Distributor - GWh |
| 2Q19 | 2Q18 | Var. | 1H19 | 1H18 | Var. |
CPFL Paulista | 2,599 | 2,507 | 3.7% | 5,114 | 4,941 | 3.5% |
CPFL Piratininga | 1,548 | 1,601 | -3.3% | 3,027 | 3,130 | -3.3% |
RGE | 1,280 | 1,209 | 5.8% | 2,432 | 2,302 | 5.6% |
CPFL Santa Cruz | 178 | 151 | 17.5% | 354 | 296 | 19.7% |
Total | 5,604 | 5,469 | 2.5% | 10,928 | 10,670 | 2.4% |
2.1.3) Load in the concession area
Load in the Concession Area - GWh |
| 2Q19 | 2Q18 | Var. | 1H19 | 1H18 | Var. |
Captive Market | 10,902 | 10,930 | -0.3% | 23,248 | 23,065 | 0.8% |
Free Client | 5,637 | 5,467 | 3.1% | 11,377 | 11,084 | 2.6% |
Total | 16,539 | 16,398 | 0.9% | 34,625 | 34,149 | 1.4% |
| 2Q19 Results | August 13, 2019 |
2.2) Generation Installed Capacity
In 2Q19, the Generation installed capacity of CPFL Energia group, considering the proportional stake in each project, is of 3,307 MW.
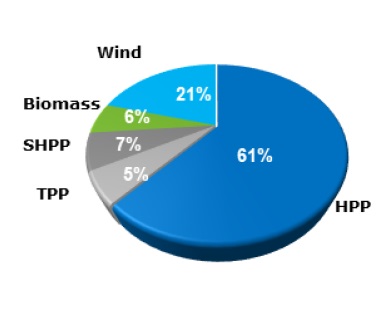
Note: Take into account CPFL Energia’s 53.18% stake in CPFL Renováveis.
| 2Q19 Results | August 13, 2019 |
3) CRITERIA OF FINANCIAL STATEMENTS CONSOLIDATION
The interests directly or indirectly held by CPFL Energia in its subsidiaries and jointly-owned entities are described on attachment 12.11. Except for: (i) the jointly-owned entities ENERCAN, BAESA, Foz do Chapecó and EPASA, that, as from January 1, 2013 are no longer proportionally consolidated in the Company’s financial statements, being their assets, liabilities and results accounted for using the equity method of accounting, and (ii) the investment in Investco S.A. recorded at cost by the subsidiary Paulista Lajeado, the other units are fully consolidated.
As of June 30, 2019 and 2019, the participation of non-controlling interests stated in the consolidated statements refers to the third-party interests in the subsidiaries CERAN, Paulista Lajeado and CPFL Renováveis.
3.1) Consolidation of CPFL Renováveis Financial Statements
On June 30, 2019, CPFL Energia indirectly held 53.18% of CPFL Renováveis, through its subsidiary CPFL Geração. CPFL Renováveis has been fully consolidated (100%, line by line), in CPFL Energia’s financial statements since August 1, 2011, and the interest held by the non-controlling shareholders has been mentioned bellow the net income line (in the Financial Statements), as “Non-Controlling Shareholders’ Interest”, and in the Shareholders Equity (in the Balance Sheet) in the line with the same name.
3.2) Consolidation of RGE Sul Financial Statements
On June 30, 2019, CPFL Energia held the following stake in the capital stock of RGE Sul: 89.0107%, directly, and 10.9893%, indirectly, through CPFL Brasil. RGE Sul has been fully consolidated (100%, line by line), in CPFL Energia’s financial statements since November 1st, 2016.
3.3) Economic-Financial Performance Presentation
In accordance with U.S. SEC (Securities and Exchange Commission) guidelines and pursuant to items 100(a) and (b) of Regulation G, with the disclosure of 4Q16/2016 results, in order to avoid the disclosure of non-GAAP measures, we no longer disclose the economic-financial performance considering the proportional consolidation of the generation projects and the adjustment of the numbers for non-recurring items, focusing the disclosure in the IFRS criterion. Only in chapter 5, of Indebtedness, we continue presenting the information in the financial covenants criterion, considering that the proper reconciliation with the numbers in the IFRS criterion are presented in item 12.11 of this report.
3.4) Consolidation of Transmission Companies
As of 4Q17, the subsidiaries CPFL Transmissão Piracicaba and CPFL Transmissão Morro Agudo are consolidated in the financial statements of the segment "Conventional Generation".
| 2Q19 Results | August 13, 2019 |
4) ECONOMIC-FINANCIAL PERFORMANCE
Consolidated Income Statement - CPFL ENERGIA (R$ Million) |
| 2Q19 | 2Q18 | Var. | 1H19 | 1H18 | Var. |
Gross Operating Revenue | 10,804 | 10,501 | 2.9% | 21,592 | 20,138 | 7.2% |
Net Operating Revenue | 7,036 | 6,945 | 1.3% | 14,164 | 13,320 | 6.3% |
Cost of Electric Power | (4,269) | (4,538) | -5.9% | (8,752) | (8,552) | 2.3% |
Operating Costs & Expenses | (1,761) | (1,520) | 15.8% | (3,364) | (2,991) | 12.5% |
EBIT | 1,007 | 887 | 13.5% | 2,047 | 1,777 | 15.2% |
EBITDA1 | 1,505 | 1,370 | 9.9% | 3,036 | 2,736 | 11.0% |
Financial Income (Expense) | (211) | (246) | -14.0% | (431) | (553) | -22.0% |
Income Before Taxes | 885 | 710 | 24.6% | 1,791 | 1,378 | 30.0% |
Net Income | 574 | 450 | 27.4% | 1,144 | 870 | 31.6% |
Note: (1) EBITDA is calculated from the sum of net income, taxes, financial result and depreciation/amortization, according to CVM Instruction no. 527/12. See the calculation in item 4.6 of this report.
4.1) Opening of economic-financial performance by business segment
Income Statement by business segment - CPFL Energia (R$ million) |
| | Distribution | | Conventional Generation | | Renewable Generation | | Commerciali-zation | | Services | | Others | | Eliminations | | Total |
2Q19 |
Net operating revenue | | 5,766 | | 298 | | 411 | | 813 | | 158 | | - | | (410) | | 7,036 |
Operating costs and expenses | | (4,893) | | (54) | | (160) | | (791) | | (119) | | (14) | | 410 | | (5,622) |
Depreciation e amortization | | (194) | | (30) | | (162) | | (0) | | (6) | | (16) | | - | | (408) |
Income from electric energy service | | 679 | | 214 | | 89 | | 21 | | 33 | | (30) | | - | | 1,007 |
Equity accounting | | - | | 90 | | - | | - | | - | | - | | - | | 90 |
EBITDA | | 873 | | 334 | | 251 | | 22 | | 39 | | (14) | | - | | 1,505 |
Financial result | | (72) | | (39) | | (111) | | (1) | | 0 | | 11 | | - | | (211) |
Income (loss) before taxes | | 607 | | 265 | | (22) | | 20 | | 33 | | (19) | | - | | 885 |
Income tax and social contribution | | (220) | | (57) | | (17) | | (7) | | (10) | | (0) | | - | | (311) |
Net income (loss) | | 387 | | 208 | | (38) | | 13 | | 23 | | (19) | | - | | 574 |
| | | | | | | | | | | | | | | | | |
| | | | | | | | | | | | | | | | | |
2Q18 |
Net operating revenue | | 5,641 | | 271 | | 415 | | 843 | | 128 | | - | | (352) | | 6,945 |
Operating costs and expenses | | (4,874) | | (41) | | (159) | | (812) | | (103) | | (8) | | 352 | | (5,645) |
Depreciation e amortization | | (207) | | (30) | | (154) | | (1) | | (6) | | (16) | | - | | (414) |
Income from electric energy service | | 560 | | 200 | | 101 | | 30 | | 19 | | (24) | | - | | 887 |
Equity accounting | | - | | 69 | | - | | - | | - | | - | | - | | 69 |
EBITDA | | 768 | | 299 | | 256 | | 31 | | 25 | | (8) | | - | | 1,370 |
Financial result | | (47) | | (75) | | (119) | | (5) | | (0) | | 0 | | - | | (246) |
Income (loss) before taxes | | 514 | | 194 | | (18) | | 26 | | 19 | | (24) | | - | | 710 |
Income tax and social contribution | | (190) | | (38) | | (19) | | (9) | | (5) | | 2 | | - | | (260) |
Net income (loss) | | 324 | | 155 | | (37) | | 16 | | 14 | | (22) | | - | | 450 |
| | | | | | | | | | | | | | | | | |
Variation |
Net operating revenue | | 2.2% | | 10.0% | | -0.9% | | -3.6% | | 23.9% | | - | | 16.4% | | 1.3% |
Operating costs and expenses | | 0.4% | | 31.8% | | 0.7% | | -2.6% | | 16.3% | | 68.6% | | 16.4% | | -0.4% |
Depreciation e amortization | | -6.2% | | -1.2% | | 4.6% | | -18.6% | | 10.1% | | 0.1% | | - | | -1.4% |
Income from electric energy service | | 21.2% | | 7.3% | | -11.8% | | -29.9% | | 68.6% | | 23.9% | | - | | 13.5% |
Equity accounting | | - | | 30.4% | | - | | - | | - | | - | | - | | 30.4% |
EBITDA | | 13.8% | | 11.8% | | -1.9% | | -29.7% | | 55.4% | | 68.6% | | - | | 9.9% |
Financial result | | 53.7% | | -48.1% | | -6.7% | | -73.3% | | - | | 3847.6% | | - | | -14.0% |
Income (loss) before taxes | | 18.2% | | 37.0% | | 22.7% | | -21.8% | | 74.9% | | -21.8% | | - | | 24.6% |
Income tax and social contribution | | 16.0% | | 48.9% | | -11.2% | | -26.9% | | 92.8% | | - | | - | | 19.8% |
Net income (loss) | | 19.6% | | 34.0% | | 5.4% | | -18.9% | | 68.0% | | -14.0% | | - | | 27.4% |
Note: an analysis of the economic-financial performance by business segment is presented in chapter 11.
| 2Q19 Results | August 13, 2019 |
Income Statement by business segment - CPFL Energia (R$ million) |
| | Distribution | | Conventional Generation | | Renewable Generation | | Commerciali-zation | | Services | | Others | | Eliminations | | Total |
1H19 |
Net operating revenue | | 11,703 | | 567 | | 745 | | 1,573 | | 304 | | - | | (728) | | 14,164 |
Operating costs and expenses | | (9,850) | | (105) | | (303) | | (1,520) | | (229) | | (25) | | 728 | | (11,304) |
Depreciation e amortization | | (386) | | (59) | | (322) | | (1) | | (12) | | (31) | | - | | (813) |
Income from electric energy service | | 1,467 | | 403 | | 121 | | 51 | | 62 | | (56) | | - | | 2,047 |
Equity accounting | | - | | 175 | | - | | - | | - | | - | | - | | 175 |
EBITDA | | 1,853 | | 638 | | 443 | | 52 | | 75 | | (25) | | - | | 3,036 |
Financial result | | (131) | | (83) | | (223) | | (9) | | 1 | | 14 | | - | | (431) |
Income (loss) before taxes | | 1,335 | | 495 | | (102) | | 42 | | 63 | | (43) | | - | | 1,791 |
Income tax and social contribution | | (483) | | (103) | | (29) | | (14) | | (17) | | (0) | | - | | (647) |
Net income (loss) | | 852 | | 392 | | (132) | | 28 | | 46 | | (43) | | - | | 1,144 |
| | | | | | | | | | | | | | | | | |
| | | | | | | | | | | | | | | | | |
1H18 |
Net operating revenue | | 10,842 | | 552 | | 799 | | 1,553 | | 239 | | - | | (665) | | 13,320 |
Operating costs and expenses | | (9,282) | | (82) | | (315) | | (1,514) | | (192) | | (18) | | 665 | | (10,739) |
Depreciation e amortization | | (388) | | (60) | | (312) | | (1) | | (11) | | (31) | | - | | (804) |
Income from electric energy service | | 1,172 | | 409 | | 171 | | 37 | | 36 | | (49) | | - | | 1,777 |
Equity accounting | | - | | 154 | | - | | - | | - | | - | | - | | 154 |
EBITDA | | 1,560 | | 624 | | 484 | | 39 | | 48 | | (18) | | - | | 2,736 |
Financial result | | (151) | | (143) | | (248) | | (12) | | (1) | | 2 | | - | | (553) |
Income (loss) before taxes | | 1,021 | | 421 | | (77) | | 25 | | 36 | | (47) | | - | | 1,378 |
Income tax and social contribution | | (377) | | (83) | | (32) | | (10) | | (9) | | 2 | | - | | (509) |
Net income (loss) | | 644 | | 337 | | (109) | | 16 | | 27 | | (45) | | - | | 870 |
| | | | | | | | | | | | | | | | | |
Variation |
Net operating revenue | | 7.9% | | 2.7% | | -6.6% | | 1.3% | | 27.0% | | - | | 9.6% | | 6.3% |
Operating costs and expenses | | 6.1% | | 27.4% | | -4.0% | | 0.4% | | 19.5% | | 40.7% | | 9.6% | | 5.3% |
Depreciation e amortization | | -0.3% | | -1.3% | | 3.2% | | -16.8% | | 8.6% | | 0.0% | | - | | 1.1% |
Income from electric energy service | | 25.1% | | -1.6% | | -29.5% | | 37.1% | | 71.6% | | 14.7% | | - | | 15.2% |
Equity accounting | | - | | 13.8% | | - | | - | | - | | - | | - | | 13.8% |
EBITDA | | 18.8% | | 2.2% | | -8.4% | | 35.4% | | 56.9% | | 40.7% | | - | | 11.0% |
Financial result | | -13.3% | | -41.9% | | -10.2% | | -25.5% | | - | | 565.0% | | - | | -22.0% |
Income (loss) before taxes | | 30.8% | | 17.7% | | 32.7% | | 67.0% | | 77.3% | | -9.5% | | - | | 30.0% |
Income tax and social contribution | | 28.3% | | 23.1% | | -8.5% | | 50.4% | | 90.0% | | - | | - | | 27.2% |
Net income (loss) | | 32.3% | | 16.4% | | 20.6% | | 77.1% | | 72.9% | | -4.8% | | - | | 31.6% |
Note: an analysis of the economic-financial performance by business segment is presented in chapter 11.
4.2) Sectoral Financial Assets and Liabilities
In 2Q19, it was accounted the totalsectoral financial assets in the amount of R$ 21 million, compared to the totalsectoral financial assets in the amount of R$ 481 million in 2Q18, a variation of R$ 460 million. In 1H19, it was accounted the totalsectoral financial liabilities in the amount of R$ 303 million, compared to the totalsectoral financial assets in the amount of R$ 854 million in 1H18, a variation of R$ 1,157 million.
On June 30, 2019, the balance of these sectoral financial assets and liabilities was positive in R$ 1,253 million, compared to a positive balance of R$ 1,212 million on March 31, 2019 and a positive balance of R$ 1,094 million on June 30, 2018.
As established by the applicable regulation, any sectoral financial assets or liabilities shall be included in the tariffs of the distributors in their respective annual tariff events.
4.3) Operating Revenue
In 2Q19, gross operating revenue reached R$ 10,804 million, representing an increase of 2.9% (R$ 303 million). Deductions from the gross operating revenue was of R$ 3,768 million in 2Q19, representing an increase of 6.0% (R$ 212 million). Net operating revenue reached R$ 7,036 million in 2Q19, registering an increase of 1.3% (R$ 91 million).
The main factors that affected the net operating revenue were:
· Increase of revenues in the Distribution segment, in the amount of R$ 125 million (for more details, see item 11.1.1.2);
| 2Q19 Results | August 13, 2019 |
· Increase of revenues in the Services segment, in the amount of R$ 31 million;
· Increase of revenues in the Conventional Generation segment, in the amount of R$ 27 million;
Partially offset by:
· Reduction of R$ 58 million in the eliminations, due to the sales among the group’s segments;
· Reduction of revenues in the Commercialization segment, in the amount of R$ 30 million;
· Reduction of revenues in the Renewable Generation segment, in the amount of R$ 4 million.
In 1H19, gross operating revenue reached R$ 21,592 million, representing an increase of 7.2% (R$ 1,453 million). Deductions from the gross operating revenue was of R$ 7,428 million in 1H19, representing an increase of 8.9% (R$ 610 million). Net operating revenue reached R$ 14,164 million in 1H19, registering an increase of 6.3% (R$ 844 million).
The main factors that affected the net operating revenue were:
· Increase of revenues in the Distribution segment, in the amount of R$ 861 million (for more details, see item 11.1.1.2);
· Increase of revenues in the Services segment, in the amount of R$ 65 million;
· Increase of revenues in the Commercialization segment, in the amount of R$ 20 million;
· Increase of revenues in the Conventional Generation segment, in the amount of R$ 15 million;
Partially offset by:
· Reduction of R$ 63 million in the eliminations, due to the sales among the group’s segments;
· Reduction of revenues in the Renewable Generation segment, in the amount of R$ 53 million.
4.4) Cost of Electric Energy
Cost of Electric Energy (R$ Million) |
| 2Q19 | 2Q18 | Var. | 1H19 | 1H18 | Var. |
Cost of Electric Power Purchased for Resale | | | | | | |
Energy from Itaipu Binacional | 693 | 716 | -3.3% | 1,350 | 1,275 | 5.9% |
PROINFA | 99 | 82 | 20.4% | 204 | 168 | 21.3% |
Energy Purchased through Auction in the Regulated Environment, Bilateral Contracts and Energy Purchased in the Spot Market | 3,104 | 3,442 | -9.8% | 6,676 | 6,417 | 4.0% |
PIS and COFINS Tax Credit | (289) | (378) | -23.5% | (671) | (696) | -3.6% |
Total | 3,606 | 3,863 | -6.6% | 7,559 | 7,164 | 5.5% |
| | | | | | | |
Charges for the Use of the Transmission and Distribution System | | | | | | |
Basic Network Charges | 489 | 576 | -15.1% | 987 | 1,143 | -13.7% |
Itaipu Transmission Charges | 70 | 65 | 6.9% | 137 | 128 | 7.0% |
Connection Charges | 46 | 38 | 20.3% | 93 | 70 | 32.6% |
Charges for the Use of the Distribution System | 12 | 12 | -2.6% | 25 | 21 | 14.4% |
ESS / EER | 112 | 62 | 80.8% | 71 | 175 | -59.2% |
PIS and COFINS Tax Credit | (66) | (78) | -14.9% | (119) | (150) | -20.3% |
Total | 662 | 675 | -2.0% | 1,193 | 1,388 | -14.0% |
| | | | | | | |
Cost of Electric Energy | 4,269 | 4,538 | -5.9% | 8,752 | 8,552 | 2.3% |
In 2Q19, the cost of electric energy, comprising the purchase of electricity for resale and charges for the use of the distribution and transmission system, amounted to R$ 4,269 million, registering a reduction of 5.9% (R$ 269 million).
The factors that explain these variations follow below:
· The cost of electric power purchased for resale reached R$ 3,606 million in 2Q19, a reductionof 6.6% (R$ 256 million), due to the following factors:
| 2Q19 Results | August 13, 2019 |
(i) Reduction of 9.8% (R$ 338 million) in the cost of energy purchased through auction in the regulated environment, bilateral contracts and energy purchased in the spot market, due to the reduction of 13.0% in the average purchase price (R$ 198.11/MWh in 2Q19 vs. R$ 227.70/MWh in 2Q18), partially offset by the increase of 3.6% (549 GWh) in the volume of purchased energy;
(ii) Reduction of 3.3% (R$ 23 million) in the cost of energy from Itaipu, due to the reductions of 2.6% in the average purchase price (R$ 252.40/MWh in 2Q19 vs. R$ 259.09/MWh in 2Q18) and of 0.7% (20 GWh) in the volume of purchased energy;
Partially offset by:
(iii) Reduction of 23.5% (R$ 89 million) in PIS and COFINS tax credits (cost reducer), generated from the energy purchase;
(iv) Increase of 20.4% (R$ 17 million) in the amount of PROINFA cost, due to the increase of 21.2% in the average purchase price (R$ 371.99/MWh in 2Q19 vs. R$ 306.88/MWh in 2Q18), partially offset by the reduction of 0.7% (2 GWh) in the volume of purchased energy.
· Charges for the use of the transmission and distribution system reached R$ 662 million in 2Q19, a reduction of 2.0% (R$ 13 million), due to the following factors:
(i) Reduction of 10.9% (R$ 75 million) in the connection and transmission charges (basic network, Itaipu transmission, connection and usage of the distribution system);
Partially offset by:
(ii) Increase of 80.8% (R$ 50 million) in sectoral charges (System Service Usage Charges – ESS / Reserve Energy Charges – EER);
(iii) Reduction of 14.9% (R$ 12 million) in PIS and COFINS tax credits (cost reducer), generated from the charges.
In 1H19, the cost of electric energy, comprising the purchase of electricity for resale and charges for the use of the distribution and transmission system, amounted to R$ 8,752 million, registering an increase of 2.3% (R$ 201 million).
The factors that explain these variations follow below:
· The cost of electric power purchased for resale reached R$ 7,559 million in 1H19, an increase of 5.5% (R$ 395 million), due to the following factors:
(i) Increase of 4.0% (R$ 259 million) in the cost of energy purchased through auction in the regulated environment, bilateral contracts and energy purchased in the spot market, due to the increase of 6.5% (1,996 GWh) in the volume of purchased energy, partially offset by the reduction of 2.3% in the average purchase price (R$ 204.90/MWh in 1H19 vs. R$ 209.81/MWh in 1H18);
(ii) Increase of 5.9% (R$ 75 million) in the cost of energy from Itaipu, due to the increase of 6.7% in the average purchase price (R$ 247.04/MWh in 1H19 vs. R$ 231.60/MWh in 1H18), partially offset by the reduction of 0.7% (39 GWh) in the volume of purchased energy;
(iii) Increase of 21.3% (R$ 36 million) in the amount of PROINFA cost, due to the increase of 21.5% in the average purchase price (R$ 389.95/MWh in 1H19 vs. R$ 320.84/MWh in 1H18), partially offset by the reduction of 0.2% (1 GWh) in the volume of purchased energy;
| 2Q19 Results | August 13, 2019 |
(iv) Reduction of 3.6% (R$ 25 million) in PIS and COFINS tax credits (cost reducer), generated from the energy purchase;
· Charges for the use of the transmission and distribution system reached R$ 1,193 million in 1H19, a reduction of 14.0% (R$ 195 million), due to the following factors:
(i) Reduction of 8.9% (R$ 121 million) in the connection and transmission charges (basic network, Itaipu transmission, connection and usage of the distribution system);
(ii) Reduction of 59.2% (R$ 104 million) in sectoral charges (ESS/EER);
Partially offset by:
(iii) Reduction of 20.3% (R$ 30 million) in PIS and COFINS tax credits (cost reducer), generated from the charges.
4.5) Operating Costs and Expenses
Operating costs and expenses reached R$ 1,761 million in 2Q19, compared to R$ 1,520 million in 2Q18, an increase of 15.8% (R$ 241 million). In 1H19, operating costs and expenses reached R$ 3,364 million, compared to R$ 2,991 million in 1H18, an increase of 12.5% (R$ 373 million).
The factors that explain these variations follow below:
PMSO
Reported PMSO (R$ million) |
| 2Q19 | 2Q18 | Variation | 1H19 | 1H18 | Variação |
| R$ MM | % | R$ MM | % |
Reported PMSO | | | | | | | | |
Personnel | (366) | (352) | (13) | 3.8% | (714) | (690) | (24) | 3.4% |
Material | (66) | (63) | (3) | 4.4% | (133) | (126) | (7) | 5.6% |
Outsourced Services | (178) | (156) | (23) | 14.6% | (343) | (337) | (7) | 2.0% |
Other Operating Costs/Expenses | (203) | (143) | (60) | 42.4% | (378) | (249) | (130) | 52.3% |
Allowance for doubtful accounts | (65) | (42) | (23) | 56.0% | (134) | (68) | (66) | 96.1% |
Legal and judicial expenses | (39) | (31) | (7) | 23.7% | (71) | (44) | (27) | 62.2% |
Others | (99) | (69) | (30) | 42.6% | (174) | (137) | (37) | 27.1% |
Total Reported PMSO | (814) | (714) | (99) | 13.9% | (1,569) | (1,401) | (167) | 11.9% |
The PMSO item reached R$ 814 million in 2Q19, compared to R$ 714 million in 2Q18, an increase of 13.9% (R$ 99 million), due to the following factors:
(i) Personnel - increase of 3.8% (R$ 13 million), mainly due to the collective bargaining agreement – wages and benefits;
(ii) Material - increase of 4.4% (R$ 3 million), due to the increases in uniforms and equipment (R$ 2 million) and in maintenance of the fleet, lines and networks (R$ 1 million);
(iii) Outsourced services - increase of 14.6% (R$ 23 million), mainly due to (i) the positive effect of the recovery of PIS and COFINS tax credits at CPFL Renováveis in 2018 and (ii) the readjustment of contracts with suppliers;
| 2Q19 Results | August 13, 2019 |
(iv) Other operational costs/expenses-increase of 42.4% (R$ 60 million), mainly due to:
ü Increase of 56.0% (R$ 23 million) in allowance for doubtful account;
ü Increase of 84.7% (R$ 18 million) in assets write-off;
ü Increase of 23.7% (R$ 7 million) in legal and judicial expenses;
ü Other effects (R$ 12 million).
In 1H19, the PMSO item reached R$ 1,569 million, compared to R$ 1,401 million in 1H18, an increase of 11.9% (R$ 167 million), due to the following factors:
(i) Personnel - increase of 3.4% (R$ 24 million), mainly due to the collective bargaining agreement – wages and benefits;
(ii) Material - increase of 5.6% (R$ 7 million), mainly due to the increase in maintenance of the fleet, lines and networks;
(iii) Outsourced services - increase of 2.0% (R$ 7 million), mainly due to the increase in maintenance services in lines, network and substations;
(iv) Other operational costs/expenses - increase of 52.3% (R$ 130 million), mainly due to:
ü Increase of 96.1% (R$ 66 million) in allowance for doubtful account;
ü Increase of 62.2% (R$ 27 million) in legal and judicial expenses;
ü Increase of 16.2% (R$ 8 million) in assets write-off;
ü Increase of 20.8% (R$ 8 million) in collection fee;
ü Other effects (R$ 21 million).
Other operating costs and expenses
Other operating costs and expenses reached R$ 948 million in 2Q19, compared to R$ 804 million in 2Q18, registering an increase of 17.5% (R$ 141 million), due to the following factors:
· Increase of 38.2% (R$ 141 million) inCosts of Building the Infrastructure item;
· Increase of 25.2% (R$ 6 million) inPrivate Pension Fund item, due to the registration of the impacts of the 2019 actuarial report;
Partially offset by:
· Reduction of 1.4% (R$ 6 million) inDepreciation and Amortization item.
In 1H19, other operating costs and expenses reached R$ 1,795 million, compared to R$ 1,590 million in 1H18, registering an increase of 13.0% (R$ 206 million), due to the following factors:
· Increase of 25.1% (R$ 186 million) inCosts of Building the Infrastructure item;
· Increase of 25.2% (R$ 11 million) inPrivate Pension Fund item, due to the registration of the impacts of the 2019 actuarial report;
· Increase of 1.1% (R$ 9 million) inDepreciation and Amortization item.
4.6) EBITDA
In 2Q19,EBITDA reached R$ 1,505 million, compared to R$ 1,370 million in 2Q18, registering an increase of 9.9% (R$ 135 million), mainly reflecting the performance of the Distribution andConventional Generation segments.
| 2Q19 Results | August 13, 2019 |
In 1H19,EBITDA reached R$ 3,036 million, compared to R$ 2,736 million in 1H18, registering an increase of 11.0% (R$ 300 million), mainly reflecting the performance of the Distribution and Conventional Generation segments.
EBITDA is calculated according to CVM Instruction no. 527/12 and showed in the table below:
EBITDA and Net Income conciliation (R$ million) |
| 2Q19 | 2Q18 | Var. | 1H19 | 1H18 | Var. |
Net Income | 574 | 450 | 27.4% | 1,144 | 870 | 31.6% |
De preciation and Amortization | 408 | 414 | | 813 | 804 | |
Financial Result | 211 | 246 | | 431 | 553 | |
Income Tax / Social Contribution | 311 | 260 | | 647 | 509 | |
EBITDA | 1,505 | 1,370 | 9.9% | 3,036 | 2,736 | 11.0% |
4.7) Financial Result
Financial Result (R$ Million) |
| 2Q19 | 2Q18 | Var. | 1H19 | 1H18 | Var. |
Revenues | 231 | 169 | 36.8% | 438 | 366 | 19.6% |
Expenses | (443) | (415) | 6.7% | (869) | (919) | -5.5% |
Financial Result | (211) | (246) | -14.0% | (431) | (553) | -22.0% |
In 2Q19,net financial expense was of R$ 211 million, a reduction of 14.0% (R$ 34 million) compared to the net financial expense of R$ 246 million reported in 2Q18. The items explaining this variation are as follows:
(i) Increase of 32.0% (R$ 25 million) inadditions and late payment fines;
(ii) Reduction of 5.3% (R$ 19 million) in theexpenses with the net debt (debt charges net of income from financial investments), due to the reduction in the indebtedness;
(iii) Increase of 18.4% (R$ 3 million) insectoral financial assets and liabilities updates;
(iv) Reduction of 56.3% (R$ 10 million) in theother financial revenues and expenses;
Partially offset by:
(v) Reduction of 80.9% (R$ 23 million) in themark-to-market (non-cash effect).
In 1H19,net financial expense was of R$ 431 million, a reduction of 22.0% (R$ 122 million) compared to the net financial expense of R$ 553 million reported in 1H18. The items explaining this variation are as follows:
(i) Reduction of 7.0% (R$ 50 million) in theexpenses with the net debt (debt charges net of income from financial investments), due to the reduction in the indebtedness;
(ii) Increase of 146.1% (R$ 28 million) insectoral financial assets and liabilities updates;
(iii) Increase of 13.4% (R$ 23 million) inadditions and late payment fines;
(iv) Variation of R$ 12 million in themark-to-market (non-cash effect), from an expense ofR$ 8 million in 1H18 to a revenue of R$ 4 million in 1H19;
| 2Q19 Results | August 13, 2019 |
(v) Reduction of 41.1% (R$ 9 million) in theother financial revenues and expenses.
4.8) Net Income
Net incomewas of R$ 574 million in 2Q19, registering an increase of 27.4% (R$ 123 million) if compared to the net income of R$ 450 million observed in 2Q18. In 1H19,net incomewas of R$ 1,144 million, registering an increase of 31.6% (R$ 274 million) if compared to the net income of R$ 870 million observed in 1H18.
| 2Q19 Results | August 13, 2019 |
5) INDEBTEDNESS
5.1) Debt (IFRS)

Note: for debt linked to foreign currency (23.2% of total in 2Q19), swap operations are contracted, aiming the protection of the foreign exchange and the rate linked to the contract.
| 2Q19 Results | August 13, 2019 |
Net Debt in IFRS
IFRS | R$ Million | 2Q19 | 2Q18 | Var. % |
Financial Debt (including hedge) | (19,472) | (19,839) | -1.8% |
(+) Available Funds | 6,982 | 2,490 | 180.4% |
(=) Net Debt | (12,490) | (17,348) | -28.0% |
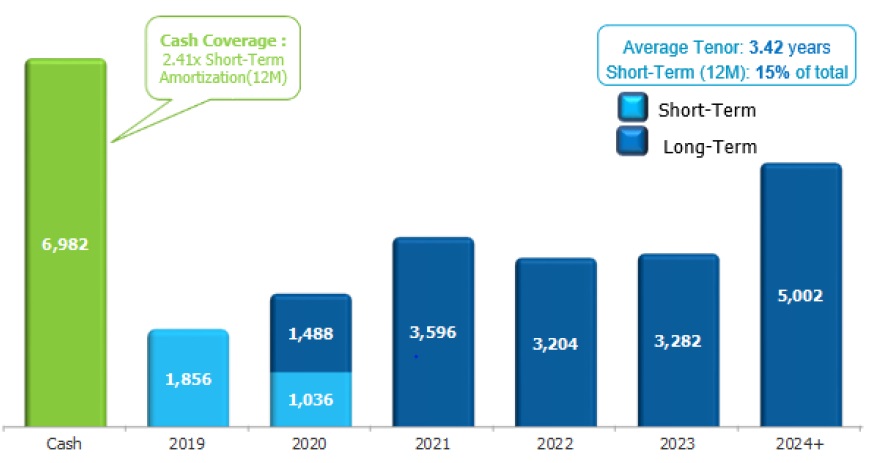
5.1.1) Debt Amortization Schedule in IFRS (Jun-19)
CPFL Energia has a large market access to liquidity sources through diversified funding alternatives, either through local market financing lines such as debenture issues, BNDES and other development banks, or through financing lines in the foreign market. This access to credit for the CPFL group is currently strengthened by the support of its shareholding structure, as State Grid gives greater robustness to CPFL group in financial market.
Notes:
1) Considers only the principal of the debt of R$ 19,464 million. In order to reach the value of debt in IFRS, of R$ 19,472 million, should be included charges and the mark-to-market (MTM) effect and cost with funding;
2) Short-term (July 2019 – June 2020) = R$ 2,892 million.
The cash position at the end of 2Q19 had a coverage ratio of2.41 x the amortizations of the next 12 months, enough to honor all amortization commitments until the beginning of 2021. The average amortization term, calculated from this schedule, is of3.42 years.
On May 9, 2019, the 9th issue of CPFL Renováveis debentures in the total amount of R$ 838 million was approved. The net resources from this issuance will be used in order to achieve CPFL Energia average debt cost and ensure more adequate costs for the company.
| 2Q19 Results | August 13, 2019 |
Gross Debt Cost1 in IFRS criteria
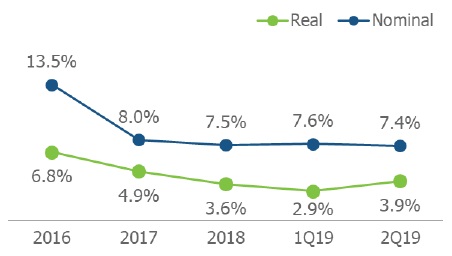
Note: (1) as of 2Q17, CPFL Energia started to calculate its debt average cost considering the end of the period, to better reflect the variations on interest rates.
5.2) Debt in Financial Covenants Criteria
5.2.1) Indexation and Debt Cost in Financial Covenants Criteria
Indexation1 After Hedge2 in Financial Covenants Criteria – 2Q18 vs. 2Q19
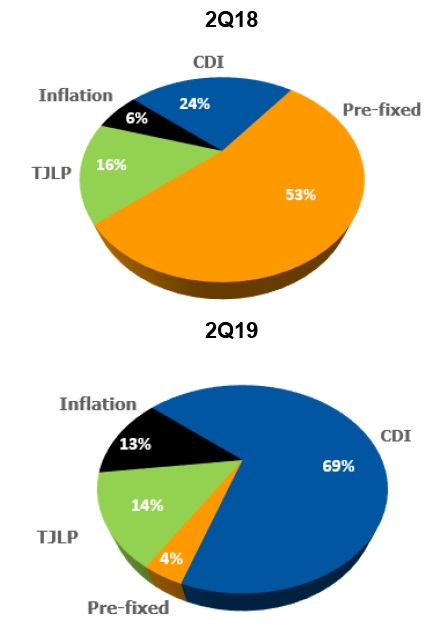
1) Considering proportional consolidation of CPFL Renováveis, CERAN, ENERCAN, Foz do Chapecó and EPASA;
2) For debt linked to foreign currency (25.5% of total), swap operations are contracted, aiming the protection of the foreign exchange and the rate linked to the contract.
| 2Q19 Results | August 13, 2019 |
5.2.2) Net Debt in Financial Covenants Criteria and Leverage
In 2Q19 Proforma Net Debt totaledR$ 10,964 million, a reduction of29,9% compared to net debt position at the end of 2Q18, in the amount ofR$ 15,651 million.
Covenant Criteria (*) - R$ Million | 2Q19 | 2Q18 | Var. |
Financial Debt (including hedge)1 | (17,776) | (17,821) | -0.3% |
(+) Available Funds | 6,812 | 2,170 | 213.9% |
(=) Net Debt | (10,964) | (15,651) | -29.9% |
EBITDA Proforma2 | 5,683 | 5,041 | 12.7% |
Net Debt / EBITDA | 1.93 | 3.11 | -37.9% |
1) Considering proportional consolidation of CPFL Renováveis, CERAN, ENERCAN, Foz do Chapecó and EPASA;
2) Proforma EBITDA in the financial covenants criteria: adjusted according to equivalent participation of CPFL Energia in each of its subsidiaries, with the inclusion of regulatory assets and liabilities and the historical EBITDA of newly acquired projects.
In line with the criteria for calculation of financial covenants of loan agreements with financial institutions, net debt is adjusted according to the equivalent stake of CPFL Energia in each of its subsidiaries. Also, include in the calculation of Proforma EBITDA the effects of historic EBITDA of newly acquired projects.
Considering that the Proforma Net Debt totaledR$ 10,964 million and Proforma EBITDA in the last 12 months reachedR$ 5,683 million, the ratio Proforma Net Debt / EBITDA at the end of 2Q19 reached1.93x.
6) INVESTMENTS
6.1) Actual Investments
Investments (R$ Million) |
Segment | 2Q19 | 2Q18 | Var. | 1H19 | 1H18 | Var. |
Distribution | 482 | 346 | 39.2% | 885 | 712 | 24.2% |
Generation - Conventional | 4 | 2 | 99.8% | 5 | 3 | 71.1% |
Generation - Renewable | 17 | 60 | -72.0% | 49 | 104 | -52.7% |
Commercialization | 1 | 1 | 5.6% | 1 | 1 | -12.3% |
Services and Others2 | 15 | 13 | 18.7% | 22 | 26 | -14.0% |
Subtotal | 518 | 421 | 22.9% | 963 | 847 | 13.7% |
Transmission1 | 3 | 0 | 926.7% | 3 | 0 | 526.9% |
Total | 521 | 422 | 23.5% | 966 | 848 | 14.0% |
Note:
1) Investments of R$ 2,628 thousands in 2Q19 and R$ 256 thousands in 2Q18.
2) Others – basically refer to assets and transactions that are not related to the listed segments.
In 2Q19, investments were R$ 521 million, an increase of 23.5%, compared to R$ 422 million registered in 2Q18. We highlight investments made by CPFL Energia in the Distribution segment:
a. Expansion and strengthening of the electric system;
b. Electricity system maintenance and improvements;
c. Operational infrastructure;
d. Upgrade of management and operational support systems;
e. Customer help services;
f. Research and development programs;
| 2Q19 Results | August 13, 2019 |
6.2) Investments Forecasts
On November 30, 2018, CPFL Energia’s Board of Directors approved Board of Executive Officers’ proposal for 2019 Annual Budget and 2020/2023 Multiannual Plan for the Company, which was previously discussed by the Budget and Corporate Finance Commission.
Investments Forecasts (R$ million)1

Notes:
1) Constant currency;
2) Investment Plan released in 4Q18/2018 Earnings Release, from March 2019;
3) Disregard investments in Special Obligations (among other items financed by consumers);
4) Conventional + Renewable.
| 2Q19 Results | August 13, 2019 |
7) DIVIDEND POLICY
On May 21, 2019, CPFL Energia announced to its shareholders and to the market that its Board of Directors approved, at the meeting held on that date, the adoption of a dividend distribution policy.
Such Dividend Policy determines that the Company should distribute annually, as dividends, at least 50% of the adjusted net income, in accordance with the Brazilian Corporate Law. Furthermore, the Dividend Policy sets out the factors that will influence the amount of the distributions, such as the Company’s financial conditions, its future prospects, the macroeconomic conditions, tariff reviews and adjustments, regulatory changes and the Company’s growth strategies, as well as other issues considered relevant by the Board of Directors and the shareholders. The Dividend Policy also highlights that certain obligations contained in the Company’s financial contracts may limit the amount of dividends and/or interest on own capital that may be distributed, provided that, according to the Company’s tax planning, it may be determined that the distribution of interest on own capital, in the future, is of the Company’s interest.
The approved Dividend Policy is merely indicative, with the purpose of signaling to the market the treatment that the Company intends to give to the distribution of dividends to its shareholders, having, therefore, a programmatic character, not binding upon the Company or its governing bodies.
The Dividend Policy is available at the Investor Relations website http://www.cpfl.com.br/ir.
| 2Q19 Results | August 13, 2019 |
8) STOCK MARKETS
8.1) Stock Performance
CPFL Energia is listed on both the B3 (Novo Mercado) and the New York Stock Exchange (NYSE) (ADR Level III), segments with the highest levels of corporate governance.
B3 | NYSE |
Date | CPFE3 (R$) | IEE | IBOV | Date | CPL (US$) | DJBr20 | Dow Jones |
06/30/2019 | R$ 30.43 | 63,831 | 100,967 | 06/30/2019 | $ 15.62 | 24,736 | 26,600 |
03/31/2019 | R$ 30.48 | 57,449 | 95,415 | 03/31/2019 | $ 15.52 | 23,618 | 25,929 |
06/30/2018 | R$ 21.67 | 38,562 | 72,763 | 06/30/2018 | $ 11.08 | 18,614 | 24,271 |
QoQ | -0.2% | 11.1% | 5.8% | QoQ | 0.6% | 4.7% | 2.6% |
YoY | 40.4% | 65.5% | 38.8% | YoY | 41.0% | 32.9% | 9.6% |
On June 30, 2019, CPFL Energia’s shares closed at R$ 30.43 per share on the B3 and US$ 15.62 per ADR on the NYSE, a depreciation of -0.2% and an appreciation in the quarter of 0.6%, respectively. Considering the variation in the last 12 months, the shares and ADRs presented an appreciation of 40.4% on the B3 and of 41.0% on the NYSE.
8.2) Daily Average Volume
The daily trading volume in 2Q19 averaged R$ 43.0 million, of which R$ 41.4 million on the B3 and R$ 1.5 million on the NYSE, representing an increase of 318.8% in relation to 2Q18. The number of trades on the B3 increase by 134.8%.
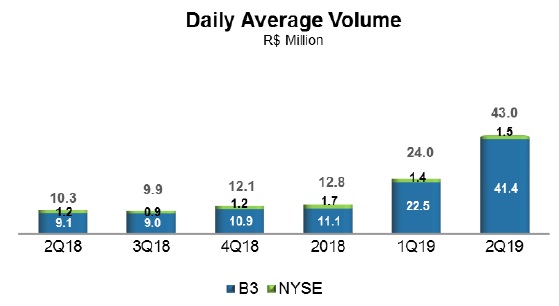
Note: Considers the sum of the average daily volume on the B3 and NYSE.
8.3) Public Offering of Shares
On April 2, 2019, the Company informed B3 S.A. - Brasil, Bolsa, Balcão of its intention to carry out a public offering of common shares ("Offering"), and on April 18, 2019, B3 approved its request for extension of the term to reach a minimum percentage of outstanding (free float) shares in the market of 15% of the Company's total capital up to October 31, 2019. On April 24, 2019, a Material Fact was disclosed by the Company, stating that it had filed a Registration Statement on Form F-3 ("Form F-3") with the Securities and Exchange Commission ("SEC"), allowing the Company tocarry out certain public offerings of common shares issued by it in the United States, including as American Depositary Shares ("ADS").
| 2Q19 Results | August 13, 2019 |
On June 12, 2019, following the announcements previously made, the Company disclosed in a Material Fact that the Board of Directors had approved, within the scope of the Offering and pursuant to CVM Instruction 476, a price per share of R$ 27.50 and the Company's capital increase amounting to R$ 3,212,470,965.00, through the issue of 116,817,126 new shares. As a result, capital increased from R$ 5,741,284,174.75 to R$ 8,953,755,139.75 and the total number of registered common shares with no par value increased from 1,017,914,746 to 1,134,731,872. On June 27, 2019, the number of shares was increased by a supplementary lot of 15% of the total shares initially offered (without considering the Additional Lot), i.e., 17,522,568 common Company-issued shares under the same conditions and price of the shares initially offered, increasing the total number of shares to 1,152,254,440. On June 28, 2019, these shares were settled, totaling R$ 481,870,620.00 from the capital increase, increasing capital to R$ 9,435,625,759.75 at June 30, 2019.
The issue costs totaled R$ 45,968 thousands, net of tax effects, up to June 30, 2019.
The Offering was carried out, simultaneously: (i) with restricted efforts of placement in Brazil, in the non-organized over-the-counter market, under the coordination of Banco Itaú BBA S.A. ("Lead Coordinator") and Santander (Brazil) S.A., Bradesco BBI S.A., Banco BTG Pactual S.A. and Morgan Stanley S.A. (which together with the Lead Manager were the "Offering Coordinators"), including efforts to place shares abroad by "International Placement Agents", exclusively with Foreign Investors registered with the CVM and investing in Brazil; and (ii) abroad, under the coordination of Itau BBA USA Securities, Inc., Santander Investment Securities Inc., Bradesco Securities Inc., Banco BTG Pactual SA - Cayman Branch and Morgan Stanley & Co. LLC (collectively the "International Offering Coordinators"), carried out in the United States of America in the form of ADSs, represented by ADRs, listed and admitted for trading on the New York Stock Exchange ("NYSE"). There was no reallocation of shares between the Brazilian Offering and the International Offering, due to the demand verified in Brazil and abroad during the course of the Offering and, therefore, there was no allocation of ADSs in the context of the International Offering, and therefore, all the shares were distributed under the Brazilian Offering.
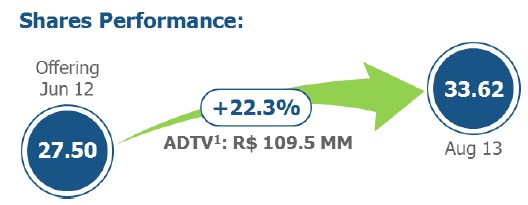
Note: (1) Average Daily Trading Volume (ADTV): from Jun 13 (day after the day of the offer) to Aug 13.
| 2Q19 Results | August 13, 2019 |
9) CORPORATE GOVERNANCE
The corporate governance model adopted by CPFL Energia and its subsidiaries is based on the principles of transparency, equity, accountability and corporate responsibility.
In 2019, CPFL will mark 15 years since being listed on the B3 and the New York Stock Exchange (“NYSE”). With more than 100 years of history in Brazil, the Company’s shares are listed on theNovo MercadoSpecial Listing Segment of the B3 with Level III ADRs, special segments for companies that comply with corporate governance best practices. All CPFL shares are common shares, entitling all shareholders the right to vote, as well as the tag along right with same conditions granted to the seller, in case of an offer which results in control transference.
CPFL’s Management is composed of the Board of Directors (“Board”), its decision-making authority, and the Board of Executive Officers, its executive body. The Board is responsible for defining the strategic business direction of the holding company and subsidiaries, and is composed of 9 members (of which 2 independent members), all members with unified terms of one year, eligible for reelection.
The Internal Regulation of the Board establishes the procedures for evaluating the directors, under the leadership of the Chairman, as well as their main duties and rights.
The Board set up five advisory committees (Strategy and Processes Management Committee, Human Resources Management Committee, Related Parties Committee, Risks Management Committee and Budget and Corporate Finance Committee), which support the Board in its decisions and monitor relevant and strategic themes, such as people and risk management, sustainability, the surveillance of internal audits, analysis of transactions with parties that are related to controlling shareholders. Furthermore, the board may be, in accordance with its Rules of Procedure, as it deems necessary.
The Board of Executive Officers is composed of 1 Chief Executive Officer and 9 Vice Presidents, with terms of two years, eligible for reelection, responsible for executing the strategy of CPFL Energia and its subsidiaries as defined by the Board of Directors in line with corporate governance guidelines. To ensure alignment of governance practices, some Executive Officers sit on the Boards of Directors of companies that form the CPFL group and nominate their respective executive officers.
CPFL has a permanent Fiscal Council, composed of 3 members, that also exercises the duties of Audit Committee, in line with Sarbanes-Oxley Law (SOX), applicable to foreign companies listed on U.S. stock exchanges.
The guidelines and documents on corporate governance are available at the Investor Relations website http://www.cpfl.com.br/ir.
| 2Q19 Results | August 13, 2019 |
10) SHAREHOLDERS STRUCTURE
CPFL Energia is a holding company that owns stake in other companies. State Grid Corporation of China (SGCC) controls CPFL Energia through its subsidiaries State Grid International Development Co., Ltd, State Grid International Development Limited (SGID), International Grid Holdings Limited, State Grid Brazil Power Participações S.A. (SGBP) and ESC Energia S.A.:
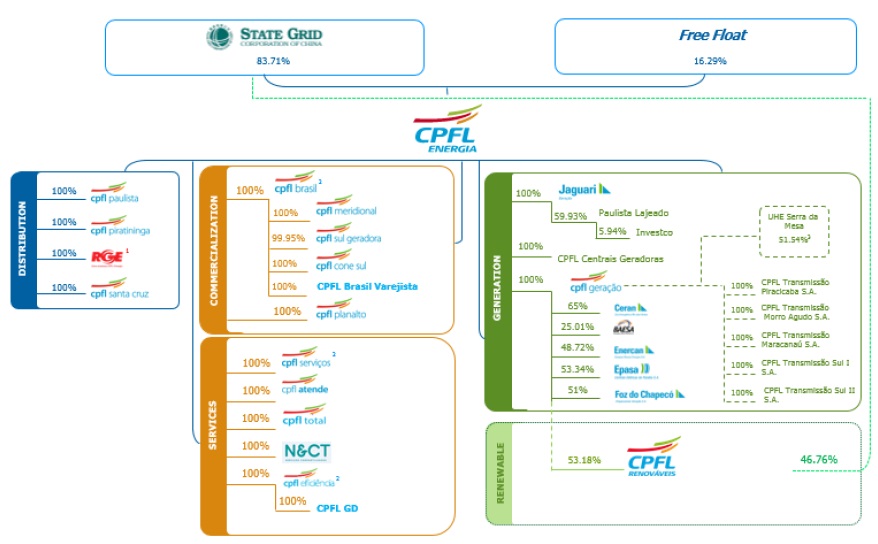
Reference date: 06/30/2019
Notes:
(1) RGE is held by CPFL Energia (89.0107%) and CPFL Brasil (10.9893%).
(2) CPFL Soluções = CPFL Brasil + CPFL Serviços + CPFL Eficiência;
(3) 51.54% stake of the availability of power and energy of Serra da Mesa HPP, regarding the Power Purchase Agreement between CPFL Geração and Furnas;
| 2Q19 Results | August 13, 2019 |
11) PERFORMANCE OF THE BUSINESS SEGMENTS
11.1) Distribution Segment
11.1.1) Economic-Financial Performance
Consolidated Income Statement - Distribution (R$ Million) |
| 2Q19 | 2Q18 | Var. | 1H19 | 1H18 | Var. |
Gross Operating Revenue | 9,376 | 9,051 | 3.6% | 18,823 | 17,381 | 8.3% |
Net Operating Revenue | 5,766 | 5,641 | 2.2% | 11,703 | 10,842 | 7.9% |
Cost of Electric Power | (3,666) | (3,873) | -5.4% | (7,543) | (7,324) | 3.0% |
Operating Costs & Expenses | (1,422) | (1,208) | 17.7% | (2,693) | (2,346) | 14.8% |
EBIT | 679 | 560 | 21.2% | 1,467 | 1,172 | 25.1% |
EBITDA(1) | 873 | 768 | 13.8% | 1,853 | 1,560 | 18.8% |
Financial Income (Expense) | (72) | (47) | 53.7% | (131) | (151) | -13.3% |
Income Before Taxes | 607 | 514 | 18.2% | 1,335 | 1,021 | 30.8% |
Net Income | 387 | 324 | 19.6% | 852 | 644 | 32.3% |
Note:
(1) EBITDA (IFRS) is calculated from the sum of net income, taxes, financial result and depreciation/amortization, as CVM Instruction no. 527/12.
11.1.1.1) Sectoral Financial Assets and Liabilities
On June 30, 2019, the balance of sectoral financial assets and liabilities was positive in R$ 1,253 million. If compared to December 31, 2018, there was a reduction of R$ 255 million, as demonstrated in the chart below.
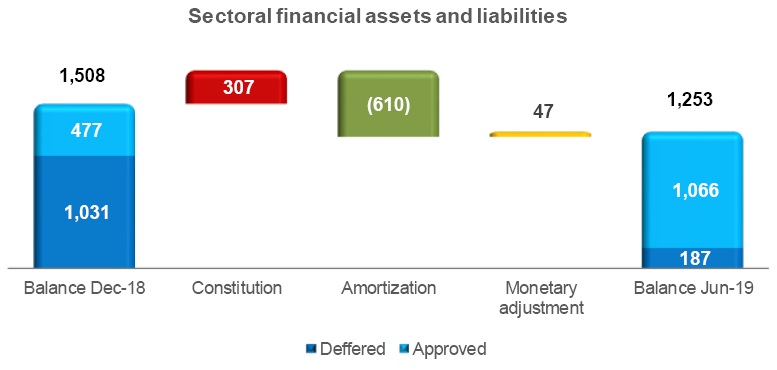
The variation in this balance was due to the constitution of an asset of R$ 307 million, mainly due to higher costs with Itaipu energy and CDE over the tariff coverage. On the other hand, there was an amortization of R$ 610 million, mainly favored by the tariff readjustments that took place in this period, allowing to pass-through the costs to the consumers. The monetary adjustment of assets and liabilities totaled R$ 47 million. It is also important to note that 85% the accounted balance in June-19 was already approved by Aneel in the recent tariff events and will be pass-through to the consumers in the next months.
| 2Q19 Results | August 13, 2019 |
11.1.1.2) Operating Revenue
Operating Revenue (R$ Million) |
| 2Q19 | 2Q18 | Var. | 1H19 | 1H18 | Var. |
Gross Operating Revenue | | | | | | |
Revenue with Energy Sales (Captive + TUSD) | 8,214 | 7,218 | 13.8% | 16,781 | 14,168 | 18.4% |
Short-term Electric Energy | 115 | 260 | -55.7% | 358 | 375 | -4.4% |
Revenue from Building the Infrastructure of the Concession | 511 | 370 | 38.1% | 926 | 740 | 25.1% |
Sectoral Financial Assets and Liabilities | 21 | 481 | -95.6% | (303) | 854 | - |
CDE Resources - Low-income and Other Tariff Subsidies | 338 | 378 | -10.4% | 767 | 754 | 1.7% |
Adjustments to the Concession's Financial Asset | 108 | 139 | -21.8% | 173 | 203 | -15.1% |
Other Revenues and Income | 68 | 206 | -66.8% | 120 | 285 | -57.8% |
Total | 9,376 | 9,051 | 3.6% | 18,823 | 17,381 | 8.3% |
| | | | | | | |
Deductions from the Gross Operating Revenue | | | | | | |
ICMS Tax | (1,614) | (1,477) | 9.2% | (3,354) | (2,878) | 16.5% |
PIS and COFINS Taxes | (812) | (799) | 1.7% | (1,606) | (1,534) | 4.7% |
CDE Sector Charge | (1,046) | (922) | 13.5% | (2,044) | (1,819) | 12.4% |
R&D and Energy Efficiency Program | (52) | (51) | 0.6% | (107) | (99) | 8.2% |
PROINFA | (44) | (38) | 15.3% | (83) | (73) | 12.8% |
Tariff Flags and Others | (35) | (116) | -70.1% | 88 | (123) | -171.0% |
Others | (7) | (6) | 14.4% | (14) | (11) | 20.0% |
Total | (3,610) | (3,410) | 5.9% | (7,120) | (6,539) | 8.9% |
| | | | | | | |
Net Operating Revenue | 5,766 | 5,641 | 2.2% | 11,703 | 10,842 | 7.9% |
In 2Q19, gross operating revenue amounted to R$ 9,376 million, an increase of 3.6% (R$ 325 million), due to the following factors:
· Increase of 13.8% (R$ 996 million) in the revenue with energy sales (captive + free clients), due to: (i) the positive average tariff adjustment in the distribution companies for the period between 2Q18 and 2Q19 (average increase of 20.58% in RGE in June-18, due to the adoption of the 4th tariff revision cycle, and in tariff adjustments, increases of 19.25% in CPFL Piratininga in October-18, of 13.31% in CPFL Santa Cruz in March-19 and of 8.66% in CPFL Paulista in April-19); and (ii) the increase of 0.9% in the load in the concession area;
· Increase of 38.1% (R$ 141 million) in revenue from building the infrastructure of the concession,which has its counterpart in the same amount in operational costs;
Partially offset by:
· Decrease of 95.6% (R$ 460 million) in the accounting of Sectoral Financial Assets/Liabilities;
· Decrease of 55.7% (R$ 145 million) in Short-term Electric Energy;
· Decrease of 66.8% (R$ 137 million) in Other Revenues and Income, due to a refund (extraordinary effect, in the amount of R$ 133 million), in the 2Q18. In 2018 tariff events, Aneel determined the reimbursement to the consumers of an amount collected in tariffs in the period 2010-12, since the resources were not fully applied. The distribution companies received the amount from the Federal Government and, in the same date, sectoral financial liabilities were constituted in the same amount, therefore without affecting the results1;
· Decrease of 10.4% (R$ 39 million) in tariff subsidies (CDE resources);
· Decrease of 21.8% (R$ 30 million) in the adjustments to the Concession´s Financial Asset, despite the higher IPCA (1.46% in 2Q19 versus 0.71% in 2Q18), due to the accounting of tariff revision processes in CPFL Paulista, RGE and RGE Sul in 2Q18 (extraordinary effectin the amount of R$ 93 million, due to the RAB appraisal report);
1 Law n. 12.111/2009 determined an additional 0.3% collection over Net Operating Revenue between January 2010 and December 2012, aiming to refund states and municipalities by an eventual lack of ICMS tax collection over fossil fuel used in the electric energy generation, in the 24 months following the integration of isolated systems to the NIPS. Since the collected amounts were not fully used, Law no. 13.587/2018 determined the refund of resources to the consumers in 2018 tariff events.
| 2Q19 Results | August 13, 2019 |
Deductions from the gross operating revenue were R$ 3,610 million in 2Q19, representing an increase of 5.9% (R$ 200 million), due to the following factors:
· Increase of 6.6% (R$ 150 million) in taxes (ICMS and PIS/Cofins);
· Increase of 13.5% (R$ 125 million) in the CDE sector charge;
· Increase of 7.4% (R$ 7 million) in other items;
Partially offset by the following factors:
· Decrease of 70.1% (R$ 81 million) in tariff flags approved by CCEE;
Net operating revenue reached R$ 5,766 million in 2Q19, representing an increase of 2.2% (R$ 125 million).
In 1H19, gross operating revenue amounted to R$ 18,823 million, an increase of 8.3% (R$ 1,442 million), due to the following factors:
· Increase of 18.4% (R$ 2,613 million) in the revenue with energy sales (captive + free clients), due to: (i) the positive average tariff adjustment in the distribution companies for the period between 1H18 and 1H19; and (ii) the increase of 1.4% in the load within the concession area;
· Increase of 25.1% (R$ 186 million) in revenue from building the infrastructure of the concession;
Partially offset by:
· Variation of R$ 1,157 million in the Sectoral Financial Assets/Liabilities, from a sectoral financial asset of R$ 854 million in 1H18 to a liability of R$ 303 million in 1H19;
· Decrease of 57.8% (R$ 165 million) in Other Revenues and Income;
· Decrease of 15.1% (R$ 31 million) in the adjustments to the Concession´s Financial Asset;
· Decrease of R$ 4 million in the other items.
Deductions from the gross operating revenue were R$ 7,120 million in 1H19, representing an increase of 8.9% (R$ 581 million), due to the following factors:
· Increase of 12.4% (R$ 548 million) in taxes (ICMS and PIS and COFINS);
· Increase of 12.4% (R$ 225 million) in the CDE sector charge;
· Increase of R$ 20 million in the other items;
Partially offset by:
· Reduction of R$ 211 million in tariff flags approved by CCEE.
Net operating revenue reached R$ 11,703 million in 1H19, representing an increase of 7.9% (R$ 861 million).
| 2Q19 Results | August 13, 2019 |
11.1.1.3) Cost of Electric Energy
Cost of Electric Energy (R$ Million) |
| 2Q19 | 2Q18 | Var. | 1H19 | 1H18 | Var. |
Cost of Electric Power Purchased for Resale | | | | | | |
Energy from Itaipu Binacional | 693 | 716 | -3.3% | 1,350 | 1,275 | 5.9% |
PROINFA | 99 | 82 | 20.4% | 204 | 168 | 21.3% |
Energy Purchased through Auction in the Regulated Environment, Bilateral Contracts and Energy Purchased in the Spot Market | 2,468 | 2,733 | -9.7% | 5,400 | 5,117 | 5.5% |
PIS and COFINS Tax Credit | (232) | (318) | -27.1% | (556) | (583) | -4.7% |
Total | 3,028 | 3,213 | -5.8% | 6,398 | 5,977 | 7.0% |
| | | | | | | |
Charges for the Use of the Transmission and Distribution System | | | | | | |
Basic Network Charges | 469 | 557 | -15.7% | 948 | 1,105 | -14.2% |
Itaipu Transmission Charges | 70 | 65 | 6.9% | 137 | 128 | 7.0% |
Connection Charges | 45 | 36 | 24.0% | 90 | 66 | 37.1% |
Charges for the Use of the Distribution System | 7 | 7 | -3.8% | 16 | 13 | 23.3% |
ESS / EER | 112 | 62 | 81.0% | 71 | 175 | -59.3% |
PIS and COFINS Tax Credit | (65) | (67) | -3.5% | (117) | (139) | -15.9% |
Total | 638 | 660 | -3.3% | 1,145 | 1,347 | -15.0% |
| | | | | | | |
Cost of Electric Energy | 3,666 | 3,873 | -5.4% | 7,543 | 7,324 | 3.0% |
In 2Q19, the cost of electric energy, comprising the purchase of electricity for resale and charges for the use of the distribution and transmission system, amounted to R$ 3,666 million, representing a decrease of 5.4% (R$ 208 million):
· Thecost of electric power purchased for resale was R$ 3,028 million in 2Q19, representing a decrease of 5.8% (R$ 186 million), due to the following factors:
(i) Reduction of 9,7% (R$ 265 million) in thecost of energy purchased in the regulated environment, bilateral contracts and short term, due to the reduction of 19.2% in the average purchase price (from R$ 268.67/MWh in 2Q18 to R$ 217.19/MWh in 2Q19), partially offset by the increase of 11.7% (1,191 GWh) in the volume of purchased energy;
(ii) Decrease of 3.3% (R$ 23 million) in thecost of energy fromItaipu, due to thedecrease of 2.6% in the average purchase price (from R$ 259.09/MWh in 2Q18 to R$ 252.40/MWh in 2Q19) and the reduction of 0.7% (20 GWh) in the volume of purchased energy;
Partially offset by:
(iii) Decrease of 27.1% (R$ 86 million) inPIS and Cofins tax credit (cost reducer), generated from the energy purchase;
(iv) Increase of 20.4% (R$ 17 million) in thecost with Proinfa, due to an increase of 21.3% in the average purchase price (R$ 371.99/MWh in 2Q19 vs. R$ 306.61/MWh in 2Q18), partially offset by the reduction of 0.7% (2 GWh) in the volume of purchased energy;
· Charges for the use of the transmission and distribution system reached R$ 638 million in 2Q19, representing a decrease of 3.3% (R$ 22 million), due to the following factors:
(i) Decrease of 11.2% (R$ 75 million) inconnection and transmission charges (Basic Network, Itaipu transmission, connection and usage of the distribution system);
Partially offset by:
(ii) Increase of 81.1% (R$ 50 million) insector charges (ESS – System Service Usage Charges /EER – Reserve Energy Charges)
(iii) Decrease of 3.5% (R$ 2 million) inPIS and Cofins tax credit (cost reducer), generated from the charges.
| 2Q19 Results | August 13, 2019 |
In 1H19, the cost of electric energy, comprising the purchase of electricity for resale and charges for the use of the distribution and transmission system, amounted to R$ 7,543 million, representing an increase of 3.0% (R$ 219 million):
· Thecost of electric power purchased for resale was R$ 6,398 million in 1H19, representing an increase of 7.0% (R$ 421 million), due to the following factors:
(i) Increase of 5.5% (R$ 283 million) in thecost of energy purchased in the regulated environment, bilateral contracts and short term, due to an increase of 11.5% (2,458 GWh) in the volume of purchased energy, partially offset by a reduction of 5.4% in the average purchase price (from R$ 239.80/MWh in 1H18 to R$ 226.90/MWh in 1H19);
(ii) Increase of 5.9% (R$ 75 million) in thecost of energy from Itaipu, due to the increase of 6.7% in the average purchase price (from R$ 231.60/MWh in 1H18 to R$ 247,04/MWh in 1H19), partially offset by the reduction of 0.7% (39 GWh) in the volume of purchased energy;
(iii) Increase of 21.3% (R$ 36 million) in thecost with Proinfa,due to the increase of 21.6% in the average purchase price (R$ 389.95/MWh in 1H19 vs. R$ 320.58/MWh in 1H18), partially offset by the reduction of 0.3% (2 GWh) in the volume of purchased energy;
(iv) Decrease of 4.7% (R$ 27 million) inPIS and Cofins tax credit (cost reducer), generated from the energy purchase.
· Charges for the use of the transmission and distribution system reached R$ 1,145 million in 1H19, representing a decrease of 15.0% (R$ 202 million), due to the following factors:
(i) Decrease of 9.2% (R$ 121 million) inconnection and transmission charges;
(ii) Decrease of 59.3% (R$ 104 million) in sector charges (ESS/EER)
Partially offset by:
(iii) Decrease of 15.9% (R$ 22 million) inPIS and Cofins tax credit (cost reducer), generated from the charges.
11.1.1.4) Operating Costs and Expenses
Operating costs and expenses reached R$ 1,422 million in 2Q19, an increase of 17.7% (R$ 214 million). In 1H19, operating costs and expenses reached R$ 2,693 million, an increase of 14.8% (R$ 347 million).
The factors that explain these variations follow below:
| 2Q19 Results | August 13, 2019 |
PMSO
Reported PMSO (R$ million) |
| 2Q19 | 2Q18 | Variation | 1H19 | 1H18 | Variação |
| R$ MM | % | R$ MM | % |
Reported PMSO | | | | | | | | |
Personnel | (242) | (231) | (12) | 5.1% | (469) | (455) | (14) | 3.1% |
Material | (44) | (42) | (3) | 6.1% | (90) | (82) | (8) | 10.3% |
Outsourced Services | (220) | (210) | (10) | 4.8% | (427) | (416) | (10) | 2.4% |
Other Operating Costs/Expenses | (182) | (126) | (56) | 44.6% | (340) | (220) | (120) | 54.2% |
Allowance for doubtful accounts | (64) | (42) | (22) | 53.7% | (132) | (68) | (64) | 94.6% |
Legal and judicial expenses | (38) | (30) | (8) | 26.9% | (68) | (40) | (28) | 69.4% |
Others | (80) | (54) | (26) | 47.4% | (139) | (112) | (27) | 24.2% |
Total Reported PMSO | (689) | (608) | (80) | 13.2% | (1,325) | (1,173) | (152) | 13.0% |
In 2Q19,PMSO reached R$ 689 million, an increase of 13.2% (R$ 80 million).
Personnel– increase of 5.1% (R$ 12 million),mainly due to the collective bargaining agreement – wages and benefits;
Material– increase of 6.1% (R$ 3 million), mainly replacement of materials to grid maintenance (R$ 2 million);
Third party services – increase of 4.8% (R$ 10 million), mainly due to the increase in the following items: electric system maintenance (R$ 4 million), collection actions, re notification, cut and reconnection (R$ 4 million) and tree pruning (R$ 2 million);
Other operating costs/expenses – increase of 44.6% (R$ 56 million), due to the increase in allowance for doubtful accounts (R$ 22 million), assets write-off (R$ 18 million), in legal and judicial expenses (R$ 8 million), bank´s collection fee (R$ 4 million) and other costs/expenses (R$ 4 million).
In 1H19,PMSO reached R$ 1,325 million, an increase of 13.0% (R$ 152 million).
Personnel– increase of 3.1% (R$ 14 million);
Material– increase of 10.3% (R$ 8 million), mainly replacement of materials to grid maintenance (R$ 7 million);
Third party services – increase of 2.4% (R$ 10 million), mainly due to the increases in the following items: electric system maintenance (R$ 6 million), meter reading and delivery of bills (R$ 5 million), outsourced services (R$ 4 million) and collection actions, re notification, cut and reconnection (R$ 3 million), partially offset by the reductions in audit and consulting (R$ 6 million) and other costs/expenses (R$ 2 million);
Other operating costs/expenses – increase of 54.2% (R$ 120 million), due to the increase in the following items: allowance for doubtful accounts (R$ 64 million), legal and judicial expenses (R$ 28 million), assets write-off (R$ 9 million), bank´s collection fee (R$ 8 million) and other costs/expenses (R$ 11 million).
Other operating costs and expenses
| 2Q19 Results | August 13, 2019 |
In 2Q19, other operating costs and expenses reached R$ 733 million, registering an increase of 22.3% (R$ 134 million), with the variations below:
(i) Increase of 38.1% (R$ 141 million) incost of building the concession´s infrastructure (this item does not affect results, since it has its counterpart in “operating revenue”);
(ii) Increase of 25.3% (R$ 6 million) inPrivate Pension Fund item, due to the registration of the impacts of the actuarial report;
Partially offset by:
(iii) Decrease of 6.2% (R$ 13 million) inDepreciation and Amortization.
In 1H19, other operating costs and expenses reached R$ 1,368 million, registering an increase of 16.7% (R$ 195 million), with the variations below:
(iv) Increase of 25.1% (R$ 186 million) incost of building the concession´s infrastructure;
(v) Increase of 25.3% (R$ 11 million) inPrivate Pension Fund;
Partially offset by:
(vi) Decrease of 0.3% (R$ 1 million) inDepreciation and Amortization.
11.1.1.5) EBITDA
EBITDAtotaled R$ 873 million in 2Q19, an increase of 13.8% (R$ 106 million), mainly favored by the positive effects of tariff adjustments and revisions, by the load performance and by the adjustments to the Concession´s Financial Asset. These effects were partially offset by the RAB appraisal report due to tariff revisions, leading to an extraordinary gain in 2Q18, and by the higher PMSO.
In 1H19,EBITDAtotaled R$ 1,853 million, an increase of 18.8% (R$ 293 million), basically influenced by the same effects mentioned above.
Conciliation of Net Income and EBITDA (R$ million) |
| 2Q19 | 2Q18 | Var. | 1H19 | 1H18 | Var. |
Net income | 387 | 324 | 19.6% | 852 | 644 | 32.3% |
Depreciation and Amortization | 194 | 207 | | 386 | 388 | |
Financial Results | 72 | 47 | | 131 | 151 | |
Income Tax /Social Contribution | 220 | 190 | | 483 | 377 | |
EBITDA | 873 | 768 | 13.8% | 1,853 | 1,560 | 18.8% |
11.1.1.6) Financial Result
Financial Result (R$ Million) |
| 2Q19 | 2Q18 | Var. | 1H19 | 1H18 | Var. |
Revenues | 148 | 122 | 21.1% | 293 | 259 | 13.3% |
Expenses | (220) | (169) | 30.1% | (424) | (410) | 3.5% |
Financial Result | (72) | (47) | 53.7% | (131) | (151) | -13.3% |
In 2Q19, the net financial result recorded a net financial expense of R$ 72 million, an increase of53.7% (R$ 25 million). The items explaining these changes are as follows:
| 2Q19 Results | August 13, 2019 |
(i) Reduction of 92.1% (R$ 42 million) inmark-to-market accounting (non-cash effect), which recorded an expressive gain in 2Q18, a fact that did not happen again in 2Q19, due to a variation in forward interest curve, influenced by the uncertainty of the beginning of electoral season;
(ii) Increase of 7.3% (R$ 14 million) in theexpenses with net debt, due to an increase in the balance, from R$ 8,294 million in Jun-18 to R$ 8,987 million in Jun-19;
These factors were partially offset by:
(iii) Increase of 31.8% (R$ 25 million) inlate payment interest and fines;
(iv) Increase of 18.4% (R$ 3 million) insectoral financial assets and liabilities update;
(v) Decrease of 60.2% (R$ 2 million) inother financial revenues and expenses.
In 1H19, the net financial result recorded a net financial expense of R$ 131 million, a reduction of 13.3% (R$ 20 million). The items explaining these changes are as follows:
(i) Increase of 146.1% (R$ 28 million) insectoral financial assets and liabilities update;
(ii) Increase of 13.6% (R$ 23 million) inlate payment interest and fines;
(iii) Decrease of R$ 10 million inother financial revenues and expenses;
Partially offset by:
(iv) Increase of 5.7% (R$ 20 million) in theexpenses with net debt, mainly due to the increase in balance;
(v) Decrease of 81.8% (R$ 20 million) inmark-to-market accounting (non-cash effect), which recorded an expressive gain in 1H18, a fact that did not happen in 1H19.
11.1.1.7) Net Income
Net Incometotaled R$ 387 million in 2Q19, an increase of 19.6% (R$ 63 million). In 1H19,Net Incometotaled R$ 852 million, an increase of 32.3% (R$ 208 million).
11.1.2) Tariff Events
Reference dates
Tariff Process Dates |
Distributor | Date |
CPFL Santa Cruz | March 22nd |
CPFL Paulista | April 8th |
RGE | June 19th |
CPFL Piratininga | October 23rd |
| 2Q19 Results | August 13, 2019 |
Tariff Revision |
Distributor | Periodicity | Next Revision | Cycle |
CPFL Piratininga | Every 4 years | October 2019 | 5thPTRC |
CPFL Santa Cruz | Every 5 years | March 2021 | 5th PTRC |
CPFL Paulista | Every 5 years | April 2023 | 5th PTRC |
RGE | Every 5 years | June 2023 | 5th PTRC |
Annual tariff adjustments of October 2018, March 2019, April and June 2019
| CPFL Piratininga | CPFL Santa Cruz | CPFL Paulista | RGE | RGE Sul |
Ratifying Resolution | 2,472 | 2,522 | 2,526 | 2,557 |
Adjustment | 20.01% | 13.70% | 12.02% | 10.05% |
Parcel A | 7.07% | 1.12% | 0.78% | -2.16% |
Parcel B | 1.76% | 0.90% | 2.17% | 2.21% |
Financial Components | 11.18% | 11.68% | 9.07% | 10.00% |
Effect on consumer billings | 19.25% | 13.31% | 8.66% | 8.63% | 1.72% |
Date of entry into force | 10/23/2018 | 03/22/2019 | 8/4/2019 | 06/19/2019 |
Periodic tariff reviews occurred in 2018
| RGE |
Ratifying Resolution | 2,401 |
Adjustment | 21.27% |
Parcel A | 6.11% |
Parcel B | 9.45% |
Financial Components | 5.71% |
Effect on consumer billings | 20.58% |
Date of entry into force | 06/19/2018 |
| 2Q19 Results | August 13, 2019 |
4th Periodic Tariff Review Cycle | RGE |
Date | Jun-18 |
Gross Regulatory Asset Base (A) | 4,374 |
Depreciation Rate (B) | 3.74% |
Depreciation Quota (C = A x B) | 164 |
Net Regulatory Asset Base (D) | 3,032 |
Pre-tax WACC (E) | 12.26% |
Cost of Capital (F = D x E) | 372 |
Special Obligations (G) | 8 |
Regulatory EBITDA (H = C + F + G) | 543 |
OPEX = CAOM + CAIMI (I) | 523 |
Parcel B (J = H + I) | 1,066 |
Productivity Index Parcel B ( K ) | 1.07% |
Quality Incentive Mechanism ( L) | 0.05% |
Parcel B with adjusts (M = J * (K - L) | 1,054 |
Other Revenues (N) | 28 |
Adjusted Parcel B (O = M - N) | 1,026 |
Parcel A (P) | 2,816 |
Required Revenue (Q = O + P) | 3,842 |
RGE
On June 19, 2018, ANEEL approved the result of the fourth Periodic Tariff Review of distributor RGE. The average effect to be perceived by the consumers was 20.58% and details can be found in the table above.
11.1.3) Operating Performance of Distribution
SAIDI and SAIFI
Below we are presenting the results achieved by the distribution companies with regard to the main indicators that measure the quality and reliability of their supply of electric energy. The SAIDI (System Average Interruption Duration Index) measures the average duration, in hours, of interruption per consumer per year. The SAIFI (System Average Interruption Frequency Index) measures the average number of interruptions per consumer per year.
SAIDI and SAIFI Indicators |
Distributor | SAIDI (hours) | SAIFI (interruptions) |
2014 | 2015 | 2016 | 2017 | 2018 | 2Q18 | 1Q19 | 2Q19 | ANEEL1 | 2014 | 2015 | 2016 | 2017 | 2018 | 2Q18 | 1Q19 | 2Q19 | ANEEL1 |
CPFL Paulista | 6.93 | 7.76 | 7.62 | 7.14 | 6.17 | 6.50 | 6.46 | 6.71 | 7.38 | 4.89 | 4.89 | 5.00 | 4.94 | 4.03 | 4.46 | 4.16 | 4.29 | 6.32 |
CPFL Piratininga | 6.98 | 7.25 | 8.44² | 6.97 | 5.92 | 5.93 | 6.40 | 6.55 | 6.42 | 4.19 | 4.31 | 3.97² | 4.45 | 3.87 | 3.61 | 4.31 | 4.35 | 5.68 |
RGE | 18.28 | 17.47 | 16.82 | 14.83 | 14.44 | 14.45 | 14.95 | 14.83 | 11.08 | 9.01 | 8.37 | 8.44 | 7.68 | 6.10 | 6.61 | 6.27 | 6.40 | 8.35 |
CPFL Santa Cruz | 7.44 | 8.68 | 8.47 | 6.22 | 6.01 | 5.61 | 6.21 | 6.22 | 8.46 | 5.89 | 6.64 | 6.25 | 5.13 | 5.09 | 4.98 | 4.84 | 4.82 | 7.64 |
Notes:
1) Limit of the Regulatory Agency (ANEEL);
2) In the previous disclosures, we reported a SAIDI of 6.97 and a SAIFI of 3.80 for CPFL Piratininga in 2016. This number excluded the effect of a CTEEP transmission failure during a storm. However, a decision by ANEEL determined that this effect was included in the SAIDI and SAIFI statistics, so that we corrected the values, as shown in the table.
The annualized values of SAIDI and SAIFI for the second quarter of 2019 presented results very close to those of the same period of 2018 (+4.0% in the SAIDI and -0.2% in the SAIFI) in the consolidated of the distributors. In this quarterly comparison, it is worth highlighting the reduction in CPFL Paulista (-3.8%), CPFL Santa Cruz (-3.2%) and RGE (-0.3%) SAIFI.
As regards RGE Sul specifically, the recovery plan for technical indicators remains Rural, Troncal and Urban pruning, treatment of major primary, secondary and damage recidivism, programming of services for testing and maintenance in substations and transmission lines, carry outtermovision and ultrasound inspections in distribution networks, substations and transmission lines. In addition, part of the maintenance plan, improvements and extensions of the existing structure, with the forecast of exchanges of posts, capacity adjustment, modernization of substations, and installation of remote control and control equipment. This plan is part of a continuous improvement that is already under development. In addition to the significant investments being made, the significant reduction of these investments has already been observed.
| 2Q19 Results | August 13, 2019 |
Since 2019, the RGE and RGE Sul concessions have been unified, becoming a single distributor for the purpose of calculating technical indicators.
Losses
Find below the performance of CPFL distribution companies throughout the last quarters:
12M Accumulated Losses1 | |
2Q18 | 3Q18 | 4Q18 | 1Q19 | 2Q19 | ANEEL |
CPFL Energia | 9.02% | 8.86% | 9.03% | 8.84% | 9.01% | 8.27% |
CPFL Paulista | 9.10% | 8.87% | 9.13% | 8.86% | 9.13% | 8.37% |
CPFL Piratininga | 7.87% | 7.79% | 7.94% | 7.69% | 7.88% | 6.92% |
RGE | 9.73% | 9.71% | 9.70% | 9.78% | 9.74% | 9.14% |
CPFL Santa Cruz | 8.84% | 8.09% | 8.56% | 7.82% | 8.10% | 7.58% |
Notes:
1) The figures above were adequate to a better comparison with the regulatory losses trajectory defined by the Regulatory Agency (ANEEL). In CPFL Piratininga, RGE and RGE Sul, high-voltage customers were disregarded.
The consolidated losses index of CPFL Energia was of 9.01% in 2Q19, compared to 8.84% in 1Q19, an increase of 0.17 p.p. Compared to 2Q18 (9.02%), there was a reduction of 0.01 p.p.
The CPFL group has intensified the actions against non-technical losses in recent years, where the main achievements of the semester were:
(i) Conducting 291,000 inspections at consumer units;
(ii) Cut out of 55,000 inactivated consumer units;
(iii) Regularization of 1,100 clandestine consumers;
(iv) Replacing obsolete / defective meters with new electronics;
(v) Implementation of armored measuring boxes for 4 thousand customers in São Paulo;
(vi) Recovery of 295 GWh of energy, of which 217 GWh related to revenue growth and 78 GWh of retroactive energy;
(vii) Driving to the police station of 81 people, between arrests and indictment for power theft;
| 2Q19 Results | August 13, 2019 |
(viii) Communication of CPFL Energia's actions to combat losses in physical and digital media, showing that energy theft is a crime and is subject to penalties.
Delinquency
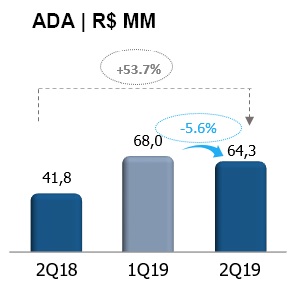
ADA increased by R$ 64 million (approximately 53.7%) in 2Q19 compared to 2Q18.
In 2Q19 several actions were implemented with a positive result, with a reduction of 5.6%compared to 1Q19:
(i) Increase of power cuts in 2Q19 (536 thousand in 2Q19 versus 465 thousand in 1Q19) and expectation to maintain the same level until the end of the year (meter and circuit breaker);
(ii) Intensification of other collection actions: 2.9 million negatives in 2Q19 (641k over 1Q) and 2.4 million SMS and emails (171k over 1Q);
(iii) Intensified negotiations with customers with judicial and inactive debts ( Group A);
(iv) Implementation of new payment options (debit and credit card) for overdue accounts
11.2) Commercialization and Services Segments
11.2.1) Commercialization Segment
Consolidated Income Statement - Commercialization (R$ Million) |
| 2Q19 | 2Q18 | Var. | 1H19 | 1H18 | Var. |
Net Operating Revenue | 809 | 843 | -4.0% | 1,569 | 1,553 | 1.1% |
EBITDA(1) | 21 | 31 | -33.0% | 51 | 39 | 32.8% |
Net Loss | 13 | 16 | -18.9% | 28 | 16 | 77.1% |
Note:
(1) EBITDA is calculated from the sum of net income, taxes, financial result and depreciation/amortization.
| 2Q19 Results | August 13, 2019 |
11.2.2) Services Segment
Consolidated Income Statement - Services (R$ Million) |
| 2Q19 | 2Q18 | Var. | 1H19 | 1H18 | Var. |
Net Operating Revenue | 158 | 112 | 41.7% | 304 | 239 | 27.0% |
EBITDA(1) | 39 | 23 | 72.0% | 75 | 48 | 56.9% |
Net Income | 23 | 13 | 76.7% | 46 | 27 | 72.9% |
Note:
(1) EBITDA is calculated from the sum of net income, taxes, financial result and depreciation/amortization.
11.3) Conventional Generation Segment
11.3.1) Economic-Financial Performance
Consolidated Income Statement - Conventional Generation (R$ million) |
| 2Q19 | 2Q18 | Var. | 1H19 | 1H18 | Var. |
Gross Operating Revenue | 332 | 297 | 11.7% | 633 | 605 | 4.6% |
Net Operating Revenue | 298 | 271 | 10.0% | 567 | 552 | 2.7% |
Cost of Electric Power | (29) | (17) | 70.5% | (58) | (35) | 63.7% |
Operating Costs & Expenses | (55) | (54) | 1.3% | (107) | (107) | -0.7% |
EBIT | 214 | 200 | 7.3% | 403 | 409 | -1.6% |
EBITDA | 334 | 299 | 11.8% | 638 | 624 | 2.2% |
Financial Income (Expense) | (39) | (75) | -48.1% | (83) | (143) | -41.9% |
Income Before Taxes | 265 | 194 | 37.0% | 495 | 421 | 17.7% |
Net Income | 208 | 155 | 34.0% | 392 | 337 | 16.4% |
Nota:
(1) EBITDA is calculated from the sum of net income, taxes, financial result and depreciation/amortization.
11.3.1.1) Operating Revenue
In the analysis presented in this report we consider thetransmission companies CPFL Piracicaba and CPFL Morro Agudo.
In 2Q19,Gross Operating Revenuereached R$ 332 million, an increase of 11.7% (R$ 35 million).Net Operating Revenue was of R$ 298 million,registering an increase of 10.0% (R$ 27 million).
The main factors that affected the net operating revenue are:
(i) Increase of R$ 13 million in other operating revenues, mainly due to the increase of GSF agreement in CPFL Geração;
(ii) Increase of R$ 25 million in the revenue with the power supply, explained by the readjustment of contracts combined with the increase in the amount of energy sold in CPFL Geração ( R$ 16.8 million). Increase in subsidiary CERAN's revenue (R$ 7.8 million), mainly explained by the increase in the amount of energy sold.
Partially offset by:
(iii) Reduction of R$ 4 million in the revenue with the power supply from Jaguari Geração
In 1H19,Gross Operating Revenuereached R$ 633 million,an increase of 4.6% (R$ 28 million) in relation to 1H18.Net Operating Revenue was of R$ 567 million,registering an increase of 2.7% (R$ 15 million). The main factor contributing to the increase in net operatingrevenue was the increase in energy supply revenue (volume increase), combined with the readjustment of the contracts in CPFL Geração (R$ 20 million). Additionally, we can mention the R$ 9 million increase in revenue from the Rio das Antas Complex (Ceran).
| 2Q19 Results | August 13, 2019 |
This effects were partially offset by:
(iv) Reduction of R$ 5 million in the revenue with the power supply from Jaguari Geração
11.3.1.2) Cost of Electric Power
In 2Q19, the cost of electricity reached R $ 29 million, an increase of 70.5% (R $ 12 million), mainly due to the following factor:
• Increase of R $ 12 million in Cost of Energy Purchased for Resale, mainly explained by the GSF reimbursement agreement (R $ 19 million) and partially offset by the volume reduction with energy purchase (R $ 5 million) in CPFL Geração.
In 1H19, the cost of electricity reached R $ 58 million, an increase of 63.7% (R $ 23 million), also mainly explained by the increase in cost of energy purchased over 1H18, due to the GSF reimbursement agreement.
11.3.1.3)Operating Costs and Expenses
Operating costs and expenses reached R$ 55 million in 2Q19, compared to R$ 54 million in 2Q18, a variation of 1.3%. In 1H19, operating costs and expenses remained at the same level as 1H18 (R$ 107 million).
The factors that explain these variations follow below:
PMSO
PMSO (R$ million) |
| 2Q19 | 2Q18 | Variation | 1H19 | 1H18 | Variation |
| % | % |
PMSO | | | | | | |
Personnel | 9 | 9 | 2.8% | 17 | 17 | -3.8% |
Material | 1 | 1 | 31.0% | 2 | 1 | 30.5% |
Outsourced Services | 7 | 6 | 19.0% | 12 | 10 | 17.7% |
Other Operating Costs/Expenses | 7 | 8 | -11.0% | 15 | 17 | -12.0% |
GSF Risk Premium | 2 | 2 | 31.9% | 5 | 4 | 31.9% |
Others | 5 | 7 | -22.8% | 10 | 13 | -24.0% |
Total PMSO | 24 | 23 | 2.5% | 46 | 46 | -1.0% |
PMSO item reached R$ 24 million in 2Q19, registering an increase of 2.5%, compared to 2Q18.
In 1H19, PMSO reached R$ 46 million, registering a reduction of 1.0%, compared to 1H18.
Other operating costs and expenses
Other operating costs and expenses reached R$ 30 million in 2Q19, compared to R$ 31 million in 2Q18.
In 1H19, other operating costs and expenses reached R $ 61 million, compared to R $ 61 million in 1H18.
| 2Q19 Results | August 13, 2019 |
In “Others” expenses, reclassification of expenses related to the Financial Compensation on Water Resources ( CFURH), to the Deductions from Operating Revenue group, according to Aneel's guidance (R$ 2 million in 2Q19 and R$ 4 million in 1H19).
11.3.1.4) Equity Income
Equity Income (R$ Million) |
| 2Q19 | 2Q18 | Var. R$ | Var. % | 1H19 | 1H18 | Var. R$ | Var. % |
Projects | | | | | | | | |
Barra Grande HPP | (3) | (0) | (3) | 100.0% | 0 | 3 | (2) | -89.1% |
Campos Novos HPP | 36 | 21 | 16 | 74.4% | 67 | 48 | 19 | 38.6% |
Foz do Chapecó HPP | 32 | 29 | 3 | 9.4% | 62 | 60 | 2 | 3.2% |
Epasa TPP | 25 | 19 | 5 | 28.3% | 47 | 44 | 3 | 7.3% |
Total | 90 | 69 | 21 | 30.3% | 176 | 154 | 21 | 13.8% |
Note: Disclosure of interest in subsidiaries is made in accordance with IFRS 12 and CPC 45.
In 2Q19, Equity Income result reached R$ 90 million, compared to R$ 69 million in 2Q18, an increase of 30.3% (R$ 21 million).
Equity Income (R$ Million) |
BAESA | 2Q19 | 2Q18 | Var. R$ | Var. % | 1H19 | 1H18 | Var. R$ | Var. % |
| | | | | | | | | |
Net Revenue | 14 | 15 | (1) | -8.0% | 28 | 31 | (2) | -7.5% |
Operating Costs / Expenses | (12) | (10) | (2) | 22.2% | (18) | (15) | (3) | 23.2% |
Deprec. / Amortization | (3) | (3) | 0 | 0.0% | (6) | (6) | (0) | 0.1% |
Net Financial Result | (3) | (5) | 2 | -36.1% | (3) | (6) | 2 | -38.6% |
Income Tax | 2 | 0 | 1 | 1023.2% | (0) | (1) | 1 | -95.0% |
Net Income | (3) | (0) | (3) | 878.3% | 0 | 3 | (2) | -89.1% |
| | | | | | | | | |
Equity Income (R$ Million) |
ENERCAN | 2Q19 | 2Q18 | Var. R$ | Var. % | 1H19 | 1H18 | Var. R$ | Var. % |
| | | | | | | | | |
Net Revenue | 89 | 65 | 23 | 35.7% | 156 | 134 | 22 | 16.7% |
Operating Costs / Expenses | (23) | (22) | (1) | 3.2% | (35) | (37) | 3 | -7.3% |
Deprec. / Amortization | (6) | (6) | 0 | -3.9% | (12) | (12) | 1 | -4.2% |
Net Financial Result | (4) | (5) | 1 | -23.4% | (8) | (10) | 3 | -25.5% |
Income Tax | (19) | (11) | (8) | 78.7% | (34) | (25) | (10) | 40.0% |
Net Income | 36 | 21 | 16 | 74.4% | 67 | 48 | 19 | 38.6% |
| | | | | | | | | |
Equity Income (R$ Million) |
FOZ DO CHAPECO | 2Q19 | 2Q18 | Var. R$ | Var. % | 1H19 | 1H18 | Var. R$ | Var. % |
| | | | | | | | | |
Net Revenue | 111 | 108 | 3 | 2.4% | 219 | 215 | 5 | 2.2% |
Operating Costs / Expenses | (24) | (25) | 1 | -4.5% | (53) | (49) | (3) | 6.7% |
Deprec. / Amortization | (16) | (16) | 0 | -2.8% | (32) | (32) | 0 | -0.5% |
Net Financial Result | (23) | (32) | 9 | -29.3% | (41) | (44) | 4 | -8.6% |
Income Tax | (16) | (15) | (1) | 8.5% | (31) | (31) | (0) | 1.5% |
Net Income | 32 | 29 | 3 | 9.4% | 62 | 60 | 2 | 3.2% |
| 2Q19 Results | August 13, 2019 |
Equity Income (R$ Million) |
EPASA | 2Q19 | 2Q18 | Var. R$ | Var. % | 1H19 | 1H18 | Var. R$ | Var. % |
| | | | | | | | | |
Net Revenue | 111 | 53 | 58 | 108.3% | 216 | 146 | 69 | 47.1% |
Operating Costs / Expenses | (74) | (25) | (49) | 196.0% | (145) | (83) | (62) | 75.3% |
Deprec. / Amortization | (5) | (5) | 0 | -0.8% | (9) | (9) | 0 | -0.7% |
Net Financial Result | (2) | (2) | 0 | -1.4% | (3) | (3) | 0 | -1.6% |
Income Tax | (6) | (2) | (3) | 137.7% | (11) | (7) | (4) | 50.3% |
Net Income | 25 | 19 | 5 | 28.3% | 47 | 44 | 3 | 7.3% |
11.3.1.5) EBITDA
In 2Q19,EBITDAwas of R$ 334 million, compared to R$ 299 million in 2Q18, an increase of 11.8% (R$ 35 million).
The main factors that contributed to this variation in 2Q19 were:
(i) Inflation effect over the contracts (+R$ 22 MM);
(ii) Higher hydro and thermal generation (+R$ 13 MM).
In 1H19,EBITDAwas of R$ 638 million, compared to R$ 624 million in 1H18, an increase of 2.2% (R$ 14 million).
The main factors that contributed to this variation in 1H19 were:
(i) Inflation effect over the contracts (+R$ 33 MM);
(ii) Higher hydro and thermal generation (+ R$ 13 MM).
Partially compensated by:
(iii) Baesa: compensation agreement related to 2018 (-R$ 17 MM)
(iv) EPASA overhaul (-R$ 10 MM)
Conciliation of Net Income and EBITDA (R$ million) |
| 2Q19 | 2Q18 | Var. | 1H19 | 1H18 | Var. |
Net Income | 208 | 155 | 34.0% | 392 | 337 | 16.4% |
Depreciation and Amortization | 30 | 30 | | 60 | 61 | |
Financial Result | 39 | 75 | | 83 | 143 | |
Income Tax /Social Contribution | 57 | 38 | | 103 | 83 | |
EBITDA | 334 | 299 | 11.8% | 638 | 624 | 2.2% |
11.3.1.6) Financial Result
Financial Result (IFRS - R$ Million) |
| 2Q19 | 2Q18 | Var. | 1H19 | 1H18 | Var. |
Financial Revenues | 13 | 16 | -18.6% | 23 | 37 | -36.5% |
Financial Eafpenses | (52) | (91) | -42.9% | (106) | (179) | -40.8% |
Financial Result | (39) | (75) | -48.1% | (83) | (143) | -41.9% |
In 2Q19, the financial result was a net financial expense of R$ 39 million, representing a reduction of 48.1% (R $ 36 million) compared to the net financial expense of R$ 75 million in 2Q18.
The main items that explain this variation are:
| 2Q19 Results | August 13, 2019 |
(i) Decrease of 30.5% (R $ 20 million) indebt charges, mainly due to the reduction in total debt volume, also due to the CDI variation (3.07% in 2Q19 compared to 3.17% in 2Q18).
(ii) Reduction of 99.7% (R$ 18 million) in expenses withmonetary and foreign exchange updates: positive effect of R$ 22 million in the mark-to-market of the zero-cost collar derivative2;
(iii) Revenue of R $ 7 million in 2Q19 related toInterest on loan agreements, an increase of R$ 3 million compared to 2Q18.
Partially offset by:
(iv) Reduction of 61.4% (R $ 9 million) inincome from financial investments.
In 1H19, the financial result was a net financial expense of R$ 83 million, a decrease of 41.9% (R$ 60 million) compared to the net financial expense of R$ 143 million in 1H18.
The main items that explain this variation are:
(i) Decrease of 28.5% (R$ 37 million) indebt charges, mainly due to the reduction in total debt volume;
(ii) Reduction of 88.7% (R$ 33 million) in expenses withmonetary and foreign exchange updates: positive effect of R$ 22 million referring to the zero cost collar derivative and R$ 11 million referring to other monetary and exchange rate updates;
(iii) Revenue of R $ 13 million in 1H19 related toInterest on loan agreements, an increase of R$ 9 million compared to 1H18.
Partially offset by:
(iv) Reduction of 69.1% (R $ 20 million) inincome from financial investments.
11.3.1.7) Net Income
In 2Q19,net incomewas of R$ 208 million, compared to a net income of R$ 155 million in 2Q18, an increase of 34.0% (R$ 53 million).
In 1H19,net incomewas of R$ 392 million, compared to a net income of R$ 337 million in 1H18, an increase of 16.4% (R$ 55 million).
2In 2015, subsidiary CPFL Geração contracted US$ denominated put and call options, involving the same financial institution as counterpart, and which on a combined basis are characterized as an operation usually known as zero-cost collar. The contracting of this operation does not involve any kind of speculation, inasmuch as it is aimed at minimizing any negative impacts on future revenues of the joint venture ENERCAN, which has electric energy sale agreements with annual restatement of part of the tariff based on the variation in the US$. In addition, according to Management’s view, the scenario was favorable for contracting this type of financial instrument, considering the high volatility implicit in dollar options and the fact that there was no initial cost for same.
| 2Q19 Results | August 13, 2019 |
11.4) CPFL Renováveis
11.4.1) Economic-Financial Performance
Income Statement - CPFL Renováveis ( R$ Million) |
| 2Q19 | 2Q18 | Var. % | 1H19 | 1H18 | Var. % |
Gross Operating Revenue | 434 | 437 | -0.7% | 788 | 843 | -6.5% |
Net Operating Revenue | 411 | 415 | -0.9% | 745 | 799 | -6.6% |
Cost of Electric Power | (66) | (82) | -19.1% | (120) | (152) | -21.5% |
Operating Costs & Expenses | (256) | (232) | 10.3% | (505) | (475) | 6.4% |
EBIT | 89 | 101 | -11.8% | 121 | 171 | -29.5% |
EBITDA(1) | 251 | 256 | -1.9% | 443 | 484 | -8.4% |
Financial Income (Expense) | (111) | (119) | -6.7% | (223) | (248) | -10.2% |
Income Before Taxes | (22) | (18) | 22.7% | (102) | (77) | 32.7% |
Net Income | (38) | (37) | 5.4% | (132) | (109) | 20.6% |
Note:
(1) EBITDA is calculated from the sum of net income, taxes, financial result and depreciation/amortization.
11.4.1.1) Operating Revenue
In 2Q19,Gross Operating Revenue reached R$ 434 million, representing a reduction of 0.7% (-R$3 million).Net Operating Revenue reached R$ 411 million, representing a reduction of 0.9% (-R$ 4 million).
These variations are mainly explained by the following factors:
Wind Source:
· Reduction of R$ 35 million in revenue from wind farms, mainly due to: (i) lower generation of wind complexes (-R$ 22 million); (ii) the difference in the price of energy sold in the new energy auction through the Surplus and Deficit Offset Mechanism (MCSD), since the energy no longer contracted in 2Q18 was sold in the free market at a price higher than the contract price in the regulated market in 2Q19 (-R$ 9 million), and (iii) annual reimbursement for generation deficit of Santa Clara Complex (-R$ 4 million).
SHPPs Source and Holding Company:
· Increase of R$ 22 million in revenue from SHPPs, chiefly due to the different strategy of seasonal adjustment of physical guarantee in the agreements between the periods and the adjustments in agreements (R$ 19 million), as well as the higher volume of secondary energy in the MRE( R$ 3 million)
· Increase of R$ 6 million in the Holding Company’s revenue due to intercompany hedge and swap operations settled at the PLD price in 2Q19, while in 2Q18 these operations mitigated the effect of exposure of wind farms that were selling energy in the MCSD (flat seasonality).
Biomass Source:
· Increase of R$ 3 million in biomass revenue due to the strategy of contract seasonalization and higher generation at some plants (R$ 8 million), which was partially offset by lower energy settlement to rebuild guarantees and hedge in 2Q19 (-R$ 4 million), with corresponding energy purchase costs.
| 2Q19 Results | August 13, 2019 |
11.4.1.2) Cost of Electric Power
In 2Q19, cost of electric power totaled R$ 66 million, representing a reduction of 19.1% (-R$ 16 million). In 1H19, cost of electric power totaled R$ 120 million, a decrease of 21.5% compared to 1H18.
Energy purchase cost totaled R$ 42 million in 2Q19, a reduction of 37.3% (-R$ 25 million). In 1H19, there was a decrease of 36.8% in the energy purchase cost (-R$ 41 million). These results were mainly influenced by the lower energy volume purchased for hedge operations and energy deficits at wind farms that participated in the MCSD due to flat seasonality in 2018 and lower GSF in the periods.
Cost of system use fees totaled R$ 25 million in 2Q19, an increase of 60.0% (R$ 9 million), mainly due to the positive effect of the recovery of PIS and Cofins credits in 2018, which was partially offset by price adjustments in connection charges, as well as the distribution and transmission system use and connection tariffs. In 1H19 there was an increase of 21.3% (R$ 9 million).
11.4.1.3) Operating Costs and Expenses
Operating Costs and Expenses reached R$ 256 million in 2Q19, compared to R$ 232 million in 2Q18, representing an increase of 10.3% (R$ 24 million). In 1H19, there was an increase of 6.4%, reaching R$ 505 million (R$ 30 million).
The factors that explain these variations follow:
PMSO
PMSO (R$ million) | | | | |
| 2Q19 | 2Q18 | Variation | 0 | 1H18 | Variation |
| R$ MM | % | R$ MM | % |
Reported PMSO | | | | | | | | |
Personnel | (27) | (26) | (1) | 3.3% | (54) | (51) | (2) | 4.5% |
Material | (4) | (7) | 3 | -47.8% | (8) | (17) | 9 | -53.0% |
Outsourced Services | (51) | (34) | (17) | 50.3% | (97) | (77) | (20) | 25.9% |
Other Operating Costs/Expenses | (12) | (10) | (2) | 21.8% | (25) | (18) | (7) | 39.6% |
GSF Risk Premium | (1) | (1) | 1 | -50.0% | (1) | (2) | 1 | -50.0% |
Others | (11) | (9) | (3) | 31.8% | (24) | (15) | (8) | 53.6% |
Total PMSO | (94) | (77) | (17) | 21.7% | (183) | (163) | (20) | 12.5% |
The PMSO item reached R$ 94 million in 2Q19, compared to R$ 77 million in 2Q18, an increase of 21.7% (R$ 17 million). In 1H19, the PMSO had an increase of 12.5% (R$ 20 million), This performance is mainly due to the positive effect of the recovery of PIS and Cofins credits in 2018 and price adjustments on agreements with O&M suppliers of wind turbines at Campo dos Ventos and São Benedito wind complexes after the end of the partial grace period in the initial years of operation.
Other operating costs and expenses
Other operating costs and expenses, represented by Depreciation and Amortization accounts, reached R$ 162 million in 2Q19, increase of 4.6% (R$ 7 million) and an increase in 1H19 of 3.2%.(R$ 10 million). These increases are explained by the operational startup of SHPP Boa Vista II in November 2018 and the effect of the unitization of the Pedra Cheirosa wind complex in July 2018.
| 2Q19 Results | August 13, 2019 |
11.4.1.4) EBITDA
In 2Q19, EBITDA was of R$ 251 million, compared to R$ 256 million in 2Q18, a reduction of 1.9% (-R$ 5 million). This result is mainly due to lower net revenue from wind farms, end grace period from the contract of O&M by ACL wind farm andto the recovery of PIS/Cofins credits in 2Q18.These factors were partially offset by higher revenue SHPs due to the different seasonal strategy of physical guaranteeof contracts between periods and readjustment of contracts; and lower GSF expense.
In 1H19, there was a reduction of 8.4% (-R$ 41 million). This result is mainly due to lower net revenue from wind farms.
Conciliation of Net Income and EBITDA (R$ million) | | | |
| 2Q19 | 2Q18 | Var. | 1H19 | 1H18 | Var. |
Net income | (38) | (37) | 5.4% | (132) | (109) | 20.6% |
Amortization | (162) | (154) | | (322) | (312) | |
Financial Results | (111) | (119) | | (223) | (248) | |
Income Tax /Social Contribution | (17) | (19) | | (29) | (32) | |
EBITDA | 251 | 256 | -1.9% | 443 | 484 | -8.4% |
11.4.1.5) Financial Result
Financial Result (Adjusted - R$ Million) |
| 2Q19 | 2Q18 | Var. | 1H19 | 1H18 | Var. |
Revenues | 50 | 30 | 68.0% | 99 | 60 | 64.6% |
Expenses | (161) | (149) | -8.3% | (322) | (308) | 4.3% |
Financial Result | (111) | (119) | -6.7% | (223) | (248) | -10.2% |
In 2Q19, net financial result registered a net financial expense of R$ 111 million, a reduction of 6.7% (-R$ 8 million).
The main items that explain this variation are:
· Reduction of 11.5% (-R$ 13 million) of net debt;
· Increase of 114.5% (+R$ 2 million) insettlement by CCEE
In 1H19, net financial result registered a net financial expense of R$ 223 million, a reduction of 10.2% (-R$ 25 million).
The main items that explain this variation are:
· Reduction of 10.7% (-R$ 24 million) of net debt;
· Reduction of 27.9% (-R$ 2 million) insettlement by CCEE;
| 2Q19 Results | August 13, 2019 |
11.4.1.6) Net Income
In 2Q19, net loss was of R$ 38 million, compared to the net loss of R$ 37 million in 2Q18. 1H19, the net loss was of R$ 132 million. These performances reflect the lower EBITDA and higher financial result in the periods.
11.4.2) Status of Generation Projects – 100% Participation
On the date of this report, the portfolio of projects of CPFL Renováveis (100% participation) totaled 2,133 MW of operating installed capacity and 97 MW of capacity under construction. The operational power plants comprises 40 Small Hydroelectric Power Plants – SHPPs (453 MW), 45 wind farms (1,309 MW), 8 biomass thermoelectric power plants (370 MW) and 1 solar power plant (1 MW). Still under construction there are 1 SHPP (28 MW) and 4 wind farms (69 MW).
Additionally, CPFL Renováveis owns wind, solar and SHPP projects under development totaling 2,903 MW.
The table below illustrates the overall portfolio of assets (100% participation) in operation, construction and development, and its installed capacity on this date.
CPFL Renováveis - Portfolio (100% participation) |
In MW | SHPP | Biomass | Wind | Solar | Total |
Operating | 453 | 370 | 1,309 | 1 | 2,133 |
Under construction | 28 | - | 69 | - | 97 |
Under development | 149 | - | 2,415 | 340 | 2,903 |
Total | 630 | 370 | 3,792 | 341 | 5,134 |
Lucia Cherobim SHPP
The PCH Lucia Cherobim, project located in the State of Paraná, is scheduled to have its start-up in 2024. The installed capacity is of 28.0 MW and the physical guarantee is of 16.6 average-MW. Energy was sold through a long-term contract in the 2018 A-6 new energy auction (price: R$ 189.95/MWh – June 2018).
Wind Farmsof the Gameleira Complex
The wind farms of the Gameleira Complex (Costa das Dunas, Figueira Branca, Farol de Touros e Gameleira), located in the State of Rio Grande do Norte, is scheduled to have its start-up in 2024. The installed capacity is of 69.3 MW and the phusical guarantee is of 39.4 average-MW. Part of the energy (12.0 average-MW) was sold through a long-term contract it the 2018 A-6 new energy auction (price: R$ 89.89/MWh – June 2018).
| 2Q19 Results | August 13, 2019 |
12) ATTACHMENTS
12.1) Statement of Assets – CPFL Energia
(R$ thousands)

| | Consolidated |
ASSETS | 06/30/2019 | 12/31/2018 | 06/30/2018 |
| | | | |
CURRENT | | | |
Cash and Cash Equivalents | 6,981,505 | 1,891,457 | 2,490,235 |
Consumers, Concessionaries and Licensees | 4,599,139 | 4,547,951 | 4,545,631 |
Dividend and Interest on Equity | 94,353 | 100,182 | 153,187 |
Recoverable Taxes | 405,457 | 411,256 | 480,967 |
Derivatives | 204,125 | 309,484 | 449,475 |
Sectoral Financial Assets | 1,193,246 | 1,330,981 | 679,406 |
Concession Financial Assets | - | - | 23,241 |
Contractual Assets | 26,502 | 23,535 | - |
Other Credits | 628,045 | 787,470 | 849,752 |
TOTAL CURRENT | 14,132,373 | 9,402,316 | 9,671,894 |
| | | | |
NON-CURRENT | | | |
Consumers, Concessionaries and Licensees | 689,638 | 752,795 | 235,146 |
Judicial Deposits | 889,207 | 854,374 | 866,057 |
Recoverable Taxes | 422,337 | 253,691 | 233,474 |
Sectoral Financial Assets | 179,944 | 223,880 | 414,528 |
Derivatives | 377,061 | 347,507 | 370,585 |
Deferred Taxes | 928,067 | 956,380 | 825,862 |
Concession Financial Assets | 8,070,373 | 7,430,149 | 7,053,027 |
Investments at Cost | 116,654 | 116,654 | 116,654 |
Other Credits | 719,417 | 927,440 | 901,320 |
Investments | 1,038,754 | 980,362 | 906,115 |
Property, Plant and Equipment | 9,225,343 | 9,456,614 | 9,612,096 |
Contractual Assets | 1,344,423 | 1,046,433 | - |
Intangible | 9,298,719 | 9,462,935 | 10,501,494 |
TOTAL NON-CURRENT | 33,299,936 | 32,809,214 | 32,036,357 |
| | | | |
TOTAL ASSETS | 47,432,309 | 42,211,530 | 41,708,250 |
| 2Q19 Results | August 13, 2019 |
12.2) Statement of Liabilities – CPFL Energia
(R$ thousands)
| Consolidated |
LIABILITIES AND SHAREHOLDERS' EQUITY | 06/30/2019 | 12/31/2018 | 06/30/2018 |
| | | | |
CURRENT | | | |
Suppliers | 2,725,984 | 2,398,085 | 3,229,917 |
Loans and Financing | 2,566,905 | 2,446,113 | 3,011,598 |
Debentures | 652,074 | 917,352 | 1,385,146 |
Employee Pension Plans | 133,557 | 86,623 | 69,132 |
Regulatory Charges | 161,283 | 150,656 | 286,858 |
Taxes, Fees and Contributions | 856,520 | 765,438 | 470,759 |
Dividend and Interest on Equity | 532,295 | 532,608 | 37,105 |
Accrued Liabilities | 156,881 | 119,252 | 150,597 |
Derivatives | 6,883 | 8,139 | 11,314 |
Sectoral Financial Liabilities | - | - | 394 |
Public Utilities | 6,104 | 11,570 | 11,179 |
Other Accounts Payable | 1,137,104 | 979,296 | 1,049,723 |
TOTAL CURRENT | 8,935,592 | 8,415,132 | 9,713,721 |
| | | | |
NON-CURRENT | | | |
Suppliers | 330,302 | 333,036 | 135,370 |
Loans and Financing | 8,549,968 | 8,989,846 | 7,657,213 |
Debentures | 8,263,067 | 8,023,493 | 8,591,981 |
Employee Pension Plans | 1,107,738 | 1,156,639 | 870,298 |
Taxes, Fees and Contributions | 4,353 | 9,691 | 14,768 |
Deferred Taxes | 1,095,818 | 1,136,227 | 1,276,832 |
Reserve for Tax, Civil and Labor Risks | 978,819 | 979,360 | 949,408 |
Derivatives | 14,070 | 23,659 | 1,443 |
Sectoral Financial Liabilities | 120,373 | 46,703 | - |
Public Utilities | 96,647 | 89,965 | 86,561 |
Other Accounts Payable | 634,525 | 475,396 | 469,910 |
TOTAL NON-CURRENT | 21,195,681 | 21,264,015 | 20,053,785 |
| | | | |
SHAREHOLDERS' EQUITY | | | |
Capital | 9,389,657 | 5,741,284 | 5,741,284 |
Capital Reserve | 393,959 | 469,257 | 468,018 |
Legal Reserve | 900,992 | 900,992 | 798,090 |
Statutory Reserve - Concession Financial Assets | - | - | - |
Statutory Reserve - Strengthening of Working Capital | 3,527,510 | 3,527,510 | 1,292,046 |
Other Comprehensive Income | (396,793) | (376,294) | (160,056) |
Retained Earnings | 1,196,597 | - | 1,656,377 |
| | 15,011,923 | 10,262,749 | 9,795,759 |
Non-Controlling Shareholders' Interest | 2,289,113 | 2,269,634 | 2,144,986 |
TOTAL SHAREHOLDERS' EQUITY | 17,301,036 | 12,532,383 | 11,940,745 |
| | | | |
TOTAL LIABILITIES AND SHAREHOLDERS' EQUITY | 47,432,309 | 42,211,530 | 41,708,250 |
| 2Q19 Results | August 13, 2019 |
12.3) Income Statement – CPFL Energia
(R$ thousands)
Consolidated |
| | 2Q19 | 2Q18 | Variation | | 1H19 | 1H18 | Variation |
OPERATING REVENUES | | | | | | | | |
Electricity Sales to Final Customers | | 7,527,618 | 6,909,773 | 8.9% | | 15,537,512 | 13,657,216 | 13.8% |
Electricity Sales to Distributors | | 1,316,478 | 1,317,495 | -0.1% | | 2,668,969 | 2,315,954 | 15.2% |
Revenue from building the infrastructure | | 511,367 | 370,053 | 38.2% | | 926,580 | 740,615 | 25.1% |
Update of concession's financial asset | | 108,297 | 138,552 | -21.8% | | 172,787 | 203,409 | -15.1% |
Sectorial financial assets and liabilities | | 21,055 | 480,699 | -95.6% | | (302,825) | 854,246 | - |
Other Operating Revenues | | 1,319,216 | 1,284,344 | 2.7% | | 2,588,763 | 2,366,973 | 9.4% |
| | | 10,804,030 | 10,500,917 | 2.9% | | 21,591,785 | 20,138,414 | 7.2% |
| | | | | | | | | |
DEDUCTIONS FROM OPERATING REVENUES | | (3,767,724) | (3,555,551) | 6.0% | | (7,428,033) | (6,818,393) | 8.9% |
NET OPERATING REVENUES | | 7,036,306 | 6,945,366 | 1.3% | | 14,163,752 | 13,320,021 | 6.3% |
| | | | | | | | | |
COST OF ELECTRIC ENERGY SERVICES | | | | | | | | |
Electricity Purchased for Resale | | (3,606,485) | (3,862,633) | -6.6% | | (7,559,027) | (7,163,909) | 5.5% |
Electricity Network Usage Charges | | (662,126) | (675,403) | -2.0% | | (1,193,346) | (1,387,849) | -14.0% |
| | | (4,268,610) | (4,538,036) | -5.9% | | (8,752,373) | (8,551,758) | 2.3% |
OPERATING COSTS AND EXPENSES | | | | | | | | |
Personnel | | (365,768) | (352,388) | 3.8% | | (713,786) | (690,133) | 3.4% |
Material | | (66,140) | (63,358) | 4.4% | | (132,997) | (125,979) | 5.6% |
Outsourced Services | | (178,448) | (155,722) | 14.6% | | (343,458) | (336,654) | 2.0% |
Other Operating Costs/Expenses | | (203,162) | (142,718) | 42.4% | | (378,422) | (248,540) | 52.3% |
Allowance for Doubtful Accounts | | (65,236) | (41,822) | 56.0% | | (133,850) | (68,242) | 96.1% |
Legal and judicial expenses | | (38,937) | (31,467) | 23.7% | | (70,975) | (43,751) | 62.2% |
Others | | (98,989) | (69,429) | 42.6% | | (173,596) | (136,547) | 27.1% |
Cost of building the infrastructure | | (511,323) | (370,047) | 38.2% | | (926,534) | (740,606) | 25.1% |
Employee Pension Plans | | (28,151) | (22,477) | 25.2% | | (56,302) | (44,955) | 25.2% |
Depreciation and Amortization | | (336,070) | (342,493) | -1.9% | | (668,401) | (661,169) | 1.1% |
Amortization of Concession's Intangible | | (72,109) | (71,287) | 1.2% | | (144,219) | (142,795) | 1.0% |
| | | (1,761,172) | (1,520,490) | 15.8% | | (3,364,118) | (2,990,831) | 12.5% |
| | | | | | | | | |
EBITDA1 | | 1,504,503 | 1,369,511 | 9.9% | | 3,035,600 | 2,735,788 | 11.0% |
| | | | | | | | | |
INCOME FROM ELECTRIC ENERGY SERVICE | | 1,006,524 | 886,840 | 13.5% | | 2,047,260 | 1,777,432 | 15.2% |
| | | | | | | | | |
FINANCIAL REVENUES (EXPENSES) | | | | | | | | |
Financial Revenues | | 231,337 | 169,078 | 36.8% | | 437,932 | 366,230 | 19.6% |
Financial Expenses | | (442,661) | (414,752) | 6.7% | | (869,296) | (919,423) | -5.5% |
| | | (211,324) | (245,674) | -14.0% | | (431,364) | (553,193) | -22.0% |
| | | | | | | | | |
EQUITY ACCOUNTING | | | | | | | | |
Equity Accounting | | 89,799 | 68,891 | 30.3% | | 175,719 | 154,392 | 13.8% |
Assets Surplus Value Amortization | | (145) | (145) | 0.0% | | (290) | (290) | 0.0% |
| | | 89,654 | 68,746 | 30.4% | | 175,430 | 154,102 | 13.8% |
| | | | | | | | | |
INCOME BEFORE TAXES ON INCOME | | 884,854 | 709,913 | 24.6% | | 1,791,326 | 1,378,341 | 30.0% |
| | | | | | | | | |
Social Contribution | | (84,028) | (69,844) | 20.3% | | (174,078) | (136,712) | 27.3% |
Income Tax | | (227,153) | (189,892) | 19.6% | | (473,217) | (372,047) | 27.2% |
| | | | | | | | |
NET INCOME | | 573,673 | 450,177 | 27.4% | | 1,144,031 | 869,581 | 31.6% |
Controlling Shareholders' Interest | | 580,629 | 455,714 | 27.4% | | 1,184,079 | 899,497 | 31.6% |
Non-Controlling Shareholders' Interest | | (6,956) | (5,537) | 25.6% | | (40,049) | (29,915) | 33.9% |
Note:
(1) EBITDA is calculated from the sum of net income, taxes, financial result and depreciation/amortization, according to CVM Instruction no. 527/12.
| 2Q19 Results | August 13, 2019 |
12.4) Cash Flow – CPFL Energia
(R$ thousands)
Consolidated |
| | | | | |
| | | 2Q19 | | Last 12M |
| | | | | |
Beginning Balance | | 3,440,810 | | 2,490,235 |
| | | | | |
Net Income Before Taxes | | 884,854 | | 3,352,962 |
| | | | | |
Depreciation and Amortization | | 408,181 | | 1,602,720 |
Interest on Debts and Monetary and Foreign Exchange Restatements | | 224,170 | | 1,022,321 |
Consumers, Concessionaries and Licensees | | 38,433 | | (757,649) |
Sectoral Financial Assets | | 87,278 | | (77,306) |
Accounts Receivable - Resources Provided by the CDE/CCEE | | 34,420 | | 50,609 |
Suppliers | | (423,434) | | (463,695) |
Sectoral Financial Liabilities | | (108,333) | | 26,460 |
Accounts Payable - CDE | | 17,527 | | 85,760 |
Interest on Debts and Debentures Paid | | (308,161) | | (1,267,172) |
Income Tax and Social Contribution Paid | | (216,503) | | (983,789) |
Others | | 301,108 | | 732,812 |
| | | 54,686 | | (28,929) |
| | | | | |
Total Operating Activities | | 939,540 | | 3,324,033 |
| | | | | |
Investment Activities | | | | |
Purchases of Contract Asset, Property, Plant and Equipment and Intangible Assets | | (520,572) | | (2,180,903) |
Others | | (10,572) | | 289,750 |
Total Investment Activities | | (531,144) | | (1,891,153) |
| | | | | |
Financing Activities | | | | |
Capital Increase of Noncontrolling Shareholder | | 3,624,689 | | 3,632,668 |
Loans and Debentures | | 3,632,128 | | 7,655,975 |
Principal Amortization of Loans and Debentures, Net of Derivatives | | (4,112,121) | | (8,202,193) |
Dividend and Interest on Equity Paid | | (12,409) | | (28,072) |
Others | | 12 | | 12 |
Total Financing Activities | | 3,132,299 | | 3,058,390 |
| | | | | |
| | | | | |
Cash Flow Generation | | 3,540,695 | | 4,491,270 |
| | | | | |
Ending Balance - 06/30/2019 | | 6,981,505 | | 6,981,505 |
| 2Q19 Results | August 13, 2019 |
12.5) Income Statement – Conventional Generation Segment
(R$ thousands)

Conventional Generation |
| 2Q19 | 2Q18 | Var. | 1H19 | 1H18 | Var. |
OPERATING REVENUE | | | | | | |
Eletricity Sales to Distributors | 311,394 | 290,266 | 7.3% | 599,668 | 575,444 | 4.2% |
Revenue from construction of concession infrastructure | 582 | 171 | 239.7% | 637 | 256 | 149.1% |
Other Operating Revenues | 19,958 | 6,671 | 199.2% | 32,446 | 29,371 | 10.5% |
| 331,934 | 297,108 | 11.7% | 632,750 | 605,071 | 4.6% |
| | | | | | |
DEDUCTIONS FROM OPERATING REVENUE | (34,279) | (26,595) | 28.9% | (65,635) | (53,103) | 23.6% |
NET OPERATING REVENUE | 297,655 | 270,513 | 10.0% | 567,115 | 551,968 | 2.7% |
| | | | | | |
COST OF ELETRIC ENERGY SERVICES | | | | | | |
Eletricity Purchased for Resale | (21,921) | (9,985) | 119.5% | (44,332) | (21,705) | 104.3% |
Eletricity Network Usage Charges | (6,873) | (6,899) | -0.4% | (13,662) | (13,729) | -0.5% |
| (28,794) | (16,884) | 70.5% | (57,994) | (35,434) | 63.7% |
OPERATING COSTS AND EXPENSES | | | | | | |
Personnel | (8,837) | (8,598) | 2.8% | (16,716) | (17,376) | -3.8% |
Material | (800) | (611) | 31.0% | (1,689) | (1,294) | 30.5% |
Outsourced Services | (6,698) | (5,630) | 19.0% | (12,335) | (10,481) | 17.7% |
Other Operating Costs/Expenses | (7,469) | (8,395) | -11.0% | (14,829) | (16,858) | -12.0% |
Costs of infrastructure construction | (537) | (165) | 225.6% | (590) | (246) | 139.6% |
Employee Pension Plans | (473) | (388) | 21.9% | (946) | (777) | 21.8% |
Depreciation and Amortization | (27,278) | (27,632) | -1.3% | (54,489) | (55,287) | -1.4% |
Amortization of Concession's Intangible | (2,492) | (2,492) | 0.0% | (4,983) | (4,983) | 0.0% |
| (54,585) | (53,910) | 1.3% | (106,577) | (107,302) | -0.7% |
| | | | | | |
EBITDA | 333,845 | 298,733 | 11.8% | 637,736 | 623,894 | 2.2% |
| | | | | | |
EBIT | 214,277 | 199,719 | 7.3% | 402,544 | 409,232 | -1.6% |
| | | | | | |
FINANCIAL INCOME (EXPENSE) | | | | | | |
Financial Income | 13,142 | 16,147 | -18.6% | 23,229 | 36,609 | -36.5% |
Financial Expenses | (52,024) | (91,110) | -42.9% | (106,150) | (179,439) | -40.8% |
| (38,881) | (74,964) | -48.1% | (82,921) | (142,829) | -41.9% |
| | | | | | |
EQUITY ACCOUNTING | | | | | | |
Equity Accounting | 89,799 | 68,891 | 30.3% | 175,719 | 154,392 | 13.8% |
Assets Surplus Value Amortization | (145) | (145) | 0.0% | (290) | (290) | 0.0% |
| 89,654 | 68,746 | 30.4% | 175,430 | 154,102 | 13.8% |
| | | | | | |
INCOME BEFORE TAXES ON INCOME | 265,049 | 193,502 | 37.0% | 495,052 | 420,505 | 17.7% |
| | | | | | |
Social Contribution | (15,183) | (10,191) | 49.0% | (27,296) | (22,170) | 23.1% |
Income Tax | (41,906) | (28,140) | 48.9% | (75,427) | (61,284) | 23.1% |
| | | | | | | |
NET INCOME (LOSS) | 207,961 | 155,171 | 34.0% | 392,329 | 337,051 | 16.4% |
Note:
(1) EBITDA (IFRS) is calculated from the sum of net income, taxes, financial result and depreciation/amortization, as CVM Instruction no. 527/12.
| 2Q19 Results | August 13, 2019 |
12.6) Income Statement – CPFL Renováveis
(R$ thousands)

Consolidated - 100% Participation |
| 2Q19 | 2Q18 | Var. | Var. % | 1H19 | 1H18 | Var. | Var. % |
OPERATING REVENUES | | | | | | | | |
Eletricity Sales to Final Consumers | 5,596 | 5,501 | 95 | 1.7% | 11,420 | 11,307 | 112 | 1.0% |
Eletricity Sales to Distributors | 428,303 | 431,114 | (2,811) | -0.7% | 773,279 | 829,881 | (56,602) | -6.8% |
Other Operating Revenues | 391 | 827 | (437) | -52.8% | 3,202 | 1,771 | 1,431 | 80.8% |
| 434,289 | 437,442 | (3,153) | -0.7% | 787,900 | 842,959 | (55,059) | -6.5% |
| | | | | | | | |
DEDUCTIONS FROM OPERATING REVENUES | (22,993) | (22,411) | (582) | 2.6% | (42,415) | (44,375) | 1,960 | -4.4% |
NET OPERATING REVENUES | 411,297 | 415,031 | (3,735) | -0.9% | 745,486 | 798,584 | (53,098) | -6.6% |
| | | | | | | | |
COST OF ELETRIC ENERGY SERVICES | | | | | | | | |
Eletricity Purchased for Resale | (41,776) | (66,623) | 24,847 | -37.3% | (71,020) | (112,388) | 41,369 | -36.8% |
Eletricity Network Usage Charges | (24,563) | (15,356) | (9,207) | 60.0% | (48,590) | (40,056) | (8,534) | 21.3% |
| (66,339) | (81,979) | 15,640 | -19.1% | (119,610) | (152,444) | 32,834 | -21.5% |
OPERATING COSTS AND EXPENSES | | | | | | | | |
Personnel | (27,145) | (26,277) | (868) | 3.3% | (53,519) | (51,238) | (2,282) | 4.5% |
Material | (3,706) | (7,096) | 3,390 | -47.8% | (7,892) | (16,784) | 8,893 | -53.0% |
Outsourced Services | (51,204) | (34,057) | (17,147) | 50.3% | (96,675) | (76,763) | (19,912) | 25.9% |
Other Operating Costs/Expenses | (12,019) | (9,865) | (2,154) | 21.8% | (24,866) | (17,811) | (7,055) | 39.6% |
Depreciation and Amortization | (121,805) | (115,502) | (6,303) | 5.5% | (242,579) | (233,983) | (8,595) | 3.7% |
Amortization of Concession's Intangible | (39,807) | (38,984) | (823) | 2.1% | (79,614) | (78,190) | (1,424) | 1.8% |
| (255,686) | (231,781) | (23,904) | 10.3% | (505,144) | (474,769) | (30,375) | 6.4% |
| | | | | | | | |
EBITDA1 | 250,884 | 255,758 | (4,874) | -1.9% | 442,924 | 483,544 | (40,620) | -8.4% |
| | | | | | | | |
EBIT | 89,272 | 101,272 | (11,999) | -11.8% | 120,732 | 171,371 | (50,639) | -29.5% |
| | | | | | | | |
FINANCIAL INCOME (EXPENSE) | | | | | | | | |
Financial Income | 50,196 | 29,873 | 20,324 | 68.0% | 98,787 | 60,012 | 38,774 | 64.6% |
Financial Expenses | (161,370) | (148,991) | (12,379) | 8.3% | (321,666) | (308,345) | (13,321) | 4.3% |
| (111,174) | (119,119) | 7,945 | -6.7% | (222,880) | (248,333) | 25,453 | -10.2% |
| | | | | | | | |
INCOME BEFORE TAXES ON INCOME | (21,902) | (17,847) | (4,054) | 22.7% | (102,148) | (76,962) | (25,185) | 32.7% |
| | | | | | | | |
Social Contribution | (5,474) | (6,262) | 788 | -12.6% | (9,751) | (10,880) | 1,129 | - |
Income Tax | (11,122) | (12,431) | 1,309 | -10.5% | (19,622) | (21,219) | 1,597 | - |
| | | | | | | | |
NET INCOME | (38,498) | (36,541) | (1,957) | 5.4% | (131,521) | (109,061) | (22,459) | 20.6% |
Note:
(1) EBITDA (IFRS) is calculated from the sum of net income, taxes, financial result and depreciation/amortization, as CVM Instruction no. 527/12.
| 2Q19 Results | August 13, 2019 |
12.7) Income Statement – Distribution Segment
(R$ thousands)

Consolidated |
| | 2Q19 | 2Q18 | Variation | | 1H19 | 1H18 | Variation |
OPERATING REVENUE | | | | | | | | |
Electricity Sales to Final Customers | | 6,989,937 | 6,429,785 | 8.7% | | 14,496,462 | 12,711,164 | 14.0% |
Electricity Sales to Distributors | | 479,891 | 371,901 | 29.0% | | 1,040,005 | 574,824 | 80.9% |
Revenue from building the infrastructure | | 510,785 | 369,882 | 38.1% | | 925,944 | 740,360 | 25.1% |
Adjustments to the concession´s financial asset | | 108,297 | 138,552 | -21.8% | | 172,787 | 203,409 | -15.1% |
Sectoral financial assets and liabilities | | 21,055 | 480,699 | -95.6% | | (302,825) | 854,246 | - |
Other Operating Revenues | | 1,266,397 | 1,260,290 | 0.5% | | 2,490,183 | 2,296,547 | 8.4% |
| | 9,376,362 | 9,051,109 | 3.6% | | 18,822,556 | 17,380,549 | 8.3% |
| | | | | | | | |
DEDUCTIONS FROM OPERATING REVENUE | | (3,609,963) | (3,409,928) | 5.9% | | (7,119,930) | (6,538,609) | 8.9% |
NET OPERATING REVENUE | | 5,766,399 | 5,641,181 | 2.2% | | 11,702,625 | 10,841,940 | 7.9% |
| | | | | | | | |
COST OF ELECTRIC ENERGY SERVICES | | | | | | | | |
Electricity Purchased for Resale | | (3,027,897) | (3,213,444) | -5.8% | | (6,398,131) | (5,976,970) | 7.0% |
Electricity Network Usage Charges | | (637,948) | (659,937) | -3.3% | | (1,144,915) | (1,347,286) | -15.0% |
| | (3,665,844) | (3,873,382) | -5.4% | | (7,543,046) | (7,324,255) | 3.0% |
OPERATING COSTS AND EXPENSES | | | | | | | | |
Personnel | | (242,327) | (230,639) | 5.1% | | (468,674) | (454,758) | 3.1% |
Material | | (44,492) | (41,933) | 6.1% | | (90,202) | (81,774) | 10.3% |
Outsourced Services | | (219,825) | (209,847) | 4.8% | | (426,514) | (416,328) | 2.4% |
Other Operating Costs/Expenses | | (182,077) | (125,894) | 44.6% | | (339,936) | (220,395) | 54.2% |
Allowance for Doubtful Accounts | | (64,309) | (41,834) | 53.7% | | (132,433) | (68,044) | 94.6% |
Legal and Judicial Expenses | | (37,968) | (29,909) | 26.9% | | (68,429) | (40,384) | 69.4% |
Others | | (79,800) | (54,151) | 47.4% | | (139,074) | (111,967) | 24.2% |
Cost of building the infrastructure | | (510,785) | (369,882) | 38.1% | | (925,944) | (740,360) | 25.1% |
Employee Pension Plans | | (27,678) | (22,089) | 25.3% | | (55,356) | (44,178) | 25.3% |
Depreciation and Amortization | | (180,264) | (193,096) | -6.6% | | (358,135) | (359,468) | -0.4% |
Amortization of Concession's Intangible | | (14,133) | (14,133) | 0.0% | | (28,266) | (28,266) | 0.0% |
| | | (1,421,581) | (1,207,514) | 17.7% | | (2,693,025) | (2,345,526) | 14.8% |
| | | | | | | | | |
EBITDA1 | | 873,370 | 767,515 | 13.8% | | 1,852,955 | 1,559,892 | 18.8% |
| | | | | | | | | |
EBIT | | 678,973 | 560,286 | 21.2% | | 1,466,554 | 1,172,159 | 25.1% |
| | | | | | | | | |
FINANCIAL INCOME (EXPENSE) | | | | | | | | |
Financial Income | | 147,983 | 122,226 | 21.1% | | 293,158 | 258,664 | 13.3% |
Financial Expenses | | (219,612) | (168,838) | 30.1% | | (424,319) | (409,983) | 3.5% |
Interest on Equity | | | | | | | | |
| | | (71,630) | (46,612) | 53.7% | | (131,161) | (151,319) | -13.3% |
| | | | | | | | | |
INCOME BEFORE TAXES ON INCOME | | 607,344 | 513,674 | 18.2% | | 1,335,393 | 1,020,839 | 30.8% |
| | | | | | | | | |
Social Contribution | | (59,250) | (50,355) | 17.7% | | (129,701) | (100,238) | 29.4% |
Income Tax | | (161,054) | (139,642) | 15.3% | | (353,572) | (276,369) | 27.9% |
| | | | | | | | | |
NET INCOME | | 387,039 | 323,678 | 19.6% | | 852,120 | 644,232 | 32.3% |
Note:
(1) EBITDA (IFRS) is calculated from the sum of net income, taxes, financial result and depreciation/amortization, as CVM Instruction no. 527/12.
| 2Q19 Results | August 13, 2019 |
12.8) Economic-Financial Performance by Distributor
(R$ thousands)
Summary of Income Statement by Distribution Company (R$ Thousands) |
| | | | | | | |
CPFL PAULISTA |
| 2Q19 | 2Q18 | Var. | 1H19 | 1H18 | Var. |
Gross Operating Revenue | 4,112,125 | 3,972,508 | 3.5% | 8,094,519 | 7,476,769 | 8.3% |
Net Operating Revenue | 2,561,594 | 2,495,498 | 2.6% | 5,087,160 | 4,698,072 | 8.3% |
Cost of Electric Power | (1,676,475) | (1,743,941) | -3.9% | (3,378,361) | (3,230,509) | 4.6% |
Operating Costs & Expenses | (570,059) | (493,542) | 15.5% | (1,083,029) | (955,244) | 13.4% |
EBIT | 315,060 | 258,014 | 22.1% | 625,770 | 512,319 | 22.1% |
EBITDA(1) | 380,118 | 332,134 | 14.4% | 754,368 | 646,496 | 16.7% |
Financial Income (Expense) | (20,959) | (2,386) | 778.2% | (39,608) | (34,920) | 13.4% |
Income Before Taxes | 294,101 | 255,628 | 15.1% | 586,162 | 477,399 | 22.8% |
Net Income | 188,854 | 162,096 | 16.5% | 376,319 | 303,142 | 24.1% |
| | | | | | | |
CPFL PIRATININGA |
| 2Q19 | 2Q18 | Var. | 1H19 | 1H18 | Var. |
Gross Operating Revenue | 1,702,178 | 1,618,895 | 5.1% | 3,494,537 | 3,139,416 | 11.3% |
Net Operating Revenue | 1,017,361 | 983,671 | 3.4% | 2,114,980 | 1,900,681 | 11.3% |
Cost of Electric Power | (696,875) | (708,937) | -1.7% | (1,457,217) | (1,343,760) | 8.4% |
Operating Costs & Expenses | (227,098) | (197,521) | 15.0% | (448,225) | (365,939) | 22.5% |
EBIT | 93,388 | 77,213 | 20.9% | 209,539 | 190,982 | 9.7% |
EBITDA(1) | 120,469 | 102,343 | 17.7% | 263,529 | 240,801 | 9.4% |
Financial Income (Expense) | (12,649) | 138 | -9271.9% | (22,597) | (24,508) | -7.8% |
Income Before Taxes | 80,739 | 77,350 | 4.4% | 186,942 | 166,474 | 12.3% |
Net Income | 51,348 | 48,180 | 6.6% | 118,839 | 104,288 | 14.0% |
| | | | | | | |
RGE |
| 2Q19 | 2Q18 | Var. | 1H19 | 1H18 | Var. |
Gross Operating Revenue | 3,124,003 | 3,038,975 | 2.8% | 6,378,523 | 5,957,257 | 7.1% |
Net Operating Revenue | 1,900,802 | 1,885,313 | 0.8% | 3,901,464 | 3,709,140 | 5.2% |
Cost of Electric Power | (1,130,266) | (1,246,388) | -9.3% | (2,375,887) | (2,426,977) | -2.1% |
Operating Costs & Expenses | (536,498) | (444,059) | 20.8% | (998,875) | (878,910) | 13.6% |
EBIT | 234,038 | 194,866 | 20.1% | 526,703 | 403,253 | 30.6% |
EBITDA(1) | 324,076 | 291,605 | 11.1% | 706,257 | 584,842 | 20.8% |
Financial Income (Expense) | (34,345) | (41,403) | -17.0% | (61,939) | (85,777) | -27.8% |
Income Before Taxes | 199,693 | 153,463 | 30.1% | 464,764 | 317,476 | 46.4% |
Net Income | 125,937 | 95,800 | 31.5% | 294,239 | 198,951 | 47.9% |
| | | | | | | |
CPFL SANTA CRUZ |
| 2Q19 | 2Q18 | Var. | 1H19 | 1H18 | Var. |
Gross Operating Revenue | 438,055 | 420,732 | 4.1% | 854,977 | 807,106 | 5.9% |
Net Operating Revenue | 286,641 | 276,701 | 3.6% | 599,020 | 534,047 | 12.2% |
Cost of Electric Power | (162,228) | (174,116) | -6.8% | (331,582) | (323,010) | 2.7% |
Operating Costs & Expenses | (87,925) | (72,391) | 21.5% | (162,897) | (145,433) | 12.0% |
EBIT | 36,488 | 30,194 | 20.8% | 104,542 | 65,605 | 59.4% |
EBITDA(1) | 48,707 | 41,433 | 17.6% | 128,801 | 87,753 | 46.8% |
Financial Income (Expense) | (3,677) | (2,961) | 24.2% | (7,017) | (6,114) | 14.8% |
Income Before Taxes | 32,810 | 27,233 | 20.5% | 97,525 | 59,490 | 63.9% |
Net Income | 20,900 | 17,601 | 18.7% | 62,723 | 37,851 | 65.7% |
Note:
(1) EBITDA (IFRS) is calculated from the sum of net income, taxes, financial result and depreciation/amortization.
| 2Q19 Results | August 13, 2019 |
12.9) Sales within the Concession Area by Distributor (In GWh)
CPFL Paulista |
| 2Q19 | 2Q18 | Var. | 1H19 | 1H18 | Var. |
Residential | 2,349 | 2,327 | 0.9% | 5,003 | 4,788 | 4.5% |
Industrial | 2,744 | 2,741 | 0.1% | 5,417 | 5,415 | 0.0% |
Commercial | 1,432 | 1,401 | 2.2% | 2,980 | 2,866 | 4.0% |
Others | 1,090 | 1,118 | -2.5% | 2,194 | 2,168 | 1.2% |
Total | 7,615 | 7,587 | 0.4% | 15,594 | 15,236 | 2.4% |
| | | | | | | |
CPFL Piratininga |
| 2Q19 | 2Q18 | Var. | 1H19 | 1H18 | Var. |
Residential | 967 | 975 | -0.9% | 2,101 | 2,017 | 4.2% |
Industrial | 1,569 | 1,662 | -5.6% | 3,072 | 3,263 | -5.9% |
Commercial | 636 | 625 | 1.7% | 1,333 | 1,277 | 4.4% |
Others | 325 | 304 | 6.8% | 658 | 595 | 10.6% |
Total | 3,496 | 3,567 | -2.0% | 7,164 | 7,152 | 0.2% |
| | | | | | | |
RGE |
| 2Q19 | 2Q18 | Var. | 1H19 | 1H18 | Var. |
Residential | 1,286 | 1,347 | -4.5% | 2,880 | 2,814 | 2.3% |
Industrial | 1,655 | 1,641 | 0.9% | 3,156 | 3,123 | 1.1% |
Commercial | 634 | 666 | -4.8% | 1,381 | 1,401 | -1.4% |
Others | 1,207 | 1,222 | -1.2% | 2,670 | 2,790 | -4.3% |
Total | 4,783 | 4,877 | -1.9% | 10,087 | 10,128 | -0.4% |
| | | | | | | |
CPFL Santa Cruz |
| 2Q19 | 2Q18 | Var. | 1H19 | 1H18 | Var. |
Residential | 199 | 200 | -0.3% | 420 | 402 | 4.6% |
Industrial | 267 | 247 | 8.4% | 533 | 484 | 10.2% |
Commercial | 90 | 88 | 3.2% | 192 | 180 | 6.2% |
Others | 176 | 190 | -7.5% | 366 | 356 | 2.7% |
Total | 732 | 724 | 1.2% | 1,511 | 1,422 | 6.2% |
| 2Q19 Results | August 13, 2019 |
12.10) Sales to the Captive Market by Distributor (in GWh)
CPFL Paulista |
| 2Q19 | 2Q18 | Var. | 1H19 | 1H18 | Var. |
Residential | 2,349 | 2,327 | 0.9% | 5,003 | 4,788 | 4.5% |
Industrial | 590 | 619 | -4.6% | 1,181 | 1,260 | -6.3% |
Commercial | 1,042 | 1,048 | -0.5% | 2,193 | 2,154 | 1.8% |
Others | 1,035 | 1,086 | -4.7% | 2,104 | 2,093 | 0.5% |
Total | 5,016 | 5,080 | -1.3% | 10,480 | 10,295 | 1.8% |
| | | | | | | |
CPFL Piratininga |
| 2Q19 | 2Q18 | Var. | 1H19 | 1H18 | Var. |
Residential | 967 | 975 | -0.9% | 2,101 | 2,017 | 4.2% |
Industrial | 255 | 283 | -10.1% | 514 | 570 | -9.9% |
Commercial | 446 | 447 | -0.1% | 953 | 923 | 3.2% |
Others | 280 | 261 | 7.4% | 569 | 512 | 11.3% |
Total | 1,947 | 1,966 | -0.9% | 4,137 | 4,022 | 2.9% |
| | | | | | | |
RGE |
| 2Q19 | 2Q18 | Var. | 1H19 | 1H18 | Var. |
Residential | 1,286 | 1,347 | -4.5% | 2,880 | 2,814 | 2.3% |
Industrial | 483 | 525 | -8.1% | 939 | 1,004 | -6.5% |
Commercial | 536 | 582 | -7.9% | 1,182 | 1,235 | -4.2% |
Others | 1,198 | 1,213 | -1.2% | 2,654 | 2,773 | -4.3% |
Total | 3,503 | 3,667 | -4.5% | 7,654 | 7,826 | -2.2% |
| | | | | | | |
CPFL Santa Cruz |
| 2Q19 | 2Q18 | Var. | 1H19 | 1H18 | Var. |
Residential | 199 | 200 | -0.3% | 420 | 402 | 4.6% |
Industrial | 97 | 101 | -4.1% | 194 | 199 | -2.8% |
Commercial | 84 | 82 | 1.9% | 178 | 169 | 5.0% |
Others | 175 | 190 | -7.7% | 365 | 356 | 2.5% |
Total | 555 | 573 | -3.1% | 1,157 | 1,126 | 2.7% |
| 2Q19 Results | August 13, 2019 |
12.11) Information on Interest in Companies
Energy distribution | Company Type | Equity Interest | Location (State) | Number of municipalities | Approximate number of consumers
(in thousands) | Concession term | End of the concession |
Companhia Paulista de Força e Luz ("CPFL Paulista") | Publicly-quoted corporation | Direct
100% | Countryside of São Paulo | 234 | 4,539 | 30 years | November 2027 |
Companhia Piratininga de Força e Luz ("CPFL Piratininga") | Publicly-quoted corporation | Direct
100% | Countryside and seaside of São Paulo | 27 | 1,773 | 30 years | October 2028 |
RGE Sul Distribuidora de Energia S.A. ("RGE") (a) | Publicly-quoted corporation | Direct and Indirect
100% | Countryside of Rio Grande do Sul | 381 | 2,904 | 30 years | November 2027 |
Companhia Jaguari de Energia ("CPFL Santa Cruz") | Private corporation | Direct
100% | Countryside of São Paulo, Paraná and Minas Gerais | 45 | 461 | 30 years | July 2045 |
Note:
(a) On December 31, 2018, was approved the grouping of the concessions of the distribution companies RGE Sul Distribuidora de Energia S.A. (“RGE Sul”) and Rio Grande Energia S.A. (“RGE”), considering RGE Sul as the Merging Company and RGE as the Merged Company;
Energy generation (conventional and renewable sources) | Company Type | Equity Interest | Location (State) | Number of plants / type of energy | Installed capacity |
Total | CPFL participation |
CPFL Geração de Energia S.A. ("CPFL Geração") | Publicly-quoted corporation | Direct
100% | São Paulo and Goiás | 3 Hydroelectric (b) | 1,295 | 678 |
CERAN - Companhia Energética Rio das Antas ("CERAN") | Private corporation | Indirect
65% | Rio Grande do Sul | 3 Hydroelectric | 360 | 234 |
Foz do Chapecó Energia S.A. ("Foz do Chapecó") | Private corporation | Indirect
51% (c) | Santa Catarina and
Rio Grande do Sul | 1 Hydroelectric | 855 | 436 |
Campos Novos Energia S.A. ("ENERCAN") | Private corporation | Indirect
48.72% | Santa Catarina | 1 Hydroelectric | 880 | 429 |
BAESA - Energética Barra Grande S.A. ("BAESA") | Publicly-quoted corporation | Indirect
25.01% | Santa Catarina and
Rio Grande do Sul | 1 Hydroelectric | 690 | 173 |
Centrais Elétricas da Paraíba S.A. ("EPASA") | Private corporation | Indirect
53.34% | Paraíba | 2 Thermoelectric | 342 | 182 |
Paulista Lajeado Energia S.A. ("Paulista Lajeado") | Private corporation | Indirect
59.93% (d) | Tocantins | 1 Hydroelectric | 903 | 38 |
CPFL Energias Renováveis S.A. ("CPFL Renováveis") | Publicly-quoted corporation | Indirect
51.56% | See chapter 11.4.2 | See chapter 11.4.2 | See chapter 11.4.2 | See chapter 11.4.2 |
CPFL Centrais Geradoras Ltda. ("CPFL Centrais Geradoras") | Limited company | Direct
100% | São Paulo and Minas Gerais | 6 MHPPs | 4 | 4 |
Transmission | Company Type | Core activity | Equity Interest |
CPFL Transmissão Piracicaba S.A. ("CPFL Piracicaba") | Privately-held corporation | Electric energy transmission services | Indirect 100% |
CPFL Transmissão Morro Agudo S.A. ("CPFL Morro Agudo") | Privately-held corporation | Electric energy transmission services | Indirect 100% |
CPFL Transmissão Maracanaú S.A. ("CPFL Maracanaú") | Privately-held corporation | Electric energy transmission services | Indirect 100% |
CPFL Transmissão Sul I S.A. ("CPFL Sul I") | Privately-held corporation | Electric energy transmission services | Indirect 100% |
CPFL Transmissão Sul II S.A. ("CPFL Sul II") | Privately-held corporation | Electric energy transmission services | Indirect 100% |
Notes:
(b) CPFL Geração holds 51.54% of the assured power and power of the Serra da Mesa HPP, whose concession belongs to Furnas. The Cariobinha HPP and the Carioba TPP projects are deactivated pending the position of the Ministry of Mines and Energy on the anticipated closure of its concession and are not included in the table;
(c) The joint venture Chapecoense fully consolidates the interim financial statements of its direct subsidiary, Foz de Chapecó;
(d) Paulista Lajeado has a 7% participation in the installed power of Investco S.A. (5.94% share of its capital).
| 2Q19 Results | August 13, 2019 |
Energy commercialization | Company Type | Core activity | Equity Interest |
CPFL Comercialização Brasil S.A. ("CPFL Brasil") | Private corporation | Energy commercialization | Direct
100% |
Clion Assessoria e Comercialização de Energia Elétrica Ltda. ("CPFL Meridional") | Limited company | Commercialization and provision of energy services | Indirect
100% |
CPFL Comercialização Cone Sul S.A. ("CPFL Cone Sul") | Private corporation | Energy commercialization | Indirect
100% |
CPFL Planalto Ltda. ("CPFL Planalto") | Limited company | Energy commercialization | Direct
100% |
CPFL Brasil Varejista S.A. ("CPFL Brasil Varejista") | Private corporation | Energy commercialization | Indirect
100% |
Services | Company Type | Core activity | Equity Interest |
CPFL Serviços, Equipamentos, Industria e Comércio S.A. ("CPFL Serviços") | Private corporation | Manufacturing, commercialization, rental and maintenance of electro-mechanical equipment and service provision | Direct
100% |
NECT Serviços Administrativos Ltda. ("Nect") | Limited company | Provision of administrative services | Direct
100% |
CPFL Atende Centro de Contatos e Atendimento Ltda. ("CPFL Atende") | Limited company | Provision of telephone answering services | Direct
100% |
CPFL Total Serviços Administrativos Ltda. ("CPFL Total") | Limited company | Billing and collection services | Direct
100% |
CPFL Eficiência Energética S.A. ("CPFL Eficiência") | Private corporation | Management in Energy Efficiency | Direct
100% |
TI Nect Serviços de Informática Ltda. ("Authi") | Limited company | IT services | Direct
100% |
CPFL GD S.A. ("CPFL GD") | Private corporation | Electric energy generation services | Indirect
100% |
Others | Company Type | Core activity | Equity Interest |
CPFL Jaguari de Geração de Energia Ltda. ("Jaguari Geração") | Limited company | Venture capital company | Direct
100% |
Chapecoense Geração S.A. ("Chapecoense") | Private corporation | Venture capital company | Indirect
51% |
Sul Geradora Participações S.A. ("Sul Geradora") | Private corporation | Venture capital company | Indirect
99.95% |
CPFL Telecom S.A. ("CPFL Telecom") | Private corporation | Telecommunication services | Direct
100% |
| 2Q19 Results | August 13, 2019 |
12.12) Reconciliation of Net Debt/EBITDA Pro Forma ratio of CPFL Energia for purposes of financial covenants calculation
(R$ million)
Net Debt Pro Forma Reconciliation (2Q19) |
| | | | | | | | | | | |
Net debt - Generation projects | | | | | | | | | | |
Jun-19 | Majority-controlled subsidiaries (fully consolidated) | Investees accounted for under the equity method | Total |
CERAN | CPFL Renováveis | Paulista Lajeado | Subtotal | ENERCAN | BAESA | Chapecoense | EPASA | Subtotal |
Borrowings and Debentures | 423 | 5,261 | - | 5,684 | 521 | - | 1,120 | 169 | 1,810 | 7,494 |
(-) Cash and Cash Equivalents | (74) | (682) | (20) | (775) | (73) | (21) | (223) | (53) | (370) | (1,146) |
Net Debt | 349 | 4,580 | (20) | 4,909 | 448 | (21) | 897 | 116 | 1,439 | 6,348 |
CPFL Stake (%) | 65.00% | 53.18% | 59.93% | - | 48.72% | 25.01% | 51.00% | 53.34% | - | - |
Net Debt in Generation Projects | 227 | 2,435 | (12) | 2,651 | 218 | (5) | 457 | 62 | 732 | 3,383 |
| | | | | | | | | | | |
Reconciliation | | | | | | | | | | |
CPFL Energia | | | | | | | | |
Gross Debt | 19,472 | | | | | | | | |
(-) Cash and Cash Equivalents | (6,982) | | | | | | | | |
Net Debt (IFRS) | 12,490 | | | | | | | | |
(-) Fully Consolidated Projects | (4,909) | | | | | | | | |
(+) Proportional Consolidation | 3,383 | | | | | | | | |
Net Debt (Pro Forma) | 10,964 | | | | | | | | |
| | | | | | | | | | | |
| | | | | | | | | | | |
EBITDA Pro Forma Reconciliation (2Q19 - LTM) |
| | | | | | | | | | | |
EBITDA - Generation Projects | | | | | | | | | | |
2Q19LTM | Majority-controlled subsidiaries (fully consolidated) | Investees accounted for under the equity method | Total |
CERAN | CPFL Renováveis | Paulista Lajeado | Subtotal | ENERCAN | BAESA | Chapecoense | EPASA | Subtotal |
Net operating revenue | 333 | 1,883 | 47 | 2,263 | 638 | 312 | 873 | 969 | 2,792 | 5,056 |
Operating cost and expense | (93) | (715) | (25) | (833) | (183) | (228) | (198) | (679) | (1,288) | (2,121) |
EBITDA | 240 | 1,168 | 22 | 1,430 | 455 | 84 | 675 | 291 | 1,504 | 2,934 |
CPFL stake (%) | 65.00% | 53.18% | 59.93% | - | 48.72% | 25.01% | 51.00% | 53.34% | - | - |
Proportional EBITDA | 156 | 621 | 13 | 790 | 222 | 21 | 344 | 155 | 742 | 1,532 |
| | | | | | | | | | | |
Reconciliation | | | | | | | | | | |
CPFL Energia - 2Q19 LTM | | | | | | | | |
Net income | 2,440 | | | | | | | | |
Amortization | 1,603 | | | | | | | | |
Financial Results | 981 | | | | | | | | |
Income Tax /Social Contribution | 913 | | | | | | | | |
EBITDA | 5,937 | | | | | | | | |
(-) Equity income | (356) | | | | | | | | |
(-) EBITDA - Fully consolidated projects | (1,430) | | | | | | | | |
(+) Proportional EBITDA | 1,532 | | | | | | | | |
EBITDA Pro Forma | 5,683 | | | | | | | | |
| | | | | | | | | | | |
Net Debt / EBITDA Pro Forma | 1,93x | | | | | | | | |
Note: in accordance with financial covenants calculation in cases of assets acquired by the Company.
Pursuant to the requirements of the Securities Exchange Act of 1934, the registrant has duly caused this report to be signed on its behalf by the undersigned, thereunto duly authorized.
Date: August 14, 2019
| CPFL ENERGIA S.A. |
|
| | By: | /S/ YueHui Pan
|
| | Name:
Title: | YueHui Pan
Chief Financial Officer and Head of Investor Relations |
FORWARD-LOOKING STATEMENTS
This press release may contain forward-looking statements. These statements are statements that are not historical facts, and are based on management's current view and estimates of future economic circumstances, industry conditions, company performance and financial results. The words "anticipates", "believes", "estimates", "expects", "plans" and similar expressions, as they relate to the company, are intended to identify forward-looking statements. Statements regarding the declaration or payment of dividends, the implementation of principal operating and financing strategies and capital expenditure plans, the direction of future operations and the factors or trends affecting financial condition, liquidity or results of operations are examples of forward-looking statements. Such statements reflect the current views of management and are subject to a number of risks and uncertainties. There is no guarantee that the expected events, trends or results will actually occur. The statements are based on many assumptions and factors, including general economic and market conditions, industry conditions, and operating factors. Any changes in such assumptions or factors could cause actual results to differ materially from current expectations.
