UNITED STATES
SECURITIES AND EXCHANGE COMMISSION
Washington, D.C. 20549
FORM N-CSR
CERTIFIED SHAREHOLDER REPORT OF REGISTERED
MANAGEMENT INVESTMENT COMPANIES
Investment Company Act file number 811-21624
Allianz Variable Insurance Products Fund of Funds Trust
(Exact name of registrant as specified in charter)
5701 Golden Hills Drive, Minneapolis, MN 55416-1297
(Address of principal executive offices) (Zip code)
Citi Fund Services Ohio, Inc., 4400 Easton Commons, Suite 200, Columbus, OH 43219-8000
(Name and address of agent for service)
Registrant’s telephone number, including area code: 800-624-0197
Date of fiscal year end: December 31
Date of reporting period: December 31, 2022
Item 1. Reports to Stockholders.
AZL® Balanced Index Strategy Fund
Annual Report
December 31, 2022

Management Discussion and Analysis
Page 1
Expense Examples and Portfolio Composition
Page 3
Schedule of Portfolio Investments
Page 4
Statement of Assets and Liabilities
Page 5
Page 5
Statements of Changes in Net Assets
Page 6
Page 7
Notes to the Financial Statements
Page 8
Report of Independent Registered Public Accounting Firm
Page 12
Other Federal Income Tax Information
Page 13
Page 14
Approval of Investment Advisory Agreement
Page 15
Information about the Board of Trustees and Officers
Page 18
This report is submitted for the general information of the shareholder of the Fund. The report is not authorized for distribution to prospective investors in the Fund unless preceded or accompanied by an effective prospectus, which contains details concerning the sales charges and other pertinent information.
AZL® Balanced Index Strategy Fund Review (Unaudited) |
What factors affected the Fund’s
performance during the year ended
December 31, 2022?*
For the year ended December 31, 2022, the AZL Balanced Index Strategy Fund (the “Fund”) returned (15.10)%. That compared to (18.11)%, (13.01)% and (15.39)% total return for its benchmarks, the S&P 500 Index, the Bloomberg U.S. Aggregate Bond Index, and the Balanced Composite Index, respectively.1
The AZL Balanced Index Strategy Fund is a fund of funds that pursues broad diversification across four underlying equity sub-portfolios and one fixed income sub-portfolio. The four equity sub-portfolios pursue passive strategies that aim to achieve, before fees, returns similar to the S&P 500 Index (S&P 500), the S&P MidCap 400 Index2, the S&P SmallCap 600 Index3, and the MSCI EAFE Index4.
The fixed-income sub-portfolio is an enhanced bond index strategy that seeks to achieve a return that exceeds that of the Bloomberg U.S. Aggregate Bond Index. Generally, the Fund allocates 40% to 60% of its assets to the underlying equity index funds and 40% to 60% of its assets to the underlying fixed income fund.
Domestic equities began the year at near all-time highs, but began to decline early in 2022 due to a combination of rising inflation and geopolitical uncertainties. The Federal Reserve (the Fed) shifted to a more hawkish policy approach in an attempt to bring inflation under control, as did many global central banks. The Fed increased the federal funds rate multiple times throughout the year for a combined total of 425 basis points. Russia’s invasion of Ukraine also weighed on global markets, although European countries were particularly hard hit due to their geographic proximity to the conflict and reliance on Russian commodities such as energy and wheat.
Despite strong labor rates throughout developed markets, high inflation and an anticipated economic slowdown had a negative effect on investor sentiment for the year under review. The S&P 500 declined as company valuations struggled under the higher interest rate environment. Investors grew risk averse as fears of an economic recession loomed, selling off equity positions to avoid the volatility in equity markets. By the end of the period under review, U.S. equities had experienced their worst year since the Great Financial Crisis of 2008, and international equities performed only slightly better.
The Fed’s actions made short-term financing more expensive, and the U.S. Treasury yield curve ultimately inverted with 2-year Treasuries yielding more than 10-year Treasuries by 0.55% at the end of 2022. The monetary tightening generated headwinds for domestic fixed income markets as investors demanded higher yields to account for rising rates. Widening credit spreads further weighed on prices on lower-quality bonds
as investors demanded to be compensated for rising credit risks. Nearly all fixed income sectors finished the year with negative performance.
The Fund, which invests in both U.S. and international markets, outperformed its blended benchmark during the 12-month period. Its off-benchmark allocation to developed market non- U.S. equities contributed to performance, as these outpaced U.S. equities. In addition, the Fund’s performance compared to the blended benchmark was positively affected by its allocation to mid- and small-cap U.S. equities, which outpaced their large-cap counterparts.
The fixed income allocation detracted slightly from the Fund’s performance compared to the benchmark largely due to the underlying fund’s fees. However, the Fund’s fixed income allocation benefited from security selection, particularly in mortgage-backed securities and investment grade credit. Allocation to Treasury Inflation Protected Securities (TIPS) also contributed to the Fund’s performance.
Past performance does not guarantee future results.
| * | The Fund’s portfolio composition is subject to change. There is no guarantee that any sectors mentioned will continue to perform as described or that securities in such sectors will be held by the Fund in the future. The information contained in this commentary is for informational purposes only and should not be construed as a recommendation to purchase or sell securities in the sector mentioned. The Fund’s holdings and weightings are as of December 31, 2022. |
| 1 | For a complete description of the Fund’s performance benchmark please refer to page 2 of this report. |
| 2 | The Standard & Poor’s MidCap 400 Index (“S&P 400”) is a widely used index for mid-sized companies. The S&P 400 covers 7% of the U.S. equities market, and is part of a series of S&P U.S. indexes that can be used as building blocks for portfolio composition. |
| 3 | The Standard & Poor’s SmallCap 600 Index (“S&P 600”) covers approximately 3% of the domestic equities market. Measuring the small-cap segment of the market that is typically renowned for poor trading liquidity and financial instability, the index is designed to be an efficient portfolio of companies that meet specific inclusion criteria to ensure that they are investable and financially viable. |
| 4 | The Morgan Stanley Capital International, Europe, Australasia and Far East (“MSCI EAFE”) Index is a free float-adjusted market capitalization-weighted index that is designed to measure the equity market performance of developed markets, excluding the U.S. & Canada. |
The indexes defined above are unmanaged. Investors cannot invest directly in an index.
1
| AZL® Balanced Index Strategy Fund Review (Unaudited) |
Fund Objective
The Fund’s investment objective is to seek long-term capital appreciation with preservation of capital as an important consideration. This objective may be changed by the Trustees of the Fund without shareholder approval. The Fund seeks to achieve its objective by investing in a combination of Index Strategy Underlying Funds that represent different classes in the Fund’s asset allocation.
Investment Concerns
The Fund invests in underlying funds, so its investment performance is directly related to the performance of those underlying funds. Before investing, investors should assess the risks associated with and types of investments made by each of the underlying funds in which the Fund invests.
Stocks are more volatile and carry more risk and return potential than other forms of investments.
International investing may involve risk of capital loss from unfavorable fluctuations in currency values, from differences in generally accepted accounting principles or from economic or political instability in other nations.
Small- to mid-capitalization companies typically have a higher risk of failure and historically have experienced a greater degree of volatility.
The performance of the underlying funds is expected to be lower than that of the Indexes because of fees and expenses. Securities in which the underlying funds will invest may involve substantial risk and may be subject to sudden severe price declines.
Investing in a single industry or sector, or concentrating investments in a limited number of industries or sectors, tends to increase the risk that economic, political, or regulatory developments affecting certain industries or sectors will have a large impact on the value of the portfolio.
Debt securities held by an underlying fund may decline in value due to rising interest rates.
Mortgage-backed investments involve risk of loss due to prepayments and, like any bond, due to default. Because of the sensitivity of mortgage-related securities to changes in interest rates, an underlying fund’s performance may be more volatile than if it did not hold these securities.
For a complete description of these and other risks associated with investing in the Fund, please refer to the Fund’s prospectus.
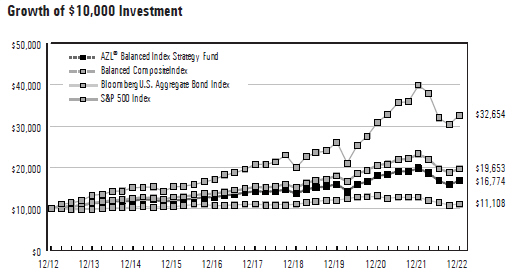
The chart above represents a comparison of a hypothetical investment in the Fund versus a similar investment in the Fund’s benchmarks and represents the reinvestment of dividends and capital gains in the Fund.
Average Annual Total Returns as of December 31, 2022
| 1 Year | 3 Years | 5 Years | 10 Years | |||||||||||||||||
AZL® Balanced Index Strategy Fund | (15.10 | )% | 1.60 | % | 3.29 | % | 5.31 | % | ||||||||||||
Balanced Composite Index | (15.39 | )% | 2.98 | % | 5.14 | % | 6.99 | % | ||||||||||||
Bloomberg U.S. Aggregate Bond Index | (13.01 | )% | (2.71 | )% | 0.02 | % | 1.06 | % | ||||||||||||
S&P 500 Total Return Index | (18.11 | )% | 7.66 | % | 9.42 | % | 12.56 | % | ||||||||||||
Past performance does not guarantee future results. The performance data quoted represents past performance and current returns may be lower or higher. The investment return and principal value will fluctuate so that an investor’s shares, when redeemed, may be worth more or less than the original cost. To obtain performance information current to the most recent month end, please visit www.Allianzlife.com.
| Expense Ratio | Gross | ||||
AZL® Balanced Index Strategy Fund | 0.69 | % | |||
The above expense ratio is based on the current Fund prospectus dated April 29, 2022. The Manager and the Fund have entered into a written contract limiting operating expenses, excluding certain expenses (such as interest expense and acquired fund fees and expenses), to 0.20% through April 30, 2024. Additional information pertaining to the December 31, 2022 expense ratio can be found in the Financial Highlights.
Acquired fund fees and expenses are incurred indirectly by the Fund through the valuation of the Fund’s investments in the permitted Underlying Funds. Accordingly, acquired fund fees and expenses affect the Fund’s total returns. Because these fees and expenses are not included in the Fund’s financial highlights, the Fund’s total annual fund operating expenses, as shown in the current prospectus, do not correlate to the ratios of expenses to average net assets shown in the Financial Highlights. Without acquired fund fees and expenses the Fund’s gross expense ratio would be 0.08%.
The total return of the Fund does not reflect the effect of any insurance charges, the annual maintenance fee or the deduction of taxes that a shareholder would pay on Fund distributions or the redemption of Fund shares. Such charges, fees and tax payments would reduce the performance quoted.
The Fund’s performance is measured against the Standard & Poor’s 500 Index (“S&P 500”), the Bloomberg U.S. Aggregate Bond Index and the Balanced Composite Index (“Composite”). The S&P 500 is representative of 500 selected common stocks, most of which are listed on the New York Stock Exchange, and is a measure of the U.S. Stock market as a whole. The Bloomberg U.S. Aggregate Bond Index is a market value-weighted performance benchmark for investment-grade fixed-rate debt issues, including government, corporate, asset-backed, and mortgage-backed securities, with maturities of at least one year. The Composite is a blended index comprised of (50%) S&P 500 and (50%) Bloomberg U.S. Aggregate Bond Index. These indexes are unmanaged and do not reflect the deduction of fees associated with a mutual fund, such as investment management and fund accounting fees. The Fund’s performance reflects the deduction of fees for services provided to the Fund. Investors cannot invest directly in an index.
2
AZL Balanced Index Strategy Fund
(Unaudited)
As a shareholder of the AZL Balanced Index Strategy Fund (the “Fund”), you incur ongoing costs, including management fees, distribution fees, and other Fund expenses. These examples are intended to help you understand your ongoing costs (in dollars) of investing in the Fund and to compare these costs with the ongoing costs of investing in other mutual funds. Please note that the expenses shown in each table do not reflect expenses that apply to the subaccount or the insurance contract. If the expenses that apply to the subaccount or the insurance contract were included, your costs would have been higher.
These examples are based on an investment of $1,000 invested at the beginning of the period and held for the periods presented below.
The Actual Expense table below provides information about actual account values and actual expenses. You may use the information below, together with the amount you invested, to estimate the expenses that you paid over the period. Simply divide your account value by $1,000 (for example, an $8,600 account value divided by $1,000 = 8.6), then multiply the result by the number in the table under the heading entitled “Expenses Paid During Period” to estimate the expenses you paid on your account during this period.
| Beginning Account Value 7/1/22 | Ending Account Value 12/31/22 | Expenses Paid During Period 7/1/22 -12/31/22* | Annualized Expense Ratio During Period 7/1/22 - 12/31/22 | |||||||||||||
AZL Balanced Index Strategy Fund | $ | 1,000.00 | $ | 1,003.80 | $ | 0.45 | 0.09 | % | ||||||||
The Hypothetical Expense table below provides information about hypothetical account values and hypothetical expenses based on the Fund’s actual expense ratio and an assumed rate of return of 5% per year before expenses, which is not the Fund’s actual return. The hypothetical account values and expenses may not be used to estimate the actual ending account balance or expenses you paid for the period. You may use this information to compare this 5% hypothetical example with the 5% hypothetical examples that appear in the shareholder reports of other funds.
Beginning Account Value | Ending Account Value 12/31/22 | Expenses Paid During Period 7/1/22 -12/31/22* | Annualized Expense Ratio During Period 7/1/22 - 12/31/22 | |||||
| AZL Balanced Index Strategy Fund | $1,000.00 | $1,024.75 | $0.46 | 0.09% |
| * | Expenses are equal to the average account value multiplied by the Fund’s annualized expense ratio multiplied by 184/365 (the number of days in the most recent fiscal half-year divided by the number of days in the fiscal year). |
Portfolio Composition
(Unaudited)
| Investments | Percent of Net Assets | ||||
Fixed Income Fund | 50.0% | ||||
Domestic Equity Funds | 37.4 | ||||
International Equity Fund | 12.6 | ||||
|
| ||||
Total Investment Securities | 100.0 | ||||
Net other assets (liabilities) | —† | ||||
|
| ||||
Net Assets | 100.0% | ||||
|
| ||||
| † | Represents less than 0.05%. |
3
AZL Balanced Index Strategy Fund
Schedule of Portfolio Investments
December 31, 2022
| Shares | Value | |||||
Affiliated Investment Companies (100.0%): | ||||||
Domestic Equity Funds (37.4%): | ||||||
1,358,211 | AZL Mid Cap Index Fund, Class 2 | $ | 26,036,905 | |||
5,224,046 | AZL S&P 500 Index Fund, Class 2 | 88,495,341 | ||||
1,222,204 | AZL Small Cap Stock Index Fund, Class 2 | 13,969,790 | ||||
|
| |||||
| 128,502,036 | ||||||
|
| |||||
Fixed Income Fund (50.0%): | ||||||
18,093,901 | AZL Enhanced Bond Index Fund | 171,530,181 | ||||
|
| |||||
| Shares | Value | |||
Affiliated Investment Companies, continued | ||||
International Equity Fund (12.6%): | ||||
2,829,607 AZL International Index Fund, Class 2 | $ | 43,179,803 | ||
|
| |||
Total Affiliated Investment Companies (Cost $305,846,434) | 343,212,020 | |||
|
| |||
Total Investment Securities (Cost $305,846,434) — 100.0%(a) | 343,212,020 | |||
Net other assets (liabilities) — 0.0%† | (130,544 | ) | ||
|
| |||
Net Assets — 100.0% | $ | 343,081,476 | ||
|
| |||
| (a) | See Federal Tax Information listed in the Notes to the Financial Statements. |
| † | Represents less than 0.05%. |
Percentages indicated are based on net assets as of December 31, 2022
See accompanying notes to the financial statements.
4
AZL Balanced Index Strategy Fund
Statement of Assets and Liabilities
December 31, 2022
Assets: | |||||
Investments in affiliates, at cost | $ | 305,846,434 | |||
|
| ||||
Investments in affiliates, at value | $ | 343,212,020 | |||
Interest and dividends receivable | 39 | ||||
Receivable for affiliated investments sold | 40,768 | ||||
Prepaid expenses | 3,079 | ||||
|
| ||||
Total Assets | 343,255,906 | ||||
|
| ||||
Liabilities: | |||||
Cash overdraft | 40,719 | ||||
Payable for capital shares redeemed | 98,254 | ||||
Management fees payable | 14,806 | ||||
Administration fees payable | 8,128 | ||||
Custodian fees payable | 419 | ||||
Administrative and compliance services fees payable | 864 | ||||
Transfer agent fees payable | 693 | ||||
Trustee fees payable | 2,158 | ||||
Other accrued liabilities | 8,389 | ||||
|
| ||||
Total Liabilities | 174,430 | ||||
|
| ||||
Net Assets | $ | 343,081,476 | |||
|
| ||||
Net Assets Consist of: | |||||
Paid in capital | $ | 282,767,295 | |||
Total distributable earnings | 60,314,181 | ||||
|
| ||||
Net Assets | $ | 343,081,476 | |||
|
| ||||
Shares of beneficial interest (unlimited number of shares authorized, no par value) | 24,930,981 | ||||
Net Asset Value (offering and redemption price per share) | $ | 13.76 | |||
|
| ||||
For the Year Ended December 31, 2022
Investment Income: | |||||
Dividends from affiliates | $ | 5,384,860 | |||
Dividends from non-affiliates | 115 | ||||
|
| ||||
Total Investment Income | 5,384,975 | ||||
|
| ||||
Expenses: | |||||
Management fees | 187,233 | ||||
Administration fees | 67,297 | ||||
Custodian fees | 2,271 | ||||
Administrative and compliance services fees | 5,370 | ||||
Transfer agent fees | 5,705 | ||||
Trustee fees | 21,405 | ||||
Professional fees | 18,231 | ||||
Shareholder reports | 9,543 | ||||
Other expenses | 5,666 | ||||
|
| ||||
Total expenses | 322,721 | ||||
|
| ||||
Net Investment Income/(Loss) | 5,062,254 | ||||
|
| ||||
Net realized and Change in net unrealized gains/losses on investments: | |||||
Net realized gains/(losses) on affiliated underlying funds | (952,697 | ) | |||
Net realized gains distributions from affiliated underlying funds | 20,953,907 | ||||
Change in net unrealized appreciation/depreciation on affiliated underlying funds | (90,623,801 | ) | |||
|
| ||||
Net realized and Change in net unrealized gains/losses on investments | (70,622,591 | ) | |||
|
| ||||
Change in Net Assets Resulting From Operations | $ | (65,560,337 | ) | ||
|
| ||||
See accompanying notes to the financial statements.
5
AZL Balanced Index Strategy Fund
Statements of Changes in Net Assets
For the Year Ended | For the Year Ended | |||||||||
Change In Net Assets: | ||||||||||
Operations: | ||||||||||
Net investment income/(loss) | $ 5,062,254 | $ 3,700,360 | ||||||||
Net realized gains/(losses) on investments | 20,001,210 | 29,274,448 | ||||||||
Change in unrealized appreciation/depreciation on investments | (90,623,801) | 8,822,387 | ||||||||
|
|
|
| |||||||
Change in net assets resulting from operations | (65,560,337) | 41,797,195 | ||||||||
|
|
|
| |||||||
Distributions to Shareholders: | ||||||||||
Distributions | (33,007,068) | (29,204,021) | ||||||||
|
|
|
| |||||||
Change in net assets resulting from distributions to shareholders | (33,007,068) | (29,204,021) | ||||||||
|
|
|
| |||||||
Capital Transactions: | ||||||||||
Proceeds from shares issued | 5,020,134 | 33,603,341 | ||||||||
Proceeds from dividends reinvested | 33,007,068 | 29,204,021 | ||||||||
Value of shares redeemed | (41,552,550) | (47,478,927) | ||||||||
|
|
|
| |||||||
Change in net assets resulting from capital transactions | (3,525,348) | 15,328,435 | ||||||||
|
|
|
| |||||||
Change in net assets | (102,092,753) | 27,921,609 | ||||||||
Net Assets: | ||||||||||
Beginning of period | 445,174,229 | 417,252,620 | ||||||||
|
|
|
| |||||||
End of period | $ 343,081,476 | $ 445,174,229 | ||||||||
|
|
|
| |||||||
Share Transactions: | ||||||||||
Shares issued | 321,940 | 1,833,889 | ||||||||
Dividends reinvested | 2,474,293 | 1,683,229 | ||||||||
Shares redeemed | (2,652,854) | (2,604,847) | ||||||||
|
|
|
| |||||||
Change in shares | 143,379 | 912,271 | ||||||||
|
|
|
| |||||||
See accompanying notes to the financial statements.
6
AZL Balanced Index Strategy Fund
(Selected data for a share of beneficial interest outstanding throughout the periods indicated. Does not reflect fees or expenses associated with the separate accounts that invest in the Fund or in any variable annuity contracts or variable life insurance policy for which the Fund serves as an investment vehicle.)
| Year Ended December 31, 2022 | Year Ended December 31, 2021 | Year Ended December 31, 2020 | Year Ended December 31, 2019 | Year Ended December 31, 2018 | |||||||||||||||||||||
Net Asset Value, Beginning of Period | $17.96 | $17.48 | $16.46 | $14.89 | $16.34 | ||||||||||||||||||||
|
|
|
|
|
|
|
|
|
| ||||||||||||||||
Investment Activities: | |||||||||||||||||||||||||
Net Investment Income/(Loss) | 0.21 | (a) | 0.15 | (a) | 0.33 | (a) | 0.30 | (a) | 0.31 | ||||||||||||||||
Net Realized and Unrealized Gains/(Losses) on Investments | (2.97 | ) | 1.56 | 1.62 | 2.22 | (0.99 | ) | ||||||||||||||||||
|
|
|
|
|
|
|
|
|
| ||||||||||||||||
Total from Investment Activities | (2.76 | ) | 1.71 | 1.95 | 2.52 | (0.68 | ) | ||||||||||||||||||
|
|
|
|
|
|
|
|
|
| ||||||||||||||||
Distributions to Shareholders From: | |||||||||||||||||||||||||
Net Investment Income | (0.37 | ) | (0.34 | ) | (0.33 | ) | (0.38 | ) | (0.16 | ) | |||||||||||||||
Net Realized Gains | (1.07 | ) | (0.89 | ) | (0.60 | ) | (0.57 | ) | (0.61 | ) | |||||||||||||||
|
|
|
|
|
|
|
|
|
| ||||||||||||||||
Total Dividends | (1.44 | ) | (1.23 | ) | (0.93 | ) | (0.95 | ) | (0.77 | ) | |||||||||||||||
|
|
|
|
|
|
|
|
|
| ||||||||||||||||
Net Asset Value, End of Period | $13.76 | $17.96 | $17.48 | $16.46 | $14.89 | ||||||||||||||||||||
|
|
|
|
|
|
|
|
|
| ||||||||||||||||
Total Return (b) | (15.10 | )% | 10.04 | % | 12.24 | % | 17.24 | % | (4.36 | )% | |||||||||||||||
Ratios to Average Net Assets/Supplemental Data: | |||||||||||||||||||||||||
Net Assets, End of Period (000’s) | $ | 343,081 | $ | 445,174 | $ | 417,253 | $ | 397,402 | $ | 386,189 | |||||||||||||||
Net Investment Income/(Loss) | 1.35 | % | 0.85 | % | 2.01 | % | 1.87 | % | 1.82 | % | |||||||||||||||
Expenses Before Reductions*(c) | 0.09 | % | 0.08 | % | 0.09 | % | 0.09 | % | 0.08 | % | |||||||||||||||
Expenses Net of Reductions* | 0.09 | % | 0.08 | % | 0.09 | % | 0.09 | % | 0.08 | % | |||||||||||||||
Portfolio Turnover Rate | 8 | % | 13 | % | 19 | % | 5 | % | 5 | % | |||||||||||||||
| * | The expense ratios exclude the impact of fees/expenses paid by each underlying fund. |
| (a) | Calculated using the average shares method. |
| (b) | The returns include reinvested dividends and fund level expenses, but exclude insurance contract charges. If these charges were included, the returns would have been lower. |
| (c) | Excludes fee reductions. If such fee reductions had not occurred, the ratios would have been as indicated. |
See accompanying notes to the financial statements.
7
AZL Balanced Index Strategy Fund
Notes to the Financial Statements
December 31, 2022
1. Organization
The Allianz Variable Insurance Products Fund of Funds Trust (the “Trust”) was organized as a Delaware statutory trust on June 16, 2004. The Trust is an open-end management investment company registered under the Investment Company Act of 1940, as amended, (the “1940 Act”) and thus is determined to be an investment company, and follows the investment company accounting and reporting guidance under Financial Accounting Standards Board (“FASB”) Accounting Standards Codification (“ASC”) Topic 946 “Financial Services—Investment Companies”. The Trust consists of 12 separate investment portfolios (collectively, the “Funds”), of which one is included in this report, the AZL Balanced Index Strategy Fund (the “Fund”), and 11 are presented in separate reports. The Fund is a diversified series of the Trust.
The Fund is a “fund of funds”, which means that the Fund invests primarily in other mutual funds (the “Underlying Funds”). Underlying Funds invest in stocks, bonds, and other securities and reflect varying amounts of potential investment risk and reward. The Underlying Funds record their investments at fair value. Periodically, the Fund will adjust its asset allocation as it seeks to achieve its investment objective.
The Trust is authorized to issue an unlimited number of shares of the Fund without par value. Shares of the Fund are available through the variable annuity contracts offered through the separate accounts of participating insurance companies. Currently, the Fund only offers its shares to separate accounts of Allianz Life Insurance Company of North America and Allianz Life Insurance Company of New York, affiliates of the Trust and the Manager, as defined below.
Under the Trust’s organizational documents, its officers and trustees are indemnified against certain liabilities arising out of the performance of their duties to the Fund. In addition, in the normal course of business, the Fund may enter into contracts with its vendors and others that provide for general indemnifications. The Fund’s maximum exposure under these arrangements is unknown, as this would involve future claims that may be made against the Fund. However, based on experience, the Fund expects that risk of loss to be remote.
2. Significant Accounting Policies
The following is a summary of significant accounting policies followed by the Fund in the preparation of its financial statements. The policies conform with U.S. generally accepted accounting principles (“U.S. GAAP”). The preparation of financial statements requires management to make certain estimates and assumptions that affect the reported amounts of assets and liabilities and disclosure of contingent assets and liabilities at the date of the financial statements and the reported amounts of increases and decreases in net assets from operations during the reporting period. Actual results could differ from those estimates.
Security Valuation
The Fund records its investments at fair value. Fair value is defined as the price that would be received to sell an asset or paid to transfer a liability in an orderly transaction between willing market participants at the measurement date. The valuation techniques used to determine fair value are further described in Note 4 below.
Investment Transactions and Investment Income
Investment transactions are accounted for on trade date. Net realized gains and losses on investments sold and on foreign currency transactions are recorded on the basis of identified cost. Interest income is recorded on the accrual basis and includes, where applicable, the amortization of premiums or accretion of discounts. Dividend income is recorded on the ex-dividend date except in the case of foreign securities, in which case dividends are recorded as soon as such information becomes available.
Distributions to Shareholders
Distributions to shareholders are recorded on the ex-dividend date. The Fund distributes its dividends from net investment income and net realized capital gains, if any, on an annual basis. The amount of distributions from net investment income and from net realized gains is determined in accordance with federal income tax regulations, which may differ from U.S. GAAP. These “book/tax” differences are either temporary or permanent in nature. To the extent these differences are permanent in nature (e.g., return of capital, net operating loss, reclassification of certain market discounts, gain/loss, paydowns, and distributions), such amounts are reclassified within the composition of net assets based on their federal tax-basis treatment; temporary differences (e.g., wash sales and differing treatment on certain investments) do not require reclassification. Distributions to shareholders that exceed net investment income and net realized gains for tax purposes are reported as distributions of capital.
Expense Allocation
Expenses directly attributable to the Fund are charged directly to the Fund, while expenses attributable to more than one Fund are allocated among the respective Funds based upon relative net assets or some other reasonable method. Expenses which are attributable to more than one Trust are allocated across the Allianz Variable Insurance Products Trust, Allianz Variable Insurance Products Fund of Funds Trust and AIM ETF Products Trust based upon relative net assets or another reasonable basis. Allianz Investment Management LLC (the “Manager”), serves as the investment manager for the Trust, Allianz Variable Insurance Products Trust and AIM ETF Products Trust.
This report does not reflect fees or expenses associated with the separate accounts that invest in the Fund or in any variable annuity contracts or variable life insurance policy for which the Fund serves as an investment vehicle.
Affiliated Securities Transactions
Pursuant to Rule 17a-7 under the 1940 Act, the Fund may engage in securities transactions with affiliated investment companies and advisory accounts managed by the Manager. Any such purchase or sale transaction must be effected without a brokerage commission or other remuneration, except for customary transfer fees. The transaction must be effected at the current market price, which is either the security’s last sale price on an exchange or, if there are no transactions in the security that day, at the average of the highest bid and lowest asked price. During the year ended December 31, 2022, the Fund did not engage in any Rule 17a-7 transactions.
8
AZL Balanced Index Strategy Fund
Notes to the Financial Statements
December 31, 2022
3. Fees and Transactions with Affiliates and Other Parties
The Manager provides investment advisory and management services for the Fund. The Manager has contractually agreed to waive fees and reimburse the Fund to limit the annual expenses, excluding interest expense (e.g., cash overdraft fees), taxes, brokerage commissions, acquired fund fees and expenses, other expenditures that are capitalized in accordance with U.S. GAAP and other extraordinary expenses not incurred in the ordinary course of the Fund’s business, based on the daily net assets of the Fund, through April 30, 2024. Expenses incurred for investment advisory and management services are reflected on the Statement of Operations as “Management fees.”
For the year ended December 31, 2022, the annual rate due to the Manager and the annual expense limit were as follows:
| Annual Rate | Annual Expense Limit | |||||||||
AZL Balanced Index Strategy Fund | 0.05% | 0.20% | ||||||||
Any amounts contractually waived or reimbursed by the Manager with respect to the annual expense limit in a particular fiscal year will be subject to repayment by the Fund to the Manager to the extent that from time to time through the next three fiscal years the repayment will not cause the Fund’s expenses to exceed the lesser of the stated limit at the time of the waiver or the current stated limit. Any amounts recouped by the Manager during the period are reflected on the Statement of Operations as “Recoupment of prior expenses reimbursed by the Manager.” At December 31, 2022, there were no remaining contractual reimbursements subject to repayment by the Fund in subsequent years.
Management fees, which the Manager may waive in order to maintain more competitive expense ratios, are not subject to repayment in subsequent years. Information on the total amount waived/ reimbursed by the Manager or repaid to the Manager by the Fund during the period can be found on the Statement of Operations, as applicable. During the year ended December 31, 2022, there were no such waivers.
The Manager or an affiliate of the Manager serves as the investment adviser of certain underlying funds in which the Fund invests. At December 31, 2022, these underlying funds are noted as Affiliated Investment Companies in the Fund’s Schedule of Portfolio Investments. Additional information, including financial statements, about these Funds is available at www.allianzlife.com. The Manager or an affiliate of the Manager is paid a separate fee from the underlying funds for such services. A summary of the Fund’s investments in affiliated investment companies for the year ended December 31, 2022 is as follows:
Value 12/31/21 | Purchases at Cost | Proceeds from Sales | Net Realized Gains (Losses) | Change in Net (Depreciation) | Value 12/31/22 | Shares as of | Dividend Income | Net Realized Gains Distributions from Affiliated Underlying Funds | |||||||||||||||||||||||||||||||||||||
| |||||||||||||||||||||||||||||||||||||||||||||
AZL Enhanced Bond Index Fund | $ | 219,744,177 | $ | 5,709,348 | $ | (21,873,273 | ) | $ | (3,489,825 | ) | $ | (28,560,246 | ) | $ | 171,530,181 | 18,093,901 | $ | 2,745,075 | $ | 98,997 | |||||||||||||||||||||||||
AZL International Index Fund, Class 2 | 56,332,794 | 2,655,444 | (5,477,585 | ) | (105,462 | ) | (10,225,388 | ) | 43,179,803 | 2,829,607 | 1,310,717 | 1,117,272 | |||||||||||||||||||||||||||||||||
AZL Mid Cap Index Fund, Class 2 | 34,268,489 | 5,548,005 | (3,731,094 | ) | 525,248 | (10,573,743 | ) | 26,036,905 | 1,358,211 | 198,376 | 5,349,630 | ||||||||||||||||||||||||||||||||||
AZL S&P 500 Index Fund, Class 2 | 116,684,094 | 14,490,836 | (9,034,169 | ) | 2,019,190 | (35,664,610 | ) | 88,495,341 | 5,224,046 | 1,011,905 | 11,975,591 | ||||||||||||||||||||||||||||||||||
AZL Small Cap Stock Index Fund, Class 2 | 18,213,442 | 2,531,204 | (1,273,194 | ) | 98,152 | (5,599,814 | ) | 13,969,790 | 1,222,204 | 118,787 | 2,412,417 | ||||||||||||||||||||||||||||||||||
|
|
|
|
|
|
|
|
|
|
|
|
|
|
|
|
|
| ||||||||||||||||||||||||||||
| $ | 445,242,996 | $ | 30,934,837 | $ | (41,389,315 | ) | $ | (952,697 | ) | $ | (90,623,801 | ) | $ | 343,212,020 | 28,727,969 | $ | 5,384,860 | $ | 20,953,907 | ||||||||||||||||||||||||||
|
|
|
|
|
|
|
|
|
|
|
|
|
|
|
|
|
| ||||||||||||||||||||||||||||
Pursuant to separate agreements between the Trust and the Manager, the Manager provides a Chief Compliance Officer (“CCO”) and certain compliance oversight and regulatory filing services to the Trust. Under these agreements, the Manager is entitled to an amount equal to a portion of the compensation and certain other expenses related to the individuals performing the CCO and compliance oversight services, as well as $100 per hour for time incurred in connection with the preparation and filing of certain documents with the SEC. The fees are paid to the Manager on a quarterly basis. The total expenses incurred by the Fund for these services are reflected on the Statement of Operations as “Administrative and compliance services fees.”
Citi Fund Services Ohio, Inc. (“Citi” or the “Administrator”), a wholly owned subsidiary of Citigroup, Inc., with which an officer of the Trust is affiliated, serves as the Trust’s administrator and fund accountant, and assists the Trust in all aspects of its administration and operation. The Administrator is entitled to a fee, accrued daily and paid monthly. The Administrator is entitled to an annual fee for each additional class of shares of any Fund, certain annual fees in supporting fair value services, and a Trust-wide annual fee for providing infrastructure and support in implementing the written policies and procedures comprising the Fund’s compliance program. The Administrator is also reimbursed for certain expenses incurred. The total expenses incurred by the Fund for these services are reflected on the Statement of Operations as “Administration fees.”
FIS Investor Services LLC (“FIS”) serves as the Fund’s transfer agent. Under the Transfer Agent Agreement, the Trust pays FIS a fee for its services and reimburses FIS for all of their reasonable out-of-pocket expenses incurred in providing these services.
The Bank of New York Mellon (“BNY Mellon” or the “Custodian”) serves as the Trust’s custodian. For these services as custodian, the Funds pay BNY Mellon a fee based on a percentage of assets held on behalf of the Funds, plus certain out-of-pocket charges.
Allianz Life Financial Services, LLC (“ALFS”), an affiliate of the Manager, serves as distributor of the Fund. ALFS receives an annual Trust-wide annual fee of $7,500, paid by the Manager from its profits and not by the Trust, for recordkeeping and reporting services.
Certain Officers and Trustees of the Trust are affiliated with the Manager or the Administrator. Such Officers (except for the Trust’s CCO as noted above) and Trustees receive no compensation from the Trust for serving in their respective roles.
9
AZL Balanced Index Strategy Fund
Notes to the Financial Statements
December 31, 2022
4. Investment Valuation Summary
The valuation techniques employed by the Fund, as described below, maximize the use of observable inputs and minimize the use of unobservable inputs in determining fair value. The inputs used for valuing the Fund’s investments are summarized in the three broad levels listed below:
| ● | Level 1 - quoted prices in active markets for identical assets |
| ● | Level 2 - other significant observable inputs (including quoted prices for similar securities, interest rates, prepayments speeds, credit risk, etc.) |
| ● | Level 3 - significant unobservable inputs (including the Fund’s own assumptions in determining the fair value of investments) |
Changes in valuation techniques may result in transfers in or out of an assigned level within the disclosure hierarchy. The inputs or methodology used for valuing investments is not necessarily an indication of the risk associated with investing in those investments.
Investments in other investment companies are valued at their published net asset value (“NAV”). Security prices are determined pursuant to valuation procedures approved by the Trust’s Board of Trustees (the “Board” or “Trustees”) as of the close of the New York Stock Exchange (“NYSE”) (generally 4:00 pm Eastern Time). The investments utilizing Level 1 valuations represent investments in open-end investment companies.
The Board has designated the Manager to perform the Fund’s fair value determinations in accordance with valuation procedures approved by the Board. The effect of using fair value pricing is that the Fund’s NAV will be subject to the judgment of the Manager. The Manager’s fair valuation process is subject to the oversight of the Board.
The following is a summary of the valuation inputs used as of December 31, 2022 in valuing the Fund’s investments based upon the three levels defined above:
Investment Securities: | Level 1 | Level 2 | Level 3 | Total | ||||||||||||
Affiliated Investment Companies | $343,212,020 | $– | $– | $343,212,020 | ||||||||||||
|
|
|
|
|
|
|
| |||||||||
Total Investment Securities | $343,212,020 | $– | $– | $343,212,020 | ||||||||||||
|
|
|
|
|
|
|
| |||||||||
5. Security Purchases and Sales
For the year ended December 31, 2022, cost of purchases and proceeds from sales of securities (excluding securities maturing less than one year from acquisition) were as follows:
| Purchases | Sales | |||||||||
| ||||||||||
AZL Balanced Index Strategy Fund | $30,934,837 | $41,389,315 | ||||||||
6. Investment Risks
The risks below are presented in an order intended to facilitate readability. Their order does not imply that the realization of one risk is more likely to occur more frequently than another risk, nor does it imply that the realization of one risk is likely to have a greater adverse impact than another risk. The Fund may be subject to other risks in addition to these identified risks. This section discusses certain common principal risks encountered by the Fund.
Derivatives Risk: The Fund may invest directly or through affiliated or unaffiliated mutual funds or unregistered investment pools in derivative instruments such as futures, options, and options on futures. A derivative is a financial contract whose value depends on, or is derived from, the value of an underlying asset, reference rate, or risk. Use of derivative instruments involves risks different from, or possibly greater than, the risks associated with investing directly in securities and other traditional investments. Derivatives are subject to a number of other risks, such as liquidity risk, interest rate risk, market risk, credit risk, and selection risk. Derivatives also involve the risk of mispricing or improper valuation and the risk that changes in the value may not correlate perfectly with the underlying asset, rate, or index. Using derivatives may result in losses, possibly in excess of the principal amount invested. Also, suitable derivative transactions may not be available in all circumstances. The other party to a derivatives contract could default. During the year ended December 31, 2022, the Fund did not directly invest in derivatives.
Foreign Securities Risk: Investing in the securities of non-U.S. issuers involves a number of risks, such as fluctuations in currency values, adverse political, social or economic developments, and differences in social and economic developments or policies. Such risks include future political and economic developments, and the possible imposition of exchange controls or other foreign governmental laws and restrictions. In addition, with respect to certain countries, there is the possibility of expropriation of assets, confiscatory taxation, political or social instability or diplomatic developments which could adversely affect investments in those securities. Certain foreign companies may be subject to sanctions, embargoes, or other governmental actions that may impair or otherwise limit the ability to invest in, receive, hold or sell the securities of such companies.
Fund of Fund Risk: The Fund, as a shareholder of the underlying funds, indirectly bears its proportionate share of any investment management fees and other expenses of the underlying funds. Further due to the fees and expenses paid by the Fund, as well as small variations in the Fund’s actual allocations to the underlying funds and any futures and cash held in the Fund’s portfolio, the performance and income distributions of the Fund will not be the same as the performance and income distributions of the underlying funds. In addition, the Fund maintains indirect exposure to various types of risk which may exist in the underlying Funds, such as foreign securities risk, fixed income securities risk and other risks.
Interest Rate Risk: Debt securities held by an underlying fund may decline in value due to rising interest rates. The price of a bond is also affected by its maturity. Bonds with longer maturities generally have greater sensitivity to changes in interest rates.
Market Risk: The market price of securities owned by the underlying funds may go up or down, sometimes rapidly and unpredictably. Securities may decline in value due to factors affecting securities markets generally or particular industries represented in the securities markets. The value of a security may decline due to general market conditions that are not specifically related to a particular company, such as real or perceived adverse economic conditions, changes in the general outlook for corporate earnings, changes in interest or currency rates, or adverse investor sentiment, as well as natural disasters, and outbreaks of infectious illnesses or other widespread public health issues.
10
AZL Balanced Index Strategy Fund
Notes to the Financial Statements
December 31, 2022
7. Coronavirus (COVID-19) Pandemic
The global outbreak of the COVID-19 strain of the coronavirus has caused adverse effects on many companies, sectors, nations, regions and the markets in general, and may continue for an unpredictable duration. The effects of this pandemic may adversely impact the value and performance of the Fund, its ability to buy and sell fund investments at appropriate valuations, and its ability to achieve its investment objective(s).
8. Federal Tax Information
It is the policy of the Fund to continue to qualify as a regulated investment company by complying with the provisions available to certain investment companies, as defined under Subchapter M of the Internal Revenue Code, and to make distributions of net investment income and net realized gains sufficient to relieve it from all, or substantially all, federal income taxes. Accordingly, no provisions for federal income taxes are required in the financial statements.
Management of the Fund has reviewed tax positions taken in tax years that remain subject to examination by all major tax jurisdictions, including federal (i.e., the last four tax year ends and the interim tax period since then, as applicable). Management believes that there is no tax liability resulting from unrecognized tax benefits related to uncertain tax positions taken.
Cost of securities, including derivatives and short positions as applicable, for federal income tax purposes at December 31, 2022 is $309,928,719. The gross unrealized appreciation/ (depreciation) on a tax basis is as follows:
Unrealized appreciation | 52,340,807 | ||||
Unrealized (depreciation) | (19,057,506 | ) | |||
|
| ||||
Net unrealized appreciation/(depreciation) | $33,283,301 | ||||
|
|
The tax character of dividends paid to shareholders during the year ended December 31, 2022, was as follows:
| Ordinary Income | Net Long-Term | Total Distributions(a) | ||||||||
| ||||||||||
AZL Balanced Index Strategy Fund | $8,497,247 | $24,509,821 | $33,007,068 | |||||||
| (a) | Total distributions paid may differ from the Statements of Changes in Net Assets because dividends are recognized when actually paid for tax purposes. |
The tax character of dividends paid to shareholders during the year ended December 31, 2021, was as follows:
| Ordinary Income | Net Long-Term | Total Distributions(a) | ||||||||
| ||||||||||
AZL Balanced Index Strategy Fund | $7,990,462 | $21,213,559 | $29,204,021 | |||||||
(a) Total distributions paid may differ from the Statements of Changes in Net Assets because dividends are recognized when actually paid for tax purposes.
At December 31, 2022, the components of accumulated earnings on a tax basis were as follows:
| Undistributed Ordinary Income | Undistributed Long-Term Capital Gains | Accumulated Capital and Other Losses | Unrealized Appreciation/ Depreciation(a) | Total Accumulated Earnings/(Deficit) | |||||||||||||||||||||||||
| |||||||||||||||||||||||||||||
AZL Balanced Index Strategy Fund | $6,203,899 | $20,826,981 | $– | $33,283,301 | $60,314,181 | ||||||||||||||||||||||||
| (a) | The differences between book-basis and tax-basis unrealized appreciation/(depreciation) is attributable primarily to tax deferral of losses on wash sales. |
9. Ownership and Principal Holders
The beneficial ownership, either directly or indirectly, of more than 25% of the voting securities of a fund creates presumptions of control of the fund, under section 2 (a)(9) of the 1940 Act. As of December 31, 2022, the Fund had an individual shareholder account which is affiliated with the Manager representing ownership in excess of 90% of the Fund.
Investment activities of this shareholder could have a material impact to the Fund.
10. Subsequent Events
Management of the Fund has evaluated the need for additional disclosures or adjustments resulting from events through the date the financial statements were issued. Based on this evaluation, there were no subsequent events to report that would have material impact on the Fund’s financial statements.
11
REPORT OF INDEPENDENT REGISTERED PUBLIC ACCOUNTING FIRM
To the Board of Trustees of Allianz Variable Insurance Products Fund of Funds Trust and Shareholders of
AZL Balanced Index Strategy Fund
Opinion on the Financial Statements
We have audited the accompanying statement of assets and liabilities, including the schedule of portfolio investments, of AZL Balanced Index Strategy Fund (one of the funds constituting Allianz Variable Insurance Products Fund of Funds Trust, referred to hereafter as the “Fund”) as of December 31, 2022, the related statement of operations for the year ended December 31, 2022, the statements of changes in net assets for each of the two years in the period ended December 31, 2022, including the related notes, and the financial highlights for each of the five years in the period ended December 31, 2022 (collectively referred to as the “financial statements”). In our opinion, the financial statements present fairly, in all material respects, the financial position of the Fund as of December 31, 2022, the results of its operations for the year then ended, the changes in its net assets for each of the two years in the period ended December 31, 2022 and the financial highlights for each of the five years in the period ended December 31, 2022 in conformity with accounting principles generally accepted in the United States of America.
Basis for Opinion
These financial statements are the responsibility of the Fund’s management. Our responsibility is to express an opinion on the Fund’s financial statements based on our audits. We are a public accounting firm registered with the Public Company Accounting Oversight Board (United States) (PCAOB) and are required to be independent with respect to the Fund in accordance with the U.S. federal securities laws and the applicable rules and regulations of the Securities and Exchange Commission and the PCAOB.
We conducted our audits of these financial statements in accordance with the standards of the PCAOB. Those standards require that we plan and perform the audit to obtain reasonable assurance about whether the financial statements are free of material misstatement, whether due to error or fraud.
Our audits included performing procedures to assess the risks of material misstatement of the financial statements, whether due to error or fraud, and performing procedures that respond to those risks. Such procedures included examining, on a test basis, evidence regarding the amounts and disclosures in the financial statements. Our audits also included evaluating the accounting principles used and significant estimates made by management, as well as evaluating the overall presentation of the financial statements. Our procedures included confirmation of securities owned as of December 31, 2022 by correspondence with the transfer agent. We believe that our audits provide a reasonable basis for our opinion.
/s/ PricewaterhouseCoopers LLP
New York, New York
February 23, 2023
We have served as the auditor of one or more investment companies in the Allianz Variable Insurance Products complex since 2018.
12
Other Federal Income Tax Information (Unaudited)
For the year ended December 31, 2022, 18.69% of the total ordinary income dividends paid by the Fund qualify for the corporate dividends received deductions available to corporate shareholders.
During the year ended December 31, 2022, the Fund declared net long-term capital gain distributions of $24,509,821.
13
A description of the policies and procedures that the Fund uses to determine how to vote proxies relating to portfolio securities is available, without charge, upon request, by visiting the Securities and Exchange Commission’s (‘‘Commission’’) website at www.sec.gov, or by calling 800-624-0197.
Information regarding how the Fund voted proxies relating to portfolio securities during the most recent 12-month period ended June 30th is available (i) without charge, upon request, by calling 800-624-0197; (ii) on the Trust’s website at https://www.allianzlife.com; and (iii) on the Commission’s website at http://www.sec.gov.
The Fund files complete Schedules of Portfolio Holdings with the Commission for the first and third quarters of each fiscal year on Form N-PORT. Schedules of Portfolio Holdings for the Fund are available without charge on the Commission’s website at http://www.sec.gov, or may be obtained by calling 800-624-0197.
14
Approval of Investment Advisory Agreement (Unaudited)
Subject to the general supervision of the Board of Trustees (the “Board”) and in accordance with the investment objectives and restrictions of each separate series (each a “Fund,” together, the “Funds”) of the Allianz Variable Insurance Products Fund of Funds Trust (the “Trust”), investment advisory services are provided to the Funds by Allianz Investment Management LLC (the “Manager”). The Manager manages each Fund pursuant to an investment management agreement (the “Management Agreement”) with the Trust in respect of each such Fund. The Management Agreement provides that the Manager, subject to the supervision and approval of the Board, is responsible for the management of each Fund. For management services, each Fund pays the Manager an investment advisory fee based upon each Fund’s average daily net assets. The Manager has contractually agreed to limit the expenses of each Fund by reimbursing the Fund if and when total Fund operating expenses exceed certain amounts until at least April 30, 2024 (the “Expense Limitation Agreement”).
In reviewing the services provided by the Manager and the terms of the Management Agreement, the Board receives and reviews information related to the Manager’s experience and expertise in the variable insurance marketplace. In addition, the Board receives information regarding the Manager’s expertise with regard to portfolio diversification and asset allocation requirements within variable insurance products issued by Allianz Life Insurance Company of North America (“Allianz Life”) and its subsidiary, Allianz Life Insurance Company of New York (“Allianz of New York”). Currently, the Funds are offered only through Allianz Life and Allianz of New York variable products, and not in the retail fund market.
As required by the Investment Company Act of 1940 (the “1940 Act”), the Board has reviewed and approved the Management Agreement with the Manager. The Board’s decision to approve this contract reflects the exercise of its business judgment on whether to approve new arrangements and continue the existing arrangements. During its review of the contract, the Board considered many factors, among the most material of which are: the Fund’s investment objectives and long-term performance; the Manager’s management philosophy, personnel, processes and investment performance, including its compliance history and the adequacy of its compliance processes; the preferences and expectations of Fund shareholders (and underlying contract owners) and their relative sophistication; the continuing state of competition in the mutual fund industry; and comparable fees in the mutual fund industry.
The Board also considered the compensation and benefits received by the Manager. This includes fees received for services provided to a Fund by employees of the Manager or of affiliates of the Manager and research services received by the Manager from brokers that execute Fund trades, as well as advisory fees. The Board considered the fact that: (1) the Manager and the Trust are parties to an Administrative Services Agreement and a Compliance Services Agreement, under which the Manager is compensated by the Trust for performing certain administrative and compliance services including providing an employee of the Manager or one of its affiliates to act as the Trust’s Chief Compliance Officer; and (2) Allianz Life Financial Services, LLC, an affiliated person of the Manager, is a registered securities broker-dealer and received (along with its affiliated persons) payments made by the underlying funds pursuant to Rule 12b-1.
The Board is aware that various courts have interpreted provisions of the 1940 Act and have indicated in their decisions that the following factors may be relevant to an adviser’s compensation: the nature, extent and quality of the services provided by the adviser, including the performance of the fund; the adviser’s cost of providing the services; the extent to which the adviser may realize “economies of scale” as the fund grows larger; any indirect benefits that may accrue to the adviser and its affiliates as a result of the adviser’s relationship with the fund; performance and expenses of comparable funds; the profitability of acting as adviser to the fund; and the extent to which the independent Board members, who are not “interested persons” of a fund as defined by the 1940 Act (“Independent Trustees”), are fully informed about all facts bearing on the adviser’s services and fees. The Board is aware of these factors and takes them into account in its review of the Management Agreement for the Funds.
Each member of the Board considered and weighed these factors in light of his or her experience in governing the Trust. The Board is assisted in its deliberations by the advice of independent legal counsel to the Independent Trustees (“Independent Trustee Counsel”). In this regard, the Board requests and receives a significant amount of information about the Funds and the Manager. Some of this information is provided at each regular meeting of the Board; additional information is provided in connection with the particular meetings at which the Board’s formal review of the Management Agreement occurs. In between regularly scheduled meetings, the Board may receive information on particular matters as the need arises. Thus, the Board’s evaluation of the Management Agreement is informed by reports covering such matters as: the Manager’s investment philosophy, personnel and processes, and the Fund’s investment performance (in absolute terms as well as in relationship to its benchmark and certain competitor or “peer group” funds). In connection with comparing the performance of each Fund versus its benchmark, the Board receives reports on the extent to which the Fund’s performance may be attributed to various applicable factors, such as asset class allocation decisions and volatility management strategies, if applicable, the performance of the underlying funds, rebalancing decisions, and the impact of cash positions and Fund fees and expenses. The Board also receives reports on the Funds’ expenses (including the advisory fee itself and the overall expense structure of the Funds, both in absolute terms and relative to peer group and/or competing funds, with due regard for the Expense Limitation Agreement and additional voluntary expense limitations); the use and allocation of any brokerage commissions derived from trading the Funds’ portfolio securities; the nature, extent and quality of the advisory and other services provided to the Fund by the Manager and its affiliates; compliance and audit reports concerning the Funds and the companies that service them; and relevant developments in the mutual fund industry and how the Funds and/or the Manager are responding to them.
The Board also receives financial information about the Manager, including reports on the compensation and benefits the Manager derives from its relationships with the Funds. These reports cover not only the fees under the Management Agreement, but also the fees, if any, received for providing other services to the Funds. The reports also discuss any indirect or “fall-out” benefits the Manager or its affiliates may derive from their relationships with the Funds.
The Management Agreement was most recently considered at Board meetings held in the summer and fall of 2022. Information relevant to the approval of the Management Agreement was considered at Board meetings held June 14 and 21, 2022, and September 13, 2022, as well as at various other meetings preceding those meetings. Accordingly, the Management Agreement was approved by the Board at an in-person meeting on September 13, 2022. At such meeting the Board also approved the Expense Limitation Agreement between the Manager and the Trust for the period ending April 30, 2024.
In connection with such meetings, the Board requested and evaluated extensive materials from the Manager, including performance and expense information for other investment companies with similar investment objectives derived from data compiled by an independent third-party provider and other sources believed to be reliable by the Manager and the Trustees. Prior to voting, the Trustees reviewed the proposed approval of the Management Agreement with management and with Independent Trustee Counsel and received a memorandum from such counsel discussing the legal standards for their consideration of the proposed approval. The Independent Trustees also discussed the proposed approval in private sessions with Independent Trustee Counsel at which no representatives of the Manager were present. In reaching their determinations relating to the approval of the Management Agreement, in respect of each Fund, each member of the Board considered all factors he or she believed relevant. The Board based its decision to approve
15
the Management Agreement on the totality of the circumstances and relevant factors, and with a view to past and future long-term considerations. Not all of the factors and considerations discussed above and below are necessarily relevant to every Fund, and the Board did not assign relative weights to factors discussed herein or deem any one or group of them to be controlling in and of themselves.
Shareholder reports must include a discussion of certain factors relating to the selection of the investment adviser and the approval of the advisory fee. The “factors” enumerated by the SEC are set forth below in italics, as well as the Board’s conclusions regarding such factors:
(1) The nature, extent and quality of services provided by the Manager. The Trustees noted that the Manager, subject to the oversight of the Board, administers each Fund’s business and other affairs. The Trustees noted that the Manager also provides the Trust and each Fund with such administrative and other services (exclusive of, and in addition to, any such services provided by any other service providers retained by the Trust on behalf of the Funds) and executive and other personnel as are necessary for the operation of the Trust and the Funds. Except for the Trust’s Chief Compliance Officer and certain compliance staff, the Manager pays all of the compensation of Trustees and officers of the Trust who are employees of the Manager or its affiliates.
The Board considered the scope and quality of services provided by the Manager and noted that the scope of the services provided has continued to expand as a result of regulatory and other developments. The Board noted, for example, that the Manager is responsible for maintaining and monitoring its own compliance program, and this compliance program has been continuously refined and enhanced in light of new regulatory requirements. The Board considered the capabilities and resources which the Manager has dedicated to performing services on behalf of the Trust and its Funds. The quality of administrative and other services, including the Manager’s role in coordinating the activities of the Trust’s other service providers, also were considered. The Board concluded that, overall, they were satisfied with the nature, extent and quality of services provided (and expected to be provided) to the Trust and to each of the Funds under the Management Agreement.
(2) The investment performance of the Funds and the Manager. In connection with every quarterly Board meeting and the summer and fall 2022 contract review process, Trustees received extensive information on the performance results of each Fund. This included, for example, performance information on absolute total return, performance versus the appropriate benchmark(s) and performance versus peer groups as reported by Lipper, the contribution to performance of the Manager’s asset class allocation decisions and volatility management strategies, if applicable, the performance of the underlying funds, and the impact on performance of rebalancing decisions, cash and Fund fees. This included Lipper performance information on the Funds for the previous quarter, and previous one-, three- and five-year periods, to the extent available. For example, in connection with the Board meetings held June 14 and 21, 2022, and September 13, 2022, the Manager reported that, for the five-year period ended December 31, 2021, two Funds were in the top 40%, three were in the middle 20%, and seven were in the bottom 40% of their respective Lipper peer groups. The Manager reported that for the three-year period ended December 31, 2021, three Funds were in the top 40%, two were in the middle 20%, and seven were in the bottom 40% of their respective Lipper peer groups. For the one-year period ended December 31, 2021, six Funds were in the top 40%, two were in the middle 20%, and four were in the bottom 40% of their respective Lipper peer groups.
The Manager also reported on the performance of the MVP Funds compared to custom managed-volatility peer groups. For the five-year period ended December 31, 2021, four Funds were in the top 40%, two were in the middle 20%, and four were in the bottom 20%. For the three-year period ended December 31, 2021, four Funds were in the top 40%, two were in the middle 20%, and four were in the bottom 40% of their respective custom managed-volatility peer groups. For the one-year period ended December 31, 2021, seven Funds were in the top 40%, two were in the middle 20%, and one was in the bottom 40% of their respective custom managed-volatility peer groups. The Board members discussed with the Manager and considered the impact of the volatility management strategies on performance in different market environments, where applicable, and considered whether they were operating as intended. The Board noted, in particular, the impact of certain characteristics of the Funds’ volatility management strategies in relation to volatility experienced as a result of the COVID-19 pandemic, and that relative performance had improved as the markets stabilized.
At the Board meeting held September 13, 2022, the Board also received updated performance information for the Funds, including updated Lipper peer group ranking information, for various periods ending June 30, 2022.
At the Board meeting held September 13, 2022, the Trustees determined that the investment performance of the Funds was acceptable.
(3) The costs of services to be provided and profits to be realized by the Manager and its affiliates from the relationship with the Funds. The Board considered that the Manager receives an advisory fee from each of the Funds. The Manager reported that for the three MVP Fusion Funds the advisory fee paid put these Funds in the 13th percentile of the customized peer group. The Manager reported that for the four MVP Index Strategy Funds the advisory fee paid put them in the 23rd percentile of the customized peer group, and for the AZL Balanced Index Strategy Fund the advisory fee paid put it in the 7th percentile of the customized peer group. The Manager reported that for the AZL DFA Multi-Strategy Fund, the advisory fee paid was in the 5th percentile. The Manager reported that for the AZL MVP DFA Multi-Strategy, AZL MVP FIAM Multi-Strategy, and AZL MVP T. Rowe Price Capital Appreciation Plus Funds, the advisory fee paid was in the 1st percentile. (A lower percentile reflects lower fund fees and is better for fund shareholders.) Trustees were provided with information on the total expense ratios of the Funds and other funds in the customized peer groups, and the Manager reported upon the challenges in making peer group comparisons for the Funds. The Board further considered and found that the advisory fee paid to the Manager with respect to each Fund was based on services provided to the Fund that were in addition to, rather than duplicative of, the services provided pursuant to the advisory agreements for the underlying funds in which the Fund invests.
The Manager provided information concerning the profitability of the Manager’s investment advisory activities for the period from 2019 through 2021. The Board recognized that it is difficult to make comparisons of profitability from investment company advisory agreements because comparative information is not generally publicly available and is affected by numerous factors, including the structure of the particular adviser, the types of funds it manages, its business mix, numerous assumptions regarding allocation of expenses and the adviser’s capital structure and cost of capital. In considering profitability information, the Board considered the possible effect of certain fall-out benefits to the Manager and its affiliates. The Board focused on profitability of the Manager’s relationships with the Funds before taxes and distribution expenses. The Board recognized that the Manager should earn a reasonable level of profits for the services it provides to each Fund.
The Board also considered that Wilshire Funds Management (“Wilshire”) serves as a consultant to the Manager in preparing statistical and other factual information for use in the creation and maintenance of the asset allocation models for the AZL MVP Fusion Funds, pursuant to an agreement between the Manager and Wilshire. Wilshire serves as a consultant to the Manager with respect to selecting the AZL MVP Fusion Funds’ underlying funds and the asset allocations among the underlying funds. The Manager, not any Fund, pays a consultant fee to Wilshire.
(4) and (5) The extent to which economies of scale would be realized as the Funds grow, and whether fee levels reflect these economies of scale. The Board noted that the advisory fee schedules for the Funds do not contain breakpoints that reduce the fee rate on assets above specified levels. The Board recognized that breakpoints may be an appropriate way for the Manager to share its economies of scale, if any, with Funds that have substantial assets. The Board found there was no uniform methodology for establishing breakpoints
16
that give effect to Fund-specific services provided by the Manager. The Board noted that in the fund industry as a whole, as well as among funds similar to the Funds, there is no uniformity or pattern in the fees and asset levels at which breakpoints (if any) apply. Depending on the age, size, and other characteristics of a particular fund and its manager’s cost structure, different conclusions can be drawn as to whether there are economies of scale to be realized at any particular level of assets, notwithstanding the intuitive conclusion that such economies exist, or will be realized at some level of total assets. Moreover, because different managers have different cost structures and service models, it is difficult to draw meaningful conclusions from the breakpoints that may have been adopted by other funds. The Board also noted that the advisory agreements for many funds do not have breakpoints at all, or if breakpoints exist, they may be at asset levels significantly greater than those of the individual Funds. The Board noted that the total assets in all of the Funds, as of June
30, 2022, were approximately $8.2 billion and that the largest Fund, the AZL MVP Growth Index Strategy Fund, had assets of approximately $2.1 billion.
The Board noted that the Manager has agreed to temporarily limit Fund expenses under the Expense Limitation Agreement, which has the effect of reducing expenses similar to implementation of advisory fee breakpoints. The Manager has committed to continue to consider the continuation of expense limits and/or advisory fee breakpoints as Fund assets change. The Board receives quarterly reports on the level of Fund assets. The Board expects to continue to consider: (a) the extent to which economies of scale have been realized, and (b) whether the advisory fee should be modified, either in connection with the next renewal of the Management Agreement or by modifying the Expense Limitation Agreement, to reflect such economies of scale, if any.
Having taken these factors into account, the Board concluded that the absence of breakpoints in the Funds’ advisory fee rate schedules was acceptable under each Fund’s circumstances.
In conclusion, after full consideration of the above factors, as well as such other factors as each member of the Board considered instructive in evaluating the Management Agreement, the Board concluded that the advisory fees were reasonable, and that the continuation of the Management Agreement was in the best interest of the Funds.
17
Information about the Board of Trustees and Officers (Unaudited)
The Trust is managed by the Trustees in accordance with the laws of the state of Delaware governing business trusts. In addition to serving on the Board of Trustees of the Trust, each Trustee serves on the Board of the Allianz Variable Insurance Products Trust (“VIP Trust”) and the AIM ETF Products Trust (“ETF Trust”) (collectively, the Trust, the VIP Trust, and ETF Trust are the “AIM Complex”). There are currently seven Trustees, one of whom is an “interested person” of the Trust within the meaning of that term under the 1940 Act. The Trustees and Officers of the Trust, and their addresses, years of birth, their positions held with the Trust, their terms of office with the Trust and length of time served, their principal occupation(s) during the past five years, the number of portfolios in the Trust they oversee, and their other directorships held during the past five years are as follows:
Independent Trustees(1)
| Name, Address, and Birth Year | Positions Held with AIM Complex | Term of Office(2)/Length of Time Served | Principal Occupation(s) During Past 5 Years | Number of Portfolios Overseen for the AIM Complex | Other 5 Years | |||||
Peggy L. Ettestad (1957) 5701 Golden Hills Drive Minneapolis, MN 55416 | Lead Independent Trustee | Since 10/14 (Trustee since 2/07) | Managing Director, Red Canoe Management Consulting LLC, 2008 to present | 50 | None | |||||
Tamara Lynn Fagely (1958) 5701 Golden Hills Drive Minneapolis, MN 55416 | Trustee | Since 12/17 | Retired; previously, Chief Operations Officer, Hartford Funds, 2012 to 2013 | 50 | Diamond Hill Funds (10 Funds) | |||||
Richard H. Forde (1953) 5701 Golden Hills Drive Minneapolis, MN 55416 | Trustee | Since 12/17 | Retired; previously, Member of the Board and Chairman of the Finance and Investment Committee, Connecticut Water Service, Inc., 2013 to 2019 | 50 | Connecticut Water Service, Inc. | |||||
Jack Gee (1959) 5701 Golden Hills Drive Minneapolis, MN 55416 | Trustee | Since 1/22 (Consultant to the Independent Trustees since 2/20)(3) | Retired; previously, Managing Director, BlackRock, Inc., Treasurer and Chief Financial Officer U.S. iShares, 2004 to 2019 | 50 | Engine No. 1 ETF Trust (2 Funds); Esoterica Thematic Trust (2019 - 2020) | |||||
Claire R. Leonardi (1955) 5701 Golden Hills Drive Minneapolis, MN 55416 | Trustee | Since 2/04 | Retired; previously, CEO, Health eSense Inc. (a medical device company), 2015 to 2018, and Connecticut Innovations, Inc. (a venture capital firm), 2012 to 2015 | 50 | None | |||||
Dickson W. Lewis (1948) 5701 Golden Hills Drive Minneapolis, MN 55416 | Trustee | Since 2/04 | Retired; previously, senior executive for Lifetouch National School Studios (a photography company), 2006 to 2014, Jostens (a producer of year books and class rings), 2001 to 2006, and Fortis Financial Group, 1997 to 2001 | 50 | None | |||||
18
Interested Trustee(4)
| Name, Address, and Birth Year | Positions Held AIM Complex | Term of Office(2)/Length of Time Served | Principal Occupation(s) During Past 5 Years | Number of Portfolios Overseen for the AIM Complex | Other 5 Years | |||||
| Brian Muench (1970) 5701 Golden Hills Drive Minneapolis, MN 55416 | Trustee | Since 6/11 | President, Allianz Investment Management LLC, 2010 to present; Vice President, Allianz Life, 2011 to present | 50 | None | |||||
| (1) | Each of the Independent Trustees is a member of the Audit Committee. |
| (2) | Indefinite. |
| (3) | Prior to January 1, 2022, Mr. Gee served as a consultant to the Independent Trustees since February 2020, during which he attended meetings of the Board and its standing committees, including the audit committee, solely in his capacity as a consultant, and was not entitled to vote. |
| (4) | Is an “interested person,” as defined by the 1940 Act, due to employment by Allianz Life and the Manager. |
Officers
| Name, Address, and Birth Year | Positions Held with AIM Complex | Term of Length of Time Served | Principal Occupation(s) During Past 5 Years | |||
| Brian Muench (1970) 5701 Golden Hills Drive Minneapolis, MN 55416 | President | Since 11/10 | President, Allianz Investment Management LLC, November 2010 to present; Vice President, Allianz Life, 2011 to present. | |||
| Erik Nelson (1972) 5701 Golden Hills Drive Minneapolis, MN 55416 | Secretary | Since 12/20 | Chief Legal Officer, Allianz Investment Management LLC; Associate General Counsel, Senior Counsel, Allianz Life, 2008 to present. | |||
| Bashir C. Asad (1963) Citi Fund Services Ohio, Inc. 4400 Easton Commons, Suite 200 Columbus, OH 43219 | Treasurer, Principal Accounting Officer and Principal Financial Officer | Since 06/16 | Senior Vice President, Citi Fund Services Ohio, Inc., 2011 to present. | |||
| Chris R. Pheiffer (1968) 5701 Golden Hills Drive Minneapolis, MN 55416 | Chief Compliance Officer(2) and Anti-Money Laundering Compliance Officer | Since 02/14 | Chief Compliance Officer of the Trust and the VIP Trust, 2014 to present, and the ETF Trust, 2020 to present. | |||
| Michael Tanski (1970) 5701 Golden Hills Drive Minneapolis, MN 55416 | Vice President | Since 04/09 | Assistant Vice President, Allianz Investment Management LLC, 2013 to present. | |||
| (1) | Indefinite. |
| (2) | The Manager and the Trust are parties to a Compliance Services Agreement under which the Manager provides an employee of the Manager or one of its affiliates to act as the Trust’s Chief Compliance Officer. |
The Fund’s Statement of Additional Information (“SAI”) contains additional information about the Trust’s Trustees and Officers. The SAI is available without charge, upon request, by calling toll-free 800-624-0197 or at https://www.allianzlife.com.
19
The Allianz VIP Fund of Funds are distributed by Allianz Life Financial Services, LLC. These Funds are not FDIC Insured. | ANNRPT1222 02/23 |
AZL® DFA Multi-Strategy Fund
Annual Report
December 31, 2022

This report is submitted for the general information of the shareholder of the Fund. The report is not authorized for distribution to prospective investors in the Fund unless preceded or accompanied by an effective prospectus, which contains details concerning the sales charges and other pertinent information.
Allianz Investment Management LLC serves as the Manager for the AZL® DFA Multi-Strategy Fund.
What factors affected the Fund’s performance during the year ended December 31, 2022?*
For the year ended December 31, 2022, the AZL DFA Multi-Strategy Fund (the “Fund”) returned (11.41)%. That compared to (18.11)%, (13.01)% and (15.91)% total return for its benchmarks, the S&P 500 Index, the Bloomberg U.S. Aggregate Bond Index, and the Moderate Composite Index, respectively.1
The Fund is a fund of funds that pursues broad diversification across three equity sub-portfolios and one fixed income sub-portfolio. The four underlying sub-portfolios are managed by Dimensional Fund Advisors. Generally, the Fund allocates 50% to 70% of its assets to the underlying equity funds and between 30% and 50% to the underlying fixed-income fund.
Domestic equities began the year at near all-time highs, but began to decline early in 2022 due to a combination of rising inflation and geopolitical uncertainties. The Federal Reserve (the Fed) shifted to a more hawkish policy approach in an attempt to bring inflation under control, as did many global central banks. The Fed increased the federal funds rate multiple times throughout the year for a combined total of 425 basis points. Russia’s invasion of Ukraine also weighed on global markets, although European countries were particularly hard hit due to their geographic proximity to the conflict and reliance on Russian commodities such as energy and wheat.
Despite strong labor rates throughout developed markets, high inflation and an anticipated economic slowdown had a negative effect on investor sentiment for the year under review. The S&P 500 declined as company valuations struggled under the higher interest rate environment. Investors grew risk averse as fears of an economic recession loomed, selling off equity positions to avoid the volatility in equity markets. By the end of the period under review, U.S. equities had experienced their worst year since the Great Financial Crisis of 2008, and international equities performed only slightly better.
The Fed’s actions made short-term financing more expensive, and the U.S. Treasury yield curve ultimately inverted with 2-year Treasuries yielding more than 10-year Treasuries by 0.55% at the end of 2022. The monetary tightening generated headwinds for domestic fixed income markets as investors demanded higher yields to account for rising rates. Widening credit spreads further weighed on prices on lower-quality bonds as investors demanded to be compensated for rising credit risks. Nearly all fixed income sectors finished with negative performance.
The Fund, which invests in both U.S. and international markets, outperformed its composite benchmark in 2022. The Fund’s exposure to developed markets non-U.S. stocks contributed to its relative performance, as international stocks generally outperformed U.S. equities for the period. However, the Fund’s value bias detracted from its international equity holdings in the broader international equity space, which offset some of that outperformance. Within U.S. equities, a value preference among smaller market capitalization stocks added to relative performance.
The Fund’s fixed income holdings outperformed its fixed income benchmark. This outperformance was due largely to the Fund’s underweight to duration, which contributed in the rising interest rate environment.
Past performance does not guarantee future results.
| * | The Fund’s portfolio composition is subject to change. There is no guarantee that any sectors mentioned will continue to perform as described or that securities in such sectors will be held by the Fund in the future. The information contained in this commentary is for informational purposes only and should not be construed as a recommendation to purchase or sell securities in the sector mentioned. The Fund’s holdings and weightings are as of December 31, 2022. |
| 1 | For a complete description of the Fund’s performance benchmark please refer to page 2 of this report. |
1
AZL® DFA Multi-Strategy Fund Review (Unaudited) |
Fund Objective
The Fund’s investment objective is to seek long-term capital appreciation. This objective may be changed by the Trustees of the Fund without shareholder approval. The Fund seeks to achieve its objective by investing in a combination of DFA Underlying Funds that represent different classes in the Fund’s asset allocation.
Investment Concerns
The Fund invests in underlying funds, so its investment performance is directly related to the performance of those underlying funds. Before investing, investors should assess the risks associated with and types of investments made by each of the underlying funds in which the Fund invests.
International investing may involve risk of capital loss from unfavorable fluctuations in currency values, from differences in generally accepted accounting principles or from economic or political instability in other nations.
Value-based investments are subject to the risk that the broad market may not recognize their intrinsic value.
Small- to mid-capitalization companies typically have a higher risk of failure and historically have experienced a greater degree of volatility.
Debt securities held by an underlying fund may decline in value due to rising interest rates.
Investing in derivative instruments involves risks that may be different from or greater than the risk associated with investing directly in securities or other traditional instruments.
For a complete description of these and other risks associated with investing in the Fund, please refer to the Fund’s prospectus.
Growth of $10,000 Investment

The chart above represents a comparison of a hypothetical investment in the Fund versus a similar investment in the Fund’s benchmarks and represents the reinvestment of dividends and capital gains in the Fund.
| Average Annual Total Returns as of December 31, 2022 | ||||||||||||||||||||
| 1 Year | 3 Years | 5 Years | 10 Years | |||||||||||||||||
AZL® DFA Multi-Strategy Fund | �� | (11.41 | )% | 3.71 | % | 4.12 | % | 6.80 | % | |||||||||||
Bloomberg U.S. Aggregate Bond Index | (13.01 | )% | (2.71 | )% | 0.02 | % | 1.06 | % | ||||||||||||
Moderate Composite Index | (15.91 | )% | 4.00 | % | 6.07 | % | 8.14 | % | ||||||||||||
S&P 500 Index | (18.11 | )% | 7.66 | % | 9.42 | % | 12.56 | % | ||||||||||||
Past performance does not guarantee future results. The performance data quoted represents past performance and current returns may be lower or higher. The investment return and principal value will fluctuate so that an investor’s shares, when redeemed, may be worth more or less than the original cost. To obtain performance information current to the most recent month end, please visit www.Allianzlife.com.
| Expense Ratio | Gross | ||||
AZL® DFA Multi-Strategy Fund | 0.95 | % | |||
The above expense ratio is based on the current Fund prospectus dated April 29, 2022. The Manager and the Fund have entered into a written contract limiting operating expenses, excluding certain expenses (such as interest expense and acquired fund fees and expenses), to 0.20% through April 30, 2024. Additional information pertaining to the December 31, 2022 expense ratio can be found in the Financial Highlights.
Acquired fund fees and expenses are incurred indirectly by the Fund through the valuation of the Fund’s investments in the permitted Underlying Funds. Accordingly, acquired fund fees and expenses affect the Fund’s total returns. Because these fees and expenses are not included in the Fund’s financial highlights, the Fund’s total annual fund operating expenses, as shown in the current prospectus, do not correlate to the ratios of expenses to average net assets shown in the Financial Highlights. Without acquired fund fees and expenses the Fund’s gross expense ratio would be 0.07%.
The total return of the Fund does not reflect the effect of any insurance charges, the annual maintenance fee or the deduction of taxes that a shareholder would pay on Fund distributions or the redemption of Fund shares. Such charges, fees and tax payments would reduce the performance quoted.
The Fund’s performance is measured against the Standard & Poor’s 500 Index (“S&P 500”), the Bloomberg U.S. Aggregate Bond Index and the Moderate Composite Index (“Composite”). The S&P 500 is representative of 500 selected common stocks, most of which are listed on the New York Stock Exchange, and is a measure of the U.S. Stock market as a whole. The Bloomberg U.S.
Aggregate Bond Index is a market value-weighted performance benchmark for investment-grade fixed-rate debt issues, including government, corporate, asset-backed, and mortgage-backed securities, with maturities of at least one year. The Composite is a blended index comprised of (60%) S&P 500 and (40%) Bloomberg U.S. Aggregate Bond Index. These indexes are unmanaged and do not reflect the deduction of fees associated with a mutual fund, such as investment management and fund accounting fees. The Fund’s performance reflects the deduction of fees for services provided to the Fund. Investors cannot invest directly in an index.
2
AZL DFA Multi-Strategy Fund
(Unaudited)
As a shareholder of the AZL DFA Multi-Strategy Fund (the “Fund”), you incur ongoing costs, including management fees, distribution fees, and other Fund expenses. These examples are intended to help you understand your ongoing costs (in dollars) of investing in the Fund and to compare these costs with the ongoing costs of investing in other mutual funds. Please note that the expenses shown in each table do not reflect expenses that apply to the subaccount or the insurance contract. If the expenses that apply to the subaccount or the insurance contract were included, your costs would have been higher.
These examples are based on an investment of $1,000 invested at the beginning of the period and held for the periods presented below.
The Actual Expense table below provides information about actual account values and actual expenses. You may use the information below, together with the amount you invested, to estimate the expenses that you paid over the period. Simply divide your account value by $1,000 (for example, an $8,600 account value divided by $1,000 = 8.6), then multiply the result by the number in the table under the heading entitled “Expenses Paid During Period” to estimate the expenses you paid on your account during this period.
| Beginning Account Value 7/1/22 | Ending Account Value 12/31/22 | Expenses Paid During Period 7/1/22 - 12/31/22* | Annualized Expense Ratio During Period 7/1/22 - 12/31/22 | |||||||||||||||||
AZL DFA Multi-Strategy Fund | $ | 1,000.00 | $ | 1,026.10 | $ | 0.41 | 0.08 | % | ||||||||||||
The Hypothetical Expense table below provides information about hypothetical account values and hypothetical expenses based on the Fund’s actual expense ratio and an assumed rate of return of 5% per year before expenses, which is not the Fund’s actual return. The hypothetical account values and expenses may not be used to estimate the actual ending account balance or expenses you paid for the period. You may use this information to compare this 5% hypothetical example with the 5% hypothetical examples that appear in the shareholder reports of other funds.
| Beginning Account Value 7/1/22 | Ending Account Value 12/31/22 | Expenses Paid During Period 7/1/22 - 12/31/22* | Annualized Expense Ratio During Period 7/1/22 - 12/31/22 | |||||||||||||||||
AZL DFA Multi-Strategy Fund | $ | 1,000.00 | $ | 1,024.80 | $ | 0.41 | 0.08 | % | ||||||||||||
| * | Expenses are equal to the average account value multiplied by the Fund’s annualized expense ratio multiplied by 184/365 (the number of days in the most recent fiscal half-year divided by the number of days in the fiscal year). |
Portfolio Composition
(Unaudited)
| Investments | Percent of Net Assets | ||||
Domestic Equity Funds | 48.0 | % | |||
Fixed Income Fund | 39.9 | ||||
International Equity Fund | 12.1 | ||||
|
| ||||
Total Investment Securities | 100.0 | ||||
Net other assets (liabilities) | — | † | |||
|
| ||||
Net Assets | 100.0 | % | |||
|
| ||||
| † | Represents less than 0.05%. |
3
AZL DFA Multi-Strategy Fund
Schedule of Portfolio Investments
December 31, 2022
| Shares | Value | |||||||
| Affiliated Investment Companies (100.0%): | ||||||||
| Domestic Equity Funds (48.0%): | ||||||||
| 22,347,069 | AZL DFA U.S. Core Equity Fund | $ | 274,198,533 | |||||
| 7,725,096 | AZL DFA U.S. Small Cap Fund | 73,002,157 | ||||||
|
| |||||||
| 347,200,690 | ||||||||
|
| |||||||
| Fixed Income Fund (39.9%): | ||||||||
| 34,146,314 | AZL DFA Five-Year Global Fixed Income Fund | 288,877,815 | ||||||
|
| |||||||
| (a) | See Federal Tax Information listed in the Notes to the Financial Statements. |
| † | Represents less than 0.05%. |
| Percentages | indicated are based on net assets as of December 31, 2022 |
| Shares | Value | |||||||
| Affiliated Investment Companies, continued | ||||||||
| International Equity Fund (12.1%): | ||||||||
| 9,331,334 | AZL DFA International Core Equity Fund | $ | 87,434,596 | |||||
|
| |||||||
Total Affiliated Investment Companies (Cost $730,848,594) | 723,513,101 | |||||||
|
| |||||||
Total Investment Securities | ||||||||
(Cost $730,848,594) — 100.0%(a) | 723,513,101 | |||||||
Net other assets (liabilities) — 0.0%† | (199,330 | ) | ||||||
|
| |||||||
Net Assets — 100.0% | $ | 723,313,771 | ||||||
|
| |||||||
See accompanying notes to the financial statements.
4
AZL DFA Multi-Strategy Fund
Statement of Assets and Liabilities
December 31, 2022
Assets: | |||||
Investments in affiliates, at cost | $ | 730,848,594 | |||
|
| ||||
Investments in affiliates, at value | $ | 723,513,101 | |||
Receivable for affiliated investments sold | 586,417 | ||||
Prepaid expenses | 6,586 | ||||
|
| ||||
Total Assets | 724,106,104 | ||||
|
| ||||
Liabilities: | |||||
Cash overdraft | 586,417 | ||||
Payable for capital shares redeemed | 138,888 | ||||
Management fees payable | 31,166 | ||||
Administration fees payable | 8,938 | ||||
Custodian fees payable | 923 | ||||
Administrative and compliance services fees payable | 1,892 | ||||
Transfer agent fees payable | 748 | ||||
Trustee fees payable | 4,728 | ||||
Other accrued liabilities | 18,633 | ||||
|
| ||||
Total Liabilities | 792,333 | ||||
|
| ||||
Net Assets | $ | 723,313,771 | |||
|
| ||||
Net Assets Consist of: | |||||
Paid in capital | $ | 653,456,952 | |||
Total distributable earnings | 69,856,819 | ||||
|
| ||||
Net Assets | $ | 723,313,771 | |||
|
| ||||
Shares of beneficial interest (unlimited number of shares authorized, no par value) | 59,698,814 | ||||
Net Asset Value (offering and redemption price per share) | $ | 12.12 | |||
|
|
For the Year Ended December 31, 2022
Investment Income: | |||||
Dividends from affiliates | $ | 17,629,583 | |||
Dividends from non-affiliates | 4 | ||||
|
| ||||
Total Investment Income | 17,629,587 | ||||
|
| ||||
Expenses: | |||||
Management fees | 397,328 | ||||
Administration fees | 70,075 | ||||
Custodian fees | 4,449 | ||||
Administrative and compliance services fees | 11,186 | ||||
Transfer agent fees | 5,824 | ||||
Trustee fees | 44,625 | ||||
Professional fees | 37,915 | ||||
Shareholder reports | 20,484 | ||||
Other expenses | 12,238 | ||||
|
| ||||
Total expenses | 604,124 | ||||
|
| ||||
Net Investment Income/(Loss) | 17,025,463 | ||||
|
| ||||
Net realized and Change in net unrealized gains/losses on investments: | |||||
Net realized gains/(losses) on affiliated underlying funds | (1,966,069 | ) | |||
Net realized gains distributions from affiliated underlying funds | 64,023,392 | ||||
Change in net unrealized appreciation/depreciation on affiliated underlying funds | (183,469,466 | ) | |||
|
| ||||
Net realized and Change in net unrealized gains/losses on investments | (121,412,143 | ) | |||
|
| ||||
Change in Net Assets Resulting From Operations | $ | (104,386,680 | ) | ||
|
|
See accompanying notes to the financial statements.
5
AZL DFA Multi-Strategy Fund
Statements of Changes in Net Assets
For the Year Ended | For the Year Ended | |||||||||
Change In Net Assets: | ||||||||||
Operations: | ||||||||||
Net investment income/(loss) | $ | 17,025,463 | $ | 4,802,539 | ||||||
Net realized gains/(losses) on investments | 62,057,323 | 77,843,439 | ||||||||
Change in unrealized appreciation/depreciation on investments | (183,469,466 | ) | 41,094,500 | |||||||
|
|
|
| |||||||
Change in net assets resulting from operations | (104,386,680 | ) | 123,740,478 | |||||||
|
|
|
| |||||||
Distributions to Shareholders: | ||||||||||
Distributions | (82,510,932 | ) | (61,195,147 | ) | ||||||
|
|
|
| |||||||
Change in net assets resulting from distributions to shareholders | (82,510,932 | ) | (61,195,147 | ) | ||||||
|
|
|
| |||||||
Capital Transactions: | ||||||||||
Proceeds from shares issued | 589,750 | 4,709,796 | ||||||||
Proceeds from dividends reinvested | 82,510,932 | 61,195,146 | ||||||||
Value of shares redeemed | (110,533,399 | ) | (131,578,754 | ) | ||||||
|
|
|
| |||||||
Change in net assets resulting from capital transactions | (27,432,717 | ) | (65,673,812 | ) | ||||||
|
|
|
| |||||||
Change in net assets | (214,330,329 | ) | (3,128,481 | ) | ||||||
Net Assets: | ||||||||||
Beginning of period | 937,644,100 | 940,772,581 | ||||||||
|
|
|
| |||||||
End of period | $ | 723,313,771 | $ | 937,644,100 | ||||||
|
|
|
| |||||||
Share Transactions: | ||||||||||
Shares issued | 45,986 | 298,193 | ||||||||
Dividends reinvested | 7,022,207 | 4,093,321 | ||||||||
Shares redeemed | (8,112,112 | ) | (8,451,340 | ) | ||||||
|
|
|
| |||||||
Change in shares | (1,043,919 | ) | (4,059,826 | ) | ||||||
|
|
|
| |||||||
See accompanying notes to the financial statements.
6
AZL DFA Multi-Strategy Fund
(Selected data for a share of beneficial interest outstanding throughout the periods indicated. Does not reflect fees or expenses associated with the separate accounts that invest in the Fund or in any variable annuity contracts or variable life insurance policy for which the Fund serves as an investment vehicle.)
| Year Ended December 31, 2022 | Year Ended December 31, 2021 | Year Ended December 31, 2020 | Year Ended December 31, 2019 | Year Ended December 31, 2018 | |||||||||||||||||||||
Net Asset Value, Beginning of Period | $ | 15.44 | $ | 14.52 | $ | 14.36 | $ | 12.99 | $ | 14.19 | |||||||||||||||
|
|
|
|
|
|
|
|
|
| ||||||||||||||||
Investment Activities: | |||||||||||||||||||||||||
Net Investment Income/(Loss) | 0.29 | (a) | 0.08 | (a) | 0.22 | (a) | 0.38 | (a) | 0.15 | ||||||||||||||||
Net Realized and Unrealized Gains/(Losses) on Investments | (2.10 | ) | 1.89 | 1.20 | 1.73 | (0.97 | ) | ||||||||||||||||||
|
|
|
|
|
|
|
|
|
| ||||||||||||||||
Total from Investment Activities | (1.81 | ) | 1.97 | 1.42 | 2.11 | (0.82 | ) | ||||||||||||||||||
|
|
|
|
|
|
|
|
|
| ||||||||||||||||
Distributions to Shareholders From: | |||||||||||||||||||||||||
Net Investment Income | (0.16 | ) | (0.25 | ) | (0.45 | ) | (0.16 | ) | (0.17 | ) | |||||||||||||||
Net Realized Gains | (1.35 | ) | (0.80 | ) | (0.81 | ) | (0.58 | ) | (0.21 | ) | |||||||||||||||
|
|
|
|
|
|
|
|
|
| ||||||||||||||||
Total Dividends | (1.51 | ) | (1.05 | ) | (1.26 | ) | (0.74 | ) | (0.38 | ) | |||||||||||||||
|
|
|
|
|
|
|
|
|
| ||||||||||||||||
Net Asset Value, End of Period | $12.12 | $15.44 | $14.52 | $14.36 | $12.99 | ||||||||||||||||||||
|
|
|
|
|
|
|
|
|
| ||||||||||||||||
Total Return (b) | (11.41 | )% | 13.81 | % | 10.64 | % | 16.57 | % | (5.91 | )% | |||||||||||||||
Ratios to Average Net Assets/Supplemental Data: | |||||||||||||||||||||||||
Net Assets, End of Period (000’s) | $ | 723,314 | $ | 937,644 | $ | 940,773 | $ | 983,277 | $ | 972,134 | |||||||||||||||
Net Investment Income/(Loss) | 2.14 | % | 0.50 | % | 1.60 | % | 2.74 | % | 0.84 | % | |||||||||||||||
Expenses Before Reductions*(c) | 0.08 | % | 0.07 | % | 0.08 | % | 0.07 | % | 0.07 | % | |||||||||||||||
Expenses Net of Reductions* | 0.08 | % | 0.07 | % | 0.08 | % | 0.07 | % | 0.07 | % | |||||||||||||||
Portfolio Turnover Rate | 10 | % | 6 | % | 18 | % | 6 | % | 7 | % | |||||||||||||||
| * | The expense ratios exclude the impact of fees/expenses paid by each underlying fund. |
| (a) | Calculated using the average shares method. |
| (b) | The returns include reinvested dividends and fund level expenses, but exclude insurance contract charges. If these charges were included, the returns would have been lower. |
| (c) | Excludes fee reductions. If such fee reductions had not occurred, the ratios would have been as indicated. |
See accompanying notes to the financial statements.
7
AZL DFA Multi-Strategy Fund
Notes to the Financial Statements
December 31, 2022
1. Organization
The Allianz Variable Insurance Products Fund of Funds Trust (the “Trust”) was organized as a Delaware statutory trust on June 16, 2004. The Trust is an open-end management investment company registered under the Investment Company Act of 1940, as amended, (the “1940 Act”) and thus is determined to be an investment company, and follows the investment company accounting and reporting guidance under Financial Accounting Standards Board (“FASB”) Accounting Standards Codification (“ASC”) Topic 946 “Financial Services—Investment Companies”. The Trust consists of 12 separate investment portfolios (collectively, the “Funds”), of which one is included in this report, the AZL DFA Multi- Strategy Fund (the “Fund”), and 11 are presented in separate reports. The Fund is a diversified series of the Trust.
The Fund is a “fund of funds”, which means that the Fund invests primarily in other mutual funds (the “Underlying Funds”). Underlying Funds invest in stocks, bonds, and other securities and reflect varying amounts of potential investment risk and reward. The Underlying Funds record their investments at fair value. Periodically, the Fund will adjust its asset allocation as it seeks to achieve its investment objective.
The Trust is authorized to issue an unlimited number of shares of the Fund without par value. Shares of the Fund are available through the variable annuity contracts offered through the separate accounts of participating insurance companies. Currently, the Fund only offers its shares to separate accounts of Allianz Life Insurance Company of North America and Allianz Life Insurance Company of New York, affiliates of the Trust and the Manager, as defined below.
Under the Trust’s organizational documents, its officers and trustees are indemnified against certain liabilities arising out of the performance of their duties to the Fund. In addition, in the normal course of business, the Fund may enter into contracts with its vendors and others that provide for general indemnifications. The Fund’s maximum exposure under these arrangements is unknown, as this would involve future claims that may be made against the Fund. However, based on experience, the Fund expects that risk of loss to be remote.
2. Significant Accounting Policies
The following is a summary of significant accounting policies followed by the Fund in the preparation of its financial statements. The policies conform with U.S. generally accepted accounting principles (“U.S. GAAP”). The preparation of financial statements requires management to make certain estimates and assumptions that affect the reported amounts of assets and liabilities and disclosure of contingent assets and liabilities at the date of the financial statements and the reported amounts of increases and decreases in net assets from operations during the reporting period. Actual results could differ from those estimates.
Security Valuation
The Fund records its investments at fair value. Fair value is defined as the price that would be received to sell an asset or paid to transfer a liability in an orderly transaction between willing market participants at the measurement date. The valuation techniques used to determine fair value are further described in Note 4 below.
Investment Transactions and Investment Income
Investment transactions are accounted for on trade date. Net realized gains and losses on investments sold and on foreign currency transactions are recorded on the basis of identified cost. Interest income is recorded on the accrual basis and includes, where applicable, the amortization of premiums or accretion of discounts. Dividend income is recorded on the ex-dividend date except in the case of foreign securities, in which case dividends are recorded as soon as such information becomes available.
Distributions to Shareholders
Distributions to shareholders are recorded on the ex-dividend date. The Fund distributes its dividends from net investment income and net realized capital gains, if any, on an annual basis. The amount of distributions from net investment income and from net realized gains is determined in accordance with federal income tax regulations, which may differ from U.S. GAAP. These “book/tax” differences are either temporary or permanent in nature. To the extent these differences are permanent in nature (e.g., return of capital, net operating loss, reclassification of certain market discounts, gain/loss, paydowns, and distributions), such amounts are reclassified within the composition of net assets based on their federal tax-basis treatment; temporary differences (e.g., wash sales and differing treatment on certain investments) do not require reclassification. Distributions to shareholders that exceed net investment income and net realized gains for tax purposes are reported as distributions of capital.
Expense Allocation
Expenses directly attributable to the Fund are charged directly to the Fund, while expenses attributable to more than one Fund are allocated among the respective Funds based upon relative net assets or some other reasonable method. Expenses which are attributable to more than one Trust are allocated across the Allianz Variable Insurance Products Trust, Allianz Variable Insurance Products Fund of Funds Trust and AIM ETF Products Trust based upon relative net assets or another reasonable basis. Allianz Investment Management LLC (the “Manager”), serves as the investment manager for the Trust, Allianz Variable Insurance Products Trust and AIM ETF Products Trust.
This report does not reflect fees or expenses associated with the separate accounts that invest in the Fund or in any variable annuity contracts or variable life insurance policy for which the Fund serves as an investment vehicle.
Affiliated Securities Transactions
Pursuant to Rule 17a-7 under the 1940 Act, the Fund may engage in securities transactions with affiliated investment companies and advisory accounts managed by the Manager. Any such purchase or sale transaction must be effected without a brokerage commission or other remuneration, except for customary transfer fees. The transaction must be effected at the current market price, which is either the security’s last sale price on an exchange or, if there are no transactions in the security that day, at the average of the highest bid and lowest asked price. During the year ended December 31, 2022, the Fund did not engage in any Rule 17a-7 transactions.
8
AZL DFA Multi-Strategy Fund
Notes to the Financial Statements
December 31, 2022
3. Fees and Transactions with Affiliates and Other Parties
The Manager provides investment advisory and management services for the Fund. The Manager has contractually agreed to waive fees and reimburse the Fund to limit the annual expenses, excluding interest expense (e.g., cash overdraft fees), taxes, brokerage commissions, acquired fund fees and expenses, other expenditures that are capitalized in accordance with U.S. GAAP and other extraordinary expenses not incurred in the ordinary course of the Fund’s business, based on the daily net assets of the Fund, through April 30, 2024. Expenses incurred for investment advisory and management services are reflected on the Statement of Operations as “Management fees.”
For the year ended December 31, 2022, the annual rate due to the Manager and the annual expense limit were as follows:
| Annual Rate | Annual Expense Limit | |||||||||
AZL DFA Multi-Strategy Fund | 0.05 | % | 0.20 | % | ||||||
Any amounts contractually waived or reimbursed by the Manager with respect to the annual expense limit in a particular fiscal year will be subject to repayment by the Fund to the Manager to the extent that from time to time through the next three fiscal years the repayment will not cause the Fund’s expenses to exceed the lesser of the stated limit at the time of the waiver or the current stated limit. Any amounts recouped by the Manager during the period are reflected on the Statement of Operations as “Recoupment of prior expenses reimbursed by the Manager.” At December 31, 2022, there were no remaining contractual reimbursements subject to repayment by the Fund in subsequent years.
Management fees, which the Manager may waive in order to maintain more competitive expense ratios, are not subject to repayment in subsequent years. Information on the total amount waived/ reimbursed by the Manager or repaid to the Manager by the Fund during the period can be found on the Statement of Operations, as applicable. During the year ended December 31, 2022, there were no such waivers.
The Manager or an affiliate of the Manager serves as the investment adviser of certain underlying funds in which the Fund invests. At December 31, 2022, these underlying funds are noted as Affiliated Investment Companies in the Fund’s Schedule of Portfolio Investments. Additional information, including financial statements, about these Funds is available at www.allianzlife.com. The Manager or an affiliate of the Manager is paid a separate fee from the underlying funds for such services. A summary of the Fund’s investments in affiliated investment companies for the year ended December 31, 2022 is as follows:
| Value 12/31/21 | Purchases at Cost | Proceeds from Sales | Net Realized Gains (Losses) | Change in Net Unrealized Appreciation (Depreciation) | Value 12/31/22 | Shares as of | Dividend Income | Net Realized Distributions | |||||||||||||||||||||||||||||||||||||
AZL DFA Five-Year Global Fixed Income Fund | $ | 367,167,703 | $ | 13,022,045 | $ | (54,338,199) | $ | (6,558,172 | ) | $ | (30,415,562) | $ | 288,877,815 | 34,146,314 | $ | 12,682,812 | $ | — | |||||||||||||||||||||||||||
AZL DFA International Core Equity Fund | 112,815,044 | 10,091,526 | (10,858,008) | 283,054 | (24,897,020) | 87,434,596 | 9,331,334 | 2,292,117 | 7,703,740 | ||||||||||||||||||||||||||||||||||||
AZL DFA U.S. Core Equity Fund | 360,655,079 | 39,180,220 | (33,642,977) | 4,360,004 | (96,353,793) | 274,198,533 | 22,347,069 | 2,183,665 | 36,996,554 | ||||||||||||||||||||||||||||||||||||
AZL DFA U.S. Small Cap Fund | 97,278,433 | 19,794,086 | (12,216,316) | (50,955) | (31,803,091) | 73,002,157 | 7,725,096 | 470,989 | 19,323,098 | ||||||||||||||||||||||||||||||||||||
|
|
|
|
|
|
|
|
|
|
|
|
|
|
|
|
|
| ||||||||||||||||||||||||||||
| $ | 937,916,259 | $ | 82,087,877 | $ | (111,055,500) | $ | (1,966,069) | $ | (183,469,466) | $ | 723,513,101 | 73,549,813 | $ | 17,629,583 | $ | 64,023,392 | |||||||||||||||||||||||||||||
|
|
|
|
|
|
|
|
|
|
|
|
|
|
|
|
|
| ||||||||||||||||||||||||||||
Pursuant to separate agreements between the Trust and the Manager, the Manager provides a Chief Compliance Officer (“CCO”) and certain compliance oversight and regulatory filing services to the Trust. Under these agreements, the Manager is entitled to an amount equal to a portion of the compensation and certain other expenses related to the individuals performing the CCO and compliance oversight services, as well as $100 per hour for time incurred in connection with the preparation and filing of certain documents with the SEC. The fees are paid to the Manager on a quarterly basis. The total expenses incurred by the Fund for these services are reflected on the Statement of Operations as “Administrative and compliance services fees.”
Citi Fund Services Ohio, Inc. (“Citi” or the “Administrator”), a wholly owned subsidiary of Citigroup, Inc., with which an officer of the Trust is affiliated, serves as the Trust’s administrator and fund accountant, and assists the Trust in all aspects of its administration and operation. The Administrator is entitled to a fee, accrued daily and paid monthly. The Administrator is entitled to an annual fee for each additional class of shares of any Fund, certain annual fees in supporting fair value services, and a Trust-wide annual fee for providing infrastructure and support in implementing the written policies and procedures comprising the Fund’s compliance program. The Administrator is also reimbursed for certain expenses incurred. The total expenses incurred by the Fund for these services are reflected on the Statement of Operations as “Administration fees.”
FIS Investor Services LLC (“FIS”) serves as the Fund’s transfer agent. Under the Transfer Agent Agreement, the Trust pays FIS a fee for its services and reimburses FIS for all of their reasonable out-of-pocket expenses incurred in providing these services.
The Bank of New York Mellon (“BNY Mellon” or the “Custodian”) serves as the Trust’s custodian. For these services as custodian, the Funds pay BNY Mellon a fee based on a percentage of assets held on behalf of the Funds, plus certain out-of-pocket charges.
Allianz Life Financial Services, LLC (“ALFS”), an affiliate of the Manager, serves as distributor of the Fund. ALFS receives an annual Trust-wide annual fee of $7,500, paid by the Manager from its profits and not by the Trust, for recordkeeping and reporting services.
Certain Officers and Trustees of the Trust are affiliated with the Manager or the Administrator. Such Officers (except for the Trust’s CCO as noted above) and Trustees receive no compensation from the Trust for serving in their respective roles.
9
AZL DFA Multi-Strategy Fund
Notes to the Financial Statements
December 31, 2022
4. Investment Valuation Summary
The valuation techniques employed by the Fund, as described below, maximize the use of observable inputs and minimize the use of unobservable inputs in determining fair value. The inputs used for valuing the Fund’s investments are summarized in the three broad levels listed below:
| ● | Level 1 - quoted prices in active markets for identical assets |
| ● | Level 2 - other significant observable inputs (including quoted prices for similar securities, interest rates, prepayments speeds, credit risk, etc.) |
| ● | Level 3 - significant unobservable inputs (including the Fund’s own assumptions in determining the fair value of investments) |
Changes in valuation techniques may result in transfers in or out of an assigned level within the disclosure hierarchy. The inputs or methodology used for valuing investments is not necessarily an indication of the risk associated with investing in those investments.
Investments in other investment companies are valued at their published net asset value (“NAV”). Security prices are determined pursuant to valuation procedures approved by the Trust’s Board of Trustees (the “Board” or “Trustees”) as of the close of the New York Stock Exchange (“NYSE”) (generally 4:00 pm Eastern Time). The investments utilizing Level 1 valuations represent investments in open-end investment companies.
The Board has designated the Manager to perform the Fund’s fair value determinations in accordance with valuation procedures approved by the Board. The effect of using fair value pricing is that the Fund’s NAV will be subject to the judgment of the Manager. The Manager’s fair valuation process is subject to the oversight of the Board.
The following is a summary of the valuation inputs used as of December 31, 2022 in valuing the Fund’s investments based upon the three levels defined above:
| Investment Securities: | Level 1 | Level 2 | Level 3 | Total | ||||||||||||||||||||||||||||||||||||
Affiliated Investment Companies | $723,513,101 | $— | $— | $723,513,101 | ||||||||||||||||||||||||||||||||||||
|
|
|
|
|
|
|
| |||||||||||||||||||||||||||||||||
Total Investment Securities | $723,513,101 | $— | $— | $723,513,101 | ||||||||||||||||||||||||||||||||||||
|
|
|
|
|
|
|
| |||||||||||||||||||||||||||||||||
5. Security Purchases and Sales
For the year ended December 31, 2022, cost of purchases and proceeds from sales of securities (excluding securities maturing less than one year from acquisition) were as follows:
| Purchases | Sales | |||||||||
AZL DFA Multi-Strategy Fund | $ | 82,087,877 | $ | 111,055,500 | ||||||
6. Investment Risks
The risks below are presented in an order intended to facilitate readability. Their order does not imply that the realization of one risk is more likely to occur more frequently than another risk, nor does it imply that the realization of one risk is likely to have a greater adverse impact than another risk. The Fund may be subject to other risks in addition to these identified risks. This section discusses certain common principal risks encountered by the Fund.
Derivatives Risk: The Fund may invest directly or through affiliated or unaffiliated mutual funds or unregistered investment pools in derivative instruments such as futures, options, and options on futures. A derivative is a financial contract whose value depends on, or is derived from, the value of an underlying asset, reference rate, or risk. Use of derivative instruments involves risks different from, or possibly greater than, the risks associated with investing directly in securities and other traditional investments. Derivatives are subject to a number of other risks, such as liquidity risk, interest rate risk, market risk, credit risk, and selection risk. Derivatives also involve the risk of mispricing or improper valuation and the risk that changes in the value may not correlate perfectly with the underlying asset, rate, or index. Using derivatives may result in losses, possibly in excess of the principal amount invested. Also, suitable derivative transactions may not be available in all circumstances. The other party to a derivatives contract could default.
Foreign Securities Risk: Investing in the securities of non-U.S. issuers involves a number of risks, such as fluctuations in currency values, adverse political, social or economic developments, and differences in social and economic developments or policies. Such risks include future political and economic developments, and the possible imposition of exchange controls or other foreign governmental laws and restrictions. In addition, with respect to certain countries, there is the possibility of expropriation of assets, confiscatory taxation, political or social instability or diplomatic developments which could adversely affect investments in those securities. Certain foreign companies may be subject to sanctions, embargoes, or other governmental actions that may impair or otherwise limit the ability to invest in, receive, hold or sell the securities of such companies.
Fund of Fund Risk: The Fund, as a shareholder of the underlying funds, indirectly bears its proportionate share of any investment management fees and other expenses of the underlying funds. Further due to the fees and expenses paid by the Fund, as well as small variations in the Fund’s actual allocations to the underlying funds and any futures and cash held in the Fund’s portfolio, the performance and income distributions of the Fund will not be the same as the performance and income distributions of the underlying funds. In addition, the Fund maintains indirect exposure to various types of risk which may exist in the underlying Funds, such as foreign securities risk, fixed income securities risk and other risks.
Interest Rate Risk: Debt securities held by an underlying fund may decline in value due to rising interest rates. The price of a bond is also affected by its maturity. Bonds with longer maturities generally have greater sensitivity to changes in interest rates.
Market Risk: The market price of securities owned by the underlying funds may go up or down, sometimes rapidly and unpredictably. Securities may decline in value due to factors affecting securities markets generally or particular industries represented in the securities markets. The value of a security may decline due to general market conditions that are not specifically related to a particular company, such as real or perceived adverse economic conditions, changes in the general outlook for corporate earnings, changes in interest or currency rates, or adverse investor sentiment, as well as natural disasters, and outbreaks of infectious illnesses or other widespread public health issues.
10
AZL DFA Multi-Strategy Fund
Notes to the Financial Statements
December 31, 2022
7. Coronavirus (COVID-19) Pandemic
The global outbreak of the COVID-19 strain of the coronavirus has caused adverse effects on many companies, sectors, nations, regions and the markets in general, and may continue for an unpredictable duration. The effects of this pandemic may adversely impact the value and performance of the Fund, its ability to buy and sell fund investments at appropriate valuations, and its ability to achieve its investment objective(s).
8. Federal Tax Information
It is the policy of the Fund to continue to qualify as a regulated investment company by complying with the provisions available to certain investment companies, as defined under Subchapter M of the Internal Revenue Code, and to make distributions of net investment income and net realized gains sufficient to relieve it from all, or substantially all, federal income taxes. Accordingly, no provisions for federal income taxes are required in the financial statements.
Management of the Fund has reviewed tax positions taken in tax years that remain subject to examination by all major tax jurisdictions, including federal (i.e., the last four tax year ends and the interim tax period since then, as applicable). Management believes that there is no tax liability resulting from unrecognized tax benefits related to uncertain tax positions taken.
Cost of securities, including derivatives and short positions as applicable, for federal income tax purposes at December 31, 2022 is $736,441,218. The gross unrealized appreciation/ (depreciation) on a tax basis is as follows:
Unrealized appreciation | $ | 34,511,546 | |||
Unrealized (depreciation) | (47,439,663 | ) | |||
|
| ||||
Net unrealized appreciation/(depreciation) | $ | (12,928,117 | ) | ||
|
|
The tax character of dividends paid to shareholders during the year ended December 31, 2022, was as follows:
| Ordinary Income | Net Long-Term | Total Distributions(a) | |||||||||||||
AZL DFA Multi-Strategy Fund | $ | 8,932,252 | $ | 73,578,680 | $ | 82,510,932 | |||||||||
| (a) | Total distributions paid may differ from the Statements of Changes in Net Assets because dividends are recognized when actually paid for tax purposes. |
The tax character of dividends paid to shareholders during the year ended December 31, 2021, was as follows:
| Ordinary Income | Net Long-Term | Total Distributions(a) | |||||||||||||
AZL DFA Multi-Strategy Fund | $ | 14,639,563 | $ | 46,555,584 | $ | 61,195,147 | |||||||||
| (a) | Total distributions paid may differ from the Statements of Changes in Net Assets because dividends are recognized when actually paid for tax purposes. |
At December 31, 2022, the components of accumulated earnings on a tax basis were as follows:
| Undistributed Ordinary Income | Undistributed Long-Term Capital Gains | Accumulated Capital and Other Losses | Unrealized Appreciation/ Depreciation(a) | Total Accumulated Earnings/ (Deficit) | |||||||||||||||||||||
AZL DFA Multi-Strategy Fund | $ | 19,998,939 | $ | 62,785,997 | $ | — | $ | (12,928,117 | ) | $ | 69,856,819 | ||||||||||||||
| (a) | The differences between book-basis and tax-basis unrealized appreciation/(depreciation) is attributable primarily to tax deferral of losses on wash sales. |
9. Ownership and Principal Holders
The beneficial ownership, either directly or indirectly, of more than 25% of the voting securities of a fund creates presumptions of control of the fund, under section 2 (a)(9) of the 1940 Act. As of December 31, 2022, the Fund had an individual shareholder account which is affiliated with the Manager representing ownership in excess of 90% of the Fund. Investment activities of this shareholder could have a material impact to the Fund. As of December 31, 2022, the Fund had a controlling interest (in excess of 50%) in the AZL DFA Five-Year Global Fixed Income Fund, AZL DFA U.S. Core Equity Fund, and AZL DFA U.S. Small Cap Fund, which are affiliated with the Manager.
10. Subsequent Events
Management of the Fund has evaluated the need for additional disclosures or adjustments resulting from events through the date the financial statements were issued. Based on this evaluation, there were no subsequent events to report that would have material impact on the Fund’s financial statements.
11
REPORT OF INDEPENDENT REGISTERED PUBLIC ACCOUNTING FIRM
To the Board of Trustees of Allianz Variable Insurance Products Fund of Funds Trust and Shareholders of
AZL DFA Multi-Strategy Fund
Opinion on the Financial Statements
We have audited the accompanying statement of assets and liabilities, including the schedule of portfolio investments, of AZL DFA Multi-Strategy Fund (one of the funds constituting Allianz Variable Insurance Products Fund of Funds Trust, referred to hereafter as the “Fund”) as of December 31, 2022, the related statement of operations for the year ended December 31, 2022, the statements of changes in net assets for each of the two years in the period ended December 31, 2022, including the related notes, and the financial highlights for each of the five years in the period ended December 31, 2022 (collectively referred to as the “financial statements”). In our opinion, the financial statements present fairly, in all material respects, the financial position of the Fund as of December 31, 2022, the results of its operations for the year then ended, the changes in its net assets for each of the two years in the period ended December 31, 2022 and the financial highlights for each of the five years in the period ended December 31, 2022 in conformity with accounting principles generally accepted in the United States of America.
Basis for Opinion
These financial statements are the responsibility of the Fund’s management. Our responsibility is to express an opinion on the Fund’s financial statements based on our audits. We are a public accounting firm registered with the Public Company Accounting Oversight Board (United States) (PCAOB) and are required to be independent with respect to the Fund in accordance with the U.S. federal securities laws and the applicable rules and regulations of the Securities and Exchange Commission and the PCAOB.
We conducted our audits of these financial statements in accordance with the standards of the PCAOB. Those standards require that we plan and perform the audit to obtain reasonable assurance about whether the financial statements are free of material misstatement, whether due to error or fraud.
Our audits included performing procedures to assess the risks of material misstatement of the financial statements, whether due to error or fraud, and performing procedures that respond to those risks. Such procedures included examining, on a test basis, evidence regarding the amounts and disclosures in the financial statements. Our audits also included evaluating the accounting principles used and significant estimates made by management, as well as evaluating the overall presentation of the financial statements. Our procedures included confirmation of securities owned as of December 31, 2022 by correspondence with the transfer agent. We believe that our audits provide a reasonable basis for our opinion.
/s/ PricewaterhouseCoopers LLP
New York, New York
February 23, 2023
We have served as the auditor of one or more investment companies in the Allianz Variable Insurance Products complex since 2018.
12
Other Federal Income Tax Information (Unaudited)
For the year ended December 31, 2022, 86.61% of the total ordinary income dividends paid by the Fund qualify for the corporate dividends received deductions available to corporate shareholders.
During the year ended December 31, 2022, the Fund declared net long-term capital gain distributions of $73,578,680.
13
A description of the policies and procedures that the Fund uses to determine how to vote proxies relating to portfolio securities is available, without charge, upon request, by visiting the Securities and Exchange Commission’s (‘‘Commission’’) website at www.sec.gov, or by calling 800-624-0197.
Information regarding how the Fund voted proxies relating to portfolio securities during the most recent 12-month period ended June 30th is available (i) without charge, upon request, by calling 800-624-0197; (ii) on the Trust’s website at https://www.allianzlife.com; and (iii) on the Commission’s website at http://www.sec.gov.
The Fund files complete Schedules of Portfolio Holdings with the Commission for the first and third quarters of each fiscal year on Form N-PORT. Schedules of Portfolio Holdings for the Fund are available without charge on the Commission’s website at http://www.sec.gov, or may be obtained by calling 800-624-0197.
14
Approval of Investment Advisory Agreement (Unaudited)
Subject to the general supervision of the Board of Trustees (the “Board”) and in accordance with the investment objectives and restrictions of each separate series (each a “Fund,” together, the “Funds”) of the Allianz Variable Insurance Products Fund of Funds Trust (the “Trust”), investment advisory services are provided to the Funds by Allianz Investment Management LLC (the “Manager”). The Manager manages each Fund pursuant to an investment management agreement (the “Management Agreement”) with the Trust in respect of each such Fund. The Management Agreement provides that the Manager, subject to the supervision and approval of the Board, is responsible for the management of each Fund. For management services, each Fund pays the Manager an investment advisory fee based upon each Fund’s average daily net assets. The Manager has contractually agreed to limit the expenses of each Fund by reimbursing the Fund if and when total Fund operating expenses exceed certain amounts until at least April 30, 2024 (the “Expense Limitation Agreement”).
In reviewing the services provided by the Manager and the terms of the Management Agreement, the Board receives and reviews information related to the Manager’s experience and expertise in the variable insurance marketplace. In addition, the Board receives information regarding the Manager’s expertise with regard to portfolio diversification and asset allocation requirements within variable insurance products issued by Allianz Life Insurance Company of North America (“Allianz Life”) and its subsidiary, Allianz Life Insurance Company of New York (“Allianz of New York”). Currently, the Funds are offered only through Allianz Life and Allianz of New York variable products, and not in the retail fund market.
As required by the Investment Company Act of 1940 (the “1940 Act”), the Board has reviewed and approved the Management Agreement with the Manager. The Board’s decision to approve this contract reflects the exercise of its business judgment on whether to approve new arrangements and continue the existing arrangements. During its review of the contract, the Board considered many factors, among the most material of which are: the Fund’s investment objectives and long-term performance; the Manager’s management philosophy, personnel, processes and investment performance, including its compliance history and the adequacy of its compliance processes; the preferences and expectations of Fund shareholders (and underlying contract owners) and their relative sophistication; the continuing state of competition in the mutual fund industry; and comparable fees in the mutual fund industry.
The Board also considered the compensation and benefits received by the Manager. This includes fees received for services provided to a Fund by employees of the Manager or of affiliates of the Manager and research services received by the Manager from brokers that execute Fund trades, as well as advisory fees. The Board considered the fact that: (1) the Manager and the Trust are parties to an Administrative Services Agreement and a Compliance Services Agreement, under which the Manager is compensated by the Trust for performing certain administrative and compliance services including providing an employee of the Manager or one of its affiliates to act as the Trust’s Chief Compliance Officer; and (2) Allianz Life Financial Services, LLC, an affiliated person of the Manager, is a registered securities broker-dealer and received (along with its affiliated persons) payments made by the underlying funds pursuant to Rule 12b-1.
The Board is aware that various courts have interpreted provisions of the 1940 Act and have indicated in their decisions that the following factors may be relevant to an adviser’s compensation: the nature, extent and quality of the services provided by the adviser, including the performance of the fund; the adviser’s cost of providing the services; the extent to which the adviser may realize “economies of scale” as the fund grows larger; any indirect benefits that may accrue to the adviser and its affiliates as a result of the adviser’s relationship with the fund; performance and expenses of comparable funds; the profitability of acting as adviser to the fund; and the extent to which the independent Board members, who are not “interested persons” of a fund as defined by the 1940 Act (“Independent Trustees”), are fully informed about all facts bearing on the adviser’s services and fees. The Board is aware of these factors and takes them into account in its review of the Management Agreement for the Funds.
Each member of the Board considered and weighed these factors in light of his or her experience in governing the Trust. The Board is assisted in its deliberations by the advice of independent legal counsel to the Independent Trustees (“Independent Trustee Counsel”). In this regard, the Board requests and receives a significant amount of information about the Funds and the Manager. Some of this information is provided at each regular meeting of the Board; additional information is provided in connection with the particular meetings at which the Board’s formal review of the Management Agreement occurs. In between regularly scheduled meetings, the Board may receive information on particular matters as the need arises. Thus, the Board’s evaluation of the Management Agreement is informed by reports covering such matters as: the Manager’s investment philosophy, personnel and processes, and the Fund’s investment performance (in absolute terms as well as in relationship to its benchmark and certain competitor or “peer group” funds). In connection with comparing the performance of each Fund versus its benchmark, the Board receives reports on the extent to which the Fund’s performance may be attributed to various applicable factors, such as asset class allocation decisions and volatility management strategies, if applicable, the performance of the underlying funds, rebalancing decisions, and the impact of cash positions and Fund fees and expenses. The Board also receives reports on the Funds’ expenses (including the advisory fee itself and the overall expense structure of the Funds, both in absolute terms and relative to peer group and/or competing funds, with due regard for the Expense Limitation Agreement and additional voluntary expense limitations); the use and allocation of any brokerage commissions derived from trading the Funds’ portfolio securities; the nature, extent and quality of the advisory and other services provided to the Fund by the Manager and its affiliates; compliance and audit reports concerning the Funds and the companies that service them; and relevant developments in the mutual fund industry and how the Funds and/or the Manager are responding to them.
The Board also receives financial information about the Manager, including reports on the compensation and benefits the Manager derives from its relationships with the Funds. These reports cover not only the fees under the Management Agreement, but also the fees, if any, received for providing other services to the Funds. The reports also discuss any indirect or “fall-out” benefits the Manager or its affiliates may derive from their relationships with the Funds.
The Management Agreement was most recently considered at Board meetings held in the summer and fall of 2022. Information relevant to the approval of the Management Agreement was considered at Board meetings held June 14 and 21, 2022, and September 13, 2022, as well as at various other meetings preceding those meetings. Accordingly, the Management Agreement was approved by the Board at an in-person meeting on September 13, 2022. At such meeting the Board also approved the Expense Limitation Agreement between the Manager and the Trust for the period ending April 30, 2024.
In connection with such meetings, the Board requested and evaluated extensive materials from the Manager, including performance and expense information for other investment companies with similar investment objectives derived from data compiled by an independent third-party provider and other sources believed to be reliable by the Manager and the Trustees. Prior to voting, the Trustees reviewed the proposed approval of the Management Agreement with management and with Independent Trustee Counsel and received a memorandum from such counsel discussing the legal standards for their consideration of the proposed approval. The Independent Trustees also discussed the proposed approval in private sessions with Independent Trustee Counsel at which no representatives of the Manager were present. In reaching their determinations relating to the approval of the Management Agreement, in respect of each Fund, each member of the Board considered all factors he or she believed relevant. The Board based its decision to approve
15
the Management Agreement on the totality of the circumstances and relevant factors, and with a view to past and future long-term considerations. Not all of the factors and considerations discussed above and below are necessarily relevant to every Fund, and the Board did not assign relative weights to factors discussed herein or deem any one or group of them to be controlling in and of themselves.
Shareholder reports must include a discussion of certain factors relating to the selection of the investment adviser and the approval of the advisory fee. The “factors” enumerated by the SEC are set forth below in italics, as well as the Board’s conclusions regarding such factors:
(1) The nature, extent and quality of services provided by the Manager. The Trustees noted that the Manager, subject to the oversight of the Board, administers each Fund’s business and other affairs. The Trustees noted that the Manager also provides the Trust and each Fund with such administrative and other services (exclusive of, and in addition to, any such services provided by any other service providers retained by the Trust on behalf of the Funds) and executive and other personnel as are necessary for the operation of the Trust and the Funds. Except for the Trust’s Chief Compliance Officer and certain compliance staff, the Manager pays all of the compensation of Trustees and officers of the Trust who are employees of the Manager or its affiliates.
The Board considered the scope and quality of services provided by the Manager and noted that the scope of the services provided has continued to expand as a result of regulatory and other developments. The Board noted, for example, that the Manager is responsible for maintaining and monitoring its own compliance program, and this compliance program has been continuously refined and enhanced in light of new regulatory requirements. The Board considered the capabilities and resources which the Manager has dedicated to performing services on behalf of the Trust and its Funds. The quality of administrative and other services, including the Manager’s role in coordinating the activities of the Trust’s other service providers, also were considered. The Board concluded that, overall, they were satisfied with the nature, extent and quality of services provided (and expected to be provided) to the Trust and to each of the Funds under the Management Agreement.
(2) The investment performance of the Funds and the Manager. In connection with every quarterly Board meeting and the summer and fall 2022 contract review process, Trustees received extensive information on the performance results of each Fund. This included, for example, performance information on absolute total return, performance versus the appropriate benchmark(s) and performance versus peer groups as reported by Lipper, the contribution to performance of the Manager’s asset class allocation decisions and volatility management strategies, if applicable, the performance of the underlying funds, and the impact on performance of rebalancing decisions, cash and Fund fees. This included Lipper performance information on the Funds for the previous quarter, and previous one-, three- and five-year periods, to the extent available. For example, in connection with the Board meetings held June 14 and 21, 2022, and September 13, 2022, the Manager reported that, for the five-year period ended December 31, 2021, two Funds were in the top 40%, three were in the middle 20%, and seven were in the bottom 40% of their respective Lipper peer groups. The Manager reported that for the three-year period ended December 31, 2021, three Funds were in the top 40%, two were in the middle 20%, and seven were in the bottom 40% of their respective Lipper peer groups. For the one-year period ended December 31, 2021, six Funds were in the top 40%, two were in the middle 20%, and four were in the bottom 40% of their respective Lipper peer groups.
The Manager also reported on the performance of the MVP Funds compared to custom managed-volatility peer groups. For the five-year period ended December 31, 2021, four Funds were in the top 40%, two were in the middle 20%, and four were in the bottom 20%. For the three-year period ended December 31, 2021, four Funds were in the top 40%, two were in the middle 20%, and four were in the bottom 40% of their respective custom managed-volatility peer groups. For the one-year period ended December 31, 2021, seven Funds were in the top 40%, two were in the middle 20%, and one was in the bottom 40% of their respective custom managed-volatility peer groups. The Board members discussed with the Manager and considered the impact of the volatility management strategies on performance in different market environments, where applicable, and considered whether they were operating as intended. The Board noted, in particular, the impact of certain characteristics of the Funds’ volatility management strategies in relation to volatility experienced as a result of the COVID-19 pandemic, and that relative performance had improved as the markets stabilized.
At the Board meeting held September 13, 2022, the Board also received updated performance information for the Funds, including updated Lipper peer group ranking information, for various periods ending June 30, 2022.
At the Board meeting held September 13, 2022, the Trustees determined that the investment performance of the Funds was acceptable.
(3) The costs of services to be provided and profits to be realized by the Manager and its affiliates from the relationship with the Funds. The Board considered that the Manager receives an advisory fee from each of the Funds. The Manager reported that for the three MVP Fusion Funds the advisory fee paid put these Funds in the 13th percentile of the customized peer group. The Manager reported that for the four MVP Index Strategy Funds the advisory fee paid put them in the 23rd percentile of the customized peer group, and for the AZL Balanced Index Strategy Fund the advisory fee paid put it in the 7th percentile of the customized peer group. The Manager reported that for the AZL DFA Multi-Strategy Fund, the advisory fee paid was in the 5th percentile. The Manager reported that for the AZL MVP DFA Multi-Strategy, AZL MVP FIAM Multi-Strategy, and AZL MVP T. Rowe Price Capital Appreciation Plus Funds, the advisory fee paid was in the 1st percentile. (A lower percentile reflects lower fund fees and is better for fund shareholders.) Trustees were provided with information on the total expense ratios of the Funds and other funds in the customized peer groups, and the Manager reported upon the challenges in making peer group comparisons for the Funds. The Board further considered and found that the advisory fee paid to the Manager with respect to each Fund was based on services provided to the Fund that were in addition to, rather than duplicative of, the services provided pursuant to the advisory agreements for the underlying funds in which the Fund invests.
The Manager provided information concerning the profitability of the Manager’s investment advisory activities for the period from 2019 through 2021. The Board recognized that it is difficult to make comparisons of profitability from investment company advisory agreements because comparative information is not generally publicly available and is affected by numerous factors, including the structure of the particular adviser, the types of funds it manages, its business mix, numerous assumptions regarding allocation of expenses and the adviser’s capital structure and cost of capital. In considering profitability information, the Board considered the possible effect of certain fall-out benefits to the Manager and its affiliates. The Board focused on profitability of the Manager’s relationships with the Funds before taxes and distribution expenses. The Board recognized that the Manager should earn a reasonable level of profits for the services it provides to each Fund.
The Board also considered that Wilshire Funds Management (“Wilshire”) serves as a consultant to the Manager in preparing statistical and other factual information for use in the creation and maintenance of the asset allocation models for the AZL MVP Fusion Funds, pursuant to an agreement between the Manager and Wilshire. Wilshire serves as a consultant to the Manager with respect to selecting the AZL MVP Fusion Funds’ underlying funds and the asset allocations among the underlying funds. The Manager, not any Fund, pays a consultant fee to Wilshire.
(4) and (5) The extent to which economies of scale would be realized as the Funds grow, and whether fee levels reflect these economies of scale. The Board noted that the advisory fee schedules for the Funds do not contain breakpoints that reduce the fee rate on assets above specified levels. The Board recognized that breakpoints may be an appropriate way for the Manager to share its economies of scale, if any, with Funds that have substantial assets. The Board found there was no uniform methodology for establishing breakpoints
16
that give effect to Fund-specific services provided by the Manager. The Board noted that in the fund industry as a whole, as well as among funds similar to the Funds, there is no uniformity or pattern in the fees and asset levels at which breakpoints (if any) apply. Depending on the age, size, and other characteristics of a particular fund and its manager’s cost structure, different conclusions can be drawn as to whether there are economies of scale to be realized at any particular level of assets, notwithstanding the intuitive conclusion that such economies exist, or will be realized at some level of total assets. Moreover, because different managers have different cost structures and service models, it is difficult to draw meaningful conclusions from the breakpoints that may have been adopted by other funds. The Board also noted that the advisory agreements for many funds do not have breakpoints at all, or if breakpoints exist, they may be at asset levels significantly greater than those of the individual Funds. The Board noted that the total assets in all of the Funds, as of June 30, 2022, were approximately $8.2 billion and that the largest Fund, the AZL MVP Growth Index Strategy Fund, had assets of approximately $2.1 billion.
The Board noted that the Manager has agreed to temporarily limit Fund expenses under the Expense Limitation Agreement, which has the effect of reducing expenses similar to implementation of advisory fee breakpoints. The Manager has committed to continue to consider the continuation of expense limits and/or advisory fee breakpoints as Fund assets change. The Board receives quarterly reports on the level of Fund assets. The Board expects to continue to consider: (a) the extent to which economies of scale have been realized, and (b) whether the advisory fee should be modified, either in connection with the next renewal of the Management Agreement or by modifying the Expense Limitation Agreement, to reflect such economies of scale, if any.
Having taken these factors into account, the Board concluded that the absence of breakpoints in the Funds’ advisory fee rate schedules was acceptable under each Fund’s circumstances.
In conclusion, after full consideration of the above factors, as well as such other factors as each member of the Board considered instructive in evaluating the Management Agreement, the Board concluded that the advisory fees were reasonable, and that the continuation of the Management Agreement was in the best interest of the Funds.
17
Information about the Board of Trustees and Officers (Unaudited)
The Trust is managed by the Trustees in accordance with the laws of the state of Delaware governing business trusts. In addition to serving on the Board of Trustees of the Trust, each Trustee serves on the Board of the Allianz Variable Insurance Products Trust (“VIP Trust”) and the AIM ETF Products Trust (“ETF Trust”) (collectively, the Trust, the VIP Trust, and ETF Trust are the “AIM Complex”). There are currently seven Trustees, one of whom is an “interested person” of the Trust within the meaning of that term under the 1940 Act. The Trustees and Officers of the Trust, and their addresses, years of birth, positions held with the Trust, terms of office with the Trust and length of time served, principal occupation(s) during the past five years, the number of portfolios in the Trust they oversee, and other directorships held during the past five years are as follows:
Independent Trustees(1)
| Name, Address, and Birth Year | Positions Held with AIM Complex | Term of Office(2)/Length of Time Served | Principal Occupation(s) During Past 5 Years | Number of Portfolios Overseen for the AIM Complex | Other 5 Years | |||||
Peggy L. Ettestad (1957) 5701 Golden Hills Drive Minneapolis, MN 55416 | Lead Independent Trustee | Since 10/14 (Trustee since 2/07) | Managing Director, Red Canoe Management Consulting LLC, 2008 to present | 50 | None | |||||
Tamara Lynn Fagely (1958) 5701 Golden Hills Drive Minneapolis, MN 55416 | Trustee | Since 12/17 | Retired; previously, Chief Operations Officer, Hartford Funds, 2012 to 2013 | 50 | Diamond Hill Funds (10 Funds) | |||||
Richard H. Forde (1953) 5701 Golden Hills Drive Minneapolis, MN 55416 | Trustee | Since 12/17 | Retired; previously, Member of the Board and Chairman of the Finance and Investment Committee, Connecticut Water Service, Inc., 2013 to 2019 | 50 | Connecticut Water Service, Inc. | |||||
Jack Gee (1959) 5701 Golden Hills Drive Minneapolis, MN 55416 | Trustee | Since 1/22 (Consultant to the Independent Trustees since 2/20)(3) | Retired; previously, Managing Director, BlackRock, Inc., Treasurer and Chief Financial Officer U.S. iShares, 2004 to 2019 | 50 | Engine No. 1 ETF Trust (2 Funds); Esoterica Thematic Trust (2019 - 2020) | |||||
Claire R. Leonardi (1955) 5701 Golden Hills Drive Minneapolis, MN 55416 | Trustee | Since 2/04 | Retired; previously, CEO, Health eSense Inc. (a medical device company), 2015 to 2018, and Connecticut Innovations, Inc. (a venture capital firm), 2012 to 2015 | 50 | None | |||||
Dickson W. Lewis (1948) 5701 Golden Hills Drive Minneapolis, MN 55416 | Trustee | Since 2/04 | Retired; previously, senior executive for Lifetouch National School Studios (a photography company), 2006 to 2014, Jostens (a producer of year books and class rings), 2001 to 2006, and Fortis Financial Group, 1997 to 2001 | 50 | None | |||||
18
Interested Trustee(4)
| Name, Address, and Birth Year | Positions Held with AIM Complex | Term of Office(2)/Length of Time Served | Principal Occupation(s) During Past 5 Years | Number of Portfolios Overseen for the AIM Complex | Other 5 Years | |||||
Brian Muench (1970) 5701 Golden Hills Drive Minneapolis, MN 55416 | Trustee | Since 6/11 | President, Allianz Investment Management LLC, 2010 to present; Vice President, Allianz Life, 2011 to present | 50 | None | |||||
| (1) | Each of the Independent Trustees is a member of the Audit Committee. |
| (2) | Indefinite. |
| (3) | Prior to January 1, 2022, Mr. Gee served as a consultant to the Independent Trustees since February 2020, during which he attended meetings of the Board and its standing committees, including the audit committee, solely in his capacity as a consultant, and was not entitled to vote. |
| (4) | Is an “interested person,” as defined by the 1940 Act, due to employment by Allianz Life and the Manager. |
Officers
| Name, Address, and Birth Year | Positions Held with AIM Complex | Term of Office(1)/ Length of Time Served | Principal Occupation(s) During Past 5 Years | |||
Brian Muench (1970) 5701 Golden Hills Drive Minneapolis, MN 55416 | President | Since 11/10 | President, Allianz Investment Management LLC, November 2010 to present; Vice President, Allianz Life, 2011 to present. | |||
Erik Nelson (1972) 5701 Golden Hills Drive Minneapolis, MN 55416 | Secretary | Since 12/20 | Chief Legal Officer, Allianz Investment Management LLC; Associate General Counsel, Senior Counsel, Allianz Life, 2008 to present. | |||
Bashir C. Asad (1963) Citi Fund Services Ohio, Inc. 4400 Easton Commons, Suite 200 Columbus, OH 43219 | Treasurer, Principal Accounting Officer and Principal Financial Officer | Since 06/16 | Senior Vice President, Citi Fund Services Ohio, Inc., 2011 to present. | |||
Chris R. Pheiffer (1968) 5701 Golden Hills Drive Minneapolis, MN 55416 | Chief Compliance Officer(2) and Anti-Money Laundering Compliance Officer | Since 02/14 | Chief Compliance Officer of the Trust and the VIP Trust, 2014 to present, and the ETF Trust, 2020 to present. | |||
| Michael Tanski (1970) 5701 Golden Hills Drive Minneapolis, MN 55416 | Vice President | Since 04/09 | Assistant Vice President, Allianz Investment Management LLC, 2013 to present. | |||
| (1) | Indefinite. |
| (2) | The Manager and the Trust are parties to a Compliance Services Agreement under which the Manager provides an employee of the Manager or one of its affiliates to act as the Trust’s Chief Compliance Officer. |
The Fund’s Statement of Additional Information (“SAI”) contains additional information about the Trust’s Trustees and Officers. The SAI is available without charge, upon request, by calling toll-free 800-624-0197 or at https://www.allianzlife.com.
19
| The Allianz VIP Fund of Funds are distributed by Allianz Life Financial Services, LLC. | ||
| These Funds are not FDIC Insured. | ANNRPT1222 02/23 |
AZL® MVP Balanced Index Strategy Fund
Annual Report
December 31, 2022

This report is submitted for the general information of the shareholder of the Fund. The report is not authorized for distribution to prospective investors in the Fund unless preceded or accompanied by an effective prospectus, which contains details concerning the sales charges and other pertinent information.
Allianz Investment Management LLC serves as the Manager for the AZL® MVP Balanced Index Strategy Fund.
What factors affected the Fund’s performance during the year ended December 31, 2022?*
For the year ended December 31, 2022, the AZL MVP Balanced Index Strategy Fund (the “Fund”) returned (14.87)%. That compared to (18.11)%, (13.01)% and (15.39)% total return for its benchmarks, the S&P 500 Index, the Bloomberg U.S. Aggregate Bond Index, and the Balanced Composite Index, respectively.1
The AZL MVP Balanced Index Strategy Fund is a fund of funds that pursues broad diversification across four underlying equity sub-portfolios and one fixed income sub-portfolio. The four equity sub-portfolios pursue passive strategies that aim to achieve, before fees, returns similar to the S&P 500 Index (S&P 500), the S&P MidCap 400 Index2, the S&P SmallCap 600 Index3 and the MSCI EAFE Index4.
The fixed-income sub-portfolio is an enhanced bond index strategy that seeks to achieve a return that exceeds that of the Bloomberg U.S. Aggregate Bond Index. Generally, the Fund allocates 40% to 60% of its assets to the underlying equity index funds and 40% to 60% of its assets to the underlying fixed income fund.
The Fund also employs the MVP (Managed Volatility Portfolio) risk management process, which is intended to adjust the risk of the portfolio based on quantitative indicators of market risk, such as the current level of fund and market volatility.
Domestic equities began the year at near all-time highs, but began to decline early in 2022 due to a combination of rising inflation and geopolitical uncertainties. The Federal Reserve (the Fed) shifted to a more hawkish policy approach in an attempt to bring inflation under control, as did many global central banks. The Fed increased the federal funds rate multiple times throughout the year for a combined total of 425 basis points. Russia’s invasion of Ukraine also weighed on global markets, although European countries were particularly hard hit due to their geographic proximity to the conflict and reliance on Russian commodities such as energy and wheat.
Despite strong labor rates throughout developed markets, high inflation and an anticipated economic slowdown had a negative effect on investor sentiment for the year under review. The S&P 500 declined as company valuations struggled under the higher interest rate environment. Investors grew risk averse as fears of an economic recession loomed, selling off equity positions to avoid the volatility in equity markets. By the end of the period under review, U.S. equities had experienced their worst year since the Great Financial Crisis of 2008, and international equities performed only slightly better.
The Fed’s actions made short-term financing more expensive, and the U.S. Treasury yield curve ultimately inverted with 2-year Treasuries yielding more than 10-year Treasuries by 0.55% at the end of 2022. The monetary tightening generated headwinds for domestic fixed income markets as investors demanded higher yields to account for rising rates. Widening credit spreads further weighed on prices on lower-quality bonds
as investors demanded to be compensated for rising credit risks. Nearly all fixed income sectors finished the year with negative performance.
The Fund, which invests in both U.S. and international markets, outperformed its blended benchmark during the 12-month period. Its off-benchmark allocation to developed market non-U.S. equities contributed to performance, as these outpaced U.S. equities. In addition, the Fund’s performance compared to the composite benchmark was positively affected by its allocation to mid- and small-cap U.S. equities, which outpaced their large-cap counterparts.
The fixed income allocation detracted slightly from the Fund’s performance compared to the benchmark largely due to the underlying fund’s fees. However, the Fund’s fixed income allocation benefited from security selection, particularly in mortgage-backed securities and investment grade credit. Allocation to Treasury Inflation Protected Securities (TIPS) also contributed to the Fund’s performance.
The MVP risk management process utilizes derivatives in an effort to control portfolio volatility in unstable market conditions. Market volatility was relatively high during 2022, therefore the MVP process was engaged and reduced the Fund’s equity exposure at multiple points during the year. The MVP process contributed positively to the Fund’s performance during 2022.
Past performance does not guarantee future results.
| * | The Fund’s portfolio composition is subject to change. There is no guarantee that any sectors mentioned will continue to perform as described or that securities in such sectors will be held by the Fund in the future. The information contained in this commentary is for informational purposes only and should not be construed as a recommendation to purchase or sell securities in the sector mentioned. The Fund’s holdings and weightings are as of December 31, 2022. |
| 1 | For a complete description of the Fund’s performance benchmarks please refer to page 2 of this report. |
| 2 | The Standard & Poor’s MidCap 400 Index (“S&P 400”) is a widely used index for mid-sized companies. The S&P 400 covers 7% of the U.S. equities market, and is part of a series of S&P U.S. indexes that can be used as building blocks for portfolio composition. |
| 3 | The Standard & Poor’s SmallCap 600 Index (“S&P 600”) covers approximately 3% of the domestic equities market. Measuring the small-cap segment of the market that is typically renowned for poor trading liquidity and financial instability, the index is designed to be an efficient portfolio of companies that meet specific inclusion criteria to ensure that they are investable and financially viable. |
| 4 | The Morgan Stanley Capital International, Europe, Australasia and Far East (“MSCI EAFE”) Index is a free float-adjusted market capitalization-weighted index that is designed to measure the equity market performance of developed markets, excluding the U.S. & Canada. |
The indexes defined above are unmanaged. Investors cannot invest directly in an index.
1
AZL® MVP Balanced Index Strategy Fund Review (Unaudited) |
Fund Objective
The Fund’s investment objective is to seek long-term capital appreciation with preservation of capital as an important consideration. This objective may be changed by the Trustees of the Fund without shareholder approval. The Fund seeks to achieve its objective by investing in a combination of Index Strategy Underlying Funds that represent different classes in the Fund’s asset allocation.
Investment Concerns
The Fund invests in underlying funds, so its investment performance is directly related to the performance of those underlying funds. Before investing, investors should assess the risks associated with and types of investments made by each of the underlying funds in which the Fund invests.
Quantitative investing involves risk that the values of securities selected in the quantitative analysis can react differently than the market or securities selected using fundamental analysis.
Stocks are more volatile and carry more risk and return potential than other forms of investments.
International investing may involve risk of capital loss from unfavorable fluctuations in currency values, from differences in generally accepted accounting principles or from economic or political instability in other nations.
Small- to mid-capitalization companies typically have a higher risk of failure and historically have experienced a greater degree of volatility.
The performance of the underlying funds is expected to be lower than that of the Indexes because of fees and expenses. Securities in which the underlying funds will invest may involve substantial risk and may be subject to sudden severe price declines.
Investing in a single industry or sector, or concentrating investments in a limited number of industries or sectors, tends to increase the risk that economic, political, or regulatory developments affecting certain industries or sectors will have a large impact on the value of the portfolio.
Debt securities held by an underlying fund may decline in value due to rising interest rates.
Mortgage-backed investments involve risk of loss due to prepayments and, like any bond, due to default. Because of the sensitivity of mortgage-related securities to changes in interest rates, an underlying fund’s performance may be more volatile than if it did not hold these securities.
Investing in derivative instruments involves risks that may be different from or greater than the risk associated with investing directly in securities or other traditional instruments.
For a complete description of these and other risks associated with investing in the Fund, please refer to the Fund’s prospectus.
Growth of $10,000 Investment
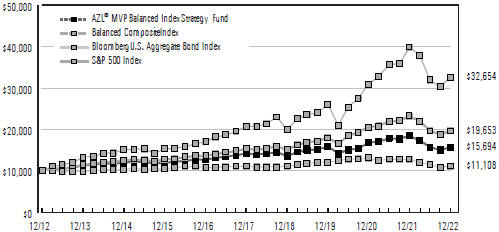
The chart above represents a comparison of a hypothetical investment in the Fund versus a similar investment in the Fund’s benchmarks and represents the reinvestment of dividends and capital gains in the Fund.
| Average Annual Total Returns as of December 31, 2022 | ||||||||||||||||||||
| 1 Year | 3 Years | 5 Years | 10 Years | |||||||||||||||||
AZL® MVP Balanced Index Strategy Fund | (14.87 | )% | (0.24 | )% | 2.09 | % | 4.61 | % | ||||||||||||
Balanced Composite Index | (15.39 | )% | 2.98 | % | 5.14 | % | 6.99 | % | ||||||||||||
Bloomberg U.S. Aggregate Bond Index | (13.01 | )% | (2.71 | )% | 0.02 | % | 1.06 | % | ||||||||||||
S&P 500 Index | (18.11 | )% | 7.66 | % | 9.42 | % | 12.56 | % | ||||||||||||
Past performance does not guarantee future results. The performance data quoted represents past performance and current returns may be lower or higher. The investment return and principal value will fluctuate so that an investor’s shares, when redeemed, may be worth more or less than the original cost. To obtain performance information current to the most recent month end, please visit www.Allianzlife.com.
| Expense Ratio | Gross | ||||
AZL® MVP Balanced Index Strategy Fund | 0.71 | % | |||
The above expense ratio is based on the current Fund prospectus dated April 29, 2022. The Manager and the Fund have entered into a written contract limiting operating expenses, excluding certain expenses (such as interest expense and acquired fund fees and expenses), to 0.20% through April 30, 2024. Additional information pertaining to the December 31, 2022 expense ratio can be found in the Financial Highlights.
Acquired fund fees and expenses are incurred indirectly by the Fund through the valuation of the Fund’s investments in the permitted Underlying Funds. Accordingly, acquired fund fees and expenses affect the Fund’s total returns. Because these fees and expenses are not included in the Fund’s financial highlights, the Fund’s total annual fund operating expenses, as shown in the current prospectus, do not correlate to the ratios of expenses to average net assets shown in the Financial Highlights. Without acquired fund fees and expenses the Fund’s gross expense ratio would be 0.13%.
The total return of the Fund does not reflect the effect of any insurance charges, the annual maintenance fee or the deduction of taxes that a shareholder would pay on Fund distributions or the redemption of Fund shares. Such charges, fees and tax payments would reduce the performance quoted.
The Fund’s performance is measured against the Standard & Poor’s 500 Index (“S&P 500”), the Bloomberg U.S. Aggregate Bond Index and the Balanced Composite Index (“Composite”). The S&P 500 is representative of 500 selected common stocks, most of which are listed on the New York Stock Exchange, and is a measure of the U.S. Stock market as a whole. The Bloomberg U.S. Aggregate Bond Index is a market value-weighted performance benchmark for investment-grade fixed-rate debt issues, including government, corporate, asset-backed, and mortgage-backed securities, with maturities of at least one year. The Composite is a blended index comprised of (50%) S&P 500 and (50%) Bloomberg U.S. Aggregate Bond Index. These indexes are unmanaged and do not reflect the deduction of fees associated with a mutual fund, such as investment management and fund accounting fees. The Fund’s performance reflects the deduction of fees for services provided to the Fund. Investors cannot invest directly in an index.
2
AZL MVP Balanced Index Strategy Fund
(Unaudited)
As a shareholder of the AZL MVP Balanced Index Strategy Fund (the “Fund”), you incur ongoing costs, including management fees, distribution fees, and other Fund expenses. These examples are intended to help you understand your ongoing costs (in dollars) of investing in the Fund and to compare these costs with the ongoing costs of investing in other mutual funds. Please note that the expenses shown in each table do not reflect expenses that apply to the subaccount or the insurance contract. If the expenses that apply to the subaccount or the insurance contract were included, your costs would have been higher.
These examples are based on an investment of $1,000 invested at the beginning of the period and held for the periods presented below.
The Actual Expense table below provides information about actual account values and actual expenses. You may use the information below, together with the amount you invested, to estimate the expenses that you paid over the period. Simply divide your account value by $1,000 (for example, an $8,600 account value divided by $1,000 = 8.6), then multiply the result by the number in the table under the heading entitled “Expenses Paid During Period” to estimate the expenses you paid on your account during this period.
| Beginning Account Value 7/1/22 | Ending Account Value | Expenses Paid During Period 7/1/22 - 12/31/22* | Annualized Expense Ratio During Period 7/1/22 - 12/31/22 | |||||||||||||||||
AZL MVP Balanced Index Strategy Fund | $ | 1,000.00 | $ | 996.90 | $ | 0.75 | 0.15 | % | ||||||||||||
The Hypothetical Expense table below provides information about hypothetical account values and hypothetical expenses based on the Fund’s actual expense ratio and an assumed rate of return of 5% per year before expenses, which is not the Fund’s actual return. The hypothetical account values and expenses may not be used to estimate the actual ending account balance or expenses you paid for the period. You may use this information to compare this 5% hypothetical example with the 5% hypothetical examples that appear in the shareholder reports of other funds.
| Beginning Account Value 7/1/22 | Ending Account Value | Expenses Paid During Period 7/1/22 - 12/31/22* | Annualized Expense Ratio During Period 7/1/22 - 12/31/22 | |||||||||||||||||
AZL MVP Balanced Index Strategy Fund | $ | 1,000.00 | $ | 1,024.45 | $ | 0.77 | 0.15 | % | ||||||||||||
| * | Expenses are equal to the average account value multiplied by the Fund’s annualized expense ratio multiplied by 184/365 (the number of days in the most recent fiscal half-year divided by the number of days in the fiscal year). |
Portfolio Composition
(Unaudited)
| Investments | Percent of Net Assets | ||||
Fixed Income Fund | 47.7% | ||||
Domestic Equity Funds | 34.9 | ||||
International Equity Fund | 12.5 | ||||
|
| ||||
Total Investment Securities | 95.1 | ||||
Net other assets (liabilities) | 4.9 | ||||
|
| ||||
Net Assets | 100.0% | ||||
|
| ||||
3
AZL MVP Balanced Index Strategy Fund
Schedule of Portfolio Investments
December 31, 2022
| Shares | Value | |||||||
Affiliated Investment Companies (95.1%): | ||||||||
Domestic Equity Funds (34.9%): | ||||||||
| 945,582 | AZL Mid Cap Index Fund, Class 2 | $ | 18,126,803 | |||||
| 3,318,497 | AZL S&P 500 Index Fund, Class 2 | 56,215,335 | ||||||
| 838,483 | AZL Small Cap Stock Index Fund, Class 2 | 9,583,863 | ||||||
|
| |||||||
| 83,926,001 | ||||||||
|
| |||||||
Fixed Income Fund (47.7%): | ||||||||
| 12,087,930 | AZL Enhanced Bond Index Fund | 114,593,573 | ||||||
|
| |||||||
| (a) | See Federal Tax Information listed in the Notes to the Financial Statements. |
Percentages indicated are based on net assets as of December 31, 2022
| Shares | Value | |||||||||||
Affiliated Investment Companies, continued | ||||||||||||
International Equity Fund (12.5%): | ||||||||||||
| 1,971,241 | AZL International Index Fund, Class 2 | $ | 30,081,134 | |||||||||
|
| |||||||||||
| | Total Affiliated Investment Companies (Cost $221,790,781) | 228,600,708 | ||||||||||
|
| |||||||||||
| | Total Investment Securities (Cost $221,790,781) — 95.1%(a) | 228,600,708 | ||||||||||
|
| |||||||||||
Net other assets (liabilities) — 4.9% | 11,653,048 | |||||||||||
|
| |||||||||||
Net Assets — 100.0% | $ | 240,253,756 | ||||||||||
|
| |||||||||||
Futures Contracts
At December 31, 2022, the Fund’s open futures contracts were as follows:
Long Futures
| Description | Expiration Date | Number of Contracts | Notional Amount | Value and Unrealized Appreciation/ (Depreciation) | ||||||||||||||||
S&P 500 Index E-Mini March Futures (U.S. Dollar) | 3/17/23 | 27 | $ | 5,212,350 | $ | 119 | ||||||||||||||
U.S. Treasury 10-year Note March Futures (U.S. Dollar) | 3/22/23 | 52 | 5,839,438 | (56,027 | ) | |||||||||||||||
|
|
| ||||||||||||||||||
| $ | (55,908 | ) | ||||||||||||||||||
|
|
| ||||||||||||||||||
See accompanying notes to the financial statements.
4
AZL MVP Balanced Index Strategy Fund
Statement of Assets and Liabilities
December 31, 2022
Assets: | |||||
Investments in affiliates, at cost | $ | 221,790,781 | |||
|
|
| |||
Investments in affiliates, at value | $ | 228,600,708 | |||
Deposit at broker for futures contracts collateral | 11,679,932 | ||||
Interest and dividends receivable | 31,856 | ||||
Receivable for affiliated investments sold | 319,622 | ||||
Prepaid expenses | 2,246 | ||||
|
|
| |||
Total Assets | 240,634,364 | ||||
|
|
| |||
Liabilities: | |||||
Cash overdraft | 319,588 | ||||
Payable for capital shares redeemed | 26,697 | ||||
Payable for variation margin on futures contracts | 1,036 | ||||
Management fees payable | 20,724 | ||||
Administration fees payable | 5,701 | ||||
Custodian fees payable | 336 | ||||
Administrative and compliance services fees payable | 432 | ||||
Transfer agent fees payable | 489 | ||||
Trustee fees payable | 1,078 | ||||
Other accrued liabilities | 4,527 | ||||
|
|
| |||
Total Liabilities | 380,608 | ||||
|
|
| |||
Net Assets | $ | 240,253,756 | |||
|
|
| |||
Net Assets Consist of: | |||||
Paid in capital | $ | 243,545,514 | |||
Total distributable earnings | (3,291,758 | ) | |||
|
|
| |||
Net Assets | $ | 240,253,756 | |||
|
|
| |||
Shares of beneficial interest (unlimited number of shares authorized, no par value) | 21,734,798 | ||||
Net Asset Value (offering and redemption price per share) | $ | 11.05 | |||
|
|
| |||
For the Year Ended December 31, 2022
Investment Income: | |||||
Dividends from affiliates | $ | 3,705,786 | |||
Interest | 180,141 | ||||
Dividends from non-affiliates | 133 | ||||
|
|
| |||
Total Investment Income | 3,886,060 | ||||
|
|
| |||
Expenses: | |||||
Management fees | 269,877 | ||||
Administration fees | 64,355 | ||||
Custodian fees | 2,526 | ||||
Administrative and compliance services fees | 3,720 | ||||
Transfer agent fees | 5,485 | ||||
Trustee fees | 14,932 | ||||
Professional fees | 12,527 | ||||
Shareholder reports | 7,779 | ||||
Other expenses | 3,997 | ||||
|
|
| |||
Total expenses | 385,198 | ||||
|
|
| |||
Net Investment Income/(Loss) | 3,500,862 | ||||
|
|
| |||
Net realized and Change in net unrealized gains/losses on investments: | |||||
Net realized gains/(losses) on affiliated underlying funds | (147,888 | ) | |||
Net realized gains distributions from affiliated underlying funds | 14,165,926 | ||||
Net realized gains/(losses) on futures contracts | (1,658,743 | ) | |||
Change in net unrealized appreciation/depreciation on affiliated underlying funds | (62,394,265 | ) | |||
Change in net unrealized appreciation/depreciation on futures contracts | (255,914 | ) | |||
|
|
| |||
Net realized and Change in net unrealized gains/losses on investments | (50,290,884 | ) | |||
|
|
| |||
Change in Net Assets Resulting From Operations | $ | (46,790,022 | ) | ||
|
|
|
See accompanying notes to the financial statements.
5
AZL MVP Balanced Index Strategy Fund
Statements of Changes in Net Assets
| For the Year Ended December 31, 2022 | For the Year Ended December 31, 2021 | |||||||||
Change In Net Assets: | ||||||||||
Operations: | ||||||||||
Net investment income/(loss) | $ | 3,500,862 | $ | 2,411,227 | ||||||
Net realized gains/(losses) on investments | 12,359,295 | 21,469,001 | ||||||||
Change in unrealized appreciation/depreciation on investments | (62,650,179 | ) | 7,225,526 | |||||||
|
|
|
| |||||||
Change in net assets resulting from operations | (46,790,022 | ) | 31,105,754 | |||||||
|
|
|
| |||||||
Distributions to Shareholders: | ||||||||||
Distributions | (23,582,834 | ) | (22,484,516 | ) | ||||||
|
|
|
| |||||||
Change in net assets resulting from distributions to shareholders | (23,582,834 | ) | (22,484,516 | ) | ||||||
|
|
|
| |||||||
Capital Transactions: | ||||||||||
Proceeds from shares issued | 4,208,329 | 15,897,547 | ||||||||
Proceeds from dividends reinvested | 23,582,834 | 22,484,516 | ||||||||
Value of shares redeemed | (41,882,168 | ) | (42,773,216 | ) | ||||||
|
|
|
| |||||||
Change in net assets resulting from capital transactions | (14,091,005 | ) | (4,391,153 | ) | ||||||
|
|
|
| |||||||
Change in net assets | (84,463,861 | ) | 4,230,085 | |||||||
Net Assets: | ||||||||||
Beginning of period | 324,717,617 | 320,487,532 | ||||||||
|
|
|
| |||||||
End of period | $ | 240,253,756 | $ | 324,717,617 | ||||||
|
|
|
| |||||||
Share Transactions: | ||||||||||
Shares issued | 334,406 | 1,079,752 | ||||||||
Dividends reinvested | 2,197,841 | 1,618,756 | ||||||||
Shares redeemed | (3,382,738 | ) | (2,935,821 | ) | ||||||
|
|
|
| |||||||
Change in shares | (850,491 | ) | (237,313 | ) | ||||||
|
|
|
| |||||||
See accompanying notes to the financial statements.
6
AZL MVP Balanced Index Strategy Fund
(Selected data for a share of beneficial interest outstanding throughout the periods indicated. Does not reflect fees or expenses associated with the separate accounts that invest in the Fund or in any variable annuity contracts or variable life insurance policy for which the Fund serves as an investment vehicle.)
| Year Ended December 31, 2022 | Year Ended December 31, 2021 | Year Ended December 31, 2020 | Year Ended December 31, 2019 | Year Ended December 31, 2018 | |||||||||||||||||||||
Net Asset Value, Beginning of Period | $14.38 | $14.04 | $13.90 | $12.37 | $13.38 | ||||||||||||||||||||
|
|
|
|
|
|
|
|
|
| ||||||||||||||||
Investment Activities: | |||||||||||||||||||||||||
Net Investment Income/(Loss) | 0.16 | (a) | 0.11 | (a) | 0.24 | (a) | 0.25 | (a) | 0.24 | ||||||||||||||||
Net Realized and Unrealized Gains/(Losses) on Investments | (2.34 | ) | 1.26 | 0.54 | 1.82 | (0.82 | ) | ||||||||||||||||||
|
|
|
|
|
|
|
|
|
| ||||||||||||||||
Total from Investment Activities | (2.18 | ) | 1.37 | 0.78 | 2.07 | (0.58 | ) | ||||||||||||||||||
|
|
|
|
|
|
|
|
|
| ||||||||||||||||
Distributions to Shareholders From: | |||||||||||||||||||||||||
Net Investment Income | (0.28 | ) | (0.26 | ) | (0.27 | ) | (0.29 | ) | (0.11 | ) | |||||||||||||||
Net Realized Gains | (0.87 | ) | (0.77 | ) | (0.37 | ) | (0.25 | ) | (0.32 | ) | |||||||||||||||
|
|
|
|
|
|
|
|
|
| ||||||||||||||||
Total Dividends | (1.15 | ) | (1.03 | ) | (0.64 | ) | (0.54 | ) | (0.43 | ) | |||||||||||||||
|
|
|
|
|
|
|
|
|
| ||||||||||||||||
Net Asset Value, End of Period | $11.05 | $14.38 | $14.04 | $13.90 | $12.37 | ||||||||||||||||||||
|
|
|
|
|
|
|
|
|
| ||||||||||||||||
Total Return (b) | (14.87 | )% | 10.02 | % | 5.98 | % | 16.92 | % | (4.44 | )% | |||||||||||||||
Ratios to Average Net Assets/Supplemental Data: | |||||||||||||||||||||||||
Net Assets, End of Period (000’s) | $240,254 | $324,718 | $320,488 | $331,516 | $301,934 | ||||||||||||||||||||
Net Investment Income/(Loss) | 1.30 | % | 0.74 | % | 1.82 | % | 1.84 | % | 1.79 | % | |||||||||||||||
Expenses Before Reductions*(c) | 0.14 | % | 0.13 | % | 0.14 | % | 0.14 | % | 0.13 | % | |||||||||||||||
Expenses Net of Reductions* | 0.14 | % | 0.13 | % | 0.14 | % | 0.14 | % | 0.13 | % | |||||||||||||||
Portfolio Turnover Rate | 7 | % | 10 | % | 13 | % | 9 | % | 7 | % | |||||||||||||||
| * | The expense ratios exclude the impact of fees/expenses paid by each underlying fund. |
| (a) | Calculated using the average shares method. |
| (b) | The returns include reinvested dividends and fund level expenses, but exclude insurance contract charges. If these charges were included, the returns would have been lower. |
| (c) | Excludes fee reductions. If such fee reductions had not occurred, the ratios would have been as indicated. |
See accompanying notes to the financial statements.
7
AZL MVP Balanced Index Strategy Fund
Notes to the Financial Statements
December 31, 2022
1. Organization
The Allianz Variable Insurance Products Fund of Funds Trust (the “Trust”) was organized as a Delaware statutory trust on June 16, 2004. The Trust is an open-end management investment company registered under the Investment Company Act of 1940, as amended, (the “1940 Act”) and thus is determined to be an investment company, and follows the investment company accounting and reporting guidance under Financial Accounting Standards Board (“FASB”) Accounting Standards Codification (“ASC”) Topic 946 “Financial Services—Investment Companies”. The Trust consists of 12 separate investment portfolios (collectively, the “Funds”), of which one is included in this report, the AZL MVP Balanced Index Strategy Fund (the “Fund”), and 11 are presented in separate reports. The Fund is a diversified series of the Trust.
The Fund is a “fund of funds”, which means that the Fund invests primarily in other mutual funds (the “Underlying Funds”). Underlying Funds invest in stocks, bonds, and other securities and reflect varying amounts of potential investment risk and reward. The Underlying Funds record their investments at fair value. Periodically, the Fund will adjust its asset allocation as it seeks to achieve its investment objective.
The Trust is authorized to issue an unlimited number of shares of the Fund without par value. Shares of the Fund are available through the variable annuity contracts offered through the separate accounts of participating insurance companies. Currently, the Fund only offers its shares to separate accounts of Allianz Life Insurance Company of North America and Allianz Life Insurance Company of New York, affiliates of the Trust and the Manager, as defined below.
Under the Trust’s organizational documents, its officers and trustees are indemnified against certain liabilities arising out of the performance of their duties to the Fund. In addition, in the normal course of business, the Fund may enter into contracts with its vendors and others that provide for general indemnifications. The Fund’s maximum exposure under these arrangements is unknown, as this would involve future claims that may be made against the Fund. However, based on experience, the Fund expects that risk of loss to be remote.
On December 13, 2022, the Board unanimously approved a reorganization whereby the Fund will acquire all of the assets and liabilities of the AZL MVP Fusion Balanced Fund and costs related to the reorganization will be paid by the Manager.
2. Significant Accounting Policies
The following is a summary of significant accounting policies followed by the Fund in the preparation of its financial statements. The policies conform with U.S. generally accepted accounting principles (“U.S. GAAP”). The preparation of financial statements requires management to make certain estimates and assumptions that affect the reported amounts of assets and liabilities and disclosure of contingent assets and liabilities at the date of the financial statements and the reported amounts of increases and decreases in net assets from operations during the reporting period. Actual results could differ from those estimates.
Security Valuation
The Fund records its investments at fair value. Fair value is defined as the price that would be received to sell an asset or paid to transfer a liability in an orderly transaction between willing market participants at the measurement date. The valuation techniques used to determine fair value are further described in Note 4 below.
Investment Transactions and Investment Income
Investment transactions are accounted for on trade date. Net realized gains and losses on investments sold and on foreign currency transactions are recorded on the basis of identified cost. Interest income is recorded on the accrual basis and includes, where applicable, the amortization of premiums or accretion of discounts. Dividend income is recorded on the ex-dividend date except in the case of foreign securities, in which case dividends are recorded as soon as such information becomes available.
Distributions to Shareholders
Distributions to shareholders are recorded on the ex-dividend date. The Fund distributes its dividends from net investment income and net realized capital gains, if any, on an annual basis. The amount of distributions from net investment income and from net realized gains is determined in accordance with federal income tax regulations, which may differ from U.S. GAAP. These “book/tax” differences are either temporary or permanent in nature. To the extent these differences are permanent in nature (e.g., return of capital, net operating loss, reclassification of certain market discounts, gain/loss, paydowns, and distributions), such amounts are reclassified within the composition of net assets based on their federal tax-basis treatment; temporary differences (e.g., wash sales and differing treatment on certain investments) do not require reclassification. Distributions to shareholders that exceed net investment income and net realized gains for tax purposes are reported as distributions of capital.
Expense Allocation
Expenses directly attributable to the Fund are charged directly to the Fund, while expenses attributable to more than one Fund are allocated among the respective Funds based upon relative net assets or some other reasonable method. Expenses which are attributable to more than one Trust are allocated across the Allianz Variable Insurance Products Trust, Allianz Variable Insurance Products Fund of Funds Trust and AIM ETF Products Trust based upon relative net assets or another reasonable basis. Allianz Investment Management LLC (the “Manager”), serves as the investment manager for the Trust, Allianz Variable Insurance Products Trust and AIM ETF Products Trust.
This report does not reflect fees or expenses associated with the separate accounts that invest in the Fund or in any variable annuity contracts or variable life insurance policy for which the Fund serves as an investment vehicle.
Affiliated Securities Transactions
Pursuant to Rule 17a-7 under the 1940 Act, the Fund may engage in securities transactions with affiliated investment companies and advisory accounts managed by the Manager. Any such purchase or sale transaction must be effected without a brokerage commission or other remuneration, except for customary transfer fees. The transaction must be effected at the current market price, which is either the security’s last sale price on an exchange or, if there are no transactions in the security that day, at the average of the highest bid and lowest asked price. During the year ended December 31, 2022, the Fund did not engage in any Rule 17a-7 transactions.
8
AZL MVP Balanced Index Strategy Fund
Notes to the Financial Statements
December 31, 2022
Derivative Instruments
All open derivative positions at period end are reflected on the Fund’s Schedule of Portfolio Investments. The following is a description of the derivative instruments utilized by the
Fund, including the primary underlying risk exposures related to each instrument type. The Fund’s allocation to the MVP (Managed Volatility Portfolio) risk management process may include (a) derivatives such as index futures, other futures contracts, options, and other similar securities and (b) cash, money market equivalents, short-term debt instruments, money market funds, and short-term debt funds to satisfy all applicable margin requirements and to provide additional portfolio liquidity to satisfy large redemptions and any margin calls. Due to the leverage provided by derivatives, the notional value of the Fund’s derivative positions could exceed 20% of the Fund’s value. The Fund may also use futures to gain equity exposure and may hold cash as a buffer in the event of market shocks.
Futures Contracts
During the year ended December 31, 2022, the Fund invested in futures contracts to reduce volatility and limit the need to decrease or increase allocations to underlying funds.
Futures contracts are valued based upon their quoted daily settlement prices. Upon entering into a futures contract, the Fund is required to segregate liquid assets in accordance with the initial margin requirements of the broker or exchange. Futures contracts are marked to market daily and a payable or receivable for the change in value (“variation margin”), if any, is recorded by the Fund. Gains or losses are recognized but not considered realized until the contracts expire or are closed. Futures contracts involve, to varying degrees, elements of market risk (generally equity price risk related to stock futures, interest rate risk related to bond futures, and foreign currency risk related to currency futures) and exposure to loss in excess of the variation margin disclosed in the Statement of Assets and Liabilities. The primary risks associated with the use of futures contracts are the imperfect correlation between the change in value of the underlying securities and the prices of futures contracts, the possibility of an illiquid market, and the inability of the counterparty to meet the terms of the contract. For the year ended December 31, 2022, the monthly average notional amount for long contracts was $8.0 million, and the monthly average notional amount for short contracts was $22.6 million. Realized gains and losses are reported as “Net realized gains/(losses) on futures contracts” on the Statement of Operations.
Summary of Derivative Instruments
The following is a summary of the values of derivative instruments on the Fund’s Statement of Assets and Liabilities, categorized by risk exposure, as of December 31, 2022:
Asset Derivatives | Liability Derivatives | |||||||||||
| Primary Risk Exposure | Statement of Assets and Liabilities Location | Total Value | Statement of Assets and Liabilities Location | Total Value | ||||||||
Equity Risk | ||||||||||||
| Futures Contracts | Receivable for variation margin on futures contracts* | $119 | Payable for variation margin on futures contracts* | $— | ||||||||
Interest Rate Risk | ||||||||||||
| Futures Contracts | Receivable for variation margin on futures contracts* | — | Payable for variation margin on futures contracts* | 56,027 | ||||||||
| * | For futures contracts, the amounts represent the cumulative appreciation/depreciation of these futures contracts as reported in the Schedule of Portfolio Investments. Only the current day’s variation margin is reported within the Statement of Assets and Liabilities as variation margin on futures contracts. |
The following is a summary of the effect of derivative instruments on the Statement of Operations, categorized by risk exposure, for the year ended December 31, 2022:
| Primary Risk Exposure | Location of Gains/(Losses) on Derivatives Recognized | Realized Gains/(Losses) on Derivatives Recognized | Change in Net Unrealized on Derivatives Recognized | |||||||
Equity Risk | ||||||||||
| Futures Contracts | Net realized gains/(losses) on futures contracts/ Change in net unrealized appreciation/ depreciation on futures contracts | $(804,512) | $(115,897) | |||||||
Interest Rate Risk | ||||||||||
| Futures Contracts | Net realized gains/(losses) on futures contracts/ Change in net unrealized appreciation/ depreciation on futures contracts | (854,231 | ) | (140,017 | ) | |||||
3. Fees and Transactions with Affiliates and Other Parties
The Manager provides investment advisory and management services for the Fund. The Manager has contractually agreed to waive fees and reimburse the Fund to limit the annual expenses, excluding interest expense (e.g., cash overdraft fees), taxes, brokerage commissions, acquired fund fees and expenses, other expenditures that are capitalized in accordance with U.S. GAAP and other extraordinary expenses not incurred in the ordinary course of the Fund’s business, based on the daily net assets of the Fund, through April 30, 2024. Expenses incurred for investment advisory and management services are reflected on the Statement of Operations as “Management fees.
” For the year ended December 31, 2022, the annual rate due to the Manager and the annual expense limit were as follows:
| Annual Rate | Annual Expense Limit | |||||||||
AZL MVP Balanced Index Strategy Fund | 0.10 | % | 0.20 | % | ||||||
Any amounts contractually waived or reimbursed by the Manager with respect to the annual expense limit in a particular fiscal year will be subject to repayment by the Fund to the Manager to the extent that from time to time through the next three fiscal years the repayment will not cause the Fund’s expenses to exceed the lesser of the stated limit at the time of the waiver or the current stated limit. Any amounts recouped by the Manager during the year are reflected on the Statement of Operations as “Recoupment of prior expenses reimbursed by the Manager.” At December 31, 2022, there were no remaining contractual reimbursements subject to repayment by the Fund in subsequent years.
9
AZL MVP Balanced Index Strategy Fund
Notes to the Financial Statements
December 31, 2022
Management fees, which the Manager may waive in order to maintain more competitive expense ratios, are not subject to repayment in subsequent years. Information on the total amount waived/reimbursed by the Manager or repaid to the Manager by the Fund during the year can be found on the Statement of Operations, as applicable. During the year ended December 31, 2022, there were no such waivers.
The Manager or an affiliate of the Manager serves as the investment adviser of certain underlying funds in which the Fund invests. At December 31, 2022, these underlying funds are noted as Affiliated Investment Companies in the Fund’s Schedule of Portfolio Investments. Additional information, including financial statements, about these Funds is available at www.allianzlife.com. The Manager or an affiliate of the Manager is paid a separate fee from the underlying funds for such services. A summary of the Fund’s investments in affiliated investment companies for the year ended December 31, 2022 is as follows:
Value 12/31/21 | Purchases at Cost | Proceeds from Sales | Net Realized Gains (Losses) | Change in Net Unrealized Appreciation (Depreciation) | Value 12/31/22 | Shares as of | Dividend Income | Net Realized Gains from Affiliated | |||||||||||||||||||||||||||||||||||||
AZL Enhanced Bond Index Fund | $ | 152,852,171 | $ | 1,947,675 | $ | (18,148,385 | ) | $ | (2,877,365) | $ | (19,180,523 | ) | $ | 114,593,573 | 12,087,930 | $ | 1,879,879 | $ | 67,795 | ||||||||||||||||||||||||||
AZL International Index Fund, Class 2 | 41,204,618 | 1,893,593 | (5,505,814 | ) | 282,534 | (7,793,797 | ) | 30,081,134 | 1,971,241 | 946,357 | 806,687 | ||||||||||||||||||||||||||||||||||
AZL Mid Cap Index Fund, Class 2 | 24,548,632 | 4,005,265 | (3,188,090 | ) | 75,679 | (7,314,683 | ) | 18,126,803 | 945,582 | 143,213 | 3,862,052 | ||||||||||||||||||||||||||||||||||
AZL S&P 500 Index Fund, Class 2 | 77,077,394 | 8,733,376 | (7,757,154 | ) | 2,363,157 | (24,201,438 | ) | 56,215,335 | 3,318,497 | 651,954 | 7,715,674 | ||||||||||||||||||||||||||||||||||
AZL Small Cap Stock Index Fund, Class 2 | 12,881,687 | 1,886,338 | (1,288,445 | ) | 8,107 | (3,903,824 | ) | 9,583,863 | 838,483 | 84,383 | 1,713,718 | ||||||||||||||||||||||||||||||||||
|
|
|
|
|
|
|
|
|
|
|
|
|
|
|
|
|
| ||||||||||||||||||||||||||||
| $ | 308,564,502 | $ | 18,466,247 | $ | (35,887,888) | $ | (147,888 | ) | $ | (62,394,265) | $ | 228,600,708 | 19,161,733 | $ | 3,705,786 | $ | 14,165,926 | ||||||||||||||||||||||||||||
|
|
|
|
|
|
|
|
|
|
|
|
|
|
|
|
|
| ||||||||||||||||||||||||||||
Pursuant to separate agreements between the Trust and the Manager, the Manager provides a Chief Compliance Officer (“CCO”) and certain compliance oversight and regulatory filing services to the Trust. Under these agreements, the Manager is entitled to an amount equal to a portion of the compensation and certain other expenses related to the individuals performing the CCO and compliance oversight services, as well as $100 per hour for time incurred in connection with the preparation and filing of certain documents with the SEC. The fees are paid to the Manager on a quarterly basis. The total expenses incurred by the Fund for these services are reflected on the Statement of Operations as “Administrative and compliance services fees.”
Citi Fund Services Ohio, Inc. (“Citi” or the “Administrator”), a wholly owned subsidiary of Citigroup, Inc., with which an officer of the Trust is affiliated, serves as the Trust’s administrator and fund accountant, and assists the Trust in all aspects of its administration and operation. The Administrator is entitled to a fee, accrued daily and paid monthly. The Administrator is entitled to an annual fee for each additional class of shares of any Fund, certain annual fees in supporting fair value services, and a Trust-wide annual fee for providing infrastructure and support in implementing the written policies and procedures comprising the Fund’s compliance program. The Administrator is also reimbursed for certain expenses incurred. The total expenses incurred by the Fund for these services are reflected on the Statement of Operations as “Administration fees.”
FIS Investor Services LLC (“FIS”) serves as the Fund’s transfer agent. Under the Transfer Agent Agreement, the Trust pays FIS a fee for its services and reimburses FIS for all of their reasonable out-of-pocket expenses incurred in providing these services.
The Bank of New York Mellon (“BNY Mellon” or the “Custodian”) serves as the Trust’s custodian. For these services as custodian, the Funds pay BNY Mellon a fee based on a percentage of assets held on behalf of the Funds, plus certain out-of-pocket charges.
Allianz Life Financial Services, LLC (“ALFS”), an affiliate of the Manager, serves as distributor of the Fund. ALFS receives an annual Trust-wide annual fee of $7,500, paid by the Manager from its profits and not by the Trust, for recordkeeping and reporting services.
Certain Officers and Trustees of the Trust are affiliated with the Manager or the Administrator. Such Officers (except for the Trust’s CCO as noted above) and Trustees receive no compensation from the Trust for serving in their respective roles.
4. Investment Valuation Summary
The valuation techniques employed by the Fund, as described below, maximize the use of observable inputs and minimize the use of unobservable inputs in determining fair value. The inputs used for valuing the Fund’s investments are summarized in the three broad levels listed below:
● Level 1 - | quoted prices in active markets for identical assets | |
● Level 2 - | other significant observable inputs (including quoted prices for similar securities, interest rates, prepayments speeds, credit risk, etc.) | |
● Level 3 - | significant unobservable inputs (including the Fund’s own assumptions in determining the fair value of investments) |
Changes in valuation techniques may result in transfers in or out of an assigned level within the disclosure hierarchy. The inputs or methodology used for valuing investments is not necessarily an indication of the risk associated with investing in those investments.
Investments in other investment companies are valued at their published net asset value (“NAV”). Security prices are determined pursuant to valuation procedures approved by the Trust’s Board of Trustees (the “Board” or “Trustees”) as of the close of the New York Stock Exchange (“NYSE”) (generally 4:00 pm Eastern Time). The investments utilizing Level 1 valuations represent investments in open-end investment companies. Futures contracts are valued at the settlement prices established each day on the primary exchange and are typically categorized as Level 1 in the fair value hierarchy.
The Board has designated the Manager to perform the Fund’s fair value determinations in accordance with valuation procedures approved by the Board. The effect of using fair value pricing is that the Fund’s NAV will be subject to the judgment of the Manager. The Manager’s fair valuation process is subject to the oversight of the Board.
10
AZL MVP Balanced Index Strategy Fund
Notes to the Financial Statements
December 31, 2022
The following is a summary of the valuation inputs used as of December 31, 2022 in valuing the Fund’s investments based upon the three levels defined above:
| Investment Securities: | Level 1 | Level 2 | Level 3 | Total | ||||||||||||||||
Affiliated Investment Companies | $228,600,708 | $— | $— | $228,600,708 | ||||||||||||||||
|
|
|
|
|
|
|
| |||||||||||||
Total Investment Securities | 228,600,708 | — | — | 228,600,708 | ||||||||||||||||
|
|
|
|
|
|
|
| |||||||||||||
Other Financial Instruments:* | ||||||||||||||||||||
Futures contracts | (55,908) | — | — | (55,908) | ||||||||||||||||
|
|
|
|
|
|
|
| |||||||||||||
Total Investments | $228,544,800 | $— | $— | $228,544,800 | ||||||||||||||||
|
|
|
|
|
|
|
| |||||||||||||
| * | Other Financial Instruments would include any derivative instruments, such as futures contracts. These investments are generally presented in the financial statements at variation margin. |
5. Security Purchases and Sales
For the year ended December 31, 2022, cost of purchases and proceeds from sales of securities (excluding securities maturing less than one year from acquisition) were as follows:
| Purchases | Sales | |||||||||
AZL MVP Balanced Index Strategy Fund | $ | 18,466,247 | $ | 35,887,888 | ||||||
6. Investment Risks
The risks below are presented in an order intended to facilitate readability. Their order does not imply that the realization of one risk is more likely to occur more frequently than another risk, nor does it imply that the realization of one risk is likely to have a greater adverse impact than another risk. The Fund may be subject to other risks in addition to these identified risks. This section discusses certain common principal risks encountered by the Fund.
Derivatives Risk: The Fund may invest directly or through affiliated or unaffiliated mutual funds or unregistered investment pools in derivative instruments such as futures, options, and options on futures. A derivative is a financial contract whose value depends on, or is derived from, the value of an underlying asset, reference rate, or risk. Use of derivative instruments involves risks different from, or possibly greater than, the risks associated with investing directly in securities and other traditional investments. Derivatives are subject to a number of other risks, such as liquidity risk, interest rate risk, market risk, credit risk, and selection risk. Derivatives also involve the risk of mispricing or improper valuation and the risk that changes in the value may not correlate perfectly with the underlying asset, rate, or index. Using derivatives may result in losses, possibly in excess of the principal amount invested. Also, suitable derivative transactions may not be available in all circumstances. The other party to a derivatives contract could default.
Foreign Securities Risk: Investing in the securities of non-U.S. issuers involves a number of risks, such as fluctuations in currency values, adverse political, social or economic developments, and differences in social and economic developments or policies. Such risks include future political and economic developments, and the possible imposition of exchange controls or other foreign governmental laws and restrictions. In addition, with respect to certain countries, there is the possibility of expropriation of assets, confiscatory taxation, political or social instability or diplomatic developments which could adversely affect investments in those securities. Certain foreign companies may be subject to sanctions, embargoes, or other governmental actions that may impair or otherwise limit the ability to invest in, receive, hold or sell the securities of such companies.
Fund of Fund Risk: The Fund, as a shareholder of the underlying funds, indirectly bears its proportionate share of any investment management fees and other expenses of the underlying funds. Further due to the fees and expenses paid by the Fund, as well as small variations in the Fund’s actual allocations to the underlying funds and any futures and cash held in the Fund’s portfolio, the performance and income distributions of the Fund will not be the same as the performance and income distributions of the underlying funds. In addition, the Fund maintains indirect exposure to various types of risk which may exist in the underlying Funds, such as foreign securities risk, fixed income securities risk and other risks.
Interest Rate Risk: Debt securities held by an underlying fund may decline in value due to rising interest rates. The price of a bond is also affected by its maturity. Bonds with longer maturities generally have greater sensitivity to changes in interest rates.
Market Risk: The market price of securities owned by the underlying funds may go up or down, sometimes rapidly and unpredictably. Securities may decline in value due to factors affecting securities markets generally or particular industries represented in the securities markets. The value of a security may decline due to general market conditions that are not specifically related to a particular company, such as real or perceived adverse economic conditions, changes in the general outlook for corporate earnings, changes in interest or currency rates, or adverse investor sentiment, as well as natural disasters, and outbreaks of infectious illnesses or other widespread public health issues.
Quantitative Investing Risk: The value of securities selected using quantitative analysis can react differently to issuer, political, market, and economic developments than the market as a whole or securities selected using only fundamental analysis. The factors used in quantitative analysis and the weight placed on those factors may not be predictive of a security’s value. In addition, factors that affect a security’s value can change over time and these changes may not be reflected in the quantitative model. A quantitative model can be adversely affected by errors or imperfections in the factors or the data on which evaluations are based, or by technical issues with construction or implementation of the model, which in any case may result in a failure of the portfolio to perform as expected or a failure to identify securities that will perform well in the future.
7. Coronavirus (COVID-19) Pandemic
The global outbreak of the COVID-19 strain of the coronavirus has caused adverse effects on many companies, sectors, nations, regions and the markets in general, and may continue for an unpredictable duration. The effects of this pandemic may adversely impact the value and performance of the Fund, its ability to buy and sell fund investments at appropriate valuations, and its ability to achieve its investment objective(s).
11
AZL MVP Balanced Index Strategy Fund
Notes to the Financial Statements
December 31, 2022
8. Federal Tax Information
It is the policy of the Fund to continue to qualify as a regulated investment company by complying with the provisions available to certain investment companies, as defined under Subchapter M of the Internal Revenue Code, and to make distributions of net investment income and net realized gains sufficient to relieve it from all, or substantially all, federal income taxes. Accordingly, no provisions for federal income taxes are required in the financial statements.
Management of the Fund has reviewed tax positions taken in tax years that remain subject to examination by all major tax jurisdictions, including federal (i.e., the last four tax year ends and the interim tax period since then, as applicable). Management believes that there is no tax liability resulting from unrecognized tax benefits related to uncertain tax positions taken.
Cost of securities, including derivatives and short positions as applicable, for federal income tax purposes at December 31, 2022 is $226,021,731. The gross unrealized appreciation/ (depreciation) on a tax basis is as follows:
Unrealized appreciation | $18,868,022 | ||||
Unrealized (depreciation) | (16,289,045) | ||||
|
| ||||
Net unrealized appreciation/(depreciation) | $2,578,977 | ||||
|
|
The tax character of dividends paid to shareholders during the year ended December 31, 2022 was as follows:
| Ordinary Income | Net Long-Term | Total Distributions(a) | |||||||||||||
AZL MVP Balanced Index Strategy Fund | $ | 12,671,482 | $ | 10,911,352 | $ | 23,582,834 | |||||||||
(a) Total distributions paid may differ from the Statements of Changes in Net Assets because dividends are recognized when actually paid for tax purposes.
The tax character of dividends paid to shareholders during the year ended December 31, 2021 was as follows:
| Ordinary Income | Net Long-Term | Total Distributions(a) | |||||||||||||
AZL MVP Balanced Index Strategy Fund | $ | 12,933,774 | $ | 9,550,742 | $ | 22,484,516 | |||||||||
| (a) | Total distributions paid may differ from the Statements of Changes in Net Assets because dividends are recognized when actually paid for tax purposes. |
At December 31, 2022, the components of accumulated earnings on a tax basis were as follows:
| Undistributed Ordinary Income | Undistributed Long-Term Capital Gains | Accumulated Capital and Other Losses | Unrealized Appreciation/ Depreciation(a) | Total Accumulated Earnings/ (Deficit) | |||||||||||||||||||||
AZL MVP Balanced Index Strategy Fund | $ | 4,448,788 | $ | 7,647,345 | $ | — | $ | 2,578,977 | $ | 14,675,110 | |||||||||||||||
| (a) | The differences between book-basis and tax-basis unrealized appreciation/(depreciation) is attributable primarily to tax deferral of losses on wash sales, mark-to-market of futures contracts and straddles. |
9. Ownership and Principal Holders
The beneficial ownership, either directly or indirectly, of more than 25% of the voting securities of a fund creates presumptions of control of the fund, under section 2 (a)(9) of the 1940 Act. As of December 31, 2022, the Fund had an individual shareholder account which is affiliated with the Manager representing ownership in excess of 85% of the Fund. Investment activities of this shareholder could have a material impact to the Fund.
10. Subsequent Events
Management of the Fund has evaluated the need for additional disclosures or adjustments resulting from events through the date the financial statements were issued. Based on this evaluation, there were no subsequent events to report that would have material impact on the Fund’s financial statements, except as noted below.
The reorganization, as discussed in Note 1, whereby the Fund will acquire all of the assets and liabilities of the AZL MVP Fusion Balanced Fund, is expected to be completed on or about March 10, 2023.
12
REPORT OF INDEPENDENT REGISTERED PUBLIC ACCOUNTING FIRM
To the Board of Trustees of Allianz Variable Insurance Products Fund of Funds Trust and Shareholders of
AZL MVP Balanced Index Strategy Fund
Opinion on the Financial Statements
We have audited the accompanying statement of assets and liabilities, including the schedule of portfolio investments, of AZL MVP Balanced Index Strategy Fund (one of the funds constituting Allianz Variable Insurance Products Fund of Funds Trust, referred to hereafter as the “Fund”) as of December 31, 2022, the related statement of operations for the year ended December 31, 2022, the statements of changes in net assets for each of the two years in the period ended December 31, 2022, including the related notes, and the financial highlights for each of the five years in the period ended December 31, 2022 (collectively referred to as the “financial statements”). In our opinion, the financial statements present fairly, in all material respects, the financial position of the Fund as of December 31, 2022, the results of its operations for the year then ended, the changes in its net assets for each of the two years in the period ended December 31, 2022 and the financial highlights for each of the five years in the period ended December 31, 2022 in conformity with accounting principles generally accepted in the United States of America.
Basis for Opinion
These financial statements are the responsibility of the Fund’s management. Our responsibility is to express an opinion on the Fund’s financial statements based on our audits. We are a public accounting firm registered with the Public Company Accounting Oversight Board (United States) (PCAOB) and are required to be independent with respect to the Fund in accordance with the U.S. federal securities laws and the applicable rules and regulations of the Securities and Exchange Commission and the PCAOB.
We conducted our audits of these financial statements in accordance with the standards of the PCAOB. Those standards require that we plan and perform the audit to obtain reasonable assurance about whether the financial statements are free of material misstatement, whether due to error or fraud.
Our audits included performing procedures to assess the risks of material misstatement of the financial statements, whether due to error or fraud, and performing procedures that respond to those risks. Such procedures included examining, on a test basis, evidence regarding the amounts and disclosures in the financial statements. Our audits also included evaluating the accounting principles used and significant estimates made by management, as well as evaluating the overall presentation of the financial statements. Our procedures included confirmation of securities owned as of December 31, 2022 by correspondence with the transfer agent and brokers. We believe that our audits provide a reasonable basis for our opinion.
/s/ PricewaterhouseCoopers LLP
New York, New York
February 23, 2023
We have served as the auditor of one or more investment companies in the Allianz Variable Insurance Products complex since 2018.
13
Other Federal Income Tax Information (Unaudited)
For the year ended December 31, 2022, 8.36% of the total ordinary income dividends paid by the Fund qualify for the corporate dividends received deductions available to corporate shareholders.
During the year ended December 31, 2022, the Fund declared net short-term capital gain distributions of $6,885,873.
During the year ended December 31, 2022, the Fund declared net long-term capital gain distributions of $10,911,352.
14
A description of the policies and procedures that the Fund uses to determine how to vote proxies relating to portfolio securities is available, without charge, upon request, by visiting the Securities and Exchange Commission’s (‘‘Commission’’) website at www.sec.gov, or by calling 800-624-0197.
Information regarding how the Fund voted proxies relating to portfolio securities during the most recent 12-month period ended June 30th is available (i) without charge, upon request, by calling 800-624-0197; (ii) on the Trust’s website at https://www.allianzlife.com; and (iii) on the Commission’s website at http://www.sec.gov.
The Fund files complete Schedules of Portfolio Holdings with the Commission for the first and third quarters of each fiscal year on Form N-PORT. Schedules of Portfolio Holdings for the Fund are available without charge on the Commission’s website at http://www.sec.gov, or may be obtained by calling 800-624-0197.
15
Approval of Investment Advisory Agreement (Unaudited)
Subject to the general supervision of the Board of Trustees (the “Board”) and in accordance with the investment objectives and restrictions of each separate series (each a “Fund,” together, the “Funds”) of the Allianz Variable Insurance Products Fund of Funds Trust (the “Trust”), investment advisory services are provided to the Funds by Allianz Investment Management LLC (the “Manager”). The Manager manages each Fund pursuant to an investment management agreement (the “Management Agreement”) with the Trust in respect of each such Fund. The Management Agreement provides that the Manager, subject to the supervision and approval of the Board, is responsible for the management of each Fund. For management services, each Fund pays the Manager an investment advisory fee based upon each Fund’s average daily net assets. The Manager has contractually agreed to limit the expenses of each Fund by reimbursing the Fund if and when total Fund operating expenses exceed certain amounts until at least April 30, 2024 (the “Expense Limitation Agreement”).
In reviewing the services provided by the Manager and the terms of the Management Agreement, the Board receives and reviews information related to the Manager’s experience and expertise in the variable insurance marketplace. In addition, the Board receives information regarding the Manager’s expertise with regard to portfolio diversification and asset allocation requirements within variable insurance products issued by Allianz Life Insurance Company of North America (“Allianz Life”) and its subsidiary, Allianz Life Insurance Company of New York (“Allianz of New York”). Currently, the Funds are offered only through Allianz Life and Allianz of New York variable products, and not in the retail fund market.
As required by the Investment Company Act of 1940 (the “1940 Act”), the Board has reviewed and approved the Management Agreement with the Manager. The Board’s decision to approve this contract reflects the exercise of its business judgment on whether to approve new arrangements and continue the existing arrangements. During its review of the contract, the Board considered many factors, among the most material of which are: the Fund’s investment objectives and long-term performance; the Manager’s management philosophy, personnel, processes and investment performance, including its compliance history and the adequacy of its compliance processes; the preferences and expectations of Fund shareholders (and underlying contract owners) and their relative sophistication; the continuing state of competition in the mutual fund industry; and comparable fees in the mutual fund industry.
The Board also considered the compensation and benefits received by the Manager. This includes fees received for services provided to a Fund by employees of the Manager or of affiliates of the Manager and research services received by the Manager from brokers that execute Fund trades, as well as advisory fees. The Board considered the fact that: (1) the Manager and the Trust are parties to an Administrative Services Agreement and a Compliance Services Agreement, under which the Manager is compensated by the Trust for performing certain administrative and compliance services including providing an employee of the Manager or one of its affiliates to act as the Trust’s Chief Compliance Officer; and (2) Allianz Life Financial Services, LLC, an affiliated person of the Manager, is a registered securities broker-dealer and received (along with its affiliated persons) payments made by the underlying funds pursuant to Rule 12b-1.
The Board is aware that various courts have interpreted provisions of the 1940 Act and have indicated in their decisions that the following factors may be relevant to an adviser’s compensation: the nature, extent and quality of the services provided by the adviser, including the performance of the fund; the adviser’s cost of providing the services; the extent to which the adviser may realize “economies of scale” as the fund grows larger; any indirect benefits that may accrue to the adviser and its affiliates as a result of the adviser’s relationship with the fund; performance and expenses of comparable funds; the profitability of acting as adviser to the fund; and the extent to which the independent Board members, who are not “interested persons” of a fund as defined by the 1940 Act (“Independent Trustees”), are fully informed about all facts bearing on the adviser’s services and fees. The Board is aware of these factors and takes them into account in its review of the Management Agreement for the Funds.
Each member of the Board considered and weighed these factors in light of his or her experience in governing the Trust. The Board is assisted in its deliberations by the advice of independent legal counsel to the Independent Trustees (“Independent Trustee Counsel”). In this regard, the Board requests and receives a significant amount of information about the Funds and the Manager. Some of this information is provided at each regular meeting of the Board; additional information is provided in connection with the particular meetings at which the Board’s formal review of the Management Agreement occurs. In between regularly scheduled meetings, the Board may receive information on particular matters as the need arises. Thus, the Board’s evaluation of the Management Agreement is informed by reports covering such matters as: the Manager’s investment philosophy, personnel and processes, and the Fund’s investment performance (in absolute terms as well as in relationship to its benchmark and certain competitor or “peer group” funds). In connection with comparing the performance of each Fund versus its benchmark, the Board receives reports on the extent to which the Fund’s performance may be attributed to various applicable factors, such as asset class allocation decisions and volatility management strategies, if applicable, the performance of the underlying funds, rebalancing decisions, and the impact of cash positions and Fund fees and expenses. The Board also receives reports on the Funds’ expenses (including the advisory fee itself and the overall expense structure of the Funds, both in absolute terms and relative to peer group and/or competing funds, with due regard for the Expense Limitation Agreement and additional voluntary expense limitations); the use and allocation of any brokerage commissions derived from trading the Funds’ portfolio securities; the nature, extent and quality of the advisory and other services provided to the Fund by the Manager and its affiliates; compliance and audit reports concerning the Funds and the companies that service them; and relevant developments in the mutual fund industry and how the Funds and/or the Manager are responding to them.
The Board also receives financial information about the Manager, including reports on the compensation and benefits the Manager derives from its relationships with the Funds. These reports cover not only the fees under the Management Agreement, but also the fees, if any, received for providing other services to the Funds. The reports also discuss any indirect or “fall-out” benefits the Manager or its affiliates may derive from their relationships with the Funds.
The Management Agreement was most recently considered at Board meetings held in the summer and fall of 2022. Information relevant to the approval of the Management Agreement was considered at Board meetings held June 14 and 21, 2022, and September 13, 2022, as well as at various other meetings preceding those meetings. Accordingly, the Management Agreement was approved by the Board at an in-person meeting on September 13, 2022. At such meeting the Board also approved the Expense Limitation Agreement between the Manager and the Trust for the period ending April 30, 2024.
In connection with such meetings, the Board requested and evaluated extensive materials from the Manager, including performance and expense information for other investment companies with similar investment objectives derived from data compiled by an independent third-party provider and other sources believed to be reliable by the Manager and the Trustees. Prior to voting, the Trustees reviewed the proposed approval of the Management Agreement with management and with Independent Trustee Counsel and received a memorandum from such counsel discussing the legal standards for their consideration of the proposed approval. The Independent Trustees also discussed the proposed approval in private sessions with Independent Trustee Counsel at which no representatives of the Manager were present. In reaching their determinations relating to the approval of the Management Agreement, in respect of each Fund, each member of the Board considered all factors he or she believed relevant. The Board based its decision to approve
16
the Management Agreement on the totality of the circumstances and relevant factors, and with a view to past and future long-term considerations. Not all of the factors and considerations discussed above and below are necessarily relevant to every Fund, and the Board did not assign relative weights to factors discussed herein or deem any one or group of them to be controlling in and of themselves.
Shareholder reports must include a discussion of certain factors relating to the selection of the investment adviser and the approval of the advisory fee. The “factors” enumerated by the SEC are set forth below in italics, as well as the Board’s conclusions regarding such factors:
(1) The nature, extent and quality of services provided by the Manager. The Trustees noted that the Manager, subject to the oversight of the Board, administers each Fund’s business and other affairs. The Trustees noted that the Manager also provides the Trust and each Fund with such administrative and other services (exclusive of, and in addition to, any such services provided by any other service providers retained by the Trust on behalf of the Funds) and executive and other personnel as are necessary for the operation of the Trust and the Funds. Except for the Trust’s Chief Compliance Officer and certain compliance staff, the Manager pays all of the compensation of Trustees and officers of the Trust who are employees of the Manager or its affiliates.
The Board considered the scope and quality of services provided by the Manager and noted that the scope of the services provided has continued to expand as a result of regulatory and other developments. The Board noted, for example, that the Manager is responsible for maintaining and monitoring its own compliance program, and this compliance program has been continuously refined and enhanced in light of new regulatory requirements. The Board considered the capabilities and resources which the Manager has dedicated to performing services on behalf of the Trust and its Funds. The quality of administrative and other services, including the Manager’s role in coordinating the activities of the Trust’s other service providers, also were considered. The Board concluded that, overall, they were satisfied with the nature, extent and quality of services provided (and expected to be provided) to the Trust and to each of the Funds under the Management Agreement.
(2) The investment performance of the Funds and the Manager. In connection with every quarterly Board meeting and the summer and fall 2022 contract review process, Trustees received extensive information on the performance results of each Fund. This included, for example, performance information on absolute total return, performance versus the appropriate benchmark(s) and performance versus peer groups as reported by Lipper, the contribution to performance of the Manager’s asset class allocation decisions and volatility management strategies, if applicable, the performance of the underlying funds, and the impact on performance of rebalancing decisions, cash and Fund fees. This included Lipper performance information on the Funds for the previous quarter, and previous one-, three- and five-year periods, to the extent available. For example, in connection with the Board meetings held June 14 and 21, 2022, and September 13, 2022, the Manager reported that, for the five-year period ended December 31, 2021, two Funds were in the top 40%, three were in the middle 20%, and seven were in the bottom 40% of their respective Lipper peer groups. The Manager reported that for the three-year period ended December 31, 2021, three Funds were in the top 40%, two were in the middle 20%, and seven were in the bottom 40% of their respective Lipper peer groups. For the one-year period ended December 31, 2021, six Funds were in the top 40%, two were in the middle 20%, and four were in the bottom 40% of their respective Lipper peer groups.
The Manager also reported on the performance of the MVP Funds compared to custom managed-volatility peer groups. For the five-year period ended December 31, 2021, four Funds were in the top 40%, two were in the middle 20%, and four were in the bottom 20%. For the three-year period ended December 31, 2021, four Funds were in the top 40%, two were in the middle 20%, and four were in the bottom 40% of their respective custom managed-volatility peer groups. For the one-year period ended December 31, 2021, seven Funds were in the top 40%, two were in the middle 20%, and one was in the bottom 40% of their respective custom managed-volatility peer groups. The Board members discussed with the Manager and considered the impact of the volatility management strategies on performance in different market environments, where applicable, and considered whether they were operating as intended. The Board noted, in particular, the impact of certain characteristics of the Funds’ volatility management strategies in relation to volatility experienced as a result of the COVID-19 pandemic, and that relative performance had improved as the markets stabilized.
At the Board meeting held September 13, 2022, the Board also received updated performance information for the Funds, including updated Lipper peer group ranking information, for various periods ending June 30, 2022.
At the Board meeting held September 13, 2022, the Trustees determined that the investment performance of the Funds was acceptable.
(3) The costs of services to be provided and profits to be realized by the Manager and its affiliates from the relationship with the Funds. The Board considered that the Manager receives an advisory fee from each of the Funds. The Manager reported that for the three MVP Fusion Funds the advisory fee paid put these Funds in the 13th percentile of the customized peer group. The Manager reported that for the four MVP Index Strategy Funds the advisory fee paid put them in the 23rd percentile of the customized peer group, and for the AZL Balanced Index Strategy Fund the advisory fee paid put it in the 7th percentile of the customized peer group. The Manager reported that for the AZL DFA Multi-Strategy Fund, the advisory fee paid was in the 5th percentile. The Manager reported that for the AZL MVP DFA Multi-Strategy, AZL MVP FIAM Multi-Strategy, and AZL MVP T. Rowe Price Capital Appreciation Plus Funds, the advisory fee paid was in the 1st percentile. (A lower percentile reflects lower fund fees and is better for fund shareholders.) Trustees were provided with information on the total expense ratios of the Funds and other funds in the customized peer groups, and the Manager reported upon the challenges in making peer group comparisons for the Funds. The Board further considered and found that the advisory fee paid to the Manager with respect to each Fund was based on services provided to the Fund that were in addition to, rather than duplicative of, the services provided pursuant to the advisory agreements for the underlying funds in which the Fund invests.
The Manager provided information concerning the profitability of the Manager’s investment advisory activities for the period from 2019 through 2021. The Board recognized that it is difficult to make comparisons of profitability from investment company advisory agreements because comparative information is not generally publicly available and is affected by numerous factors, including the structure of the particular adviser, the types of funds it manages, its business mix, numerous assumptions regarding allocation of expenses and the adviser’s capital structure and cost of capital. In considering profitability information, the Board considered the possible effect of certain fall-out benefits to the Manager and its affiliates. The Board focused on profitability of the Manager’s relationships with the Funds before taxes and distribution expenses. The Board recognized that the Manager should earn a reasonable level of profits for the services it provides to each Fund.
The Board also considered that Wilshire Funds Management (“Wilshire”) serves as a consultant to the Manager in preparing statistical and other factual information for use in the creation and maintenance of the asset allocation models for the AZL MVP Fusion Funds, pursuant to an agreement between the Manager and Wilshire. Wilshire serves as a consultant to the Manager with respect to selecting the AZL MVP Fusion Funds’ underlying funds and the asset allocations among the underlying funds. The Manager, not any Fund, pays a consultant fee to Wilshire.
(4) and (5) The extent to which economies of scale would be realized as the Funds grow, and whether fee levels reflect these economies of scale. The Board noted that the advisory fee schedules for the Funds do not contain breakpoints that reduce the fee rate on assets above specified levels. The Board recognized that breakpoints may be an appropriate way for the Manager to share its economies of scale, if any, with Funds that have substantial assets. The Board found there was no uniform methodology for establishing breakpoints
17
that give effect to Fund-specific services provided by the Manager. The Board noted that in the fund industry as a whole, as well as among funds similar to the Funds, there is no uniformity or pattern in the fees and asset levels at which breakpoints (if any) apply. Depending on the age, size, and other characteristics of a particular fund and its manager’s cost structure, different conclusions can be drawn as to whether there are economies of scale to be realized at any particular level of assets, notwithstanding the intuitive conclusion that such economies exist, or will be realized at some level of total assets. Moreover, because different managers have different cost structures and service models, it is difficult to draw meaningful conclusions from the breakpoints that may have been adopted by other funds. The Board also noted that the advisory agreements for many funds do not have breakpoints at all, or if breakpoints exist, they may be at asset levels significantly greater than those of the individual Funds. The Board noted that the total assets in all of the Funds, as of June 30, 2022, were approximately $8.2 billion and that the largest Fund, the AZL MVP Growth Index Strategy Fund, had assets of approximately $2.1 billion.
The Board noted that the Manager has agreed to temporarily limit Fund expenses under the Expense Limitation Agreement, which has the effect of reducing expenses similar to implementation of advisory fee breakpoints. The Manager has committed to continue to consider the continuation of expense limits and/or advisory fee breakpoints as Fund assets change. The Board receives quarterly reports on the level of Fund assets. The Board expects to continue to consider: (a) the extent to which economies of scale have been realized, and (b) whether the advisory fee should be modified, either in connection with the next renewal of the Management Agreement or by modifying the Expense Limitation Agreement, to reflect such economies of scale, if any.
Having taken these factors into account, the Board concluded that the absence of breakpoints in the Funds’ advisory fee rate schedules was acceptable under each Fund’s circumstances.
In conclusion, after full consideration of the above factors, as well as such other factors as each member of the Board considered instructive in evaluating the Management Agreement, the Board concluded that the advisory fees were reasonable, and that the continuation of the Management Agreement was in the best interest of the Funds.
18
Information about the Board of Trustees and Officers (Unaudited)
The Trust is managed by the Trustees in accordance with the laws of the state of Delaware governing business trusts. In addition to serving on the Board of Trustees of the Trust, each Trustee serves on the Board of the Allianz Variable Insurance Products Trust (“VIP Trust”) and the AIM ETF Products Trust (“ETF Trust”) (collectively, the Trust, the VIP Trust, and ETF Trust are the “AIM Complex”). There are currently seven Trustees, one of whom is an “interested person” of the Trust within the meaning of that term under the 1940 Act. The Trustees and Officers of the Trust, and their addresses, years of birth, their positions held with the Trust, their terms of office with the Trust and length of time served, their principal occupation(s) during the past five years, the number of portfolios in the Trust they oversee, and their other directorships held during the past five years are as follows:
Independent Trustees(1)
| Name, Address, and Birth Year | Positions Held with AIM Complex | Term of Office(2)/Length of Time Served | Principal Occupation(s) During Past 5 Years | Number of for the AIM | Other Directorships the AIM Complex 5 Years | |||||
Peggy L. Ettestad (1957) 5701 Golden Hills Drive Minneapolis, MN 55416 | Lead Independent Trustee | Since 10/14 (Trustee since 2/07) | Managing Director, Red Canoe Management Consulting LLC, 2008 to present | 50 | None | |||||
Tamara Lynn Fagely (1958) 5701 Golden Hills Drive Minneapolis, MN 55416 | Trustee | Since 12/17 | Retired; previously, Chief Operations Officer, Hartford Funds, 2012 to 2013 | 50 | Diamond Hill Funds (10 Funds) | |||||
Richard H. Forde (1953) 5701 Golden Hills Drive Minneapolis, MN 55416 | Trustee | Since 12/17 | Retired; previously, Member of the Board and Chairman of the Finance and Investment Committee, Connecticut Water Service, Inc., 2013 to 2019 | 50 | Connecticut Water Service, Inc. | |||||
Jack Gee (1959) 5701 Golden Hills Drive Minneapolis, MN 55416 | Trustee | Since 1/22 (Consultant to the Independent Trustees since 2/20)(3) | Retired; previously, Managing Director, BlackRock, Inc., Treasurer and Chief Financial Officer U.S. iShares, 2004 to 2019 | 50 | Engine No. 1 ETF Trust (2 Funds); Esoterica Thematic Trust (2019 - 2020) | |||||
Claire R. Leonardi (1955) 5701 Golden Hills Drive Minneapolis, MN 55416 | Trustee | Since 2/04 | Retired; previously, CEO, Health eSense Inc. (a medical device company), 2015 to 2018, and Connecticut Innovations, Inc. (a venture capital firm), 2012 to 2015 | 50 | None | |||||
Dickson W. Lewis (1948) 5701 Golden Hills Drive Minneapolis, MN 55416 | Trustee | Since 2/04 | Retired; previously, senior executive for Lifetouch National School Studios (a photography company), 2006 to 2014, Jostens (a producer of year books and class rings), 2001 to 2006, and Fortis Financial Group, 1997 to 2001 | 50 | None | |||||
19
Interested Trustee(4)
| Name, Address, and Birth Year | Positions Held with Complex | Term of Office(2)/Length of Time Served | Principal Occupation(s) During Past 5 Years | Number of for the AIM | Other Directorships the AIM Complex 5 Years | |||||
| Brian Muench (1970) 5701 Golden Hills Drive Minneapolis, MN 55416 | Trustee | Since 6/11 | President, Allianz Investment Management LLC, 2010 to present; Vice President, Allianz Life, 2011 to present | 50 | None | |||||
| (1) | Each of the Independent Trustees is a member of the Audit Committee. |
| (2) | Indefinite. |
| (3) | Prior to January 1, 2022, Mr. Gee served as a consultant to the Independent Trustees since February 2020, during which he attended meetings of the Board and its standing committees, including the audit committee, solely in his capacity as a consultant, and was not entitled to vote. |
| (4) | Is an “interested person,” as defined by the 1940 Act, due to employment by Allianz Life and the Manager. |
Officers
| Name, Address, and Birth Year | Positions Held with AIM Complex | Term of Office(1)/ Length | Principal Occupation(s) During Past 5 Years | |||
Brian Muench (1970) 5701 Golden Hills Drive Minneapolis, MN 55416 | President | Since 11/10 | President, Allianz Investment Management LLC, November 2010 to present; Vice President, Allianz Life, 2011 to present. | |||
| Erik Nelson (1972) 5701 Golden Hills Drive Minneapolis, MN 55416 | Secretary | Since 12/20 | Chief Legal Officer, Allianz Investment Management LLC; Associate General Counsel, Senior Counsel, Allianz Life, 2008 to present. | |||
| Bashir C. Asad (1963) Citi Fund Services Ohio, Inc. 4400 Easton Commons, Suite 200 Columbus, OH 43219 | Treasurer, Principal Accounting Officer and Principal Financial Officer | Since 06/16 | Senior Vice President, Citi Fund Services Ohio, Inc., 2011 to present. | |||
| Chris R. Pheiffer (1968) 5701 Golden Hills Drive Minneapolis, MN 55416 | Chief Compliance Officer(2) and Anti-Money Laundering Compliance Officer | Since 02/14 | Chief Compliance Officer of the Trust and the VIP Trust, 2014 to present, and the ETF Trust, 2020 to present. | |||
| Michael Tanski (1970) 5701 Golden Hills Drive Minneapolis, MN 55416 | Vice President | Since 04/09 | Assistant Vice President, Allianz Investment Management LLC, 2013 to present. | |||
| (1) | Indefinite. |
| (2) | The Manager and the Trust are parties to a Compliance Services Agreement under which the Manager provides an employee of the Manager or one of its affiliates to act as the Trust’s Chief Compliance Officer. |
The Fund’s Statement of Additional Information (“SAI”) contains additional information about the Trust’s Trustees and Officers. The SAI is available without charge, upon request, by calling toll-free 800-624-0197 or at https://www.allianzlife.com.
20

| The Allianz VIP Fund of Funds are distributed by Allianz Life Financial Services, LLC. | ||
| These Funds are not FDIC Insured. | ANNRPT1222 02/23 |
AZL® MVP DFA Multi-Strategy Fund
Annual Report
December 31, 2022

This report is submitted for the general information of the shareholder of the Fund. The report is not authorized for distribution to prospective investors in the Fund unless preceded or accompanied by an effective prospectus, which contains details concerning the sales charges and other pertinent information.
Allianz Investment Management LLC serves as the Manager for the AZL® MVP DFA Multi-Strategy Fund.
What factors affected the Fund’s performance during the year ended December 31, 2022?*
For the year ended December 31, 2022, the AZL MVP DFA Multi-Strategy Fund (the “Fund”) returned (11.76)%. That compared to (18.11)%, (13.01)% and (15.91)% total return for its benchmarks, the S&P 500 Index, the Bloomberg U.S. Aggregate Bond Index, and the Moderate Composite Index, respectively.1
The Fund is a fund of funds that pursues broad diversification across three equity sub-portfolios and one fixed income sub-portfolio. The four underlying sub-portfolios are managed by Dimensional Fund Advisors. Generally, the Fund allocates 50% to 70% of its assets to the underlying equity funds and between 30% and 50% to the underlying fixed-income fund.
The Fund also employs the MVP (Managed Volatility Portfolio) risk management process, which is intended to adjust the risk of the portfolio based on quantitative indicators of market risk, such as the current level of fund and market volatility.
Quantitative investing involves risk that the values of securities selected in the quantitative analysis can react differently than the market or securities selected using fundamental analysis.
Domestic equities began the year at near all-time highs, but began to decline early in 2022 due to a combination of rising inflation and geopolitical uncertainties. The Federal Reserve (the Fed) shifted to a more hawkish policy approach in an attempt to bring inflation under control, as did many global central banks. The Fed increased the federal funds rate multiple times throughout the year for a combined total of 425 basis points. Russia’s invasion of Ukraine also weighed on global markets, although European countries were particularly hard hit due to their geographic proximity to the conflict and reliance on Russian commodities such as energy and wheat.
Despite strong labor rates throughout developed markets, high inflation and an anticipated economic slowdown had a negative effect on investor sentiment for the year under review. The S&P 500 declined as company valuations struggled under the higher interest rate environment. Investors grew risk averse as fears of an economic recession loomed, selling off equity positions to avoid the volatility in equity markets. By the end of the period under review, U.S. equities had experienced their worst year since the Great Financial Crisis of 2008, and international equities performed only slightly better.
The Fed’s actions made short-term financing more expensive, and the U.S. Treasury yield curve ultimately inverted with 2-year Treasuries yielding more than 10-year Treasuries by 0.55% at the end of 2022. The monetary tightening generated headwinds for domestic fixed income markets as investors demanded higher yields to account for rising rates. Widening credit spreads further weighed on prices on lower-quality bonds as investors demanded to be compensated for rising credit risks. Nearly all fixed income sectors finished with negative performance.
The Fund, which invests in both U.S. and international markets, outperformed its composite benchmark in 2022. The Fund’s exposure to developed markets non-U.S. stocks contributed to its relative performance, as international stocks generally outperformed U.S. equities for the period. However, the Fund’s value bias detracted from its international equity holdings in the broader international equity space, which offset some of that outperformance. Within U.S. equities, a value preference among smaller market capitalization stocks added to relative performance.
The Fund’s fixed income holdings outperformed its fixed income benchmark. This outperformance was due largely to the Fund’s underweight to duration, which contributed to performance in the rising interest rate environment.
The MVP risk management process utilizes derivatives in an effort to control portfolio volatility in unstable market conditions. Market volatility was relatively high during 2022, therefore the MVP process was engaged and reduced the Fund’s equity exposure at multiple points during the year. The MVP process did slightly detract from the Fund’s performance during 2022.
Past performance does not guarantee future results.
| * | The Fund’s portfolio composition is subject to change. There is no guarantee that any sectors mentioned will continue to perform as described or that securities in such sectors will be held by the Fund in the future. The information contained in this commentary is for informational purposes only and should not be construed as a recommendation to purchase or sell securities in the sector mentioned. The Fund’s holdings and weightings are as of December 31, 2022. |
| 1 | For a complete description of the Fund’s performance benchmarks please refer to page 2 of this report. |
1
AZL® MVP DFA Multi-Strategy Fund Review (Unaudited) |
Fund Objective
The Fund’s investment objective is to seek long-term capital appreciation. This objective may be changed by the Trustees of the Fund without shareholder approval. The Fund seeks to achieve its objective by investing in a combination of DFA Underlying Funds that represent different classes in the Fund’s asset allocation.
Investment Concerns
The Fund invests in underlying funds, so its investment performance is directly related to the performance of those underlying funds. Before investing, investors should assess the risks associated with and types of investments made by each of the underlying funds in which the Fund invests.
Quantitative investing involves risk that the values of securities selected in the quantitative analysis can react differently than the market or securities selected using fundamental analysis.
International investing may involve risk of capital loss from unfavorable fluctuations in currency values, from differences in generally accepted accounting principles or from economic or political instability in other nations.
Value-based investments are subject to the risk that the broad market may not recognize their intrinsic value.
Small- to mid-capitalization companies typically have a higher risk of failure and historically have experienced a greater degree of volatility.
Debt securities held by an underlying fund may decline in value due to rising interest rates.
Investing in derivative instruments involves risks that may be different from or greater than the risk associated with investing directly in securities or other traditional instruments.
For a complete description of these and other risks associated with investing in the Fund, please refer to the Fund’s prospectus.
Growth of $10,000 Investment
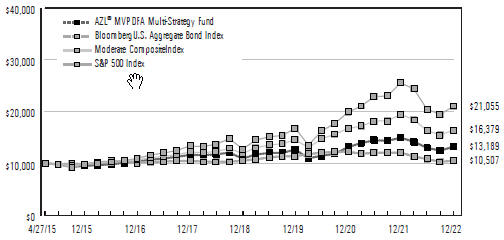
The chart above represents a comparison of a hypothetical investment in the Fund versus a similar investment in the Fund’s benchmarks and represents the reinvestment of dividends and capital gains in the Fund.
| Average Annual Total Returns as of December 31, 2022 | ||||||||||||||||||||
| 1 Year | 3 Years | 5 Years | Since Inception (4/27/2015) | |||||||||||||||||
AZL® MVP DFA Multi-Strategy Fund | (11.76 | )% | 1.37 | % | 2.50 | % | 3.67 | % | ||||||||||||
Bloomberg U.S. Aggregate Bond Index | (13.01 | )% | (2.71 | )% | 0.02 | % | 0.65 | % | ||||||||||||
Moderate Composite Index | (15.91 | )% | 4.00 | % | 6.07 | % | 6.64 | % | ||||||||||||
S&P 500 Index | (18.11 | )% | 7.66 | % | 9.42 | % | 10.18 | % | ||||||||||||
Past performance does not guarantee future results. The performance data quoted represents past performance and current returns may be lower or higher. The investment return and principal value will fluctuate so that an investor’s shares, when redeemed, may be worth more or less than the original cost. To obtain performance information current to the most recent month end, please visit www.Allianzlife.com.
| Expense Ratio | Gross | ||||
AZL® MVP DFA Multi-Strategy Fund | 1.13 | % | |||
The above expense ratio is based on the current Fund prospectus dated April 29, 2022. The Manager and the Fund have entered into a written agreement reducing the management fee to 0.10% through at least April 30, 2024. The Manager and the Fund have entered into a written contract limiting operating expenses, excluding certain expenses (such as interest expense and acquired fund fees and expenses), to 0.15% through April 30, 2024. Additional information pertaining to the December 31, 2022 expense ratio can be found in the Financial Highlights.
Acquired fund fees and expenses are incurred indirectly by the Fund through the valuation of the Fund’s investments in the permitted Underlying Funds. Accordingly, acquired fund fees and expenses affect the Fund’s total returns. Because these fees and expenses are not included in the Fund’s financial highlights, the Fund’s total annual fund operating expenses, as shown in the current prospectus, do not correlate to the ratios of expenses to average net assets shown in the Financial Highlights. Without acquired fund fees and expenses the Fund’s gross expense ratio would be 0.29%.
The total return of the Fund does not reflect the effect of any insurance charges, the annual maintenance fee or the deduction of taxes that a shareholder would pay on Fund distributions or the redemption of Fund shares. Such charges, fees and tax payments would reduce the performance quoted.
The Fund’s performance is measured against the Standard & Poor’s 500 Index (“S&P 500”), the Bloomberg U.S. Aggregate Bond Index and the Moderate Composite Index (“Composite”). The S&P 500 is representative of 500 selected common stocks, most of which are listed on the New York Stock Exchange, and is a measure of the U.S. Stock market as a whole. The Bloomberg U.S. Aggregate Bond Index is a market value-weighted performance benchmark for investment-grade fixed-rate debt issues, including government, corporate, asset-backed, and mortgage-backed securities, with maturities of at least one year. The Composite is a blended index comprised of (60%) S&P 500 and (40%) Bloomberg U.S. Aggregate Bond Index. These indexes are unmanaged and do not reflect the deduction of fees associated with a mutual fund, such as investment management and fund accounting fees. The Fund’s performance reflects the deduction of fees for services provided to the Fund. Investors cannot invest directly in an index.
2
AZL MVP DFA Multi-Strategy Fund
(Unaudited)
As a shareholder of the AZL MVP DFA Multi-Strategy Fund (the “Fund”), you incur ongoing costs, including management fees, distribution fees, and other Fund expenses. These examples are intended to help you understand your ongoing costs (in dollars) of investing in the Fund and to compare these costs with the ongoing costs of investing in other mutual funds. Please note that the expenses shown in each table do not reflect expenses that apply to the subaccount or the insurance contract. If the expenses that apply to the subaccount or the insurance contract were included, your costs would have been higher.
These examples are based on an investment of $1,000 invested at the beginning of the period and held for the periods presented below.
The Actual Expense table below provides information about actual account values and actual expenses. You may use the information below, together with the amount you invested, to estimate the expenses that you paid over the period. Simply divide your account value by $1,000 (for example, an $8,600 account value divided by $1,000 = 8.6), then multiply the result by the number in the table under the heading entitled “Expenses Paid During Period” to estimate the expenses you paid on your account during this period.
| Beginning Account Value 7/1/22 | Ending Account Value 12/31/22 | Expenses Paid During Period 7/1/22 - 12/31/22* | Annualized Expense Ratio During Period 7/1/22 - 12/31/22 | |||||||||||||||||
AZL MVP DFA Multi-Strategy Fund | $ | 1,000.00 | $ | 1,014.50 | $ | 0.76 | 0.15 | % | ||||||||||||
The Hypothetical Expense table below provides information about hypothetical account values and hypothetical expenses based on the Fund’s actual expense ratio and an assumed rate of return of 5% per year before expenses, which is not the Fund’s actual return. The hypothetical account values and expenses may not be used to estimate the actual ending account balance or expenses you paid for the period. You may use this information to compare this 5% hypothetical example with the 5% hypothetical examples that appear in the shareholder reports of other funds.
| Beginning Account Value 7/1/22 | Ending Account Value 12/31/22 | Expenses Paid During Period 7/1/22 - 12/31/22* | Annualized Expense Ratio During Period 7/1/22 - 12/31/22 | |||||||||||||||||
AZL MVP DFA Multi-Strategy Fund | $ | 1,000.00 | $ | 1,024.45 | $ | 0.77 | 0.15 | % | ||||||||||||
| * | Expenses are equal to the average account value multiplied by the Fund’s annualized expense ratio multiplied by 184/365 (the number of days in the most recent fiscal half-year divided by the number of days in the fiscal year). |
Portfolio Composition
(Unaudited)
| Investments | Percent of Net Assets | ||||
Domestic Equity Funds | 45.0% | ||||
Fixed Income Fund | 38.5 | ||||
International Equity Fund | 12.3 | ||||
|
| ||||
Total Investment Securities | 95.8 | ||||
Net other assets (liabilities) | 4.2 | ||||
|
| ||||
Net Assets | 100.0% | ||||
|
| ||||
3
AZL MVP DFA Multi-Strategy Fund
Schedule of Portfolio Investments
December 31, 2022
| Shares | Value | |||||||
| Affiliated Investment Companies (95.8%): | ||||||||
| Domestic Equity Funds (45.0%): | ||||||||
| 2,231,529 | AZL DFA U.S. Core Equity Fund | $ | 27,380,862 | |||||
| 838,902 | AZL DFA U.S. Small Cap Fund | 7,927,626 | ||||||
|
| |||||||
| 35,308,488 | ||||||||
|
| |||||||
| Fixed Income Fund (38.5%): | ||||||||
| 3,562,509 | AZL DFA Five-Year Global Fixed Income Fund | 30,138,829 | ||||||
|
| |||||||
| (a) | See Federal Tax Information listed in the Notes to the Financial Statements. |
Percentages indicated are based on net assets as of December 31, 2022
| Shares | Value | |||||||
| Affiliated Investment Companies, continued | ||||||||
| International Equity Fund (12.3%): | ||||||||
| 1,031,321 | AZL DFA International Core Equity Fund | $ | 9,663,475 | |||||
|
| |||||||
Total Affiliated Investment Companies (Cost $75,606,498) | 75,110,792 | |||||||
|
| |||||||
Total Investment Securities | ||||||||
(Cost $75,606,498) — 95.8%(a) | 75,110,792 | |||||||
Net other assets (liabilities) — 4.2% | 3,311,806 | |||||||
|
| |||||||
Net Assets — 100.0% | $ | 78,422,598 | ||||||
|
| |||||||
Futures Contracts
At December 31, 2022, the Fund’s open futures contracts were as follows:
Long Futures
| Description | Expiration Date | Number of Contracts | Notional Amount | Value and Unrealized Appreciation/ (Depreciation) | ||||||||||||
S&P 500 Index E-Mini March Futures (U.S. Dollar) | 3/17/23 | 10 | $ | 1,930,500 | $ | 44 | ||||||||||
U.S. Treasury 10-year Note March Futures (U.S. Dollar) | 3/22/23 | 11 | 1,235,266 | (13,143 | ) | |||||||||||
|
| |||||||||||||||
| $ | (13,099 | ) | ||||||||||||||
|
| |||||||||||||||
See accompanying notes to the financial statements.
4
AZL MVP DFA Multi-Strategy Fund
Statement of Assets and Liabilities
December 31, 2022
Assets: | |||||
Investments in affiliates, at cost | $ | 75,606,498 | |||
|
| ||||
Investments in affiliates, at value | $ | 75,110,792 | |||
Deposit at broker for futures contracts collateral | 3,353,800 | ||||
Interest and dividends receivable | 9,574 | ||||
Receivable for affiliated investments sold | 10,451 | ||||
Receivable from Manager | 1,803 | ||||
Prepaid expenses | 722 | ||||
|
| ||||
Total Assets | 78,487,142 | ||||
|
| ||||
Liabilities: | |||||
Cash overdraft | 10,451 | ||||
Payable for capital shares redeemed | 44,531 | ||||
Administration fees payable | 6,493 | ||||
Custodian fees payable | 236 | ||||
Administrative and compliance services fees payable | 163 | ||||
Transfer agent fees payable | 561 | ||||
Trustee fees payable | 408 | ||||
Other accrued liabilities | 1,701 | ||||
|
| ||||
Total Liabilities | 64,544 | ||||
|
| ||||
Net Assets | $ | 78,422,598 | |||
|
| ||||
Net Assets Consist of: | |||||
Paid in capital | $ | 81,682,574 | |||
Total distributable earnings | (3,259,976 | ) | |||
|
| ||||
Net Assets | $ | 78,422,598 | |||
|
| ||||
Shares of beneficial interest (unlimited number of shares authorized, no par value) | 7,985,040 | ||||
Net Asset Value (offering and redemption price per share) | $ | 9.82 | |||
|
|
For the Year Ended December 31, 2022
Investment Income: | |||||
Dividends from affiliates | $ | 1,869,643 | |||
Interest | 59,502 | ||||
Dividends from non-affiliates | 58 | ||||
|
| ||||
Total Investment Income | 1,929,203 | ||||
|
| ||||
Expenses: | |||||
Management fees | 171,705 | ||||
Administration fees | 64,790 | ||||
Custodian fees | 1,695 | ||||
Administrative and compliance services fees | 1,223 | ||||
Transfer agent fees | 5,575 | ||||
Trustee fees | 4,873 | ||||
Professional fees | 4,152 | ||||
Shareholder reports | 2,560 | ||||
Other expenses | 1,342 | ||||
|
| ||||
Total expenses before reductions | 257,915 | ||||
Less Management fees contractually waived | (85,851 | ) | |||
Less expense contractually waived/reimbursed by the Manager | (43,284 | ) | |||
|
| ||||
Net expenses | 128,780 | ||||
|
| ||||
Net Investment Income/(Loss) | 1,800,423 | ||||
|
| ||||
Net realized and Change in net unrealized gains/losses on investments: | |||||
Net realized gains/(losses) on securities | 5 | ||||
Net realized gains/(losses) on affiliated underlying funds | (731,685 | ) | |||
Net realized gains distributions from affiliated underlying funds | 6,605,087 | ||||
Net realized gains/(losses) on futures contracts | (844,274 | ) | |||
Change in net unrealized appreciation/depreciation on affiliated underlying funds | (18,287,010 | ) | |||
Change in net unrealized appreciation/depreciation on futures contracts | (72,430 | ) | |||
|
| ||||
Net realized and Change in net unrealized gains/losses on investments | (13,330,307 | ) | |||
|
| ||||
Change in Net Assets Resulting From Operations | $ | (11,529,884 | ) | ||
|
|
See accompanying notes to the financial statements.
5
AZL MVP DFA Multi-Strategy Fund
Statements of Changes in Net Assets
For the Year Ended | For the Year Ended | |||||||||
Change In Net Assets: | ||||||||||
Operations: | ||||||||||
Net investment income/(loss) | $ | 1,800,423 | $ | 404,032 | ||||||
Net realized gains/(losses) on investments | 5,029,133 | 7,098,818 | ||||||||
Change in unrealized appreciation/depreciation on investments | (18,359,440 | ) | 4,745,683 | |||||||
|
|
|
| |||||||
Change in net assets resulting from operations | (11,529,884 | ) | 12,248,533 | |||||||
|
|
|
| |||||||
Distributions to Shareholders: | ||||||||||
Distributions | (7,022,119 | ) | (7,170,758 | ) | ||||||
|
|
|
| |||||||
Change in net assets resulting from distributions to shareholders | (7,022,119 | ) | (7,170,758 | ) | ||||||
|
|
|
| |||||||
Capital Transactions: | ||||||||||
Proceeds from shares issued | 1,880,038 | 11,200,599 | ||||||||
Proceeds from dividends reinvested | 7,022,118 | 7,170,758 | ||||||||
Value of shares redeemed | (11,906,090 | ) | (14,138,661 | ) | ||||||
|
|
|
| |||||||
Change in net assets resulting from capital transactions | (3,003,934 | ) | 4,232,696 | |||||||
|
|
|
| |||||||
Change in net assets | (21,555,937 | ) | 9,310,471 | |||||||
Net Assets: | ||||||||||
Beginning of period | 99,978,535 | 90,668,064 | ||||||||
|
|
|
| |||||||
End of period | $ | 78,422,598 | $ | 99,978,535 | ||||||
|
|
|
| |||||||
Share Transactions: | ||||||||||
Shares issued | 168,171 | 894,545 | ||||||||
Dividends reinvested | 734,531 | 606,663 | ||||||||
Shares redeemed | (1,108,743 | ) | (1,137,291 | ) | ||||||
|
|
|
| |||||||
Change in shares | (206,041 | ) | 363,917 | |||||||
|
|
|
| |||||||
See accompanying notes to the financial statements.
6
AZL MVP DFA Multi-Strategy Fund
(Selected data for a share of beneficial interest outstanding throughout the periods indicated. Does not reflect fees or expenses associated with the separate accounts that invest in the Fund or in any variable annuity contracts or variable life insurance policy for which the Fund serves as an investment vehicle.)
| Year Ended December 31, 2022 | Year Ended December 31, 2021 | Year Ended December 31, 2020 | Year Ended December 31, 2019 | Year Ended December 31, 2018 | |||||||||||||||||||||
Net Asset Value, Beginning of Period | $12.21 | $11.58 | $12.03 | $10.65 | $11.60 | ||||||||||||||||||||
|
|
|
|
|
|
|
|
|
| ||||||||||||||||
Investment Activities: | |||||||||||||||||||||||||
Net Investment Income/(Loss) | 0.23 | (a) | 0.05 | (a) | 0.16 | (a) | 0.31 | (a) | 0.08 | ||||||||||||||||
Net Realized and Unrealized Gains/(Losses) on Investments | (1.69 | ) | 1.51 | 0.22 | 1.36 | (0.79 | ) | ||||||||||||||||||
|
|
|
|
|
|
|
|
|
| ||||||||||||||||
Total from Investment Activities | (1.46 | ) | 1.56 | 0.38 | 1.67 | (0.71 | ) | ||||||||||||||||||
|
|
|
|
|
|
|
|
|
| ||||||||||||||||
Distributions to Shareholders From: | |||||||||||||||||||||||||
Net Investment Income | (0.11 | ) | (0.17 | ) | (0.34 | ) | (0.11 | ) | (0.08 | ) | |||||||||||||||
Net Realized Gains | (0.82 | ) | (0.76 | ) | (0.49 | ) | (0.18 | ) | (0.16 | ) | |||||||||||||||
|
|
|
|
|
|
|
|
|
| ||||||||||||||||
Total Dividends | (0.93 | ) | (0.93 | ) | (0.83 | ) | (0.29 | ) | (0.24 | ) | |||||||||||||||
|
|
|
|
|
|
|
|
|
| ||||||||||||||||
Net Asset Value, End of Period | $9.82 | $12.21 | $11.58 | $12.03 | $10.65 | ||||||||||||||||||||
|
|
|
|
|
|
|
|
|
| ||||||||||||||||
Total Return (b) | (11.76 | )% | 13.74 | % | 3.77 | % | 15.81 | % | (6.22 | )% | |||||||||||||||
Ratios to Average Net Assets/Supplemental Data: | |||||||||||||||||||||||||
Net Assets, End of Period (000’s) | $ | 78,423 | $ | 99,979 | $ | 90,668 | $ | 95,959 | $ | 86,601 | |||||||||||||||
Net Investment Income/(Loss) | 2.10 | % | 0.42 | % | 1.44 | % | 2.71 | % | 0.91 | % | |||||||||||||||
Expenses Before Reductions*(c) | 0.30 | % | 0.29 | % | 0.30 | % | 0.29 | % | 0.29 | % | |||||||||||||||
Expenses Net of Reductions* | 0.15 | % | 0.15 | % | 0.15 | % | 0.15 | % | 0.15 | % | |||||||||||||||
Portfolio Turnover Rate | 11 | % | 13 | % | 18 | % | 10 | % | 16 | % | |||||||||||||||
| * | The expense ratios exclude the impact of fees/expenses paid by each underlying fund. |
| (a) | Calculated using the average shares method. |
| (b) | The returns include reinvested dividends and fund level expenses, but exclude insurance contract charges. If these charges were included, the returns would have been lower. |
| (c) | Excludes fee reductions. If such fee reductions had not occurred, the ratios would have been as indicated. |
See accompanying notes to the financial statements.
7
AZL MVP DFA Multi-Strategy Fund
Notes to the Financial Statements
December 31, 2022
1. Organization
The Allianz Variable Insurance Products Fund of Funds Trust (the “Trust”) was organized as a Delaware statutory trust on June 16, 2004. The Trust is an open-end management investment company registered under the Investment Company Act of 1940, as amended, (the “1940 Act”) and thus is determined to be an investment company, and follows the investment company accounting and reporting guidance under Financial Accounting Standards Board (“FASB”) Accounting Standards Codification (“ASC”) Topic 946 “Financial Services—Investment Companies”. The Trust consists of 12 separate investment portfolios (collectively, the “Funds”), of which one is included in this report, the AZL MVP DFA Multi- Strategy Fund (the “Fund”), and 11 are presented in separate reports. The Fund is a diversified series of the Trust.
The Fund is a “fund of funds”, which means that the Fund invests primarily in other mutual funds (the “Underlying Funds”). Underlying Funds invest in stocks, bonds, and other securities and reflect varying amounts of potential investment risk and reward. The Underlying Funds record their investments at fair value. Periodically, the Fund will adjust its asset allocation as it seeks to achieve its investment objective.
The Trust is authorized to issue an unlimited number of shares of the Fund without par value. Shares of the Fund are available through the variable annuity contracts offered through the separate accounts of participating insurance companies. Currently, the Fund only offers its shares to separate accounts of Allianz Life Insurance Company of North America and Allianz Life Insurance Company of New York, affiliates of the Trust and the Manager, as defined below.
Under the Trust’s organizational documents, its officers and trustees are indemnified against certain liabilities arising out of the performance of their duties to the Fund. In addition, in the normal course of business, the Fund may enter into contracts with its vendors and others that provide for general indemnifications. The Fund’s maximum exposure under these arrangements is unknown, as this would involve future claims that may be made against the Fund. However, based on experience, the Fund expects that risk of loss to be remote.
On December 13, 2022, the Board unanimously approved a reorganization whereby the Fund will acquire all of the assets and liabilities of the AZL MVP Fusion Moderate Fund and costs related to the reorganization will be paid by the Manager.
2. Significant Accounting Policies
The following is a summary of significant accounting policies followed by the Fund in the preparation of its financial statements. The policies conform with U.S. generally accepted accounting principles (“U.S. GAAP”). The preparation of financial statements requires management to make certain estimates and assumptions that affect the reported amounts of assets and liabilities and disclosure of contingent assets and liabilities at the date of the financial statements and the reported amounts of increases and decreases in net assets from operations during the reporting period. Actual results could differ from those estimates.
Security Valuation
The Fund records its investments at fair value. Fair value is defined as the price that would be received to sell an asset or paid to transfer a liability in an orderly transaction between willing market participants at the measurement date. The valuation techniques used to determine fair value are further described in Note 4 below.
Investment Transactions and Investment Income
Investment transactions are accounted for on trade date. Net realized gains and losses on investments sold and on foreign currency transactions are recorded on the basis of identified cost. Interest income is recorded on the accrual basis and includes, where applicable, the amortization of premiums or accretion of discounts. Dividend income is recorded on the ex-dividend date except in the case of foreign securities, in which case dividends are recorded as soon as such information becomes available.
Distributions to Shareholders
Distributions to shareholders are recorded on the ex-dividend date. The Fund distributes its dividends from net investment income and net realized capital gains, if any, on an annual basis. The amount of distributions from net investment income and from net realized gains is determined in accordance with federal income tax regulations, which may differ from U.S. GAAP. These “book/tax” differences are either temporary or permanent in nature. To the extent these differences are permanent in nature (e.g., return of capital, net operating loss, reclassification of certain market discounts, gain/loss, paydowns, and distributions), such amounts are reclassified within the composition of net assets based on their federal tax-basis treatment; temporary differences (e.g., wash sales and differing treatment on certain investments) do not require reclassification. Distributions to shareholders that exceed net investment income and net realized gains for tax purposes are reported as distributions of capital.
Expense Allocation
Expenses directly attributable to the Fund are charged directly to the Fund, while expenses attributable to more than one Fund are allocated among the respective Funds based upon relative net assets or some other reasonable method. Expenses which are attributable to more than one Trust are allocated across the Allianz Variable Insurance Products Trust, Allianz Variable Insurance Products Fund of Funds Trust and AIM ETF Products Trust based upon relative net assets or another reasonable basis. Allianz Investment Management LLC (the “Manager”), serves as the investment manager for the Trust, Allianz Variable Insurance Products Trust and AIM ETF Products Trust.
This report does not reflect fees or expenses associated with the separate accounts that invest in the Fund or in any variable annuity contracts or variable life insurance policy for which the Fund serves as an investment vehicle.
Affiliated Securities Transactions
Pursuant to Rule 17a-7 under the 1940 Act, the Fund may engage in securities transactions with affiliated investment companies and advisory accounts managed by the Manager. Any such purchase or sale transaction must be effected without a brokerage commission or other remuneration, except for customary transfer fees. The transaction must be effected at the current market price, which is either the security’s last sale price on an exchange or, if there are no transactions in the security that day, at the average of the highest bid and lowest asked price. During the year ended December 31, 2022, the Fund did not engage in any Rule 17a-7 transactions.
8
AZL MVP DFA Multi-Strategy Fund
Notes to the Financial Statements
December 31, 2022
Derivative Instruments
All open derivative positions at period end are reflected on the Fund’s Schedule of Portfolio Investments. The following is a description of the derivative instruments utilized by the Fund, including the primary underlying risk exposures related to each instrument type. The Fund’s allocation to the MVP (Managed Volatility Portfolio) risk management process may include (a) derivatives such as index futures, other futures contracts, options, and other similar securities and (b) cash, money market equivalents, short-term debt instruments, money market funds, and short-term debt funds to satisfy all applicable margin requirements and to provide additional portfolio liquidity to satisfy large redemptions and any margin calls. Due to the leverage provided by derivatives, the notional value of the Fund’s derivative positions could exceed 20% of the Fund’s value. The Fund may also use futures to gain equity exposure and may hold cash as a buffer in the event of market shocks.
Futures Contracts
During the year ended December 31, 2022, the Fund invested in futures contracts to reduce volatility and limit the need to decrease or increase allocations to underlying funds. Futures contracts are valued based upon their quoted daily settlement prices. Upon entering into a futures contract, the Fund is required to segregate liquid assets in accordance with the initial margin requirements of the broker or exchange. Futures contracts are marked to market daily and a payable or receivable for the change in value (“variation margin”), if any, is recorded by the Fund. Gains or losses are recognized but not considered realized until the contracts expire or are closed. Futures contracts involve, to varying degrees, elements of market risk (generally equity price risk related to stock futures, interest rate risk related to bond futures, and foreign currency risk related to currency futures) and exposure to loss in excess of the variation margin disclosed in the Statement of Assets and Liabilities. The primary risks associated with the use of futures contracts are the imperfect correlation between the change in value of the underlying securities and the prices of futures contracts, the possibility of an illiquid market, and the inability of the counterparty to meet the terms of the contract. For the year ended December 31, 2022, the monthly average notional amount for long contracts was $2.1 million, and the monthly average notional amount for short contracts was $4.1 million. Realized gains and losses are reported as “Net realized gains/(losses) on futures contracts” on the Statement of Operations.
Summary of Derivative Instruments
The following is a summary of the values of derivative instruments on the Fund’s Statement of Assets and Liabilities, categorized by risk exposure, as of December 31, 2022:
Asset Derivatives | Liability Derivatives | |||||||||||
| Primary Risk Exposure | Statement of Assets and Liabilities Location | Total Value | Statement of Assets and Liabilities Location | Total Value | ||||||||
Equity Risk | ||||||||||||
| Futures Contracts | Receivable for variation margin on futures contracts* | $44 | Payable for variation margin on futures contracts* | $— | ||||||||
Interest Rate Risk | ||||||||||||
| Futures Contracts | Receivable for variation margin on futures contracts* | — | Payable for variation margin on futures contracts* | $13,143 | ||||||||
| * | For futures contracts, the amounts represent the cumulative appreciation/depreciation of these futures contracts as reported in the Schedule of Portfolio Investments. Only the current day’s variation margin is reported within the Statement of Assets and Liabilities as Variation margin on futures contracts. |
The following is a summary of the effect of derivative instruments on the Statement of Operations, categorized by risk exposure, for the year ended December 31, 2022:
| Primary Risk Exposure | Location of Gains/(Losses) on Derivatives Recognized | Realized Gains/(Losses) on Derivatives Recognized | Change in Net Unrealized Appreciation/Depreciation on Derivatives Recognized | |||||||||
Equity Risk | ||||||||||||
| Futures Contracts | Net realized gains/(losses) on futures contracts/ Change in net unrealized appreciation/ depreciation on futures contracts | $ | (633,202 | ) | $ | (39,840 | ) | |||||
Interest Rate Risk | ||||||||||||
| Futures Contracts | Net realized gains/(losses) on futures contracts/ Change in net unrealized appreciation/ depreciation on futures contracts | (211,072 | ) | (32,590 | ) | |||||||
3. Fees and Transactions with Affiliates and Other Parties
The Manager provides investment advisory and management services for the Fund. The Manager has contractually agreed to waive fees and reimburse the Fund to limit the annual expenses, excluding interest expense (e.g., cash overdraft fees), taxes, brokerage commissions, acquired fund fees and expenses, other expenditures that are capitalized in accordance with U.S. GAAP and other extraordinary expenses not incurred in the ordinary course of the Fund’s business, based on the daily net assets of the Fund, through April 30, 2024. Expenses incurred for investment advisory and management services are reflected on the Statement of Operations as “Management fees.”
For the year ended December 31, 2022, the annual rate due to the Manager and the annual expense limit were as follows:
Annual Rate*
| Annual Expense Limit
| |||||||||
AZL MVP DFA Multi-Strategy Fund | 0.20 | % | 0.15 | % | ||||||
| * | The Manager waived, prior to any application of expense limit, the management fee to 0.10% on all assets in order to maintain a more competitive expense ratio. The Manager reserves the right to increase the management fee to the amount shown in the table above (i.e., discontinue the waiver) at any time after April 30, 2024. |
Any amounts contractually waived or reimbursed by the Manager with respect to the annual expense limit in a particular fiscal year will be subject to repayment by the Fund to the Manager to the extent that from time to time through the next three fiscal years the repayment will not cause the Fund’s expenses to exceed the lesser of the stated limit at the time of the waiver or the current stated limit. Any amounts recouped by the Manager during the period are reflected on the Statement of Operations as “Recoupment of prior expenses reimbursed by the Manager.”
9
AZL MVP DFA Multi-Strategy Fund
Notes to the Financial Statements
December 31, 2022
At December 31, 2022, the contractual reimbursements subject to repayment by the Fund in subsequent years were as follows:
| Expires 12/31/2023 | Expires 12/31/2024 | Expires 12/31/2025 | Total | |||||||||||||||||
AZL MVP DFA Multi-Strategy Fund | $ | 42,695 | $ | 34,818 | $ | 43,284 | $ | 120,797 | ||||||||||||
Management fees, which the Manager waived in order to maintain more competitive expense ratios, are not subject to repayment in subsequent years. Information on the total amount waived/reimbursed by the Manager or repaid to the Manager by the Fund during the year can be found on the Statement of Operations.
The Manager or an affiliate of the Manager serves as the investment adviser of certain underlying funds in which the Fund invests. At December 31, 2022, these underlying funds are noted as Affiliated Investment Companies in the Fund’s Schedule of Portfolio Investments. Additional information, including financial statements, about these Funds is available at www.allianzlife.com. The Manager or an affiliate of the Manager is paid a separate fee from the underlying funds for such services. A summary of the Fund’s investments in affiliated investment companies for the year ended December 31, 2022 is as follows:
| Value 12/31/21 | Purchases at Cost | Proceeds from Sales | Net Realized Gains (Losses) | Change in Net Unrealized Appreciation (Depreciation) | Value 12/31/22 | Shares as of 12/31/22 | Dividend Income | Net Realized Gains Distributions from Affiliated Underlying Funds | |||||||||||||||||||||||||||||||||||||
AZL DFA Five-Year Global Fixed Income Fund | $ | 37,767,059 | $ | 1,762,391 | $ | (5,543,855 | ) | $ | (696,592 | ) | $ | (3,150,174 | ) | $ | 30,138,829 | 3,562,509 | $ | 1,353,267 | $ | — | |||||||||||||||||||||||||
AZL DFA International Core Equity Fund | 12,108,383 | 1,143,105 | (943,767 | ) | 914 | (2,645,160 | ) | 9,663,475 | 1,031,321 | 247,289 | 831,139 | ||||||||||||||||||||||||||||||||||
AZL DFA U.S. Core Equity Fund | 35,037,922 | 4,314,968 | (2,836,454 | ) | 49,046 | (9,184,620 | ) | 27,380,862 | 2,231,529 | 218,642 | 3,704,336 | ||||||||||||||||||||||||||||||||||
AZL DFA U.S. Small Cap Fund | 10,092,382 | 2,120,057 | (892,704 | ) | (85,053 | ) | (3,307,056 | ) | 7,927,626 | 838,902 | 50,445 | 2,069,612 | |||||||||||||||||||||||||||||||||
|
|
|
|
|
|
|
|
|
|
|
|
|
|
|
|
|
| ||||||||||||||||||||||||||||
| $ | 95,005,746 | $ | 9,340,521 | $ | (10,216,780 | ) | $ | (731,685 | ) | $ | (18,287,010 | ) | $ | 75,110,792 | 7,664,261 | $ | 1,869,643 | $ | 6,605,087 | ||||||||||||||||||||||||||
|
|
|
|
|
|
|
|
|
|
|
|
|
|
|
|
|
| ||||||||||||||||||||||||||||
Pursuant to separate agreements between the Trust and the Manager, the Manager provides a Chief Compliance Officer (“CCO”) and certain compliance oversight and regulatory filing services to the Trust. Under these agreements, the Manager is entitled to an amount equal to a portion of the compensation and certain other expenses related to the individuals performing the CCO and compliance oversight services, as well as $100 per hour for time incurred in connection with the preparation and filing of certain documents with the SEC. The fees are paid to the Manager on a quarterly basis. The total expenses incurred by the Fund for these services are reflected on the Statement of Operations as “Administrative and compliance services fees.”
Citi Fund Services Ohio, Inc. (“Citi” or the “Administrator”), a wholly owned subsidiary of Citigroup, Inc., with which an officer of the Trust is affiliated, serves as the Trust’s administrator and fund accountant, and assists the Trust in all aspects of its administration and operation. The Administrator is entitled to a fee, accrued daily and paid monthly. The Administrator is entitled to an annual fee for each additional class of shares of any Fund, certain annual fees in supporting fair value services, and a Trust-wide annual fee for providing infrastructure and support in implementing the written policies and procedures comprising the Fund’s compliance program. The Administrator is also reimbursed for certain expenses incurred. The total expenses incurred by the Fund for these services are reflected on the Statement of Operations as “Administration fees.”
FIS Investor Services LLC (“FIS”) serves as the Fund’s transfer agent. Under the Transfer Agent Agreement, the Trust pays FIS a fee for its services and reimburses FIS for all of their reasonable out-of-pocket expenses incurred in providing these services.
The Bank of New York Mellon (“BNY Mellon” or the “Custodian”) serves as the Trust’s custodian. For these services as custodian, the Funds pay BNY Mellon a fee based on a percentage of assets held on behalf of the Funds, plus certain out-of-pocket charges.
Allianz Life Financial Services, LLC (“ALFS”), an affiliate of the Manager, serves as distributor of the Fund. ALFS receives an annual Trust-wide annual fee of $7,500, paid by the Manager from its profits and not by the Trust, for recordkeeping and reporting services.
Certain Officers and Trustees of the Trust are affiliated with the Manager or the Administrator. Such Officers (except for the Trust’s CCO as noted above) and Trustees receive no compensation from the Trust for serving in their respective roles.
4. Investment Valuation Summary
The valuation techniques employed by the Fund, as described below, maximize the use of observable inputs and minimize the use of unobservable inputs in determining fair value. The inputs used for valuing the Fund’s investments are summarized in the three broad levels listed below:
| ● | Level 1 - quoted prices in active markets for identical assets |
| ● | Level 2 - other significant observable inputs (including quoted prices for similar securities, interest rates, prepayments speeds, credit risk, etc.) |
| ● | Level 3 - significant unobservable inputs (including the Fund’s own assumptions in determining the fair value of investments) |
Changes in valuation techniques may result in transfers in or out of an assigned level within the disclosure hierarchy. The inputs or methodology used for valuing investments is not necessarily an indication of the risk associated with investing in those investments.
10
AZL MVP DFA Multi-Strategy Fund
Notes to the Financial Statements
December 31, 2022
Investments in other investment companies are valued at their published net asset value (“NAV”). Security prices are determined pursuant to valuation procedures approved by the Trust’s Board of Trustees (the “Board” or “Trustees”) as of the close of the New York Stock Exchange (“NYSE”) (generally 4:00 pm Eastern Time). The investments utilizing Level 1 valuations represent investments in open-end investment companies. Futures contracts are valued at the settlement prices established each day on the primary exchange and are typically categorized as Level 1 in the fair value hierarchy.
The Board has designated the Manager to perform the Fund’s fair value determinations in accordance with valuation procedures approved by the Board. The effect of using fair value pricing is that the Fund’s NAV will be subject to the judgment of the Manager. The Manager’s fair valuation process is subject to the oversight of the Board.
The following is a summary of the valuation inputs used as of December 31, 2022 in valuing the Fund’s investments based upon the three levels defined above:
| Investment Securities: | Level 1 | Level 2 | Level 3 | Total | ||||||||||||||||||||||||||||||||||||
Affiliated Investment Companies | $ | 75,110,792 | $ | — | $ | — | $ | 75,110,792 | ||||||||||||||||||||||||||||||||
|
|
|
|
|
|
|
| |||||||||||||||||||||||||||||||||
Total Investment Securities | 75,110,792 | — | — | 75,110,792 | ||||||||||||||||||||||||||||||||||||
|
|
|
|
|
|
|
| |||||||||||||||||||||||||||||||||
Other Financial Instruments:* | ||||||||||||||||||||||||||||||||||||||||
Futures Contracts | (13,099 | ) | — | — | (13,099 | ) | ||||||||||||||||||||||||||||||||||
|
|
|
|
|
|
|
| |||||||||||||||||||||||||||||||||
Total Investments | $ | 75,097,693 | $ | — | $ | — | $ | 75,097,693 | ||||||||||||||||||||||||||||||||
|
|
|
|
|
|
|
| |||||||||||||||||||||||||||||||||
| * | Other Financial Instruments would include any derivative instruments, such as futures contracts. These investments are generally presented in the financial statements at variation margin. |
5. Security Purchases and Sales
For the year ended December 31, 2022, cost of purchases and proceeds from sales of securities (excluding securities maturing less than one year from acquisition) were as follows:
| Purchases | Sales | |||||||||
AZL MVP DFA Multi-Strategy Fund | $ | 9,340,521 | $ | 10,216,780 | ||||||
6. Investment Risks
The risks below are presented in an order intended to facilitate readability. Their order does not imply that the realization of one risk is more likely to occur more frequently than another risk, nor does it imply that the realization of one risk is likely to have a greater adverse impact than another risk. The Fund may be subject to other risks in addition to these identified risks. This section discusses certain common principal risks encountered by the Fund.
Derivatives Risk: The Fund may invest directly or through affiliated or unaffiliated mutual funds or unregistered investment pools in derivative instruments such as futures, options, and options on futures. A derivative is a financial contract whose value depends on, or is derived from, the value of an underlying asset, reference rate, or risk. Use of derivative instruments involves risks different from, or possibly greater than, the risks associated with investing directly in securities and other traditional investments. Derivatives are subject to a number of other risks, such as liquidity risk, interest rate risk, market risk, credit risk, and selection risk. Derivatives also involve the risk of mispricing or improper valuation and the risk that changes in the value may not correlate perfectly with the underlying asset, rate, or index. Using derivatives may result in losses, possibly in excess of the principal amount invested. Also, suitable derivative transactions may not be available in all circumstances. The other party to a derivatives contract could default.
Foreign Securities Risk: Investing in the securities of non-U.S. issuers involves a number of risks, such as fluctuations in currency values, adverse political, social or economic developments, and differences in social and economic developments or policies. Such risks include future political and economic developments, and the possible imposition of exchange controls or other foreign governmental laws and restrictions. In addition, with respect to certain countries, there is the possibility of expropriation of assets, confiscatory taxation, political or social instability or diplomatic developments which could adversely affect investments in those securities. Certain foreign companies may be subject to sanctions, embargoes, or other governmental actions that may impair or otherwise limit the ability to invest in, receive, hold or sell the securities of such companies.
Fund of Fund Risk: The Fund, as a shareholder of the underlying funds, indirectly bears its proportionate share of any investment management fees and other expenses of the underlying funds. Further due to the fees and expenses paid by the Fund, as well as small variations in the Fund’s actual allocations to the underlying funds and any futures and cash held in the Fund’s portfolio, the performance and income distributions of the Fund will not be the same as the performance and income distributions of the underlying funds. In addition, the Fund maintains indirect exposure to various types of risk which may exist in the underlying Funds, such as foreign securities risk, fixed income securities risk and other risks.
Interest Rate Risk: Debt securities held by an underlying fund may decline in value due to rising interest rates. The price of a bond is also affected by its maturity. Bonds with longer maturities generally have greater sensitivity to changes in interest rates.
Market Risk: The market price of securities owned by the underlying funds may go up or down, sometimes rapidly and unpredictably. Securities may decline in value due to factors affecting securities markets generally or particular industries represented in the securities markets. The value of a security may decline due to general market conditions that are not specifically related to a particular company, such as real or perceived adverse economic conditions, changes in the general outlook for corporate earnings, changes in interest or currency rates, or adverse investor sentiment, as well as natural disasters, and outbreaks of infectious illnesses or other widespread public health issues.
Quantitative Investing Risk: The value of securities selected using quantitative analysis can react differently to issuer, political, market, and economic developments than the market as a whole or securities selected using only fundamental analysis. The factors used in quantitative analysis and the weight placed on those factors may not be predictive of a security’s value. In addition, factors that affect a security’s value can change over time and these changes may not be reflected in the quantitative model. A quantitative model can be adversely affected by errors or imperfections in the factors or the data on which evaluations are based, or by technical issues with construction or implementation of the model, which in any case may result in a failure of the portfolio to perform as expected or a failure to identify securities that will perform well in the future.
11
AZL MVP DFA Multi-Strategy Fund
Notes to the Financial Statements
December 31, 2022
7. Coronavirus (COVID-19) Pandemic
The global outbreak of the COVID-19 strain of the coronavirus has caused adverse effects on many companies, sectors, nations, regions and the markets in general, and may continue for an unpredictable duration. The effects of this pandemic may adversely impact the value and performance of the Fund, its ability to buy and sell fund investments at appropriate valuations, and its ability to achieve its investment objective(s).
8. Federal Tax Information
It is the policy of the Fund to continue to qualify as a regulated investment company by complying with the provisions available to certain investment companies, as defined under Subchapter M of the Internal Revenue Code, and to make distributions of net investment income and net realized gains sufficient to relieve it from all, or substantially all, federal income taxes. Accordingly, no provisions for federal income taxes are required in the financial statements.
Management of the Fund has reviewed tax positions taken in tax years that remain subject to examination by all major tax jurisdictions, including federal (i.e., the last four tax year ends and the interim tax period since then, as applicable). Management believes that there is no tax liability resulting from unrecognized tax benefits related to uncertain tax positions taken.
Cost of securities, including derivatives and short positions as applicable, for federal income tax purposes at December 31, 2022 is $76,781,122. The gross unrealized appreciation/ (depreciation) on a tax basis is as follows:
Unrealized appreciation | $ | 3,000,151 | |||
Unrealized (depreciation) | (4,670,481 | ) | |||
|
| ||||
Net unrealized appreciation/(depreciation) | $ | (1,670,330 | ) | ||
|
|
The tax character of dividends paid to shareholders during the year ended December 31, 2022 was as follows:
| Ordinary Income | Net Long-Term Capital Gains | Total Distributions(a) | |||||||||||||
AZL MVP DFA Multi-Strategy Fund | $ | 3,205,864 | $ | 3,816,255 | $ | 7,022,119 | |||||||||
| (a) | Total distributions paid may differ from the Statements of Changes in Net Assets because dividends are recognized when actually paid for tax purposes. |
The tax character of dividends paid to shareholders during the year ended December 31, 2021 was as follows:
| Ordinary Income | Net Long-Term Capital Gains | Total Distributions(a) | |||||||||||||
AZL MVP DFA Multi-Strategy Fund | $ | 3,153,404 | $ | 4,017,354 | $ | 7,170,758 | |||||||||
| (a) | Total distributions paid may differ from the Statements of Changes in Net Assets because dividends are recognized when actually paid for tax purposes. |
At December 31, 2022, the components of accumulated earnings on a tax basis were as follows:
| Undistributed Ordinary Income | Undistributed Long-Term Capital Gains | Accumulated Capital and Other Losses | Unrealized Appreciation/ Depreciation(a) | Total Accumulated Earnings/(Deficit) | |||||||||||||||||||||
AZL MVP DFA Multi-Strategy Fund | $ | 2,117,573 | $ | 797,743 | $ | — | $ | (1,670,330 | ) | $ | 1,244,986 | ||||||||||||||
| (a) | The differences between book-basis and tax-basis unrealized appreciation/(depreciation) is attributable primarily to tax deferral of losses on wash sales, mark-to-market of futures contracts and straddles. |
9. Ownership and Principal Holders
The beneficial ownership, either directly or indirectly, of more than 25% of the voting securities of a fund creates presumptions of control of the fund, under section 2 (a)(9) of the 1940 Act. As of December 31, 2022, the Fund had an individual shareholder account which is affiliated with the Manager representing ownership in excess of 85% of the Fund.
Investment activities of this shareholder could have a material impact to the Fund.
10. Subsequent Events
Management of the Fund has evaluated the need for additional disclosures or adjustments resulting from events through the date the financial statements were issued. Based on this evaluation, there were no subsequent events to report that would have material impact on the Fund’s financial statements, except as noted below.
The reorganization, as discussed in Note 1, whereby the Fund will acquire all of the assets and liabilities of the AZL MVP Fusion Moderate Fund, is expected to be completed on or about March 10, 2023.
12
REPORT OF INDEPENDENT REGISTERED PUBLIC ACCOUNTING FIRM
To the Board of Trustees of Allianz Variable Insurance Products Fund of Funds Trust and Shareholders of
AZL MVP DFA Multi-Strategy Fund
Opinion on the Financial Statements
We have audited the accompanying statement of assets and liabilities, including the schedule of portfolio investments, of AZL MVP DFA Multi-Strategy Fund (one of the funds constituting Allianz Variable Insurance Products Fund of Funds Trust, referred to hereafter as the “Fund”) as of December 31, 2022, the related statement of operations for the year ended December 31, 2022, the statements of changes in net assets for each of the two years in the period ended December 31, 2022, including the related notes, and the financial highlights for each of the five years in the period ended December 31, 2022 (collectively referred to as the “financial statements”). In our opinion, the financial statements present fairly, in all material respects, the financial position of the Fund as of December 31, 2022, the results of its operations for the year then ended, the changes in its net assets for each of the two years in the period ended December 31, 2022 and the financial highlights for each of the five years in the period ended December 31, 2022 in conformity with accounting principles generally accepted in the United States of America.
Basis for Opinion
These financial statements are the responsibility of the Fund’s management. Our responsibility is to express an opinion on the Fund’s financial statements based on our audits. We are a public accounting firm registered with the Public Company Accounting Oversight Board (United States) (PCAOB) and are required to be independent with respect to the Fund in accordance with the U.S. federal securities laws and the applicable rules and regulations of the Securities and Exchange Commission and the PCAOB.
We conducted our audits of these financial statements in accordance with the standards of the PCAOB. Those standards require that we plan and perform the audit to obtain reasonable assurance about whether the financial statements are free of material misstatement, whether due to error or fraud.
Our audits included performing procedures to assess the risks of material misstatement of the financial statements, whether due to error or fraud, and performing procedures that respond to those risks. Such procedures included examining, on a test basis, evidence regarding the amounts and disclosures in the financial statements. Our audits also included evaluating the accounting principles used and significant estimates made by management, as well as evaluating the overall presentation of the financial statements. Our procedures included confirmation of securities owned as of December 31, 2022 by correspondence with the transfer agent and brokers. We believe that our audits provide a reasonable basis for our opinion.
/s/ PricewaterhouseCoopers LLP
New York, New York
February 23, 2023
We have served as the auditor of one or more investment companies in the Allianz Variable Insurance Products complex since 2018.
13
Other Federal Income Tax Information (Unaudited)
For the year ended December 31, 2022, 18.26% of the total ordinary income dividends paid by the Fund qualify for the corporate dividends received deductions available to corporate shareholders.
During the year ended December 31, 2022, the Fund declared net short-term capital gain distributions of $2,373,017.
During the year ended December 31, 2022, the Fund declared net long-term capital gain distributions of $3,816,255.
14
A description of the policies and procedures that the Fund uses to determine how to vote proxies relating to portfolio securities is available, without charge, upon request, by visiting the Securities and Exchange Commission’s (‘‘Commission’’) website at www.sec.gov, or by calling 800-624-0197.
Information regarding how the Fund voted proxies relating to portfolio securities during the most recent 12-month period ended June 30th is available (i) without charge, upon request, by calling 800-624-0197; (ii) on the Trust’s website at https://www.allianzlife.com; and (iii) on the Commission’s website at http://www.sec.gov.
The Fund files complete Schedules of Portfolio Holdings with the Commission for the first and third quarters of each fiscal year on Form N-PORT. Schedules of Portfolio Holdings for the Fund are available without charge on the Commission’s website at http://www.sec.gov, or may be obtained by calling 800-624-0197.
15
Approval of Investment Advisory Agreement (Unaudited)
Subject to the general supervision of the Board of Trustees (the “Board”) and in accordance with the investment objectives and restrictions of each separate series (each a “Fund,” together, the “Funds”) of the Allianz Variable Insurance Products Fund of Funds Trust (the “Trust”), investment advisory services are provided to the Funds by Allianz Investment Management LLC (the “Manager”). The Manager manages each Fund pursuant to an investment management agreement (the “Management Agreement”) with the Trust in respect of each such Fund. The Management Agreement provides that the Manager, subject to the supervision and approval of the Board, is responsible for the management of each Fund. For management services, each Fund pays the Manager an investment advisory fee based upon each Fund’s average daily net assets. The Manager has contractually agreed to limit the expenses of each Fund by reimbursing the Fund if and when total Fund operating expenses exceed certain amounts until at least April 30, 2024 (the “Expense Limitation Agreement”).
In reviewing the services provided by the Manager and the terms of the Management Agreement, the Board receives and reviews information related to the Manager’s experience and expertise in the variable insurance marketplace. In addition, the Board receives information regarding the Manager’s expertise with regard to portfolio diversification and asset allocation requirements within variable insurance products issued by Allianz Life Insurance Company of North America (“Allianz Life”) and its subsidiary, Allianz Life Insurance Company of New York (“Allianz of New York”). Currently, the Funds are offered only through Allianz Life and Allianz of New York variable products, and not in the retail fund market.
As required by the Investment Company Act of 1940 (the “1940 Act”), the Board has reviewed and approved the Management Agreement with the Manager. The Board’s decision to approve this contract reflects the exercise of its business judgment on whether to approve new arrangements and continue the existing arrangements. During its review of the contract, the Board considered many factors, among the most material of which are: the Fund’s investment objectives and long-term performance; the Manager’s management philosophy, personnel, processes and investment performance, including its compliance history and the adequacy of its compliance processes; the preferences and expectations of Fund shareholders (and underlying contract owners) and their relative sophistication; the continuing state of competition in the mutual fund industry; and comparable fees in the mutual fund industry.
The Board also considered the compensation and benefits received by the Manager. This includes fees received for services provided to a Fund by employees of the Manager or of affiliates of the Manager and research services received by the Manager from brokers that execute Fund trades, as well as advisory fees. The Board considered the fact that: (1) the Manager and the Trust are parties to an Administrative Services Agreement and a Compliance Services Agreement, under which the Manager is compensated by the Trust for performing certain administrative and compliance services including providing an employee of the Manager or one of its affiliates to act as the Trust’s Chief Compliance Officer; and (2) Allianz Life Financial Services, LLC, an affiliated person of the Manager, is a registered securities broker-dealer and received (along with its affiliated persons) payments made by the underlying funds pursuant to Rule 12b-1.
The Board is aware that various courts have interpreted provisions of the 1940 Act and have indicated in their decisions that the following factors may be relevant to an adviser’s compensation: the nature, extent and quality of the services provided by the adviser, including the performance of the fund; the adviser’s cost of providing the services; the extent to which the adviser may realize “economies of scale” as the fund grows larger; any indirect benefits that may accrue to the adviser and its affiliates as a result of the adviser’s relationship with the fund; performance and expenses of comparable funds; the profitability of acting as adviser to the fund; and the extent to which the independent Board members, who are not “interested persons” of a fund as defined by the 1940 Act (“Independent Trustees”), are fully informed about all facts bearing on the adviser’s services and fees. The Board is aware of these factors and takes them into account in its review of the Management Agreement for the Funds.
Each member of the Board considered and weighed these factors in light of his or her experience in governing the Trust. The Board is assisted in its deliberations by the advice of independent legal counsel to the Independent Trustees (“Independent Trustee Counsel”). In this regard, the Board requests and receives a significant amount of information about the Funds and the Manager. Some of this information is provided at each regular meeting of the Board; additional information is provided in connection with the particular meetings at which the Board’s formal review of the Management Agreement occurs. In between regularly scheduled meetings, the Board may receive information on particular matters as the need arises. Thus, the Board’s evaluation of the Management Agreement is informed by reports covering such matters as: the Manager’s investment philosophy, personnel and processes, and the Fund’s investment performance (in absolute terms as well as in relationship to its benchmark and certain competitor or “peer group” funds). In connection with comparing the performance of each Fund versus its benchmark, the Board receives reports on the extent to which the Fund’s performance may be attributed to various applicable factors, such as asset class allocation decisions and volatility management strategies, if applicable, the performance of the underlying funds, rebalancing decisions, and the impact of cash positions and Fund fees and expenses. The Board also receives reports on the Funds’ expenses (including the advisory fee itself and the overall expense structure of the Funds, both in absolute terms and relative to peer group and/or competing funds, with due regard for the Expense Limitation Agreement and additional voluntary expense limitations); the use and allocation of any brokerage commissions derived from trading the Funds’ portfolio securities; the nature, extent and quality of the advisory and other services provided to the Fund by the Manager and its affiliates; compliance and audit reports concerning the Funds and the companies that service them; and relevant developments in the mutual fund industry and how the Funds and/or the Manager are responding to them.
The Board also receives financial information about the Manager, including reports on the compensation and benefits the Manager derives from its relationships with the Funds. These reports cover not only the fees under the Management Agreement, but also the fees, if any, received for providing other services to the Funds. The reports also discuss any indirect or “fall-out” benefits the Manager or its affiliates may derive from their relationships with the Funds.
The Management Agreement was most recently considered at Board meetings held in the summer and fall of 2022. Information relevant to the approval of the Management Agreement was considered at Board meetings held June 14 and 21, 2022, and September 13, 2022, as well as at various other meetings preceding those meetings. Accordingly, the Management Agreement was approved by the Board at an in-person meeting on September 13, 2022. At such meeting the Board also approved the Expense Limitation Agreement between the Manager and the Trust for the period ending April 30, 2024.
In connection with such meetings, the Board requested and evaluated extensive materials from the Manager, including performance and expense information for other investment companies with similar investment objectives derived from data compiled by an independent third-party provider and other sources believed to be reliable by the Manager and the Trustees. Prior to voting, the Trustees reviewed the proposed approval of the Management Agreement with management and with Independent Trustee Counsel and received a memorandum from such counsel discussing the legal standards for their consideration of the proposed approval. The Independent Trustees also discussed the proposed approval in private sessions with Independent Trustee Counsel at which no representatives of the Manager were present. In reaching their determinations relating to the approval of the Management Agreement, in respect of each Fund, each member of the Board considered all factors he or she believed relevant. The Board based its decision to approve
16
the Management Agreement on the totality of the circumstances and relevant factors, and with a view to past and future long-term considerations. Not all of the factors and considerations discussed above and below are necessarily relevant to every Fund, and the Board did not assign relative weights to factors discussed herein or deem any one or group of them to be controlling in and of themselves.
Shareholder reports must include a discussion of certain factors relating to the selection of the investment adviser and the approval of the advisory fee. The “factors” enumerated by the SEC are set forth below in italics, as well as the Board’s conclusions regarding such factors:
(1) The nature, extent and quality of services provided by the Manager. The Trustees noted that the Manager, subject to the oversight of the Board, administers each Fund’s business and other affairs. The Trustees noted that the Manager also provides the Trust and each Fund with such administrative and other services (exclusive of, and in addition to, any such services provided by any other service providers retained by the Trust on behalf of the Funds) and executive and other personnel as are necessary for the operation of the Trust and the Funds. Except for the Trust’s Chief Compliance Officer and certain compliance staff, the Manager pays all of the compensation of Trustees and officers of the Trust who are employees of the Manager or its affiliates.
The Board considered the scope and quality of services provided by the Manager and noted that the scope of the services provided has continued to expand as a result of regulatory and other developments. The Board noted, for example, that the Manager is responsible for maintaining and monitoring its own compliance program, and this compliance program has been continuously refined and enhanced in light of new regulatory requirements. The Board considered the capabilities and resources which the Manager has dedicated to performing services on behalf of the Trust and its Funds. The quality of administrative and other services, including the Manager’s role in coordinating the activities of the Trust’s other service providers, also were considered. The Board concluded that, overall, they were satisfied with the nature, extent and quality of services provided (and expected to be provided) to the Trust and to each of the Funds under the Management Agreement.
(2) The investment performance of the Funds and the Manager. In connection with every quarterly Board meeting and the summer and fall 2022 contract review process, Trustees received extensive information on the performance results of each Fund. This included, for example, performance information on absolute total return, performance versus the appropriate benchmark(s) and performance versus peer groups as reported by Lipper, the contribution to performance of the Manager’s asset class allocation decisions and volatility management strategies, if applicable, the performance of the underlying funds, and the impact on performance of rebalancing decisions, cash and Fund fees. This included Lipper performance information on the Funds for the previous quarter, and previous one-, three- and five-year periods, to the extent available. For example, in connection with the Board meetings held June 14 and 21, 2022, and September 13, 2022, the Manager reported that, for the five-year period ended December 31, 2021, two Funds were in the top 40%, three were in the middle 20%, and seven were in the bottom 40% of their respective Lipper peer groups. The Manager reported that for the three-year period ended December 31, 2021, three Funds were in the top 40%, two were in the middle 20%, and seven were in the bottom 40% of their respective Lipper peer groups. For the one-year period ended December 31, 2021, six Funds were in the top 40%, two were in the middle 20%, and four were in the bottom 40% of their respective Lipper peer groups.
The Manager also reported on the performance of the MVP Funds compared to custom managed-volatility peer groups. For the five-year period ended December 31, 2021, four Funds were in the top 40%, two were in the middle 20%, and four were in the bottom 20%. For the three-year period ended December 31, 2021, four Funds were in the top 40%, two were in the middle 20%, and four were in the bottom 40% of their respective custom managed-volatility peer groups. For the one-year period ended December 31, 2021, seven Funds were in the top 40%, two were in the middle 20%, and one was in the bottom 40% of their respective custom managed-volatility peer groups. The Board members discussed with the Manager and considered the impact of the volatility management strategies on performance in different market environments, where applicable, and considered whether they were operating as intended. The Board noted, in particular, the impact of certain characteristics of the Funds’ volatility management strategies in relation to volatility experienced as a result of the COVID-19 pandemic, and that relative performance had improved as the markets stabilized.
At the Board meeting held September 13, 2022, the Board also received updated performance information for the Funds, including updated Lipper peer group ranking information, for various periods ending June 30, 2022.
At the Board meeting held September 13, 2022, the Trustees determined that the investment performance of the Funds was acceptable.
(3) The costs of services to be provided and profits to be realized by the Manager and its affiliates from the relationship with the Funds. The Board considered that the Manager receives an advisory fee from each of the Funds. The Manager reported that for the three MVP Fusion Funds the advisory fee paid put these Funds in the 13th percentile of the customized peer group. The Manager reported that for the four MVP Index Strategy Funds the advisory fee paid put them in the 23rd percentile of the customized peer group, and for the AZL Balanced Index Strategy Fund the advisory fee paid put it in the 7th percentile of the customized peer group. The Manager reported that for the AZL DFA Multi-Strategy Fund, the advisory fee paid was in the 5th percentile. The Manager reported that for the AZL MVP DFA Multi-Strategy, AZL MVP FIAM Multi-Strategy, and AZL MVP T. Rowe Price Capital Appreciation Plus Funds, the advisory fee paid was in the 1st percentile. (A lower percentile reflects lower fund fees and is better for fund shareholders.) Trustees were provided with information on the total expense ratios of the Funds and other funds in the customized peer groups, and the Manager reported upon the challenges in making peer group comparisons for the Funds. The Board further considered and found that the advisory fee paid to the Manager with respect to each Fund was based on services provided to the Fund that were in addition to, rather than duplicative of, the services provided pursuant to the advisory agreements for the underlying funds in which the Fund invests.
The Manager provided information concerning the profitability of the Manager’s investment advisory activities for the period from 2019 through 2021. The Board recognized that it is difficult to make comparisons of profitability from investment company advisory agreements because comparative information is not generally publicly available and is affected by numerous factors, including the structure of the particular adviser, the types of funds it manages, its business mix, numerous assumptions regarding allocation of expenses and the adviser’s capital structure and cost of capital. In considering profitability information, the Board considered the possible effect of certain fall-out benefits to the Manager and its affiliates. The Board focused on profitability of the Manager’s relationships with the Funds before taxes and distribution expenses. The Board recognized that the Manager should earn a reasonable level of profits for the services it provides to each Fund.
The Board also considered that Wilshire Funds Management (“Wilshire”) serves as a consultant to the Manager in preparing statistical and other factual information for use in the creation and maintenance of the asset allocation models for the AZL MVP Fusion Funds, pursuant to an agreement between the Manager and Wilshire. Wilshire serves as a consultant to the Manager with respect to selecting the AZL MVP Fusion Funds’ underlying funds and the asset allocations among the underlying funds. The Manager, not any Fund, pays a consultant fee to Wilshire.
(4) and (5) The extent to which economies of scale would be realized as the Funds grow, and whether fee levels reflect these economies of scale. The Board noted that the advisory fee schedules for the Funds do not contain breakpoints that reduce the fee rate on assets above specified levels. The Board recognized that breakpoints may be an appropriate way for the Manager to share its economies of scale, if any, with Funds that have substantial assets. The Board found there was no uniform methodology for establishing breakpoints
17
that give effect to Fund-specific services provided by the Manager. The Board noted that in the fund industry as a whole, as well as among funds similar to the Funds, there is no uniformity or pattern in the fees and asset levels at which breakpoints (if any) apply. Depending on the age, size, and other characteristics of a particular fund and its manager’s cost structure, different conclusions can be drawn as to whether there are economies of scale to be realized at any particular level of assets, notwithstanding the intuitive conclusion that such economies exist, or will be realized at some level of total assets. Moreover, because different managers have different cost structures and service models, it is difficult to draw meaningful conclusions from the breakpoints that may have been adopted by other funds. The Board also noted that the advisory agreements for many funds do not have breakpoints at all, or if breakpoints exist, they may be at asset levels significantly greater than those of the individual Funds. The Board noted that the total assets in all of the Funds, as of June 30, 2022, were approximately $8.2 billion and that the largest Fund, the AZL MVP Growth Index Strategy Fund, had assets of approximately $2.1 billion.
The Board noted that the Manager has agreed to temporarily limit Fund expenses under the Expense Limitation Agreement, which has the effect of reducing expenses similar to implementation of advisory fee breakpoints. The Manager has committed to continue to consider the continuation of expense limits and/or advisory fee breakpoints as Fund assets change. The Board receives quarterly reports on the level of Fund assets. The Board expects to continue to consider: (a) the extent to which economies of scale have been realized, and (b) whether the advisory fee should be modified, either in connection with the next renewal of the Management Agreement or by modifying the Expense Limitation Agreement, to reflect such economies of scale, if any.
Having taken these factors into account, the Board concluded that the absence of breakpoints in the Funds’ advisory fee rate schedules was acceptable under each Fund’s circumstances.
In conclusion, after full consideration of the above factors, as well as such other factors as each member of the Board considered instructive in evaluating the Management Agreement, the Board concluded that the advisory fees were reasonable, and that the continuation of the Management Agreement was in the best interest of the Funds.
18
Information about the Board of Trustees and Officers (Unaudited)
The Trust is managed by the Trustees in accordance with the laws of the state of Delaware governing business trusts. In addition to serving on the Board of Trustees of the Trust, each Trustee serves on the Board of the Allianz Variable Insurance Products Trust (“VIP Trust”) and the AIM ETF Products Trust (“ETF Trust”) (collectively, the Trust, the VIP Trust, and ETF Trust are the “AIM Complex”). There are currently seven Trustees, one of whom is an “interested person” of the Trust within the meaning of that term under the 1940 Act. The Trustees and Officers of the Trust, and their addresses, years of birth, their positions held with the Trust, their terms of office with the Trust and length of time served, their principal occupation(s) during the past five years, the number of portfolios in the Trust they oversee, and their other directorships held during the past five years are as follows:
Independent Trustees(1)
| Name, Address, and Birth Year | Positions Complex | Term of Office(2)/Length of Time Served | Principal Occupation(s) During Past 5 Years | Number of Portfolios Overseen for the AIM Complex | Other 5 Years | |||||
Peggy L. Ettestad (1957) 5701 Golden Hills Drive Minneapolis, MN 55416 | Lead Independent Trustee | Since 10/14 (Trustee since 2/07) | Managing Director, Red Canoe Management Consulting LLC, 2008 to present | 50 | None | |||||
Tamara Lynn Fagely (1958) 5701 Golden Hills Drive Minneapolis, MN 55416 | Trustee | Since 12/17 | Retired; previously, Chief Operations Officer, Hartford Funds, 2012 to 2013 | 50 | Diamond Hill Funds (10 Funds) | |||||
Richard H. Forde (1953) 5701 Golden Hills Drive Minneapolis, MN 55416 | Trustee | Since 12/17 | Retired; previously, Member of the Board and Chairman of the Finance and Investment Committee, Connecticut Water Service, Inc., 2013 to 2019 | 50 | Connecticut Water Service, Inc. | |||||
Jack Gee (1959) 5701 Golden Hills Drive Minneapolis, MN 55416 | Trustee | Since 1/22 (Consultant to the Independent Trustees since 2/20)(3) | Retired; previously, Managing Director, BlackRock, Inc., Treasurer and Chief Financial Officer U.S. iShares, 2004 to 2019 | 50 | Engine No. 1 ETF Trust (2 Funds); Esoterica Thematic Trust (2019 - 2020) | |||||
Claire R. Leonardi (1955) 5701 Golden Hills Drive Minneapolis, MN 55416 | Trustee | Since 2/04 | Retired; previously, CEO, Health eSense Inc. (a medical device company), 2015 to 2018, and Connecticut Innovations, Inc. (a venture capital firm), 2012 to 2015 | 50 | None | |||||
Dickson W. Lewis (1948) 5701 Golden Hills Drive Minneapolis, MN 55416 | Trustee | Since 2/04 | Retired; previously, senior executive for Lifetouch National School Studios (a photography company), 2006 to 2014, Jostens (a producer of year books and class rings), 2001 to 2006, and Fortis Financial Group, 1997 to 2001 | 50 | None | |||||
19
Interested Trustee(4)
| Name, Address, and Birth Year | Positions Held with AIM Complex | Term of Office(2)/Length of Time Served | Principal Occupation(s) During Past 5 Years | Number of Portfolios Overseen for the AIM Complex | Other 5 Years | |||||
Brian Muench (1970) 5701 Golden Hills Drive Minneapolis, MN 55416 | Trustee | Since 6/11 | President, Allianz Investment Management LLC, 2010 to present; Vice President, Allianz Life, 2011 to present | 50 | None | |||||
| (1) | Each of the Independent Trustees is a member of the Audit Committee. |
| (2) | Indefinite. |
| (3) | Prior to January 1, 2022, Mr. Gee served as a consultant to the Independent Trustees since February 2020, during which he attended meetings of the Board and its standing committees, including the audit committee, solely in his capacity as a consultant, and was not entitled to vote. |
| (4) | Is an “interested person,” as defined by the 1940 Act, due to employment by Allianz Life and the Manager. |
Officers
| Name, Address, and Birth Year | Positions Held with AIM Complex | Term of Office(1)/ Length of Time Served | Principal Occupation(s) During Past 5 Years | |||
Brian Muench (1970) 5701 Golden Hills Drive Minneapolis, MN 55416 | President | Since 11/10 | President, Allianz Investment Management LLC, November 2010 to present; Vice President, Allianz Life, 2011 to present. | |||
Erik Nelson (1972) 5701 Golden Hills Drive Minneapolis, MN 55416 | Secretary | Since 12/20 | Chief Legal Officer, Allianz Investment Management LLC; Associate General Counsel, Senior Counsel, Allianz Life, 2008 to present. | |||
| Bashir C. Asad (1963) Citi Fund Services Ohio, Inc. 4400 Easton Commons, Suite 200 Columbus, OH 43219 | Treasurer, Principal Accounting Officer and Principal Financial Officer | Since 06/16 | Senior Vice President, Citi Fund Services Ohio, Inc., 2011 to present. | |||
Chris R. Pheiffer (1968) 5701 Golden Hills Drive Minneapolis, MN 55416 | Chief Compliance Officer(2) and Anti-Money Laundering Compliance Officer | Since 02/14 | Chief Compliance Officer of the Trust and the VIP Trust, 2014 to present, and the ETF Trust, 2020 to present. | |||
Michael Tanski (1970) 5701 Golden Hills Drive Minneapolis, MN 55416 | Vice President | Since 04/09 | Assistant Vice President, Allianz Investment Management LLC, 2013 to present. | |||
| (1) | Indefinite. |
| (2) | The Manager and the Trust are parties to a Compliance Services Agreement under which the Manager provides an employee of the Manager or one of its affiliates to act as the Trust’s Chief Compliance Officer. |
The Fund’s Statement of Additional Information (“SAI”) contains additional information about the Trust’s Trustees and Officers. The SAI is available without charge, upon request, by calling toll-free 800-624-0197 or at https://www.allianzlife.com.
20
| The Allianz VIP Fund of Funds are distributed by Allianz Life Financial Services, LLC. | ||
| These Funds are not FDIC Insured. | ANNRPT1222 02/23 |
AZL® MVP Fidelity Institutional Asset Management Multi-Strategy Fund
Annual Report
December 31, 2022

Management Discussion and Analysis
Page 1
Expense Examples and Portfolio Composition
Page 3
Schedule of Portfolio Investments
Page 4
Statement of Assets and Liabilities
Page 5
Page 5
Statements of Changes in Net Assets
Page 6
Page 7
Notes to the Financial Statements
Page 8
Report of Independent Registered Public Accounting Firm
Page 14
Other Federal Income Tax Information
Page 15
Page 16
Approval of Investment Advisory Agreement
Page 17
Information about the Board of Trustees and Officers
Page 20
This report is submitted for the general information of the shareholder of the Fund. The report is not authorized for distribution to prospective investors in the Fund unless preceded or accompanied by an effective prospectus, which contains details concerning the sales charges and other pertinent information.
Allianz Investment Management LLC serves as the Manager for the AZL® MVP Fidelity Institutional Asset Management Multi- Strategy Fund.
What factors affected the Fund’s performance during the year ended December 31, 2022?*
For the year ended December 31, 2022, the AZL® MVP Fidelity Institutional Asset Management Multi-Strategy Fund (the “Fund”) returned (13.81)%. That compared to a (18.11)%, (13.01)% and a (14.89)% total return for its benchmarks, the S&P 500 Index, the Bloomberg U.S. Aggregate Bond Index, and the Income & Growth Composite Index, respectively.1
The Fund currently invests in one underlying fund, the AZL® Fidelity Institutional Asset Management Multi-Strategy Fund, which is managed by its sub adviser, FIAM LLC. The underlying fund is approximately 60% invested primarily in investment- grade fixed-income securities, and approximately 40% of the underlying fund’s assets are invested primarily in large-cap common stocks.
The Fund also employs the MVP (Managed Volatility Portfolio) risk management process, which is intended to adjust the risk of the portfolio based on quantitative indicators of market risk, such as the current level of fund and market volatility.
U.S. equity markets declined in 2022, reacting in large part to a slowing economy and a shift away from COVID-era monetary easing. Persistent inflation led to the U.S. Federal Reserve tightening monetary policy. This move, combined with a deceleration in both global manufacturing and profit margins, drove stock prices lower. Eight of 11 sectors posted negative contributions to returns, with communication services and consumer discretionary the largest detractors to the Fund’s absolute performance. The positive contributions from the energy sector only partially offset this negative impact.
Meanwhile, the U.S. bond market posted negative returns in 2022 as the U.S. Federal Reserve took aggressive steps to rein in inflation, which remained elevated due to supply chain challenges and spikes in food and energy prices due to Russia’s invasion of Ukraine, among other factors. This notable strategic shift began in late 2021 when the Fed indicated that it was planning to stop bond purchases as part of its quantitative easing program. The trend continued in 2022 as the Fed made a series of increases to its federal funds target rate, starting in March and continuing through December.
The Fund outperformed its composite benchmark during the period under review, and the Fund’s equity component outperformed its equity benchmark, the S&P 500 Index. The Fund’s investment process looks at multiple viewpoints in determining the attractiveness of a security, which helped
deliver positive relative results during a period of low market performance. In this risk-averse market investing environment, the Fund’s defensively postured factors boosted relative returns, with companies exhibiting stable financials and high-quality earnings performing well compared to their peers. The shift to a risk-averse environment was also well captured by the Fund’s momentum factors. Stock selection within health care and information technology contributed to relative returns, as did an overweight position in energy. Meanwhile, stock selection in utilities detracted from the Fund’s performance relative to its equity benchmark, as did modest exposure to growth-oriented companies and economically sensitive cyclical value factors.
The Fund’s fixed income component underperformed its benchmark, the Bloomberg U.S. Aggregate Bond Index. The fixed income component’s relative return was hurt by an overweight allocation to high-yield corporate bonds, as spreads widened amid growing market concern over the possibility of a recession. The Fund’s fixed income relative performance benefitted from its modestly shorter duration compared to that of the benchmark throughout the period, as bond yields rose materially during the year. An underweight position in mortgage-backed securities also contributed positively to relative returns as spreads widened considerably.
The Fund held futures to equitize its cash positions during the period. Exposure to this form of derivative did not materially impact the Fund’s performance.
The MVP risk management process utilizes derivatives in an effort to control portfolio volatility in unstable market conditions. Market volatility was relatively high during 2022, therefore the MVP process was engaged and reduced the Fund’s equity exposure at multiple points during the year. The MVP process contributed positively to the Fund’s performance during 2022.
Past performance does not guarantee future results.
| * | The Fund’s portfolio composition is subject to change. There is no guarantee that any sectors mentioned will continue to perform as described or that securities in such sectors will be held by the Fund in the future. The information contained in this commentary is for informational purposes only and should not be construed as a recommendation to purchase or sell securities in the sector mentioned. The Fund’s holdings and weightings are as of December 31, 2022. |
| 1 | For a complete description of the Fund’s performance benchmark please refer to page 2 of this report. |
1
AZL® MVP Fidelity Institutional Asset Management Multi-Strategy Fund Review (Unaudited) |
Fund Objective
The Fund’s investment objective is to seek a high level of current income while maintaining prospects for capital appreciation. This objective may be changed by the Trustees of the Fund without shareholder approval. The Fund seeks to achieve its objective by investing primarily in shares of another mutual fund managed by the manager, the AZL® Fidelity Institutional Asset Management Multi-Strategy Fund, combined with the MVP risk management process.
Investment Concerns
The Fund invests in underlying funds, so its investment performance is directly related to the performance of those underlying funds. Before investing, investors should assess the risks associated with and types of investments made by each of the underlying funds in which the Fund invests.
Quantitative investing involves risk that the values of securities selected in the quantitative analysis can react differently than the market or securities selected using fundamental analysis.
Emerging market investing may be subject to additional economic, political, liquidity, and currency risks not associated with more developed countries.
International investing may involve risk of capital loss from unfavorable fluctuations in currency values, from differences in generally accepted accounting principles or from economic or political instability in other nations.
Mortgage-backed investments involve risk of loss due to prepayments and, like any bond, due to default. Because of the sensitivity of mortgage-related securities to changes in interest rates, an underlying fund’s performance may be more volatile than if it did not hold these securities.
Bonds offer a relatively stable level of income, although bond prices will fluctuate, providing the potential for principal gain or loss. Debt securities held by an underlying fund may decline in value due to rising interest rates. High-yield bonds have a higher risk of default or other adverse credit events, but have the potential to pay higher earnings over investment-grade bonds. The higher risk of default, or the inability of the creditor to repay its debt, is the primary reason for the higher interest rates on high-yield bonds.
The performance of investments in real estate depends on the overall strength of the real estate market, the management of real estate investments trusts (REITs), real estate operating companies (REOCs), and foreign real estate companies, and property management, all of which can be affected by a variety of factors, including national and regional economic conditions.
Investing in derivative instruments involves risks that may be different from or greater than the risk associated with investing directly in securities or other traditional instruments.
For a complete description of these and other risks associated with investing in the Fund, please refer to the Fund’s prospectus.
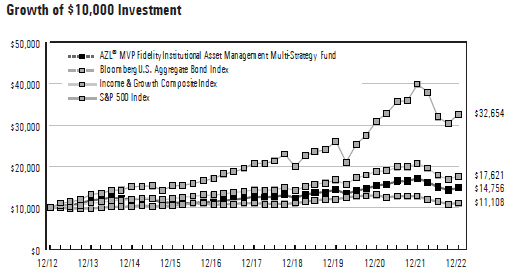
The chart above represents a comparison of a hypothetical investment in the Fund versus a similar investment in the Fund’s benchmarks and represents the reinvestment of dividends and capital gains in the Fund.
Average Annual Total Returns as of December 31, 2022
| 1 Year | 3 Years | 5 Years | 10 Years | |||||||||||||||||
AZL® MVP Fidelity Institutional Asset Management Multi-Strategy Fund | (13.81 | )% | 0.86 | % | 3.14 | % | 3.97 | % | ||||||||||||
Bloomberg U.S. Aggregate Bond Index | (13.01 | )% | (2.71 | )% | 0.02 | % | 1.06 | % | ||||||||||||
Income & Growth Composite Index | (14.89 | )% | 1.91 | % | 4.18 | % | 5.83 | % | ||||||||||||
S&P 500 Index | (18.11 | )% | 7.66 | % | 9.42 | % | 12.56 | % | ||||||||||||
Past performance does not guarantee future results. The performance data quoted represents past performance and current returns may be lower or higher. The investment return and principal value will fluctuate so that an investor’s shares, when redeemed, may be worth more or less than the original cost. To obtain performance information current to the most recent month end, please visit www.Allianzlife.com.
| Expense Ratio | Gross | ||||
AZL® MVP Fidelity Institutional Asset Management Multi-Strategy Fund | 0.82 | % | |||
The above expense ratio is based on the current Fund prospectus dated April 29, 2022. The Manager and the Fund have entered into a written contract limiting operating expenses, excluding certain expenses (such as interest expense and acquired fund fees and expenses), to 0.15% through April 30, 2024. Additional information pertaining to the December 31, 2022 expense ratio can be found in the Financial Highlights.
Acquired fund fees and expenses are incurred indirectly by the Fund through the valuation of the Fund’s investments in the permitted Underlying Funds. Accordingly, acquired fund fees and expenses affect the Fund’s total returns. Because these fees and expenses are not included in the Fund’s financial highlights, the Fund’s total annual fund operating expenses, as shown in the current prospectus, do not correlate to the ratios of expenses to average net assets shown in the Financial Highlights. Without acquired fund fees and expenses the Fund’s gross expense ratio would be 0.14%.
The total return of the Fund does not reflect the effect of any insurance charges, the annual maintenance fee or the deduction of taxes that a shareholder would pay on Fund distributions or the redemption of Fund shares. Such charges, fees and tax payments would reduce the performance quoted.
The Fund’s performance is measured against the Standard & Poor’s 500 Index (“S&P 500”), the Bloomberg U.S. Aggregate Bond Index and the Income & Growth Composite Index (“Composite”). The S&P 500 is representative of 500 selected common stocks, most of which are listed on the New York Stock Exchange, and is a measure of the U.S. Stock market as a whole. The Bloomberg U.S. Aggregate Bond Index is a market value-weighted performance benchmark for investment-grade fixed-rate debt issues, including government, corporate, asset-backed, and mortgage-backed securities, with maturities of at least one year. The Composite is a blended index comprised of (40%) S&P 500 and (60%) Bloomberg U.S.
Aggregate Bond Index. These indexes are unmanaged and do not reflect the deduction of fees associated with a mutual fund, such as investment management and fund accounting fees. The Fund’s performance reflects the deduction of fees for services provided to the Fund. Investors cannot invest directly in an index.
2
AZL MVP FIAM Multi-Strategy Fund
(Unaudited)
As a shareholder of the AZL MVP FIAM Multi-Strategy Fund (the “Fund”), you incur ongoing costs, including management fees, distribution fees, and other Fund expenses. These examples are intended to help you understand your ongoing costs (in dollars) of investing in the Fund and to compare these costs with the ongoing costs of investing in other mutual funds. Please note that the expenses shown in each table do not reflect expenses that apply to the subaccount or the insurance contract. If the expenses that apply to the subaccount or the insurance contract were included, your costs would have been higher.
These examples are based on an investment of $1,000 invested at the beginning of the period and held for the periods presented below.
The Actual Expense table below provides information about actual account values and actual expenses. You may use the information below, together with the amount you invested, to estimate the expenses that you paid over the period. Simply divide your account value by $1,000 (for example, an $8,600 account value divided by $1,000 = 8.6), then multiply the result by the number in the table under the heading entitled “Expenses Paid During Period” to estimate the expenses you paid on your account during this period.
| Beginning Account Value 7/1/22 | Ending Account Value 12/31/22 | Expenses Paid During Period 7/1/22 -12/31/22* | Annualized Expense Ratio During Period 7/1/22 - 12/31/22 | |||||||||||||
AZL MVP FIAM Multi-Strategy Fund | $ | 1,000.00 | $ | 985.50 | $ | 0.80 | 0.16 | % | ||||||||
The Hypothetical Expense table below provides information about hypothetical account values and hypothetical expenses based on the Fund’s actual expense ratio and an assumed rate of return of 5% per year before expenses, which is not the Fund’s actual return. The hypothetical account values and expenses may not be used to estimate the actual ending account balance or expenses you paid for the period. You may use this information to compare this 5% hypothetical example with the 5% hypothetical examples that appear in the shareholder reports of other funds.
| Beginning Account Value 7/1/22 | Ending Account Value 12/31/22 | Expenses Paid During Period 7/1/22 -12/31/22* | Annualized Expense Ratio During Period 7/1/22 - 12/31/22 | |||||||||||||
AZL MVP FIAM Multi-Strategy Fund | $ | 1,000.00 | $ | 1,024.40 | $ | 0.82 | 0.16 | % | ||||||||
| * | Expenses are equal to the average account value multiplied by the Fund’s annualized expense ratio multiplied by 184/365 (the number of days in the most recent fiscal half-year divided by the number of days in the fiscal year). |
Portfolio Composition
(Unaudited)
| Investments | Percent of Net Assets | ||||
Balanced Funds | 95.3% | ||||
|
| ||||
Total Investment Securities | 95.3 | ||||
Net other assets (liabilities) | 4.7 | ||||
|
| ||||
Net Assets | 100.0% | ||||
|
| ||||
3
AZL MVP FIAM Multi-Strategy Fund
Schedule of Portfolio Investments
December 31, 2022
| Shares | Value | |||||||||
| Affiliated Investment Company (95.3%): | ||||||||||
| Balanced Funds (95.3%): | ||||||||||
| 14,021,480 | AZL Fidelity Institutional Asset Management Multi- Strategy Fund | $ | 173,726,137 | |||||||
|
| |||||||||
| | Total Affiliated Investment Company (Cost $171,741,737) | 173,726,137 | ||||||||
|
| |||||||||
| | Total Investment Securities (Cost $171,741,737) — 95.3%(a) | 173,726,137 | ||||||||
Net other assets (liabilities) — 4.7% | 8,656,468 | |||||||||
|
| |||||||||
Net Assets — 100.0% | $ | 182,382,605 | ||||||||
|
| |||||||||
| (a) | See Federal Tax Information listed in the Notes to the Financial Statements. |
| Percentages | indicated are based on net assets as of December 31, 2022 |
Futures Contracts
At December 31, 2022, the Fund’s open futures contracts were as follows:
Short Futures
| Description | Expiration Date | Number of Contracts | Notional Amount | Value and Unrealized Appreciation/ (Depreciation) | ||||||||||||||||
S&P 500 Index E-Mini March Futures (U.S. Dollar) | 3/17/23 | 31 | $ | (5,984,550 | ) | $ | 95,629 | |||||||||||||
|
| |||||||||||||||||||
Long Futures | ||||||||||||||||||||
| Description | Expiration Date | Number of Contracts | Notional Amount | Value and Unrealized Appreciation/ (Depreciation) | ||||||||||||||||
U.S. Treasury 10-year Note March Futures (U.S. Dollar) | 3/22/23 | 46 | $ | 5,165,656 | $ | (51,648) | ||||||||||||||
|
| |||||||||||||||||||
Total Net Futures Contracts | $ | 43,981 | ||||||||||||||||||
|
| |||||||||||||||||||
See accompanying notes to the financial statements.
4
AZL MVP FIAM Multi-Strategy Fund
Statement of Assets and Liabilities December 31, 2022 | ||
Assets: | |||||
Investments in affiliates, at cost | $ | 171,741,737 | |||
|
| ||||
Investments in affiliates, at value | $ | 173,726,137 | |||
Deposit at broker for futures contracts collateral | 8,690,813 | ||||
Interest and dividends receivable | 24,241 | ||||
Receivable for capital shares issued | 1,680 | ||||
Receivable for affiliated investments sold | 13,538 | ||||
Prepaid expenses | 1,721 | ||||
|
| ||||
Total Assets | 182,458,130 | ||||
|
| ||||
Liabilities: | |||||
Cash overdraft | 13,537 | ||||
Payable for capital shares redeemed | 29,828 | ||||
Payable for variation margin on futures contracts | 3,354 | ||||
Management fees payable | 13,868 | ||||
Administration fees payable | 7,449 | ||||
Custodian fees payable | 413 | ||||
Administrative and compliance services fees payable | 431 | ||||
Transfer agent fees payable | 641 | ||||
Trustee fees payable | 1,077 | ||||
Other accrued liabilities | 4,927 | ||||
Total Liabilities | 75,525 | ||||
|
| ||||
Net Assets | $ | 182,382,605 | |||
|
| ||||
Net Assets Consist of: | |||||
Paid in capital | $ | 187,407,407 | |||
Total distributable earnings | (5,024,802 | ) | |||
|
| ||||
Net Assets | $ | 182,382,605 | |||
|
| ||||
Shares of beneficial interest (unlimited number of shares authorized, no par value) | 16,537,859 | ||||
Net Asset Value (offering and redemption price per share) | $ | 11.03 | |||
|
|
For the Year Ended December 31, 2022 |
Investment Income: | |||||
Dividends from affiliates | $ | 1,815,835 | |||
Interest | 137,053 | ||||
Dividends from non-affiliates | 68 | ||||
|
| ||||
Total Investment Income | 1,952,956 | ||||
|
| ||||
Expenses: | |||||
Management fees | 203,981 | ||||
Administration fees | 66,022 | ||||
Custodian fees | 2,431 | ||||
Administrative and compliance services fees | 2,915 | ||||
Transfer agent fees | 5,646 | ||||
Trustee fees | 11,686 | ||||
Professional fees | 9,814 | ||||
Shareholder reports | 7,299 | ||||
Other expenses | 3,037 | ||||
|
| ||||
Total expenses before reductions | 312,831 | ||||
Less expense contractually waived/reimbursed by the Manager | (7,061 | ) | |||
|
| ||||
Net expenses | 305,770 | ||||
|
| ||||
Net Investment Income/(Loss) | 1,647,186 | ||||
|
| ||||
Net realized and Change in net unrealized gains/losses on investments: | |||||
Net realized gains/(losses) on affiliated underlying funds | 652,379 | ||||
Net realized gains distributions from affiliated underlying funds | 12,757,152 | ||||
Net realized gains/(losses) on futures contracts | 235,299 | ||||
Change in net unrealized appreciation/depreciation on affiliated underlying funds | (47,594,466 | ) | |||
Change in net unrealized appreciation/depreciation on futures contracts | (107,108 | ) | |||
|
| ||||
Net realized and Change in net unrealized gains/losses on investments | (34,056,744) | ||||
|
| ||||
Change in Net Assets Resulting From Operations | $ | (32,409,558 | ) | ||
|
|
See accompanying notes to the financial statements.
5
AZL MVP FIAM Multi-Strategy Fund
Statements of Changes in Net Assets
For the Year Ended | For the Year Ended | |||||||||
Change In Net Assets: | ||||||||||
Operations: | ||||||||||
Net investment income/(loss) | $ 1,647,186 | $ 881,696 | ||||||||
Net realized gains/(losses) on investments | 13,644,830 | 9,228,087 | ||||||||
Change in unrealized appreciation/depreciation on investments | (47,701,574 | ) | 16,675,005 | |||||||
|
|
|
| |||||||
Change in net assets resulting from operations | (32,409,558 | ) | 26,784,788 | |||||||
|
|
|
| |||||||
Distributions to Shareholders: | ||||||||||
Distributions | (10,283,765 | ) | (15,134,637 | ) | ||||||
|
|
|
| |||||||
Change in net assets resulting from distributions to shareholders | (10,283,765 | ) | (15,134,637 | ) | ||||||
|
|
|
| |||||||
Capital Transactions: | ||||||||||
Proceeds from shares issued | 1,666,236 | 4,587,179 | ||||||||
Proceeds from dividends reinvested | 10,283,765 | 15,134,637 | ||||||||
Value of shares redeemed | (30,662,612 | ) | (42,501,630 | ) | ||||||
|
|
|
| |||||||
Change in net assets resulting from capital transactions | (18,712,611 | ) | (22,779,814 | ) | ||||||
|
|
|
| |||||||
Change in net assets | (61,405,934 | ) | (11,129,663 | ) | ||||||
Net Assets: | ||||||||||
Beginning of period | 243,788,539 | 254,918,202 | ||||||||
|
|
|
| |||||||
End of period | $ 182,382,605 | $ 243,788,539 | ||||||||
|
|
|
| |||||||
Share Transactions: | ||||||||||
Shares issued | 138,834 | 337,882 | ||||||||
Dividends reinvested | 946,940 | 1,160,632 | ||||||||
Shares redeemed | (2,537,378 | ) | (3,113,533 | ) | ||||||
|
|
|
| |||||||
Change in shares | (1,451,604 | ) | (1,615,019 | ) | ||||||
|
|
|
| |||||||
See accompanying notes to the financial statements.
6
AZL MVP FIAM Multi-Strategy Fund
(Selected data for a share of beneficial interest outstanding throughout the periods indicated. Does not reflect fees or expenses associated with the separate accounts that invest in the Fund or in any variable annuity contracts or variable life insurance policy for which the Fund serves as an investment vehicle.)
| Year Ended December 31, 2022 | Year Ended December 31, 2021 | Year Ended December 31, 2020 | Year Ended December 31, 2019 | Year Ended December 31, 2018 | |||||||||||||||||||||
Net Asset Value, Beginning of Period | $13.55 | $13.00 | $12.47 | $11.17 | $11.81 | ||||||||||||||||||||
|
|
|
|
|
|
|
|
|
| ||||||||||||||||
Investment Activities: | |||||||||||||||||||||||||
Net Investment Income/(Loss) | 0.10 | (a) | 0.05 | (a) | 0.27 | (a) | 0.27 | (a) | 0.28 | ||||||||||||||||
Net Realized and Unrealized Gains/(Losses) on Investments | (1.98 | ) | 1.36 | 0.61 | 1.52 | (0.52 | ) | ||||||||||||||||||
|
|
|
|
|
|
|
|
|
| ||||||||||||||||
Total from Investment Activities | (1.88 | ) | 1.41 | 0.88 | 1.79 | (0.24 | ) | ||||||||||||||||||
|
|
|
|
|
|
|
|
|
| ||||||||||||||||
Distributions to Shareholders From: | |||||||||||||||||||||||||
Net Investment Income | (0.09 | ) | (0.36 | ) | (0.35 | ) | (0.49 | ) | (0.40 | ) | |||||||||||||||
Net Realized Gains | (0.55 | ) | (0.50 | ) | — | — | — | ||||||||||||||||||
|
|
|
|
|
|
|
|
|
| ||||||||||||||||
Total Dividends | (0.64 | ) | (0.86 | ) | (0.35 | ) | (0.49 | ) | (0.40 | ) | |||||||||||||||
|
|
|
|
|
|
|
|
|
| ||||||||||||||||
Net Asset Value, End of Period | $11.03 | $13.55 | $13.00 | $12.47 | $11.17 | ||||||||||||||||||||
|
|
|
|
|
|
|
|
|
| ||||||||||||||||
Total Return (b) | (13.81 | )% | 11.07 | % | 7.16 | % | 16.25 | % | (2.14 | )% | |||||||||||||||
Ratios to Average Net Assets/Supplemental Data: | |||||||||||||||||||||||||
Net Assets, End of Period (000’s) | $ | 182,383 | $ | 243,789 | $ | 254,918 | $ | 265,363 | $ | 245,936 | |||||||||||||||
Net Investment Income/(Loss) | 0.81 | % | 0.35 | % | 2.19 | % | 2.24 | % | 2.12 | % | |||||||||||||||
Expenses Before Reductions*(c) | 0.15 | % | 0.14 | % | 0.15 | % | 0.14 | % | 0.14 | % | |||||||||||||||
Expenses Net of Reductions* | 0.15 | % | 0.14 | % | 0.15 | % | 0.14 | % | 0.14 | % | |||||||||||||||
Portfolio Turnover Rate | 8 | % | 3 | % | 6 | % | 7 | % | 7 | % | |||||||||||||||
| * | The expense ratios exclude the impact of fees/expenses paid by each underlying fund. |
| (a) | Calculated using the average shares method. |
| (b) | The returns include reinvested dividends and fund level expenses, but exclude insurance contract charges. If these charges were included, the returns would have been lower. |
| (c) | Excludes fee reductions. If such fee reductions had not occurred, the ratios would have been as indicated. |
See accompanying notes to the financial statements.
7
AZL MVP FIAM Multi-Strategy Fund
Notes to the Financial Statements
December 31, 2022
1. Organization
The Allianz Variable Insurance Products Fund of Funds Trust (the “Trust”) was organized as a Delaware statutory trust on June 16, 2004. The Trust is an open-end management investment company registered under the Investment Company Act of 1940, as amended, (the “1940 Act”) and thus is determined to be an investment company, and follows the investment company accounting and reporting guidance under Financial Accounting Standards Board (“FASB”) Accounting Standards Codification (“ASC”) Topic 946 “Financial Services—Investment Companies”. The Trust consists of 12 separate investment portfolios (collectively, the “Funds”), of which one is included in this report, the AZL MVP FIAM Multi-Strategy Fund (the “Fund”), and 11 are presented in separate reports. The Fund is a diversified series of the Trust.
The Fund is a “fund of funds”, which means that the Fund invests primarily in other mutual funds (the “Underlying Funds”). Underlying Funds invest in stocks, bonds, and other securities and reflect varying amounts of potential investment risk and reward. The Underlying Funds record their investments at fair value. Periodically, the Fund will adjust its asset allocation as it seeks to achieve its investment objective.
The Trust is authorized to issue an unlimited number of shares of the Fund without par value. Shares of the Fund are available through the variable annuity contracts offered through the separate accounts of participating insurance companies. Currently, the Fund only offers its shares to separate accounts of Allianz Life Insurance Company of North America and Allianz Life Insurance Company of New York, affiliates of the Trust and the Manager, as defined below.
Under the Trust’s organizational documents, its officers and trustees are indemnified against certain liabilities arising out of the performance of their duties to the Fund. In addition, in the normal course of business, the Fund may enter into contracts with its vendors and others that provide for general indemnifications. The Fund’s maximum exposure under these arrangements is unknown, as this would involve future claims that may be made against the Fund. However, based on experience, the Fund expects that risk of loss to be remote.
On December 13, 2022, the Board unanimously approved a reorganization whereby the Fund will acquire all of the assets and liabilities of the AZL MVP Fusion Conservative Fund and costs related to the reorganization will be paid by the Manager.
2. Significant Accounting Policies
The following is a summary of significant accounting policies followed by the Fund in the preparation of its financial statements. The policies conform with U.S. generally accepted accounting principles (“U.S. GAAP”). The preparation of financial statements requires management to make certain estimates and assumptions that affect the reported amounts of assets and liabilities and disclosure of contingent assets and liabilities at the date of the financial statements and the reported amounts of increases and decreases in net assets from operations during the reporting period. Actual results could differ from those estimates.
Security Valuation
The Fund records its investments at fair value. Fair value is defined as the price that would be received to sell an asset or paid to transfer a liability in an orderly transaction between willing market participants at the measurement date. The valuation techniques used to determine fair value are further described in Note 4 below.
Investment Transactions and Investment Income
Investment transactions are accounted for on trade date. Net realized gains and losses on investments sold and on foreign currency transactions are recorded on the basis of identified cost. Interest income is recorded on the accrual basis and includes, where applicable, the amortization of premiums or accretion of discounts. Dividend income is recorded on the ex-dividend date except in the case of foreign securities, in which case dividends are recorded as soon as such information becomes available.
Distributions to Shareholders
Distributions to shareholders are recorded on the ex-dividend date. The Fund distributes its dividends from net investment income and net realized capital gains, if any, on an annual basis. The amount of distributions from net investment income and from net realized gains is determined in accordance with federal income tax regulations, which may differ from U.S. GAAP. These “book/tax” differences are either temporary or permanent in nature. To the extent these differences are permanent in nature (e.g., return of capital, net operating loss, reclassification of certain market discounts, gain/loss, paydowns, and distributions), such amounts are reclassified within the composition of net assets based on their federal tax-basis treatment; temporary differences (e.g., wash sales and differing treatment on certain investments) do not require reclassification. Distributions to shareholders that exceed net investment income and net realized gains for tax purposes are reported as distributions of capital.
Expense Allocation
Expenses directly attributable to the Fund are charged directly to the Fund, while expenses attributable to more than one Fund are allocated among the respective Funds based upon relative net assets or some other reasonable method. Expenses which are attributable to more than one Trust are allocated across the Allianz Variable Insurance Products Trust, Allianz Variable Insurance Products Fund of Funds Trust and AIM ETF Products Trust based upon relative net assets or another reasonable basis. Allianz Investment Management LLC (the “Manager”), serves as the investment manager for the Trust, Allianz Variable Insurance Products Trust and AIM ETF Products Trust.
This report does not reflect fees or expenses associated with the separate accounts that invest in the Fund or in any variable annuity contracts or variable life insurance policy for which the Fund serves as an investment vehicle.
Affiliated Securities Transactions
Pursuant to Rule 17a-7 under the 1940 Act, the Fund may engage in securities transactions with affiliated investment companies and advisory accounts managed by the Manager. Any such purchase or sale transaction must be effected without a brokerage commission or other remuneration, except for customary transfer fees. The transaction must be effected at the current market price, which is either the security’s last sale price on an exchange or, if there are no transactions in the security that day, at the average of the highest bid and lowest asked price. During the year ended December 31, 2022, the Fund did not engage in any Rule 17a-7 transactions.
8
AZL MVP FIAM Multi-Strategy Fund
Notes to the Financial Statements
December 31, 2022
Derivative Instruments
All open derivative positions at period end are reflected on the Fund’s Schedule of Portfolio Investments. The following is a description of the derivative instruments utilized by the Fund, including the primary underlying risk exposures related to each instrument type. The Fund’s allocation to the MVP (Managed Volatility Portfolio) risk management process may include (a) derivatives such as index futures, other futures contracts, options, and other similar securities and (b) cash, money market equivalents, short-term debt instruments, money market funds, and short-term debt funds to satisfy all applicable margin requirements and to provide additional portfolio liquidity to satisfy large redemptions and any margin calls. Due to the leverage provided by derivatives, the notional value of the Fund’s derivative positions could exceed 20% of the Fund’s value. The Fund may also use futures to gain equity exposure and may hold cash as a buffer in the event of market shocks.
Futures Contracts
During the year ended December 31, 2022, the Fund invested in futures contracts to reduce volatility and limit the need to decrease or increase allocations to underlying funds. Futures contracts are valued based upon their quoted daily settlement prices. Upon entering into a futures contract, the Fund is required to segregate liquid assets in accordance with the initial margin requirements of the broker or exchange. Futures contracts are marked to market daily and a payable or receivable for the change in value (“variation margin”), if any, is recorded by the Fund. Gains or losses are recognized but not considered realized until the contracts expire or are closed. Futures contracts involve, to varying degrees, elements of market risk (generally equity price risk related to stock futures, interest rate risk related to bond futures, and foreign currency risk related to currency futures) and exposure to loss in excess of the variation margin disclosed in the Statement of Assets and Liabilities. The primary risks associated with the use of futures contracts are the imperfect correlation between the change in value of the underlying securities and the prices of futures contracts, the possibility of an illiquid market, and the inability of the counterparty to meet the terms of the contract. For the year ended December 31, 2022, the monthly average notional amount for long contracts was $6.1 million, and the monthly average notional amount for short contracts was $21.8 million. Realized gains and losses are reported as “Net realized gains/(losses) on futures contracts” on the Statement of Operations.
Summary of Derivative Instruments
The following is a summary of the values of derivative instruments on the Fund’s Statement of Assets and Liabilities, categorized by risk exposure, as of December 31, 2022:
Asset Derivatives | Liability Derivatives | |||||||||||
| Primary Risk Exposure | Statement of Assets and Liabilities Location | Total Value | Statement of Assets and Liabilities Location | Total Value | ||||||||
Equity Risk | ||||||||||||
| Futures Contracts | Receivable for variation margin on futures contracts* | $95,629 | Payable for variation margin on futures contracts* | $— | ||||||||
Interest Rate Risk | ||||||||||||
| Futures Contracts | Receivable for variation margin on futures contracts* | — | Payable for variation margin on futures contracts* | 51,648 | ||||||||
| * | For futures contracts, the amounts represent the cumulative appreciation/depreciation of these futures contracts as reported in the Schedule of Portfolio Investments. Only the current day’s variation margin is reported within the Statement of Assets and Liabilities as variation margin on futures contracts. |
The following is a summary of the effect of derivative instruments on the Statement of Operations, categorized by risk exposure, for the year ended December 31, 2022:
| Primary Risk Exposure | Location of Gains/(Losses) on Derivatives Recognized | Realized Gains/(Losses) on Derivatives Recognized | Change in Net Unrealized on Derivatives Recognized | |||||||
Equity Risk | ||||||||||
| Futures Contracts | Net realized gains/(losses) on futures contracts/ Change in net unrealized appreciation/ depreciation on futures contracts | $949,716 | $21,907 | |||||||
Interest Rate Risk | ||||||||||
| Futures Contracts | Net realized gains/(losses) on futures contracts/ Change in net unrealized appreciation/ depreciation on futures contracts | (714,417 | ) | (129,015 | ) | |||||
3. Fees and Transactions with Affiliates and Other Parties
The Manager provides investment advisory and management services for the Fund. The Manager has contractually agreed to waive fees and reimburse the Fund to limit the annual expenses, excluding interest expense (e.g., cash overdraft fees), taxes, brokerage commissions, acquired fund fees and expenses, other expenditures that are capitalized in accordance with U.S. GAAP and other extraordinary expenses not incurred in the ordinary course of the Fund’s business, based on the daily net assets of the Fund, through April 30, 2024. Expenses incurred for investment advisory and management services are reflected on the Statement of Operations as “Management fees.”
For the year ended December 31, 2022, the annual rate due to the Manager and the annual expense limit were as follows:
| Annual Rate | Annual Expense Limit | |||||||||
AZL MVP FIAM Multi-Strategy Fund | 0.10% | 0.15% | ||||||||
Any amounts contractually waived or reimbursed by the Manager with respect to the annual expense limit in a particular fiscal year will be subject to repayment by the Fund to the Manager to the extent that from time to time through the next three fiscal years the repayment will not cause the Fund’s expenses to exceed the lesser of the stated limit at the time of the waiver or the current stated limit. Any amounts recouped by the Manager during the period are reflected on the Statement of Operations as “Recoupment of prior expenses reimbursed by the Manager.”
At December 31, 2022, the contractual reimbursements subject to repayment by the Fund in subsequent years were as follows:
9
AZL MVP FIAM Multi-Strategy Fund
Notes to the Financial Statements
December 31, 2022
| Expires 12/31/2025 | Total | |||||||||
AZL MVP FIAM Multi-Strategy Fund | $7,061 | $7,061 | ||||||||
Management fees, which the Manager may waive in order to maintain more competitive expense ratios, are not subject to repayment in subsequent years. Information on the total amount waived/ reimbursed by the Manager or repaid to the Manager by the Fund during the period can be found on the Statement of Operations, as applicable. During the year ended December 31, 2022, there were no such waivers.
The Manager or an affiliate of the Manager serves as the investment adviser of certain underlying funds in which the Fund invests. At December 31, 2022, these underlying funds are noted as Affiliated Investment Companies in the Fund’s Schedule of Portfolio Investments. Additional information, including financial statements, about these Funds is available at www.allianzlife.com. The Manager or an affiliate of the Manager is paid a separate fee from the underlying funds for such services. A summary of the Fund’s investments in affiliated investment companies for the year ended December 31, 2022 is as follows:
| Value 12/31/21 | Purchases at Cost | Proceeds from Sales | Net Realized Gains (Losses) | Change in Net Unrealized Appreciation (Depreciation) | Value 12/31/22 | Shares as of | Dividend Income | Net Realized Gains Distributions from Affiliated Underlying Funds | ||||||||||||||||||||||||||||
AZL Fidelity Institutional Asset Management Multi-Strategy Fund | $ | 231,703,402 | $ | 15,035,283 | $ | (26,070,461) | $ | 652,379 | $ | (47,594,466) | $ | 173,726,137 | 14,021,480 | $ | 1,815,835 | $ | 12,757,152 | |||||||||||||||||||
Pursuant to separate agreements between the Trust and the Manager, the Manager provides a Chief Compliance Officer (“CCO”) and certain compliance oversight and regulatory filing services to the Trust. Under these agreements, the Manager is entitled to an amount equal to a portion of the compensation and certain other expenses related to the individuals performing the CCO and compliance oversight services, as well as $100 per hour for time incurred in connection with the preparation and filing of certain documents with the SEC. The fees are paid to the Manager on a quarterly basis. The total expenses incurred by the Fund for these services are reflected on the Statement of Operations as “Administrative and compliance services fees.”
Citi Fund Services Ohio, Inc. (“Citi” or the “Administrator”), a wholly owned subsidiary of Citigroup, Inc., with which an officer of the Trust is affiliated, serves as the Trust’s administrator and fund accountant, and assists the Trust in all aspects of its administration and operation. The Administrator is entitled to a fee, accrued daily and paid monthly. The Administrator is entitled to an annual fee for each additional class of shares of any Fund, certain annual fees in supporting fair value services, and a Trust-wide annual fee for providing infrastructure and support in implementing the written policies and procedures comprising the Fund’s compliance program. The Administrator is also reimbursed for certain expenses incurred. The total expenses incurred by the Fund for these services are reflected on the Statement of Operations as “Administration fees.”
FIS Investor Services LLC (“FIS”) serves as the Fund’s transfer agent. Under the Transfer Agent Agreement, the Trust pays FIS a fee for its services and reimburses FIS for all of their reasonable out-of-pocket expenses incurred in providing these services.
The Bank of New York Mellon (“BNY Mellon” or the “Custodian”) serves as the Trust’s custodian. For these services as custodian, the Funds pay BNY Mellon a fee based on a percentage of assets held on behalf of the Funds, plus certain out-of-pocket charges.
Allianz Life Financial Services, LLC (“ALFS”), an affiliate of the Manager, serves as distributor of the Fund. ALFS receives an annual Trust-wide annual fee of $7,500, paid by the Manager from its profits and not by the Trust, for recordkeeping and reporting services.
Certain Officers and Trustees of the Trust are affiliated with the Manager or the Administrator. Such Officers (except for the Trust’s CCO as noted above) and Trustees receive no compensation from the Trust for serving in their respective roles.
4. Investment Valuation Summary
The valuation techniques employed by the Fund, as described below, maximize the use of observable inputs and minimize the use of unobservable inputs in determining fair value. The inputs used for valuing the Fund’s investments are summarized in the three broad levels listed below:
| ● Level 1 - | quoted prices in active markets for identical assets |
| ● Level 2 - | other significant observable inputs (including quoted prices for similar securities, interest rates, prepayments speeds, credit risk, etc.) |
| ● Level 3 - | significant unobservable inputs (including the Fund’s own assumptions in determining the fair value of investments) |
Changes in valuation techniques may result in transfers in or out of an assigned level within the disclosure hierarchy. The inputs or methodology used for valuing investments is not necessarily an indication of the risk associated with investing in those investments.
Investments in other investment companies are valued at their published net asset value (“NAV”). Security prices are determined pursuant to valuation procedures approved by the Trust’s Board of Trustees (the “Board” or “Trustees”) as of the close of the New York Stock Exchange (“NYSE”) (generally 4:00 pm Eastern Time). The investments utilizing Level 1 valuations represent investments in open-end investment companies. Futures contracts are valued at the settlement prices established each day on the primary exchange and are typically categorized as Level 1 in the fair value hierarchy.
The Board has designated the Manager to perform the Fund’s fair value determinations in accordance with valuation procedures approved by the Board. The effect of using fair value pricing is that the Fund’s NAV will be subject to the judgement of the Manager. The Manager’s fair valuation process is subject to the oversight of the Board.
The following is a summary of the valuation inputs used as of December 31, 2022 in valuing the Fund’s investments based upon the three levels defined above:
10
AZL MVP FIAM Multi-Strategy Fund
Notes to the Financial Statements
December 31, 2022
Investment Securities: | Level 1 | Level 2 | Level 3 | Total | ||||||||||||||||
Affiliated Investment Company | $173,726,137 | $— | $— | $173,726,137 | ||||||||||||||||
|
|
|
|
|
|
|
| |||||||||||||
Total Investment Securities | 173,726,137 | — | — | 173,726,137 | ||||||||||||||||
|
|
|
|
|
|
|
| |||||||||||||
Other Financial Instruments:* | ||||||||||||||||||||
Futures Contracts | 43,981 | — | — | 43,981 | ||||||||||||||||
|
|
|
|
|
|
|
| |||||||||||||
Total Investments | $173,770,118 | $— | $— | $173,770,118 | ||||||||||||||||
|
|
|
|
|
|
|
| |||||||||||||
| * | Other Financial Instruments would include any derivative instruments, such as futures contracts. These investments are generally presented in the financial statements as variation margin. |
5. Security Purchases and Sales
For the year ended December 31, 2022, cost of purchases and proceeds from sales of securities (excluding securities maturing less than one year from acquisition) were as follows:
| Purchases | Sales | |||||||||
AZL MVP FIAM Multi-Strategy Fund | $ | 15,035,283 | $ | 26,070,461 | ||||||
6. Investment Risks
The risks below are presented in an order intended to facilitate readability. Their order does not imply that the realization of one risk is more likely to occur more frequently than another risk, nor does it imply that the realization of one risk is likely to have a greater adverse impact than another risk. The Fund may be subject to other risks in addition to these identified risks. This section discusses certain common principal risks encountered by the Fund.
Derivatives Risk: The Fund may invest directly or through affiliated or unaffiliated mutual funds or unregistered investment pools in derivative instruments such as futures, options, and options on futures. A derivative is a financial contract whose value depends on, or is derived from, the value of an underlying asset, reference rate, or risk. Use of derivative instruments involves risks different from, or possibly greater than, the risks associated with investing directly in securities and other traditional investments. Derivatives are subject to a number of other risks, such as liquidity risk, interest rate risk, market risk, credit risk, and selection risk. Derivatives also involve the risk of mispricing or improper valuation and the risk that changes in the value may not correlate perfectly with the underlying asset, rate, or index. Using derivatives may result in losses, possibly in excess of the principal amount invested. Also, suitable derivative transactions may not be available in all circumstances. The other party to a derivatives contract could default.
Foreign Securities Risk: Investing in the securities of non-U.S. issuers involves a number of risks, such as fluctuations in currency values, adverse political, social or economic developments, and differences in social and economic developments or policies. Such risks include future political and economic developments, and the possible imposition of exchange controls or other foreign governmental laws and restrictions. In addition, with respect to certain countries, there is the possibility of expropriation of assets, confiscatory taxation, political or social instability or diplomatic developments which could adversely affect investments in those securities. Certain foreign companies may be subject to sanctions, embargoes, or other governmental actions that may impair or otherwise limit the ability to invest in, receive, hold or sell the securities of such companies.
Fund of Fund Risk: The Fund, as a shareholder of the underlying funds, indirectly bears its proportionate share of any investment management fees and other expenses of the underlying funds. Further due to the fees and expenses paid by the Fund, as well as small variations in the Fund’s actual allocations to the underlying funds and any futures and cash held in the Fund’s portfolio, the performance and income distributions of the Fund will not be the same as the performance and income distributions of the underlying funds. In addition, the Fund maintains indirect exposure to various types of risk which may exist in the underlying Funds, such as foreign securities risk, fixed income securities risk and other risks.
Interest Rate Risk: Debt securities held by an underlying fund may decline in value due to rising interest rates. The price of a bond is also affected by its maturity. Bonds with longer maturities generally have greater sensitivity to changes in interest rates.
Market Risk: The market price of securities owned by the underlying funds may go up or down, sometimes rapidly and unpredictably. Securities may decline in value due to factors affecting securities markets generally or particular industries represented in the securities markets. The value of a security may decline due to general market conditions that are not specifically related to a particular company, such as real or perceived adverse economic conditions, changes in the general outlook for corporate earnings, changes in interest or currency rates, or adverse investor sentiment, as well as natural disasters, and outbreaks of infectious illnesses or other widespread public health issues.
Quantitative Investing Risk: The value of securities selected using quantitative analysis can react differently to issuer, political, market, and economic developments than the market as a whole or securities selected using only fundamental analysis. The factors used in quantitative analysis and the weight placed on those factors may not be predictive of a security’s value. In addition, factors that affect a security’s value can change over time and these changes may not be reflected in the quantitative model. A quantitative model can be adversely affected by errors or imperfections in the factors or the data on which evaluations are based, or by technical issues with construction or implementation of the model, which in any case may result in a failure of the portfolio to perform as expected or a failure to identify securities that will perform well in the future.
7. Coronavirus (COVID-19) Pandemic
The global outbreak of the COVID-19 strain of the coronavirus has caused adverse effects on many companies, sectors, nations, regions and the markets in general, and may continue for an unpredictable duration. The effects of this pandemic may adversely impact the value and performance of the Fund, its ability to buy and sell fund investments at appropriate valuations, and its ability to achieve its investment objective(s).
11
AZL MVP FIAM Multi-Strategy Fund
Notes to the Financial Statements
December 31, 2022
8. Federal Tax Information
It is the policy of the Fund to continue to qualify as a regulated investment company by complying with the provisions available to certain investment companies, as defined under Subchapter M of the Internal Revenue Code, and to make distributions of net investment income and net realized gains sufficient to relieve it from all, or substantially all, federal income taxes. Accordingly, no provisions for federal income taxes are required in the financial statements.
Management of the Fund has reviewed tax positions taken in tax years that remain subject to examination by all major tax jurisdictions, including federal (i.e., the last four tax year ends and the interim tax period since then, as applicable). Management believes that there is no tax liability resulting from unrecognized tax benefits related to uncertain tax positions taken.
Cost of securities, including derivatives and short positions as applicable, for federal income tax purposes at December 31, 2022 is $175,314,634. The gross unrealized appreciation/ (depreciation) on a tax basis is as follows:
Unrealized appreciation | $– | ||||
Unrealized (depreciation) | (1,588,497) | ||||
|
| ||||
Net unrealized appreciation/(depreciation) | $(1,588,497) | ||||
|
|
As of the end of its tax year ended December 31, 2022, the Fund had capital loss carry forwards (“CLCFs”) as summarized in the table below. The Board does not intend to authorize a distribution of any realized gain for the Fund until any applicable CLCF has been offset.
CLCFs not subject to expiration:
| Short-Term Amount | Long-Term Amount | Total | |||||||||||||
AZL MVP FIAM Multi-Strategy Fund | $4,411,253 | $– | $4,411,253 | ||||||||||||
The tax character of dividends paid to shareholders during the year ended December 31, 2022 was as follows:
| Ordinary Income | Net Long-Term | Total Distributions(a) | |||||||||||||
AZL MVP FIAM Multi-Strategy Fund | $7,184,253 | $3,099,512 | $10,283,765 | ||||||||||||
| (a) | Total distributions paid may differ from the Statements of Changes in Net Assets because dividends are recognized when actually paid for tax purposes. |
The tax character of dividends paid to shareholders during the year ended December 31, 2021 was as follows:
| Ordinary Income | Net Long-Term | Total Distributions(a) | |||||||||||||
AZL MVP FIAM Multi-Strategy Fund | $6,339,708 | $8,794,929 | $15,134,637 | ||||||||||||
| (a) | Total distributions paid may differ from the Statements of Changes in Net Assets because dividends are recognized when actually paid for tax purposes. |
At December 31, 2022, the components of accumulated earnings on a tax basis were as follows:
| Undistributed Ordinary Income | Undistributed Long-Term Capital Gains | Accumulated Capital and Other Losses | Unrealized Appreciation/ Depreciation(a) | Total Accumulated Earnings/ (Deficit) | |||||||||||||||||||||
AZL MVP FIAM Multi-Strategy Fund | $4,941,176 | $— | $ | (4,411,253) | $ | (1,588,497) | $ | (1,058,574) | |||||||||||||||||
| (a) | The differences between book-basis and tax-basis unrealized appreciation/(depreciation) is attributable primarily to tax deferral of losses on wash sales mark-to-market of futures contracts and straddles. |
9. Ownership and Principal Holders
The beneficial ownership, either directly or indirectly, of more than 25% of the voting securities of a fund creates presumptions of control of the fund, under section 2 (a)(9) of the 1940 Act. As of December 31, 2022, the Fund had an individual shareholder account which is affiliated with the Manager representing ownership in excess of 85% of the Fund. Investment activities of this shareholder could have a material impact to the Fund.
10. Subsequent Events
Management of the Fund has evaluated the need for additional disclosures or adjustments resulting from events through the date the financial statements were issued. Based on this evaluation, there were no subsequent events to report that would have material impact on the Fund’s financial statements, except as noted below.
12
AZL MVP FIAM Multi-Strategy Fund
Notes to the Financial Statements
December 31, 2022
The reorganization, as discussed in Note 1, whereby the Fund will acquire all of the assets and liabilities of the AZL MVP Fusion Conservative Fund, is expected to be completed on or about March 10, 2023.
13
REPORT OF INDEPENDENT REGISTERED PUBLIC ACCOUNTING FIRM
To the Board of Trustees of Allianz Variable Insurance Products Fund of Funds Trust and Shareholders of
AZL MVP Fidelity Institutional Asset Management Multi-Strategy Fund
Opinion on the Financial Statements
We have audited the accompanying statement of assets and liabilities, including the schedule of portfolio investments, of AZL MVP Fidelity Institutional Asset Management Multi-Strategy Fund (one of the funds constituting Allianz Variable Insurance Products Fund of Funds Trust, referred to hereafter as the “Fund”) as of December 31, 2022, the related statement of operations for the year ended December 31, 2022, the statements of changes in net assets for each of the two years in the period ended December 31, 2022, including the related notes, and the financial highlights for each of the five years in the period ended December 31, 2022 (collectively referred to as the “financial statements”). In our opinion, the financial statements present fairly, in all material respects, the financial position of the Fund as of December 31, 2022, the results of its operations for the year then ended, the changes in its net assets for each of the two years in the period ended December 31, 2022 and the financial highlights for each of the five years in the period ended December 31, 2022 in conformity with accounting principles generally accepted in the United States of America.
Basis for Opinion
These financial statements are the responsibility of the Fund’s management. Our responsibility is to express an opinion on the Fund’s financial statements based on our audits. We are a public accounting firm registered with the Public Company Accounting Oversight Board (United States) (PCAOB) and are required to be independent with respect to the Fund in accordance with the U.S. federal securities laws and the applicable rules and regulations of the Securities and Exchange Commission and the PCAOB.
We conducted our audits of these financial statements in accordance with the standards of the PCAOB. Those standards require that we plan and perform the audit to obtain reasonable assurance about whether the financial statements are free of material misstatement, whether due to error or fraud.
Our audits included performing procedures to assess the risks of material misstatement of the financial statements, whether due to error or fraud, and performing procedures that respond to those risks. Such procedures included examining, on a test basis, evidence regarding the amounts and disclosures in the financial statements. Our audits also included evaluating the accounting principles used and significant estimates made by management, as well as evaluating the overall presentation of the financial statements. Our procedures included confirmation of securities owned as of December 31, 2022 by correspondence with the transfer agent and brokers. We believe that our audits provide a reasonable basis for our opinion.
/s/ PricewaterhouseCoopers LLP
New York, New York
February 23, 2023
We have served as the auditor of one or more investment companies in the Allianz Variable Insurance Products complex since 2018.
14
Other Federal Income Tax Information (Unaudited)
For the year ended December 31, 2022, 3.76% of the total ordinary income dividends paid by the Fund qualify for the corporate dividends received deductions available to corporate shareholders.
During the year ended December 31, 2022, the Fund declared net short-term capital gain distributions of $5,782,865.
During the year ended December 31, 2022, the Fund declared net long-term capital gain distributions of $3,099,512.
15
A description of the policies and procedures that the Fund uses to determine how to vote proxies relating to portfolio securities is available, without charge, upon request, by visiting the Securities and Exchange Commission’s (‘‘Commission’’) website at www.sec.gov, or by calling 800-624-0197.
Information regarding how the Fund voted proxies relating to portfolio securities during the most recent 12-month period ended June 30th is available (i) without charge, upon request, by calling 800-624-0197; (ii) on the Trust’s website at https://www.allianzlife.com; and (iii) on the Commission’s website at http://www.sec.gov.
The Fund files complete Schedules of Portfolio Holdings with the Commission for the first and third quarters of each fiscal year on Form N-PORT. Schedules of Portfolio Holdings for the Fund are available without charge on the Commission’s website at http://www.sec.gov, or may be obtained by calling 800-624-0197.
16
Approval of Investment Advisory Agreement (Unaudited)
Subject to the general supervision of the Board of Trustees (the “Board”) and in accordance with the investment objectives and restrictions of each separate series (each a “Fund,” together, the “Funds”) of the Allianz Variable Insurance Products Fund of Funds Trust (the “Trust”), investment advisory services are provided to the Funds by Allianz Investment Management LLC (the “Manager”). The Manager manages each Fund pursuant to an investment management agreement (the “Management Agreement”) with the Trust in respect of each such Fund. The Management Agreement provides that the Manager, subject to the supervision and approval of the Board, is responsible for the management of each Fund. For management services, each Fund pays the Manager an investment advisory fee based upon each Fund’s average daily net assets. The Manager has contractually agreed to limit the expenses of each Fund by reimbursing the Fund if and when total Fund operating expenses exceed certain amounts until at least April 30, 2024 (the “Expense Limitation Agreement”).
In reviewing the services provided by the Manager and the terms of the Management Agreement, the Board receives and reviews information related to the Manager’s experience and expertise in the variable insurance marketplace. In addition, the Board receives information regarding the Manager’s expertise with regard to portfolio diversification and asset allocation requirements within variable insurance products issued by Allianz Life Insurance Company of North America (“Allianz Life”) and its subsidiary, Allianz Life Insurance Company of New York (“Allianz of New York”). Currently, the Funds are offered only through Allianz Life and Allianz of New York variable products, and not in the retail fund market.
As required by the Investment Company Act of 1940 (the “1940 Act”), the Board has reviewed and approved the Management Agreement with the Manager. The Board’s decision to approve this contract reflects the exercise of its business judgment on whether to approve new arrangements and continue the existing arrangements. During its review of the contract, the Board considered many factors, among the most material of which are: the Fund’s investment objectives and long-term performance; the Manager’s management philosophy, personnel, processes and investment performance, including its compliance history and the adequacy of its compliance processes; the preferences and expectations of Fund shareholders (and underlying contract owners) and their relative sophistication; the continuing state of competition in the mutual fund industry; and comparable fees in the mutual fund industry.
The Board also considered the compensation and benefits received by the Manager. This includes fees received for services provided to a Fund by employees of the Manager or of affiliates of the Manager and research services received by the Manager from brokers that execute Fund trades, as well as advisory fees. The Board considered the fact that: (1) the Manager and the Trust are parties to an Administrative Services Agreement and a Compliance Services Agreement, under which the Manager is compensated by the Trust for performing certain administrative and compliance services including providing an employee of the Manager or one of its affiliates to act as the Trust’s Chief Compliance Officer; and (2) Allianz Life Financial Services, LLC, an affiliated person of the Manager, is a registered securities broker-dealer and received (along with its affiliated persons) payments made by the underlying funds pursuant to Rule 12b-1.
The Board is aware that various courts have interpreted provisions of the 1940 Act and have indicated in their decisions that the following factors may be relevant to an adviser’s compensation: the nature, extent and quality of the services provided by the adviser, including the performance of the fund; the adviser’s cost of providing the services; the extent to which the adviser may realize “economies of scale” as the fund grows larger; any indirect benefits that may accrue to the adviser and its affiliates as a result of the adviser’s relationship with the fund; performance and expenses of comparable funds; the profitability of acting as adviser to the fund; and the extent to which the independent Board members, who are not “interested persons” of a fund as defined by the 1940 Act (“Independent Trustees”), are fully informed about all facts bearing on the adviser’s services and fees. The Board is aware of these factors and takes them into account in its review of the Management Agreement for the Funds.
Each member of the Board considered and weighed these factors in light of his or her experience in governing the Trust. The Board is assisted in its deliberations by the advice of independent legal counsel to the Independent Trustees (“Independent Trustee Counsel”). In this regard, the Board requests and receives a significant amount of information about the Funds and the Manager. Some of this information is provided at each regular meeting of the Board; additional information is provided in connection with the particular meetings at which the Board’s formal review of the Management Agreement occurs. In between regularly scheduled meetings, the Board may receive information on particular matters as the need arises. Thus, the Board’s evaluation of the Management Agreement is informed by reports covering such matters as: the Manager’s investment philosophy, personnel and processes, and the Fund’s investment performance (in absolute terms as well as in relationship to its benchmark and certain competitor or “peer group” funds). In connection with comparing the performance of each Fund versus its benchmark, the Board receives reports on the extent to which the Fund’s performance may be attributed to various applicable factors, such as asset class allocation decisions and volatility management strategies, if applicable, the performance of the underlying funds, rebalancing decisions, and the impact of cash positions and Fund fees and expenses. The Board also receives reports on the Funds’ expenses (including the advisory fee itself and the overall expense structure of the Funds, both in absolute terms and relative to peer group and/or competing funds, with due regard for the Expense Limitation Agreement and additional voluntary expense limitations); the use and allocation of any brokerage commissions derived from trading the Funds’ portfolio securities; the nature, extent and quality of the advisory and other services provided to the Fund by the Manager and its affiliates; compliance and audit reports concerning the Funds and the companies that service them; and relevant developments in the mutual fund industry and how the Funds and/or the Manager are responding to them.
The Board also receives financial information about the Manager, including reports on the compensation and benefits the Manager derives from its relationships with the Funds. These reports cover not only the fees under the Management Agreement, but also the fees, if any, received for providing other services to the Funds. The reports also discuss any indirect or “fall-out” benefits the Manager or its affiliates may derive from their relationships with the Funds.
The Management Agreement was most recently considered at Board meetings held in the summer and fall of 2022. Information relevant to the approval of the Management Agreement was considered at Board meetings held June 14 and 21, 2022, and September 13, 2022, as well as at various other meetings preceding those meetings. Accordingly, the Management Agreement was approved by the Board at an in-person meeting on September 13, 2022. At such meeting the Board also approved the Expense Limitation Agreement between the Manager and the Trust for the period ending April 30, 2024.
In connection with such meetings, the Board requested and evaluated extensive materials from the Manager, including performance and expense information for other investment companies with similar investment objectives derived from data compiled by an independent third-party provider and other sources believed to be reliable by the Manager and the Trustees. Prior to voting, the Trustees reviewed the proposed approval of the Management Agreement with management and with Independent Trustee Counsel and received a memorandum from such counsel discussing the legal standards for their consideration of the proposed approval. The Independent Trustees also discussed the proposed approval in private sessions with Independent Trustee Counsel at which no representatives of the Manager were present. In reaching their determinations relating to the approval of the Management Agreement, in respect of each Fund, each member of the Board considered all factors he or she believed relevant. The Board based its decision to approve
17
the Management Agreement on the totality of the circumstances and relevant factors, and with a view to past and future long-term considerations. Not all of the factors and considerations discussed above and below are necessarily relevant to every Fund, and the Board did not assign relative weights to factors discussed herein or deem any one or group of them to be controlling in and of themselves.
Shareholder reports must include a discussion of certain factors relating to the selection of the investment adviser and the approval of the advisory fee. The “factors” enumerated by the SEC are set forth below in italics, as well as the Board’s conclusions regarding such factors:
(1) The nature, extent and quality of services provided by the Manager. The Trustees noted that the Manager, subject to the oversight of the Board, administers each Fund’s business and other affairs. The Trustees noted that the Manager also provides the Trust and each Fund with such administrative and other services (exclusive of, and in addition to, any such services provided by any other service providers retained by the Trust on behalf of the Funds) and executive and other personnel as are necessary for the operation of the Trust and the Funds. Except for the Trust’s Chief Compliance Officer and certain compliance staff, the Manager pays all of the compensation of Trustees and officers of the Trust who are employees of the Manager or its affiliates.
The Board considered the scope and quality of services provided by the Manager and noted that the scope of the services provided has continued to expand as a result of regulatory and other developments. The Board noted, for example, that the Manager is responsible for maintaining and monitoring its own compliance program, and this compliance program has been continuously refined and enhanced in light of new regulatory requirements. The Board considered the capabilities and resources which the Manager has dedicated to performing services on behalf of the Trust and its Funds. The quality of administrative and other services, including the Manager’s role in coordinating the activities of the Trust’s other service providers, also were considered. The Board concluded that, overall, they were satisfied with the nature, extent and quality of services provided (and expected to be provided) to the Trust and to each of the Funds under the Management Agreement.
(2) The investment performance of the Funds and the Manager. In connection with every quarterly Board meeting and the summer and fall 2022 contract review process, Trustees received extensive information on the performance results of each Fund. This included, for example, performance information on absolute total return, performance versus the appropriate benchmark(s) and performance versus peer groups as reported by Lipper, the contribution to performance of the Manager’s asset class allocation decisions and volatility management strategies, if applicable, the performance of the underlying funds, and the impact on performance of rebalancing decisions, cash and Fund fees. This included Lipper performance information on the Funds for the previous quarter, and previous one-, three- and five-year periods, to the extent available. For example, in connection with the Board meetings held June 14 and 21, 2022, and September 13, 2022, the Manager reported that, for the five-year period ended December 31, 2021, two Funds were in the top 40%, three were in the middle 20%, and seven were in the bottom 40% of their respective Lipper peer groups. The Manager reported that for the three-year period ended December 31, 2021, three Funds were in the top 40%, two were in the middle 20%, and seven were in the bottom 40% of their respective Lipper peer groups. For the one-year period ended December 31, 2021, six Funds were in the top 40%, two were in the middle 20%, and four were in the bottom 40% of their respective Lipper peer groups.
The Manager also reported on the performance of the MVP Funds compared to custom managed-volatility peer groups. For the five-year period ended December 31, 2021, four Funds were in the top 40%, two were in the middle 20%, and four were in the bottom 20%. For the three-year period ended December 31, 2021, four Funds were in the top 40%, two were in the middle 20%, and four were in the bottom 40% of their respective custom managed-volatility peer groups. For the one-year period ended December 31, 2021, seven Funds were in the top 40%, two were in the middle 20%, and one was in the bottom 40% of their respective custom managed-volatility peer groups. The Board members discussed with the Manager and considered the impact of the volatility management strategies on performance in different market environments, where applicable, and considered whether they were operating as intended. The Board noted, in particular, the impact of certain characteristics of the Funds’ volatility management strategies in relation to volatility experienced as a result of the COVID-19 pandemic, and that relative performance had improved as the markets stabilized.
At the Board meeting held September 13, 2022, the Board also received updated performance information for the Funds, including updated Lipper peer group ranking information, for various periods ending June 30, 2022.
At the Board meeting held September 13, 2022, the Trustees determined that the investment performance of the Funds was acceptable.
(3) The costs of services to be provided and profits to be realized by the Manager and its affiliates from the relationship with the Funds. The Board considered that the Manager receives an advisory fee from each of the Funds. The Manager reported that for the three MVP Fusion Funds the advisory fee paid put these Funds in the 13th percentile of the customized peer group. The Manager reported that for the four MVP Index Strategy Funds the advisory fee paid put them in the 23rd percentile of the customized peer group, and for the AZL Balanced Index Strategy Fund the advisory fee paid put it in the 7th percentile of the customized peer group. The Manager reported that for the AZL DFA Multi-Strategy Fund, the advisory fee paid was in the 5th percentile. The Manager reported that for the AZL MVP DFA Multi-Strategy, AZL MVP FIAM Multi-Strategy, and AZL MVP T. Rowe Price Capital Appreciation Plus Funds, the advisory fee paid was in the 1st percentile. (A lower percentile reflects lower fund fees and is better for fund shareholders.) Trustees were provided with information on the total expense ratios of the Funds and other funds in the customized peer groups, and the Manager reported upon the challenges in making peer group comparisons for the Funds. The Board further considered and found that the advisory fee paid to the Manager with respect to each Fund was based on services provided to the Fund that were in addition to, rather than duplicative of, the services provided pursuant to the advisory agreements for the underlying funds in which the Fund invests.
The Manager provided information concerning the profitability of the Manager’s investment advisory activities for the period from 2019 through 2021. The Board recognized that it is difficult to make comparisons of profitability from investment company advisory agreements because comparative information is not generally publicly available and is affected by numerous factors, including the structure of the particular adviser, the types of funds it manages, its business mix, numerous assumptions regarding allocation of expenses and the adviser’s capital structure and cost of capital. In considering profitability information, the Board considered the possible effect of certain fall-out benefits to the Manager and its affiliates. The Board focused on profitability of the Manager’s relationships with the Funds before taxes and distribution expenses. The Board recognized that the Manager should earn a reasonable level of profits for the services it provides to each Fund.
The Board also considered that Wilshire Funds Management (“Wilshire”) serves as a consultant to the Manager in preparing statistical and other factual information for use in the creation and maintenance of the asset allocation models for the AZL MVP Fusion Funds, pursuant to an agreement between the Manager and Wilshire. Wilshire serves as a consultant to the Manager with respect to selecting the AZL MVP Fusion Funds’ underlying funds and the asset allocations among the underlying funds. The Manager, not any Fund, pays a consultant fee to Wilshire.
(4) and (5) The extent to which economies of scale would be realized as the Funds grow, and whether fee levels reflect these economies of scale. The Board noted that the advisory fee schedules for the Funds do not contain breakpoints that reduce the fee rate on assets above specified levels. The Board recognized that breakpoints may be an appropriate way for the Manager to share its economies of scale, if any, with Funds that have substantial assets. The Board found there was no uniform methodology for establishing breakpoints
18
that give effect to Fund-specific services provided by the Manager. The Board noted that in the fund industry as a whole, as well as among funds similar to the Funds, there is no uniformity or pattern in the fees and asset levels at which breakpoints (if any) apply. Depending on the age, size, and other characteristics of a particular fund and its manager’s cost structure, different conclusions can be drawn as to whether there are economies of scale to be realized at any particular level of assets, notwithstanding the intuitive conclusion that such economies exist, or will be realized at some level of total assets. Moreover, because different managers have different cost structures and service models, it is difficult to draw meaningful conclusions from the breakpoints that may have been adopted by other funds. The Board also noted that the advisory agreements for many funds do not have breakpoints at all, or if breakpoints exist, they may be at asset levels significantly greater than those of the individual Funds. The Board noted that the total assets in all of the Funds, as of June 30, 2022, were approximately $8.2 billion and that the largest Fund, the AZL MVP Growth Index Strategy Fund, had assets of approximately $2.1 billion.
The Board noted that the Manager has agreed to temporarily limit Fund expenses under the Expense Limitation Agreement, which has the effect of reducing expenses similar to implementation of advisory fee breakpoints. The Manager has committed to continue to consider the continuation of expense limits and/or advisory fee breakpoints as Fund assets change. The Board receives quarterly reports on the level of Fund assets. The Board expects to continue to consider: (a) the extent to which economies of scale have been realized, and (b) whether the advisory fee should be modified, either in connection with the next renewal of the Management Agreement or by modifying the Expense Limitation Agreement, to reflect such economies of scale, if any.
Having taken these factors into account, the Board concluded that the absence of breakpoints in the Funds’ advisory fee rate schedules was acceptable under each Fund’s circumstances.
In conclusion, after full consideration of the above factors, as well as such other factors as each member of the Board considered instructive in evaluating the Management Agreement, the Board concluded that the advisory fees were reasonable, and that the continuation of the Management Agreement was in the best interest of the Funds.
19
Information about the Board of Trustees and Officers (Unaudited)
The Trust is managed by the Trustees in accordance with the laws of the state of Delaware governing business trusts. In addition to serving on the Board of Trustees of the Trust, each Trustee serves on the Board of the Allianz Variable Insurance Products Trust (“VIP Trust”) and the AIM ETF Products Trust (“ETF Trust”) (collectively, the Trust, the VIP Trust, and ETF Trust are the “AIM Complex”). There are currently seven Trustees, one of whom is an “interested person” of the Trust within the meaning of that term under the 1940 Act. The Trustees and Officers of the Trust, and their addresses, years of birth, their positions held with the Trust, their terms of office with the Trust and length of time served, their principal occupation(s) during the past five years, the number of portfolios in the Trust they oversee, and their other directorships held during the past five years are as follows:
Independent Trustees(1)
| Name, Address, and Birth Year | Positions Held with AIM Complex | Term of Office(2)/Length of Time Served | Principal Occupation(s) During Past 5 Years | Number of Portfolios Overseen for the AIM Complex | Other Directorships Held Outside of the AIM Complex During Past 5 Years | |||||
Peggy L. Ettestad (1957) 5701 Golden Hills Drive Minneapolis, MN 55416 | Lead Independent Trustee | Since 10/14 (Trustee since 2/07) | Managing Director, Red Canoe Management Consulting LLC, 2008 to present | 50 | None | |||||
Tamara Lynn Fagely (1958) 5701 Golden Hills Drive Minneapolis, MN 55416 | Trustee | Since 12/17 | Retired; previously, Chief Operations Officer, Hartford Funds, 2012 to 2013 | 50 | Diamond Hill Funds (10 Funds) | |||||
Richard H. Forde (1953) 5701 Golden Hills Drive Minneapolis, MN 55416 | Trustee | Since 12/17 | Retired; previously, Member of the Board and Chairman of the Finance and Investment Committee, Connecticut Water Service, Inc., 2013 to 2019 | 50 | Connecticut Water Service, Inc. | |||||
Jack Gee (1959) 5701 Golden Hills Drive Minneapolis, MN 55416 | Trustee | Since 1/22 (Consultant to the Independent Trustees since 2/20)(3) | Retired; previously, Managing Director, BlackRock, Inc., Treasurer and Chief Financial Officer U.S. iShares, 2004 to 2019 | 50 | Engine No. 1 ETF Trust (2 Funds); Esoterica Thematic Trust (2019 - 2020) | |||||
Claire R. Leonardi (1955) 5701 Golden Hills Drive Minneapolis, MN 55416 | Trustee | Since 2/04 | Retired; previously, CEO, Health eSense Inc. (a medical device company), 2015 to 2018, and Connecticut Innovations, Inc. (a venture capital firm), 2012 to 2015 | 50 | None | |||||
Dickson W. Lewis (1948) 5701 Golden Hills Drive Minneapolis, MN 55416 | Trustee | Since 2/04 | Retired; previously, senior executive for Lifetouch National School Studios (a photography company), 2006 to 2014, Jostens (a producer of year books and class rings), 2001 to 2006, and Fortis Financial Group, 1997 to 2001 | 50 | None | |||||
20
Interested Trustee(4)
| Name, Address, and Birth Year | Positions Held with AIM Complex | Term of Office(2)/Length of Time Served | Principal Occupation(s) During Past 5 Years | Number of Portfolios Overseen for the AIM Complex | Other Directorships Held Outside of the AIM Complex During Past 5 Years | |||||
Brian Muench (1970) 5701 Golden Hills Drive Minneapolis, MN 55416 | Trustee | Since 6/11 | President, Allianz Investment Management LLC, 2010 to present; Vice President, Allianz Life, 2011 to present | 50 | None |
| (1) | Each of the Independent Trustees is a member of the Audit Committee. |
| (2) | Indefinite. |
| (3) | Prior to January 1, 2022, Mr. Gee served as a consultant to the Independent Trustees since February 2020, during which he attended meetings of the Board and its standing committees, including the audit committee, solely in his capacity as a consultant, and was not entitled to vote. |
| (4) | Is an “interested person,” as defined by the 1940 Act, due to employment by Allianz Life and the Manager. |
Officers
| Name, Address, and Birth Year | Positions Held with AIM Complex | Term of Office(1)/ Length of Time Served | Principal Occupation(s) During Past 5 Years | |||
Brian Muench (1970) 5701 Golden Hills Drive Minneapolis, MN 55416 | President | Since 11/10 | President, Allianz Investment Management LLC, November 2010 to present; Vice President, Allianz Life, 2011 to present. | |||
Erik Nelson (1972) 5701 Golden Hills Drive Minneapolis, MN 55416 | Secretary | Since 12/20 | Chief Legal Officer, Allianz Investment Management LLC; Associate General Counsel, Senior Counsel, Allianz Life, 2008 to present. | |||
Bashir C. Asad (1963) Citi Fund Services Ohio, Inc. 4400 Easton Commons, Suite 200 Columbus, OH 43219 | Treasurer, Principal Accounting Officer and Principal Financial Officer | Since 06/16 | Senior Vice President, Citi Fund Services Ohio, Inc., 2011 to present. | |||
Chris R. Pheiffer (1968) 5701 Golden Hills Drive Minneapolis, MN 55416 | Chief Compliance Officer(2) and Anti-Money Laundering Compliance Officer | Since 02/14 | Chief Compliance Officer of the Trust and the VIP Trust, 2014 to present, and the ETF Trust, 2020 to present. | |||
Michael Tanski (1970) 5701 Golden Hills Drive Minneapolis, MN 55416 | Vice President | Since 04/09 | Assistant Vice President, Allianz Investment Management LLC, 2013 to present. | |||
| (1) | Indefinite. |
| (2) | The Manager and the Trust are parties to a Compliance Services Agreement under which the Manager provides an employee of the Manager or one of its affiliates to act as the Trust’s Chief Compliance Officer. |
The Fund’s Statement of Additional Information (“SAI”) contains additional information about the Trust’s Trustees and Officers. The SAI is available without charge, upon request, by calling toll-free 800-624-0197 or at https://www.allianzlife.com.
21
| The Allianz VIP Fund of Funds are distributed by Allianz Life Financial Services, LLC. | ||
| These Funds are not FDIC Insured. | ANNRPT1222 02/23 |
AZL® MVP FusionSM Balanced Fund
Annual Report
December 31, 2022

This report is submitted for the general information of the shareholder of the Fund. The report is not authorized for distribution to prospective investors in the Fund unless preceded or accompanied by an effective prospectus, which contains details concerning the sales charges and other pertinent information.
Allianz Investment Management LLC serves as the Manager for the AZL® FusionSM Balanced Fund.
What factors affected the Fund’s performance during the year ended December 31, 2022?*
For the year ended December 31, 2022, the AZL® MVP FusionSM Balanced Fund (the “Fund”) returned (14.91)%. That compared to a (18.11)%, (13.01)% and a (15.39)% total return for its benchmarks, the S&P 500 Index, the Bloomberg U.S. Aggregate Bond Index, and the Balanced Composite Index, respectively.1
The Fund is a fund of funds that achieves broad diversificationbyinvesting in underlying funds. The Fund typically holds between 40% and 60% of its assets in equity funds and 40% to 60% of its assets in fixed-income funds. The Fund also employs the MVP (Managed Volatility Portfolio) risk management process, whichisintended to adjust the risk of the portfolio based on quantitative indicators of market risk, such as the current level of fund and market volatility.
Domestic equities began the year at near all-time highs, but began to decline early in 2022 due to a combination of rising inflation and geopolitical uncertainties. The Federal Reserve (the Fed) shifted to a more hawkish policy approach in an attempt to bring inflation under control, as did many global central banks. The Fed increased the federal funds rate multiple times throughout the year for a combined total of 425 basis points. Russia’s invasion of Ukraine also weighed on global markets, although European countries were particularly hard hit due to their geographic proximity to the conflict and reliance on Russian commodities such as energy and wheat.
Despite strong labor rates throughout developed markets, high inflation and an anticipated economic slowdown had a negative effect on investor sentiment for the year under review. The S&P 500 declined as company valuations struggled under the higher interest rate environment. Investors grew risk averse as fears of an economic recession loomed, selling off equity positions to avoid the volatility in equity markets. By the end of the period under review, U.S. equities had experienced their worst year since the Great Financial Crisis of 2008, and international equities performed only slightly better.
The Fed’s actions made short-term financing more expensive, and the U.S. Treasury yield curve ultimately inverted with 2-year Treasuries yielding more than 10-year Treasuries by 0.55% at the end of 2022. The monetary tightening generated
headwinds for domestic fixed income markets as investors demanded higher yields to account for rising rates. Widening credit spreads further weighed on prices on lower-quality bonds as investors demanded to be compensated for rising credit risks. Nearly all fixed income sectors finished the year with negative performance.
The Fund, which invests in both U.S. and international markets, outperformed its composite benchmark during the 12-month period. Its off-benchmark allocation to developed market non- U.S. equities contributed to performance, as these outpaced U.S. equities. In addition, the Fund’s performance compared to the composite benchmark was positively affected by its allocation to mid- and small-cap U.S. equities, which outpaced their large-cap counterparts.
The Fund’s overweight exposure to U.S. value stocks compared to growth stocks contributed to performance, as growth stocks underperformed during the year. The fixed income allocation detracted slightly from the Fund’s performance relative to its benchmark largely due to the underlying fund’s fees. However, the Fund’s fixed income allocation benefited from security selection, particularly in mortgage-backed securities.
The MVP risk management process utilizes derivatives in an effort to control portfolio volatility in unstable market conditions. Market volatility was relatively high during 2022, therefore the MVP process was engaged and reduced the Fund’s equity exposure at multiple points during the year. The MVP process slightly detracted from the Fund’s performance during 2022.
Past performance does not guarantee future results.
| * | The Fund’s portfolio composition is subject to change. There is no guarantee that any sectors mentioned will continue to perform as described or that securities in such sectors will be held by the Fund in the future. The information contained in this commentary is for informational purposes only and should not be construed as a recommendation to purchase or sell securities in the sector mentioned. The Fund’s holdings and weightings are as of December 31, 2022. |
| 1 | For a complete description of the Fund’s performance benchmark please refer to page 2 of this report. |
1
AZL® MVP FusionSM Balanced Fund Review (Unaudited) |
Fund Objective
The Fund’s investment objective is to seek long-term capital appreciation with preservation of capital as an important consideration. This objective may be changed by the Trustees of the Fund without shareholder approval. The Fund seeks to achieve its objective by investing in a combination of permitted Underlying Funds that represent different classes in the Fund’s asset allocation.
Investment Concerns
The Fund invests in underlying funds, so its investment performance is directly related to the performance of those underlying funds. Before investing, investors should assess the risks associated with and types of investments made by each of the underlying funds in which the Fund invests.
Quantitative investing involves risk that the values of securities selected in the quantitative analysis can react differently than the market or securities selected using fundamental analysis.
Stocks are more volatile and carry more risk and return potential than other forms of investments.
Emerging market investing may be subject to additional economic, political, liquidity, and currency risks not associated with more developed countries.
International investing may involve risk of capital loss from unfavorable fluctuations in currency values, from differences in generally accepted accounting principles or from economic or political instability in other nations.
Small- to mid-capitalization companies typically have a higher risk of failure and historically have experienced a greater degree of volatility.
Bonds offer a relatively stable level of income, although bond prices will fluctuate, providing the potential for principal gain or loss.
Debt securities held by an underlying fund may decline in value due to rising interest rates.
Investing in derivative instruments involves risks that may be different from or greater than the risk associated with investing directly in securities or other traditional instruments.
For a complete description of these and other risks associated with investing in the Fund, please refer to the Fund’s prospectus.
Growth of $10,000 Investment
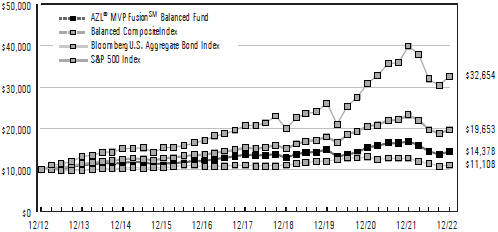
The chart above represents a comparison of a hypothetical investment in the Fund versus a similar investment in the Fund’s benchmarks and represents the reinvestment of dividends and capital gains in the Fund.
| Average Annual Total Returns as of December 31, 2022 | ||||||||||||||||||||
| 1 Year | 3 Years | 5 Years | 10 Years | |||||||||||||||||
AZL® MVP FusionSM Balanced Fund | (14.91)% | (1.20)% | 1.10% | 3.70% | ||||||||||||||||
Balanced Composite Index | (15.39)% | 2.98% | 5.14% | 6.99% | ||||||||||||||||
Bloomberg U.S. Aggregate Bond Index | (13.01)% | (2.71)% | 0.02% | 1.06% | ||||||||||||||||
S&P 500 Index | (18.11)% | 7.66% | 9.42% | 12.56% | ||||||||||||||||
Past performance does not guarantee future results. The performance data quoted represents past performance and current returns may be lower or higher. The investment return and principal value will fluctuate so that an investor’s shares, when redeemed, may be worth more or less than the original cost. To obtain performance information current to the most recent month end, please visit www.Allianzlife.com.
| Expense Ratio | Gross | ||||
AZL® MVP FusionSM Balanced Fund | 0.94 | % | |||
The above expense ratio is based on the current Fund prospectus dated April 29, 2022. The Manager and the Fund have entered into a written agreement reducing the management fee to 0.15% through at least April 30, 2024. The Manager and the Fund have entered into a written contract limiting operating expenses, excluding certain expenses (such as interest expense and acquired fund fees and expenses), to 0.30% through April 30, 2024. Additional information pertaining to the December 31, 2022 expense ratio can be found in the Financial Highlights.
Acquired fund fees and expenses are incurred indirectly by the Fund through the valuation of the Fund’s investments in the permitted Underlying Funds. Accordingly, acquired fund fees and expenses affect the Fund’s total returns. Because these fees and expenses are not included in the Fund’s financial highlights, the Fund’s total annual fund operating expenses, as shown in the current prospectus, do not correlate to the ratios of expenses to average net assets shown in the Financial Highlights. Without acquired fund fees and expenses the Fund’s gross expense ratio would be 0.22%.
The total return of the Fund does not reflect the effect of any insurance charges, the annual maintenance fee or the deduction of taxes that a shareholder would pay on Fund distributions or the redemption of Fund shares. Such charges, fees and tax payments would reduce the performance quoted.
The Fund’s performance is measured against the Standard & Poor’s 500 Index (“S&P 500”), the Bloomberg U.S. Aggregate Bond Index and the Balanced Composite Index (“Composite”). The S&P 500 is representative of 500 selected common stocks, most of which are listed on the New York Stock Exchange, and is a measure of the U.S. Stock market as a whole. The Bloomberg U.S. Aggregate Bond Index is a market value-weighted performance benchmark for investment-grade fixed-rate debt issues, including government, corporate, asset-backed, and mortgage-backed securities, with maturities of at least one year. The Composite is a blended index comprised of (50%) S&P 500 and (50%) Bloomberg U.S. Aggregate Bond Index. These indexes are unmanaged and do not reflect the deduction of fees associated with a mutual fund, such as investment management and fund accounting fees. The Fund’s performance reflects the deduction of fees for services provided to the Fund. Investors cannot invest directly in an index.
2
AZL MVP Fusion Balanced Fund
(Unaudited)
As a shareholder of the AZL MVP Fusion Balanced Fund (the “Fund”), you incur ongoing costs, including management fees, distribution fees, and other Fund expenses. These examples are intended to help you understand your ongoing costs (in dollars) of investing in the Fund and to compare these costs with the ongoing costs of investing in other mutual funds. Please note that the expenses shown in each table do not reflect expenses that apply to the subaccount or the insurance contract. If the expenses that apply to the subaccount or the insurance contract were included, your costs would have been higher.
These examples are based on an investment of $1,000 invested at the beginning of the period and held for the periods presented below.
The Actual Expense table below provides information about actual account values and actual expenses. You may use the information below, together with the amount you invested, to estimate the expenses that you paid over the period. Simply divide your account value by $1,000 (for example, an $8,600 account value divided by $1,000 = 8.6), then multiply the result by the number in the table under the heading entitled “Expenses Paid During Period” to estimate the expenses you paid on your account during this period.
Beginning Account Value 7/1/22 | Ending Account Value 12/31/22 | Expenses Paid During Period 7/1/22 - 12/31/22* | Annualized Expense Ratio During Period 7/1/22 - 12/31/22 | |||||||||||||||||
AZL MVP Fusion Balanced Fund | $1,000.00 | $995.90 | $0.91 | 0.18% | ||||||||||||||||
The Hypothetical Expense table below provides information about hypothetical account values and hypothetical expenses based on the Fund’s actual expense ratio and an assumed rate of return of 5% per year before expenses, which is not the Fund’s actual return. The hypothetical account values and expenses may not be used to estimate the actual ending account balance or expenses you paid for the period. You may use this information to compare this 5% hypothetical example with the 5% hypothetical examples that appear in the shareholder reports of other funds.
Beginning Account Value 7/1/22 | Ending Account Value 12/31/22 | Expenses Paid During Period 7/1/22 -12/31/22* | Annualized Expense Ratio During Period 7/1/22 - 12/31/22 | |||||||||||||||||
AZL MVP Fusion Balanced Fund | $1,000.00 | $1,024.30 | $0.92 | 0.18% | ||||||||||||||||
| * | Expenses are equal to the average account value multiplied by the Fund’s annualized expense ratio multiplied by 184/365 (the number of days in the most recent fiscal half-year divided by the number of days in the fiscal year). |
Portfolio Composition
(Unaudited)
| Investments | Percent of Net Assets | ||||
Fixed Income Funds | 48.0% | ||||
Domestic Equity Funds | 32.4 | ||||
International Equity Funds | 15.2 | ||||
|
| ||||
Total Investment Securities | 95.6 | ||||
Net other assets (liabilities) | 4.4 | ||||
|
| ||||
Net Assets | 100.0% | ||||
|
| ||||
3
AZL MVP Fusion Balanced Fund
Schedule of Portfolio Investments
December 31, 2022
| Shares | Value | |||||||||||
Affiliated Investment Companies (95.6%): | ||||||||||||
Domestic Equity Funds (32.4%): | ||||||||||||
| 1,215,684 | AZL DFA U.S. Core Equity Fund | $ | 14,916,440 | |||||||||
| 971,124 | AZL DFA U.S. Small Cap Fund | 9,177,120 | ||||||||||
| 862,206 | AZL Gateway Fund | 12,148,483 | ||||||||||
| 784,049 | AZL Mid Cap Index Fund, Class 2 | 15,030,229 | ||||||||||
| 4,737,153 | AZL Russell 1000 Growth Index Fund, Class 2 | 62,009,329 | ||||||||||
| 5,384,101 | AZL Russell 1000 Value Index Fund, Class 2 | 66,547,484 | ||||||||||
| 795,303 | AZL Small Cap Stock Index Fund, Class 2 | 9,090,309 | ||||||||||
|
| |||||||||||
| 188,919,394 | ||||||||||||
|
| |||||||||||
Fixed Income Funds (48.0%): | ||||||||||||
| 4,670,936 | AZL Enhanced Bond Index Fund | 44,280,473 | ||||||||||
| 6,766,830 | AZL Fidelity Institutional Asset Management Total Bond Fund, Class 2 | 58,803,752 | ||||||||||
| 6,924,363 | AZL MetWest Total Return Bond Fund | 58,787,844 | ||||||||||
| Shares | Value | |||||||||||
Affiliated Investment Companies, continued | ||||||||||||
Fixed Income Funds, continued | ||||||||||||
| 3,082,760 | PIMCO VIT Income Portfolio | $ | 29,871,947 | |||||||||
| 3,097,148 | PIMCO VIT Low Duration Portfolio | 29,360,960 | ||||||||||
| 6,574,033 | PIMCO VIT Total Return Portfolio | 59,034,817 | ||||||||||
|
| |||||||||||
| 280,139,793 | ||||||||||||
|
| |||||||||||
International Equity Funds (15.2%): | ||||||||||||
| 2,241,452 | AZL DFA International Core Equity Fund | 21,002,405 | ||||||||||
| 3,289,131 | AZL International Index Fund, Class 2 | 50,192,138 | ||||||||||
| 2,943,452 | AZL MSCI Emerging Markets Equity Index Fund, Class 2 | 17,778,451 | ||||||||||
|
| |||||||||||
| 88,972,994 | ||||||||||||
|
| |||||||||||
| | Total Affiliated Investment Companies (Cost $586,781,825) | 558,032,181 | ||||||||||
|
| |||||||||||
| | Total Investment Securities (Cost $586,781,825) — 95.6%(a) | 558,032,181 | ||||||||||
Net other assets (liabilities) — 4.4% | 25,482,685 | |||||||||||
|
| |||||||||||
Net Assets — 100.0% | $ | 583,514,866 | ||||||||||
|
| |||||||||||
| (a) | See Federal Tax Information listed in the Notes to the Financial Statements. |
Percentages indicated are based on net assets as of December 31, 2022
Futures Contracts
At December 31, 2022, the Fund’s open futures contracts were as follows:
Long Futures
| Description | Expiration Date | Number of Contracts | Notional Amount | Value and Unrealized (Depreciation) | ||||||||||||
S&P 500 Index E-Mini March Futures (U.S. Dollar) | 3/17/23 | 66 | $ | 12,741,300 | $ | 842 | ||||||||||
U.S. Treasury 10-year Note March Futures (U.S. Dollar) | 3/22/23 | 113 | 12,689,547 | (126,062 | ) | |||||||||||
|
|
| ||||||||||||||
| $ | (125,220 | ) | ||||||||||||||
|
|
| ||||||||||||||
See accompanying notes to the financial statements.
4
AZL MVP Fusion Balanced Fund
Statement of Assets and Liabilities
December 31, 2022
Assets: | |||||
Investments in affiliates, at cost | $ | 586,781,825 | |||
|
|
| |||
Investments in affiliates, at value | $ | 558,032,181 | |||
Deposit at broker for futures contracts collateral | 25,443,647 | ||||
Interest and dividends receivable | 499,411 | ||||
Receivable for capital shares issued | 25,654 | ||||
Receivable for affiliated investments sold | 341,963 | ||||
Receivable for variation margin on futures contracts | 710 | ||||
Prepaid expenses | 16,946 | ||||
|
|
| |||
Total Assets | 584,360,512 | ||||
|
|
| |||
Liabilities: | |||||
Cash overdraft | 341,935 | ||||
Payable for investments purchased | 428,439 | ||||
Management fees payable | 75,272 | ||||
|
|
| |||
Total Liabilities | 845,646 | ||||
|
|
| |||
Net Assets | $ | 583,514,866 | |||
|
|
| |||
Net Assets Consist of: | |||||
Paid in capital | $ | 593,238,820 | |||
Total distributable earnings | (9,723,954 | ) | |||
|
|
| |||
Net Assets | $ | 583,514,866 | |||
|
|
| |||
Shares of beneficial interest (unlimited number of shares authorized, no par value) | 62,802,690 | ||||
Net Asset Value (offering and redemption price per share) | $ | 9.29 | |||
|
|
| |||
For the Year Ended December 31, 2022
Investment Income: | |||||
Dividends from affiliates | $ | 10,111,889 | |||
Interest | 417,010 | ||||
Dividends from non-affiliates | 35 | ||||
|
|
| |||
Total Investment Income | 10,528,934 | ||||
|
|
| |||
Expenses: | |||||
Management fees | 1,303,867 | ||||
Administration fees | 68,707 | ||||
Custodian fees | 4,607 | ||||
Administrative and compliance services fees | 9,193 | ||||
Transfer agent fees | 5,747 | ||||
Trustee fees | 36,694 | ||||
Professional fees | 30,876 | ||||
Shareholder reports | 18,251 | ||||
Other expenses | 10,173 | ||||
|
|
| |||
Total expenses | 1,488,115 | ||||
Less Management fees contractually waived | (325,973 | ) | |||
|
|
| |||
Net expenses | 1,162,142 | ||||
|
|
| |||
Net Investment Income/(Loss) | 9,366,792 | ||||
|
|
| |||
Net realized and Change in net unrealized gains/losses on investments: | |||||
Net realized gains/(losses) on affiliated underlying funds | (139,783 | ) | |||
Net realized gains distributions from affiliated underlying funds | 34,783,036 | ||||
Net realized gains/(losses) on futures contracts | (6,184,668 | ) | |||
Change in net unrealized appreciation/depreciation on affiliated underlying funds | (150,743,393 | ) | |||
Change in net unrealized appreciation/depreciation on futures contracts | (618,811 | ) | |||
|
|
| |||
Net realized and Change in net unrealized gains/losses on investments | (122,903,619 | ) | |||
|
|
| |||
Change in Net Assets Resulting From Operations | $ | (113,536,827 | ) | ||
|
|
|
See accompanying notes to the financial statements.
5
AZL MVP Fusion Balanced Fund
Statements of Changes in Net Assets
| For the Year Ended December 31, 2022 | For the Year Ended December 31, 2021 | |||||||||
Change In Net Assets: | ||||||||||
Operations: | ||||||||||
Net investment income/(loss) | $ | 9,366,792 | $ | 8,631,674 | ||||||
Net realized gains/(losses) on investments | 28,458,585 | 58,611,047 | ||||||||
Change in unrealized appreciation/depreciation on investments | (151,362,204 | ) | 5,241,201 | |||||||
|
|
|
| |||||||
Change in net assets resulting from operations | (113,536,827 | ) | 72,483,922 | |||||||
|
|
|
| |||||||
Distributions to Shareholders: | ||||||||||
Distributions | (41,330,975 | ) | (17,895,771 | ) | ||||||
|
|
|
| |||||||
Change in net assets resulting from distributions to shareholders | (41,330,975 | ) | (17,895,771 | ) | ||||||
|
|
|
| |||||||
Capital Transactions: | ||||||||||
Proceeds from shares issued | 1,423,474 | 1,993,876 | ||||||||
Proceeds from dividends reinvested | 41,330,975 | 17,895,770 | ||||||||
Value of shares redeemed | (89,479,348 | ) | (117,103,853 | ) | ||||||
|
|
|
| |||||||
Change in net assets resulting from capital transactions | (46,724,899 | ) | (97,214,207 | ) | ||||||
|
|
|
| |||||||
Change in net assets | (201,592,701 | ) | (42,626,056 | ) | ||||||
Net Assets: | ||||||||||
Beginning of period | 785,107,567 | 827,733,623 | ||||||||
|
|
|
| |||||||
End of period | $ | 583,514,866 | $ | 785,107,567 | ||||||
|
|
|
| |||||||
Share Transactions: | ||||||||||
Shares issued | 142,878 | 173,506 | ||||||||
Dividends reinvested | 4,572,010 | 1,567,055 | ||||||||
Shares redeemed | (8,723,584 | ) | (10,136,507 | ) | ||||||
|
|
|
| |||||||
Change in shares | (4,008,696) | (8,395,946) | ||||||||
|
|
|
| |||||||
See accompanying notes to the financial statements.
6
AZL MVP Fusion Balanced Fund
(Selected data for a share of beneficial interest outstanding throughout the periods indicated. Does not reflect fees or expenses associated with the separate accounts that invest in the Fund or in any variable annuity contracts or variable life insurance policy for which the Fund serves as an investment vehicle.)
| Year Ended December 31, 2022 | Year Ended December 31, 2021 | Year Ended December 31, 2020 | Year Ended December 31, 2019 | Year Ended December 31, 2018 | ||||||||||||||||
Net Asset Value, Beginning of Period | $11.75 | $11.01 | $11.24 | $10.44 | $11.91 | |||||||||||||||
|
|
|
|
|
|
|
|
|
| |||||||||||
Investment Activities: | ||||||||||||||||||||
Net Investment Income/(Loss) | 0.15 | (a) | 0.12 | (a) | 0.20 | (a) | 0.22 | (a) | 0.22 | |||||||||||
Net Realized and Unrealized Gains/(Losses) on Investments | (1.92 | ) | 0.89 | 0.18 | 1.38 | (0.83 | ) | |||||||||||||
|
|
|
|
|
|
|
|
|
| |||||||||||
Total from Investment Activities | (1.77 | ) | 1.01 | 0.38 | 1.60 | (0.61 | ) | |||||||||||||
|
|
|
|
|
|
|
|
|
| |||||||||||
Distributions to Shareholders From: | ||||||||||||||||||||
Net Investment Income | (0.27 | ) | (0.27 | ) | (0.26 | ) | (0.29 | ) | (0.15 | ) | ||||||||||
Net Realized Gains | (0.42 | ) | — | (0.35 | ) | (0.51 | ) | (0.71 | ) | |||||||||||
|
|
|
|
|
|
|
|
|
| |||||||||||
Total Dividends | (0.69 | ) | (0.27 | ) | (0.61 | ) | (0.80 | ) | (0.86 | ) | ||||||||||
|
|
|
|
|
|
|
|
|
| |||||||||||
Net Asset Value, End of Period | $9.29 | $11.75 | $11.01 | $11.24 | $10.44 | |||||||||||||||
|
|
|
|
|
|
|
|
|
| |||||||||||
Total Return (b) | (14.91 | )% | 9.20 | % | 3.78 | % | 15.76 | % | (5.40 | )% | ||||||||||
Ratios to Average Net Assets/Supplemental Data: | ||||||||||||||||||||
Net Assets, End of Period (000’s) | $583,515 | $785,108 | $827,734 | $923,719 | $919,206 | |||||||||||||||
Net Investment Income/(Loss) | 1.44 | % | 1.06 | % | 1.88 | % | 1.95 | % | 1.74 | % | ||||||||||
Expenses Before Reductions*(c) | 0.23 | % | 0.22 | % | 0.23 | % | 0.23 | % | 0.22 | % | ||||||||||
Expenses Net of Reductions* | 0.18 | % | 0.17 | % | 0.23 | % | 0.23 | % | 0.22 | % | ||||||||||
Portfolio Turnover Rate | 7 | % | 9 | % | 17 | % | 12 | % | 15 | % | ||||||||||
| * | The expense ratios exclude the impact of fees/expenses paid by each underlying fund. |
| (a) | Calculated using the average shares method. |
| (b) | The returns include reinvested dividends and fund level expenses, but exclude insurance contract charges. If these charges were included, the returns would have been lower. |
| (c) | Excludes fee reductions. If such fee reductions had not occurred, the ratios would have been as indicated. |
See accompanying notes to the financial statements.
7
AZL MVP Fusion Balanced Fund
Notes to the Financial Statements
December 31, 2022
1. Organization
The Allianz Variable Insurance Products Fund of Funds Trust (the “Trust”) was organized as a Delaware statutory trust on June 16, 2004. The Trust is an open-end management investment company registered under the Investment Company Act of 1940, as amended, (the “1940 Act”) and thus is determined to be an investment company, and follows the investment company accounting and reporting guidance under Financial Accounting Standards Board (“FASB”) Accounting Standards Codification (“ASC”) Topic 946 “Financial Services—Investment Companies”. The Trust consists of 12 separate investment portfolios (collectively, the “Funds”), of which one is included in this report, the AZL MVP Fusion Balanced Fund (the “Fund”), and 11 are presented in separate reports. The Fund is a diversified series of the Trust.
The Fund is a “fund of funds”, which means that the Fund invests primarily in other mutual funds (the “Underlying Funds”). Underlying Funds invest in stocks, bonds, and other securities and reflect varying amounts of potential investment risk and reward. The Underlying Funds record their investments at fair value. Periodically, the Fund will adjust its asset allocation as it seeks to achieve its investment objective.
The Trust is authorized to issue an unlimited number of shares of the Fund without par value. Shares of the Fund are available through the variable annuity contracts offered through the separate accounts of participating insurance companies. Currently, the Fund only offers its shares to separate accounts of Allianz Life Insurance Company of North America and Allianz Life Insurance Company of New York, affiliates of the Trust and the Manager, as defined below.
Under the Trust’s organizational documents, its officers and trustees are indemnified against certain liabilities arising out of the performance of their duties to the Fund. In addition in the normal course of business, the Fund may enter into contracts with its vendors and others that provide for general indemnifications. The Fund’s maximum exposure under these arrangements is unknown, as this would involve future claims that may be made against the Fund. However, based on experience, the Fund expects that risk of loss to be remote.
On December 13, 2022, the Board unanimously approved a reorganization whereby the AZL MVP Balanced Index Strategy Fund will acquire all of the assets and liabilities of the Fund and costs related to the reorganization will be paid by the Manager.
2. Significant Accounting Policies
The following is a summary of significant accounting policies followed by the Fund in the preparation of its financial statements. The policies conform with U.S. generally accepted accounting principles (“U.S. GAAP”). The preparation of financial statements requires management to make certain estimates and assumptions that affect the reported amounts of assets and liabilities and disclosure of contingent assets and liabilities at the date of the financial statements and the reported amounts of increases and decreases in net assets from operations during the reporting period. Actual results could differ from those estimates.
Security Valuation
The Fund records its investments at fair value. Fair value is defined as the price that would be received to sell an asset or paid to transfer a liability in an orderly transaction between willing market participants at the measurement date. The valuation techniques used to determine fair value are further described in Note 4 below.
Investment Transactions and Investment Income
Investment transactions are accounted for on trade date. Net realized gains and losses on investments sold and on foreign currency transactions are recorded on the basis of identified cost. Interest income is recorded on the accrual basis and includes, where applicable, the amortization of premiums or accretion of discounts. Dividend income is recorded on the ex-dividend date except in the case of foreign securities, in which case dividends are recorded as soon as such information becomes available.
Distributions to Shareholders
Distributions to shareholders are recorded on the ex-dividend date. The Fund distributes its dividends from net investment income and net realized capital gains, if any, on an annual basis. The amount of distributions from net investment income and from net realized gains is determined in accordance with federal income tax regulations, which may differ from U.S. GAAP. These “book/tax” differences are either temporary or permanent in nature. To the extent these differences are permanent in nature (e.g., return of capital, net operating loss, reclassification of certain market discounts, gain/loss, paydowns, and distributions), such amounts are reclassified within the composition of net assets based on their federal tax-basis treatment; temporary differences (e.g., wash sales and differing treatment on certain investments) do not require reclassification. Distributions to shareholders that exceed net investment income and net realized gains for tax purposes are reported as distributions of capital.
Expense Allocation
Expenses directly attributable to the Fund are charged directly to the Fund, while expenses attributable to more than one Fund are allocated among the respective Funds based upon relative net assets or some other reasonable method. Expenses which are attributable to more than one Trust are allocated across the Allianz Variable Insurance Products Trust, Allianz Variable Insurance Products Fund of Funds Trust and AIM ETF Products Trust based upon relative net assets or another reasonable basis. Allianz Investment Management LLC (the “Manager”), serves as the investment manager for the Trust, Allianz Variable Insurance Products Trust and AIM ETF Products Trust.
This report does not reflect fees or expenses associated with the separate accounts that invest in the Fund or in any variable annuity contracts or variable life insurance policy for which the Fund serves as an investment vehicle.
Affiliated Securities Transactions
Pursuant to Rule 17a-7 under the 1940 Act, the Fund may engage in securities transactions with affiliated investment companies and advisory accounts managed by the Manager. Any such purchase or sale transaction must be effected without a brokerage commission or other remuneration, except for customary transfer fees. The transaction must be effected at the current market price, which is either the security’s last sale price on an exchange or, if there are no transactions in the security that day, at the average of the highest bid and lowest asked price. During the year ended December 31, 2022, the Fund did not engage in any Rule 17a-7 transactions.
8
AZL MVP Fusion Balanced Fund
Notes to the Financial Statements
December 31, 2022
Derivative Instruments
All open derivative positions at period end are reflected on the Fund’s Schedule of Portfolio Investments. The following is a description of the derivative instruments utilized by the Fund, including the primary underlying risk exposures related to each instrument type. The Fund’s allocation to the MVP (Managed Volatility Portfolio) risk management process may include (a) derivatives such as index futures, other futures contracts, options, and other similar securities and (b) cash, money market equivalents, short-term debt instruments, money market funds, and short-term debt funds to satisfy all applicable margin requirements and to provide additional portfolio liquidity to satisfy large redemptions and any margin calls. Due to the leverage provided by derivatives, the notional value of the Fund’s derivative positions could exceed 20% of the Fund’s value. The Fund may also use futures to gain equity exposure and may hold cash as a buffer in the event of market shocks.
Futures Contracts
During the year ended December 31, 2022, the Fund invested in futures contracts to reduce volatility and limit the need to decrease or increase allocations to underlying funds. Futures contracts are valued based upon their quoted daily settlement prices. Upon entering into a futures contract, the Fund is required to segregate liquid assets in accordance with the initial margin requirements of the broker or exchange. Futures contracts are marked to market daily and a payable or receivable for the change in value (“variation margin”), if any, is recorded by the Fund. Gains or losses are recognized but not considered realized until the contracts expire or are closed. Futures contracts involve, to varying degrees, elements of market risk (generally equity price risk related to stock futures, interest rate risk related to bond futures, and foreign currency risk related to currency futures) and exposure to loss in excess of the variation margin disclosed in the Statement of Assets and Liabilities. The primary risks associated with the use of futures contracts are the imperfect correlation between the change in value of the underlying securities and the prices of futures contracts, the possibility of an illiquid market, and the inability of the counterparty to meet the terms of the contract. For the year ended December 31, 2022, the monthly average notional amount for long contracts was $18.8 million, and the monthly average notional amount for short contracts was $43.2 million. Realized gains and losses are reported as “Net realized gains/(losses) on futures contracts” on the Statement of Operations.
Summary of Derivative Instruments
The following is a summary of the values of derivative instruments on the Fund’s Statement of Assets and Liabilities, categorized by risk exposure, as of December 31, 2022:
Asset Derivatives | Liability Derivatives | |||||||||||
| Primary Risk Exposure | Statement of Assets and Liabilities Location | Total Value | Statement of Assets and Liabilities Location | Total Value | ||||||||
Equity Risk | ||||||||||||
| Futures Contracts | Receivable for variation margin on futures contracts* | $842 | Payable for variation margin on futures contracts* | $— | ||||||||
Interest Rate Risk | ||||||||||||
| Futures Contracts | Receivable for variation margin on futures contracts* | — | Payable for variation margin on futures contracts* | 126,062 | ||||||||
| * | For futures contracts, the amounts represent the cumulative appreciation/depreciation of these futures contracts as reported in the Schedule of Portfolio Investments. Only the current day’s variation margin is reported within the Statement of Assets and Liabilities as variation margin on futures contracts. |
The following is a summary of the effect of derivative instruments on the Statement of Operations, categorized by risk exposure, for the year ended December 31, 2022:
| Primary Risk Exposure | Location of Gains/(Losses) on Derivatives Recognized | Realized Gains/(Losses) on Derivatives Recognized | Change in Net Unrealized Appreciation/Depreciation on Derivatives Recognized | |||||||
Equity Risk | ||||||||||
| Futures Contracts | Net realized gains/(losses) on futures contracts/ Change in net unrealized appreciation/ depreciation on futures contracts | $(4,155,156) | $(286,232) | |||||||
Interest Rate Risk | ||||||||||
| Futures Contracts | Net realized gains/(losses) on futures contracts/ Change in net unrealized appreciation/ depreciation on futures contracts | (2,029,512 | ) | (332,579 | ) | |||||
3. Fees and Transactions with Affiliates and Other Parties
The Manager provides investment advisory and management services for the Fund. The Manager has contractually agreed to waive fees and reimburse the Fund to limit the annual expenses, excluding interest expense (e.g., cash overdraft fees), taxes, brokerage commissions, acquired fund fees and expenses, other expenditures that are capitalized in accordance with U.S. GAAP and other extraordinary expenses not incurred in the ordinary course of the Fund’s business, based on the daily net assets of the Fund, through April 30, 2024.
Expenses incurred for investment advisory and management services are reflected on the Statement of Operations as “Management fees.”
For the year ended December 31, 2022, the annual rate due to the Manager and the annual expense limit were as follows:
| Annual Rate* | Annual Expense Limit | |||||||||
AZL MVP Fusion Balanced Fund | 0.20 | % | 0.30 | % | ||||||
* The Manager waived, prior to any application of expense limit, the management fee to 0.15% on all assets in order to maintain a more competitive expense ratio. The Manager reserves the right to increase the management fee to the amount shown in the table above (i.e., discontinue the waiver) at any time after April 30, 2024.
Any amounts contractually waived or reimbursed by the Manager with respect to the annual expense limit in a particular fiscal year will be subject to repayment by the Fund to the Manager to the extent that from time to time through the next three fiscal years the repayment will not cause the Fund’s expenses to exceed the lesser of the stated limit at the time of the waiver or the current stated limit. Any amounts recouped by the Manager during the year are reflected on the Statement of Operations as “Recoupment of prior expenses reimbursed by the Manager.” At December 31, 2022, there were no remaining contractual reimbursements subject to repayment by the Fund in subsequent years.
9
AZL MVP Fusion Balanced Fund
Notes to the Financial Statements
December 31, 2022
Management fees, which the Manager waived in order to maintain more competitive expense ratios, are not subject to repayment in subsequent years. Information on the total amount waived/reimbursed by the Manager or repaid to the Manager by the Fund during the period can be found on the Statement of Operations.
The Manager or an affiliate of the Manager serves as the investment adviser of certain underlying funds in which the Fund invests. At December 31, 2022, these underlying funds are noted as Affiliated Investment Companies in the Fund’s Schedule of Portfolio Investments. Additional information, including financial statements, about these Funds is available at www.allianzlife.com. The Manager or an affiliate of the Manager is paid a separate fee from the underlying funds for such services. A summary of the Fund’s investments in affiliated investment companies for the year ended December 31, 2022 is as follows:
Value 12/31/21 | Purchases at Cost | Proceeds from Sales | Net Realized Gains (Losses) | Change in Net (Depreciation) | Value 12/31/22 | Shares as of | Dividend Income | Net Realized Gains Distributions from Affiliated Underlying Funds | |||||||||||||||||||||||||||||||||||||
AZL DFA International Core Equity Fund | $ | 27,941,892 | $ | 2,432,119 | $ | (3,356,233 | ) | $ | 331,509 | $ | (6,346,882 | ) | $ | 21,002,405 | 2,241,452 | $ | 557,701 | $ | 1,874,419 | ||||||||||||||||||||||||||
AZL DFA U.S. Core Equity Fund | 20,086,112 | 2,141,457 | (2,247,494 | ) | 485,023 | (5,548,658 | ) | 14,916,440 | 1,215,684 | 119,352 | 2,022,106 | ||||||||||||||||||||||||||||||||||
AZL DFA U.S. Small Cap Fund | 12,121,637 | 2,441,128 | (1,434,329 | ) | 110,563 | (4,061,879 | ) | 9,177,120 | 971,124 | 58,085 | 2,383,043 | ||||||||||||||||||||||||||||||||||
AZL Enhanced Bond Index Fund | 58,465,846 | 742,112 | (6,431,531 | ) | (888,652 | ) | (7,607,302 | ) | 44,280,473 | 4,670,936 | 716,281 | 25,832 | |||||||||||||||||||||||||||||||||
AZL Fidelity Institutional Asset Management Total Bond Fund, Class 2 | 77,791,210 | 3,165,489 | (8,944,378 | ) | (827,297 | ) | (12,381,272 | ) | 58,803,752 | 6,766,830 | 1,580,972 | 1,584,516 | |||||||||||||||||||||||||||||||||
AZL Gateway Fund | 15,879,837 | 43,110 | (1,862,240 | ) | 232,801 | (2,145,025 | ) | 12,148,483 | 862,206 | 43,110 | — | ||||||||||||||||||||||||||||||||||
AZL International Index Fund, Class 2 | 67,404,093 | 2,879,143 | (7,679,384 | ) | 595,525 | (13,007,239 | ) | 50,192,138 | 3,289,131 | 1,554,267 | 1,324,877 | ||||||||||||||||||||||||||||||||||
AZL MetWest Total Return Bond Fund | 77,636,975 | 757,691 | (7,786,590 | ) | (1,416,061 | ) | (10,404,171 | ) | 58,787,844 | 6,924,363 | 715,086 | 42,605 | |||||||||||||||||||||||||||||||||
AZL Mid Cap Index Fund, Class 2 | 20,096,921 | 3,238,906 | (2,447,590 | ) | 197,864 | (6,055,872 | ) | 15,030,229 | 784,049 | 115,811 | 3,123,094 | ||||||||||||||||||||||||||||||||||
AZL MSCI Emerging Markets Equity Index Fund, Class 2 | 22,761,576 | 693,635 | (321,860 | ) | 23,852 | (5,378,752 | ) | 17,778,451 | 2,943,452 | 264,637 | 428,998 | ||||||||||||||||||||||||||||||||||
AZL Russell 1000 Growth Index Fund, Class 2 | 88,312,742 | 13,602,823 | (313,065 | ) | 43,637 | (39,636,808 | ) | 62,009,329 | 4,737,153 | 42,179 | 13,482,198 | ||||||||||||||||||||||||||||||||||
AZL Russell 1000 Value Index Fund, Class 2 | 88,988,474 | 7,817,652 | (15,892,955 | ) | 2,732,507 | (17,098,194 | ) | 66,547,484 | 5,384,101 | 896,431 | 6,921,221 | ||||||||||||||||||||||||||||||||||
AZL Small Cap Stock Index Fund, Class 2 | 12,091,075 | 1,647,440 | (1,052,730 | ) | 58,396 | (3,653,872 | ) | 9,090,309 | 795,303 | 77,313 | 1,570,127 | ||||||||||||||||||||||||||||||||||
PIMCO VIT Income Portfolio | 39,472,198 | 1,196,045 | (6,586,712 | ) | (46,409 | ) | (4,093,043 | ) | 29,871,947 | 3,082,760 | 1,125,913 | — | |||||||||||||||||||||||||||||||||
PIMCO VIT Low Duration Portfolio | 39,176,597 | 537,565 | (7,696,055 | ) | (396,726 | ) | (2,260,421 | ) | 29,360,960 | 3,097,148 | 537,566 | — | |||||||||||||||||||||||||||||||||
PIMCO VIT Total Return Portfolio | 77,857,428 | 1,707,186 | (8,089,479 | ) | (1,376,315 | ) | (11,064,003 | ) | 59,034,817 | 6,574,033 | 1,707,185 | — | |||||||||||||||||||||||||||||||||
|
|
|
|
|
|
|
|
|
|
|
|
|
|
|
|
|
| ||||||||||||||||||||||||||||
| $ | 746,084,613 | $ | 45,043,501 | $ | (82,142,625) | $ | (139,783 | ) | $ | (150,743,393 | ) | $ | 558,032,181 | 54,339,725 | $ | 10,111,889 | $ | 34,783,036 | |||||||||||||||||||||||||||
|
|
|
|
|
|
|
|
|
|
|
|
|
|
|
|
|
| ||||||||||||||||||||||||||||
Pursuant to separate agreements between the Trust and the Manager, the Manager provides a Chief Compliance Officer (“CCO”) and certain compliance oversight and regulatory filing services to the Trust. Under these agreements, the Manager is entitled to an amount equal to a portion of the compensation and certain other expenses related to the individuals performing the CCO and compliance oversight services, as well as $100 per hour for time incurred in connection with the preparation and filing of certain documents with the SEC. The fees are paid to the Manager on a quarterly basis. The total expenses incurred by the Fund for these services are reflected on the Statement of Operations as “Administrative and compliance services fees.”
Citi Fund Services Ohio, Inc. (“Citi” or the “Administrator”), a wholly owned subsidiary of Citigroup, Inc., with which an officer of the Trust is affiliated, serves as the Trust’s administrator and fund accountant, and assists the Trust in all aspects of its administration and operation. The Administrator is entitled to a fee, accrued daily and paid monthly. The Administrator is entitled to an annual fee for each additional class of shares of any Fund, certain annual fees in supporting fair value services, and a Trust-wide annual fee for providing infrastructure and support in implementing the written policies and procedures comprising the Fund’s compliance program. The Administrator is also reimbursed for certain expenses incurred. The total expenses incurred by the Fund for these services are reflected on the Statement of Operations as “Administration fees.”
FIS Investor Services LLC (“FIS”) serves as the Fund’s transfer agent. Under the Transfer Agent Agreement, the Trust pays FIS a fee for its services and reimburses FIS for all of their reasonable out-of-pocket expenses incurred in providing these services.
The Bank of New York Mellon (“BNY Mellon” or the “Custodian”) serves as the Trust’s custodian. For these services as custodian, the Funds pay BNY Mellon a fee based on a percentage of assets held on behalf of the Funds, plus certain out-of-pocket charges.
Allianz Life Financial Services, LLC (“ALFS”), an affiliate of the Manager, serves as distributor of the Fund. ALFS receives an annual Trust-wide annual fee of $7,500, paid by the Manager from its profits and not by the Trust, for recordkeeping and reporting services.
Certain Officers and Trustees of the Trust are affiliated with the Manager or the Administrator. Such Officers (except for the Trust’s CCO as noted above) and Trustees receive no compensation from the Trust for serving in their respective roles.
10
AZL MVP Fusion Balanced Fund
Notes to the Financial Statements
December 31, 2022
4. Investment Valuation Summary
The valuation techniques employed by the Fund, as described below, maximize the use of observable inputs and minimize the use of unobservable inputs in determining fair value. The inputs used for valuing the Fund’s investments are summarized in the three broad levels listed below:
| ● | Level 1 - quoted prices in active markets for identical assets |
| ● | Level 2 - other significant observable inputs (including quoted prices for similar securities, interest rates, prepayments speeds, credit risk, etc.) |
| ● | Level 3 - significant unobservable inputs (including the Fund’s own assumptions in determining the fair value of investments) |
Changes in valuation techniques may result in transfers in or out of an assigned level within the disclosure hierarchy. The inputs or methodology used for valuing investments is not necessarily an indication of the risk associated with investing in those investments.
Investments in other investment companies are valued at their published net asset value (“NAV”). Security prices are determined pursuant to valuation procedures approved by the Trust’s Board of Trustees (the “Board” or “Trustees”) as of the close of the New York Stock Exchange (“NYSE”) (generally 4:00 pm Eastern Time). The investments utilizing Level 1 valuations represent investments in open-end investment companies. Futures contracts are valued at the settlement prices established each day on the primary exchange and are typically categorized as Level 1 in the fair value hierarchy.
The Board has designated the Manager to perform the Fund’s fair value determinations in accordance with valuation procedures approved by the Board. The effect of using fair value pricing is that the Fund’s NAV will be subject to the judgment of the Manager. The Manager’s fair valuation process is subject to the oversight of the Board.
The following is a summary of the valuation inputs used as of December 31, 2022 in valuing the Fund’s investments based upon the three levels defined above:
| Investment Securities: | Level 1 | Level 2 | Level 3 | Total | ||||||||||||||||||||||||||||||||||||
Affiliated Investment Companies | $558,032,181 | $— | $— | $558,032,181 | ||||||||||||||||||||||||||||||||||||
|
|
|
|
|
|
|
| |||||||||||||||||||||||||||||||||
Total Investment Securities | 558,032,181 | — | — | 558,032,181 | ||||||||||||||||||||||||||||||||||||
|
|
|
|
|
|
|
| |||||||||||||||||||||||||||||||||
Other Financial Instruments:* | ||||||||||||||||||||||||||||||||||||||||
Futures Contracts | (125,220) | — | — | (125,220) | ||||||||||||||||||||||||||||||||||||
|
|
|
|
|
|
|
| |||||||||||||||||||||||||||||||||
Total Investments | $557,906,961 | $— | $— | $557,906,961 | ||||||||||||||||||||||||||||||||||||
|
|
|
|
|
|
|
| |||||||||||||||||||||||||||||||||
| * | Other Financial Instruments would include any derivative instruments, such as futures contracts. These investments are generally recorded in the financial statements at variation margin. |
5. Security Purchases and Sales
For the year ended December 31, 2022, cost of purchases and proceeds from sales of securities (excluding securities maturing less than one year from acquisition) were as follows:
| Purchases | Sales | |||||||||
AZL MVP Fusion Balanced Fund | $ | 45,043,501 | $ | 82,142,625 | ||||||
6. Investment Risks
The risks below are presented in an order intended to facilitate readability. Their order does not imply that the realization of one risk is more likely to occur more frequently than another risk, nor does it imply that the realization of one risk is likely to have a greater adverse impact than another risk. The Fund may be subject to other risks in addition to these identified risks. This section discusses certain common principal risks encountered by the Fund.
Derivatives Risk: The Fund may invest directly or through affiliated or unaffiliated mutual funds or unregistered investment pools in derivative instruments such as futures, options, and options on futures. A derivative is a financial contract whose value depends on, or is derived from, the value of an underlying asset, reference rate, or risk. Use of derivative instruments involves risks different from, or possibly greater than, the risks associated with investing directly in securities and other traditional investments. Derivatives are subject to a number of other risks, such as liquidity risk, interest rate risk, market risk, credit risk, and selection risk. Derivatives also involve the risk of mispricing or improper valuation and the risk that changes in the value may not correlate perfectly with the underlying asset, rate, or index. Using derivatives may result in losses, possibly in excess of the principal amount invested. Also, suitable derivative transactions may not be available in all circumstances. The other party to a derivatives contract could default.
Foreign Securities Risk: Investing in the securities of non-U.S. issuers involves a number of risks, such as fluctuations in currency values, adverse political, social or economic developments, and differences in social and economic developments or policies. Such risks include future political and economic developments, and the possible imposition of exchange controls or other foreign governmental laws and restrictions. In addition, with respect to certain countries, there is the possibility of expropriation of assets, confiscatory taxation, political or social instability or diplomatic developments which could adversely affect investments in those securities. Certain foreign companies may be subject to sanctions, embargoes, or other governmental actions that may impair or otherwise limit the ability to invest in, receive, hold or sell the securities of such companies.
Fund of Fund Risk: The Fund, as a shareholder of the underlying funds, indirectly bears its proportionate share of any investment management fees and other expenses of the underlying funds. Further due to the fees and expenses paid by the Fund, as well as small variations in the Fund’s actual allocations to the underlying funds and any futures and cash held in the Fund’s portfolio, the performance and income distributions of the Fund will not be the same as the performance and income distributions of the underlying funds. In addition, the Fund maintains indirect exposure to various types of risk which may exist in the underlying Funds, such as foreign securities risk, fixed income securities risk and other risks.
Interest Rate Risk: Debt securities held by an underlying fund may decline in value due to rising interest rates. The price of a bond is also affected by its maturity. Bonds with longer maturities generally have greater sensitivity to changes in interest rates.
11
AZL MVP Fusion Balanced Fund
Notes to the Financial Statements
December 31, 2022
Market Risk: The market price of securities owned by the underlying funds may go up or down, sometimes rapidly and unpredictably. Securities may decline in value due to factors affecting securities markets generally or particular industries represented in the securities markets. The value of a security may decline due to general market conditions that are not specifically related to a particular company, such as real or perceived adverse economic conditions, changes in the general outlook for corporate earnings, changes in interest or currency rates, or adverse investor sentiment, as well as natural disasters, and outbreaks of infectious illnesses or other widespread public health issues.
Quantitative Investing Risk: The value of securities selected using quantitative analysis can react differently to issuer, political, market, and economic developments than the market as a whole or securities selected using only fundamental analysis. The factors used in quantitative analysis and the weight placed on those factors may not be predictive of a security’s value. In addition, factors that affect a security’s value can change over time and these changes may not be reflected in the quantitative model. A quantitative model can be adversely affected by errors or imperfections in the factors or the data on which evaluations are based, or by technical issues with construction or implementation of the model, which in any case may result in a failure of the portfolio to perform as expected or a failure to identify securities that will perform well in the future.
7. Coronavirus (COVID-19) Pandemic
The global outbreak of the COVID-19 strain of the coronavirus has caused adverse effects on many companies, sectors, nations, regions and the markets in general, and may continue for an unpredictable duration. The effects of this pandemic may adversely impact the value and performance of the Fund, its ability to buy and sell fund investments at appropriate valuations, and its ability to achieve its investment objective(s).
8. Federal Tax Information
It is the policy of the Fund to continue to qualify as a regulated investment company by complying with the provisions available to certain investment companies, as defined under Subchapter M of the Internal Revenue Code, and to make distributions of net investment income and net realized gains sufficient to relieve it from all, or substantially all, federal income taxes. Accordingly, no provisions for federal income taxes are required in the financial statements.
Management of the Fund has reviewed tax positions taken in tax years that remain subject to examination by all major tax jurisdictions, including federal (i.e., the last four tax year ends and the interim tax period since then, as applicable). Management believes that there is no tax liability resulting from unrecognized tax benefits related to uncertain tax positions taken.
Cost of securities, including derivatives and short positions as applicable, for federal income tax purposes at December 31, 2022 is $598,205,828. The gross unrealized appreciation/ (depreciation) on a tax basis is as follows:
Unrealized appreciation | $10,078,575 | ||||||||||||||
Unrealized (depreciation) | (50,252,222) | ||||||||||||||
|
| ||||||||||||||
Net unrealized appreciation/(depreciation) | $(40,173,647) | ||||||||||||||
|
|
The tax character of dividends paid to shareholders during the year ended December 31, 2022 was as follows:
| Ordinary Income | Net Long-Term Capital Gains | Total Distributions(a) | |||||||||||||
AZL MVP Fusion Balanced Fund | 16,011,158 | 25,319,817 | $ | 41,330,975 | |||||||||||
| (a) | Total distributions paid may differ from the Statements of Changes in Net Assets because dividends are recognized when actually paid for tax purposes. |
The tax character of dividends paid to shareholders during the year ended December 31, 2021 was as follows:
| Ordinary Income | Net Long-Term Capital Gains | Total Distributions(a) | |||||||||||||
AZL MVP Fusion Balanced Fund | $ | 17,895,771 | $ | – | $ | 17,895,771 | |||||||||
| (a) | Total distributions paid may differ from the Statements of Changes in Net Assets because dividends are recognized when actually paid for tax purposes. |
At December 31, 2022, the components of accumulated earnings on a tax basis were as follows:
| Undistributed Ordinary Income | Undistributed Long-Term Capital Gains | Accumulated Capital and Other Losses | Unrealized Appreciation/ Depreciation(a) | Total Accumulated Earnings/ (Deficit) | |||||||||||||||||||||
AZL MVP Fusion Balanced Fund | $ | 14,540,099 | $ | 27,736,574 | $ | — | $ | (40,173,647 | ) | $ | 2,103,026 | ||||||||||||||
| (a) | The differences between book-basis and tax-basis unrealized appreciation/(depreciation) is attributable primarily to tax deferral of losses on wash sales, mark-to-market of futures contracts and straddles. |
12
AZL MVP Fusion Balanced Fund
Notes to the Financial Statements
December 31, 2022
9. Ownership and Principal Holders
The beneficial ownership, either directly or indirectly, of more than 25% of the voting securities of a fund creates presumptions of control of the fund, under section 2 (a)(9) of the 1940 Act. As of December 31, 2022, the Fund had an individual shareholder account which is affiliated with the Manager representing ownership in excess of 90% of the Fund. Investment activities of this shareholder could have a material impact to the Fund.
10. Subsequent Events
Management of the Fund has evaluated the need for additional disclosures or adjustments resulting from events through the date the financial statements were issued. Based on this evaluation, there were no subsequent events to report that would have material impact on the Fund’s financial statements, except as noted below.
The reorganization, as discussed in Note 1, whereby the AZL MVP Balanced Index Strategy Fund will acquire all of the assets and liabilities of the Fund, is expected to be completed on or about March 10, 2023.
13
REPORT OF INDEPENDENT REGISTERED PUBLIC ACCOUNTING FIRM
To the Board of Trustees of Allianz Variable Insurance Products Fund of Funds Trust and Shareholders of
AZL MVP Fusion Balanced Fund
Opinion on the Financial Statements
We have audited the accompanying statement of assets and liabilities, including the schedule of portfolio investments, of AZL MVP Fusion Balanced Fund (one of the funds constituting Allianz Variable Insurance Products Fund of Funds Trust, referred to hereafter as the “Fund”) as of December 31, 2022, the related statement of operations for the year ended December 31, 2022, the statements of changes in net assets for each of the two years in the period ended December 31, 2022, including the related notes, and the financial highlights for each of the five years in the period ended December 31, 2022 (collectively referred to as the “financial statements”). In our opinion, the financial statements present fairly, in all material respects, the financial position of the Fund as of December 31, 2022, the results of its operations for the year then ended, the changes in its net assets for each of the two years in the period ended December 31, 2022 and the financial highlights for each of the five years in the period ended December 31, 2022 in conformity with accounting principles generally accepted in the United States of America.
Basis for Opinion
These financial statements are the responsibility of the Fund’s management. Our responsibility is to express an opinion on the Fund’s financial statements based on our audits. We are a public accounting firm registered with the Public Company Accounting Oversight Board (United States) (PCAOB) and are required to be independent with respect to the Fund in accordance with the U.S. federal securities laws and the applicable rules and regulations of the Securities and Exchange Commission and the PCAOB.
We conducted our audits of these financial statements in accordance with the standards of the PCAOB. Those standards require that we plan and perform the audit to obtain reasonable assurance about whether the financial statements are free of material misstatement, whether due to error or fraud.
Our audits included performing procedures to assess the risks of material misstatement of the financial statements, whether due to error or fraud, and performing procedures that respond to those risks. Such procedures included examining, on a test basis, evidence regarding the amounts and disclosures in the financial statements. Our audits also included evaluating the accounting principles used and significant estimates made by management, as well as evaluating the overall presentation of the financial statements. Our procedures included confirmation of securities owned as of December 31, 2022 by correspondence with the transfer agent and brokers; when replies were not received from brokers, we performed other auditing procedures. We believe that our audits provide a reasonable basis for our opinion.
/s/ PricewaterhouseCoopers LLP
New York, New York
February 23, 2023
We have served as the auditor of one or more investment companies in the Allianz Variable Insurance Products complex since 2018.
14
Other Federal Income Tax Information (Unaudited)
For the year ended December 31, 2022, 10.72% of the total ordinary income dividends paid by the Fund qualify for the corporate dividends received deductions available to corporate shareholders.
During the year ended December 31, 2022, the Fund declared net long-term capital gain distributions of $25,319,817.
15
A description of the policies and procedures that the Fund uses to determine how to vote proxies relating to portfolio securities is available, without charge, upon request, by visiting the Securities and Exchange Commission’s (‘‘Commission’’) website at www.sec.gov, or by calling 800-624-0197.
Information regarding how the Fund voted proxies relating to portfolio securities during the most recent 12-month period ended June 30th is available (i) without charge, upon request, by calling 800-624-0197; (ii) on the Trust’s website at https://www.allianzlife.com; and (iii) on the Commission’s website at http://www.sec.gov.
The Fund files complete Schedules of Portfolio Holdings with the Commission for the first and third quarters of each fiscal year on Form N-PORT. Schedules of Portfolio Holdings for the Fund are available without charge on the Commission’s website at http://www.sec.gov, or may be obtained by calling 800-624-0197.
16
Approval of Investment Advisory Agreement (Unaudited)
Subject to the general supervision of the Board of Trustees (the “Board”) and in accordance with the investment objectives and restrictions of each separate series (each a “Fund,” together, the “Funds”) of the Allianz Variable Insurance Products Fund of Funds Trust (the “Trust”), investment advisory services are provided to the Funds by Allianz Investment Management LLC (the “Manager”). The Manager manages each Fund pursuant to an investment management agreement (the “Management Agreement”) with the Trust in respect of each such Fund. The Management Agreement provides that the Manager, subject to the supervision and approval of the Board, is responsible for the management of each Fund. For management services, each Fund pays the Manager an investment advisory fee based upon each Fund’s average daily net assets. The Manager has contractually agreed to limit the expenses of each Fund by reimbursing the Fund if and when total Fund operating expenses exceed certain amounts until at least April 30, 2024 (the “Expense Limitation Agreement”).
In reviewing the services provided by the Manager and the terms of the Management Agreement, the Board receives and reviews information related to the Manager’s experience and expertise in the variable insurance marketplace. In addition, the Board receives information regarding the Manager’s expertise with regard to portfolio diversification and asset allocation requirements within variable insurance products issued by Allianz Life Insurance Company of North America (“Allianz Life”) and its subsidiary, Allianz Life Insurance Company of New York (“Allianz of New York”). Currently, the Funds are offered only through Allianz Life and Allianz of New York variable products, and not in the retail fund market.
As required by the Investment Company Act of 1940 (the “1940 Act”), the Board has reviewed and approved the Management Agreement with the Manager. The Board’s decision to approve this contract reflects the exercise of its business judgment on whether to approve new arrangements and continue the existing arrangements. During its review of the contract, the Board considered many factors, among the most material of which are: the Fund’s investment objectives and long-term performance; the Manager’s management philosophy, personnel, processes and investment performance, including its compliance history and the adequacy of its compliance processes; the preferences and expectations of Fund shareholders (and underlying contract owners) and their relative sophistication; the continuing state of competition in the mutual fund industry; and comparable fees in the mutual fund industry.
The Board also considered the compensation and benefits received by the Manager. This includes fees received for services provided to a Fund by employees of the Manager or of affiliates of the Manager and research services received by the Manager from brokers that execute Fund trades, as well as advisory fees. The Board considered the fact that: (1) the Manager and the Trust are parties to an Administrative Services Agreement and a Compliance Services Agreement, under which the Manager is compensated by the Trust for performing certain administrative and compliance services including providing an employee of the Manager or one of its affiliates to act as the Trust’s Chief Compliance Officer; and (2) Allianz Life Financial Services, LLC, an affiliated person of the Manager, is a registered securities broker-dealer and received (along with its affiliated persons) payments made by the underlying funds pursuant to Rule 12b-1.
The Board is aware that various courts have interpreted provisions of the 1940 Act and have indicated in their decisions that the following factors may be relevant to an adviser’s compensation: the nature, extent and quality of the services provided by the adviser, including the performance of the fund; the adviser’s cost of providing the services; the extent to which the adviser may realize “economies of scale” as the fund grows larger; any indirect benefits that may accrue to the adviser and its affiliates as a result of the adviser’s relationship with the fund; performance and expenses of comparable funds; the profitability of acting as adviser to the fund; and the extent to which the independent Board members, who are not “interested persons” of a fund as defined by the 1940 Act (“Independent Trustees”), are fully informed about all facts bearing on the adviser’s services and fees. The Board is aware of these factors and takes them into account in its review of the Management Agreement for the Funds.
Each member of the Board considered and weighed these factors in light of his or her experience in governing the Trust. The Board is assisted in its deliberations by the advice of independent legal counsel to the Independent Trustees (“Independent Trustee Counsel”). In this regard, the Board requests and receives a significant amount of information about the Funds and the Manager. Some of this information is provided at each regular meeting of the Board; additional information is provided in connection with the particular meetings at which the Board’s formal review of the Management Agreement occurs. In between regularly scheduled meetings, the Board may receive information on particular matters as the need arises. Thus, the Board’s evaluation of the Management Agreement is informed by reports covering such matters as: the Manager’s investment philosophy, personnel and processes, and the Fund’s investment performance (in absolute terms as well as in relationship to its benchmark and certain competitor or “peer group” funds). In connection with comparing the performance of each Fund versus its benchmark, the Board receives reports on the extent to which the Fund’s performance may be attributed to various applicable factors, such as asset class allocation decisions and volatility management strategies, if applicable, the performance of the underlying funds, rebalancing decisions, and the impact of cash positions and Fund fees and expenses. The Board also receives reports on the Funds’ expenses (including the advisory fee itself and the overall expense structure of the Funds, both in absolute terms and relative to peer group and/or competing funds, with due regard for the Expense Limitation Agreement and additional voluntary expense limitations); the use and allocation of any brokerage commissions derived from trading the Funds’ portfolio securities; the nature, extent and quality of the advisory and other services provided to the Fund by the Manager and its affiliates; compliance and audit reports concerning the Funds and the companies that service them; and relevant developments in the mutual fund industry and how the Funds and/or the Manager are responding to them.
The Board also receives financial information about the Manager, including reports on the compensation and benefits the Manager derives from its relationships with the Funds. These reports cover not only the fees under the Management Agreement, but also the fees, if any, received for providing other services to the Funds. The reports also discuss any indirect or “fall-out” benefits the Manager or its affiliates may derive from their relationships with the Funds.
The Management Agreement was most recently considered at Board meetings held in the summer and fall of 2022. Information relevant to the approval of the Management Agreement was considered at Board meetings held June 14 and 21, 2022, and September 13, 2022, as well as at various other meetings preceding those meetings. Accordingly, the Management Agreement was approved by the Board at an in-person meeting on September 13, 2022. At such meeting the Board also approved the Expense Limitation Agreement between the Manager and the Trust for the period ending April 30, 2024.
In connection with such meetings, the Board requested and evaluated extensive materials from the Manager, including performance and expense information for other investment companies with similar investment objectives derived from data compiled by an independent third-party provider and other sources believed to be reliable by the Manager and the Trustees. Prior to voting, the Trustees reviewed the proposed approval of the Management Agreement with management and with Independent Trustee Counsel and received a memorandum from such counsel discussing the legal standards for their consideration of the proposed approval. The Independent Trustees also discussed the proposed approval in private sessions with Independent Trustee Counsel at which no representatives of the Manager were present. In reaching their determinations relating to the approval of the Management Agreement, in respect of each Fund, each member of the Board considered all factors he or she believed relevant. The Board based its decision to approve
17
the Management Agreement on the totality of the circumstances and relevant factors, and with a view to past and future long-term considerations. Not all of the factors and considerations discussed above and below are necessarily relevant to every Fund, and the Board did not assign relative weights to factors discussed herein or deem any one or group of them to be controlling in and of themselves.
Shareholder reports must include a discussion of certain factors relating to the selection of the investment adviser and the approval of the advisory fee. The “factors” enumerated by the SEC are set forth below in italics, as well as the Board’s conclusions regarding such factors:
(1) The nature, extent and quality of services provided by the Manager. The Trustees noted that the Manager, subject to the oversight of the Board, administers each Fund’s business and other affairs. The Trustees noted that the Manager also provides the Trust and each Fund with such administrative and other services (exclusive of, and in addition to, any such services provided by any other service providers retained by the Trust on behalf of the Funds) and executive and other personnel as are necessary for the operation of the Trust and the Funds. Except for the Trust’s Chief Compliance Officer and certain compliance staff, the Manager pays all of the compensation of Trustees and officers of the Trust who are employees of the Manager or its affiliates.
The Board considered the scope and quality of services provided by the Manager and noted that the scope of the services provided has continued to expand as a result of regulatory and other developments. The Board noted, for example, that the Manager is responsible for maintaining and monitoring its own compliance program, and this compliance program has been continuously refined and enhanced in light of new regulatory requirements. The Board considered the capabilities and resources which the Manager has dedicated to performing services on behalf of the Trust and its Funds. The quality of administrative and other services, including the Manager’s role in coordinating the activities of the Trust’s other service providers, also were considered. The Board concluded that, overall, they were satisfied with the nature, extent and quality of services provided (and expected to be provided) to the Trust and to each of the Funds under the Management Agreement.
(2) The investment performance of the Funds and the Manager. In connection with every quarterly Board meeting and the summer and fall 2022 contract review process, Trustees received extensive information on the performance results of each Fund. This included, for example, performance information on absolute total return, performance versus the appropriate benchmark(s) and performance versus peer groups as reported by Lipper, the contribution to performance of the Manager’s asset class allocation decisions and volatility management strategies, if applicable, the performance of the underlying funds, and the impact on performance of rebalancing decisions, cash and Fund fees. This included Lipper performance information on the Funds for the previous quarter, and previous one-, three- and five-year periods, to the extent available. For example, in connection with the Board meetings held June 14 and 21, 2022, and September 13, 2022, the Manager reported that, for the five-year period ended December 31, 2021, two Funds were in the top 40%, three were in the middle 20%, and seven were in the bottom 40%. The Manager reported that for the three-year period ended December 31, 2021, three Funds were in the top 40%, two were in the middle 20%, and seven were in the bottom 40%. For the one-year period ended December 31, 2021, six Funds were in the top 40%, two were in the middle 20%, and four were in the bottom 40% against peers.
The Manager also reported on the performance of the MVP Funds compared to custom managed-volatility peer groups. For the five-year period ended December 31, 2021, four Funds were in the top 40%, two were in the middle 20%, and four were in the bottom 20%. For the three-year period ended December 31, 2021, four Funds were in the top 40%, two were in the middle 20%, and four were in the bottom 40%. For the one-year period ended December 31, 2021, seven Funds were in the top 40%, two were in the middle 20%, and one was in the bottom 40%. The Board members discussed with the Manager and considered the impact of the volatility management strategies on performance in different market environments, where applicable, and considered whether they were operating as intended. The Board noted, in particular, the impact of certain characteristics of the Funds’ volatility management strategies in relation to volatility experienced as a result of the COVID-19 pandemic, and that relative performance had improved as the markets stabilized.
At the Board meeting held September 13, 2022, the Board also received updated performance information for the Funds, including updated Lipper peer group ranking information, for various periods ending June 30, 2022.
At the Board meeting held September 13, 2022, the Trustees determined that the investment performance of the Funds was acceptable.
(3) The costs of services to be provided and profits to be realized by the Manager and its affiliates from the relationship with the Funds. The Board considered that the Manager receives an advisory fee from each of the Funds. The Manager reported that for the three MVP Fusion Funds the advisory fee paid put these Funds in the 13th percentile of the customized peer group. The Manager reported that for the four MVP Index Strategy Funds the advisory fee paid put them in the 23rd percentile of the customized peer group, and for the AZL Balanced Index Strategy Fund the advisory fee paid put it in the 7th percentile of the customized peer group. The Manager reported that for the AZL DFA Multi-Strategy Fund, the advisory fee paid was in the 5th percentile. The Manager reported that for the AZL MVP DFA Multi-Strategy, AZL MVP FIAM Multi-Strategy, and AZL MVP T. Rowe Price Capital Appreciation Plus Funds, the advisory fee paid was in the 1st percentile. (A lower percentile reflects lower fund fees and is better for fund shareholders.) Trustees were provided with information on the total expense ratios of the Funds and other funds in the customized peer groups, and the Manager reported upon the challenges in making peer group comparisons for the Funds. The Board further considered and found that the advisory fee paid to the Manager with respect to each Fund was based on services provided to the Fund that were in addition to, rather than duplicative of, the services provided pursuant to the advisory agreements for the underlying funds in which the Fund invests.
The Manager provided information concerning the profitability of the Manager’s investment advisory activities for the period from 2019 through 2021. The Board recognized that it is difficult to make comparisons of profitability from investment company advisory agreements because comparative information is not generally publicly available and is affected by numerous factors, including the structure of the particular adviser, the types of funds it manages, its business mix, numerous assumptions regarding allocation of expenses and the adviser’s capital structure and cost of capital. In considering profitability information, the Board considered the possible effect of certain fall-out benefits to the Manager and its affiliates. The Board focused on profitability of the Manager’s relationships with the Funds before taxes and distribution expenses. The Board recognized that the Manager should earn a reasonable level of profits for the services it provides to each Fund.
The Board also considered that Wilshire Funds Management (“Wilshire”) serves as a consultant to the Manager in preparing statistical and other factual information for use in the creation and maintenance of the asset allocation models for the AZL MVP Fusion Funds, pursuant to an agreement between the Manager and Wilshire. Wilshire serves as a consultant to the Manager with respect to selecting the AZL MVP Fusion Funds’ underlying funds and the asset allocations among the underlying funds. The Manager, not any Fund, pays a consultant fee to Wilshire.
(4) and (5) The extent to which economies of scale would be realized as the Funds grow, and whether fee levels reflect these economies of scale. The Board noted that the advisory fee schedules for the Funds do not contain breakpoints that reduce the fee rate on assets above specified levels. The Board recognized that breakpoints may be an appropriate way for the Manager to share its economies of scale, if any, with Funds that have substantial assets. The Board found there was no uniform methodology for establishing breakpoints that give effect to Fund-specific services provided by the Manager. The Board noted that in the fund industry as a whole, as well as among funds similar to the Funds, there is no
18
uniformity or pattern in the fees and asset levels at which breakpoints (if any) apply. Depending on the age, size, and other characteristics of a particular fund and its manager’s cost structure, different conclusions can be drawn as to whether there are economies of scale to be realized at any particular level of assets, notwithstanding the intuitive conclusion that such economies exist, or will be realized at some level of total assets. Moreover, because different managers have different cost structures and service models, it is difficult to draw meaningful conclusions from the breakpoints that may have been adopted by other funds. The Board also noted that the advisory agreements for many funds do not have breakpoints at all, or if breakpoints exist, they may be at asset levels significantly greater than those of the individual Funds. The Board noted that the total assets in all of the Funds, as of June 30, 2022, were approximately $8.2 billion and that the largest Fund, the AZL MVP Growth Index Strategy Fund, had assets of approximately $2.1 billion.
The Board noted that the Manager has agreed to temporarily limit Fund expenses under the Expense Limitation Agreement, which has the effect of reducing expenses similar to implementation of advisory fee breakpoints. The Manager has committed to continue to consider the continuation of expense limits and/or advisory fee breakpoints as Fund assets change. The Board receives quarterly reports on the level of Fund assets. The Board expects to continue to consider: (a) the extent to which economies of scale have been realized, and (b) whether the advisory fee should be modified, either in connection with the next renewal of the Management Agreement or by modifying the Expense Limitation Agreement, to reflect such economies of scale, if any.
Having taken these factors into account, the Board concluded that the absence of breakpoints in the Funds’ advisory fee rate schedules was acceptable under each Fund’s circumstances.
In conclusion, after full consideration of the above factors, as well as such other factors as each member of the Board considered instructive in evaluating the Management Agreement, the Board concluded that the advisory fees were reasonable, and that the continuation of the Management Agreement was in the best interest of the Funds.
19
Information about the Board of Trustees and Officers (Unaudited)
The Trust is managed by the Trustees in accordance with the laws of the state of Delaware governing business trusts. In addition to serving on the Board of Trustees of the Trust, each Trustee serves on the Board of the Allianz Variable Insurance Products Trust (“VIP Trust”) and the AIM ETF Products Trust (“ETF Trust”) (collectively, the Trust, the VIP Trust, and ETF Trust are the “AIM Complex”). There are currently seven Trustees, one of whom is an “interested person” of the Trust within the meaning of that term under the 1940 Act. The Trustees and Officers of the Trust, and their addresses, years of birth, their positions held with the Trust, their terms of office with the Trust and length of time served, their principal occupation(s) during the past five years, the number of portfolios in the Trust they oversee, and their other directorships held during the past five years are as follows:
Independent Trustees(1)
| Name, Address, and Birth Year | Positions Held with AIM Complex | Term of Office(2)/Length | Principal Occupation(s) During Past 5 Years | Number of Portfolios Overseen for the AIM Complex | Other 5 Years | |||||
Peggy L. Ettestad (1957) 5701 Golden Hills Drive Minneapolis, MN 55416 | Lead Independent Trustee | Since 10/14 (Trustee since 2/07) | Managing Director, Red Canoe Management Consulting LLC, 2008 to present | 50 | None | |||||
Tamara Lynn Fagely (1958) 5701 Golden Hills Drive Minneapolis, MN 55416 | Trustee | Since 12/17 | Retired; previously, Chief Operations Officer, Hartford Funds, 2012 to 2013 | 50 | Diamond Hill Funds (10 Funds) | |||||
Richard H. Forde (1953) 5701 Golden Hills Drive Minneapolis, MN 55416 | Trustee | Since 12/17 | Retired; previously, Member of the Board and Chairman of the Finance and Investment Committee, Connecticut Water Service, Inc., 2013 to 2019 | 50 | Connecticut Water Service, Inc. | |||||
Jack Gee (1959) 5701 Golden Hills Drive Minneapolis, MN 55416 | Trustee | Since 1/22 (Consultant to the Independent Trustees since 2/20)(3) | Retired; previously, Managing Director, BlackRock, Inc., Treasurer and Chief Financial Officer U.S. iShares, 2004 to 2019 | 50 | Engine No. 1 ETF Trust (2 Funds); Esoterica Thematic Trust (2019 - 2020) | |||||
Claire R. Leonardi (1955) 5701 Golden Hills Drive Minneapolis, MN 55416 | Trustee | Since 2/04 | Retired; previously, CEO, Health eSense Inc.(a medical device company), 2015 to 2018, and Connecticut Innovations, Inc. (a venture capital firm), 2012 to 2015 | 50 | None | |||||
Dickson W. Lewis (1948) 5701 Golden Hills Drive Minneapolis, MN 55416 | Trustee | Since 2/04 | Retired; previously, senior executive for Lifetouch National School Studios (a photography company), 2006 to 2014, Jostens (a producer of year books and class rings), 2001 to 2006, and Fortis Financial Group, 1997 to 2001 | 50 | None | |||||
20
Interested Trustee(4)
| Name, Address, and Birth Year | Positions Held with AIM Complex | Term of Office(2)/Length of Time Served | Principal Occupation(s) During Past 5 Years | Number of Portfolios Overseen | Other Directorships Held Outside the AIM Complex During Past 5 Years | |||||
Brian Muench (1970) 5701 Golden Hills Drive Minneapolis, MN 55416 | Trustee | Since 6/11 | President, Allianz Investment Management LLC, 2010 to present; Vice President, Allianz Life, 2011 to present | 50 | None | |||||
| (1) | Each of the Independent Trustees is a member of the Audit Committee. |
| (2) | Indefinite. |
| (3) | Prior to January 1, 2022, Mr. Gee served as a consultant to the Independent Trustees since February 2020, during which he attended meetings of the Board and its standing committees, including the audit committee, solely in his capacity as a consultant, and was not entitled to vote. |
| (4) | Is an “interested person,” as defined by the 1940 Act, due to employment by Allianz Life and the Manager. |
Officers
| Name, Address, and Birth Year | Positions Held with AIM Complex | Term of Office(1)/ Length of Time Served | Principal Occupation(s) During Past 5 Years | |||
Brian Muench (1970) 5701 Golden Hills Drive Minneapolis, MN 55416 | President | Since 11/10 | President, Allianz Investment Management LLC, November 2010 to present; Vice President, Allianz Life, 2011 to present. | |||
Erik Nelson (1972) 5701 Golden Hills Drive Minneapolis, MN 55416 | Secretary | Since 12/20 | Chief Legal Officer, Allianz Investment Management LLC; Associate General Counsel, Senior Counsel, Allianz Life, 2008 to present. | |||
Bashir C. Asad (1963) Citi Fund Services Ohio, Inc. 4400 Easton Commons, Suite 200 Columbus, OH 43219 | Treasurer, Principal Accounting Officer and Principal Financial Officer | Since 06/16 | Senior Vice President, Citi Fund Services Ohio, Inc., 2011 to present. | |||
Chris R. Pheiffer (1968) 5701 Golden Hills Drive Minneapolis, MN 55416 | Chief Compliance Officer(2) and Anti-Money Laundering Compliance Officer | Since 02/14 | Chief Compliance Officer of the Trust and the VIP Trust, 2014 to present, and the ETF Trust, 2020 to present. | |||
Michael Tanski (1970) 5701 Golden Hills Drive Minneapolis, MN 55416 | Vice President | Since 04/09 | Assistant Vice President, Allianz Investment Management LLC, 2013 to present. | |||
| (1) | Indefinite. |
| (2) | The Manager and the Trust are parties to a Compliance Services Agreement under which the Manager provides an employee of the Manager or one of its affiliates to act as the Trust’s Chief Compliance Officer. |
The Fund’s Statement of Additional Information (“SAI”) contains additional information about the Trust’s Trustees and Officers. The SAI is available without charge, upon request, by calling toll-free 800-624-0197 or at https://www.allianzlife.com.
21

| The Allianz VIP Fund of Funds are distributed by Allianz Life Financial Services, LLC. | ||
| These Funds are not FDIC Insured. | ANNRPT1222 02/23 |
AZL® MVP FusionSM Conservative Fund
Annual Report
December 31, 2022

This report is submitted for the general information of the shareholder of the Fund. The report is not authorized for distribution to prospective investors in the Fund unless preceded or accompanied by an effective prospectus, which contains details concerning the sales charges and other pertinent information.
Allianz Investment Management LLC serves as Manager for the AZL® MVP FusionSM Conservative Fund.
What factors affected the Fund’s performance during the year ended December 31, 2022?*
For the year ended December 31, 2022, the AZL® MVP FusionSM Conservative (the “Fund”) returned (14.15)%. That compared to a (18.11)%, (13.01)% and an (14.64)% total return for its benchmarks, the S&P 500 Index, the Bloomberg U.S. Aggregate Bond Index, and the Conservative Composite Index, respectively.1
The Fund is a fund of funds that achieves broad diversification by investing in underlying funds. The Fund typically holds between 25% and 45% of its assets in equity funds and 55% to 75% of its assets in fixed-income funds. The Fund also employs the MVP (Managed Volatility Portfolio) risk management process, which is intended to adjust the risk of the portfolio based on quantitative indicators of market risk, such as the current level of fund and market volatility.
Domestic equities began the year at near all-time highs, but began to decline early in 2022 due to a combination of rising inflation and geopolitical uncertainties. The Federal Reserve (the Fed) shifted to a more hawkish policy approach in an attempt to bring inflation under control, as did many global central banks. The Fed increased the federal funds rate multiple times throughout the year for a combined total of 425 basis points. Russia’s invasion of Ukraine also weighed on global markets, although European countries were particularly hard hit due to their geographic proximity to the conflict and reliance on Russian commodities such as energy and wheat.
Despite strong labor rates throughout developed markets, high inflation and an anticipated economic slowdown had a negative effect on investor sentiment for the year under review. The S&P 500 declined as company valuations struggled under the higher interest rate environment. Investors grew risk averse as fears of an economic recession loomed, selling off equity positions to avoid the volatility in equity markets. By the end of the period under review, U.S. equities had experienced their worst year since the Great Financial Crisis of 2008, and international equities performed only slightly better.
The Fed’s actions made short-term financing more expensive, and the U.S. Treasury yield curve ultimately inverted with 2-year Treasuries yielding more than 10-year Treasuries by 0.55% at the end of 2022. The monetary tightening generated headwinds for domestic fixed income markets as investors demanded higher yields to account for rising rates. Widening credit spreads further weighed on prices on lower-quality bonds as investors demanded to be compensated for rising credit risks. Nearly all fixed income sectors finished the year with negative performance.
The Fund, which invests in both U.S. and international markets, outperformed its composite benchmark during the 12-month period. Its allocation to developed non-U.S. contributed to performance and emerging market non-U.S. equities detracted from performance as these are not included in its composite benchmark. In addition, the Fund’s performance compared to the composite benchmark was positively affected by its allocation to mid- and small-cap U.S. equities, which surpassed large cap U.S. equities. The Fund’s overweight exposure to U.S. value stocks compared to growth stocks contributed, as growth stocks underperformed during the year.
The MVP risk management process utilizes derivatives in an effort to control portfolio volatility in unstable market conditions. Market volatility was relatively high during 2022, therefore the MVP process was engaged and reduced the Fund’s equity exposure at multiple points during the year. The MVP process slightly detracted from the Fund’s performance during 2022.
Past performance does not guarantee future results.
| * | The Fund’s portfolio composition is subject to change. There is no guarantee that any sectors mentioned will continue to perform as described or that securities in such sectors will be held by the Fund in the future. The information contained in this commentary is for informational purposes only and should not be construed as a recommendation to purchase or sell securities in the sector mentioned. The Fund’s holdings and weightings are as of December 31, 2022. |
| 1 | For a complete description of the Fund’s performance benchmark please refer to page 2 of this report. |
1
AZL® MVP FusionSM Conservative Fund Review (Unaudited) |
Fund Objective
The Fund’s investment objective is to seek long-term capital appreciation with preservation of capital as an important consideration. This objective may be changed by the Trustees of the Fund without shareholder approval. The Fund seeks to achieve its objective by investing in a combination of permitted Underlying Funds that represent different classes in the Fund’s asset allocation.
Investment Concerns
The Fund invests in underlying funds, so its investment performance is directly related to the performance of those underlying funds. Before investing, investors should assess the risks associated with and types of investments made by each of the underlying funds in which the Fund invests.
Quantitative investing involves risk that the values of securities selected in the quantitative analysis can react differently than the market or securities selected using fundamental analysis.
Stocks are more volatile and carry more risk and return potential than other forms of investments.
Emerging market investing may be subject to additional economic, political, liquidity, and currency risks not associated with more developed countries.
International investing may involve risk of capital loss from unfavorable fluctuations in currency values, from differences in generally accepted accounting principles or from economic or political instability in other nations.
Small- to mid-capitalization companies typically have a higher risk of failure and historically have experienced a greater degree of volatility.
Bonds offer a relatively stable level of income, although bond prices will fluctuate, providing the potential for principal gain or loss.
Mortgage-backed investments involve risk of loss due to prepayments and, like any bond, due to default. Because of the sensitivity of mortgage-related securities to changes in interest rates, an underlying fund’s performance may be more volatile than if it did not hold these securities.
Debt securities held by an underlying fund may decline in value due to rising interest rates.
Investing in derivative instruments involves risks that may be different from or greater than the risk associated with investing directly in securities or other traditional instruments.
For a complete description of these and other risks associated with investing in the Fund, please refer to the Fund’s prospectus.
Growth of $10,000 Investment
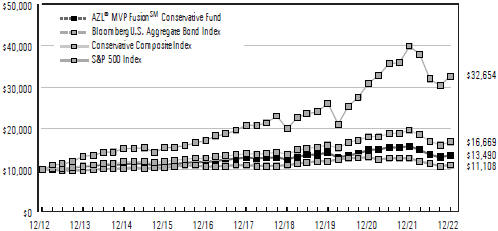
The chart above represents a comparison of a hypothetical investment in the Fund versus a similar investment in the Fund’s benchmarks and represents the reinvestment of dividends and capital gains in the Fund.
| Average Annual Total Returns as of December 31, 2022 | ||||||||||||||||||||
| 1 Year | 3 Years | 5 Years | 10 Years | |||||||||||||||||
AZL® MVP FusionSM Conservative Fund | (14.15 | )% | (1.52 | )% | 0.86 | % | 3.04 | % | ||||||||||||
Bloomberg U.S. Aggregate Bond Index | (13.01 | )% | (2.71 | )% | 0.02 | % | 1.06 | % | ||||||||||||
Conservative Composite | (14.64 | )% | 1.36 | % | 3.68 | % | 5.24 | % | ||||||||||||
S&P 500 Index | (18.11 | )% | 7.66 | % | 9.42 | % | 12.56 | % | ||||||||||||
Past performance does not guarantee future results. The performance data quoted represents past performance and current returns may be lower or higher. The investment return and principal value will fluctuate so that an investor’s shares, when redeemed, may be worth more or less than the original cost. To obtain performance information current to the most recent month end, please visit www.Allianzlife.com.
| Expense Ratio | Gross | ||||
AZL® MVP FusionSM Conservative Fund | 0.95% | ||||
The above expense ratio is based on the current Fund prospectus dated April 29, 2022. The Manager and the Fund have entered into a written agreement reducing the management fee to 0.15% through at least April 30, 2024. The Manager and the Fund have entered into a written contract limiting operating expenses, excluding certain expenses (such as interest expense and acquired fund fees and expenses), to 0.35% through April 30, 2024. Additional information pertaining to the December 31, 2022 expense ratio can be found in the Financial Highlights.
Acquired fund fees and expenses are incurred indirectly by the Fund through the valuation of the Fund’s investments in the permitted Underlying Funds. Accordingly, acquired fund fees and expenses affect the Fund’s total returns. Because these fees and expenses are not included in the Fund’s financial highlights, the Fund’s total annual fund operating expenses, as shown in the current prospectus, do not correlate to the ratios of expenses to average net assets shown in the Financial Highlights. Without acquired fund fees and expenses the Fund’s gross expense ratio would be 0.24%.
The total return of the Fund does not reflect the effect of any insurance charges, the annual maintenance fee or the deduction of taxes that a shareholder would pay on Fund distributions or the redemption of Fund shares. Such charges, fees and tax payments would reduce the performance quoted.
The Fund’s performance is measured against the Standard & Poor’s 500 Index (“S&P 500”), the Bloomberg U.S. Aggregate Bond Index and the Conservative Composite Index (“Composite”). The S&P 500 is representative of 500 selected common stocks, most of which are listed on the New York Stock Exchange, and is a measure of the U.S. Stock market as a whole. The Bloomberg U.S. Aggregate Bond Index is a market value-weighted performance benchmark for investment-grade fixed-rate debt issues, including government, corporate, asset-backed, and mortgage-backed securities, with maturities of at least one year. The Composite is a blended index comprised of (35%) S&P 500 and (65%) Bloomberg U.S. Aggregate Bond Index. These indexes are unmanaged and do not reflect the deduction of fees associated with a mutual fund, such as investment management and fund accounting fees. The Fund’s performance reflects the deduction of fees for services provided to the Fund. Investors cannot invest directly in an index.
2
AZL MVP Fusion Conservative Fund
(Unaudited)
As a shareholder of the AZL MVP Fusion Conservative Fund (the “Fund”), you incur ongoing costs, including management fees, distribution fees, and other Fund expenses. These examples are intended to help you understand your ongoing costs (in dollars) of investing in the Fund and to compare these costs with the ongoing costs of investing in other mutual funds. Please note that the expenses shown in each table do not reflect expenses that apply to the subaccount or the insurance contract. If the expenses that apply to the subaccount or the insurance contract were included, your costs would have been higher.
These examples are based on an investment of $1,000 invested at the beginning of the period and held for the periods presented below.
The Actual Expense table below provides information about actual account values and actual expenses. You may use the information below, together with the amount you invested, to estimate the expenses that you paid over the period. Simply divide your account value by $1,000 (for example, an $8,600 account value divided by $1,000 = 8.6), then multiply the result by the number in the table under the heading entitled “Expenses Paid During Period” to estimate the expenses you paid on your account during this period.
| Beginning Account Value 7/1/22 | Ending Account Value 12/31/22 | Expenses Paid During Period 7/1/22 -12/31/22* | Annualized Expense Ratio During Period 7/1/22 - 12/31/22 | |||||||||||||||||
AZL MVP Fusion Conservative Fund | $ | 1,000.00 | $ | 989.90 | $ | 1.10 | 0.22 | % | ||||||||||||
The Hypothetical Expense table below provides information about hypothetical account values and hypothetical expenses based on the Fund’s actual expense ratio and an assumed rate of return of 5% per year before expenses, which is not the Fund’s actual return. The hypothetical account values and expenses may not be used to estimate the actual ending account balance or expenses you paid for the period. You may use this information to compare this 5% hypothetical example with the 5% hypothetical examples that appear in the shareholder reports of other funds.
| Beginning Account Value 7/1/22 | Ending Account Value 12/31/22 | Expenses Paid During Period 7/1/22 -12/31/22* | Annualized Expense Ratio During Period 7/1/22 - 12/31/22 | |||||||||||||||||
AZL MVP Fusion Conservative Fund | $ | 1,000.00 | $ | 1,024.10 | $ | 1.12 | 0.22 | % | ||||||||||||
| * | Expenses are equal to the average account value multiplied by the Fund’s annualized expense ratio multiplied by 184/365 (the number of days in the most recent fiscal half-year divided by the number of days in the fiscal year). |
Portfolio Composition
(Unaudited)
| Investments | Percent of Net Assets | |||
Fixed Income Funds | 62.3 | % | ||
Domestic Equity Funds | 23.5 | |||
International Equity Funds | 9.7 | |||
|
| |||
Total Investment Securities | 95.5 | |||
Net other assets (liabilities) | 4.5 | |||
|
| |||
Net Assets | 100.0 | % | ||
|
| |||
3
AZL MVP Fusion Conservative Fund
Schedule of Portfolio Investments
December 31, 2022
| Shares | Value | |||||||||
| Affiliated Investment Companies (95.5%): | ||||||||||
| Domestic Equity Funds (23.5%): | ||||||||||
| 240,728 | AZL DFA U.S. Core Equity Fund | $ 2,953,729 | ||||||||
| 179,719 | AZL DFA U.S. Small Cap Fund | 1,698,343 | ||||||||
| 184,574 | AZL Gateway Fund | 2,600,653 | ||||||||
| 175,921 | AZL Mid Cap Index Fund, Class 2 | 3,372,398 | ||||||||
| 1,010,078 | AZL Russell 1000 Growth Index Fund, Class 2 | 13,221,924 | ||||||||
| 1,115,102 | AZL Russell 1000 Value Index Fund, Class 2 | 13,782,660 | ||||||||
| 182,842 | AZL Small Cap Stock Index Fund, Class 2 | 2,089,887 | ||||||||
|
| |||||||||
| 39,719,594 | ||||||||||
|
| |||||||||
| Fixed Income Funds (62.3%): | ||||||||||
| 1,751,019 | AZL Enhanced Bond Index Fund | 16,599,658 | ||||||||
| 2,539,913 | AZL Fidelity Institutional Asset Management Total Bond Fund, Class 2 | 22,071,843 | ||||||||
| 2,602,878 | AZL MetWest Total Return Bond Fund | 22,098,434 | ||||||||
| (a) | See Federal Tax Information listed in the Notes to the Financial Statements. |
Percentages indicated are based on net assets as of December 31, 2022
| Shares | Value | |||||||||
| Affiliated Investment Companies, continued | ||||||||||
| Fixed Income Funds, continued | ||||||||||
| 1,061,780 | PIMCO VIT Income Portfolio | $ | 10,288,651 | |||||||
| 1,260,928 | PIMCO VIT Low Duration Portfolio | 11,953,598 | ||||||||
| 2,463,891 | PIMCO VIT Total Return Portfolio | 22,125,739 | ||||||||
|
| |||||||||
| 105,137,923 | ||||||||||
|
| |||||||||
| International Equity Funds (9.7%): | ||||||||||
| 462,216 | AZL DFA International Core Equity Fund | 4,330,965 | ||||||||
| 615,025 | AZL International Index Fund, Class 2 | 9,385,283 | ||||||||
| 433,428 | AZL MSCI Emerging Markets Equity Index Fund, Class 2 | 2,617,905 | ||||||||
|
| |||||||||
| 16,334,153 | ||||||||||
|
| |||||||||
| | Total Affiliated Investment Companies | 161,191,670 | ||||||||
|
| |||||||||
| | Total Investment Securities | 161,191,670 | ||||||||
Net other assets (liabilities) — 4.5% | 7,595,084 | |||||||||
|
| |||||||||
Net Assets — 100.0% | $ | 168,786,754 | ||||||||
|
| |||||||||
Futures Contracts
At December 31, 2022, the Fund’s open futures contracts were as follows:
Long Futures
| Description | Expiration Date | Number of Contracts | Notional Amount | Value and Unrealized Appreciation/ (Depreciation) | ||||||||||||
S&P 500 Index E-Mini March Futures (U.S. Dollar) | 3/17/23 | 13 | $ 2,509,650 | $ 57 | ||||||||||||
U.S. Treasury 10-year Note March Futures (U.S. Dollar) | 3/22/23 | 44 | 4,941,063 | (47,280) | ||||||||||||
|
| |||||||||||||||
| $ (47,223) | ||||||||||||||||
|
| |||||||||||||||
See accompanying notes to the financial statements.
4
AZL MVP Fusion Conservative Fund
Statement of Assets and Liabilities
December 31, 2022
Assets: | |||||
Investments in affiliates, at cost | $ | 175,588,651 | |||
|
| ||||
Investments in affiliates, at value | $ | 161,191,670 | |||
Deposit at broker for futures contracts collateral | 7,619,176 | ||||
Interest and dividends receivable | 182,654 | ||||
Receivable for investments sold | 39,015 | ||||
Receivable for variation margin on futures contracts | 153 | ||||
Prepaid expenses | 1,589 | ||||
|
| ||||
Total Assets | 169,034,257 | ||||
|
| ||||
Liabilities: | |||||
Cash overdraft | 39,010 | ||||
Payable for investments purchased | 161,400 | ||||
Payable for capital shares redeemed | 24,419 | ||||
Management fees payable | 21,829 | ||||
Administration fees payable | 450 | ||||
Custodian fees payable | 25 | ||||
Administrative and compliance services fees payable | 24 | ||||
Transfer agent fees payable | 39 | ||||
Trustee fees payable | 61 | ||||
Other accrued liabilities | 246 | ||||
|
| ||||
Total Liabilities | 247,503 | ||||
|
| ||||
Net Assets | $ | 168,786,754 | |||
|
| ||||
Net Assets Consist of: | |||||
Paid in capital | $ | 179,984,737 | |||
Total distributable earnings | (11,197,983 | ) | |||
|
| ||||
Net Assets | $ | 168,786,754 | |||
|
| ||||
Shares of beneficial interest (unlimited number of shares authorized, no par value) | 17,050,341 | ||||
Net Asset Value (offering and redemption price per share) | $ | 9.90 | |||
|
| ||||
For the Year Ended December 31, 2022
Investment Income: | |||||
Dividends from affiliates | $ | 3,125,432 | |||
Interest | 126,566 | ||||
Dividends from non-affiliates | 112 | ||||
|
| ||||
Total Investment Income | 3,252,110 | ||||
|
| ||||
Expenses: | |||||
Management fees | 376,979 | ||||
Administration fees | 65,511 | ||||
Custodian fees | 2,706 | ||||
Administrative and compliance services fees | 2,684 | ||||
Transfer agent fees | 5,607 | ||||
Trustee fees | 10,762 | ||||
Professional fees | 9,050 | ||||
Shareholder reports | 5,203 | ||||
Other expenses | 2,869 | ||||
|
| ||||
Total expenses | 481,371 | ||||
Less Management fees contractually waived | (94,246 | ) | |||
|
| ||||
Net expenses | 387,125 | ||||
|
| ||||
Net Investment Income/(Loss) | 2,864,985 | ||||
|
| ||||
Net realized and Change in net unrealized gains/losses on investments: | |||||
Net realized gains/(losses) on affiliated underlying funds | (1,253,032 | ) | |||
Net realized gains distributions from affiliated underlying funds | 7,583,338 | ||||
Net realized gains/(losses) on futures contracts | (1,494,726 | ) | |||
Change in net unrealized appreciation/depreciation on affiliated underlying funds | (38,140,813 | ) | |||
Change in net unrealized appreciation/depreciation on futures contracts | (184,228 | ) | |||
|
| ||||
Net realized and Change in net unrealized gains/losses on investments | (33,489,461 | ) | |||
|
| ||||
Change in Net Assets Resulting From Operations | $ | (30,624,476 | ) | ||
|
|
See accompanying notes to the financial statements.
5
AZL MVP Fusion Conservative Fund
Statements of Changes in Net Assets
| For the Year Ended December 31, 2022 | For the Year Ended December 31, 2021 | |||||||||
Change In Net Assets: | ||||||||||
Operations: | ||||||||||
Net investment income/(loss) | $2,864,985 | $2,674,716 | ||||||||
Net realized gains/(losses) on investments | 4,835,580 | 16,146,670 | ||||||||
Change in unrealized appreciation/depreciation on investments | (38,325,041 | ) | (4,710,756 | ) | ||||||
|
|
|
| |||||||
Change in net assets resulting from operations | (30,624,476 | ) | 14,110,630 | |||||||
|
|
|
| |||||||
Distributions to Shareholders: | ||||||||||
Distributions | (11,461,610 | ) | (5,520,754 | ) | ||||||
|
|
|
| |||||||
Change in net assets resulting from distributions to shareholders | (11,461,610 | ) | (5,520,754 | ) | ||||||
|
|
|
| |||||||
Capital Transactions: | ||||||||||
Proceeds from shares issued | 7,466,757 | 22,638,031 | ||||||||
Proceeds from dividends reinvested | 11,461,610 | 5,520,754 | ||||||||
Value of shares redeemed | (35,655,263 | ) | (49,266,734 | ) | ||||||
|
|
|
| |||||||
Change in net assets resulting from capital transactions | (16,726,896 | ) | (21,107,949 | ) | ||||||
|
|
|
| |||||||
Change in net assets | (58,812,982 | ) | (12,518,073 | ) | ||||||
Net Assets: | ||||||||||
Beginning of period | 227,599,736 | 240,117,809 | ||||||||
|
|
|
| |||||||
End of period | $ 168,786,754 | $ 227,599,736 | ||||||||
|
|
|
| |||||||
Share Transactions: | ||||||||||
Shares issued | 667,588 | 1,843,209 | ||||||||
Dividends reinvested | 1,184,051 | 455,884 | ||||||||
Shares redeemed | (3,220,644 | ) | (4,002,802 | ) | ||||||
|
|
|
| |||||||
Change in shares | (1,369,005 | ) | (1,703,709 | ) | ||||||
|
|
|
| |||||||
See accompanying notes to the financial statements.
6
AZL MVP Fusion Conservative Fund
(Selected data for a share of beneficial interest outstanding throughout the periods indicated. Does not reflect fees or expenses associated with the separate accounts that invest in the Fund or in any variable annuity contracts or variable life insurance policy for which the Fund serves as an investment vehicle.)
| Year Ended | Year Ended | Year Ended | Year Ended | Year Ended | |||||||||||||||||||||
| December 31, 2022 | December 31, 2021 | December 31, 2020 | December 31, 2019 | December 31, 2018 | |||||||||||||||||||||
Net Asset Value, Beginning of Period | $12.36 | $11.93 | $11.96 | $11.16 | $12.23 | ||||||||||||||||||||
|
|
|
|
|
|
|
|
|
| ||||||||||||||||
Investment Activities: | |||||||||||||||||||||||||
Net Investment Income/(Loss) | 0.17 | (a) | 0.14 | (a) | 0.23 | (a) | 0.25 | (a) | 0.23 | ||||||||||||||||
Net Realized and Unrealized Gains/(Losses) on Investments | (1.94 | ) | 0.59 | 0.31 | 1.24 | (0.67 | ) | ||||||||||||||||||
|
|
|
|
|
|
|
|
|
| ||||||||||||||||
Total from Investment Activities | (1.77 | ) | 0.73 | 0.54 | 1.49 | (0.44 | ) | ||||||||||||||||||
|
|
|
|
|
|
|
|
|
| ||||||||||||||||
Distributions to Shareholders From: | |||||||||||||||||||||||||
Net Investment Income | (0.32 | ) | (0.30 | ) | (0.27 | ) | (0.30 | ) | (0.17 | ) | |||||||||||||||
Net Realized Gains | (0.37 | ) | — | (0.30 | ) | (0.39 | ) | (0.46 | ) | ||||||||||||||||
|
|
|
|
|
|
|
|
|
| ||||||||||||||||
Total Dividends | (0.69 | ) | (0.30 | ) | (0.57 | ) | (0.69 | ) | (0.63 | ) | |||||||||||||||
|
|
|
|
|
|
|
|
|
| ||||||||||||||||
Net Asset Value, End of Period | $9.90 | $12.36 | $11.93 | $11.96 | $11.16 | ||||||||||||||||||||
|
|
|
|
|
|
|
|
|
| ||||||||||||||||
Total Return (b) | (14.15 | )% | 6.15 | % | 4.79 | % | 13.54 | % | (3.75 | )% | |||||||||||||||
Ratios to Average Net Assets/Supplemental Data: | |||||||||||||||||||||||||
Net Assets, End of Period (000’s) | $168,787 | $227,600 | $240,118 | $249,093 | $235,129 | ||||||||||||||||||||
Net Investment Income/(Loss) | 1.52 | % | 1.14 | % | 1.96 | % | 2.11 | % | 1.83 | % | |||||||||||||||
Expenses Before Reductions*(c) | 0.26 | % | 0.24 | % | 0.25 | % | 0.25 | % | 0.24 | % | |||||||||||||||
Expenses Net of Reductions* | 0.21 | % | 0.19 | % | 0.25 | % | 0.25 | % | 0.24 | % | |||||||||||||||
Portfolio Turnover Rate | 9 | % | 15 | % | 17 | % | 21 | % | 16 | % | |||||||||||||||
| * | The expense ratios exclude the impact of fees/expenses paid by each underlying fund. |
| (a) | Calculated using the average shares method. |
| (b) | The returns include reinvested dividends and fund level expenses, but exclude insurance contract charges. If these charges were included, the returns would have been lower. |
| (c) | Excludes fee reductions. If such fee reductions had not occurred, the ratios would have been as indicated. |
See accompanying notes to the financial statements.
7
AZL MVP Fusion Conservative Fund
Notes to the Financial Statements
December 31, 2022
1. Organization
The Allianz Variable Insurance Products Fund of Funds Trust (the “Trust”) was organized as a Delaware statutory trust on June 16, 2004. The Trust is an open-end management investment company registered under the Investment Company Act of 1940, as amended, (the “1940 Act”) and thus is determined to be an investment company, and follows the investment company accounting and reporting guidance under Financial Accounting Standards Board (“FASB”) Accounting Standards Codification (“ASC”) Topic 946 “Financial Services—Investment Companies”. The Trust consists of 12 separate investment portfolios (collectively, the “Funds”), of which one is included in this report, the AZL MVP Fusion Conservative Fund (the “Fund”), and 11 are presented in separate reports. The Fund is a diversified series of the Trust.
The Fund is a “fund of funds”, which means that the Fund invests primarily in other mutual funds (the “Underlying Funds”). Underlying Funds invest in stocks, bonds, and other securities and reflect varying amounts of potential investment risk and reward. The Underlying Funds record their investments at fair value. Periodically, the Fund will adjust its asset allocation as it seeks to achieve its investment objective.
The Trust is authorized to issue an unlimited number of shares of the Fund without par value. Shares of the Fund are available through the variable annuity contracts offered through the separate accounts of participating insurance companies. Currently, the Fund only offers its shares to separate accounts of Allianz Life Insurance Company of North America and Allianz Life Insurance Company of New York, affiliates of the Trust and the Manager, as defined below.
Under the Trust’s organizational documents, its officers and trustees are indemnified against certain liabilities arising out of the performance of their duties to the Fund. In addition, in the normal course of business, the Fund may enter into contracts with its vendors and others that provide for general indemnifications. The Fund’s maximum exposure under these arrangements is unknown, as this would involve future claims that may be made against the Fund. However, based on experience, the Fund expects that risk of loss to be remote.
On December 13, 2022, the Board unanimously approved a reorganization whereby the AZL MVP FIAM Multi-Strategy Fund will acquire all of the assets and liabilities of the Fund and costs related to the reorganization will be paid by the Manager.
2. Significant Accounting Policies
The following is a summary of significant accounting policies followed by the Fund in the preparation of its financial statements. The policies conform with U.S. generally accepted accounting principles (“U.S. GAAP”). The preparation of financial statements requires management to make certain estimates and assumptions that affect the reported amounts of assets and liabilities and disclosure of contingent assets and liabilities at the date of the financial statements and the reported amounts of increases and decreases in net assets from operations during the reporting period. Actual results could differ from those estimates.
Security Valuation
The Fund records its investments at fair value. Fair value is defined as the price that would be received to sell an asset or paid to transfer a liability in an orderly transaction between willing market participants at the measurement date. The valuation techniques used to determine fair value are further described in Note 4 below.
Investment Transactions and Investment Income
Investment transactions are accounted for on trade date. Net realized gains and losses on investments sold and on foreign currency transactions are recorded on the basis of identified cost. Interest income is recorded on the accrual basis and includes, where applicable, the amortization of premiums or accretion of discounts. Dividend income is recorded on the ex-dividend date except in the case of foreign securities, in which case dividends are recorded as soon as such information becomes available.
Distributions to Shareholders
Distributions to shareholders are recorded on the ex-dividend date. The Fund distributes its dividends from net investment income and net realized capital gains, if any, on an annual basis. The amount of distributions from net investment income and from net realized gains is determined in accordance with federal income tax regulations, which may differ from U.S. GAAP. These “book/tax” differences are either temporary or permanent in nature. To the extent these differences are permanent in nature (e.g., return of capital, net operating loss, reclassification of certain market discounts, gain/loss, paydowns, and distributions), such amounts are reclassified within the composition of net assets based on their federal tax-basis treatment; temporary differences (e.g., wash sales and differing treatment on certain investments) do not require reclassification. Distributions to shareholders that exceed net investment income and net realized gains for tax purposes are reported as distributions of capital.
Expense Allocation
Expenses directly attributable to the Fund are charged directly to the Fund, while expenses attributable to more than one Fund are allocated among the respective Funds based upon relative net assets or some other reasonable method. Expenses which are attributable to more than one Trust are allocated across the Allianz Variable Insurance Products Trust, Allianz Variable Insurance Products Fund of Funds Trust and AIM ETF Products Trust based upon relative net assets or another reasonable basis. Allianz Investment Management LLC (the “Manager”), serves as the investment manager for the Trust, Allianz Variable Insurance Products Trust and AIM ETF Products Trust.
This report does not reflect fees or expenses associated with the separate accounts that invest in the Fund or in any variable annuity contracts or variable life insurance policy for which the Fund serves as an investment vehicle.
8
AZL MVP Fusion Conservative Fund
Notes to the Financial Statements
December 31, 2022
Affiliated Securities Transactions
Pursuant to Rule 17a-7 under the 1940 Act, the Fund may engage in securities transactions with affiliated investment companies and advisory accounts managed by the Manager. Any such purchase or sale transaction must be effected without a brokerage commission or other remuneration, except for customary transfer fees. The transaction must be effected at the current market price, which is either the security’s last sale price on an exchange or, if there are no transactions in the security that day, at the average of the highest bid and lowest asked price. During the year ended December 31, 2022, the Fund did not engage in any Rule 17a-7 transactions.
Derivative Instruments
All open derivative positions at period end are reflected on the Fund’s Schedule of Portfolio Investments. The following is a description of the derivative instruments utilized by the Fund, including the primary underlying risk exposures related to each instrument type. The Fund’s allocation to the MVP (Managed Volatility Portfolio) risk management process may include (a) derivatives such as index futures, other futures contracts, options, and other similar securities and (b) cash, money market equivalents, short-term debt instruments, money market funds, and short-term debt funds to satisfy all applicable margin requirements and to provide additional portfolio liquidity to satisfy large redemptions and any margin calls. Due to the leverage provided by derivatives, the notional value of the Fund’s derivative positions could exceed 20% of the Fund’s value. The Fund may also use futures to gain equity exposure and may hold cash as a buffer in the event of market shocks.
Futures Contracts
During the year ended December 31, 2022, the Fund invested in futures contracts to reduce volatility and limit the need to decrease or increase allocations to underlying funds. Futures contracts are valued based upon their quoted daily settlement prices. Upon entering into a futures contract, the Fund is required to segregate liquid assets in accordance with the initial margin requirements of the broker or exchange. Futures contracts are marked to market daily and a payable or receivable for the change in value (“variation margin”), if any, is recorded by the Fund. Gains or losses are recognized but not considered realized until the contracts expire or are closed. Futures contracts involve, to varying degrees, elements of market risk (generally equity price risk related to stock futures, interest rate risk related to bond futures, and foreign currency risk related to currency futures) and exposure to loss in excess of the variation margin disclosed in the Statement of Assets and Liabilities. The primary risks associated with the use of futures contracts are the imperfect correlation between the change in value of the underlying securities and the prices of futures contracts, the possibility of an illiquid market, and the inability of the counterparty to meet the terms of the contract. For the year ended December 31, 2022, the monthly average notional amount for long contracts was $6.7 million, and the monthly average notional amount for short contracts was $11.4 million. Realized gains and losses are reported as “Net realized gains/(losses) on futures contracts” on the Statement of Operations.
Summary of Derivative Instruments
The following is a summary of the values of derivative instruments on the Fund’s Statement of Assets and Liabilities, categorized by risk exposure, as of December 31, 2022:
Asset Derivatives | Liability Derivatives | |||||||||||
| Primary Risk Exposure | Statement of Assets and Liabilities Location | Total Value | Statement of Assets and Liabilities Location | Total Value | ||||||||
Equity Risk | ||||||||||||
| Futures Contracts | Receivable for variation margin on futures contracts* | $57 | Payable for variation margin on futures contracts* | $— | ||||||||
Interest Rate Risk | ||||||||||||
| Futures Contracts | Receivable for variation margin on futures contracts* | — | Payable for variation margin on futures contracts* | 47,280 | ||||||||
| * | For futures contracts, the amounts represent the cumulative appreciation/depreciation of these futures contracts as reported in the Schedule of Portfolio Investments. Only the current day’s variation margin is reported within the Statement of Assets and Liabilities as variation margin on futures contracts. |
The following is a summary of the effect of derivative instruments on the Statement of Operations, categorized by risk exposure, for the year ended December 31, 2022:
| Primary Risk Exposure | Location of Gains/(Losses) on Derivatives Recognized | Realized Gains/(Losses) on Derivatives Recognized | Change in Net Unrealized Appreciation/Depreciation | |||||||
Equity Risk | ||||||||||
| Futures Contracts | Net realized gains/(losses) on futures contracts/ Change in net unrealized appreciation/depreciation on futures contracts | $(691,646) | $(59,721) | |||||||
Interest Rate Risk | ||||||||||
| Futures Contracts | Net realized gains/(losses) on futures contracts/ Change in net unrealized appreciation/depreciation on futures contracts | (803,080) | (124,507) | |||||||
3. Fees and Transactions with Affiliates and Other Parties
The Manager provides investment advisory and management services for the Fund. The Manager has contractually agreed to waive fees and reimburse the Fund to limit the annual expenses, excluding interest expense (e.g., cash overdraft fees), taxes, brokerage commissions, acquired fund fees and expenses, other expenditures that are capitalized in accordance with U.S. GAAP and other extraordinary expenses not incurred in the ordinary course of the Fund’s business, based on the daily net assets of the Fund, through April 30, 2024. Expenses incurred for investment advisory and management services are reflected on the Statement of Operations as “Management fees.”
For the year ended December 31, 2022, the annual rate due to the Manager and the annual expense limit were as follows:
| Annual Rate* | Annual Expense Limit | |||
AZL MVP Fusion Conservative Fund | 0.20% | 0.35% | ||
9
AZL MVP Fusion Conservative Fund
Notes to the Financial Statements
December 31, 2022
* The Manager waived, prior to any application of expense limit, the management fee to 0.15% on all assets in order to maintain a more competitive expense ratio. The Manager reserves the right to increase the management fee to the amount shown in the table above (i.e., discontinue the waiver) at any time after April 30, 2024.
Any amounts contractually waived or reimbursed by the Manager with respect to the annual expense limit in a particular fiscal year will be subject to repayment by the Fund to the Manager to the extent that from time to time through the next three fiscal years the repayment will not cause the Fund’s expenses to exceed the lesser of the stated limit at the time of the waiver or the current stated limit. Any amounts recouped by the Manager during the period are reflected on the Statement of Operations as “Recoupment of prior expenses reimbursed by the Manager.” At December 31, 2022, there were no remaining contractual reimbursements subject to repayment by the Fund in subsequent years.
Management fees, which the Manager waived in order to maintain more competitive expense ratios, are not subject to repayment in subsequent years. Information on the total amount waived/ reimbursed by the Manager or repaid to the Manager by the Fund during the year can be found on the Statement of Operations.
The Manager or an affiliate of the Manager serves as the investment adviser of certain underlying funds in which the Fund invests. At December 31, 2022, these underlying funds are noted as Affiliated Investment Companies in the Fund’s Schedule of Portfolio Investments. Additional information, including financial statements, about these Funds is available at www.allianzlife.com. The Manager or an affiliate of the Manager is paid a separate fee from the underlying funds for such services. A summary of the Fund’s investments in affiliated investment companies for the year ended December 31, 2022 is as follows:
| Value 12/31/21 | Purchases at Cost | Proceeds from Sales | Net Realized Gains (Losses) | Change in Net Unrealized Appreciation (Depreciation) | Value 12/31/22 | Shares as of 12/31/22 | Dividend Income | Net Realized Gains Distributions from Affiliated Underlying Funds | ||||||||||||||||||||||||||||
AZL DFA International Core Equity Fund | $ 5,768,878 | $572,041 | $ (792,181) | $ 22,881 | $ (1,240,654) | $ 4,330,965 | 462,216 | $ 114,289 | $ 384,122 | |||||||||||||||||||||||||||
AZL DFA U.S. Core Equity Fund | 4,043,677 | 492,810 | (577,519) | 93,775 | (1,099,014) | 2,953,729 | 240,728 | 23,816 | 403,500 | |||||||||||||||||||||||||||
AZL DFA U.S. Small Cap Fund | 2,308,939 | 495,873 | (361,622) | (20,579 | ) | (724,268) | 1,698,343 | 179,719 | 11,076 | 454,406 | ||||||||||||||||||||||||||
AZL Enhanced Bond Index Fund | 22,145,524 | 317,637 | (2,701,777) | (322,555) | (2,839,171) | 16,599,658 | 1,751,019 | 272,600 | 9,831 | |||||||||||||||||||||||||||
AZL Fidelity Institutional Asset Management Total Bond Fund, Class 2 | 29,547,272 | 1,332,873 | (3,866,254) | (371,687 | ) | (4,570,361) | 22,071,843 | 2,539,913 | 601,471 | 602,820 | ||||||||||||||||||||||||||
AZL Gateway Fund | 3,429,976 | 21,158 | (449,808) | 58,731 | (459,404) | 2,600,653 | 184,574 | 9,244 | — | |||||||||||||||||||||||||||
AZL International Index Fund, Class 2 | 12,593,893 | 895,334 | (1,816,099) | (94,202 | ) | (2,193,643) | 9,385,283 | 615,025 | 293,540 | 250,217 | ||||||||||||||||||||||||||
AZL MetWest Total Return Bond Fund | 29,522,395 | 437,497 | (3,449,576) | (531,840 | ) | (3,880,042) | 22,098,434 | 2,602,878 | 272,405 | 16,230 | ||||||||||||||||||||||||||
AZL Mid Cap Index Fund, Class 2 | 4,620,535 | 857,895 | (783,881) | 48,151 | (1,370,302) | 3,372,398 | 175,921 | 26,331 | 710,069 | |||||||||||||||||||||||||||
AZL MSCI Emerging Markets Equity Index Fund, Class 2 | 3,429,809 | 252,151 | (296,394) | 25,610 | (793,271) | 2,617,905 | 433,428 | 39,150 | 63,466 | |||||||||||||||||||||||||||
AZL Russell 1000 Growth Index Fund, Class 2 | 18,402,908 | 5,562,827 | (2,514,165) | (164,241 | ) | (8,065,405) | 13,221,924 | 1,010,078 | 8,958 | 2,863,383 | ||||||||||||||||||||||||||
AZL Russell 1000 Value Index Fund, Class 2 | 18,552,106 | 2,601,343 | (4,406,624) | 614,064 | (3,578,229) | 13,782,660 | 1,115,102 | 188,453 | 1,455,023 | |||||||||||||||||||||||||||
AZL Small Cap Stock Index Fund, Class 2 | 2,893,033 | 475,219 | (440,229) | 37,686 | (875,822) | 2,089,887 | 182,842 | 18,232 | 370,271 | |||||||||||||||||||||||||||
PIMCO VIT Income Portfolio | 13,656,413 | 411,581 | (2,348,228) | (15,017 | ) | (1,391,943) | 10,288,651 | 1,061,780 | 387,426 | — | ||||||||||||||||||||||||||
PIMCO VIT Low Duration Portfolio | 15,816,060 | 218,210 | (3,022,582) | (141,842) | (916,248) | 11,953,598 | 1,260,928 | 216,802 | — | |||||||||||||||||||||||||||
PIMCO VIT Total Return Portfolio | 29,598,029 | 801,436 | (3,638,723) | (491,967 | ) | (4,143,036) | 22,125,739 | 2,463,891 | 641,639 | — | ||||||||||||||||||||||||||
|
|
|
|
|
|
|
|
|
|
|
|
|
|
|
|
|
| |||||||||||||||||||
| $ 216,329,447 | $ 15,745,885 | $ (31,465,662) | $ (1,253,032 | ) | $ (38,140,813) | $ 161,191,670 | 1 6,280,042 | $ 3,125,432 | $ 7,583,338 | |||||||||||||||||||||||||||
|
|
|
|
|
|
|
|
|
|
|
|
|
|
|
|
|
| |||||||||||||||||||
Pursuant to separate agreements between the Trust and the Manager, the Manager provides a Chief Compliance Officer (“CCO”) and certain compliance oversight and regulatory filing services to the Trust. Under these agreements, the Manager is entitled to an amount equal to a portion of the compensation and certain other expenses related to the individuals performing the CCO and compliance oversight services, as well as $100 per hour for time incurred in connection with the preparation and filing of certain documents with the SEC. The fees are paid to the Manager on a quarterly basis. The total expenses incurred by the Fund for these services are reflected on the Statement of Operations as “Administrative and compliance services fees.”
Citi Fund Services Ohio, Inc. (“Citi” or the “Administrator”), a wholly owned subsidiary of Citigroup, Inc., with which an officer of the Trust is affiliated, serves as the Trust’s administrator and fund accountant, and assists the Trust in all aspects of its administration and operation. The Administrator is entitled to a fee, accrued daily and paid monthly. The Administrator is entitled to an annual fee for each additional class of shares of any Fund, certain annual fees in supporting fair value services, and a Trust-wide annual fee for providing infrastructure and support in implementing the written policies and procedures comprising the Fund’s compliance program. The Administrator is also reimbursed for certain expenses incurred. The total expenses incurred by the Fund for these services are reflected on the Statement of Operations as “Administration fees.”
FIS Investor Services LLC (“FIS”) serves as the Fund’s transfer agent. Under the Transfer Agent Agreement, the Trust pays FIS a fee for its services and reimburses FIS for all of their reasonable out-of-pocket expenses incurred in providing these services.
The Bank of New York Mellon (“BNY Mellon” or the “Custodian”) serves as the Trust’s custodian. For these services as custodian, the Funds pay BNY Mellon a fee based on a percentage of assets held on behalf of the Funds, plus certain out-of-pocket charges.
10
AZL MVP Fusion Conservative Fund
Notes to the Financial Statements
December 31, 2022
Allianz Life Financial Services, LLC (“ALFS”), an affiliate of the Manager, serves as distributor of the Fund. ALFS receives an annual Trust-wide annual fee of $7,500, paid by the Manager from its profits and not by the Trust, for recordkeeping and reporting services.
Certain Officers and Trustees of the Trust are affiliated with the Manager or the Administrator. Such Officers (except for the Trust’s CCO as noted above) and Trustees receive no compensation from the Trust for serving in their respective roles.
4. Investment Valuation Summary
The valuation techniques employed by the Fund, as described below, maximize the use of observable inputs and minimize the use of unobservable inputs in determining fair value. The inputs used for valuing the Fund’s investments are summarized in the three broad levels listed below:
| ● Level 1 - | quoted prices in active markets for identical assets | |||
| ● Level 2 - | other significant observable inputs (including quoted prices for similar securities, interest rates, prepayments speeds, credit risk, etc.) | |||
| ● Level 3 - | significant unobservable inputs (including the Fund’s own assumptions in determining the fair value of investments) |
Changes in valuation techniques may result in transfers in or out of an assigned level within the disclosure hierarchy. The inputs or methodology used for valuing investments is not necessarily an indication of the risk associated with investing in those investments.
Investments in other investment companies are valued at their published net asset value (“NAV”). Security prices are determined pursuant to valuation procedures approved by the Trust’s Board of Trustees (the “Board” or “Trustees”) as of the close of the New York Stock Exchange (“NYSE”) (generally 4:00 pm Eastern Time). The investments utilizing Level 1 valuations represent investments in open-end investment companies. Futures contracts are valued at the settlement prices established each day on the primary exchange and are typically categorized as Level 1 in the fair value hierarchy.
The Board has designated the Manager to perform the Fund’s fair value determinations in accordance with valuation procedures approved by the Board. The effect of using fair value pricing is that the Fund’s NAV will be subject to the judgment of the Manager. The Manager’s fair valuation process is subject to the oversight of the Board.
The following is a summary of the valuation inputs used as of December 31, 2022 in valuing the Fund’s investments based upon the three levels defined above:
Investment Securities: | Level 1 | Level 2 | Level 3 | Total | ||||||||||||||||
Affiliated Investment Companies | $161,191,670 | $— | $— | $161,191,670 | ||||||||||||||||
|
|
|
|
|
|
|
| |||||||||||||
Total Investment Securities | 161,191,670 | — | — | 161,191,670 | ||||||||||||||||
|
|
|
|
|
|
|
| |||||||||||||
Other Financial Instruments:* | ||||||||||||||||||||
Futures Contracts | (47,223) | — | — | (47,223 | ) | |||||||||||||||
|
|
|
|
|
|
|
| |||||||||||||
Total Investments | $161,144,447 | $— | $— | $161,144,447 | ||||||||||||||||
|
|
|
|
|
|
|
| |||||||||||||
| * | Other Financial Instruments would include any derivative instruments, such as futures contracts. These investments are generally recorded in the financial statements at the variation margin. |
5. Security Purchases and Sales
For the year ended December 31, 2022, cost of purchases and proceeds from sales of securities (excluding securities maturing less than one year from acquisition) were as follows:
| Purchases | Sales | |||||||||
AZL MVP Fusion Conservative Fund | $ | 15,745,885 | $ | 31,465,662 | ||||||
6. Investment Risks
The risks below are presented in an order intended to facilitate readability. Their order does not imply that the realization of one risk is more likely to occur more frequently than another risk, nor does it imply that the realization of one risk is likely to have a greater adverse impact than another risk. The Fund may be subject to other risks in addition to these identified risks. This section discusses certain common principal risks encountered by the Fund.
Derivatives Risk: The Fund may invest directly or through affiliated or unaffiliated mutual funds or unregistered investment pools in derivative instruments such as futures, options, and options on futures. A derivative is a financial contract whose value depends on, or is derived from, the value of an underlying asset, reference rate, or risk. Use of derivative instruments involves risks different from, or possibly greater than, the risks associated with investing directly in securities and other traditional investments. Derivatives are subject to a number of other risks, such as liquidity risk, interest rate risk, market risk, credit risk, and selection risk. Derivatives also involve the risk of mispricing or improper valuation and the risk that changes in the value may not correlate perfectly with the underlying asset, rate, or index. Using derivatives may result in losses, possibly in excess of the principal amount invested. Also, suitable derivative transactions may not be available in all circumstances. The other party to a derivatives contract could default.
Foreign Securities Risk: Investing in the securities of non-U.S. issuers involves a number of risks, such as fluctuations in currency values, adverse political, social or economic developments, and differences in social and economic developments or policies. Such risks include future political and economic developments, and the possible imposition of exchange controls or other foreign governmental laws and restrictions. In addition, with respect to certain countries, there is the possibility of expropriation of assets, confiscatory taxation, political or social instability or diplomatic developments which could adversely affect investments in those securities. Certain foreign companies may be subject to sanctions, embargoes, or other governmental actions that may impair or otherwise limit the ability to invest in, receive, hold or sell the securities of such companies.
11
AZL MVP Fusion Conservative Fund
Notes to the Financial Statements
December 31, 2022
Fund of Fund Risk: The Fund, as a shareholder of the underlying funds, indirectly bears its proportionate share of any investment management fees and other expenses of the underlying funds. Further due to the fees and expenses paid by the Fund, as well as small variations in the Fund’s actual allocations to the underlying funds and any futures and cash held in the Fund’s portfolio, the performance and income distributions of the Fund will not be the same as the performance and income distributions of the underlying funds. In addition, the Fund maintains indirect exposure to various types of risk which may exist in the underlying Funds, such as foreign securities risk, fixed income securities risk and other risks.
Interest Rate Risk: Debt securities held by an underlying fund may decline in value due to rising interest rates. The price of a bond is also affected by its maturity. Bonds with longer maturities generally have greater sensitivity to changes in interest rates.
Market Risk: The market price of securities owned by the underlying funds may go up or down, sometimes rapidly and unpredictably. Securities may decline in value due to factors affecting securities markets generally or particular industries represented in the securities markets. The value of a security may decline due to general market conditions that are not specifically related to a particular company, such as real or perceived adverse economic conditions, changes in the general outlook for corporate earnings, changes in interest or currency rates, or adverse investor sentiment, as well as natural disasters, and outbreaks of infectious illnesses or other widespread public health issues.
Quantitative Investing Risk: The value of securities selected using quantitative analysis can react differently to issuer, political, market, and economic developments than the market as a whole or securities selected using only fundamental analysis. The factors used in quantitative analysis and the weight placed on those factors may not be predictive of a security’s value. In addition, factors that affect a security’s value can change over time and these changes may not be reflected in the quantitative model. A quantitative model can be adversely affected by errors or imperfections in the factors or the data on which evaluations are based, or by technical issues with construction or implementation of the model, which in any case may result in a failure of the portfolio to perform as expected or a failure to identify securities that will perform well in the future.
7. Coronavirus (COVID-19) Pandemic
The global outbreak of the COVID-19 strain of the coronavirus has caused adverse effects on many companies, sectors, nations, regions and the markets in general, and may continue for an unpredictable duration. The effects of this pandemic may adversely impact the value and performance of the Fund, its ability to buy and sell fund investments at appropriate valuations, and its ability to achieve its investment objective(s).
8. Federal Tax Information
It is the policy of the Fund to continue to qualify as a regulated investment company by complying with the provisions available to certain investment companies, as defined under Subchapter M of the Internal Revenue Code, and to make distributions of net investment income and net realized gains sufficient to relieve it from all, or substantially all, federal income taxes. Accordingly, no provisions for federal income taxes are required in the financial statements.
Management of the Fund has reviewed tax positions taken in tax years that remain subject to examination by all major tax jurisdictions, including federal (i.e., the last four tax year ends and the interim tax period since then, as applicable). Management believes that there is no tax liability resulting from unrecognized tax benefits related to uncertain tax positions taken.
Cost of securities, including derivatives and short positions as applicable, for federal income tax purposes at December 31, 2022 is $179,158,465. The gross unrealized appreciation/ (depreciation) on a tax basis is as follows:
Unrealized appreciation | $491,581 | ||||
Unrealized (depreciation) | (18,458,376) | ||||
|
| ||||
Net unrealized appreciation/(depreciation) | $(17,966,795) | ||||
|
|
The tax character of dividends paid to shareholders during the year ended December 31, 2022 was as follows:
Ordinary Income | Net Long-Term Capital Gains | Total Distributions(a) | ||||||||
AZL MVP Fusion Conservative Fund | $5,294,198 | $6,167,412 | $11,461,610 | |||||||
(a) Total distributions paid may differ from the Statements of Changes in Net Assets because dividends are recognized when actually paid for tax purposes.
The tax character of dividends paid to shareholders during the year ended December 31, 2021 was as follows:
Ordinary Income | Net Long-Term Capital Gains | Total Distributions(a) | ||||||||
AZL MVP Fusion Conservative Fund | $5,520,754 | $– | $5,520,754 | |||||||
| (a) | Total distributions paid may differ from the Statements of Changes in Net Assets because dividends are recognized when actually paid for tax purposes. |
At December 31, 2022, the components of accumulated earnings on a tax basis were as follows:
12
AZL MVP Fusion Conservative Fund
Notes to the Financial Statements
December 31, 2022
Undistributed Ordinary Income | Undistributed Long-Term Capital Gains | Accumulated Capital and Other Losses | Unrealized Appreciation/ Depreciation(a) | Total Accumulated Earnings/(Deficit) | ||||||||||||||||
AZL MVP Fusion Conservative Fund | $4,140,585 | $5,144,680 | $— | $(17,966,795) | $(8,681,530) | |||||||||||||||
| (a) | The differences between book-basis and tax-basis unrealized appreciation/(depreciation) is attributable primarily to tax deferral of losses on wash sales, mark-to-market of futures contracts and straddles. |
9. Ownership and Principal Holders
The beneficial ownership, either directly or indirectly, of more than 25% of the voting securities of a fund creates presumptions of control of the fund, under section 2 (a)(9) of the 1940 Act. As of December 31, 2022, the Fund had an individual shareholder account which is affiliated with the Manager representing ownership in excess of 90% of the Fund.
Investment activities of this shareholder could have a material impact to the Fund.
10. Subsequent Events
Management of the Fund has evaluated the need for additional disclosures or adjustments resulting from events through the date the financial statements were issued. Based on this evaluation, there were no subsequent events to report that would have material impact on the Fund’s financial statements, except as noted below.
The reorganization, as discussed in Note 1, whereby the AZL MVP FIAM Multi-Strategy Fund will acquire all of the assets and liabilities of the Fund, is expected to be completed on or about March 10, 2023.
13
REPORT OF INDEPENDENT REGISTERED PUBLIC ACCOUNTING FIRM
To the Board of Trustees of Allianz Variable Insurance Products Fund of Funds Trust and Shareholders of
AZL MVP Fusion Conservative Fund
Opinion on the Financial Statements
We have audited the accompanying statement of assets and liabilities, including the schedule of portfolio investments, of AZL MVP Fusion Conservative Fund (one of the funds constituting Allianz Variable Insurance Products Fund of Funds Trust, referred to hereafter as the “Fund”) as of December 31, 2022, the related statement of operations for the year ended December 31, 2022, the statements of changes in net assets for each of the two years in the period ended December 31, 2022, including the related notes, and the financial highlights for each of the five years in the period ended December 31, 2022 (collectively referred to as the “financial statements”). In our opinion, the financial statements present fairly, in all material respects, the financial position of the Fund as of December 31, 2022, the results of its operations for the year then ended, the changes in its net assets for each of the two years in the period ended December 31, 2022 and the financial highlights for each of the five years in the period ended December 31, 2022 in conformity with accounting principles generally accepted in the United States of America.
Basis for Opinion
These financial statements are the responsibility of the Fund’s management. Our responsibility is to express an opinion on the Fund’s financial statements based on our audits. We are a public accounting firm registered with the Public Company Accounting Oversight Board (United States) (PCAOB) and are required to be independent with respect to the Fund in accordance with the U.S. federal securities laws and the applicable rules and regulations of the Securities and Exchange Commission and the PCAOB.
We conducted our audits of these financial statements in accordance with the standards of the PCAOB. Those standards require that we plan and perform the audit to obtain reasonable assurance about whether the financial statements are free of material misstatement, whether due to error or fraud.
Our audits included performing procedures to assess the risks of material misstatement of the financial statements, whether due to error or fraud, and performing procedures that respond to those risks. Such procedures included examining, on a test basis, evidence regarding the amounts and disclosures in the financial statements. Our audits also included evaluating the accounting principles used and significant estimates made by management, as well as evaluating the overall presentation of the financial statements. Our procedures included confirmation of securities owned as of December 31, 2022 by correspondence with the transfer agent and brokers; when replies were not received from brokers, we performed other auditing procedures. We believe that our audits provide a reasonable basis for our opinion.
/s/ PricewaterhouseCoopers LLP
New York, New York
February 23, 2023
We have served as the auditor of one or more investment companies in the Allianz Variable Insurance Products complex since 2018.
14
Other Federal Income Tax Information (Unaudited)
For the year ended December 31, 2022, 13.51% of the total ordinary income dividends paid by the Fund qualify for the corporate dividends received deductions available to corporate shareholders.
During the year ended December 31, 2022, the Fund declared net long-term capital gain distributions of $6,167,412.
15
A description of the policies and procedures that the Fund uses to determine how to vote proxies relating to portfolio securities is available, without charge, upon request, by visiting the Securities and Exchange Commission’s (‘‘Commission’’) website at www.sec.gov, or by calling 800-624-0197.
Information regarding how the Fund voted proxies relating to portfolio securities during the most recent 12-month period ended June 30th is available (i) without charge, upon request, by calling 800-624-0197; (ii) on the Trust’s website at https://www.allianzlife.com; and (iii) on the Commission’s website at http://www.sec.gov.
The Fund files complete Schedules of Portfolio Holdings with the Commission for the first and third quarters of each fiscal year on Form N-PORT. Schedules of Portfolio Holdings for the Fund are available without charge on the Commission’s website at http://www.sec.gov, or may be obtained by calling 800-624-0197.
16
Approval of Investment Advisory Agreement (Unaudited)
Subject to the general supervision of the Board of Trustees (the “Board”) and in accordance with the investment objectives and restrictions of each separate series (each a “Fund,” together, the “Funds”) of the Allianz Variable Insurance Products Fund of Funds Trust (the “Trust”), investment advisory services are provided to the Funds by Allianz Investment Management LLC (the “Manager”). The Manager manages each Fund pursuant to an investment management agreement (the “Management Agreement”) with the Trust in respect of each such Fund. The Management Agreement provides that the Manager, subject to the supervision and approval of the Board, is responsible for the management of each Fund. For management services, each Fund pays the Manager an investment advisory fee based upon each Fund’s average daily net assets. The Manager has contractually agreed to limit the expenses of each Fund by reimbursing the Fund if and when total Fund operating expenses exceed certain amounts until at least April 30, 2024 (the “Expense Limitation Agreement”).
In reviewing the services provided by the Manager and the terms of the Management Agreement, the Board receives and reviews information related to the Manager’s experience and expertise in the variable insurance marketplace. In addition, the Board receives information regarding the Manager’s expertise with regard to portfolio diversification and asset allocation requirements within variable insurance products issued by Allianz Life Insurance Company of North America (“Allianz Life”) and its subsidiary, Allianz Life Insurance Company of New York (“Allianz of New York”). Currently, the Funds are offered only through Allianz Life and Allianz of New York variable products, and not in the retail fund market.
As required by the Investment Company Act of 1940 (the “1940 Act”), the Board has reviewed and approved the Management Agreement with the Manager. The Board’s decision to approve this contract reflects the exercise of its business judgment on whether to approve new arrangements and continue the existing arrangements. During its review of the contract, the Board considered many factors, among the most material of which are: the Fund’s investment objectives and long-term performance; the Manager’s management philosophy, personnel, processes and investment performance, including its compliance history and the adequacy of its compliance processes; the preferences and expectations of Fund shareholders (and underlying contract owners) and their relative sophistication; the continuing state of competition in the mutual fund industry; and comparable fees in the mutual fund industry.
The Board also considered the compensation and benefits received by the Manager. This includes fees received for services provided to a Fund by employees of the Manager or of affiliates of the Manager and research services received by the Manager from brokers that execute Fund trades, as well as advisory fees. The Board considered the fact that: (1) the Manager and the Trust are parties to an Administrative Services Agreement and a Compliance Services Agreement, under which the Manager is compensated by the Trust for performing certain administrative and compliance services including providing an employee of the Manager or one of its affiliates to act as the Trust’s Chief Compliance Officer; and (2) Allianz Life Financial Services, LLC, an affiliated person of the Manager, is a registered securities broker-dealer and received (along with its affiliated persons) payments made by the underlying funds pursuant to Rule 12b-1.
The Board is aware that various courts have interpreted provisions of the 1940 Act and have indicated in their decisions that the following factors may be relevant to an adviser’s compensation: the nature, extent and quality of the services provided by the adviser, including the performance of the fund; the adviser’s cost of providing the services; the extent to which the adviser may realize “economies of scale” as the fund grows larger; any indirect benefits that may accrue to the adviser and its affiliates as a result of the adviser’s relationship with the fund; performance and expenses of comparable funds; the profitability of acting as adviser to the fund; and the extent to which the independent Board members, who are not “interested persons” of a fund as defined by the 1940 Act (“Independent Trustees”), are fully informed about all facts bearing on the adviser’s services and fees. The Board is aware of these factors and takes them into account in its review of the Management Agreement for the Funds.
Each member of the Board considered and weighed these factors in light of his or her experience in governing the Trust. The Board is assisted in its deliberations by the advice of independent legal counsel to the Independent Trustees (“Independent Trustee Counsel”). In this regard, the Board requests and receives a significant amount of information about the Funds and the Manager. Some of this information is provided at each regular meeting of the Board; additional information is provided in connection with the particular meetings at which the Board’s formal review of the Management Agreement occurs. In between regularly scheduled meetings, the Board may receive information on particular matters as the need arises. Thus, the Board’s evaluation of the Management Agreement is informed by reports covering such matters as: the Manager’s investment philosophy, personnel and processes, and the Fund’s investment performance (in absolute terms as well as in relationship to its benchmark and certain competitor or “peer group” funds). In connection with comparing the performance of each Fund versus its benchmark, the Board receives reports on the extent to which the Fund’s performance may be attributed to various applicable factors, such as asset class allocation decisions and volatility management strategies, if applicable, the performance of the underlying funds, rebalancing decisions, and the impact of cash positions and Fund fees and expenses. The Board also receives reports on the Funds’ expenses (including the advisory fee itself and the overall expense structure of the Funds, both in absolute terms and relative to peer group and/or competing funds, with due regard for the Expense Limitation Agreement and additional voluntary expense limitations); the use and allocation of any brokerage commissions derived from trading the Funds’ portfolio securities; the nature, extent and quality of the advisory and other services provided to the Fund by the Manager and its affiliates; compliance and audit reports concerning the Funds and the companies that service them; and relevant developments in the mutual fund industry and how the Funds and/or the Manager are responding to them.
The Board also receives financial information about the Manager, including reports on the compensation and benefits the Manager derives from its relationships with the Funds. These reports cover not only the fees under the Management Agreement, but also the fees, if any, received for providing other services to the Funds. The reports also discuss any indirect or “fall-out” benefits the Manager or its affiliates may derive from their relationships with the Funds.
The Management Agreement was most recently considered at Board meetings held in the summer and fall of 2022. Information relevant to the approval of the Management Agreement was considered at Board meetings held June 14 and 21, 2022, and September 13, 2022, as well as at various other meetings preceding those meetings. Accordingly, the Management Agreement was approved by the Board at an in-person meeting on September 13, 2022. At such meeting the Board also approved the Expense Limitation Agreement between the Manager and the Trust for the period ending April 30, 2024.
In connection with such meetings, the Board requested and evaluated extensive materials from the Manager, including performance and expense information for other investment companies with similar investment objectives derived from data compiled by an independent third-party provider and other sources believed to be reliable by the Manager and the Trustees. Prior to voting, the Trustees reviewed the proposed approval of the Management Agreement with management and with Independent Trustee Counsel and received a memorandum from such counsel discussing the legal standards for their consideration of the proposed approval. The Independent Trustees also discussed the proposed approval in private sessions with Independent Trustee Counsel at which no representatives of the Manager were present. In reaching their determinations relating to the approval of the Management Agreement, in respect of each Fund, each member of the Board considered all factors he or she believed relevant. The Board based its decision to approve
17
the Management Agreement on the totality of the circumstances and relevant factors, and with a view to past and future long-term considerations. Not all of the factors and considerations discussed above and below are necessarily relevant to every Fund, and the Board did not assign relative weights to factors discussed herein or deem any one or group of them to be controlling in and of themselves.
Shareholder reports must include a discussion of certain factors relating to the selection of the investment adviser and the approval of the advisory fee. The “factors” enumerated by the SEC are set forth below in italics, as well as the Board’s conclusions regarding such factors:
(1) The nature, extent and quality of services provided by the Manager. The Trustees noted that the Manager, subject to the oversight of the Board, administers each Fund’s business and other affairs. The Trustees noted that the Manager also provides the Trust and each Fund with such administrative and other services (exclusive of, and in addition to, any such services provided by any other service providers retained by the Trust on behalf of the Funds) and executive and other personnel as are necessary for the operation of the Trust and the Funds. Except for the Trust’s Chief Compliance Officer and certain compliance staff, the Manager pays all of the compensation of Trustees and officers of the Trust who are employees of the Manager or its affiliates.
The Board considered the scope and quality of services provided by the Manager and noted that the scope of the services provided has continued to expand as a result of regulatory and other developments. The Board noted, for example, that the Manager is responsible for maintaining and monitoring its own compliance program, and this compliance program has been continuously refined and enhanced in light of new regulatory requirements. The Board considered the capabilities and resources which the Manager has dedicated to performing services on behalf of the Trust and its Funds. The quality of administrative and other services, including the Manager’s role in coordinating the activities of the Trust’s other service providers, also were considered. The Board concluded that, overall, they were satisfied with the nature, extent and quality of services provided (and expected to be provided) to the Trust and to each of the Funds under the Management Agreement.
(2) The investment performance of the Funds and the Manager. In connection with every quarterly Board meeting and the summer and fall 2022 contract review process, Trustees received extensive information on the performance results of each Fund. This included, for example, performance information on absolute total return, performance versus the appropriate benchmark(s) and performance versus peer groups as reported by Lipper, the contribution to performance of the Manager’s asset class allocation decisions and volatility management strategies, if applicable, the performance of the underlying funds, and the impact on performance of rebalancing decisions, cash and Fund fees. This included Lipper performance information on the Funds for the previous quarter, and previous one-, three- and five-year periods, to the extent available. For example, in connection with the Board meetings held June 14 and 21, 2022, and September 13, 2022, the Manager reported that, for the five-year period ended December 31, 2021, two Funds were in the top 40%, three were in the middle 20%, and seven were in the bottom 40% of their respective Lipper peer groups. The Manager reported that for the three-year period ended December 31, 2021, three Funds were in the top 40%, two were in the middle 20%, and seven were in the bottom 40% of their respective Lipper peer groups. For the one-year period ended December 31, 2021, six Funds were in the top 40%, two were in the middle 20%, and four were in the bottom 40% of their respective Lipper peer groups.
The Manager also reported on the performance of the MVP Funds compared to custom managed-volatility peer groups. For the five-year period ended December 31, 2021, four Funds were in the top 40%, two were in the middle 20%, and four were in the bottom 20%. For the three-year period ended December 31, 2021, four Funds were in the top 40%, two were in the middle 20%, and four were in the bottom 40% of their respective custom managed-volatility peer groups. For the one-year period ended December 31, 2021, seven Funds were in the top 40%, two were in the middle 20%, and one was in the bottom 40% of their respective custom managed-volatility peer groups. The Board members discussed with the Manager and considered the impact of the volatility management strategies on performance in different market environments, where applicable, and considered whether they were operating as intended. The Board noted, in particular, the impact of certain characteristics of the Funds’ volatility management strategies in relation to volatility experienced as a result of the COVID-19 pandemic, and that relative performance had improved as the markets stabilized.
At the Board meeting held September 13, 2022, the Board also received updated performance information for the Funds, including updated Lipper peer group ranking information, for various periods ending June 30, 2022.
At the Board meeting held September 13, 2022, the Trustees determined that the investment performance of the Funds was acceptable.
(3) The costs of services to be provided and profits to be realized by the Manager and its affiliates from the relationship with the Funds. The Board considered that the Manager receives an advisory fee from each of the Funds. The Manager reported that for the three MVP Fusion Funds the advisory fee paid put these Funds in the 13th percentile of the customized peer group. The Manager reported that for the four MVP Index Strategy Funds the advisory fee paid put them in the 23rd percentile of the customized peer group, and for the AZL Balanced Index Strategy Fund the advisory fee paid put it in the 7th percentile of the customized peer group. The Manager reported that for the AZL DFA Multi-Strategy Fund, the advisory fee paid was in the 5th percentile. The Manager reported that for the AZL MVP DFA Multi-Strategy, AZL MVP FIAM Multi-Strategy, and AZL MVP T. Rowe Price Capital Appreciation Plus Funds, the advisory fee paid was in the 1st percentile. (A lower percentile reflects lower fund fees and is better for fund shareholders.) Trustees were provided with information on the total expense ratios of the Funds and other funds in the customized peer groups, and the Manager reported upon the challenges in making peer group comparisons for the Funds. The Board further considered and found that the advisory fee paid to the Manager with respect to each Fund was based on services provided to the Fund that were in addition to, rather than duplicative of, the services provided pursuant to the advisory agreements for the underlying funds in which the Fund invests.
The Manager provided information concerning the profitability of the Manager’s investment advisory activities for the period from 2019 through 2021. The Board recognized that it is difficult to make comparisons of profitability from investment company advisory agreements because comparative information is not generally publicly available and is affected by numerous factors, including the structure of the particular adviser, the types of funds it manages, its business mix, numerous assumptions regarding allocation of expenses and the adviser’s capital structure and cost of capital. In considering profitability information, the Board considered the possible effect of certain fall-out benefits to the Manager and its affiliates. The Board focused on profitability of the Manager’s relationships with the Funds before taxes and distribution expenses. The Board recognized that the Manager should earn a reasonable level of profits for the services it provides to each Fund.
The Board also considered that Wilshire Funds Management (“Wilshire”) serves as a consultant to the Manager in preparing statistical and other factual information for use in the creation and maintenance of the asset allocation models for the AZL MVP Fusion Funds, pursuant to an agreement between the Manager and Wilshire. Wilshire serves as a consultant to the Manager with respect to selecting the AZL MVP Fusion Funds’ underlying funds and the asset allocations among the underlying funds. The Manager, not any Fund, pays a consultant fee to Wilshire.
(4) and (5) The extent to which economies of scale would be realized as the Funds grow, and whether fee levels reflect these economies of scale. The Board noted that the advisory fee schedules for the Funds do not contain breakpoints that reduce the fee rate on assets above specified levels. The Board recognized that breakpoints may be an appropriate way for the Manager to share its economies of scale, if any, with Funds that have substantial assets. The Board found there was no uniform methodology for establishing breakpoints
18
that give effect to Fund-specific services provided by the Manager. The Board noted that in the fund industry as a whole, as well as among funds similar to the Funds, there is no uniformity or pattern in the fees and asset levels at which breakpoints (if any) apply. Depending on the age, size, and other characteristics of a particular fund and its manager’s cost structure, different conclusions can be drawn as to whether there are economies of scale to be realized at any particular level of assets, notwithstanding the intuitive conclusion that such economies exist, or will be realized at some level of total assets. Moreover, because different managers have different cost structures and service models, it is difficult to draw meaningful conclusions from the breakpoints that may have been adopted by other funds. The Board also noted that the advisory agreements for many funds do not have breakpoints at all, or if breakpoints exist, they may be at asset levels significantly greater than those of the individual Funds. The Board noted that the total assets in all of the Funds, as of June 30, 2022, were approximately $8.2 billion and that the largest Fund, the AZL MVP Growth Index Strategy Fund, had assets of approximately $2.1 billion.
The Board noted that the Manager has agreed to temporarily limit Fund expenses under the Expense Limitation Agreement, which has the effect of reducing expenses similar to implementation of advisory fee breakpoints. The Manager has committed to continue to consider the continuation of expense limits and/or advisory fee breakpoints as Fund assets change. The Board receives quarterly reports on the level of Fund assets. The Board expects to continue to consider: (a) the extent to which economies of scale have been realized, and (b) whether the advisory fee should be modified, either in connection with the next renewal of the Management Agreement or by modifying the Expense Limitation Agreement, to reflect such economies of scale, if any.
Having taken these factors into account, the Board concluded that the absence of breakpoints in the Funds’ advisory fee rate schedules was acceptable under each Fund’s circumstances.
In conclusion, after full consideration of the above factors, as well as such other factors as each member of the Board considered instructive in evaluating the Management Agreement, the Board concluded that the advisory fees were reasonable, and that the continuation of the Management Agreement was in the best interest of the Funds.
19
Information about the Board of Trustees and Officers (Unaudited)
The Trust is managed by the Trustees in accordance with the laws of the state of Delaware governing business trusts. In addition to serving on the Board of Trustees of the Trust, each Trustee serves on the Board of the Allianz Variable Insurance Products Trust (“VIP Trust”) and the AIM ETF Products Trust (“ETF Trust”) (collectively, the Trust, the VIP Trust, and ETF Trust are the “AIM Complex”). There are currently seven Trustees, one of whom is an “interested person” of the Trust within the meaning of that term under the 1940 Act. The Trustees and Officers of the Trust, and their addresses, years of birth, their positions held with the Trust, their terms of office with the Trust and length of time served, their principal occupation(s) during the past five years, the number of portfolios in the Trust they oversee, and their other directorships held during the past five years are as follows:
Independent Trustees(1)
| Name, Address, and Birth Year | Positions Held with AIM Complex | Term of Office(2)/Length of Time Served | Principal Occupation(s) During Past 5 Years | Number of Portfolios Overseen for the AIM Complex | Other 5 Years | |||||||
Peggy L. Ettestad (1957) 5701 Golden Hills Drive Minneapolis, MN 55416 | Lead Independent Trustee | Since 10/14 (Trustee since 2/07) | Managing Director, Red Canoe Management Consulting LLC, 2008 to present | 50 | None | |||||||
Tamara Lynn Fagely (1958) 5701 Golden Hills Drive Minneapolis, MN 55416 | Trustee | Since 12/17 | Retired; previously, Chief Operations Officer, Hartford Funds, 2012 to 2013 | 50 | | Diamond Hill Funds (10 Funds) | | |||||
Richard H. Forde (1953) 5701 Golden Hills Drive Minneapolis, MN 55416 | Trustee | Since 12/17 | Retired; previously, Member of the Board and Chairman of the Finance and Investment Committee, Connecticut Water Service, Inc., 2013 to 2019 | 50 | | Connecticut Water Service, Inc. | | |||||
Jack Gee (1959) 5701 Golden Hills Drive Minneapolis, MN 55416 | Trustee | Since 1/22 (Consultant to the Independent Trustees since 2/20)(3) | Retired; previously, Managing Director, BlackRock, Inc., Treasurer and Chief Financial Officer U.S. iShares, 2004 to 2019 | 50 | | Engine No. 1 ETF Trust (2 Funds); Esoterica Thematic Trust (2019 - 2020) | | |||||
Claire R. Leonardi (1955) 5701 Golden Hills Drive Minneapolis, MN 55416 | Trustee | Since 2/04 | Retired; previously, CEO, Health eSense Inc. (a medical device company), 2015 to 2018, and Connecticut Innovations, Inc. (a venture capital firm), 2012 to 2015 | 50 | None | |||||||
Dickson W. Lewis (1948) 5701 Golden Hills Drive Minneapolis, MN 55416 | Trustee | Since 2/04 | Retired; previously, senior executive for Lifetouch National School Studios (a photography company), 2006 to 2014, Jostens (a producer of year books and class rings), 2001 to 2006, and Fortis Financial Group, 1997 to 2001 | 50 | None | |||||||
20
Interested Trustee(4)
| Name, Address, and Birth Year | Positions Held with AIM Complex | Term of Office(2)/Length of Time Served | Principal Occupation(s) During Past 5 Years | Number of Portfolios Overseen for the AIM Complex | Other 5 Years | |||||
Brian Muench (1970) 5701 Golden Hills Drive Minneapolis, MN 55416 | Trustee | Since 6/11 | President, Allianz Investment Management LLC, 2010 to present; Vice President, Allianz Life, 2011 to present | 50 | None | |||||
| (1) | Each of the Independent Trustees is a member of the Audit Committee. |
| (2) | Indefinite. |
| (3) | Prior to January 1, 2022, Mr. Gee served as a consultant to the Independent Trustees since February 2020, during which he attended meetings of the Board and its standing committees, including the audit committee, solely in his capacity as a consultant, and was not entitled to vote. |
| (4) | Is an “interested person,” as defined by the 1940 Act, due to employment by Allianz Life and the Manager. |
Officers
| Name, Address, and Birth Year | Positions Held with AIM Complex | Term of Office(1)/ Length of Time Served | Principal Occupation(s) During Past 5 Years | |||
Brian Muench (1970) 5701 Golden Hills Drive Minneapolis, MN 55416 | President | Since 11/10 | President, Allianz Investment Management LLC, November 2010 to present; Vice President, Allianz Life, 2011 to present. | |||
Erik Nelson (1972) 5701 Golden Hills Drive Minneapolis, MN 55416 | Secretary | Since 12/20 | Chief Legal Officer, Allianz Investment Management LLC; Associate General Counsel, Senior Counsel, Allianz Life, 2008 to present. | |||
Bashir C. Asad (1963) Citi Fund Services Ohio, Inc. 4400 Easton Commons, Suite 200 Columbus, OH 43219 | Treasurer, Principal Accounting Officer and Principal Financial Officer | Since 06/16 | Senior Vice President, Citi Fund Services Ohio, Inc., 2011 to present. | |||
Chris R. Pheiffer (1968) 5701 Golden Hills Drive Minneapolis, MN 55416 | Chief Compliance Officer(2) and Anti-Money Laundering Compliance Officer | Since 02/14 | Chief Compliance Officer of the Trust and the VIP Trust, 2014 to present, and the ETF Trust, 2020 to present. | |||
Michael Tanski (1970) 5701 Golden Hills Drive Minneapolis, MN 55416 | Vice President | Since 04/09 | Assistant Vice President, Allianz Investment Management LLC, 2013 to present. | |||
| (1) | Indefinite. |
| (2) | The Manager and the Trust are parties to a Compliance Services Agreement under which the Manager provides an employee of the Manager or one of its affiliates to act as the Trust’s Chief Compliance Officer. |
The Fund’s Statement of Additional Information (“SAI”) contains additional information about the Trust’s Trustees and Officers. The SAI is available without charge, upon request, by calling toll-free 800-624-0197 or at https://www.allianzlife.com.
21

| The Allianz VIP Fund of Funds are distributed by Allianz Life Financial Services, LLC. | ||
| These Funds are not FDIC Insured. | ANNRPT1222 02/23 |
AZL® MVP FusionSM Moderate Fund
Annual Report
December 31, 2022

Management Discussion and Analysis
Page 1
Expense Examples and Portfolio Composition
Page 3
Schedule of Portfolio Investments
Page 4
Statement of Assets and Liabilities
Page 5
Page 5
Statements of Changes in Net Assets
Page 6
Page 7
Notes to the Financial Statements
Page 8
Report of Independent Registered Public Accounting Firm
Page 14
Other Federal Income Tax Information
Page 15
Page 16
Approval of Investment Advisory Agreement
Page 17
Information about the Board of Trustees and Officers
Page 20
This report is submitted for the general information of the shareholder of the Fund. The report is not authorized for distribution to prospective investors in the Fund unless preceded or accompanied by an effective prospectus, which contains details concerning the sales charges and other pertinent information.
Allianz Investment Management
LLC serves as the Manager for the AZL® MVP FusionSM Moderate Fund.
What factors affected the Fund’s performance during the year ended December 31, 2022?*
For the year ended December 31, 2022, the AZL® MVP FusionSM Moderate Fund (the “Fund”) returned (15.39)%. That compared to a (18.11)%, (13.01)% and a (15.91)% total return for its benchmarks, the S&P 500 Index, the Bloomberg U.S. Aggregate Bond Index, and the Moderate Composite Index, respectively.1
The Fund is a fund of funds that achieves broad diversification by investing in underlying funds. The Fund typically holds between 50% and 70% of its assets in equity funds and 30% to 50% of its assets in fixed-income funds. The Fund also employs the MVP (Managed Volatility Portfolio) risk management process, which is intended to adjust the risk of the portfolio based on quantitative indicators of market risk, such as the current level of fund and market volatility.
Domestic equities began the year at near all-time highs, but began to decline early in 2022 due to a combination of rising inflation and geopolitical uncertainties. The Federal Reserve (the Fed) shifted to a more hawkish policy approach in an attempt to bring inflation under control, as did many global central banks. The Fed increased the federal funds rate multiple times throughout the year for a combined total of 425 basis points. Russia’s invasion of Ukraine also weighed on global markets, although European countries were particularly hard hit due to their geographic proximity to the conflict and reliance on Russian commodities such as energy and wheat.
Despite strong labor rates throughout developed markets, high inflation and an anticipated economic slowdown had a negative effect on investor sentiment for the year under review. The S&P 500 declined as company valuations struggled under the higher interest rate environment. Investors grew risk averse as fears of an economic recession loomed, selling off equity positions to avoid the volatility in equity markets. By the end of the period under review, U.S. equities had experienced their worst year since the Great Financial Crisis of 2008, and international equities performed only slightly better.
The Fed’s actions made short-term financing more expensive, and the U.S. Treasury yield curve ultimately inverted with 2-year Treasuries yielding more than 10-year Treasuries by
0.55% at the end of 2022. The monetary tightening generated headwinds for domestic fixed income markets as investors demanded higher yields to account for rising rates. Widening credit spreads further weighed on prices on lower-quality bonds as investors demanded to be compensated for rising credit risks. Nearly all fixed income sectors finished the year with negative performance.
The Fund, which invests in both U.S. and international markets, outperformed its composite benchmark during the 12-month period. Its off-benchmark allocation to developed market non- U.S. equities contributed to performance, as these outpaced U.S. equities. In addition, the Fund’s performance compared to the composite benchmark was positively affected by its allocation to mid- and small-cap U.S. equities, which outpaced their large-cap counterparts.
The Fund’s overweight exposure to U.S. value stocks compared to growth stocks contributed to performance, as growth stocks underperformed during the year.
The MVP risk management process utilizes derivatives in an effort to control portfolio volatility in unstable market conditions. Market volatility was relatively high during 2022, therefore the MVP process was engaged and reduced the Fund’s equity exposure at multiple points during the year. The MVP process slightly detracted from the Fund’s performance during 2022.
Past performance does not guarantee future results.
| * | The Fund’s portfolio composition is subject to change. There is no guarantee that any sectors mentioned will continue to perform as described or that securities in such sectors will be held by the Fund in the future. The information contained in this commentary is for informational purposes only and should not be construed as a recommendation to purchase or sell securities in the sector mentioned. The Fund’s holdings and weightings are as of December 31, 2022. |
| 1 | For a complete description of the Fund’s performance benchmark please refer to page 2 of this report. |
1
AZL® MVP FusionSM Moderate Fund Review (Unaudited) |
Fund Objective
The Fund’s investment objective is to seek long-term capital appreciation. This objective may be changed by the Trustees of the Fund without shareholder approval. The Fund seeks to achieve its objective by investing in a combination of permitted Underlying Funds that represent different classes in the Fund’s asset allocation.
Investment Concerns
The Fund invests in underlying funds, so its investment performance is directly related to the performance of those underlying funds. Before investing, investors should assess the risks associated with and types of investments made by each of the underlying funds in which the Fund invests.
Quantitative investing involves risk that the values of securities selected in the quantitative analysis can react differently than the market or securities selected using fundamental analysis.
Stocks are more volatile and carry more risk and return potential than other forms of investments.
Emerging market investing may be subject to additional economic, political, liquidity, and currency risks not associated with more developed countries.
International investing may involve risk of capital loss from unfavorable fluctuations in currency values, from differences in generally accepted accounting principles or from economic or political instability in other nations.
Small- to mid-capitalization companies typically have a higher risk of failure and historically have experienced a greater degree of volatility.
Debt securities held by an underlying fund may decline in value due to rising interest rates.
Bonds offer a relatively stable level of income, although bond prices will fluctuate, providing the potential for principal gain or loss.
Investing in derivative instruments involves risks that may be different from or greater than the risk associated with investing directly in securities or other traditional instruments.
For a complete description of these and other risks associated with investing in the Fund, please refer to the Fund’s prospectus.
Growth of $10,000 Investment
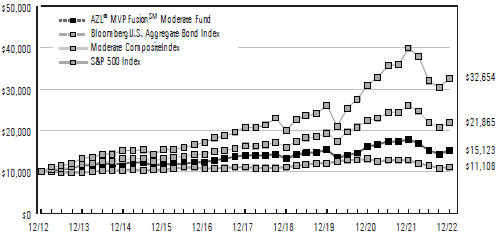
The chart above represents a comparison of a hypothetical investment in the Fund versus a similar investment in the Fund’s benchmarks and represents the reinvestment of dividends and capital gains in the Fund.
| Average Annual Total Returns as of December 31, 2022 | ||||||||||||||||||||
| 1 Year | 3 Years | 5 Years | 10 Years | |||||||||||||||||
AZL® MVP FusionSM Moderate Fund | (15.39 | )% | (0.58 | )% | 1.52 | % | 4.22 | % | ||||||||||||
Bloomberg U.S. Aggregate Bond Index | (13.01 | )% | (2.71 | )% | 0.02 | % | 1.06 | % | ||||||||||||
Moderate Composite Index | (15.91 | )% | 4.00 | % | 6.07 | % | 8.14 | % | ||||||||||||
S&P 500 Index | (18.11 | )% | 7.66 | % | 9.42 | % | 12.56 | % | ||||||||||||
Past performance does not guarantee future results. The performance data quoted represents past performance and current returns may be lower or higher. The investment return and principal value will fluctuate so that an investor’s shares, when redeemed, may be worth more or less than the original cost. To obtain performance information current to the most recent month end, please visit www.Allianzlife.com.
| Expense Ratio | Gross | ||||
AZL® MVP FusionSM Moderate Fund | 0.94 | % | |||
The above expense ratio is based on the current Fund prospectus dated April 29, 2022. The Manager and the Fund have entered into a written agreement reducing the management fee to 0.15% through at least April 30, 2024. The Manager and the Fund have entered into a written contract limiting operating expenses, excluding certain expenses (such as interest expense and acquired fund fees and expenses), to 0.30% through April 30, 2024. Additional information pertaining to the December 31, 2022 expense ratio can be found in the Financial Highlights.
Acquired fund fees and expenses are incurred indirectly by the Fund through the valuation of the Fund’s investments in the permitted Underlying Funds. Accordingly, acquired fund fees and expenses affect the Fund’s total returns. Because these fees and expenses are not included in the Fund’s financial highlights, the Fund’s total annual fund operating expenses, as shown in the current prospectus, do not correlate to the ratios of expenses to average net assets shown in the Financial Highlights. Without acquired fund fees and expenses the Fund’s gross expense ratio would be 0.22%.
The total return of the Fund does not reflect the effect of any insurance charges, the annual maintenance fee or the deduction of taxes that a shareholder would pay on Fund distributions or the redemption of Fund shares. Such charges, fees and tax payments would reduce the performance quoted.
The Fund’s performance is measured against the Standard & Poor’s 500 Index (“S&P 500”), the Bloomberg U.S. Aggregate Bond Index and the Moderate Composite Index (“Composite”). The S&P 500 is representative of 500 selected common stocks, most of which are listed on the New York Stock Exchange, and is a measure of the U.S. Stock market as a whole. The Bloomberg U.S. Aggregate Bond Index is a market value-weighted performance benchmark for investment-grade fixed-rate debt issues, including government, corporate, asset-backed, and mortgage-backed securities, with maturities of at least one year. The Composite is a blended index comprised of (60%) S&P 500 and (40%) Bloomberg U.S. Aggregate Bond Index. These indexes are unmanaged and do not reflect the deduction of fees associated with a mutual fund, such as investment management and fund accounting fees. The Fund’s performance reflects the deduction of fees for services provided to the Fund. Investors cannot invest directly in an index.
2
AZL MVP Fusion Moderate Fund
(Unaudited)
As a shareholder of the AZL MVP Fusion Moderate Fund (the “Fund”), you incur ongoing costs, including management fees, distribution fees, and other Fund expenses. These examples are intended to help you understand your ongoing costs (in dollars) of investing in the Fund and to compare these costs with the ongoing costs of investing in other mutual funds. Please note that the expenses shown in each table do not reflect expenses that apply to the subaccount or the insurance contract. If the expenses that apply to the subaccount or the insurance contract were included, your costs would have been higher.
These examples are based on an investment of $1,000 invested at the beginning of the period and held for the periods presented below.
The Actual Expense table below provides information about actual account values and actual expenses. You may use the information below, together with the amount you invested, to estimate the expenses that you paid over the period. Simply divide your account value by $1,000 (for example, an $8,600 account value divided by $1,000 = 8.6), then multiply the result by the number in the table under the heading entitled “Expenses Paid During Period” to estimate the expenses you paid on your account during this period.
| Beginning Account Value 7/1/22 | Ending Account Value 12/31/22 | Expenses Paid During Period | Annualized Expense Ratio During Period 7/1/22 - 12/31/22 | |||||
AZL MVP Fusion Moderate Fund | $1,000.00 | $1,000.20 | $0.86 | 0.17% | ||||
The Hypothetical Expense table below provides information about hypothetical account values and hypothetical expenses based on the Fund’s actual expense ratio and an assumed rate of return of 5% per year before expenses, which is not the Fund’s actual return. The hypothetical account values and expenses may not be used to estimate the actual ending account balance or expenses you paid for the period. You may use this information to compare this 5% hypothetical example with the 5% hypothetical examples that appear in the shareholder reports of other funds.
| Beginning Account Value 7/1/22 | Ending Account Value 12/31/22 | Expenses Paid During Period | Annualized Expense Ratio During Period 7/1/22 - 12/31/22 | |||||
AZL MVP Fusion Moderate Fund | $1,000.00 | $1,024.35 | $0.87 | 0.17% | ||||
| * | Expenses are equal to the average account value multiplied by the Fund’s annualized expense ratio multiplied by 184/365 (the number of days in the most recent fiscal half-year divided by the number of days in the fiscal year). |
Portfolio Composition
(Unaudited)
| Investments | Percent of Net Assets | ||||
Fixed Income Funds | 38.3 | % | |||
Domestic Equity Funds | 38.1 | ||||
International Equity Funds | 19.3 | ||||
|
| ||||
Total Investment Securities | 95.7 | ||||
Net other assets (liabilities) | 4.3 | ||||
|
| ||||
Net Assets | 100.0 | % | |||
|
| ||||
3
AZL MVP Fusion Moderate Fund
Schedule of Portfolio Investments
December 31, 2022
| Shares | Value | |||||||
Affiliated Investment Companies (95.7%): | ||||||||
Domestic Equity Funds (38.1%): | ||||||||
| 5,063,007 | AZL DFA U.S. Core Equity Fund | $ | 62,123,098 | |||||
| 2,632,761 | AZL DFA U.S. Small Cap Fund | 24,879,590 | ||||||
| 2,460,165 | AZL Gateway Fund | 34,663,722 | ||||||
| 2,543,175 | AZL Mid Cap Index Fund, Class 2 | 48,752,659 | ||||||
| 11,813,795 | AZL Russell 1000 Growth Index Fund, Class 2 | 154,642,579 | ||||||
| 13,313,866 | AZL Russell 1000 Value Index Fund, Class 2 | 164,559,389 | ||||||
| 2,168,732 | AZL Small Cap Stock Index Fund, Class 2 | 24,788,609 | ||||||
|
| |||||||
| 514,409,646 | ||||||||
|
| |||||||
Fixed Income Funds (38.3%): | ||||||||
| 8,977,352 | AZL Enhanced Bond Index Fund | 85,105,293 | ||||||
| 12,882,017 | AZL Fidelity Institutional Asset Management Total Bond Fund, Class 2 | 111,944,728 | ||||||
| 13,180,673 | AZL MetWest Total Return Bond Fund | 111,903,911 | ||||||
| (a) | See Federal Tax Information listed in the Notes to the Financial Statements. |
Percentages indicated are based on net assets as of December 31, 2022
Futures Contracts
At December 31, 2022, the Fund’s open futures contracts were as follows:
Long Futures
| Shares | Value | |||||||
Affiliated Investment Companies, continued | ||||||||
Fixed Income Funds, continued | ||||||||
| 5,702,467 | PIMCO VIT Income Portfolio | $ | 55,256,908 | |||||
| 4,333,614 | PIMCO VIT Low Duration Portfolio | 41,082,662 | ||||||
| 12,516,753 | PIMCO VIT Total Return Portfolio | 112,400,444 | ||||||
|
| |||||||
| 517,693,946 | ||||||||
|
| |||||||
International Equity Funds (19.3%): | ||||||||
| 7,380,232 | AZL DFA International Core Equity Fund | 69,152,775 | ||||||
| 8,962,732 | AZL International Index Fund, Class 2 | 136,771,296 | ||||||
| 9,101,157 | AZL MSCI Emerging Markets Equity Index Fund, Class 2 | 54,970,988 | ||||||
|
| |||||||
| 260,895,059 | ||||||||
|
| |||||||
Total Affiliated Investment Companies | ||||||||
(Cost $1,336,360,973) | 1,292,998,651 | |||||||
|
| |||||||
Total Investment Securities | ||||||||
(Cost $1,336,360,973) — 95.7%(a) | 1,292,998,651 | |||||||
Net other assets (liabilities) — 4.3% | 57,901,787 | |||||||
|
| |||||||
Net Assets — 100.0% | $ | 1,350,900,438 | ||||||
|
| |||||||
| Description | Expiration Date | Number of Contracts | Notional Amount | Value and Unrealized Appreciation/ (Depreciation) | ||||||||||||
S&P 500 Index E-Mini March Futures (U.S. Dollar) | 3/17/23 | 181 | $ | 34,942,050 | $ | 412 | ||||||||||
U.S. Treasury 10-year Note March Futures (U.S. Dollar) | 3/22/23 | 207 | 23,245,453 | (229,155 | ) | |||||||||||
|
|
| ||||||||||||||
| $ | (228,743 | ) | ||||||||||||||
|
|
| ||||||||||||||
See accompanying notes to the financial statements.
4
AZL MVP Fusion Moderate Fund
Statement of Assets and Liabilities
December 31, 2022
Assets: | |||||
Investments in affiliates, at cost | $ | 1,336,360,973 | |||
|
| ||||
Investments in affiliates, at value | $ | 1,292,998,651 | |||
Deposit at broker for futures contracts collateral | 58,044,356 | ||||
Interest and dividends receivable | 921,004 | ||||
Receivable for capital shares issued | 13,563 | ||||
Receivable for affiliated investments sold | 588,110 | ||||
Receivable for variation margin on futures contracts | 863 | ||||
Prepaid expenses | 50,339 | ||||
|
| ||||
Total Assets | 1,352,616,886 | ||||
|
| ||||
Liabilities: | |||||
Cash overdraft | 588,010 | ||||
Payable for investments purchased | 758,320 | ||||
Payable for capital shares redeemed | 195,656 | ||||
Management fees payable | 174,462 | ||||
|
| ||||
Total Liabilities | 1,716,448 | ||||
|
| ||||
Net Assets | $ | 1,350,900,438 | |||
|
| ||||
Net Assets Consist of: | |||||
Paid in capital | $ | 1,339,434,660 | |||
Total distributable earnings | 11,465,778 | ||||
|
| ||||
Net Assets | $ | 1,350,900,438 | |||
|
| ||||
Shares of beneficial interest (unlimited number of shares authorized, no par value) | 144,750,285 | ||||
Net Asset Value (offering and redemption price per share) | $ | 9.33 | |||
|
| ||||
For the Year Ended December 31, 2022
Investment Income: | |||||
Dividends from affiliates | $ | 22,447,968 | |||
Interest | 972,337 | ||||
Dividends from non-affiliates | 15 | ||||
|
| ||||
Total Investment Income | 23,420,320 | ||||
|
| ||||
Expenses: | |||||
Management fees | 3,027,175 | ||||
Administration fees | 74,120 | ||||
Custodian fees | 8,234 | ||||
Administrative and compliance services fees | 20,767 | ||||
Transfer agent fees | 5,974 | ||||
Trustee fees | 82,824 | ||||
Professional fees | 69,669 | ||||
Shareholder reports | 36,738 | ||||
Other expenses | 22,964 | ||||
|
| ||||
Total expenses | 3,348,465 | ||||
Less Management fees contractually waived | (756,808 | ) | |||
|
| ||||
Net expenses | 2,591,657 | ||||
|
| ||||
Net Investment Income/(Loss) | 20,828,663 | ||||
|
| ||||
Net realized and Change in net unrealized gains/losses on investments: | |||||
Net realized gains/(losses) on affiliated underlying funds | (342,247 | ) | |||
Net realized gains distributions from affiliated underlying funds | 94,266,035 | ||||
Net realized gains/(losses) on futures contracts | (16,239,156 | ) | |||
Change in net unrealized appreciation/depreciation on affiliated underlying funds | (370,947,690 | ) | |||
Change in net unrealized appreciation/depreciation on futures contracts | (1,414,313 | ) | |||
|
| ||||
Net realized and Change in net unrealized gains/losses on investments | (294,677,371) | ||||
|
| ||||
Change in Net Assets Resulting From Operations | $ | (273,848,708 | ) | ||
|
|
See accompanying notes to the financial statements.
5
AZL MVP Fusion Moderate Fund
Statements of Changes in Net Assets
For the Year Ended | For the Year Ended | |||||||||
Change In Net Assets: | ||||||||||
Operations: | ||||||||||
Net investment income/(loss) | $ | 20,828,663 | $ | 19,108,158 | ||||||
Net realized gains/(losses) on investments | 77,684,632 | 140,772,455 | ||||||||
Change in unrealized appreciation/depreciation on investments | (372,362,003 | ) | 38,699,650 | |||||||
|
|
|
| |||||||
Change in net assets resulting from operations | (273,848,708 | ) | 198,580,263 | |||||||
|
|
|
| |||||||
Distributions to Shareholders: | ||||||||||
Distributions | (103,099,048 | ) | (38,601,462 | ) | ||||||
|
|
|
| |||||||
Change in net assets resulting from distributions to shareholders | (103,099,048 | ) | (38,601,462 | ) | ||||||
|
|
|
| |||||||
Capital Transactions: | ||||||||||
Proceeds from shares issued | 1,443,421 | 4,491,735 | ||||||||
Proceeds from dividends reinvested | 103,099,047 | 38,601,462 | ||||||||
Value of shares redeemed | (208,704,578 | ) | (264,486,763 | ) | ||||||
|
|
|
| |||||||
Change in net assets resulting from capital transactions | (104,162,110 | ) | (221,393,566 | ) | ||||||
|
|
|
| |||||||
Change in net assets | (481,109,866 | ) | (61,414,765 | ) | ||||||
Net Assets: | ||||||||||
Beginning of period | 1,832,010,304 | 1,893,425,069 | ||||||||
|
|
|
| |||||||
End of period | $ | 1,350,900,438 | $ | 1,832,010,304 | ||||||
|
|
|
| |||||||
Share Transactions: | ||||||||||
Shares issued | 138,907 | 394,315 | ||||||||
Dividends reinvested | 11,404,762 | 3,345,014 | ||||||||
Shares redeemed | (20,206,786 | ) | (22,707,643 | ) | ||||||
|
|
|
| |||||||
Change in shares | (8,663,117 | ) | (18,968,314 | ) | ||||||
|
|
|
| |||||||
See accompanying notes to the financial statements.
6
AZL MVP Fusion Moderate Fund
(Selected data for a share of beneficial interest outstanding throughout the periods indicated. Does not reflect fees or expenses associated with the separate accounts that invest in the Fund or in any variable annuity contracts or variable life insurance policy for which the Fund serves as an investment vehicle.)
| Year Ended December 31, 2022 | Year Ended December 31, 2021 | Year Ended December 31, 2020 | Year Ended December 31, 2019 | Year Ended December 31, 2018 | |||||||||||||||||||||
Net Asset Value, Beginning of Period | $11.94 | $10.98 | $11.16 | $10.31 | $11.97 | ||||||||||||||||||||
|
|
|
|
|
|
|
|
|
| ||||||||||||||||
Investment Activities: | |||||||||||||||||||||||||
Net Investment Income/(Loss) | 0.14 | (a) | 0.12 | (a) | 0.19 | (a) | 0.20 | (a) | 0.21 | ||||||||||||||||
Net Realized and Unrealized Gains/(Losses) on Investments | (2.00 | ) | 1.09 | 0.26 | 1.53 | (0.93 | ) | ||||||||||||||||||
|
|
|
|
|
|
|
|
|
| ||||||||||||||||
Total from Investment Activities | (1.86 | ) | 1.21 | 0.45 | 1.73 | (0.72 | ) | ||||||||||||||||||
|
|
|
|
|
|
|
|
|
| ||||||||||||||||
Distributions to Shareholders From: | |||||||||||||||||||||||||
Net Investment Income | (0.25 | ) | (0.25 | ) | (0.23 | ) | (0.29 | ) | (0.14 | ) | |||||||||||||||
Net Realized Gains | (0.50 | ) | — | (0.40 | ) | (0.59 | ) | (0.80 | ) | ||||||||||||||||
|
|
|
|
|
|
|
|
|
| ||||||||||||||||
Total Dividends | (0.75 | ) | (0.25 | ) | (0.63 | ) | (0.88 | ) | (0.94 | ) | |||||||||||||||
|
|
|
|
|
|
|
|
|
| ||||||||||||||||
Net Asset Value, End of Period | $9.33 | $11.94 | $10.98 | $11.16 | $10.31 | ||||||||||||||||||||
|
|
|
|
|
|
|
|
|
| ||||||||||||||||
Total Return (b) | (15.39 | )% | 11.09 | % | 4.54 | % | 17.31 | % | (6.46 | )% | |||||||||||||||
Ratios to Average Net Assets/Supplemental Data: | |||||||||||||||||||||||||
Net Assets, End of Period (000’s) | $ | 1,350,900 | $ | 1,832,010 | $ | 1,893,425 | $ | 2,032,770 | $ | 1,953,730 | |||||||||||||||
Net Investment Income/(Loss) | 1.38 | % | 1.01 | % | 1.84 | % | 1.81 | % | 1.66 | % | |||||||||||||||
Expenses Before Reductions*(c) | 0.22 | % | 0.22 | % | 0.22 | % | 0.22 | % | 0.22 | % | |||||||||||||||
Expenses Net of Reductions* | 0.17 | % | 0.17 | % | 0.22 | % | 0.22 | % | 0.22 | % | |||||||||||||||
Portfolio Turnover Rate | 8 | % | 10 | % | 18 | % | 12 | % | 18 | % | |||||||||||||||
| * | The expense ratios exclude the impact of fees/expenses paid by each underlying fund. |
| (a) | Calculated using the average shares method. |
| (b) | The returns include reinvested dividends and fund level expenses, but exclude insurance contract charges. If these charges were included, the returns would have been lower. |
| (c) | Excludes fee reductions. If such fee reductions had not occurred, the ratios would have been as indicated. |
See accompanying notes to the financial statements.
7
AZL MVP Fusion Moderate Fund
Notes to the Financial Statements
December 31, 2022
1. Organization
The Allianz Variable Insurance Products Fund of Funds Trust (the “Trust”) was organized as a Delaware statutory trust on June 16, 2004. The Trust is an open-end management investment company registered under the Investment Company Act of 1940, as amended, (the “1940 Act”) and thus is determined to be an investment company, and follows the investment company accounting and reporting guidance under Financial Accounting Standards Board (“FASB”) Accounting Standards Codification (“ASC”) Topic 946 “Financial Services—Investment Companies”. The Trust consists of 12 separate investment portfolios (collectively, the “Funds”), of which one is included in this report, the AZL MVP Fusion Moderate Fund (the “Fund”), and 11 are presented in separate reports. The Fund is a diversified series of the Trust.
The Fund is a “fund of funds”, which means that the Fund invests primarily in other mutual funds (the “Underlying Funds”). Underlying Funds invest in stocks, bonds, and other securities and reflect varying amounts of potential investment risk and reward. The Underlying Funds record their investments at fair value. Periodically, the Fund will adjust its asset allocation as it seeks to achieve its investment objective.
The Trust is authorized to issue an unlimited number of shares of the Fund without par value. Shares of the Fund are available through the variable annuity contracts offered through the separate accounts of participating insurance companies. Currently, the Fund only offers its shares to separate accounts of Allianz Life Insurance Company of North America and Allianz Life Insurance Company of New York, affiliates of the Trust and the Manager, as defined below.
Under the Trust’s organizational documents, its officers and trustees are indemnified against certain liabilities arising out of the performance of their duties to the Fund. In addition, in the normal course of business, the Fund may enter into contracts with its vendors and others that provide for general indemnifications. The Fund’s maximum exposure under these arrangements is unknown, as this would involve future claims that may be made against the Fund. However, based on experience, the Fund expects that risk of loss to be remote.
On December 13, 2022, the Board unanimously approved a reorganization whereby the AZL MVP DFA Multi-Strategy Fund will acquire all of the assets and liabilities of the Fund and costs related to the reorganization will be paid by the Manager.
2. Significant Accounting Policies
The following is a summary of significant accounting policies followed by the Fund in the preparation of its financial statements. The policies conform with U.S. generally accepted accounting principles (“U.S. GAAP”). The preparation of financial statements requires management to make certain estimates and assumptions that affect the reported amounts of assets and liabilities and disclosure of contingent assets and liabilities at the date of the financial statements and the reported amounts of increases and decreases in net assets from operations during the reporting period. Actual results could differ from those estimates.
Security Valuation
The Fund records its investments at fair value. Fair value is defined as the price that would be received to sell an asset or paid to transfer a liability in an orderly transaction between willing market participants at the measurement date. The valuation techniques used to determine fair value are further described in Note 4 below.
Investment Transactions and Investment Income
Investment transactions are accounted for on trade date. Net realized gains and losses on investments sold and on foreign currency transactions are recorded on the basis of identified cost. Interest income is recorded on the accrual basis and includes, where applicable, the amortization of premiums or accretion of discounts. Dividend income is recorded on the ex-dividend date except in the case of foreign securities, in which case dividends are recorded as soon as such information becomes available.
Distributions to Shareholders
Distributions to shareholders are recorded on the ex-dividend date. The Fund distributes its dividends from net investment income and net realized capital gains, if any, on an annual basis. The amount of distributions from net investment income and from net realized gains is determined in accordance with federal income tax regulations, which may differ from U.S. GAAP. These “book/tax” differences are either temporary or permanent in nature. To the extent these differences are permanent in nature (e.g., return of capital, net operating loss, reclassification of certain market discounts, gain/loss, paydowns, and distributions), such amounts are reclassified within the composition of net assets based on their federal tax-basis treatment; temporary differences (e.g., wash sales and differing treatment on certain investments) do not require reclassification. Distributions to shareholders that exceed net investment income and net realized gains for tax purposes are reported as distributions of capital.
Expense Allocation
Expenses directly attributable to the Fund are charged directly to the Fund, while expenses attributable to more than one Fund are allocated among the respective Funds based upon relative net assets or some other reasonable method. Expenses which are attributable to more than one Trust are allocated across the Allianz Variable Insurance Products Trust, Allianz Variable Insurance Products Fund of Funds Trust and AIM ETF Products Trust based upon relative net assets or another reasonable basis. Allianz Investment Management LLC (the “Manager”), serves as the investment manager for the Trust, Allianz Variable Insurance Products Trust and AIM ETF Products Trust.
This report does not reflect fees or expenses associated with the separate accounts that invest in the Fund or in any variable annuity contracts or variable life insurance policy for which the Fund serves as an investment vehicle.
Affiliated Securities Transactions
Pursuant to Rule 17a-7 under the 1940 Act, the Fund may engage in securities transactions with affiliated investment companies and advisory accounts managed by the Manager. Any such purchase or sale transaction must be effected without a brokerage commission or other remuneration, except for customary transfer fees. The transaction must be effected at the current market price, which is either the security’s last sale price on an exchange or, if there are no transactions in the security that day, at the average of the highest bid and lowest asked price. During the year ended December 31, 2022, the Fund did not engage in any Rule 17a-7 transactions.
8
AZL MVP Fusion Moderate Fund
Notes to the Financial Statements
December 31, 2022
Derivative Instruments
All open derivative positions at period end are reflected on the Fund’s Schedule of Portfolio Investments. The following is a description of the derivative instruments utilized by the Fund, including the primary underlying risk exposures related to each instrument type. The Fund’s allocation to the MVP (Managed Volatility Portfolio) risk management process may include (a) derivatives such as index futures, other futures contracts, options, and other similar securities and (b) cash, money market equivalents, short-term debt instruments, money market funds, and short-term debt funds to satisfy all applicable margin requirements and to provide additional portfolio liquidity to satisfy large redemptions and any margin calls. Due to the leverage provided by derivatives, the notional value of the Fund’s derivative positions could exceed 20% of the Fund’s value. The Fund may also use futures to gain equity exposure and may hold cash as a buffer in the event of market shocks.
Futures Contracts
During the year ended December 31, 2022, the Fund invested in futures contracts to reduce volatility and limit the need to decrease or increase allocations to underlying funds. Futures contracts are valued based upon their quoted daily settlement prices. Upon entering into a futures contract, the Fund is required to segregate liquid assets in accordance with the initial margin requirements of the broker or exchange. Futures contracts are marked to market daily and a payable or receivable for the change in value (“variation margin”), if any, is recorded by the Fund. Gains or losses are recognized but not considered realized until the contracts expire or are closed. Futures contracts involve, to varying degrees, elements of market risk (generally equity price risk related to stock futures, interest rate risk related to bond futures, and foreign currency risk related to currency futures) and exposure to loss in excess of the variation margin disclosed in the Statement of Assets and Liabilities. The primary risks associated with the use of futures contracts are the imperfect correlation between the change in value of the underlying securities and the prices of futures contracts, the possibility of an illiquid market, and the inability of the counterparty to meet the terms of the contract. For the year ended December 31, 2022, the monthly average notional amount for long contracts was $43.4 million, and the monthly average notional amount for short contracts was $89.0 million. Realized gains and losses are reported as “Net realized gains/(losses) on futures contracts” on the Statement of Operations.
Summary of Derivative Instruments
The following is a summary of the values of derivative instruments on the Fund’s Statement of Assets and Liabilities, categorized by risk exposure, as of December 31, 2022:
Asset Derivatives | Liability Derivatives | |||||||||||
| Primary Risk Exposure | Statement of Assets and Liabilities Location | Total Value | Statement of Assets and Liabilities Location | Total Value | ||||||||
Equity Risk | ||||||||||||
| Futures Contracts | Receivable for variation margin on futures contracts* | $412 | Payable for variation margin on futures contracts* | $— | ||||||||
Interest Rate Risk | ||||||||||||
| Futures Contracts | Receivable for variation margin on futures contracts* | — | Payable for variation margin on futures contracts* | 229,155 | ||||||||
| * | For futures contracts, the amounts represent the cumulative appreciation/depreciation of these futures contracts as reported in the Schedule of Portfolio Investments. Only the current day’s variation margin is reported within the Statement of Assets and Liabilities as variation margin on futures contracts. |
The following is a summary of the effect of derivative instruments on the Statement of Operations, categorized by risk exposure, for the year ended December 31, 2022:
| Primary Risk Exposure | Location of Gains/(Losses) on Derivatives Recognized | Realized Gains/(Losses) on Derivatives Recognized | Change in Net Unrealized on Derivatives Recognized | |||||||
Equity Risk | ||||||||||
| Futures Contracts | Net realized gains/(losses) on futures contracts/ Change in net unrealized appreciation/ depreciation on futures contracts | $ | (12,466,951) | $ | (801,861) | |||||
Interest Rate Risk | ||||||||||
| Futures Contracts | Net realized gains/(losses) on futures contracts/ Change in net unrealized appreciation/ depreciation on futures contracts | (3,772,205 | ) | (612,452 | ) | |||||
3. Fees and Transactions with Affiliates and Other Parties
The Manager provides investment advisory and management services for the Fund. The Manager has contractually agreed to waive fees and reimburse the Fund to limit the annual expenses, excluding interest expense (e.g., cash overdraft fees), taxes, brokerage commissions, acquired fund fees and expenses, other expenditures that are capitalized in accordance with U.S. GAAP and other extraordinary expenses not incurred in the ordinary course of the Fund’s business, based on the daily net assets of the Fund, through April 30, 2024. Expenses incurred for investment advisory and management services are reflected on the Statement of Operations as “Management fees.”
For the year ended December 31, 2022, the annual rate due to the Manager and the annual expense limit were as follows:
| Annual Rate* | Annual Expense Limit | |||||||||
AZL MVP Fusion Moderate Fund | 0.20 | % | 0.30 | % | ||||||
* The Manager waived, prior to any application of expense limit, the management fee to 0.15% on all assets in order to maintain a more competitive expense ratio. The Manager reserves the right to increase the management fee to the amount shown in the table above (i.e., discontinue the waiver) at any time after April 30, 2024.
Any amounts contractually waived or reimbursed by the Manager with respect to the annual expense limit in a particular fiscal year will be subject to repayment by the Fund to the Manager to the extent that from time to time through the next three fiscal years the repayment will not cause the Fund’s expenses to exceed the lesser of the stated limit at the time of the waiver or the current stated limit. Any amounts recouped by the Manager during the year are reflected on the Statement of Operations as “Recoupment of prior expenses reimbursed by the Manager.” At December 31, 2022, there were no remaining contractual reimbursements subject to repayment by the Fund in subsequent years.
9
AZL MVP Fusion Moderate Fund
Notes to the Financial Statements
December 31, 2022
Management fees, which the Manager waived in order to maintain more competitive expense ratios, are not subject to repayment in subsequent years. Information on the total amount waived/reimbursed by the Manager or repaid to the Manager by the Fund during the period can be found on the Statement of Operations.
The Manager or an affiliate of the Manager serves as the investment adviser of certain underlying funds in which the Fund invests. At December 31, 2022, these underlying funds are noted as Affiliated Investment Companies in the Fund’s Schedule of Portfolio Investments. Additional information, including financial statements, about these Funds is available at www.allianzlife.com. The Manager or an affiliate of the Manager is paid a separate fee from the underlying funds for such services. A summary of the Fund’s investments in affiliated investment companies for the year ended December 31, 2022 is as follows:
| Value 12/31/21 | Purchases at Cost | Proceeds from Sales | Net Realized Gains (Losses) | Change in Net (Depreciation) | Value 12/31/22 | Shares as of 12/31/22 | Dividend Income | Net Realized Gains Distributions from Affiliated Underlying Funds | |||||||||||||||||||||||||||||||||||||
AZL DFA International Core Equity Fund | $ | 93,180,597 | $ | 8,029,729 | $ | (12,182,810 | ) | $ | 1,331,696 | $ | (21,206,437 | ) | $ | 69,152,775 | 7,380,232 | $ | 1,841,271 | $ | 6,188,458 | ||||||||||||||||||||||||||
AZL DFA U.S. Core Equity Fund | 84,150,832 | 8,877,306 | (9,785,575 | ) | 2,107,688 | (23,227,153 | ) | 62,123,098 | 5,063,007 | 494,767 | 8,382,539 | ||||||||||||||||||||||||||||||||||
AZL DFA U.S. Small Cap Fund | 33,221,577 | 6,605,764 | (4,185,530 | ) | 395,614 | (11,157,835 | ) | 24,879,590 | 2,632,761 | 157,180 | 6,448,584 | ||||||||||||||||||||||||||||||||||
AZL Enhanced Bond Index Fund | 114,082,224 | 1,422,444 | (13,877,420 | ) | (2,332,757 | ) | (14,189,198 | ) | 85,105,293 | 8,977,352 | 1,372,931 | 49,513 | |||||||||||||||||||||||||||||||||
AZL Fidelity Institutional Asset Management Total Bond Fund, Class 2 | 150,037,904 | 6,010,934 | (18,747,443 | ) | (2,333,470 | ) | (23,023,197 | ) | 111,944,728 | 12,882,017 | 3,002,102 | 3,008,831 | |||||||||||||||||||||||||||||||||
AZL Gateway Fund | 46,426,902 | 123,370 | (6,323,885 | ) | 688,105 | (6,250,770 | ) | 34,663,722 | 2,460,165 | 123,370 | — | ||||||||||||||||||||||||||||||||||
AZL International Index Fund, Class 2 | 185,015,693 | 7,874,007 | (22,081,098 | ) | 1,771,874 | (35,809,180 | ) | 136,771,296 | 8,962,732 | 4,250,677 | 3,623,330 | ||||||||||||||||||||||||||||||||||
AZL MetWest Total Return Bond Fund | 149,740,460 | 1,438,795 | (16,541,457 | ) | (3,474,482 | ) | (19,259,405 | ) | 111,903,911 | 13,180,673 | 1,357,888 | 80,906 | |||||||||||||||||||||||||||||||||
AZL Mid Cap Index Fund, Class 2 | 65,527,708 | 10,435,456 | (8,215,370 | ) | 882,632 | (19,877,767 | ) | 48,752,659 | 2,543,175 | 373,133 | 10,062,322 | ||||||||||||||||||||||||||||||||||
AZL MSCI Emerging Markets Equity Index Fund, Class 2 | 69,388,891 | 2,144,719 | — | — | (16,562,622 | ) | 54,970,988 | 9,101,157 | 818,257 | 1,326,462 | |||||||||||||||||||||||||||||||||||
AZL Russell 1000 Growth Index Fund, Class 2 | 219,697,935 | 33,727,905 | (52,291 | ) | 17,282 | (98,748,252 | ) | 154,642,579 | 11,813,795 | 105,189 | 33,622,716 | ||||||||||||||||||||||||||||||||||
AZL Russell 1000 Value Index Fund, Class 2 | 221,679,438 | 19,428,192 | (40,702,509 | ) | 4,748,649 | (40,594,381 | ) | 164,559,389 | 13,313,866 | 2,227,782 | 17,200,412 | ||||||||||||||||||||||||||||||||||
AZL Small Cap Stock Index Fund, Class 2 | 32,993,204 | 4,482,312 | (2,864,779 | ) | 166,349 | (9,988,477 | ) | 24,788,609 | 2,168,732 | 210,351 | 4,271,962 | ||||||||||||||||||||||||||||||||||
PIMCO VIT Income Portfolio | 73,715,110 | 2,227,499 | (12,807,449 | ) | (414,227 | ) | (7,333,145 | ) | 55,256,908 | 5,702,467 | 2,096,619 | — | |||||||||||||||||||||||||||||||||
PIMCO VIT Low Duration Portfolio | 52,466,332 | 752,869 | (8,439,480 | ) | (557,048 | ) | (3,140,011 | ) | 41,082,662 | 4,333,614 | 752,869 | — | |||||||||||||||||||||||||||||||||
PIMCO VIT Total Return Portfolio | 150,165,203 | 3,263,581 | (17,108,328 | ) | (3,340,152 | ) | (20,579,860 | ) | 112,400,444 | 12,516,753 | 3,263,582 | — | |||||||||||||||||||||||||||||||||
|
|
|
|
|
|
|
|
|
|
|
|
|
|
|
|
|
| ||||||||||||||||||||||||||||
| $ | 1,741,490,010 | $ | 116,844,882 | $ | (193,915,424 | ) | $ | (342,247 | ) | $ | (370,947,690 | ) | $ | 1,292,998,651 | 123,032,498 | $ | 22,447,968 | $ | 94,266,035 | ||||||||||||||||||||||||||
|
|
|
|
|
|
|
|
|
|
|
|
|
|
|
|
|
| ||||||||||||||||||||||||||||
Pursuant to separate agreements between the Trust and the Manager, the Manager provides a Chief Compliance Officer (“CCO”) and certain compliance oversight and regulatory filing services to the Trust. Under these agreements, the Manager is entitled to an amount equal to a portion of the compensation and certain other expenses related to the individuals performing the CCO and compliance oversight services, as well as $100 per hour for time incurred in connection with the preparation and filing of certain documents with the SEC. The fees are paid to the Manager on a quarterly basis. The total expenses incurred by the Fund for these services are reflected on the Statement of Operations as “Administrative and compliance services fees.”
Citi Fund Services Ohio, Inc. (“Citi” or the “Administrator”), a wholly owned subsidiary of Citigroup, Inc., with which an officer of the Trust is affiliated, serves as the Trust’s administrator and fund accountant, and assists the Trust in all aspects of its administration and operation. The Administrator is entitled to a fee, accrued daily and paid monthly. The Administrator is entitled to an annual fee for each additional class of shares of any Fund, certain annual fees in supporting fair value services, and a Trust-wide annual fee for providing infrastructure and support in implementing the written policies and procedures comprising the Fund’s compliance program. The Administrator is also reimbursed for certain expenses incurred. The total expenses incurred by the Fund for these services are reflected on the Statement of Operations as “Administration fees.”
FIS Investor Services LLC (“FIS”) serves as the Fund’s transfer agent. Under the Transfer Agent Agreement, the Trust pays FIS a fee for its services and reimburses FIS for all of their reasonable out-of-pocket expenses incurred in providing these services.
The Bank of New York Mellon (“BNY Mellon” or the “Custodian”) serves as the Trust’s custodian. For these services as custodian, the Funds pay BNY Mellon a fee based on a percentage of assets held on behalf of the Funds, plus certain out-of-pocket charges.
Allianz Life Financial Services, LLC (“ALFS”), an affiliate of the Manager, serves as distributor of the Fund. ALFS receives an annual Trust-wide annual fee of $7,500, paid by the Manager from its profits and not by the Trust, for recordkeeping and reporting services.
Certain Officers and Trustees of the Trust are affiliated with the Manager or the Administrator. Such Officers (except for the Trust’s CCO as noted above) and Trustees receive no compensation from the Trust for serving in their respective roles.
10
AZL MVP Fusion Moderate Fund
Notes to the Financial Statements
December 31, 2022
4. Investment Valuation Summary
The valuation techniques employed by the Fund, as described below, maximize the use of observable inputs and minimize the use of unobservable inputs in determining fair value. The inputs used for valuing the Fund’s investments are summarized in the three broad levels listed below:
| ● | Level 1 - quoted prices in active markets for identical assets |
| ● | Level 2 - other significant observable inputs (including quoted prices for similar securities, interest rates, prepayments speeds, credit risk, etc.) |
| ● | Level 3 - significant unobservable inputs (including the Fund’s own assumptions in determining the fair value of investments) |
Changes in valuation techniques may result in transfers in or out of an assigned level within the disclosure hierarchy. The inputs or methodology used for valuing investments is not necessarily an indication of the risk associated with investing in those investments.
Investments in other investment companies are valued at their published net asset value (“NAV”). Security prices are determined pursuant to valuation procedures approved by the Trust’s Board of Trustees (the “Board” or “Trustees”) as of the close of the New York Stock Exchange (“NYSE”) (generally 4:00 pm Eastern Time). The investments utilizing Level 1 valuations represent investments in open-end investment companies. Futures contracts are valued at the settlement prices established each day on the primary exchange and are typically categorized as Level 1 in the fair value hierarchy.
The Board has designated the Manager to perform the Fund’s fair value determinations in accordance with valuation procedures approved by the Board. The effect of using fair value pricing is that the Fund’s NAV will be subject to the judgment of the Manager. The Manager’s fair valuation process is subject to the oversight of the Board.
The following is a summary of the valuation inputs used as of December 31, 2022 in valuing the Fund’s investments based upon the three levels defined above:
Investment Securities: | Level 1 | Level 2 | Level 3 | Total | ||||||||||||
Affiliated Investment Companies | $1,292,998,651 | $— | $— | $1,292,998,651 | ||||||||||||
|
|
|
|
|
|
|
| |||||||||
Total Investment Securities | 1,292,998,651 | — | — | 1,292,998,651 | ||||||||||||
|
|
|
|
|
|
|
| |||||||||
Other Financial Instruments:* | ||||||||||||||||
Futures Contracts | (228,743 | ) | — | — | (228,743 | ) | ||||||||||
|
|
|
|
|
|
|
| |||||||||
Total Investments | $1,292,769,908 | $— | $— | $1,292,769,908 | ||||||||||||
|
|
|
|
|
|
|
| |||||||||
| * | Other Financial Instruments would include any derivative instruments, such as futures contracts. These investments are generally presented in the financial statements at variation margin. |
5. Security Purchases and Sales
For the year ended December 31, 2022, cost of purchases and proceeds from sales of securities (excluding securities maturing less than one year from acquisition) were as follows:
| Purchases | Sales | |||||||||
AZL MVP Fusion Moderate Fund | $ | 116,844,882 | $ | 193,915,424 | ||||||
6. Investment Risks
The risks below are presented in an order intended to facilitate readability. Their order does not imply that the realization of one risk is more likely to occur more frequently than another risk, nor does it imply that the realization of one risk is likely to have a greater adverse impact than another risk. The Fund may be subject to other risks in addition to these identified risks. This section discusses certain common principal risks encountered by the Fund.
Derivatives Risk: The Fund may invest directly or through affiliated or unaffiliated mutual funds or unregistered investment pools in derivative instruments such as futures, options, and options on futures. A derivative is a financial contract whose value depends on, or is derived from, the value of an underlying asset, reference rate, or risk. Use of derivative instruments involves risks different from, or possibly greater than, the risks associated with investing directly in securities and other traditional investments. Derivatives are subject to a number of other risks, such as liquidity risk, interest rate risk, market risk, credit risk, and selection risk. Derivatives also involve the risk of mispricing or improper valuation and the risk that changes in the value may not correlate perfectly with the underlying asset, rate, or index. Using derivatives may result in losses, possibly in excess of the principal amount invested. Also, suitable derivative transactions may not be available in all circumstances. The other party to a derivatives contract could default.
Foreign Securities Risk: Investing in the securities of non-U.S. issuers involves a number of risks, such as fluctuations in currency values, adverse political, social or economic developments, and differences in social and economic developments or policies. Such risks include future political and economic developments, and the possible imposition of exchange controls or other foreign governmental laws and restrictions. In addition, with respect to certain countries, there is the possibility of expropriation of assets, confiscatory taxation, political or social instability or diplomatic developments which could adversely affect investments in those securities. Certain foreign companies may be subject to sanctions, embargoes, or other governmental actions that may impair or otherwise limit the ability to invest in, receive, hold or sell the securities of such companies.
Fund of Fund Risk: The Fund, as a shareholder of the underlying funds, indirectly bears its proportionate share of any investment management fees and other expenses of the underlying funds. Further due to the fees and expenses paid by the Fund, as well as small variations in the Fund’s actual allocations to the underlying funds and any futures and cash held in the Fund’s portfolio, the performance and income distributions of the Fund will not be the same as the performance and income distributions of the underlying funds. In addition, the Fund maintains indirect exposure to various types of risk which may exist in the underlying Funds, such as foreign securities risk, fixed income securities risk and other risks.
Interest Rate Risk: Debt securities held by an underlying fund may decline in value due to rising interest rates. The price of a bond is also affected by its maturity. Bonds with longer maturities generally have greater sensitivity to changes in interest rates.
11
AZL MVP Fusion Moderate Fund
Notes to the Financial Statements
December 31, 2022
Market Risk: The market price of securities owned by the underlying funds may go up or down, sometimes rapidly and unpredictably. Securities may decline in value due to factors affecting securities markets generally or particular industries represented in the securities markets. The value of a security may decline due to general market conditions that are not specifically related to a particular company, such as real or perceived adverse economic conditions, changes in the general outlook for corporate earnings, changes in interest or currency rates, or adverse investor sentiment, as well as natural disasters, and outbreaks of infectious illnesses or other widespread public health issues.
Quantitative Investing Risk: The value of securities selected using quantitative analysis can react differently to issuer, political, market, and economic developments than the market as a whole or securities selected using only fundamental analysis. The factors used in quantitative analysis and the weight placed on those factors may not be predictive of a security’s value. In addition, factors that affect a security’s value can change over time and these changes may not be reflected in the quantitative model. A quantitative model can be adversely affected by errors or imperfections in the factors or the data on which evaluations are based, or by technical issues with construction or implementation of the model, which in any case may result in a failure of the portfolio to perform as expected or a failure to identify securities that will perform well in the future.
7. Coronavirus (COVID-19) Pandemic
The global outbreak of the COVID-19 strain of the coronavirus has caused adverse effects on many companies, sectors, nations, regions and the markets in general, and may continue for an unpredictable duration. The effects of this pandemic may adversely impact the value and performance of the Fund, its ability to buy and sell fund investments at appropriate valuations, and its ability to achieve its investment objective(s).
8. Federal Tax Information
It is the policy of the Fund to continue to qualify as a regulated investment company by complying with the provisions available to certain investment companies, as defined under Subchapter M of the Internal Revenue Code, and to make distributions of net investment income and net realized gains sufficient to relieve it from all, or substantially all, federal income taxes. Accordingly, no provisions for federal income taxes are required in the financial statements.
Management of the Fund has reviewed tax positions taken in tax years that remain subject to examination by all major tax jurisdictions, including federal (i.e., the last four tax year ends and the interim tax period since then, as applicable). Management believes that there is no tax liability resulting from unrecognized tax benefits related to uncertain tax positions taken.
Cost of securities, including derivatives and short positions as applicable, for federal income tax purposes at December 31, 2022 is $1,367,881,290. The gross unrealized appreciation/ (depreciation) on a tax basis is as follows:
Unrealized appreciation | $30,167,702 | ||||
Unrealized (depreciation) | (105,050,341 | ) | |||
|
| ||||
Net unrealized appreciation/(depreciation) | $(74,882,639 | ) | |||
|
|
The tax character of dividends paid to shareholders during the year ended December 31, 2022 was as follows:
| Ordinary Income | Net Long-Term Capital Gains | Total Distributions(a) | |||||||||||||
AZL MVP Fusion Moderate Fund | $ | 34,229,656 | $ | 68,869,392 | $ | 103,099,048 | |||||||||
| (a) | Total distributions paid may differ from the Statements of Changes in Net Assets because dividends are recognized when actually paid for tax purposes. |
The tax character of dividends paid to shareholders during the year ended December 31, 2021 was as follows:
| Ordinary Income | Net Long-Term Capital Gains | Total Distributions(a) | |||||||||||||
AZL MVP Fusion Moderate Fund | $ | 38,601,462 | $ | – | $ | 38,601,462 | |||||||||
| (a) | Total distributions paid may differ from the Statements of Changes in Net Assets because dividends are recognized when actually paid for tax purposes. |
At December 31, 2022, the components of accumulated earnings on a tax basis were as follows:
| Undistributed Ordinary Income | Undistributed Long-Term Capital Gains | Accumulated Capital and Other Losses | Unrealized Appreciation/ Depreciation(a) | Total Accumulated Earnings/ (Deficit) | |||||||||||||||||||||
AZL MVP Fusion Moderate Fund | $ | 34,631,139 | $ | 81,695,825 | $ | — | $ | (74,882,639 | ) | $ | 41,444,325 | ||||||||||||||
| (a) | The differences between book-basis and tax-basis unrealized appreciation/(depreciation) is attributable primarily to tax deferral of losses on wash sales, straddles and mark-to-market of futures contracts. |
12
AZL MVP Fusion Moderate Fund
Notes to the Financial Statements
December 31, 2022
9. Ownership and Principal Holders
The beneficial ownership, either directly or indirectly, of more than 25% of the voting securities of a fund creates presumptions of control of the fund, under section 2 (a)(9) of the 1940 Act. As of December 31, 2022, the Fund had an individual shareholder account which is affiliated with the Manager representing ownership in excess of 85% of the Fund. Investment activities of this shareholder could have a material impact to the Fund. As of December 31, 2022, the Fund had a controlling interest (in excess of 50%) in the AZL MetWest Total Return Bond Fund, which is affiliated with the Manager.
10. Subsequent Events
Management of the Fund has evaluated the need for additional disclosures or adjustments resulting from events through the date the financial statements were issued. Based on this evaluation, there were no subsequent events to report that would have material impact on the Fund’s financial statements, except as noted below.
The reorganization, as discussed in Note 1, whereby the AZL MVP DFA Multi-Strategy Fund will acquire all of the assets and liabilities of the Fund, is expected to be completed on or about March 10, 2023.
13
REPORT OF INDEPENDENT REGISTERED PUBLIC ACCOUNTING FIRM
To the Board of Trustees of Allianz Variable Insurance Products Fund of Funds Trust and Shareholders of
AZL MVP Fusion Moderate Fund
Opinion on the Financial Statements
We have audited the accompanying statement of assets and liabilities, including the schedule of portfolio investments, of AZL MVP Fusion Moderate Fund (one of the funds constituting Allianz Variable Insurance Products Fund of Funds Trust, referred to hereafter as the “Fund”) as of December 31, 2022, the related statement of operations for the year ended December 31, 2022, the statements of changes in net assets for each of the two years in the period ended December 31, 2022, including the related notes, and the financial highlights for each of the five years in the period ended December 31, 2022 (collectively referred to as the “financial statements”). In our opinion, the financial statements present fairly, in all material respects, the financial position of the Fund as of December 31, 2022, the results of its operations for the year then ended, the changes in its net assets for each of the two years in the period ended December 31, 2022 and the financial highlights for each of the five years in the period ended December 31, 2022 in conformity with accounting principles generally accepted in the United States of America.
Basis for Opinion
These financial statements are the responsibility of the Fund’s management. Our responsibility is to express an opinion on the Fund’s financial statements based on our audits. We are a public accounting firm registered with the Public Company Accounting Oversight Board (United States) (PCAOB) and are required to be independent with respect to the Fund in accordance with the U.S. federal securities laws and the applicable rules and regulations of the Securities and Exchange Commission and the PCAOB.
We conducted our audits of these financial statements in accordance with the standards of the PCAOB. Those standards require that we plan and perform the audit to obtain reasonable assurance about whether the financial statements are free of material misstatement, whether due to error or fraud.
Our audits included performing procedures to assess the risks of material misstatement of the financial statements, whether due to error or fraud, and performing procedures that respond to those risks. Such procedures included examining, on a test basis, evidence regarding the amounts and disclosures in the financial statements. Our audits also included evaluating the accounting principles used and significant estimates made by management, as well as evaluating the overall presentation of the financial statements. Our procedures included confirmation of securities owned as of December 31, 2022 by correspondence with the transfer agent and brokers; when replies were not received from brokers, we performed other auditing procedures. We believe that our audits provide a reasonable basis for our opinion.
/s/ PricewaterhouseCoopers LLP
New York, New York
February 23, 2023
We have served as the auditor of one or more investment companies in the Allianz Variable Insurance Products complex since 2018.
14
Other Federal Income Tax Information (Unaudited)
For the year ended December 31, 2022, 22.88% of the total ordinary income dividends paid by the Fund qualify for the corporate dividends received deductions available to corporate shareholders.
During the year ended December 31, 2022, the Fund declared net long-term capital gain distributions of $68,869,392.
15
A description of the policies and procedures that the Fund uses to determine how to vote proxies relating to portfolio securities is available, without charge, upon request, by visiting the Securities and Exchange Commission’s (‘‘Commission’’) website at www.sec.gov, or by calling 800-624-0197.
Information regarding how the Fund voted proxies relating to portfolio securities during the most recent 12-month period ended June 30th is available (i) without charge, upon request, by calling 800-624-0197; (ii) on the Trust’s website at https://www.allianzlife.com; and (iii) on the Commission’s website at http://www.sec.gov.
The Fund files complete Schedules of Portfolio Holdings with the Commission for the first and third quarters of each fiscal year on Form N-PORT. Schedules of Portfolio Holdings for the Fund are available without charge on the Commission’s website at http://www.sec.gov, or may be obtained by calling 800-624-0197.
16
Approval of Investment Advisory Agreement (Unaudited)
Subject to the general supervision of the Board of Trustees (the “Board”) and in accordance with the investment objectives and restrictions of each separate series (each a “Fund,” together, the “Funds”) of the Allianz Variable Insurance Products Fund of Funds Trust (the “Trust”), investment advisory services are provided to the Funds by Allianz Investment Management LLC (the “Manager”). The Manager manages each Fund pursuant to an investment management agreement (the “Management Agreement”) with the Trust in respect of each such Fund. The Management Agreement provides that the Manager, subject to the supervision and approval of the Board, is responsible for the management of each Fund. For management services, each Fund pays the Manager an investment advisory fee based upon each Fund’s average daily net assets. The Manager has contractually agreed to limit the expenses of each Fund by reimbursing the Fund if and when total Fund operating expenses exceed certain amounts until at least April 30, 2024 (the “Expense Limitation Agreement”).
In reviewing the services provided by the Manager and the terms of the Management Agreement, the Board receives and reviews information related to the Manager’s experience and expertise in the variable insurance marketplace. In addition, the Board receives information regarding the Manager’s expertise with regard to portfolio diversification and asset allocation requirements within variable insurance products issued by Allianz Life Insurance Company of North America (“Allianz Life”) and its subsidiary, Allianz Life Insurance Company of New York (“Allianz of New York”). Currently, the Funds are offered only through Allianz Life and Allianz of New York variable products, and not in the retail fund market.
As required by the Investment Company Act of 1940 (the “1940 Act”), the Board has reviewed and approved the Management Agreement with the Manager. The Board’s decision to approve this contract reflects the exercise of its business judgment on whether to approve new arrangements and continue the existing arrangements. During its review of the contract, the Board considered many factors, among the most material of which are: the Fund’s investment objectives and long-term performance; the Manager’s management philosophy, personnel, processes and investment performance, including its compliance history and the adequacy of its compliance processes; the preferences and expectations of Fund shareholders (and underlying contract owners) and their relative sophistication; the continuing state of competition in the mutual fund industry; and comparable fees in the mutual fund industry.
The Board also considered the compensation and benefits received by the Manager. This includes fees received for services provided to a Fund by employees of the Manager or of affiliates of the Manager and research services received by the Manager from brokers that execute Fund trades, as well as advisory fees. The Board considered the fact that: (1) the Manager and the Trust are parties to an Administrative Services Agreement and a Compliance Services Agreement, under which the Manager is compensated by the Trust for performing certain administrative and compliance services including providing an employee of the Manager or one of its affiliates to act as the Trust’s Chief Compliance Officer; and (2) Allianz Life Financial Services, LLC, an affiliated person of the Manager, is a registered securities broker-dealer and received (along with its affiliated persons) payments made by the underlying funds pursuant to Rule 12b-1.
The Board is aware that various courts have interpreted provisions of the 1940 Act and have indicated in their decisions that the following factors may be relevant to an adviser’s compensation: the nature, extent and quality of the services provided by the adviser, including the performance of the fund; the adviser’s cost of providing the services; the extent to which the adviser may realize “economies of scale” as the fund grows larger; any indirect benefits that may accrue to the adviser and its affiliates as a result of the adviser’s relationship with the fund; performance and expenses of comparable funds; the profitability of acting as adviser to the fund; and the extent to which the independent Board members, who are not “interested persons” of a fund as defined by the 1940 Act (“Independent Trustees”), are fully informed about all facts bearing on the adviser’s services and fees. The Board is aware of these factors and takes them into account in its review of the Management Agreement for the Funds.
Each member of the Board considered and weighed these factors in light of his or her experience in governing the Trust. The Board is assisted in its deliberations by the advice of independent legal counsel to the Independent Trustees (“Independent Trustee Counsel”). In this regard, the Board requests and receives a significant amount of information about the Funds and the Manager. Some of this information is provided at each regular meeting of the Board; additional information is provided in connection with the particular meetings at which the Board’s formal review of the Management Agreement occurs. In between regularly scheduled meetings, the Board may receive information on particular matters as the need arises. Thus, the Board’s evaluation of the Management Agreement is informed by reports covering such matters as: the Manager’s investment philosophy, personnel and processes, and the Fund’s investment performance (in absolute terms as well as in relationship to its benchmark and certain competitor or “peer group” funds). In connection with comparing the performance of each Fund versus its benchmark, the Board receives reports on the extent to which the Fund’s performance may be attributed to various applicable factors, such as asset class allocation decisions and volatility management strategies, if applicable, the performance of the underlying funds, rebalancing decisions, and the impact of cash positions and Fund fees and expenses. The Board also receives reports on the Funds’ expenses (including the advisory fee itself and the overall expense structure of the Funds, both in absolute terms and relative to peer group and/or competing funds, with due regard for the Expense Limitation Agreement and additional voluntary expense limitations); the use and allocation of any brokerage commissions derived from trading the Funds’ portfolio securities; the nature, extent and quality of the advisory and other services provided to the Fund by the Manager and its affiliates; compliance and audit reports concerning the Funds and the companies that service them; and relevant developments in the mutual fund industry and how the Funds and/or the Manager are responding to them.
The Board also receives financial information about the Manager, including reports on the compensation and benefits the Manager derives from its relationships with the Funds. These reports cover not only the fees under the Management Agreement, but also the fees, if any, received for providing other services to the Funds. The reports also discuss any indirect or “fall-out” benefits the Manager or its affiliates may derive from their relationships with the Funds.
The Management Agreement was most recently considered at Board meetings held in the summer and fall of 2022. Information relevant to the approval of the Management Agreement was considered at Board meetings held June 14 and 21, 2022, and September 13, 2022, as well as at various other meetings preceding those meetings. Accordingly, the Management Agreement was approved by the Board at an in-person meeting on September 13, 2022. At such meeting the Board also approved the Expense Limitation Agreement between the Manager and the Trust for the period ending April 30, 2024.
In connection with such meetings, the Board requested and evaluated extensive materials from the Manager, including performance and expense information for other investment companies with similar investment objectives derived from data compiled by an independent third-party provider and other sources believed to be reliable by the Manager and the Trustees. Prior to voting, the Trustees reviewed the proposed approval of the Management Agreement with management and with Independent Trustee Counsel and received a memorandum from such counsel discussing the legal standards for their consideration of the proposed approval. The Independent Trustees also discussed the proposed approval in private sessions with Independent Trustee Counsel at which no representatives of the Manager were present. In reaching their determinations relating to the approval of the Management Agreement, in respect of each Fund, each member of the Board considered all factors he or she believed relevant. The Board based its decision to approve
17
the Management Agreement on the totality of the circumstances and relevant factors, and with a view to past and future long-term considerations. Not all of the factors and considerations discussed above and below are necessarily relevant to every Fund, and the Board did not assign relative weights to factors discussed herein or deem any one or group of them to be controlling in and of themselves.
Shareholder reports must include a discussion of certain factors relating to the selection of the investment adviser and the approval of the advisory fee. The “factors” enumerated by the SEC are set forth below in italics, as well as the Board’s conclusions regarding such factors:
(1) The nature, extent and quality of services provided by the Manager. The Trustees noted that the Manager, subject to the oversight of the Board, administers each Fund’s business and other affairs. The Trustees noted that the Manager also provides the Trust and each Fund with such administrative and other services (exclusive of, and in addition to, any such services provided by any other service providers retained by the Trust on behalf of the Funds) and executive and other personnel as are necessary for the operation of the Trust and the Funds. Except for the Trust’s Chief Compliance Officer and certain compliance staff, the Manager pays all of the compensation of Trustees and officers of the Trust who are employees of the Manager or its affiliates.
The Board considered the scope and quality of services provided by the Manager and noted that the scope of the services provided has continued to expand as a result of regulatory and other developments. The Board noted, for example, that the Manager is responsible for maintaining and monitoring its own compliance program, and this compliance program has been continuously refined and enhanced in light of new regulatory requirements. The Board considered the capabilities and resources which the Manager has dedicated to performing services on behalf of the Trust and its Funds. The quality of administrative and other services, including the Manager’s role in coordinating the activities of the Trust’s other service providers, also were considered. The Board concluded that, overall, they were satisfied with the nature, extent and quality of services provided (and expected to be provided) to the Trust and to each of the Funds under the Management Agreement.
(2) The investment performance of the Funds and the Manager. In connection with every quarterly Board meeting and the summer and fall 2022 contract review process, Trustees received extensive information on the performance results of each Fund. This included, for example, performance information on absolute total return, performance versus the appropriate benchmark(s) and performance versus peer groups as reported by Lipper, the contribution to performance of the Manager’s asset class allocation decisions and volatility management strategies, if applicable, the performance of the underlying funds, and the impact on performance of rebalancing decisions, cash and Fund fees. This included Lipper performance information on the Funds for the previous quarter, and previous one-, three- and five-year periods, to the extent available. For example, in connection with the Board meetings held June 14 and 21, 2022, and September 13, 2022, the Manager reported that, for the five-year period ended December 31, 2021, two Funds were in the top 40%, three were in the middle 20%, and seven were in the bottom 40% of their respective Lipper peer groups. The Manager reported that for the three-year period ended December 31, 2021, three Funds were in the top 40%, two were in the middle 20%, and seven were in the bottom 40% of their respective Lipper peer groups. For the one-year period ended December 31, 2021, six Funds were in the top 40%, two were in the middle 20%, and four were in the bottom 40% of their respective Lipper peer groups.
The Manager also reported on the performance of the MVP Funds compared to custom managed-volatility peer groups. For the five-year period ended December 31, 2021, four Funds were in the top 40%, two were in the middle 20%, and four were in the bottom 20%. For the three-year period ended December 31, 2021, four Funds were in the top 40%, two were in the middle 20%, and four were in the bottom 40% of their respective custom managed-volatility peer groups. For the one-year period ended December 31, 2021, seven Funds were in the top 40%, two were in the middle 20%, and one was in the bottom 40% of their respective custom managed-volatility peer groups. The Board members discussed with the Manager and considered the impact of the volatility management strategies on performance in different market environments, where applicable, and considered whether they were operating as intended. The Board noted, in particular, the impact of certain characteristics of the Funds’ volatility management strategies in relation to volatility experienced as a result of the COVID-19 pandemic, and that relative performance had improved as the markets stabilized.
At the Board meeting held September 13, 2022, the Board also received updated performance information for the Funds, including updated Lipper peer group ranking information, for various periods ending June 30, 2022.
At the Board meeting held September 13, 2022, the Trustees determined that the investment performance of the Funds was acceptable.
(3) The costs of services to be provided and profits to be realized by the Manager and its affiliates from the relationship with the Funds. The Board considered that the Manager receives an advisory fee from each of the Funds. The Manager reported that for the three MVP Fusion Funds the advisory fee paid put these Funds in the 13th percentile of the customized peer group. The Manager reported that for the four MVP Index Strategy Funds the advisory fee paid put them in the 23rd percentile of the customized peer group, and for the AZL Balanced Index Strategy Fund the advisory fee paid put it in the 7th percentile of the customized peer group. The Manager reported that for the AZL DFA Multi-Strategy Fund, the advisory fee paid was in the 5th percentile. The Manager reported that for the AZL MVP DFA Multi-Strategy, AZL MVP FIAM Multi-Strategy, and AZL MVP T. Rowe Price Capital Appreciation Plus Funds, the advisory fee paid was in the 1st percentile. (A lower percentile reflects lower fund fees and is better for fund shareholders.) Trustees were provided with information on the total expense ratios of the Funds and other funds in the customized peer groups, and the Manager reported upon the challenges in making peer group comparisons for the Funds. The Board further considered and found that the advisory fee paid to the Manager with respect to each Fund was based on services provided to the Fund that were in addition to, rather than duplicative of, the services provided pursuant to the advisory agreements for the underlying funds in which the Fund invests.
The Manager provided information concerning the profitability of the Manager’s investment advisory activities for the period from 2019 through 2021. The Board recognized that it is difficult to make comparisons of profitability from investment company advisory agreements because comparative information is not generally publicly available and is affected by numerous factors, including the structure of the particular adviser, the types of funds it manages, its business mix, numerous assumptions regarding allocation of expenses and the adviser’s capital structure and cost of capital. In considering profitability information, the Board considered the possible effect of certain fall-out benefits to the Manager and its affiliates. The Board focused on profitability of the Manager’s relationships with the Funds before taxes and distribution expenses. The Board recognized that the Manager should earn a reasonable level of profits for the services it provides to each Fund.
The Board also considered that Wilshire Funds Management (“Wilshire”) serves as a consultant to the Manager in preparing statistical and other factual information for use in the creation and maintenance of the asset allocation models for the AZL MVP Fusion Funds, pursuant to an agreement between the Manager and Wilshire. Wilshire serves as a consultant to the Manager with respect to selecting the AZL MVP Fusion Funds’ underlying funds and the asset allocations among the underlying funds. The Manager, not any Fund, pays a consultant fee to Wilshire.
(4) and (5) The extent to which economies of scale would be realized as the Funds grow, and whether fee levels reflect these economies of scale. The Board noted that the advisory fee schedules for the Funds do not contain breakpoints that reduce the fee rate on assets above specified levels. The Board recognized that breakpoints may be an appropriate way for the Manager to share its economies of scale, if any, with Funds that have substantial assets. The Board found there was no uniform methodology for establishing breakpoints
18
that give effect to Fund-specific services provided by the Manager. The Board noted that in the fund industry as a whole, as well as among funds similar to the Funds, there is no uniformity or pattern in the fees and asset levels at which breakpoints (if any) apply. Depending on the age, size, and other characteristics of a particular fund and its manager’s cost structure, different conclusions can be drawn as to whether there are economies of scale to be realized at any particular level of assets, notwithstanding the intuitive conclusion that such economies exist, or will be realized at some level of total assets. Moreover, because different managers have different cost structures and service models, it is difficult to draw meaningful conclusions from the breakpoints that may have been adopted by other funds. The Board also noted that the advisory agreements for many funds do not have breakpoints at all, or if breakpoints exist, they may be at asset levels significantly greater than those of the individual Funds. The Board noted that the total assets in all of the Funds, as of June 30, 2022, were approximately $8.2 billion and that the largest Fund, the AZL MVP Growth Index Strategy Fund, had assets of approximately $2.1 billion.
The Board noted that the Manager has agreed to temporarily limit Fund expenses under the Expense Limitation Agreement, which has the effect of reducing expenses similar to implementation of advisory fee breakpoints. The Manager has committed to continue to consider the continuation of expense limits and/or advisory fee breakpoints as Fund assets change. The Board receives quarterly reports on the level of Fund assets. The Board expects to continue to consider: (a) the extent to which economies of scale have been realized, and (b) whether the advisory fee should be modified, either in connection with the next renewal of the Management Agreement or by modifying the Expense Limitation Agreement, to reflect such economies of scale, if any.
Having taken these factors into account, the Board concluded that the absence of breakpoints in the Funds’ advisory fee rate schedules was acceptable under each Fund’s circumstances.
In conclusion, after full consideration of the above factors, as well as such other factors as each member of the Board considered instructive in evaluating the Management Agreement, the Board concluded that the advisory fees were reasonable, and that the continuation of the Management Agreement was in the best interest of the Funds.
19
Information about the Board of Trustees and Officers (Unaudited)
The Trust is managed by the Trustees in accordance with the laws of the state of Delaware governing business trusts. In addition to serving on the Board of Trustees of the Trust, each Trustee serves on the Board of the Allianz Variable Insurance Products Trust (“VIP Trust”) and the AIM ETF Products Trust (“ETF Trust”) (collectively, the Trust, the VIP Trust, and ETF Trust are the “AIM Complex”). There are currently seven Trustees, one of whom is an “interested person” of the Trust within the meaning of that term under the 1940 Act. The Trustees and Officers of the Trust, and their addresses, years of birth, their positions held with the Trust, their terms of office with the Trust and length of time served, their principal occupation(s) during the past five years, the number of portfolios in the Trust they oversee, and their other directorships held during the past five years are as follows:
Independent Trustees(1)
| Name, Address, and Birth Year | Positions Held with AIM Complex | Term of Office(2)/Length of Time Served | Principal Occupation(s) During Past 5 Years | Number of Portfolios Overseen for the AIM Complex | Other 5 Years | |||||
Peggy L. Ettestad (1957) 5701 Golden Hills Drive Minneapolis, MN 55416 | Lead Independent Trustee | Since 10/14 (Trustee since 2/07) | Managing Director, Red Canoe Management Consulting LLC, 2008 to present | 50 | None | |||||
Tamara Lynn Fagely (1958) 5701 Golden Hills Drive Minneapolis, MN 55416 | Trustee | Since 12/17 | Retired; previously, Chief Operations Officer, Hartford Funds, 2012 to 2013 | 50 | Diamond Hill Funds (10 Funds) | |||||
Richard H. Forde (1953) 5701 Golden Hills Drive Minneapolis, MN 55416 | Trustee | Since 12/17 | Retired; previously, Member of the Board and Chairman of the Finance and Investment Committee, Connecticut Water Service, Inc., 2013 to 2019 | 50 | Connecticut Water Service, Inc. | |||||
Jack Gee (1959) 5701 Golden Hills Drive Minneapolis, MN 55416 | Trustee | Since 1/22 (Consultant to the Independent Trustees since 2/20)(3) | Retired; previously, Managing Director, BlackRock, Inc., Treasurer and Chief Financial Officer U.S. iShares, 2004 to 2019 | 50 | Engine No. 1 ETF Trust (2 Funds); Esoterica Thematic Trust (2019 - 2020) | |||||
Claire R. Leonardi (1955) 5701 Golden Hills Drive Minneapolis, MN 55416 | Trustee | Since 2/04 | Retired; previously, CEO, Health eSense Inc. (a medical device company), 2015 to 2018, and Connecticut Innovations, Inc. (a venture capital firm), 2012 to 2015 | 50 | None | |||||
Dickson W. Lewis (1948) 5701 Golden Hills Drive Minneapolis, MN 55416 | Trustee | Since 2/04 | Retired; previously, senior executive for Lifetouch National School Studios (a photography company), 2006 to 2014, Jostens (a producer of year books and class rings), 2001 to 2006, and Fortis Financial Group, 1997 to 2001 | 50 | None | |||||
20
Interested Trustee(4)
| Name, Address, and Birth Year | Positions Held with AIM Complex | Term of Office(2)/Length of Time Served | Principal Occupation(s) During Past 5 Years | Number of for the AIM | Other 5 Years | |||||
Brian Muench (1970) 5701 Golden Hills Drive Minneapolis, MN 55416 | Trustee | Since 6/11 | President, Allianz Investment Management LLC, 2010 to present; Vice President, Allianz Life, 2011 to present | 50 | None | |||||
| (1) | Each of the Independent Trustees is a member of the Audit Committee. |
| (2) | Indefinite. |
| (3) | Prior to January 1, 2022, Mr. Gee served as a consultant to the Independent Trustees since February 2020, during which he attended meetings of the Board and its standing committees, including the audit committee, solely in his capacity as a consultant, and was not entitled to vote. |
| (4) | Is an “interested person,” as defined by the 1940 Act, due to employment by Allianz Life and the Manager. |
Officers
| Name, Address, and Birth Year | Positions Held with AIM Complex | Term of Length of Time Served | Principal Occupation(s) During Past 5 Years | |||
Brian Muench (1970) 5701 Golden Hills Drive Minneapolis, MN 55416 | President | Since 11/10 | President, Allianz Investment Management LLC, November 2010 to present; Vice President, Allianz Life, 2011 to present. | |||
Erik Nelson (1972) 5701 Golden Hills Drive Minneapolis, MN 55416 | Secretary | Since 12/20 | Chief Legal Officer, Allianz Investment Management LLC; Associate General Counsel, Senior Counsel, Allianz Life, 2008 to present. | |||
Bashir C. Asad (1963) Citi Fund Services Ohio, Inc. 4400 Easton Commons, Suite 200 Columbus, OH 43219 | Treasurer, Principal Accounting Officer and Principal Financial Officer | Since 06/16 | Senior Vice President, Citi Fund Services Ohio, Inc., 2011 to present. | |||
Chris R. Pheiffer (1968) 5701 Golden Hills Drive Minneapolis, MN 55416 | Chief Compliance Officer(2) and Anti-Money Laundering Compliance Officer | Since 02/14 | Chief Compliance Officer of the Trust and the VIP Trust, 2014 to present, and the ETF Trust, 2020 to present. | |||
Michael Tanski (1970) 5701 Golden Hills Drive Minneapolis, MN 55416 | Vice President | Since 04/09 | Assistant Vice President, Allianz Investment Management LLC, 2013 to present. | |||
| (1) | Indefinite. |
| (2) | The Manager and the Trust are parties to a Compliance Services Agreement under which the Manager provides an employee of the Manager or one of its affiliates to act as the Trust’s Chief Compliance Officer. |
The Fund’s Statement of Additional Information (“SAI”) contains additional information about the Trust’s Trustees and Officers. The SAI is available without charge, upon request, by calling toll-free 800-624-0197 or at https://www.allianzlife.com.
21

| The Allianz VIP Fund of Funds are distributed by Allianz Life Financial Services, LLC. | ||
| These Funds are not FDIC Insured. | ANNRPT1222 02/23 |
AZL® MVP Global Balanced Index Strategy Fund
Annual Report
December 31, 2022

This report is submitted for the general information of the shareholder of the Fund. The report is not authorized for distribution to prospective investors in the Fund unless preceded or accompanied by an effective prospectus, which contains details concerning the sales charges and other pertinent information.
Allianz Investment Management LLC serves as the Manager for the AZL® MVP Global Balanced Index Strategy Fund.
What factors affected the Fund’s performance during the year ended December 31, 2022?*
For the year ended December 31, 2022, the AZL MVP Global Balanced Index Strategy Fund (the “Fund”) returned (16.09)%. That compared to (17.73)%, (19.74)%, (13.01)% and (15.27)% total return for its benchmarks, the MSCI World Index, the MSCI Emerging Markets Index, the Bloomberg U.S. Aggregate Bond Index, and the Global Balanced Composite Index, respectively.1
The Fund is a fund of funds that pursues broad global diversification. The two equity sub-portfolios pursue passive strategies that aim to achieve, before fees, returns similar to the MSCI World Index, which represents shares of large- and mid-cap companies in developed market countries, and the MSCI Emerging Markets Index, which represents shares of large- and mid-cap companies in foreign emerging markets countries. The fixed-income sub-portfolio is an enhanced bond index strategy that seeks to achieve a return that exceeds that of the Bloomberg U.S. Aggregate Bond Index.
Generally, the Fund allocates 40% to 60% of its assets to the underlying equity index funds and between 40% and 60% to the underlying fixed income fund. The Fund also employs the MVP (Managed Volatility Portfolio) risk management process, which is intended to adjust the risk of the portfolio based on quantitative indicators of market risk, such as the current level of fund and market volatility.
Domestic equities began the year at near all-time highs, but began to decline early in 2022 due to a combination of rising inflation and geopolitical uncertainties. The Federal Reserve (the Fed) shifted to a more hawkish policy approach in an attempt to bring inflation under control, as did many global central banks. The Fed increased the federal funds rate multiple times throughout the year for a combined total of 425 basis points. Russia’s invasion of Ukraine also weighed on global markets, although European countries were particularly hard hit due to their geographic proximity to the conflict and reliance on Russian commodities such as energy and wheat.
Despite strong labor rates throughout developed markets, high inflation and an anticipated economic slowdown had a negative effect on investor sentiment for the year under review. The S&P 500 declined as company valuations struggled under the higher interest rate environment. Investors grew risk averse as fears
of an economic recession loomed, selling off equity positions to avoid the volatility in equity markets. By the end of the period under review, U.S. equities had experienced their worst year since the Great Financial Crisis of 2008, and international equities performed only slightly better.
The Fed’s actions made short-term financing more expensive, and the U.S. Treasury yield curve ultimately inverted with 2-year Treasuries yielding more than 10-year Treasuries by 0.55% at the end of 2022. The monetary tightening generated headwinds for domestic fixed income markets as investors demanded higher yields to account for rising rates. Widening credit spreads further weighed on prices on lower-quality bonds as investors demanded to be compensated for rising credit risks. Nearly all fixed income sectors finished the year with negative performance.
The Fund, which invests in both U.S. and international markets, underperformed its composite benchmark in 2022. Both the equity and fixed income allocations underperformed their respective blended benchmarks primarily due to the underlying funds’ fees. However, the Fund’s fixed income allocation benefited from security selection, particularly in mortgage-backed securities.
The MVP risk management process utilizes derivatives in an effort to control portfolio volatility in unstable market conditions. Market volatility was relatively high during 2022, therefore the MVP process was engaged and reduced the Fund’s equity exposure at multiple points during the year. The MVP process did slightly detract from the Fund’s performance during 2022.
Past performance does not guarantee future results.
| * | The Fund’s portfolio composition is subject to change. There is no guarantee that any sectors mentioned will continue to perform as described or that securities in such sectors will be held by the Fund in the future. The information contained in this commentary is for informational purposes only and should not be construed as a recommendation to purchase or sell securities in the sector mentioned. The Fund’s holdings and weightings are as of December 31, 2022. |
| 1 | For a complete description of the Fund’s performance benchmarks please refer to page 2 of this report. |
1
AZL® MVP Global Balanced Index Strategy Fund Review (Unaudited) |
Fund Objective
The Fund seeks long-term capital appreciation with preservation of capital. This objective may be changed by the Trustees of the Fund without shareholder approval. The Fund seeks to achieve its objective by investing primarily in a combination of Underlying Funds, which are managed by the manager, combined with the MVP risk management process.
Investment Concerns
The Fund invests in underlying funds, so its investment performance is directly related to the performance of those underlying funds. Before investing, investors should assess the risks associated with and types of investments made by each of the underlying funds in which the Fund invests.
Quantitative investing involves risk that the values of securities selected in the quantitative analysis can react differently than the market or securities selected using fundamental analysis.
Stocks are more volatile and carry more risk and return potential than other forms of investments.
Emerging market investing may be subject to additional economic, political, liquidity, and currency risks not associated with more developed countries.
International investing may involve risk of capital loss from unfavorable fluctuations in currency values, from differences in generally accepted accounting principles or from economic or political instability in other nations.
Small- to mid-capitalization companies typically have a higher risk of failure and historically have experienced a greater degree of volatility.
The performance of the underlying funds is expected to be lower than that of the Indexes because of fees and expenses. Securities in which the underlying funds will invest may involve substantial risk and may be subject to sudden severe price declines.
Investing in a single industry or sector, or concentrating investments in a limited number of industries or sectors, tends to increase the risk that economic, political, or regulatory developments affecting certain industries or sectors will have a large impact on the value of the portfolio.
Mortgage-backed investments involve risk of loss due to prepayments and, like any bond, due to default. Because of the sensitivity of mortgage-related securities to changes in interest rates, an underlying fund’s performance may be more volatile than if it did not hold these securities.
Investing in derivative instruments involves risks that may be different from or greater than the risk associated with investing directly in securities or other traditional instruments.
Debt securities held by an underlying fund may decline in value due to rising interest rates.
For a complete description of these and other risks associated with investing in the Fund, please refer to the Fund’s prospectus.
Growth of $10,000 Investment
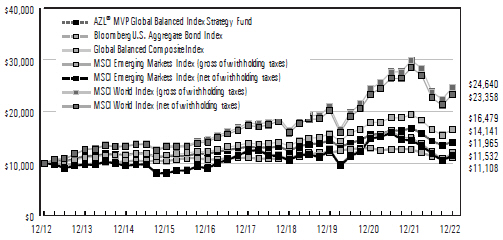
The chart above represents a comparison of a hypothetical investment in the Fund versus a similar investment in the Fund’s benchmarks and represents the reinvestment of dividends and capital gains in the Fund.
| Average Annual Total Returns as of December 31, 2022 | ||||||||||||||||||||
| 1 Year | 3 Years | 5 Years | 10 Years | |||||||||||||||||
AZL® MVP Global Balanced Index Strategy Fund | (16.09 | )% | (0.76 | )% | 1.36 | % | 3.53 | % | ||||||||||||
Bloomberg U.S. Aggregate Bond Index | (13.01 | )% | (2.71 | )% | 0.02 | % | 1.06 | % | ||||||||||||
Global Balanced Composite Index | (15.27 | )% | 1.56 | % | 3.43 | % | 5.12 | % | ||||||||||||
MSCI Emerging Markets Index (gross of withholding taxes) | (19.74 | )% | (2.34 | )% | (1.03 | )% | 1.81 | % | ||||||||||||
MSCI Emerging Markets Index (net of withholding taxes) | (20.09 | )% | (2.69 | )% | (1.40 | )% | 1.44 | % | ||||||||||||
MSCI World Index (gross of withholding taxes) | (17.73 | )% | 5.45 | % | 6.69 | % | 9.44 | % | ||||||||||||
MSCI World Index (net of withholding taxes) | (18.14 | )% | 4.94 | % | 6.14 | % | 8.85 | % | ||||||||||||
Past performance does not guarantee future results. The performance data quoted represents past performance and current returns may be lower or higher. The investment return and principal value will fluctuate so that an investor’s shares, when redeemed, may be worth more or less than the original cost. To obtain performance information current to the most recent month end, please visit www.Allianzlife.com.
| Expense Ratio | Gross | ||||
AZL® MVP Global Balanced Index Strategy Fund | 0.79 | % | |||
The above expense ratio is based on the current Fund prospectus dated April 29, 2022. The Manager and the Fund have entered into a written contract limiting operating expenses, excluding certain expenses (such as interest expense and acquired fund fees and expenses), to 0.15% through April 30, 2024. Additional information pertaining to the December 31, 2022 expense ratio can be found in the Financial Highlights.
Acquired fund fees and expenses are incurred indirectly by the Fund through the valuation of the Fund’s investments in the permitted Underlying Funds. Accordingly, acquired fund fees and expenses affect the Fund’s total returns. Because these fees and expenses are not included in the Fund’s financial highlights, the Fund’s total annual fund operating expenses, as shown in the current prospectus, do not correlate to the ratios of expenses to average net assets shown in the Financial Highlights. Without acquired fund fees and expenses the Fund’s gross expense ratio would be 0.13%.
The total return of the Fund does not reflect the effect of any insurance charges, the annual maintenance fee or the deduction of taxes that a shareholder would pay on Fund distributions or the redemption of Fund shares. Such charges, fees and tax payments would reduce the performance quoted.
The Fund’s performance measured against the Morgan Stanley Capital International, Europe World Index (“MSCI World Index”), the Morgan Stanley Capital International, Europe Emerging Markets (“MSCI EM Index”), the Bloomberg U.S. Aggregate Bond Index, and the Global Balanced Composite Index (“Composite“). The MSCI World Index is a broad global equity benchmark that represents large- and mid-cap equity performance across 23 developed markets countries. The MSCI EM Index captures the large- and mid-cap representation across 24 emerging markets countries: Brazil, Chile, China, Colombia, Czech Republic, Egypt, Greece, Hungary, India, Indonesia, Korea, Malaysia, Mexico, Pakistan, Peru, Philippines, Poland, Qatar, Russia, South Africa, Taiwan, Thailand, Turkey, and United Arab Emirates. The Bloomberg U.S. Aggregate Bond Index is a market value-weighted performance benchmark for investment-grade fixed-rate debt issues, including government, corporate, asset-backed, and mortgage-backed securities, with maturities of at least one year. The Composite is a blended index comprised of (45%) MSCI World Index; (5%) MSCI EM Index; and (50%) Bloomberg U.S. Aggregate Bond Index. The Indexes are unmanaged and do not reflect the deduction of fees associated with a mutual fund, such as Investment management and fund accounting fees. The Index noted as “gross of withholding taxes” reflects the maximum possible reinvestment of dividends with no adjustment for withholding tax deductions or tax credits. The Index noted as “net of withholding taxes” reflects the reinvestment of dividends after the deduction of withholding taxes, using (for international indexes) a tax rate applicable to non-resident institutional investors who do not benefit from double taxation treaties. Investors cannot invest directly in an index.
2
AZL MVP Global Balanced Index Strategy Fund
(Unaudited)
As a shareholder of the AZL MVP Global Balanced Index Strategy Fund (the “Fund”), you incur ongoing costs, including management fees, distribution fees, and other Fund expenses. These examples are intended to help you understand your ongoing costs (in dollars) of investing in the Fund and to compare these costs with the ongoing costs of investing in other mutual funds. Please note that the expenses shown in each table do not reflect expenses that apply to the subaccount or the insurance contract. If the expenses that apply to the subaccount or the insurance contract were included, your costs would have been higher.
These examples are based on an investment of $1,000 invested at the beginning of the period and held for the periods presented below.
The Actual Expense table below provides information about actual account values and actual expenses. You may use the information below, together with the amount you invested, to estimate the expenses that you paid over the period. Simply divide your account value by $1,000 (for example, an $8,600 account value divided by $1,000 = 8.6), then multiply the result by the number in the table under the heading entitled “Expenses Paid During Period” to estimate the expenses you paid on your account during this period.
| Beginning Account Value 7/1/22 | Ending Account Value 12/31/22 | Expenses Paid During Period 7/1/22 - 12/31/22* | Annualized Expense Ratio During Period 7/1/22 - 12/31/22 | |||||||||||||||||
AZL MVP Global Balanced Index Strategy Fund | $ | 1,000.00 | $ | 986.50 | $ | 0.70 | 0.14 | % | ||||||||||||
The Hypothetical Expense table below provides information about hypothetical account values and hypothetical expenses based on the Fund’s actual expense ratio and an assumed rate of return of 5% per year before expenses, which is not the Fund’s actual return. The hypothetical account values and expenses may not be used to estimate the actual ending account balance or expenses you paid for the period. You may use this information to compare this 5% hypothetical example with the 5% hypothetical examples that appear in the shareholder reports of other funds.
| Beginning Account Value 7/1/22 | Ending Account Value 12/31/22 | Expenses Paid During Period 7/1/22 - 12/31/22* | Annualized Expense Ratio During Period 7/1/22 - 12/31/22 | |||||||||||||||||
AZL MVP Global Balanced Index Strategy Fund | $ | 1,000.00 | $ | 1,024.50 | $ | 0.71 | 0.14 | % | ||||||||||||
| * | Expenses are equal to the average account value multiplied by the Fund’s annualized expense ratio multiplied by 184/365 (the number of days in the most recent fiscal half-year divided by the number of days in the fiscal year). |
Portfolio Composition
(Unaudited)
| Investments | Percent of Net Assets | |
Fixed Income Fund | 47.7% | |
International Equity Funds | 47.7% | |
Private Placements | 0.1 | |
Common Stocks | —† | |
Corporate Bonds | —† | |
Convertible Bond | —† | |
| ||
Total Investment Securities | 95.5 | |
Net other assets (liabilities) | 4.5 | |
| ||
Net Assets | 100.0% | |
| ||
| † | Represents less than 0.05%. |
Portfolio Composition
(Unaudited)
| Investments | Percent of Net Assets | |
United States | 95.5% | |
Australia | — † | |
India | — † | |
| ||
Total Investment Securities | 95.5 | |
Net other assets (liabilities) | 4.5 | |
| ||
Net Assets | 100.0% | |
| ||
3
AZL MVP Global Balanced Index Strategy Fund
Schedule of Portfolio Investments
December 31, 2022
| Shares | Value | |||||||||
Common Stocks (0.0%†): |
| |||||||||
Materials (0.0%†): |
| |||||||||
| 145,123 | Grand Rounds, Inc., Series C(a)(b) | $ | 163,989 | |||||||
|
| |||||||||
| Paper & Forest Products (0.0%†): | ||||||||||
| 386,370 | Quintis Pty, Ltd.(a)(b) | 3 | ||||||||
|
| |||||||||
Total Common Stocks (Cost $653,277) | 163,992 | |||||||||
|
| |||||||||
Private Placements (0.1%): |
| |||||||||
| Household Durables (0.0%†): | ||||||||||
| 23,389 | Jawbone, 0.00%(a)(b) | — | ||||||||
|
| |||||||||
| Internet Software & Services (0.1%): | ||||||||||
| 5,547 | Lookout, Inc., 0.00%(a)(b) | 20,246 | ||||||||
| 63,925 | Lookout, Inc. Preferred Shares, Series F, 0.00%(a)(b) | 352,227 | ||||||||
|
| |||||||||
| 372,473 | ||||||||||
|
| |||||||||
Total Private Placements (Cost $485,378) | 372,473 | |||||||||
|
| |||||||||
| Principal Amount | ||||||||||
Convertible Bond (0.0%†): | ||||||||||
Food Products (0.0%†): | ||||||||||
| $400,000 | REI Agro, Ltd., Registered Shares, 5.50%, 12/8/19(a)(b)(c) | — | ||||||||
|
| |||||||||
Total Convertible Bond (Cost $—) | — | |||||||||
|
| |||||||||
| † | Represents less than 0.05%. |
| (a) | Security was valued using significant unobservable inputs as of December 31, 2022. |
| (b) | Rule 144A, Section 4(2) or other security which is restricted to resale to institutional investors. |
| (c) | Defaulted bond. |
| (d) | See Federal Tax Information listed in the Notes to the Financial Statements. |
Percentages indicated are based on net assets as of December 31, 2022
Futures Contracts
At December 31, 2022, the Fund’s open futures contracts were as follows:
Long Futures
| Principal Amount | Value | |||||||
Corporate Bonds (0.0%†): |
| |||||||
Paper & Forest Products (0.0%†): |
| |||||||
| $52,331 | Quintis Pty, Ltd., 7.50%, 10/1/26, Callable 2/6/23 @ 103.38(a)(b) | $ | 52,331 | |||||
| 730,672 | Quintis Pty, Ltd., 0.00%, 10/1/28, Callable 3/20/23 @ 98(a)(b) | 102,075 | ||||||
|
| |||||||
Total Corporate Bonds (Cost $783,003) | 154,406 | |||||||
|
| |||||||
| Shares | ||||||||
Affiliated Investment Companies (95.4%): |
| |||||||
Fixed Income Fund (47.7%): |
| |||||||
| 26,045,107 | AZL Enhanced Bond Index Fund | 246,907,613 | ||||||
|
| |||||||
International Equity Funds (47.7%): |
| |||||||
| 4,298,988 | AZL MSCI Emerging Markets Equity Index Fund, Class 2 | 25,965,885 | ||||||
| 17,652,354 | AZL MSCI Global Equity Index Fund | 220,830,950 | ||||||
|
| |||||||
| 246,796,835 | ||||||||
|
| |||||||
Total Affiliated Investment Companies (Cost $513,502,319) | 493,704,448 | |||||||
|
| |||||||
Total Investment Securities (Cost $515,423,977) — 95.5%(d) | 494,395,319 | |||||||
Net other assets (liabilities) — 4.5% | 23,483,592 | |||||||
|
| |||||||
Net Assets — 100.0% | $ | 517,878,911 | ||||||
|
| |||||||
| Description | Expiration Date | Number of Contracts | Notional Amount | Value and Unrealized Appreciation/ (Depreciation) | ||||||||||||
S&P 500 Index E-Mini March Futures (U.S. Dollar) | 3/17/23 | 61 | $ | 11,776,050 | $ | 820 | ||||||||||
U.S. Treasury 10-year Note March Futures (U.S. Dollar) | 3/22/23 | 104 | 11,678,875 | (114,741) | ||||||||||||
|
| |||||||||||||||
| $ | (113,921) | |||||||||||||||
|
| |||||||||||||||
See accompanying notes to the financial statements.
4
AZL MVP Global Balanced Index Strategy Fund
Statement of Assets and Liabilities
December 31, 2022
Assets: | |||||
Investments in non-affiliates, at cost | $ | 1,921,658 | |||
Investments in affiliates, at cost | 513,502,319 | ||||
|
| ||||
Investments in non-affiliates, at value | $ | 690,871 | |||
Investments in affiliates, at value | 493,704,448 | ||||
Deposit at broker for futures contracts collateral | 23,487,333 | ||||
Interest and dividends receivable | 66,338 | ||||
Receivable for investments sold | 223,310 | ||||
Receivable for variation margin on futures contracts | 710 | ||||
Reclaims receivable | 55,953 | ||||
Prepaid expenses | 4,780 | ||||
|
| ||||
Total Assets | 518,233,743 | ||||
|
| ||||
Liabilities: | |||||
Cash overdraft | 223,308 | ||||
Payable for capital shares redeemed | 51,486 | ||||
Management fees payable | 44,554 | ||||
Administration fees payable | 9,560 | ||||
Custodian fees payable | 1,390 | ||||
Administrative and compliance services fees payable | 1,499 | ||||
Transfer agent fees payable | 808 | ||||
Trustee fees payable | 3,745 | ||||
Other accrued liabilities | 18,482 | ||||
|
| ||||
Total Liabilities | 354,832 | ||||
|
| ||||
Net Assets | $ | 517,878,911 | |||
|
| ||||
Net Assets Consist of: | |||||
Paid in capital | $ | 564,538,779 | |||
Total distributable earnings | (46,659,868 | ) | |||
|
| ||||
Net Assets | $ | 517,878,911 | |||
|
| ||||
Shares of beneficial interest (unlimited number of shares authorized, no par value) | 54,850,645 | ||||
Net Asset Value (offering and redemption price per share) | $ | 9.44 | |||
|
| ||||
For the Year Ended December 31, 2022
Investment Income: | |||||
Dividends from affiliates | $ | 7,168,214 | |||
Interest | 380,359 | ||||
Dividends from non-affiliates | 40 | ||||
Foreign withholding tax | (14,596) | ||||
|
| ||||
Total Investment Income | 7,534,017 | ||||
|
| ||||
Expenses: | |||||
Management fees | 575,974 | ||||
Administration fees | 67,420 | ||||
Custodian fees | 13,064 | ||||
Administrative and compliance services fees | 8,046 | ||||
Transfer agent fees | 5,659 | ||||
Trustee fees | 32,161 | ||||
Professional fees | 27,101 | ||||
Shareholder reports | 23,359 | ||||
Other expenses | 8,912 | ||||
|
| ||||
Total expenses | 761,696 | ||||
|
| ||||
Net Investment Income/(Loss) | 6,772,321 | ||||
|
| ||||
Net realized and Change in net unrealized gains/losses on investments: | |||||
Net realized gains/(losses) on securities and foreign currencies | 35,596 | ||||
Net realized gains/(losses) on affiliated underlying funds | (3,218,421) | ||||
Net realized gains distributions from affiliated underlying funds | 17,849,868 | ||||
Net realized gains/(losses) on futures contracts | (4,012,564) | ||||
Change in net unrealized appreciation/depreciation on securities and foreign currencies | (1,308,478) | ||||
Change in net unrealized appreciation/depreciation on affiliated underlying funds | (123,701,538) | ||||
Change in net unrealized appreciation/depreciation on futures contracts | (544,268) | ||||
|
| ||||
Net realized and Change in net unrealized gains/losses on investments | (114,899,805) | ||||
|
| ||||
Change in Net Assets Resulting From Operations | $ | (108,127,484) | |||
|
|
See accompanying notes to the financial statements.
5
AZL MVP Global Balanced Index Strategy Fund
Statements of Changes in Net Assets
For the Year Ended | For the Year Ended | |||||||||
Change In Net Assets: | ||||||||||
Operations: | ||||||||||
Net investment income/(loss) | $ | 6,772,321 | $ | 4,331,659 | ||||||
Net realized gains/(losses) on investments | 10,654,479 | 40,077,421 | ||||||||
Change in unrealized appreciation/depreciation on investments | (125,554,284 | ) | 10,489,059 | |||||||
|
|
|
| |||||||
Change in net assets resulting from operations | (108,127,484 | ) | 54,898,139 | |||||||
|
|
|
| |||||||
Distributions to Shareholders: | ||||||||||
Distributions | (44,561,908 | ) | (51,326,070 | ) | ||||||
|
|
|
| |||||||
Change in net assets resulting from distributions to shareholders | (44,561,908 | ) | (51,326,070 | ) | ||||||
|
|
|
| |||||||
Capital Transactions: | ||||||||||
Proceeds from shares issued | 1,117,253 | 1,510,549 | ||||||||
Proceeds from dividends reinvested | 44,561,908 | 51,326,070 | ||||||||
Value of shares redeemed | (66,319,575 | ) | (82,125,254 | ) | ||||||
|
|
|
| |||||||
Change in net assets resulting from capital transactions | (20,640,414 | ) | (29,288,635 | ) | ||||||
|
|
|
| |||||||
Change in net assets | (173,329,806 | ) | (25,716,566 | ) | ||||||
Net Assets: | ||||||||||
Beginning of period | 691,208,717 | 716,925,283 | ||||||||
|
|
|
| |||||||
End of period | $ | 517,878,911 | $ | 691,208,717 | ||||||
|
|
|
| |||||||
Share Transactions: | ||||||||||
Shares issued | 103,568 | 121,489 | ||||||||
Dividends reinvested | 4,838,426 | 4,298,666 | ||||||||
Shares redeemed | (6,242,472 | ) | (6,486,089 | ) | ||||||
|
|
|
| |||||||
Change in shares | (1,300,478 | ) | (2,065,934 | ) | ||||||
|
|
|
| |||||||
See accompanying notes to the financial statements.
6
AZL MVP Global Balanced Index Strategy Fund
(Selected data for a share of beneficial interest outstanding throughout the periods indicated. Does not reflect fees or expenses associated with the separate accounts that invest in the Fund or in any variable annuity contracts or variable life insurance policy for which the Fund serves as an investment vehicle.)
| Year Ended December 31, 2022 | Year Ended December 31, 2021 | Year Ended December 31, 2020 | Year Ended December 31, 2019† | Year Ended December 31, 2018 | ||||||||||||||||
Net Asset Value, Beginning of Period | $12.31 | $12.31 | $12.99 | $11.62 | $12.59 | |||||||||||||||
|
|
|
|
|
|
|
|
|
| |||||||||||
Investment Activities: | ||||||||||||||||||||
Net Investment Income/(Loss) | 0.12 | (a) | 0.08 | (a) | 0.19 | (a) | 0.18 | (a) | 0.18 | |||||||||||
Net Realized and Unrealized Gains/(Losses) on Investments | (2.12 | ) | 0.89 | 0.73 | 1.68 | (0.90 | ) | |||||||||||||
|
|
|
|
|
|
|
|
|
| |||||||||||
Total from Investment Activities | (2.00 | ) | 0.97 | 0.92 | 1.86 | (0.72 | ) | |||||||||||||
|
|
|
|
|
|
|
|
|
| |||||||||||
Distributions to Shareholders From: | ||||||||||||||||||||
Net Investment Income | (0.32 | ) | (0.20 | ) | (1.22 | ) | (0.23 | ) | (0.18 | ) | ||||||||||
Net Realized Gains | (0.55 | ) | (0.77 | ) | (0.38 | ) | (0.26 | ) | (0.07 | ) | ||||||||||
|
|
|
|
|
|
|
|
|
| |||||||||||
Total Dividends | (0.87 | ) | (0.97 | ) | (1.60 | ) | (0.49 | ) | (0.25 | ) | ||||||||||
|
|
|
|
|
|
|
|
|
| |||||||||||
Net Asset Value, End of Period | $9.44 | $12.31 | $12.31 | $12.99 | $11.62 | |||||||||||||||
|
|
|
|
|
|
|
|
|
| |||||||||||
Total Return (b) | (16.09 | )% | 8.05 | % | 7.81 | % | 16.20 | % | (5.77 | )% | ||||||||||
Ratios to Average Net Assets/Supplemental Data: | ||||||||||||||||||||
Net Assets, End of Period (000’s) | $517,879 | $691,209 | $716,925 | $763,705 | $735,489 | |||||||||||||||
Net Investment Income/(Loss) | 1.18 | % | 0.61 | % | 1.49 | % | 1.40 | % | 1.43 | % | ||||||||||
Expenses Before Reductions*(c) | 0.13 | % | 0.13 | % | 0.13 | % | 0.66 | % | 0.69 | % | ||||||||||
Expenses Net of Reductions* | 0.13 | % | 0.13 | % | 0.13 | % | 0.66 | % | 0.69 | % | ||||||||||
Portfolio Turnover Rate | 5 | % | 5 | % | 9 | % | 103 | %(d) | 39 | % | ||||||||||
| * | The expense ratios exclude the impact of fees/expenses paid by each underlying fund. |
| † | The amounts shown, where applicable, are consolidated through December 6, 2019. (Prior to December 6, 2019, the Fund primarily invested in shares of a wholly-owned and controlled subsidiary of the Fund.) |
| (a) | Calculated using the average shares method. |
| (b) | The returns include reinvested dividends and fund level expenses, but exclude insurance contract charges. If these charges were included, the returns would have been lower. |
| (c) | Excludes fee reductions. If such fee reductions had not occurred, the ratios would have been as indicated. |
| (d) | Portfolio turnover increased significantly during the year due to a change in investment strategy of the Fund. |
See accompanying notes to the financial statements.
7
AZL MVP Global Balanced Index Strategy Fund
Notes to the Financial Statements
December 31, 2022
1. Organization
The Allianz Variable Insurance Products Fund of Funds Trust (the “Trust”) was organized as a Delaware statutory trust on June 16, 2004. The Trust is an open-end management investment company registered under the Investment Company Act of 1940, as amended, (the “1940 Act”) and thus is determined to be an investment company, and follows the investment company accounting and reporting guidance under Financial Accounting Standards Board (“FASB”) Accounting Standards Codification (“ASC”) Topic 946 “Financial Services—Investment Companies”. The Trust consists of 12 separate investment portfolios (collectively, the “Funds”), of which one is included in this report, the AZL MVP Global Balanced Index Strategy Fund (the “Fund”), and 11 are presented in separate reports. The Fund is a diversified series of the Trust.
The Fund is a “fund of funds”, which means that the Fund invests primarily in other mutual funds (the “Underlying Funds”). Underlying Funds invest in stocks, bonds, and other securities and reflect varying amounts of potential investment risk and reward. The Underlying Funds record their investments at fair value. Periodically, the Fund will adjust its asset allocation as it seeks to achieve its investment objective.
The Trust is authorized to issue an unlimited number of shares of the Fund without par value. Shares of the Fund are available through the variable annuity contracts offered through the separate accounts of participating insurance companies. Currently, the Fund only offers its shares to separate accounts of Allianz Life Insurance Company of North America and Allianz Life Insurance Company of New York, affiliates of the Trust and the Manager, as defined below.
Under the Trust’s organizational documents, its officers and trustees are indemnified against certain liabilities arising out of the performance of their duties to the Fund. In addition, in the normal course of business, the Fund may enter into contracts with its vendors and others that provide for general indemnifications. The Fund’s maximum exposure under these arrangements is unknown, as this would involve future claims that may be made against the Fund. However, based on experience, the Fund expects that risk of loss to be remote.
2. Significant Accounting Policies
The following is a summary of significant accounting policies followed by the Fund in the preparation of its financial statements. The policies conform with U.S. generally accepted accounting principles (“U.S. GAAP”). The preparation of financial statements requires management to make certain estimates and assumptions that affect the reported amounts of assets and liabilities and disclosure of contingent assets and liabilities at the date of the financial statements and the reported amounts of increases and decreases in net assets from operations during the reporting period. Actual results could differ from those estimates.
Security Valuation
The Fund records its investments at fair value. Fair value is defined as the price that would be received to sell an asset or paid to transfer a liability in an orderly transaction between willing market participants at the measurement date. The valuation techniques used to determine fair value are further described in Note 4 below.
Investment Transactions and Investment Income
Investment transactions are accounted for on trade date. Net realized gains and losses on investments sold and on foreign currency transactions are recorded on the basis of identified cost. Interest income is recorded on the accrual basis and includes, where applicable, the amortization of premiums or accretion of discounts. Dividend income is recorded on the ex-dividend date except in the case of foreign securities, in which case dividends are recorded as soon as such information becomes available.
Foreign Currency Translation and Withholding Taxes
The accounting records of the Fund are maintained in U.S. dollars. Foreign currency amounts are translated into U.S. dollars at the current rate of exchange to determine the fair value of investments, assets and liabilities. Purchases and sales of securities, and income and expenses are translated at the prevailing rate of exchange on the respective dates of such transactions. The Fund does not isolate that portion of the results of operations resulting from changes in foreign exchange rates on investments from fluctuations arising from changes in market prices of securities held. Such fluctuations are included in the net realized and unrealized gain or loss on investments and foreign currencies.
Income received by the Fund from sources within foreign countries may be subject to withholding and other income or similar taxes imposed by such countries. The Fund accrues such taxes, as applicable, based on its current interpretation of tax rules in the foreign markets in which it invests.
Distributions to Shareholders
Distributions to shareholders are recorded on the ex-dividend date. The Fund distributes its dividends from net investment income and net realized capital gains, if any, on an annual basis. The amount of distributions from net investment income and from net realized gains is determined in accordance with federal income tax regulations, which may differ from U.S. GAAP. These “book/tax” differences are either temporary or permanent in nature. To the extent these differences are permanent in nature (e.g., return of capital, net operating loss, reclassification of certain market discounts, gain/loss, paydowns, and distributions), such amounts are reclassified within the composition of net assets based on their federal tax-basis treatment; temporary differences (e.g., wash sales and differing treatment on certain investments) do not require reclassification. Distributions to shareholders that exceed net investment income and net realized gains for tax purposes are reported as distributions of capital.
Expense Allocation
Expenses directly attributable to the Fund are charged directly to the Fund, while expenses attributable to more than one Fund are allocated among the respective Funds based upon relative net assets or some other reasonable method. Expenses which are attributable to more than one Trust are allocated across the Allianz Variable Insurance Products Trust, Allianz Variable Insurance Products Fund of Funds Trust and AIM ETF Products Trust based upon relative net assets or another reasonable basis. Allianz Investment Management LLC (the “Manager”), serves as the investment manager for the Trust, Allianz Variable Insurance Products Trust and AIM ETF Products Trust.
This report does not reflect fees or expenses associated with the separate accounts that invest in the Fund or in any variable annuity contracts or variable life insurance policy for which the Fund serves as an investment vehicle.
8
AZL MVP Global Balanced Index Strategy Fund
Notes to the Financial Statements
December 31, 2022
Affiliated Securities Transactions
Pursuant to Rule 17a-7 under the 1940 Act, the Fund may engage in securities transactions with affiliated investment companies and advisory accounts managed by the Manager. Any such purchase or sale transaction must be effected without a brokerage commission or other remuneration, except for customary transfer fees. The transaction must be effected at the current market price, which is either the security’s last sale price on an exchange or, if there are no transactions in the security that day, at the average of the highest bid and lowest asked price. During the year ended December 31, 2022, the Fund did not engage in any Rule 17a-7 transactions.
Derivative Instruments
All open derivative positions at period end are reflected on the Fund’s Schedule of Portfolio Investments. The following is a description of the derivative instruments utilized by the Fund, including the primary underlying risk exposures related to each instrument type. The Fund’s allocation to the MVP (Managed Volatility Portfolio) risk management process may include (a) derivatives such as index futures, other futures contracts, options, and other similar securities and (b) cash, money market equivalents, short-term debt instruments, money market funds, and short-term debt funds to satisfy all applicable margin requirements and to provide additional portfolio liquidity to satisfy large redemptions and any margin calls. Due to the leverage provided by derivatives, the notional value of the Fund’s derivative positions could exceed 20% of the Fund’s value. The Fund may also use futures to gain equity exposure and may hold cash as a buffer in the event of market shocks.
Futures Contracts
During the year ended December 31, 2022, the Fund invested in futures contracts to reduce volatility and limit the need to decrease or increase allocations to underlying funds. Futures contracts are valued based upon their quoted daily settlement prices. Upon entering into a futures contract, the Fund is required to segregate liquid assets in accordance with the initial margin requirements of the broker or exchange. Futures contracts are marked to market daily and a payable or receivable for the change in value (“variation margin”), if any, is recorded by the Fund. Gains or losses are recognized but not considered realized until the contracts expire or are closed. Futures contracts involve, to varying degrees, elements of market risk (generally equity price risk related to stock futures, interest rate risk related to bond futures, and foreign currency risk related to currency futures) and exposure to loss in excess of the variation margin disclosed in the Statement of Assets and Liabilities. The primary risks associated with the use of futures contracts are the imperfect correlation between the change in value of the underlying securities and the prices of futures contracts, the possibility of an illiquid market, and the inability of the counterparty to meet the terms of the contract. For the year ended December 31, 2022, the monthly average notional amount for long contracts was $17.7 million, and the monthly average notional amount for short contracts was $40.8 million. Realized gains and losses are reported as “Net realized gains/(losses) on futures contracts” on the Statement of Operations.
Summary of Derivative Instruments
The following is a summary of the values of derivative instruments on the Fund’s Statement of Assets and Liabilities, categorized by risk exposure, as of December 31, 2022:
Asset Derivatives | Liability Derivatives | |||||||||||
| Primary Risk Exposure | Statement of Assets and Liabilities Location | Total Value | Statement of Assets and Liabilities Location | Total Value | ||||||||
Equity Risk | ||||||||||||
| Futures Contracts | Receivable for variation margin on futures contracts* | $820 | Payable for variation margin on futures contracts* | $— | ||||||||
Interest Rate Risk | ||||||||||||
| Futures Contracts | Receivable for variation margin on futures contracts* | — | Payable for variation margin on futures contracts* | $114,741 | ||||||||
| * | For futures contracts, the amounts represent the cumulative appreciation/depreciation of these futures contracts as reported in the Schedule of Portfolio Investments. Only the current day’s variation margin is reported within the Statement of Assets and Liabilities as variation margin on futures contracts. |
The following is a summary of the effect of derivative instruments on the Statement of Operations, categorized by risk exposure, for the year ended December 31, 2022:
| Primary Risk Exposure | Location of Gains/(Losses) on Derivatives Recognized | Realized Gains/(Losses) on Derivatives Recognized | Change in Net Unrealized on Derivatives Recognized | |||||||
Equity Risk | ||||||||||
| Futures Contracts | Net realized gains/(losses) on futures contracts/ Change in net unrealized appreciation/ depreciation on futures contracts | $(2,213,623) | $(248,094) | |||||||
Interest Rate Risk | ||||||||||
| Futures Contracts | Net realized gains/(losses) on futures contracts/ Change in net unrealized appreciation/ depreciation on futures contracts | (1,798,941 | ) | (296,174 | ) | |||||
3. Fees and Transactions with Affiliates and Other Parties
The Manager provides investment advisory and management services for the Fund. The Manager has contractually agreed to waive fees and reimburse the Fund to limit the annual expenses, excluding interest expense (e.g., cash overdraft fees), taxes, brokerage commissions, acquired fund fees and expenses, other expenditures that are capitalized in accordance with U.S. GAAP and other extraordinary expenses not incurred in the ordinary course of the Fund’s business, based on the daily net assets of the Fund, through April 30, 2024. Expenses incurred for investment advisory and management services are reflected on the Statement of Operations as “Management fees.”
For the year ended December 31, 2022, the annual rate due to the Manager and the annual expense limit were as follows:
| Annual Rate | Annual Expense Limit | |||||||||
AZL MVP Global Balanced Index Strategy Fund | 0.10 | % | 0.15 | % | ||||||
9
AZL MVP Global Balanced Index Strategy Fund
Notes to the Financial Statements
December 31, 2022
Any amounts contractually waived or reimbursed by the Manager with respect to the annual expense limit in a particular fiscal year will be subject to repayment by the Fund to the Manager to the extent that from time to time through the next three fiscal years the repayment will not cause the Fund’s expenses to exceed the lesser of the stated limit at the time of the waiver or the current stated limit. Any amounts recouped by the Manager during the period are reflected on the Statement of Operations as “Recoupment of prior expenses reimbursed by the Manager.” At December 31, 2022, there were no remaining contractual reimbursements subject to repayment by the Fund in subsequent years.
Management fees, which the Manager may waive in order to maintain more competitive expense ratios, are not subject to repayment in subsequent years. Information on the total amount waived/reimbursed by the Manager or repaid to the Manager by the Fund during the period can be found on the Statement of Operations, as applicable. During the year ended December 31, 2022, there were no such waivers.
The Manager or an affiliate of the Manager serves as the investment adviser of certain underlying funds in which the Fund invests. At December 31, 2022, these underlying funds are noted as Affiliated Investment Companies in the Fund’s Schedule of Portfolio Investments. Additional information, including financial statements, about these Funds is available at www.allianzlife.com. The Manager or an affiliate of the Manager is paid a separate fee from the underlying funds for such services. A summary of the Fund’s investments in affiliated investment companies for the year ended December 31, 2022 is as follows:
| Value 12/31/2021 | Purchases at Cost | Proceeds from Sales | Net Realized Gains (Losses) | Change in Net Unrealized Appreciation (Depreciation) | Value 12/31/22 | Shares as of | Dividend Income | Net Realized Gains Distributions from Affiliated | |||||||||||||||||||||||||||||||||||||
AZL Enhanced Bond Index Fund | $ 323,676,941 | $ 4,253,739 | $ (33,999,228) | $ (4,951,460) | $ (42,072,379) | $ 246,907,613 | 26,045,107 | $ 4,010,631 | $ 144,638 | ||||||||||||||||||||||||||||||||||||
AZL MSCI Emerging Markets Equity Index Fund, Class 2 | 34,089,504 | 1,020,079 | (1,270,190 | ) | 22,137 | (7,895,645) | 25,965,885 | 4,298,988 | 389,182 | 630,897 | |||||||||||||||||||||||||||||||||||
AZL MSCI Global Equity Index Fund, Class 2 | 297,133,346 | 20,349,654 | (24,629,438) | 1,710,902 | (73,733,514) | 220,830,950 | 17,652,354 | 2,768,401 | 17,074,333 | ||||||||||||||||||||||||||||||||||||
|
|
|
|
|
|
|
| �� |
|
|
|
|
|
|
|
|
|
| |||||||||||||||||||||||||||
| $ 654,899,791 | $ 25,623,472 | $ (59,898,856) | $ (3,218,421) | $ (123,701,538) | $ 493,704,448 | 47,996,449 | $ 7,168,214 | $ 17,849,868 | |||||||||||||||||||||||||||||||||||||
|
|
|
|
|
|
|
|
|
|
|
|
|
|
|
|
|
| ||||||||||||||||||||||||||||
Pursuant to separate agreements between the Trust and the Manager, the Manager provides a Chief Compliance Officer (“CCO”) and certain compliance oversight and regulatory filing services to the Trust. Under these agreements, the Manager is entitled to an amount equal to a portion of the compensation and certain other expenses related to the individuals performing the CCO and compliance oversight services, as well as $100 per hour for time incurred in connection with the preparation and filing of certain documents with the SEC. The fees are paid to the Manager on a quarterly basis. The total expenses incurred by the Fund for these services are reflected on the Statement of Operations as “Administrative and compliance services fees.”
Citi Fund Services Ohio, Inc. (“Citi” or the “Administrator”), a wholly owned subsidiary of Citigroup, Inc., with which an officer of the Trust is affiliated, serves as the Trust’s administrator and fund accountant, and assists the Trust in all aspects of its administration and operation. The Administrator is entitled to a fee, accrued daily and paid monthly. The Administrator is entitled to an annual fee for each additional class of shares of any Fund, certain annual fees in supporting fair value services, and a Trust-wide annual fee for providing infrastructure and support in implementing the written policies and procedures comprising the Fund’s compliance program. The Administrator is also reimbursed for certain expenses incurred. The total expenses incurred by the Fund for these services are reflected on the Statement of Operations as “Administration fees.”
FIS Investor Services LLC (“FIS”) serves as the Fund’s transfer agent. Under the Transfer Agent Agreement, the Trust pays FIS a fee for its services and reimburses FIS for all of their reasonable out-of-pocket expenses incurred in providing these services.
The Bank of New York Mellon (“BNY Mellon” or the “Custodian”) serves as the Trust’s custodian. For these services as custodian, the Funds pay BNY Mellon a fee based on a percentage of assets held on behalf of the Funds, plus certain out-of-pocket charges.
Allianz Life Financial Services, LLC (“ALFS”), an affiliate of the Manager, serves as distributor of the Fund. ALFS receives an annual Trust-wide annual fee of $7,500, paid by the Manager from its profits and not by the Trust, for recordkeeping and reporting services.
Certain Officers and Trustees of the Trust are affiliated with the Manager or the Administrator. Such Officers (except for the Trust’s CCO as noted above) and Trustees receive no compensation from the Trust for serving in their respective roles.
4. Investment Valuation Summary
The valuation techniques employed by the Fund, as described below, maximize the use of observable inputs and minimize the use of unobservable inputs in determining fair value. The inputs used for valuing the Fund’s investments are summarized in the three broad levels listed below:
| ● | Level 1 - quoted prices in active markets for identical assets |
| ● | Level 2 - other significant observable inputs (including quoted prices for similar securities, interest rates, prepayments speeds, credit risk, etc.) |
| ● | Level 3 - significant unobservable inputs (including the Fund’s own assumptions in determining the fair value of investments) |
Changes in valuation techniques may result in transfers in or out of an assigned level within the disclosure hierarchy. The inputs or methodology used for valuing investments is not necessarily an indication of the risk associated with investing in those investments.
Security prices are determined pursuant to valuation procedures approved by the Trust’s Board of Trustees (the “Board” or “Trustees”) as of the close of the New York Stock Exchange (“NYSE”) (generally 4:00 pm Eastern Time). Equity securities are valued at the last quoted sale price or, if there is no sale, the last quoted bid price is used. Securities listed on NASDAQ Stock Market, Inc. (“NASDAQ”) are valued at the official closing price as reported by NASDAQ. In each of these situations, valuations are typically categorized as a Level 1 in
10
AZL MVP Global Balanced Index Strategy Fund
Notes to the Financial Statements
December 31, 2022
the fair value hierarchy. Investments in open-end investment companies are valued at their respective net asset value as reported by such companies and are typically categorized as Level 1 in the fair value hierarchy. Futures contracts are valued at the settlement prices established each day on the primary exchange and are typically categorized as Level 1 in the fair value hierarchy.
Debt and other fixed income securities are generally valued at an evaluated bid price provided by an independent pricing source in accordance with valuation procedures approved by the Board. To value debt securities, pricing services may use various pricing techniques which take into account appropriate factors such as market activity, yield, quality, coupon rate, maturity, type of issue, trading characteristics, call features, credit ratings and other data, as well as broker quotes. Short-term securities of sufficient credit quality with sixty days or less remaining until maturity may be valued at amortized cost, which approximates fair value. In each of these situations, valuations are typically categorized as Level 2 in the fair value hierarchy.
Other assets and securities for which market quotations have become unreliable or are not readily available as defined in Rule 2a-5 under the 1940 Act are valued in accordance with valuation procedures approved by the Board. Fair value pricing may be used for significant events such as securities whose trading has been suspended, whose price has become stale or for which there is no currently available price at the close of the NYSE. Depending on the source and relative significance of valuation inputs, these instruments may be classified as Level 2 or Level 3 in the fair value hierarchy. The Fund utilizes a pricing service to assist in determining the fair value of securities when certain significant events occur that may affect the value of foreign securities.
In accordance with valuation procedures approved by the Board, fair value pricing may be used if events materially affecting the value of foreign securities occur between the time when the exchange on which they are traded closes and the time when the Fund’s net asset value is calculated. Management identifies possible fluctuation in international securities by monitoring the increase or decrease in the value of a designated benchmark index. In the event of an increase or decrease greater than predetermined levels, the Fund may use a systematic valuation model provided by an independent third party to fair value its international equity securities which are then typically categorized as Level 2 in the fair value hierarchy.
The Board has designated the Manager to perform the Fund’s fair value determinations in accordance with valuation procedures approved by the Board. The effect of using fair value pricing is that the Fund’s NAV will be subject to the judgment of the Manager. The Manager’s fair valuation process is subject to the oversight of the Board.
The following is a summary of the valuation inputs used as of December 31, 2022 in valuing the Fund’s investments based upon the three levels defined above:
Investment Securities: | Level 1 | Level 2 | Level 3 | Total | ||||||||||||||||
Common Stocks+ | $— | $— | $163,992 | $163,992 | ||||||||||||||||
Private Placements+ | — | — | 372,473 | 372,473 | ||||||||||||||||
Convertible Bond+ | — | — | —# | — | ||||||||||||||||
Corporate Bonds+ | — | — | 154,406 | 154,406 | ||||||||||||||||
Affiliated Investment Companies | 493,704,448 | — | — | 493,704,448 | ||||||||||||||||
|
|
|
|
|
|
|
| |||||||||||||
Total Investment Securities | 493,704,448 | — | 690,871 | 494,395,319 | ||||||||||||||||
|
|
|
|
|
|
|
| |||||||||||||
Other Financial Instruments:* | ||||||||||||||||||||
Futures Contracts | (113,921) | — | — | (113,921) | ||||||||||||||||
|
|
|
|
|
|
|
| |||||||||||||
Total Investments | $493,590,527 | $— | $690,871 | $494,281,398 | ||||||||||||||||
|
|
|
|
|
|
|
| |||||||||||||
| + | For detailed industry descriptions, see the accompanying Schedule of Portfolio Investments. |
| # | Represents the interest in securities that were determined to have a value of zero at December 31, 2022. |
| * | Other Financial Instruments would include any derivative instruments, such as futures contracts. These investments are generally presented in the financial statements at variation margin. |
5. Security Purchases and Sales
For the year ended December 31, 2022, cost of purchases and proceeds from sales of securities (excluding securities maturing less than one year from acquisition) were as follows:
| Purchases | Sales | |||||||||
AZL MVP Global Balanced Index Strategy Fund | $ | 25,625,485 | $ | 59,898,856 | ||||||
6. Restricted Securities
A restricted security is a security which has been purchased through a private offering and cannot be resold to the general public without prior registration under the Securities Act of 1933 (the “1933 Act”) or pursuant to the resale limitations provided by Rule 144A under the 1933 Act, or an exemption from the registration requirements of the 1933 Act. Whether a restricted security is illiquid is determined pursuant to guidelines established by the Trustees. Not all restricted securities are considered illiquid. The illiquid restricted securities held as of December 31, 2022 are identified below.
11
AZL MVP Global Balanced Index Strategy Fund
Notes to the Financial Statements
December 31, 2022
| Security | Acquisition Date(a) | Acquisition Cost | Shares or Principal Amount | Fair Value | Percentage of Net Assets | ||||||||||||||||||||
Grand Rounds, Inc., Series C | 3/31/15 | $ | 399,608 | 145,123 | $ | 163,989 | 0.03 | % | |||||||||||||||||
Jawbone | 1/24/17 | – | 23,389 | – | 0.00 | % | |||||||||||||||||||
Lookout, Inc. | 3/4/15 | 3,384 | 5,547 | 20,246 | 0.00 | % | |||||||||||||||||||
Lookout, Inc. Preferred Shares, Series F | 9/19/14 | 481,994 | 63,925 | 352,227 | 0.07 | % | |||||||||||||||||||
Quintis Pty, Ltd. | 10/25/18 | 253,669 | 386,370 | 3 | 0.00 | % | |||||||||||||||||||
Quintis Pty, Ltd., 7.50%, 10/1/26, Callable 2/6/23 @ 103.38 | 10/25/18 | 52,331 | 52,331 | 52,331 | 0.01 | % | |||||||||||||||||||
Quintis Pty, Ltd., 0.00%, 10/1/28, Callable 2/6/23 @ 98 | 10/25/18 | 730,672 | 730,672 | 102,075 | 0.02 | % | |||||||||||||||||||
REI Agro, Ltd., Registered Shares, 5.50%, 12/8/19 | 2/7/12 | – | 400,000 | – | 0.00 | % | |||||||||||||||||||
| (a) | Acquisition date represents the initial purchase date of the security. |
7. Investment Risks
The risks below are presented in an order intended to facilitate readability. Their order does not imply that the realization of one risk is more likely to occur more frequently than another risk, nor does it imply that the realization of one risk is likely to have a greater adverse impact than another risk. The Fund may be subject to other risks in addition to these identified risks. This section discusses certain common principal risks encountered by the Fund.
Derivatives Risk: The Fund may invest directly or through affiliated or unaffiliated mutual funds or unregistered investment pools in derivative instruments such as futures, options, and options on futures. A derivative is a financial contract whose value depends on, or is derived from, the value of an underlying asset, reference rate, or risk. Use of derivative instruments involves risks different from, or possibly greater than, the risks associated with investing directly in securities and other traditional investments. Derivatives are subject to a number of other risks, such as liquidity risk, interest rate risk, market risk, credit risk, and selection risk. Derivatives also involve the risk of mispricing or improper valuation and the risk that changes in the value may not correlate perfectly with the underlying asset, rate, or index. Using derivatives may result in losses, possibly in excess of the principal amount invested. Also, suitable derivative transactions may not be available in all circumstances. The other party to a derivatives contract could default.
Foreign Securities Risk: Investing in the securities of non-U.S. issuers involves a number of risks, such as fluctuations in currency values, adverse political, social or economic developments, and differences in social and economic developments or policies. Such risks include future political and economic developments, and the possible imposition of exchange controls or other foreign governmental laws and restrictions. In addition, with respect to certain countries, there is the possibility of expropriation of assets, confiscatory taxation, political or social instability or diplomatic developments which could adversely affect investments in those securities. Certain foreign companies may be subject to sanctions, embargoes, or other governmental actions that may impair or otherwise limit the ability to invest in, receive, hold or sell the securities of such companies.
Fund of Fund Risk: The Fund, as a shareholder of the underlying funds, indirectly bears its proportionate share of any investment management fees and other expenses of the underlying funds. Further due to the fees and expenses paid by the Fund, as well as small variations in the Fund’s actual allocations to the underlying funds and any futures and cash held in the Fund’s portfolio, the performance and income distributions of the Fund will not be the same as the performance and income distributions of the underlying funds. In addition, the Fund maintains indirect exposure to various types of risk which may exist in the underlying Funds, such as foreign securities risk, fixed income securities risk and other risks.
Interest Rate Risk: Debt securities held by an underlying fund may decline in value due to rising interest rates. The price of a bond is also affected by its maturity. Bonds with longer maturities generally have greater sensitivity to changes in interest rates.
Market Risk: The market price of securities owned by the underlying funds may go up or down, sometimes rapidly and unpredictably. Securities may decline in value due to factors affecting securities markets generally or particular industries represented in the securities markets. The value of a security may decline due to general market conditions that are not specifically related to a particular company, such as real or perceived adverse economic conditions, changes in the general outlook for corporate earnings, changes in interest or currency rates, or adverse investor sentiment, as well as natural disasters, and outbreaks of infectious illnesses or other widespread public health issues.
Quantitative Investing Risk: The value of securities selected using quantitative analysis can react differently to issuer, political, market, and economic developments than the market as a whole or securities selected using only fundamental analysis. The factors used in quantitative analysis and the weight placed on those factors may not be predictive of a security’s value. In addition, factors that affect a security’s value can change over time and these changes may not be reflected in the quantitative model. A quantitative model can be adversely affected by errors or imperfections in the factors or the data on which evaluations are based, or by technical issues with construction or implementation of the model, which in any case may result in a failure of the portfolio to perform as expected or a failure to identify securities that will perform well in the future
8. Coronavirus (COVID-19) Pandemic
The global outbreak of the COVID-19 strain of the coronavirus has caused adverse effects on many companies, sectors, nations, regions and the markets in general, and may continue for an unpredictable duration. The effects of this pandemic may adversely impact the value and performance of the Fund, its ability to buy and sell fund investments at appropriate valuations, and its ability to achieve its investment objective(s).
9. Federal Tax Information
It is the policy of the Fund to continue to qualify as a regulated investment company by complying with the provisions available to certain investment companies, as defined under Subchapter M of the Internal Revenue Code, and to make distributions of net investment income and net realized gains sufficient to relieve it from all, or substantially all, federal income taxes. Accordingly, no provisions for federal income taxes are required in the financial statements.
12
AZL MVP Global Balanced Index Strategy Fund
Notes to the Financial Statements
December 31, 2022
Management of the Fund has reviewed tax positions taken in tax years that remain subject to examination by all major tax jurisdictions, including federal (i.e., the last four tax year ends and the interim tax period since then, as applicable). Management believes that there is no tax liability resulting from unrecognized tax benefits related to uncertain tax positions taken.
Cost of securities, including derivatives and short positions as applicable, for federal income tax purposes at December 31, 2022 was $517,224,824. The gross unrealized appreciation/(depreciation) on a tax basis was as follows:
Unrealized appreciation | $23,626,314 | |||
Unrealized (depreciation) | (46,455,819 | ) | ||
|
| |||
Net unrealized appreciation/(depreciation) | $ | (22,829,505 | ) | |
|
|
As of the end of its tax year ended December 31, 2022, the Fund had capital loss carry forwards (“CLCFs”) as summarized in the table below. The Board does not intend to authorize a distribution of any realized gain for the Fund until any applicable CLCF has been offset.
CLCFs not subject to expiration:
| Short-Term Amount | Long-Term Amount | Total | |||||||||||||
AZL MVP Global Balanced Index Strategy Fund | $5,556,638 | $13,165,100 | $18,721,738 | ||||||||||||
The tax character of dividends paid to shareholders during the year ended December 31, 2022 was as follows:
| Ordinary Income | Net Long-Term Capital Gains | Total Distributions(a) | |||||||||||||
AZL MVP Global Balanced Index Strategy Fund | $35,754,717 | $8,807,191 | $44,561,908 | ||||||||||||
| (a) | Total distributions paid may differ from the Statements of Changes in Net Assets because dividends are recognized when actually paid for tax purposes. |
The tax character of dividends paid to shareholders during the year ended December 31, 2021, was as follows:
| Ordinary Income | Net Long-Term Capital Gains | Total Distributions(a) | |||||||||||||
AZL MVP Global Balanced Index Strategy Fund | $ | 37,629,606 | $ | 13,696,464 | $ | 51,326,070 | |||||||||
| (a) | Total distributions paid may differ from the Statements of Changes in Net Assets because dividends are recognized when actually paid for tax purposes. |
At December 31, 2022, the components of accumulated earnings on a tax basis were as follows:
| Undistributed Ordinary Income | Undistributed Long-Term Capital Gains | Accumulated Capital and Other Losses | Unrealized Appreciation/ Depreciation(a) | Total Accumulated Earnings/ (Deficit) | ||||||||||||||||
AZL MVP Global Balanced Index Strategy Fund | $ | 20,387,494 | $— | $ | (18,721,738 | ) | $ | (22,830,735 | ) | $ | (21,164,979 | ) | ||||||||
| (a) | The differences between book-basis and tax-basis unrealized appreciation/(depreciation) is attributable primarily to tax deferral of losses on wash sales, foreign currency gains or losses, mark-to-market of futures contracts and straddles. |
10. Ownership and Principal Holders
The beneficial ownership, either directly or indirectly, of more than 25% of the voting securities of a fund creates presumptions of control of the fund, under section 2 (a)(9) of the 1940 Act. As of December 31, 2022, the Fund had an individual shareholder account which is affiliated with the Manager representing ownership in excess of 85% of the Fund. Investment activities of this shareholder could have a material impact to the Fund. As of December 31, 2022, the Fund had a controlling interest (in excess of 50%) in the AZL MSCI Global Equity Index Fund, which is affiliated with the Manager.
11. Subsequent Events
Management of the Fund has evaluated the need for additional disclosures or adjustments resulting from events through the date the financial statements were issued. Based on this evaluation, there were no subsequent events to report that would have material impact on the Fund’s financial statements.
13
REPORT OF INDEPENDENT REGISTERED PUBLIC ACCOUNTING FIRM
To the Board of Trustees of Allianz Variable Insurance Products Fund of Funds Trust and Shareholders of
AZL MVP Global Balanced Index Strategy Fund
Opinion on the Financial Statements
We have audited the accompanying statement of assets and liabilities, including the schedule of portfolio investments, of AZL MVP Global Balanced Index Strategy Fund (one of the funds constituting Allianz Variable Insurance Products Fund of Funds Trust, referred to hereafter as the “Fund”) as of December 31, 2022, the related statement of operations for the year ended December 31, 2022, the statements of changes in net assets for each of the two years in the period ended December 31, 2022, including the related notes, and the financial highlights for each of the five years in the period ended December 31, 2022 (collectively referred to as the “financial statements”). In our opinion, the financial statements present fairly, in all material respects, the financial position of the Fund as of December 31, 2022, the results of its operations for the year then ended, the changes in its net assets for each of the two years in the period ended December 31, 2022 and the financial highlights for each of the five years in the period ended December 31, 2022 in conformity with accounting principles generally accepted in the United States of America.
Basis for Opinion
These financial statements are the responsibility of the Fund’s management. Our responsibility is to express an opinion on the Fund’s financial statements based on our audits. We are a public accounting firm registered with the Public Company Accounting Oversight Board (United States) (PCAOB) and are required to be independent with respect to the Fund in accordance with the U.S. federal securities laws and the applicable rules and regulations of the Securities and Exchange Commission and the PCAOB.
We conducted our audits of these financial statements in accordance with the standards of the PCAOB. Those standards require that we plan and perform the audit to obtain reasonable assurance about whether the financial statements are free of material misstatement, whether due to error or fraud.
Our audits included performing procedures to assess the risks of material misstatement of the financial statements, whether due to error or fraud, and performing procedures that respond to those risks. Such procedures included examining, on a test basis, evidence regarding the amounts and disclosures in the financial statements. Our audits also included evaluating the accounting principles used and significant estimates made by management, as well as evaluating the overall presentation of the financial statements. Our procedures included confirmation of securities owned as of December 31, 2022 by correspondence with the custodian, transfer agent and brokers. We believe that our audits provide a reasonable basis for our opinion.
/s/ PricewaterhouseCoopers LLP
New York, New York
February 23, 2023
We have served as the auditor of one or more investment companies in the Allianz Variable Insurance Products complex since 2018.
14
Other Federal Income Tax Information (Unaudited)
For the year ended December 31, 2022, 2.64% of the total ordinary income dividends paid by the Fund qualify for the corporate dividends received deductions available to corporate shareholders.
During the year ended December 31, 2022, the Fund declared net short-term capital gain distributions of $19,386,973.
During the year ended December 31, 2022, the Fund declared net long-term capital gain distributions of $8,807,191.
15
A description of the policies and procedures that the Fund uses to determine how to vote proxies relating to portfolio securities is available, without charge, upon request, by visiting the Securities and Exchange Commission’s (‘‘Commission’’) website at www.sec.gov, or by calling 800-624-0197.
Information regarding how the Fund voted proxies relating to portfolio securities during the most recent 12-month period ended June 30th is available (i) without charge, upon request, by calling 800-624-0197; (ii) on the Trust’s website at https://www.allianzlife.com; and (iii) on the Commission’s website at http://www.sec.gov.
The Fund files complete Schedules of Portfolio Holdings with the Commission for the first and third quarters of each fiscal year on Form N-PORT. Schedules of Portfolio Holdings for the Fund are available without charge on the Commission’s website at http://www.sec.gov, or may be obtained by calling 800-624-0197.
16
Approval of Investment Advisory Agreement (Unaudited)
Subject to the general supervision of the Board of Trustees (the “Board”) and in accordance with the investment objectives and restrictions of each separate series (each a “Fund,” together, the “Funds”) of the Allianz Variable Insurance Products Fund of Funds Trust (the “Trust”), investment advisory services are provided to the Funds by Allianz Investment Management LLC (the “Manager”). The Manager manages each Fund pursuant to an investment management agreement (the “Management Agreement”) with the Trust in respect of each such Fund. The Management Agreement provides that the Manager, subject to the supervision and approval of the Board, is responsible for the management of each Fund. For management services, each Fund pays the Manager an investment advisory fee based upon each Fund’s average daily net assets. The Manager has contractually agreed to limit the expenses of each Fund by reimbursing the Fund if and when total Fund operating expenses exceed certain amounts until at least April 30, 2024 (the “Expense Limitation Agreement”).
In reviewing the services provided by the Manager and the terms of the Management Agreement, the Board receives and reviews information related to the Manager’s experience and expertise in the variable insurance marketplace. In addition, the Board receives information regarding the Manager’s expertise with regard to portfolio diversification and asset allocation requirements within variable insurance products issued by Allianz Life Insurance Company of North America (“Allianz Life”) and its subsidiary, Allianz Life Insurance Company of New York (“Allianz of New York”). Currently, the Funds are offered only through Allianz Life and Allianz of New York variable products, and not in the retail fund market.
As required by the Investment Company Act of 1940 (the “1940 Act”), the Board has reviewed and approved the Management Agreement with the Manager. The Board’s decision to approve this contract reflects the exercise of its business judgment on whether to approve new arrangements and continue the existing arrangements. During its review of the contract, the Board considered many factors, among the most material of which are: the Fund’s investment objectives and long-term performance; the Manager’s management philosophy, personnel, processes and investment performance, including its compliance history and the adequacy of its compliance processes; the preferences and expectations of Fund shareholders (and underlying contract owners) and their relative sophistication; the continuing state of competition in the mutual fund industry; and comparable fees in the mutual fund industry.
The Board also considered the compensation and benefits received by the Manager. This includes fees received for services provided to a Fund by employees of the Manager or of affiliates of the Manager and research services received by the Manager from brokers that execute Fund trades, as well as advisory fees. The Board considered the fact that: (1) the Manager and the Trust are parties to an Administrative Services Agreement and a Compliance Services Agreement, under which the Manager is compensated by the Trust for performing certain administrative and compliance services including providing an employee of the Manager or one of its affiliates to act as the Trust’s Chief Compliance Officer; and (2) Allianz Life Financial Services, LLC, an affiliated person of the Manager, is a registered securities broker-dealer and received (along with its affiliated persons) payments made by the underlying funds pursuant to Rule 12b-1.
The Board is aware that various courts have interpreted provisions of the 1940 Act and have indicated in their decisions that the following factors may be relevant to an adviser’s compensation: the nature, extent and quality of the services provided by the adviser, including the performance of the fund; the adviser’s cost of providing the services; the extent to which the adviser may realize “economies of scale” as the fund grows larger; any indirect benefits that may accrue to the adviser and its affiliates as a result of the adviser’s relationship with the fund; performance and expenses of comparable funds; the profitability of acting as adviser to the fund; and the extent to which the independent Board members, who are not “interested persons” of a fund as defined by the 1940 Act (“Independent Trustees”), are fully informed about all facts bearing on the adviser’s services and fees. The Board is aware of these factors and takes them into account in its review of the Management Agreement for the Funds.
Each member of the Board considered and weighed these factors in light of his or her experience in governing the Trust. The Board is assisted in its deliberations by the advice of independent legal counsel to the Independent Trustees (“Independent Trustee Counsel”). In this regard, the Board requests and receives a significant amount of information about the Funds and the Manager. Some of this information is provided at each regular meeting of the Board; additional information is provided in connection with the particular meetings at which the Board’s formal review of the Management Agreement occurs. In between regularly scheduled meetings, the Board may receive information on particular matters as the need arises. Thus, the Board’s evaluation of the Management Agreement is informed by reports covering such matters as: the Manager’s investment philosophy, personnel and processes, and the Fund’s investment performance (in absolute terms as well as in relationship to its benchmark and certain competitor or “peer group” funds). In connection with comparing the performance of each Fund versus its benchmark, the Board receives reports on the extent to which the Fund’s performance may be attributed to various applicable factors, such as asset class allocation decisions and volatility management strategies, if applicable, the performance of the underlying funds, rebalancing decisions, and the impact of cash positions and Fund fees and expenses. The Board also receives reports on the Funds’ expenses (including the advisory fee itself and the overall expense structure of the Funds, both in absolute terms and relative to peer group and/or competing funds, with due regard for the Expense Limitation Agreement and additional voluntary expense limitations); the use and allocation of any brokerage commissions derived from trading the Funds’ portfolio securities; the nature, extent and quality of the advisory and other services provided to the Fund by the Manager and its affiliates; compliance and audit reports concerning the Funds and the companies that service them; and relevant developments in the mutual fund industry and how the Funds and/or the Manager are responding to them.
The Board also receives financial information about the Manager, including reports on the compensation and benefits the Manager derives from its relationships with the Funds. These reports cover not only the fees under the Management Agreement, but also the fees, if any, received for providing other services to the Funds. The reports also discuss any indirect or “fall-out” benefits the Manager or its affiliates may derive from their relationships with the Funds.
The Management Agreement was most recently considered at Board meetings held in the summer and fall of 2022. Information relevant to the approval of the Management Agreement was considered at Board meetings held June 14 and 21, 2022, and September 13, 2022, as well as at various other meetings preceding those meetings. Accordingly, the Management Agreement was approved by the Board at an in-person meeting on September 13, 2022. At such meeting the Board also approved the Expense Limitation Agreement between the Manager and the Trust for the period ending April 30, 2024.
In connection with such meetings, the Board requested and evaluated extensive materials from the Manager, including performance and expense information for other investment companies with similar investment objectives derived from data compiled by an independent third-party provider and other sources believed to be reliable by the Manager and the Trustees. Prior to voting, the Trustees reviewed the proposed approval of the Management Agreement with management and with Independent Trustee Counsel and received a memorandum from such counsel discussing the legal standards for their consideration of the proposed approval. The Independent Trustees also discussed the proposed approval in private sessions with Independent Trustee Counsel at which no representatives of the Manager were present. In reaching their determinations relating to the approval of the Management Agreement, in respect of each Fund, each member of the Board considered all factors he or she believed relevant. The Board based its decision to approve
17
the Management Agreement on the totality of the circumstances and relevant factors, and with a view to past and future long-term considerations. Not all of the factors and considerations discussed above and below are necessarily relevant to every Fund, and the Board did not assign relative weights to factors discussed herein or deem any one or group of them to be controlling in and of themselves.
Shareholder reports must include a discussion of certain factors relating to the selection of the investment adviser and the approval of the advisory fee. The “factors” enumerated by the SEC are set forth below in italics, as well as the Board’s conclusions regarding such factors:
(1) The nature, extent and quality of services provided by the Manager. The Trustees noted that the Manager, subject to the oversight of the Board, administers each Fund’s business and other affairs. The Trustees noted that the Manager also provides the Trust and each Fund with such administrative and other services (exclusive of, and in addition to, any such services provided by any other service providers retained by the Trust on behalf of the Funds) and executive and other personnel as are necessary for the operation of the Trust and the Funds. Except for the Trust’s Chief Compliance Officer and certain compliance staff, the Manager pays all of the compensation of Trustees and officers of the Trust who are employees of the Manager or its affiliates.
The Board considered the scope and quality of services provided by the Manager and noted that the scope of the services provided has continued to expand as a result of regulatory and other developments. The Board noted, for example, that the Manager is responsible for maintaining and monitoring its own compliance program, and this compliance program has been continuously refined and enhanced in light of new regulatory requirements. The Board considered the capabilities and resources which the Manager has dedicated to performing services on behalf of the Trust and its Funds. The quality of administrative and other services, including the Manager’s role in coordinating the activities of the Trust’s other service providers, also were considered. The Board concluded that, overall, they were satisfied with the nature, extent and quality of services provided (and expected to be provided) to the Trust and to each of the Funds under the Management Agreement.
(2) The investment performance of the Funds and the Manager. In connection with every quarterly Board meeting and the summer and fall 2022 contract review process, Trustees received extensive information on the performance results of each Fund. This included, for example, performance information on absolute total return, performance versus the appropriate benchmark(s) and performance versus peer groups as reported by Lipper, the contribution to performance of the Manager’s asset class allocation decisions and volatility management strategies, if applicable, the performance of the underlying funds, and the impact on performance of rebalancing decisions, cash and Fund fees. This included Lipper performance information on the Funds for the previous quarter, and previous one-, three- and five-year periods, to the extent available. For example, in connection with the Board meetings held June 14 and 21, 2022, and September 13, 2022, the Manager reported that, for the five-year period ended December 31, 2021, two Funds were in the top 40%, three were in the middle 20%, and seven were in the bottom 40% of their respective Lipper peer groups. The Manager reported that for the three-year period ended December 31, 2021, three Funds were in the top 40%, two were in the middle 20%, and seven were in the bottom 40% of their respective Lipper peer groups. For the one-year period ended December 31, 2021, six Funds were in the top 40%, two were in the middle 20%, and four were in the bottom 40% of their respective Lipper peer groups.
The Manager also reported on the performance of the MVP Funds compared to custom managed-volatility peer groups. For the five-year period ended December 31, 2021, four Funds were in the top 40%, two were in the middle 20%, and four were in the bottom 20%. For the three-year period ended December 31, 2021, four Funds were in the top 40%, two were in the middle 20%, and four were in the bottom 40% of their respective custom managed-volatility peer groups. For the one-year period ended December 31, 2021, seven Funds were in the top 40%, two were in the middle 20%, and one was in the bottom 40% of their respective custom managed-volatility peer groups. The Board members discussed with the Manager and considered the impact of the volatility management strategies on performance in different market environments, where applicable, and considered whether they were operating as intended. The Board noted, in particular, the impact of certain characteristics of the Funds’ volatility management strategies in relation to volatility experienced as a result of the COVID-19 pandemic, and that relative performance had improved as the markets stabilized.
At the Board meeting held September 13, 2022, the Board also received updated performance information for the Funds, including updated Lipper peer group ranking information, for various periods ending June 30, 2022.
At the Board meeting held September 13, 2022, the Trustees determined that the investment performance of the Funds was acceptable.
(3) The costs of services to be provided and profits to be realized by the Manager and its affiliates from the relationship with the Funds. The Board considered that the Manager receives an advisory fee from each of the Funds. The Manager reported that for the three MVP Fusion Funds the advisory fee paid put these Funds in the 13th percentile of the customized peer group. The Manager reported that for the four MVP Index Strategy Funds the advisory fee paid put them in the 23rd percentile of the customized peer group, and for the AZL Balanced Index Strategy Fund the advisory fee paid put it in the 7th percentile of the customized peer group. The Manager reported that for the AZL DFA Multi-Strategy Fund, the advisory fee paid was in the 5th percentile. The Manager reported that for the AZL MVP DFA Multi-Strategy, AZL MVP FIAM Multi-Strategy, and AZL MVP T. Rowe Price Capital Appreciation Plus Funds, the advisory fee paid was in the 1st percentile. (A lower percentile reflects lower fund fees and is better for fund shareholders.) Trustees were provided with information on the total expense ratios of the Funds and other funds in the customized peer groups, and the Manager reported upon the challenges in making peer group comparisons for the Funds. The Board further considered and found that the advisory fee paid to the Manager with respect to each Fund was based on services provided to the Fund that were in addition to, rather than duplicative of, the services provided pursuant to the advisory agreements for the underlying funds in which the Fund invests.
The Manager provided information concerning the profitability of the Manager’s investment advisory activities for the period from 2019 through 2021. The Board recognized that it is difficult to make comparisons of profitability from investment company advisory agreements because comparative information is not generally publicly available and is affected by numerous factors, including the structure of the particular adviser, the types of funds it manages, its business mix, numerous assumptions regarding allocation of expenses and the adviser’s capital structure and cost of capital. In considering profitability information, the Board considered the possible effect of certain fall-out benefits to the Manager and its affiliates. The Board focused on profitability of the Manager’s relationships with the Funds before taxes and distribution expenses. The Board recognized that the Manager should earn a reasonable level of profits for the services it provides to each Fund.
The Board also considered that Wilshire Funds Management (“Wilshire”) serves as a consultant to the Manager in preparing statistical and other factual information for use in the creation and maintenance of the asset allocation models for the AZL MVP Fusion Funds, pursuant to an agreement between the Manager and Wilshire. Wilshire serves as a consultant to the Manager with respect to selecting the AZL MVP Fusion Funds’ underlying funds and the asset allocations among the underlying funds. The Manager, not any Fund, pays a consultant fee to Wilshire.
(4) and (5) The extent to which economies of scale would be realized as the Funds grow, and whether fee levels reflect these economies of scale. The Board noted that the advisory fee schedules for the Funds do not contain breakpoints that reduce the fee rate on assets above specified levels. The Board recognized that breakpoints may be an appropriate way for the Manager to share its economies of scale, if any, with Funds that have substantial assets. The Board found there was no uniform methodology for establishing breakpoints
18
that give effect to Fund-specific services provided by the Manager. The Board noted that in the fund industry as a whole, as well as among funds similar to the Funds, there is no uniformity or pattern in the fees and asset levels at which breakpoints (if any) apply. Depending on the age, size, and other characteristics of a particular fund and its manager’s cost structure, different conclusions can be drawn as to whether there are economies of scale to be realized at any particular level of assets, notwithstanding the intuitive conclusion that such economies exist, or will be realized at some level of total assets. Moreover, because different managers have different cost structures and service models, it is difficult to draw meaningful conclusions from the breakpoints that may have been adopted by other funds. The Board also noted that the advisory agreements for many funds do not have breakpoints at all, or if breakpoints exist, they may be at asset levels significantly greater than those of the individual Funds. The Board noted that the total assets in all of the Funds, as of June 30, 2022, were approximately $8.2 billion and that the largest Fund, the AZL MVP Growth Index Strategy Fund, had assets of approximately $2.1 billion.
The Board noted that the Manager has agreed to temporarily limit Fund expenses under the Expense Limitation Agreement, which has the effect of reducing expenses similar to implementation of advisory fee breakpoints. The Manager has committed to continue to consider the continuation of expense limits and/or advisory fee breakpoints as Fund assets change. The Board receives quarterly reports on the level of Fund assets. The Board expects to continue to consider: (a) the extent to which economies of scale have been realized, and (b) whether the advisory fee should be modified, either in connection with the next renewal of the Management Agreement or by modifying the Expense Limitation Agreement, to reflect such economies of scale, if any.
Having taken these factors into account, the Board concluded that the absence of breakpoints in the Funds’ advisory fee rate schedules was acceptable under each Fund’s circumstances.
In conclusion, after full consideration of the above factors, as well as such other factors as each member of the Board considered instructive in evaluating the Management Agreement, the Board concluded that the advisory fees were reasonable, and that the continuation of the Management Agreement was in the best interest of the Funds.
19
Information about the Board of Trustees and Officers (Unaudited)
The Trust is managed by the Trustees in accordance with the laws of the state of Delaware governing business trusts. In addition to serving on the Board of Trustees of the Trust, each Trustee serves on the Board of the Allianz Variable Insurance Products Trust (“VIP Trust”) and the AIM ETF Products Trust (“ETF Trust”) (collectively, the Trust, the VIP Trust, and ETF Trust are the “AIM Complex”). There are currently seven Trustees, one of whom is an “interested person” of the Trust within the meaning of that term under the 1940 Act. The Trustees and Officers of the Trust, and their addresses, years of birth, their positions held with the Trust, their terms of office with the Trust and length of time served, their principal occupation(s) during the past five years, the number of portfolios in the Trust they oversee, and their other directorships held during the past five years are as follows:
Independent Trustees(1)
| Name, Address, and Birth Year | Positions Held with AIM Complex | Term of Office(2)/Length of Time Served | Principal Occupation(s) During Past 5 Years | Number of for the AIM | Other Complex 5 Years | |||||
Peggy L. Ettestad (1957) 5701 Golden Hills Drive Minneapolis, MN 55416 | Lead Independent Trustee | Since 10/14 (Trustee since 2/07) | Managing Director, Red Canoe Management Consulting LLC, 2008 to present | 50 | None | |||||
Tamara Lynn Fagely (1958) 5701 Golden Hills Drive Minneapolis, MN 55416 | Trustee | Since 12/17 | Retired; previously, Chief Operations Officer, Hartford Funds, 2012 to 2013 | 50 | Diamond Hill Funds (10 Funds) | |||||
Richard H. Forde (1953) 5701 Golden Hills Drive Minneapolis, MN 55416 | Trustee | Since 12/17 | Retired; previously, Member of the Board and Chairman of the Finance and Investment Committee, Connecticut Water Service, Inc., 2013 to 2019 | 50 | Connecticut Water Service, Inc. | |||||
Jack Gee (1959) 5701 Golden Hills Drive Minneapolis, MN 55416 | Trustee | Since 1/22 (Consultant to the Independent Trustees since 2/20)(3) | Retired; previously, Managing Director, BlackRock, Inc., Treasurer and Chief Financial Officer U.S. iShares, 2004 to 2019 | 50 | Engine No. 1 ETF Trust (2 Funds); Esoterica Thematic Trust (2019 - 2020) | |||||
Claire R. Leonardi (1955) 5701 Golden Hills Drive Minneapolis, MN 55416 | Trustee | Since 2/04 | Retired; previously, CEO, Health eSense Inc. (a medical device company), 2015 to 2018, and Connecticut Innovations, Inc. (a venture capital firm), 2012 to 2015 | 50 | None | |||||
Dickson W. Lewis (1948) 5701 Golden Hills Drive Minneapolis, MN 55416 | Trustee | Since 2/04 | Retired; previously, senior executive for Lifetouch National School Studios (a photography company), 2006 to 2014, Jostens (a producer of year books and class rings), 2001 to 2006, and Fortis Financial Group, 1997 to 2001 | 50 | None | |||||
20
Interested Trustee(4)
| Name, Address, and Birth Year | Positions Complex | Term of Office(2)/Length of Time Served | Principal Occupation(s) During Past 5 Years | Number of for the AIM | Other Directorships Held Outside of the AIM Complex During Past 5 Years | |||||
Brian Muench (1970) 5701 Golden Hills Drive Minneapolis, MN 55416 | Trustee | Since 6/11 | President, Allianz Investment Management LLC, 2010 to present; Vice President, Allianz Life, 2011 to present | 50 | None | |||||
| (1) | Each of the Independent Trustees is a member of the Audit Committee. |
| (2) | Indefinite. |
| (3) | Prior to January 1, 2022, Mr. Gee served as a consultant to the Independent Trustees since February 2020, during which he attended meetings of the Board and its standing committees, including the audit committee, solely in his capacity as a consultant, and was not entitled to vote. |
| (4) | Is an “interested person,” as defined by the 1940 Act, due to employment by Allianz Life and the Manager. |
Officers
| Name, Address, and Birth Year | Positions Held with AIM Complex | Term of Office(1)/ Length of Time Served | Principal Occupation(s) During Past 5 Years | |||
Brian Muench (1970) 5701 Golden Hills Drive Minneapolis, MN 55416 | President | Since 11/10 | President, Allianz Investment Management LLC, November 2010 to present; Vice President, Allianz Life, 2011 to present. | |||
Erik Nelson (1972) 5701 Golden Hills Drive Minneapolis, MN 55416 | Secretary | Since 12/20 | Chief Legal Officer, Allianz Investment Management LLC; Associate General Counsel, Senior Counsel, Allianz Life, 2008 to present. | |||
Bashir C. Asad (1963) Citi Fund Services Ohio, Inc. 4400 Easton Commons, Suite 200 Columbus, OH 43219 | Treasurer, Principal Accounting Officer and Principal Financial Officer | Since 06/16 | Senior Vice President, Citi Fund Services Ohio, Inc., 2011 to present. | |||
Chris R. Pheiffer (1968) 5701 Golden Hills Drive Minneapolis, MN 55416 | Chief Compliance Officer(2) and Anti-Money Laundering Compliance Officer | Since 02/14 | Chief Compliance Officer of the Trust and the VIP Trust, 2014 to present, and the ETF Trust, 2020 to present. | |||
Michael Tanski (1970) 5701 Golden Hills Drive Minneapolis, MN 55416 | Vice President | Since 04/09 | Assistant Vice President, Allianz Investment Management LLC, 2013 to present. | |||
| (1) | Indefinite. |
| (2) | The Manager and the Trust are parties to a Compliance Services Agreement under which the Manager provides an employee of the Manager or one of its affiliates to act as the Trust’s Chief Compliance Officer. |
The Fund’s Statement of Additional Information (“SAI”) contains additional information about the Trust’s Trustees and Officers. The SAI is available without charge, upon request, by calling toll-free 800-624-0197 or at https://www.allianzlife.com.
21

The Allianz VIP Fund of Funds are distributed by Allianz Life Financial Services, LLC.
These Funds are not FDIC Insured.
ANNRPT1222 02/23
AZL® MVP Growth Index Strategy Fund
Annual Report
December 31, 2022

This report is submitted for the general information of the shareholder of the Fund. The report is not authorized for distribution to prospective investors in the Fund unless preceded or accompanied by an effective prospectus, which contains details concerning the sales charges and other pertinent information.
Allianz Investment Management LLC serves as the Manager for the AZL® MVP Growth Index Strategy Fund.
What factors affected the Fund’s performance during the year ended December 31, 2022?*
For the year ended December 31, 2022, the AZL® MVP Growth Index Strategy Fund (the “Fund”) returned (15.10)%. That compared to (18.11)%, (13.01)% and (16.71)% total return for its benchmarks, the S&P 500 Index, the Bloomberg U.S. Aggregate Bond Index, and the Growth Composite Index, respectively.1
The Fund is a fund of funds that pursues broad diversification across four underlying equity portfolios and one fixed income sub-portfolio. The four equity sub-portfolios pursue passive strategies that aim to achieve, before fees, returns similar to the S&P 500 Index, the S&P MidCap 400 Index2, the S&P SmallCap 600 Index3 and the MSCI EAFE Index4. The fixed-income sub-portfolio is an enhanced bond index strategy that seeks to achieve a return that exceeds that of the Bloomberg U.S. Aggregate Bond Index. Generally, the Fund allocates 65% to 85% of its assets to the underlying equity index funds and 15% to 35% of its assets to the underlying fixed income fund.
The Fund also employs the MVP (Managed Volatility Portfolio) risk management process, which is intended to adjust the risk of the portfolio based on quantitative indicators of market risk, such as the current level of fund and market volatility.
Domestic equities began the year at near all-time highs, but began to decline early in 2022 due to a combination of rising inflation and geopolitical uncertainties. The Federal Reserve (the Fed) shifted to a more hawkish policy approach in an attempt to bring inflation under control, as did many global central banks. The Fed increased the federal funds rate multiple times throughout the year for a combined total of 425 basis points. Russia’s invasion of Ukraine also weighed on global markets, although European countries were particularly hard hit due to their geographic proximity to the conflict and reliance on Russian commodities such as energy and wheat.
Despite strong labor rates throughout developed markets, high inflation and an anticipated economic slowdown had a negative effect on investor sentiment for the year under review. The S&P 500 declined as company valuations struggled under the higher interest rate environment. Investors grew risk averse as fears of an economic recession loomed, selling off equity positions to avoid the volatility in equity markets. By the end of the period under review, U.S. equities had experienced their worst year since the Great Financial Crisis of 2008, and international equities performed only slightly better.
The Fed’s actions made short-term financing more expensive, and the U.S. Treasury yield curve ultimately inverted with 2-year Treasuries yielding more than 10-year Treasuries by 0.55% at the end of 2022. The monetary tightening generated headwinds for domestic fixed income markets as investors demanded higher yields to account for rising rates. Widening
credit spreads further weighed on prices on lower-quality bonds as investors demanded to be compensated for rising credit risks. Nearly all fixed income sectors finished the year with negative performance.
The Fund, which invests in both U.S. and international markets, outperformed its composite benchmark during the 12-month period. Its off-benchmark allocation to developed market non-U.S. equities contributed to performance, as these outpaced U.S. equities. In addition, the Fund’s performance compared to the composite benchmark was positively affected by its allocation to mid- and small-cap U.S. equities, which outpaced their large-cap counterparts.
The fixed income allocation detracted slightly from the Fund’s performance relative to its benchmark largely due to the underlying fund’s fees. However, the Fund’s fixed income allocation benefited from security selection, particularly in mortgage-backed securities and investment-grade credit. Allocation to Treasury Inflation Protected Securities (TIPS) also contributed to the Fund’s performance.
The MVP risk management process utilizes derivatives in an effort to control portfolio volatility in unstable market conditions. Market volatility was relatively high during 2022, therefore the MVP process was engaged and reduced the Fund’s equity exposure at multiple points during the year. The MVP Process did contribute to the Fund’s performance during 2022.
Past performance does not guarantee future results.
| * | The Fund’s portfolio composition is subject to change. There is no guarantee that any sectors mentioned will continue to perform as described or that securities in such sectors will be held by the Fund in the future. The information contained in this commentary is for informational purposes only and should not be construed as a recommendation to purchase or sell securities in the sector mentioned. The Fund’s holdings and weightings are as of December 31, 2022. |
| 1 | For a complete description of the Fund’s performance benchmarks please refer to page 2 of this report. |
| 2 | The Standard & Poor’s MidCap 400 Index (“S&P 400”) is a widely used index for mid-sized companies. The S&P 400 covers 7% of the U.S. equities market, and is part of a series of S&P U.S. indexes that can be used as building blocks for portfolio composition.. |
| 3 | The Standard & Poor’s SmallCap 600 Index (“S&P 600”) covers approximately 3% of the domestic equities market. Measuring the small-cap segment of the market that is typically renowned for poor trading liquidity and financial instability, the index is designed to be an efficient portfolio of companies that meet specific inclusion criteria to ensure that they are investable and financially viable. |
| 4 | The Morgan Stanley Capital International, Europe, Australasia and Far East (“MSCI EAFE”) Index is a free float-adjusted market capitalization-weighted index that is designed to measure the equity market performance of developed markets, excluding the U.S. & Canada. |
The indexes defined above are unmanaged. Investors cannot invest directly in an index.
1
AZL® MVP Growth Index Strategy Fund Review (Unaudited) |
Fund Objective
The Fund’s investment objective is to seek long-term capital appreciation. This objective may be changed by the Trustees of the Fund without shareholder approval. The Fund seeks to achieve its objective by investing in a combination of Index Strategy Underlying Funds that represent different classes in the Fund’s asset allocation.
Investment Concerns
The Fund invests in underlying funds, so its investment performance is directly related to the performance of those underlying funds. Before investing, investors should assess the risks associated with and types of investments made by each of the underlying funds in which the Fund invests.
Quantitative investing involves risk that the values of securities selected in the quantitative analysis can react differently than the market or securities selected using fundamental analysis.
Stocks are more volatile and carry more risk and return potential than other forms of investments.
International investing may involve risk of capital loss from unfavorable fluctuations in currency values, from differences in generally accepted accounting principles or from economic or political instability in other nations.
Small- to mid-capitalization companies typically have a higher risk of failure and historically have experienced a greater degree of volatility.
The performance of the underlying funds is expected to be lower than that of the Indexes because of fees and expenses. Securities in which the underlying funds will invest may involve substantial risk and may be subject to sudden severe price declines.
Investing in a single industry or sector, or concentrating investments in a limited number of industries or sectors, tends to increase the risk that economic, political, or regulatory developments affecting certain industries or sectors will have a large impact on the value of the portfolio.
Bonds offer a relatively stable level of income, although bond prices will fluctuate, providing the potential for principal gain or loss.
Mortgage-backed investments involve risk of loss due to prepayments and, like any bond, due to default. Because of the sensitivity of mortgage-related securities to changes in interest rates, an underlying fund’s performance may be more volatile than if it did not hold these securities.
Debt securities held by an underlying fund may decline in value due to rising interest rates.
Investing in derivative instruments involves risks that may be different from or greater than the risk associated with investing directly in securities or other traditional instruments.
For a complete description of these and other risks associated with investing in the Fund, please refer to the Fund’s prospectus.
Growth of $10,000 Investment

The chart above represents a comparison of a hypothetical investment in the Fund versus a similar investment in the Fund’s benchmarks and represents the reinvestment of dividends and capital gains in the Fund.
| Average Annual Total Returns as of December 31, 2022 | ||||||||||||||||||||
| 1 Year | 3 Years | 5 Years | 10 Years | |||||||||||||||||
AZL® MVP Growth Index Strategy Fund | (15.10 | )% | 1.15 | % | 3.14 | % | 6.31 | % | ||||||||||||
Bloomberg U.S. Aggregate Bond Index | (13.01 | )% | (2.71 | )% | 0.02 | % | 1.06 | % | ||||||||||||
Growth Composite Index | (16.71 | )% | 5.46 | % | 7.40 | % | 9.83 | % | ||||||||||||
S&P 500 Index | (18.11 | )% | 7.66 | % | 9.42 | % | 12.56 | % | ||||||||||||
Past performance does not guarantee future results. The performance data quoted represents past performance and current returns may be lower or higher. The investment return and principal value will fluctuate so that an investor’s shares, when redeemed, may be worth more or less than the original cost. To obtain performance information current to the most recent month end, please visit www.Allianzlife.com.
| Expense Ratio | Gross | ||||
AZL® MVP Growth Index Strategy Fund | 0.68 | % | |||
The above expense ratio is based on the current Fund prospectus dated April 29, 2022. The Manager and the Fund have entered into a written contract limiting operating expenses, excluding certain expenses (such as interest expense and acquired fund fees and expenses), to 0.20% through April 30, 2024. Additional information pertaining to the December 31, 2022 expense ratio can be found in the Financial Highlights.
Acquired fund fees and expenses are incurred indirectly by the Fund through the valuation of the Fund’s investments in the permitted Underlying Funds. Accordingly, acquired fund fees and expenses affect the Fund’s total returns. Because these fees and expenses are not included in the Fund’s financial highlights, the Fund’s total annual fund operating expenses, as shown in the current prospectus, do not correlate to the ratios of expenses to average net assets shown in the Financial Highlights. Without acquired fund fees and expenses the Fund’s gross expense ratio would be 0.12%.
The total return of the Fund does not reflect the effect of any insurance charges, the annual maintenance fee or the deduction of taxes that a shareholder would pay on Fund distributions or the redemption of Fund shares. Such charges, fees and tax payments would reduce the performance quoted.
The Fund’s performance is measured against the Standard & Poor’s 500 Index (“S&P 500”), the Bloomberg U.S. Aggregate Bond Index and the Growth Composite Index (“Composite”). The S&P 500 is representative of 500 selected common stocks, most of which are listed on the New York Stock Exchange, and is a measure of the U.S. Stock market as a whole. The Bloomberg U.S. Aggregate Bond Index is a market value-weighted performance benchmark for investment-grade fixed-rate debt issues, including government, corporate, asset-backed, and mortgage-backed securities, with maturities of at least one year. The Composite is a blended index comprised of (75%) S&P 500 and (25%) Bloomberg U.S. Aggregate Bond Index. These indexes are unmanaged and do not reflect the deduction of fees associated with a mutual fund, such as investment management and fund accounting fees. The Fund’s performance reflects the deduction of fees for services provided to the Fund. Investors cannot invest directly in an index.
2
AZL MVP Growth Index Strategy Fund
(Unaudited)
As a shareholder of the AZL MVP Growth Index Strategy Fund (the “Fund”), you incur ongoing costs, including management fees, distribution fees, and other Fund expenses. These examples are intended to help you understand your ongoing costs (in dollars) of investing in the Fund and to compare these costs with the ongoing costs of investing in other mutual funds. Please note that the expenses shown in each table do not reflect expenses that apply to the subaccount or the insurance contract. If the expenses that apply to the subaccount or the insurance contract were included, your costs would have been higher.
These examples are based on an investment of $1,000 invested at the beginning of the period and held for the periods presented below.
The Actual Expense table below provides information about actual account values and actual expenses. You may use the information below, together with the amount you invested, to estimate the expenses that you paid over the period. Simply divide your account value by $1,000 (for example, an $8,600 account value divided by $1,000 = 8.6), then multiply the result by the number in the table under the heading entitled “Expenses Paid During Period” to estimate the expenses you paid on your account during this period.
| Beginning Account Value 7/1/22 | Ending Account Value | Expenses Paid During Period 7/1/22 - 12/31/22* | Annualized Expense Ratio During Period 7/1/22 - 12/31/22 | |||||||||||||||||
AZL MVP Growth Index Strategy Fund | $ | 1,000.00 | $ | 1,012.50 | $ | 0.61 | 0.12 | % | ||||||||||||
The Hypothetical Expense table below provides information about hypothetical account values and hypothetical expenses based on the Fund’s actual expense ratio and an assumed rate of return of 5% per year before expenses, which is not the Fund’s actual return. The hypothetical account values and expenses may not be used to estimate the actual ending account balance or expenses you paid for the period. You may use this information to compare this 5% hypothetical example with the 5% hypothetical examples that appear in the shareholder reports of other funds.
| Beginning Account Value 7/1/22 | Ending Account Value | Expenses Paid During Period 7/1/22 - 12/31/22* | Annualized Expense Ratio During Period 7/1/22 - 12/31/22 | |||||||||||||||||
AZL MVP Growth Index Strategy Fund | $ | 1,000.00 | $ | 1,024.60 | $ | 0.61 | 0.12 | % | ||||||||||||
| * | Expenses are equal to the average account value multiplied by the Fund’s annualized expense ratio multiplied by 184/365 (the number of days in the most recent fiscal half-year divided by the number of days in the fiscal year). |
Portfolio Composition
(Unaudited)
| Investments | Percent of Net Assets | |||
Domestic Equity Funds | 51.8 | % | ||
Fixed Income Fund | 23.4 | |||
International Equity Fund | 19.1 | |||
Unaffiliated Investment Company | 1.0 | |||
|
| |||
Total Investment Securities | 95.3 | |||
Net other assets (liabilities) | 4.7 | |||
|
| |||
Net Assets | 100.0 | % | ||
|
| |||
3
AZL MVP Growth Index Strategy Fund
Schedule of Portfolio Investments
December 31, 2022
| Shares | Value | |||||
Affiliated Investment Companies (94.3%): | ||||||
Domestic Equity Funds (51.8%): | ||||||
| 11,318,375 | AZL Mid Cap Index Fund, Class 2 | $ | 216,973,253 | |||
| 41,560,050 | AZL S&P 500 Index Fund, Class 2 | 704,027,251 | ||||
| 9,173,868 | AZL Small Cap Stock Index Fund, Class 2 | 104,857,311 | ||||
|
| |||||
| 1,025,857,815 | ||||||
|
| |||||
| Fixed Income Fund (23.4%): | ||||||
| 48,945,266 | AZL Enhanced Bond Index Fund | 464,001,120 | ||||
|
| |||||
| International Equity Fund (19.1%): | ||||||
| 24,872,729 | AZL International Index Fund, Class 2 | 379,557,841 | ||||
|
| |||||
Total Affiliated Investment Companies | 1,869,416,776 | |||||
|
| |||||
| (a) | The rate represents the effective yield at December 31, 2022. |
| (b) | See Federal Tax Information listed in the Notes to the Financial Statements. |
Percentages indicated are based on net assets as of December 31, 2022
| Shares | Value | |||||
Unaffiliated Investment Company (1.0%): | ||||||
Money Markets (1.0%): | ||||||
| 20,671,377 | Dreyfus Treasury Securities Cash Management Fund, Institutional Shares, 3.90%(a) | $ | 20,671,377 | |||
|
| |||||
Total Unaffiliated Investment Company | 20,671,377 | |||||
|
| |||||
Total Investment Securities | 1,890,088,153 | |||||
Net other assets (liabilities) — 4.7% | 92,399,064 | |||||
|
| |||||
Net Assets — 100.0% | $ | 1,982,487,217 | ||||
|
| |||||
Futures Contracts
At December 31, 2022, the Fund’s open futures contracts were as follows:
Long Futures
| Description | Expiration Date | Number of Contracts | Notional Amount | Value and Unrealized Appreciation/ (Depreciation) | ||||||||||||
S&P 500 Index E-Mini March Futures (U.S. Dollar) | 3/17/23 | 34 | $ | 6,563,700 | $ | 149 | ||||||||||
U.S. Treasury 10-year Note March Futures (U.S. Dollar) | 3/22/23 | 257 | 28,860,297 | (288,228 | ) | |||||||||||
|
| |||||||||||||||
| $ | (288,079 | ) | ||||||||||||||
|
| |||||||||||||||
See accompanying notes to the financial statements.
4
AZL MVP Growth Index Strategy Fund
Statement of Assets and Liabilities
December 31, 2022
Assets: | |||||
Investments in non-affiliates, at cost | $ | 20,671,377 | |||
Investments in affiliates, at cost | 1,707,295,973 | ||||
|
| ||||
Investments in non-affiliates, at value | 20,671,377 | ||||
Investments in affiliates, at value | $ | 1,869,416,776 | |||
Cash | 107,116 | ||||
Deposit at broker for futures contracts collateral | 92,275,497 | ||||
Interest and dividends receivable | 327,755 | ||||
Receivable for affiliated investments sold | 1,072,415 | ||||
Prepaid expenses | 17,973 | ||||
|
| ||||
Total Assets | 1,983,888,909 | ||||
|
| ||||
Liabilities: | |||||
Payable for capital shares redeemed | 908,993 | ||||
Payable for variation margin on futures contracts | 240,443 | ||||
Management fees payable | 170,747 | ||||
Administration fees payable | 10,759 | ||||
Custodian fees payable | 2,230 | ||||
Administrative and compliance services fees payable | 5,356 | ||||
Transfer agent fees payable | 855 | ||||
Trustee fees payable | 13,381 | ||||
Other accrued liabilities | 48,928 | ||||
|
| ||||
Total Liabilities | 1,401,692 | ||||
|
| ||||
Net Assets | $ | 1,982,487,217 | |||
|
| ||||
Net Assets Consist of: | |||||
Paid in capital | $ | 1,967,980,181 | |||
Total distributable earnings | 14,507,036 | ||||
|
| ||||
Net Assets | $ | 1,982,487,217 | |||
|
| ||||
Shares of beneficial interest (unlimited number of shares authorized, no par value) | 158,600,352 | ||||
Net Asset Value (offering and redemption price per share) | $ | 12.50 | |||
|
| ||||
For the Year Ended December 31, 2022
Investment Income: | |||||
Dividends from affiliates | $ | 29,880,875 | |||
Interest | 1,593,962 | ||||
Dividends from non-affiliates | 18,745 | ||||
|
|
| |||
Total Investment Income | 31,493,582 | ||||
|
|
| |||
Expenses: | |||||
Management fees | 2,186,853 | ||||
Administration fees | 80,797 | ||||
Custodian fees | 9,885 | ||||
Administrative and compliance services fees | 30,392 | ||||
Transfer agent fees | 6,347 | ||||
Trustee fees | 121,387 | ||||
Professional fees | 102,788 | ||||
Shareholder reports | 45,895 | ||||
Other expenses | 33,579 | ||||
|
|
| |||
Total expenses | 2,617,923 | ||||
|
|
| |||
Net Investment Income/(Loss) | 28,875,659 | ||||
|
|
| |||
Net realized and Change in net unrealized gains/losses on investments: | |||||
Net realized gains/(losses) on affiliated underlying funds | 19,348,268 | ||||
Net realized gains distributions from affiliated underlying funds | 172,808,681 | ||||
Net realized gains/(losses) on futures contracts | (1,939,966 | ) | |||
Change in net unrealized appreciation/depreciation on affiliated underlying funds | (606,773,574 | ) | |||
Change in net unrealized appreciation/depreciation on futures contracts | (2,046,151 | ) | |||
|
|
| |||
Net realized and Change in net unrealized gains/losses on investments | (418,602,742 | ) | |||
|
|
| |||
Change in Net Assets Resulting From Operations | $ | (389,727,083 | ) | ||
|
|
|
See accompanying notes to the financial statements.
5
AZL MVP Growth Index Strategy Fund
Statements of Changes in Net Assets
For the Year Ended | For the Year Ended | |||||||||
Change In Net Assets: | ||||||||||
Operations: | ||||||||||
Net investment income/(loss) | $ | 28,875,659 | $ | 21,820,473 | ||||||
Net realized gains/(losses) on investments | 190,216,983 | 208,301,547 | ||||||||
Change in unrealized appreciation/depreciation on investments | (608,819,725 | ) | 170,625,447 | |||||||
|
|
|
| |||||||
Change in net assets resulting from operations | (389,727,083 | ) | 400,747,467 | |||||||
|
|
|
| |||||||
Distributions to Shareholders: | ||||||||||
Distributions | (229,168,242 | ) | (239,202,740 | ) | ||||||
|
|
|
| |||||||
Change in net assets resulting from distributions to shareholders | (229,168,242 | ) | (239,202,740 | ) | ||||||
|
|
|
| |||||||
Capital Transactions: | ||||||||||
Proceeds from shares issued | 4,917,148 | 9,801,680 | ||||||||
Proceeds from dividends reinvested | 229,168,242 | 239,202,741 | ||||||||
Value of shares redeemed | (274,271,436 | ) | (347,022,760 | ) | ||||||
|
|
|
| |||||||
Change in net assets resulting from capital transactions | (40,186,046 | ) | (98,018,339 | ) | ||||||
|
|
|
| |||||||
Change in net assets | (659,081,371 | ) | 63,526,388 | |||||||
Net Assets: | ||||||||||
Beginning of period | 2,641,568,588 | 2,578,042,200 | ||||||||
|
|
|
| |||||||
End of period | $ | 1,982,487,217 | $ | 2,641,568,588 | ||||||
|
|
|
| |||||||
Share Transactions: | ||||||||||
Shares issued | 320,462 | 583,609 | ||||||||
Dividends reinvested | 19,002,342 | 15,139,414 | ||||||||
Shares redeemed | (19,312,786 | ) | (20,645,029 | ) | ||||||
|
|
|
| |||||||
Change in shares | 10,018 | (4,922,006 | ) | |||||||
|
|
|
| |||||||
See accompanying notes to the financial statements.
6
AZL MVP Growth Index Strategy Fund
(Selected data for a share of beneficial interest outstanding throughout the periods indicated. Does not reflect fees or expenses associated with the separate accounts that invest in the Fund or in any variable annuity contracts or variable life insurance policy for which the Fund serves as an investment vehicle.)
| Year Ended December 31, 2022 | Year Ended December 31, 2021 | Year Ended December 31, 2020 | Year Ended December 31, 2019 | Year Ended December 31, 2018 | ||||||||||||||||
Net Asset Value, Beginning of Period | $16.66 | $15.77 | $16.02 | $13.99 | $15.56 | |||||||||||||||
|
|
|
|
|
|
|
|
|
| |||||||||||
Investment Activities: | ||||||||||||||||||||
Net Investment Income/(Loss) | 0.19 | (a) | 0.14 | (a) | 0.26 | (a) | 0.26 | (a) | 0.26 | |||||||||||
Net Realized and Unrealized Gains/(Losses) on Investments | (2.76 | ) | 2.36 | 0.42 | 2.55 | (1.22 | ) | |||||||||||||
|
|
|
|
|
|
|
|
|
| |||||||||||
Total from Investment Activities | (2.57 | ) | 2.50 | 0.68 | 2.81 | (0.96 | ) | |||||||||||||
|
|
|
|
|
|
|
|
|
| |||||||||||
Distributions to Shareholders From: | ||||||||||||||||||||
Net Investment Income | (0.26 | ) | (0.30 | ) | (0.29 | ) | (0.35 | ) | (0.13 | ) | ||||||||||
Net Realized Gains | (1.33 | ) | (1.31 | ) | (0.64 | ) | (0.43 | ) | (0.48 | ) | ||||||||||
|
|
|
|
|
|
|
|
|
| |||||||||||
Total Dividends | (1.59 | ) | (1.61 | ) | (0.93 | ) | (0.78 | ) | (0.61 | ) | ||||||||||
|
|
|
|
|
|
|
|
|
| |||||||||||
Net Asset Value, End of Period | $12.50 | $16.66 | $15.77 | $16.02 | $13.99 | |||||||||||||||
|
|
|
|
|
|
|
|
|
| |||||||||||
Total Return (b) | (15.10 | )% | 16.40 | % | 4.73 | % | 20.52 | % | (6.45 | )% | ||||||||||
Ratios to Average Net Assets/Supplemental Data: | ||||||||||||||||||||
Net Assets, End of Period (000’s) | $1,982,487 | $2,641,569 | $2,578,042 | $2,722,348 | $2,423,165 | |||||||||||||||
Net Investment Income/(Loss) | 1.32 | % | 0.82 | % | 1.76 | % | 1.67 | % | 1.71 | % | ||||||||||
Expenses Before Reductions*(c) | 0.12 | % | 0.12 | % | 0.12 | % | 0.12 | % | 0.12 | % | ||||||||||
Expenses Net of Reductions* | 0.12 | % | 0.12 | % | 0.12 | % | 0.12 | % | 0.12 | % | ||||||||||
Portfolio Turnover Rate | 10 | % | 6 | % | 12 | % | 5 | % | 4 | % | ||||||||||
| * | The expense ratios exclude the impact of fees/expenses paid by each underlying fund. |
| (a) | Calculated using the average shares method. |
| (b) | The returns include reinvested dividends and fund level expenses, but exclude insurance contract charges. If these charges were included, the returns would have been lower. |
| (c) | Excludes fee reductions. If such fee reductions had not occurred, the ratios would have been as indicated. |
See accompanying notes to the financial statements.
7
AZL MVP Growth Index Strategy Fund
Notes to the Financial Statements
December 31, 2022
1. Organization
The Allianz Variable Insurance Products Fund of Funds Trust (the “Trust”) was organized as a Delaware statutory trust on June 16, 2004. The Trust is an open-end management investment company registered under the Investment Company Act of 1940, as amended, (the “1940 Act”) and thus is determined to be an investment company, and follows the investment company accounting and reporting guidance under Financial Accounting Standards Board (“FASB”) Accounting Standards Codification (“ASC”) Topic 946 “Financial Services—Investment Companies”. The Trust consists of 12 separate investment portfolios (collectively, the “Funds”), of which one is included in this report, the AZL MVP Growth Index Strategy Fund (the “Fund”), and 11 are presented in separate reports. The Fund is a diversified series of the Trust.
The Fund is a “fund of funds”, which means that the Fund invests primarily in other mutual funds (the “Underlying Funds”). Underlying Funds invest in stocks, bonds, and other securities and reflect varying amounts of potential investment risk and reward. The Underlying Funds record their investments at fair value. Periodically, the Fund will adjust its asset allocation as it seeks to achieve its investment objective.
The Trust is authorized to issue an unlimited number of shares of the Fund without par value. Shares of the Fund are available through the variable annuity contracts offered through the separate accounts of participating insurance companies. Currently, the Fund only offers its shares to separate accounts of Allianz Life Insurance Company of North America and Allianz Life Insurance Company of New York, affiliates of the Trust and the Manager, as defined below.
Under the Trust’s organizational documents, its officers and trustees are indemnified against certain liabilities arising out of the performance of their duties to the Fund. In addition, in the normal course of business, the Fund may enter into contracts with its vendors and others that provide for general indemnifications. The Fund’s maximum exposure under these arrangements is unknown, as this would involve future claims that may be made against the Fund. However, based on experience, the Fund expects that risk of loss to be remote.
2. Significant Accounting Policies
The following is a summary of significant accounting policies followed by the Fund in the preparation of its financial statements. The policies conform with U.S. generally accepted accounting principles (“U.S. GAAP”). The preparation of financial statements requires management to make certain estimates and assumptions that affect the reported amounts of assets and liabilities and disclosure of contingent assets and liabilities at the date of the financial statements and the reported amounts of increases and decreases in net assets from operations during the reporting period. Actual results could differ from those estimates.
Security Valuation
The Fund records its investments at fair value. Fair value is defined as the price that would be received to sell an asset or paid to transfer a liability in an orderly transaction between willing market participants at the measurement date. The valuation techniques used to determine fair value are further described in Note 4 below.
Investment Transactions and Investment Income
Investment transactions are accounted for on trade date. Net realized gains and losses on investments sold and on foreign currency transactions are recorded on the basis of identified cost. Interest income is recorded on the accrual basis and includes, where applicable, the amortization of premiums or accretion of discounts. Dividend income is recorded on the ex-dividend date except in the case of foreign securities, in which case dividends are recorded as soon as such information becomes available.
Distributions to Shareholders
Distributions to shareholders are recorded on the ex-dividend date. The Fund distributes its dividends from net investment income and net realized capital gains, if any, on an annual basis. The amount of distributions from net investment income and from net realized gains is determined in accordance with federal income tax regulations, which may differ from U.S. GAAP. These “book/tax” differences are either temporary or permanent in nature. To the extent these differences are permanent in nature (e.g., return of capital, net operating loss, reclassification of certain market discounts, gain/loss, paydowns, and distributions), such amounts are reclassified within the composition of net assets based on their federal tax-basis treatment; temporary differences (e.g., wash sales and differing treatment on certain investments) do not require reclassification. Distributions to shareholders that exceed net investment income and net realized gains for tax purposes are reported as distributions of capital.
Expense Allocation
Expenses directly attributable to the Fund are charged directly to the Fund, while expenses attributable to more than one Fund are allocated among the respective Funds based upon relative net assets or some other reasonable method. Expenses which are attributable to more than one Trust are allocated across the Allianz Variable Insurance Products Trust, Allianz Variable Insurance Products Fund of Funds Trust and AIM ETF Products Trust based upon relative net assets or another reasonable basis. Allianz Investment Management LLC (the “Manager”), serves as the investment manager for the Trust, Allianz Variable Insurance Products Trust and AIM ETF Products Trust.
This report does not reflect fees or expenses associated with the separate accounts that invest in the Fund or in any variable annuity contracts or variable life insurance policy for which the Fund serves as an investment vehicle.
Affiliated Securities Transactions
Pursuant to Rule 17a-7 under the 1940 Act, the Fund may engage in securities transactions with affiliated investment companies and advisory accounts managed by the Manager. Any such purchase or sale transaction must be effected without a brokerage commission or other remuneration, except for customary transfer fees. The transaction must be effected at the current market price, which is either the security’s last sale price on an exchange or, if there are no transactions in the security that day, at the average of the highest bid and lowest asked price. During the year ended December 31, 2022, the Fund did not engage in any Rule 17a-7 transactions.
8
AZL MVP Growth Index Strategy Fund
Notes to the Financial Statements
December 31, 2022
Derivative Instruments
All open derivative positions at period end are reflected on the Fund’s Schedule of Portfolio Investments. The following is a description of the derivative instruments utilized by the Fund, including the primary underlying risk exposures related to each instrument type. The Fund’s allocation to the MVP (Managed Volatility Portfolio) risk management process may include (a) derivatives such as index futures, other futures contracts, options, and other similar securities and (b) cash, money market equivalents, short-term debt instruments, money market funds, and short-term debt funds to satisfy all applicable margin requirements and to provide additional portfolio liquidity to satisfy large redemptions and any margin calls. Due to the leverage provided by derivatives, the notional value of the Fund’s derivative positions could exceed 20% of the Fund’s value. The Fund may also use futures to gain equity exposure and may hold cash as a buffer in the event of market shocks.
Futures Contracts
During the year ended December 31, 2022, the Fund invested in futures contracts to reduce volatility and limit the need to decrease or increase allocations to underlying funds. Futures contracts are valued based upon their quoted daily settlement prices. Upon entering into a futures contract, the Fund is required to segregate liquid assets in accordance with the initial margin requirements of the broker or exchange. Futures contracts are marked to market daily and a payable or receivable for the change in value (“variation margin”), if any, is recorded by the Fund. Gains or losses are recognized but not considered realized until the contracts expire or are closed. Futures contracts involve, to varying degrees, elements of market risk (generally equity price risk related to stock futures, interest rate risk related to bond futures, and foreign currency risk related to currency futures) and exposure to loss in excess of the variation margin disclosed in the Statement of Assets and Liabilities. The primary risks associated with the use of futures contracts are the imperfect correlation between the change in value of the underlying securities and the prices of futures contracts, the possibility of an illiquid market, and the inability of the counterparty to meet the terms of the contract. For the year ended December 31, 2022, the monthly average notional amount for long contracts was $36.2 million, and the monthly average notional amount for short contracts was $296.6 million. Realized gains and losses are reported as “Net realized gains/(losses) on futures contracts” on the Statement of Operations.
Summary of Derivative Instruments
The following is a summary of the values of derivative instruments on the Fund’s Statement of Assets and Liabilities, categorized by risk exposure, as of December 31, 2022:
Asset Derivatives | Liability Derivatives | |||||||||||
| Primary Risk Exposure | Statement of Assets and Liabilities Location | Total Value | Statement of Assets and Liabilities Location | Total Value | ||||||||
Equity Risk | ||||||||||||
| Futures Contracts | Receivable for variation margin on futures contracts* | $149 | Payable for variation margin on futures contracts* | $— | ||||||||
Interest Rate Risk | ||||||||||||
| Futures Contracts | Receivable for variation margin on futures contracts* | — | Payable for variation margin on futures contracts* | 288,228 | ||||||||
| * | For futures contracts, the amounts represent the cumulative appreciation/depreciation of these futures contracts as reported in the Schedule of Portfolio Investments. Only the current day’s variation margin, if any, is reported within the Statement of Assets and Liabilities as variation margin on futures contracts. |
The following is a summary of the effect of derivative instruments on the Statement of Operations, categorized by risk exposure, for the year ended December 31, 2022:
| Primary Risk Exposure | Location of Gains/(Losses) on Derivatives Recognized | Realized Gains/(Losses) on Derivatives Recognized | Change in Net Unrealized on Derivatives Recognized | |||||||
Equity Risk | ||||||||||
| Futures Contracts | Net realized gains/(losses) on futures contracts/ Change in net unrealized appreciation/ depreciation on futures contracts | $1,241,673 | $ | (1,424,567) | ||||||
Interest Rate Risk | ||||||||||
| Futures Contracts | Net realized gains/(losses) on futures contracts/ Change in net unrealized appreciation/ depreciation on futures contracts | (3,181,639 | ) | (621,584) | ||||||
3. Fees and Transactions with Affiliates and Other Parties
The Manager provides investment advisory and management services for the Fund. The Manager has contractually agreed to waive fees and reimburse the Fund to limit the annual expenses, excluding interest expense (e.g., cash overdraft fees), taxes, brokerage commissions, acquired fund fees and expenses, other expenditures that are capitalized in accordance with U.S. GAAP and other extraordinary expenses not incurred in the ordinary course of the Fund’s business, based on the daily net assets of the Fund, through April 30, 2024.
Expenses incurred for investment advisory and management services are reflected on the Statement of Operations as “Management fees.”
For the year ended December 31, 2022, the annual rate due to the Manager and the annual expense limit were as follows:
| Annual Rate | Annual Expense Limit | |||||||||
AZL MVP Growth Index Strategy Fund | 0.10 | % | 0.20 | % | ||||||
Any amounts contractually waived or reimbursed by the Manager with respect to the annual expense limit in a particular fiscal year will be subject to repayment by the Fund to the Manager to the extent that from time to time through the next three fiscal years the repayment will not cause the Fund’s expenses to exceed the lesser of the stated limit at the time of the waiver or the current stated limit. Any amounts recouped by the Manager during the period are reflected on the Statement of Operations as “Recoupment of prior expenses reimbursed by the Manager.” At December 31, 2022, there were no remaining contractual reimbursements subject to repayment by the Fund in subsequent years.
9
AZL MVP Growth Index Strategy Fund
Notes to the Financial Statements
December 31, 2022
Management fees, which the Manager may waive in order to maintain more competitive expense ratios, are not subject to repayment in subsequent years. Information on the total amount waived/ reimbursed by the Manager or repaid to the Manager by the Fund during the period can be found on the Statement of Operations, as applicable. During the year ended December 31, 2022, there were no such waivers.
The Manager or an affiliate of the Manager serves as the investment adviser of certain underlying funds in which the Fund invests. At December 31, 2022, these underlying funds are noted as Affiliated Investment Companies in the Fund’s Schedule of Portfolio Investments. Additional information, including financial statements, about these Funds is available at www.allianzlife.com. The Manager or an affiliate of the Manager is paid a separate fee from the underlying funds for such services. A summary of the Fund’s investments in affiliated investment companies for the year ended December 31, 2022 is as follows:
| Value 12/31/21 | Purchases at Cost | Proceeds from Sales | Net Realized Gains (Losses) | Change in Net Unrealized Appreciation (Depreciation) | Value 12/31/22 | Shares as of | Dividend Income | Net Realized Gains Distributions from Affiliated Underlying Funds | |||||||||||||||||||||||||||||||||||||
AZL Enhanced Bond Index Fund | $ | 582,601,042 | $ | 7,723,150 | $ | (39,528,778 | ) | $ | (8,025,602 | ) | $ | (78,768,692 | ) | $ | 464,001,120 | 48,945,266 | $ | 7,454,321 | $ | 268,830 | |||||||||||||||||||||||||
AZL International Index Fund, Class 2 | 511,613,042 | 21,428,857 | (60,381,099 | ) | 2,493,515 | (95,596,474 | ) | 379,557,841 | 24,872,729 | 11,568,079 | 9,860,777 | ||||||||||||||||||||||||||||||||||
AZL Mid Cap Index Fund, Class 2 | 305,093,027 | 48,250,701 | (48,257,592 | ) | 2,868,960 | (90,981,843 | ) | 216,973,253 | 11,318,375 | 1,725,266 | 46,525,436 | ||||||||||||||||||||||||||||||||||
AZL S&P 500 Index Fund, Class 2 | 957,053,324 | 105,007,011 | (83,137,775 | ) | 20,405,470 | (295,300,779 | ) | 704,027,251 | 41,560,050 | 8,181,494 | 96,825,517 | ||||||||||||||||||||||||||||||||||
AZL Small Cap Stock Index Fund, Class 2 | 156,760,310 | 20,279,835 | (27,662,973 | ) | 1,605,925 | (46,125,786 | ) | 104,857,311 | 9,173,868 | 951,715 | 19,328,121 | ||||||||||||||||||||||||||||||||||
|
|
|
|
|
|
|
|
|
|
|
|
|
|
|
|
|
| ||||||||||||||||||||||||||||
| $ | 2,513,120,745 | $ | 202,689,554 | $ | (258,968,217 | ) | $ | 19,348,268 | $ | (606,773,574 | ) | $ | 1,869,416,776 | 135,870,288 | $ | 29,880,875 | $ | 172,808,681 | |||||||||||||||||||||||||||
|
|
|
|
|
|
|
|
|
|
|
|
|
|
|
|
|
| ||||||||||||||||||||||||||||
Pursuant to separate agreements between the Trust and the Manager, the Manager provides a Chief Compliance Officer (“CCO”) and certain compliance oversight and regulatory filing services to the Trust. Under these agreements, the Manager is entitled to an amount equal to a portion of the compensation and certain other expenses related to the individuals performing the CCO and compliance oversight services, as well as $100 per hour for time incurred in connection with the preparation and filing of certain documents with the SEC. The fees are paid to the Manager on a quarterly basis. The total expenses incurred by the Fund for these services are reflected on the Statement of Operations as “Administrative and compliance services fees.”
Citi Fund Services Ohio, Inc. (“Citi” or the “Administrator”), a wholly owned subsidiary of Citigroup, Inc., with which an officer of the Trust is affiliated, serves as the Trust’s administrator and fund accountant, and assists the Trust in all aspects of its administration and operation. The Administrator is entitled to a fee, accrued daily and paid monthly. The Administrator is entitled to an annual fee for each additional class of shares of any Fund, certain annual fees in supporting fair value services, and a Trust-wide annual fee for providing infrastructure and support in implementing the written policies and procedures comprising the Fund’s compliance program. The Administrator is also reimbursed for certain expenses incurred. The total expenses incurred by the Fund for these services are reflected on the Statement of Operations as “Administration fees.”
FIS Investor Services LLC (“FIS”) serves as the Fund’s transfer agent. Under the Transfer Agent Agreement, the Trust pays FIS a fee for its services and reimburses FIS for all of their reasonable out-of-pocket expenses incurred in providing these services.
The Bank of New York Mellon (“BNY Mellon” or the “Custodian”) serves as the Trust’s custodian. For these services as custodian, the Funds pay BNY Mellon a fee based on a percentage of assets held on behalf of the Funds, plus certain out-of-pocket charges.
Allianz Life Financial Services, LLC (“ALFS”), an affiliate of the Manager, serves as distributor of the Fund. ALFS receives an annual Trust-wide annual fee of $7,500, paid by the Manager from its profits and not by the Trust, for recordkeeping and reporting services.
Certain Officers and Trustees of the Trust are affiliated with the Manager or the Administrator. Such Officers (except for the Trust’s CCO as noted above) and Trustees receive no compensation from the Trust for serving in their respective roles.
4. Investment Valuation Summary
The valuation techniques employed by the Fund, as described below, maximize the use of observable inputs and minimize the use of unobservable inputs in determining fair value. The inputs used for valuing the Fund’s investments are summarized in the three broad levels listed below:
| ● Level 1 - | quoted prices in active markets for identical assets | |||
| ● Level 2 - | other significant observable inputs (including quoted prices for similar securities, interest rates, prepayments speeds, credit risk, etc.) | |||
| ● Level 3 - | significant unobservable inputs (including the Fund’s own assumptions in determining the fair value of investments) |
Changes in valuation techniques may result in transfers in or out of an assigned level within the disclosure hierarchy. The inputs or methodology used for valuing investments is not necessarily an indication of the risk associated with investing in those investments.
Investments in other investment companies are valued at their published net asset value (“NAV”). Security prices determined pursuant to valuation procedures approved by the Trust’s Board of Trustees (the “Board” or “Trustees”) as of the close of the New York Stock Exchange (“NYSE”) (generally 4:00 pm Eastern Time). The investments utilizing Level 1 valuations represent investments in open-end investment companies. Futures contracts are valued at the settlement prices established each day on the primary exchange and are typically categorized as Level 1 in the fair value hierarchy.
The Board has designated the Manager to perform the Fund’s fair value determinations in accordance with valuation procedures approved by the Board. The effect of using fair value pricing is that the Fund’s NAV will be subject to the judgment of the Manager. The Manager’s fair valuation process is subject to the oversight of the Board.
10
AZL MVP Growth Index Strategy Fund
Notes to the Financial Statements
December 31, 2022
The following is a summary of the valuation inputs used as of December 31, 2022 in valuing the Fund’s investments based upon the three levels defined above:
Investment Securities: | Level 1 | Level 2 | Level 3 | Total | ||||||||||||
Affiliated Investment Companies | $1,869,416,776 | $— | $— | $1,869,416,776 | ||||||||||||
Unaffiliated Investment Company | 20,671,377 | — | — | 20,671,377 | ||||||||||||
|
|
|
|
|
|
|
| |||||||||
Total Investment Securities | 1,890,088,153 | — | — | 1,890,088,153 | ||||||||||||
|
|
|
|
|
|
|
| |||||||||
Other Financial Instruments:* | ||||||||||||||||
Futures Contracts | (288,079) | — | — | (288,079) | ||||||||||||
|
|
|
|
|
|
|
| |||||||||
Total Investments | $1,889,800,074 | $— | $— | $1,889,800,074 | ||||||||||||
|
|
|
|
|
|
|
| |||||||||
| * | Other Financial Instruments would include any derivative instruments, such as futures contracts. These investments are generally presented in the financial statements at variation margin. |
5. Security Purchases and Sales
For the year ended December 31, 2022, cost of purchases and proceeds from sales of securities (excluding securities maturing less than one year from acquisition) were as follows:
| Purchases | Sales | |||||||||
AZL MVP Growth Index Strategy Fund | $ | 202,689,554 | $ | 258,968,217 | ||||||
6. Investment Risks
The risks below are presented in an order intended to facilitate readability. Their order does not imply that the realization of one risk is more likely to occur more frequently than another risk, nor does it imply that the realization of one risk is likely to have a greater adverse impact than another risk. The Fund may be subject to other risks in addition to these identified risks. This section discusses certain common principal risks encountered by the Fund.
Derivatives Risk: The Fund may invest directly or through affiliated or unaffiliated mutual funds or unregistered investment pools in derivative instruments such as futures, options, and options on futures. A derivative is a financial contract whose value depends on, or is derived from, the value of an underlying asset, reference rate, or risk. Use of derivative instruments involves risks different from, or possibly greater than, the risks associated with investing directly in securities and other traditional investments. Derivatives are subject to a number of other risks, such as liquidity risk, interest rate risk, market risk, credit risk, and selection risk. Derivatives also involve the risk of mispricing or improper valuation and the risk that changes in the value may not correlate perfectly with the underlying asset, rate, or index. Using derivatives may result in losses, possibly in excess of the principal amount invested. Also, suitable derivative transactions may not be available in all circumstances. The other party to a derivatives contract could default.
Foreign Securities Risk: Investing in the securities of non-U.S. issuers involves a number of risks, such as fluctuations in currency values, adverse political, social or economic developments, and differences in social and economic developments or policies. Such risks include future political and economic developments, and the possible imposition of exchange controls or other foreign governmental laws and restrictions. In addition, with respect to certain countries, there is the possibility of expropriation of assets, confiscatory taxation, political or social instability or diplomatic developments which could adversely affect investments in those securities. Certain foreign companies may be subject to sanctions, embargoes, or other governmental actions that may impair or otherwise limit the ability to invest in, receive, hold or sell the securities of such companies.
Fund of Fund Risk: The Fund, as a shareholder of the underlying funds, indirectly bears its proportionate share of any investment management fees and other expenses of the underlying funds. Further due to the fees and expenses paid by the Fund, as well as small variations in the Fund’s actual allocations to the underlying funds and any futures and cash held in the Fund’s portfolio, the performance and income distributions of the Fund will not be the same as the performance and income distributions of the underlying funds. In addition, the Fund maintains indirect exposure to various types of risk which may exist in the underlying Funds, such as foreign securities risk, fixed income securities risk and other risks.
Interest Rate Risk: Debt securities held by an underlying fund may decline in value due to rising interest rates. The price of a bond is also affected by its maturity. Bonds with longer maturities generally have greater sensitivity to changes in interest rates.
Market Risk: The market price of securities owned by the underlying funds may go up or down, sometimes rapidly and unpredictably. Securities may decline in value due to factors affecting securities markets generally or particular industries represented in the securities markets. The value of a security may decline due to general market conditions that are not specifically related to a particular company, such as real or perceived adverse economic conditions, changes in the general outlook for corporate earnings, changes in interest or currency rates, or adverse investor sentiment, as well as natural disasters, and outbreaks of infectious illnesses or other widespread public health issues.
Quantitative Investing Risk: The value of securities selected using quantitative analysis can react differently to issuer, political, market, and economic developments than the market as a whole or securities selected using only fundamental analysis. The factors used in quantitative analysis and the weight placed on those factors may not be predictive of a security’s value. In addition, factors that affect a security’s value can change over time and these changes may not be reflected in the quantitative model. A quantitative model can be adversely affected by errors or imperfections in the factors or the data on which evaluations are based, or by technical issues with construction or implementation of the model, which in any case may result in a failure of the portfolio to perform as expected or a failure to identify securities that will perform well in the future.
7. Coronavirus (COVID-19) Pandemic
The global outbreak of the COVID-19 strain of the coronavirus has caused adverse effects on many companies, sectors, nations, regions and the markets in general, and may continue for an unpredictable duration. The effects of this pandemic may adversely impact the value and performance of the Fund, its ability to buy and sell fund investments at appropriate valuations, and its ability to achieve its investment objective(s).
11
AZL MVP Growth Index Strategy Fund
Notes to the Financial Statements
December 31, 2022
8. Federal Tax Information
It is the policy of the Fund to continue to qualify as a regulated investment company by complying with the provisions available to certain investment companies, as defined under Subchapter M of the Internal Revenue Code, and to make distributions of net investment income and net realized gains sufficient to relieve it from all, or substantially all, federal income taxes. Accordingly, no provisions for federal income taxes are required in the financial statements.
Management of the Fund has reviewed tax positions taken in tax years that remain subject to examination by all major tax jurisdictions, including federal (i.e., the last four tax year ends and the interim tax period since then, as applicable). Management believes that there is no tax liability resulting from unrecognized tax benefits related to uncertain tax positions taken.
Cost of securities, including derivatives and short positions as applicable, for federal income tax purposes at December 31, 2022 is $1,768,371,746. The gross unrealized appreciation/ (depreciation) on a tax basis is as follows:
Unrealized appreciation | $190,814,106 | |||
Unrealized (depreciation) | (69,097,699 | ) | ||
|
| |||
Net unrealized appreciation/(depreciation) | $121,716,407 | |||
|
|
The tax character of dividends paid to shareholders during the year ended December 31, 2022 was as follows:
| Ordinary Income | Net Long-Term | Total Distributions(a) | |||||||||||||
AZL MVP Growth Index Strategy Fund | $ | 121,454,400 | $ | 107,713,842 | $ | 229,168,242 | |||||||||
| (a) | Total distributions paid may differ from the Statements of Changes in Net Assets because dividends are recognized when actually paid for tax purposes. |
The tax character of dividends paid to shareholders during the year ended December 31, 2021, was as follows:
| Ordinary Income | Net Long-Term | Total Distributions(a) | |||||||||||||
AZL MVP Growth Index Strategy Fund | $ | 125,623,238 | $ | 113,579,502 | $ | 239,202,740 | |||||||||
| (a) | Total distributions paid may differ from the Statements of Changes in Net Assets because dividends are recognized when actually paid for tax purposes. |
At December 31, 2022, the components of accumulated earnings on a tax basis were as follows:
| Undistributed Ordinary Income | Undistributed Long-Term Capital Gains | Accumulated Capital and Other Losses | Unrealized Appreciation/ Depreciation(a) | Total Accumulated Earnings/ (Deficit) | ||||||||||||||||
AZL MVP Growth Index Strategy Fund | $38,506,846 | $37,753,362 | $— | $121,716,407 | $197,976,615 | |||||||||||||||
| (a) | The differences between book-basis and tax-basis unrealized appreciation/(depreciation) is attributable primarily to tax deferral of losses on wash sales, mark-to-market of futures contracts and straddles. |
9. Ownership and Principal Holders
The beneficial ownership, either directly or indirectly, of more than 25% of the voting securities of a fund creates presumptions of control of the fund, under section 2 (a)(9) of the 1940 Act. As of December 31, 2022, the Fund had an individual shareholder account which is affiliated with the Manager representing ownership in excess of 85% of the Fund. Investment activities of this shareholder could have a material impact to the Fund.
10. Subsequent Events
Management of the Fund has evaluated the need for additional disclosures or adjustments resulting from events through the date the financial statements were issued. Based on this evaluation, there were no subsequent events to report that would have material impact on the Fund’s financial statements.
12
REPORT OF INDEPENDENT REGISTERED PUBLIC ACCOUNTING FIRM
To the Board of Trustees of Allianz Variable Insurance Products Fund of Funds Trust and Shareholders of
AZL MVP Growth Index Strategy Fund
Opinion on the Financial Statements
We have audited the accompanying statement of assets and liabilities, including the schedule of portfolio investments, of AZL MVP Growth Index Strategy Fund (one of the funds constituting Allianz Variable Insurance Products Fund of Funds Trust, referred to hereafter as the “Fund”) as of December 31, 2022, the related statement of operations for the year ended December 31, 2022, the statements of changes in net assets for each of the two years in the period ended December 31, 2022, including the related notes, and the financial highlights for each of the five years in the period ended December 31, 2022 (collectively referred to as the “financial statements”). In our opinion, the financial statements present fairly, in all material respects, the financial position of the Fund as of December 31, 2022, the results of its operations for the year then ended, the changes in its net assets for each of the two years in the period ended December 31, 2022 and the financial highlights for each of the five years in the period ended December 31, 2022 in conformity with accounting principles generally accepted in the United States of America.
Basis for Opinion
These financial statements are the responsibility of the Fund’s management. Our responsibility is to express an opinion on the Fund’s financial statements based on our audits. We are a public accounting firm registered with the Public Company Accounting Oversight Board (United States) (PCAOB) and are required to be independent with respect to the Fund in accordance with the U.S. federal securities laws and the applicable rules and regulations of the Securities and Exchange Commission and the PCAOB.
We conducted our audits of these financial statements in accordance with the standards of the PCAOB. Those standards require that we plan and perform the audit to obtain reasonable assurance about whether the financial statements are free of material misstatement, whether due to error or fraud.
Our audits included performing procedures to assess the risks of material misstatement of the financial statements, whether due to error or fraud, and performing procedures that respond to those risks. Such procedures included examining, on a test basis, evidence regarding the amounts and disclosures in the financial statements. Our audits also included evaluating the accounting principles used and significant estimates made by management, as well as evaluating the overall presentation of the financial statements. Our procedures included confirmation of securities owned as of December 31, 2022 by correspondence with the custodian, transfer agent and brokers. We believe that our audits provide a reasonable basis for our opinion.
/s/ PricewaterhouseCoopers LLP
New York, New York
February 23, 2023
We have served as the auditor of one or more investment companies in the Allianz Variable Insurance Products complex since 2018.
13
Other Federal Income Tax Information (Unaudited)
For the year ended December 31, 2022, 10.62% of the total ordinary income dividends paid by the Fund qualify for the corporate dividends received deductions available to corporate shareholders.
During the year ended December 31, 2022, the Fund declared net short-term capital gain distributions of $84,411,796.
During the year ended December 31, 2022, the Fund declared net long-term capital gain distributions of $107,713,842.
14
A description of the policies and procedures that the Fund uses to determine how to vote proxies relating to portfolio securities is available, without charge, upon request, by visiting the Securities and Exchange Commission’s (‘‘Commission’’) website at www.sec.gov, or by calling 800-624-0197.
Information regarding how the Fund voted proxies relating to portfolio securities during the most recent 12-month period ended June 30th is available (i) without charge, upon request, by calling 800-624-0197; (ii) on the Trust’s website at https://www.allianzlife.com; and (iii) on the Commission’s website at http://www.sec.gov.
The Fund files complete Schedules of Portfolio Holdings with the Commission for the first and third quarters of each fiscal year on Form N-PORT. Schedules of Portfolio Holdings for the Fund are available without charge on the Commission’s website at http://www.sec.gov, or may be obtained by calling 800-624-0197.
15
Approval of Investment Advisory Agreement (Unaudited)
Subject to the general supervision of the Board of Trustees (the “Board”) and in accordance with the investment objectives and restrictions of each separate series (each a “Fund,” together, the “Funds”) of the Allianz Variable Insurance Products Fund of Funds Trust (the “Trust”), investment advisory services are provided to the Funds by Allianz Investment Management LLC (the “Manager”). The Manager manages each Fund pursuant to an investment management agreement (the “Management Agreement”) with the Trust in respect of each such Fund. The Management Agreement provides that the Manager, subject to the supervision and approval of the Board, is responsible for the management of each Fund. For management services, each Fund pays the Manager an investment advisory fee based upon each Fund’s average daily net assets. The Manager has contractually agreed to limit the expenses of each Fund by reimbursing the Fund if and when total Fund operating expenses exceed certain amounts until at least April 30, 2024 (the “Expense Limitation Agreement”).
In reviewing the services provided by the Manager and the terms of the Management Agreement, the Board receives and reviews information related to the Manager’s experience and expertise in the variable insurance marketplace. In addition, the Board receives information regarding the Manager’s expertise with regard to portfolio diversification and asset allocation requirements within variable insurance products issued by Allianz Life Insurance Company of North America (“Allianz Life”) and its subsidiary, Allianz Life Insurance Company of New York (“Allianz of New York”). Currently, the Funds are offered only through Allianz Life and Allianz of New York variable products, and not in the retail fund market.
As required by the Investment Company Act of 1940 (the “1940 Act”), the Board has reviewed and approved the Management Agreement with the Manager. The Board’s decision to approve this contract reflects the exercise of its business judgment on whether to approve new arrangements and continue the existing arrangements. During its review of the contract, the Board considered many factors, among the most material of which are: the Fund’s investment objectives and long-term performance; the Manager’s management philosophy, personnel, processes and investment performance, including its compliance history and the adequacy of its compliance processes; the preferences and expectations of Fund shareholders (and underlying contract owners) and their relative sophistication; the continuing state of competition in the mutual fund industry; and comparable fees in the mutual fund industry.
The Board also considered the compensation and benefits received by the Manager. This includes fees received for services provided to a Fund by employees of the Manager or of affiliates of the Manager and research services received by the Manager from brokers that execute Fund trades, as well as advisory fees. The Board considered the fact that: (1) the Manager and the Trust are parties to an Administrative Services Agreement and a Compliance Services Agreement, under which the Manager is compensated by the Trust for performing certain administrative and compliance services including providing an employee of the Manager or one of its affiliates to act as the Trust’s Chief Compliance Officer; and (2) Allianz Life Financial Services, LLC, an affiliated person of the Manager, is a registered securities broker-dealer and received (along with its affiliated persons) payments made by the underlying funds pursuant to Rule 12b-1.
The Board is aware that various courts have interpreted provisions of the 1940 Act and have indicated in their decisions that the following factors may be relevant to an adviser’s compensation: the nature, extent and quality of the services provided by the adviser, including the performance of the fund; the adviser’s cost of providing the services; the extent to which the adviser may realize “economies of scale” as the fund grows larger; any indirect benefits that may accrue to the adviser and its affiliates as a result of the adviser’s relationship with the fund; performance and expenses of comparable funds; the profitability of acting as adviser to the fund; and the extent to which the independent Board members, who are not “interested persons” of a fund as defined by the 1940 Act (“Independent Trustees”), are fully informed about all facts bearing on the adviser’s services and fees. The Board is aware of these factors and takes them into account in its review of the Management Agreement for the Funds.
Each member of the Board considered and weighed these factors in light of his or her experience in governing the Trust. The Board is assisted in its deliberations by the advice of independent legal counsel to the Independent Trustees (“Independent Trustee Counsel”). In this regard, the Board requests and receives a significant amount of information about the Funds and the Manager. Some of this information is provided at each regular meeting of the Board; additional information is provided in connection with the particular meetings at which the Board’s formal review of the Management Agreement occurs. In between regularly scheduled meetings, the Board may receive information on particular matters as the need arises. Thus, the Board’s evaluation of the Management Agreement is informed by reports covering such matters as: the Manager’s investment philosophy, personnel and processes, and the Fund’s investment performance (in absolute terms as well as in relationship to its benchmark and certain competitor or “peer group” funds). In connection with comparing the performance of each Fund versus its benchmark, the Board receives reports on the extent to which the Fund’s performance may be attributed to various applicable factors, such as asset class allocation decisions and volatility management strategies, if applicable, the performance of the underlying funds, rebalancing decisions, and the impact of cash positions and Fund fees and expenses. The Board also receives reports on the Funds’ expenses (including the advisory fee itself and the overall expense structure of the Funds, both in absolute terms and relative to peer group and/or competing funds, with due regard for the Expense Limitation Agreement and additional voluntary expense limitations); the use and allocation of any brokerage commissions derived from trading the Funds’ portfolio securities; the nature, extent and quality of the advisory and other services provided to the Fund by the Manager and its affiliates; compliance and audit reports concerning the Funds and the companies that service them; and relevant developments in the mutual fund industry and how the Funds and/or the Manager are responding to them.
The Board also receives financial information about the Manager, including reports on the compensation and benefits the Manager derives from its relationships with the Funds. These reports cover not only the fees under the Management Agreement, but also the fees, if any, received for providing other services to the Funds. The reports also discuss any indirect or
“fall-out” benefits the Manager or its affiliates may derive from their relationships with the Funds.
The Management Agreement was most recently considered at Board meetings held in the summer and fall of 2022. Information relevant to the approval of the Management Agreement was considered at Board meetings held June 14 and 21, 2022, and September 13, 2022, as well as at various other meetings preceding those meetings. Accordingly, the Management Agreement was approved by the Board at an in-person meeting on September 13, 2022. At such meeting the Board also approved the Expense Limitation Agreement between the Manager and the Trust for the period ending April 30, 2024.
In connection with such meetings, the Board requested and evaluated extensive materials from the Manager, including performance and expense information for other investment companies with similar investment objectives derived from data compiled by an independent third-party provider and other sources believed to be reliable by the Manager and the Trustees. Prior to voting, the Trustees reviewed the proposed approval of the Management Agreement with management and with Independent Trustee Counsel and received a memorandum from such counsel discussing the legal standards for their consideration of the proposed approval. The Independent Trustees also discussed the proposed approval in private sessions with Independent Trustee Counsel at which no representatives of the Manager were present. In reaching their determinations relating to the approval of the Management Agreement, in respect of each Fund, each member of the Board considered all factors he or she believed relevant. The Board based its decision to approve
16
the Management Agreement on the totality of the circumstances and relevant factors, and with a view to past and future long-term considerations. Not all of the factors and considerations discussed above and below are necessarily relevant to every Fund, and the Board did not assign relative weights to factors discussed herein or deem any one or group of them to be controlling in and of themselves.
Shareholder reports must include a discussion of certain factors relating to the selection of the investment adviser and the approval of the advisory fee. The “factors” enumerated by the SEC are set forth below in italics, as well as the Board’s conclusions regarding such factors:
(1) The nature, extent and quality of services provided by the Manager. The Trustees noted that the Manager, subject to the oversight of the Board, administers each Fund’s business and other affairs. The Trustees noted that the Manager also provides the Trust and each Fund with such administrative and other services (exclusive of, and in addition to, any such services provided by any other service providers retained by the Trust on behalf of the Funds) and executive and other personnel as are necessary for the operation of the Trust and the Funds. Except for the Trust’s Chief Compliance Officer and certain compliance staff, the Manager pays all of the compensation of Trustees and officers of the Trust who are employees of the Manager or its affiliates.
The Board considered the scope and quality of services provided by the Manager and noted that the scope of the services provided has continued to expand as a result of regulatory and other developments. The Board noted, for example, that the Manager is responsible for maintaining and monitoring its own compliance program, and this compliance program has been continuously refined and enhanced in light of new regulatory requirements. The Board considered the capabilities and resources which the Manager has dedicated to performing services on behalf of the Trust and its Funds. The quality of administrative and other services, including the Manager’s role in coordinating the activities of the Trust’s other service providers, also were considered. The Board concluded that, overall, they were satisfied with the nature, extent and quality of services provided (and expected to be provided) to the Trust and to each of the Funds under the Management Agreement.
(2) The investment performance of the Funds and the ManagerIn connection with every quarterly Board meeting and the summer and fall 2022 contract review process, Trustees received extensive information on the performance results of each Fund. This included, for example, performance information on absolute total return, performance versus the appropriate benchmark(s) and performance versus peer groups as reported by Lipper, the contribution to performance of the Manager’s asset class allocation decisions and volatility management strategies, if applicable, the performance of the underlying funds, and the impact on performance of rebalancing decisions, cash and Fund fees. This included Lipper performance information on the Funds for the previous quarter, and previous one-, three- and five-year periods, to the extent available. For example, in connection with the Board meetings held June 14 and 21, 2022, and September 13, 2022, the Manager reported that, for the five-year period ended December 31, 2021, two Funds were in the top 40%, three were in the middle 20%, and seven were in the bottom 40% of their respective Lipper peer groups. The Manager reported that for the three-year period ended December 31, 2021, three Funds were in the top 40%, two were in the middle 20%, and seven were in the bottom 40% of their respective Lipper peer groups. For the one-year period ended December 31, 2021, six Funds were in the top 40%, two were in the middle 20%, and four were in the bottom 40% of their respective Lipper peer groups.
The Manager also reported on the performance of the MVP Funds compared to custom managed-volatility peer groups. For the five-year period ended December 31, 2021, four Funds were in the top 40%, two were in the middle 20%, and four were in the bottom 20%. For the three-year period ended December 31, 2021, four Funds were in the top 40%, two were in the middle 20%, and four were in the bottom 40% of their respective custom managed-volatility peer groups. For the one-year period ended December 31, 2021, seven Funds were in the top 40%, two were in the middle 20%, and one was in the bottom 40% of their respective custom managed-volatility peer groups. The Board members discussed with the Manager and considered the impact of the volatility management strategies on performance in different market environments, where applicable, and considered whether they were operating as intended. The Board noted, in particular, the impact of certain characteristics of the Funds’ volatility management strategies in relation to volatility experienced as a result of the COVID-19 pandemic, and that relative performance had improved as the markets stabilized.
At the Board meeting held September 13, 2022, the Board also received updated performance information for the Funds, including updated Lipper peer group ranking information, for various periods ending June 30, 2022.
At the Board meeting held September 13, 2022, the Trustees determined that the investment performance of the Funds was acceptable.
(3) The costs of services to be provided and profits to be realized by the Manager and its affiliates from the relationship with the Funds. The Board considered that the Manager receives an advisory fee from each of the Funds. The Manager reported that for the three MVP Fusion Funds the advisory fee paid put these Funds in the 13th percentile of the customized peer group. The Manager reported that for the four MVP Index Strategy Funds the advisory fee paid put them in the 23rd percentile of the customized peer group, and for the AZL Balanced Index Strategy Fund the advisory fee paid put it in the 7th percentile of the customized peer group. The Manager reported that for the AZL DFA Multi-Strategy Fund, the advisory fee paid was in the 5th percentile. The Manager reported that for the AZL MVP DFA Multi-Strategy, AZL MVP FIAM Multi-Strategy, and AZL MVP T. Rowe Price Capital Appreciation Plus Funds, the advisory fee paid was in the 1st percentile. (A lower percentile reflects lower fund fees and is better for fund shareholders.) Trustees were provided with information on the total expense ratios of the Funds and other funds in the customized peer groups, and the Manager reported upon the challenges in making peer group comparisons for the Funds. The Board further considered and found that the advisory fee paid to the Manager with respect to each Fund was based on services provided to the Fund that were in addition to, rather than duplicative of, the services provided pursuant to the advisory agreements for the underlying funds in which the Fund invests.
The Manager provided information concerning the profitability of the Manager’s investment advisory activities for the period from 2019 through 2021. The Board recognized that it is difficult to make comparisons of profitability from investment company advisory agreements because comparative information is not generally publicly available and is affected by numerous factors, including the structure of the particular adviser, the types of funds it manages, its business mix, numerous assumptions regarding allocation of expenses and the adviser’s capital structure and cost of capital. In considering profitability information, the Board considered the possible effect of certain fall-out benefits to the Manager and its affiliates. The Board focused on profitability of the Manager’s relationships with the Funds before taxes and distribution expenses. The Board recognized that the Manager should earn a reasonable level of profits for the services it provides to each Fund.
The Board also considered that Wilshire Funds Management (“Wilshire”) serves as a consultant to the Manager in preparing statistical and other factual information for use in the creation and maintenance of the asset allocation models for the AZL MVP Fusion Funds, pursuant to an agreement between the Manager and Wilshire. Wilshire serves as a consultant to the Manager with respect to selecting the AZL MVP Fusion Funds’ underlying funds and the asset allocations among the underlying funds. The Manager, not any Fund, pays a consultant fee to Wilshire.
(4) and (5) The extent to which economies of scale would be realized as the Funds grow, and whether fee levels reflect these economies of scale. The Board noted that the advisory fee schedules for the Funds do not contain breakpoints that reduce the fee rate on assets above specified levels. The Board recognized that breakpoints may be an appropriate way for the Manager to share its economies of scale, if any, with Funds that have substantial assets. The Board found there was no uniform methodology for establishing breakpoints
17
that give effect to Fund-specific services provided by the Manager. The Board noted that in the fund industry as a whole, as well as among funds similar to the Funds, there is no uniformity or pattern in the fees and asset levels at which breakpoints (if any) apply. Depending on the age, size, and other characteristics of a particular fund and its manager’s cost structure, different conclusions can be drawn as to whether there are economies of scale to be realized at any particular level of assets, notwithstanding the intuitive conclusion that such economies exist, or will be realized at some level of total assets. Moreover, because different managers have different cost structures and service models, it is difficult to draw meaningful conclusions from the breakpoints that may have been adopted by other funds. The Board also noted that the advisory agreements for many funds do not have breakpoints at all, or if breakpoints exist, they may be at asset levels significantly greater than those of the individual Funds. The Board noted that the total assets in all of the Funds, as of June 30, 2022, were approximately $8.2 billion and that the largest Fund, the AZL MVP Growth Index Strategy Fund, had assets of approximately $2.1 billion.
The Board noted that the Manager has agreed to temporarily limit Fund expenses under the Expense Limitation Agreement, which has the effect of reducing expenses similar to implementation of advisory fee breakpoints. The Manager has committed to continue to consider the continuation of expense limits and/or advisory fee breakpoints as Fund assets change. The Board receives quarterly reports on the level of Fund assets. The Board expects to continue to consider: (a) the extent to which economies of scale have been realized, and (b) whether the advisory fee should be modified, either in connection with the next renewal of the Management Agreement or by modifying the Expense Limitation Agreement, to reflect such economies of scale, if any.
Having taken these factors into account, the Board concluded that the absence of breakpoints in the Funds’ advisory fee rate schedules was acceptable under each Fund’s circumstances.
In conclusion, after full consideration of the above factors, as well as such other factors as each member of the Board considered instructive in evaluating the Management Agreement, the Board concluded that the advisory fees were reasonable, and that the continuation of the Management Agreement was in the best interest of the Funds.
18
Information about the Board of Trustees and Officers (Unaudited)
The Trust is managed by the Trustees in accordance with the laws of the state of Delaware governing business trusts. In addition to serving on the Board of Trustees of the Trust, each Trustee serves on the Board of the Allianz Variable Insurance Products Trust (“VIP Trust”) and the AIM ETF Products Trust (“ETF Trust”) (collectively, the Trust, the VIP Trust, and ETF Trust are the “AIM Complex”). There are currently seven Trustees, one of whom is an “interested person” of the Trust within the meaning of that term under the 1940 Act. The Trustees and Officers of the Trust, and their addresses, years of birth, their positions held with the Trust, their terms of office with the Trust and length of time served, their principal occupation(s) during the past five years, the number of portfolios in the Trust they oversee, and their other directorships held during the past five years are as follows:
Independent Trustees(1)
| Name, Address, and Birth Year | Positions Held with AIM Complex | Term of Office(2)/Length of Time Served | Principal Occupation(s) During Past 5 Years | Number of Portfolios Overseen for the AIM Complex | Other 5 Years | |||||
Peggy L. Ettestad (1957) 5701 Golden Hills Drive Minneapolis, MN 55416 | Lead Independent Trustee | Since 10/14 (Trustee since 2/07) | Managing Director, Red Canoe Management Consulting LLC, 2008 to present | 50 | None | |||||
Tamara Lynn Fagely (1958) 5701 Golden Hills Drive Minneapolis, MN 55416 | Trustee | Since 12/17 | Retired; previously, Chief Operations Officer, Hartford Funds, 2012 to 2013 | 50 | Diamond Hill Funds (10 Funds) | |||||
Richard H. Forde (1953) 5701 Golden Hills Drive Minneapolis, MN 55416 | Trustee | Since 12/17 | Retired; previously, Member of the Board and Chairman of the Finance and Investment Committee, Connecticut Water Service, Inc., 2013 to 2019 | 50 | Connecticut Water Service, Inc. | |||||
Jack Gee (1959) 5701 Golden Hills Drive Minneapolis, MN 55416 | Trustee | Since 1/22 (Consultant to the Independent Trustees since 2/20)(3) | Retired; previously, Managing Director, BlackRock, Inc., Treasurer and Chief Financial Officer U.S. iShares, 2004 to 2019 | 50 | Engine No. 1 ETF Trust (2 Funds); Esoterica Thematic Trust (2019 - 2020) | |||||
Claire R. Leonardi (1955) 5701 Golden Hills Drive Minneapolis, MN 55416 | Trustee | Since 2/04 | Retired; previously, CEO, Health eSense Inc. (a medical device company), 2015 to 2018, and Connecticut Innovations, Inc. (a venture capital firm), 2012 to 2015 | 50 | None | |||||
Dickson W. Lewis (1948) 5701 Golden Hills Drive Minneapolis, MN 55416 | Trustee | Since 2/04 | Retired; previously, senior executive for Lifetouch National School Studios (a photography company), 2006 to 2014, Jostens (a producer of year books and class rings), 2001 to 2006, and Fortis Financial Group, 1997 to 2001 | 50 | None | |||||
19
Interested Trustee(4)
| Name, Address, and Birth Year | Positions Held with AIM Complex | Term of Office(2)/Length of Time Served | Principal Occupation(s) During Past 5 Years | Number of Portfolios Overseen for the AIM Complex | Other 5 Years | |||||
Brian Muench (1970) 5701 Golden Hills Drive Minneapolis, MN 55416 | Trustee | Since 6/11 | President, Allianz Investment Management LLC, 2010 to present; Vice President, Allianz Life, 2011 to present | 50 | None | |||||
| (1) | Each of the Independent Trustees is a member of the Audit Committee. |
| (2) | Indefinite. |
| (3) | Prior to January 1, 2022, Mr. Gee served as a consultant to the Independent Trustees since February 2020, during which he attended meetings of the Board and its standing committees, including the audit committee, solely in his capacity as a consultant, and was not entitled to vote. |
| (4) | Is an “interested person,” as defined by the 1940 Act, due to employment by Allianz Life and the Manager. |
Officers
| Name, Address, and Birth Year | Positions Held with AIM Complex | Term of Office(1)/ Length of Time Served | Principal Occupation(s) During Past 5 Years | |||
Brian Muench (1970) 5701 Golden Hills Drive Minneapolis, MN 55416 | President | Since 11/10 | President, Allianz Investment Management LLC, November 2010 to present; Vice President, Allianz Life, 2011 to present. | |||
Erik Nelson (1972) 5701 Golden Hills Drive Minneapolis, MN 55416 | Secretary | Since 12/20 | Chief Legal Officer, Allianz Investment Management LLC; Associate General Counsel, Senior Counsel, Allianz Life, 2008 to present. | |||
Bashir C. Asad (1963) Citi Fund Services Ohio, Inc. 4400 Easton Commons, Suite 200 Columbus, OH 43219 | Treasurer, Principal Accounting Officer and Principal Financial Officer | Since 06/16 | Senior Vice President, Citi Fund Services Ohio, Inc., 2011 to present. | |||
Chris R. Pheiffer (1968) 5701 Golden Hills Drive Minneapolis, MN 55416 | Chief Compliance Officer(2) and Anti-Money Laundering Compliance Officer | Since 02/14 | Chief Compliance Officer of the Trust and the VIP Trust, 2014 to present, and the ETF Trust, 2020 to present. | |||
Michael Tanski (1970) 5701 Golden Hills Drive Minneapolis, MN 55416 | Vice President | Since 04/09 | Assistant Vice President, Allianz Investment Management LLC, 2013 to present. | |||
| (1) | Indefinite. |
| (2) | The Manager and the Trust are parties to a Compliance Services Agreement under which the Manager provides an employee of the Manager or one of its affiliates to act as the Trust’s Chief Compliance Officer. |
The Fund’s Statement of Additional Information (“SAI”) contains additional information about the Trust’s Trustees and Officers. The SAI is available without charge, upon request, by calling toll-free 800-624-0197 or at https://www.allianzlife.com.
20

| The Allianz VIP Fund of Funds are distributed by Allianz Life Financial Services, LLC. | ||
| These Funds are not FDIC Insured. | ANNRPT1222 02/23 |
AZL® MVP Moderate Index Strategy Fund
Annual Report
December 31, 2022

Management Discussion and Analysis
Page 1
Expense Examples and Portfolio Composition
Page 3
Schedule of Portfolio Investments
Page 4
Statement of Assets and Liabilities
Page 5
Page 5
Statements of Changes in Net Assets
Page 6
Page 7
Notes to the Financial Statements
Page 8
Report of Independent Registered Public Accounting Firm
Page 13
Other Federal Income Tax Information
Page 14
Page 15
Approval of Investment Advisory Agreement
Page 16
Information about the Board of Trustees and Officers
Page 19
This report is submitted for the general information of the shareholder of the Fund. The report is not authorized for distribution to prospective investors in the Fund unless preceded or accompanied by an effective prospectus, which contains details concerning the sales charges and other pertinent information.
Allianz Investment Management LLC serves as the Manager for the AZL® MVP Moderate Index Strategy Fund.
What factors affected the Fund’s performance during the year ended December 31, 2022?*
For the year ended December 31, 2022, the AZL® MVP Moderate Index Strategy Fund (the “Fund”) returned (15.38)%. That compared to a (18.11)%, (13.01)% and (15.91)% total return for its benchmarks, the S&P 500 Index, the Bloomberg U.S. Aggregate Bond Index, and the Moderate Composite Index, respectively.1
The Fund is a fund of funds that pursues broad diversification across four underlying equity sub-portfolios and one fixed income sub-portfolio. The four equity portfolios pursue passive strategies that aim to achieve, before fees, returns similar to the S&P 500 Index (S&P 500), the S&P MidCap 400 Index2, the S&P SmallCap 600 Index3 and the MSCI EAFE Index4. The fixed-income sub-portfolio is an enhanced bond index strategy that seeks to achieve a return that exceeds that of the Bloomberg Barclays U.S. Aggregate Bond Index. Generally, the Fund allocates 50% to 70% of its assets to the underlying equity index funds and 30% to 50% of its assets to the underlying fixed income fund.
The Fund also employs the MVP (Managed Volatility Portfolio) risk management process, which is intended to adjust the risk of the portfolio based on quantitative indicators of market risk, such as the current level of fund and market volatility.
Domestic equities began the year at near all-time highs, but began to decline early in 2022 due to a combination of rising inflation and geopolitical uncertainties. The Federal Reserve (the Fed) shifted to a more hawkish policy approach in an attempt to bring inflation under control, as did many global central banks. The Fed increased the federal funds rate multiple times throughout the year for a combined total of 425 basis points. Russia’s invasion of Ukraine also weighed on global markets, although European countries were particularly hard hit due to their geographic proximity to the conflict and reliance on Russian commodities such as energy and wheat.
Despite strong labor rates throughout developed markets, high inflation and an anticipated economic slowdown had a negative effect on investor sentiment for the year under review. The S&P 500 declined as company valuations struggled under the higher interest rate environment. Investors grew risk averse as fears of an economic recession loomed, selling off equity positions to avoid the volatility in equity markets. By the end of the period under review, U.S. equities had experienced their worst year since the Great Financial Crisis of 2008, and international equities performed only slightly better.
The Fed’s actions made short-term financing more expensive, and the U.S. Treasury yield curve ultimately inverted with 2-year Treasuries yielding more than 10-year Treasuries by 0.55% at the end of 2022. The monetary tightening generated headwinds for domestic fixed income markets as investors demanded higher yields to account for rising rates. Widening credit spreads further weighed on prices on lower-quality bonds as investors demanded to be compensated for rising credit risks. Nearly all fixed income sectors finished with negative performance.
The Fund, which invests in both U.S. and international markets, outperformed its blended benchmark during the 12-month period. Its off-benchmark allocation to developed market non-U.S. equities contributed, as these outpaced U.S. equities. In addition, the Fund’s performance compared to the blended benchmark was positively affected by its allocation to mid- and small-cap U.S. equities, which outpaced their large-cap counterparts.
The fixed income allocation detracted slightly from the Fund’s performance relative to its benchmark largely due to the underlying fund’s fees. The Fund’s fixed income allocation benefited from security selection, particularly in mortgage- backed securities and investment-grade credit. Allocation to Treasury Inflation Protected Securities (TIPS) also contributed to the Fund’s performance.
The MVP risk management process utilizes derivatives in an effort to control portfolio volatility in unstable market conditions. Market volatility was relatively high during 2022, therefore the MVP process was engaged and reduced the Fund’s equity exposure at multiple points during the year. The MVP process did contribute to the Fund’s performance during 2022.
Past performance does not guarantee future results.
| * | The Fund’s portfolio composition is subject to change. There is no guarantee that any sectors mentioned will continue to perform as described or that securities in such sectors will be held by the Fund in the future. The information contained in this commentary is for informational purposes only and should not be construed as a recommendation to purchase or sell securities in the sector mentioned. The Fund’s holdings and weightings are as of December 31, 2022. |
| 1 | For a complete description of the Fund’s performance benchmarks please refer to page 2 of this report. |
| 2 | The Standard & Poor’s MidCap 400 Index (“S&P 400”) is a widely used index for mid-sized companies. The S&P 400 covers 7% of the U.S. equities market, and is part of a series of S&P U.S. indexes that can be used as building blocks for portfolio composition. |
| 3 | The Standard & Poor’s SmallCap 600 Index (“S&P 600”) covers approximately 3% of the domestic equities market. Measuring the small-cap segment of the market that is typically renowned for poor trading liquidity and financial instability, the index is designed to be an efficient portfolio of companies that meet specific inclusion criteria to ensure that they are investable and financially viable. |
| 4 | The Morgan Stanley Capital International, Europe, Australasia and Far East (“MSCI EAFE”) Index is a free float-adjusted market capitalization-weighted index that is designed to measure the equity market performance of developed markets, excluding the U.S. & Canada. |
The indexes defined above are unmanaged. Investors cannot invest directly in an index.
1
AZL® MVP Moderate Index Strategy Fund Review (Unaudited) |
Fund Objective
The Fund’s investment objective is to seek long-term capital appreciation. This objective may be changed by the Trustees of the Fund without shareholder approval. The Fund seeks to achieve its objective by investing in a combination of Index Strategy Underlying Funds that represent different classes in the Fund’s asset allocation.
Investment Concerns
The Fund invests in underlying funds, so its investment performance is directly related to the performance of those underlying funds. Before investing, investors should assess the risks associated with and types of investments made by each of the underlying funds in which the Fund invests.
Quantitative investing involves risk that the values of securities selected in the quantitative analysis can react differently than the market or securities selected using fundamental analysis.
Stocks are more volatile and carry more risk and return potential than other forms of investments.
International investing may involve risk of capital loss from unfavorable fluctuations in currency values, from differences in generally accepted accounting principles or from economic or political instability in other nations.
Small- to mid-capitalization companies typically have a higher risk of failure and historically have experienced a greater degree of volatility.
The performance of the underlying funds is expected to be lower than that of the Indexes because of fees and expenses. Securities in which the underlying funds will invest may involve substantial risk and may be subject to sudden severe price declines.
Investing in a single industry or sector, or concentrating investments in a limited number of industries or sectors, tends to increase the risk that economic, political, or regulatory developments affecting certain industries or sectors will have a large impact on the value of the portfolio.
Mortgage-backed investments involve risk of loss due to prepayments and, like any bond, due to default. Because of the sensitivity of mortgage-related securities to changes in interest rates, an underlying fund’s performance may be more volatile than if it did not hold these securities.
Debt securities held by an underlying fund may decline in value due to rising interest rates.
Bonds offer a relatively stable level of income, although bond prices will fluctuate, providing the potential for principal gain or loss.
Investing in derivative instruments involves risks that may be different from or greater than the risk associated with investing directly in securities or other traditional instruments.
For a complete description of these and other risks associated with investing in the Fund, please refer to the Fund’s prospectus.
Growth of $10,000 Investment
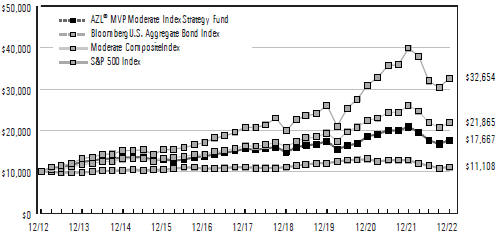
The chart above represents a comparison of a hypothetical investment in the Fund versus a similar investment in the Fund’s benchmarks and represents the reinvestment of dividends and capital gains in the Fund.
| Average Annual Total Returns as of December 31, 2022 | ||||||||||||||||||||
| 1 Year | 3 Years | 5 Years | 10 Years | |||||||||||||||||
AZL® MVP Moderate Index Strategy Fund | (15.38 | )% | 0.43 | % | 2.63 | % | 5.86 | % | ||||||||||||
Bloomberg U.S. Aggregate Bond Index | (13.01 | )% | (2.71 | )% | 0.02 | % | 1.06 | % | ||||||||||||
Moderate Composite Index | (15.91 | )% | 4.00 | % | 6.07 | % | 8.14 | % | ||||||||||||
S&P 500 Index | (18.11 | )% | 7.66 | % | 9.42 | % | 12.56 | % | ||||||||||||
Past performance does not guarantee future results. The performance data quoted represents past performance and current returns may be lower or higher. The investment return and principal value will fluctuate so that an investor’s shares, when redeemed, may be worth more or less than the original cost. To obtain performance information current to the most recent month end, please visit www.Allianzlife.com.
| Expense Ratio | Gross | ||||||
AZL® MVP Moderate Index Strategy Fund | 0.70 | % | |||||
The above expense ratio is based on the current Fund prospectus dated April 29, 2022. The Manager and the Fund have entered into a written contract limiting operating expenses, excluding certain expenses (such as interest expense and acquired fund fees and expenses), to 0.15% through April 30, 2024. Additional information pertaining to the December 31, 2022 expense ratio can be found in the Financial Highlights.
Acquired fund fees and expenses are incurred indirectly by the Fund through the valuation of the Fund’s investments in the permitted Underlying Funds. Accordingly, acquired fund fees and expenses affect the Fund’s total returns. Because these fees and expenses are not included in the Fund’s financial highlights, the Fund’s total annual fund operating expenses, as shown in the current prospectus, do not correlate to the ratios of expenses to average net assets shown in the Financial Highlights. Without acquired fund fees and expenses the Fund’s gross expense ratio would be 0.13%.
The total return of the Fund does not reflect the effect of any insurance charges, the annual maintenance fee or the deduction of taxes that a shareholder would pay on Fund distributions or the redemption of Fund shares. Such charges, fees and tax payments would reduce the performance quoted.
The Fund’s performance is measured against the Standard & Poor’s 500 Index (“S&P 500”), the Bloomberg U.S. Aggregate Bond Index and the Moderate Composite Index (“Composite”). The S&P 500 is representative of 500 selected common stocks, most of which are listed on the New York Stock Exchange, and is a measure of the U.S. Stock market as a whole. The Bloomberg U.S. Aggregate Bond Index is a market value-weighted performance benchmark for investment-grade fixed-rate debt issues, including government, corporate, asset-backed, and mortgage-backed securities, with maturities of at least one year. The Composite is a blended index comprised of (60%) S&P 500 and (40%) Bloomberg U.S. Aggregate Bond Index. These indexes are unmanaged and do not reflect the deduction of fees associated with a mutual fund, such as investment management and fund accounting fees. The Fund’s performance reflects the deduction of fees for services provided to the Fund. Investors cannot invest directly in an index.
2
AZL MVP Moderate Index Strategy Fund
(Unaudited)
As a shareholder of the AZL MVP Moderate Index Strategy Fund (the “Fund”), you incur ongoing costs, including management fees, distribution fees, and other Fund expenses. These examples are intended to help you understand your ongoing costs (in dollars) of investing in the Fund and to compare these costs with the ongoing costs of investing in other mutual funds. Please note that the expenses shown in each table do not reflect expenses that apply to the subaccount or the insurance contract. If the expenses that apply to the subaccount or the insurance contract were included, your costs would have been higher.
These examples are based on an investment of $1,000 invested at the beginning of the period and held for the periods presented below.
The Actual Expense table below provides information about actual account values and actual expenses. You may use the information below, together with the amount you invested, to estimate the expenses that you paid over the period. Simply divide your account value by $1,000 (for example, an $8,600 account value divided by $1,000 = 8.6), then multiply the result by the number in the table under the heading entitled “Expenses Paid During Period” to estimate the expenses you paid on your account during this period.
| Beginning Account Value 7/1/22 | Ending Account Value | Expenses Paid During Period | Annualized Expense Ratio During Period 7/1/22 - 12/31/22 | |||||||||||||||||
AZL MVP Moderate Index Strategy Fund | $1,000.00 | $1,002.80 | $0.71 | 0.14% | ||||||||||||||||
The Hypothetical Expense table below provides information about hypothetical account values and hypothetical expenses based on the Fund’s actual expense ratio and an assumed rate of return of 5% per year before expenses, which is not the Fund’s actual return. The hypothetical account values and expenses may not be used to estimate the actual ending account balance or expenses you paid for the period. You may use this information to compare this 5% hypothetical example with the 5% hypothetical examples that appear in the shareholder reports of other funds.
| Beginning Account Value 7/1/22 | Ending Account Value | Expenses Paid During Period 7/1/22 - 12/31/22* | Annualized Expense Ratio During Period 7/1/22 - 12/31/22 | |||||||||||||||||
AZL MVP Moderate Index Strategy Fund | $1,000.00 | $1,024.50 | $0.71 | 0.14% | ||||||||||||||||
| * | Expenses are equal to the average account value multiplied by the Fund’s annualized expense ratio multiplied by 184/365 (the number of days in the most recent fiscal half-year divided by the number of days in the fiscal year). |
Portfolio Composition
(Unaudited)
| Investments | Percent of Net Assets | ||||
Domestic Equity Funds | 42.0% | ||||
Fixed Income Fund | 38.3 | ||||
International Equity Fund | 15.1 | ||||
Unaffiliated Investment Company | 0.1 | ||||
|
| ||||
Total Investment Securities | 95.5 | ||||
Net other assets (liabilities) | 4.5 | ||||
|
| ||||
Net Assets | 100.0% | ||||
|
| ||||
3
AZL MVP Moderate Index Strategy Fund
Schedule of Portfolio Investments
December 31, 2022
| Shares | Value | |||||||||||
Affiliated Investment Companies (95.4%): | ||||||||||||
Domestic Equity Funds (42.0%): | ||||||||||||
| 1,861,765 | AZL Mid Cap Index Fund, Class 2 | $ | 35,690,028 | |||||||||
| 6,573,142 | AZL S&P 500 Index Fund, Class 2 | 111,349,034 | ||||||||||
| 1,549,848 | AZL Small Cap Stock Index Fund, Class 2 | 17,714,768 | ||||||||||
|
| |||||||||||
| 164,753,830 | ||||||||||||
|
| |||||||||||
Fixed Income Fund (38.3%): | ||||||||||||
| 15,809,499 | AZL Enhanced Bond Index Fund | 149,874,048 | ||||||||||
|
| |||||||||||
International Equity Fund (15.1%): | ||||||||||||
| 3,884,159 | AZL International Index Fund, Class 2 | 59,272,264 | ||||||||||
|
| |||||||||||
| | Total Affiliated Investment Companies (Cost $370,226,270) | 373,900,142 | ||||||||||
|
| |||||||||||
| (a) | The rate represents the effective yield at December 31, 2022. |
| (b) | See Federal Tax Information listed in the Notes to the Financial Statements. |
Percentages indicated are based on net assets as of December 31, 2022
Futures Contracts
At December 31, 2022, the Fund’s open futures contracts were as follows:
Long Futures
| Shares | Value | |||||||||
Unaffiliated Investment Company (0.1%): |
| |||||||||
Money Markets (0.1%): |
| |||||||||
| 503,141 | Dreyfus Treasury Securities Cash Management Fund, Institutional Shares, 3.90%(a) | $ | 503,141 | |||||||
| | Total Unaffiliated Investment Company (Cost $503,141) | 503,141 | ||||||||
|
| |||||||||
| | Total Investment Securities (Cost $370,729,411) — 95.5%(b) | 374,403,283 | ||||||||
Net other assets (liabilities) — 4.5% | 17,540,087 | |||||||||
|
| |||||||||
Net Assets — 100.0% | $ | 391,943,370 | ||||||||
|
| |||||||||
| Description | Expiration Date | Number of Contracts | Notional Amount | Value and Unrealized Appreciation/ | ||||||||||||
S&P 500 Index E-Mini March Futures (U.S. Dollar) | 3/17/23 | 56 | $ | 10,810,800 | $ | (222) | ||||||||||
U.S. Treasury 10-year Note March Futures (U.S. Dollar) | 3/22/23 | 64 | 7,187,000 | (73,880) | ||||||||||||
|
| |||||||||||||||
| $ | (74,102) | |||||||||||||||
|
| |||||||||||||||
See accompanying notes to the financial statements.
4
AZL MVP Moderate Index Strategy Fund
Statement of Assets and Liabilities
December 31, 2022
Assets: | |||||
Investments in non-affiliates, at cost | $ | 503,141 | |||
Investments in affiliates, at cost | 370,226,270 | ||||
|
|
| |||
Investments in non-affiliates, at value | 503,141 | ||||
Investments in affiliates, at value | $ | 373,900,142 | |||
Deposit at broker for futures contracts collateral | 17,600,470 | ||||
Interest and dividends receivable | 50,442 | ||||
Receivable for affiliated investments sold | 71,882 | ||||
Prepaid expenses | 3,599 | ||||
|
|
| |||
Total Assets | 392,129,676 | ||||
|
|
| |||
Liabilities: | |||||
Payable for capital shares redeemed | 136,974 | ||||
Management fees payable | 33,757 | ||||
Administration fees payable | 5,467 | ||||
Custodian fees payable | 327 | ||||
Administrative and compliance services fees payable | 659 | ||||
Transfer agent fees payable | 465 | ||||
Trustee fees payable | 1,647 | ||||
Other accrued liabilities | 7,010 | ||||
|
|
| |||
Total Liabilities | 186,306 | ||||
|
|
| |||
Net Assets | $ | 391,943,370 | |||
|
|
| |||
Net Assets Consist of: | |||||
Paid in capital | $ | 400,253,454 | |||
Total distributable earnings | (8,310,084 | ) | |||
|
|
| |||
Net Assets | $ | 391,943,370 | |||
|
|
| |||
Shares of beneficial interest (unlimited number of shares authorized, no par value) | 33,753,854 | ||||
Net Asset Value (offering and redemption price per share) | $ | 11.61 | |||
|
|
| |||
For the Year Ended December 31, 2022
Investment Income: | |||||
Dividends from affiliates | $ | 6,005,900 | |||
Interest | 287,557 | ||||
Dividends from non-affiliates | 506 | ||||
|
|
| |||
Total Investment Income | 6,293,963 | ||||
|
|
| |||
Expenses: | |||||
Management fees | 435,963 | ||||
Administration fees | 64,138 | ||||
Custodian fees | 2,541 | ||||
Administrative and compliance services fees | 5,882 | ||||
Transfer agent fees | 5,421 | ||||
Trustee fees | 23,534 | ||||
Professional fees | 19,838 | ||||
Shareholder reports | 12,699 | ||||
Other expenses | 6,643 | ||||
|
|
| |||
Total expenses | 576,659 | ||||
|
|
| |||
Net Investment Income/(Loss) | 5,717,304 | ||||
|
|
| |||
Net realized and Change in net unrealized gains/losses on investments: | |||||
Net realized gains/(losses) on affiliated underlying funds | 1,460,258 | ||||
Net realized gains distributions from affiliated underlying funds | 27,664,688 | ||||
Net realized gains/(losses) on futures contracts | (3,917,938 | ) | |||
Change in net unrealized appreciation/depreciation on affiliated underlying funds | (109,076,784 | ) | |||
Change in net unrealized appreciation/depreciation on futures contracts | (413,207 | ) | |||
|
|
| |||
Net realized and Change in net unrealized gains/losses on investments | (84,282,983 | ) | |||
|
|
| |||
Change in Net Assets Resulting From Operations | $ | (78,565,679 | ) | ||
|
|
|
See accompanying notes to the financial statements.
5
AZL MVP Moderate Index Strategy Fund
Statements of Changes in Net Assets
For the Year Ended | For the Year Ended | |||||||||
Change In Net Assets: | ||||||||||
Operations: | ||||||||||
Net investment income/(loss) | $ | 5,717,304 | $ | 4,035,970 | ||||||
Net realized gains/(losses) on investments | 25,207,008 | 41,148,740 | ||||||||
Change in unrealized appreciation/depreciation on investments | (109,489,991 | ) | 17,688,368 | |||||||
|
|
|
| |||||||
Change in net assets resulting from operations | (78,565,679 | ) | 62,873,078 | |||||||
|
|
|
| |||||||
Distributions to Shareholders: | ||||||||||
Distributions | (45,166,558 | ) | (45,617,497 | ) | ||||||
|
|
|
| |||||||
Change in net assets resulting from distributions to shareholders | (45,166,558 | ) | (45,617,497 | ) | ||||||
|
|
|
| |||||||
Capital Transactions: | ||||||||||
Proceeds from shares issued | 2,377,791 | 5,846,960 | ||||||||
Proceeds from dividends reinvested | 45,166,558 | 45,617,497 | ||||||||
Value of shares redeemed | (55,840,669 | ) | (78,601,729 | ) | ||||||
|
|
|
| |||||||
Change in net assets resulting from capital transactions | (8,296,320 | ) | (27,137,272 | ) | ||||||
|
|
|
| |||||||
Change in net assets | (132,028,557 | ) | (9,881,691 | ) | ||||||
Net Assets: | ||||||||||
Beginning of period | 523,971,927 | 533,853,618 | ||||||||
|
|
|
| |||||||
End of period | $ | 391,943,370 | $ | 523,971,927 | ||||||
|
|
|
| |||||||
Share Transactions: | ||||||||||
Shares issued | 173,404 | 367,334 | ||||||||
Dividends reinvested | 4,018,377 | 3,067,754 | ||||||||
Shares redeemed | (4,239,959 | ) | (4,974,236 | ) | ||||||
|
|
|
| |||||||
Change in shares | (48,178 | ) | (1,539,148 | ) | ||||||
|
|
|
| |||||||
See accompanying notes to the financial statements.
6
AZL MVP Moderate Index Strategy Fund
(Selected data for a share of beneficial interest outstanding throughout the periods indicated. Does not reflect fees or expenses associated with the separate accounts that invest in the Fund or in any variable annuity contracts or variable life insurance policy for which the Fund serves as an investment vehicle.)
| Year Ended December 31, 2022 | Year Ended December 31, 2021 | Year Ended December 31, 2020 | Year Ended December 31, 2019 | Year Ended December 31, 2018 | ||||||||||||||||
Net Asset Value, Beginning of Period | $15.50 | $15.11 | $14.96 | $13.28 | $14.68 | |||||||||||||||
|
|
|
|
|
|
|
|
|
| |||||||||||
Investment Activities: | ||||||||||||||||||||
Net Investment Income/(Loss) | 0.17 | (a) | 0.12 | (a) | 0.26 | (a) | 0.26 | (a) | 0.26 | |||||||||||
Net Realized and Unrealized Gains/(Losses) on Investments | (2.60 | ) | 1.70 | 0.64 | 2.17 | (1.00 | ) | |||||||||||||
|
|
|
|
|
|
|
|
|
| |||||||||||
Total from Investment Activities | (2.43 | ) | 1.82 | 0.90 | 2.43 | (0.74 | ) | |||||||||||||
|
|
|
|
|
|
|
|
|
| |||||||||||
Distributions to Shareholders From: | ||||||||||||||||||||
Net Investment Income | (0.28 | ) | (0.30 | ) | (0.27 | ) | (0.32 | ) | (0.13 | ) | ||||||||||
Net Realized Gains | (1.18 | ) | (1.13 | ) | (0.48 | ) | (0.43 | ) | (0.53 | ) | ||||||||||
|
|
|
|
|
|
|
|
|
| |||||||||||
Total Dividends | (1.46 | ) | (1.43 | ) | (0.75 | ) | (0.75 | ) | (0.66 | ) | ||||||||||
|
|
|
|
|
|
|
|
|
| |||||||||||
Net Asset Value, End of Period | $11.61 | $15.50 | $15.11 | $14.96 | $13.28 | |||||||||||||||
|
|
|
|
|
|
|
|
|
| |||||||||||
Total Return (b) | (15.38 | )% | 12.46 | % | 6.44 | % | 18.64 | % | (5.26 | )% | ||||||||||
Ratios to Average Net Assets/Supplemental Data: | ||||||||||||||||||||
Net Assets, End of Period (000’s) | $391,943 | $523,972 | $533,854 | $534,298 | $489,072 | |||||||||||||||
Net Investment Income/(Loss) | 1.31 | % | 0.76 | % | 1.83 | % | 1.77 | % | 1.73 | % | ||||||||||
Expenses Before Reductions*(c) | 0.13 | % | 0.13 | % | 0.13 | % | 0.13 | % | 0.13 | % | ||||||||||
Expenses Net of Reductions* | 0.13 | % | 0.13 | % | 0.13 | % | 0.13 | % | 0.13 | % | ||||||||||
Portfolio Turnover Rate | 8 | % | 6 | % | 18 | % | 5 | % | 5 | % | ||||||||||
| * | The expense ratios exclude the impact of fees/expenses paid by each underlying fund. |
| (a) | Calculated using the average shares method. |
| (b) | The returns include reinvested dividends and fund level expenses, but exclude insurance contract charges. If these charges were included, the returns would have been lower. |
| (c) | Excludes fee reductions. If such fee reductions had not occurred, the ratios would have been as indicated. |
See accompanying notes to the financial statements.
7
AZL MVP Moderate Index Strategy Fund
Notes to the Financial Statements
December 31, 2022
1. Organization
The Allianz Variable Insurance Products Fund of Funds Trust (the “Trust”) was organized as a Delaware statutory trust on June 16, 2004. The Trust is an open-end management investment company registered under the Investment Company Act of 1940, as amended, (the “1940 Act”) and thus is determined to be an investment company, and follows the investment company accounting and reporting guidance under Financial Accounting Standards Board (“FASB”) Accounting Standards Codification (“ASC”) Topic 946 “Financial Services—Investment Companies”. The Trust consists of 12 separate investment portfolios (collectively, the “Funds”), of which one is included in this report, the AZL MVP Moderate Index Strategy Fund (the “Fund”), and 11 are presented in separate reports. The Fund is a diversified series of the Trust.
The Fund is a “fund of funds”, which means that the Fund invests primarily in other mutual funds (the “Underlying Funds”). Underlying Funds invest in stocks, bonds, and other securities and reflect varying amounts of potential investment risk and reward. The Underlying Funds record their investments at fair value. Periodically, the Fund will adjust its asset allocation as it seeks to achieve its investment objective.
The Trust is authorized to issue an unlimited number of shares of the Fund without par value. Shares of the Fund are available through the variable annuity contracts offered through the separate accounts of participating insurance companies. Currently, the Fund only offers its shares to separate accounts of Allianz Life Insurance Company of North America and Allianz Life Insurance Company of New York, affiliates of the Trust and the Manager, as defined below.
Under the Trust’s organizational documents, its officers and trustees are indemnified against certain liabilities arising out of the performance of their duties to the Fund. In addition, in the normal course of business, the Fund may enter into contracts with its vendors and others that provide for general indemnifications. The Fund’s maximum exposure under these arrangements is unknown, as this would involve future claims that may be made against the Fund. However, based on experience, the Fund expects that risk of loss to be remote.
2. Significant Accounting Policies
The following is a summary of significant accounting policies followed by the Fund in the preparation of its financial statements. The policies conform with U.S. generally accepted accounting principles (“U.S. GAAP”). The preparation of financial statements requires management to make certain estimates and assumptions that affect the reported amounts of assets and liabilities and disclosure of contingent assets and liabilities at the date of the financial statements and the reported amounts of increases and decreases in net assets from operations during the reporting period. Actual results could differ from those estimates.
Security Valuation
The Fund records its investments at fair value. Fair value is defined as the price that would be received to sell an asset or paid to transfer a liability in an orderly transaction between willing market participants at the measurement date. The valuation techniques used to determine fair value are further described in Note 4 below.
Investment Transactions and Investment Income
Investment transactions are accounted for on trade date. Net realized gains and losses on investments sold and on foreign currency transactions are recorded on the basis of identified cost. Interest income is recorded on the accrual basis and includes, where applicable, the amortization of premiums or accretion of discounts. Dividend income is recorded on the ex-dividend date except in the case of foreign securities, in which case dividends are recorded as soon as such information becomes available.
Distributions to Shareholders
Distributions to shareholders are recorded on the ex-dividend date. The Fund distributes its dividends from net investment income and net realized capital gains, if any, on an annual basis. The amount of distributions from net investment income and from net realized gains is determined in accordance with federal income tax regulations, which may differ from U.S. GAAP. These “book/tax” differences are either temporary or permanent in nature. To the extent these differences are permanent in nature (e.g., return of capital, net operating loss, reclassification of certain market discounts, gain/loss, paydowns, and distributions), such amounts are reclassified within the composition of net assets based on their federal tax-basis treatment; temporary differences (e.g., wash sales and differing treatment on certain investments) do not require reclassification. Distributions to shareholders that exceed net investment income and net realized gains for tax purposes are reported as distributions of capital.
Expense Allocation
Expenses directly attributable to the Fund are charged directly to the Fund, while expenses attributable to more than one Fund are allocated among the respective Funds based upon relative net assets or some other reasonable method. Expenses which are attributable to more than one Trust are allocated across the Allianz Variable Insurance Products Trust, Allianz Variable Insurance Products Fund of Funds Trust and AIM ETF Products Trust based upon relative net assets or another reasonable basis. Allianz Investment Management LLC (the “Manager”), serves as the investment manager for the Trust, Allianz Variable Insurance Products Trust and AIM ETF Products Trust.
This report does not reflect fees or expenses associated with the separate accounts that invest in the Fund or in any variable annuity contracts or variable life insurance policy for which the Fund serves as an investment vehicle.
Affiliated Securities Transactions
Pursuant to Rule 17a-7 under the 1940 Act, the Fund may engage in securities transactions with affiliated investment companies and advisory accounts managed by the Manager. Any such purchase or sale transaction must be effected without a brokerage commission or other remuneration, except for customary transfer fees. The transaction must be effected at the current market price, which is either the security’s last sale price on an exchange or, if there are no transactions in the security that day, at the average of the highest bid and lowest asked price. During the year ended December 31, 2022, the Fund did not engage in any Rule 17a-7 transactions.
8
AZL MVP Moderate Index Strategy Fund
Notes to the Financial Statements
December 31, 2022
Derivative Instruments
All open derivative positions at period end are reflected on the Fund’s Schedule of Portfolio Investments. The following is a description of the derivative instruments utilized by the Fund, including the primary underlying risk exposures related to each instrument type. The Fund’s allocation to the MVP (Managed Volatility Portfolio) risk management process may include (a) derivatives such as index futures, other futures contracts, options, and other similar securities and (b) cash, money market equivalents, short-term debt instruments, money market funds, and short-term debt funds to satisfy all applicable margin requirements and to provide additional portfolio liquidity to satisfy large redemptions and any margin calls. Due to the leverage provided by derivatives, the notional value of the Fund’s derivative positions could exceed 20% of the Fund’s value. The Fund may also use futures to gain equity exposure and may hold cash as a buffer in the event of market shocks.
Futures Contracts
During the year ended December 31, 2022, the Fund invested in futures contracts to reduce volatility and limit the need to decrease or increase allocations to underlying funds. Futures contracts are valued based upon their quoted daily settlement prices. Upon entering into a futures contract, the Fund is required to segregate liquid assets in accordance with the initial margin requirements of the broker or exchange. Futures contracts are marked to market daily and a payable or receivable for the change in value (“variation margin”), if any, is recorded by the Fund. Gains or losses are recognized but not considered realized until the contracts expire or are closed. Futures contracts involve, to varying degrees, elements of market risk (generally equity price risk related to stock futures, interest rate risk related to bond futures, and foreign currency risk related to currency futures) and exposure to loss in excess of the variation margin disclosed in the Statement of Assets and Liabilities. The primary risks associated with the use of futures contracts are the imperfect correlation between the change in value of the underlying securities and the prices of futures contracts, the possibility of an illiquid market, and the inability of the counterparty to meet the terms of the contract. For the year ended December 31, 2022, the monthly average notional amount for long contracts was $11.4 million, and the monthly average notional amount for short contracts was $33.0 million. Realized gains and losses are reported as “Net realized gains/(losses) on futures contracts” on the Statement of Operations.
Summary of Derivative Instruments
The following is a summary of the values of derivative instruments on the Fund’s Statement of Assets and Liabilities, categorized by risk exposure, as of December 31, 2022:
Asset Derivatives | Liability Derivatives | |||||||||||
| Primary Risk Exposure | Statement of Assets and Liabilities Location | Total Value | Statement of Assets and Liabilities Location | Total Value | ||||||||
Equity Risk | ||||||||||||
| Futures Contracts | Receivable for variation margin on futures contracts* | $— | Payable for variation margin on futures contracts* | $222 | ||||||||
Interest Rate Risk | ||||||||||||
| Futures Contracts | Receivable for variation margin on futures contracts* | — | Payable for variation margin on futures contracts* | 73,880 | ||||||||
| * | For futures contracts, the amounts represent the cumulative appreciation/depreciation of these futures contracts as reported in the Schedule of Portfolio Investments. Only the current day’s variation margin, if any, is reported within the Statement of Assets and Liabilities as variation margin on futures contracts. |
The following is a summary of the effect of derivative instruments on the Statement of Operations, categorized by risk exposure, for the year ended December 31, 2022:
| Primary Risk Exposure | Location of Gains/(Losses) on Derivatives Recognized | Realized Gains/(Losses) on Derivatives Recognized | Change in Net Unrealized on Derivatives Recognized | |||||||
Equity Risk | ||||||||||
| Futures Contracts | Net realized gains/(losses) on futures contracts/ Change in net unrealized appreciation/ depreciation on futures contracts | $(2,860,225) | $(229,970) | |||||||
Interest Rate Risk | ||||||||||
| Futures Contracts | Net realized gains/(losses) on futures contracts/ Change in net unrealized appreciation/ depreciation on futures contracts | (1,057,713 | ) | (183,237 | ) | |||||
3. Fees and Transactions with Affiliates and Other Parties
The Manager provides investment advisory and management services for the Fund. The Manager has contractually agreed to waive fees and reimburse the Fund to limit the annual expenses, excluding interest expense (e.g., cash overdraft fees), taxes, brokerage commissions, acquired fund fees and expenses, other expenditures that are capitalized in accordance with U.S. GAAP and other extraordinary expenses not incurred in the ordinary course of the Fund’s business, based on the daily net assets of the Fund, through April 30, 2024. Expenses incurred for investment advisory and management services are reflected on the Statement of Operations as “Management fees.”
For the year ended December 31, 2022, the annual rate due to the Manager and the annual expense limit were as follows:
| Annual Rate | Annual Expense Limit | |||||||||
AZL MVP Moderate Index Strategy Fund | 0.10 | % | 0.15 | % | ||||||
Any amounts contractually waived or reimbursed by the Manager with respect to the annual expense limit in a particular fiscal year will be subject to repayment by the Fund to the Manager to the extent that from time to time through the next three fiscal years the repayment will not cause the Fund’s expenses to exceed the lesser of the stated limit at the time of the waiver or the current stated limit. Any amounts recouped by the Manager during the period are reflected on the Statement of Operations as “Recoupment of prior expenses reimbursed by the Manager.” At December 31, 2022, there were no remaining contractual reimbursements subject to repayment by the Fund in subsequent years.
9
AZL MVP Moderate Index Strategy Fund
Notes to the Financial Statements
December 31, 2022
Management fees, which the Manager may waive in order to maintain more competitive expense ratios, are not subject to repayment in subsequent years. Information on the total amount waived/reimbursed by the Manager or repaid to the Manager by the Fund during the period can be found on the Statement of Operations, as applicable. During the year ended December 31, 2022, there were no such waivers.
The Manager or an affiliate of the Manager serves as the investment adviser of certain underlying funds in which the Fund invests. At December 31, 2022, these underlying funds are noted as Affiliated Investment Companies in the Fund’s Schedule of Portfolio Investments. Additional information, including financial statements, about these Funds is available at www.allianzlife.com. The Manager or an affiliate of the Manager is paid a separate fee from the underlying funds for such services. A summary of the Fund’s investments in affiliated investment companies for the year ended December 31, 2022 is as follows:
Purchases at Cost | Proceeds from Sales | Net Realized Gains (Losses) | Change in Net Unrealized Appreciation (Depreciation) | Value 12/31/22 | Shares as of | Dividend Income | Net Realized Gains Distributions from Affiliated Underlying Funds | ||||||||||||||||||||||||||||||||||||||
AZL Enhanced Bond Index Fund | $ | 195,344,854 | $ | 2,533,602 | $ | (19,562,957) | $ | (3,240,933) | $ | (25,200,518) | $ | 149,874,048 | 15,809,499 | $ | 2,445,412 | $ | 88,191 | ||||||||||||||||||||||||||||
AZL International Index Fund, Class 2 | 79,559,857 | 3,393,602 | (9,094,375) | 742,165 | (15,328,985) | 59,272,264 | 3,884,159 | 1,831,990 | 1,561,612 | ||||||||||||||||||||||||||||||||||||
AZL Mid Cap Index Fund, Class 2 | 48,455,219 | 7,829,481 | (6,406,566) | 336,637 | (14,524,743) | 35,690,028 | 1,861,765 | 279,953 | 7,549,527 | ||||||||||||||||||||||||||||||||||||
AZL S&P 500 Index Fund, Class 2 | 150,357,182 | 17,587,842 | (13,450,996) | 3,580,897 | (46,725,891) | 111,349,034 | 6,573,142 | 1,292,507 | 15,296,433 | ||||||||||||||||||||||||||||||||||||
AZL Small Cap Stock Index Fund, Class 2 | 24,282,630 | 3,324,962 | (2,637,669) | 41,492 | (7,296,647) | 17,714,768 | 1,549,848 | 156,038 | 3,168,925 | ||||||||||||||||||||||||||||||||||||
|
|
|
|
|
|
|
|
|
|
|
|
|
|
|
|
|
| ||||||||||||||||||||||||||||
| $ | 497,999,742 | $ | 34,669,489 | $ | (51,152,563) | $ | 1,460,258 | $ | (109,076,784) | $ | 373,900,142 | 29,678,413 | $ | 6,005,900 | $ | 27,664,688 | |||||||||||||||||||||||||||||
|
|
|
|
|
|
|
|
|
|
|
|
|
|
|
|
|
| ||||||||||||||||||||||||||||
Pursuant to separate agreements between the Trust and the Manager, the Manager provides a Chief Compliance Officer (“CCO”) and certain compliance oversight and regulatory filing services to the Trust. Under these agreements, the Manager is entitled to an amount equal to a portion of the compensation and certain other expenses related to the individuals performing the CCO and compliance oversight services, as well as $100 per hour for time incurred in connection with the preparation and filing of certain documents with the SEC. The fees are paid to the Manager on a quarterly basis. The total expenses incurred by the Fund for these services are reflected on the Statement of Operations as “Administrative and compliance services fees.”
Citi Fund Services Ohio, Inc. (“Citi” or the “Administrator”), a wholly owned subsidiary of Citigroup, Inc., with which an officer of the Trust is affiliated, serves as the Trust’s administrator and fund accountant, and assists the Trust in all aspects of its administration and operation. The Administrator is entitled to a fee, accrued daily and paid monthly. The Administrator is entitled to an annual fee for each additional class of shares of any Fund, certain annual fees in supporting fair value services, and a Trust-wide annual fee for providing infrastructure and support in implementing the written policies and procedures comprising the Fund’s compliance program. The Administrator is also reimbursed for certain expenses incurred. The total expenses incurred by the Fund for these services are reflected on the Statement of Operations as “Administration fees.”
FIS Investor Services LLC (“FIS”) serves as the Fund’s transfer agent. Under the Transfer Agent Agreement, the Trust pays FIS a fee for its services and reimburses FIS for all of their reasonable out-of-pocket expenses incurred in providing these services.
The Bank of New York Mellon (“BNY Mellon” or the “Custodian”) serves as the Trust’s custodian. For these services as custodian, the Funds pay BNY Mellon a fee based on a percentage of assets held on behalf of the Funds, plus certain out-of-pocket charges.
Allianz Life Financial Services, LLC (“ALFS”), an affiliate of the Manager, serves as distributor of the Fund. ALFS receives an annual Trust-wide annual fee of $7,500, paid by the Manager from its profits and not by the Trust, for recordkeeping and reporting services.
Certain Officers and Trustees of the Trust are affiliated with the Manager or the Administrator. Such Officers (except for the Trust’s CCO as noted above) and Trustees receive no compensation from the Trust for serving in their respective roles.
4. Investment Valuation Summary
The valuation techniques employed by the Fund, as described below, maximize the use of observable inputs and minimize the use of unobservable inputs in determining fair value. The inputs used for valuing the Fund’s investments are summarized in the three broad levels listed below:
| ● | Level 1 - quoted prices in active markets for identical assets |
| ● | Level 2 - other significant observable inputs (including quoted prices for similar securities, interest rates, prepayments speeds, credit risk, etc.) |
| ● | Level 3 - significant unobservable inputs (including the Fund’s own assumptions in determining the fair value of investments) |
Changes in valuation techniques may result in transfers in or out of an assigned level within the disclosure hierarchy. The inputs or methodology used for valuing investments is not necessarily an indication of the risk associated with investing in those investments.
Investments in other investment companies are valued at their published net asset value (“NAV”). Security prices are determined pursuant to valuation procedures approved by the Trust’s Board of Trustees (the “Board” or “Trustees”) as of the close of the New York Stock Exchange (“NYSE”) (generally 4:00 pm Eastern Time). The investments utilizing Level 1 valuations represent investments in open-end investment companies. Futures contracts are valued at the settlement prices established each day on the primary exchange and are typically categorized as Level 1 in the fair value hierarchy.
The Board has designated the Manager to perform the Fund’s fair value determinations in accordance with valuation procedures approved by the Board. The effect of using fair value pricing is that the Fund’s NAV will be subject to the judgment of the Manager. The Manager’s fair valuation process is subject to the oversight of the Board.
10
AZL MVP Moderate Index Strategy Fund
Notes to the Financial Statements
December 31, 2022
The following is a summary of the valuation inputs used as of December 31, 2022 in valuing the Fund’s investments based upon the three levels defined above:
| Investment Securities: | Level 1 | Level 2 | Level 3 | Total | ||||||||||||||||||||||||||||||||||||
Affiliated Investment Companies | $373,900,142 | $— | $— | $373,900,142 | ||||||||||||||||||||||||||||||||||||
Unaffiliated Investment Company | 503,141 | — | — | 503,141 | ||||||||||||||||||||||||||||||||||||
|
|
|
|
|
|
|
| |||||||||||||||||||||||||||||||||
Total Investment Securities | 374,403,283 | — | — | 374,403,283 | ||||||||||||||||||||||||||||||||||||
|
|
|
|
|
|
|
| |||||||||||||||||||||||||||||||||
Other Financial Instruments:* | ||||||||||||||||||||||||||||||||||||||||
Futures Contracts | (74,102) | — | — | (74,102) | ||||||||||||||||||||||||||||||||||||
|
|
|
|
|
|
|
| |||||||||||||||||||||||||||||||||
Total Investments | $374,329,181 | $— | $— | $374,329,181 | ||||||||||||||||||||||||||||||||||||
|
|
|
|
|
|
|
| |||||||||||||||||||||||||||||||||
| * | Other Financial Instruments would include any derivative instruments, such as futures contracts. These investments are generally presented in the financial statements at variation margin. |
5. Security Purchases and Sales
For the year ended December 31, 2022, cost of purchases and proceeds from sales of securities (excluding securities maturing less than one year from acquisition) were as follows:
| Purchases | Sales | |||||||||
AZL MVP Moderate Index Strategy Fund | $ | 34,669,489 | $ | 51,152,563 | ||||||
6. Investment Risks
The risks below are presented in an order intended to facilitate readability. Their order does not imply that the realization of one risk is more likely to occur more frequently than another risk, nor does it imply that the realization of one risk is likely to have a greater adverse impact than another risk. The Fund may be subject to other risks in addition to these identified risks. This section discusses certain common principal risks encountered by the Fund.
Derivatives Risk: The Fund may invest directly or through affiliated or unaffiliated mutual funds or unregistered investment pools in derivative instruments such as futures, options, and options on futures. A derivative is a financial contract whose value depends on, or is derived from, the value of an underlying asset, reference rate, or risk. Use of derivative instruments involves risks different from, or possibly greater than, the risks associated with investing directly in securities and other traditional investments. Derivatives are subject to a number of other risks, such as liquidity risk, interest rate risk, market risk, credit risk, and selection risk. Derivatives also involve the risk of mispricing or improper valuation and the risk that changes in the value may not correlate perfectly with the underlying asset, rate, or index. Using derivatives may result in losses, possibly in excess of the principal amount invested. Also, suitable derivative transactions may not be available in all circumstances. The other party to a derivatives contract could default.
Foreign Securities Risk: Investing in the securities of non-U.S. issuers involves a number of risks, such as fluctuations in currency values, adverse political, social or economic developments, and differences in social and economic developments or policies. Such risks include future political and economic developments, and the possible imposition of exchange controls or other foreign governmental laws and restrictions. In addition, with respect to certain countries, there is the possibility of expropriation of assets, confiscatory taxation, political or social instability or diplomatic developments which could adversely affect investments in those securities. Certain foreign companies may be subject to sanctions, embargoes, or other governmental actions that may impair or otherwise limit the ability to invest in, receive, hold or sell the securities of such companies.
Fund of Fund Risk: The Fund, as a shareholder of the underlying funds, indirectly bears its proportionate share of any investment management fees and other expenses of the underlying funds. Further due to the fees and expenses paid by the Fund, as well as small variations in the Fund’s actual allocations to the underlying funds and any futures and cash held in the Fund’s portfolio, the performance and income distributions of the Fund will not be the same as the performance and income distributions of the underlying funds. In addition, the Fund maintains indirect exposure to various types of risk which may exist in the underlying Funds, such as foreign securities risk, fixed income securities risk and other risks.
Interest Rate Risk: Debt securities held by an underlying fund may decline in value due to rising interest rates. The price of a bond is also affected by its maturity. Bonds with longer maturities generally have greater sensitivity to changes in interest rates.
Market Risk: The market price of securities owned by the underlying funds may go up or down, sometimes rapidly and unpredictably. Securities may decline in value due to factors affecting securities markets generally or particular industries represented in the securities markets. The value of a security may decline due to general market conditions that are not specifically related to a particular company, such as real or perceived adverse economic conditions, changes in the general outlook for corporate earnings, changes in interest or currency rates, or adverse investor sentiment, as well as natural disasters, and outbreaks of infectious illnesses or other widespread public health issues.
Quantitative Investing Risk: The value of securities selected using quantitative analysis can react differently to issuer, political, market, and economic developments than the market as a whole or securities selected using only fundamental analysis. The factors used in quantitative analysis and the weight placed on those factors may not be predictive of a security’s value. In addition, factors that affect a security’s value can change over time and these changes may not be reflected in the quantitative model. A quantitative model can be adversely affected by errors or imperfections in the factors or the data on which evaluations are based, or by technical issues with construction or implementation of the model, which in any case may result in a failure of the portfolio to perform as expected or a failure to identify securities that will perform well in the future.
7. Coronavirus (COVID-19) Pandemic
The global outbreak of the COVID-19 strain of the coronavirus has caused adverse effects on many companies, sectors, nations, regions and the markets in general, and may continue for an unpredictable duration. The effects of this pandemic may adversely impact the value and performance of the Fund, its ability to buy and sell fund investments at appropriate valuations, and its ability to achieve its investment objective(s).
11
AZL MVP Moderate Index Strategy Fund
Notes to the Financial Statements
December 31, 2022
8. Federal Tax Information
It is the policy of the Fund to continue to qualify as a regulated investment company by complying with the provisions available to certain investment companies, as defined under Subchapter M of the Internal Revenue Code, and to make distributions of net investment income and net realized gains sufficient to relieve it from all, or substantially all, federal income taxes. Accordingly, no provisions for federal income taxes are required in the financial statements.
Management of the Fund has reviewed tax positions taken in tax years that remain subject to examination by all major tax jurisdictions, including federal (i.e., the last four tax year ends and the interim tax period since then, as applicable). Management believes that there is no tax liability resulting from unrecognized tax benefits related to uncertain tax positions taken.
Cost of securities, including derivatives and short positions as applicable, for federal income tax purposes at December 31, 2022 is $375,499,065. The gross unrealized appreciation/ (depreciation) on a tax basis is as follows:
Unrealized appreciation | $21,606,021 | ||||
Unrealized (depreciation) | (22,701,803) | ||||
|
| ||||
Net unrealized appreciation/(depreciation) | $(1,095,782) | ||||
|
|
The tax character of dividends paid to shareholders during the year ended December 31, 2022 was as follows:
| Ordinary Income | Net Long-Term | Total Distributions(a) | |||||||||||||
AZL MVP Moderate Index Strategy Fund | $ | 23,583,961 | $ | 21,582,597 | $ | 45,166,558 | |||||||||
| (a) | Total distributions paid may differ from the Statements of Changes in Net Assets because dividends are recognized when actually paid for tax purposes. |
The tax character of dividends paid to shareholders during the year ended December 31, 2021, was as follows:
| Ordinary Income | Net Long-Term | Total Distributions(a) | |||||||||||||
AZL MVP Moderate Index Strategy Fund | $ | 24,370,056 | $ | 21,247,441 | $ | 45,617,497 | |||||||||
| (a) | Total distributions paid may differ from the Statements of Changes in Net Assets because dividends are recognized when actually paid for tax purposes. |
At December 31, 2022, the components of accumulated earnings on a tax basis were as follows:
| Undistributed Ordinary Income | Undistributed Long-Term Capital Gains | Accumulated Capital and Other Losses | Unrealized Appreciation/ Depreciation(a) | Total Accumulated Earnings/ (Deficit) | |||||||||||||||||||||
AZL MVP Moderate Index Strategy Fund | $ | 7,277,589 | $ | 5,115,916 | $ | — | $ | (1,095,782 | ) | $ | 11,297,723 | ||||||||||||||
| (a) | The differences between book-basis and tax-basis unrealized appreciation/(depreciation) is attributable primarily to tax deferral of losses on wash sales, mark-to-market of futures contracts and straddles. |
9. Ownership and Principal Holders
The beneficial ownership, either directly or indirectly, of more than 25% of the voting securities of a fund creates presumptions of control of the fund, under section 2 (a)(9) of the 1940 Act. As of December 31, 2022, the Fund had an individual shareholder account which is affiliated with the Manager representing ownership in excess of 85% of the Fund.
Investment activities of this shareholder could have a material impact to the Fund.
10. Subsequent Events
Management of the Fund has evaluated the need for additional disclosures or adjustments resulting from events through the date the financial statements were issued. Based on this evaluation, there were no subsequent events to report that would have material impact on the Fund’s financial statements.
12
REPORT OF INDEPENDENT REGISTERED PUBLIC ACCOUNTING FIRM
To the Board of Trustees of Allianz Variable Insurance Products Fund of Funds Trust and Shareholders of
AZL MVP Moderate Index Strategy Fund
Opinion on the Financial Statements
We have audited the accompanying statement of assets and liabilities, including the schedule of portfolio investments, of AZL MVP Moderate Index Strategy Fund (one of the funds constituting Allianz Variable Insurance Products Fund of Funds Trust, referred to hereafter as the “Fund”) as of December 31, 2022, the related statement of operations for the year ended December 31, 2022, the statements of changes in net assets for each of the two years in the period ended December 31, 2022, including the related notes, and the financial highlights for each of the five years in the period ended December 31, 2022 (collectively referred to as the “financial statements”). In our opinion, the financial statements present fairly, in all material respects, the financial position of the Fund as of December 31, 2022, the results of its operations for the year then ended, the changes in its net assets for each of the two years in the period ended December 31, 2022 and the financial highlights for each of the five years in the period ended December 31, 2022 in conformity with accounting principles generally accepted in the United States of America.
Basis for Opinion
These financial statements are the responsibility of the Fund’s management. Our responsibility is to express an opinion on the Fund’s financial statements based on our audits. We are a public accounting firm registered with the Public Company Accounting Oversight Board (United States) (PCAOB) and are required to be independent with respect to the Fund in accordance with the U.S. federal securities laws and the applicable rules and regulations of the Securities and Exchange Commission and the PCAOB.
We conducted our audits of these financial statements in accordance with the standards of the PCAOB. Those standards require that we plan and perform the audit to obtain reasonable assurance about whether the financial statements are free of material misstatement, whether due to error or fraud.
Our audits included performing procedures to assess the risks of material misstatement of the financial statements, whether due to error or fraud, and performing procedures that respond to those risks. Such procedures included examining, on a test basis, evidence regarding the amounts and disclosures in the financial statements. Our audits also included evaluating the accounting principles used and significant estimates made by management, as well as evaluating the overall presentation of the financial statements. Our procedures included confirmation of securities owned as of December 31, 2022 by correspondence with the custodian, transfer agent and brokers. We believe that our audits provide a reasonable basis for our opinion.
/s/ PricewaterhouseCoopers LLP
New York, New York
February 23, 2023
We have served as the auditor of one or more investment companies in the Allianz Variable Insurance Products complex since 2018.
13
Other Federal Income Tax Information (Unaudited)
For the year ended December 31, 2022, 8.64% of the total ordinary income dividends paid by the Fund qualify for the corporate dividends received deductions available to corporate shareholders.
During the year ended December 31, 2022, the Fund declared net short-term capital gain distributions of $15,058,395.
During the year ended December 31, 2022, the Fund declared net long-term capital gain distributions of $21,582,597.
14
A description of the policies and procedures that the Fund uses to determine how to vote proxies relating to portfolio securities is available, without charge, upon request, by visiting the Securities and Exchange Commission’s (‘‘Commission’’) website at www.sec.gov, or by calling 800-624-0197.
Information regarding how the Fund voted proxies relating to portfolio securities during the most recent 12-month period ended June 30th is available (i) without charge, upon request, by calling 800-624-0197; (ii) on the Trust’s website at https://www.allianzlife.com; and (iii) on the Commission’s website at http://www.sec.gov.
The Fund files complete Schedules of Portfolio Holdings with the Commission for the first and third quarters of each fiscal year on Form N-PORT. Schedules of Portfolio Holdings for the Fund are available without charge on the Commission’s website at http://www.sec.gov, or may be obtained by calling 800-624-0197.
15
Approval of Investment Advisory Agreement (Unaudited)
Subject to the general supervision of the Board of Trustees (the “Board”) and in accordance with the investment objectives and restrictions of each separate series (each a “Fund,” together, the “Funds”) of the Allianz Variable Insurance Products Fund of Funds Trust (the “Trust”), investment advisory services are provided to the Funds by Allianz Investment Management LLC (the “Manager”). The Manager manages each Fund pursuant to an investment management agreement (the “Management Agreement”) with the Trust in respect of each such Fund. The Management Agreement provides that the Manager, subject to the supervision and approval of the Board, is responsible for the management of each Fund. For management services, each Fund pays the Manager an investment advisory fee based upon each Fund’s average daily net assets. The Manager has contractually agreed to limit the expenses of each Fund by reimbursing the Fund if and when total Fund operating expenses exceed certain amounts until at least April 30, 2024 (the “Expense Limitation Agreement”).
In reviewing the services provided by the Manager and the terms of the Management Agreement, the Board receives and reviews information related to the Manager’s experience and expertise in the variable insurance marketplace. In addition, the Board receives information regarding the Manager’s expertise with regard to portfolio diversification and asset allocation requirements within variable insurance products issued by Allianz Life Insurance Company of North America (“Allianz Life”) and its subsidiary, Allianz Life Insurance Company of New York (“Allianz of New York”). Currently, the Funds are offered only through Allianz Life and Allianz of New York variable products, and not in the retail fund market.
As required by the Investment Company Act of 1940 (the “1940 Act”), the Board has reviewed and approved the Management Agreement with the Manager. The Board’s decision to approve this contract reflects the exercise of its business judgment on whether to approve new arrangements and continue the existing arrangements. During its review of the contract, the Board considered many factors, among the most material of which are: the Fund’s investment objectives and long-term performance; the Manager’s management philosophy, personnel, processes and investment performance, including its compliance history and the adequacy of its compliance processes; the preferences and expectations of Fund shareholders (and underlying contract owners) and their relative sophistication; the continuing state of competition in the mutual fund industry; and comparable fees in the mutual fund industry.
The Board also considered the compensation and benefits received by the Manager. This includes fees received for services provided to a Fund by employees of the Manager or of affiliates of the Manager and research services received by the Manager from brokers that execute Fund trades, as well as advisory fees. The Board considered the fact that: (1) the Manager and the Trust are parties to an Administrative Services Agreement and a Compliance Services Agreement, under which the Manager is compensated by the Trust for performing certain administrative and compliance services including providing an employee of the Manager or one of its affiliates to act as the Trust’s Chief Compliance Officer; and (2) Allianz Life Financial Services, LLC, an affiliated person of the Manager, is a registered securities broker-dealer and received (along with its affiliated persons) payments made by the underlying funds pursuant to Rule 12b-1.
The Board is aware that various courts have interpreted provisions of the 1940 Act and have indicated in their decisions that the following factors may be relevant to an adviser’s compensation: the nature, extent and quality of the services provided by the adviser, including the performance of the fund; the adviser’s cost of providing the services; the extent to which the adviser may realize “economies of scale” as the fund grows larger; any indirect benefits that may accrue to the adviser and its affiliates as a result of the adviser’s relationship with the fund; performance and expenses of comparable funds; the profitability of acting as adviser to the fund; and the extent to which the independent Board members, who are not “interested persons” of a fund as defined by the 1940 Act (“Independent Trustees”), are fully informed about all facts bearing on the adviser’s services and fees. The Board is aware of these factors and takes them into account in its review of the Management Agreement for the Funds.
Each member of the Board considered and weighed these factors in light of his or her experience in governing the Trust. The Board is assisted in its deliberations by the advice of independent legal counsel to the Independent Trustees (“Independent Trustee Counsel”). In this regard, the Board requests and receives a significant amount of information about the Funds and the Manager. Some of this information is provided at each regular meeting of the Board; additional information is provided in connection with the particular meetings at which the Board’s formal review of the Management Agreement occurs. In between regularly scheduled meetings, the Board may receive information on particular matters as the need arises. Thus, the Board’s evaluation of the Management Agreement is informed by reports covering such matters as: the Manager’s investment philosophy, personnel and processes, and the Fund’s investment performance (in absolute terms as well as in relationship to its benchmark and certain competitor or “peer group” funds). In connection with comparing the performance of each Fund versus its benchmark, the Board receives reports on the extent to which the Fund’s performance may be attributed to various applicable factors, such as asset class allocation decisions and volatility management strategies, if applicable, the performance of the underlying funds, rebalancing decisions, and the impact of cash positions and Fund fees and expenses. The Board also receives reports on the Funds’ expenses (including the advisory fee itself and the overall expense structure of the Funds, both in absolute terms and relative to peer group and/or competing funds, with due regard for the Expense Limitation Agreement and additional voluntary expense limitations); the use and allocation of any brokerage commissions derived from trading the Funds’ portfolio securities; the nature, extent and quality of the advisory and other services provided to the Fund by the Manager and its affiliates; compliance and audit reports concerning the Funds and the companies that service them; and relevant developments in the mutual fund industry and how the Funds and/or the Manager are responding to them.
The Board also receives financial information about the Manager, including reports on the compensation and benefits the Manager derives from its relationships with the Funds. These reports cover not only the fees under the Management Agreement, but also the fees, if any, received for providing other services to the Funds. The reports also discuss any indirect or “fall-out” benefits the Manager or its affiliates may derive from their relationships with the Funds.
The Management Agreement was most recently considered at Board meetings held in the summer and fall of 2022. Information relevant to the approval of the Management Agreement was considered at Board meetings held June 14 and 21, 2022, and September 13, 2022, as well as at various other meetings preceding those meetings. Accordingly, the Management Agreement was approved by the Board at an in-person meeting on September 13, 2022. At such meeting the Board also approved the Expense Limitation Agreement between the Manager and the Trust for the period ending April 30, 2024.
In connection with such meetings, the Board requested and evaluated extensive materials from the Manager, including performance and expense information for other investment companies with similar investment objectives derived from data compiled by an independent third-party provider and other sources believed to be reliable by the Manager and the Trustees. Prior to voting, the Trustees reviewed the proposed approval of the Management Agreement with management and with Independent Trustee Counsel and received a memorandum from such counsel discussing the legal standards for their consideration of the proposed approval. The Independent Trustees also discussed the proposed approval in private sessions with Independent Trustee Counsel at which no representatives of the Manager were present. In reaching their determinations relating to the approval of the Management Agreement, in respect of each Fund, each member of the Board considered all factors he or she believed relevant. The Board based its decision to approve
16
the Management Agreement on the totality of the circumstances and relevant factors, and with a view to past and future long-term considerations. Not all of the factors and considerations discussed above and below are necessarily relevant to every Fund, and the Board did not assign relative weights to factors discussed herein or deem any one or group of them to be controlling in and of themselves.
Shareholder reports must include a discussion of certain factors relating to the selection of the investment adviser and the approval of the advisory fee. The “factors” enumerated by the SEC are set forth below in italics, as well as the Board’s conclusions regarding such factors:
(1) The nature, extent and quality of services provided by the Manager. The Trustees noted that the Manager, subject to the oversight of the Board, administers each Fund’s business and other affairs. The Trustees noted that the Manager also provides the Trust and each Fund with such administrative and other services (exclusive of, and in addition to, any such services provided by any other service providers retained by the Trust on behalf of the Funds) and executive and other personnel as are necessary for the operation of the Trust and the Funds. Except for the Trust’s Chief Compliance Officer and certain compliance staff, the Manager pays all of the compensation of Trustees and officers of the Trust who are employees of the Manager or its affiliates.
The Board considered the scope and quality of services provided by the Manager and noted that the scope of the services provided has continued to expand as a result of regulatory and other developments. The Board noted, for example, that the Manager is responsible for maintaining and monitoring its own compliance program, and this compliance program has been continuously refined and enhanced in light of new regulatory requirements. The Board considered the capabilities and resources which the Manager has dedicated to performing services on behalf of the Trust and its Funds. The quality of administrative and other services, including the Manager’s role in coordinating the activities of the Trust’s other service providers, also were considered. The Board concluded that, overall, they were satisfied with the nature, extent and quality of services provided (and expected to be provided) to the Trust and to each of the Funds under the Management Agreement.
(2) The investment performance of the Funds and the Manager. In connection with every quarterly Board meeting and the summer and fall 2022 contract review process, Trustees received extensive information on the performance results of each Fund. This included, for example, performance information on absolute total return, performance versus the appropriate benchmark(s) and performance versus peer groups as reported by Lipper, the contribution to performance of the Manager’s asset class allocation decisions and volatility management strategies, if applicable, the performance of the underlying funds, and the impact on performance of rebalancing decisions, cash and Fund fees. This included Lipper performance information on the Funds for the previous quarter, and previous one-, three- and five-year periods, to the extent available. For example, in connection with the Board meetings held June 14 and 21, 2022, and September 13, 2022, the Manager reported that, for the five-year period ended December 31, 2021, two Funds were in the top 40%, three were in the middle 20%, and seven were in the bottom 40% of their respective Lipper peer groups. The Manager reported that for the three-year period ended December 31, 2021, three Funds were in the top 40%, two were in the middle 20%, and seven were in the bottom 40% of their respective Lipper peer groups. For the one-year period ended December 31, 2021, six Funds were in the top 40%, two were in the middle 20%, and four were in the bottom 40% of their respective Lipper peer groups.
The Manager also reported on the performance of the MVP Funds compared to custom managed-volatility peer groups. For the five-year period ended December 31, 2021, four Funds were in the top 40%, two were in the middle 20%, and four were in the bottom 20%. For the three-year period ended December 31, 2021, four Funds were in the top 40%, two were in the middle 20%, and four were in the bottom 40% of their respective custom managed-volatility peer groups. For the one-year period ended December 31, 2021, seven Funds were in the top 40%, two were in the middle 20%, and one was in the bottom 40% of their respective custom managed-volatility peer groups. The Board members discussed with the Manager and considered the impact of the volatility management strategies on performance in different market environments, where applicable, and considered whether they were operating as intended. The Board noted, in particular, the impact of certain characteristics of the Funds’ volatility management strategies in relation to volatility experienced as a result of the COVID-19 pandemic, and that relative performance had improved as the markets stabilized.
At the Board meeting held September 13, 2022, the Board also received updated performance information for the Funds, including updated Lipper peer group ranking information, for various periods ending June 30, 2022.
At the Board meeting held September 13, 2022, the Trustees determined that the investment performance of the Funds was acceptable.
(3) The costs of services to be provided and profits to be realized by the Manager and its affiliates from the relationship with the Funds. The Board considered that the Manager receives an advisory fee from each of the Funds. The Manager reported that for the three MVP Fusion Funds the advisory fee paid put these Funds in the 13th percentile of the customized peer group. The Manager reported that for the four MVP Index Strategy Funds the advisory fee paid put them in the 23rd percentile of the customized peer group, and for the AZL Balanced Index Strategy Fund the advisory fee paid put it in the 7th percentile of the customized peer group. The Manager reported that for the AZL DFA Multi-Strategy Fund, the advisory fee paid was in the 5th percentile. The Manager reported that for the AZL MVP DFA Multi-Strategy, AZL MVP FIAM Multi-Strategy, and AZL MVP T. Rowe Price Capital Appreciation Plus Funds, the advisory fee paid was in the 1st percentile. (A lower percentile reflects lower fund fees and is better for fund shareholders.) Trustees were provided with information on the total expense ratios of the Funds and other funds in the customized peer groups, and the Manager reported upon the challenges in making peer group comparisons for the Funds. The Board further considered and found that the advisory fee paid to the Manager with respect to each Fund was based on services provided to the Fund that were in addition to, rather than duplicative of, the services provided pursuant to the advisory agreements for the underlying funds in which the Fund invests.
The Manager provided information concerning the profitability of the Manager’s investment advisory activities for the period from 2019 through 2021. The Board recognized that it is difficult to make comparisons of profitability from investment company advisory agreements because comparative information is not generally publicly available and is affected by numerous factors, including the structure of the particular adviser, the types of funds it manages, its business mix, numerous assumptions regarding allocation of expenses and the adviser’s capital structure and cost of capital. In considering profitability information, the Board considered the possible effect of certain fall-out benefits to the Manager and its affiliates. The Board focused on profitability of the Manager’s relationships with the Funds before taxes and distribution expenses. The Board recognized that the Manager should earn a reasonable level of profits for the services it provides to each Fund.
The Board also considered that Wilshire Funds Management (“Wilshire”) serves as a consultant to the Manager in preparing statistical and other factual information for use in the creation and maintenance of the asset allocation models for the AZL MVP Fusion Funds, pursuant to an agreement between the Manager and Wilshire. Wilshire serves as a consultant to the Manager with respect to selecting the AZL MVP Fusion Funds’ underlying funds and the asset allocations among the underlying funds. The Manager, not any Fund, pays a consultant fee to Wilshire.
(4) and (5) The extent to which economies of scale would be realized as the Funds grow, and whether fee levels reflect these economies of scale. The Board noted that the advisory fee schedules for the Funds do not contain breakpoints that reduce the fee rate on assets above specified levels. The Board recognized that breakpoints may be an appropriate way for the Manager to share its economies of scale, if any, with Funds that have substantial assets. The Board found there was no uniform methodology for establishing breakpoints
17
that give effect to Fund-specific services provided by the Manager. The Board noted that in the fund industry as a whole, as well as among funds similar to the Funds, there is no uniformity or pattern in the fees and asset levels at which breakpoints (if any) apply. Depending on the age, size, and other characteristics of a particular fund and its manager’s cost structure, different conclusions can be drawn as to whether there are economies of scale to be realized at any particular level of assets, notwithstanding the intuitive conclusion that such economies exist, or will be realized at some level of total assets. Moreover, because different managers have different cost structures and service models, it is difficult to draw meaningful conclusions from the breakpoints that may have been adopted by other funds. The Board also noted that the advisory agreements for many funds do not have breakpoints at all, or if breakpoints exist, they may be at asset levels significantly greater than those of the individual Funds. The Board noted that the total assets in all of the Funds, as of June 30, 2022, were approximately $8.2 billion and that the largest Fund, the AZL MVP Growth Index Strategy Fund, had assets of approximately $2.1 billion.
The Board noted that the Manager has agreed to temporarily limit Fund expenses under the Expense Limitation Agreement, which has the effect of reducing expenses similar to implementation of advisory fee breakpoints. The Manager has committed to continue to consider the continuation of expense limits and/or advisory fee breakpoints as Fund assets change. The Board receives quarterly reports on the level of Fund assets. The Board expects to continue to consider: (a) the extent to which economies of scale have been realized, and (b) whether the advisory fee should be modified, either in connection with the next renewal of the Management Agreement or by modifying the Expense Limitation Agreement, to reflect such economies of scale, if any.
Having taken these factors into account, the Board concluded that the absence of breakpoints in the Funds’ advisory fee rate schedules was acceptable under each Fund’s circumstances.
In conclusion, after full consideration of the above factors, as well as such other factors as each member of the Board considered instructive in evaluating the Management Agreement, the Board concluded that the advisory fees were reasonable, and that the continuation of the Management Agreement was in the best interest of the Funds.
18
Information about the Board of Trustees and Officers (Unaudited)
The Trust is managed by the Trustees in accordance with the laws of the state of Delaware governing business trusts. In addition to serving on the Board of Trustees of the Trust, each Trustee serves on the Board of the Allianz Variable Insurance Products Trust (“VIP Trust”) and the AIM ETF Products Trust (“ETF Trust”) (collectively, the Trust, the VIP Trust, and ETF Trust are the “AIM Complex”). There are currently seven Trustees, one of whom is an “interested person” of the Trust within the meaning of that term under the 1940 Act. The Trustees and Officers of the Trust, and their addresses, years of birth, their positions held with the Trust, their terms of office with the Trust and length of time served, their principal occupation(s) during the past five years, the number of portfolios in the Trust they oversee, and their other directorships held during the past five years are as follows:
Independent Trustees(1)
| Name, Address, and Birth Year | Positions Held with AIM Complex | Term of Office(2)/Length of Time Served | Principal Occupation(s) During Past 5 Years | Number of Portfolios Overseen for the AIM Complex | Other 5 Years | |||||
Peggy L. Ettestad (1957) 5701 Golden Hills Drive Minneapolis, MN 55416 | Lead Independent Trustee | Since 10/14 (Trustee since 2/07) | Managing Director, Red Canoe Management Consulting LLC, 2008 to present | 50 | None | |||||
Tamara Lynn Fagely (1958) 5701 Golden Hills Drive Minneapolis, MN 55416 | Trustee | Since 12/17 | Retired; previously, Chief Operations Officer, Hartford Funds, 2012 to 2013 | 50 | Diamond Hill Funds (10 Funds) | |||||
Richard H. Forde (1953) 5701 Golden Hills Drive Minneapolis, MN 55416 | Trustee | Since 12/17 | Retired; previously, Member of the Board and Chairman of the Finance and Investment Committee, Connecticut Water Service, Inc., 2013 to 2019 | 50 | Connecticut Water Service, Inc. | |||||
Jack Gee (1959) 5701 Golden Hills Drive Minneapolis, MN 55416 | Trustee | Since 1/22 (Consultant to the Independent Trustees since 2/20)(3) | Retired; previously, Managing Director, BlackRock, Inc., Treasurer and Chief Financial Officer U.S. iShares, 2004 to 2019 | 50 | Engine No. 1 ETF Trust (2 Funds); Esoterica Thematic Trust (2019 - 2020) | |||||
Claire R. Leonardi (1955) 5701 Golden Hills Drive Minneapolis, MN 55416 | Trustee | Since 2/04 | Retired; previously, CEO, Health eSense Inc. (a medical device company), 2015 to 2018, and Connecticut Innovations, Inc. (a venture capital firm), 2012 to 2015 | 50 | None | |||||
Dickson W. Lewis (1948) 5701 Golden Hills Drive Minneapolis, MN 55416 | Trustee | Since 2/04 | Retired; previously, senior executive for Lifetouch National School Studios (a photography company), 2006 to 2014, Jostens (a producer of year books and class rings), 2001 to 2006, and Fortis Financial Group, 1997 to 2001 | 50 | None | |||||
19
Interested Trustee(4)
| Name, Address, and Birth Year | Positions Held with AIM Complex | Term of Office(2)/Length of Time Served | Principal Occupation(s) During Past 5 Years | Number of Portfolios Overseen for the AIM Complex | Other 5 Years | |||||
Brian Muench (1970) 5701 Golden Hills Drive Minneapolis, MN 55416 | Trustee | Since 6/11 | President, Allianz Investment Management LLC, 2010 to present; Vice President, Allianz Life, 2011 to present | 50 | None | |||||
| (1) | Each of the Independent Trustees is a member of the Audit Committee. |
| (2) | Indefinite. |
| (3) | Prior to January 1, 2022, Mr. Gee served as a consultant to the Independent Trustees since February 2020, during which he attended meetings of the Board and its standing committees, including the audit committee, solely in his capacity as a consultant, and was not entitled to vote. |
| (4) | Is an “interested person,” as defined by the 1940 Act, due to employment by Allianz Life and the Manager. |
Officers
| Name, Address, and Birth Year | Positions Held with AIM Complex | Term of Office(1)/ Length of Time Served | Principal Occupation(s) During Past 5 Years | |||
Brian Muench (1970) 5701 Golden Hills Drive Minneapolis, MN 55416 | President | Since 11/10 | President, Allianz Investment Management LLC, November 2010 to present; Vice President, Allianz Life, 2011 to present. | |||
Erik Nelson (1972) 5701 Golden Hills Drive Minneapolis, MN 55416 | Secretary | Since 12/20 | Chief Legal Officer, Allianz Investment Management LLC; Associate General Counsel, Senior Counsel, Allianz Life, 2008 to present. | |||
Bashir C. Asad (1963) Citi Fund Services Ohio, Inc. 4400 Easton Commons, Suite 200 Columbus, OH 43219 | Treasurer, Principal Accounting Officer and Principal Financial Officer | Since 06/16 | Senior Vice President, Citi Fund Services Ohio, Inc., 2011 to present. | |||
Chris R. Pheiffer (1968) 5701 Golden Hills Drive Minneapolis, MN 55416 | Chief Compliance Officer(2) and Anti-Money Laundering Compliance Officer | Since 02/14 | Chief Compliance Officer of the Trust and the VIP Trust, 2014 to present, and the ETF Trust, 2020 to present. | |||
Michael Tanski (1970) 5701 Golden Hills Drive Minneapolis, MN 55416 | Vice President | Since 04/09 | Assistant Vice President, Allianz Investment Management LLC, 2013 to present. | |||
| (1) | Indefinite. |
| (2) | The Manager and the Trust are parties to a Compliance Services Agreement under which the Manager provides an employee of the Manager or one of its affiliates to act as the Trust’s Chief Compliance Officer. |
The Fund’s Statement of Additional Information (“SAI”) contains additional information about the Trust’s Trustees and Officers. The SAI is available without charge, upon request, by calling toll-free 800-624-0197 or at https://www.allianzlife.com.
20

| The Allianz VIP Fund of Funds are distributed by Allianz Life Financial Services, LLC. | ||
| These Funds are not FDIC Insured. | ANNRPT1222 02/23 |
AZL® MVP T. Rowe Price Capital Appreciation Plus Fund
Annual Report
December 31, 2022

Table of Contents
Management Discussion and Analysis
Page 1
Expense Examples and Portfolio Composition
Page 3
Schedule of Portfolio Investments
Page 4
Statement of Assets and Liabilities
Page 5
Statement of Operations
Page 5
Statements of Changes in Net Assets
Page 6
Financial Highlights
Page 7
Notes to the Financial Statements
Page 8
Report of Independent Registered Public Accounting Firm
Page 13
Other Federal Income Tax Information
Page 14
Other Information
Page 15
Approval of Investment Advisory Agreement
Page 16
Information about the Board of Trustees and Officers
Page 19
This report is submitted for the general information of the shareholder of the Fund. The report is not authorized for distribution to prospective investors in the Fund unless preceded or accompanied by an effective prospectus, which contains details concerning the sales charges and other pertinent information.
AZL® MVP T. Rowe Price Capital Appreciation Plus Fund Review (Unaudited)
Allianz Investment Management LLC serves as the Manager for the AZL® MVP T. Rowe Price Capital Appreciation Plus Fund.
|
What factors affected the Fund’s performance during the year ended December 31, 2022?*
For the year ended December 31, 2022, the AZL® MVP T. Rowe Price Capital Appreciation Plus Fund (the “Fund”) returned (13.71)%. That compared to (18.11)%, (13.01)% and (15.91)% total return for its benchmarks, the S&P 500 Index, the Bloomberg U.S. Aggregate Bond Index, and the Moderate Composite Index, respectively.1
The Fund is a fund of funds that invests primarily in a combination of three underlying mutual funds (the “Underlying Funds”). The Fund is designed to provide a diversified portfolio consisting of Underlying Funds in equity and fixed income asset classes.
The Fund also employs the MVP (Managed Volatility Portfolio) risk management process, which is intended to adjust the risk of the portfolio based on quantitative indicators of market risk, such as the current level of fund and market volatility.
Major U.S. stock indexes fell sharply in 2022, the worst year for equities since the 2008 global financial crisis. Investors shunned riskier assets in response to Russia’s invasion of Ukraine, elevated inflation exacerbated by rising commodity prices and global supply chain disruptions, surging U.S. Treasury yields and the Federal Reserve’s short-term interest rate increases starting in mid-March.
Although many indexes finished the year above their lowest levels of 2022, many investors remained concerned that ongoing Fed rate hikes would hurt corporate earnings and push the economy into a recession in 2023.
The equity portion of the Fund modestly outperformed the S&P 500 Index. Meanwhile, its fixed income holdings posted a negative return during the one-year period but strongly outperformed the Bloomberg U.S. Aggregate Bond Index. Within equities, stock selection in consumer discretionary and information technology contributed the most to relative performance. Conversely, energy detracted from relative results due to sector allocation effects.
Within fixed income, the Fund’s above-benchmark exposure to bank loans improved relative results, as the asset class was one of the best performing areas of the fixed income markets during the year.
Overall, the Fund’s exposure to equities decreased during the period, as the Fund trimmed select stocks in the consumer discretionary and utilities sectors. In contrast, the Fund’s overall weight in fixed income increased during the year, as an underlying fund started a position in U.S. Treasuries. The Fund’s cash position declined compared to the beginning of the period as a result of these shifts.
During the year, the Fund maintained exposure to covered call options, a type of derivative that is designed to provide downside protection for the portfolio while offering the benefits of owning a stock, such as dividends and capital appreciation, so long as the stock remains below the option strike price. The Fund’s covered call strategy made a moderately positive contribution to returns.
The MVP risk management process utilizes derivatives in an effort to control portfolio volatility in unstable market conditions. Market volatility was relatively high during 2022, therefore the MVP process was engaged and reduced the Fund’s equity exposure at multiple points during the year. The MVP process contributed positively to the Fund’s performance during 2022.
Past performance does not guarantee future results.
| * | The Fund’s portfolio composition is subject to change. There is no guarantee that any sectors mentioned will continue to perform as described or that securities in such sectors will be held by the Fund in the future. The information contained in this commentary is for informational purposes only and should not be construed as a recommendation to purchase or sell securities in the sector mentioned. The Fund’s holdings and weightings are as of December 31, 2022. |
| 1 | For a complete description of the Fund’s performance benchmark please refer to page 2 of this report. |
1
AZL® MVP T. Rowe Price Capital Appreciation Plus Fund Review (Unaudited)
Fund Objective
The Fund’s investment objective is to seek long-term capital appreciation with preservation of capital as an important intermediate-term objective. This objective may be changed by the Trustees of the Fund without shareholder approval. The Fund seeks to achieve its objective by investing in a combination of Underlying Funds that represent different classes in the Fund’s asset allocation.
Investment Concerns
The Fund invests in underlying funds, so its investment performance is directly related to the performance of those underlying funds. Before investing, investors should assess the risks associated with and types of investments made by each of the underlying funds in which the Fund invests. The performance of the underlying funds is expected to be lower than that of the Indexes because of fees and expenses. Securities in which the underlying funds will invest may involve substantial risk and may be subject to sudden severe price declines.
Quantitative investing involves risk that the values of securities selected in the quantitative analysis can react differently than the market or securities selected using fundamental analysis.
Stocks are more volatile and carry more risk than other forms of investments, including investments in high-grade fixed income securities. Small- to mid-capitalization companies typically have a higher risk of failure and historically have experienced a greater degree of volatility. International investing may involve risk of capital loss from unfavorable fluctuations in currency values, from differences in generally accepted accounting principles or from economic or political instability in other nations.
Investing in a single industry or sector, or concentrating investments in a limited number of industries or sectors, tends to increase the risk that economic, political, or regulatory developments affecting certain industries or sectors will have a large impact on the value of the portfolio.
High-yield bonds have a higher risk of default or other adverse credit events, but have the potential to pay higher earnings over investment-grade bonds. The higher risk of default, or the inability of the creditor to repay its debt, is the primary reason for the higher interest rates on high-yield bonds. Mortgage-backed investments involve risk of loss due to prepayments and, like any bond, due to default. Because of the sensitivity of mortgage-related securities to changes in interest rates, an underlying fund’s performance may be more volatile than if it did not hold these securities. Debt securities held by an underlying fund may decline in value due to rising interest rates. |
Investing in derivative instruments involves risks that may be different from or greater than the risk associated with investing directly in securities or other traditional instruments.
For a complete description of these and other risks associated with investing in the Fund, please refer to the Fund’s prospectus. |
Growth of $10,000 Investment
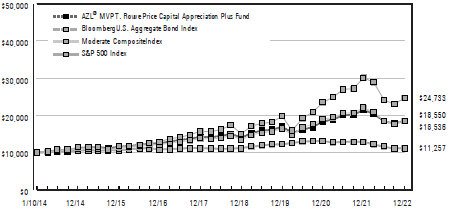
The chart above represents a comparison of a hypothetical investment in the Fund versus a similar investment in the Fund’s benchmarks and represents the reinvestment of dividends and capital gains in the Fund.
Average Annual Total Returns as of December 31, 2022
| 1 Year | 3 Years | 5 Years | Since Inception (1/10/14) | |||||||||||
AZL® MVP T. Rowe Price Capital Appreciation Plus Fund | (13.71 | )% | 2.95 | % | 5.42 | % | 7.12% | |||||||
Bloomberg U.S. Aggregate Bond Index | (13.01 | )% | (2.71 | )% | 0.02 | % | 1.33% | |||||||
Moderate Composite Index | (15.91 | )% | 4.00 | % | 6.07 | % | 7.13% | |||||||
S&P 500 Index | (18.11 | )% | 7.66 | % | 9.42 | % | 10.62% | |||||||
Past performance does not guarantee future results. The performance data quoted represents past performance and current returns may be lower or higher. The investment return and principal value will fluctuate so that an investor’s shares, when redeemed, may be worth more or less than the original cost. To obtain performance information current to the most recent month end, please visit www.Allianzlife.com.
| Expense Ratio | Gross | |
AZL® MVP T. Rowe Price Capital Appreciation Plus Fund | 0.87% |
The above expense ratio is based on the current Fund prospectus dated April 29, 2022. The Manager and the Fund have entered into a written contract limiting operating expenses, excluding certain expenses (such as interest expense and acquired fund fees and expenses), to 0.15% through April 30, 2024. Additional information pertaining to the December 31, 2022 expense ratio can be found in the Financial Highlights.
Acquired fund fees and expenses are incurred indirectly by the Fund through the valuation of the Fund’s investments in the permitted Underlying Funds. Accordingly, acquired fund fees and expenses affect the Fund’s total returns. Because these fees and expenses are not included in the Fund’s financial highlights, the Fund’s total annual fund operating expenses, as shown in the current prospectus, do not correlate to the ratios of expenses to average net assets shown in the Financial Highlights. Without acquired fund fees and expenses the Fund’s gross expense ratio would be 0.12%.
The total return of the Fund does not reflect the effect of any insurance charges, the annual maintenance fee or the deduction of taxes that a shareholder would pay on Fund distributions or the redemption of Fund shares. Such charges, fees and tax payments would reduce the performance quoted.
The Fund’s performance is measured against the Standard and Poor’s 500 Index (“S&P 500”), the Bloomberg U.S. Aggregate Bond Index and the Moderate Composite Index (“Composite”). The S&P 500 is representative of 500 selected common stocks, most of which are listed on the New York Stock Exchange, and is a measure of the U.S. Stock market as a whole. The Bloomberg U.S. Aggregate Bond Index is a market value-weighted performance benchmark for investment-grade fixed-rate debt issues, including government, corporate, asset-backed, and mortgage-backed securities, with maturities of at least one year. The Composite is a blended index comprised of (60%) of the S&P 500 and (40%) of the Bloomberg U.S. Aggregate Bond Index. These indexes are unmanaged and do not reflect the deduction of fees associated with a mutual fund, such as investment management and fund accounting fees. The Fund’s performance reflects the deduction of fees for services provided to the Fund. Investors cannot invest directly in an index.
2
AZL MVP T. Rowe Price Capital Appreciation Plus Fund
Expense Examples
(Unaudited)
As a shareholder of the AZL MVP T. Rowe Price Capital Appreciation Plus Fund (the “Fund”), you incur ongoing costs, including management fees, distribution fees, and other Fund expenses. These examples are intended to help you understand your ongoing costs (in dollars) of investing in the Fund and to compare these costs with the ongoing costs of investing in other mutual funds. Please note that the expenses shown in each table do not reflect expenses that apply to the subaccount or the insurance contract. If the expenses that apply to the subaccount or the insurance contract were included, your costs would have been higher.
These examples are based on an investment of $1,000 invested at the beginning of the period and held for the periods presented below.
The Actual Expense table below provides information about actual account values and actual expenses. You may use the information below, together with the amount you invested, to estimate the expenses that you paid over the period. Simply divide your account value by $1,000 (for example, an $8,600 account value divided by $1,000 = 8.6), then multiply the result by the number in the table under the heading entitled “Expenses Paid During Period” to estimate the expenses you paid on your account during this period.
| Beginning Account Value 7/1/22 | Ending Account Value 12/31/22 | Expenses Paid During Period 7/1/22 - 12/31/22* | Annualized Expense Ratio During Period 7/1/22 - 12/31/22 | |||||
AZL MVP T. Rowe Price Capital Appreciation Plus Fund | $1,000.00 | $1,005.10 | $0.61 | 0.12% |
The Hypothetical Expense table below provides information about hypothetical account values and hypothetical expenses based on the Fund’s actual expense ratio and an assumed rate of return of 5% per year before expenses, which is not the Fund’s actual return. The hypothetical account values and expenses may not be used to estimate the actual ending account balance or expenses you paid for the period. You may use this information to compare this 5% hypothetical example with the 5% hypothetical examples that appear in the shareholder reports of other funds.
| Beginning Account Value 7/1/22 | Ending Account Value 12/31/22 | Expenses Paid During Period 7/1/22 - 12/31/22* | Annualized Expense Ratio During Period 7/1/22 - 12/31/22 | |||||
AZL MVP T. Rowe Price Capital Appreciation Plus Fund | $1,000.00 | $1,024.60 | $0.61 | 0.12% |
| * | Expenses are equal to the average account value multiplied by the Fund’s annualized expense ratio multiplied by 184/365 (the number of days in the most recent fiscal half-year divided by the number of days in the fiscal year). |
Portfolio Composition
(Unaudited)
| Investments | Percent of Net Assets | |||
Domestic Equity Funds | 77.3 | % | ||
Fixed Income Fund | 17.5 | |||
Unaffiliated Investment Company | 0.3 | |||
Total Investment Securities | 95.1 | |||
Net other assets (liabilities) | 4.9 | |||
Net Assets | 100.0 | % | ||
3
AZL MVP T. Rowe Price Capital Appreciation Plus Fund
Schedule of Portfolio Investments
December 31, 2022
| Shares | Value | |||||||||||
|
| |||||||||||
Affiliated Investment Companies (94.8%): | ||||||||||||
Domestic Equity Funds (77.3%): | ||||||||||||
| 18,317,192 | AZL S&P 500 Index Fund, Class 2 | $ | 310,293,240 | |||||||||
| 35,691,746 | AZL T. Rowe Price Capital Appreciation Fund | 580,347,796 | ||||||||||
|
| |||||||||||
| 890,641,036 | ||||||||||||
|
| |||||||||||
Fixed Income Fund (17.5%): | ||||||||||||
| 21,323,716 | AZL Enhanced Bond Index Fund | 202,148,827 | ||||||||||
|
| |||||||||||
| | Total Affiliated Investment Companies (Cost $1,076,033,070) | 1,092,789,863 | ||||||||||
|
| |||||||||||
| Shares | Value | |||||||
| ||||||||
Unaffiliated Investment Company (0.3%): | ||||||||
Money Markets (0.3%): | ||||||||
| 3,484,965 | Dreyfus Treasury Securities Cash Management | |||||||
| Fund, Institutional Shares, 3.90%(a) | $ | 3,484,965 | ||||||
| Total Unaffiliated Investment Company (Cost $3,484,965) | 3,484,965 | |||||||
|
| |||||||
| Total Investment Securities | ||||||||
| (Cost $1,079,518,035) — 95.1%(b) | 1,096,274,828 | |||||||
| Net other assets (liabilities) — 4.9% | 56,059,024 | |||||||
|
| |||||||
| Net Assets — 100.0% | $ | 1,152,333,852 | ||||||
|
| |||||||
| (a) | The rate represents the effective yield at December 31, 2022. |
| (b) | See Federal Tax Information listed in the Notes to the Financial Statements. |
Percentages indicated are based on net assets as of December 31, 2022
Futures Contracts
At December 31, 2022, the Fund’s open futures contracts were as follows:
Short Futures
| Description | Expiration Date | Number of Contracts | Notional Amount | Value and Unrealized Appreciation/ (Depreciation) | ||||||||||||
| ||||||||||||||||
S&P 500 Index E-Mini March Futures (U.S. Dollar) | 3/17/23 | 47 | $ | (9,073,350 | ) | $ | (31,525) | |||||||||
|
| |||||||||||||||
Long Futures | ||||||||||||||||
| Description | Expiration Date | Number of Contracts | Notional Amount | Value and Unrealized Appreciation/ (Depreciation) | ||||||||||||
| ||||||||||||||||
U.S. Treasury 10-year Note March Futures (U.S. Dollar) | 3/22/23 | 214 | $ | 24,031,531 | $ | (242,650) | ||||||||||
|
| |||||||||||||||
Total Net Futures Contracts | $ | (274,175) | ||||||||||||||
|
| |||||||||||||||
See accompanying notes to the financial statements.
4
AZL MVP T. Rowe Price Capital Appreciation Plus Fund
Statement of Assets and Liabilities | Statement of Operations | |
December 31, 2022 | For the Year Ended December 31, 2022 |
Assets: | ||||
Investments in non-affiliates, at cost | $ | 3,484,965 | ||
Investments in affiliates, at cost | 1,076,033,070 | |||
|
| |||
Investments in non-affiliates, at value | 3,484,965 | |||
Investments in affiliates, at value | $ | 1,092,789,863 | ||
Deposit at broker for futures contracts collateral | 55,781,159 | |||
Interest and dividends receivable | 167,754 | |||
Receivable for affiliated investments sold | 407,858 | |||
Prepaid expenses | 10,534 | |||
|
| |||
Total Assets | 1,152,642,133 | |||
|
| |||
Liabilities: | ||||
Payable for capital shares redeemed | 87,000 | |||
Payable for variation margin on futures contracts | 81,832 | |||
Management fees payable | 98,899 | |||
Administration fees payable | 7,784 | |||
Custodian fees payable | 609 | |||
Administrative and compliance services fees payable | 2,486 | |||
Transfer agent fees payable | 639 | |||
Trustee fees payable | 6,211 | |||
Other accrued liabilities | 22,821 | |||
|
| |||
Total Liabilities | 308,281 | |||
|
| |||
Net Assets | $ | 1,152,333,852 | ||
|
| |||
Net Assets Consist of: | ||||
Paid in capital | $ | 1,118,014,430 | ||
Total distributable earnings | 34,319,422 | |||
|
| |||
Net Assets | $ | 1,152,333,852 | ||
|
| |||
Shares of beneficial interest (unlimited number of shares authorized, no par value) | 102,656,588 | |||
Net Asset Value (offering and redemption price per share) | $ | 11.23 | ||
|
| |||
Investment Income: | ||||
Dividends from affiliates | $ | 11,311,927 | ||
Interest | 896,606 | |||
Dividends from non-affiliates | 2,277 | |||
|
| |||
Total Investment Income | 12,210,810 | |||
|
| |||
Expenses: | ||||
Management fees | 1,259,102 | |||
Administration fees | 71,438 | |||
Custodian fees | 3,746 | |||
Administrative and compliance services fees | 17,091 | |||
Transfer agent fees | 5,819 | |||
Trustee fees | 68,240 | |||
Professional fees | 58,164 | |||
Shareholder reports | 26,373 | |||
Other expenses | 18,978 | |||
|
| |||
Total expenses | 1,528,951 | |||
|
| |||
Net Investment Income/(Loss) | 10,681,859 | |||
|
| |||
Net realized and Change in net unrealized gains/losses on investments: | ||||
Net realized gains/(losses) on affiliated underlying funds | 4,451,953 | |||
Net realized gains distributions from affiliated underlying funds | 131,728,022 | |||
Net realized gains/(losses) on futures contracts | (1,514,306) | |||
Change in net unrealized appreciation/depreciation on | (342,434,978) | |||
Change in net unrealized appreciation/depreciation on futures contracts | (1,241,084) | |||
|
| |||
Net realized and Change in net unrealized gains/losses on investments | (209,010,393) | |||
|
| |||
Change in Net Assets Resulting From Operations | $ | (198,328,534) | ||
|
|
See accompanying notes to the financial statements.
5
AZL MVP T. Rowe Price Capital Appreciation Plus Fund
Statements of Changes in Net Assets
For the Year Ended December 31, 2022 | For the Year Ended December 31, 2021 | |||||||
| ||||||||
Change In Net Assets: | ||||||||
Operations: | ||||||||
Net investment income/(loss) | $ | 10,681,859 | $ | 11,277,080 | ||||
Net realized gains/(losses) on investments | 134,665,669 | 152,587,780 | ||||||
Change in unrealized appreciation/depreciation on investments | (343,676,062) | 63,749,923 | ||||||
|
|
|
| |||||
Change in net assets resulting from operations | (198,328,534) | 227,614,783 | ||||||
|
|
|
| |||||
Distributions to Shareholders: | ||||||||
Distributions | (163,081,942) | (117,162,627) | ||||||
|
|
|
| |||||
Change in net assets resulting from distributions to shareholders | (163,081,942) | (117,162,627) | ||||||
|
|
|
| |||||
Capital Transactions: | ||||||||
Proceeds from shares issued | 9,252,790 | 27,760,813 | ||||||
Proceeds from dividends reinvested | 163,081,942 | 117,162,627 | ||||||
Value of shares redeemed | (136,568,768) | (150,065,830) | ||||||
|
|
|
| |||||
Change in net assets resulting from capital transactions | 35,765,964 | (5,142,390) | ||||||
|
|
|
| |||||
Change in net assets | (325,644,512) | 105,309,766 | ||||||
Net Assets: | ||||||||
Beginning of period | 1,477,978,364 | 1,372,668,598 | ||||||
|
|
|
| |||||
End of period | $ | 1,152,333,852 | $ | 1,477,978,364 | ||||
|
|
|
| |||||
Share Transactions: | ||||||||
Shares issued | 697,803 | 1,873,539 | ||||||
Dividends reinvested | 14,678,843 | 8,147,610 | ||||||
Shares redeemed | (10,374,116) | (9,940,639) | ||||||
|
|
|
| |||||
Change in shares | 5,002,530 | 80,510 | ||||||
|
|
|
| |||||
See accompanying notes to the financial statements.
6
AZL MVP T. Rowe Price Capital Appreciation Plus Fund
Financial Highlights
(Selected data for a share of beneficial interest outstanding throughout the periods indicated. Does not reflect fees or expenses associated with the separate accounts that invest in the Fund or in any variable annuity contracts or variable life insurance policy for which the Fund serves as an investment vehicle.)
| Year Ended December 31, 2022 | Year Ended December 31, 2021 | Year Ended December 31, 2020 | Year Ended December 31, 2019 | Year Ended December 31, 2018 | ||||||||||||||||
Net Asset Value, Beginning of Period | $15.13 | $14.07 | $13.85 | $11.96 | $12.71 | |||||||||||||||
|
|
|
|
|
|
|
|
|
| |||||||||||
Investment Activities: | ||||||||||||||||||||
Net Investment Income/(Loss) | 0.11 | (a) | 0.12 | (a) | 0.19 | (a) | 0.25 | (a) | 0.16 | |||||||||||
Net Realized and Unrealized Gains/(Losses) on Investments | (2.21 | ) | 2.21 | 0.87 | 2.27 | (0.34 | ) | |||||||||||||
|
|
|
|
|
|
|
|
|
| |||||||||||
Total from Investment Activities | (2.10 | ) | 2.33 | 1.06 | 2.52 | (0.18 | ) | |||||||||||||
|
|
|
|
|
|
|
|
|
| |||||||||||
Distributions to Shareholders From: | ||||||||||||||||||||
Net Investment Income | (1.02 | ) | (0.55 | ) | (0.39 | ) | (0.25 | ) | (0.13 | ) | ||||||||||
Net Realized Gains | (0.78 | ) | (0.72 | ) | (0.45 | ) | (0.38 | ) | (0.44 | ) | ||||||||||
|
|
|
|
|
|
|
|
|
| |||||||||||
Total Dividends | (1.80 | ) | (1.27 | ) | (0.84 | ) | (0.63 | ) | (0.57 | ) | ||||||||||
|
|
|
|
|
|
|
|
|
| |||||||||||
Net Asset Value, End of Period | $11.23 | $15.13 | $14.07 | $13.85 | $11.96 | |||||||||||||||
|
|
|
|
|
|
|
|
|
| |||||||||||
Total Return (b) | (13.71 | )% | 17.04 | % | 8.02 | % | 21.39 | % | (1.67 | )% | ||||||||||
Ratios to Average Net Assets/Supplemental Data: | ||||||||||||||||||||
Net Assets, End of Period (000’s) | $1,152,334 | $1,477,978 | $1,372,669 | $1,325,661 | $1,083,375 | |||||||||||||||
Net Investment Income/(Loss) | 0.85 | % | 0.78 | % | 1.41 | % | 1.90 | % | 1.27 | % | ||||||||||
Expenses Before Reductions*(c) | 0.12 | % | 0.12 | % | 0.12 | % | 0.12 | % | 0.12 | % | ||||||||||
Expenses Net of Reductions* | 0.12 | % | 0.12 | % | 0.12 | % | 0.12 | % | 0.12 | % | ||||||||||
Portfolio Turnover Rate | 10 | % | 10 | % | 10 | % | 5 | % | 5 | % | ||||||||||
| * | The expense ratios exclude the impact of fees/expenses paid by each underlying fund. |
| (a) | Calculated using the average shares method. |
| (b) | The returns include reinvested dividends and fund level expenses, but exclude insurance contract charges. If these charges were included, the returns would have been lower. |
| (c) | Excludes fee reductions. If such fee reductions had not occurred, the ratios would have been as indicated. |
See accompanying notes to the financial statements.
7
AZL MVP T. Rowe Price Capital Appreciation Plus Fund
Notes to the Financial Statements
December 31, 2022
1. Organization
The Allianz Variable Insurance Products Fund of Funds Trust (the “Trust”) was organized as a Delaware statutory trust on June 16, 2004. The Trust is an open-end management investment company registered under the Investment Company Act of 1940, as amended, (the “1940 Act”) and thus is determined to be an investment company, and follows the investment company accounting and reporting guidance under Financial Accounting Standards Board (“FASB”) Accounting Standards Codification (“ASC”) Topic 946 “Financial Services—Investment Companies”. The Trust consists of 12 separate investment portfolios (collectively, the “Funds”), of which one is included in this report, the AZL MVP T. Rowe Price Capital Appreciation Plus Fund (the “Fund”), and 11 are presented in separate reports. The Fund is a diversified series of the Trust.
The Fund is a “fund of funds”, which means that the Fund invests primarily in other mutual funds (the “Underlying Funds”). Underlying Funds invest in stocks, bonds, and other securities and reflect varying amounts of potential investment risk and reward. The Underlying Funds record their investments at fair value. Periodically, the Fund will adjust its asset allocation as it seeks to achieve its investment objective.
The Trust is authorized to issue an unlimited number of shares of the Fund without par value. Shares of the Fund are available through the variable annuity contracts offered through the separate accounts of participating insurance companies. Currently, the Fund only offers its shares to separate accounts of Allianz Life Insurance Company of North America and Allianz Life Insurance Company of New York, affiliates of the Trust and the Manager, as defined below.
Under the Trust’s organizational documents, its officers and trustees are indemnified against certain liabilities arising out of the performance of their duties to the Fund. In addition, in the normal course of business, the Fund may enter into contracts with its vendors and others that provide for general indemnifications. The Fund’s maximum exposure under these arrangements is unknown, as this would involve future claims that may be made against the Fund. However, based on experience, the Fund expects that risk of loss to be remote.
2. Significant Accounting Policies
The following is a summary of significant accounting policies followed by the Fund in the preparation of its financial statements. The policies conform with U.S. generally accepted accounting principles (“U.S. GAAP”). The preparation of financial statements requires management to make certain estimates and assumptions that affect the reported amounts of assets and liabilities and disclosure of contingent assets and liabilities at the date of the financial statements and the reported amounts of increases and decreases in net assets from operations during the reporting period. Actual results could differ from those estimates.
Security Valuation
The Fund records its investments at fair value. Fair value is defined as the price that would be received to sell an asset or paid to transfer a liability in an orderly transaction between willing market participants at the measurement date. The valuation techniques used to determine fair value are further described in Note 4 below.
Investment Transactions and Investment Income
Investment transactions are accounted for on trade date. Net realized gains and losses on investments sold and on foreign currency transactions are recorded on the basis of identified cost. Interest income is recorded on the accrual basis and includes, where applicable, the amortization of premiums or accretion of discounts. Dividend income is recorded on the ex-dividend date except in the case of foreign securities, in which case dividends are recorded as soon as such information becomes available.
Distributions to Shareholders
Distributions to shareholders are recorded on the ex-dividend date. The Fund distributes its dividends from net investment income and net realized capital gains, if any, on an annual basis. The amount of distributions from net investment income and from net realized gains is determined in accordance with federal income tax regulations, which may differ from U.S. GAAP. These “book/tax” differences are either temporary or permanent in nature. To the extent these differences are permanent in nature (e.g., return of capital, net operating loss, reclassification of certain market discounts, gain/loss, paydowns, and distributions), such amounts are reclassified within the composition of net assets based on their federal tax-basis treatment; temporary differences (e.g., wash sales and differing treatment on certain investments) do not require reclassification. Distributions to shareholders that exceed net investment income and net realized gains for tax purposes are reported as distributions of capital.
Expense Allocation
Expenses directly attributable to the Fund are charged directly to the Fund, while expenses attributable to more than one Fund are allocated among the respective Funds based upon relative net assets or some other reasonable method. Expenses which are attributable to more than one Trust are allocated across the Allianz Variable Insurance Products Trust, Allianz Variable Insurance Products Fund of Funds Trust and AIM ETF Products Trust based upon relative net assets or another reasonable basis. Allianz Investment Management LLC (the “Manager”), serves as the investment manager for the Trust, Allianz Variable Insurance Products Trust and AIM ETF Products Trust.
This report does not reflect fees or expenses associated with the separate accounts that invest in the Fund or in any variable annuity contracts or variable life insurance policy for which the Fund serves as an investment vehicle.
Affiliated Securities Transactions
Pursuant to Rule 17a-7 under the 1940 Act, the Fund may engage in securities transactions with affiliated investment companies and advisory accounts managed by the Manager. Any such purchase or sale transaction must be effected without a brokerage commission or other remuneration, except for customary transfer fees. The transaction must be effected at the current market price, which is either the security’s last sale price on an exchange or, if there are no transactions in the security that day, at the average of the highest bid and lowest asked price. During the year ended December 31, 2022, the Fund did not engage in any Rule 17a-7 transactions.
8
AZL MVP T. Rowe Price Capital Appreciation Plus Fund
Notes to the Financial Statements
December 31, 2022
Derivative Instruments
All open derivative positions at period end are reflected on the Fund’s Schedule of Portfolio Investments. The following is a description of the derivative instruments utilized by the Fund, including the primary underlying risk exposures related to each instrument type. The Fund’s allocation to the MVP (Managed Volatility Portfolio) risk management process may include (a) derivatives such as index futures, other futures contracts, options, and other similar securities and (b) cash, money market equivalents, short-term debt instruments, money market funds, and short-term debt funds to satisfy all applicable margin requirements and to provide additional portfolio liquidity to satisfy large redemptions and any margin calls. Due to the leverage provided by derivatives, the notional value of the Fund’s derivative positions could exceed 20% of the Fund’s value. The Fund may also use futures to gain equity exposure and may hold cash as a buffer in the event of market shocks.
Futures Contracts
During the year ended December 31, 2022, the Fund invested in futures contracts to reduce volatility and limit the need to decrease or increase allocations to underlying funds. Futures contracts are valued based upon their quoted daily settlement prices. Upon entering into a futures contract, the Fund is required to segregate liquid assets in accordance with the initial margin requirements of the broker or exchange. Futures contracts are marked to market daily and a payable or receivable for the change in value (“variation margin”), if any, is recorded by the Fund. Gains or losses are recognized but not considered realized until the contracts expire or are closed. Futures contracts involve, to varying degrees, elements of market risk (generally equity price risk related to stock futures, interest rate risk related to bond futures, and foreign currency risk related to currency futures) and exposure to loss in excess of the variation margin disclosed in the Statement of Assets and Liabilities. The primary risks associated with the use of futures contracts are the imperfect correlation between the change in value of the underlying securities and the prices of futures contracts, the possibility of an illiquid market, and the inability of the counterparty to meet the terms of the contract. For the year ended December 31, 2022, the monthly average notional amount for long contracts was $26.0 million, and the monthly average notional amount for short contracts was $160.7 million. Realized gains and losses are reported as “Net realized gains/(losses) on futures contracts” on the Statement of Operations.
Summary of Derivative Instruments
The following is a summary of the values of derivative instruments on the Fund’s Statement of Assets and Liabilities, categorized by risk exposure, as of December 31, 2022:
Asset Derivatives | Liability Derivatives | |||||||||||
| Primary Risk Exposure | Statement of Assets and Liabilities Location | Total Value | Statement of Assets and Liabilities Location | Total Value | ||||||||
Equity Risk | ||||||||||||
Futures Contracts | Receivable for variation margin on futures contracts* | $— | Payable for variation margin on futures contracts* | $31,525 | ||||||||
Interest Rate Risk | ||||||||||||
Futures Contracts | Receivable for variation margin on futures contracts* | — | Payable for variation margin on futures contracts* | $242,650 | ||||||||
| * | For futures contracts, the amounts represent the cumulative appreciation/depreciation of these futures contracts as reported in the Schedule of Portfolio Investments. Only the current day’s variation margin, if any, is reported within the Statement of Assets and Liabilities as variation margin on futures contracts. |
The following is a summary of the effect of derivative instruments on the Statement of Operations, categorized by risk exposure, for the year ended December 31, 2022:
| Primary Risk Exposure | Location of Gains/(Losses) on Derivatives Recognized | Realized Gains/(Losses) on Derivatives Recognized | Change in Net Unrealized Appreciation/Depreciation on Derivatives Recognized | |||||||
Equity Risk | ||||||||||
Futures Contracts | Net realized gains/(losses) on futures contracts/ Change in net unrealized appreciation/ depreciation on futures contracts | $1,359,701 | $(689,232 | ) | ||||||
Interest Rate Risk | ||||||||||
Futures Contracts | Net realized gains/(losses) on futures contracts/ Change in net unrealized appreciation/ depreciation on futures contracts | (2,874,007 | ) | (551,852 | ) | |||||
3. Fees and Transactions with Affiliates and Other Parties
The Manager provides investment advisory and management services for the Fund. The Manager has contractually agreed to waive fees and reimburse the Fund to limit the annual expenses, excluding interest expense (e.g., cash overdraft fees), taxes, brokerage commissions, acquired fund fees and expenses, other expenditures that are capitalized in accordance with U.S. GAAP and other extraordinary expenses not incurred in the ordinary course of the Fund’s business, based on the daily net assets of the Fund, through April 30, 2024. Expenses incurred for investment advisory and management services are reflected on the Statement of Operations as “Management fees.”
For the year ended December 31, 2022, the annual rate due to the Manager and the annual expense limit were as follows:
| Annual Rate | Annual Expense Limit | |||
AZL MVP T. Rowe Price Capital Appreciation Plus Fund | 0.10% | 0.15% |
Any amounts contractually waived or reimbursed by the Manager with respect to the annual expense limit in a particular fiscal year will be subject to repayment by the Fund to the Manager to the extent that from time to time through the next three fiscal years the repayment will not cause the Fund’s expenses to exceed the lesser of the stated limit at the time of the waiver or the current stated limit. Any amounts recouped by the Manager during the year are reflected on the Statement of Operations as “Recoupment of prior expenses reimbursed by the Manager.” At December 31, 2022, there were no remaining contractual reimbursements subject to repayment by the Fund in subsequent years.
9
AZL MVP T. Rowe Price Capital Appreciation Plus Fund
Notes to the Financial Statements
December 31, 2022
Management fees, which the Manager may waive in order to maintain more competitive expense ratios, are not subject to repayment in subsequent years. Information on the total amount waived/reimbursed by the Manager or repaid to the Manager by the Fund during the year can be found on the Statement of Operations, as applicable. During the year ended December 31, 2022, there were no such waivers.
The Manager or an affiliate of the Manager serves as the investment adviser of certain underlying funds in which the Fund invests. At December 31, 2022, these underlying funds are noted as Affiliated Investment Companies in the Fund’s Schedule of Portfolio Investments. Additional information, including financial statements, about these Funds is available at www.allianzlife.com. The Manager or an affiliate of the Manager is paid a separate fee from the underlying funds for such services. A summary of the Fund’s investments in affiliated investment companies for the year ended December 31, 2022 is as follows:
Value 12/31/21 | Purchases at Cost | Proceeds from Sales | Net Realized Gains (Losses) | Change in Net Unrealized Appreciation (Depreciation) | Value 12/31/22 | Shares as of 12/31/22 | Dividend Income | Net Realized Gains Distributions from Affiliated Underlying Funds | ||||||||||||||||||||||||||||
AZL Enhanced Bond Index Fund | $ | 232,814,119 | $ | 4,666,699 | $ | — | $ | — | $ | (35,331,991) | $ | 202,148,827 | 21,323,716 | $ | 3,219,091 | $ | 116,092 | |||||||||||||||||||
AZL S&P 500 Index Fund, Class 2 | 416,095,724 | 46,761,710 | (31,295,146) | 4,742,405 | (126,011,453) | 310,293,240 | 18,317,192 | 3,643,381 | 43,118,328 | |||||||||||||||||||||||||||
AZL T. Rowe Price Capital Appreciation Fund | 755,651,464 | 92,943,057 | (86,864,739) | (290,452) | (181,091,534) | 580,347,796 | 35,691,746 | 4,449,455 | 88,493,602 | |||||||||||||||||||||||||||
|
|
|
|
|
|
|
|
|
|
|
|
|
|
|
|
|
| |||||||||||||||||||
| $ | 1,404,561,307 | $ | 144,371,466 | $ | (118,159,885) | $ | 4,451,953 | $ | (342,434,978) | $ | 1,092,789,863 | 75,332,654 | $ | 11,311,927 | $ | 131,728,022 | ||||||||||||||||||||
|
|
|
|
|
|
|
|
|
|
|
|
|
|
|
|
|
| |||||||||||||||||||
Pursuant to separate agreements between the Trust and the Manager, the Manager provides a Chief Compliance Officer (“CCO”) and certain compliance oversight and regulatory filing services to the Trust. Under these agreements, the Manager is entitled to an amount equal to a portion of the compensation and certain other expenses related to the individuals performing the CCO and compliance oversight services, as well as $100 per hour for time incurred in connection with the preparation and filing of certain documents with the SEC. The fees are paid to the Manager on a quarterly basis. The total expenses incurred by the Fund for these services are reflected on the Statement of Operations as “Administrative and compliance services fees.”
Citi Fund Services Ohio, Inc. (“Citi” or the “Administrator”), a wholly owned subsidiary of Citigroup, Inc., with which an officer of the Trust is affiliated, serves as the Trust’s administrator and fund accountant, and assists the Trust in all aspects of its administration and operation. The Administrator is entitled to a fee, accrued daily and paid monthly. The Administrator is entitled to an annual fee for each additional class of shares of any Fund, certain annual fees in supporting fair value services, and a Trust-wide annual fee for providing infrastructure and support in implementing the written policies and procedures comprising the Fund’s compliance program. The Administrator is also reimbursed for certain expenses incurred. The total expenses incurred by the Fund for these services are reflected on the Statement of Operations as “Administration fees.”
FIS Investor Services LLC (“FIS”) serves as the Fund’s transfer agent. Under the Transfer Agent Agreement, the Trust pays FIS a fee for its services and reimburses FIS for all of their reasonable out-of-pocket expenses incurred in providing these services.
The Bank of New York Mellon (“BNY Mellon” or the “Custodian”) serves as the Trust’s custodian. For these services as custodian, the Funds pay BNY Mellon a fee based on a percentage of assets held on behalf of the Funds, plus certain out-of-pocket charges.
Allianz Life Financial Services, LLC (“ALFS”), an affiliate of the Manager, serves as distributor of the Fund. ALFS receives an annual Trust-wide annual fee of $7,500, paid by the Manager from its profits and not by the Trust, for recordkeeping and reporting services.
Certain Officers and Trustees of the Trust are affiliated with the Manager or the Administrator. Such Officers (except for the Trust’s CCO as noted above) and Trustees receive no compensation from the Trust for serving in their respective roles.
4. Investment Valuation Summary
The valuation techniques employed by the Fund, as described below, maximize the use of observable inputs and minimize the use of unobservable inputs in determining fair value. The inputs used for valuing the Fund’s investments are summarized in the three broad levels listed below:
● Level 1 - | quoted prices in active markets for identical assets | |||
● Level 2 - | other significant observable inputs (including quoted prices for similar securities, interest rates, prepayments speeds, credit risk, etc.) | |||
● Level 3 - | significant unobservable inputs (including the Fund’s own assumptions in determining the fair value of investments) |
Changes in valuation techniques may result in transfers in or out of an assigned level within the disclosure hierarchy. The inputs or methodology used for valuing investments is not necessarily an indication of the risk associated with investing in those investments.
Investments in other investment companies are valued at their published net asset value (“NAV”). Security prices are determined pursuant to valuation procedures approved by the Trust’s Board of Trustees (the “Board” or “Trustees”) as of the close of the New York Stock Exchange (“NYSE”) (generally 4:00 pm Eastern Time). The investments utilizing Level 1 valuations represent investments in open-end investment companies. Futures contracts are valued at the settlement prices established each day on the primary exchange and are typically categorized as Level 1 in the fair value hierarchy.
The Board has designated the Manager to perform the Fund’s fair value determinations in accordance with valuation procedures approved by the Board. The effect of using fair value pricing is that the Fund’s NAV will be subject to the judgment of the Manager. The Manager’s fair valuation process is subject to the oversight of the Board.
The following is a summary of the valuation inputs used as of December 31, 2022 in valuing the Fund’s investments based upon the three levels defined above:
10
AZL MVP T. Rowe Price Capital Appreciation Plus Fund
Notes to the Financial Statements
December 31, 2022
Investment Securities: | Level 1 | Level 2 | Level 3 | Total | ||||||||||||||||||||||||||||
Affiliated Investment Companies | $1,092,789,863 | $— | $— | $1,092,789,863 | ||||||||||||||||||||||||||||
Unaffiliated Investment Company | 3,484,965 | — | — | 3,484,965 | ||||||||||||||||||||||||||||
|
|
|
|
|
|
|
| |||||||||||||||||||||||||
Total Investment Securities | 1,096,274,828 | — | — | 1,096,274,828 | ||||||||||||||||||||||||||||
|
|
|
|
|
|
|
| |||||||||||||||||||||||||
Other Financial Instruments:* | ||||||||||||||||||||||||||||||||
Futures Contracts | (274,175) | — | — | (274,175) | ||||||||||||||||||||||||||||
|
|
|
|
|
|
|
| |||||||||||||||||||||||||
Total Investments | $1,096,000,653 | $— | $— | $1,096,000,653 | ||||||||||||||||||||||||||||
|
|
|
|
|
|
|
| |||||||||||||||||||||||||
| * | Other Financial Instruments would include any derivative instruments, such as futures contracts. These investments are generally presented in the financial statements at variation margin. |
5. Security Purchases and Sales
For the year ended December 31, 2022, cost of purchases and proceeds from sales of securities (excluding securities maturing less than one year from acquisition) were as follows:
| Purchases | Sales | |||||||||||
AZL MVP T. Rowe Price Capital Appreciation Plus Fund | $144,371,466 | $118,159,885 | ||||||||||
6. Investment Risks
The risks below are presented in an order intended to facilitate readability. Their order does not imply that the realization of one risk is more likely to occur more frequently than another risk, nor does it imply that the realization of one risk is likely to have a greater adverse impact than another risk. The Fund may be subject to other risks in addition to these identified risks. This section discusses certain common principal risks encountered by the Fund.
Derivatives Risk: The Fund may invest directly or through affiliated or unaffiliated mutual funds or unregistered investment pools in derivative instruments such as futures, options, and options on futures. A derivative is a financial contract whose value depends on, or is derived from, the value of an underlying asset, reference rate, or risk. Use of derivative instruments involves risks different from, or possibly greater than, the risks associated with investing directly in securities and other traditional investments. Derivatives are subject to a number of other risks, such as liquidity risk, interest rate risk, market risk, credit risk, and selection risk. Derivatives also involve the risk of mispricing or improper valuation and the risk that changes in the value may not correlate perfectly with the underlying asset, rate, or index. Using derivatives may result in losses, possibly in excess of the principal amount invested. Also, suitable derivative transactions may not be available in all circumstances. The other party to a derivatives contract could default.
Foreign Securities Risk: Investing in the securities of non-U.S. issuers involves a number of risks, such as fluctuations in currency values, adverse political, social or economic developments, and differences in social and economic developments or policies. Such risks include future political and economic developments, and the possible imposition of exchange controls or other foreign governmental laws and restrictions. In addition, with respect to certain countries, there is the possibility of expropriation of assets, confiscatory taxation, political or social instability or diplomatic developments which could adversely affect investments in those securities. Certain foreign companies may be subject to sanctions, embargoes, or other governmental actions that may impair or otherwise limit the ability to invest in, receive, hold or sell the securities of such companies.
Fund of Fund Risk: The Fund, as a shareholder of the underlying funds, indirectly bears its proportionate share of any investment management fees and other expenses of the underlying funds. Further due to the fees and expenses paid by the Fund, as well as small variations in the Fund’s actual allocations to the underlying funds and any futures and cash held in the Fund’s portfolio, the performance and income distributions of the Fund will not be the same as the performance and income distributions of the underlying funds. In addition, the Fund maintains indirect exposure to various types of risk which may exist in the underlying Funds, such as foreign securities risk, fixed income securities risk and other risks.
Interest Rate Risk: Debt securities held by an underlying fund may decline in value due to rising interest rates. The price of a bond is also affected by its maturity. Bonds with longer maturities generally have greater sensitivity to changes in interest rates.
Market Risk: The market price of securities owned by the underlying funds may go up or down, sometimes rapidly and unpredictably. Securities may decline in value due to factors affecting securities markets generally or particular industries represented in the securities markets. The value of a security may decline due to general market conditions that are not specifically related to a particular company, such as real or perceived adverse economic conditions, changes in the general outlook for corporate earnings, changes in interest or currency rates, or adverse investor sentiment, as well as natural disasters, and outbreaks of infectious illnesses or other widespread public health issues.
Quantitative Investing Risk: The value of securities selected using quantitative analysis can react differently to issuer, political, market, and economic developments than the market as a whole or securities selected using only fundamental analysis. The factors used in quantitative analysis and the weight placed on those factors may not be predictive of a security’s value. In addition, factors that affect a security’s value can change over time and these changes may not be reflected in the quantitative model. A quantitative model can be adversely affected by errors or imperfections in the factors or the data on which evaluations are based, or by technical issues with construction or implementation of the model, which in any case may result in a failure of the portfolio to perform as expected or a failure to identify securities that will perform well in the future.
7. Coronavirus (COVID-19) Pandemic
The global outbreak of the COVID-19 strain of the coronavirus has caused adverse effects on many companies, sectors, nations, regions and the markets in general, and may continue for an unpredictable duration. The effects of this pandemic may adversely impact the value and performance of the Fund, its ability to buy and sell fund investments at appropriate valuations, and its ability to achieve its investment objective(s).
11
AZL MVP T. Rowe Price Capital Appreciation Plus Fund
Notes to the Financial Statements
December 31, 2022
8. Federal Tax Information
It is the policy of the Fund to continue to qualify as a regulated investment company by complying with the provisions available to certain investment companies, as defined under Subchapter M of the Internal Revenue Code, and to make distributions of net investment income and net realized gains sufficient to relieve it from all, or substantially all, federal income taxes. Accordingly, no provisions for federal income taxes are required in the financial statements.
Management of the Fund has reviewed tax positions taken in tax years that remain subject to examination by all major tax jurisdictions, including federal (i.e., the last four tax year ends and the interim tax period since then, as applicable). Management believes that there is no tax liability resulting from unrecognized tax benefits related to uncertain tax positions taken.
Cost of securities, including derivatives and short positions as applicable, for federal income tax purposes at December 31, 2022 is $1,085,145,607. The gross unrealized appreciation/ (depreciation) on a tax basis is as follows:
Unrealized appreciation | $47,397,173 | |||
Unrealized (depreciation) | (36,267,952) | |||
|
| |||
Net unrealized appreciation/(depreciation) | $11,129,221 | |||
|
|
As of the end of its tax year ended December 31, 2022, the Fund had capital loss carry forwards (“CLCFs”) as summarized in the table below. The Board does not intend to authorize a distribution of any realized gain for the Fund until any applicable CLCF has been offset.
CLCFs not subject to expiration:
| Short-Term Amount | Long-Term Amount | �� Total | |||||||||||||
AZL MVP T. Rowe Price Capital Appreciation Plus Fund | $12,754,208 | $– | $12,754,208 | ||||||||||||
The tax character of dividends paid to shareholders during the year ended December 31, 2022 was as follows:
| Ordinary Income | Net Long-Term Capital Gains | Total Distributions(a) | |||||||||||||
AZL MVP T. Rowe Price Capital Appreciation Plus Fund | $116,758,976 | $46,322,966 | $163,081,942 | ||||||||||||
| (a) | Total distributions paid may differ from the Statements of Changes in Net Assets because dividends are recognized when actually paid for tax purposes. |
The tax character of dividends paid to shareholders during the year ended December 31, 2021, was as follows:
| Ordinary Income | Net Long-Term Capital Gains | Total Distributions(a) | |||||||||||||
AZL MVP T. Rowe Price Capital Appreciation Plus Fund | $68,964,639 | $48,197,988 | $117,162,627 | ||||||||||||
| (a) | Total distributions paid may differ from the Statements of Changes in Net Assets because dividends are recognized when actually paid for tax purposes. |
At December 31, 2022, the components of accumulated earnings on a tax basis were as follows:
| Undistributed Ordinary Income | Undistributed Long-Term Capital Gains | Accumulated Capital and Other Losses | Unrealized Appreciation/ Depreciation(a) | Total Accumulated Earnings/ (Deficit) | |||||||||||||||||||||
AZL MVP T. Rowe Price Capital Appreciation Plus Fund | $91,615,824 | $– | $(12,754,208) | $11,129,221 | $89,990,837 | ||||||||||||||||||||
| (a) | The differences between book-basis and tax-basis unrealized appreciation/(depreciation) is attributable primarily to tax deferral of losses on wash sales, mark-to-market of futures contracts and straddles. |
9. Ownership and Principal Holders
The beneficial ownership, either directly or indirectly, of more than 25% of the voting securities of a fund creates presumptions of control of the fund, under section 2 (a)(9) of the 1940 Act. As of December 31, 2022, the Fund had an individual shareholder account which is affiliated with the Manager representing ownership in excess of 85% of the Fund. Investment activities of this shareholder could have a material impact to the Fund. As of December 31, 2022, the Fund had a controlling interest (in excess of 50%) in the AZL T. Rowe Price Capital Appreciation Fund, which is affiliated with the Manager.
10. Subsequent Events
Management of the Fund has evaluated the need for additional disclosures or adjustments resulting from events through the date the financial statements were issued. Based on this evaluation, there were no subsequent events to report that would have material impact on the Fund’s financial statements.
12
REPORT OF INDEPENDENT REGISTERED PUBLIC ACCOUNTING FIRM
To the Board of Trustees of Allianz Variable Insurance Products Fund of
Funds Trust and Shareholders of AZL MVP T. Rowe Price Capital Appreciation Plus Fund
Opinion on the Financial Statements
We have audited the accompanying statement of assets and liabilities, including the schedule of portfolio investments, of AZL MVP T. Rowe Price Capital Appreciation Plus Fund (one of the funds constituting Allianz Variable Insurance Products Fund of Funds Trust, referred to hereafter as the “Fund”) as of December 31, 2022, the related statement of operations for the year ended December 31, 2022, the statements of changes in net assets for each of the two years in the period ended December 31, 2022, including the related notes, and the financial highlights for each of the five years in the period ended December 31, 2022 (collectively referred to as the “financial statements”). In our opinion, the financial statements present fairly, in all material respects, the financial position of the Fund as of December 31, 2022, the results of its operations for the year then ended, the changes in its net assets for each of the two years in the period ended December 31, 2022 and the financial highlights for each of the five years in the period ended December 31, 2022 in conformity with accounting principles generally accepted in the United States of America.
Basis for Opinion
These financial statements are the responsibility of the Fund’s management. Our responsibility is to express an opinion on the Fund’s financial statements based on our audits. We are a public accounting firm registered with the Public Company Accounting Oversight Board (United States) (PCAOB) and are required to be independent with respect to the Fund in accordance with the U.S. federal securities laws and the applicable rules and regulations of the Securities and Exchange Commission and the PCAOB.
We conducted our audits of these financial statements in accordance with the standards of the PCAOB. Those standards require that we plan and perform the audit to obtain reasonable assurance about whether the financial statements are free of material misstatement, whether due to error or fraud.
Our audits included performing procedures to assess the risks of material misstatement of the financial statements, whether due to error or fraud, and performing procedures that respond to those risks. Such procedures included examining, on a test basis, evidence regarding the amounts and disclosures in the financial statements. Our audits also included evaluating the accounting principles used and significant estimates made by management, as well as evaluating the overall presentation of the financial statements. Our procedures included confirmation of securities owned as of December 31, 2022 by correspondence with the custodian, transfer agent and brokers. We believe that our audits provide a reasonable basis for our opinion.
| /s/ PricewaterhouseCoopers LLP |
| New York, New York |
| February 23, 2023 |
We have served as the auditor of one or more investment companies in the Allianz Variable Insurance Products complex since 2018.
13
Other Federal Income Tax Information (Unaudited)
For the year ended December 31, 2022, 6.09% of the total ordinary income dividends paid by the Fund qualify for the corporate dividends received deductions available to corporate shareholders.
During the year ended December 31, 2022, the Fund declared net short-term capital gain distributions of $24,474,292.
During the year ended December 31, 2022, the Fund declared net long-term capital gain distributions of $46,322,966.
14
Other Information (Unaudited)
A description of the policies and procedures that the Fund uses to determine how to vote proxies relating to portfolio securities is available, without charge, upon request, by visiting the Securities and Exchange Commission’s (‘‘Commission’’) website at www.sec.gov, or by calling 800-624-0197.
Information regarding how the Fund voted proxies relating to portfolio securities during the most recent 12-month period ended June 30th is available (i) without charge, upon request, by calling 800-624-0197; (ii) on the Trust’s website at https://www.allianzlife.com; and (iii) on the Commission’s website at http://www.sec.gov.
The Fund files complete Schedules of Portfolio Holdings with the Commission for the first and third quarters of each fiscal year on Form N-PORT. Schedules of Portfolio Holdings for the Fund are available without charge on the Commission’s website at http://www.sec.gov, or may be obtained by calling 800-624-0197.
15
Approval of Investment Advisory Agreement (Unaudited)
Subject to the general supervision of the Board of Trustees (the “Board”) and in accordance with the investment objectives and restrictions of each separate series (each a “Fund,” together, the “Funds”) of the Allianz Variable Insurance Products Fund of Funds Trust (the “Trust”), investment advisory services are provided to the Funds by Allianz Investment Management LLC (the “Manager”). The Manager manages each Fund pursuant to an investment management agreement (the “Management Agreement”) with the Trust in respect of each such Fund. The Management Agreement provides that the Manager, subject to the supervision and approval of the Board, is responsible for the management of each Fund. For management services, each Fund pays the Manager an investment advisory fee based upon each Fund’s average daily net assets. The Manager has contractually agreed to limit the expenses of each Fund by reimbursing the Fund if and when total Fund operating expenses exceed certain amounts until at least April 30, 2024 (the “Expense Limitation Agreement”).
In reviewing the services provided by the Manager and the terms of the Management Agreement, the Board receives and reviews information related to the Manager’s experience and expertise in the variable insurance marketplace. In addition, the Board receives information regarding the Manager’s expertise with regard to portfolio diversification and asset allocation requirements within variable insurance products issued by Allianz Life Insurance Company of North America (“Allianz Life”) and its subsidiary, Allianz Life Insurance Company of New York (“Allianz of New York”). Currently, the Funds are offered only through Allianz Life and Allianz of New York variable products, and not in the retail fund market.
As required by the Investment Company Act of 1940 (the “1940 Act”), the Board has reviewed and approved the Management Agreement with the Manager. The Board’s decision to approve this contract reflects the exercise of its business judgment on whether to approve new arrangements and continue the existing arrangements. During its review of the contract, the Board considered many factors, among the most material of which are: the Fund’s investment objectives and long-term performance; the Manager’s management philosophy, personnel, processes and investment performance, including its compliance history and the adequacy of its compliance processes; the preferences and expectations of Fund shareholders (and underlying contract owners) and their relative sophistication; the continuing state of competition in the mutual fund industry; and comparable fees in the mutual fund industry.
The Board also considered the compensation and benefits received by the Manager. This includes fees received for services provided to a Fund by employees of the Manager or of affiliates of the Manager and research services received by the Manager from brokers that execute Fund trades, as well as advisory fees. The Board considered the fact that: (1) the Manager and the Trust are parties to an Administrative Services Agreement and a Compliance Services Agreement, under which the Manager is compensated by the Trust for performing certain administrative and compliance services including providing an employee of the Manager or one of its affiliates to act as the Trust’s Chief Compliance Officer; and (2) Allianz Life Financial Services, LLC, an affiliated person of the Manager, is a registered securities broker-dealer and received (along with its affiliated persons) payments made by the underlying funds pursuant to Rule 12b-1.
The Board is aware that various courts have interpreted provisions of the 1940 Act and have indicated in their decisions that the following factors may be relevant to an adviser’s compensation: the nature, extent and quality of the services provided by the adviser, including the performance of the fund; the adviser’s cost of providing the services; the extent to which the adviser may realize “economies of scale” as the fund grows larger; any indirect benefits that may accrue to the adviser and its affiliates as a result of the adviser’s relationship with the fund; performance and expenses of comparable funds; the profitability of acting as adviser to the fund; and the extent to which the independent Board members, who are not “interested persons” of a fund as defined by the 1940 Act (“Independent Trustees”), are fully informed about all facts bearing on the adviser’s services and fees. The Board is aware of these factors and takes them into account in its review of the Management Agreement for the Funds.
Each member of the Board considered and weighed these factors in light of his or her experience in governing the Trust. The Board is assisted in its deliberations by the advice of independent legal counsel to the Independent Trustees (“Independent Trustee Counsel”). In this regard, the Board requests and receives a significant amount of information about the Funds and the Manager. Some of this information is provided at each regular meeting of the Board; additional information is provided in connection with the particular meetings at which the Board’s formal review of the Management Agreement occurs. In between regularly scheduled meetings, the Board may receive information on particular matters as the need arises. Thus, the Board’s evaluation of the Management Agreement is informed by reports covering such matters as: the Manager’s investment philosophy, personnel and processes, and the Fund’s investment performance (in absolute terms as well as in relationship to its benchmark and certain competitor or “peer group” funds). In connection with comparing the performance of each Fund versus its benchmark, the Board receives reports on the extent to which the Fund’s performance may be attributed to various applicable factors, such as asset class allocation decisions and volatility management strategies, if applicable, the performance of the underlying funds, rebalancing decisions, and the impact of cash positions and Fund fees and expenses. The Board also receives reports on the Funds’ expenses (including the advisory fee itself and the overall expense structure of the Funds, both in absolute terms and relative to peer group and/or competing funds, with due regard for the Expense Limitation Agreement and additional voluntary expense limitations); the use and allocation of any brokerage commissions derived from trading the Funds’ portfolio securities; the nature, extent and quality of the advisory and other services provided to the Fund by the Manager and its affiliates; compliance and audit reports concerning the Funds and the companies that service them; and relevant developments in the mutual fund industry and how the Funds and/or the Manager are responding to them.
The Board also receives financial information about the Manager, including reports on the compensation and benefits the Manager derives from its relationships with the Funds. These reports cover not only the fees under the Management Agreement, but also the fees, if any, received for providing other services to the Funds. The reports also discuss any indirect or “fall-out” benefits the Manager or its affiliates may derive from their relationships with the Funds.
The Management Agreement was most recently considered at Board meetings held in the summer and fall of 2022. Information relevant to the approval of the Management Agreement was considered at Board meetings held June 14 and 21, 2022, and September 13, 2022, as well as at various other meetings preceding those meetings. Accordingly, the Management Agreement was approved by the Board at an in-person meeting on September 13, 2022. At such meeting the Board also approved the Expense Limitation Agreement between the Manager and the Trust for the period ending April 30, 2024.
In connection with such meetings, the Board requested and evaluated extensive materials from the Manager, including performance and expense information for other investment companies with similar investment objectives derived from data compiled by an independent third-party provider and other sources believed to be reliable by the Manager and the Trustees. Prior to voting, the Trustees reviewed the proposed approval of the Management Agreement with management and with Independent Trustee Counsel and received a memorandum from such counsel discussing the legal standards for their consideration of the proposed approval. The Independent Trustees also discussed the proposed approval in private sessions with Independent Trustee Counsel at which no representatives of the Manager were present. In reaching their determinations relating to the approval of the Management Agreement, in respect of each Fund, each member of the Board considered all factors he or she believed relevant. The Board based its decision to approve
16
the Management Agreement on the totality of the circumstances and relevant factors, and with a view to past and future long-term considerations. Not all of the factors and considerations discussed above and below are necessarily relevant to every Fund, and the Board did not assign relative weights to factors discussed herein or deem any one or group of them to be controlling in and of themselves.
Shareholder reports must include a discussion of certain factors relating to the selection of the investment adviser and the approval of the advisory fee. The “factors” enumerated by the SEC are set forth below in italics, as well as the Board’s conclusions regarding such factors:
(1) The nature, extent and quality of services provided by the Manager. The Trustees noted that the Manager, subject to the oversight of the Board, administers each Fund’s business and other affairs. The Trustees noted that the Manager also provides the Trust and each Fund with such administrative and other services (exclusive of, and in addition to, any such services provided by any other service providers retained by the Trust on behalf of the Funds) and executive and other personnel as are necessary for the operation of the Trust and the Funds. Except for the Trust’s Chief Compliance Officer and certain compliance staff, the Manager pays all of the compensation of Trustees and officers of the Trust who are employees of the Manager or its affiliates.
The Board considered the scope and quality of services provided by the Manager and noted that the scope of the services provided has continued to expand as a result of regulatory and other developments. The Board noted, for example, that the Manager is responsible for maintaining and monitoring its own compliance program, and this compliance program has been continuously refined and enhanced in light of new regulatory requirements. The Board considered the capabilities and resources which the Manager has dedicated to performing services on behalf of the Trust and its Funds. The quality of administrative and other services, including the Manager’s role in coordinating the activities of the Trust’s other service providers, also were considered. The Board concluded that, overall, they were satisfied with the nature, extent and quality of services provided (and expected to be provided) to the Trust and to each of the Funds under the Management Agreement.
(2) The investment performance of the Funds and the Manager. In connection with every quarterly Board meeting and the summer and fall 2022 contract review process, Trustees received extensive information on the performance results of each Fund. This included, for example, performance information on absolute total return, performance versus the appropriate benchmark(s) and performance versus peer groups as reported by Lipper, the contribution to performance of the Manager’s asset class allocation decisions and volatility management strategies, if applicable, the performance of the underlying funds, and the impact on performance of rebalancing decisions, cash and Fund fees. This included Lipper performance information on the Funds for the previous quarter, and previous one-, three- and five-year periods, to the extent available. For example, in connection with the Board meetings held June 14 and 21, 2022, and September 13, 2022, the Manager reported that, for the five-year period ended December 31, 2021, two Funds were in the top 40%, three were in the middle 20%, and seven were in the bottom 40% of their respective Lipper peer groups. The Manager reported that for the three-year period ended December 31, 2021, three Funds were in the top 40%, two were in the middle 20%, and seven were in the bottom 40% of their respective Lipper peer groups. For the one-year period ended December 31, 2021, six Funds were in the top 40%, two were in the middle 20%, and four were in the bottom 40% of their respective Lipper peer groups.
The Manager also reported on the performance of the MVP Funds compared to custom managed-volatility peer groups. For the five-year period ended December 31, 2021, four Funds were in the top 40%, two were in the middle 20%, and four were in the bottom 20%. For the three-year period ended December 31, 2021, four Funds were in the top 40%, two were in the middle 20%, and four were in the bottom 40% of their respective custom managed-volatility peer groups. For the one-year period ended December 31, 2021, seven Funds were in the top 40%, two were in the middle 20%, and one was in the bottom 40% of their respective custom managed-volatility peer groups. The Board members discussed with the Manager and considered the impact of the volatility management strategies on performance in different market environments, where applicable, and considered whether they were operating as intended. The Board noted, in particular, the impact of certain characteristics of the Funds’ volatility management strategies in relation to volatility experienced as a result of the COVID-19 pandemic, and that relative performance had improved as the markets stabilized.
At the Board meeting held September 13, 2022, the Board also received updated performance information for the Funds, including updated Lipper peer group ranking information, for various periods ending June 30, 2022.
At the Board meeting held September 13, 2022, the Trustees determined that the investment performance of the Funds was acceptable.
(3) The costs of services to be provided and profits to be realized by the Manager and its affiliates from the relationship with the Funds. The Board considered that the Manager receives an advisory fee from each of the Funds. The Manager reported that for the three MVP Fusion Funds the advisory fee paid put these Funds in the 13th percentile of the customized peer group. The Manager reported that for the four MVP Index Strategy Funds the advisory fee paid put them in the 23rd percentile of the customized peer group, and for the AZL Balanced Index Strategy Fund the advisory fee paid put it in the 7th percentile of the customized peer group. The Manager reported that for the AZL DFA Multi-Strategy Fund, the advisory fee paid was in the 5th percentile. The Manager reported that for the AZL MVP DFA Multi-Strategy, AZL MVP FIAM Multi-Strategy, and AZL MVP T. Rowe Price Capital Appreciation Plus Funds, the advisory fee paid was in the 1st percentile. (A lower percentile reflects lower fund fees and is better for fund shareholders.) Trustees were provided with information on the total expense ratios of the Funds and other funds in the customized peer groups, and the Manager reported upon the challenges in making peer group comparisons for the Funds. The Board further considered and found that the advisory fee paid to the Manager with respect to each Fund was based on services provided to the Fund that were in addition to, rather than duplicative of, the services provided pursuant to the advisory agreements for the underlying funds in which the Fund invests.
The Manager provided information concerning the profitability of the Manager’s investment advisory activities for the period from 2019 through 2021. The Board recognized that it is difficult to make comparisons of profitability from investment company advisory agreements because comparative information is not generally publicly available and is affected by numerous factors, including the structure of the particular adviser, the types of funds it manages, its business mix, numerous assumptions regarding allocation of expenses and the adviser’s capital structure and cost of capital. In considering profitability information, the Board considered the possible effect of certain fall-out benefits to the Manager and its affiliates. The Board focused on profitability of the Manager’s relationships with the Funds before taxes and distribution expenses. The Board recognized that the Manager should earn a reasonable level of profits for the services it provides to each Fund.
The Board also considered that Wilshire Funds Management (“Wilshire”) serves as a consultant to the Manager in preparing statistical and other factual information for use in the creation and maintenance of the asset allocation models for the AZL MVP Fusion Funds, pursuant to an agreement between the Manager and Wilshire. Wilshire serves as a consultant to the Manager with respect to selecting the AZL MVP Fusion Funds’ underlying funds and the asset allocations among the underlying funds. The Manager, not any Fund, pays a consultant fee to Wilshire.
(4) and (5) The extent to which economies of scale would be realized as the Funds grow, and whether fee levels reflect these economies of scale. The Board noted that the advisory fee schedules for the Funds do not contain breakpoints that reduce the fee rate on assets above specified levels. The Board recognized that breakpoints may be an appropriate way for the Manager to share its economies of scale, if any, with Funds that have substantial assets. The Board found there was no uniform methodology for establishing breakpoints
17
that give effect to Fund-specific services provided by the Manager. The Board noted that in the fund industry as a whole, as well as among funds similar to the Funds, there is no uniformity or pattern in the fees and asset levels at which breakpoints (if any) apply. Depending on the age, size, and other characteristics of a particular fund and its manager’s cost structure, different conclusions can be drawn as to whether there are economies of scale to be realized at any particular level of assets, notwithstanding the intuitive conclusion that such economies exist, or will be realized at some level of total assets. Moreover, because different managers have different cost structures and service models, it is difficult to draw meaningful conclusions from the breakpoints that may have been adopted by other funds. The Board also noted that the advisory agreements for many funds do not have breakpoints at all, or if breakpoints exist, they may be at asset levels significantly greater than those of the individual Funds. The Board noted that the total assets in all of the Funds, as of June 30, 2022, were approximately $8.2 billion and that the largest Fund, the AZL MVP Growth Index Strategy Fund, had assets of approximately $2.1 billion.
The Board noted that the Manager has agreed to temporarily limit Fund expenses under the Expense Limitation Agreement, which has the effect of reducing expenses similar to implementation of advisory fee breakpoints. The Manager has committed to continue to consider the continuation of expense limits and/or advisory fee breakpoints as Fund assets change. The Board receives quarterly reports on the level of Fund assets. The Board expects to continue to consider: (a) the extent to which economies of scale have been realized, and (b) whether the advisory fee should be modified, either in connection with the next renewal of the Management Agreement or by modifying the Expense Limitation Agreement, to reflect such economies of scale, if any.
Having taken these factors into account, the Board concluded that the absence of breakpoints in the Funds’ advisory fee rate schedules was acceptable under each Fund’s circumstances.
In conclusion, after full consideration of the above factors, as well as such other factors as each member of the Board considered instructive in evaluating the Management Agreement, the Board concluded that the advisory fees were reasonable, and that the continuation of the Management Agreement was in the best interest of the Funds.
18
Information about the Board of Trustees and Officers (Unaudited)
The Trust is managed by the Trustees in accordance with the laws of the state of Delaware governing business trusts. In addition to serving on the Board of Trustees of the Trust, each Trustee serves on the Board of the Allianz Variable Insurance Products Trust (“VIP Trust”) and the AIM ETF Products Trust (“ETF Trust”) (collectively, the Trust, the VIP Trust, and ETF Trust are the “AIM Complex”). There are currently seven Trustees, one of whom is an “interested person” of the Trust within the meaning of that term under the 1940 Act. The Trustees and Officers of the Trust, and their addresses, years of birth, their positions held with the Trust, their terms of office with the Trust and length of time served, their principal occupation(s) during the past five years, the number of portfolios in the Trust they oversee, and their other directorships held during the past five years are as follows:
Independent Trustees(1)
| Name, Address, and Birth Year | Positions Held with AIM Complex | Term of Office(2)/Length of Time Served | Principal Occupation(s) During Past 5 Years | Number of Portfolios Overseen for the AIM Complex | Other the AIM Complex During Past | |||||
Peggy L. Ettestad (1957) 5701 Golden Hills Drive Minneapolis, MN 55416 | Lead Independent Trustee | Since 10/14 (Trustee since 2/07) | Managing Director, Red Canoe Management Consulting LLC, 2008 to present | 50 | None | |||||
Tamara Lynn Fagely (1958) 5701 Golden Hills Drive Minneapolis, MN 55416 | Trustee | Since 12/17 | Retired; previously, Chief Operations Officer, Hartford Funds, 2012 to 2013 | 50 | Diamond Hill Funds (10 Funds) | |||||
Richard H. Forde (1953) 5701 Golden Hills Drive Minneapolis, MN 55416 | Trustee | Since 12/17 | Retired; previously, Member of the Board and Chairman of the Finance and Investment Committee, Connecticut Water Service, Inc., 2013 to 2019 | 50 | Connecticut Water Service, Inc. | |||||
Jack Gee (1959) 5701 Golden Hills Drive Minneapolis, MN 55416 | Trustee | Since 1/22 (Consultant to the Independent Trustees since 2/20)(3) | Retired; previously, Managing Director, BlackRock, Inc., Treasurer and Chief Financial Officer U.S. iShares, 2004 to 2019 | 50 | Engine No. 1 ETF Trust (2 Funds); Esoterica Thematic Trust (2019 - 2020) | |||||
Claire R. Leonardi (1955) 5701 Golden Hills Drive Minneapolis, MN 55416 | Trustee | Since 2/04 | Retired; previously, CEO, Health eSense Inc. (a medical device company), 2015 to 2018, and Connecticut Innovations, Inc. (a venture capital firm), 2012 to 2015 | 50 | None | |||||
Dickson W. Lewis (1948) 5701 Golden Hills Drive Minneapolis, MN 55416 | Trustee | Since 2/04 | Retired; previously, senior executive for Lifetouch National School Studios (a photography company), 2006 to 2014, Jostens (a producer of year books and class rings), 2001 to 2006, and Fortis Financial Group, 1997 to 2001 | 50 | None | |||||
19
Interested Trustee(4)
| Name, Address, and Birth Year | Positions Held with AIM Complex | Term of Office(2)/Length | Principal Occupation(s) During Past 5 Years | Number of Portfolios Overseen for the AIM Complex | Other Complex During Past 5 Years | |||||
Brian Muench (1970) 5701 Golden Hills Drive Minneapolis, MN 55416 | Trustee | Since 6/11 | President, Allianz Investment Management LLC, 2010 to present; Vice President, Allianz Life, 2011 to present | 50 | None |
| (1) | Each of the Independent Trustees is a member of the Audit Committee. |
| (2) | Indefinite. |
| (3) | Prior to January 1, 2022, Mr. Gee served as a consultant to the Independent Trustees since February 2020, during which he attended meetings of the Board and its standing committees, including the audit committee, solely in his capacity as a consultant, and was not entitled to vote. |
| (4) | Is an “interested person,” as defined by the 1940 Act, due to employment by Allianz Life and the Manager. |
Officers
| Name, Address, and Birth Year | Positions Held with AIM Complex | Term of Office(1)/ Served | Principal Occupation(s) During Past 5 Years | |||
Brian Muench (1970) 5701 Golden Hills Drive Minneapolis, MN 55416 | President | Since 11/10 | President, Allianz Investment Management LLC, November 2010 to present; Vice President, Allianz Life, 2011 to present. | |||
Erik Nelson (1972) 5701 Golden Hills Drive Minneapolis, MN 55416 | Secretary | Since 12/20 | Chief Legal Officer, Allianz Investment Management LLC; Associate General Counsel, Senior Counsel, Allianz Life, 2008 to present. | |||
Bashir C. Asad (1963) Citi Fund Services Ohio, Inc. 4400 Easton Commons, Suite 200 Columbus, OH 43219 | Treasurer, Principal Accounting Officer and Principal Financial Officer | Since 06/16 | Senior Vice President, Citi Fund Services Ohio, Inc., 2011 to present. | |||
Chris R. Pheiffer (1968) 5701 Golden Hills Drive Minneapolis, MN 55416 | Chief Compliance Officer(2) and Anti-Money Laundering Compliance Officer | Since 02/14 | Chief Compliance Officer of the Trust and the VIP Trust, 2014 to present, and the ETF Trust, 2020 to present. | |||
Michael Tanski (1970) 5701 Golden Hills Drive Minneapolis, MN 55416 | Vice President | Since 04/09 | Assistant Vice President, Allianz Investment Management LLC, 2013 to present. | |||
| (1) | Indefinite. |
| (2) | The Manager and the Trust are parties to a Compliance Services Agreement under which the Manager provides an employee of the Manager or one of its affiliates to act as the Trust’s Chief Compliance Officer. |
The Fund’s Statement of Additional Information (“SAI”) contains additional information about the Trust’s Trustees and Officers. The SAI is available without charge, upon request, by calling toll-free 800-624-0197 or at https://www.allianzlife.com.
20
| The Allianz VIP Fund of Funds are distributed by Allianz Life Financial Services, LLC. | ||
| These Funds are not FDIC Insured. | ANNRPT1222 02/23 |
Item 2. Code of Ethics.
| (a) | The registrant has adopted a code of ethics that applies to the registrant’s principal executive officer, principal financial officer, principal accounting officer or controller, or persons performing similar functions. This code of ethics is included as an Exhibit. |
| (b) | During the period covered by the report, with respect to the registrant’s code of ethics that applies to its principal executive officer, principal financial officer, principal accounting officer or controller, or persons performing similar functions; there have been no amendments to, nor any waivers granted from, a provision that relates to any element of the code of ethics definition enumerated in paragraph (b) of this Item 2. |
Item 3. Audit Committee Financial Expert.
| (a)(1) | The registrant’s board of directors has determined that the registrant has at least one audit committee financial expert serving on its audit committee. |
| (a)(2) | The audit committee financial expert is Tamara Lynn Fagely, who is “independent” for purposes of this Item 3 of Form N-CSR. |
Item 4. Principal Accountant Fees and Services.
2022 | 2021 | |||
(a) Audit Fees | $181,418 | $181,418 | ||
(b) Audit-Related Fees | $30,000 | $4,000 | ||
Related to the consent on Form N-1A for the annual registration statement. | ||||
2022 | 2021 | |||
(c) Tax Fees | $57,288 | $57,288 | ||
Preparation of the funds’ federal income tax returns. | ||||
2022 | 2021 | |||
(d) All Other Fees | $0 | $0 |
| 4(e)(1) | The Audit Committee (“Committee”) of the Registrant is responsible for pre-approving all audit and non-audit services performed by the independent auditor in order to assure that the provision of such services does not impair the auditor’s independence. Before the Registrant engages the independent auditor to render a service, the engagement must be either specifically approved by the Committee or entered into pursuant to the pre-approval policy. The Committee may delegate preapproval authority to one or more of its members. The member or members to whom such authority is delegated shall report any pre-approval decisions to the Committee at its next scheduled meeting. The Committee may not delegate to management the Committee’s responsibilities to pre-approve services performed by the independent auditor. The Committee has delegated pre-approval authority to its Chairman for any services not exceeding $10,000. |
| 4(e)(2) | During the previous two fiscal years, the Registrant did not receive any non-audit services pursuant to a waiver from the audit committee approval or pre-approval requirement under paragraph (c)(7)(i)(C) of Rule 2-01 of Regulation S-X. |
| 4(f) | Not applicable. |
| 4(g) | The aggregate fees billed for each of the last two fiscal years for professional services rendered by PricewaterhouseCoopers LLP for tax compliance, tax advice, and tax planning were as follows: |
2022 | 2021 | |||
| $57,288 | $57,288 |
| 4(h) | Not applicable. |
| 4(i) | Not applicable |
| 4(j) | Not applicable. |
Item 5. Audit Committee of Listed Registrants.
Not applicable.
Item 6. Investments.
| (a) | The Schedule of Investments as of the close of the reporting period are included as part of the report to shareholders filed under Item 1 of the Form N-CSR. |
| (b) | Not applicable. |
Item 7. Disclosure of Proxy Voting Policies and Procedures for Closed-End Management Investment Companies.
Not applicable.
Item 8. Portfolio Managers of Closed-End Management Investment Companies.
Not applicable.
Item 9. Purchases of Equity Securities by Closed-End Management Investment Company and Affiliated Purchasers.
Not applicable.
Item 10. Submission of Matters to a Vote of Security Holders.
Not applicable.
Item 11. Controls and Procedures.
| (a) | The registrant’s principal executive officer and principal financial officer have concluded, based on their evaluation of the registrant’s disclosure controls and procedures as conducted within 90 days of the filing date of this report, that these disclosure controls and procedures are adequately designed and are operating effectively to ensure that information required to be disclosed by the registrant on Form N-CSR is recorded, processed, summarized and reported within the time periods specified in the Securities and Exchange Commission’s rules and forms. |
| (b) | There were no changes in the registrant’s internal control over financial reporting (as defined in Rule 30a-3(d) under the Act (17 CFR 270.30a-3(d)) that occurred during the period covered by this report that have materially affected or are reasonably likely to materially affect, the registrant’s internal control over financial reporting. |
Item 12. Disclosure of Securities Lending Activities for Closed-End Management Investment Companies.
Not applicable.
Item 13. Exhibits.
| (a)(1) | The code of ethics that is the subject of the disclosure required by Item 2 is attached hereto. |
| (a)(2) | Certifications pursuant to Rule 30a-2(a) are furnished herewith. |
| (a)(3) | Not applicable. |
| (a)(4) | Not applicable. |
| (b) | Certifications pursuant to Rule 30a-2(b) are furnished herewith. |
SIGNATURES
Pursuant to the requirements of the Securities Exchange Act of 1934 and the Investment Company Act of 1940, the registrant has duly caused this report to be signed on its behalf by the undersigned, thereunto duly authorized.
| (Registrant) | Allianz Variable Insurance Products Fund of Funds Trust |
| By (Signature and Title) | /s/ Brian Muench | |||||||
| Brian Muench, Principal Executive Officer | ||||||||
Date Febrary 24, 2023
Pursuant to the requirements of the Securities Exchange Act of 1934 and the Investment Company Act of 1940, this report has been signed below by the following persons on behalf of the registrant and in the capacities and on the dates indicated.
| By (Signature and Title) | /s/ Brian Muench | |||||||
| Brian Muench, Principal Executive Officer | ||||||||
| Date Febrary 24, 2023 | ||||||||
| By (Signature and Title) | /s/ Bashir C. Asad | |||||||
| Bashir C. Asad, Principal Financial Officer & Principal Accounting Officer | ||||||||
Date Febrary 24, 2023