The various steps taken by Exeter to ensure the integrity of analytical data are consistent with standard industry practice. The sampling procedures are appropriate for the style of mineralization and structural controls for the Caspiche Project. Cube’s examination of drill cores, particularly in regard to the recognition of mineralized intervals, verified the soundness of the core sampling procedure.
Exeter conducts comprehensive internal and external validation of its databases, both in hard copy and electronic format. Drill collars are professionally surveyed and independent audits are encouraged. All laboratory results are checked by a qualified geologist before loading into the database and again at regular intervals for long term trends.
Comprehensive external database audits have been conducted several times during the period October 2008 to September 2011. AMEC has audited the Exeter Caspiche mineral resource database on four occasions during January 2009, August 2009, January 2010 and August 2010. The AMEC database audits have included checking of collar, survey, lithology, stratigraphic unit, alteration, oxidation and assay data against original logging sheets and assay records. In addition to database auditing, AMEC has checked the location of drill holes in the field, and sampled and assayed select drill core intervals during their site visit in October 2008.
AMEC performed four audits of the Caspiche mineral resource database during the period October 2008 to August 2010 and found that it was adequately free of data entry errors and determined that it was acceptable for use in mineral resource estimation (Wakefield and Marinho, 2009a, 2009b, 2010, and Tolman and Perkins, 2010).
At the end of the 2010 drill season, Exeter performed an internal database audit on all hard copy and electronic data and determined that no significant data entry problems existed.
In August 2010, AMEC performed an audit of Caspiche drilling data received since the effective date of the previous mineral resource estimate for the Property. No significant errors were found in the mineral resource database in collar, survey, lithology, stratigraphic unit, alteration or oxidation in data entry from original logs. A selection of assay records in the database were checked against the original assay certificates and no errors were found.
Cube undertook an extensive verification of the drill holes database whilst in Exeter’s Copiapó office in Chile. Database verification included:
Exeter routinely uses a professional surveyor to determine the exact position of drill hole locations. Drill hole collar locations are surveyed using a Leica TC 600 total station unit with centimetre accuracy using the Instituto Geográfico Militar 26° to 36° transform.
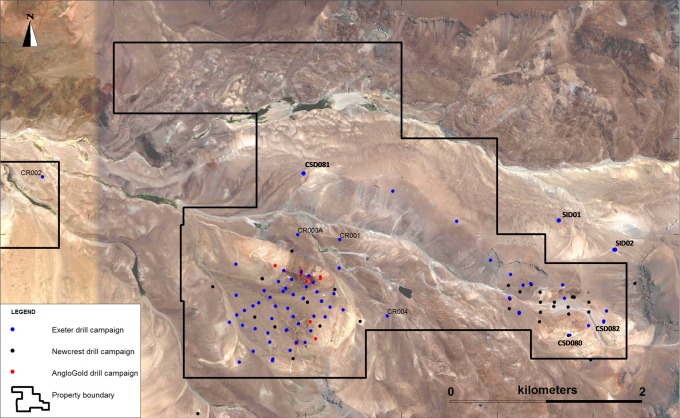
Drill hole locations were verified during an October 2008 site visit to the property by AMEC who collected handheld GPS location readings for seven drill hole locations in the Caspiche Porphyry area to verify the accuracy of the drill hole coordinates in the mineral resource database. An additional three holes were surveyed by Cube in September 2011 with a hand held Garman 76Cx GPS unit. A comparison between Exeter surveyed drill hole locations and GPS location readings are shown in Table 12.1.
Significant differences were noted between the Exeter surveyed drill hole locations and GPS collar coordinates. Handheld GPS coordinates were collected using the PSAD56 datum, which is a general transform that can vary up to 50 m from the more precise Instituto Geográfico Militar 26° to 36° transform used by Exeter (Galaz, 2008). AMEC compared Exeter surveyed collar locations with drill pads on geo-referenced digital images, and found the collar locations to be acceptably accurate (Wakefield and Marinho, 2010).
AMEC, during their October 2008 site visit, selected six Exeter drill hole intervals for check assaying to confirm the presence of gold and copper in the Caspiche drill core (Wakefield and Marinho, 2009a). Mineralized intervals at various depths were selected from the three most relevant drill holes available at the time (CSD014, CSD015, and CSD016). Exeter split (sawn quarter-core), sampled, and bagged the core under AMEC supervision and AMEC submitted the samples to ACME Laboratories in Santiago, Chile, for assaying. ACME assayed gold by standard 30-g fire assay and atomic absorption finish (ACME code G6), and copper by four-acid total digestion and atomic absorption (ACME code 8TD).
Table 12.2 is a summary of the ACME check sampling of Caspiche drill core, and shows the assay results from the original Exeter half-core sampling and the AMEC quarter-core sampling. A single SRM submitted with the check samples reported good assay accuracy for gold and copper.
The assay results shown in Table 12.2 confirm the presence of gold and copper in Exeter Caspiche drill core. AMEC assay results also agree reasonably well with Exeter assay results.
Rio Tinto undertook a review of the Caspiche project in October 2008. As part of this review, Rio Tinto took six samples of drill core coarse reject material for metallurgical testwork. The samples were selected to be representative of a variety of alteration styles occurring at Caspiche. A comparison of drill hole intercept grades and metallurgical testwork head grades are presented in Table 12.3. In general, there is very good agreement between the metallurgical testwork head grades and the drill hole assay grades as recorded in the drill hole database.
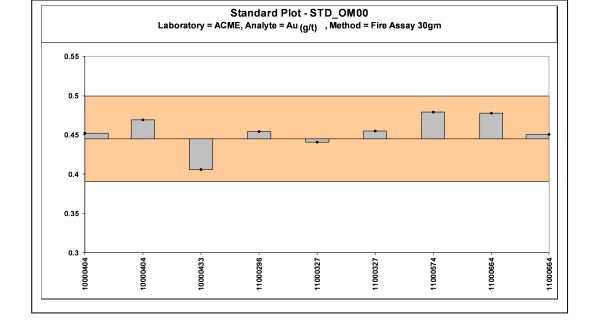
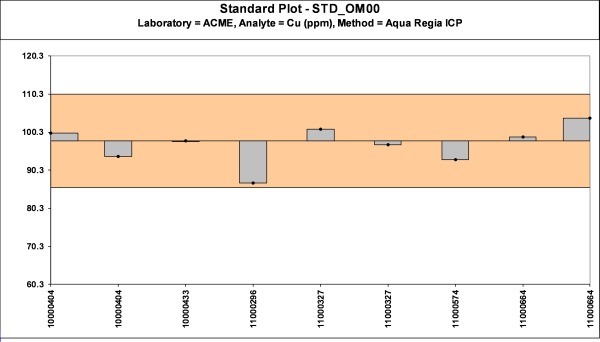
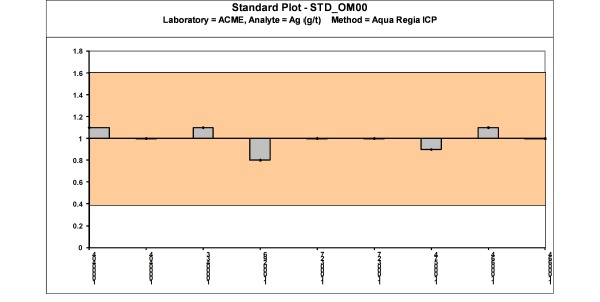
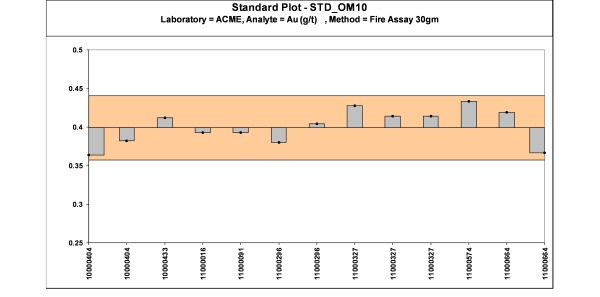
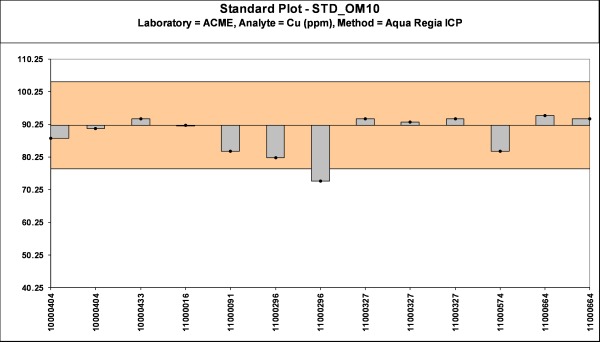
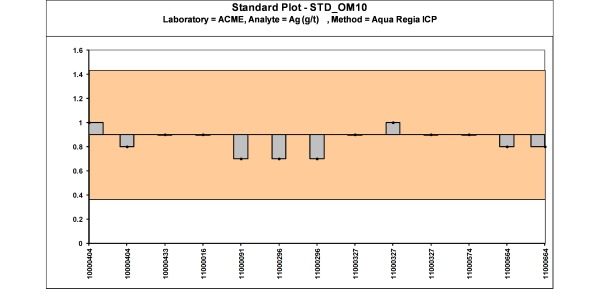
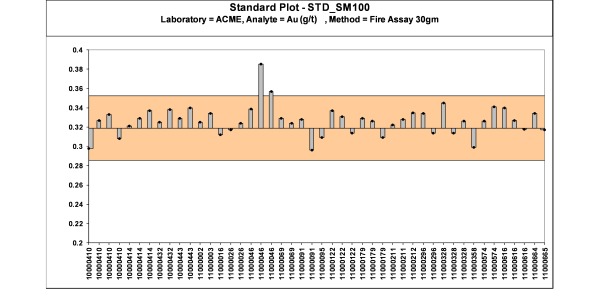
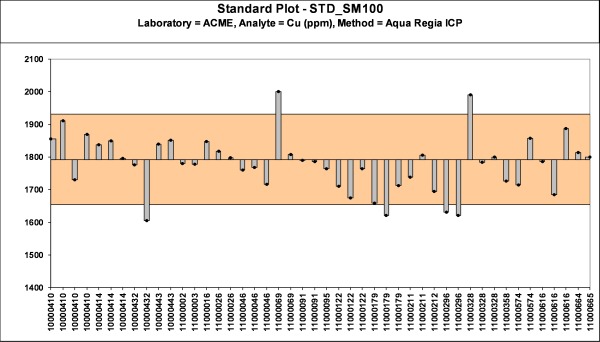
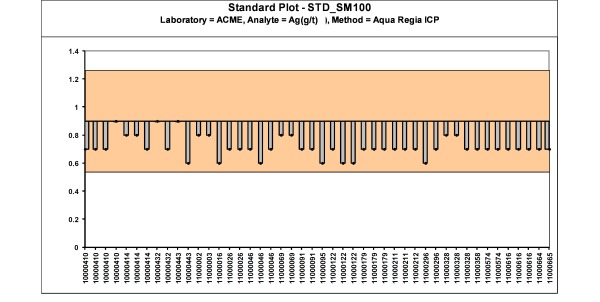
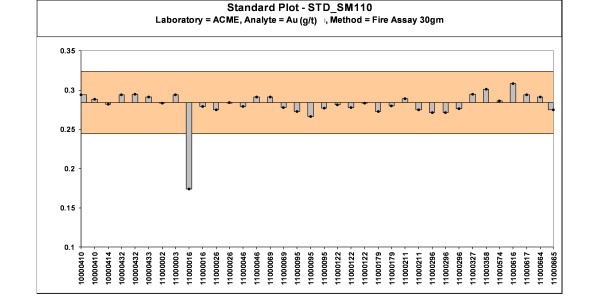
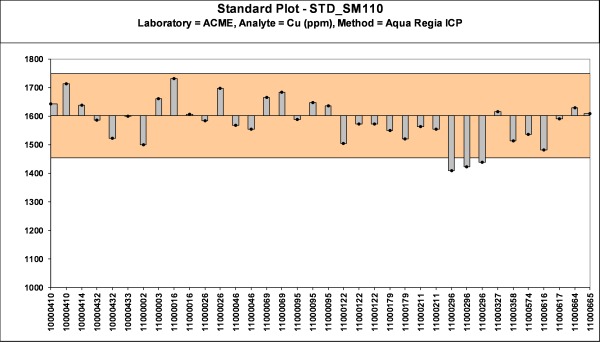
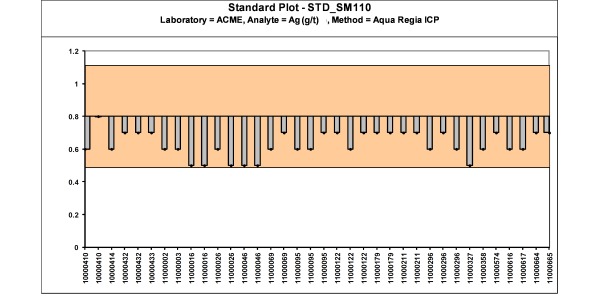
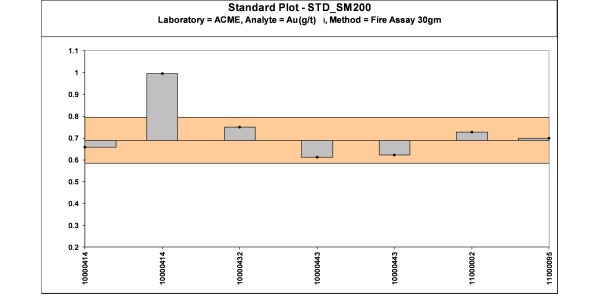
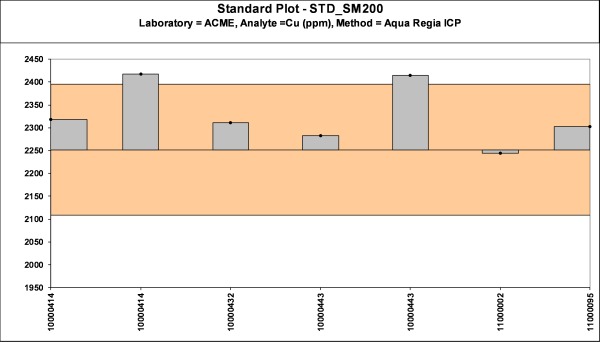
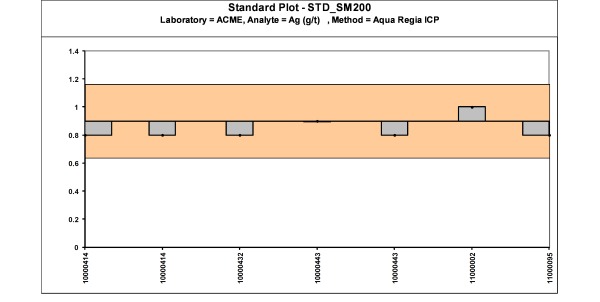
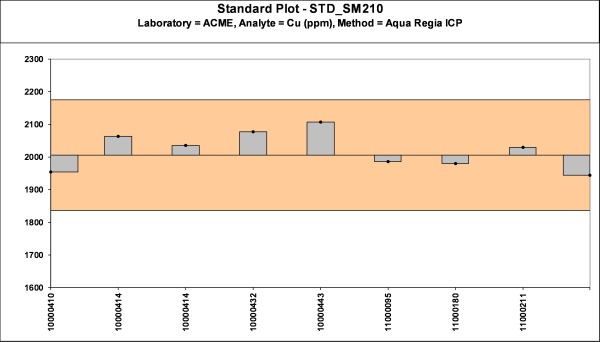
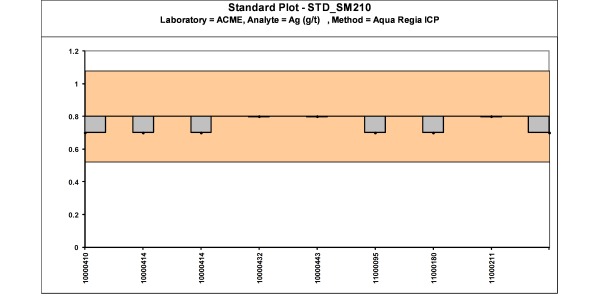
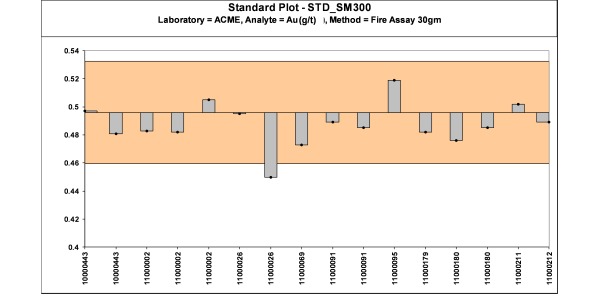
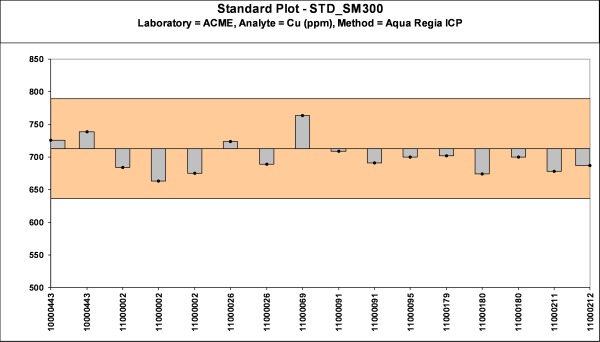
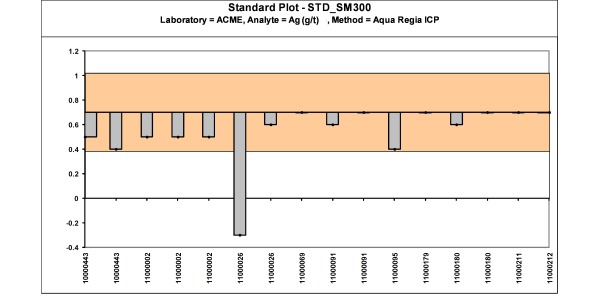
Geochemical Standard Reference Material (SRM’s) has been used by Exeter in all drilling programmes at Caspiche. During the period January 2008 to September 2011, SRM’s and blanks have been inserted at rates varying between 1 in 25 to 1 in 40 samples. The majority of SRM’s are provided by Geostats Pty. Ltd. (“Geostats”) of Australia. Exeter has also
produced and characterised some SRM’s based on representative Caspiche mineralized material. To date, a total of 928 gold SRM’s have been submitted from 28 different standards with recommended assay values varying from 0.24 to 2.14 Au ppm. In addition, a total of 169 copper SRM’s have been submitted from 7 different standards with recommended assay values varying from 90 to 2,252 Cu ppm
Cube undertook a review of all SRM results for the entire period between January 2007 to September 2011. During this period, the majority of gold and copper SRM's performed within the expected limits with 93 % and 92 % being within two standard deviations of the expected value respectively. Cube made selected random checks of the database for SRM values that were outside two standard deviations of the expected value and noted that in all cases Exeter had highlighted these for follow-up.
In general, blanks showed acceptable performance with only 11 values exceeding 0.03 Au ppm and only 1 value exceeding 0.09 Au ppm.
Cube is of the opinion that Exeter has implemented and continues to maintain a well managed and robust QA/QC program and there does not appear to be evidence of systematic error or material bias.
Exeter conducted selected confirmation drilling of Anglo drilling (two holes) and Newcrest drilling (four holes).
Exeter confirmation drilling of Anglo drilling revealed a slight high-bias, on average, in the Anglo gold assays, however the thickness of the intercepts are approximately equal. Anglo copper assays are, on average, unbiased when compared to Exeter confirmation drilling intercepts. Exeter confirmation drilling of Newcrest drilling showed that no significant bias exists, on average, in the Newcrest gold assays, and that the thicknesses of the intercepts are approximately equal. Newcrest copper and silver assays are, on average, unbiased when compared to Exeter confirmation drilling intercepts.
AMEC reviewed the results from all six twinned holes and concluded that the Exeter drilling confirms gold, copper, and silver grades (Newcrest only for silver) and thicknesses of both the Anglo and Newcrest drill intercepts. AMEC concluded that Anglo and Newcrest drill hole are acceptable for use in mineral resource estimation (Wakefield and Marinho, 2010). Cube briefly reviewed the twin data and concurs with the AMEC conclusion.
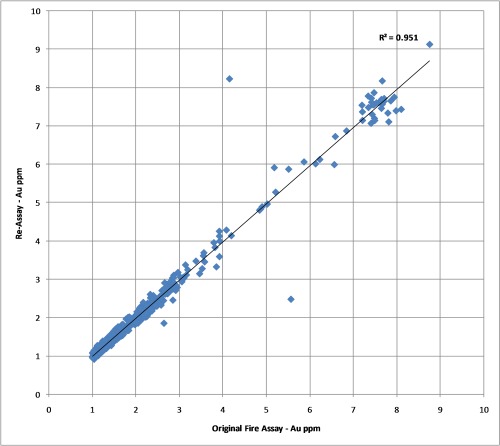
As part of the assaying procedure, samples that return significant gold values greater than 1-2 Au ppm, are routinely re-assayed with a second fire assay using the same method as the original assay. Figure 12.1 shows a scatter plot of the original assay versus the re-assay of all gold samples with an original grade of greater than 1 Au ppm, a total of 560 pairs, with one outlier removed. This comparison shows reasonable correlation indicating relatively low variability within the pulp sample. This re-assaying procedure also includes the geochemical standards.
Cube Consulting has undertaken reasonable endeavours to assess the veracity of drilling data for the Caspiche project. It can be concluded that all logging, sampling and data QA/QC procedures between January 2007 and September 2011 have been carried out to a high industry standard and record keeping and database management is excellent.
Cube believes that the current database provides an accurate and robust representation of the Caspiche project and is appropriate for use in mineral resource estimation.
| 13.0 | MINERAL PROCESSING AND METALLURGICAL TESTING |
This Item summarizes the metallurgical testwork undertaken and in progress. It discusses the nature and extent of the testing and analytical procedures and provides a summary of the relevant results. Additional information is provided where available on sample representivity on the different styles of mineralization and potential deleterious elements.
Prior to 2008, the only metallurgical testwork carried out on Caspiche mineralization was leaching testwork of a scouting nature on oxide samples. Exeter carried out bottle roll tests on reverse circulation (RC) drill chips from the discovery hole CSD 013 at SGS Santiago. Ten years earlier, Newcrest also carried out similar level scouting work on six intercepts at SGS Santiago. There were no records of any metallurgical work being carried out by Anglo. The test details of all these early metallurgical programmes were reported by Van Kerkvoort, Delendatti and Perkins, in the first Exeter NI 43-101 Technical Report, “Technical Report & Proposed Exploration for Caspiche Project, Region III, Chile” 26 April 2008, by Van Kerkvoort, G., Delendatti, G.L.A., and Perkins, J. (Section 27, References).
| 13.1.2 | Core Samples for Test Work |
The first Exeter test programme was carried out on RC chips because of the timing of CSD 013 at the very end of the first field drilling season prior to the Andean winter. It was decided that all future work would be carried out on drill core, and indeed from that time all drilling at the Caspiche Porphyry was with diamond core, with the exception of a minor amount of shallow RC precollars.
Following an examination of early assay statistics, Exeter geologists and metallurgists decided it would be prudent to make a preliminary split of coarse crushed (nominal 70 % passing 10 mm) half-drill core and store this material for future metallurgical test regimes. If future statistics indicated a nugget effect that would require finer crushing of all the half-core, this procedure would be reviewed.
In August 2008, Exeter selected drill-hole intervals from the Caspiche Porphyry oxide and sulphide mineralized intercepts for metallurgical test work. Six oxide and six sulphide intervals were selected and the stored coarse crushed material was appropriately assembled and sent to two laboratories.
| 13.1.3 | Preliminary Oxide Test Work |
Caspiche oxide mineralization appeared to lie as a relatively thick horizontal blanket with little to no copper content, averaging less than 0.01 %Cu or below the detection limit of the laboratory analyses. It was hoped that this material would be amenable to heap leaching as it was thought it would be very difficult to float any gold values into a concentrate.
McClelland Laboratories International (MLI) of Sparks, Nevada carried out bottle roll tests on each of the six oxide intercepts at the as received size and at a finer crush of 1.7 mm. The intercepts were then combined to form two composites classified as Andesite and Porphyry which provided sufficient material for a column leach test on both. Gold dissolutions of
Project No.: C-580 January, 2012 | Page 129 - 378 |  |
approximately 77 % and 84 % were achieved in 30 days of leaching with moderate reagent consumptions. Exeter considered these results to be encouraging for heap leaching the oxide blanket. The programme was reported in detail in the independent Amec NI 43-101 Technical Report, “Caspiche Property, Region III, Chile, NI 43-101 Technical Report, Prepared for Exeter Resource Corporation” dated 14 September 2009 by Wakefield, T. W., and Marinho, R.
There was little oxide mineralization encountered in the 2009 drill programme and a dedicated oxide drill campaign was planned for 2010 with the results described in 13.3 following.
| 13.1.4 | Preliminary Sulphide Test Work |
The first six sulphide intercepts were sent to G&T Metallurgical Laboratories in Kamloops, BC in August 2008. G&T and Exeter agreed that the preliminary testwork for Caspiche should examine a wide range of rock and alteration types for liberation and flotation characteristics, prior to compositing.
All six samples were subjected to detailed modal analyses and mineralogical investigation to identify probable primary and regrind sizes for a conventional porphyry copper circuit. Rougher flotation was examined using standard reagents and once performance was stabilized, concentrate samples were reground and three stages of cleaning carried out with the objective of producing a 25 %Cu concentrate grade. The variable presence of enargite (Cu3AsS4) was confirmed in all samples as a significant copper mineral.
Later, in July 2009, following the completion of the 2009 field programme, Exeter selected a further 14 sulphide intervals which were a mix of quarter core and coarse reject material, which in combination with the previous six, provided a broad and representative sample of the mineralization to depths greater than 1,000 m down hole. Characterization test work similar to the original six samples was completed at G&T in Kamloops, followed by a similar programme of flotation testing.
As might be anticipated, the results were variable. Final concentrate grades ranged from 18 %Cu to 35 %Cu with an average of 27 %Cu, and average recovery at this grade was 83 %Cu. Gold recoveries to rougher concentrates averaged 78 % but dropped sharply through the cleaner circuit to average 52 % in final concentrate. Enargite in final copper concentrates resulted in arsenic assays from 0.02 % to just under 10 % with an average of 1.6 %As. Arsenic is considered by most smelters to be a deleterious element in commercial copper concentrates, generally above levels of 0.01 %As. Antimony was also noted at levels close to levels where smelter penalties might be levied.
Centrifugal gravity testwork was also carried out on selected rougher tails to gauge potential for scavenging gold values. Even though the rougher tails gold values were very low, approximately 0.15 g/tAu, on some samples, there appeared to be some potential.
Flotation performance was interpreted to be more sensitive to changes in sulphur grade than the style of mineralization, and it was decided to form composites from retained material from the 20 intercepts based on sulphur content, and move to flowsheet and locked-cycle testing (LCT). The high and low sulphur samples (HS and LS) were further split into high and low arsenic (HA and LA) so that 4 composites in total were tested and designated, LSLA, LSHA, HSLA and HSHA.
Project No.: C-580 January, 2012 | Page 130 - 378 | |
G&T carried out the detailed flotation programme on these composites in the first half of 2010 using slightly lower than normal dosage rates of conventional reagents. In the rougher flotation tests copper recovery averaged 90 % and gold recovery, 80 %. In general the results pointed toward a primary grind P80 of about 130 µm, a rougher pH of 8.5, a concentrate regrind P80 of about 20 – 25 µm, and an elevated cleaner pH of 11 – 11.5. Flotation conditions were varied but found to have a relatively small impact on performance.
The locked cycle tests confirmed that the high sulphur composites were more difficult to treat, with copper and gold recoveries averaging 85 % and 55 % respectively into a 24 %Cu concentrate. Arsenic grades were 0.6 % As and 2.2 % As for the low and high arsenic composites respectively. The low sulphur composites performed better with 87 % and 73 % gold being recovered into a 27 %Cu concentrate, with similar arsenic grades for the LA and HA samples.
G&T averaged the results of the four groups of LCTs but it is believed that this is not a good representation of the tests as the conditions between the tests were altered in an attempt to improve recovery and to some extent the concentrate grade.
The 8 LCT tests are summarized in Table 13.1. It can be seen that varying conditions did indeed change the results, particularly the copper concentrate grade, significantly in composites HSHA and LSLA. For all composites, high grade copper concentrates of at least 25 % Cu were achieved in all the tests except one.
Table 13.1: LCT Test Results at G&T
Test No | Composite | Copper | Gold | Arsenic |
| %Cu | %Cu Recv. | g/t Au | %Au Recv. | % |
| 47 | HS - HA | 30.0 | 82.0 | 68.7 | 52.1 | 3.3 |
| 51 | HS - HA | 16.5 | 88.6 | 43.3 | 59.2 | 1.7 |
| G&T Average | HS - HA | 20.2 | 84.9 | 50.9 | 57.9 | 2.3 |
| 29 | HS - LA | 27.3 | 83.3 | 30.5 | 47.2 | 0.4 |
| 39 | HS - LA | 28.3 | 84.4 | 32.0 | 56.4 | 0.7 |
| G&T Average | HS - LA | 27.8 | 84.6 | 31.6 | 52.0 | 0.6 |
| 13 | LS - HA | 33.5 | 86.1 | 79.4 | 69.9 | 3.2 |
| 37 | LS - HA | 24.7 | 87.5 | 57.0 | 71.2 | 2.6 |
| G&T Average | LS - HA | 27.9 | 86.7 | 65.9 | 72.4 | 2.9 |
| 20 | LS - LA | 25.1 | 88.6 | 64.8 | 72.6 | 0.6 |
| 38 | LS - LA | 30.4 | 90.4 | 73.4 | 75.5 | 0.6 |
| G&T Average | LS - LA | 26.8 | 89.1 | 67.2 | 72.7 | 0.6 |
Project No.: C-580 January, 2012 | Page 131 - 378 | |
A number of gravity tests, using a laboratory scale Knelson concentrator and a super-panner, were carried out on all four composites. Negligible gold was recovered in all but one composite, HS – HA. In this composite, 10.4 % of the gold from flotation feed was recovered into a concentrate containing 33 g/t Au.
In view of lower gold recoveries in the high sulphur composites, in mid-2010 Exeter commissioned SGS Lakefield laboratories to carry out an independent test programme on residual sample of the two high sulphur composites. Despite different reagent suites and operators, very similar results were obtained.
The results from these two programmes were reported in more detail in the September 2009 Technical Report by AMEC and the September 2010 Technical Report by Tolman and Perkins.
| 13.1.5 | Concentrate Treatment |
Exeter realized that Caspiche copper concentrates would almost certainly require further treatment to remove arsenic from final concentrates in order for them to be marketable. A large number of alternative treatment routes for arsenic removal either existed or were being developed. However, with the low copper grades encountered at Caspiche, it would be impractical to obtain sufficient concentrate from normal drill core samples to test more than one or two.
In 2009, SNC Lavalin Australia (SNC) was retained to review the appropriate technologies and select those most suited to Caspiche considering the concentrate characteristics and the physical location of the project. The basis was a hypothetical Caspiche concentrate based on flotation test results and hypothetical high and low altitude locations for treatment facilities. Reductive roasting was selected to remove arsenic and antimony and produce a saleable calcine product suited to existing custom copper smelters. Pressure oxidation was recommended as an alternative to allow cathode copper and doré gold to be produced directly; thereby bypassing the need to market concentrates. Testwork programmes were developed to confirm these two approaches.
| 13.2 | Sulphide Mineralization |
Metallurgical testwork on mineralized sulphide material has continued and a number of programmes are ongoing as of the effective date of this report (see section 13.5).
| 13.2.1 | November 2010 Pilot Plant |
Initially, Exeter geologists and metallurgists selected and sent 91 intercepts and used 84 of these intercepts for the pilot plant blend that was considered representative of the sulphide mineralization. The selections included all rock and alteration types and extended from 200 m to over 1300 m down hole. In total, 8620 metres of mineralization was represented and the calculated head assay of the combined mass was 0.25 %Cu, 0.53 g/tAu, 2.05 %S and 0.03 %As. This assay approximates that of the overall reserves and in Exeter’s opinon confirmed the representivity of the pilot plant sample.
This material all existed as coarse -9.5 mm crushed core with a total weight of over 11 tonnes and was sent to SGS Lakefield in Canada. The prime objective of the pilot plant programme was to produce sufficient copper concentrate for roasting and pressure oxidation
Project No.: C-580 January, 2012 | Page 132 - 378 | |
testwork, estimated at around 60 to 70 kg. In addition large quantities of other flotation products were collected, especially cleaner-scavenger tails which potentially represented a significant loss of gold from circuit. Cleaner scavenger tails samples were cyanide leached to test for gold recovery. A secondary but important objective was to test the flowsheet as developed. A third, equally important objective was to obtain plant design parameters on key process streams, for example rougher and cleaner tailings as well as the final concentrate.
Prior to the start of pilot plant operation, samples were split out for various physical tests and pre-pilot flotation testing. The physical tests included Bond Ball Mill Work Index, SMC® (SMC Testing Laboratories pty ltd) testing and gravity recoverable gold testing. The pre-pilot flotation testwork included the same progression as previous test work; from batch rougher tests to batch cleaner tests to locked cycle tests, and was carried out to confirm grind targets and reagent conditions. In addition batch pyrite flotation was tested on the first cleaner scavenger tails of two of the cleaner tests as well as on the same product from the final cycle of the locked cycle test.
The pilot plant campaigns began on 9th November 2010 and lasted for just over two weeks. The plant was assembled to mirror the flowsheet tested with flotation residence times being approximately twice those indicated in laboratory test work. Target primary grind size was 120 µm to 130 µm and rougher concentrate regrind target was 20 µm to 30 µm. The reagents used were potassium ethyl xanthate (PEX), potassium amyl xanthate (PAX), Aerofloat 208 (A208), Methyl Isobutyl Carbinol (MIBC) as a frother, carboxy methyl cellulose (CMC 7LT) as a depressant and hydrated lime for pH control.
The assembled plant was only run on day shift, and time was taken to assess early results and make decisions on any changes to operating conditions, as well as to occasionally test possible variations on flotation conditions in the laboratory. Five campaigns were run at about 100 kg/hour for a single shift followed by an extended sixth run for approximately 60 hours. The campaigns were observed in part by Exeter and Aker Solutions (now Jacobs) metallurgists.
Pilot plant flotation performance was reasonably steady for a manually controlled plant and cleaner recycle flows appeared to stabilize approximately 1 to 2 hours after start up, confirmed by hourly control samples. Grinding targets were difficult to achieve and the closed circuit screen size had to be progressively increased until the 5th campaign. All rougher tails and cleaner-scavenger tails flows were collected in 200 litre drums without overflow, and allowed to settle. During the second campaign, a pyrite circuit was operated on cleaner-scavenger tails using PAX as a stronger collector to produce a separate pyrite concentrate and final tail.
Solid-liquid separation tests and rheology tests were carried out on rougher tails, cleaner-scavenger tails and 3rd cleaner concentrate (final concentrate). The rheology tests were carried out on the thickened material. Filtration tests were also carried out on the 3rd cleaner concentrate. Detailed sizings and mineralogy of cleaner products was carried out.
Samples of cleaner-scavenger tails and the pyrite concentrate from the second campaign were tested for gold dissolution in cyanide leaching tests. Selected solutions from these tests were subject to sulphidization, acidification, recycling and thickening (SART) of precipitate test work. Subsequently samples of the same products from locked cycle flotation tests were similarly tested to check on variability of response.
Project No.: C-580 January, 2012 | Page 133 - 378 | |
A very large volume of data and test results were generated by the pilot plant programme described above. The principal results below were extracted from the SGS report, Project 12403-003, Final Report dated 28 February 2011. A selection of head assay values are illustrated in Table 13.2. indicating that the material tested closely matched the material selected.
Table 13.2: Sample Assays
| Sample | Cu % | Au g/t | S % | As % |
| Exeter – Calculated head assay | 0.23 | 0.54 | 1.79 | 0.03 |
| SGS – Actual head assay split | 0.25 | 0.53 | 2.1 | 0.03 |
| SGS – PP feed average assay | 0.25 | 0.55 | 2.03 | n/a |
| SGS – LCT calculated head assay | 0.20 | 0.44 | 1.85 | n/a |
Duplicate SMC tests were carried out to provide Julius Kruttschnitt Mineral Research Centre (JKMRC) Drop Weight Index (DWI) values, and other JKMRC mill design parameters, as well as solids SG.
The results which are summarized in Table 13.3 indicated that the samples straddled the average of more than 11000 test results on over 600 deposits in the JKMRC database.
Table 13.3: Physical Tests
| Sample | DWI | A | b | Abrasion parameter ta | SG | Ab | T10 |
| | kWh/m3 | | | | | Value | Rank | Value | Rank |
| 1 | 6.29 | 81.6 | 0.51 | 0.41 | 2.62 | 41.6 | mod hard | 32.6 | medium |
| 2 | 5.21 | 69.8 | 0.72 | 0.50 | 2.62 | 50.3 | medium | 35.8 | mod soft |
The Bond Ball Mill work index (BWi) of a head sample at a passing screen size of 106 µm was 12.8 kWh/tonne. The operating work index of the primary grinding mill during the pilot plant extended run was 12.2 kWh/tonne when producing a P80 of around 120 µm, which is in reasonable agreement.
| 13.2.1.2 | Flotation Summary |
Table 13.4 below summarizes the locked cycle tests and the average pilot plant results:
Project No.: C-580 January, 2012 | Page 134 - 378 | |
Table 13.4: Selected Pilot Plant Flotation Results
| | Product | Mass Wt% | Assay (Adj.) | Distribution, % |
| Cu % | Au g/t | S % | Cu | Au | S |
AVG PP-06A to PP-06D | PP Feed | 100.0 | 0.25 | 0.55 | 2.03 | 100.0 | 100.0 | 100.0 |
| Rougher Conc | 8.7 | 2.48 | 4.68 | 16.6 | 87.4 | 74.7 | 71.1 |
| Rougher Tail | 91.3 | 0.034 | 0.15 | 0.64 | 12.6 | 25.3 | 28.9 |
| 1st Cleaner Scav Tail | 7.9 | 0.34 | 1.55 | 15.0 | 10.8 | 22.5 | 58.3 |
| 3rd Cleaner Conc | 0.8 | 23.5 | 35.4 | 32.2 | 76.6 | 52.2 | 12.8 |
| LCT | Head (calc) | 100.0 | 0.20 | 0.44 | 1.85 | 100.0 | 100.0 | 100.0 |
| Rougher Conc | 8.3 | 2.08 | 4.04 | 15.1 | 86.5 | 76.0 | 67.7 |
| Rougher Tail | 91.7 | 0.029 | 0.12 | 0.65 | 13.5 | 24.0 | 32.3 |
| 1st Cleaner Scav Tail | 7.5 | 0.15 | 1.13 | 12.9 | 5.6 | 19.3 | 52.6 |
| 3rd Cleaner Conc | 0.8 | 20.9 | 32.3 | 35.9 | 81.0 | 56.7 | 15.0 |
The pilot plant was not intended to simulate or predict full scale plant recoveries; however LCTs are often used for this purpose. The results were in reasonable agreement although the LCT sample appeared to have a lower grade. The best pilot plant run was the 4th which produced a final concentrate of 31 %Cu at 75 % copper recovery and 59 % gold recovery. As in previous test work, losses of gold and copper to first cleaner-scavenger tails were considerable as can be seen in the table above.
Of note were the mass pulls to rougher concentrate that were necessary to achieve these recoveries, and the resultant high weights reporting to cleaner tails together with substantial copper and gold values. To a large extent this was considered normal and a function of the low copper head grade and significant quantities of pyrite present.
Table 13.5 details assays that were carried out on the concentrate and cleaner-scavenger tailings for downstream testwork. Mineralogical analyses indicated that 55 % of the copper was present as chalcopyrite and 30 % as enargite in both products. In this concentrate the arsenic and antimony contents would be considered deleterious by most custom smelters. Mercury is also elevated and could at a level considered deleterious by some smelters.
Table 13.5: Detailed Product Assays
| Product Stream | Cu % | Au g/t | Ag g/t | S % | As % | Cl g/t | F % | Hg g/t | Sb % | SiO2% |
3rd Cleaner Conc | 22.3 | 31 | 73 | 33.5 | 2.27 | 150 | 0.017 | 48 | 0.41 | 9.2 |
| Cleaner-Scav tails | 0.24 | 1.2 | 3.7 | 14.2 | 0.07 | 85 | 0.16 | 1.9 | 0.00 | 46.0 |
Project No.: C-580 January, 2012 | Page 135 - 378 | |
| 13.2.1.3 | Product Characteristics |
All three principal products settled well with non-ionic flocculant Magnafloc 333 with clear supernatants. There was quite a large variation in results and the best results for good percentage underflow solids are summarized in Table 13.6:
Table 13.6: Settling Test Results
| Product Stream | Mag 333 | Feed | Underflow | Unit Area | Critical Solids |
| g/t | % solids (wt) | % solids (wt) | m2/t/day | Density % wt |
| Rougher Tailings | 25 | 10 | 57 | 0.048 | 66 |
3rd Cleaner Conc | 10 | 16 | 76 | 0.021 | nd |
| Cleaner-Scav tails | 46 | 5 | 45 | 0.103 | 50 |
For rougher tailings, unit areas were in the range of 0.048 to 0.071 m2/t/d for a flocculant dosage of 25 - 45 g/t.
For scavenger cleaner tails, unit areas were in the range of 0.103 – 0.144 m2/t/d for a flocculant dosage of 36 – 56 g/t.
Rheology tests were carried out using a concentric cylinder rotational viscometer (CCRV) to determine critical solids density (CSD) of the three products. The CSD of rougher tailings was 66 % wt of solids at 98 Pa unsheared yield stress. The sample appeared thixotropic on shearing with a solids content of up to 68.7 %. The Cleaner Scavenger tails CSD was 50 % wt corresponding to an unsheared yield stress of 55 Pa. Both samples displayed primarily Bingham Plastic behaviour.
Final concentrate was fast settling when shear was applied and a vane viscometer had to be used. At 83.1 and 81.7 % solids, peak yield stresses of 122 and 60 Pa were measured respectively. Such fast settling behaviour will need to be examined in more detail for pumping calculations.
Pressure filtration testing of the final concentrate was not possible due to settling in the feed chamber of the feed diaphragm pump. Alternative pump units to suit the chamber were not available; however Exeter metallurgists believe such issues are not considered likely to affect commercially available production units.
Vacuum filtration testing was straightforward and SGS predictions were as shown in Table 13.7.
Project No.: C-580 January, 2012 | Page 136 - 378 | |
Table 13.7: Vacuum Filtration Test Results
| Filter Test Predictions | Feed Solids | Cake Thickness | Cake Moisture | Vacuum Filter Cycle Times (Minutes) | Dry Output |
| % wt | mm | % wt | Form | Dry | kg/m2/hr |
| Belt Filter | 75 | 15 | 9 | 0.12 | 0.86 | 2062 |
| 75 | 30 | 9 | 0.47 | 1.73 | 1842 |
| Disc or Drum Filter | 75 | 10 | 11.8 | 0.05 | 0.09 | 7770 |
| 75 | 18 | 10.9 | 0.17 | 0.28 | 4317 |
| 75 | 30 | 10.1 | 0.47 | 0.78 | 2590 |
The results for the specific throughput for the belt filter at a lower moisture content of 8 % were about 950 kg/m2/h – this would be an acceptable parameter for the design criteria. However, a pressure filter is likely to produce a better result than a belt filter and should be tested at the earliest opportunity with one of the commercial suppliers. The use of a drum filter is not recommended due to the higher product moisture.
A rougher tailings sample from the pilot plant campaign has been treated for almost 40 weeks in a humidity cell at SGS Lakefield. The leach solutions appear relatively stable and at the time of writing no parameters are outside Chilean environmental limits.
The SGS pilot plant run provided the opportunity to gather representative kilogram-quantity samples of cleaner-scavenger tails and test further processing of them in efforts to reduce losses of copper and gold, as well as potential silver, that had occurred in all flotation test work to date.
In view of the high mass pulls to rougher flotation concentrate, it was decided to follow up selective earlier laboratory tests and try to separate a pyrite concentrate from the cleaner-scavenger tails containing gold values. This was done during the second pilot plant campaign throughout an operational shift and the results are shown in Table 13.8:
Table 13.8: Pilot Plant Pyrite Flotation Results
| Product | Weight % | Assay | Distribution % |
| Cu % | Au g/t | S % | Cu | Au | S |
| Pyrite Feed (Cl Sc Tails) | 100.0 | 0.13 | 0.76 | 8.23 | 100.0 | 100.0 | 100.0 |
| Pyrite Concentrate | 33.4 | 0.32 | 1.92 | 21.7 | 82.7 | 83.8 | 88.0 |
| Pyrite Tails | 66.6 | 0.03 | 0.19 | 1.49 | 17.3 | 16.2 | 12.0 |
It should be pointed out that the actual operational mass pull during this pyrite flotation test was quite high at 12.3 % as opposed to more normal mass pull targets of 7 % to 8 %. A sample of pilot plant cleaner-scavenger tailings and pyrite concentrate as well as two samples of cleaner scavenger tails from locked cycle tests were pre-aerated for 24 hours and then leached for 48 hours in 0.1 % NaCN solution at 40 % solids as the optimum conditions. No carbon additions were trialed in these tests. The results of the leach tests are summarized in Table 13.9.
Project No.: C-580 January, 2012 | Page 137 - 378 | |
Table 13.9: Flotation Product Cyanide Leaching Results of Flotation Plant Products
| Sample Leached | 48 hour % extraction | NaCN | Calculated Head |
| Au | Ag | Cu | Kg/t | Au g/t | Ag g/t | Cu % |
| PP Cleaner Scavenger Tails | 67.6 | 39.1 | 46.5 | 3.99 | 1.25 | 4.1 | 0.26 |
| PP Pyrite Concentrate | 67.3 | 32.2 | 46.9 | 4.48 | 1.56 | 4.6 | 0.30 |
| LCT Cl Sc Tails - HSHA | 60.5 | 48.0 | 49.2 | 1.77 | 1.19 | 2.9 | 0.12 |
| LCT Cl Sc Tails - HSLA | 60.2 | 50.7 | 47.9 | 1.33 | 1.11 | 1.8 | 0.08 |
SART tests for cyanide recovery were carried out on three of the solutions from these tests. The optimum conditions were found to be pH 4 using 110 % of the stoichiometric requirement of sodium hydrogen sulphide (NaSH). Sulphuric acid additions ranged from 1.3 g/L to 1.8 g/L and re-neutralization hydrated lime additions ranged from 0.94 g/L to 1.4 g/L. The results are summarized in Table 13.10.
Table 13.10: SART Cyanide and Copper Recovery Results
| SART Sample | Sodium Cyanide | Copper |
| Added kg/t | Recovered kg/t | Recovered % | Feed mg/t | Tails mg/t | Recovered % |
| PP Cleaner Scavenger Tails | 4.74 | 3.5 | 74 | 851 | 0.4 | 100 |
| LCT Cl Sc Tails - HSHA | 3.03 | 2.6 | 86 | 363 | 8.0 | 98 |
| LCT Cl Sc Tails - HSLA | 2.64 | 2.1 | 80 | 244 | 0.4 | 100 |
The copper recoveries were almost quantitative as expected however the cyanide recoveries ranged from 74 % to 86 %, most probably as a result of cyanide present as thiocyanate, SCN-, which cannot be regenerated in the SART circuit and is instead mostly precipitated into the copper product.
| 13.2.3 | Pressure Oxidation of Caspiche Concentrate |
SGS were selected to carry out a batch bench-scale pressure oxidation (POX) testwork programme on a portion of the pilot plant final concentrate.
The POX tests were carried out in 2 litre Parr titanium autoclaves and examined the effects of temperature, residence time and grind size. Copper extraction was greater than 99 % for the conditions tested which included temperatures from 210 oC to 225 oC and 60 to 120 minutes residence time. As expected, reaction kinetics were faster at the higher temperature of 225 degrees and with a reground concentrate P80 of 32 µm complete oxidation occurred within 60 minutes. The arsenic content of final solutions was low, with 200 mg/L average depending on the conditions used in each individual test while virtually all antimony remained in the residue. The final solutions contained from 20 to 23 g/L Cu and 40 to 50 g/L H2SO4. Weight loss of solids was between 49-60 %. The POX residues were washed and selected samples were bottle-roll leached at 25 % solids in 1 g/L sodium cyanide solution for 24 to 48 hours. Gold dissolutions were high and ranged from 95 % to 99 % with an average cyanide consumption of 1.4 kg/t. Generally leaching was complete after 24 hours. Lime consumptions ranged from 5 to 70 kg/t with the lower figure obtained using a “hot cure” stage on the autoclave discharge to break down basic sulphates. Silver recoveries were low
Project No.: C-580 January, 2012 | Page 138 - 378 | |
and ranged from 7 % to 29 %. It is possible that these could be improved by a post POX treatment route and should be investigated in future pilot plant work.
All leach tests resulted in calculated gold head assays lower than the assay head. SGS speculated that some gold could be in the POX pregnant solution as a result of chloride or fluoride but it did not show up in assays and was not investigated further.
A comparison leach was carried out on the un-oxidized flotation concentrate. This showed 14 % gold dissolution after 48 hours with 19 kg/t cyanide consumption.
| 13.2.4 | Reductive Roasting of Caspiche Concentrate |
Two roasting technology suppliers were contracted to carry out small scale roasting testwork on Caspiche pilot plant final concentrate. The objective was to reduce arsenic contained in the concentrate to 0.2 % As or less while maintaining sulphur content in the roaster product (“calcine”) as high as possible. Outotec carried out testwork in Germany and Sweden and Technip carried out testwork at Hazen Research in Denver, Colorado.
| 13.2.4.1 | Outotec Roasting Testwork |
Outotec carried out testwork in a standard Boliden rotary kiln and in a 50 mm fluid bed reactor using SO2 gas as the fluidizing medium. The resulting calcine values from both tests are held to reflect those for full scale operation.
The calcine indicated very good fluidizing properties when fluidized with nitrogen at up to 700 oC, however agglomeration was observed at 650 oC when fluidized with SO2. Outotec found the agglomerates to be soft and anticipated that this would not be an issue with a full scale roaster operating with double the gas velocities and with an inert sand fluidizing medium.
A summary of the fluidized bed calcine results is given in Table 13.11, copied from the Outotec report.
Table 13.11: Elemental Analysis of Calcine Test Products
| Test | Temp (oC) | Cu (%) | Fe (%) | S (%) | Zn (%) | As (%) | Sb (%) | SiO2 (%) | Al2O3 (%) |
| 113/10* | | 23.6 | 25.9 | 32.8 | 0.75 | 2.40 | 0.53 | 9.2 | 1.8 |
| 1 | 600 | 22.8 | 31.4 | 27.9 | 0.63 | 0.19 | 0.25 | 12.7 | 2.4 |
| 2 | 650 | 24.1 | 31.1 | 27.3 | 0.73 | 0.14 | 0.18 | 12.0 | 2.2 |
| 3 | 700 | 24.9 | 30.9 | 27.2 | 0.75 | 0.16 | 0.13 | 11.8 | 2.2 |
| 4 | 725 | 26.0 | 30.8 | 25.5 | 0.81 | 0.19 | 0.16 | 11.4 | 2.2 |
| 5 | 600 | 23.5 | 30.9 | 27.6 | 0.68 | 0.33 | 0.24 | 12.2 | 2.4 |
| 6 | 650 | 24.1 | 31.3 | 25.5 | 0.69 | 0.11 | 0.16 | 12.7 | 2.2 |
| 7 | 700 | 25.0 | 31.0 | 25.6 | 0.74 | 0.18 | 0.15 | 11.7 | 2.2 |
| 8 | 725 | 25.4 | 31.0 | 24.1 | 0.75 | 0.26 | 0.16 | 11.5 | 2.5 |
The programme indicated an optimum temperature in the 650 oC to 700 oC range for reducing arsenic and antimony while maintaining sulphur values. Calcine residues of much less than 0.20 %As were achieved and almost 70 % of the antimony was removed. Outotec considered the concentrate to be very good for full scale fluidized roasting and recommended further pilot scale work to optimize conditions.
Project No.: C-580 January, 2012 | Page 139 - 378 | |
| 13.2.4.2 | Technip Roasting Testwork |
The testwork was carried out at Hazen Research’s facilities in Denver under the supervision of Technip personnel. Hazen carried out the work in a 107 mm inside diameter stainless steel fluidized bed reactor within a heating chamber. The inert fluidizing medium was sand. The off gases and solids were treated in a cyclone for solids recovery to underflow and the cyclone overflow passed to a baghouse. Final off gases were scrubbed by NaOH in a packed column. The column was fluidized with nitrogen into which a calculated amount of oxygen was metred. Process gases were sampled and analysed.
Six runs of approximately 2 hours duration at steady state were carried out under different process conditions. Technip found that temperatures of 725 oC to be best for arsenic removal and achieved calcines of 0.2 %As at these levels as indicated in Table 13.12, copied from the Hazen Research report. Sulphur assays in the calcine were 26 % to 27 %S.
The baghouse product (arsenic concentrate) assayed from 3 %As to almost 7 %As.
Table 13.12: Summary for Partial Roast of Caspiche Flotation Concentrate
| Measurement | Fluid-bed Roast Test |
| 1 | 2 | 3 | 4 | 5 | 6 |
| Average Temperatures, °C | | | | | | |
| Bed zone (3) | 625 | 650 | 625 | 675 | 725 | 725 |
| Freeboard | 430 | 435 | 415 | 430 | 450 | 530 |
| Cyclone outlet | 290 | 300 | 285 | 300 | 315 | 350 |
| Average Rates, g/min | | | | | | |
| Concentrate | 27.2 | 26.8 | 25.2 | 26.6 | 26.2 | 120.6 |
| Cyclone | 21.6 | 20.4 | 21.8 | 21.0 | 20.6 | 85.2 |
| Baghouse | na | 0.64 | 0.63 | 0.73 | 0.51 | 3.8 |
Gas Flows, sft3*/min | | | | | | |
Fluidizing N2 | 2.93 | 2.93 | 2.93 | 2.93 | 2.93 | 1.03 |
Feed transport N2 | 0.45 | 0.45 | 0.45 | 0.45 | 0.45 | 0.48 |
Purge N2 | 0.02 | 0.02 | 0.02 | 0.02 | 0.02 | 0.02 |
Oxidant, sLmin O2 | 1.9 | 1.9 | 2.4 | 2.4 | 2.4 | 9.3* |
| Total Sulfur Assay, wt% | | | | | | |
| Concentrate feed | 33.7 | 33.7 | 33.7 | 33.7 | 33.7 | 33.7 |
| Final test cyclone | 27.9 | 27.5 | 27.4 | 25.9 | 26.1 | 27.2 |
| Final test baghouse | na | 25.2 | 24.3 | 23.2 | 23.5 | 22.1 |
| Arsenic Assay, wt% | | | | | | |
| Concentrate feed | 2.16 | 2.16 | 2.16 | 2.16 | 2.16 | 2.16 |
| Final test cyclone | 0.83 | 0.678 | 0.599 | 0.318 | 0.191 | 0.206 |
| Final test baghouse | na | 2.45 | 2.93 | 3.15 | 3.08 | 6.87 |
na = not availabe
* standard cubic feet per minute.56 sft3/min air added as oxidant with the N2 equivalent O2 (sL/min) from air hown.
For the prefeasibility study the parameters set were: Feed grades 0.231 %Cu and 0.562 g/tAu; recovery 83 %Cu and 60 %Au; concentrate grade 25 %Cu and 44 %Au; crushing P95 at 2”, grinding P80 at 130 µm, regrind P80 at 30m.
Project No.: C-580 January, 2012 | Page 140 - 378 | |
There was very little additional oxide mineralization encountered in the 2009 drill programme, so a specific drilling programme was completed in the 2009 – 2010 field season to obtain appropriate oxide samples.
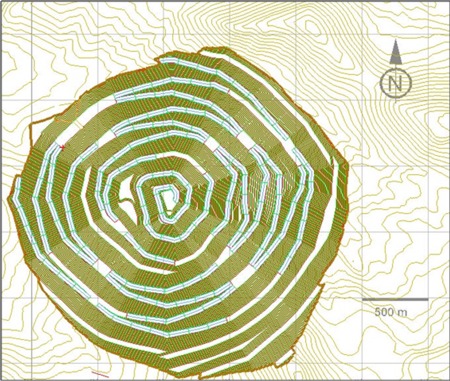
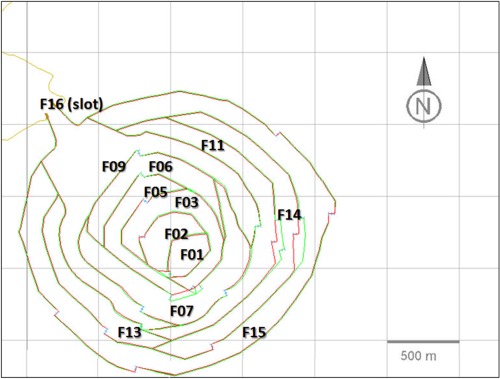
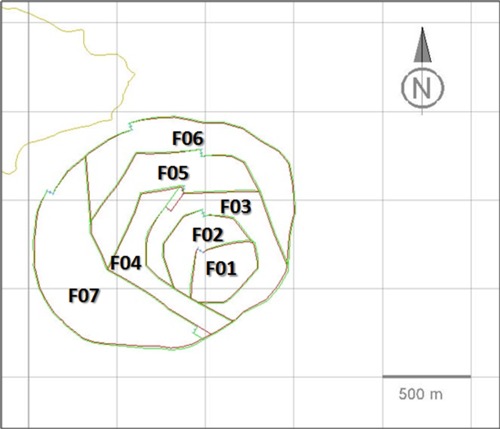
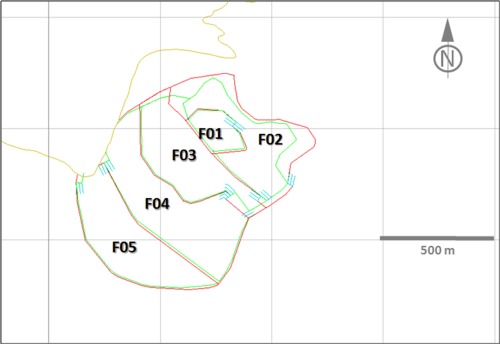
Following the encouraging results of the initial column leaching tests referred to in 13.1.3 a comprehensive column leach programme was implemented. The objective was to examine leaching characteristics at a range of oxide crush sizes in order to be able to select the most appropriate size or project possible run-of-mine (ROM) recoveries by heap leaching. Seven large diameter PQ core (85 mm diameter) and HQ core (63 mm diameter) drill holes were completed to characterize the oxide zone, with several of them “twinning” RC holes by earlier explorers. The oxide mineralization encountered in these PQ holes was considered by Exeter geologists to be broadly representative of the oxide resource in terms of depth and area.
The mineralization intersected in these holes was split into 11 composites based on rock type, depth or location and ranged in length from 22 metres to 116 metres of continuous sample. The intention was to column test each composite at nominal P80 sizes of 50 mm, 25 mm and 12.5 mm, as well as completing bottle roll and physical (crushing, abrasion) testwork.
The programme was carried out at MLI in 2010 in 10’ high columns with diameters up to 12” selected to suit the top size of material. The weight requirements for the larger columns meant that only 8 of the 11 composites were able to be tested at all 3 sizes. One of these 8, Composite 8, was a transition sample, included to evaluate what might happen if leaching of oxide was extended into the transition zone. Composite 1 was a sample of mineralized transported material from 0 to 22 m depth and there was only sufficient to be tested at 12.5 mm. Composite 3 (86 m to 146 m) and Composite 11 (120 m to 150 m) were tested at P80 of 25 mm and 12.5 mm.
The whole PQ core was hand-crushed at MLI in order that the largest size range would be as coarse as possible. The average size distribution of the 8 composites tested at the coarser size turned out to be approximately 65 % passing (P65) 50 mm rather than the nominal 80% passing size. This coarser than nominal size should be considered when reviewing results. Head grades of all the oxide composites ranged from 0.39 to 0.67 g/t Au and 50 to 230 ppm Cu. The transition composite contained 0.07 %Cu and 0.83 % sulphide sulphur.
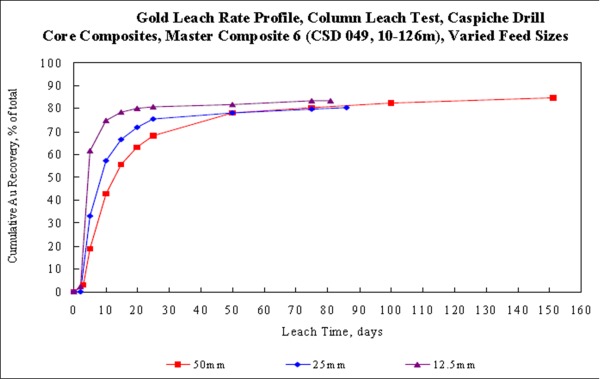
The seven oxide composites that were tested at all three feed sizes gave average gold recoveries of 79.3 %, 80.4 % and 81.7 % for 50 mm, 25 mm and 12.5 mm respectively. Gold recovery rates for the -50 mm feeds were substantially slower than for the finer feeds, however gold recovery was expected to approach those obtained from the finer feeds with a longer leaching cycle. Composite 11 (120 m to 130 m) gave the lowest gold recoveries of the oxide samples at just over 70 % for the 25 mm material. An example of a kinetic curve for gold dissolution from the test programme is given in the Figure 13.1.
Project No.: C-580 January, 2012 | Page 141 - 378 | |
Figure 13.1: Gold Leach Rate Profile
Gold recoveries obtained from Composite 8 at -50 mm, -25 mm and -12.5 mm were 54.2 %, 68.8 % and 68.9 % respectively, and the leach kinetics were slower than for the oxide samples. As expected with the higher copper content, cyanide consumptions were significantly higher. The results suggest that transition material could be treated by heap leaching if required, however it is probable that copper might need to be removed and cyanide recovered in a SART facility, also that gold recoveries will be much lower. Due to the copper in solution, transition material should not be leached or mixed with oxide material.
Bottle roll test results at P80 -1.7 mm feed sizes were reasonably predictive of column test gold recoveries, and were effectively used for estimation of column test lime requirements. This suggests that in production, such tests might be able to be used for performance prediction if carried out on blast hole cuttings.
Cyanide consumptions for the oxide composites were high, but should be significantly lower in commercial production. This is based on comparative testwork data base results and actual production results of similar operations. Lime requirements were moderate, and pH control during leaching generally was not difficult. Load/permeability tests on the column residues indicated that the oxide ore material would display adequate permeability under expected heap stack height compressive loadings.
Sufficient material was left from two composites to carry out additional column leaches at 25 mm using lower cyanide concentrations, namely addition rates of 1.00, 0.50 and 0.25 kg/t NaCN. The results of this optimization programme are summarized in Table 13.13.
Project No.: C-580 January, 2012 | Page 142 - 378 | |
Table 13.13: Results of Optimization Programme
Composite Number (P80 of 25 mm, 80 day leach) | Gold Recovery % at | NaCN Consumption, kg/t |
| NaCN Addition Strength g/L | NaCN Addition Strength g/L |
| 1.00 | 1.00 | 0.50 | 0.25 | 1.00 | 1.00 | 0.50 | 0.25 |
| 6 (CSD049; 10 m to 126 m) | 80.3 | 84.2 | 83.0 | 80.4 | 1.71 | 1.67 | 1.10 | 0.72 |
| 9 (CSD054; 24 m to 128 m) | 81.4 | 79.4 | 76.8 | 77.3 | 1.38 | 1.38 | 1.13 | 0.88 |
The programme indicated the expected downward trend in cyanide consumption together with a small reduction in gold recovery with the weaker solutions. Once again, even at the lower cyanide additions, consumptions in a full scale heap are expected to be considerably lower.
The results from this programme were considered to confirm comprehensively the technical application of heap leaching for oxide ore by both MLI and Exeter and, together with the crushing and abrasion results, provided sufficient information to carry out a detailed study into this treatment route by Aker Solutions.
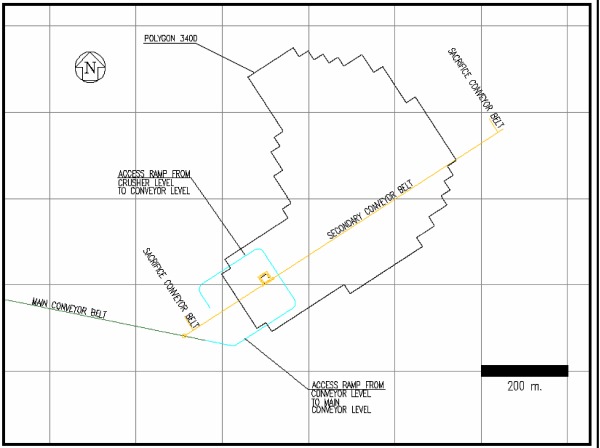
Aker endorsed the Exeter programme results and during the preliminary engineering trade-off phase of the PFS determined that a 5 year oxide operation on -50 mm material would be close to optimal. In reviewing the crushing design, the conventional use of a gyratory crusher in the circuit for such a short operational life was considered sub-optimal as the crusher would be too small for the later sulphide operation. Aker’s conceptual design called for screening ahead of jaw crushing followed by open-circuit secondary crushing. Both Aker and a crusher manufacturer called for a large sample to be sized in order to develop reasonable crushing plant design parameters.
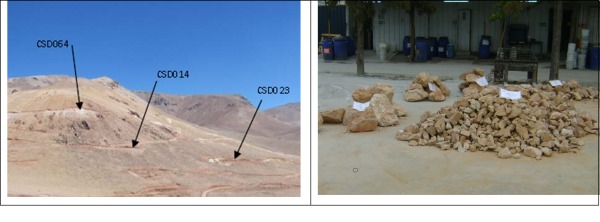
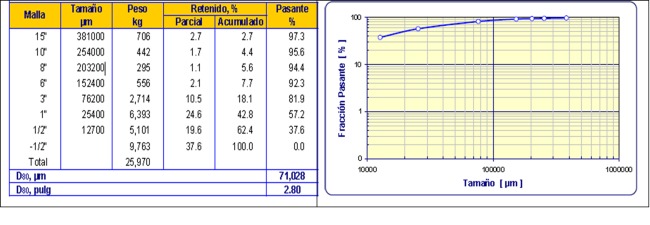
In January 2011, two truckloads of mineralized oxide material was excavated from 3 trenches located next to drill holes 14, 23 and 64 and were sent to SGS Santiago for sizing. This data was used to estimate screening requirements ahead of the jaw crusher and assist in dimensioning the crusher. The samples were selected and composited to reflect actual Caspiche oxide ore composition as much as practically possible given the limited outcrop and depth penetration. All waste or “transported” material was carefully excluded from the samples.
Project No.: C-580 January, 2012 | Page 143 - 378 | |
Figure 13.2: Oxide Material
The results obtained from SGS are reproduced in Figure 13.3 and indicate ROM feed sizing (F80) from the test pit locations of 2.8” or 71 mm.
Figure 13.3: Results Obtained From SGS
MLI are also completing humidity cell testwork on column residues to check the propensity for acid rock drainage (ARD) on heap leach materials.
For the prefeasibility study the parameters set were: Feed grade average 0.404 g/tAu; recovery 78 %; crushing P95 at 2”.
Project No.: C-580 January, 2012 | Page 144 - 378 | |
| 13.4 | MacNeill Zone Testwork |
The MacNeill Zone is an area of late stage intermediate sulphidation mineralization to the west-south-west of the main porphyry zone on the lower flange of a barren diatreme. It is characterized by low copper assays normally less than 0.10 %Cu and in general average to above average gold assays. Before it was recognized as a separate system, one intercept from the 20 original intercepts sent to G&T was from MacNeill. This intercept, CSD 036,
196 m – 262 m, assayed 0.03 %Cu and 0.94 g/t Au and was not amenable to flotation, recovering only 47 % of the copper and 34 % of the gold into a concentrate assaying 0.71 %Cu.
Accordingly it was decided to check the preliminary response of this zone to heap leaching by carrying bottle roll and column leach tests at MLI in Reno.
| 13.4.1.1 | Preliminary MacNeill Testwork |
Initially 6 samples from drill holes CSD 044 and CSD 042, considered typical of MacNeill mineralization, were sent to MLI and represented progressively deeper intervals in the zone. Gold assays varied from 0.36 g/t Au to 1.33 g/t Au and copper from 0.04 %Cu to 0.11 %Cu. In spite of the variations in gold head grade depths, bottle roll gold recoveries in % terms from all six samples were similar at similar stages of the leach, and averaged just under 60 % with a range of 54 % to 65 %. Cyanide consumptions averaged 0.5 kg/t NaCN on all but the 0.11 %Cu sample which consumed 1.2 kg/t NaCN. Leach kinetics appeared to be quite rapid.
| 13.4.1.2 | MacNeill Amenability Testwork |
It was decided to follow up this work at MLI with 13 coarse crushed (9.5 mm) intercepts from the 2009-2010 drilling campaign which were proportioned to make 7 composites, 3 destined for column tests and 4 destined for bottle roll and flotation tests. The 3 composites for column testing represented shallow, deep and “transitional” material - where MacNeill overprints conventional Caspiche mineralization (“McTrans”). The four for flotation testing represented MacNeill and McTrans split into high sulphur (HS) and low sulphur (LS) composites.
The results of cyanide leaching all 7 composites at different sizes are summarized in Table 13.14:
Project No.: C-580 January, 2012 | Page 145 - 378 | |
Table 13.14: MacNeill & McTrans Gold Leach Recoveries
| Composite | Gold Recovery % | NaCN consumption kg/t |
| 9.5 mm | 1.7 mm | 75 µm | 9.5 mm | 1.7 mm | 75 µm |
| MacNeill Shallow | 69.7 | 69.0 | 80.6 | 1.29 | 0.68 | 0.59 |
| MacNeill Deep | 55.3 | 64.0 | 79.1 | 1.05 | 0.39 | 0.29 |
| McTrans | 54.7 | 63.1 | 71.4 | 1.27 | 1.00 | 1.05 |
| MacNeill HS | n/a | 65.0 | 73.6 | n/a | 0.45 | 0.47 |
| MacNeill LS | n/a | 67.2 | 75.9 | n/a | 0.75 | 0.67 |
| McTrans HS | n/a | 60.7 | 67.9 | n/a | 1.05 | 1.28 |
| McTrans LS | n/a | 68.8 | 83.6 | n/a | 1.22 | 0.52 |
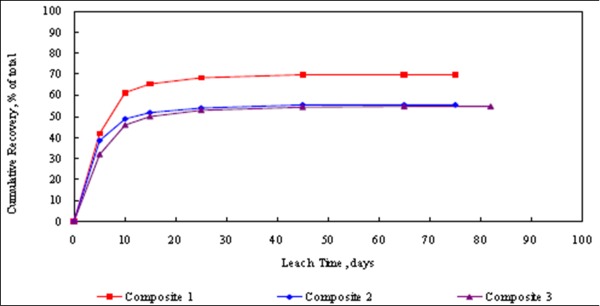
The three 9.5 mm results represent agglomerated column tests where the gold leached very quickly to the final recovery levels of between 55 % and 70 %.
Figure 13.4: Cumulative Recovery
The high cyanide consumptions in the column tests are believed to be a function of leaching for 80 days and would be expected to be substantially less at 20 to 30 days. Generally cyanide consumptions are higher on McTrans than on MacNeill material and reflect the amount of copper present. Copper extractions ranged from 12.5 % to 25 %. No percolation problems or slumping was observed in the column tests.
While flotation was carried out on the appropriate composites, they did not respond particularl well at normal sizes and when recovery did improve at a 45 µm, concentrate copper grades were still low.
For the prefeasibility study the parameters set were: Feed grade average 0.508 g/tAu; recovery 40 %; crushing P95 at 2”.
Project No.: C-580 January, 2012 | Page 146 - 378 | |
| 13.5 | Ongoing Test Programmes |
As of the effective date of this report, testwork is continuing on several programmes at both SGS Lakefield and MLI in Reno. While the work has not been formally finalized and no reports are available, in some cases final test data has been available and has been used by Aker and Exeter.
| 13.5.1 | Sulphide Mineralization |
| ● | 12403-008 Flotation Optimization |
This programme uses left-over pilot plant feed material to optimize flotation conditions and improve copper and gold flotation recoveries. It is a conventional programme looking at a wider range of physical and reagent conditions recommended by metallurgical experts in this field of low grade copper porphyry flowsheet development.
Within the scope are trials of magnetic separation, flash flotation and gravity recovery of gold from both feed and pilot plant tails.
| ● | 12403-005 Variability Assessment |
This programme has used lower than average copper grade drill core intercepts from the pilot plant shipment of 91 intercepts. Conditions close to the optimum identified in 12403-008 are being used to review the response of each sample to standard conditions but may be adjusted based on detailed mineralogy being carried out. This means that the programme necessarily has to lag behind the optimization programme. Weights of intercepts available for testwork are limited and it may not be possible to go to LCT tests.
| ● | 12403-006 HPGR and Physical Characteristics |
This programme uses whole HQ core from an abandoned drill hole, CSD039 (Composites 1, 2 and 3) and a metallurgical hole Mett03 (Composites A to H) drilled for the purpose down through the main zone of mineralization. The samples numbering is progressive with depth to reflect both key type changes in mineralization and to provide sufficient weight for a comparative comminution programme. Comminution results were largely completed some time ago and have been provided to Aker (Table 13.15) for use in preliminary HPGR evaluation; however the design criteria for the three cases under study have not used this data. Together with the pilot plant data and comparative work indices carried out by both G&T and SGS, Exeter consider the comminution characteristics have been adequately defined for pre-feasibility purposes in terms of representivity and variability in the deposit. Additional results of a confirmatory nature would be required for feasibility study purposes.
Project No.: C-580 January, 2012 | Page 147 - 378 | |
Table 13.15: Physical Test Results 12403-006
Sample Name | Relative Density | SMC A x b | SPI Index (min) | Abrasion Index (g) | UCS Mpa | HPGR kWh/t | Bond Ball Wi kWh/t |
| Comp 1 | 2.66 | 76.5 | 50.1 | 0.36 | 73 | 1.8 | 9.9 |
| Comp 2 | 2.60 | 76.7 | 37.3 | 0.34 | 69 | 1.7 | 10.4 |
| Comp 3 | 2.49 | 97.1 | 32.0 | 0.10 | 16 | 1.7 | 9.9 |
| Comp A | 2.52 | 73.8 | 43.2 | 0.20 | 13 | 1.9 | 11.5 |
| Comp B | 2.50 | 85.8 | 39.9 | 0.26 | 27 | 1.7 | 9.2 |
| Comp C | 2.53 | 69.7 | 46.9 | 0.33 | 32 | 1.8 | 10.4 |
| Comp D | 2.57 | 57.0 | 49.6 | 0.40 | 53 | 1.8 | 11.5 |
| Comp E | 2.49 | 43.9 | 58.4 | 0.34 | 75 | 1.8 | 11.4 |
| Comp F | 2.55 | 51.8 | 62.1 | 0.36 | 59 | 1.9 | 11.1 |
| Comp G | 2.59 | 50.2 | 47.4 | 0.28 | 26 | 1.7 | 9.6 |
| Comp H | 2.53 | 44.3 | 69.2 | 0.39 | 76 | 1.9 | 12.5 |
When the PFS started, the density of the ore was unknown, however, for design purposes, 2.7 t/m3 was assumed as a typical for a porphyry copper ore in Chile. It has no impact in the crushing and conveying sizing because those systems were calculated with a bulk density (1.6 t/m3), and the effect on slurries are less than 1 % of volumetric flow rates, i.e. the pumps and pipes sizes for the project do not change.
Most of the data was as expected and suggested an increase in hardness with depth with the exceptions of Composites 3 and G. The UCS results appeared to be lower than expected and the detailed report suggested most have failed on fracture planes.
Locked cycle HPGR tests have been completed and the Bond Mill work index after HPGR will be compared with the conventional BWi and alternative SAG mill and HPGR circuits compared. In addition, flotation responses will be compared between conventionally milled and HPGR milled materials after mineralogical examinations are completed.
| ● | 12403-009 MacNeill HPGR and Flotation |
Two metallurgical HQ drill holes were drilled into the main MacNeill Zone and into McTrans material late in the 2010 drilling season. SGS have been supplied with part of this material to check the HPGR and physical characteristics of these two ore types and in general conduct a similar programme to 12403-006. Work has started on the various grinding parameters.
| 13.5.2 | Oxide Mineralization |
There is currently no testwork on oxide mineralization other than humidity cell leaching for environmental purposes. In the coming 2011/12 drill season, a second campaign of PQ holes is planned to provide samples for a comprehensive breakage and sizing assessment, together with further confirmatory column testwork. A proposal to set up a large column test programme on ROM ore was not accepted because of the difficulty of establishing the representivity of any near surface or accessible material.
Project No.: C-580 January, 2012 | Page 148 - 378 | |
| 13.5.3 | MacNeill and Low Copper Mineralization |
MLI are carrying out a programme of column testing of MacNeill mineralization at sizes coarser than the 9.5 mm previously tested. This programme is expected to be reported in the near future.
Other low-copper gold mineralization exists in the main Caspiche hypogene zone with copper grades potentially too low to anticipate a reasonable flotation response given the results of the current testwork to date. Preliminary samples of typical material from these areas have been identified and sent to MLI in order to assess the possible amenability of this material to heap leaching.
Project No.: C-580 January, 2012 | Page 149 - 378 | |
| 14.0 | MINERAL RESOURCE ESTIMATION |
The following discussion regarding mineral resource estimation was modified from an internal report prepared for Exeter by AMEC (Marinho, 2011).
The additional drilling, recommended in previous studies, improved the geological knowledge of the central and north-west areas of the deposit.
The Caspiche mineral resource estimate was updated by Daniel Silva under the supervision of Mr. Rodrigo Marinho, P.Geo (APEGBC), CPG (AIPG), AMEC Principal Geologist. The mineral resource estimates were prepared under the Canadian Institute of Mining Metallurgy and Petroleum (CIM) Definition Standards (2005) and CIM Estimation of Mineral Resources and Mineral Reserves Best Practice Guidelines (2003).
The Caspiche mineral resource estimate was reviewed and verified by Mr Ted Coupland, MAusIMM(CP), Director and Principal Geostatistician of Cube Consulting Pty Ltd ("Cube"). Cube is an independent Australian firm specializing in mining and mineral resource consulting services.
Exeter provided AMEC with a drilling database on the Caspiche property updated to 19 April, 2011. AMEC imported the collar, survey, lithology, alteration, and assay data into GEMS® (version 6.2.4), a commercial mining software program. GEMS® validation routines were used to check for overlapping intervals, missing intervals, and consistent drill hole lengths between tables, no errors were reported.
The actual database totals 69,293.85 m of drilling in 140 drill holes. Table 14.1 is a summary of the drill holes that were used for the current mineral resource estimate. The database includes 6,620 m of 6 additional drill holes completed by Exeter since the last update of the resource estimate (30 December, 2010).
Table 14.1: Summary of Drill Data used for the Caspiche Mineral Resource Estimate
| Campaign | No. Holes | Min. Length (m) | Max. Length (m) | Avg. Length (m) | Total(m) |
| AngloGold | 18 | 32 | 200 | 84.33 | 1,518 |
| Newcrest | 35 | 92 | 332 | 208.88 | 7,311 |
| Exeter | 87 | 73 | 1,497.10 | 694.99 | 60,464.85 |
| Total | 140 | 32 | 1,497.10 | 494.96 | 69,293.85 |
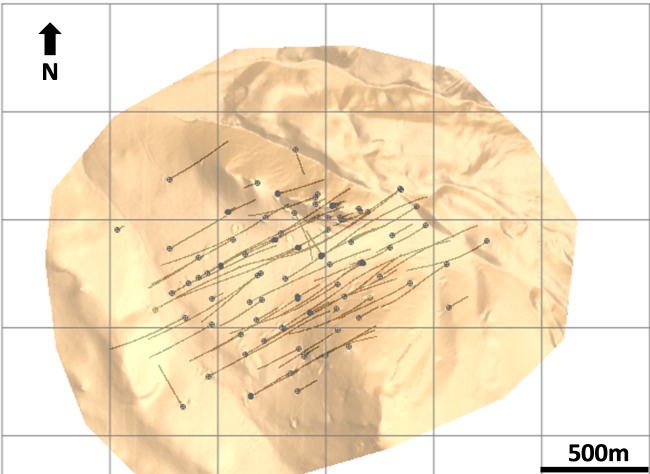
AMEC used an updated topographic surface file for the mineral resource estimates. The topographic model was based on 0.5 m resolution digital elevation model (DEM) modelling from high definition stereo satellite photos. Then, isolated portions of the topographic surface were adjusted using surveyed drill hole collar elevations to create a final topographic surface for use in mineral resource estimation.
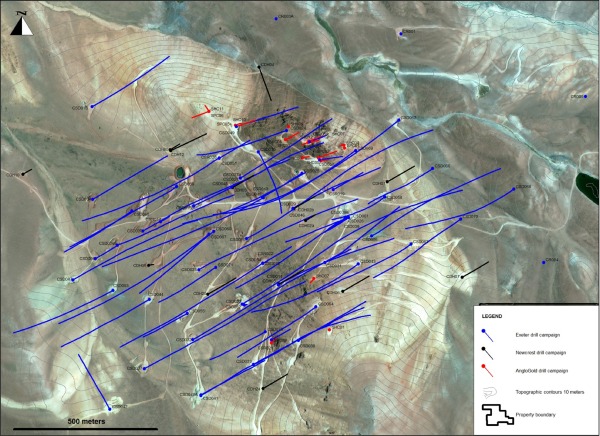
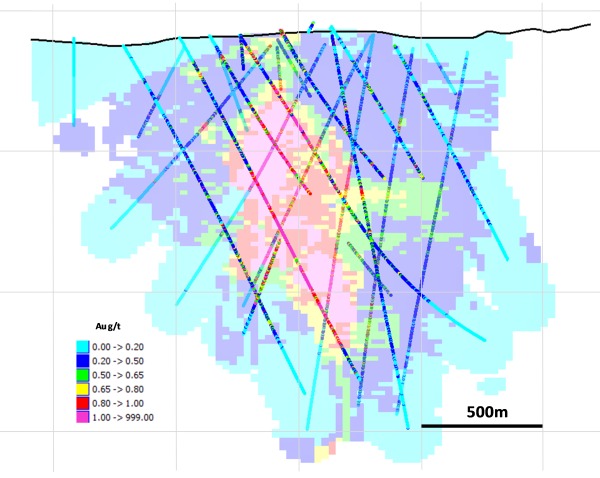
Figure 14.1 shows detailed topography and drill hole locations over the Caspiche Porphyry project.
Project No.: C-580 January, 2012 | Page 150 - 378 | |
Figure 14.1: Caspiche and Drill Hole Locations – Caspiche Porphyry Project (Source: Cube Consulting, 2011)
Project No.: C-580 January, 2012 | Page 151 - 378 | |
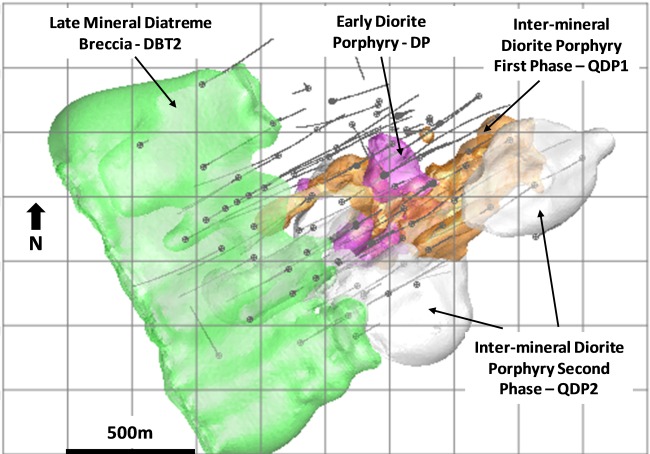
| 14.3 | Lithological Model and Definition of Domains |
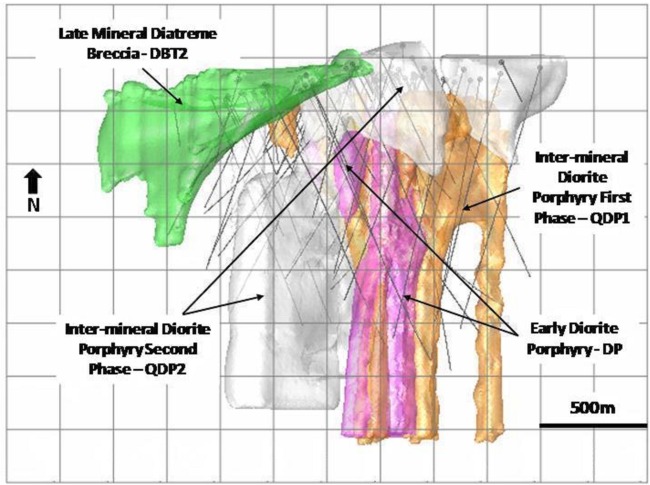
Exeter provided triangulated solid models representing the Caspiche lithological and alteration units. Examples of the lithological and alteration wireframes provided to AMEC are shown in Figure 14.2 to Figure 14.4.
AMEC reviewed interpreted shapes on vertical sections and level plans for the main lithological units; diorite Porphyry (DP), quartz-diorite Porphyry 1 (QDP1), quartz-diorite Porphyry 2 (QDP2), basement (CFB), volcanic breccias (VOLCBX), diatreme breccias (DTB) and MacNeill Zone (MAC).
Table 14.2 summarizes the lithological units used for the modelling.
An alteration model, consisting of potassic and argillic units and a calcite-potassic zone at the bottom of the system was also constructed.
Table 14.2: Lithological Unit Description
| Domain | Description |
| DP | Diorite Porphyry (main host rock for mineralization) |
| DTB | Diatreme breccia |
| QDP2 | Quartz-diorite Porphyry (late and lower grade) |
| QDP1 | Quartz-diorite Porphyry |
| VOLCBX | Volcanic breccias |
| CFB | Earliest cretaceous host rock (Basement) |
| OB | Overburden |
| MAC | MacNeill |
Exeter provided AMEC with an updated limit of oxidation boundary for this model update. The limit of oxidation was constructed from logging information; mainly sulphide descriptions. AMEC checked the oxide and sulphide solids against the drill holes database coding and found it to be acceptable.
The lithological solids provide the main support for the estimation domains. AMEC compared summary statistics and contact plots for combinations of lithology, alteration and weathering models. Final estimation domains for gold and silver were based on lithological and alteration codes without weathering zones. Copper estimation domains included weathering zones.
Gold grades are clearly higher in the DP but there are no clear lithological controls for gold mineralization. AMEC has interpreted the DP intrusion to be the source of mineralizing solutions carrying mainly gold and silver. The mineralizing solutions were disseminated through the other lithological units during the mineralization event.
Project No.: C-580 January, 2012 | Page 152 - 378 | |
Figure 14.2: Caspiche Lithological Model - Plan (Source: Cube Consulting, 2011)
Project No.: C-580 January, 2012 | Page 153 - 378 | |
Figure 14.3: Caspiche Lithological Model – Looking North (Source: Cube Consulting, 2011)
Project No.: C-580 January, 2012 | Page 154 - 378 | |
Figure 14.4: Caspiche Lithological and Alteration Model – Looking North (Source: Cube Consulting, 2011)
Project No.: C-580 January, 2012 | Page 155 - 378 | |
Copper mineralization is not controlled by lithological units, but is controlled by the oxidation boundary. The contact plots for copper show a transitional contact from the oxide to the sulphide zone and for grade estimation purposes AMEC created a transitional or mixed zone by projecting the oxide bottom surface 15 m above and below. Samples from oxide and sulphide zones are shared during grade estimation only for the transitional zone blocks.
The nominal sample length for assays is 2 m, and only six samples exceed 8 m in length. AMEC regularized the drilling data by compositing the drill-hole data into 8 m lengths within the lithological, alteration and weathering solids.
AMEC back-tagged the 8 m composites using the lithology solid shapes. The composites were also back-tagged with the oxide, mixed, sulphide and alteration solids.
| 14.5 | Exploratory Data Analysis |
Prior to estimation, AMEC constructed contact profiles to analyze the gold, copper and silver composite grade behaviour at the lithological boundaries. The aim of this analysis was to characterize the boundary conditions between the main lithological units and to determine the appropriate combinations of composite data for grade estimation.
Hard, firm, and soft contacts are important for the grade estimation plan. Soft contacts permit sample sharing from two adjacent lithological units during grade estimation. Hard contacts do not permit sample sharing. Firm contacts allow sample sharing across contacts for a certain distance only.
AMEC found firm contacts for the following domain contacts: DP / CFB, DP / VOLCBX, QDP1 / CFB and QDP1 / VOLCBX. The remaining domain boundaries were considered as hard. For the firm boundary domains, AMEC created halos where samples are shared. AMEC expanded the interpretations of DP and QDP1 units horizontally by 60 m and 30 m, respectively, to represent these halos. The estimation domain codes for the expanded DP and QDP1 units were denoted DPEX and QDP1EX respectively. During grade estimation, blocks within this halo shared samples from the DP and QDP1 domains. Additional estimation domains were defined based on potassic-calcic alteration (KCA). The KCA domain was expanded horizontally by 30 m (KCAEX) to allow sample sharing. A summary of grade estimation domains and sample sharing strategies for gold/silver and copper are shown in Table 14.3 and 14.4, respectively.
Project No.: C-580 January, 2012 | Page 156 - 378 | |
Table 14.3: Estimation Domains and Data Combinations – Gold and Silver
| Domain | Sample Sharing |
| OB | Overburden Samples Only |
| CFB+VOLCBX | Shared Samples CFB+VOLCBX |
| KCA | Potassic-Calcic Alteration Samples Only |
| KCAEX | Samples within 30 m Halo Zone Outside KCA |
| DP | DP Samples Only |
| DPEX | Samples within 60 m Halo Zone Outside DP |
| QDP1 | QDP1 Samples Only |
| QDP1EX | Samples within 30 m Halo Zone Outside QDP1 |
| QDP2 | QDP2 Samples Only |
| DTB | DTB Samples Only |
| MAC | MAC Samples Only |
Table 14.4: Estimation Domains and Data Combinations – Copper
| Domain | Sample Sharing |
| Oxide | Oxide Samples Only |
| Mixed | Shared samples Between Oxide and Sulphide ±30 m |
| Sulphide | Sulphide Samples Only |
Exploratory data analysis comprised basic statistical evaluation for 8 m composites for gold, copper, silver, arsenic, iron, molybdenum, sulphur, cobalt and zinc. However, the main elements of interest are gold, copper and silver.
Using box plots AMEC observed similar gold means for the basement (CFB) and volcanic breccia units (VOLCBX). The diorite Porphyry (DP) has the highest gold mean and more constrained distribution of grades. All units, excepting OB and DTB, have low coefficient of variation values, confirming the low variability of gold composite grades in the main mineralized units.
Arsenic grades broadly correlate with intensity of argillic alteration which is strongest higher in the system. Although isolated “pods” of higher grade arsenic can locally occur at depth in the central portions of the system.
The DP unit is preferentially mineralized, i.e. it has a higher mean. AMEC notes that the weathering profile, associated with alteration types, is markedly the preferable control for copper mineralization.
Silver grade distributions are consistent for most lithological units. The oxide portion of the VOLCBX has a higher average silver grade than the overall mean and also higher than the mixed and sulphide zones of the QDP1.
Molybdenum (Mo) grades are higher in VOLCBX, MacNeill and basement rock. This element is likely to be of magmatic provenance and like other gold rich porphyry deposits
Project No.: C-580 January, 2012 | Page 157 - 378 | |
the distribution of molybdenum in a “halo” around the central intrusions is interpreted to be a function of temperature controlling mineral precipitation, but more detailed mineralogical studies are required to understand the controls for molybdenum mineralization. For this reason AMEC has not reported Mo grades or considered its participation in the economics of the project.
In general, the summary statistics show low variability of gold and copper grades in the main units, diorite Porphyry, basement, VOLCBX, and quartz-diorite porphyries. The homogeneous distribution is also indicated by the low CV values. This homogeneity can also be observed in the cumulative frequency distributions.
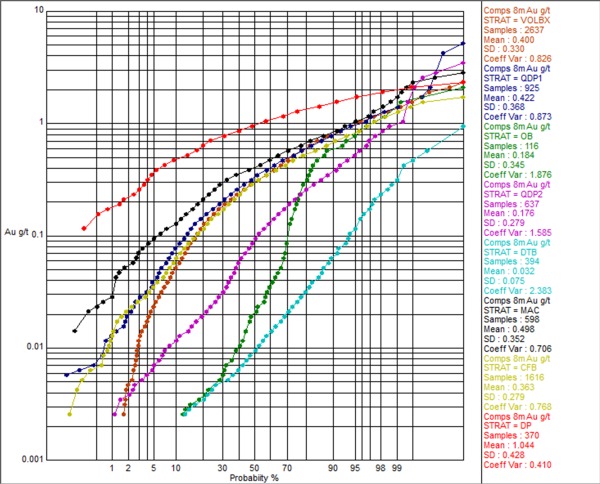
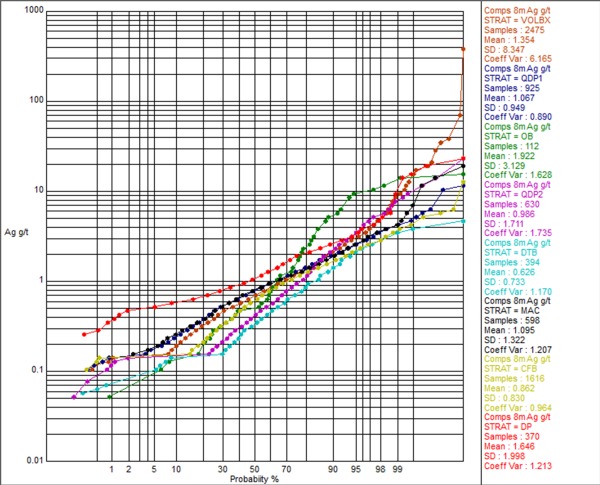
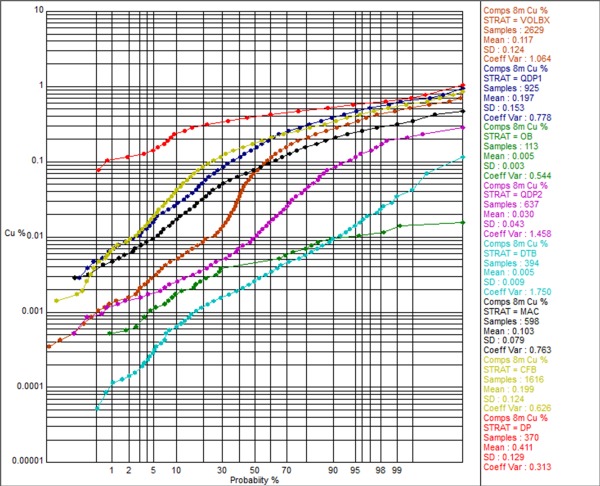
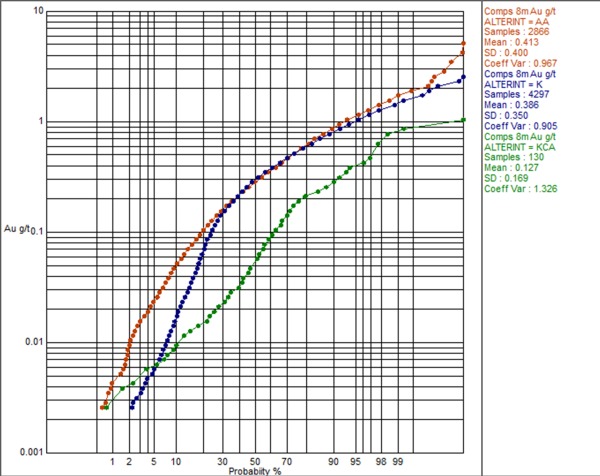
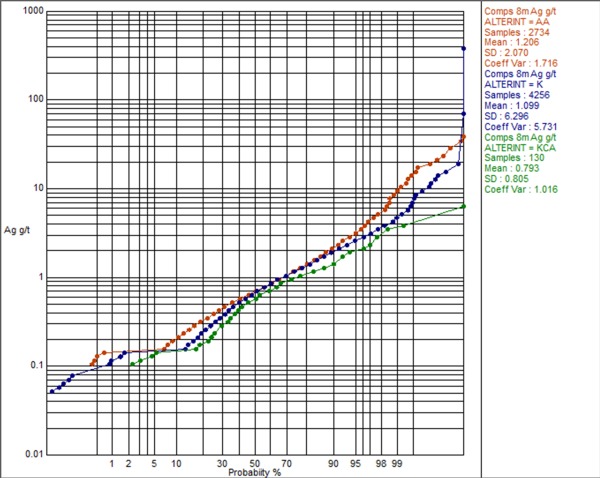
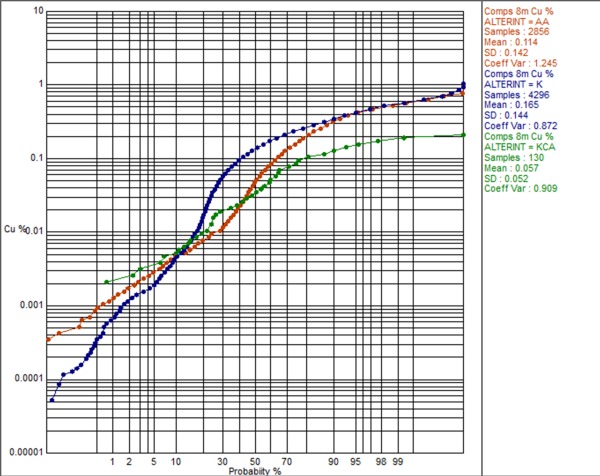
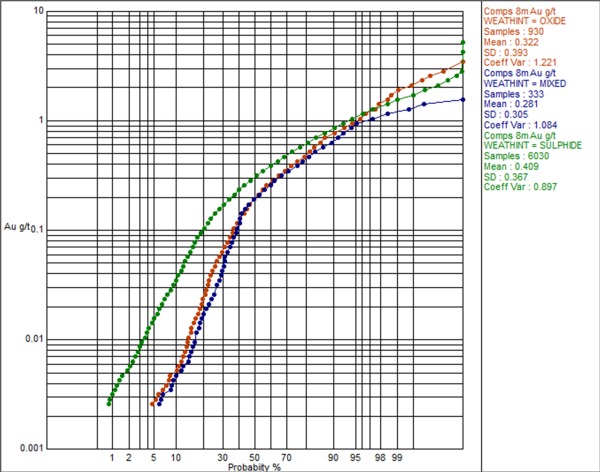
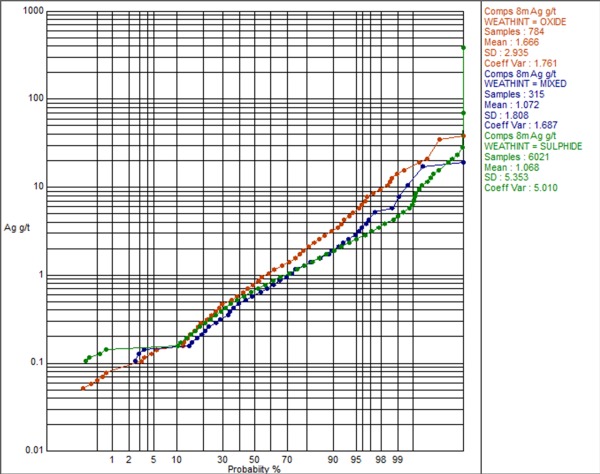
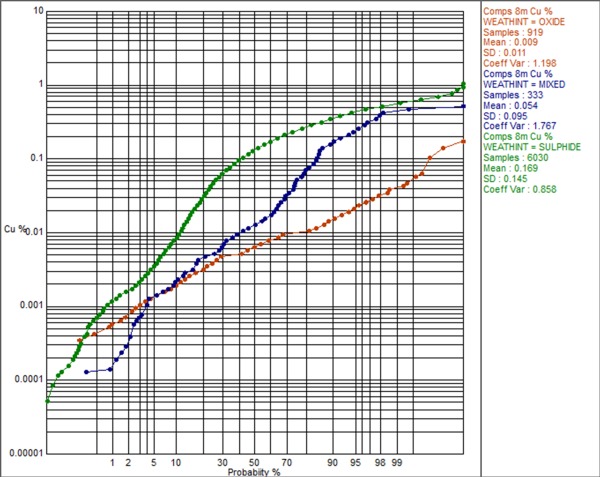
Figure 14.5 to Figure 14.13 show gold, silver and copper log-probability plots for 8 m downhole composites for the Caspiche Porphyry project classified by stratigraphy, alteration and weathering.
Figure 14.5: Caspiche 8 m Composites by Stratigraphy – Log-Prob Plot – g/t Au (Source: Cube Consulting, 2011)
Project No.: C-580 January, 2012 | Page 158 - 378 | |
Figure 14.6: Caspiche 8 m Composites by Stratigraphy – Log-Prob Plot – g/t Ag (Source: Cube Consulting, 2011)
Project No.: C-580 January, 2012 | Page 159 - 378 | |
Figure 14.7: Caspiche 8 m Composites by Stratigraphy – Log-Prob Plot - Cu % (Source: Cube Consulting, 2011)
Project No.: C-580 January, 2012 | Page 160 - 378 | |
Figure 14.8: Caspiche 8 m Composites by Alteration – Log-Prob Plot – g/t Au (Source: Cube Consulting, 2011)
Project No.: C-580 January, 2012 | Page 161 - 378 | |
Figure 14.9: Caspiche 8 m Composites by Alteration – Log-Prob Plot – g/t Ag (Source: Cube Consulting, 2011)
Project No.: C-580 January, 2012 | Page 162 - 378 | |
Figure 14.10: Caspiche 8 m Composites by Alteration – Log-Prob Plot - Cu % (Source: Cube Consulting, 2011)
Project No.: C-580 January, 2012 | Page 163 - 378 | |
Figure 14.11: Caspiche 8 m Composites by Weathering – Log-Prob Plot – g/t Au (Source: Cube Consulting, 2011)
Project No.: C-580 January, 2012 | Page 164 - 378 | |
Figure 14.12: Caspiche 8 m Composites by Weathering – Log-Prob Plot – g/t Ag (Source: Cube Consulting, 2011)
Project No.: C-580 January, 2012 | Page 165 - 378 | |
Figure 14.13: Caspiche 8 m Composites by Weathering – Log-Prob Plot - Cu % (Source: Cube Consulting, 2011)
Project No.: C-580 January, 2012 | Page 166 - 378 | |
Table 14.5 to Table 14.7 summarize basic statistics by estimation domain as determined by AMEC in Section 14.5.1 for gold, silver and copper respectively.
Table 14.5: Caspiche 8 m Composites by Estimation Domain – Summary Statistics - Au ppm
| Domain | No | Minimum | Maximum | Average | Standard | Coefficient |
| Sample | Au ppm | Au ppm | Au ppm | Deviation | of Variation |
| OB | 116 | 0.003 | 2.208 | 0.184 | 0.345 | 1.876 |
| CFB+VOLCBX | 3399 | 0.003 | 2.404 | 0.332 | 0.272 | 0.821 |
| KCA | 130 | 0.003 | 1.047 | 0.127 | 0.169 | 1.326 |
| KCAEX | 66 | 0.019 | 1.379 | 0.313 | 0.303 | 0.969 |
| DP | 356 | 0.177 | 2.263 | 1.075 | 0.407 | 0.379 |
| DPEX | 443 | 0.134 | 1.727 | 0.695 | 0.307 | 0.442 |
| QDP1 | 839 | 0.027 | 5.194 | 0.452 | 0.37 | 0.818 |
| QDP1EX | 354 | 0.023 | 2.165 | 0.524 | 0.401 | 0.764 |
| QDP2 | 598 | 0.003 | 3.4 | 0.184 | 0.286 | 1.552 |
| DTB | 394 | 0.003 | 0.938 | 0.032 | 0.075 | 2.383 |
| MAC | 598 | 0.014 | 2.748 | 0.498 | 0.352 | 0.706 |
Table 14.6: Caspiche 8 m Composites by Estimation Domain – Summary Statistics – Ag ppm
| Domain | No | Minimum | Maximum | Average | Standard | Coefficient |
| Sample | Ag ppm | Ag ppm | Ag ppm | Deviation | of Variation |
| OB | 112 | 0.05 | 15.68 | 1.922 | 3.129 | 1.628 |
| CFB+VOLCBX | 3237 | 0.1 | 399.153 | 1.177 | 7.304 | 6.204 |
| KCA | 130 | 0.1 | 6.204 | 0.793 | 0.805 | 1.016 |
| KCAEX | 66 | 0.15 | 5.076 | 0.929 | 0.842 | 0.907 |
| DP | 356 | 0.249 | 22.373 | 1.667 | 2.032 | 1.219 |
| DPEX | 443 | 0.150 | 6.575 | 1.142 | 0.829 | 0.726 |
| QDP1 | 839 | 0.141 | 11.258 | 1.089 | 0.961 | 0.882 |
| QDP1EX | 354 | 0.1 | 18.903 | 1.018 | 1.453 | 1.427 |
| QDP2 | 591 | 0.05 | 22.138 | 1.036 | 1.755 | 1.694 |
| DTB | 394 | 0.059 | 4.693 | 0.626 | 0.733 | 1.17 |
| MAC | 598 | 0.15 | 19.729 | 1.095 | 1.322 | 1.207 |
Project No.: C-580 January, 2012 | Page 167 - 378 | |
Table 14.7: Caspiche 8 m Composites by Estimation Domain – Summary Statistics – Cu %
| Domain | No | Minimum | Maximum | Average | Standard | Coefficient |
| Sample | Cu % | Cu % | Cu % | Deviation | of Variation |
| Oxide | 919 | 0.000 | 0.173 | 0.009 | 0.011 | 1.198 |
| Mixed | 333 | 0.000 | 0.508 | 0.054 | 0.095 | 1.767 |
| Sulphide | 6030 | 0.000 | 1.066 | 0.169 | 0.145 | 0.858 |
AMEC used Sage2001 software to construct down-the-hole and directional correlograms for the estimation domains for gold, copper, silver, molybdenum, sulphur and arsenic. The nugget value was determined from the down-the-hole correlograms. Directional correlogram models were fitted using two spherical structures. Typically, the nugget value is low. The first structure ranges of gold along the mineralization plunge are long, reaching 480 m in the QDP1 intrusion. In most of intrusive domains, the variances of both the first and second structures are similar.
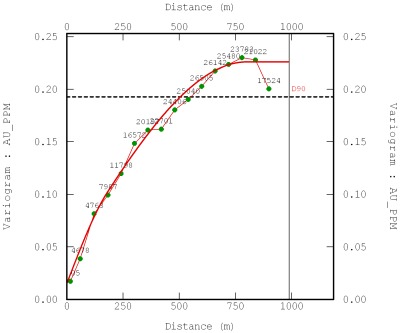
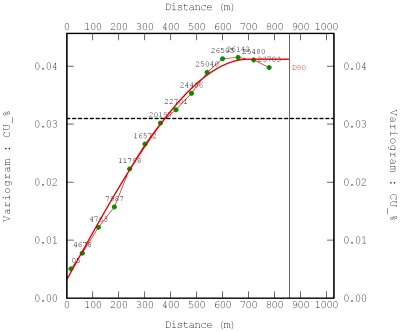
Cube undertook selected variography of the Caspiche Porphyry as part of an independent review of the AMEC 2011 resource estimate. Cube's findings were similar to that of AMEC, in particular, the presence of a low relative nugget value with long and very well structured variogram ranges in a vertical plunge direction for gold and copper. Silver appeared somewhat more variable, manifested by a higher relative nugget and less well developed variogram ranges. Cube combined the DP and QDP1 intrusive units for the purposes of variography. Figure 14.14 and Figure 14.15 show variogram models with maximum ranges of 750 m and 700 m in the vertical plunge direction for gold and copper respectively.
Figure 14.14: Caspiche Variogram Model – DP+QDP1 – Vertical Plunge - Gold (Source: Cube Consulting, 2011)
Project No.: C-580 January, 2012 | Page 168 - 378 | |
Figure 14.15: Caspiche Variogram Model – DP+QDP1 – Vertical Plunge - Copper (Source: Cube Consulting, 2011)
| 14.7 | Restriction of Extreme High Grade Values |
AMEC evaluated probability plots to define grade outliers for gold, silver, copper, molybdenum, arsenic, sulphur, iron, cobalt and zinc by estimation domains.
In general, the probability plots indicate that outlier values occur in the upper 1 % to 5 % of the distribution. AMEC controlled the outliers by using a restricted search ellipse during grade estimation. The grade thresholds and distance for gold and silver outlier by domain are shown in Table 14.8. Table 14.9 summarizes restriction parameters for copper.
The outlier restriction is applied during the block grade estimation. High-grade samples are permitted to estimate grades for blocks within the defined distance thresholds, beyond the distance the samples are capped at the grade threshold.
Project No.: C-580 January, 2012 | Page 169 - 378 | |
Table 14.8: High Grade Restriction for Gold and Silver
| Domain | High Grade Search |
| Au Threshold (g/t) | Ag Threshold (g/t) | Range (m) |
| X | Y | Z |
| OB | 1.00 | 10.0 | 40 | 40 | 25 |
| CFB+VOLCBX | 1.90 | 12.0 | 40 | 40 | 25 |
| KCA | 0.50 | 2.3 | 40 | 40 | 25 |
| KCAEX | 1.00 | 2.0 | 40 | 40 | 25 |
| DP | 2.10 | 5.0 | 40 | 40 | 25 |
| DPEX | 2.10 | 5.0 | 40 | 40 | 25 |
| QDP1 | 1.90 | 5.1 | 40 | 40 | 25 |
| QDP1EX | 1.60 | 4.0 | 40 | 40 | 25 |
| QDP2 | 1.00 | 10.0 | 40 | 40 | 25 |
| DTB | 0.30 | 3.0 | 40 | 40 | 25 |
| MAC | 1.10 | 5.0 | 40 | 40 | 25 |
Note: suffix “EX” means that the unit had its interpretation expanded
Table 14.9: High Grade Restriction for Copper
| Domain | High Grade Search |
| Cu Threshold (%) | Range (m) |
| X | Y | Z |
| Oxide | 0.05 | 40 | 40 | 25 |
| Transition | 0.48 | 40 | 40 | 25 |
| Sulphide | 0.80 | 40 | 40 | 25 |
Project No.: C-580 January, 2012 | Page 170 - 378 | |
| 14.8 | Block Model Dimensions and Grade Estimation |
AMEC defined a block model with regular blocks of 25 m x 25 m x 15 m and rotated it to a 057° azimuth to better fit the drilling sections orientation.
AMEC estimated gold, silver, copper, arsenic, iron, sulphur, cobalt, zinc and molybdenum; however, only the main elements (gold, silver and copper) were reported. Grade estimation was completed by domain using Ordinary Kriging (OK). The grade estimation was completed in three passes to allow estimation of all, or at least most of the blocks coded within the mineralized units. The first two estimation passes had the same search parameters, but the third had a more relaxed sample selection.
The estimation parameters for gold, silver and copper are summarized in Table 14.10. Sample sharing is based upon the contact profiles and statistical analysis for the lithology and weathering domains.
AMEC defined different search orientations for each domain based upon geological trends and grade continuity observed from the visual inspection of drill-hole data and the actual knowledge of the mineralization controls.
Table 14.10: Estimation Parameters for Gold, Silver and Copper
| Domain | Pass | Search Ellipse | Min. No. Comp | Max. No. Comp | Max. Comp./ Hole | No. Octant | Max. Comp. /Octant |
| Rotation (°) | Ranges(m) |
| Z | X | Z | X | Y | Z |
DP DPEX DTB MAC QDP2 OB | 1 | 87 | 60 | - | 125 | 150 | 125 | 7 | 15 | 4 | 2 | 2 |
| 2 | 87 | 60 | - | 125 | 150 | 125 | 4 | 15 | 4 | 2 | 2 |
| 3 | 87 | 60 | - | 900 | 1200 | 900 | 2 | 9 | 4 | 2 | 2 |
CFB + VOLCBX | 1 | 87 | 75 | - | 125 | 150 | 125 | 7 | 15 | 4 | 2 | 2 |
| 2 | 87 | 75 | - | 125 | 150 | 125 | 4 | 15 | 4 | 2 | 2 |
| 3 | 87 | 75 | - | 900 | 1200 | 900 | 2 | 9 | 4 | 2 | 2 |
QDP1EX KCAEX KCA QDP1 | 1 | 87 | 90 | - | 125 | 150 | 125 | 7 | 15 | 4 | 2 | 2 |
| 2 | 87 | 90 | - | 125 | 150 | 125 | 4 | 15 | 4 | 2 | 2 |
| 3 | 87 | 90 | - | 900 | 1200 | 900 | 2 | 9 | 4 | 2 | 2 |
The estimation plan for gold is controlled by lithological units and the calcite potassic unit. The estimation plan for copper includes a hard boundary between the oxide and sulphide boundary. Sample sharing is permitted in the transitional zone within 30 m, up and down, of the oxide/sulphide boundary.
Project No.: C-580 January, 2012 | Page 171 - 378 | |
AMEC used 898 density determination values available to calculate the average for each lithological unit (Table 14.11). Exeter determines density using the water immersion method on whole core lengths of approximately 15 cm. Because of high variability in the DP unit, two values were assigned to this unit based upon alteration type, argillic and potassic plus calcite-potassic.
AMEC assigned density values to blocks based upon the lithological codes. In AMEC’s and Cube’s opinion, these density values are reasonable for use in mineral resource estimation at this level of study.
Table 14.11: Average Density Values for Caspiche Resource Model
| Rock Type | Determinations | Density(g/cm3) |
| |
| OB | 9 | 2.17 |
| BASEMENT | 225 | 2.54 |
| VOLCBX | 274 | 2.40 |
| DP-Argillic | 27 | 2.45 |
| DP-Potassic | 24 | 2.58 |
| QDP1 | 129 | 2.51 |
| QDP2 | 78 | 2.42 |
| DTB | 48 | 2.39 |
| MAC | 84 | 2.43 |
| 14.10 | Block Model Validation |
AMEC validated the Caspiche model to ensure appropriate honouring of the input data. A nearest neighbour (NN) model was created to validate the OK model. The validation comprised: summary statistics checking for global estimation bias, drift analysis, smooth effect analysis and visual inspection of composites against blocks in vertical sections and horizontal planes.
AMEC generated tables of basic statistics comparing the OK and NN estimates to check for global bias in the gold, copper and silver grade estimates. The OK estimate is slightly higher in mean gold grade compared to the NN estimate in most of the domains. The differences in the global mean are smaller than 5 % and AMEC considered them acceptable (see Table 14.12).
Project No.: C-580 January, 2012 | Page 172 - 378 | |
Table 14.12: Comparison between Composite, NN and Kriged Statistics, Gold
| Mineralization | Composites | Blocks |
| No. | Average | CV |
| No. | Average | CV | Kriged (g/t Au) | NN (g/t Au) | Kriged/NN | Kriged | NN | Kriged/NN |
| OB | 116 | 0.18 | 1.87 | 1,694 | 0.14 | 0.14 | 100% | 1.07 | 1.60 | 67% |
| BASEMENT | 1,616 | 0.36 | 0.77 | 55,122 | 0.24 | 0.24 | 100% | 0.78 | 0.91 | 86% |
| VOLCBX | 2,637 | 0.40 | 0.83 | 56,226 | 0.26 | 0.25 | 104% | 0.90 | 1.04 | 87% |
| DP | 370 | 1.04 | 0.41 | 7,325 | 0.84 | 0.82 | 102% | 0.49 | 0.59 | 83% |
| MAC | 598 | 0.50 | 0.70 | 11,595 | 0.43 | 0.44 | 98% | 0.38 | 0.55 | 69% |
| QDP1 | 925 | 0.42 | 0.87 | 12,802 | 0.40 | 0.40 | 100% | 0.67 | 0.79 | 85% |
| QDP2 | 637 | 0.18 | 1.58 | 17,206 | 0.13 | 0.12 | 105% | 0.92 | 1.27 | 72% |
| DTB | 394 | 0.03 | 2.36 | 12,050 | 0.02 | 0.02 | 100% | 1.10 | 1.56 | 71% |
The OK grade estimates for copper are 100 % equal to the NN grades, illustrating that copper estimate is not globally biased.
Kriged and NN estimates for silver show a difference in the global mean of less than 5 % for all domains and AMEC considered the estimate to be within an acceptable range.
Spatial bias in the block model can be detected using swath plots. These are obtained by plotting the average kriged and NN grades along different directions. AMEC used only blocks estimated in Passes 1 and 2 for this analysis, because these are the blocks estimated with more information and possibly candidates for measured and indicated resources.
The OK and NN models show local disagreements, but in AMEC’s opinion, these are not significant. AMEC visually compared the NN and OK grades and noticed that some disagreements occur at the borders of the model, where drilling is limited (see Figure 14.16).
Project No.: C-580 January, 2012 | Page 173 - 378 | |
Figure 14.16: East-West Swath Plot, Sulphide, Gold (Source: AMEC, 2011)
AMEC completed a visual inspection comparing grades of composites and blocks in vertical sections and plan views. AMEC concluded that the grade estimate represents the composite grades and that grade extrapolation is well controlled.
Figure 14.17 is an example of a vertical section with composites and blocks coloured by gold grades. Good agreement between estimated grades and composite grades are observed. AMEC did not observe high grade blow-outs or areas with extreme extrapolation when considering blocks as candidates for Measured, Indicated and Inferred categories.
Project No.: C-580 January, 2012 | Page 174 - 378 | |
Figure 14.17: Vertical Section (looking northwest) with Blocks and Composite Grades for Gold (Corridor of ±100 m) (Source: Cube Consulting, 2011)
Kriged estimates are generally used directly for estimating resource tonnages above various cutoffs. This practice gives correct results, a priori, only at a zero-grade cutoff. At any cutoff grade that is greater than zero, the smoothing-effect may distort the kriged estimate grade-tonnage curves. The effective amount of smoothing in the kriged estimates depends on the variogram model, in particular the nugget-effect and the ranges, and on the composite selection criteria for kriging. At cutoffs less than the global grade average, the tonnage given by the kriged estimates will be overestimated, and at cutoffs greater than the global grade average, it will be underestimated.
There are several techniques to assess and handle this problem. AMEC used a Hermitian correction method, which consists of:
| 1) | Computing the theoretical dispersion variance of the blocks, knowing the variogram model of the relevant metals. |
| 2) | Transforming the distribution of the declustered composites (NN) so that it reflects a block support; this is done using a Hermitian correction (Herco). |
| 3) | Comparison of the grade-tonnage curve of the Herco transforms with the grade-tonnage curve of the kriged estimates. |
The theoretical block dispersion variances (BDV) of the 25 m x 25 m x 15 m blocks were calculated for gold using AMEC’s single block kriger (sbkbs.exe).
Project No.: C-580 January, 2012 | Page 175 - 378 | |
The BDVs were then used in AMEC’s in-house Herco routine (Herco_04f.exe) to transform the distribution of the NN. Grade-tonnage curves were generated and are shown in Figure 14.18.
Smoothing can be exacerbated by a number of factors, such as large drill-hole spacing relative to variogram ranges, high nugget effect and large numbers of composites used in the estimation. At Caspiche, smoothing varies from one mineralized unit to the other but the amount of smoothing at around 0.25 g/t Au, which is the approximately operational cut-off, is relatively limited. Consequently, resources stated at 0.25 g/t Au should not be significantly over - or under - estimated because of smoothing.
Figure 14.18: Gold Grade-Tonnage Curve, VOLCBX Domain (Source: AMEC, 2011)
| 14.10.5 | Independent Validation by Cube Consulting |
Cube undertook a variety of validation steps to form an independent opinion as to the veracity of the August 2011 Caspiche resource estimate. Validation steps included:
| ● | Importation of AMEC block model and replication of resource figures; |
| ● | Review of lithological and alteration interpretation wireframes; |
| ● | Independent drill hole coding, compositing and composite statistics; |
| ● | Independent variography; |
| ● | Independent estimation and gold and copper for the DP and QDP1 domains and comparison to AMEC estimation; |
| ● | Visual and statistical validation of resource estimate; |
| ● | Reasonable prospects for economic extraction; |
| ● | Review of resource classification. |
Project No.: C-580 January, 2012 | Page 176 - 378 | |
| 14.10.5.1 | Importation of AMEC Block model |
Cube imported the AMEC block model into Gemcom Surpac™ and was able to replicate the sulphide resource figures precisely. A very minor discrepancy was observed when comparing the oxide resource figures however this difference is considered as immaterial.
| 14.10.5.2 | Review of Lithological and Alteration Interpretation Wireframes |
All interpretation wireframes appear to adequately honour logged geological and alteration characteristics. Cube considers the lithological and alteration interpretation to be a robust and appropriate representation of the Caspiche Porphyry deposit.
| 14.10.5.3 | Drill Hole Coding, Compositing and Statistics |
Independent drill hole coding, compositing and composite statistics undertaken by Cube confirm the veracity of this component of work by AMEC.
| 14.10.5.4 | Independent Variography |
As indicated in Section 14.6, independent variography undertaken by Cube broadly confirms the parameters defined by AMEC.
| 14.10.5.5 | Independent Estimation |
Cube undertook a high level independent check estimation of the DP and QDP1 zones within the reportable resource constraint applied by AMEC. Cube's check estimate relied upon the independently derived drill hole coding, compositing, variography and Ordinary Kriging estimation parameters. Cube's check estimate was within 0.5 % of AMEC’s gold estimate at a cutoff of 0.25 Au g/t and within 2.6 % of AMEC’s copper estimate at a cutoff of 0.10 Cu %. Figure 14.19 and Figure 14.20 show comparative grade-tonnage curves between Cube’s and AMEC’s resource estimates within the DP and QDP1 domains for gold and copper respectively. Cube concluded that the check estimates sufficiently demonstrated the robustness of the AMEC resource estimation.
Project No.: C-580 January, 2012 | Page 177 - 378 | |
Figure 14.19: Cube vs AMEC Grade-Tonnage Curve, DP+QDP1 Domain - Gold (Source: Cube Consulting, 2011)
Figure 14.20: Cube vs AMEC Grade-Tonnage Curve, DP+QDP1 Domain - Copper (Source: Cube Consulting, 2011)
Project No.: C-580 January, 2012 | Page 178 - 378 | |
| 14.10.5.6 | Visual and Statistical Validation |
Cube undertook visual and statistical validation of the AMEC Caspiche resource estimation and concludes that the resulting model appears to be a reasonable reflection of the input data.
| 1.4.10.5.7 | Reasonable Prospect of Economic Extraction |
It is Cube's opinion that the approach taken by AMEC in evaluating “reasonable prospects of economic extraction” is well considered and robust for defining the reportable mineral resources for the Caspiche project.
| 14.10.5.8 | Resource Classification and Reporting |
The approach taken by AMEC for mineral resource classification and reporting of the Caspiche mineral resources is considered appropriate by Cube and adequately satisfies the reporting requirements as defined by the CIM guidelines (CIM 2005) National Instrument NI 43-101.
| 14.11 | Resource Classification and Tabulation |
AMEC assessed reasonable prospects of economic extraction by applying preliminary economics for potential open pit and underground mining methods. The assessment does not represent an economic analysis of the deposit, but was used to determine reasonable assumptions for the purpose of resource tabulation. Mining and process costs are based on NCL’s Scoping Study and process recoveries were estimated from current testwork.
AMEC completed a Lerchs-Grossman (LG) optimization using Whittle® (version 4) software to determine the resource shell for open pit resources. Whittle parameters are listed in Table 14.13. Note that only gold and copper were considered as revenues for floating the open pit and underground scenarios.
Project No.: C-580 January, 2012 | Page 179 - 378 | |
Table 14.13: Optimization Parameters for Open Pit Resource Shell
| Parameter | Value |
| Slope Angle (degrees) | 43 |
| Mining Cost (US$/t) | 1.53 |
| Mining Recovery (%) | 100 |
| Mining Dilution Fraction | 1 |
| Processing Cost (US$/t) Heap Leaching | 3.4 |
| Processing Cost (US$/t) Mill | 7.04 |
| Gold Process Recovery (%) Heap Leaching | 78 |
| Gold Process Recovery (%) Mill | 65 |
| Copper Process Recovery (%) Mill | 85 |
| Gold Price (US$/oz) | 1,150 |
| Copper Price (US$/lb) | 2.50 |
| Gold Selling Cost (US$/oz) | 6 |
| Copper Selling Cost (US$/lb) | 0.20 |
The 2010-2011 drilling campaign from Exeter added 6,620 metres of new information, confirming mineralization and grade continuity. AMEC (2009) defined drill spacing for achieving Measured and Indicated Mineral Resource classification. From this study AMEC has concluded:
| ● | The Measured Resource criterion (Quarterly 90 % reaching 15 % accuracy) is satisfied with a drill hole spacing of 75 x 75 m giving a nominal 53 m spacing to farthest sample. |
| ● | The Indicated Resource criterion (Annually 90 % reaching 15 % accuracy) is satisfied with a drill hole spacing of 200 x 200 m staggered (with a central hole) that will give a nominal 100 m spacing to farthest sample. |
AMEC created a script to classify blocks into the resource categories. This script verifies Ordinary Kriging estimation variance, the number of composites and distance of closest sample used for estimating grades to a block.
| ● | AMEC’s criterion for classifying block as Measured is: Three drill holes used and the closest sample at 53 m or two drill holes used and the closest sample at a maximum distance of 53 m and the kriging variance associated to a mesh of 75 x 75 m. |
| ● | AMEC’s criterion for classifying block as Indicated is: Two drill holes used and the closest sample at 105 m or one drill holes used and the closest sample at a maximum distance of 105 m and kriging variance associated to a mesh of 200 x 200 m (with a central hole). |
Project No.: C-580 January, 2012 | Page 180 - 378 | |
Blocks that were not classified as Measured or Indicated and have a closest sample at a maximum distance of 150 m will be placed into the Inferred category.
Because of some inconsistencies with the classification results of the 2010 model for the MacNeill zone, AMEC used a different approach: Blocks from this zone were selected with the previous (2010) classification codes and imported to the actual model only Indicated category blocks. Some of the blocks actually classified as Measured category, according to the 2011 classification, were overwritten to Indicated, which better represents AMEC’s opinion for classifying blocks into this specific zone of the deposit.
AMEC addressed the spotted dog feature, common in resource classification based on mathematical criteria, by running an automated process of smoothing that removed the isolated blocks or pool of blocks of one category into a different one. Figure 14.21 illustrates a bench plan, elevation 3,858, before and after the smoothing applied for the classification.
Figure 14.21: Bench Plan Showing Classification Before and After Smoothing (Source: AMEC, 2011)
The Caspiche Mineral Resources are defined as the blocks of Measured, Indicated or Inferred categories that lie within the open pit shell determined by the LG optimization undertaken by AMEC. Figure 14.22 is a vertical section of gold grades illustrating the open pit mineral resource shell.
Project No.: C-580 January, 2012 | Page 181 - 378 | |
Figure 14.22: Vertical Section (looking Northwest) of Gold Grades Showing Open Pit Resource Shell (Source: Cube Consulting, 2011)
AMEC calculated a gold equivalent (AuEq) value based on gold and copper revenues (prices and recoveries involved). The following formula was used to calculate AuEq values in each block of the model:
where Au and Cu are the block kriged Au and Cu grades, PAu and PCu are the Au and Cu prices (1,150 US$/oz and 2.50 US$/lb, respectively), and RAu and RCu are the Au and Cu projected metallurgical recoveries, 65 % and 85 % respectively for sulphide material, and 78 % for Au and 11 % for Cu in the oxide zone.
The cut-off is calculated based on the AuEq value and determined for oxide and sulphide material. Table 14.14 shows the parameters used on the determination of the marginal cut-off values and results.
Project No.: C-580 January, 2012 | Page 182 - 378 | |
Table 14.14: Marginal Cut-off Calculation Parameters and Results
| Parameters | Oxide | Sulphide |
| Processing (US$/t) Cost | 3.4 | 7.04 |
| Recovery (%) | 78 | 65 |
| Gold Price (US$/oz) | 1,150 | 1,150 |
| Copper Price (US$/lb) | NA | 2.5 |
| Selling Cost (US$/oz) | 6 | 6 |
| Cut-off AuEq (g/t) | 0.119 | 0.294 |
The Caspiche Mineral Resources from the open pit shell are reported in Table 14.15 using an approximation of the marginal cut-off values defined. The cut-off for oxide material was incremented to 0.18 g/t for consistency with the recent Prefeasibility Study results for the oxide zone prepared by Aker Solutions. Only mineralized material contained within the shell is reported.
The Caspiche mineral resource estimates have been classified and reported in accordance with the CIM guidelines (CIM 2005) National Instrument NI 43-101.
Table 14.15: Super Pit Option for Mineral Resource for Caspiche (Rodrigo Marinho, P.GEO, 18 August 2011)
Note: Silver included in the Au plus Cu Mineral Resource
AMEC generated grade-tonnage (GT) curves at different gold equivalent cut-offs for different material types (oxides and sulphides).
Figure 14.23 and Figure 14.24 show grade-tonnage curves for combined Measured and Indicated oxide and sulphide material respectively based on gold equivalent cutoffs within the open pit optimization shell.
Project No.: C-580 January, 2012 | Page 183 - 378 | |
Figure 14.23: AuEq GT Curves - Open Pit Oxide Measured + Indicated Mineral Resources (Source: AMEC, 2011)
Project No.: C-580 January, 2012 | Page 184 - 378 | |
Figure 14.24: AuEq GT Curves - Open Pit Sulphide Measured + Indicated Mineral Resources (Source: AMEC, 2011)
The Super Pit scenario involves the southern portion of the pit rim extending beyond Exeter mining properties limits; however, no mineral resources in this scenario are located outside the property boundary. The assumption in this mining scenario is that Exeter will be able to secure permission from the adjacent property owner to extend the pit limit across the property boundary to allow this additional waste stripping.
Project No.: C-580 January, 2012 | Page 185 - 378 | |
| 15.0 | Mineral Reserves Estimate |
| 15.1 | Reserve Cases for Each Option |
The study considers three options for exploitation and processing of the sulphide ore resources, and thus three mineral reserve estimates have been generated. The evaluated options are:
An open pit operation, designated ‘Super Pit case’ extracting 150,000 t/d ore over a project life of 19 years.
A combined open pit and underground operation, designated ‘Hybrid’, extracting 95,000 t/d sulphide ore over a project life of 24 years.
For each of the above options a stand alone heap leach operation is considered. This operation will process heaplecheable oxide and MacNeill ore extracted as part of prestripping or ongoing mine operations
An underground option, designated ‘Full Underground’, extracting 90,000 t/d sulphide ore for 22 years from year 9 of the project. During construction of the underground mine a heap leach operation treating both oxide and leachable MacNeill material will be operated independently.
| 15.2 | Open Pit Mineral Resources |
The procedure followed to assess the contained mineral resources used the Whittle® Four-X economic shell analysis, as described below. The mineral reserves were then defined by completion of practical designs for the selected shells.
To determine the in-pit mineral resources of the Caspiche Sulphide Project, the resources have been valued by assuming that the oxide and leachable MacNeill material would be processed via a heap leach operation to produce gold and silver doré and the sulphide would be processed in a flotation concentrator plant.
The information for this determination was provided by Aker including an estimate of the plant operating costs, metallurgical recovery of gold, copper and silver; and refining charges for both heap leach and sulphide processing.
The mine designs, mining schedules and cost estimates for the pit were developed by NCL, using their estimates for Mineral Reserves, equipment operating parameters for similar projects and an in-pit waste crushing and conveying (IPCC) system; the later developed in conjunction with Sandvik Mining and Construction (SMC).
All resources estimated are inclusive of reserves.
The definitive parameters and results are described in the following sub-sections:
Table 15.1 summarizes the base case economic parameters used for the Whittle® Four-X economic shell analysis and mine design.
The mining cost was estimated based on first principle calculations for a remote conventional open pit mine using a truck and shovel fleet for mining of ore, with costs adjusted for mining waste based on the results of the IPCC scoping level study completed in June 2011. Costs include direct operation and maintenance for drilling, blasting, loading,
Project No.: C-580 January, 2012 | Page 186 - 378 | |
hauling, waste crushing, conveying and spreading, and support costs related to road, bench, and dump maintenance as well as grade control. The costs also assumed a full maintenance and repair contract (MARC) for the first three years of operation, thereafter maintenance is assumed by owner.
The pit is deep and wide so mining cost was defined as a composition of a fixed portion and an incremental cost relating to pit depth, both referenced to the pit exit (RL 4300). These parameters were refined to achieve the expected average in-pit mining cost of 1.32 US$/t achieved after analysis of the unit cost impact of waste crushing and conveying as an alternative to trucking. (The original trucking average cost was 1.53 US$/t).
| ● | Incremental 0.025 US$/t-bench below pit exit, 0.015 US$/t-bench above pit exit |
Metal prices, processing costs, refining costs, and processing recoveries were provided to NCL by Exeter and Aker.
Project No.: C-580 January, 2012 | Page 187 - 378 | |
Table 15.1: Base Parameters using Waste Crushing and Conveying
| Parameter | Unit | Super Pit Option | Hybrid Option |
| Open Pit Mining cost | US$ /t | Base + Depth Increm. | Base + Depth Increm. |
| Average 1.320 | Average 1.40 |
| UG Mining Cost | US$/t | - | 7.0 |
| Oxide Process cost | US$/t | 3.4 | 3.4 |
| Gold Met. Recovery | % | 78 | 78 |
| Silver Met. Recovery | % | 34 | 34 |
| Gold Treatment Cost | US$/oz | 6 | 6 |
| Silver Treatment Cost | US$/oz | 0.4 | 0.4 |
| MacNeill Process cost | US$/t | 5.31 | 5.31 |
| Gold Met. Recovery | % | Upper 55, Lower 30 | Upper 55, Lower 30 |
| Silver Met. Recovery | % | 20 | 20 |
| Gold Treatment Cost | US$/oz | 6 | 6 |
| Silver Treatment Cost | US$/oz | 0.4 | 0.4 |
| Sulphide Process Cost | US$/t | 7.04 | 7.04 |
| Copper Met. Recovery | % | Variable, Table 15.2 | Variable, Table 15.2 |
| Gold Met. Recovery | % | Variable, Table 15.2 | Variable, Table 15.2 |
| Silver Met. Recovery | % | 50 | 50 |
| Copper Treatment Cost | US$/lb | 0.197 | 0.197 |
| Gold Treatment Cost | US$/oz | 6 | 6 |
| Silver Treatment Cost | US$/oz | 0.4 | 0.4 |
| Royalty Anglo American | % | 3.08 | 3.08 |
| Royalty Chilean Government | % | 5 | 5 |
| Gold Price | US$/oz | 1,150 | 1,150 |
| Silver Price | US$/oz | 20 | 20 |
| Copper Price | US$/lb | 2.5 | 2.5 |
The metallurgical recovery of the sulphide process is described in Table 15.2.
Project No.: C-580 January, 2012 | Page 188 - 378 | |
Table 15.2: Sulphide Metallurgical Recoveries
| % Cu Head Grade | Copper Recovery | Gold Recovery |
| 0.0% to 0.05% | 0 | 0 |
| 0.05% to 0.10% | 38% | 30% |
| 0.10% to 0.15% | 68% | 45% |
| 0.15% to 0.20% | 81% | 58% |
| 0.20% to 0.25% | 87% | 65% |
| 0.25% to 0.30% | 89% | 69% |
| >0.30% | >90% to 93% max | 72% |
For in-pit access, 40 m wide ramps at a 10 % grade were designed to create a network of haulroads connected throughout the mining sequence. Where possible, two way ramp access is considered for each operating phase to allow for continuous haulage.
The waste crushing and conveying installations use semi-fixed installations; no on-ramp conveyors were used and hence no adjustment to haul road widths was necessary.
A typical haul ramp cross section is shown in Figure 15.1.
Figure 15.1: Two way Haul Road Cross-Section
External mine haul roads generally consider a 40 m width and 10 % maximum grade, except for the main access corridor from the north of the pit, where it was necessary to incorporate multiple conveyor lines, construction and general traffic access, and limited haulage access to the mine dump locations. This required a total width of 70.5 m as shown in Figure 15.2.
Project No.: C-580 January, 2012 | Page 189 - 378 | |
Figure 15.2: Main Access Corridor Cross-Section
Note in the above figure that the haul road width was reduced to 26 m as the frequency of waste haulage by truck along this access is minimal.
The overall slope angles used were as recommended by A. Karzulovic & Asoc. Ltda. (AKL) as set out in their Caspiche pit stability study of February 2011 and updated in August 2011. The recommendations are summarized in Table 15.3.
Table 15.3: Slope Design
| Geotech Unit | IRA | Bench Stack | Catch Berm | Batter Angle |
| Strat unit | Alteration | Code | ° | m | m | ° |
| Overburden | 37 | 60 | 40 | 70 |
| Breccia | Strong | B-F | 43 | 195 | 40 | 70 |
| Brecha | Moderate | B-M | 54 | 150 | 40 | 70 |
| Brecha | Weak | B-D | 54 | 195 | 40 | 70 |
| Intrusive | Strong | I-F | 54 | 150 | 40 | 70 |
| Intrusive | Moderate | I-M | 54 | 195 | 40 | 70 |
| Intrusive | Weak | I-D | 54 | 195 | 40 | 70 |
| Basement | Strong | M-F | 54 | 195 | 40 | 70 |
| Basement | Moderate | M-M | 54 | 195 | 40 | 70 |
| Basement | Weak | M-D | 54 | 195 | 40 | 70 |
Project No.: C-580 January, 2012 | Page 190 - 378 | |
Table 15.4 lists the main expressions for costs and taxes used to define the block value.
Table 15.4: Block Value Calculation
| Variable | Description | Calculation |
| Ton | Tonnage by block | Volume * SG * topo % |
| RECAU | Gold Met. Recovery | |
| RECCU | Copper Met. Recovery | |
| RECAG | Silver Met. Recovery | |
| Au | Au grade g/t | |
| Cu | Cu grade % | |
| Ag | Ag grade g/t | |
| IncAu | Income Gold | t*Au * RECAU * Price_Au * 0.03215 |
| IncCu | Income Copper | t*Cu * RECCU * Price_Cu * 22.0462 |
| IncAg | Income Silver | t*Ag * RECAG* Price_Ag * 0.03215 |
| CPROC | Process Cost | t * CPROC |
| SELLAU | Selling cost Gold | t*Au * RECAU * SELLAU * 0.03215 |
| SELLCU | Selling cost Copper | t*Cu * RECCU * SELLCU * 22.0462 |
| SELLAG | Selling cost Silver | t*Ag * RECAG * SELLAG * 0.03215 |
| MCOST | Mining Cost | t * MCOST |
| RyAng | Royalty Anglo American | 3.08 % * (IncAu + IncAg) |
| Profit (1) | Profit after Anglo Royalty | (IncAu + IncCu + IncAg – MCOST - CPROC – SELLAU - SELLCU - SELLAG - RyAng) |
| RyGvt | Royalty Government | 5.00 % * Profit (1) |
| Profit (2) | Profit after Gvmt Royalty | IncAu + IncCu + IncAg – MCOST - CPROC - SELLAU - SELLCU - SELLAG – RyGvt – RyAng |
| 15.2.5 | Whittle® Pit Optimization |
Open pit optimization was completed to obtain a set of nested pit shells to guide the design of the intermediate phases and ultimate pit for the project. The Lerchs & Grossman algorithm in the Whittle® software package was used for this optimization. The deliverables were a set of nested pit shells generated by varying the revenue factor.
Super Pit: In the Super Pit option, the ultimate pit shell was selected from the recommended ultimate pit generated from a trade-off between the cash flow and the amount of contained resources.
Project No.: C-580 January, 2012 | Page 191 - 378 | |
Hybrid Pit: In the Hybrid option, selection of the ultimate pit considered three criteria: positive cash flow, an open pit mine life long enough to develop the engineering and construction of the underground mine and sufficient contained resources to ensure continuity in the ore feed during the transition to underground exploitation.
In both cases the ore considered for processing in the optimization was selected based on the economic value of each block. Material was considered as ore if the revenue of the block exceeded the mining and processing cost. The revenue was based on net gold, copper and silver prices after refining charges and royalties had been deducted.
Once a minimum economic block value had been established neither a minimum cutoff grade nor raised cutoff metal grade was applied. Dilution and ore losses were not considered in this stage for the reasons noted previously.
| 15.2.6 | Whittle® Four-X Economic Shells Results |
Only Measured and Indicated resources were used to complete the pit optimization of the Super Pit and Hybrid options. In the Hybrid option, the underground and open pit competition mode was considered in the pit optimization process in order to define the breakeven pit shell.
Table 15.5 and Table 15.6 illustrate the contained ore tonnes and grades by nested pit series for the Super Pit and Hybrid options respectively.
Project No.: C-580 January, 2012 | Page 192 - 378 | |
Table 15.5: Nested Pit Series – Super Pit Option
| Pit | Revenue Factor | Gold Price | Ore + Waste | Strip Ratio | Oxide Ore | MacNeill Ore | Sulphide Ore | Contained Metal |
| $/oz | kt | kt | Au g/t | Ag g/t | kt | Au g/t | Ag g/t | kt | Au g/t | Cu % | Ag g/t | Au Koz | Cu kt | Ag Koz | |
| 1 | 0.14 | 161 | 36 | 0.00 | 36 | 1.20 | 3.53 | 0 | 0.00 | 0.00 | 0 | 0.00 | 0.00 | 0.00 | 1 | 0 | 4 | 1 |
| 2 | 0.15 | 173 | 84 | 0.00 | 84 | 1.16 | 2.45 | 0 | 0.00 | 0.00 | 0 | 0.00 | 0.00 | 0.00 | 3 | 0 | 7 | 3 |
| 7 | 0.20 | 230 | 3,521 | 0.00 | 3,521 | 0.84 | 2.03 | 0 | 0.00 | 0.00 | 0 | 0.00 | 0.00 | 0.00 | 95 | 0 | 230 | 99 |
| 12 | 0.25 | 288 | 12,459 | 0.01 | 12,371 | 0.71 | 2.10 | 0 | 0.00 | 0.00 | 0 | 0.00 | 0.00 | 0.00 | 284 | 0 | 835 | 298 |
| 17 | 0.30 | 345 | 23,372 | 0.02 | 22,894 | 0.63 | 1.98 | 0 | 0.00 | 0.00 | 0 | 0.00 | 0.00 | 0.00 | 463 | 0 | 1,457 | 488 |
| 22 | 0.35 | 403 | 42,048 | 0.09 | 38,596 | 0.57 | 1.86 | 0 | 0.00 | 0.00 | 90 | 1.30 | 0.18 | 1.25 | 708 | 0 | 2,306 | 748 |
| 27 | 0.40 | 460 | 99,749 | 0.16 | 71,014 | 0.46 | 1.61 | 0 | 0.00 | 0.00 | 14,777 | 0.79 | 0.26 | 1.05 | 1,423 | 39 | 4,180 | 1,682 |
| 32 | 0.45 | 518 | 153,267 | 0.22 | 89,977 | 0.42 | 1.55 | 91 | 0.44 | 1.13 | 35,712 | 0.68 | 0.24 | 1.05 | 2,014 | 87 | 5,710 | 2,532 |
| 37 | 0.50 | 575 | 1,052,336 | 1.17 | 129,751 | 0.36 | 1.59 | 36,062 | 0.51 | 1.00 | 319,026 | 0.62 | 0.23 | 1.07 | 8,466 | 730 | 18,750 | 12,289 |
| 42 | 0.55 | 633 | 1,491,828 | 1.52 | 129,802 | 0.36 | 1.59 | 42,851 | 0.50 | 1.01 | 418,797 | 0.62 | 0.24 | 1.08 | 10,568 | 990 | 22,505 | 15,704 |
| 47 | 0.60 | 690 | 1,914,587 | 1.76 | 129,802 | 0.36 | 1.59 | 53,604 | 0.50 | 1.03 | 510,228 | 0.62 | 0.24 | 1.08 | 12,489 | 1,219 | 26,132 | 18,785 |
| 52 | 0.65 | 748 | 2,505,624 | 2.06 | 129,802 | 0.36 | 1.59 | 67,432 | 0.49 | 1.03 | 622,178 | 0.61 | 0.24 | 1.09 | 14,805 | 1,498 | 30,781 | 22,518 |
| 57 | 0.70 | 805 | 2,816,999 | 2.20 | 129,802 | 0.36 | 1.59 | 70,689 | 0.49 | 1.04 | 680,081 | 0.61 | 0.24 | 1.10 | 15,875 | 1,639 | 33,080 | 24,306 |
| 62 | 0.75 | 863 | 3,091,711 | 2.31 | 129,802 | 0.36 | 1.59 | 75,132 | 0.49 | 1.05 | 729,421 | 0.60 | 0.24 | 1.11 | 16,767 | 1,756 | 35,149 | 25,797 |
| 67 | 0.80 | 920 | 3,356,363 | 2.43 | 129,802 | 0.36 | 1.59 | 76,749 | 0.49 | 1.05 | 773,389 | 0.59 | 0.24 | 1.12 | 17,503 | 1,861 | 36,973 | 27,064 |
| 72 | 0.85 | 978 | 3,724,339 | 2.60 | 129,802 | 0.36 | 1.59 | 78,913 | 0.49 | 1.05 | 824,700 | 0.59 | 0.24 | 1.12 | 18,354 | 1,990 | 38,976 | 28,569 |
| 77 | 0.90 | 1,035 | 3,970,738 | 2.70 | 129,802 | 0.36 | 1.59 | 81,579 | 0.49 | 1.05 | 860,454 | 0.58 | 0.24 | 1.12 | 18,932 | 2,075 | 40,493 | 29,579 |
| 82 | 0.95 | 1,093 | 4,219,352 | 2.81 | 129,802 | 0.36 | 1.59 | 83,219 | 0.50 | 1.05 | 893,076 | 0.58 | 0.24 | 1.13 | 19,438 | 2,153 | 41,820 | 30,484 |
| 87 | 1.00 | 1,150 | 4,378,569 | 2.88 | 129,802 | 0.36 | 1.59 | 84,609 | 0.50 | 1.05 | 913,896 | 0.58 | 0.24 | 1.13 | 19,764 | 2,200 | 42,718 | 31,049 |
| 92 | 1.05 | 1,208 | 4,584,198 | 2.98 | 129,802 | 0.36 | 1.59 | 85,224 | 0.50 | 1.05 | 935,880 | 0.57 | 0.24 | 1.13 | 20,081 | 2,256 | 43,575 | 31,653 |
| 97 | 1.10 | 1,265 | 4,777,141 | 3.07 | 129,802 | 0.36 | 1.59 | 85,793 | 0.50 | 1.05 | 957,129 | 0.57 | 0.24 | 1.13 | 20,383 | 2,306 | 44,444 | 32,206 |
7Eq Au [Moz] = Au [Moz] + Cu [Mt] * Copper Price * 2204.62 / Gold Price + Ag [Moz] * Silver Price / Gold Price
Project No.: C-580 January, 2012 | Page 193 - 378 | |
Table 15.6: Nested Pit Series – Hybrid Option
| Pit | Revenue Factor | Gold Price | Ore + Waste | Strip Ratio | Oxide Ore | MacNeill Ore | Sulphide Ore | Contained Metal |
| $/oz | Kt | kt | Au g/t | Ag g/t | kt | Au g/t | Ag g/t | kt | Au g/t | Cu % | Ag g/t | Au Koz | Cu kt | Ag Koz | |
| 1 | 0.14 | 161 | 12 | 0.00 | 12 | 1.26 | 0.86 | 0 | 0.00 | 0.00 | 0 | 0.00 | 0.00 | 0.00 | 1 | 0 | 0 | 1 |
| 2 | 0.15 | 173 | 61 | 0.00 | 61 | 1.18 | 2.59 | 0 | 0.00 | 0.00 | 0 | 0.00 | 0.00 | 0.00 | 2 | 0 | 5 | 2 |
| 7 | 0.20 | 230 | 2,662 | 0.00 | 2,662 | 0.86 | 2.19 | 0 | 0.00 | 0.00 | 0 | 0.00 | 0.00 | 0.00 | 73 | 0 | 188 | 77 |
| 12 | 0.25 | 288 | 12,065 | 0.01 | 11,998 | 0.72 | 2.09 | 0 | 0.00 | 0.00 | 0 | 0.00 | 0.00 | 0.00 | 276 | 0 | 806 | 290 |
| 17 | 0.30 | 345 | 22,075 | 0.02 | 21,702 | 0.64 | 2.01 | 0 | 0.00 | 0.00 | 0 | 0.00 | 0.00 | 0.00 | 444 | 0 | 1,401 | 468 |
| 22 | 0.35 | 403 | 40,164 | 0.08 | 37,284 | 0.57 | 1.88 | 0 | 0.00 | 0.00 | 0 | 0.00 | 0.00 | 0.00 | 684 | 0 | 2,249 | 723 |
| 27 | 0.40 | 460 | 74,847 | 0.14 | 59,048 | 0.49 | 1.68 | 0 | 0.00 | 0.00 | 6,582 | 0.87 | 0.28 | 1.07 | 1,121 | 18 | 3,412 | 1,268 |
| 32 | 0.45 | 518 | 119,582 | 0.18 | 78,725 | 0.45 | 1.56 | 0 | 0.00 | 0.00 | 22,585 | 0.72 | 0.26 | 1.06 | 1,650 | 58 | 4,725 | 2,010 |
| 37 | 0.50 | 575 | 171,871 | 0.23 | 94,689 | 0.42 | 1.55 | 273 | 0.47 | 1.20 | 45,258 | 0.65 | 0.24 | 1.03 | 2,225 | 107 | 6,234 | 2,848 |
| 42 | 0.55 | 633 | 225,939 | 0.28 | 106,172 | 0.40 | 1.56 | 934 | 0.49 | 1.03 | 69,186 | 0.62 | 0.23 | 1.04 | 2,742 | 158 | 7,696 | 3,632 |
| 47 | 0.60 | 690 | 528,397 | 0.60 | 124,888 | 0.37 | 1.59 | 33,875 | 0.52 | 1.02 | 171,075 | 0.59 | 0.21 | 1.07 | 5,311 | 361 | 13,419 | 7,276 |
| 52 | 0.65 | 748 | 672,979 | 0.74 | 127,719 | 0.37 | 1.59 | 42,487 | 0.51 | 1.03 | 216,856 | 0.60 | 0.21 | 1.08 | 6,373 | 459 | 15,467 | 8,841 |
| 57 | 0.70 | 805 | 911,062 | 0.94 | 129,507 | 0.36 | 1.59 | 51,667 | 0.51 | 1.04 | 287,747 | 0.60 | 0.22 | 1.09 | 7,934 | 623 | 18,434 | 11,239 |
| 61 | 0.75 | 863 | 1,000,006 | 1.01 | 129,779 | 0.36 | 1.59 | 54,720 | 0.50 | 1.05 | 312,962 | 0.60 | 0.22 | 1.09 | 8,470 | 683 | 19,489 | 12,083 |
| 65 | 0.80 | 920 | 1,095,090 | 1.08 | 129,802 | 0.36 | 1.59 | 59,914 | 0.50 | 1.05 | 337,033 | 0.60 | 0.22 | 1.10 | 9,015 | 742 | 20,584 | 12,929 |
| 70 | 0.85 | 978 | 1,171,130 | 1.13 | 129,802 | 0.36 | 1.59 | 63,696 | 0.50 | 1.04 | 355,684 | 0.60 | 0.22 | 1.11 | 9,425 | 786 | 21,433 | 13,567 |
| 74 | 0.90 | 1,035 | 1,325,655 | 1.25 | 129,802 | 0.36 | 1.59 | 66,156 | 0.49 | 1.05 | 393,857 | 0.60 | 0.22 | 1.11 | 10,211 | 883 | 22,930 | 14,842 |
| 79 | 0.96 | 1,104 | 1,366,173 | 1.27 | 129,802 | 0.36 | 1.59 | 68,776 | 0.49 | 1.04 | 403,970 | 0.60 | 0.22 | 1.11 | 10,400 | 904 | 23,422 | 15,141 |
| 83 | 1.01 | 1,162 | 1,417,780 | 1.30 | 129,802 | 0.36 | 1.59 | 71,806 | 0.49 | 1.04 | 415,387 | 0.60 | 0.22 | 1.12 | 10,633 | 928 | 23,977 | 15,498 |
| 86 | 1.05 | 1,208 | 1,514,404 | 1.37 | 129,802 | 0.36 | 1.59 | 71,988 | 0.49 | 1.04 | 437,091 | 0.60 | 0.23 | 1.12 | 11,068 | 985 | 24,762 | 16,221 |
| 90 | 1.10 | 1,265 | 1,572,488 | 1.40 | 129,802 | 0.36 | 1.59 | 74,767 | 0.49 | 1.04 | 449,507 | 0.60 | 0.23 | 1.12 | 11,318 | 1,012 | 25,326 | 16,610 |
8Eq Au [Moz] = Au [Moz] + Cu [Mt] * Copper Price * 2204.62 / Gold Price + Ag [Moz] * Silver Price / Gold Price
Project No.: C-580 January, 2012 | Page 194 - 378 | |
Based on the overall project economic evaluation completed by Aker Solutions the Super Pit option provides the best return and is the preferred option for evaluation at feasibility study level.
All reserves for the Caspiche project have been evaluated for the three options considered, however those reserves pertaining to the Super Pit option should be given particular consideration when evaluating the report and its conclusions.
Figure 15.3 illustrates the nested pit series for the Super Pit option as a relationship between the contained equivalent gold ounces and stripping ratio. For simplicity the equivalent gold content has been estimated from a relation between metal prices.
Gold prices lower than 410 US$/oz represent the oxide cap. From there to a price of 610 US$/oz, the contained metal increases rapidly with a low stripping ratio. A rapid climb in the stripping ratio is noted up to a gold price of 750 US$/oz. The rapid increase in the stripping ratio indicates the progressive expansion of the high wall, where the incremental ratio is higher than in other zones of the pit and the metal contained below is more expensive to extract.
Over 750 US$/oz, the contained metal curve becomes gentle and parallel to the stripping ratio. The stripping ratio represents progressively smaller expansions of the pit around the main orebody to reach deeper resources.
Figure 15.3: Stripping Ratio Versus Contained Metal – Super Pit Option
Figure 15.4 illustrates the nested pit series for the Hybrid option with the same relationship between contained equivalent gold ounces and the stripping ratio.
For every step of the pit, a trade-off against exploitation by underground mining was made and as a result the change in stripping ratio has the same trend as the contained metal.
Project No.: C-580 January, 2012 | Page 195 - 378 | |
Figure 15.4: Stripping Ratio Versus Contained Metal – Hybrid Option
The ore tonnes reported within the ultimate pits are composed of oxide, MacNeill and sulphide material. The oxide tonnage is similar for the Super Pit and Hybrid options: 130 Mt of ore with average gold and silver head grades of 0.36 g/t and 1.59 g/t, respectively.
The Super Pit option contains 893 Mt of sulphide ore with average gold, copper and silver head grades of 0.58 g/t, 0.24 % and 1.13 g/t, respectively. The Hybrid option pit contains 415 Mt of sulphide ore with average gold, copper and silver head grade of 0.60 g/t, 0.22 % and 1.12 g/t, respectively.
The MacNeill ore tonnes in the Super Pit option are 83 Mt with average gold and silver head grades of 0.50 g/t and 1.05 g/t, respectively. In the Hybrid option, the ore tonnage amounts to 72 Mt with average gold and silver head grades of 0.49 g/t and 1.04 g/t, respectively.
Table 15.7 summarizes the ore tonnes and grades for each option.
Table 15.7: Ultimate Pit Shells Contained Reserves
| Option | Oxide Ore | MacNeill Ore | Sulphide Ore | Waste | Total Rock | Contained Metal |
| Mt | Au g/t | Ag g/t | Mt | Au g/t | Ag g/t | Mt | Au g/t | Cu % | Ag g/t | Mt | Mt | Au (Moz) | Cu (Mt) | Ag (Moz) | |
| Super Pit | 130 | 0.36 | 1.59 | 83 | 0.50 | 1.05 | 893 | 0.58 | 0.24 | 1.13 | 3,113 | 4,219 | 19.4 | 2.2 | 41.8 | 30.5 |
| Hybrid | 130 | 0.36 | 1.59 | 72 | 0.49 | 1.04 | 415 | 0.60 | 0.22 | 1.12 | 801 | 1,418 | 10.6 | 0.9 | 24.0 | 15.5 |
Figure 15.5 illustrates the ultimate pit shell for both options.
9 Eq Au [Moz] = Au [Moz] + Cu [Mt] * Copper Price * 2204.62 / Gold Price + Ag [Moz] * Silver Price / Gold Price
Project No.: C-580 January, 2012 | Page 196 - 378 | |
Figure 15.5: Optimal Pit Shells
| 15.2.7 | Full Underground – Oxide and MacNeill Pits |
The Full Underground option considers the early development of the heap leaching of the oxide and MacNeill ores by a Stand Alone open pit exploitation. This stand alone operation is largely based on the Prefeasibility Study: Oxide Standalone Project submitted by Exeter on Sedar (www.sedar.com) on 8th June 2011. Due to the incorporation of MacNeill ore the heap leach operation will have a longer operational life and will require minor modifications to the crushing and ADR circuit as well as process changes to accommodate the copper content within the MacNeill ore.
A set of key parameters have been defined for this alternative. These were used as a basis for pit optimization, mine design, mine planning and cost estimation. The final values are listed in Table 15.8.
Table 15.8: Key Parameters for the Heap Leach Open Pit Optimization
| Parameter | Unit | Oxides | MacNeill |
| Mining cost | $/t | Base + Depth Increm. Average 1.40 |
| Process cost | $/t | 3.40 | 5.31 |
| Gold Met. Recovery | % | 78 | Upper 55 Lower 30 |
| Silver Met. Recovery | % | 34 | 20 |
| Gold Treatment Cost | $/oz | 6 |
| Silver Treatment Cost | $/oz | 0.4 |
| Royalty Anglo American | % | 3.08 |
| Royalty Chilean Gvmt. | % | 5 |
| Gold Price | $/oz | 1,150 |
| Silver Price | $/oz | 20 |
Project No.: C-580 January, 2012 | Page 197 - 378 | |
Figure 15.6 illustrates the nested pit series for the heap leach open pit option as a relationship between the contained equivalent gold ounces and stripping ratio. For simplicity the equivalent gold content has been estimated from a relation between metal prices.
Figure 15.6: Stripping Ratio Versus Contained Metal – Heap Leach Stand Alone (Full Underground option)
The ore tonnes reported within the ultimate pits are composed of oxide and MacNeill only. The oxide tonnage is lower than the Super Pit and Hybrid options. MacNeill tonnage is in the same range. From a price of 414 US$/oz to 874 US$/oz, the contained metal increases rapidly with a low stripping ratio. A rapid climb in the stripping ratio and contained metal is noted up to a gold price of 932 US$/oz.
Table 15.9 and Figure 15.7 illustrate the Whittle results for the pit optimizations based on these criteria.
Table 15.9: Ultimate Heap Leach Pit Shell – Underground Option
| Full Underground Option | Oxide Ore | MacNeill Ore | Waste | Total Rock | Contained Metal |
| Mt | Au g/t | Ag g/t | Mt | Au g/t | Ag g/t | Mt | Mt | Au (Moz) | Ag (Moz) |
| Heap leach Pit | 112 | 0.39 | 1.57 | 74 | 0.55 | 1.12 | 151 | 337 | 2.70 | 8.29 |
Project No.: C-580 January, 2012 | Page 198 - 378 | |
Figure 15.7: Optimal Heap Leach Pit
The optimal pit for the heap leach operation contains a total of 186 Mt of ore with a gold and silver average grade of 0.45 g/t and 1.39 g/t respectively.
| 15.3 | Open Pit Mineral Reserves |
Using the ultimate pit shells as a starting point, practical pit designs which incorporate access and logical development using phases identified from intermediate Whittle shells were completed.
A set of nested pit shells was obtained from the pit optimization and used as guides for the design of the intermediate phases and ultimate pit. The general design parameters used in the detailed pit design are those listed previously. Other parameters are listed below.
| 15.3.1.1 | Super Pit and Hybrid Pit |
| ● | The bench height used for design is 15 m, matching the block height and the selected loading equipment. |
| ● | The slope parameters used for pit design were those recommended by AKL and described in the previous section (see Table 15.3). The actual slope angle input into Whittle was adjusted to include the anticipated number of access ramps in each wall generated from earlier studies. This ensured that practical pit designs closely approximated the Whittle shell used for defining ore reserves and the ultimate pit. |
| ● | A pushback width of 120 m was considered to provide space for two rope shovels and access for haulage and support equipment onto the bench. A minimum of 100 m was accepted to meet scheduling constraints, with one rope shovel digging area and good accessibility for hauling and other services. |
Project No.: C-580 January, 2012 | Page 199 - 378 | |
| ● | The pit designs consider double exits on the west and north side of the pit providing access to the primary ore and waste crushers, to the leach pad and leach pad stockpiles and to the waste dumps. |
| 15.3.1.2 | Oxide/MacNeill Pit (Within the Full Underground Option) |
| ● | The bench height used for design is 15 m, matching the block height and the selected loading equipment. |
| ● | The slope parameters used for pit design were those recommended by AKL for the Hybrid and Super Pit options. |
| ● | For in-pit access, 26 m wide ramps at a 10 % grade were designed |
| ● | A pushback width of 80 m was considered to provide space for loading equipment and access for haulage and support equipment onto the bench. |
Figure 15.8 Figure 15.9, and Figure 15.10 show the final pit design of the Super Pit, Hybrid, and Oxide/McNeill pit options respectively.
Note that in Figure 15.8, an in-pit platform for the establishment of four in-pit waste crushers is incorporated during the life of the mine. The location of this platform was established during the scoping level in-pit crushing studies completed in June 2011 by NCL, and optimized during this study. The in-pit crushing elements are discussed in more detail in Section 16.
Project No.: C-580 January, 2012 | Page 200 - 378 | |
Figure 15.8: Final Pit Design – Super Pit IPCC Option
Figure 15.9: Final Pit Design – Hybrid Option
Project No.: C-580 January, 2012 | Page 201 - 378 | |
Figure 15.10: Final Pit Design – Oxide/McNeill Pit: Full Underground Option
| 15.3.2 | Mining Phases Design |
The integration of the pit optimization shells with practical access considerations provided the input to design a series of practical mining phases.
In the Super Pit option, the defined pit was divided into sixteen phases based on optimized nested pit shell guidance: gold and copper grade, strip ratio and the ability to access the pit. Numbering of phases includes non-operational Whittle cones, for this reason operational phases are not correlative. Significant milestones during the life of the pit are:
| ● | Phase 0 targets the most profitable area of oxide ore and gives an alternative for early production of oxide ore while overall pre-stripping is developed. |
| ● | Phases 1 and 2 target the shallow sulphide ore and continued mining of the oxide and MacNeill ore. |
| ● | Phases 3 to 7 progressively enlarge the pit by splitting the northeast and southwest phases of the 120 m wide pushbacks to achieve a balanced stripping ratio in the mine schedule. |
| ● | Phase 9 contains the development of the in-pit crushing stations for the relocation of the pit-rim waste crushers, and the associated conveyor ramp. |
| ● | Phase 11 onwards enlarge the pit by 120m wide pushbacks to complete the final pit. |
In the Hybrid option, the defined pit has been divided into eight mining phases based on optimized nested pit shell guidance. The mining sequence is similar to the Super Pit option, however the final pit is smaller and no in-pit crusher platform is required.
Project No.: C-580 January, 2012 | Page 202 - 378 | |
Figure 15.11 and Figure 15.12 illustrate examples of the mining sequence of the Super Pit and the Hybrid option, respectively. Each individual mining phase is represented as one bench.
Figure 15.11: Mining Sequence – Super Pit Option – Bench 4210
Project No.: C-580 January, 2012 | Page 203 - 378 | |
Figure 15.12: Mining Sequence – Hybrid Option – Bench 4240
The heap leach stand alone pit has been developed in five mining phases, three containing oxide material and two additional phases containing MacNeill material:
| ● | Phase 1 targets the most profitable area in the center part of the pit. This phase contains oxide material only. |
| ● | Phase 2 mines the eastern part of the pit. This phase maintains the same shallow and wide characteristics of Phase 1. Phase 2 has greater resources than Phase 1, but with a lower gold grade. This phase contains oxide material only. |
| ● | Phase 3 expands to the west area of the pit. Similar grades and strip ratio to those of Phase 2 are obtained. This phase contains oxide material only |
| ● | Phase 4 continues expanding to the south west and increases pit depth Most of the ore corresponds to MacNeill material. Grades are better but at a higher strip ratio than previous phases. |
| ● | Phase 5 mines the south western part of the pit. More than 99 % of the ore contained in Phase 5 is MacNeill. Grades and strip ratio are similar to Phase 4. |
Figure 15.13 illustrates the mining sequence and final pit.
Project No.: C-580 January, 2012 | Page 204 - 378 | |
Figure 15.13: Mining Sequence – Heap Leach Pit - Bench 4300
Project No.: C-580 January, 2012 | Page 205 - 378 | |
| 15.3.3 | Comparison of Pit Designs and Optimized Shells |
The optimized pit shells and ultimate pit design volumetrics for the Super Pit option are compared in Table 15.10. The two shapes are shown graphically in Figure 15.14.
The ultimate pit design, although slightly bigger, fits well within the Whittle® optimized pit shell. Total material increased by 6 % due to the irregular shape of the bottom of the pit and minor deviations of the practical pit design overall slope angles. In addition, there are small increases in the pit volume to accommodate the in-pit crusher stations and the conveyor ramp to remove crushed waste.
Ore quantities and contained metal are practically the same; differences are within an acceptable range.
Table 15.10: Super Pit Option – Design Versus Ultimate Pit Shell Comparison
| Item | Ultimate | Mine | Difference |
| Shell | Design | (%) |
Oxide Ore (Mt) | 130 | 130 | 0 |
| Gold Grade (g/t) | 0.36 | 0.36 | 0 |
| Silver Grade (g/t) | 1.59 | 1.59 | 0 |
MacNeill Ore (Mt) | 83 | 84 | 1 |
| Gold Grade (g/t) | 0.50 | 0.50 | 0 |
| Silver Grade (g/t) | 1.05 | 1.05 | 0 |
Sulphide Ore (Mt) | 893 | 889 | 0 |
| Gold Grade (g/t) | 0.58 | 0.58 | 0 |
| Copper Grade (%) | 0.24 | 0.24 | -1 |
| Silver Grade (g/t) | 1.13 | 1.13 | 0 |
| Contained Gold Metal (M oz) | 19.4 | 19.4 | 0 |
| Contained Copper Metal (M t) | 2.2 | 2.1 | -1 |
| Contained Silver Metal (M oz) | 16.4 | 16.3 | 0 |
| Total Ore + Waste (Mt) | 4,219 | 4,486 | 6 |
| Strip Ratio | 3.1 | 3.4 | 9 |
Project No.: C-580 January, 2012 | Page 206 - 378 | |
Figure 15.14: Super Pit Option – Plots of Ultimate Pit Shell Compared to Mine Design
The optimized pit shells and ultimate pit design volumetrics for the Hybrid option are compared in Table 15.11. The two shapes are shown graphically in Figure 15.15. The ultimate pit design, although slightly bigger, fits well within the Whittle® optimized pit shell. Total material increases by 4 % due to additional ramps which produce a deviation of the overall pit wall angle.
Ore quantities and contained metal show a 2 % difference. These differences are within an acceptable range.
Project No.: C-580 January, 2012 | Page 207 - 378 | |
Table 15.11: Hybrid Option – Design Versus Ultimate Pit Shell Comparison
| Item | Ultimate | Mine | Difference |
| Shell | Design | (%) |
Oxide Ore (Mt) | 130 | 130 | 0 |
| Gold Grade (g/t) | 0.36 | 0.36 | 0 |
| Silver Grade (g/t) | 1.59 | 1.59 | 0 |
MacNeill Ore (Mt) | 72 | 74 | 3 |
| Gold Grade (g/t) | 0.49 | 0.49 | 0 |
| Silver Grade (g/t) | 1.04 | 1.04 | 0 |
Sulphide Ore (Mt) | 415 | 417 | 0 |
| Gold Grade (g/t) | 0.60 | 0.59 | -1 |
| Copper Grade (%) | 0.22 | 0.22 | -1 |
| Silver Grade (g/t) | 1.12 | 1.12 | 0 |
| Contained Gold Metal (M oz) | 10.6 | 10.6 | 0 |
| Contained Copper Metal (M t) | 0.9 | 0.9 | 0 |
| Contained Silver Metal (M oz) | 12.0 | 12.1 | 1 |
| Total Ore + Waste (Mt) | 1,418 | 1,506 | 6 |
| Strip Ratio | 1.6 | 1.8 | 10 |
Figure 15.15: Hybrid Option – Plots of Ultimate Pit Shell Compared to Mine Design
Project No.: C-580 January, 2012 | Page 208- 378 | |
| 15.3.3.3 | Oxide and MacNeill Pit |
The optimized pit shell and ultimate pit design volumetrics for the heap leach stand alone pit are compared in Table 15.12. The two shapes are shown graphically in Figure 15.16.
Table 15.12: Heap Leach Stand Alone Pit - Design Versus Ultimate Pit Shell Comparison
| Item | Ultimate Shell | Mine Design | Difference |
| |
Oxide Ore (Mt) | 113,6 | 111,7 | -2% |
| Gold Grade (g/t) | 0,389 | 0,387 | -0% |
| Silver Grade (g/t) | 1,563 | 1,567 | 0% |
MacNeill Ore (Mt) | 74,1 | 73,7 | -1% |
| Gold Grade (g/t) | 0,559 | 0,555 | -1% |
| Silver Grade (g/t) | 1,132 | 1,124 | -1% |
| Contained Gold Metal (M oz) | 2.753 | 2.704 | -2% |
| Contained Silver Metal (M oz) | 8.411 | 8.288 | -2% |
| Total Ore + Waste (Mt) | 328,8 | 336,1 | 2% |
| Strip Ratio | 0,75 | 0,81 | 8% |
Ore quantity indicates a 1.3 % difference, but since contained metal is only 1.8 % lower in the designed pit, all the differences are considered as being within acceptable ranges.
Figure 15.16: Oxide/MacNeill Pit – Plots of Ultimate Pit Shell Compared to Mine Design
| 15.3.4 | Tabulation of Contained Ore within Final Pit Designs |
Table 15.13 summarizes the contained tonnes and grade of ore for the final pit design and individual mining phases for the Super Pit option. The contained ore tonnes for the Hybrid option are summarized in Table 15.14. Both tables consider a profit zero cut-off grade. The ore tonnes in the tables consider Measured and Indicated resources (M+I) only.
Project No.: C-580 January, 2012 | Page 209 - 378 | |
Table 15.13: Super Pit Option – Contained Ore Tonnes and Grade by Phase
| Pit | Oxide Ore | MacNeill Ore | Sulphide Ore | Waste | Total Rock | Strip Ratio | Contained Metal |
| Mt | Au (g/t) | Ag (g/t) | Mt | Au (g/t) | Ag (g/t) | Mt | Au (g/t) | Cu (%) | Ag (g/t) | Mt | Mt | Au (Moz) | Cu (Mt) | Ag (Moz) | |
| F00 | 33 | 0.33 | 2.07 | 0 | 0.00 | 0.00 | 1 | 0.39 | 0.12 | 1.66 | 20 | 54 | 0.59 | 0.4 | 0.0 | 2.3 | 0.4 |
| F01 | 21 | 0.25 | 1.82 | 0 | 0.50 | 1.07 | 14 | 0.43 | 0.15 | 1.34 | 95 | 130 | 2.73 | 0.4 | 0.0 | 1.8 | 0.5 |
| F02 | 36 | 0.42 | 1.58 | 0 | 0.43 | 0.74 | 32 | 0.59 | 0.23 | 1.10 | 14 | 82 | 0.21 | 1.1 | 0.1 | 3.0 | 1.5 |
| F03 | 20 | 0.43 | 1.18 | 1 | 0.38 | 1.13 | 48 | 0.57 | 0.22 | 1.04 | 157 | 225 | 2.32 | 1.2 | 0.1 | 2.4 | 1.7 |
| F05 | 15 | 0.40 | 0.98 | 8 | 0.43 | 0.94 | 53 | 0.65 | 0.23 | 0.96 | 76 | 151 | 1.12 | 1.4 | 0.1 | 2.3 | 2.0 |
| F06 | 5 | 0.33 | 0.97 | 5 | 0.51 | 0.70 | 51 | 0.62 | 0.22 | 0.96 | 81 | 142 | 1.46 | 1.2 | 0.1 | 1.8 | 1.7 |
| F07 | 0 | 0.18 | 1.06 | 13 | 0.52 | 1.22 | 76 | 0.58 | 0.24 | 1.11 | 291 | 381 | 3.79 | 1.6 | 0.2 | 3.2 | 2.6 |
| F09 | 0 | 0.24 | 0.86 | 25 | 0.51 | 1.00 | 103 | 0.65 | 0.24 | 1.20 | 330 | 459 | 3.19 | 2.6 | 0.3 | 4.8 | 3.9 |
| F11 | 0 | 0.00 | 0.00 | 0 | 0.29 | 0.46 | 68 | 0.62 | 0.27 | 0.92 | 406 | 474 | 5.97 | 1.4 | 0.2 | 2.0 | 2.3 |
| F13 | 0 | 0.00 | 0.00 | 18 | 0.45 | 1.07 | 86 | 0.56 | 0.22 | 1.24 | 205 | 309 | 2.39 | 1.8 | 0.2 | 4.0 | 2.8 |
| F14 | 0 | 0.00 | 0.00 | 0 | 0.00 | 0.00 | 85 | 0.63 | 0.28 | 1.00 | 512 | 597 | 6.03 | 1.7 | 0.2 | 2.7 | 2.9 |
| F15 | 0 | 0.00 | 0.00 | 14 | 0.53 | 1.13 | 273 | 0.52 | 0.24 | 1.25 | 1,195 | 1,482 | 4.38 | 4.8 | 0.7 | 11.5 | 8.1 |
| Total | 130 | 0.36 | 1.59 | 84 | 0.50 | 1.05 | 889 | 0.58 | 0.24 | 1.13 | 3,383 | 4,486 | 3.32 | 18.0 | 2.1 | 39.0 | 30.0 |
10 Eq Au [Moz] = Au [Moz] + Cu [Mt] * Copper Price * 2204.62 / Gold Price + Ag [Moz] * Silver Price / Gold Price
Project No.: C-580 January, 2012 | Page 210 - 378 | |
Table 15.14: Hybrid Option – Contained Ore Tonnes and Grade by Phase
| Pit | Oxide Ore | MacNeill Ore | Sulphide Ore | Waste | Ore + Waste | Strip Ratio | Contained Metal |
| Mt | Au (g/t) | Ag (g/t) | Mt | Au (g/t) | Ag (g/t) | Mt | Au (g/t) | Cu (%) | Ag (g/t) | Mt | Mt | Au (Moz) | Cu (Mt) | Ag (Moz) | |
| F00 | 33 | 0.33 | 2.07 | 0 | 0.00 | 0.00 | 1 | 0.39 | 0.12 | 1.66 | 20 | 54 | 0.59 | 0.4 | 0.0 | 2.3 | 0.4 |
| F01 | 21 | 0.25 | 1.82 | 0 | 0.50 | 1.07 | 14 | 0.43 | 0.15 | 1.34 | 95 | 130 | 2.73 | 0.4 | 0.0 | 1.8 | 0.5 |
| F02 | 36 | 0.42 | 1.58 | 0 | 0.43 | 0.73 | 32 | 0.60 | 0.23 | 1.10 | 15 | 83 | 0.21 | 1.1 | 0.1 | 3.0 | 1.5 |
| F03 | 17 | 0.42 | 1.21 | 1 | 0.39 | 0.88 | 57 | 0.55 | 0.22 | 1.03 | 160 | 234 | 2.16 | 1.2 | 0.1 | 2.5 | 1.9 |
| F04 | 14 | 0.44 | 1.00 | 10 | 0.44 | 0.99 | 48 | 0.61 | 0.23 | 0.99 | 68 | 140 | 1.09 | 1.3 | 0.1 | 2.3 | 1.9 |
| F05 | 8 | 0.33 | 0.94 | 8 | 0.51 | 0.74 | 58 | 0.66 | 0.22 | 0.93 | 80 | 153 | 1.21 | 1.4 | 0.1 | 2.2 | 2.1 |
| F06 | 0 | 0.17 | 0.96 | 2 | 0.53 | 0.62 | 75 | 0.62 | 0.24 | 1.16 | 192 | 270 | 2.53 | 1.5 | 0.2 | 2.9 | 2.4 |
| F07 | 0 | 0.20 | 1.09 | 53 | 0.50 | 1.12 | 132 | 0.58 | 0.22 | 1.25 | 256 | 442 | 1.93 | 3.3 | 0.3 | 7.2 | 4.8 |
| Total | 130 | 0.36 | 1.59 | 74 | 0.49 | 1.04 | 417 | 0.59 | 0.22 | 1.12 | 885 | 1,506 | 1.62 | 10.6 | 0.9 | 24.2 | 15.5 |
Table 15.15: Oxide/MacNeill Pit – Contained Ore Tonnes and Grade by Phase (Full Underground Option)
| Phase | Oxide Ore | McNeill Leached Ore | Waste | Total Rock |
| Kt | Au g/t | Ag g/t | Kt | Au g/t | Ag g/t | kt | kt |
| F01 | 15 | 0.64 | 1.71 | | | | 0 | 15 |
| F02 | 66 | 0.35 | 1.60 | | | | 20 | 86 |
| F03 | 23 | 0.38 | 1.35 | | | | 12 | 35 |
| F04 | 8 | 0.25 | 1.72 | 37 | 0.52 | 0.94 | 66 | 110 |
| F05 | 0 | 0.20 | 1.00 | 37 | 0.59 | 1.31 | 52 | 89 |
| Total | 112 | 0.39 | 1.57 | 74 | 0.55 | 1.12 | 151 | 336 |
11 Eq Au [Moz] = Au [Moz] + Cu [Mt] * Copper Price * 2204.62 / Gold Price + Ag [Moz] * Silver Price / Gold Price
Project No.: C-580 January, 2012 | Page 211 - 378 | |
As noted in 15.2.6 the Super Pit option is the preferred alternative to be developed to feasibility study level. As such particular consideration of Table 15.13 should be made when evaluating the project.
| 15.3.5 | Dilution and Ore Losses |
The resource model block size of 25 m long, 25 m wide and 15 m high, is commensurate with the orebody variability and scale of operation. There is no requirement for any mining dilution factor due to the low grade variance, especially near cut-off grades.
The equipment chosen for the project will have more than sufficient capability to mine at selective mining units (SMU’s) of much smaller sizes than the current block size. Therefore, neither dilution nor ore losses are considered.
| 15.3.6 | Statement of Open Pit Mineral Reserves |
From the contained ore tonnages in the designs, a cut-off value of 0.49 US$/t, to cover re-handle costs, was applied for the oxides and MacNeill material. The open pit proven and probable reserves for each option are presented in Table 15.16.
Table 15.16 Open Pit Proven and Probable Mineral Reserves (Carlos Guzman, CChM, October 2011)
| Option | | Open Pit Mineral Proven and Probable Mineral Reserves |
| Oxide Ore | | MacNeill Ore | Sulphide Ore |
| Mt | Au g/t | Ag g/t | Mt | Au g/t | Cu % | Ag g/t | Mt | Au g/t | Cu % | Ag g/t |
| Super Pit | 124 | 0.38 | 1.62 | 78 | 0.51 | 0.07 | 1.05 | 889 | 0.58 | 0.24 | 1.13 |
| Hybrid | 124 | 0.38 | 1.62 | 70 | 0.50 | 0.07 | 1.05 | 417 | 0.59 | 0.22 | 1.12 |
| Full UG | 112 | 0.39 | 1.57 | 74 | 0.55 | 0.11 | 1,12 | | | | |
The contained ore tonnes listed in Tables 15.13, 15.14 and 15.15 above represent in-pit reserves in practically designed open-pits. However in the case of Oxide and MacNeill mineralization, mine scheduling to allow access to sulphide material at the earliest practical date results in the need to mine and stockpile these two ore types on surface and reclaim them later for processing. The additional cost of re-handling this material were estimated at 0.49 US$/tonne and as a result, in the Super Pit option, approximately 6Mt of oxides and 2 Mt MacNeill did not deliver sufficient value to cover this additional cost, and have been dropped from final Reserves quoted in 15.16.
The Super Pit option is the preferred alternative to be developed to feasibility study level. As such particular consideration of Table 15.16 should be made when evaluating the project.
| 15.4 | Underground Mineral Reserves |
The definition of the underground mineral reserves was performed assuming that a block caving method can be applied to the Caspiche deposit.
Project No.: C-580 January, 2012 | Page 212 - 378 | |
Preliminary geotechnical studies of the rock mass were completed to establish ‘caveability’ and fragmentation for a block caving method. From the current available information, the studies indicate the rock is not significantly different from primary rock in other porphyry copper deposits in Chile currently using this method (e.g. El Salvador, Andina, El Teniente).
The estimate of mineral reserves for block caving requires the inclusion of material with lower than the economic grade limit that cannot be separated and must be sent to the plant with the rest of the ore (dilution).
Figure 15.17 shows schematically the blending process within the ore column the process of block valuation. A diluted grade model was generated with the same block definition as the in situ model, the diluted grades resulting from blending the material of the blocks that form the ore column. Each block was assigned a new grade value, without discriminating fractions of ore and waste within these units.
The Laubscher dilution model was applied to calculate the diluted model, considering a 60 % Dilution Entry Point (DEP). Following current industry practice a maximum ore column height of 500 m was also applied. The grade of the waste material in the blend was assumed as zero.
Figure 15.17: Dilution & Economic Column Calculation
The cut-off criteria used to determine the ore/waste limit was the maximum cumulative profit of the ore column, such that every block that added value to the ore column was included until the total ore column profit was maximized. Blocks above that limit were considered as waste and not included as part of the mineable reserves. The economic parameters used for the determination of the mineable reserves are summarized in Table 15.17.
Project No.: C-580 January, 2012 | Page 213 - 378 | |
Table 15.17: Economic Parameters for Underground Mineable Reserves
| Parameter | Unit | Value |
| UG Mining Cost | US$/t | 7.0 |
| Sulphide Process Cost | US$/t | 7.04 |
| Copper Met. Recovery | % | Variable, Table 15.2 |
| Gold Met. Recovery | % | Variable, Table 15.2 |
| Silver Met. Recovery | % | 50 |
| Copper Treatment Cost | US$/lb | 0.197 |
| Gold Treatment Cost | US$/oz | 6 |
| Silver Treatment Cost | US$/oz | 0.4 |
| Royalty Anglo American | % | 3,08 |
| Royalty Chilean Government | % | 5 |
| Gold Price | US$/oz | 1150 |
| Silver Price | US$/oz | 20 |
| Copper Price | US$/lb | 2.5 |
An analysis of the best elevations to locate the undercut levels was carried out considering that the upper part of the deposit will be mined by open pit methods.
The results for the underground portion of the Hybrid option are presented in Table 15.18:
Table 15.18: Hybrid Option – Mineral Reserves (Carlos Guzman, CChM, October 2011)
| Undercut Level | UG Mine - Sulphide Ore | Contained Metal |
| Mt | Au (g/t) | Cu (%) | Ag (g/t) | Au (Moz) | Cu (Mt) | Ag (Moz) | |
| UC 3400 | 242 | 0.70 | 0.33 | 1.29 | 5.5 | 0.8 | 10.0 | 9.5 |
The best value was obtained with undercut level located at RL 3400. For this case the diluted mineable underground reserves are 242 Mt of ore with an average grade of 0.70 g/t Au and 0.33 % Cu. The total area of the mining footprint is 206,322 m2.
Figure 15.18 illustrates the relative position of the undercut level in relation to the pit limit.
12 Eq Au [Moz] = Au [Moz] + Cu [Mt] * Copper Price * 2204.62 / Gold Price + Ag [Moz] * Silver Price / Gold Price
Project No.: C-580 January, 2012 | Page 214 - 378 | |
Figure 15.18: Hybrid Option – Undercut Level
The same exercise was carried out for the Full Underground option, using the same technical and economic parameters as the Hybrid case. An initial analysis was performed, considering natural topography, for the best elevations to locate the undercut levels.
The best values were obtained with undercut levels located at RL 3655, RL 3505 and RL 3190. For this case the diluted underground mineable reserves are 401 Mt of ore with an average grade of 0.69 g/t Au and 0.30 % Cu. The total area of the mining footprint is 356,875 m2. The results are summarized in Table 15.19.
Project No.: C-580 January, 2012 | Page 215 - 378 | |
Table 15.19: Full Underground Option – Mineral Reserves at different Undercut Levels (Carlos Guzman, MAUSIMM, October 2011)
| Undercut Level | UG Mine - Sulphide Ore | Contained Metal |
| Mt | Au (g/t) | Cu (%) | Ag (g/t) | Au (Moz) | Cu (Mt) | Ag (Moz) | |
| UC 3655 | 78 | 0.63 | 0.23 | 1.41 | 1.6 | 0.2 | 3.5 | 2.5 |
| UC 3505 | 270 | 0.75 | 0.32 | 1.21 | 6.5 | 0.9 | 10.5 | 10.8 |
| UC 3190 | 53 | 0.51 | 0.28 | 1.39 | 0.9 | 0.1 | 2.4 | 1.6 |
| Total | 401 | 0.69 | 0.30 | 1.27 | 8.9 | 1.2 | 16.4 | 15.0 |
Figure 15.19 illustrates the relative position of the undercut levels considering natural topography.
Figure 15.19: Full Underground Option – Undercut Levels
These contained reserves are the basis for the mine design and production schedule.
| 15.4.1 | Underground Mineral Reserves |
The estimate of proven and probable reserves for block caving requires the inclusion of material with lower than the economic grade limit that cannot be separated and must be sent to the plant with the rest of the ore.
The underground reserves for each option are presented in Table 15.20.
13 Eq Au [Moz] = Au [Moz] + Cu [Mt] * Copper Price * 2204.62 / Gold Price + Ag [Moz] * Silver Price / Gold Price
Project No.: C-580 January, 2012 | Page 216 - 378 | |
Table 15.20: Underground Proven and Probable Mineral Reserves (Carlos Guzman, CChM, October 2011)
| Option | Underground Mineral Reserves - Sulphide Ore |
| Mt | Au (g/t) | Cu (%) | Ag (g/t) |
| Super Pit | | | | |
| Hybrid | 242 | 0.70 | 0.33 | 1.29 |
| Full UG | 401 | 0.69 | 0.30 | 1.27 |
The previous figures include 3 Mt of waste material for the Hybrid option and 14 Mt of waste material for the Full Underground option. That material corresponds to dilution in the block cave method and its grade has been assumed as zero.
| 15.5 | Reportable Mineral Reserves Statement by Scenario |
Table 15.21 to 15.23 summarize the proven and probable reserves derived from the measured and indicated resources for all three mining options. As the Super Pit option is the preferred alternative to be developed to feasibility study level, particular attention should be taken in Table 15.21 and the assumptions there under.
NCL considers the measured and indicated mineral resource, contained within the open pit and the underground design mineral reserve to be estimated in accordance with the CIM definitions.
Table 15.21: Super Pit Case - Mineral Reserves (Carlos Guzman, CChM, October 2011)
| Option | Super Pit |
| Oxide Ore | MacNeill Ore | Sulphide Ore | Contained Metal (millions) |
| Mt | Au g/t | Ag g/t | Mt | Au g/t | Cu % | Ag g/t | Mt | Au g/t | Cu % | Ag g/t | Au oz | Cu t | Ag oz |
| Proven | 62 | 0,42 | 1,71 | 4 | 0,46 | 0,08 | 0,70 | 321 | 0,62 | 0,26 | 1,10 | 7,3 | 0,8 | 14,8 |
| Probable | 62 | 0,33 | 1,52 | 74 | 0,51 | 0,07 | 1,08 | 568 | 0,55 | 0,23 | 1,15 | 11,9 | 1,3 | 26,6 |
| Total | 124 | 0,38 | 1,62 | 78 | 0,51 | 0,07 | 1,05 | 889 | 0,58 | 0,24 | 1,13 | 19,3 | 2,1 | 41,5 |
Super Pit Reserves Notes:
| 1. | Mineral Reserves are defined within a mine plan with pit phase designs guided by Lerchs-Grossman (LG) pit. The LG shell generation was performed on Measured and Indicated materials only, using a gold price of 1,150 US$/oz, a silver price of 20 US$/oz and a copper price of 2.5 US$/lb, a base mining cost of 1.00 US$/t with incremental of 0.025 US$/t per 15 m bench below the pit exit and 0.015 US$/t per 15 m bench above the pit exit. Processing and treatment costs used were 3.40 US$/t of ore and 6 US$/oz of gold and 0.4 US$/oz of silver for oxides, 5.31 US$/t and 6 US$/oz of gold and 0.4 US$/oz of silver for MacNeill and 7.04 US$/t and 6 US$/oz of gold and 0.4 US$/oz of silver for sulphides. Royalties of 3.08 % and 5 % were also applied. Metallurgical recoveries for oxides were 78 % for gold and 34 % for silver. Metallurgical recoveries for MacNeill were 55 % for gold in the upper layers and 30 % in the lower layers and 20 % for silver. Silver metallurgical recovery for sulphides was 50 %. Copper and gold metallurgical recovery for sulphides was a function of the head grade, defined as: |
Project No.: C-580 January, 2012 | Page 217 - 378 | |
| % Cu Head Grade | Copper Recovery | Gold Recovery |
| 0.0% to 0.05% | 0 | 0 |
| 0.05% to 0.10% | 38% | 30% |
| 0.10% to 0.15% | 68% | 45% |
| 0.15% to 0.20% | 81% | 58% |
| 0.20% to 0.25% | 87% | 65% |
| 0.25% to 0.30% | 89% | 69% |
| >0.30% | >90% to 93% max | 72% |
| 2. | Recoveries are based on a targeted 25 % copper concentrate grade |
| 3. | Sulphide and oxide ore reserves are reported at 0.00 US$/t profit |
| 4. | Leachable MacNeill ore reserves are reported at 0.49 US$/t profit after cost of rehandle |
| 5. | Tonnages are rounded to the nearest 1,000 kt; grades are rounded to two decimal places. |
| 6. | Rounding as required by reporting guidelines may result in apparent summation differences between tonnes, grade and contained metal content. |
| 7. | Tonnage and grade measurements are in metric units; contained gold and silver are in troy ounces |
| 8. | The life of mine strip ratio is 3.11 |
Table 15.22: Hybrid Case - Mineral Reserves (Carlos Guzman, CChM, October 2011)
| Option | Hybrid (Open Pit + Underground) |
| Oxide Ore | MacNeill Ore | Sulphide Ore | Contained Metal (millions) |
| Mt | Au g/t | Ag g/t | Mt | Au g/t | Cu % | Ag g/t | Mt | Au g/t | Cu % | Ag g/t | Au oz | Cu t | Ag oz |
| Proven | 62 | 0,42 | 1,71 | 4 | 0,46 | 0,08 | 0,70 | 273 | 0,65 | 0,27 | 1,13 | 6,6 | 0,7 | 13,4 |
| Probable | 62 | 0,33 | 1,52 | 65 | 0,51 | 0,07 | 1,07 | 387 | 0,62 | 0,25 | 1,21 | 9,4 | 1,0 | 20,4 |
| Total | 124 | 0,38 | 1,62 | 70 | 0,50 | 0,07 | 1,05 | 660 | 0,63 | 0,26 | 1,18 | 16,0 | 1,7 | 33,8 |
Hybrid Case Reserves Notes:
| 1. | Mineral Reserves for the open pit are defined within a mine plan with pit phase designs guided by Lerchs-Grossman (LG) pit. The LG shell generation was performed on Measured and Indicated materials only, using a gold price of 1,150 US$/oz, a silver price of 20 US$/oz and a copper price of 2.5 US$/oz, a base mining cost of 1.00 US$/t with incremental of 0.025 US$/t per 15 m bench below the pit exit and 0.015 US$/t per 15 m bench above the pit exit. Processing and treatment costs used were 3.40 US$/t of ore and 6 US$/oz of gold and 0.4 US$/oz of silver for oxides, 5.31 US$/t and 6 US$/oz of gold and 0.4 US$/oz of silver for MacNeill and 7.04 US$/t and 6 US$/oz of gold and 0.4 US$/oz of silver for sulphides. Royalties of 3.08 % and 5 % were also applied. Metallurgical recoveries for oxides were 78% for gold and 34 % for silver. Metallurgical recoveries for MacNeill were 55 % for gold in the upper layers and 30 % in the lower layers and 20 % for silver. Silver metallurgical recovery for sulphides was 50 %. Copper and gold metallurgical recovery for sulphides was a function of the head grade, defined as: |
Project No.: C-580 January, 2012 | Page 218 - 378 | |
| % Cu Head Grade | Copper Recovery | Gold Recovery |
| 0.0% to 0.05% | 0 | 0 |
| 0.05% to 0.10% | 38% | 30% |
| 0.10% to 0.15% | 68% | 45% |
| 0.15% to 0.20% | 81% | 58% |
| 0.20% to 0.25% | 87% | 65% |
| 0.25% to 0.30% | 89% | 69% |
| >0.30% | >90% to 93% max | 72% |
| 2. | Recoveries are based on a targeted 25 % copper concentrate grade |
| 3. | Sulphide and oxide ore reserves are reported at 0.00 US$/t profit |
| 4. | Leachable MacNeill ore reserves are reported at 0.49 US$/t profit after cost of rehandle |
| 5. | Tonnages are rounded to the nearest 1,000 kt; grades are rounded to two decimal places. |
| 6. | Rounding as required by reporting guidelines may result in apparent summation differences between tonnes, grade and contained metal content. |
| 7. | Tonnage and grade measurements are in metric units; contained gold and silver are in troy ounces |
| 8. | The life of mine strip ratio is 1.47 |
Table 15.23: Full Underground Case Case - Mineral Reserves (Carlos Guzman, CChM, October 2011)
| Option | Full Underground |
| Oxide Ore | MacNeill Ore | Sulphide Ore | Contained Metal (millions) |
| Mt | Au g/t | Ag g/t | Mt | Au g/t | Cu % | Ag g/t | Mt | Au g/t | Cu % | Ag g/t | Au oz | Cu t | Ag oz |
| Proven | 57 | 0,43 | 1,69 | 7 | 0,47 | 0,11 | 0,82 | 158 | 0,72 | 0,31 | 1,22 | 4,5 | 0,5 | 9,5 |
| Probable | 55 | 0,34 | 1,44 | 67 | 0,56 | 0,11 | 1,16 | 243 | 0,67 | 0,29 | 1,30 | 7,0 | 0,7 | 15,1 |
| Total | 112 | 0,39 | 1,57 | 74 | 0,55 | 0,11 | 1,12 | 400 | 0,69 | 0,30 | 1,27 | 11,6 | 1,2 | 24,6 |
Underground Reserves Notes:
| 1. | Mineral reserves for the block cave in the underground mine were defined using the Laubscher dilution model, considering a 60 % Dilution Entry Point and a maximum ore column height of 500 m. The grade of the waste and inferred material was assumed as zero. Only sulphides material was considered as economical. The economic parameters used for the determination of reserves were a gold price of 1,150 US$/oz, a silver price of 20 US$/oz and a copper price of 2.5 US$/oz, an average mining cost of 7.0 US$/t. Processing and treatment costs used were 7.04 US$/t and 6 US$/oz of gold and 0.4 US$/oz of silver. Royalties of 3.08 % and 5 % were also applied. Silver metallurgical recovery for sulphides was 50 %. Copper and gold metallurgical recovery was a function of the head grade, defined as: |
Project No.: C-580 January, 2012 | Page 219 - 378 | |
| % Cu Head Grade | Copper Recovery | Gold Recovery |
| 0.0% to 0.05% | 0 | 0 |
| 0.05% to 0.10% | 38% | 30% |
| 0.10% to 0.15% | 68% | 45% |
| 0.15% to 0.20% | 81% | 58% |
| 0.20% to 0.25% | 87% | 65% |
| 0.25% to 0.30% | 89% | 69% |
| >0.30% | >90% to 93% max | 72% |
| 2. | Recoveries are based on a targeted 25 % copper concentrate grade |
| 3. | Dilution material considering waste and inferred resources was included as probable reserves |
| 4. | Tonnages are rounded to the nearest 1,000 kt; grades are rounded to two decimal places. |
| 5. | Rounding as required by reporting guidelines may result in apparent summation differences between tonnes, grade and contained metal content. |
| 6. | Tonnage and grade measurements are in metric units; contained gold and silver are in troy ounces |
Project No.: C-580 January, 2012 | Page 220 - 378 | |
| 16.1 | Operating Parameters and Criteria |
The mine is scheduled to work 360 d/yr. Each day will consist of two 12 hour shifts and one meal break per shift. The mining operations will include; drilling, blasting, loading and hauling of ore and waste; crushing, conveying and spreading of waste, grade control and equipment maintenance.
The Super Pit and Hybrid open pit operations consider 15 m benches, 40 m haul roads at a maximum gradient of 10 %, a mobile equipment fleet of electric rope shovels, diesel powered trucks, drills and auxiliary equipment. Gyratory crushers, conveyors and mobile spreaders will be used to crush, convey and place the waste.
The underground mine considers owner’s load, haul, dumpers (LHD´s), haul trucks, drills and auxiliary equipment, as well as underground crushing and conveying systems. In each of the options analysed the heap leach open pit operations use an owner´s mining and hauling fleet as detailed in Section 16.7.
The selected mining equipment is able to develop the required productivity and achieve the annual total material movement at accepted levels of availability.
In all cases, the pit designs have been based on normal open pit design parameters, for the environment in Chile. The only variation in the designs occurs when In-pit crushing and conveying (IPCC) installations are located inside of the pits. This only occurs in the Super Pit option, and required the incorporation of an inclined conveyor ramp to carry the crushed waste to the surface. An alternative would be to develop a tunnel to convey the material to surface.
| 16.3 | Underground Mine Design |
A typical mine layout has been assumed for the proposed block caving operation. A detailed design of the underground mine for the Hybrid option was developed. The main infrastructure considered includes:
| ● | Ventilation raises and shafts |
Figure 16.1 and Figure 16.2 illustrate the general layout of the underground mine design of the Hybrid and Full Underground options, respectively.
Project No.: C-580 January, 2012 | Page 221 - 378 | |
Figure 16.1: Hybrid option – Underground Mine Design
Figure 16.2: Full Underground Option – Mine Design
For the production level, a typical draw pattern was adopted. This has an area of 195 m2 per draw-point, with 26 m between production drifts and 13 m between draw bell lines, as shown in Figure 16.3:
Project No.: C-580 January, 2012 | Page 222 - 378 | |
Figure 16.3: Typical Layout of the Production Level
The adopted general concept for the mine considers the following issues:
| ● | Production level 20 m below the undercut level. At this level, LHD units would transport the ore to ore passes located within the footprint. |
| ● | Secondary haulage level located 60 m below the production level. At this level trucks would transport the ore to the primary gyratory crusher. |
| ● | Main haulage level located at the elevation of the discharge of the crusher, 60 m below the secondary haulage (start of main conveyor belt to the plant) |
Project No.: C-580 January, 2012 | Page 223 - 378 | |
Figure 16.4 to Figure 16.7 illustrate the arrangement of the different levels that constitute the underground mine: Undercut, ventilation, haulage and conveyor levels.
Figure 16.4: Typical Layout of the Undercut Level
Project No.: C-580 January, 2012 | Page 224 - 378 | |
Figure 16.5: Typical Layout of the Ventilation Level
Project No.: C-580 January, 2012 | Page 225 - 378 | |
Figure 16.6: Typical Layout of the Haulage Level
Project No.: C-580 January, 2012 | Page 226 - 378 | |
Figure 16.7: Typical Layout of the Conveyor Level
A second mining concept considers the following issues:
| ● | Production level 20 m below the undercut level. At this level, LHD units will transport the ore to the primary crushers located within the footprint. A jaw crusher is considered for this concept. |
| ● | Main haulage level located at the elevation of the discharge of the crusher, to connect by intermediate conveyor to the main conveyor belt to the plant. |
This concept has been applied in UCL 3190 of the Hybrid option and UCL 3655 and UCL 3190 of the Full Underground option.
Project No.: C-580 January, 2012 | Page 227 - 378 | |
| 16.4 | Mine Production Schedules |
| 16.4.1 | Total Mineral Reserves |
Mine schedules for each of the mining options were produced based on the pit and underground mine designs and the contained reserves. Sulphide ore will be treated by flotation and oxide and MacNeill ore by heap leaching.
In general, the highest reserve and metal content are contained in the Super Pit. In the Hybrid option, the higher metal grades in the underground portion are insufficient to compensate for the loss of contained reserve tonnage. The Hybrid and Full Underground options have 18 % and 41 % less gold equivalent respectively.
| 16.4.2 | Mine Production Schedules |
Table 16.1 summarizes the life of mine, ore feed rate and mine movement rate associated for each of the developed options.
Table 16.1: Mine Schedule Summary
| Option | Mine Schedule |
| LOM | Oxide Process | MacNeill Process | Open Pit Feed | UG Feed | Stockpile Feed | Max. Open Pit Mvment kt/d | Avg. Open Pit Mvment kt/d |
| years | kt/d | kt/d | kt/d | kt/d | kt/d |
| Super Pit | 19 | 72 | 33 | 150 | | | 909 | 655 |
| Hybrid | 23 | 72 | 33 | 95 | 80 | 15 | 500 | 380 |
| Full UG | 35 | 72 | 33 | | 90 | | 99 | 79 |
For the Super Pit and Hybrid options, the oxide ore is mined as a result of sulphide ore requirement during the initial five years of mine life. An oxide feed rate of 26 Mt per year has been calculated as the optimum based on the oxide crushing plant capacity for the crush size required, the leach pad area, and the need to achieve satisfactory leaching characteristics; balanced against minimizing stockpiling and re-handle during development of the underlying sulphide reserves. Once oxide reserves are exhausted, leachable MacNeill ore, produced as part of the overall mining operation, is crushed and leached at a rate of 12 Mt per year. The throughput for MacNeill material is less than that for oxide as the rock is considered as being more competent than the oxide.
The total rock movement (ore and waste) for the open pit options is as follows
| ● | Super Pit option: | Average 655,000 t/d (max 909,000 t/d) with 19 years Life of |
| | Mine (LoM) | |
| | | |
| ● | Hybrid option: | Average 380,000 t/d (max 550,000 t/d) with 11 years LoM. |
The pre-stripping schedule for the open pit considers fill material requirements for construction of the main installations, corresponding to crusher platforms, starter platform for the heap leach pad, as well as ore and waste conveyor corridors amongst others.
Project No.: C-580 January, 2012 | Page 228 - 378 | |
The Super Pit option is the preferred option to be developed to Feasibility level, as such particular attention should be made to the Super Pit values and parameters used throughout this section.
Table 16.2 and Table 16.3 summarize the total construction tonnage required for the Super Pit and Hybrid options.
Table 16.2: Waste Material Requirements for Construction – Super Pit Option
| Requirement for construction | Volume (m3) | Tonnage (t @ 2.0 t/m3) |
| Truck Dump Pocket / Primary Crushing (Oxide) | 14,300 | 28,600 |
| Primary Crushing (Sulphide Ore) | 17,990 | 35,980 |
| Main Conveyor Corridor (Ore) | 2,597,100 | 5,194,200 |
| Main Conveyor Corridor (Waste) | 24,260,402 | 48,520,804 |
| Heap Leach First platform | 8,465,810 | 16,931,620 |
| Heap Leach basal improvement | 634,310 | 1,268,620 |
| Total | 35,989,912 | 71,979,824 |
Table 16.3: Waste Material Requirements for Construction – Hybrid Option
| Requirement for construction | Volume (m3) | Tonnage (t @ 2.0 t/m3) |
| Truck Dump Pocket / Primary Crushing (Oxide) | 14,300 | 28,600 |
| Primary Crushing (Sulphide Ore) | 358,970 | 717,940 |
| Crushing (Waste) | 0 | 0 |
| Main Conveyor Corridor (Ore) | 15,202,710 | 30,405,420 |
| Main Conveyor Corridor (Waste) | 11,731,050 | 23,462,100 |
| Heap Leach First platform | 8,465,810 | 16,931,620 |
| Heap Leach basal improvement | 634,310 | 1,268,620 |
| Total | 36,407,150 | 72,814,300 |
The underground mine schedules were estimated by NCL using a scheduling tool (Block Cave) without detailed engineering analysis of the mining sequence and geotechnical restrictions. The schedules take into account the extraction rates and ensure that the new area incorporated each year is, in general, within the range of 40,000 m2 per annum per face.
The underground mining rate has been defined by reference to existing operations of a similar size in terms of footprint and ore column heights. The production rate is 80 ktpd of ore per day based on having two production faces in parallel at 40 ktpd each. This is similar to the size of faces at Andina III Panel, Teniente Esmeralda, Teniente 4 and others.
Project No.: C-580 January, 2012 | Page 229 - 378 | |
The Hybrid mine schedule indicates a gap in production in the years between completion of the open pit and start of the underground mine. This is due to the limitations of the overlap between both operations and the ramp up period of the underground mine. This gap will be filled by reclaiming low grade ore from the stockpile produced during open pit operation.
Figure 16.8 and Figure 16.9 show the open pit mining schedule for the Super Pit and the Hybrid options respectively.
Figure 16.8: Super Pit Option – Mine Schedule
Figure 16.9: Hybrid Option – Open Pit Mine Schedule
The underground contribution and the total mining schedule for the Hybrid and Full Underground options are shown in Figure 16.10 and Figure 16.11 respectively:
Project No.: C-580 January, 2012 | Page 230 - 378 | |
Figure 16.10: Hybrid Option – Open Pit and Underground Mine Contribution
Figure 16.11: Full Underground Option – Mine Schedule
Annual push back, or phase, development for the Full Open Pit and the Hybrid options are presented in Figure 16.12 and Figure 16.13.
Project No.: C-580 January, 2012 | Page 231 - 378 | |
Figure 16.12: Super Pit Option – Total Material by Mining Phase
Figure 16.13: Hybrid Option – Total Material by Mining Phase – Open Pit
The Super Pit development requires 6 to 7 phases working simultaneously. The open pit in the Hybrid case has a maximum of 5 phases working per year.
Figure 16.14 and Figure 16.15 illustrate the required vertical development for each plan.
Project No.: C-580 January, 2012 | Page 232 - 378 | |
Figure 16.14: Super Pit Option – Benches per Year
Figure 16.15: Hybrid Option – Benches per Year – Open Pit
The maximum vertical development is achieved in the preproduction period. However, the tonnage contribution from the initial benches is minimal, and the numbers of benches mined per year is regarded as practically achievable.
Project No.: C-580 January, 2012 | Page 233 - 378 | |
The heap leach stand-alone open pit development requires 2 to 3 phases working simultaneously. Annual phase development is presented in Figure 16.16. The required vertical development for that plan is presented in Figure 16.17.
Figure 16.16: Full Underground Option – Total Material by Mining Phase – Heap Leach Open Pit
Figure 16.17: Full Underground Option – Benches per Year – Heap Leach Open Pit
| 16.5 | Waste Mining Strategy – Open Pits |
Due to the high waste material movement requirements for the project, the potential of using in-pit crushing and conveying (IPCC) to remove as much of the waste as possible was analysed. In addition to reducing the waste mining costs, it was clear that an opportunity existed to create a waste stockpile to the north of the pit which would allow the tailing storage facility (TSF) dam wall to be constructed with the IPCC system instead of
Project No.: C-580 January, 2012 | Page 234 - 378 | |
conventional truck dump construction. A compacted dam wall face was designed to generate the required retaining wall stability and level of impermeability, but the use of bulk fill using the IPCC system removed the requirement for an engineered self-supporting tailings retaining wall structure.
| 16.5.1 | Equipment Selection Criteria – IPCC |
The equipment selected for waste crushing, conveying and spreading was supplied by Sandvik Mining and Construction (SMC), who were contracted to develop the IPCC systems and procedures to ensure that a practical result was obtained.
The IPCC equipment selected is summarized in Table 16.4.
Table 16.4: IPCC Equipment for Super Pit and Hybrid Pit
| Equipment | Characteristics | Machine Type |
| Gyratory Crushers | 10,500 tph @100MPa | Sandvik CG880 65x119in |
| Overland Pit Conveyor | 21,000 tph; 2400 mm wide | Sandvik ST 4500 |
| Track Shiftable Conveyor | 21,000 tph; 2400 mm wide | Sandvik ST 2500 |
| Spreaders | 21,000 tph | Sandvik SP2000 50/50 |
The crusher throughput is a critical aspect of the IPCC system performance. Sandvik provided the following specifications for the system to ensure the requisite long term average throughput of 10,500 tph was achievable.
| ● | No more than 2 % of material over 150 Mpa rock strength |
| ● | Rock fragmentation typical for copper mine waste blasting; max. fragment feed size 1200 mm. |
| ● | Open Side Setting (OSS) at 280 mm to produce maximum fragment sizing +/- 500 mm |
| ● | Conveyor widths of 2,400 mm to handle the maximum fragment size |
The Super Pit and Hybrid open pit options were those evaluated for the IPCC solution and the main characteristics of each option are as follows:
The Super Pit option considers the use of two systems as described below. Each system comprises of two gyratory crushers feeding a single conveyor and spreader.
| ● | Semi-fixed ex-pit crushing and conveying (EPCC) with two crushing stations, each containing two gyratory crushers installed as fixed units, delivering product to two waste stockpile locations (the North and West Stockpiles). Progressive relocation of the crushing stations into the pit to a fixed crushing platform (IPCC) as optimization of the mining schedule dictated. |
Project No.: C-580 January, 2012 | Page 235 - 378 | |
| ● | Development of the Tailing Storage Facility (TSF) dam using the North Stockpile crushing and conveying system and with an engineered dam face design developed by Knight Pièsold. |
| ● | Throughput capacities of 10,500 tph for each gyratory crusher and 21,000 tph for each main conveyors and spreader system for a total operational capacity of 42,000 tph or +/-260 Mtpa for two systems with 4 crushers. |
Figure 16.18 and Figure 16.19 show the layout of the resulting waste stockpiles and IPCC infrastructure at the end of construction (end of Year -1) and the end of the mine life respectively for the Super Pit.
Figure 16.18: Super Pit Option – General Layout – end of Year -1
Project No.: C-580 January, 2012 | Page 236 - 378 | |
Figure 16.19: Super Pit Option – General Layout – end of Year 17
| 16.5.1.2 | Hybrid Pit Option |
The Hybrid option considers a single system consisting of two crushers, a single conveyor and a single spreader.
| ● | Ex-pit crushing station (with two gyratory crushers) and conveying to one waste stockpile (the West Waste Stockpile) with no relocation. |
| ● | System capacity of 10,500 tph (gyratory crushers) and 21,000 tph (conveyors and spreaders) for a total operational capacity of 21,000 tph or +/-130 Mtpa. |
For the Hybrid Pit, Figure 16.20 and Figure 16.21 show the comparative dump and EPCC infrastructure at the end of construction (Year -1) and the end of the open pit mining phase respectively.
Project No.: C-580 January, 2012 | Page 237 - 378 | |
Figure 16.20: Hybrid Option – General Layout – end of Year -1
Figure 16.21: Hybrid Option – General Layout – end of Year 9
Project No.: C-580 January, 2012 | Page 238 - 378 | |
| 16.6 | Operating Time Definition |
The work schedule, typical for high altiude operations in Chile, assumes production will operate 24 hours per day, 7 days per week, 365 days per year, and a total of 120 hours (5 days) each year will be lost due to adverse weather conditions. All continuous operations personnel will work a 1-week-in / 1-week-out rotation. Operations and mining personnel will work two 12 hour shifts.
Figure 16.22 summarizes the definitions used for equipment time allocation and calculation of the main operational indices.
Figure 16.22: Operating time Definition
The categories used in the time model are defined as follows
| | Calendar Time: | The amount of hours in a calendar year. At 24 hours per day and 365 operating days per year, the total calendar hours per year are 8,760 hours. |
| | Schedule Hours: | Calendar hours less annual non-scheduled work hours. |
| | Available Hours: | Schedule Hours less the amount of downtime for the piece of equipment. |
| | Downtime: | When the unit is not mechanically operable. This includes all planned and unplanned maintenance. |
| | Availability: | The measure of downtime; it is expressed as Available Hours divided by Calendar Time. |
| | Gross Operating | Available Hours less Standby. The effective operating hours (engine hours), which are used for costing purposes. |
| Standby: | When the unit is mechanically operable but is not manned or used (e.g., schedule loss, safety meetings, meals, breaks, blasting, shift change, weather outages, power outages, etc.). |
Project No.: C-580 January, 2012 | Page 239 - 378 | |
| | Net Operating | Gross Operating Hours less Delays. The net Operating Hours: These hours are used for determining fleet size requirements. |
| | Delays: | When the unit is operable and manned, but is not involved in production (i.e., fuelling, positioning, daily service, crusher down, drill and loader moves, shovel, walking, face preparation, highwall scaling, personal breaks, delays for blasts, operator changes and waiting on shovel). |
Table 16.5 provides an example of the time calculation for the major units of equipment based on the experience of NCL and that of similar operations to Caspiche.
Project No.: C-580 January, 2012 | Page 240 - 378 | |
Table 16.5: Time Usage Model Example – Mobile Equipment
| CASPICHE OPERATING HOURS | Rope Shovel | FEL | Truck | Electric Drill |
| Availability | | | | | |
| Calendar Hours | hours | 8,760 | 8,760 | 8,760 | 8,760 |
| Mtce Scheduled non-work time | hours | 0 | 0 | 0 | 0 |
| Snow Losses | hours | 120 | 120 | 120 | 120 |
| Other losses | hours | 0 | 0 | 0 | 0 |
| Industrial losses | hours | 0 | 0 | 0 | 0 |
| Scheduled Hours | hours | 8,640 | 8,640 | 8,640 | 8,640 |
| Daily Service | hours | 183 | 183 | 183 | 183 |
| Weekly Maintenance | hours | 312 | 312 | 312 | 312 |
| Other Maintenance Shutdown | hours | 212 | 212 | 148 | 198 |
| Scheduled Maintenance | hours | 707 | 707 | 643 | 693 |
| Scheduled Availability | % | 91.8 | 91.8 | 92.6 | 92.0 |
| Breakdowns as % of Scheduled | % | 3.7 | 6.6 | 6.8 | 6.0 |
| Breakdowns | hours | 321 | 572 | 590 | 518 |
| BUDGET Overall Availability | % | 88.10 | 85.20 | 85.73 | 85.98 |
| Available Hours | hours | 7,612 | 7,361 | 7,407 | 7,429 |
| Utilization | | | | | |
| Shift duration | hours | 12 | 12 | 12 | 12 |
| Shift duration | mins | 720 | 720 | 720 | 720 |
| No of shifts/day | | 2 | 2 | 2 | 2 |
| Shift startup + meeting | mins/shift | 15 | 15 | 15 | 15 |
| Travel to /from pit | mins/shift | 5 | 5 | 5 | 5 |
| Travel from pit | mins/shift | 5 | 5 | 0 | 0 |
| Truck operator changeout | mins/shift | 1 | 1 | 1 | 1 |
| Equipment Inspection | minutes | 5 | 5 | 5 | 5 |
| Meal break | minutes | 60 | 60 | 60 | 60 |
| Blasting delays | minutes | 10 | 15 | 10 | 10 |
| Fuel/Lubrication | minutes | 5 | 20 | 25 | 5 |
| Manoeuvre | % of shift | 4.20 | 0.00 | 0.00 | 8.30 |
| Manoeuvre | minutes | 30 | 0 | 0 | 60 |
| Fatigue + Safety Meeting Delays | minutes | 5 | 5 | 5 | 5 |
| Not required | minutes | 0 | 25 | 0 | 16 |
| Effective Operation/Shift | minutes | 579 | 564 | 599 | 518 |
| Equipment Utilization | (%) | 80.4 | 78.3 | 83.2 | 72.0 |
| Effective Operating Hours | | Rope Shovel | FEL | Truck | Electric Drill |
| Annual Hours | hours | 8,640 | 8,640 | 8,640 | 8,640 |
| Equipment Availability | (%) | 88.1 | 85.2 | 85.7 | 86.0 |
| Possible Mine Operating Hours | (%) | 100,0 | 100,0 | 100,0 | 100,0 |
| Equipment Utilization | (%) | 80.4 | 78.3 | 83.2 | 72.0 |
| Effective Operating Hours | hours | 6,120 | 5,764 | 6,163 | 5,349 |
| SMU (Engine) Hrs / year | | 6,502 | 6,288 | 6,481 | 6,500 |
Project No.: C-580 January, 2012 | Page 241 - 378 | |
Table 16.6 shows an equivalent Time Usage Model (TUM) developed for the North Dump IPCC System. In particular, the anticipated relocation losses for the IPCC system during Year 2 are included, and this was then taken into account when the overall availability was calculated (refer to the rows under CALENDAR HOURS).
Table 16.6: Time Usage Model Example – IPCC System Equipment
Project No.: C-580 January, 2012 | Page 242 - 378 | |
In addition, where there were multiple components (crusher, multiple conveyors and spreader), then the total downtime was adjusted to allow for the interrelationship between the components. For example, it was not always possible to carry out opportunity maintenance on conveyors or a spreader when unscheduled downtime occurred on a crusher. So, whilst the downtimes are not cumulative, there is some increase in downtime over the individual component downtimes. This is basic binomial probability theory, but in order to project accurately it would be necessary to know the Mean Time Between Failures (MTBF) and Mean Time To Repair (MTTR) for each component so that a mathematical simulation could be made. However, for this level of study, existing mine operating availability data was used and a normal maintenance strategy incorporated so as to determine an acceptable factor.
For a simple system with two crushers (with separate sacrificial belts), one overland conveyor, two Track Shiftable Conveyors (TSC’s) and one spreader, a 1.25 multiplier on downtime over the highest component downtime (hours) was deemed acceptable, and this is shown on the “Breakdowns” line for the System availability below. For this particular system and year, it can be seen that the losses due to relocations were significant. Conservative estimates of the relocation downtimes were used as recommended by SMC, and these could be improved with operating experience.
Table 16.7 shows the relocation losses used in the study for the conveyor systems to the waste dumps.
Table 16.7: Relocation Losses for the IPCC systems
| Basis of System Relocation Downtimes |
| ITEM | Type | Hours | Description |
| Track Shiftable Conveyors | 4” Deg Radial Shift of a Track Shiftable Conveyor | 72 | Calculation based on current best practice, D11 operating speed and Conveyor length. |
1st 100 m Extension using Casette | 72 | For every 200 m extension an allowance of 1 week (168 hours) is allowed for. |
2nd 100 m Extension Splicing and re-using Casette | 96 |
| Spreader and Track Shiftable System Reloction | 1,176 | 100 m Conveyor and Spreader relocated to new starting position. |
| Crushers | Gyratory Crusher Relocation | 1,176 | 7 weeks Allowance using 660 t crane and trailer |
| Hybrid Crusher Relocation | 672 | 4 Weeks Allowance made for Crusher Relocation using 660 t Crane and trailer |
Note that relocation of the entire spreading system (from one level of a stockpile to another) is required from time to time. These longer downtimes were scheduled into the production plan. The crushers were also relocated during the life of the project, and some 7 weeks was allowed for these relocations, assuming that all civil works for the new installations were planned, scheduled and completed ahead of the relocation. Accordingly, downtime was estimated as the time to dismantle and relocate the major equipment from the crusher station(s). Only one crusher was relocated in any calendar year.
Project No.: C-580 January, 2012 | Page 243 - 378 | |
Table 16.8 to Table 16.12 illustrate the open pit and underground mobile equipment fleet requirements by year through the mine life. These tables represent the equipment necessary to perform the following duties:
| ● | Mine and transport oxide, MacNeill and sulphide ore to the appropriate primary crushers or stockpiles. |
| ● | Mine and transport waste material from the pit to the appropriate waste crusher(s) and subsequent conveying to the appropriate waste stockpile using conveyors and spreaders. |
| ● | Maintain all the mine work areas, in-pit haul roads, and external haul roads; also maintain the waste stockpiles. |
| ● | Ventilate and maintain the underground areas. |
| ● | Re-handle the oxide and MacNeill ores (load, transport and auxiliary equipment) from the stockpile to the primary crusher. |
Project No.: C-580 January, 2012 | Page 244 - 378 | |
Table 16.8: Super Pit Option – Main Mobile Equipment Requirements
| Main Equipment | Y-03 | Y-02 | Y-01 | Y01 | Y02 | Y03 | Y04 | Y05 | Y06 | Y07 | Y08 | Y09 | Y10 | Y11 | Y12 | Y13 | Y14 | Y15 | Y16 | Y17 |
| Open Pit | | | | | | | | | | | | | | | | | | | | |
| FEL L-2350 | 1 | 1 | 2 | 3 | 4 | 4 | 3 | 3 | 4 | 4 | 3 | 4 | 3 | 4 | 3 | 2 | 1 | 1 | 1 | 1 |
| Electric Rope Shovel 495HR | 2 | 4 | 5 | 8 | 9 | 9 | 9 | 9 | 9 | 9 | 9 | 9 | 9 | 9 | 8 | 5 | 3 | 2 | 2 | 2 |
| Haul Truck – Liebherr T282 | 18 | 25 | 30 | 52 | 64 | 60 | 63 | 64 | 61 | 64 | 61 | 57 | 64 | 60 | 62 | 48 | 36 | 32 | 33 | 35 |
| Electric Drill – 310 mm | 3 | 4 | 5 | 10 | 14 | 13 | 13 | 13 | 14 | 14 | 15 | 15 | 15 | 15 | 12 | 8 | 6 | 5 | 4 | 3 |
| Diesel Drill – 250 mm | 1 | 2 | 2 | 3 | 3 | 4 | 4 | 4 | 4 | 4 | 4 | 4 | 4 | 4 | 4 | 3 | 2 | 2 | 2 | 1 |
| Support Drill | 1 | 1 | 2 | 2 | 2 | 2 | 2 | 2 | 2 | 2 | 2 | 2 | 2 | 2 | 2 | 1 | 2 | 1 | 1 | 2 |
| Bulldozer 1 Cat D10 | 3 | 4 | 5 | 6 | 7 | 7 | 6 | 6 | 7 | 7 | 6 | 7 | 7 | 6 | 5 | 3 | 2 | 2 | 2 | 2 |
| Bulldozer 2 Cat D11 | 3 | 3 | 4 | 4 | 5 | 5 | 4 | 4 | 5 | 5 | 4 | 5 | 4 | 5 | 4 | 4 | 3 | 3 | 3 | 3 |
| Wheeldozer 1Cat 834H | 2 | 3 | 4 | 6 | 7 | 7 | 6 | 6 | 7 | 7 | 6 | 7 | 6 | 7 | 6 | 4 | 2 | 2 | 2 | 2 |
| Wheeldozer 2 Cat 854H | 1 | 1 | 2 | 2 | 3 | 3 | 2 | 2 | 3 | 3 | 2 | 3 | 2 | 3 | 2 | 2 | 1 | 1 | 1 | 1 |
| Motorgrader 1 Cat 16M | 4 | 4 | 4 | 4 | 4 | 4 | 5 | 5 | 4 | 4 | 4 | 4 | 4 | 4 | 5 | 6 | 6 | 6 | 6 | 5 |
| Motorgrader 2 Cat 24M | 2 | 2 | 1 | 1 | 1 | 1 | 2 | 2 | 2 | 2 | 2 | 1 | 2 | 1 | 2 | 2 | 2 | 2 | 2 | 2 |
| Water Truck Cat 777F | 1 | 1 | 1 | 2 | 2 | 2 | 3 | 3 | 3 | 3 | 3 | 2 | 3 | 2 | 3 | 3 | 2 | 3 | 3 | 3 |
| Backhoe 5-8 yd3 | 1 | 1 | 1 | 1 | 1 | 1 | 1 | 1 | 1 | 1 | 1 | 1 | 1 | 1 | 1 | 1 | 1 | 1 | 1 | 1 |
| Fuel Truck 85 m3 | 1 | 1 | 1 | 1 | 1 | 1 | 1 | 1 | 1 | 1 | 1 | 1 | 1 | 1 | 1 | 1 | 1 | 1 | 1 | 1 |
| Lube Truck | 1 | 1 | 1 | 1 | 1 | 1 | 1 | 1 | 1 | 1 | 1 | 1 | 1 | 1 | 1 | 1 | 1 | 1 | 1 | 1 |
| Support Truck | 1 | 1 | 1 | 1 | 1 | 1 | 1 | 1 | 1 | 1 | 1 | 1 | 1 | 1 | 1 | 1 | 1 | 1 | 1 | 1 |
| Mobile Crane 200 t | 1 | 1 | 1 | 1 | 1 | 1 | 1 | 1 | 1 | 1 | 1 | 1 | 1 | 1 | 1 | 1 | 1 | 1 | 1 | 1 |
| Lowboy Truck 110 t | 1 | 1 | 1 | 1 | 1 | 1 | 1 | 1 | 1 | 1 | 1 | 1 | 1 | 1 | 1 | 1 | 1 | 1 | 1 | 1 |
| Tire Handler Cat 988H | 1 | 1 | 1 | 1 | 1 | 1 | 1 | 1 | 1 | 1 | 1 | 1 | 1 | 1 | 1 | 1 | 1 | 1 | 1 | 1 |
| Lighting Plant 4x1000 W | 8 | 12 | 16 | 26 | 32 | 32 | 31 | 31 | 33 | 33 | 33 | 34 | 33 | 34 | 29 | 19 | 14 | 11 | 10 | 9 |
Project No.: C-580 January, 2012 | Page 245 - 378 | |
Table 16.9: Hybrid Option – Main Mobile Equipment Requirements – Open Pit
| Main Equipment | Y-03 | Y-02 | Y-01 | Y01 | Y02 | Y03 | Y04 | Y05 | Y06 | Y07 | Y08 | Y09 | Y10 | Y11 | Y12 | Y13 | Y14 | Y15 | Y16 | Y17 | Y18 |
| Open Pit | | | | | | | | | | | | | | | | | | | | | |
| FEL 38 m3 | 1 | 1 | 2 | 2 | 2 | 2 | 2 | 2 | 2 | 2 | 2 | 1 | 2 | 2 | 2 | 1 | 1 | 1 | 1 | 1 | 1 |
| Electric Rope Shovel 56 m3 | 2 | 3 | 4 | 5 | 5 | 5 | 5 | 5 | 5 | 3 | 2 | 2 | 0 | 0 | 0 | 0 | 0 | 0 | 0 | 0 | 0 |
| Haul Truck 360 t | 17 | 19 | 28 | 30 | 34 | 35 | 27 | 35 | 37 | 37 | 26 | 21 | 9 | 7 | 6 | 4 | 3 | 2 | 2 | 2 | 1 |
| Electric Drill 250-311 mm | 3 | 3 | 4 | 6 | 6 | 7 | 7 | 7 | 7 | 5 | 3 | 3 | 0 | 0 | 0 | 0 | 0 | 0 | 0 | 0 | 0 |
| Diesel Drill 250-311 mm | 1 | 1 | 2 | 2 | 2 | 2 | 2 | 2 | 2 | 2 | 1 | 1 | 0 | 0 | 0 | 0 | 0 | 0 | 0 | 0 | 0 |
| Support Drill | 1 | 1 | 1 | 2 | 2 | 2 | 1 | 1 | 1 | 1 | 1 | 1 | 0 | 0 | 0 | 0 | 0 | 0 | 0 | 0 | 0 |
| Bulldozer 650 HP | 3 | 3 | 4 | 4 | 5 | 4 | 4 | 3 | 3 | 2 | 2 | 2 | 0 | 0 | 0 | 0 | 0 | 0 | 0 | 0 | 0 |
| Bulldozer 850 HP | 3 | 3 | 3 | 4 | 4 | 4 | 4 | 4 | 4 | 3 | 3 | 3 | 1 | 1 | 1 | 1 | 1 | 1 | 1 | 1 | 1 |
| Wheeldozer 550 HP | 2 | 2 | 3 | 4 | 4 | 4 | 3 | 4 | 4 | 3 | 2 | 2 | 0 | 0 | 0 | 0 | 0 | 0 | 0 | 0 | 0 |
| Wheeldozer 900 HP | 1 | 1 | 1 | 2 | 2 | 2 | 2 | 2 | 2 | 1 | 1 | 1 | 1 | 1 | 1 | 1 | 1 | 1 | 1 | 1 | 1 |
| Motorgrader 300 HP | 4 | 3 | 4 | 4 | 4 | 4 | 3 | 4 | 4 | 4 | 4 | 2 | 2 | 1 | 1 | 1 | 1 | 1 | 1 | 1 | 1 |
| Motorgrader 530 HP | 2 | 2 | 2 | 2 | 2 | 2 | 2 | 2 | 2 | 2 | 2 | 2 | 0 | 0 | 0 | 0 | 0 | 0 | 0 | 0 | 0 |
| Water Truck 85 m3 | 2 | 1 | 2 | 1 | 1 | 1 | 1 | 1 | 2 | 2 | 2 | 1 | 1 | 1 | 1 | 1 | 1 | 1 | 1 | 1 | 1 |
| Backhoe 5-8 yd3 | 1 | 1 | 1 | 1 | 1 | 1 | 1 | 1 | 1 | 1 | 1 | 1 | 0 | 0 | 0 | 0 | 0 | 0 | 0 | 0 | 0 |
| Fuel Truck 85 m3 | 1 | 1 | 1 | 1 | 1 | 1 | 1 | 1 | 1 | 1 | 1 | 1 | 1 | 1 | 1 | 1 | 1 | 1 | 1 | 1 | 1 |
| Lube Truck | 1 | 1 | 1 | 1 | 1 | 1 | 1 | 1 | 1 | 1 | 1 | 1 | 1 | 1 | 1 | 1 | 1 | 1 | 1 | 1 | 1 |
| Support Truck | 1 | 1 | 1 | 1 | 1 | 1 | 1 | 1 | 1 | 1 | 1 | 1 | 1 | 1 | 1 | 1 | 1 | 1 | 1 | 1 | 1 |
| Mobile Crane 200 t | 1 | 1 | 1 | 1 | 1 | 1 | 1 | 1 | 1 | 1 | 1 | 1 | 0 | 0 | 0 | 0 | 0 | 0 | 0 | 0 | 0 |
| Lowboy Truck 110 t | 1 | 1 | 1 | 1 | 1 | 1 | 1 | 1 | 1 | 1 | 1 | 1 | 0 | 0 | 0 | 0 | 0 | 0 | 0 | 0 | 0 |
| Tire Handler | 1 | 1 | 1 | 1 | 1 | 1 | 1 | 1 | 1 | 1 | 1 | 1 | 1 | 1 | 1 | 1 | 1 | 1 | 1 | 1 | 1 |
| Lighting Plant 4x1000 W | 8 | 9 | 13 | 17 | 17 | 18 | 17 | 17 | 17 | 13 | 9 | 8 | 2 | 2 | 2 | 2 | 2 | 2 | 2 | 2 | 1 |
Project No.: C-580 January, 2012 | Page 246 - 378 | |
Table 16.10: Hybrid Option – Main Equipment Requirements – Underground Mine
| Main Equipment | Y09 | Y10 | Y11 | Y12 | Y13 | Y14 | Y15 | Y16 | Y17 | Y18 | Y19 | Y20 | Y21 |
| Underground Mine | | | | | | | | | | | | | |
| LHD 10 yd3 | 1 | 4 | 7 | 10 | 14 | 18 | 21 | 21 | 21 | 21 | 18 | 13 | 8 |
| Haul Truck 80 t | 1 | 3 | 5 | 8 | 11 | 14 | 16 | 16 | 16 | 16 | 13 | 10 | 6 |
| Secondary Reduction | 1 | 1 | 2 | 2 | 3 | 4 | 5 | 5 | 5 | 5 | 4 | 3 | 2 |
| Pick hammer | 9 | 20 | 30 | 42 | 52 | 57 | 57 | 56 | 53 | 46 | 33 | 25 | 15 |
| Explosives Loader | 2 | 2 | 2 | 2 | 2 | 2 | 2 | 2 | 2 | 2 | 2 | 2 | 2 |
| Services truck | 2 | 3 | 4 | 5 | 6 | 7 | 7 | 7 | 7 | 7 | 6 | 5 | 4 |
| Lifting Platform | 3 | 3 | 3 | 3 | 3 | 3 | 3 | 3 | 3 | 3 | 3 | 3 | 3 |
| Grader | 3 | 3 | 3 | 3 | 3 | 3 | 3 | 3 | 3 | 3 | 3 | 3 | 3 |
| Ambulance | 2 | 2 | 2 | 2 | 2 | 2 | 2 | 2 | 2 | 2 | 2 | 2 | 2 |
| Main Fans | 2 | 2 | 2 | 4 | 6 | 6 | 6 | 6 | 6 | 6 | 6 | 4 | 2 |
| Secondary Fans | 13 | 31 | 48 | 65 | 82 | 89 | 89 | 89 | 83 | 72 | 50 | 37 | 22 |
In this study, the underground mine development is considered as being executed under contract, thus company owned equipment is required only from the start of underground production in year nine of the operation.
Project No.: C-580 January, 2012 | Page 247 - 378 | |
Table 16.11: Full Underground Option – Main Equipment Requirements for the Open Pit
| Main Equipment | Y-01 | Y01 | Y02 | Y03 | Y04 | Y05 | Y06 | Y07 | Y08 | Y09 | Y10 | Y11 | Y12 |
| Open Pit | | | | | | | | | | | | | |
| FEL 19m3 | 1 | 1 | 1 | 1 | 1 | 1 | 1 | 1 | 1 | 1 | 1 | 1 | 1 |
| Hydraulic Shovel 29 m3 | 2 | 2 | 2 | 2 | 2 | 2 | 2 | 2 | 2 | 2 | 1 | 1 | 1 |
| Haul Truck 185 t | 14 | 13 | 12 | 13 | 16 | 12 | 15 | 16 | 15 | 12 | 9 | 10 | 9 |
| Diesel Drill 250-311 mm | 2 | 1 | 1 | 2 | 2 | 2 | 2 | 2 | 2 | 2 | 1 | 1 | 1 |
| Support Drill | 1 | 1 | 1 | 1 | 1 | 1 | 1 | 1 | 1 | 1 | 1 | 1 | 1 |
| Bulldozer 650 HP | 2 | 2 | 2 | 2 | 2 | 2 | 2 | 2 | 2 | 2 | 1 | 1 | 1 |
| Wheeldozer 550 HP | 2 | 2 | 2 | 2 | 2 | 2 | 2 | 2 | 2 | 2 | 1 | 1 | 1 |
| Motorgrader 300 HP | 2 | 2 | 2 | 2 | 2 | 2 | 2 | 2 | 2 | 2 | 2 | 2 | 2 |
| Water Truck 85 m3 | 1 | 1 | 1 | 1 | 1 | 1 | 1 | 1 | 1 | 1 | 1 | 1 | 1 |
| Backhoe 5-8 yd3 | 1 | 1 | 1 | 1 | 1 | 1 | 1 | 1 | 1 | 1 | 1 | 1 | 1 |
| Fuel Truck 85 m3 | 1 | 1 | 1 | 1 | 1 | 1 | 1 | 1 | 1 | 1 | 1 | 1 | 1 |
| Lube Truck | 1 | 1 | 1 | 1 | 1 | 1 | 1 | 1 | 1 | 1 | 1 | 1 | 1 |
| Support Truck | 1 | 1 | 1 | 1 | 1 | 1 | 1 | 1 | 1 | 1 | 1 | 1 | 1 |
| Mobile Crane 200 t | 1 | 1 | 1 | 1 | 1 | 1 | 1 | 1 | 1 | 1 | 1 | 1 | 1 |
| Lowboy Truck 110 t | 1 | 1 | 1 | 1 | 1 | 1 | 1 | 1 | 1 | 1 | 1 | 1 | 1 |
| Tire Handler | 1 | 1 | 1 | 1 | 1 | 1 | 1 | 1 | 1 | 1 | 1 | 1 | 1 |
| Lighting Plant 4x1000 W | 6 | 5 | 5 | 6 | 6 | 6 | 6 | 6 | 6 | 6 | 4 | 4 | 4 |
Project No.: C-580 January, 2012 | Page 248 - 378 | |
Table 16.12: Full Underground Option – Main Equipment Requirements for the Underground Mine
| Main Equipment | Y12 | Y13 | Y14 | Y15 | Y16 | Y17 | Y18 | Y19 | Y20 | Y21 | Y22 | Y23 | Y24 | Y25 | Y26 | Y27 | Y28 | Y29 | Y30 | Y31 | Y32 | Y33 |
| Underground Mine | | | | | | | | | | | | | | | | | | | | | | |
| LHD 10 yd3 | 2 | 7 | 11 | 16 | 23 | 26 | 28 | 30 | 34 | 30 | 24 | 24 | 24 | 25 | 24 | 18 | 16 | 16 | 15 | 15 | 15 | 6 |
| Haul Truck 80 t | 0 | 0 | 1 | 2 | 3 | 5 | 6 | 8 | 10 | 14 | 17 | 17 | 17 | 17 | 13 | 8 | 4 | 4 | 0 | 0 | 0 | 0 |
| Secondary Reduction | 1 | 2 | 3 | 4 | 5 | 6 | 6 | 6 | 7 | 7 | 5 | 5 | 5 | 6 | 6 | 5 | 4 | 4 | 3 | 3 | 3 | 2 |
| Pick hammer | 2 | 3 | 12 | 18 | 22 | 30 | 39 | 47 | 53 | 60 | 60 | 60 | 49 | 51 | 36 | 29 | 19 | 13 | 5 | 5 | 5 | 3 |
| Explosives Loader | 2 | 2 | 4 | 4 | 4 | 4 | 4 | 4 | 4 | 4 | 2 | 2 | 2 | 4 | 4 | 4 | 4 | 4 | 2 | 2 | 2 | 2 |
| Services truck | 2 | 3 | 5 | 6 | 8 | 9 | 9 | 10 | 11 | 11 | 8 | 8 | 8 | 10 | 9 | 7 | 7 | 7 | 4 | 4 | 4 | 3 |
| Lifting Platform | 3 | 3 | 6 | 6 | 6 | 6 | 6 | 6 | 6 | 6 | 3 | 3 | 3 | 6 | 6 | 6 | 6 | 6 | 3 | 3 | 3 | 3 |
| Grader | 2 | 2 | 5 | 5 | 5 | 5 | 5 | 5 | 5 | 5 | 3 | 3 | 3 | 6 | 6 | 6 | 6 | 6 | 3 | 3 | 3 | 3 |
| Ambulance | 2 | 2 | 4 | 4 | 4 | 4 | 4 | 4 | 4 | 4 | 2 | 2 | 2 | 4 | 4 | 4 | 4 | 4 | 2 | 2 | 2 | 2 |
| Main Fans | 2 | 2 | 2 | 4 | 4 | 4 | 4 | 6 | 6 | 6 | 6 | 6 | 6 | 6 | 6 | 4 | 4 | 4 | 2 | 2 | 2 | 2 |
| Secondary Fans | 17 | 33 | 57 | 73 | 78 | 86 | 96 | 104 | 110 | 89 | 63 | 63 | 51 | 61 | 54 | 48 | 42 | 37 | 29 | 29 | 24 | 10 |
Project No.: C-580 January, 2012 | Page 249 - 378 | |
| 16.7.1 | Open Pit Mobile Equipment |
The type and quantity of mining equipment to satisfy the mine production schedule requirements are presented in this section.
| 16.7.1.1 | Equipment Selection Criteria |
The equipment selected for the project was for a standard truck and shovel mining operation, using conventional drilling patterns and contractor, as well as regular equipment maintenance requirements.
Equipment selected for the mining operation is shown in Table 16.13.
Table 16.13: Mining Equipment for the Super Pit and Hybrid Cases
| Equipment | Characteristics | Machine Type |
| Drill | 250-311 mm | PV 351 Atlas Copco, Diesel and Electric |
| FEL | 38 m3 | LT2350 - LeTourneau |
| Rope Shovel | 56 m3 | 495 HR – Bucyrus |
| Haul Truck | 360 t | T282C – Liebherr |
| Bulldozer | 650 HP 850 HP | D10T – Caterpillar D11T - Caterpillar |
| Wheeldozer | 550 HP 900 HP | 834H – Caterpillar 854H - Caterpillar |
| Motorgrader | 300 HP 530 HP | 16M – Caterpillar 24 M - Caterpillar |
| Water Truck | 85 m3 | 777 F – Caterpillar |
The stand-alone heap leach pit equipment selection considered that the entire mine will be diesel operated. The equipment selected is summarized in Table 16.14.
Table 16.14: Equipment Selection for the Stand Alone Heap Leach
| Equipment | Characteristics | Machine Type |
Drill FEL Hydraulic Shovel Haul Truck Bulldozer Wheeldozer Motorgrader Water Truck | 10 5/8” to 12 ¼” 19 m3 29 m3 185 t 650 HP 550 HP 300 HP 85 m3 | DMM-3 Atlas Copco WA 1200-Komatsu PC 5500-Komatsu 730 E-Komatsu D10T-Caterpillar 834H-Caterpillar 16M-Caterpillar 777 F-Caterpillar |
Project No.: C-580 January, 2012 | Page 250- 378 | |
Supplier names and equipment types are provided for orientation purposes only.
| 16.7.1.2 | Production Requirements |
The major mine equipment was selected based on the production schedules described previously. Based on these schedules, 25 months of pre-stripping are required for the Super Pit and the Hybrid options; 17 years of production to extract the ore of the Super Pit, and 9 years of open pit operation, followed by rehandling operations from year 9 to year 18, for the Hybrid are required.
Work during the preproduction period will include preparing roads, bench openings and preproduction stripping. Total material mined during preproduction is 392 Mt and 375 Mt for the Super Pit and the Hybrid option respectively.
The heap leach open pit will operate for 12 years; with 8 months of pre-stripping required, mainly to fulfil construction requirements and avoid higher material movement for MacNeill extraction. Table 16.15 shows the amount of ore and waste that will be handled by the open pit mining equipment.
Table 16.15: Open Pit Mine Production Summaries
| Option | Mine Production | Plant |
| Oxide Ore To Crusher | Oxide to Stockpile | MacNeill Ore To Crusher | MacNeill Ore to Stockpile | Sulphide Ore to Crusher | Sulphide Ore to Stockpile | Waste for Construction | Waste to Waste Stockpile | Total Rock From Mine | Oxide Ore Re-handle | MacNeill Ore Re-handle | Sulphide Ore Re-handle |
| (‘000 t) | (‘000 t) | (‘000 t) | (‘000 t) | (‘000 t) | (‘000 t) | (‘000 t) | (‘000 t) | (‘000 t) | (‘000 t) | (‘000 t) | (‘000 t) |
| Super Pit | 90,178 | 33,732 | 54,287 | 23,976 | 885,164 | 4,000 | 71,980 | 3,322,942 | 4,486,259 | 33,732 | 23,976 | 4,000 |
| Hybrid | 99,684 | 24,226 | 39,953 | 29,598 | 296,700 | 120,533 | 72,814 | 822,705 | 1,506,214 | 24,226 | 29,598 | 120,533 |
| Heap leach | 101,817 | 9,834 | 69,333 | 4,357 | 242,439 | | 18,229 | 132,562 | 427,780 | 9,834 | 4,357 | |
| 16.7.1.3 | Main Rock Characteristics |
Table 16.16 illustrates the material characteristics used for equipment productivity calculations. The density values are based on the resource block model values for the various materials as tabulated from the mine production schedule.
Since high compaction is needed in the construction of the platform for the plant, a higher loose density has been considered. After considering swell factors, 2.0 t/m3 has been used to convert the required volume of waste material to tonnage.
Table 16.16: Material Characteristics
| | Oxide | MacNeill | Sulphide | Waste |
Bulk Density (t/m3) | 2.35 | 2.43 | 2.44 | 2.40 |
| Material Handling Swell factor (%) | 30 | 30 | 30 | 30 |
| Moisture Content (%) | 2 | 2 | 2 | 2 |
Project No.: C-580 January, 2012 | Page 251 - 378 | |
The material handling swell factor (in situ to loose tonnage) was estimated at 30 %.
NCL assumed a moisture content of 2 %. The density of wet loose material was used to calculate truck allowable payload limits.
All equipment production is reported in dry metric tonnes. This corresponds to the units of dry measurement contained in the computer model, the stated reserves and the mine material movements as summarized in Table 16.15.
| 16.7.1.4 | Mobile Equipment Performance and Fleet Requirements |
Data from vendors and other operating mines indicate that mechanical availability of the equipment decreases with hours worked, as shown in Table 16.17. An average mechanical availability based on the life of the fleet was assigned to replicate the availability for a fleet containing units of mixed ages.
Table 16.17 Equipment Life and Mechanical Availability
| Equipment Life | Incremental Hours (000) |
| 0 - 5 | 5 - 10 | 10 - 15 | 15 - 20 | 20 - 25 | 25 - 30 | 30 - 35 | 35 - 40 | 40 - 45 |
| Major Equipment | Eq. Life (Hrs) | Mechanical Availability (%) |
| Diesel Drill PV 351D 12-1/4" | 75,000 | 87 | 85 | 83 | 81 | 81 | 81 | 81 | 81 | 81 |
| Electric Drill PV 351E 12-1/4” | 75,000 | 89 | 87 | 85 | 83 | 81 | 81 | 81 | 81 | 81 |
FEL 38 m3 | 50,000 | 92 | 90 | 88 | 86 | 84 | 84 | 84 | 84 | 84 |
FEL 19 m3 | 42,000 | 92 | 90 | 88 | 86 | 84 | 84 | 80 | 80 | 80 |
Hydraulic Shovel 22 m3 | 75,000 | 88 | 86 | 84 | 82 | 80 | 80 | 80 | 80 | 82 |
Rope Shovel 56 m3 | 100,000 | 90 | 89 | 88 | 87 | 86 | 85 | 84 | 84 | 84 |
| Haul Truck 360 t | 70,000 | 89 | 88 | 87 | 86 | 85 | 85 | 85 | 85 | 85 |
| Haul Truck 185 t | 70,000 | 89 | 88 | 87 | 86 | 85 | 85 | 85 | 85 | 85 |
| Bulldozer | 60,000 | 88 | 87 | 86 | 85 | 84 | 84 | 84 | 84 | 84 |
| Wheeldozer | 50,000 | 88 | 87 | 86 | 85 | 84 | 86 | 86 | 86 | 86 |
| Motorgrader | 60,000 | 87 | 86 | 85 | 84 | 84 | 84 | 84 | 84 | 84 |
Water Truck 85 m3 | 70,000 | 88 | 87 | 86 | 85 | 84 | 84 | 84 | 84 | 84 |
The performance of all drilling and loading units was calculated on the basis of operational indices and detailed estimates of the times involved in each activity. Truck performance estimates used variable distances per period and the type of material being hauled.
Equipment hours and number of units in the fleet were calculated using the estimated performance and the materials movement requirement per period.
Equipment required to haul ore from crusher to the pads was also included in calculations and then distributed to the process capital cost area.
Project No.: C-580 January, 2012 | 252 | |
Drilling
The drilling equipment for ore and waste will consist of diesel units capable of drilling 12-1/4 in diameter holes.
To date no specific drilling and blasting study has been conducted for the Caspiche project; assumptions were made based on general characteristics of the rock at Caspiche and experience at similar types of operations. Three different rock groups were defined using the UCS characteristics as main parameter. Penetration rates were calculated using the Workman Method, a recognized formula designed in 1996 to estimate the penetration rates in a wide range of rock:
Where:
V = Penetration rate
RF = Rock factor, depends on SC
SC = UCS = Uniaxial Compression Strength (MPa)
PD = Drilling equipment pulldown = 145.7 kg/mm
RPM = Drilling equipment revolutions per minute = 100
Table 16.18 presents the typical drilling parameters used for describing the drilling and blasting operations.
Table 16.18: Drilling Parameters
| Pattern code | UCS (MPa) | 30-55 | 55-90 | 90-120 | >120 |
| Material | | Ore | Waste | Ore | Waste | Ore | Waste | Ore | Waste |
| Drill diameter | mm | 311.2 | 311.2 | 311.2 | 311.2 | 311.2 | 311.2 | 311.2 | 311.2 |
| Bench height | m | 15 | 15 | 15 | 15 | 15 | 15 | 15 | 15 |
| Subdrill | m | 1.5 | 1.5 | 1.5 | 1.5 | 1.5 | 1.5 | 1.5 | 1.5 |
| Stemming | m | 5.0 | 6.5 | 6.0 | 6.5 | 7.0 | 8.5 | 7.3 | 8.3 |
| Burden | m | 8.8 | 9.0 | 8.5 | 8.7 | 8.2 | 8.5 | 7.8 | 8.0 |
| Spacing | m | 10.5 | 11.0 | 9.5 | 10.7 | 9.4 | 9.5 | 9.0 | 9.5 |
| Specific drilling | m3/m | 84.0 | 90.0 | 73.4 | 84.6 | 70.1 | 73.4 | 63.8 | 69.1 |
| Redrill | | 5 | 5 | 5 | 5 | 5 | 5 | 5 | 5 |
| Penetration rate | m/h | 48 | 48 | 33 | 33 | 26 | 26 | 19 | 19 |
| BCM per hole | m3/hole | 1,386 | 1,485 | 1,211 | 1,396 | 1,156 | 1,211 | 1,053 | 1,140 |
| ANFO Consumption | g/t | 221.6 | 182.5 | 220.6 | 182.2 | 219.0 | 179.8 | 222.3 | 183.0 |
Project No.: C-580 January, 2012 | Page 253 - 378 | |
Controlled drilling and blasting will be practiced along the final faces of the pits. An adjustment factor of 5 % was applied to account for re-drilling in ore and waste.
Annual production capacity was estimated for each type of drill and per each period of the mine plan. Typical estimated capacities per year for each one of the rock types are presented in Table 16.19.
Table 16.19: Drilling Capacity per Year
| UCS (MPa) | Ore | Waste |
| 30-55 | 31,494 | 33,291 |
| 55-90 | 19,919 | 22,962 |
| 90-120 | 14,272 | 14,683 |
| >120 | 9,601 | 10,394 |
The tonnage distribution for drilling according to the type of material was estimated for the life of mine and then divided by the yearly capacity.
Loading
Primary loading in the bulk material will be performed by 495 HR Bucyrus rope shovels with a 73 yd3 (56 m3) bucket, or similar unit. A LeTourneau frontend loader with a 50 yd3 (38 m3) bucket, or similar unit, will be used for secondary loading, rehandle and shovel support.
Loading for the heap leach stand-alone pit will be performed by Komatsu PC 5500 diesel-hydraulic shovels with a 38 yd3 (29 m3) bucket. The Komatsu WA-1200 with a 26 yd3 (20 m3) bucket will be used for secondary loading, rehandle and shovel support.
The productivities of the loading equipment were calculated with respect to the selected haul trucks and are shown in Table 16.20.
The tonnage distribution for loading, according to the type of material, was then allocated for the life of mine and divided by the yearly capacity for each period.
Project No.: C-580 January, 2012 | Page 254 - 378 | |
Table 16.20: Shovel and Loader Productivity Calculations
| Item | Unit | Rope Shovel | FEL |
| Bucket capacity | m3 | 56 | 38 |
| Truck capacity | m3 | 268 | 268 |
| Truck capacity | t | 360 | 360 |
| In-situ bulk density | t/ m3 | 2.45 | 2.45 |
| Bulk factor | | 40 | 40 |
| Loose density | t/ m3 | 1.75 | 1.75 |
| Moisture () | | 2 | 2 |
| Fill factor | | 90.3 | 88.8 |
| Effective bucket capacity | m3 | 50.6 | 33.7 |
| Wet/loose density | t/ m3 | 1.78 | 1.78 |
| Tonnes/pass | t | 90.0 | 60.0 |
| Theoretical passes (volume) | - | 5.3 | 8.0 |
| Theoretical passes (weight) | - | 4.0 | 6.0 |
| Actual passes | - | 4 | 6 |
| Truck load | m3 | 202 | 202 |
| Truck load | t | 360 | 360 |
| Truck fill (volume) | | 75 | 75 |
| Truck fill (weight) | | 100 | 100 |
| Loader cycle time | sec | 33.6 | 45 |
| Loader spot time | sec | 66 | 60 |
| Load time per truck | sec | 200.4 | 330 |
| Maximum productivity | Trucks / adj. NOH | 18.0 | 10,9 |
| Maximum productivity | wmt / adj. NOH | 6,467 | 3,926 |
| Maximum productivity | wmt / GOH | 5,387 | 3.271 |
| Maximum productivity | dmt / GOH | 5,279 | 3,205 |
| Maximum productivity | wmt/a | 32,464,856 | 19,148,939 |
| Maximum productivity | wmt/d | 88,945 | 52,463 |
| Maximum productivity | dmt/a | 31,815,559 | 18,765,960 |
| Maximum productivity | dmt/d | 87,166 | 51,414 |
Hauling
Using this information, the mine production plan, and haulage distances for each type of material were derived. Separate values were obtained for transport within and outside the pit (between the pit exit and the destination: primary or heap leach crusher, waste dumps or stockpile). The distances were split between ramp and horizontal transport. Average distances per year are shown in Figure 16.23 and Figure 16.24.
Project No.: C-580 January, 2012 | Page 255 - 378 | |
Figure 16.23: Super Pit Option – Estimated Distances
Figure 16.24: Hybrid Option – Estimated Distances
Truck speeds were determined using information from suppliers, adjusted by correction factors to allow for slower velocities on the benches and at the stockpiles. Speeds used for calculations are shown in Table 16.21.
Table 16.21: Average Speeds (km/h) for Liebherr T282C and Komatsu 730 E
| Tram | Liebherr T 282C | Komatsu 730E |
| Loaded Uphill | 12.5 | 10 |
| Loaded Flat | 45 | 40 |
| Loaded Downhill | 27 | 20 |
| Empty Uphill | 27 | 15 |
| Empty Flat | 45 | 40 |
| Empty Downhill | 40 | 20 |
Project No.: C-580 January, 2012 | Page 256 - 378 | |
Truck performances are calculated for every loading unit and period of the production plan depending on the travel time (see Figure 16.25 to 16.27) and other fixed times of the cycle, including loading according to the equipment used, dumping and manoeuvring, amongst others.
Figure 16.25: Super Pit Option – Travel Cycle Times for Each Origin-Destination
Figure 16.26: Hybrid Option – Travel Cycle Times for Each Origin-Destination
Project No.: C-580 January, 2012 | Page 257 - 378 | |
Figure 16.27: Heap Leach Stand Alone – Travel Cycle Times
An example of a truck performance calculation is presented in Table 16.22:
Table 16.22: Haul Truck Loaded by Rope Shovel
| | Ore | Waste |
| Truck Capacity (tonnes) | 360 | 360 |
Bucket Capacity (m3) | 56 | 56 |
| Travel Time (min) | 27 | 24.6 |
| Loading time (min) | 2.24 | 2.24 |
| Dumping and spotting time (min) | 2.5 | 2.0 |
| Cycle Time (min) | 32.4 | 28.9 |
| Hourly instantaneous productivity (t/NOH) | 667 | 749 |
| Efficiency | 85 | 85 |
| Hourly productivity (t/op h) | 567 | 636 |
| Availability | 85 | 85 |
| Utilization | 83.4 | 83.4 |
| Hours/shift | 12 | 12 |
| Shifts/day | 2 | 2 |
| Yearly capacity (’000 t/yr) | 3,522 | 3,952 |
The number of trucks required is obtained by dividing the annual hauled material by the corresponding transport capacity of a truck, represented by the distribution of the hauled material to the different loading units.
| 16.7.2 | IPCC Open Pit Equipment |
| 16.7.2.1 | Equipment List –E & IPCC – Super Pit |
Table 16.23 illustrates the E & IPCC equipment fleet for the Super Pit versus time.
Project No.: C-580 January, 2012 | Page 258 - 378 | |
Table 16.23: Super Pit Option – IPCC Equipment Requirements
| Equipment ID | Description | Avg Capacity tph | Y-02 | Y-01 | Y01 | Y02 | Y03 | Y04 | Y05 | Y06 | Y07 | Y08 | Y09 | Y10 | Y11 | Y12 | Y13 | Y14 | Y15 | Y16 | Y17 | Y18 |
| CR03 | Gyratory Crusher (CG880) | 10.500 | 1 | 1 | 1 | 1 | 1 | 1 | 1 | 1 | 1 | 1 | 1 | 1 | 1 | 1 | 1 | 1 | 1 | 1 | 1 | 1 |
| CR04 | Gyratory Crusher (CG880) | 10.500 | 1 | 1 | 1 | 1 | 1 | 1 | 1 | 1 | 1 | 1 | 1 | 1 | 1 | 1 | 1 | 1 | 1 | 1 | 1 | 1 |
| SCV-01C | Sacrificial Conveyor - Crusher 3 | 10.500 | 1 | 1 | 1 | 1 | 1 | 1 | 1 | 1 | 1 | 1 | 1 | 1 | 1 | 1 | 1 | 1 | 1 | 1 | 1 | 1 |
| SCV-01D | Sacrificial Conveyor - Crusher 4 | 10.500 | 1 | 1 | 1 | 1 | 1 | 1 | 1 | 1 | 1 | 1 | 1 | 1 | 1 | 1 | 1 | 1 | 1 | 1 | 1 | 1 |
| CV-02B | In Pit Conveyor 2 - North Stockpile Feed | 21.000 | 0 | 0 | 0 | 0 | 0 | 0 | 1 | 1 | 1 | 1 | 1 | 1 | 1 | 1 | 1 | 1 | 1 | 1 | 1 | 1 |
| CV-011B | Transfer Conveyor 2 - North Stockpile Feed | 21.000 | 0 | 0 | 0 | 0 | 0 | 0 | 1 | 1 | 1 | 1 | 1 | 1 | 1 | 1 | 1 | 1 | 1 | 1 | 1 | 1 |
| CV-03B | External Pit Conveyor - North S’pile Feed | 21.000 | 1 | 1 | 1 | 1 | 1 | 1 | 1 | 1 | 1 | 1 | 1 | 1 | 0 | 0 | 0 | 0 | 0 | 0 | 0 | 0 |
| CV-04 | Overland Conveyor - North Stockpile Feed | 21.000 | 1 | 1 | 1 | 1 | 1 | 1 | 1 | 1 | 1 | 1 | 1 | 1 | 1 | 1 | 1 | 1 | 1 | 1 | 1 | 1 |
| CV-05 | Overland Conveyor - North Stockpile Feed | 21.000 | 1 | 1 | 1 | 1 | 1 | 1 | 1 | 1 | 1 | 1 | 1 | 1 | 1 | 1 | 1 | 1 | 1 | 1 | 1 | 1 |
| CV-06 | S’Pile Transfer Conveyor - North S’Pile Feed | 21.000 | 1 | 1 | 1 | 1 | 1 | 1 | 1 | 1 | 1 | 1 | 1 | 1 | 1 | 0 | 0 | 0 | 0 | 0 | 0 | 0 |
| CV-07 | Track Shiftable Conveyor - North S’Pile Feed | 21.000 | 1 | 1 | 1 | 1 | 1 | 1 | 1 | 1 | 1 | 1 | 1 | 1 | 1 | 1 | 1 | 1 | 1 | 1 | 1 | 1 |
| CV-010 | Track Shiftable Conveyor - North S’Pile Feed | 21.000 | 0 | 0 | 0 | 1 | 1 | 1 | 1 | 1 | 0 | 0 | 0 | 0 | 0 | 0 | 1 | 1 | 1 | 1 | 1 | 1 |
| SP02 | 50/50 Spreader | 21.000 | 1 | 1 | 1 | 1 | 1 | 1 | 1 | 1 | 1 | 1 | 1 | 1 | 1 | 1 | 1 | 1 | 1 | 1 | 1 | 1 |
| CR01 | Gyratory Crusher (CG880) | 10.500 | 0 | 0 | 1 | 1 | 1 | 1 | 1 | 1 | 1 | 1 | 1 | 1 | 1 | 1 | 0 | 0 | 0 | 0 | 0 | 0 |
| CR02 | Gyratory Crusher (CG880) | 10.500 | 0 | 0 | 1 | 1 | 1 | 1 | 1 | 1 | 1 | 1 | 1 | 1 | 1 | 1 | 0 | 0 | 0 | 0 | 0 | 0 |
| SCV-01A | Sacrificial Conveyor - Crusher 1 | 10.500 | 0 | 0 | 1 | 1 | 1 | 1 | 1 | 1 | 1 | 1 | 1 | 1 | 1 | 1 | 0 | 0 | 0 | 0 | 0 | 0 |
| SCV-01B | Sacrificial Conveyor - Crusher 2 | 10.500 | 0 | 0 | 1 | 1 | 1 | 1 | 1 | 1 | 1 | 1 | 1 | 1 | 1 | 1 | 0 | 0 | 0 | 0 | 0 | 0 |
| CV-02A | In Pit Conveyor 1 - West Stockpile Feed | 21.000 | 0 | 0 | 0 | 0 | 0 | 0 | 0 | 0 | 0 | 1 | 1 | 1 | 1 | 1 | 0 | 0 | 0 | 0 | 0 | 0 |
| CV-011A | Transfer Conveyor 1 - West Stockpile | 21.000 | 0 | 0 | 0 | 0 | 0 | 0 | 0 | 0 | 0 | 1 | 1 | 1 | 1 | 1 | 0 | 0 | 0 | 0 | 0 | 0 |
| CV-03A | External Pit Conveyor - West Stockpile Feed | 21.000 | 0 | 0 | 1 | 1 | 1 | 1 | 1 | 1 | 1 | 1 | 1 | 1 | 0 | 0 | 0 | 0 | 0 | 0 | 0 | 0 |
| CV-08 | Overland Conveyor - West Stockpile Feed | 21.000 | 0 | 0 | 1 | 1 | 1 | 1 | 1 | 1 | 1 | 1 | 1 | 1 | 1 | 1 | 0 | 0 | 0 | 0 | 0 | 0 |
| CV-09 | Track Shiftable Conveyor - West Dump | 21.000 | 0 | 0 | 1 | 1 | 1 | 1 | 1 | 1 | 1 | 1 | 1 | 1 | 1 | 1 | 0 | 0 | 0 | 0 | 0 | 0 |
| SP01 | 50/50 Spreader | 21.000 | 0 | 0 | 1 | 1 | 1 | 1 | 1 | 1 | 1 | 1 | 1 | 1 | 1 | 1 | 0 | 0 | 0 | 0 | 0 | 0 |
Project No.: C-580 January, 2012 | Page 259 - 378 | |
| 16.7.2.2 | Equipment List – EPCC – Hybrid Pit |
Table 16.24 illustrates the EPCC equipment fleet for the Hybrid Pit against time.
Table 16.24: Hybrid Option – EPCC Equipment Requirements
| Equipment ID | Description | Avg Capacity tpoh | Y-02 | Y-01 | Y01 | Y02 | Y03 | Y04 | Y05 | Y06 | Y07 | Y08 | Y09 |
| CR01 | Gyratory Crusher (CG880) | 10.500 | 1 | 1 | 1 | 1 | 1 | 1 | 1 | 1 | | | |
| CR02 | Gyratory Crusher (CG880) | 10.500 | | | 1 | 1 | 1 | 1 | 1 | 1 | 1 | 1 | 1 |
| CV-03 | External Pit Conveyor | 21.000 | 1 | 1 | 1 | 1 | 1 | 1 | 1 | 1 | 1 | 1 | 1 |
| CV-04 | Overland Conveyor | 21.000 | 1 | 1 | 1 | 1 | 1 | 1 | 1 | 1 | 1 | 1 | 1 |
| CV-07 | Initial Track Shiftable Conveyor (fill Modules 1-2) | 21.000 | 1 | 1 | 1 | 1 | 1 | 1 | 1 | 1 | 1 | 1 | 1 |
| CV-08 | Track Shiftable Conveyor – (fill Module 3) | 21.000 | | | | | | | 1 | 1 | 1 | 1 | 1 |
| SP-01 | 50/50 Spreader | 21.000 | 1 | 1 | 1 | 1 | 1 | 1 | 1 | 1 | 1 | 1 | 1 |
| SCV-01 | Sacrificial Conveyor - Crusher 1 | 10.500 | 1 | 1 | 1 | 1 | 1 | 1 | 1 | 1 | | | |
| SCV-02 | Sacrificial Conveyor - Crusher 2 | 10.500 | | | 1 | 1 | 1 | 1 | 1 | 1 | 1 | 1 | 1 |
| 16.7.3 | Support and Auxiliary Equipment Requirements |
The support and ancillary equipment can be grouped broadly into two categories; the first is equipment used to support mining operations and the second to service and maintain the mining equipment fleet.
The major tasks to be completed by the equipment required to support the mining operation include the following:
| ● | Waste rock storage facility maintenance |
| ● | Bench and road maintenance |
| ● | Ditch preparation and maintenance |
| ● | Drill pattern preparation / hole stemming |
| ● | Stockpile loading and rehandling |
| ● | Waste stripping and reclamation. |
The number of auxiliary equipment units is determined as a function of the number of units in the main loading and hauling fleet, and the total rock movement in the pit. The relations that will be applied are:
| ● | One track dozer for each 2.5 loading equipment and waste stockpile operation |
| ● | One wheel dozer for roads and cleaning around shovels |
| ● | Motorgraders are estimated according to the hauling road maintenance required per year |
Project No.: C-580 January, 2012 | Page 260 - 378 | |
| ● | Water trucks are estimated from the hauling roads in use per year. |
As IPCC has been planned for use in the project, the number of each ancillary equipment type is lower than it would be for a normal trucking operation. The reasons for this are:
| ● | Lower kms of haul road in use for the project (less motorgraders and water truck requirements) |
| ● | No trucks on stockpiles (less dozers required for maintenance of stockpile crests, less water truck requirements) |
Against this reduction in “normal” ancillary equipment, the IPCC operation requires its own ancillary equipment fleet for assisting in relocations, cleanup, and associated maintenance work. Table 16.25 and Table 16.26 show the recommended fleet for the Super Pit and Hybrid options, together with the anticipated operating hours per year.
Project No.: C-580 January, 2012 | Page 261 - 378 | |
Table 16.25: Super Pit Option – IPCC Ancillary Fleet
| Additional Equipment | | | # | | | CAPEX | | | Hrs / Yr | | | USD$/hr | | | Operator Maintain | | | Total Cost $/hr | | | Annual OpCost USD | |
| Transporter | | | 0 | | | $ | 4.000.000 | | | | 250 | | | | 156,0 | | | $ | 6 | | | $ | 162 | | | $ | - | |
| 220 t Hydraulic Mobile Crane | | | 1 | | | $ | 1.250.000 | | | | 1000 | | | | 66,0 | | | $ | 6 | | | $ | 72 | | | $ | 72.000 | |
| 6 tonne TLB | | | 1 | | | $ | 150.000 | | | | 1000 | | | | 34,0 | | | $ | 6 | | | $ | 40 | | | $ | 40.000 | |
| 1 x Bobcat | | | 1 | | | $ | 40.000 | | | | 700 | | | | 36,0 | | | $ | 6 | | | $ | 42 | | | $ | 29.400 | |
| 1 x IT Loader | | | 0 | | | $ | 385.000 | | | | 700 | | | | 41 | | | $ | 6 | | | $ | 47 | | | $ | - | |
| Maintenance Trucks (with hiab crane for belt splicing/lifting) | | | 1 | | | $ | 165.000 | | | | 2000 | | | | 31 | | | $ | 6 | | | $ | 37 | | | $ | 74.000 | |
| Conveyor Side Lifting Truck/Trailer | | | 0 | | | $ | 280.000 | | | | 1200 | | | | 31 | | | $ | 6 | | | $ | 37 | | | $ | - | |
| Rock Breaker (35t excavator) | | | 0 | | | $ | 320.000 | | | | 700 | | | | 28,0 | | | $ | 6 | | | $ | 34 | | | $ | - | |
| D11 Dozers for Re-locations | | | 0 | | | On Site | | | | 660 | | | | 184,6 | | | $ | 6 | | | $ | 195 | | | $ | - | |
| D11 Dozer on dump with Spreader | | | 2 | | | On Site | | | | 3760 | | | | 184,6 | | | $ | 6 | | | $ | 195 | | | $ | 1.463.543 | |
| Truck & Lowboy | | | 1 | | | On Site | | | | 250 | | | | 60 | | | $ | 6 | | | $ | 35 | | | $ | 8.750 | |
| Belt reeler | | | 0 | | | $ | 400.000 | | | | 1000 | | | | 28,0 | | | $ | 6 | | | $ | 34 | | | $ | - | |
| Cable reeler | | | 0 | | | $ | 275.000 | | | | 1000 | | | | 28,0 | | | $ | 6 | | | $ | 34 | | | $ | - | |
| Light vehicles (supervisor, belt runners) | | | 2 | | | $ | 90.000 | | | | 1000 | | | | 22,0 | | | $ | 6 | | | $ | 28 | | | $ | 56.000 | |
| Pipelayer Dozer (c/w rail lift head & counter weight) | | | 1 | | | $ | 750.000 | | | | 1000 | | | | 81 | | | $ | 6 | | | $ | 87 | | | $ | 87.000 | |
| 660 t Terex Crawler Crane | | | 1 | | | $ | 4.666.667 | | | | 250 | | | | 150 | | | $ | 6 | | | $ | 156 | | | $ | 39.000 | |
| TOTAL | | | | | | $ | 7.201.667 | | | | | | | | | | | | | | | | | | | $ | 1.869.693 | |
Table 16.26: Hybrid Option – EPCC Ancillary Fleet
| Additional Equipment | | | # | | | CAPEX | | | Hrs / Yr | | | USD$/hr | | | Operator Maintain | | | Total Cost $/hr | | | Annual OpCost USD | |
| Transporter | | | 0 | | | $ | 4.000.000 | | | | 250 | | | | 156,0 | | | $ | 6 | | | $ | 162 | | | $ | - | |
| 220 t Hydraulic Mobile Crane | | | 0 | | | $ | 1.250.000 | | | | 1000 | | | | 66,0 | | | $ | 6 | | | $ | 72 | | | $ | - | |
| 6 tonne TLB | | | 1 | | | $ | 150.000 | | | | 1000 | | | | 34,0 | | | $ | 6 | | | $ | 40 | | | $ | 40.000 | |
| 1 x Bobcat | | | 1 | | | $ | 40.000 | | | | 700 | | | | 36,0 | | | $ | 6 | | | $ | 42 | | | $ | 29.400 | |
| 1 x IT Loader | | | 0 | | | $ | 385.000 | | | | 700 | | | | 41 | | | $ | 6 | | | $ | 47 | | | $ | - | |
| Maintenance Trucks (with hiab Lcrane for belt splicing/lifting) | | | 1 | | | $ | 165.000 | | | | 2000 | | | | 31 | | | $ | 6 | | | $ | 37 | | | $ | 74.000 | |
| Conveyor Side Lifting Truck/Trailer | | | 0 | | | $ | 280.000 | | | | 1200 | | | | 31 | | | $ | 6 | | | $ | 37 | | | $ | - | |
| Rock Breaker (35t excavator) | | | 0 | | | $ | 320.000 | | | | 700 | | | | 28,0 | | | $ | 6 | | | $ | 34 | | | $ | - | |
| D11 Dozers for Re-locations | | | 0 | | | On Site | | | | 660 | | | | 184,6 | | | $ | 6 | | | $ | 195 | | | $ | - | |
| D11 Dozer on dump with Spreader | | | 1 | | | On Site | | | | 3760 | | | | 184,6 | | | $ | 6 | | | $ | 195 | | | $ | 731.771 | |
| Truck & Lowboy | | | 1 | | | On Site | | | | 250 | | | | 60 | | | $ | 6 | | | $ | 35 | | | $ | 8.750 | |
| Belt reeler | | | 0 | | | $ | 400.000 | | | | 1000 | | | | 28,0 | | | $ | 6 | | | $ | 34 | | | $ | - | |
| Cable reeler | | | 0 | | | $ | 275.000 | | | | 1000 | | | | 28,0 | | | $ | 6 | | | $ | 34 | | | $ | - | |
| Light vehicles (supervisor, belt runners) | | | 2 | | | $ | 90.000 | | | | 1000 | | | | 22,0 | | | $ | 6 | | | $ | 28 | | | $ | 56.000 | |
| Pipelayer Dozer (c/w rail lift head & counter weight)L | | | 1 | | | $ | 750.000 | | | | 1000 | | | | 81 | | | $ | 6 | | | $ | 87 | | | $ | 87.000 | |
| 660 t Terex Crawler Crane | | | 1 | | | $ | 4.666.667 | | | | 250 | | | | 150 | | | $ | 6 | | | $ | 156 | | | $ | 39.000 | |
| TOTAL | | | | | | $ | 5.951.667 | | | | | | | | | | | | | | | | | | | $ | 1.065.921 | |
| 16.7.4 | Underground Mine Equipment |
The capital preparation and development requirements will be carried out by contractors.
The following parameters and criteria are those used in the mining equipment estimate:
Project No.: C-580 January, 2012 | Page 262 - 378 | |
LHDs with 10 yd3 bucket capacity have been selected. This equipment is able to work within the production drifts (4.0 mx3.6 m) loading and hauling the ore from the drawpoints to the crusher or to the ore passes.
Productivities for each of the defined production levels are presented in Table 16.2 and Table 16.27, respectively.
Table 16.27: Hybrid Option – LHD Productivities
| Production Level | | UC 3400 |
| | Unit | Qty |
| Grizzly | mxm | 1.25x1.25 |
| Bucket Capacity | yd3 | 10 |
| Bucket Capacity | m3 | 7.65 |
| Filling Factor | | 83 |
| Loose density | t/m3 | 1.65 |
| Effective bucket capacity | t | 10.47 |
| Velocities | | |
| - Loaded | km/h | 3.68 |
| - Empty | km/h | 5.09 |
| Average Distances | M | 38 |
| Loading Time | min | 0.40 |
| Dumping Time | min | 0.12 |
| Waiting for pickhammer | min | 0.135 |
| Hauling time-loaded | min | 0.62 |
| Hauling time-empty | min | 0.45 |
| Total Travel time | min | 1.06 |
| Cycle Time | min | 1.72 |
| Productivity | t/h | 365.08 |
| Effective time pershift | h | 6.8 |
| Productivity | t/shift | 2,483 |
| Daily Capacity | t/d | 4,965 |
Project No.: C-580 January, 2012 | Page 263 - 378 | |
Table 16.28: Full Underground Option – LHD Productivities
| Production Level | | 3505 | 3655 | 3190 |
| | Unit | Qty | Qty | Qty |
| Grizzly | mxm | 1.25x1.25 | 1.25x1.25 | 1.25x1.25 |
| Bucket Capacity | yd3 | 10 | 10 | 10 |
| Bucket Capacity | m3 | 7.65 | 7.65 | 7.65 |
| Filling Factor | | 83 | 83 | 83 |
| Loose density | t/m3 | 1.65 | 1.65 | 1.65 |
| Effective bucket capacity | t | 10.47 | 10.47 | 10.47 |
| Velocities | | | | |
| - Loaded | km/h | 3.68 | 4.42 | 4.42 |
| - Empty | km/h | 5.09 | 6.10 | 6.10 |
| Average Distances | m | 44 | 161 | 146 |
| Loading Time | min | 0.40 | 0.40 | 0.40 |
| Dumping Time | min | 0.12 | 0.12 | 0.12 |
| Waiting for pickhammer | min | 0.0011 | | |
| Hauling time-loaded | min | 0.71 | 2.19 | 1.99 |
| Hauling time-empty | min | 0.52 | 1.59 | 1.44 |
| Total Travel time | min | 1.23 | 3.78 | 3.43 |
| Cycle Time | min | 1.75 | 4.30 | 3.95 |
| Productivity | t/h | 358.66 | 146.09 | 159.08 |
| Effective time per shift | h | 6.8 | 6.8 | 6.8 |
| Productivity | t/shift | 2,439 | 993 | 182 |
| Daily Capacity | t/d | 4,878 | 1,987 | 2,164 |
Trucks selected for the Caspiche Full Underground mine are 80 t low profile units, similar to those currently used at El Teniente mine. Truck performance estimate is shown in Table 16.29\.
Project No.: C-580 January, 2012 | Page 264 - 378 | |
Table 16.29: Truck Performance
| | Unit | Qty |
| Body capacity | t | 80 |
| Filling Factor | | 90 |
| Effective body capacity | t | 72,00 |
| Velocities | | |
| - Loaded | km/h | 20 |
| - Empty | km/h | 20 |
| Average Distances | m | 700 |
| Loading Time | min | 1.50 |
| Dumping Time | min | 0.9 |
| Waiting for pickhammer | min | 0.1 |
| Without assignation | min | 0.60 |
| Delays | min | 0.5 |
| Hauling time-loaded | min | 2.10 |
| Hauling time-empty | min | 2.10 |
| Total Travel time | min | 4.20 |
| Cycle Time | min | 7.80 |
| Productivity | t/h | 554 |
| Effective time pershift | h | 6.0 |
| Productivity | t/shift | 3.323 |
| Daily Capacity | t/d | 6.646 |
| 16.7.4.3 | Support and Auxiliary Equipment |
Parameters used to estimate these equipment units are as follows:
| ● | Reduction Jumbo:0.2 units per LHD |
| ● | Maintenance Equipment:0.2 units per LHD |
| ● | Lifting Equipment:2 units per LHD |
| ● | Drift Cleaning:2 units per LHD |
Four areas will report to the Mine Superintendent:
Each of these areas will have three different categories:
Project No.: C-580 January, 2012 | Page 265 - 378 | |
| ● | Technical Services: Personnel involved in the administration of the mine. Supervisors, dispatch and administration personnel are included into this group. |
| ● | Operators: Personnel to operate the mining equipment, including support equipment. |
| ● | Maintenance: Personnel for maintenance of the mine equipment. |
The organization charts for the three options are shown in Figure 16.28 to Figure 16.30.
Table 16.30 to Table 16.33 summarize the expected mine personnel required for each option. The work schedule assumes production will operate 24 hours/day in two 12 hour shifts, for 7 days/week, 365 days/year. A 1-week-in / 1-week-out rotation will require a total of four crews on the payroll.
The personnel summary does not include senior management staff which is considered as part of the General and Administration (G&A) costs.
The open pit and underground mine personnel are listed separately.
Project No.: C-580 January, 2012 | Page 266 - 378 | |
Figure 16.28: Super Pit Option – Mine Organization
Project No.: C-580 January, 2012 | Page 267 - 378 | |
Figure 16.29: Hybrid Option – Mine Organization
Project No.: C-580 January, 2012 | Page 268 - 378 | |
Figure 16.30: Full Underground Option – Mine Organization
Table 16.30: Super Pit Option – Mine Personnel
| Personnel | Y-03 | Y-02 | Y-01 | Y01 | Y02 | Y03 | Y04 | Y05 | Y06 | Y07 | Y08 | Y09 | Y10 | Y11 | Y12 | Y13 | Y14 | Y15 | Y16 | Y17 |
| Open Pit | | | | | | | | | | | | | | | | | | | | |
| Technical services | 56 | 56 | 59 | 65 | 70 | 70 | 70 | 70 | 70 | 70 | 70 | 70 | 70 | 70 | 70 | 70 | 69 | 63 | 49 | 40 |
| Operators | 208 | 262 | 312 | 456 | 546 | 551 | 558 | 558 | 558 | 558 | 562 | 562 | 562 | 557 | 509 | 433 | 304 | 291 | 287 | 274 |
| Maintenance | | | | | 408 | 412 | 418 | 418 | 418 | 418 | 422 | 422 | 422 | 419 | 382 | 319 | 218 | 207 | 203 | 103 |
| IPCC | 43 | 43 | 56 | 56 | 56 | 56 | 56 | 56 | 56 | 56 | 56 | 56 | 56 | 46 | 38 | 38 | 18 | 18 | 18 | 18 |
| Total | 307 | 361 | 427 | 577 | 1080 | 1089 | 1102 | 1102 | 1102 | 1102 | 1110 | 1110 | 1110 | 1092 | 999 | 860 | 609 | 579 | 557 | 435 |
Project No.: C-580 January, 2012 | Page 269 - 378 | |
Table 16.31: Hybrid Option – Mine Personnel
| Personnel | Y-03 | Y-02 | Y-01 | Y01 | Y02 | Y03 | Y04 | Y05 | Y06 | Y07 | Y08 | Y09 |
| Open Pit | | | | | | | | | | | | |
| Technical services | 56 | 56 | 59 | 65 | 70 | 70 | 70 | 70 | 70 | 70 | 70 | 5 |
| Operators | 206 | 217 | 279 | 313 | 332 | 340 | 340 | 331 | 336 | 301 | 237 | 206 |
| Mechanics | 0 | 0 | 0 | 0 | 239 | 246 | 246 | 240 | 242 | 214 | 162 | 138 |
| EPCC | 0 | 39 | 39 | 44 | 44 | 44 | 44 | 44 | 44 | 44 | 44 | 44 |
| Subtotal | 262 | 312 | 377 | 422 | 685 | 700 | 700 | 685 | 692 | 629 | 513 | 393 |
| Underground Mine | | | | | | | | | | | | |
| Technical services | | | | | | | | | | | | 39 |
| Operators | | | | | | | | | | | | 142 |
| Mechanics | | | | | | | | | | | | 90 |
| Subtotal | 0 | 0 | 0 | 0 | 0 | 0 | 0 | 0 | 0 | 0 | 0 | 271 |
| Total | | | | | | | | | | | | |
| Technical services | 56 | 56 | 59 | 65 | 70 | 70 | 70 | 70 | 70 | 70 | 70 | 44 |
| Operators | 206 | 217 | 279 | 313 | 332 | 340 | 340 | 331 | 336 | 301 | 237 | 348 |
| Mechanics | 0 | 0 | 0 | 0 | 239 | 246 | 246 | 240 | 242 | 214 | 162 | 228 |
| EPCC | | 39 | 39 | 44 | 44 | 44 | 44 | 44 | 44 | 44 | 44 | 44 |
| Subtotal | 262 | 312 | 377 | 422 | 685 | 700 | 700 | 685 | 692 | 629 | 513 | 393 |
Project No.: C-580 January, 2012 | Page 270 - 378 | |
Table 16.32: Hybrid Option – Mine Personnel (Continuation)
| Personnel | Y10 | Y11 | Y12 | Y13 | Y14 | Y15 | Y16 | Y17 | Y18 | Y19 | Y20 | Y21 |
| Open Pit | | | | | | | | | | | | |
| Technical services | 5 | 5 | 5 | 5 | 5 | 5 | 5 | 5 | 5 | | | |
| Operators | 82 | 70 | 66 | 55 | 51 | 47 | 47 | 47 | 43 | | | |
| Mechanics | 50 | 41 | 38 | 29 | 26 | 23 | 23 | 14 | 13 | | | |
| EPCC | | | | | | | | | | | | |
| Subtotal | 137 | 116 | 109 | 89 | 82 | 75 | 75 | 66 | 61 | 0 | 0 | 0 |
| Underground Mine | | | | | | | | | | | | |
| Technical services | 39 | 51 | 51 | 51 | 51 | 51 | 51 | 51 | 51 | 51 | 51 | 51 |
| Operators | 191 | 221 | 262 | 328 | 374 | 410 | 410 | 410 | 410 | 360 | 294 | 222 |
| Mechanics | 158 | 226 | 302 | 378 | 434 | 458 | 454 | 442 | 414 | 330 | 258 | 162 |
| Subtotal | 388 | 498 | 615 | 757 | 859 | 919 | 915 | 903 | 875 | 741 | 603 | 435 |
| Total | | | | | | | | | | | | |
| Technical services | 44 | 56 | 56 | 56 | 56 | 56 | 56 | 56 | 56 | 51 | 51 | 51 |
| Operators | 273 | 291 | 328 | 383 | 425 | 457 | 457 | 457 | 453 | 360 | 294 | 222 |
| Mechanics | 208 | 267 | 340 | 407 | 460 | 481 | 477 | 456 | 427 | 330 | 258 | 162 |
| EPCC | 0 | 0 | 0 | 0 | 0 | 0 | 0 | 0 | 0 | 0 | 0 | 0 |
| Subtotal | 525 | 614 | 724 | 846 | 941 | 994 | 990 | 969 | 936 | 741 | 603 | 435 |
Table 16.33: Full Underground Option – Mine Personnel
| Personnel | Y01 | Y02 | Y03 | Y04 | Y05 | Y06 | Y07 | Y08 | Y09 | Y10 | Y11 | Y12 | Y13 | Y14 | Y15 | Y16 | Y17 | Y18 | Y19 | Y20 | Y21 | Y22 | Y23 |
| Underground Mine | | | | | | | | | | | | | | | | | | | | | | | |
| Technical services | 38 | 38 | 63 | 63 | 63 | 63 | 63 | 63 | 63 | 63 | 63 | 63 | 63 | 62 | 63 | 63 | 63 | 63 | 63 | 62 | 62 | 62 | 50 |
| Operators | 69 | 113 | 218 | 279 | 337 | 394 | 442 | 444 | 449 | 433 | 426 | 423 | 416 | 361 | 386 | 354 | 350 | 318 | 336 | 257 | 219 | 171 | 78 |
| Maintenance | 62 | 94 | 218 | 298 | 382 | 446 | 518 | 542 | 575 | 591 | 587 | 546 | 502 | 438 | 418 | 366 | 326 | 278 | 218 | 182 | 158 | 126 | 66 |
| Total | 169 | 245 | 499 | 640 | 782 | 903 | 1023 | 1049 | 1087 | 1087 | 1076 | 1032 | 981 | 861 | 867 | 783 | 739 | 659 | 617 | 501 | 439 | 359 | 194 |
Project No.: C-580 January, 2012 | Page 271 - 378 | |
Benchmarking of the main operational indices in the study was carried out against operating mines in Chile, Peru and Argentina. The compiled data corresponds mainly to 2010 (second semester) and the first semester of 2011.
Mines with the same type of equipment and where possible, at similar altitude were considered in the benchmark.
In addition to the results of the Super Pit option, the peer group operating costs were updated using current prices for fuel (1.00 US$/l) and power (150 US$/MWH), so the benchmarking can be fairly compared to the other mines. Mined material has also been included as reference.
Graphical results for total mine unit costs are shown in Figure 16.31:
Figure 16.31: Mine Cost Benchmark
Average cost for the operating mines is 2.03 US$/t compared with the 1.30 US$/t included in this Study. The Caspiche trucking number was 1.53 US$/t and the additional reduction was achieved by use of In-pit Crushing and Conveying (IPCC) for all waste. The original number compares favourably with another large PFS in the region completed in 2010. Average cost for mines using larger equipment (73 yd3 rope shovels and trucks >300 t) is 2.14 US$/t. Average cost for mines operating above 2500 masl is 2.05 US$/t.
If current costs for power and fuel are included in the Caspiche estimate, the unit cost increases to 1.45 US$/t. Benefits of the in pit crusher for Caspiche are included in these results.
Comparison of the mine cost breakdown by unit operations is presented in Figure 16.32:
Project No.: C-580 January, 2012 | Page 272 - 378 | |
Figure 16.32: Mine Cost Benchmark (Unit Operations)
Hauling represents the most relevant operation unit of the Caspiche mine cost. Hauling cost for Caspiche project includes 0.60 US$/t for haul trucks and 0,18 US$/t for waste in pit crushing and conveying
A compilation of loading and hauling data for high altitude mines (>3000 masl) is presented in Figure 16.33. Actual operations and recent projects are compared with the Super Pit option results. The mines and projects are identified with their altitude.
Daily rock movement is also included as reference.
Figure 16.33: Trucks and Shovel Fleet Benchmark
Project No.: C-580 January, 2012 | Page 273 - 378 | |
The highest projected production per day corresponds to Caspiche.
New projects included in the comparison are planning to use trucks over 300 t capacity. Operating mines are moving to 360 t trucks. 73 yd3 rope shovels are widely used with all trucks over 300 t.
Figure 16.34: Mine Movement and Hauling Distance Fleet Benchmark
For the Caspiche project, Figure 16.34 illustrates that Caspiche has the minimum truck requirements of the peer group evaluated. The Caspiche project has the lowest distance of those operations and projects considered in the benchmarking, it represents the benefits of the inclusion of the in- pit crusher and conveying system.
The loading capacity has been represented in Figure 16.35 as the daily production (tonnes per day) divided by the total installed loading capacity (yd3).
Project No.: C-580 January, 2012 | Page 274 - 378 | |
Figure 16.35: Loading Capacity Benchmark
Project No.: C-580 January, 2012 | Page 275 - 378 | |
Figure 16.36 presents the hauling benchmark. Hauling capacity is expressed in tonnes per day-km divided by the installed truck capacity.
Figure 16.36: Hauling Capacity Benchmark
The Caspiche operation estimates are similar to average truck usage and is within the overall range of operations.
Finally, Figure 16.37 illustrates the installed truck capacity against installed loading capacity.
Figure 16.37: Hauling Capacity Benchmark
Project No.: C-580 January, 2012 | Page 276 - 378 | |
The comparisons indicate Caspiche Super Pit option has used indices within the ranges of achievable results.
The Caspiche Super Pit option has been designed with the objective of being below world best practice but somewhat higher than standard Chilean productivities. Higher productivities of hauling and loading, a good pit design including in-pit crushing and conveying, and mine scheduling have been focused to achieve a higher efficiency, high productivity and low cost.
In summary, the average cost for the benchmark compared is 2.03 US$/t compared with 1.30 US$/t using the IPCC system. When fuel and energy prices are updated to the value used by operating mines, Caspiche is 29 % below the average unit cost. The reasons for this are
| ● | Natural variation between the operating sizes of the mines – Caspiche has very high daily material movement and hence lower fixed costs per tonne moved, |
| ● | The use of In-pit Crushing and Conveying (IPCC) for some 75 % of all material movement at considerably lower unit cost, reducing the average truck haulage distance from 6.0 to 3,2 km and contributinh 0.34 US$/t to the 0.73 US$/t lower cost ,and |
| ● | Productivity values which are in line with or lower than global standards. |
Project No.: C-580 January, 2012 | Page 277 - 378 | |
Three options for sulphide ore exploitation have been studied to prefeasibility level. The metallurgical processes are similar for the three options, differing only in treatment capacity. The three options and their characteristics are as follows:
Super Pit Option:
| ● | Sulphide reserves for this alternative are 889 Mt ore with 0.24 % Cu, 0.58 g/t Au and 1.13 g/t Ag |
| ● | Production rate: 150,000 t/d. |
Hybrid Option:
| ● | Sulphide reserves for this alternative are 660 Mt ore with 0.26 % Cu, 0.63 g/t Au and 1.18 g/t Ag |
| ● | Production rate: 95,000 t/d. |
Full Underground Option:
| ● | Sulphide reserves for this alternative are 400 Mt ore with 0.30 % Cu, 0.69 g/t Au and 1.27 g/t Ag |
| ● | Production rate: 90,000 t/d. |
In addition to the above sulphide production the project also considers heap leaching of oxide material which is produced as part of the sulphide stripping process in the Super Pit and Hybrid options, as well as a gold rich, copper poor ‘hypogene’ material (MacNeill); both of which will also be processed as a stand alone project for the Full Underground option.
The reserves for the three heap leach options are shown in Table 17.1.
The economic analysis indicates that the Super Pit option is the preferred route to be developed to Feasibility study. As such particular attention should be made to the Super pit parameters discussed in this report.
Table 17.1: Heap Leach Reserves
| Material / Option | Super Pit | Hybrid | Full Underground |
| Oxide | | | |
| Reserve (Mt) | 124 | 124 | 112 |
| Gold Headgrade (g/t) | 0.38 | 0.38 | 0.39 |
| Silver Headgrade (g/t) | 1.62 | 1.62 | 1.57 |
| MacNeill | | | |
| Reserve (Mt) | 78 | 70 | 74 |
| Gold Headgrade (g/t) | 0.51 | 0.50 | 0.55 |
| Silver Headgrade (g/t) | 1.05 | 1.05 | 1.12 |
Project No.: C-580 January, 2012 | Page 278 - 378 | |
| 17.1 | Sulphide Process Route |
In designing the sulphide process plant a number of parameters were applied. These included current available equipment sizes, conventional industry practices and others as applicable. The use of these parameters ensured a process plant installation which was conventional and which used industry wide practices and equipment sizes.
The sulphide ore will be treated through a conventional concentrator plant consisting of primary crushing, semi-autogenous (SAG) and ball mills, rougher flotation, regrind and cleaner flotation circuit. All three options studied use a similar process, differing mainly in equipment size and quantity.
Figure 17.1, illustrates the general process diagram. Equipment for each of the three options varies and is described individually below.
For tailings disposal the Super Pit option considers a rock dam built from pit waste which is crushed, conveyed and spread as described in Items 16 and 18 of this report. The Hybrid and Full Underground options consider a cycloned sand tailings impoundment dam generated from plant tailings. For the Super Pit option the tailings thickener underflow discharges through a number of points into the tailings containment area without cycloning.
Due to the characteristics of the deposit mineralization, the Caspiche process flowsheet incorporates a number of considerations to maximize production and to ensure a saleable product, these include:
| ● | Treatment of the copper concentrates to eliminate arsenic |
| ● | Leaching of the cleaner flotation tails to recover additional gold |
| ● | Use of a SART plant to recover copper contained in the gold rich leachate and to recycle cyanide. |
Project No.: C-580 January, 2012 | Page 279 - 378 | |
Figure 17.1: General Process Flow Diagram
A maximum capacity of 100,000 t/d per gyratory crusher was considered in the design criteria. The selected crushers operate with an open side setting (OSS) of 220 mm and assumes a maximum run of mine (ROM) feed size of 1200 mm from the open pit and 1,000 mm from underground mining. An effective utilization of 70 % for the Super Pit and Hybrid surface crushers and 75 % utilization for the Hybrid and Full Underground crushers with a common design factor of 1.15 was considered.
The Super Pit considers two 75,000 t/d gyratory primary crushers and the open pit stage of the Hybrid option one 95,000 t/d gyratory primary crusher.
The Full Underground option considers three undercut levels, feeding crushing stations as extraction advances. The upper and the third levels consider jaw crushers and the second level gyratory crushers. The crushers from the upper level are used later in the third level. The underground stage of the Hybrid option considers one undercut level feeding gyratory crushers. The Full Underground option initially considered using jaw crushers in the three levels of extraction, however, due to the intermediate level footprint size this type of equipment was unsuitable.
Project No.: C-580 January, 2012 | Page 280 - 378 | |
The effective utilization for the grinding and flotation plant is estimated at 92 %. A design factor of 1.15 has been used for all equipment except for the grinding mills, where a factor of 1.0 was used.
Metallurgical tests indicate a low to medium rock hardness for grinding purposes; these tests formed the basis for a grinding circuit of P80 at 130 µm being selected.
Current industry experience is that the maximum capacity of one SAG mill and two ball mills is around 100,000 t/d, depending on the primary crusher product particle size distribution, the ore hardness and the final product size requirement. This was the basis of design for the Caspiche grinding circuit.
The Hybrid and Full Underground options consider one SAG mill and two ball mills. The Super Pit considers two identical, parallel grinding circuits of one SAG mill and two ball mills each circuit of 75,000 t/d capacity. The SAG mills will be in open circuit and consider a grate discharge arrangement whilst the ball mills are in closed circuit with hydrocyclone banks. All options consider a short trommel and pebble screen at the discharge of the SAG mills. A pebble crushing plant has been included, assuming a nominal 20 % pebble production rate with a maximum of 30 % for design purposes. Two cyclone clusters for each ball mill are considered. No stand-by cyclone feed pumps are considered; however, a complete spare pump would be ready for replacement.
Rougher flotation is fed with pulp of 38 % solids content and the number and size of cells provide 45 minutes retention time. This high retention time maximizes copper and gold recovery into the rougher concentrates and is required due to the low copper and gold feed grades in the ore.
The Super Pit option considers three pairs of lines with eight 300 m3 flotation cells per line. The Hybrid and Full Underground options consider two pairs of lines with seven 300 m3 flotation cells per line. The rougher concentrate grade was estimated at 2.5 % Cu. Copper rougher recovery was estimated as 85 %, 86 % and 88 % for the Super Pit, Hybrid and Full Underground options respectively.
| 17.1.4 | Rougher Concentrate Regrind and cleaning flotation |
One tower mill per two flotation lines is considered. Regrind cyclones are fed with the rougher concentrate. Discharge from the tower mill and scavenger concentrates are in closed circuit with a cyclone bank. Cyclone underflow feeds the tower mill and cyclone overflow feeds the first cleaning stage. Regrind circuit product P80 is 30 µm.
Regrind product plus second cleaner tailings feed the first cleaner flotation and the tailings are fed directly to the scavenger cleaner flotation. Ten minutes retention time has been considered for the first cleaner and thirty minutes for the scavenger circuit. Two cleaner and five scavenger flotation cells are considered, each of 300 m3. The cell size has been standardized as much as possible in order to reduce spares inventory. Two cleaner cells are common industry practice, however the cleaner / scavenger line has been designed with flexibility in mind and should it be required the configuration of cleaner / scavenger cells can be altered.
Project No.: C-580 January, 2012 | Page 281 - 378 | |
Second and third flotation cleaners are arranged in-line, using conventional 50 m3 flotation cells. The first cleaner concentrate plus the third cleaner tailings feeds the second cleaner and the second cleaner concentrate feeds counter-currently the third cleaner. Retention time is 5 min for secondary and 3 min for tertiary cleaning. Second cleaner concentrate copper grade has been estimated as 18 % for all options.
Global cleaner copper recovery has been estimated at 97.7 % for design purposes. Third cleaner concentrate is the final concentrate which contains approximately 25 % copper.
| 14.1.5 | Final Concentrate Handling |
The final concentrate, estimated to contain approximately 15 % solids, will be thickened to 60 - 63 % solids in a conventional thickener for subsequent pumping via a concentrate pipeline to the roaster plant. A second thickener at the discharge of the pipeline increases the feed to the filters to 70 - 72 % solids. A typical thickening rate of 0.4 m2/t/d was used to design the thickeners.
Concentrates are finally pressure filtered to 8 to 9 % moisture. A typical filtering rate of 500 kg/h/m2 is used. The filtered concentrate being fed to the partial atmosphere roaster to reduce arsenic content in the concentrate.
At the concentrator plant site a one day holding tank is included to regulate the feed to the concentrate pipeline (105 km pipeline for the Super Pit plant, or 98 km long for the Hybrid and Full Underground plants) The partial atmosphere roaster treatment plant will be located at an altitude of approximately 1200 m.a.s.l. and is close to road and other infrastructure. A one hour retention time holding tank is included between the roaster plant thickening and filtering stages. In the case of extended plant stoppage the pipeline discharge thickener will provide additional storage capacity for concentrates produced.
| 17.1.6 | Final Concentrate Treatment |
The final concentrate is calculated by testwork to contain average arsenic grade in the order of 2.5 %. In order to produce commercially viable concentrate, arsenic content must be reduced to below 0.2 %. Arsenic removal was considered using either Pressure Oxidation (POX) or a partial atmosphere roaster circuit. After economic evaluation the roaster option was selected.
Filtered concentrate is roasted in a partially reducing atmosphere to eliminate arsenic and produce a calcined concentrate and sulphuric acid. The arsenic is recovered as scorodite using ferric ion produced by magnetite acid leaching, and disposed of according to environmental regulations. Roasting is performed in a FluoSolids roaster, at around 650 °C and a controlled atmosphere to avoid the conversion of arsenic sulphides to arsenic oxides which would fix the arsenic to the copper compounds inside the roaster. Figure 17.2 illustrates the scorodite precipitation process schematic.
Figure 17.2: Scorodite Precipitation Process Flow Diagram
The copper calcine is approximately 85 % of the original concentrate weight mainly due to the elimination of arsenic and part of the sulphur content. The calcine is cooled, moisture content increased to approximately 9 %, then transported by trucks to the port. At the port the calcine will be discharged to a negative pressure enclosed storage facility, and loaded to ships on a scheduled basis by means of an enclosed conveyor and loader facility.
The gases containing arsenic sulphides and SO2 will be cooled to 370-400 °C and fed to an electrostatic precipitator (ESP). The recovered ESP dust to be blended with the calcine or sold.
The clean gases leaving the ESP will be wet washed before feeding the sulphuric acid plant. The arsenic trioxide will be precipitated and treated with ferric ions to produce scorodite. The scorodite will be disposed of according to environmental regulations in an impoundment area. In the sulphuric plant SO2 will be converted to SO3 to produce 98 % sulphuric acid.
| 17.2 | Pyrite Treatment Facilities |
Cleaner - Scavenger tails will be floated in a building next to the cleaner flotation building. Pyrite flotation concentrate to be thickened in a 42 m diameter steel thickener and then leached in an agitated carbon in leach (CIL) circuit while the pyrite flotation tailings join the rougher flotation tailings at the tailings launder. CIL slurry feed density is controlled at approximately 40 % solids.
Project No.: C-580 January, 2012 | Page 283 - 378 | |
Gold laden carbon will be pumped to the cold desorption plant where it is transferred to the hot desorption plant. The desorbed solution reports to the SART plant to recover sodium cyanide and copper sulphide. At the hot desorption plant gold and silver will be removed from the carbon and the precious metal rich solution processed in an electro-winning and smelting plant to produce doré bullion. Stripped carbon reports to the carbon regeneration plant.
CIL tails report to two 42 m diameter thickeners and then a counter current decantation (CCD) circuit to neutralize cyanide and discharge the tailings slurry to a lined tailings impoundment area separate to the main tailings dam. Wash solution for the CCD circuit is provided from the scavenger flotation thickener. Figure 17.3 illustrates the pyrite treatment circuit.
Figure 17.3: Pyrite Treatment Circuit Process Schematic
The electro-winning plant tails will also be fed to the SART plant which produces cyanide solution and copper sulphide, with gypsum as a waste product.
| 17.2.1 | Flotation Tailings Handling |
For the Super Pit option, the flotation tailings will be thickened to a semi-paste in high rate thickeners and discharged from a number of spigots set around the radius of the containment basin. This discharge philosophy maximizes tailings containment and will allow beaching of tailings thus minimizing water collection against the impoundment dam. The
Project No.: C-580 January, 2012 | Page 284 - 378 | |
For the Hybrid and Full Underground options the tailings dam considers a conventional sand structure. The flotation tailings are thickened to 56 % in high capacity (high rate) thickeners, a typical thickening rate of 0.1035 m2/t/d has been considered. The tailings flow 8 km in a concrete launder, to the tailings impoundment area and are repulped to 50 % solids, with recycled water, pumped to classification cyclones producing separation ratio of 38/62, sands/slimes. Plant fresh water consumption is minimized by recirculating water from the tailings pond.
| 17.2.2 | Cleaner Tailings Treatment |
Gold recovery in the rougher concentrate has been estimated at approximately 80 %; however, the final gold recovery will be approximately 60 % of the gold head grade; this is due to a rougher concentrate copper grade of around 2.5 % which requires a high concentration ratio in the cleaner stage to obtain a saleable final concentrate. This results in gold being left in the cleaner tailings. Additional leaching has been considered to maximize gold recovery.
Metallurgical tests show the possibility of recovering approximately half of the cleaner tails gold by cyanide leaching; however, the copper content in the tailings implies high cyanide consumption and a SART process has been included to recover the copper and regenerate the cyanide; as shown in Figure 17.4.
Figure 17.4: SART Process Flow Diagram
The Sulphidation Acidification Recycling Thickening (SART) feed solution is the overflow of the counter current decantation circuit which treats the tailings of the CIL plant. This solution is mixed with sulphuric acid and sodium hydrosulphide and fed to a precipitation reactor. In this reactor copper sulphide is precipitated at pH 5 and dissolved hydrogen cyanide is generated. The precipitation reactor discharges by gravity into the precipitation thickener. A
Project No.: C-580 January, 2012 | Page 285 - 378 | |
Neutralized barren solution flows by gravity to a second thickener. The gypsum thickener operates with underflow recirculation to increase the size and handleability of the gypsum precipitate. The portion of underflow not recirculated is pumped to the filtration stage. The gypsum filter cake produced is repulped adding fresh water, in order to minimize the cyanide content, and is then pumped to a stand alone tailing pond. The overflow from the gypsum thickener is the treated final product, which is recycled to a carbon in leach process.
| 17.3 | Heap Leach Operations |
The heap leach operations will firstly process the oxide ore removed from the initial levels of the open pit and thereafter a portion of the hypogene MacNeill ore. The oxide will be treated through a 26 Mt/y capacity two stage crushing plant, heap leach cyanidation and Adsorption Desorption and Recovery (ADR) Plant. Once all oxide ore has been processed and the heap leach pad has been sufficiently washed, an interlift liner and drain system will be placed on the pad and the MacNeill ore will be placed on top of this. The MacNeill ore will be processed through the same crusher circuit, however as the material is more competent than the oxide the throughput is estimated as being 12 Mt/yr. The oxide and MacNeill ore cannot be mixed on the heap leach pad as the MacNeill ore contains a certain level of copper and has different leach characteristics. As such any MacNeill ore mined during oxide leaching will be stockpiled and processed once all oxide has been exhausted.
The MacNeill ore has different leaching characteristics than the oxide. Testwork indicates that all recoverable gold will be leached within 30 days and thereafter only the copper content will be leached out, consuming excessive cyanide. As such the MacNeill process considers a leach cycle of 30 days only in a single 7.5 m lift. Once the leach period has been completed the lift will be covered with an interlift liner and the procedure repeated. This process was compared with the use of dynamic on / off pads and was deemed to be the most economically beneficial option. In addition to the shorter leach time a SART plant will be added to the PLS stream when the MacNeill ore is being processed to recover the maximum amount of cyanide, which will be reused in the leach solution and also to extract any copper in solution which may affect downstream operations and heap leach cyanide consumption.
A summary of the heap leach processes is decribed in the following sub-sections :
Mine trucks with ROM ore discharge to a bin pocket. A static grizzly traps rocks larger than 70 % of the jaw crusher opening, and the oversize is reduced with a rock breaker. The ore is classified to 150 mm in a vibratory grizzly, the oversize is fed to a jaw crusher with a closed side setting (CSS) of 125 mm. The grizzly undersize is combined to the crusher product and feeds the secondary screen.
Project No.: C-580 January, 2012 | Page 286 - 378 | |
Secondary screen separation is 50 mm; the undersize is final product and the oversize feeds a standard cone secondary crusher with a CSS of 38 mm working in open circuit. The crushed product is transported to a truck load-out bin by a belt conveyor. Solid lime is added on the conveyor to control pH prior to leaching. The final crushed ore is transported to a valley heap leach by trucks and distributed by bulldozers and graders. Ten metre high lifts and forty metre high benches are considered.
A valley fill cyanide heap leach is considered for gold recovery. The pad will be irrigated over each 10 metre lift using drippers at an irrigation rate of 10 L/h/m2. The nominal cycle is 80 days. Actual leach time is greater because up to four 40 m benches are considered and the cyanide solution will percolate through the whole pad prior to being collected and will continue to leach available gold during this period.
The gold rich solution or pregnant leach solution (PLS), is stored in a PLS pond then pumped to the ADR plant where gold is recovered via carbon adsorption. In the case of a power outage or other emergency, the PLS overflows to the barren solution pond and finally to a containment pond sized to contain eighteen hours of PLS production. The solution irrigation pumping systems will be connected to the emergency energy supply system to allow solution to be recirculated onto the pad during any power outage or downstream interruption in operations.
| 17.3.1.3 | Adsorption, desorption, recovery (ADR) Plant. |
The ADR plant considers a counter current carbon-in-column (CIC) circuit of five columns. These are constructed in series, allowing solution to flow using a cascade gravity system. The carbon is transferred periodically counter-current to the solution by means of a transfer pump. Loaded carbon is then transferred to the elution circuit and barren solution is returned to the barren solution pond for pad irrigation. The CIC circuit has a trash screen at the feed end to remove material which may interfere with the downstream process and a safety screen ahead of the barren solution transfer pump to ensure that no carbon is transported to the barren solution pond.
The loaded carbon is acid washed and desorbed. Both unit operations will be performed in the same stainless steel column. Acid wash requires approximately two hours using 3 % hydrochloric acid. This process removes any scale or calcareous build up on the carbon and ensures effective desorption of the gold on the carbon surface. The acid wash solution is neutralized and pumped to the barren solution tank. Gold is then dissolved from the loaded carbon using a strong caustic cyanide solution.
The gold bearing electrolyte is recirculated through an electrowinning circuit where the gold is either deposited on the electrowinning cell cathode or settles in the electrowinning cell as sludge. The gold is washed from the cathodes periodically and it and the gold bearing sludge in the bottom of the electrowinning cell is filtered and then smelted where bullion doré is produced as final product.
The stripped carbon obtained from desorption is reactivated in a rotary kiln every four cycles and returned to the adsorption columns with additional fresh carbon make up as required. The reactivation stage ensures volatile organics do not build up on the carbon and ensure that it retains its ability to adsorb gold from the PLS.
Project No.: C-580 January, 2012 | Page 287 - 378 | |
The MacNeill ore is processed through the same heap leach as described in 17.2.1 and ADR circuit as the oxides but has the following changes to the circuit to that of the oxide process route.
The MacNeill ore is crushed through the same crushing circuit but at a throughput of 12 Mt per annum due to greater rock competency. As such the coarser MacNeill ROM ore requires two 250 hp jaw crushers. The primary crusher for the oxide ore treatment will be changed to a 250 hp jaw crusher and a second jaw crusher will be added. In the secondary crushing stage the existing MP1000 cone crusher will be modified to a MP1250 model, using the same crusher body but increasing motor power.
Stacking and irrigation are as per described in 17.2. Pregnant solution passes through a SART plant to remove copper and recover cyanide and thereafter treatment and doré production is as per the oxide one.
| 17.4 | Layout Considerations and Design Basis |
The heap leach process plant design has taken into consideration industry norms with regard to utilization and availability in areas of high altitude. The engineering design considers a factor of 1.15 in relevant areas.
The plant location was selected in order to reduce transportation cost to the leach pad over the mine operating life. The crushing plant was located considering trucks feeding the crusher station and leach pad should not haul uphill.
The crushing plant location was selected in order to minimize earthworks.
The plant platforms were also designed with material movement economy in mind, avoiding the use of a single platform for all the crushing and screening stages.
Ore is trucked from the crushed ore storage bin and dumped onto the pad for redistribution by a dozer. The location of the storage bin has been selected to minimize truck transportation costs. In the Super Pit and Hybrid options, oxide and MacNeill material is extracted at a higher rate than crusher capacity. The excess material will be stockpiled for crushing as mine stripping tapers off. The MacNeill stockpiled material will not be processed until all oxide material has been exhausted and oxide leaching has been completed.
The ADR plant is located near the solution ponds to reduce pumping power requirements, as well as to minimize material movement.
The containment pond was placed below the pad waste material base to collect overflow from PLS and barren solution ponds.
The diversion of all up stream superficial water is considered to protect the installations.
The process plant operation will commence with heap leach. Plant operations and maintenance personnel will be recruited prior to operations start up to work in commissioning activities and be trained in plant operations. The heap leach will operate alone for two years then, until leachable ore is exhausted, will operate in parallel with the
Project No.: C-580 January, 2012 | Page 288 - 378 | |
concentrator. Thereafter the concentrator will work alone until end of mine life. In the case of the Super Pit option labour requirements per year are summarized in Table 17.2.
Project No.: C-580 January, 2012 | Page 289 - 378 | |
Table 17.2: Manpower Distribution – Process Plant
| SUPER PIT | Year |
| AREA | -3 | -2 | -1 | 1 | 2 | 3 | 4 | 5 | 6 | 7 | 8 | 9 | 10 | 11 | 12 | 13 | 14 | 15 | 16 | 17 |
| Sulphide Process | | | | 250 | 250 | 250 | 250 | 250 | 250 | 250 | 250 | 250 | 250 | 250 | 250 | 250 | 250 | 250 | 250 | 250 |
| Superintendent | | | | 3 | 3 | 3 | 3 | 3 | 3 | 3 | 3 | 3 | 3 | 3 | 3 | 3 | 3 | 3 | 3 | 3 |
| Shift Foreman | | | | 8 | 8 | 8 | 8 | 8 | 8 | 8 | 8 | 8 | 8 | 8 | 8 | 8 | 8 | 8 | 8 | 8 |
| Operator / Mechanic | | | | 239 | 239 | 239 | 239 | 239 | 239 | 239 | 239 | 239 | 239 | 239 | 239 | 239 | 239 | 239 | 239 | 239 |
| | | | | | | | | | | | | | | | | | | | | |
| Heap Leach Process | | 53 | 52 | 52 | 52 | 52 | 52 | 52 | 52 | 52 | 52 | 52 | 52 | 52 | 52 | 34 | | | | |
| Superintendent | | 1 | 1 | 1 | 1 | 1 | 1 | 1 | 1 | 1 | 1 | 1 | 1 | 1 | 1 | 0 | | | | |
| Shift Foreman | | 4 | 4 | 4 | 4 | 4 | 4 | 4 | 4 | 4 | 4 | 4 | 4 | 4 | 4 | 0 | | | | |
| Operator / Mechanic | | 48 | 48 | 48 | 48 | 48 | 48 | 48 | 48 | 48 | 48 | 48 | 48 | 48 | 48 | 34 | | | | |
| | | | | | | | | | | | | | | | | | | | | |
| TOTAL LABOUR | | 53 | 52 | 302 | 302 | 302 | 302 | 302 | 302 | 302 | 302 | 302 | 302 | 302 | 302 | 284 | 250 | 250 | 250 | 250 |
Project No.: C-580 January, 2012 | Page 290 - 378 | |
| 18.0 | PROJECT INFRASTRUCTURE |
As described in Items 13 and 17, the Caspiche project treats both gold rich oxidized and hypogene ore (MacNeill zone) and copper and gold rich sulphide ore. The oxide and MacNeill ore will be exploited by heap leaching and a CIC-ADR plant, this ore being mined out as part of the sulphide stripping and ongoing operations. The sulphides will be processed through a copper concentrator plant and roaster with a small SART plant to recover gold and silver from the scavenger flotation tailings.
Figure 18.1: Map Plant Area (Source: Aker Solutions, 2011)
Project No.: C-580 January, 2012 | Page 291 - 378 | |
| 18.1 | Super Pit Mining Option |
The Super Pit option considers a 150,000 t/d concentrator plant located some one and a half kilometres north of the pit edge. Figure 18.2 illustrates the site layout for this option.
Figure 18.2: Super Pit Plot Plan (Source: NCL, 2011)
Project No.: C-580 January, 2012 | Page 292 - 378 | |
| 18.1.1 | Copper Concentrate Pipeline Facilities |
From the copper concentrate thickener the thickened concentrate is pumped to a 10,000 m³ header tank and then pumped to the copper concentrate roasting facilities located some 105 km south-west of the concentrator plant.
The concentrate pipeline of 5” diameter is made from HDPE lined carbon steel. Three pumping stations are used to pump the concentrate to the roaster facility. The power for these pumping stations is taken from the 110 kV overhead line which runs from the concentrator main substation to the roaster installations.
The pipeline runs alongside the plant access road for the first 25 km, and is accessed by an inspection road for the remaining 80 km. The pipeline is buried throughout its whole length.
The copper concentrate is discharged into a 25 m diameter conventional thickener increasing the concentrate solids percentage to between 70 – 72 %. The thickened concentrate is then fed to the pressure filters feed box. Two 80 m² horizontal plate pressure filters will feed the copper concentrate, with approximately 8 % moisture, to the concentrate roaster facilities.
| 18.1.2 | Tailings Handling Facilities |
The tailings are fed to three 81 m diameter high rate thickeners with gravity discharge. The thickened tailings flow in launders to the tailings storage facility (TSF).
Knight Pièsold carried out the initial design for the TSF retaining wall. The TSF dam wall has been designed to be an integral part of the waste stockpile stacked to the north of the open pit by the in-pit crushing and conveying system (IPCC).
The wall consists of a 50 m wide compacted strip constructed on the upstream face of the waste stockpile. This is prepared by pushing and re-profiling waste from the waste stockpile as it is being constructed. A further 5 m of compacted, engineered, graded waste covered with an HDPE liner to ensure impermeability and mechanical strength is then placed on the upstream side of the 50 m wide face. The tailings dam face construction will be by traditional means, i.e. trucks, graders, compactors.
The waste deposition and dam face construction schedule will be such that at no time is there less than 10 m plus freeboard and storm surge between the finished level of the tailings dam face and the level of tailings behind the dam.
The waste dump will provide the necessary reinforcement of the tailings dam face as over the life of the mine, approximately 1.7 billion tonnes of stacked waste material will be placed behind the compacted wall face.
Project No.: C-580 January, 2012 | Page 293 - 378 | |
| 18.1.3 | Waste and Stockpile Storage areas |
The waste stockpiles will be constructed, as described in Item 16, by means of waste crushing and conveying system.
For the Super Pit option the waste crushing and handling circuit consists initially of a single system of two gyratory crushers, each crushing 10,500 tonnes per hour and feeding a single conveyor and spreader system. This system will convey waste to the north of the open pit and will form the basis for the TSF wall.
In later years, a second system will be added with the same production characteristics and this system will discharge waste to a waste stockpile to the west of the open pit. The final configuration is as shown in Figure 18.2.
The overall dimensions of the North waste stockpile (Figure 18.3 ) are 3.8 km in the north-east direction by 2.1 km in the north-west direction, covering a total area of approximate 700 ha. The total height is 450 m, from 3,730 m.a.s.l. to 4,180 m.a.s.l.
Figure 18.3: Super Pit Option – North Waste Stockpile (Source: NCL, 2011)
The overall dimensions of the West waste stockpile (Figure 18.4) are 3.0 km in the north-west direction by 1.7 km in the north-east direction, covering a total area of approximate 700 ha. The total height is 423 m, from 3,805 m.a.s.l to 4,228 m.a.s.l.
Project No.: C-580 January, 2012 | Page 294 - 378 | |
Figure 18.4: Super Pit Option – West Waste Stockpile (Source: NCL, 2011)
The waste stockpile configuration was designed according to the parameters presented in Table 18.1.
Table 18.1: Waste Stockpile Design Parameters
| Item | OSA | Batter Angle | Max. Batter Height | Berm Width | Ramp Width @ 10% |
| | (º) | (º) | (m) | (m) | (m) |
| Waste stockpile | 33 | 37 | 200 | 40 | 40 |
Table 18.2 summarizes the storage capacity of the waste stockpile, a swell factor of 30 % has been assumed, considering compaction of the material once dumped.
Table 18.2: Waste Stockpile Storage Capacity
| Stockpile | Volume (000's m3) | Tonnage (‘000) |
| North | 982,251 | 1,768,052 |
| West | 863,828 | 1,554,890 |
The waste stockpile will include further safety berms as recommended by geotechnical evaluation. Further evaluation will be required as the project advances and additional geotechnical data is generated.
Project No.: C-580 January, 2012 | Page 295 - 378 | |
The Hybrid Mining option considers a 95,000 t/d concentrator plant located approximately 7 km west of the pit edge (see Figure 18.5).
| 18.2.1 | Copper Concentrate Pipeline Facilities |
Concentrate pumping and handling is largely as per that described in section 18.1.1, however the concentrate pipeline in this case is 98 km long.
The pipeline runs alongside the plant access road for the first 18 km, and for the remaining 80 km alongside the main access road. The pipeline is buried for its whole length.
| 18.2.2 | Tailings Handling Facilities |
The density of the tailings is increased in three 65 m diameter high rate thickeners with gravity discharge.
The thickened tailings are conducted in launders to the tailings cyclone cluster for classification of sands and slimes, at the TSF site eight kilometres downstream of the concentrator. The dam wall will be made from tailings sands and the slimes will be deposited behind the dam.
Recovered water will be collected in a small tank and pumped to a recycle pond located near the concentrator.
Project No.: C-580 January, 2012 | Page 296 - 378 | |
Figure 18.5: Hybrid Option Plot Plan (Source: NCL, 2011)
Project No.: C-580 January, 2012 | Page 297 - 378 | |
| 18.2.3 | Waste and Stockpile Storage areas |
In the case of the Hybrid option a single system of two gyratory crushers and a single conveying and spreading system with an overall capacity of 21,000 t/h is considered and discharges to the west waste stockpile. The final configuration of the waste stockpile is shown in Figure 18.5.
The overall dimensions of the waste stockpile are 2.5 km in the northwest direction by 1.3 km in the northeast direction, covering a total area of approximate 6 km². The total height is 400 m, from 3,855 m.a.s.l to 4,255 m.a.s.l.
Figure 18.6: Hybrid Option - Waste Stockpile (Source: NCL, 2011)
The waste stockpile configuration was designed according to the same parameters considered for the Super Pit option.
Table 18.3 summarizes the storage capacity of the waste stockpile, a swell factor of 30 % has been assumed, considering compaction of the material once deposited.
Table 18.3: Waste Stockpile Storage Capacity
| Crest Elevation (m.a.s.l.) | Volume (000's m3) | Tonnage (‘000) |
| 4,255 | 457,058 | 822,705 |
Project No.: C-580 January, 2012 | Page 298 - 378 | |
The designed waste stockpile meets the total requirement of 820 Mt of waste material scheduled in the mine production plan for the open pit section of the Hybrid option. Waste material has also been used to build the waste belt conveyor corridor and plant infrastructure. This material totals 73 Mt.
| 18.3 | Full Underground Mining Option |
The Full Underground Mining option considers a 90,000 t/d concentrator plant located some seven kilometres west of the mine (see Figure 18.7).
| 18.3.1 | Copper Concentrate Pipeline |
The concentrate pipeline is the same as per the hybrid option described in 18.2.1.
| 18.3.2 | Tailings Handling Facilities |
The density of the tailings is increased in three 63 m diameter high rate thickeners with gravity discharge.
The thickened tailings disposal and water recovery will be performed as described for the Hybrid mining alternative in 18.2.2.
| 18.3.3 | Waste and Stockpile Storage areas |
The surface layout of the Full Underground option is shown in Figure 18.7. Underground subsidence projected to surface has been used to limit permanent infrastructure location. During the engineering and construction stages of the underground mine, the heap leach operation will be developed and the surface layout considers waste stockpile, leach pad and plant installations for the heap leach process.
One waste rock storage area north of the pit was designed to contain all of the waste material. The final configuration is shown in Figure 18.7. In this option, no waste crushing and conveying option was considered due to the relatively low volume of waste material produced. As such waste stockpile construction is by means of conventional truck, dozer and grader fleet.
The overall dimensions of the waste stockpile (Figure 18.8) are 1.2 km in the east-west direction by 0.7 km in the north-south direction, covering a total area of approximate 122.3 ha. The total height is 195 m, from 4180 m.a.s.l to 4375 m.a.s.l.
Project No.: C-580 January, 2012 | Page 299 - 378 | |
Figure 18.7: Underground Option Plot Plan (Source: NCL, 2011)
Project No.: C-580 January, 2012 | Page 300 - 378 | |
Figure 18.8: Full Underground Option – Heap Leach Waste Stockpile (Source: NCL, 2011)
The waste stockpile configuration was designed according to the parameters presented in Table 18.4.
Table 18.4: Waste Stockpile Design Parameters
| Item | OSA | Batter Angle | Max. Batter Height | Berm Width | Ramp Width @ 10% |
| | (º) | (º) | (m) | (m) | (m) |
| Waste Stockpile | 30 | 37 | 150 | 35 | 30 |
Table 18.5 summarizes the storage capacity of the waste stockpile, a swell factor of 30 % has been assumed, considering compaction of the material once dumped.
Table 18.5: Heap Leach Waste Stockpile Storage Capacity
| Crest Elevation (m.a.s.l.) | Volume (000's m3) | Tonnage (‘000) |
| 4375 | 86,014 | 154,825 |
Project No.: C-580 January, 2012 | Page 301 - 378 | |
| 18.4 | Common Support Infrastructure |
| 18.4.1 | Fresh Water Facilities |
There are two separate catchment areas considered for project fresh water supply, one at Cuenca 1 and the other at Punto Verde, both located approximately 150 km away from the plant (Figure 18.1). The design currently considers a single uptake point for each water source, this will be defined by further technical evaluation of the catchment characteristics. A pumping station with three operating pumps and one standby is considered for each well location.
Both stations pump water to a common point, and thereafter through a single pipeline with three boosting stations to the process plant. The waterline discharges to the fresh water pond located near the sulphide plant, which feeds the plant as well as the mine and heap leach facilities. Power for the fresh water pumping installations is supplied via a 110 kV overhead line connected to the concentrator main substation.
A 4 m wide maintenance road runs alongside the pipeline.
The pipeline routing was completed considering only topographic aspects. Land surveys, geomorphology and archaeological studies were not available and will be developed in the next engineering phases.
Exeter has to date not completed full environmental and technical evaluation of the water sources and is working with Schlumberger Water Services to expand the current test and monitoring program.
A consideration for the purchase of these water rights has been included within the Owners Costs.
| 18.4.2 | Electrical Facilities |
Electrical power for the plant will be drawn from Chile’s Central Interconnected System (Sistema Interconectado Central, SIC) through an overhead line with a double 220 kV circuit from the Cardones electrical substation, located some 20 km south of Copiapó and 120 km from the Caspiche Project main substation. It is envisaged that this power line will be constructed and operated by a contractor, i.e. Build, Own and Operate (BOO).
In later engineering stages, feeding the project from Substation Carrera Pinto should be studied. Carrera Pinto station is located 70 km northeast of Copiapó and 96 km from Caspiche site. This alternative could be a viable option once Castilla power plant starts operating because Cardones station is currently highly congested and there are several new mining projects under development in the area.
The project primary electrical system starts at two 220 kV circuit inlets from the SIC in the project main electrical substation. This substation has a 220 kV tension level and it includes two subsystems on its 220 kV busbar. The first subsystem includes a GIS substation (SF6 gas insulation) with four 60/80/100 MVA, 220/23 kV power transformers for 23 kV power distribution to the process plant. The other includes a 110 kV AIS substation (air insulated) with two 30/40 MVA, 220/110 kV power transformers for 110 kV power distribution to the off-site facilities through 110 kV overhead lines.
Project No.: C-580 January, 2012 | Page 302 - 378 | |
The main substation also considers two 23 kV harmonics filters for harmonics control and power factor improvement; and an emergency generation station with 6 x 2,500 kW generators to back critical equipment up in case of a SIC failure.
Power will be distributed to the plant in medium voltage from the GIS 23 kV switchgear located in the project main substation through overhead lines and duct banks to the secondary substations. The secondary substation electrical rooms will distribute energy to the plant equipment in medium voltage (3.3 kV) and low voltage (400 V).
The fresh water supply and the concentrate pumping system and roasting plant are fed by 110 kV overhead lines of 114 km and 105 km.
The hybrid and full underground options have similar electrical facilities as those of the super pit but only require three 60/80/100 MVA 220/23 kV transformers. The 110 kV system will have two 20/26.6 MVA power transformers, 220/110 kV. Additionally the underground facilities will be powered through two 23 kV overhead lines that enter the mine through the main haulage tunnel. The underground facilities will consider local substations for underground equipment consumption.
Concentrate trucks will be loaded at the roasting facilities and then will drive to the selected port location. Exeter has signed memoranda of understanding with port owners and is discussing alternatives with other port operators in order to secure the best option for concentrate shipment.
The camp for Hybrid and Full Underground options will be typically of a prefabricated modular structure, located 5 km from the Concentrate plant and will have capacity for 2800 people. The camp for the Super Pit option will be located at the current location of the geology camp, some 13 km northwest (2,950 m.a.s.l.) from the mine site. The camp will have capacity for 2500 people in year zero and will increase by a further 800 people in the second year.
The size of the camp considers capacity for third party contractors that, according to the experience of other projects, may add 30 % to 40 % more people to the owners direct hire personnel.
Sewage from the camp will be routed to a sewage treatment plant sized for effluent for 3300 employees.
Septic tanks will collect sewage from the administration office, security gatehouse and truck shop. The septic sludge will be pumped out and transported by truck to the treatment facilities.
Suitable areas will be designated for the storage of common household waste, produced over the life of the mining operations.
Project No.: C-580 January, 2012 | Page 303 - 378 | |
A contract to haul solid waste from the site will need further review, to be completed at the next phase of engineering.
The assay laboratory will be a modular building type structure fully fitted with laboratory equipment and services so as to reduce the cost of construction and installation. The structure will include a sample preparation room, fire assay, wet laboratory, instrumentation, lunch room, offices, restroom and electrical sections.
Bag houses, air handling units, cabinets and countertops, dust hoods, drying ovens, fume hoods and scrubbers will be part of the equipment.
The laboratory will provide the assaying requirements for the mine and process plant and provide metallurgical test work capability for approximately 45,000 samples per year.
| 18.4.8 | Concentrator Maintenance Shop and Warehouse |
A maintenance workshop will be located in the concentrator area. It will be subdivided into the following main sections: welding shop, mechanical shop, machine shop, electrical workshop, instrument shop / tool room and warehouse. It will have numerous offices for personnel, lunch room and rest/change rooms.
| - | The welding shop will be equipped with portable welding machines, work benches and means for storing gas cylinders. |
| - | Also provided will be a welding fumes extraction system. |
| - | The mechanical shop will be furnished with several work benches and required equipment for normal maintenance activities. |
| - | Machine tools for the machine shop will include a lathe, drill presses and a hydraulic press. |
| - | Normal electrical testing equipment and work benches will be provided |
| - | A fenced area for additional storage will be located outside adjacent to the warehouse. |
Project No.: C-580 January, 2012 | Page 304 - 378 | |
Utilities provided include electric power, portable water, compressed air and a sewage system.
| 18.4.9 | Administration Building |
The administration building will be a single storey building. The building will have offices for plant senior management and administrative and technical staff.
There will be offices for secretarial and accounting personnel. In addition, the building will have a reception area, a training room, a dining room with kitchen, a large conference hall, smaller meeting rooms, a library, male and female rest rooms and the typical office supply and equipment rooms.
The building will have a central air conditioning system and be equipped with swing windows. Utilities provided include electric power, potable water and a sewage system. Main telephone switchboard and network servers for the operation will be located in the administration building.
A parking lot for approximately 25 cars and a bus loading area will be located adjacent to the building. Additional parking will be provided with walking distance.
The mine truck workshop will be located north of the open pit. It will contain ten bays, each with two truck service stations, so that up to eighteen trucks can be serviced at any one time. Each bay will be 21 m wide, 21 m long and 21 m high. The bays will have vertically lifting doors at both ends. Exhaust fume extraction fans will be provided for each service station. Ventilators for space ventilation will be located on the roof of the building.
Overhead traveling cranes will be provided for maintenance purposes.
The truck workshop building will contain lay-down areas and storage rooms furnished with racks and containers for storage of spare parts. Offices for operating personnel, first aid room, lunch room as well as toilet, shower and change facilities will be located in a separate wing of the building.
A compressor supplying compressed air, complete with air receiver/storage vessels, will be housed in its own enclosure outside the truck workshop.
Located outside in a dedicated fenced enclosure will be facilities for:
| ● | Tire shops for tire storage and repair and a tire mounting machine. |
The truck workshop building, outside storage facilities and work areas, parking and open space otherwise available for truck servicing will cover an area of approximately 240 m x 340 m.
Project No.: C-580 January, 2012 | Page 305 - 378 | |
Diesel and gasoline fuelling stations will be located near the respective fuel storage tanks in the vicinity of the mine truck workshop. Mine haul trucks will be refuelled with diesel fuel in the mine by a refuelling truck.
The fuel storage tanks will be above ground and have berms to contain any spillage of fuel. Both diesel and gasoline fuel will be delivered to the process area by trucks and then pumped to the storage tanks.
| 18.4.12.1 | Off-site Communications |
Basic telephone service will be initially supplied via satellite communication. Cell phone communication for both voice and data will be developed to service the needs of the project during construction and operations. Telephone communication will include but not be limited to:
| ● | Site administration to Owner’s office in Santiago, Roaster facility office and Port office |
| ● | Roaster Facility to a Owner’s office in Santiago, Site administration office and Port office |
| ● | Port office to Owner’s office in Santiago, Roaster facility office and Site administration office |
| ● | Internet will be accessible with connectivity to the intranet for the home office during construction and operation. |
| ● | An emergency phone connected to the UPS in the control room will be provided on the satellite service. |
| 18.4.12.2 | On-site Communication |
Permitting and licensing will be required by Caspiche Plant for two (2) wireless systems using portable radios.
| ● | One dedicated to the mining operation with base tower located at the concentrator administration building. |
| ● | The second systems will be dedicated to concentrator, roaster facility and port facility with the base station located in each facility main control rooms. |
| ● | The Operations Manager will have access to both systems at mining and concentrator |
| ● | The Concentrator/Roaster/Port facility managers will have access to their own systems. |
All facilities will have internal telephone systems connected to all buildings on sites.
Closed circuit television is to be installed at key areas for security monitoring and surveillance, such as approach to the security gatehouse, intersections of mine haul roads, entrances to mine administration building and conveyor gantries and electrowinning and gold room facilities. At least a 30-h record time will be saved in memory on safe storage media.
Project No.: C-580 January, 2012 | Page 306 - 378 | |
| 19.0 | Marketing Studies and Contracts |
Selmar International Services Ltda (Selmar) was commissioned by Sociedad Contractual Minera Eton Chile (“Eton”), Exeter Resource Corporation´s (“Exeter”) Chilean registered operating company, to provide key marketing assumptions for the Prefeasibility Study of the Caspiche Project in the Maricunga Belt, 3rd Region, Chile (“Project”). In undertaking this commission Selmar worked with its Vancouver, Canada associate - Neil S. Seldon & Associates Ltd (“NSA”). Selmar is a Chilean based company and part of Metallicarum International (MIL). MIL provide consulting advisory services and research focusing on the commercial aspects relative to mining and base and precious metal marketing, transportation and distribution, feasibility market studies, marketing audits, strategies, policy and price risk management. MIL commercial expertise is allied to a number of internationally recognized research groups in copper, lead, zinc and precious metals.
In preparing this report, Selmar has used the services of Alfonso Gonzalez, a copper market analyst, as a sub-consultant. Alfonso Gonzalez is based in Chile and provides consulting services with respect to market statistics for the copper industry on a subscription basis to private clients. Where applicable in this report certain tables and charts are attributed to Alfonso Gonzalez.
For this marketing assessment for the Caspiche project, assumptions are based on metallurgical data and reports provided by Exeter to Selmar with respect to the copper concentrate, sulphuric acid, doré metal and copper sulphide characteristics. Selmar’s commentary and outlook on concentrate marketability and related smelter charges, including treatment, refining, penalty details, payment timing, metal accountability, and other contract terms, are based on Selmar’s market knowledge and use of data available in the public domain. Selmar has not contacted any smelters specifically to discuss the marketability of the Caspiche calcine concentrates. As the project progresses through the next phase of the feasibility study, it is recommended that contact be made with smelters to discuss the acceptability of the proposed calcine from the Caspiche project and associated treatment and refining charges.
A high-level evaluation of the marketability of sulphuric acid by-product from the proposed roasting facility was completed with the assistance of a specialist sub-consultant retained by Selmar.
Selmar’s report is divided into various sections, in respect of which a summary of its main points is provided hereunder.
The Qualified Person responsible for the review of this item has confirmed that the analyses and results in the Selmar report support the assumptions of this Report.
| 19.2 | Refined Copper Market |
In forecasting refined copper supply demand market, one must recognize the risks of long-term projections, given the fact that projects have not been committed or are in the possible or probable stage or at an early stage of construction.
Project No.: C-580 January, 2012 | Page 307 - 378 | |
Recent studies by banking and other research groups indicate that there are not enough projects in the pipeline to balance the copper market going forward assuming the projected demand growth.
In recent years, the timeline for mine development has become extended in the face of the need for more exhaustive environmental and social economic issues and for any major project a lead development time of 8 to 10 years is not unusual. In consequence, the estimate for the development of the expected projects at various stages in the pipeline has a reasonable degree of certainty and there is limited potential for supply surprises on the upside. On the other hand, the trend over the past decade has been the opposite with project delays being seen for a variety of reasons. At the beginning of the current decade, the expectation was that new mine development would add substantial supplies, but in practice this did not happen. Reasons included more focus on environmental and social economic issues, rising capital and operating costs, which pushed up the required copper price, as well as the world financial crisis in 2008-2009 which all contributed to the shortfall.
Secondary copper (scrap and recycling) demand is increasing; in China for example, where domestic consumption of products using copper has resulted in these products being replaced with alternative materials.
The following chart sourced from the Bank of America Merrill Lynch Commodity Research publication of 06 July 2011 serves to illustrate these points.
Project No.: C-580 January, 2012 | Page 308 - 378 | |
Figure 19.1: The Shortfall in Refined Copper Could Reach 6 Million Tonnes by 2020
In the longer run, strong copper demand growth prospects are based on the expected resource intensive of use in economies such as China, India and other developing countries. Demand is associated with investment in power distribution networks and other infrastructure development as countries industrialize and urbanize.
The implications are nothing short of profound. Projections for iron ore, aluminium and copper suggest that demand could double or even triple over the next 25 years.
A recent study by the Development Research Center under China’s State Council concluded that China’s industrialization stage will last into the 2020’s with potential GDP growth estimated to be in the 8 to 10 per cent range.
China today consumes about 40 % of the world’s refined copper, and it is expected to continue to grow and may rise to 52 % by 2022.
Project No.: C-580 January, 2012 | Page 309 - 378 | |
Figure 19.2: China is now the Dominant Metal Market Participant
| 19.3 | Copper - the Longer Term Price |
Reflecting the tight market situation, copper prices are currently in the range of $ 9,000 to 10,000 a tonne – about four times higher than the average level through the 1990’s and well above levels seen in recent years.
Prices could remain near current levels as long as production growth continues to under-perform against the underlying demand trend creating a need to ration supplies.
It does not make sense to forecast a single constant dollar price from today going forward. Given the uncertainty in the market place, Selmar suggests that Table 19.2 illustrates reasonable ranges to be expected for prices in dollars of the day until 2014 and then in constant 2011 dollars as prices move down from today's levels toward more sustainable long-term levels.
There is every indication that inflation will again become a factor.
Project No.: C-580 January, 2012 | Page 310 - 378 | |
Table 19.1: Outlook for the Copper Price
| Year | $ of the day | $ of the day | $ of the day | $ of the day | $ of the day | Constant |
| | 2011 | 2012 | 2013 | 2014 | 2015 | Long-term |
| US$/tonne | 9,000 / 9,750 | 9,000 / 11,000 | 8,000 / 10,000 | 7,000 / 9,000 | 6,000 / 8,000 | 5,500 / 6,500 |
| US$/lb | 4.08 / 4.42 | 4.08 / 4.99 | 3.08 / 4.54 | 3.17 / 4.08 | 2.72 / 3.08 | 2.50 / 2.95 |
| 19.4 | Copper Concentrate Market Outlook |
Global copper concentrate production in 2010 was 12.8 million tonnes of contained copper or about four fifths of total newly-mined copper production of 16.2 million tonnes.
The balance of 20 % newly-mined copper comes from SX-EW electrowon copper cathode and other copper-bearing by-products.
Concentrate supplies are expected to increase particularly between 2013 - 2018 as a result of new projects now in the advanced feasibility and development stage and announced expansions of operational mines. Among the largest projects underway or being considered are:
| ● | PPC’s Caserones project in Chile |
| ● | Rio Tinto’s Oyu Tolgoi project in Mongolia |
| ● | Codelco’s Ministro Hales project in Chile |
| ● | Codelco’s Radomiro Tomic sulphide project in Chile |
| ● | Goldcorp’s El Morro project in Chile |
| ● | Barrick’s Cerro Casale project in Chile |
| ● | Barrick’s Zaldivar sulphide project in Chile |
| ● | Teck’s Quebrada Blanca sulphide in Chile |
| ● | Quadra Mining’s Sierra Gorda project in Chile |
| ● | Anglo’s Quellaveco project in Peru |
| ● | Xstrata’s Antapaccay in Peru |
| ● | Xstrata’s Las Bambas project in Peru |
| ● | Chinalco’s Toromocho project in Peru |
| ● | Minmetals Galeno project in Peru |
| ● | Anglo’s Michiquillay project in Peru |
| ● | Vale’s Salobo project in Brazil |
| ● | Xstrata’s Frieda River in PNG |
| ● | Xstrata’s Tampakan in the Philippines |
| ● | MCC’s (China) Aynak project in Afghanistan |
| ● | Kazakhmys’ Boschekul project in Kazakhstan |
Project No.: C-580 January, 2012 | Page 311 - 378 | |
| ● | Xstrata’s (Yamana) Agua Rica project in Argentina |
| ● | Anglo/Northern Dynasty’s Pebble project in Alaska, USA |
| ● | Augusta’s Rosemont Ranch project in the USA |
| ● | Teck/Novagold’s Galore Creek in Canada |
| ● | Zambia concentrates projects |
| ● | DRC concentrates projects |
The largest increases in production from expansion projects over the next decade are expected to be from the following producers:
| ● | Anglo American’s Los Bronces mine in Chile |
| ● | Xstrata/Anglo’s Collahuasi mine in Chile |
| ● | BHP Billiton Escondida mine in Chile |
| ● | Freeport’s Grasberg operation in Indonesia |
| ● | Buena Vista (ex-Cananea) in Mexico |
| ● | Olympic Dam in Australia |
| ● | Codelco’s Andina mine in Chile. |
Over the next ten years further increases in mine production and developments are expected in higher risk countries such as Pakistan, Kazakhstan, Afghanistan and the DRC.
The copper concentrate market has seen recent significant structural imbalances between mine production and smelting capacities, and by the middle of the decade if all new project and expansion plans are met there will be a surplus of concentrates. This in theory could last for several years, increasing smelter Treatment and Refining charges (TC/RC’s). Such increasing charges will also be the result of increased costs on the smelter side and it is evident that in China there is a move towards achieving more economic terms for the smelter. However, several times in recent years, China has attempted to "force" the smelting industry to work together to achieve this, but such attempts have not always lasted.
Imbalances between concentrate supply and demand are not unusual and are heavily influenced by different lead times to construct. For instance mines outside China and smelters in China, where the latter can be brought on line in three to four years whilst longer mine development lead time has been noted previously.
Custom smelter capacity is expected to grow significantly in the latter part of the decade to meet increased refined copper demand, particularly in China and India. More than fifty percent of global custom smelting capacity is expected will be located in China in 10 years time.
Domestic demand for copper in China and India as well as elsewhere in Asia is pointing towards new smelting capacity largely being built in these areas. The effect will be that smelter development is market driven to meet such domestic demand.
Project No.: C-580 January, 2012 | Page 312 - 378 | |
| 19.5 | Treatment and Refining Charges (TC/RC’s) |
In Selmar’s view there should be no difference in smelter TC/RC terms applicable to calcine concentrates compared to standard copper sulphide concentrates. The main difference will be reflected in the penalty structure and the payment terms assuming it would take the smelters more time to consume / blend the calcine due to its physical and chemical characteristics.
Over the last two decades the penalty revenues associated with the treatment of arsenic did not justify the risk associated with developing such treatment or provide the incentive to invest in new technology. However, there are other aspects, including increased regulation not only on the smelter side, but also in the movement of residues and other by-products which are forcing the development of treatment technology. In addition, more attention has to be given to the requirements of various authorities and indigenous peoples to ensure their support.
From the perspective of smelter costs and revenues, the trend is now changing and more recently arsenic penalties have increased to US$3.00 per each 0.1 % As, while simultaneously the threshold for the application of penalties has been lowered from the "traditional" 0.2 %. Application of penalties is now being seen at lower thresholds depending on the market. A new tier of significantly higher penalties for concentrates with arsenic levels above 0.5 % may be introduced, reflecting the gradual change necessary to justify operating costs and investment in arsenic reduction.
Table 19.2 illustrates long-term smelter charges, to be used as assumptions for PFS evaluation of Caspiche concentrates.
Project No.: C-580 January, 2012 | Page 313 - 378 | |
Table 19.2: Concentrates - Commercial Terms Assumptions
| Payable Metals | | | | Recommendation |
| Copper payable | (%) ( min. ded. 1unit) | | | 96.5 |
| Gold payable | (%) | | | 97.5 |
| Silver payable | (%) > 30 g/t | | | 90.0 |
| | | | | |
| Commercial terms | | | | Recommendation |
| Concentrate TC | ( US$/dmt ) | | | 85.0 |
| Copper RC | ( US$/lb payable ) | | | 0.085 |
| Copper PP | (%) | | | 0% |
| Gold RC | ( US$/oz payable ) | | | 6.0 |
| Silver RC | ( US$/oz payable ) | | | 0.50 |
| Arsenic penalty | 0.1- 0.5% / 0.1% As | | | 3,0 |
| Arsenic penalty | > 0.5% / 0.1% As | | | 10,0 |
| Antimony penalty | 0.1- 0.3% / 0.1% Sb | | | 4.0 |
| Ocean Freight | ( US$/dmt ) | | | 76.0 |
Notes It is often the case that where a percentage payment for payable metals is applied it is often subject to a minimum deduction. In the case of copper a 96.5 % payment is applied, for concentrates grading below 28.57 % Cu a further 1 % of concentrate grade is deducted.
It should be noted that delivery of concentrates is on the basis of CIF-FO (Cost, Insurance and Freight, Free Out) smelter ports. Therefore the mine must bear the cost of delivering the concentrates to the receiving smelter’s port, and the buyer is responsible for unloading the cargo and the cost thereof.
| 19.6 | Marketability of Caspiche Sulphide Concentrates |
Exeter reported in March 2011 positive results from Caspiche Project Sulphide test work. Indicating “the pilot plant recovered 75 kilograms of concentrate from approximately 10 metric tons of diamond drill core representative of Caspiche sulphide mineralization. The resulting concentrates assayed on average 23.5 % copper, 35 g/t gold, 75 g/t silver and 2.4 % arsenic”.
In Selmar’s opinion the arsenic content in these concentrates at 2.4 % is at a level where very few smelters, if any, would be prepared to accept any substantial quantity.
Test work has confirmed the successful application of both reduction roasting and pressure oxidation technologies to reduce or eliminate arsenic from the sulphide concentrates produced by flotation.
Reduction roasting was recently selected for Codelco’s new Ministro Hales copper mine in northern Chile. This mine is expected to come on stream late 2013 / early 2014. Selmar understands that Ministro Hales flotation concentrate prior to roasting would have an arsenic level similar or higher than that reported by Exeter for the Caspiche project.
Two suppliers of roaster technology, Outotec and Technip completed successful test work on the concentrates, reducing the arsenic content to less than 0.2 %, while retaining sulphur content of 25 %. Roasting did not result in copper or gold losses. The resulting roaster calcine met a specification that would be acceptable to 3rd party smelters.
Exeter has provided certain analysis detail for both the unroasted copper concentrates and for the calcined concentrates after partial roasting as shown in Table 19.3.
Project No.: C-580 January, 2012 | Page 314 - 378 | |
Table 19.3: Elemental Analysis of Calcine Test Products
| Test | Temp. | Cu | Fe | S | Zn | As | Sb | SiO2 | Al2O3 |
| (°C) | (%) | (%) | (%) | (%) | (%) | (%) | (%) | (%) |
| 113/10* | | 23.6 | 25.9 | 32.8 | 0.75 | 2.40 | 0.53 | 9.2 | 1.8 |
| 1 | 600 | 22.8 | 31.4 | 27.9 | 0.63 | 0.19 | 0.25 | 12.7 | 2.4 |
| 2 | 650 | 24.1 | 31.1 | 27.3 | 0.73 | 0.14 | 0.18 | 12.0 | 2.2 |
| 3 | 700 | 24.9 | 30.9 | 27.2 | 0.75 | 0.16 | 0.13 | 11.8 | 2.2 |
| 4 | 725 | 26.0 | 30.8 | 25.5 | 0.81 | 0.19 | 0.16 | 11.4 | 2.2 |
| 5 | 600 | 23.5 | 30.9 | 27.6 | 0.68 | 0.33 | 0.24 | 12.2 | 2.4 |
| 6 | 650 | 24.1 | 31.3 | 25.5 | 0.69 | 0.11 | 0.16 | 12.7 | 2.3 |
| 7 | 700 | 25.0 | 31.0 | 25.6 | 0.74 | 0.18 | 0.15 | 11.7 | 2.2 |
| 8 | 725 | 25.4 | 31.0 | 24.1 | 0.75 | 0.26 | 0.16 | 11.5 | 2.5 |
A residual sulphur level in the calcine of approximately 25 % should not be an issue for smelters, but this will depend on the individual smelter plant blend mix.
The key challenge when addressing the marketability of Caspiche sulphide concentrates is the availability of a sustainable long-term market for calcined concentrates, given that product quality issues, especially arsenic and antimony impurities, are a major concern for custom smelters world-wide in the current and medium term scenarios. This is an industry issue. The Caspiche project timing toward the end of the decade or early in the next has some advantage in that current projects at various stages of feasibility studies in the pipeline are also considering roaster technology or hydro-metallurgical treatment of arsenic-rich concentrates.
There is substantial ongoing research into hydro-metallurgical treatment of arsenic-rich concentrates, which could well become feasible in the timeframe of Caspiche Project development alleviating the increasing constraints of custom smelters.
In simple terms the ability of smelters to process arsenic bearing concentrates has decreased over the last several years due to a variety of factors including environmental and legislative controls as well as technical factors. It is therefore not just a question of saying that arsenic will be penalized over a certain level and looking at it purely as a cost, but in reality the question is whether or not higher arsenic bearing material can be placed under long term offtake agreements.
Significant additional tonnages of arsenic bearing concentrates from existing arsenic-rich mine expansions and new projects are expected to enter the market in the next 5 to 8 years. The largest increase of arsenic in concentrates is expected between 2011 and 2017 and is to come from new arsenic-rich projects and announced expansions of operational mines including Los Bronces, Mina Ministro Alejandro Hales, Collahuasi, Escondida, Los Pelambres, Grasberg, Batu Hijau, Oyu Tolgoi and Chelopech. Reportedly this could increase the global average arsenic content in copper concentrates from 0.16 % in 2010 to around 0.22 % on average by 2020, a 37 % increase, exacerbating custom smelters constraints and hence the need to adapt to this reality.
After partial roasting, the residual arsenic contained in Caspiche calcine concentrates, is likely to be at a level below 0.2 %. Generally, smelters target a feed blend at sub 0.1 % As but based on the overall feed, some smelters have the ability to take concentrates with As values higher than 0.2 % As, providing it can be blended down.
Project No.: C-580 January, 2012 | Page 315 - 378 | |
From a physical perspective, there may be some concern in the minds of offtake smelters in that a calcine at 0 % moisture would be inherently dusty and thus pose materials handling issues from both an environmental and plant hygiene perspective. Exeter has advised that the intent is to add water at the point of origin and it is expected that it will behave like normal concentrates and there would be a no need to pelletize. It should be noted that pelletized concentrates are not widely accepted by smelters and could pose feed issues to the reactors.
Without any discussion with smelters to ascertain the quantity that can be taken and the cost thereof, in Selmar’s opinion based on the calcine quality supplied by Exeter at about 26 % copper, 40 g/t gold, 90 g/t silver, 25 % sulphur, arsenic levels of less than 0.2 % and antimony levels of 0.25 %, it should be feasible to find a sustainable long-term market for such concentrates. Nevertheless, securing long term smelter contracts for arsenic bearing concentrates is a challenge.
Based on Selmar’s involvement in the market the likelihood is that a greater number of sales contracts will be required for Caspiche calcine than would be the case for sulphide copper concentrates. While some smelters with precious metals refinery circuits might favour high gold and silver bearing concentrates, this is not true for all, particularly for most Chinese smelters at present.
Selmar recommends that once the PFS is complete, detailed project presentations should be made to smelters to ascertain and quantify potential interest.
| 19.7 | Logistics Load Port Options |
Four port options located in Atacama Region III were identified with potential capabilities for loading Caspiche calcine concentrate shipments in bulk.
For purposes of planning and assuming there is likely to be more than one discharge port, a freight rate of US$ 70 per wmt +/- 15 % in constant 2011 dollars is suggested for 10,000 tonne parcels of calcine concentrates.
| 19.8 | Sulphuric Acid Market |
The partial roasting facility would generate approximately 105,000 tonnes per year of by-product sulphuric acid. Potential start-up is 2018-2020 with a life of mine of 15 years. Given the continued structural deficit of sulphuric acid in Chile and the base and probable future scenarios for Chile and Peru, it should not be a major problem to find a market for Caspiche annual acid production, provided such acid quality is standard for copper leaching processes and without deleterious impurities.
Furthermore, the regional balance in the vicinity of Caspiche Project suggests that the region as a whole has a structural deficit of around half a million tonnes of acid per year. Further project developments may increase this deficit.
For purposes of planning and assuming there is a local market for acid production, a price in a range US$ 100 to US$ 150 in constant dollars per tonne basis delivered Mejillones Port is suggested.
Project No.: C-580 January, 2012 | Page 316 - 378 | |
This market is very competitive and in many cases payable metals approaches 100 % and there is not a great deal of variance in terms between refineries. This situation is expected to continue in the foreseeable future.
The long term gold price assumptions seen in the market recently for major projects are in the US$ 900 to US$1,200 per ounce range.
Given that Cu2S precipitate is basically a chalcocite it should be relatively straightforward to smelt as compared to chalcopyrite concentrates.
Due to its high grade / value per tonne, Selmar does not recommend mixing it with the calcine concentrate as the copper value might be lost in sampling.
Considering the small volume of approximately 500 tonnes per year and expected copper content and from the SART plant, in Selmar’s opinion finding a smelter to buy the Caspiche Cu2S precipitate should not be a concern.
Marketing the production in big bags directly to a local smelter such as Enami should be pursued in first instance, but if this is not possible, then the alternative route would be to arrange containerized shipments to an overseas smelter
Project No.: C-580 January, 2012 | Page 317- 378 | |
| 20.0 | Environmental Considerations |
Exeter has completed a number of environmental campaigns to generate a suitable Environmental Baseline Study (EBS) to support a future project Environmental Impact Study (EIS) for the Caspiche Project. The main contractor used for the compilation of this EBS was IAL Ltda. (IAL) of Santiago, Chile. In July 2011, Exeter´s locally registered entity, SCM Eton contracted Arcadis Chile (Environmental Division) to carry out a GAP analysis of the developed Caspiche EBS. The objective of this analysis was firstly to confirm all legally required elements had been included and secondly to expand the EBS to include the potential footprints of the project options. Arcadis Chile has extensive national and international experience in development and management Base Line Studies (BLS) and environmental impact studies (EIS) for mining projects, with special expertise in the Region of Atacama where the Caspiche project is situated.
In the context of the Prefeasibility study specific environmental studies have been identified which are required for each of the options in evaluation. Table 20.1 summarizes the list of studies which must be completed to complement the existing baseline as part of the Environmental Impact Assessment (EIA) before the document can be submitted for review and approval by the appropriate Chilean authorities.
Project No.: C-580 January, 2012 | Page 318 - 378 | |
Table 20.1: Required Environmental Studies
| Component | Activity Proposal |
| Hydrology | Continue monitoring of surface water, extending to the areas that have not been sampled, replacing points that have been dry during previous sampling periods, and adding, for the same purpose additional sampling points. |
| Hydrogeology | Develop further groundwater sampling, ideally in areas where potential recipients are located (eg. Collas summer encampments). The proposed sampling includes 5 points along the Aguas Blancas River valley. Detailed Hydrogeology is required for dewatering programmes. (pit areas) |
| Geology | In order to define potential future Acid Rock drainage (ARD), analysis of the waste rock by ABA and humidity cell techniques is recommended. This test programme is currently underway and will be completed Q1 2012. |
| Air Quality | To sample air quality, specifically PM10. Monitoring is recommended at least three points (eg.: camp and receivers along the access road) |
Archaeology | Once location of project facilities has been defined an intensive archaeological baseline of the area to be affected must be completed. |
| Anthropology | Once location of project facilities has been defined, an analysis of Convention No. 169 of the ILO (Sept. 2009) must be undertaken, which aims to present the project to the indigenous communities. |
Biological Issues. (Flora, Fauna and Limnology) | Once location of project facilities has been defined an intensive flora and fauna baseline of the area to be affected must be completed. This will be completed in parallel with the water sample monitoring program. Two limnology campaigns are required during the next season. |
| Use of the Soil. | Once location of project facilities has been defined an intensive soil characterization and use of soil programme for the areas to be affected must be implemented. |
| Development of EIA | To present the EIA to the environmental assessment authorities, a document, completing a total of 9 chapters (within which is found the Environmental Baseline) must be prepared. Once the project facilities have been defined, the environmental studies required to complete the Environmental Baseline must be developed. |
The EBS was designed to meet relevant local and international legislation, and contains:
| ● | Principal Environmental findings |
| ● | Environmental and social issues of the project |
| ● | Socio-economic potential impacts and closure, and |
The studies were completed over a continuous 12 month period between mid-2009 and mid-2010. A seasonal water monitoring campaign of the area continues as part of the ongoing surface water quality programme.
Project No.: C-580 January, 2012 | Page 319 - 378 | |
A series of methodological steps were completed to fulfill the objectives and achieve the correct characterization of the environmental elements. This methodology complied with the relevant legal and environmental regulations currently in place in Chile.
| 20.1 | Principal Environmental Baseline Findings |
| 20.1.1 | Physical Environment: Climatic Characterization |
The mountain range of the Atacama Region, from a bioclimatic point of view is in a transition area ranging between two regimes; the first with rainfall during summer months (rainy plateau) and the second with winter rainfall and summer droughts. The general trend in the area is a desert influence with snow precipitation, and high evaporation.
Caspiche local conditions from the weather station installed at the camp, show an average temperature of 6.43 °C, with minimum average in July of -6.24 °C, and maximum average in March of 17.08 °C. Wind gusts average 3.85 m/s in a north-west direction, predominantly from the north. Maximum wind intensities were recorded in September/October, and minimum in the months of April, May, June and July.
Maximum annual rainfall recorded in this sector was 23.2 mm (registered in 2009). Approximately 50 % of rainfall is concentrated between May, June and July; the remaining 50 % in the months of January and February.
| 20.1.2 | Physical Environment: Main Geomorphological Units |
The basin is located between the southern sections of the foothills of Domeyko formation associated with Nevado Jotabeche with an elevation of 5,802 m.a.s.l., and the confluence of the Aguas Blancas River with Quebrada Seca, a distance of approximately 25 kilometres downstream of the Nevado Jotabeche and at an approximate elevation of 3,100 m.a.s.l. The Quebrada Aguas Blancas basin has a number of landforms associated with glacial and fluvial processes.
| 20.1.3 | Physical Environment Soil, characterizations and applications |
There are clear limitations on conditions of soil formation processes in the area. One of the key factors corresponds to the climate variable, which severely limits the accumulation of organic matter generated by the soil, so most of the forming processes have a geological formation, either by weathering or gelifraction.
Nonetheless, there are low and flat areas, where vegetation formations have been generated (meadows and wetlands), with azonal features that have allowed the development of some soils with organic characteristics.
Soil use at the regional level is characterized by low agricultural capacity, except for the cultivated valleys of the region. In terms of land use, the greatest potential of the region today corresponds to mining.
| 20.1.4 | Physical Environment: Hydrology |
The Project is located in the Aguas Blancas River System, which is a tributary of the Figueroa River at an altitude of 3,000 m.a.s.l. This sub-basin has a runoff orientation of SE – NW and drains an area of approximately 20,402 ha. The area affected directly by the project
Project No.: C-580 January, 2012 | Page 320 - 378 | |
is located at the head of this sub-basin, specifically in a first order system called “Quebrada Yeguas Heladas.” Exeter has developed hydrochemical characterization and analysis of water quality in the project area on a seasonal basis from mid 2009, completing a total of 7 campaigns.
As it descends through the sub-basin, water quality progressively deteriorates. High values of sulphates, total iron, total copper and pH were recorded in the middle and lower sections of the basin. These parameters substantially exceed the permitted limits for environmental standards, especially those parameters such as sulphates and total iron, characteristic of sites where projects and mining processes could be located.
The majority of the water sampled has high turbidity values; a great deal of purification and other processes are required to meet the relevant standards for drinking water.
Analysis of pH identified two grades of waters. The first corresponds to those categories ranging from "4" to "6" (according to Nisbet and Verneaux 1970), the qualities of these varies from neutral to alkaline neutral. The second group exhibits the most extreme behaviour, either with a sharp acidity or alkalinity.
| 20.1.5 | Biotic Environment: Flora and Vegetation |
This area is inserted in a transition zone between the High Andean Steppe Region, Sub-region Mediterranean Andes, High Andean Steppe Formation of Doña Ana Mountain Range and the Desert Region, Sub-region Andean Desert, Formation of desert steppe of El Salvador (Gajardo, 1983 and 1994).
The highest proportion of vegetation within the study area corresponds to a tall thorny shrub (height steppe) of Adesmia hystrix (rod) with a vertical structure and density (coverage) that varies according to different physiographic positions; and an herbaceous perennial stratum of Stipa atacamensis (Grassland) and / or Cristaria andicola (Malvilla).
The study recorded 83 species of local flora, all of which are native. None of the species identified have known conservation problems. The sectors of water azonal vegetation (meadows and wetlands) must be considered because these ecosystems are relevant for local sustainability, wherein the biological diversity is quite restricted.
| 20.1.6 | Biotic Environment: Fauna |
In parallel with the Andean desert conditions, and low and sparse vegetation, the fauna present in the studied area is scarce. The current inventory of invertebrates and / or potentially present invertebrates in the area comprised a total of 51 species, 50 native and one introduced. The native species include two endemic species. Of these, there are two species of reptile, 40 birds (25 passerines and 15 non-passerines) and nine species of mammals (three carnivores, one artiodactyl, five rodents and lagomorphs), 35 species were observed directly in the field during the four campaigns.
Birds are the most diverse group with 40 species, followed by mammals with nine taxa. Despite the existence of bodies of water, amphibians were not observed, they are recorded in lower areas of the basin and not in the high mountains. Almost all species are distributed in various regions of the country and there are only two species of reptiles endemic to the Atacama Region, Liolaemus juanortizi, and Liolaemus rosenmanni.
Project No.: C-580 January, 2012 | Page 321 - 378 | |
National regulations define two complementary means of defining protected species; the Regulations for Classification of Wildlife Species and the Hunting Law. None of the invertebrates recorded are cited by the Regulations for Classification of Wildlife; however according to the Hunting Law (SAG, 2008) the conservation status of species observed is as follows:
| ● | Reptiles: Liolaemus rosenmanni (Vulnerable) y Liolaemus juanortizi (Critically Endangered); |
| ● | Birds: Tinamotis pentlandii (Endangered), Chloephaga melanoptera (Endangered), Vultur gryphus (Endangered), Attagis gayi (Vulnerable); |
| ● | Mammals: Puma concolor (Critically Endangered, SAG 2008; Near Threatened, DS 151/2006 MINSEGPRES), Pseudalopex culpaeus y Pseudalopex griseus (Near Threatened), Lama guanicoe (Critically Endangered) y Lagidium viscacia (Critically Endangered). |
Colonies of Ctenomys sp. are distributed over a wide area within the project area, including the sectors of exploration, access road, meadows, and Quebrada Yeguas Heladas, and are always associated with a low scrub thorn bushes (Adesmia echinus) and tussocky grass (Stipa atacamensis).
The project area is not mentioned in either the Red Book of Priority Sites for Conservation of Biodiversity in Chile, or among those highlighted by the National Biodiversity Strategy.
| 20.1.7 | Description of Socioeconomics-Cultural Environment: Demography |
The regional population concentration is largely urban, 83.9 % of the population in the area live in cities or towns with Copiapó and Vallenar holding the largest demographic weight.
Due to the specialization in activities related to mining and agriculture, the population is predominantly male, with a sex ratio higher than the national average 103.16 for the region, compared to 97.12 for the country; this situation is exacerbated in rural areas.
The district of Las Juntas, where the project is located has a population density of only 0.091 inhabitants per square kilometre which demonstrates how sparsely inhabited is the project area. Despite the small size of the population, its presence is important, as it is associated with the indigenous Colla communities who are dedicated to pastoral activities mainly through migration cycles.
In terms of productive activities, while at the regional level mining is the main contributor to regional GDP activity with 39 %, in terms of labour demand it only accounts for 10 %, the opposite to agriculture, which accounts for 19 % of jobs, for a contribution to regional GDP of only 10 %.
| 20.1.8 | Historical and Archaeological Heritage |
Information sources indicated that the project area does not contain national monuments, zones of historic or special interest, national parks or other historical or archaeological heritage sites.
Project No.: C-580 January, 2012 | Page 322 - 378 | |
Since the exploration activities of the Caspiche Project started, Exeter has developed a relationship with the neighbouring Colla Community at Jorquera River (CCJR) and its tributaries.
Guidelines have been established which define the project objectives, and the principles of coexistence and respect for the heritage and Colla indigenous culture. Exeter and the community have fixed goals to work together via formal documents and agreements. Technical groups meet with the participation of the National Corporation of Indigenous Development (CONADI) and representatives of CCJR to discuss issues such as the environment and others.
| 20.2 | Summary of Main environmental and Social Issues for the Project |
From the Environmental Baseline Studies completed to date, it is possible to conclude that the points of sensitivity of the project site area correspond to the following:
| ● | The data obtained from geological components, water quality and climate and weather indicate the possible generation of acidic water. This is mainly due to strong presence of sulphur in the composition of rocks of volcanic origin, in the Basin of Aguas Blancas River. |
| ● | The results of the water analyses indicate a progressive deterioration of water quality as the water flows downstream to the sub-basin, highlighting elevated values of sulphates, total iron, total copper and pH. This is important as the project will be located in the upper basin. |
| ● | The existence of threatened fauna in the area of influence of the project. |
| ● | Flora and vegetation, are relevant to the functioning of ecosystems, especially those relating to water azonal vegetation (meadows and wetlands), the project execution plan must take measures to reduce the risks to these communities. |
| ● | In landscape and scenic resource, the most important point is the current proposed Sendero de Chile route where the mine activities would have an impact on the area’s current visual quality with a resource loss or significant alteration of the landscape and / or touristic values. Mitigation or compensation measures in the future must be considered. |
| ● | The eventual overload on the infrastructure systems of major urban centres is the most important issue with regard to equipment and infrastructure components. |
| ● | Archaeological sites identified are unique evidence of past activities and correspond to national monuments, it is necessary first to avoid development of any type of work that can generate partial or total destruction of the sites and make all efforts to ensure their preservation. |
| ● | The anthropological issue must take into account the existence of two camps that are used during the summer by some family groups of the Colla community. Although they |
Project No.: C-580 January, 2012 | Page 323 - 378 | |
| | are not permanently inhabited structures it should be considered that these areas are significant to the Colla lifestyle and their nomadic character. The same consideration should be given to the meadows and slopes that can be found along the gully of the Aguas Blancas River and are used throughout the year by the flocks and herds that community members keep in the gully. |
| 20.3 | Socio-economic Potential Impacts |
Socioeconomic impacts linked to the Project are expressed in the first instance by the location of the area, which houses 15.2 % of the existing Colla people in the Atacama Region (Census 2002). In the area of direct influence of the project, the Colla Community located in the area of the Jorquera River and its tributaries are the main community impacted by the project. This community has a native-like organization covered by law 19.253 and is a legitimate interlocutor, and is the main population affected by the project.
The Colla community is spread over a large area of the foothills and mountainous uplands, and also has a presence in the urban areas of the region. The communities in the rural areas have a low population density, but own an area of 10,000 ha granted adjacent to seasonal water courses. Due to their nomadic culture, employment in the area changes with the season, from lowlands to highlands, in a cycle determined by the presence and absence of snow, and the growth of the vegetation.
Livestock farming is the main economic activity of the community, together with ancillary activities to support the local consumer base. This is reflected in each household that produces similar products for different purposes, in some cases there is a market for the product, while in the majority of cases the product is intended for family consumption. (TEPU 2001).
In the Colla Community of Jorquera River and its tributaries there is no rural school, resulting in migration to urban areas. Health infrastructure is represented by a primary care clinic providing a monthly round of medical and dental care.
Possible local impacts expected from the analysis of the foregoing against Article 8 of the Regulation of Environmental Assessment System:
| ● | Impact on meadows and wetlands of the area, and associated fauna, essential for economic and ancient-cultural development of the Colla people. This is due to the high pressure which mining projects such as Caspiche and others in the area would subject the territory to as they are developed and operated. |
| ● | Increase in atmospheric emissions of suspended material produced by the activities of the mining process and vehicular traffic. This may eventually affect people in the immediate area (primary standard of air quality) as well as flora and fauna (Huasco secondary reference standard). This negative impact may be mitigated through the implementation of measures to control emissions. |
| ● | Increase of traffic flow which could result in the death or injury of animals or members of the community. This can be mitigated by speed control and strict monitoring of internal driving rules and national regulations in force. |
Project No.: C-580 January, 2012 | Page 324- 378 | |
| ● | Impact on the quality and quantity of water resources due to intensive use. Exeter provides sustainable exploitation of this resource through a secure flow of water approved by the competent authority. The water source to be used assures there is no significant impact on the current users. |
| ● | Impact on winter and summer grazing areas that feed the animals as a product of high traffic of light and heavy vehicles, water use, and mining activity. |
| ● | Impact on archaeological sites that could eventually be given the status of ancestral occupation of the territory. These sites may be affected by mining activity. To ensure that the archaeological history of the area will not be impacted by future mining infrastructure, the company should rescue materials to be impacted (Law 17.288; Ministry of Education (MINEDUC). |
| ● | Impact on local economic activity. The loss of territory for the migration and grazing of livestock and possible impact of meadows and wetlands used for summer pasture and winter activities that serve for care and feeding of livestock will have a negative impact. Development of the project will generate a significant positive impact on employment levels and the local economy. |
The conclusions reached are that all effects or impacts noted above and related to the different sections of Article 8 of the RSEIA1, imply a significant change in the livelihood and customs of the human groups inhabiting the territory.
| 20.4 | Closure and Abandonment Stage |
In Chile, there are clear and precise rules regarding the closure of mining facilities (Regulation on Mine Safety No. 72. section 5), which indicate the activities required to carry out the closure of a mining project. The following is a summary of the objectives of the Regulation, as well as the activities listed.
| ● | Ensure that the remaining facilities will not affect human health or degrade the environment. |
| ● | Ensure maintenance of physical stability and that the areas affected by mining activities are in stable condition at the closure of the project. |
| ● | Ensure the maintenance of stability associated with chemicals in the long term, in order to reduce effects on biological diversity and to avoid endangering public health and safety. |
| ● | Ensure environmental components, both surface and underground are not affected as a result of the closure. |
14 RSEIA Reglamento Sistema de Evaluación de Impacto Ambiental. Regulation of Systems of Environmental Assessment
Project No.: C-580 January, 2012 | Page 325 - 378 | |
| 21.0 | CAPITAL AND OPERATING COST |
| 21.1 | Capital Cost Estimate |
| 21.1.1 | Summary Capital Cost and estimate Basis |
The following tables summarize the initial capital costs estimate for the project including the mine area capital costs for each of the three options evaluated.
Table 21.1: Capital Cost Estimate Summary by Area – Super Pit
| DESCRIPTION | TOTAL | |
| General | 310,991,493 | |
| Mine Area | 945,227,824 | |
| Sulphides Crushing | 233,945,088 | |
| Heap leach Crushing | 22,932,573 | |
| Leaching | 65,118,024 | |
| ADR Plant | 15,015,238 | |
| Concentrator Plant | 3,636,744 | |
| Grinding | 512,352,497 | |
| Flotation | 165,399,724 | |
| Concentrate Handling | 144,545,247 | |
| Tailings Handling | 27,093,364 | |
| Scavenger Tails Treatment | 7,833,207 | |
| Concentrate Treatment | 4,598,127 | |
| Concentrate Roasting | 217,742,816 | |
| Sulphides Reagents | 5,058,482 | |
| Heap leach Reagents | 863,824 | |
| Infrastructure | 10,364,849 | |
| Power Supply | 117,647,977 | |
| Water Supply | 291,839,852 | |
| Indirect Cost | 870,184,179 | |
| Contingency | 827,366,227 | |
| TOTAL | 4,799,757,365 |
Project No.: C-580 January, 2012 | Page 326 - 378 | |
Table 21.2: Capital Cost Estimate Summary by Area – Hybrid
| DESCRIPTION | TOTAL |
| General | 167,207,809 |
| Mine Facilities | 784,709,025 |
| Sulphides Crushing | 284,304,852 |
| Heap leach Crushing | 25,969,037 |
| Leaching | 79,624,297 |
| ADR Plant | 18,509,542 |
| Grinding | 330,897,182 |
| Flotation | 119,167,189 |
| Concentrate Handling | 76,089,518 |
| Tailings Handling | 56,024,383 |
| Scavenger Tails Treatment | 16,464,485 |
| Concentrate Treatment | 4,647,500 |
| Concentrate Roasting | 161,091,170 |
| Sulphides Reagents | 4,112,897 |
| Heap leach Reagents | 993,397 |
| Infrastructure | 18,477,528 |
| Power Supply | 127,587,453 |
| Water Supply | 286,637,310 |
| Indirect Cost | 745,112,334 |
| Contingency | 683,633,302 |
| TOTAL | 3,991,260,220 |
Project No.: C-580 January, 2012 | Page 327 - 378 | |
Table 21.3: Capital Cost Estimate Summary by Area – Full Underground
| DESCRIPTION | TOTAL |
| General | 299,489,409 |
| Mine Area | 983,319,716 |
| Sulphides Crushing | 206,260,663 |
| Heap leach Crushing | 26,881,093 |
| Leaching | 106,222,008 |
| ADR Plant | 26,104,361 |
| Concentrator Plant | 15,419,112 |
| Grinding | 302,516,703 |
| Flotation | 132,616,797 |
| Concentrate Handling | 86,319,218 |
| Tailings Handling | 62,170,337 |
| Scavenger Tails Treatment | 10,947,026 |
| Concentrate Treatment | 2,746,447 |
| Concentrate Roasting | 150,762,230 |
| Sulphides Reagents | 1,100,888 |
| Heap leach Reagents | 1,151,384 |
| Infrastructure | 10,653,443 |
| Power Supply | 139,645,416 |
| Water Supply | 286,222,269 |
| Indirect Cost | 770,248,136 |
| Contingency | 721,515,343 |
| TOTAL | 4,342,658,613 |
This estimate is based on information developed during the Prefeasibility study (PFS) of the Caspiche Project.
The economic analysis completed in item 22.2 for each option indicated that the Super Pit is the preferred route to be developed to Feasibility Study. Attention should be made to the Super Pit option throughout this report.
Project No.: C-580 January, 2012 | Page 328 - 378 | |
| 21.1.1.1 | The Scope of Estimate |
| Cost Scope | The estimate includes direct costs, provisions and contingencies. The net cost includes process equipment; materials, construction equipment; contractor labour including contractor direct and indirect costs; overhead and utilities. The project indirect costs include the engineering, procurement, and construction management (EPCM), phases Feasibility and Detail Engineering. |
| Estimating System | The Aker Solutions Estimating System (EST6) was used to calculate the capital costs. |
| 21.1.1.2 | Accuracy of the Estimate |
The purpose of this estimate is to define the total cost of the project to verify its economic viability. The estimate, per Aker Solutions estimating procedures, is a Type 1 “Magnitude”, estimate with an accuracy of -15 % to + 20 % with a 90 % probability of occurrence. The Type 1 estimate is equivalent to The Association for the Advancement of Cost Engineering (AACE) Class 4 estimate.
The estimate costs are based on the following:
| ● | Equipment budgetary quotations |
| ● | Preliminary of physical material take-offs |
| ● | Aker Solutions historical and current data |
| ● | Cost information from construction contracts by Chilean contractors |
| 21.1.1.3 | Estimate Allowances |
Table 21.4 indicates the percentages used for Growth Factor Allowances for each discipline.
The estimate includes growth factor allowances for the following:
| ● | Design Growth Factor: The design growth factor allowance accounts for increases in quantity growth due to continuing design development and refinement |
| ● | Construction Growth Factor: The construction growth factor allowance covers additional quantities due to losses, damages, repairs, and modifications to material and equipment made during construction. |
The growth factor allowances for design and construction are derived from Aker Solutions historical data and agreed upon by estimating, engineering and client input.
| 21.1.1.4 | Miscellaneous Material Allowance |
Miscellaneous material allowances are made for items needed to complete the project, but likely not included in the material take-offs. Miscellaneous material allowances appear as a line item in the direct material cost.
Project No.: C-580 January, 2012 | Page 329 - 378 | |
| 21.1.1.5 | Specific Item Allowance |
The specific item allowance covers items required to finish the project, but lack definition or are in the preliminary stage of development.
| 21.1.1.6 | Take-Offs and Pricing |
Material take-offs (MTOs) were prepared by each responsible engineering discipline. The responsible discipline estimator reviewed and confirmed quantities supplied on the MTOs. Material take-offs by engineering are net quantities. Growth factor allowances were applied to labour, equipment usage, process equipment, and material costs by estimators in accordance with Table 21.4.
Project No.: C-580 January, 2012 | Page 330 - 378 | |
Table 21.4: Growth Factors – Cost Adjustments
| | COMMODITY | UNIT | DESIGN ENGINEERING NET QUANTITY OF FOLLOWING ITEMS: | GROWTH FACTOR DESIGN | % | GROWTH FACTOR CONSTRUCTION | % | TOTAL |
| 1a | Site, Earthworks, and General Improvements | m3 | Platforms, Roads, Tunnels, and Dykes | Excavations not identified and miscellaneous items | 15% | Double handling and Re-excavation due to on-site modifications | 5% | 20% |
| 1b | Site, Earthworks, and General Improvements | m3 | Fresh water pipeline and concentrate pipeline | Excavations not identified and miscellaneous items | 30% | Double handling and Re-excavation due to on-site modifications | 5% | 35% |
| 2 | Concrete | m3 | Equipment and Building Foundations, Slabs on Grades, Elevated Slabs, Walls and Columns | Miscellaneous concrete | 10% | Pour losses, broken concrete, and repairs | 5% | 15% |
| 3 | Structural Steel | T | Light, Medium and Heavy Structural Steel | Structural steel not identified. | 10% | Repairs and modifications | 5% | 15% |
| 4 | Buildings / Architectural | m2 | Building Finishes | Items not identified | 10% | Installation losses and damages | 5% | 15% |
| 5a | Process Equipment | EA | Conveyors, Pumps, etc. | Equipment quantity changes | 3% | Field modifications | 1% | 4% |
| 5b | Electrical Equipment | EA | MCCs, Switchgear, Transformers, etc | Equipment quantity changes | 10% | Field modifications | 2% | 12% |
| 5c | Chutes, Bins, Launders, Tanks, and Plate works | EA | Metal and plate work associated with process equipment | Capacity design refinements | 25% | Field modifications | 15% | 40% |
| 6a | Electrical | m | Cable Trays, Conduits, Cable, etc. | Routing changes and miscellaneous | 20% | Field run changes, installation losses, and damages | 9% | 29% |
| 6b | Electrical | m | High voltage overhead line | Routing changes and miscellaneous | 10% | Field run changes, installation losses, and damages | 5% | 15% |
| 7 | Instrumentation | m | Instruments, Stands, Tubing, etc. | Routing changes | NA | Field run changes, installation losses, and damages | NA | NA |
| 8a | Piping | m | Piping and Fittings | Routing changes | 10% | Field run changes, installation losses, and damages | 5% | 15% |
| 8b | Valves | EA | All Valves | Piping design changes | 10% | Field Run changes, installation losses, and damages | 4% | 14% |
| 21.1.1.7 | Process Equipment and Material Prices |
Equipment and material prices used in this estimate was based on vendor budgetary quotes or Aker Solutions database of recent equivalent projects.
Project No.: C-580 January, 2012 | Page 331 - 378 | |
| 21.1.1.8 | Site, Earthwork, and General Improvements |
The site earthwork, and general improvements take-offs were based on the preliminary civil sketches. Material take-offs were prepared by Aker Solutions civil engineers industry standard software (In Road) and spreadsheets. In general, the areas requiring mass earthworks will be mass excavated and then back-filled with suitable fill. The estimate also assumes that suitable fill material will be found on site and used for common and structural backfill.
In the case of the stand alone heap leach pad design for the full underground option, insufficient borrow material for pad construction will be produced in the open pit, as such the estimate assumes that a suitable borrow pit is available and that the shortfall of approximately 8 million tonnes of required material is sourced from this borrow pit. The capital estimate includes the additional cost for the extraction and placing of this borrow pit material.
Unit prices are based on labour, material, and subcontract costs from construction contracts of similar projects. If pricing information from construction contracts was not available, Aker Solutions in-house cost database was used.
Concrete quantities were determined from preliminary material take-offs prepared from preliminary concrete works sketches by Aker Solutions civil engineers.
Structural steel take-offs were obtained from the preliminary structural steel drawings. The take-offs were developed either with Aker Solutions corporate software or manual take-offs by Aker Solutions structural engineers. The structural steel take-offs categorizes structural steel by the following weight classifications: Extra Heavy, Heavy, Medium and Light. Steel structures items such as grating, handrails, and stairs, etc. are identified separately.
It is assumed that all steel is sourced locally although there may be further benefits in sourcing structural and other required steel and platework from China. This should be evaluated in the next phase of project development.
| ● | Building / Architectural |
Aker Solutions engineers prepared take-offs for roofing and sidings of site buildings. Doors, gates, and finishing for the buildings are factored. All other miscellaneous buildings are priced on a dollar per square metre basis using Aker Solutions historical data.
| 21.1.1.10 | Process Equipment |
The capital estimate includes deferred capital for process equipment which will be required when the MacNeill material is placed on the heap leach pad. This includes crusher circuit modifications and a SART plant for copper recovery and cyanide regeneration. Further deferred capital is included for IPCC plant and equipment for the super pit and hybrid options and purchase of gyratory crushers for the underground option.
Project No.: C-580 January, 2012 | Page 332 - 378 | |
Aker Solutions has received budgetary quotations for approximately 40 % of the process equipment for the Caspiche Project. Process equipment pricing is based on budgetary quotations and includes the addition of engineering development and growth factor allowances. Pricing for the remaining process equipment is from in-house databases.
Equipment installation costs are based on Aker Solutions’ in-house data for the region. The process equipment erection data was obtained from recent or on-going projects of similar process type and geography. A small amount of the process equipment installation costs, for example tanks, were based on preliminary definitions by weight of plate works per tonne.
Electrical material take-offs were prepared by Aker Solutions electrical engineers based on preliminary design single line diagrams.
The material take-offs for instruments and control valves were factored by mechanical process equipment.
Piping material take-offs were based on preliminary layout sketches. Material take–offs are net quantities.
Long run piping, such as the fresh water supply and concentrate pipeline have been estimated from first principles, no geotechnical or geomorphological evaluation has been undertaken in the PFS to confirm the selected pipe runs.
| 21.1.1.14 | Construction Labour Cost |
The source for craft base wages was Chilean construction contractors and historical data from Aker Solutions offices in Santiago, Chile. The crew composition was prepared based on Chilean practices for similar projects.
For the estimate, a shift rotation of 14 days on site working twelve hours per day, then 7 days off was used. The labour rates are “all-in” rates and are expressed in U.S. Dollars.
| ● | Unit Man-hours and Productivity |
Unit man-hours used for the estimate are from recent Aker Solutions projects in Chile. Site specific conditions considered for productivity includes, but are not limited to: altitude, weather, skills availability, camp distance and construction equipment usage
The construction equipment usage costs for the Caspiche Project includes fuel and maintenance. The equipment usage costs exclude equipment operators. The costs for equipment operators are incorporated into the unit man-hour rate of the work performed. Unit man-hours rates are based on Aker Solutions historical data for the region.
Project No.: C-580 January, 2012 | Page 333 - 378 | |
| 21.1.1.15 | Engineering, Procurement, and Construction Management (EPCM) |
Engineering includes Feasibility, Basic and Detail engineering, drawing production, document control and all other activities required to complete the detailed engineering necessary to finish the project. Home office engineering services include project management, engineering, cost engineering and scheduling, estimating support, accounting and construction contract planning.
Procurement includes purchasing from local Chilean as well as off-shore sources. Procurement responsibilities include: purchasing enquiries; negotiating terms and conditions; placing purchase orders; providing logistics and traffic control; expediting equipment and materials; inspecting purchased equipment and materials.
The estimate for construction management was developed based on the construction master plan and preliminary construction execution plan. Construction management costs were estimated using a preliminary and basic construction management organization chart. The estimate also includes field expenses for construction management personnel. Field expenses include travel, relocation, and the cost to return home.
| ● | Temporary Construction Facilities |
Temporary construction facilities and infrastructure are included in the estimate as an indirect cost. The type and size of the construction facilities have been identified in accordance with the preliminary construction execution plan. Construction facilities and infrastructure costs have been estimated by using factorized cost based in Aker Solutions historical data and combined with the preliminary execution plan.
| ● | Temporary Site Utilities |
Temporary site utilities are included in the estimate as an indirect cost.
Catering and lodging for direct activities were included in the labour cost. Catering and lodging costs for indirect personnel were estimated based on manpower projections during the construction phase of the project. Catering and lodging costs include daily meals and lodging for construction personnel. Costs for catering and lodging were developed from historical data for the region
The Vendor cost was factored by the cost of process equipment supply.
The cost for start-up spares are entered as a single line item in the indirect costs as a factored cost from the process equipment cost.
Project No.: C-580 January, 2012 | Page 334 - 378 | |
The cost for capital spares are entered as a single line item in the indirect costs as a factored cost from the process equipment cost.
The capital estimate recognises the need for the inventory of high volume consumables such as steel balls, cyanide and others, this is addressed as working capital.
| ● | Start-up Assistance and Pre-Commissioning |
Start-up assistance and pre-commissioning costs have been included in the indirect costs. Start-up and pre-commissioning costs include craft labour support, field engineering, and supervision. Costs for these activities were defined as a factor of cost of process equipment.
First fill consists of supplying chemicals and lubricants for the plant and process equipment, which are required for process plant start-up. The first fill cost was factored by cost of process equipment supply.
| ● | Third Party Engineering Services |
Third party engineering services include specialized engineering, testing, and inspection services. These items are included in the indirect portion of the estimate. Costs for third part engineering services were defined by Aker Solutions using historical databases or benchmarking.
The freight cost includes inland freight, port handling, forwarding fee, ocean freight, duties and local freight. Cost for the contract is included in the indirect costs. The freight cost was factored by cost of material and process equipment supply both local and foreign.
Project No.: C-580 January, 2012 | Page 335 - 378 | |
Owners cost of MUS$ 150 is included in the capital estimate and was supplied by Exeter. The estimate for owners cost includes such items as:
| Item | Estimate (M$US) |
| Project Management On/Off Site | 14 |
| Legal and Permitting | 8 |
| Public Relations | 3 |
| Spares and Inventory | WC |
| Hydrology studies – pit, stockpiles, dams | 0.5 |
| Geotechnical studies – pit, stockpiles, dams | 0.5 |
| Environmental studies | 4 |
| Operations crew training | 2 |
| Condemnation drilling – all surface disturbance | 5 |
| Owners commissioning team | 3 |
| Community development contributions | 3 |
| General access road upgrade contribution | 4 |
| Water and land option conversions | 79 |
| Water supply development/permitting | 15 |
| Metallurgical testwork & Flotation/Roaster/POX pilot plant | 4 |
| Water treatment plant | 5 |
| TOTAL | 150 |
The contingency is an amount added to an estimate to allow for unforeseen events, conditions, or occurrences that experience indicates will likely happen during a project. Typically, the amount of contingency applied to a project is determined by statistical analysis or judgment based on experience from similar projects. Statistical analysis was used in the estimate to calculate contingency using the software @Risk Version 4™. @Risk Version 4™ is software that uses the Monte Carlo method to simulate probable project cost outcomes. The following events were excluded from contingency analysis:
| ● | Substantial design change |
| ● | Change in execution plan |
Project No.: C-580 January, 2012 | Page 336 - 378 | |
| ● | Change in mechanical soil conditions |
The exchange rates used in the estimate are:
Table 21.5: Exchange Rates. Source: Banco Central de Chile
| CURRENCY | (A) | (A)/USD | USD/(A) |
| Australian Dollar | AUD | 1.0670 | 0.93721 |
| Chilean Peso | CLP | 483.65 | 0.00207 |
| Chinese Yuan | CNY | 6.4633 | 0.15472 |
| Euro | EUR | 0.6933 | 1.44238 |
| Japanese Yen | JPY | 80.89 | 0.01236 |
| USA Dollar base | USD | 1.00 | 1.00 |
All taxes are excluded from the estimate. Exclusions include sales tax, business taxes and VAT.
The insurance required by construction and services contractors is included in the contractor costs. The general insurance strategy for the installations and “umbrella” type cover by the owner, in agreement to the project definitions, are considered as “Owner Costs” and are excluded from this CAPEX Estimate. The insurance of services and EPCM contactor are included in the services costs.
Escalation for labour, process and construction equipment, and material is excluded from the estimate.
The following items are excluded from the definitive estimate:
Project No.: C-580 January, 2012 | Page 377 - 378 | |
| ● | Exchange rate fluctuation |
| ● | Construction utilities (purchased water & power) |
| 21.2 | Deferred and Sustainable Capital Cost |
During the life of the project there will be a requirement for further capital expenditure. This may take the form of additional mining fleet as required, capital spares and equipment and further purchase of conveyors and crusher stations for the IPCC amongst others. Sustainable capital estimates for each option evaluated are as per Table 21.6.
Project No.: C-580 January, 2012 | Page 338 - 378 | |
Table 21.6: Sustainable Capital Estimates
| | Year | Super Pit | Hybrid | Full U'G |
| | US$ | US$ | US$ |
| Initial Capital | -1 | 4,799,757,365 | 3,991,260,220 | 4,342,658,613 |
| Sustaining Capital | 1 | 393,809,910 | 103,319,311 | 97,313,952 |
| 2 | 157,342,000 | 47,932,609 | 32,359,154 |
| 3 | 6,529,112 | 40,635,373 | 19,913,249 |
| 4 | 6,567,593 | 34,044,925 | 17,311,412 |
| 5 | 41,035,489 | 72,298,820 | 21,992,698 |
| 6 | 1,478,859 | 88,997,970 | 37,836,682 |
| 7 | 298,600 | 254,451,206 | 41,635,121 |
| 8 | 44,243,072 | 146,896,009 | 66,206,927 |
| 9 | 4,834,067 | 94,235,840 | 46,798,996 |
| 10 | 6,449,319 | 88,435,130 | 71,253,672 |
| 11 | 25,029,979 | 49,557,200 | 38,727,629 |
| 12 | 118,910,021 | 20,077,273 | 25,105,849 |
| 13 | 3,929,252 | 20,026,121 | 65,417,219 |
| 14 | 34,733,247 | 14,764,565 | 13,568,503 |
| 15 | 805,210 | 10,256,575 | 1,105,000 |
| 16 | | 15,276,065 | 4,969,866 |
| 17 | | 10,810,825 | 15,660,493 |
| 18 | | 325,000 | 9,700,254 |
| 19 | | 975,000 | 650,000 |
| Total Investment | 5,645,753,095 | 5,104,576,037 | 4,970,185,289 |
Project No.: C-580 January, 2012 | Page 339 - 378 | |
| 21.3 | Operating Cost Estimate |
| 21.3.1 | Mine Operating Cost |
Open Pit
The open pit mine area direct costs include all mine operations to feed material to the primary crusher. All costs associated with the operation and maintenance of the mine are also included. Blasting operations have been assumed to be carried out by contractors and a full Maintenance and Repair Contract (MARC) is assumed for the first 3 years of operation.
Indirect costs such as training, material and office supplies were estimated and are included in the mine operating costs. Food, catering, camp, transport, recreation, safety supplies and work clothes are included in General and Administration costs.
The mine operating cost estimate incorporates costs for operations and maintenance labour, staff, and operating and maintenance supplies for each year. Operating and maintenance supplies are based on Chilean supply and include an allowance for freight and delivery to the Caspiche site. Taxes are not included. Consumables were calculated from expected use, unit consumptions, and allowances for minor items. Mine operating costs are expressed in USD/tonne of total material movement.
(a) Operating Labour
Item 16 presents the organizational structure and total mine labour requirements for the operation. Manpower cost was calculated using this data and consideration of Chilean high-altitudes mine pay scales.
(b) Parts and Consumables
Consumables and wear parts unit prices were obtained from suppliers and manufacturers or from NCL’s database for other Chilean mining projects and were used in the development of project operating costs.
The fuel price used is 0.70 US$/L and corresponds to a projected price of 70 US$/barrel F.O.B. Gulf Coast Waterborne and transformed to USD/L applying refining charges, market margin, sea and internal freight, duties and applicable supplier factors. The power cost used is 117 US$/MWH.
Main mine equipment consumptions were based on comparable projects and other similar operations in Chile.
(c) Overhead Costs
Overhead costs covering items such as assaying, ore control, blasting studies, geotechnical studies and programs, and miscellaneous items such as office supplies, light vehicles, photos, and maps are considered and are based on other similar Chilean mining operations.
(d) Summary of Open Pit Mine Operating Costs
The open pit mining unit cost results are shown in Table 21.7.
Project No.: C-580 January, 2012 | Page 340 - 378 | |
Table 21.7: Total Unit Operating Costs (US$/t)
| Item | Super Pit Option | Hybrid Option | Leachable Pit |
| Loading | 0.155 | 0.181 | 0.215 |
| Hauling | 0.599 | 0.701 | 0.472 |
| Drilling | 0.109 | 0.101 | 0.106 |
| Blasting | 0.120 | 0.130 | 0.178 |
| Ancillary | 0.086 | 0.129 | 0.154 |
| Support | 0.015 | 0.039 | 0.108 |
| Eng. & Adm | 0.040 | 0.071 | 0.211 |
| Pit Dewatering | 0.001 | 0.001 | 0.001 |
| IPCC/EPCC | 0.177 | 0.136 | ----- |
| TOTAL OPERATING COSTS | 1.302 | 1.490 | 1.446 |
Underground
Preparation costs included in the operating costs were estimated using the unit costs shown in Section 21.1 and the total area developed per year presented in the following tables.
Pre-production period cost is considered as capital cost. The capital cost estimate for preproduction capital assumes all initial mine development is completed by contractors.
Hourly costs for the underground mine equipment were estimated using first principles.
Table 21.8: Selected Equipment Hourly Cost Estimate
| Item | Hourly Cost Estimate ($US/h) |
LHD 10yd3 | 124.14 |
| 80 t truck | 144.83 |
| Pickhammer | 80.85 |
| Reduction Jumbo | 71.93 |
Project No.: C-580 January, 2012 | Page 341 - 378 | |
Mine Operating Costs Summary
Table 21.9 summarizes the operating costs for each option. It should be noted that the Super Pit and the Hybrid Cases require 3 years of pre-production and the Full Underground needs 10 years of development before delivering ore to the plant, development includes further geomechanical studies, underground drill out and explorations declines amongst others. The heap leach open pit cost for the Full Underground option have been developed by NCL.
Table 21.9: Total Unit Operating Costs Underground Option (US$/t)
| Item | Hybrid Option | Full UG Option |
| Extraction (LHD) | 0,353 | 0,501 |
| Secondary Reduction | 0,200 | 0,200 |
| Pickhammer | 0,135 | 0,135 |
| Orepass | 0,150 | 0,150 |
| Truck Hauling | 0,261 | 0,176 |
| Services | 0,661 | 0,658 |
| Levels Maint and Repair | 0,250 | 0,250 |
| Labor | 2,157 | 2,198 |
| Others | 1,250 | 1,281 |
| Mine Preparation | 1.948 | 1,795 |
| TOTAL OPERATING COSTS | 7.366 | 7,344 |
| 21.3.2 | Process Plant Operating Cost Estimate |
The major Opex considerations for the 3 options evaluated were defined within the battery limits of the project.
These battery limits are:
| ● | Upstream: mine operation. |
| ● | Downstream: production of copper cathodes and bullion doré. Aker design is limited to the production of calcine copper concentrate and doré, however the operating cost estimate includes all off site costs associated with production of final product. |
Project No.: C-580 January, 2012 | Page 342 - 378 | |
The labour estimate does not consider senior executives (General Manager and others) who are included in G&A. The estimate for labour necessary in the concentrator plant was estimated as per Table 21.10:
Table 21.10: Labour for concentrator plant
| Area | People |
| Administration / Supervisors | 1 |
| Sulphides Crushing | 28 |
| Grinding | 37 |
| Flotation | 41 |
| Concentrate Handling | 27 |
| Tailings Handling | 23 |
| Cleaner - Scavenger Tailings Treatment | 29 |
| Roasting | 56 |
| Scorodite Treatment and Disposal | 8 |
This labour structure was used for the OPEX estimate for all three options. Labour rates for similar Chilean operations were considered.
Labour rates include salaries, vacations, social laws and insurance. Labour rates do not include personnel safety protection, transport, camps, catering and other expenses necessary to maintain operations personnel, all of which are included in G&A.
Energy consumption was estimated based on the power used by the equipment. The energy rate considered is 117 US$/MWh, this value considers a contract for build, own and operate supply; energy consumption was estimated yearly.
Maintenance costs for the crushing and ADR plant have been estimated as 7 % of the direct cost of the equipment, except for the pumping and pipe transport systems. In those cases 40 % of the energy cost was considered for water and clean solutions system transport and 60 % of the energy cost for slurry pumping systems.
The pre-feasibility study considered the following main contracts:
| ● | Mobile equipment for crushing area. |
| ● | Wall construction for tailings dam. The Super Pit considered rock wall dam, and the Hybrid and Full Underground options a sand wall was considered. |
Project No.: C-580 January, 2012 | Page 343 - 378 | |
| 21.3.2.6 | Reagents and supplies |
The reagents and supplies consumptions and prices considered for the Caspiche project were based on quotations or Aker Solutions’ recent database of costs. Consumptions were based on testwork considerations or similar projects.
| 21.3.2.7 | General and Administration costs (G&A) |
G&A for this project was estimated as 7 % of the total plant treatment cost, this includes overhead.
This value considers the administrative costs of the process plant, laboratories and warehouse. It also includes contracts for services such as office and industrial cleaning and others that may be required.
The overhead for the project has been estimated as 5 % of the total value.
Contingences for this project at the current engineering level were estimated as 5 % of the total value. The contingency considers areas which have not yet been defined.
| 21.3.2.9 | Heap leach costs estimates |
The oxide heap leachable portion of the deposit was estimated considering operating cost basis for the Stand Alone Oxides Plant, 5 year Two Stage Crushing Prefeasibility Study completed by Aker Solutions, and published on SEDAR on June 8th 2011. In addition to the oxide portion a further heap leachable material, the MacNeill zone, has been identified. This material will use the same infrastructure as the oxide heap leach but the process route will be modified to include interlift liners, additional crusher capacity and a SART plant to recover cyanide and copper from the pregnant solution. Operating costs for the MacNeill material have been calculated on this operational basis.
| 21.3.2.10 | Operating Cost Summary |
Operating costs estimated for each case are shown in Figure 21.1, Figure 21.2 and Figure 21.3:
Project No.: C-580 January, 2012 | Page 344 - 378 | |
Figure 21.1: Super Pit Operating Cost Summary
Figure 21.2: Hybrid Operating Cost Summary
Project No.: C-580 January, 2012 | Page 345- 378 | |
Figure 21.3: Full Underground Operating Cost Summary
Project No.: C-580 January, 2012 | Page 346 - 378 | |
21.3.2.11 Cost per tonne of ore
A summary for total unit cost is shown in the Table 21.11. Total operating costs per tonne of ore for each option are shown in Figure 21.4 to Figure 21.6:
Table 21.11: Process Unit Cost Summary
| AREA | UNIT | COST |
| Super Pit | Hybrid | Full U'G |
| TOTAL SULPHIDES COST | US$/t ore | 10.4 | 9.9 | 10.2 |
| Mine | US$/t ore | 4.9 | 4.2 | 5.8 |
| Concentrator Process Cost | US$/t ore | 4.4 | 4.6 | 3.7 |
| CONCENTRATOR | US$/t ore | 3.5 | 3.6 | 2.9 |
| CRUSHING | US$/t ore | 0.1 | 0.2 | 0.3 |
| GRINDING | US$/t ore | 2.4 | 2.2 | 1.8 |
| FLOTATION | US$/t ore | 0.5 | 0.3 | 0.3 |
| CONCENTRATE HANDLING | US$/t ore | 0.0 | 0.1 | 0.1 |
| TAILINGS HANDLING | US$/t ore | 0.2 | 0.4 | 0.4 |
| SCAVENGER TAILS TREATMENT | US$/t ore | 0.2 | 0.5 | 0.2 |
| ROASTING PLANT | US$/t ore | 0.2 | 0.3 | 0.3 |
| AS TREATMENT AND DISPOSAL | US$/t ore | 0.4 | 0.6 | 0.3 |
| WATER SUPPLY | US$/t ore | 0.3 | 0.1 | 0.2 |
| Sulphides G&A | US$/t ore | 0.6 | 0.6 | 0.6 |
| Contingencies | US$/t ore | 0.5 | 0.5 | 0.5 |
| | | | | |
| TOTAL HEAP LEACH COST | US$/t ore | 0.68 | 0.80 | 1.11 |
| Process Cost | US$/t ore | 0.58 | 0.69 | 0.96 |
| Heap Leach G&A | US$/t ore | 0.06 | 0.07 | 0.10 |
| Contingencies | US$/t ore | 0.03 | 0.04 | 0.05 |
Project No.: C-580 January, 2012 | Page 347 - 378 | |
Figure 21.4: Super Pit Operating Cost per Tonne of Ore
Figure 21.5: Hybrid Operating Cost per Tonne of Ore
Project No.: C-580 January, 2012 | Page 348 - 378 | |
Figure 21.6: Full Underground Operating Cost per Tonne of Ore
| 21.3.2.12 | Cost per ounce of gold equivalent |
Cost per ounce of equivalent gold for each option are shown in Figure 21.7 to Figure 21.9. Gold equivalent operating costs were calculated by dividing total metals revenue by the gold price per ounce used in each year.
Project No.: C-580 January, 2012 | Page 349 - 378 | |
Figure 21.7: Super Pit: Cost per ounce of gold equivalent
Figure 21.8: Hybrid: Cost per ounce of gold equivalent
Project No.: C-580 January, 2012 | Page 350 - 378 | |
Figure 21.9: Full Underground: Cost per ounce of gold equivalent
Project No.: C-580 January, 2012 | Page 351 - 378 | |
The economic analysis is based on the estimated CAPEX and OPEX and revenue calculated thereof. The CAPEX and OPEX were developed as noted in Item 21. This section illustrates the projects revenues and associated economic analysis. Cash flow and economic analyses were performed from effective date that equipment was on the project site.
The economic analysis excludes taxes but includes Anglo American royalty of 3 %. Sensitivities based on commodity price, metals recovery, operating cost and capital expenditure variation are highlighted in Figure 22.4 to Figure 22.6 and the results discussed in section 22.3.
The economic evaluations completed for this section indicate that the Super Pit is the preferred option to be developed to Feasibility Study level.
| 22.1 | Production and Revenue |
Total payable metal production for the options evaluated is summarized in Table 22.1:
Table 22.1: Payable Metal Production
| METALS PAYABLE PRODUCTION |
| Item | Unit | Super Pit | Hybrid | Full Underground |
| Copper Production | Mlb | 4,003 | 3,267 | 2,331 |
| Gold Production | koz | 12,983 | 10,795 | 7,727 |
| Silver Production | koz | 14,736 | 11,968 | 8,360 |
The revenue associated with these payable metal productions is presented in Table 22.2. The revenue was calculated using the following metal prices:
| ● | Au | 1,430 US$/oz Years 1 – 47 1,200 US$/oz remaining LoM |
| | | |
| ● | Cu | 2.75 US$/lb LoM |
| | | |
| ● | Ag | 31.2 US$/oz Years 1 - 4 22.5 US$/oz remaining LoM |
15 Yrs 1- 4 used for precious metals prices are from heap leach start up. As such in the case of the Super Pit and Hybrid option these metal prices are used for the first 4 years of heap leach production and the first 2 years of concentrator production. In the case of the Full Underground option these metals prices are used for heap leach production only.
Project No.: C-580 January, 2012 | Page 352 - 378 | |
Table 22.2: Revenue
| REVENUE (MUS$) |
| Item | Super Pit | Hybrid | Full Underground |
| Copper Revenue | 11,009 | 8,985 | 6,411 |
| Gold Revenue | 16,051 | 13,332 | 9,520 |
| Silver Revenue | 358 | 292 | 203 |
| Total Revenue | 27,419 | 22,609 | 16,134 |
The economic evaluation was developed for all options considering Net Present Value discounted at 5 % (NPV5) and illustrates Internal Rate of Return (IRR) and Payback Period.
A summary of these indicators for all options is presented in Table 22.3:
Table 22.3: Economic Evaluation
| ECONOMIC EVALUATION – INDICATORS |
| Indicator | Unit | Super Pit | Hybrid | Full Underground |
| NPV@5 | MUS$ | 2,800 | 2,142 | 375 |
| IRR | % | 11.5 | 10.4 | 7.3 |
PAYBACK(*) | Years | 9.9 | 11.2 | 16.2 |
(*) from initial investment | | | |
The cash flows for each option are presented in Figure 22.1 to Figure 22.3.
Project No.: C-580 January, 2012 | Page 353 - 378 | |
Figure 22.1: Cash Flow – Super Pit
Figure 22.2: Cash Flow – Hybrid
Project No.: C-580 January, 2012 | Page 354 - 378 | |
Figure 22.3: Cash Flow – Full Underground
Project No.: C-580 January, 2012 | Page 355 - 378 | |
A sensitivity analysis for NPV5 was completed for all options considering metals recoveries and prices and variations in the CAPEX and OPEX. This sensitivity analysis is summarized in Figure 22.4, Figure 22.5 and Figure 22.6 as follows:
Figure 22.4: Super Pit: NPV5 Sensitivity Analysis
Figure 22.5: Hybrid: NPV5 Sensitivity Analysis
Project No.: C-580 January, 2012 | Page 356 - 378 | |
Figure 22.6: Full Underground: NPV5 Sensitivity Analysis
A sensitivity analysis for NPV=0 was completed for all options considering metals recoveries and prices and variations in the CAPEX and OPEX. This sensitivity analysis is summarized in Table 22.4. NPV = 0 is effectively breakeven for the project. Table 22.4 illustrates the metal values where breakeven occurs and highlights the robustness of the Caspiche Project.
Table 22.4: Sensitivity Analysis For NPV=0
| INDICATORS FOR NVP = 0 |
| Item | Super Pit | Hybrid | Full Underground |
| Price Copper | 1.52 | 1.49 | 2.24 |
| Price Gold (Years 1 - 4) | 1,024 | 1,034 | 1,297 |
| Price Gold (Remaining LoM) | 859 | 868 | 1,089 |
A sensitivity analysis for Cu price of 3.54 US$/lb (December 7th, 2011) was completed for all options. This sensitivity analysis is summarized in Table 22.5.
Project No.: C-580 January, 2012 | Page 357 - 378 | |
Table 22.5: Cu Current Market Price
| ECONOMIC EVALUATION - INDICATORS FOR Cu = 3.54 US$/lb |
| Indicator | Unit | Super Pit | Hybrid | Full Underground |
| NPV@5 | MUS$ | 4,605 | 3,490 | 961 |
| IRR | % | 14.8 | 13.2 | 10.8 |
PAYBACK(*) | Years | 8.6 | 9.9 | 15.0 |
A sensitivity analysis for Au price of 1,731 US$/oz (December 7th, 2011) was completed for all options. This sensitivity analysis is summarized in Table 22.4.
Table 22.6: Au Current Market Price
| ECONOMIC EVALUATION - INDICATORS FOR Au = 1,731 US$/oz |
| Indicator | Unit | Super Pit | Hybrid | Full Underground |
| NPV@5 | MUS$ | 6,598 | 5,116 | 1,858 |
| IRR | % | 18.7 | 16.8 | 79.6 |
PAYBACK(*) | Years | 7.3 | 7.8 | 11.6 |
| 22.3 | Conclusions from the Economic Analysis |
The NPV5, IRR and payback period indicate the following:
| ● | The Super Pit option provides the most favourable economic return followed by the Hybrid and then the Full Underground. |
| ● | Payback period is shortest for the Super Pit case due to economies of scale due to higher tonnage rate and the lower cost for the heap leach process. |
| ● | The Super Pit option provides the highest revenue due to the largest reserve exploitation of the options studied. |
| ● | The Full underground case is prejudiced against due to long development time. This is somewhat mitigated by early cash flow from the stand alone heap leach operation during underground mine development. |
The sensitivity analyses indicate:
| ● | Super Pit sensitivity analysis indicates that it is most sensitive to gold recovery ahead of operating costs and then copper recovery. |
| - | Metals fluctuation impact is expected. Opex sensitivity is largely due to the high volume of waste material to be moved which increases sensitivity impacts. |
Project No.: C-580 January, 2012 | Page 358 - 378 | |
| ● | Hybrid Option sensitivity analysis indicates that it is most sensitive to gold price followed by Opex and then Capex. |
| - | Capex impact is due to the long lead time to develop the underground mine operation and the smaller benefits associated with the EPCC system. |
| ● | Full Underground sensitivity analysis indicates the greatest impact in gold price followed by Capex and Opex. Capex impact is greater due to long underground development timeoperation. |
| ● | The sensitivity analysis shows maximum variation of NPV5 for Super Pit is MUS$ 1,841 and for Hybrid is MUS$ 1,382. The difference for Super Pit is higher because it has a shorter mine life than the Hybrid and at the same time processes more ore. |
Based on the above, the Super Pit option is that which is recommended for development to feasibility Study level. The key reserve and mining parameters used to reach this conclusion are as per Table 22.7.
Table 22.7: Key Reserve and Mining Parameters
| Reserves | Mt | Au g/t | Ag g/t | Cu % |
| Oxide Ore | 124 | 0.38 | 1.62 | <0.01 |
| MacNeill Ore | 78 | 0.51 | 1.05 | 0.07 |
| Sulphide Ore | 889 | 0.58 | 1.13 | 0.24 |
| | | | | |
| Contained Metal | Cu Mt | Au Moz | Ag Moz | Eq Au Moz |
| 2.1 | 19.3 | 41.5 | 30.1 |
| | | | | |
| Mine Schedule | LOM Yr | Oxide Process kt/d | MacNeill Process kt/d | Open Pit Feed kt/d |
| 19 | 72 | 33 | 150 |
Max. Open Pit Mvment. kt/d | Avg. Open Pit Mvment. kt/d | |
| 909 | 655 |
Project No.: C-580 January, 2012 | Page 359 - 378 | |
There is no property immediately adjacent to the Caspiche project that is at the same state of development as the Caspiche Porphyry deposit.
Project No.: C-580 January, 2012 | Page 360 - 378 | |
| 24.0 | Other Relevant Data and Information |
A Level 1 schedule has been developed for the execution of the three project options. The Summary Project Master Schedules are shown in Figure 24.1 to 24.3.
Figure 24.1: Super Pit Project Master Schedule
Project No.: C-580 January, 2012 | Page 361 - 378 | |
Figure 24.2: Hybrid Project Master Schedule
Project No.: C-580 January, 2012 | Page 362 - 378 | |
Figure 24.3: Full Underground Project Master Schedule
Project No.: C-580 January, 2012 | Page 363 - 378 | |
| 24.1.3 | Early Construction Activities |
In order to comply with the project schedule critical early activities must be completed, before the principal construction required on site. These include earthworks, storage and waste handling, provision of services and buildings and will commence during the project basic or detail engineering phase but should be considered during all development phase timelines. Prior to starting any site work the global environmental licence must be awarded and the relevant sectorial permits must be approved.
In order to complete these anticipated items it will be necessary to develop as much detail engineering as possible. It will also be necessary to proceed with the following pre-approval activities:
| ● | Procurement process for critical equipment for mine development and heap leach ore treatment, so purchase orders can be placed immediately after project approval. |
| ● | Bid and evaluation process for the selection of the EPCM contractor. |
| ● | Negotiations and agreements with landowners in areas where facilities are required for the project but where the land does not belong to Exeter. |
The critical path for the project runs through the environmental permitting, the main access road construction, the supply of temporary facilities and mine pre-stripping activities.
Trade-off studies may be required prior to the Feasibility Study to confirm the Super Pit is still the preferred option and to incorporate all subsequent testwork competed. Based on the Super Pit option the estimated project development time is:
| ● | Super Pit Alternative: 57 months with 95% construction completion achieved in 54 months. Overall project execution is estimated as being 63 months |
| 24.1.3 | Contracting Strategy |
On completion of feasibility study the company will review the various contracting options for the project. This section discusses options for contracting the engineering, procurement, contracts, project controls, construction management, construction and commissioning services for the implementation of the Caspiche project.
It is expected that the EPCM contractor will be based in Chile and will have relevant EPCM experience within the region. However there will be areas where it is advantageous to Exeter to award EP or EPC contracts, particularly when considering large capital equipment items.
| 24.1.3.2 | Engineering, Procurement and Construction Management |
EPCM has been the predominant form of contracting mining project implementation services in Chile over the last 20 years. Some of the services will be carried out by the owner but the majority of the work will be executed by the EPCM contractor and its sub-contractors or
Project No.: C-580 January, 2012 | Page 364 - 378 | |
partners. Consequently, the execution plan is based on one EPCM contractor executing the scope of services for the entire project.
Detailed engineering will be carried out by the EPCM contractor.
The basis for the detail design will be the feasibility study and the drawings and documents prepared. At the start of the detail design stage the design basis will be confirmed.
The EPCM contractor’s Procurement Manager will be responsible for the overall management of procurement activities in home office and field. The EPCM contractor’s Procurement Manager will be responsible for developing the Project Procurement Plan which identifies the schedule for procurement, expediting requirements, shipping logistics and other important issues.
| 24.1.6 | Construction Execution Plan |
| 24.1.6.1 | Organization and Construction Manpower |
This execution plan has been developed taking into account the specific requirements for construction of the Caspiche project. The number and distribution of project staff for Exeter and the EPCM contractor and for construction contractors have been estimated. The Super Pit option will be constructed in one phase.
It is assumed that construction labour will work 200 hours per month. The peak staff will be reached in Q3 of 2013 and is estimated at 5,244 people on site. Site personnel will work 21 days on 7 off and it is estimated that approximately 25% of them will be accommodated in Copiapó or other satellite camps.
In the Hybrid option, the project will be constructed in two phases as described below:
Phase 1
Phase 1 has been defined as the start up of the heap leach and the processing of the PLS in an ADR and EW plant to produce metal doré from Year 1 (2013) to Year 2 (2014).
The treatment of ore by heap leach will continue for approximately 12 years
Phase 2
Phase 2 is the start up of the concentrator (crushing-grinding-flotation) to treat sulphides to produce concentrate which will be fed to a partial atmosphere roaster to remove arsenic within the concentrate and produce a commercially viable calcine concentrate followed by CIP leaching of the scavenger tails.
In the Full Underground option, the project will be constructed in two phases in a similar manner to the Hybrid option.
Project No.: C-580 January, 2012 | Page 365 - 378 | |
The project will use a shift system according to the Chilean law for all personnel including Exeter EPCM contractor staff as well as direct and indirect construction and service contractors’ staff. The estimate used in this report is based on the following shift system:
The camp will be designed as an integrated construction and operations (permanent) camp and will be bid early in the project implementation phase on a design, supply and erect contract basis. The camp capacity will be defined by the peak of personnel at site. The construction of the camp will be phased to meet the accommodation requirements.
Power Generation, Clinic and Battery Limits for all phases have all been considered in the design and drawings by Aker.
| 24.1.6.3 | Pre-Commissioning, Commissioning and Handover |
The project objective is to complete the commissioning and start-up of the Caspiche project facilities on schedule, safely and within budget. Planning for commissioning activities will commence in parallel with detail design and constructability reviews. The required plant start-up sequence will define the construction schedule, contracting plan and strategies, engineering priorities, PO terms and schedules and design deliverable dates.
The EPCM Contractor will assign a commissioning team in conjunction with the construction team and Exeter’s operations personnel. The Commissioning Manager will finalize the detailed commissioning program. The participation of Exeter’s operating team is a key component of the overall commissioning plan. Their participation during wet commissioning will provide them with an opportunity to learn about process operations before performance testing and plant hand-over.
The commissioning period will start with the introduction of ore to the plant.
After commissioning the plant will go through a ramp-up period until it achieves full production capacity. Ramp-up to full production is scheduled to occur over a three month period.
Project No.: C-580 January, 2012 | Page 366 - 378 | |
| 25.0 | INTERPRETATION AND CONCLUSIONS |
| ● | No fatal flaws were identified during the course of the Caspiche Project prefeasibility study. All mine, plant and infrastructure design was based on conventional, proven equipment and techniques currently in day to day use in Chile and other countries. |
| ● | The financial analysis indicated that all alternatives for the project had a net positive cash flow and an acceptable internal rate of return and could support the progression to mine development |
| ● | At the metals prices used and based on the economic evaluations in item 22.2, the Super Pit option is the most attractive alternative. The use of in-pit crushing and conveying systems for the waste provide further upside benefits to the Super Pit option. As such the Super Pit option should be further developed to FS level. |
| ● | The Super Pit option also provides the lowest risk alternative of the 3 options evaluated. There is no need for extensive underground evaluation as required for the Hybrid and Full Underground options. |
| ● | Execution of this project type is well understood in Chile thus neither topography or altitude present excessive challenges |
| ● | The topography around the project area is reasonably benign, thus there are no great haul road inclines outside of the pit area and the overall area allows easy incorporation of plant and infrastructure without major earthworks requirement. |
| ● | The project economics derived in sections 21 and 22 show that the Super Pit option has robust economics under the metals prices used and a considerable metals price reduction prior to reaching project breakeven. This is shown in Table 25.1. |
Table 25.1: Project Break-even Analysis
| INDICATORS FOR NVP = 0 |
| Item | Super Pit | Hybrid | Full Underground |
| Price Copper | 1.52 | 1.49 | 2.24 |
| Price Gold (Years 1 - 4) | 1,024 | 1,034 | 1,297 |
| Price Gold (Remaining LoM) | 859 | 868 | 1,089 |
| ● | Three mining options with their corresponding plants were evaluated: |
| - | An open pit option, designated ‘Super Pit case’ extracting an average of 150,000 t/d sulphide ore over a project life of 19 years. A heap leach facility will also operate in parallel with the sulphide concentrator for the first 9 years, processing a maximum of 72,000 t/d heap leach ore. |
Project No.: C-580 January, 2012 | Page 367 - 378 | |
| - | A combined open pit and underground option, designated ‘Hybrid’, extracting an average of 95,000 t/d sulphide ore over a project life of 24 years. A heap leach facility will also operate in parallel with the sulphide concentrator for the first 9 years operation, processing a maximum of 72,000 t/d heap leach ore. |
| - | An underground option, designated ‘Full Underground’, extracting an average of 90,000 t/d sulphide ore for 22 years from year 9 of the project A heap leach facility will also operate in parallel with the sulphide concentrator for approximately the first 9 years operation, processing a maximum of 72,000 t/d heap leach ore. |
| - | Oxide and leachable MacNeill production was largely the same for each of the sulphide options considered in the study. |
| ● | Proven and Probable Reserves for the three options were established and are summarized in Table 25.2, 25.3 and 25.4.: |
Table 25.2: Super Pit – Proven and Probable Reserves (Carlos Guzman, CChM, October 2011)
| Option | Super Pit |
| Oxide Ore | MacNeill Ore | Sulphide Ore | Contained Metal (millions) |
| Mt | Au g/t | Ag g/t | Mt | Au g/t | Cu % | Ag g/t | Mt | Au g/t | Cu % | Ag g/t | Au oz | Cu t | Ag oz |
| Proven | 62 | 0,42 | 1,71 | 4 | 0,46 | 0,08 | 0,70 | 321 | 0,62 | 0,26 | 1,10 | 7,3 | 0,8 | 14,8 |
| Probable | 62 | 0,33 | 1,52 | 74 | 0,51 | 0,07 | 1,08 | 568 | 0,55 | 0,23 | 1,15 | 11,9 | 1,3 | 26,6 |
| Total | 124 | 0,38 | 1,62 | 78 | 0,51 | 0,07 | 1,05 | 889 | 0,58 | 0,24 | 1,13 | 19,3 | 2,1 | 41,5 |
Super Pit Reserves Notes:
| 1. | Mineral Reserves are defined within a mine plan with pit phase designs guided by Lerchs-Grossman (LG) pit. The LG shell generation was performed on Measured and Indicated materials only, using a gold price of 1,150 US$/oz, a silver price of 20 US$/oz and a copper price of 2.5 US$/lb, a base mining cost of 1.00 US$/t with incremental of 0.025 US$/t per 15 m bench below the pit exit and 0.015 US$/t per 15 m bench above the pit exit. Processing and treatment costs used were 3.40 US$/t of ore and 6 US$/oz of gold and 0.4 US$/oz of silver for oxides, 5.31 US$/t and 6 US$/oz of gold and 0.4 US$/oz of silver for MacNeill and 7.04 US$/t and 6 US$/oz of gold and 0.4 US$/oz of silver for sulphides. Royalties were also applied. Metallurgical recoveries for oxides were 78 % for gold and 34 % for silver. Metallurgical recoveries for MacNeill were 55 % for gold in the upper layers and 30 % in the lower layers and 20 % for silver. Silver metallurgical recovery for sulphides was 50 %. Copper and gold metallurgical recovery for sulphides was a function of the head grade, |
| 2. | Recoveries are based on a targeted 25 % copper concentrate grade |
| 3. | Sulphide and oxide ore reserves are reported at 0.00 US$/t profit |
| 4. | Leachable MacNeill ore reserves are reported at 0.49 US$/t profit after cost of rehandle |
| 5. | Tonnages are rounded to the nearest 1,000 kt; grades are rounded to two decimal places. |
| 6. | Rounding as required by reporting guidelines may result in apparent summation differences between tonnes, grade and contained metal content. |
| 7. | Tonnage and grade measurements are in metric units; contained gold and silver are in troy ounces |
| 8. | The life of mine strip ratio is 3.11 |
Project No.: C-580 January, 2012 | Page 368 - 378 | |
Table 25.3: Hybrid Case – Proven and Probable Reserves (Carlos Guzman, CChM, October 2011)
| Option | Hybrid (Open Pit + Underground) |
| Oxide Ore | MacNeill Ore | Sulphide Ore | Contained Metal (millions) |
| Mt | Au g/t | Ag g/t | Mt | Au g/t | Cu % | Ag g/t | Mt | Au g/t | Cu % | Ag g/t | Au oz | Cu t | Ag oz |
| Proven | 62 | 0,42 | 1,71 | 4 | 0,46 | 0,08 | 0,70 | 273 | 0,65 | 0,27 | 1,13 | 6,6 | 0,7 | 13,4 |
| Probable | 62 | 0,33 | 1,52 | 65 | 0,51 | 0,07 | 1,07 | 387 | 0,62 | 0,25 | 1,21 | 9,4 | 1,0 | 20,4 |
| Total | 124 | 0,38 | 1,62 | 70 | 0,50 | 0,07 | 1,05 | 660 | 0,63 | 0,26 | 1,18 | 16,0 | 1,7 | 33,8 |
Hybrid Case Reserves Notes:
| 1. | Mineral Reserves for the open pit are defined within a mine plan with pit phase designs guided by Lerchs-Grossman (LG) pit. The LG shell generation was performed on Measured and Indicated materials only, using a gold price of 1,150 US$/oz, a silver price of 20 US$/oz and a copper price of 2.5 US$/oz, a base mining cost of 1.00 US$/t with incremental of 0.025 US$/t per 15 m bench below the pit exit and 0.015 US$/t per 15 m bench above the pit exit. Processing and treatment costs used were 3.40 US$/t of ore and 6 US$/oz of gold and 0.4 US$/oz of silver for oxides, 5.31 US$/t and 6 US$/oz of gold and 0.4 US$/oz of silver for MacNeill and 7.04 US$/t and 6 US$/oz of gold and 0.4 US$/oz of silver for sulphides. Royalties were also applied. Metallurgical recoveries for oxides were 78% for gold and 34 % for silver. Metallurgical recoveries for MacNeill were 55 % for gold in the upper layers and 30 % in the lower layers and 20 % for silver. Silver metallurgical recovery for sulphides was 50 %. Copper and gold metallurgical recovery for sulphides was a function of the head grade. |
| 2. | Recoveries are based on a targeted 25 % copper concentrate grade |
| 3. | Sulphide and oxide ore reserves are reported at 0.00 US$/t profit |
| 4. | Leachable MacNeill ore reserves are reported at 0.49 US$/t profit after cost of rehandle |
| 5. | Tonnages are rounded to the nearest 1,000 kt; grades are rounded to two decimal places. |
| 6. | Rounding as required by reporting guidelines may result in apparent summation differences between tonnes, grade and contained metal content. |
| 7. | Tonnage and grade measurements are in metric units; contained gold and silver are in troy ounces |
| 8. | The life of mine strip ratio is 1.47 |
Table 25.4: Full Underground Case Case – Proven and Probable Reserves (Carlos Guzman, CChM, October 2011)
| Option | Full Underground |
| Oxide Ore | MacNeill Ore | Sulphide Ore | Contained Metal (millions) |
| Mt | Au g/t | Ag g/t | Mt | Au g/t | Cu % | Ag g/t | Mt | Au g/t | Cu % | Ag g/t | Au oz | Cu t | Ag oz |
| Proven | 57 | 0,43 | 1,69 | 7 | 0,47 | 0,11 | 0,82 | 158 | 0,72 | 0,31 | 1,22 | 4,5 | 0,5 | 9,5 |
| Probable | 55 | 0,34 | 1,44 | 67 | 0,56 | 0,11 | 1,16 | 243 | 0,67 | 0,29 | 1,30 | 7,0 | 0,7 | 15,1 |
| Total | 112 | 0,39 | 1,57 | 74 | 0,55 | 0,11 | 1,12 | 400 | 0,69 | 0,30 | 1,27 | 11,6 | 1,2 | 24,6 |
Underground Reserves Notes:
| 1. | Mineral reserves for the block cave in the underground mine were defined using the Laubscher dilution model, considering a 60 % Dilution Entry Point and a maximum ore column height of 500 m. The grade of the waste and inferred material was assumed as zero. Only sulphides material was considered as economical. The economic parameters used for the determination of reserves were a gold price of 1,150 US$/oz, a silver price of 20 US$/oz and a copper price of 2.5 US$/oz, an average mining cost of 7.0 US$/t. Processing and treatment costs used were 7.04 US$/t and 6 US$/oz of gold and 0.4 US$/oz of silver. Royalties were also applied. Silver metallurgical recovery for sulphides was 50 %. Copper and gold metallurgical recovery was a function of the head grade. |
| 2. | Recoveries are based on a targeted 25 % copper concentrate grade |
Project No.: C-580 January, 2012 | Page 369 - 378 | |
| 3. | Dilution material considering waste and inferred resources was included as probable reserves |
| 4. | Tonnages are rounded to the nearest 1,000 kt; grades are rounded to two decimal places. |
| 5. | Rounding as required by reporting guidelines may result in apparent summation differences between tonnes, grade and contained metal content. |
| 6. | Tonnage and grade measurements are in metric units; contained gold and silver are in troy ounces |
| ● | Total metal contained in the reserves for the three options was calculated and is summarized in Table 25.5: |
Table 25.5: Total Contained Metal
| Option | Contained Metal (Oxide + MacNeill + Sulphide) |
| |
| Au (Moz) | Cu (Mt) | Ag (Moz) | Eq Au (Moz) |
| Super Pit | 19.3 | 2.1 | 41.5 | 30.1 |
| Hybrid | 16.0 | 1.7 | 33.8 | 24.7 |
| Full UG | 11.6 | 1.2 | 24.6 | 17.8 |
Note: The metal prices used to estimate gold equivalent (Eq Au) were 1,150 US$/oz of gold, 20 US$/ oz of silver and 2.5 US$/lb of copper
| ● | Summaries of the Capital and Operating Costs estimated for the three options are as per Table 25.6 and 25.7. |
Table 25.6: Capital Cost Estimate
| CAPEX / OPTION | Super Pit | Hybrid | Full Underground |
| Mine | 945,227,824 | 784,709,025 | 983,319,716 |
| Process plant | 1,426,134,955 | 1,177,895,449 | 1,131,218,267 |
| Infrastructure (including Power and Water supply & access) | 419,852,678 | 432,702,291 | 436,867,733 |
| Indirect (incl. G&A and Owners Cost) | 870,184,179 | 745,112,334 | 770,248,136 |
| Other | 310,991,493 | 167,207,809 | 299,489,409 |
| Contingency | 827,366,227 | 683,633,302 | 721,515,343 |
| Total | 4,799,757,356 | 3,991,260,210 | 4,342,658,604 |
Project No.: C-580 January, 2012 | Page 370 - 378 | |
Table 25.7: Average operating costs ($/t ore processed) life of mine
| AREA | UNIT | COST |
| Super Pit | Hybrid | Full U'G |
| TOTAL SULPHIDES COST | US$/t ore | 10.4 | 9.9 | 10.2 |
| Mine | US$/t ore | 4.9 | 4.2 | 5.8 |
| Concentrator Process Cost | US$/t ore | 4.4 | 4.6 | 3.7 |
| CONCENTRATOR | US$/t ore | 3.5 | 3.6 | 2.9 |
| CRUSHING | US$/t ore | 0.1 | 0.2 | 0.3 |
| GRINDING | US$/t ore | 2.4 | 2.2 | 1.8 |
| FLOTATION | US$/t ore | 0.5 | 0.3 | 0.3 |
| CONCENTRATE HANDLING | US$/t ore | 0.0 | 0.1 | 0.1 |
| TAILINGS HANDLING | US$/t ore | 0.2 | 0.4 | 0.4 |
| SCAVENGER TAILS TREATMENT | US$/t ore | 0.2 | 0.5 | 0.2 |
| ROASTING PLANT | US$/t ore | 0.2 | 0.3 | 0.3 |
| AS TREATMENT AND DISPOSAL | US$/t ore | 0.4 | 0.6 | 0.3 |
| WATER SUPPLY | US$/t ore | 0.3 | 0.1 | 0.2 |
| Sulphides G&A | US$/t ore | 0.6 | 0.6 | 0.6 |
| Contingencies | US$/t ore | 0.5 | 0.5 | 0.5 |
| | | | | |
| TOTAL HEAP LEACH COST | US$/t ore | 0.68 | 0.80 | 1.11 |
| Process Cost | US$/t ore | 0.58 | 0.69 | 0.96 |
| Heap Leach G&A | US$/t ore | 0.06 | 0.07 | 0.10 |
| Contingencies | US$/t ore | 0.03 | 0.04 | 0.05 |
| ● | The capital and operating cost results were very much in line with those expected for a high altitude Chilean porphyry project of this type. Operating costs were generated from first principles and benchmarked against other operations. Capital costs were based on quotes for approximately 40 % of the equipment costs and Aker’s database information. Capital costs were also benchmarked against similar operations. |
| ● | The rock and ore characteristics for Caspiche are generally mid-range for these styles of deposits. Rock mass characteristics are mostly good and comminution characteristics indicate the ore to be somewhat softer and less abrasive than other Chilean porphyries. |
| ● | The mine plan is appropriate to the mineralization and adequately reflects the deposit type, dimensions and host rock characterization. |
| ● | Additional metallurgical studies are needed prior to a construction decision to optimize recovery and equipment selection, on oxide, MacNeill and sulphide ores. |
Project No.: C-580 January, 2012 | Page 371 - 378 | |
| ● | To advance the project to construction Exeter will require an approved environmental impact study, additional baseline studies required to support the impact study should be initiated as soon as possible. |
| ● | Additional geotechnical and hydrological studies are required particularly to model surface water flows into the Vegas or seasonal creeks. |
| ● | The project has further exploration potential in the areas around Caspiche and there is resource potential in Caspiche Epithermals. |
| ● | Additional geotechnical evaluations may permit selective slope steepening of the open pit and the use of variable bench heights. Further mine fleet optimization is possible. |
| ● | Ongoing testwork such as High Pressure Grinding Rolls; fine liberation of gold and copper may positively impact project operating costs. |
| ● | There is a potential to share infrastructure development costs, such as access roads, power lines and water supplies, with other neighboring operations. |
| ● | As indicated in item 22 the project economics are sensitive to metal prices. Conservative long term metals prices have been used in the project evaluation. |
Project No.: C-580 January, 2012 | Page 372 - 378 | |
| 26.1 | General Project Recommendations |
| ● | Before advancing to detailed feasibility study level all relevant testwork and other development updates should be applied once more to all three options studied to confirm that the criteria used in the selection of the Super Pit as the preferred option l are still valid. |
| ● | Further options for the location of the concentrate treatment plant and subsequent product transport should be evaluated in trade-off studies prior to initiating detailed feasibility studies |
| ● | Water supply studies, easement corridors and land acquisition negotiations should be advanced as these can be a time consuming processes |
In more detail the recommendations pertaining to the mine and process plant are noted below.
| ● | A double bench 30 m configuration may improve mining economics. |
| ● | A short-term analysis of the pre-stripping and first years of production to determine the variation of feed and identify operational problems should be completed. |
| ● | Further studies to improve the geotechnical slope angle of the pit and the stability of the waste dump should be completed. This may allow selected pit wall steepening. |
| ● | Analyse the potential benefit to use narrow phases in the Super Pit option for a better distribution and delaying of the waste movement per year. |
| ● | The following studies would be necessary to develop underground engineering: |
| - | Exploration drift development to confirm rock characterization. |
| - | Hydrogeological studies. |
| - | Expand structural and geotechnical understanding of the deposit. |
| ● | Identify potentially leachable low grade ore which may extend heap leach operations. |
| ● | A detailed leach pad sequential construction plan should be developed as part of the feasibility study. |
| ● | Review the possibility of using a shorter initial leach cycle with higher lifts for the oxide ore thus accelerating early cash flow |
| ● | Augment the metallurgical database with additional representative samples to ensure that the recovery and comminution processes selected are fully characterized. Use the database to begin construction of a geometallurgical model for development and later operational use. |
Project No.: C-580 January, 2012 | Page 373 - 378 | |
| ● | Continue flotation optimisation testwork to maximise selective copper and gold recovery, especially in the rougher stages |
| ● | Continue process and equipment testwork to develop the most efficient combination of processes to recover gold and copper from cleaner-scavenger tails. |
| ● | Continue to review and optimise tailings dewatering technologies and strategies to maximise water recovery and in-situ bulk density. |
| ● | Review and optimise equipment selection to use the most efficient high capacity equipment available as new prototypes become proven. |
| ● | Use existing pilot plant products for additional vendor equipment testwork. If the products become unsuitable or unavailable, consider another pilot plant campaign ahead of the feasibility study or as part of it. |
| ● | Economic evaluation considerations and inputs should be updated as ongoing metallurgical testwork results become available. |
Assuming that the outcome of the PFS and cash flow model meets Exeter’s internal requirements to proceed, it is recommended that a definitive feasibility study (DFS) be completed to confirm the economics of the Super Pit project at a higher level of accuracy (±10-15%).
The project schedule is aggressive, see item 24.1, and is based on a decision to proceed to DFS in Q3, 2012, with completion of the study by the end of Q2 2013.
Significant new information needs to be developed in most areas, including:
| ● | Metallurgy: additional testwork to confirm process parameters used for equipment definition and design purposes; and to confirm or revise inputs to the mining and financial models. |
| ● | Geotechnical: confirmation of assumptions made regarding rock strength, foundation conditions, slope stability, leach pad permeability, waste dump design, through further field investigations, laboratory testwork and data analysis. |
| ● | Topography: detailed topographic information is required for specific installation designs and material take-offs at the required accuracy. |
| ● | Geochemical definition of the PAG nature of waste rock, to support requirements for contact-water treatment plant, and with implications for closure activities. |
| ● | Hydrogeological testing to confirm water flows and de-watering requirements for the open pit. |
| ● | Engineering design and costing to required level of accuracy, including: development of PFDs, P&IDs, arrangement drawings and take-offs electrical, piping and structural design, major equipment specifications developed for budget pricing from suppliers, |
Project No.: C-580 January, 2012 | Page 374 - 378 | |
| | identification of suitable local suppliers and contractors, to obtain budget prices and unit rates for minor equipment, civil works, materials and construction activities estimation of EPCM costs |
| ● | Environmental: completion of the EIA, as a basis for permitting activities. |
| ● | Community relations: continue the process of providing information to local communities, resolving potential issues as part of the design process. |
| ● | Project implementation: more detailed discussions with Exeter concerning the approach to project design and construction. |
Table 26.1 illustrates the key areas and costs that have been identified to complete the FS. As the project develops these costs will be refined and updated.
Table 26.1: Key Areas and Costs
| Task | Cost Estimate (MUS$) |
| Feasibility study | 7 |
| Additional mining studies | 1 |
| Condemnation drilling | 5 |
| EIA | 4 |
| Metallurgical test work | 4 |
| Water rights and evaluation | 5 |
| Geotechnical evaluation | 0.5 |
| Hydrological evaluation | 0.5 |
| Land acquisition / easement | 3 |
| Community Relations | 1 |
| Additional site studies – topography etc | 1 |
| Total | 32 |
Project No.: C-580 January, 2012 | Page 375 - 378 | |
Aker Solutions, Stand Alone Oxides Plant, Pre-feasibility Study, June 2011. |
AKL Ltda., Nota Geotechnica No. NCL 2011-01, March 2011. |
AMTEL Ltd., Deportment of Gold, Silver and Copper in Caspiche Flotation Tails. Report Nr 11/39, October 2011. |
Canadian Institute of Mining, Metallurgy and Petroleum (CIM), 2003, Estimation of Mineral Resources and Mineral Reserves, Best Practice Guidelines: Canadian Institute of Mining, Metallurgy and Petroleum, November 23, 2003. |
Canadian Institute of Mining, Metallurgy and Petroleum (CIM), 2003, Estimation of Mineral Resources and Mineral Reserves, Best Practice Guidelines: Canadian Institute of Mining, Metallurgy and Petroleum, November 23, 2003 |
Canadian Institute of Mining, Metallurgy and Petroleum (CIM), 2005, CIM Standards for Mineral Resources and Mineral Reserves, Definitions and Guidelines: Canadian Institute of Mining, Metallurgy and Petroleum, December 2005. |
G & T Metallurgical Services Ltd., 2009a, Preliminary Assessment of the Caspiche Deposit, reference KM2311, unpublished report prepared for Exeter, March 2009. |
G & T Metallurgical Services Ltd., 2009b, Further Process Development of the Caspiche Deposit, reference KM2403, unpublished report prepared for Exeter, September 2009. |
G & T Metallurgical Services Ltd., 2009c, Further Metallurgical Assessment of the Caspiche Deposit, reference KM2487, unpublished report prepared for Exeter, December 2009. |
G & T Metallurgical Services Ltd., 2010, Advanced Metallurgical Assessment of Ore Type Composites from the Caspiche Deposit, reference KM2555, unpublished report prepared for Exeter, June 2010. |
Galaz, L. J., 2008, Descripción de Equipo, GPS O Navegadores Manuales, y Coordenadas IGM versus DIFROL, unpublished report prepared for Exeter, November, 2008. |
Gonzalez, 2009, Caspiche Water and Power Benchmark Study, April 19, 2009, unpublished report prepared for Exeter Resource Corporation. |
Hatch, Caspiche Water and Power Supply Benchmark Study. Report Nr H331616-0000-90-236-0001, April 2009. |
Inversiones IAL Ambiental Limitada, Proyecto Studio de Linea Base, Proyecto Minero Caspiche, August 2010. |
Inversiones IAL Ambiental Limitada, Environmental Considerations, EBS Caspiche Mining Project, June 2011. |
Karzulovic & Asoc. Ltda, (AKL), Evaluación Geotécnica, Etapa Conceptual, Proyecto Caspiche, September 2010. |
| Knight Piésold Consulting, Tailings Dam Wall Engineered Face Pre-feasibility Design (Ref. No. SA202-00171/07), August 2011. |
Project No.: C-580 January, 2012 | Page 376 - 378 | |
Marinho, R., 2011, Caspiche Project, Caspiche Mineral Resource Estimate Update, October 2011, M40011, Prepared by AMEC for Exeter Resource Corporation, October 2011. |
McClelland Laboratories Inc., 2009, Report on Heap Leach Cyanidation Testing – Caspiche Oxide Ore Drill Core Composites, MLI Job No 3315, unpublished report prepared for Exeter, May 2009. |
McClelland Laboratories Inc., Bottle Roll Tests - Caspiche MacNeill Zone Drill Cuttings Composites. MLI No. 3420, April 2010. |
McClelland Laboratories Inc., Heap Leach Cyanidation Testing – Caspiche Drill Core Composites. MLI Job No. 3423, March 2011. |
McClelland Laboratories, Report on Heap Leaching Cyanidation Testing – Caspiche Drill Core Composites, March 2, 2011. |
McClelland Laboratories Inc., Heap Leach, Milling/Cyanidation and Flotation Testing – MacNeill Zone Drill Core Composites. MLI Job No. 3495, September 2011. |
Mir, P., 2011, Sociedad Contractual Minera Eton Chile, 30 September 2011, unpublished letter to Exeter Resource Corporation from Bofill Mir Abogados. |
NCL Ingeniería y Construcción S.A., Caspiche Gold Project, IPCC Scoping Study, June 2011 |
Outotec Germany, Partial Roasting of Caspiche Cu-Concentrate (Removing of As and Sb). Report Nr 11/PNV/09, March 2011. |
Perkins, J., 2009, Exeter 2008 Metallurgical Testing, unpublished report prepared for Exeter Resource Corporation. |
Richard H. Sillitoe, Geology and Potential of the Caspiche Porphyry Copper-Gold Prospect, Northern Chile, June 2008. |
Richard H. Sillitoe, Updated Geological Model of the Caspiche Porphyry Gold-Copper Prospect, Northern Chile, May 2009. |
Richard H. Sillitoe, Geological Model of the Caspiche Porphyry Copper-Gold Prospect, Northern Chile, February 2009. |
Richard H. Sillitoe, Some New Geological Features and Peripheral Potential, Caspiche Porphyry Gold-Copper Deposit, Northern Chile, January 2010. |
Richard H. Sillitoe, Some New Geological Features of the Caspiche Porphyry Gold-Copper Deposit, Northern Chile, July 2010. |
Sandvik Mining and Construction (SMC); Caspiche Project, Pre - feasibility Study, October 2011. |
Selmar International Services Ltda in Conjunction With Neil S. Seldon & Associates Ltd, Marketing Assumptions for the Pre-feasibility Study for the Caspiche Project in Northern Chile, August 2011. |
Project No.: C-580 January, 2012 | Page 377 - 378 | |
SGA Limitada, 2007, Declaración de Impacto Ambiental, Proyecto Exploraciones Caspiche Central de Sociedad Contractual Minera Eton Chile, unpublished report prepared for Exeter Resource Corporation, 31 August 2007. |
SGA Limitada, 2008, Declaración de Impacto Ambiental, Proyecto Ampliación Caspiche Central de Sociedad Contractual Minera Eton Chile, unpublished report prepared for Exeter Resource Corporation, 12 July 2008. |
SGS Canada Inc., An investigation into Flotation Evaluation of Two Test Composites from the Caspiche Project, reference 12403-001, unpublished report prepared for Exeter, July 2010. |
SGS Canada, A Pilot Plant Test Program on Material from the Caspiche Project. Project 12403-003, February 2011. |
SGS Canada, Gold Extraction and Recovery of Copper and Cyanide From Leach Products From the Caspiche Pilot Plant Project. Project 12403-004, July 2011. |
SGS Chile, Bond Abrasion Tests on three Mineral Samples. Final Report Project OL-4557 (in Spanish), June 2011. |
SNC-Lavalin Australia, Caspiche Concentrate Treatment Conceptual Study. Document Nr 138510-0000-30RF-0002, January 2010. |
Technip USA, Inc., Cost Estimate Copper Bearing Concentrate Roasting Plant and Sulphuric Acid Plant, June 2011. |
Tolman, J.T. and Perkins, J., 2010, Caspiche Property, Region III, Chile NI 43-101 Technical Report, Prepared for Exeter Resource Corporation, 13 September 2010. |
Tolman, J., Van Kerkvoort, G., and Perkins, J., 2008, Caspiche Project, February 9, 2009, Technical Report, Region III, Chile, Prepared for Exeter Resource Corporation, 9 February 2009. |
Van Kerkvoort, G., Delendatti, G.L.A., and Perkins, J., 2008, Technical Report & Proposed Exploration for Caspiche Project, Region III, Chile, Prepared for Exeter Resource Corporation, 26 April 2008. |
Vila, T., and Sillitoe, R., 1991 Gold Rich Porphyry Systems in the Maricunga Belt, Northern Chile, Journal of Economic Geology, Vol. 86, pp. 1238-1260. |
Wakefield, T. W., and Marinho, R., 2009a, Caspiche Property, Region III, Chile, NI 43-101 Technical Report, Prepared for Exeter Resource Corporation, 27 March 2009. |
Wakefield, T. W., and Marinho, R., 2009b, Caspiche Property, Region III, Chile, NI 43-101 Technical Report, Prepared for Exeter Resource Corporation, 14 September 2009, Revised Date: 19 October 2009. |
Wakefield, T. W., and Marinho, R., 2010, Caspiche Property, Region III, Chile, NI 43-101 Technical Report, Prepared for Exeter Resource Corporation, 12 March 2010. |
Project No.: C-580 January, 2012 | Page 378 - 378 | |