Table of Contents
As filed with the Securities and Exchange Commission on November 19, 2004
Registration No. 333-
SECURITIES AND EXCHANGE COMMISSION
Washington, D.C. 20549
FORM S-1
REGISTRATION STATEMENT
Under
The Securities Act of 1933
DOLBY LABORATORIES, INC.
(Exact name of registrant as specified in its charter)
| Delaware | 6794, 3861, 3663, 7819 | 90-0199783 | ||
(State or other jurisdiction of incorporation or organization) | (Primary Standard Industrial Classification Code Number) | (I.R.S. Employer Identification Number) |
100 Potrero Avenue
San Francisco, CA 94103-4813
(415) 558-0200
(Address, including zip code, and telephone number, including area code, of registrant’s principal executive offices)
N. W. (Bill) Jasper, Jr.
President and Chief Executive Officer
Dolby Laboratories, Inc.
100 Potrero Avenue
San Francisco, CA 94103-4813
(415) 558-0200
(Name, address, including zip code, and telephone number, including area code, of agent for service)
Please send copies of all communications to:
Larry W. Sonsini, Esq. Thomas C. DeFilipps, Esq. Herbert P. Fockler, Esq. Mark B. Baudler, Esq. Wilson Sonsini Goodrich & Rosati Professional Corporation 650 Page Mill Road Palo Alto, CA 94304-1050 (650) 493-9300 | Mark S. Anderson, Esq. Phyllis T. Solomon, Esq. Dolby Laboratories, Inc. 100 Potrero Avenue San Francisco, CA 94103-4813 (415) 558-0200 | Paul C. Pringle, Esq. Eric S. Haueter, Esq. Sidley Austin Brown & Wood LLP 555 California Street San Francisco, CA 94104-1715 (415) 772-1200 |
Approximate date of commencement of proposed sale to the public: As soon as practicable after this Registration Statement becomes effective.
If any of the securities being registered on this Form are to be offered on a delayed or continuous basis pursuant to Rule 415 under the Securities Act, check the following box. ¨
If this Form is filed to register additional securities for an offering pursuant to Rule 462(b) under the Securities Act, please check the following box and list the Securities Act registration statement number of the earlier effective registration statement for the same offering. ¨
If this Form is a post-effective amendment filed pursuant to Rule 462(c) under the Securities Act, check the following box and list the Securities Act registration statement number of the earlier effective registration statement for the same offering. ¨
If this Form is a post-effective amendment filed pursuant to Rule 462(d) under the Securities Act, check the following box and list the Securities Act registration statement number of the earlier effective registration statement for the same offering. ¨
If delivery of the prospectus is expected to be made pursuant to Rule 434, check the following box. ¨
Calculation of Registration Fee
| Title of Each Class of Securities to be Registered | Proposed Maximum Aggregate Offering Price | Amount of Registration Fee | ||
Class A common stock, $0.001 par value | $460,000,000 | $58,282 |
The registrant hereby amends this Registration Statement on such date or dates as may be necessary to delay its effective date until the registrant shall file a further amendment which specifically states that this Registration Statement shall thereafter become effective in accordance with Section 8(a) of the Securities Act of 1933 or until the Registration Statement shall become effective on such date as the Commission, acting pursuant to said Section 8(a), may determine.
Table of Contents
The information in this prospectus is not complete and may be changed. We may not sell these securities until the registration statement filed with the Securities and Exchange Commission is effective. This prospectus is not an offer to sell these securities and we are not soliciting offers to buy these securities in any jurisdiction where the offer or sale is not permitted.
Prospectus (Subject to Completion)
Issued November 19, 2004
Shares

CLASS A COMMON STOCK
Dolby Laboratories, Inc. is offering shares of its Class A common stock, and the selling stockholders are offering shares of Class A common stock. We will not receive any proceeds from the sale of shares by the selling stockholders. This is our initial public offering, and no public market currently exists for our shares. We anticipate that the initial public offering price will be between $ and $ per share.
Following this offering, we will have two classes of authorized common stock, Class A common stock and Class B common stock. The rights of the holders of Class A common stock and Class B common stock are identical, except with respect to voting and conversion. Each share of Class A common stock is entitled to one vote per share. Each share of Class B common stock is entitled to ten votes per share and is convertible at any time at the option of the holder into one share of Class A common stock.
We have applied to list our Class A common stock on the New York Stock Exchange under the symbol “DLB.”
Investing in our Class A common stock involves risks. See “Risk Factors” beginning on page 8.
PRICE$ A SHARE
| Price to Public | Underwriting Discounts and Commissions | Proceeds to Dolby Laboratories | Proceeds to Selling Stockholders | |||||
Per Share | $ | $ | $ | $ | ||||
Total | $ | $ | $ | $ |
We have granted the underwriters the right to purchase up to an additional shares to cover over-allotments.
The Securities and Exchange Commission and state securities regulators have not approved or disapproved these securities, or determined if this prospectus is truthful or complete. Any representation to the contrary is a criminal offense.
Morgan Stanley & Co. Incorporated expects to deliver the shares to purchasers on , 2005.
| MORGAN STANLEY | GOLDMAN, SACHS & CO. |
| JPMORGAN |
| ADAMS HARKNESS | WILLIAM BLAIR & COMPANY |
, 2005
Table of Contents
| Page | ||
| 60 | ||
| 87 | ||
| 100 | ||
| 102 | ||
| 104 | ||
| 108 | ||
| 110 | ||
| 113 | ||
| 113 | ||
| 113 | ||
| F-1 |
You should rely only on the information contained in this prospectus. We have not authorized anyone to provide you with information different from that contained in this prospectus. We are offering to sell, and seeking offers to buy, shares of our Class A common stock only in jurisdictions where offers and sales are permitted. The information in this prospectus is accurate only as of the date of this prospectus, regardless of the time of delivery of this prospectus or any sale of shares of our Class A common stock. Except where the context requires otherwise, in this prospectus the “Company,” “Dolby,” “Dolby Laboratories,” “we,” “us” and “our” refer to Dolby Laboratories, Inc., a Delaware corporation, and, where appropriate, its subsidiaries.
This offering is only being made to persons in the United Kingdom whose ordinary activities involve them in acquiring, holding, managing or disposing of investments (as principal or agent) for the purposes of their businesses or otherwise in circumstances which have not resulted and will not result in an offer to the public in the United Kingdom within the meaning of the Public Offers of Securities Regulations 1995 or the UK Financial Services and Markets Act 2000 (“FSMA”), and each underwriter has only communicated or caused to be communicated and will only communicate or cause to be communicated any invitation or inducement to engage in investment activity (within the meaning of section 21 of FSMA) received by it in connection with the issue or sale of the shares of Class A common stock in circumstances in which section 21(1) of FSMA does not apply to us. Each of the underwriters agrees and acknowledges that it has complied and will comply with all applicable provisions of FSMA with respect to anything done by it in relation to the shares of Class A common stock in, from or otherwise involving the United Kingdom.
The shares of Class A common stock may not be offered, transferred, sold or delivered to any individual or legal entity other than to persons who trade or invest in securities in the conduct of their profession or trade (which includes banks, securities intermediaries (including dealers and brokers), insurance companies, pension funds, other institutional investors and commercial enterprises which as an ancillary activity regularly invest in securities) in the Netherlands.
Until , 2005 (25 days after the commencement of this offering), all dealers that buy, sell or trade shares of our Class A common stock, whether or not participating in this offering, may be required to deliver a prospectus. This delivery requirement is in addition to the obligation of dealers to deliver a prospectus when acting as underwriters and with respect to their unsold allotments or subscriptions.
i
Table of Contents
This summary highlights information contained elsewhere in this prospectus and does not contain all of the information you should consider in making your investment decision. You should read this summary together with the more detailed information, including our financial statements and the related notes, elsewhere in this prospectus. You should carefully consider, among other things, the matters discussed in “Risk Factors.”
DOLBY LABORATORIES, INC.
Dolby Laboratories develops and delivers innovative products and technologies that make the entertainment experience more realistic and immersive in theatres, homes, cars and elsewhere. Since Ray Dolby founded Dolby Laboratories nearly 40 years ago, we have been at the forefront of developing sound technologies that enhance the entertainment experience for audiences and consumers. Our objective is to be an essential element in the best entertainment technology by delivering to both professionals and consumers innovative and enduring technologies that enrich the entertainment experience. Our technologies are used in sound recording, distribution and playback to faithfully recreate the original audio experience and enable digital audio and surround sound in applications such as movie soundtracks, DVDs, television, satellite and cable broadcasts, video games and personal computers. Our technologies have been adopted as standards throughout the entertainment industry. For example, virtually all major movie soundtracks throughout the world are encoded using our technologies, and virtually all DVD players incorporate our technologies.
Our products, services and technologies are used throughout the entertainment chain—from content creation, to distribution for large-scale playback, such as movie theatres, to repackaging and distribution for consumer media, such as DVDs, to consumer playback, such as DVD players and home theatre systems. We have built strong, long-lasting relationships with industry professionals at every link in the entertainment chain, including filmmakers, motion picture studios, broadcasters, film distributors, cinema operators, DVD producers, manufacturers of a broad array of consumer electronics products and software developers. Industry professionals and consumers rely on Dolby to ensure consistent quality as content moves through the chain. Moreover, we believe that the use of our technologies by professionals in the creation and distribution of content increases demand for the adoption of our technologies for use in consumer applications. We believe that we are a trusted vendor for professionals and consumers alike, and that the Dolby brand is recognized globally for quality, excellence and innovation.
The following graphic illustrates our participation in this entertainment chain with respect to content for movies:
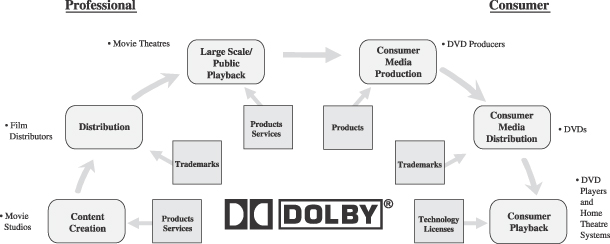
1
Table of Contents
We develop technologies for both professional and consumer applications.
On the professional side, we derive revenue from sales of products and production services to filmmakers, broadcasters, music producers, video game designers and cinema operators. Our products and production services are used by artists and content creators to help them record and reproduce the sound they envision. For large-scale playback in theatres, cinema operators use our products to play back to audiences rich, realistic soundtracks the way the filmmakers intended. Television, satellite and cable broadcasters use our encoders and decoders to transmit audio encoded with our technologies throughout the broadcast infrastructure and into consumers’ homes. Our professional products are distributed in over 50 countries and we have sold over 73,000 cinema processors worldwide. Our products and technologies have been used in the production of over 16,000 movies, tens of thousands of DVD titles and hundreds of video game titles worldwide. Virtually all movies made by major studios include soundtracks encoded with Dolby SR or Dolby Digital technologies. In addition, over 40 television shows are currently produced using our sound encoding technologies. We manufacture our professional products in our Brisbane, California and Wootton Bassett, England manufacturing facilities, where our own manufacturing techniques and rigorous test procedures help ensure our products meet customer requirements. Sales of professional products and production services accounted for $77.6 million, or 27% of our total revenue, in fiscal 2004.
On the consumer side, we derive revenue from royalties collected from licensees who manufacture consumer electronics products that include our technologies. When entertainment content is produced for playback on consumer media, DVD producers use our professional encoders to capture the source audio, so that the original soundtrack can be delivered to the consumer as faithfully as possible. To enable consumers to experience the realistic entertainment intended by the content creators, we license our sound technologies to manufacturers of a wide range of consumer electronics products, including DVD players, home theatre systems, television sets, set-top boxes, video game consoles, portable audio and video players, personal computers and in-car entertainment systems, comprising substantially all of the consumer playback devices for surround sound. We work with over 40 semiconductor manufacturers, helping them incorporate our technologies into their integrated circuits, or ICs. These manufacturers then sell their ICs to our approved licensees for incorporation into consumer electronics products. We also license our technologies to software developers who implement our technologies for use in personal computer software DVD players. Our licensing arrangements typically entitle us to receive a royalty for every product incorporating our technologies sold by approximately 500 consumer electronics product manufacturers and software developer licensees located in nearly 30 countries. Over 1.6 billion consumer electronics product units sold worldwide have incorporated our licensed technologies, including over 500 million consumer electronics product units since the beginning of fiscal 2002. Our Dolby Digital technologies alone have been incorporated in over 240 million DVD players and over 50 million audio/video receivers and set-top boxes. Our licensing engineers and support staff work closely with our licensees throughout the world to ensure that their products meet our technical and quality standards. Licensing revenue accounted for $211.4 million, or 73% of our total revenue, in fiscal 2004.
While we initially focused on sound technologies, in recent years we have expanded our business to include other technologies that facilitate the delivery of digital entertainment, such as technologies that process digital moving images or protect content from piracy. We are also developing and providing products and services to facilitate the change in the cinema industry from 35 mm film projection to digital cinema, an all digital medium for the distribution and exhibition of movies. In addition, we are continually exploring areas where we may be able to develop and deliver technology solutions that enhance the entertainment experience in other ways.
Key Dolby Strengths
We believe that the following key strengths uniquely position Dolby to develop and deliver innovative technologies to both professionals and consumers to enrich the entertainment experience:
| · | Our culture of innovation. We address technology challenges and create and deliver practical technology solutions for the entertainment industry that make a perceptible difference to audiences and consumers, and have done so repeatedly throughout our nearly 40 year history. |
2
Table of Contents
| · | Our longstanding relationships with industry participants throughout the entertainment chain. Our longstanding relationships enable us to collaborate closely with entertainment industry participants, ensuring our products and technologies are designed and used to deliver consistent, high quality sound to audiences and consumers throughout the entertainment chain. |
| · | Adoption of our technologies as industry standards. Our technologies are worldwide explicit or de facto industry standards for many types of professional and consumer applications. Industry standards are “explicit” when technologies are mandated by an industry standards-setting body, and “de facto” when technologies are widely adopted even though not specifically mandated by a standards-setting body. |
| · | Our global market leadership. We believe we are the global market leader for the delivery of surround sound technologies for both professional products and consumer applications. |
| · | Our neutrality. We believe that by not aligning ourselves exclusively with any particular industry participant we have become a trusted participant in the entertainment industry, promoting the adoption of our technologies and enabling us to maintain strong relationships with a variety of companies that often compete against one another. |
| · | The strength of our brand. We believe the Dolby brand is recognized globally and is synonymous with quality, excellence and innovation. |
| · | Our high quality management team and employee base. We have assembled a strong, experienced management team and a highly skilled engineering team with technical knowledge in a broad range of scientific disciplines that are focused on developing innovative and enduring technologies for the entertainment industry. |
Our Strategy
Our objective is to be an essential element in the best entertainment technology. Key elements of our strategy include:
| · | Expanding markets for surround sound. We intend to continue to promote the expansion of markets for surround sound. |
| · | Continuing to address the needs of industry professionals. We intend to continue to collaborate with industry professionals at each link in the entertainment chain to develop new technologies that facilitate and improve content recording, distribution and playback, and, where possible, we intend to adapt these technologies for use in consumer applications. |
| · | Developing system solutions for digital cinema. We are committed to developing and delivering sound and image technologies for digital cinema. |
| · | Developing technologies for the entertainment industry beyond sound. We intend to develop and deliver technology solutions that enrich the entertainment experience in areas beyond sound, including technologies that process digital moving images and protect content from piracy. |
| · | Continuing to promote adoption of our technologies as industry standards. We intend to continue to develop, maintain and strengthen our relationships with entertainment industry participants, professional organizations and standards-setting bodies throughout the world to help facilitate the adoption of our technologies as industry standards. |
| · | Building on the strength of the Dolby brand. We intend to continue to enhance and build on the strength of the Dolby brand and our reputation as a trusted provider of entertainment technologies for use in both professional and consumer products. |
3
Table of Contents
Industry
The global entertainment industry is in the midst of a transition from analog to digital technologies. Advancements in digital technologies have led to enhanced consumer entertainment experiences through higher fidelity sound; more dynamic sound effects; discrete surround sound; higher resolution video images; smaller file sizes and reduced storage costs; greater portability; simpler, faster and higher capacity means to distribute content; and greater interoperability across a variety of playback devices. New digital media formats and products, such as DVD players, DVD recorders, HDTV, digital cable and personal computer-based video, music and game systems, have been introduced over the past several years. These technological advances have affected a broad range of entertainment formats, including movies, broadcasts, music, video games, personal computers and personal audio and video players, as well as a wide variety of playback environments, including theatres, homes and automobiles.
Consumers are helping to drive the transition to digital entertainment through their rapid adoption of new digital consumer electronics products that allow them to play back audio and video in their homes, cars and elsewhere. Growth in sales of digital-based consumer electronics products has increased significantly in recent years. According to the October 2004 report “Worldwide and U.S. DVD Player Forecast and Analysis, 2004-2008” and the December 2001 report “U.S. DVD Player Market Forecast, 2000-2005” of independent market research firm International Data Corporation, or IDC, worldwide DVD player shipments increased from approximately 13.5 million in 2000 to approximately 89.9 million in 2003, resulting in a compound annual growth rate of approximately 88%. In its October 2004 report, IDC expects worldwide DVD player shipments to grow at a compound annual growth rate of 16.4% from 2003 through 2008, with such growth coming primarily from DVD recorders, home-theatre-in-a-box systems and portable DVD players. The large installed base of digital-based home theatre systems with surround sound capabilities enables television broadcasters to offer programming with digital audio that is comparable to or exceeds the quality available on DVDs. Governments worldwide are playing an important role in driving digital broadcasting by mandating that broadcasters transition to digital signals. Currently, all local terrestrial, or over-the-air, television stations in the United States are supposed to broadcast with a digital signal. According to IDC’s May 2004 report, “Worldwide and U.S. Digital TV 2004-2008 Forecast,” there are approximately 275 million television sets in the United States, 9.2 million of which are digital. Personal computers have also been an important factor driving the adoption of digital technology for multi-media applications. This growth in sales of digital-based consumer electronics products has coincided with increased consumer spending on electronic entertainment generally. According to the Consumer Electronics Association, or CEA, the average annual spending on consumer electronics per household in the United States has increased from approximately $600 in 1990 to approximately $1,100 in 2003. CEA defines consumer electronics to include consumer video products, home audio products and computers, peripherals and software, as well as video game hardware and software, portable audio products, mobile electronics, telephone and home office products, and blank media and accessories.
Corporate Information
We were founded in London, England in 1965 and incorporated as a New York corporation in 1967. We reincorporated in California in 1976 and reincorporated in Delaware in September 2004. Our principal executive offices are located at 100 Potrero Avenue, San Francisco, California 94103, and our telephone number is (415) 558-0200. Our web site address is www.dolby.com. The information on our web site is not part of this prospectus.
Dolby, Dolby Digital, Dolby Headphone, Dolby SR, Dolby Surround, EQ Assist, MLP, Surround EX and the double-D symbol are registered trademarks of Dolby Laboratories in the United States and other countries. This prospectus also includes other registered and unregistered trademarks of Dolby Laboratories and trademarks of other persons.
4
Table of Contents
THE OFFERING
Shares of Class A common stock offered: | ||||
By us | shares | |||
By the selling stockholders | shares | |||
Total | shares | |||
Shares of common stock to be outstanding after this offering: | ||||
Class A | shares | |||
Class B | shares | |||
Total | shares | |||
Use of proceeds | General corporate purposes, including working capital, and possible acquisitions of complementary businesses, technologies or other assets. We will not receive any of the proceeds from the sale of shares by the selling stockholders. See “Use of Proceeds.” | |||
Proposed NYSE symbol | DLB | |||
The number of shares of Class A and Class B common stock that will be outstanding after this offering is based on the number of shares outstanding at September 24, 2004, and excludes:
| · | 12,599,820 shares of Class B common stock issuable upon the exercise of options outstanding at September 24, 2004, at a weighted average exercise price of $1.61 per share; |
| · | 780,750 shares of Class B common stock issuable upon the exercise of options granted after September 24, 2004, at an exercise price of $6.28 per share; and |
| · | 6,000,000 shares of Class A common stock available for future issuance under our 2005 Stock Plan. |
Unless otherwise indicated, all information in this prospectus assumes:
| · | A five-for-one split of our common stock that will occur prior to the completion of this offering; |
| · | That all currently outstanding shares of our common stock are converted into shares of Class B common stock prior to the completion of this offering; and |
| · | That the underwriters do not exercise the over-allotment option to purchase additional shares of Class A common stock in this offering. |
5
Table of Contents
SUMMARY CONSOLIDATED FINANCIAL DATA
The following tables summarize consolidated financial data regarding our business and should be read together with “Management’s Discussion and Analysis of Financial Condition and Results of Operations” and our audited consolidated financial statements and the related notes included elsewhere in this prospectus. Our fiscal year is a 52- or 53-week period ending on the last Friday in September. The fiscal years presented include the 52-week periods ended September 27, 2002, September 26, 2003 and September 24, 2004, respectively. Ray Dolby, our founder, will contribute to us prior to the completion of this offering all of the rights he holds in intellectual property related to our business, which he currently licenses to us in exchange for royalty payments. Upon the completion of this asset contribution, all of our licensing arrangements with, and related royalty obligations to, Ray Dolby will terminate. The following summary pro forma unaudited consolidated statements of operations data give effect to the asset contribution to be made by Ray Dolby, as well as the effects of a previous change in certain licensing arrangements with Ray Dolby in June 2002, as though such transactions had been completed prior to the beginning of fiscal 2002. There will be no material change to our balance sheet as a result of the asset contribution. See “Management’s Discussion and Analysis of Financial Condition and Results of Operations—Pro Forma Presentation.”
| Actual | Pro Forma | |||||||||||||||||||||||
| Fiscal Year Ended | Fiscal Year Ended | |||||||||||||||||||||||
| Sep 27, 2002 | Sep 26, 2003 | Sep 24, 2004 | Sep 27, 2002 | Sep 26, 2003 | Sep 24, 2004 | |||||||||||||||||||
| (in thousands, except per share data) | ||||||||||||||||||||||||
Consolidated Statements of Operations Data: | ||||||||||||||||||||||||
Revenue: | ||||||||||||||||||||||||
Licensing | $ | 106,640 | $ | 157,922 | $ | 211,395 | $ | 113,361 | $ | 157,922 | $ | 211,395 | ||||||||||||
Product sales | 41,377 | 44,403 | 57,981 | 41,377 | 44,403 | 57,981 | ||||||||||||||||||
Production services | 13,851 | 15,147 | 19,665 | 13,851 | 15,147 | 19,665 | ||||||||||||||||||
Total revenue | 161,868 | 217,472 | 289,041 | 168,589 | 217,472 | 289,041 | ||||||||||||||||||
Cost of revenue: | ||||||||||||||||||||||||
Cost of licensing | 25,063 | 40,001 | 53,838 | 8,685 | 14,875 | 20,070 | ||||||||||||||||||
Cost of product sales (includes $0.2 million in stock-based compensation for fiscal 2004, actual and pro forma)(1) | 26,694 | 26,684 | 30,096 | 24,281 | 24,190 | 27,007 | ||||||||||||||||||
Cost of production services (includes $0.1 million in stock-based compensation for fiscal 2004, actual and pro forma)(1) | 5,960 | 6,958 | 7,643 | 5,960 | 6,958 | 7,643 | ||||||||||||||||||
Total cost of revenue | 57,717 | 73,643 | 91,577 | 38,926 | 46,023 | 54,720 | ||||||||||||||||||
Gross margin | 104,151 | 143,829 | 197,464 | 129,663 | 171,449 | 234,321 | ||||||||||||||||||
Operating expenses: | ||||||||||||||||||||||||
Selling, general and administrative (includes $12.7 million in stock-based compensation for fiscal 2004, actual and pro forma)(1) | 64,269 | 76,590 | 113,477 | 70,297 | 76,590 | 113,477 | ||||||||||||||||||
Research and development (includes $1.2 million in stock-based compensation for fiscal 2004, actual and pro forma)(1) | 15,128 | 18,262 | 23,884 | 15,128 | 18,262 | 23,884 | ||||||||||||||||||
Settlements | 24,205 | — | (2,000 | ) | 24,205 | — | (2,000 | ) | ||||||||||||||||
In-process research and development | — | 1,310 | 1,738 | — | 1,310 | 1,738 | ||||||||||||||||||
Total operating expenses | 103,602 | 96,162 | 137,099 | 109,630 | 96,162 | 137,099 | ||||||||||||||||||
Operating income | 549 | 47,667 | 60,365 | 20,033 | 75,287 | 97,222 | ||||||||||||||||||
Other income (expenses), net | (747 | ) | (57 | ) | 229 | (747 | ) | (57 | ) | 229 | ||||||||||||||
Income (loss) before provision for income taxes and controlling interest | (198 | ) | 47,610 | 60,594 | 19,286 | 75,230 | 97,451 | |||||||||||||||||
Provision for income taxes | 11 | 16,079 | 25,039 | 7,884 | 26,714 | 39,267 | ||||||||||||||||||
Income (loss) before controlling interest | (209 | ) | 31,531 | 35,555 | 11,402 | 48,516 | 58,184 | |||||||||||||||||
Controlling interest in net (income) loss | 104 | (562 | ) | (929 | ) | 104 | (562 | ) | (929 | ) | ||||||||||||||
Net income (loss) | $ | (105 | ) | $ | 30,969 | $ | 34,626 | $ | 11,506 | $ | 47,954 | $ | 57,255 | |||||||||||
Basic net income (loss) per common share | $ | 0.00 | $ | 0.36 | $ | 0.40 | $ | 0.14 | $ | 0.56 | $ | 0.67 | ||||||||||||
Diluted net income (loss) per common share | $ | 0.00 | $ | 0.36 | $ | 0.36 | $ | 0.14 | $ | 0.56 | $ | 0.59 | ||||||||||||
Shares used in the calculation of basic net income (loss) per share | 85,008 | 85,009 | 85,556 | 85,008 | 85,009 | 85,556 | ||||||||||||||||||
Shares used in the calculation of diluted net income (loss) per share | 85,008 | 85,983 | 96,525 | 85,010 | 85,983 | 96,525 | ||||||||||||||||||
6
Table of Contents
| (1) | Stock-based compensation recorded in fiscal 2004 was classified as follows: |
| Actual and Pro Forma | |||
| Fiscal Year Ended September 24, 2004 | |||
Cost of product sales | $ | 157 | |
Cost of production services | 55 | ||
Selling, general and administrative | 12,711 | ||
Research and development | 1,215 | ||
Total stock-based compensation | $ | 14,138 | |
The consolidated balance sheet data table below presents a summary of our balance sheet as of September 24, 2004, on an actual basis and on an as adjusted basis to give effect to the receipt of net proceeds from the sale of shares of Class A common stock by us in this offering at an assumed initial public offering price of $ per share, after deducting estimated underwriting discounts and commissions and estimated offering expenses payable by us, as set forth under “Use of Proceeds” and “Capitalization.”
| As of September 24, 2004 | ||||||
| Actual | As Adjusted | |||||
| (in thousands) | ||||||
Summary Consolidated Balance Sheet Data: | ||||||
Cash and cash equivalents | $ | 78,711 | $ | |||
Working capital | 82,450 | |||||
Total assets | 261,897 | |||||
Total debt | 14,870 | |||||
Total stockholders’ equity | 145,374 | |||||
7
Table of Contents
You should carefully consider the risks described below before making an investment decision. Our business, prospects, financial condition or operating results could be materially adversely affected by any of these risks, as well as other risks not currently known to us or that we currently deem immaterial. The trading price of our Class A common stock could decline due to any of these risks and you may lose all or part of your investment. In assessing the risks described below, you should also refer to the other information contained in this prospectus, including our consolidated financial statements and the related notes, before deciding to purchase any shares of our Class A common stock.
Our business and prospects depend on the strength of our brand, and if we do not maintain and strengthen our brand, our business will be materially harmed.
Maintaining and strengthening the “Dolby” brand is critical to maintaining and expanding both our products and services business and our technology licensing business because our continued success is due, in part, to our reputation for providing high quality products, services and technologies across a wide range of entertainment industries, which we define to include the consumer electronics product industry. If we fail to promote and maintain the Dolby brand successfully on either the professional products and production services or the licensing sides of our business, our overall business and prospects will suffer. Moreover, we believe that the likelihood that our technologies will be adopted as an industry standard in various markets and for various applications depends, in part, upon the strength of our brand, because professional organizations and industry participants are more likely to accept as an industry standard technologies developed by a well-respected and well-known brand. In addition, if we fail to maintain high quality standards for our professional products, and if we fail to maintain high quality standards for the products that incorporate our technologies through the quality-control certification process that we require of our licensees, our brand could be adversely affected. Furthermore, we believe that our ability to enter new markets as we expand our business beyond sound technologies is dependent, in part, upon the strength of our brand and our reputation as a trusted provider of entertainment technologies for use in both professional and consumer products. Maintaining and strengthening our brand will depend heavily on our ability to continue to develop innovative technologies for the entertainment industry and to continue to provide high quality products and services, which we may not do successfully.
We are dependent on the sale by our licensees of consumer electronics products that incorporate our technologies, and a reduction in those sales would adversely affect our licensing revenue.
We derive most of our revenue from the license of our technologies to consumer electronics product manufacturers. We derived 66%, 73% and 73% of our total revenue from our technology licensing business in fiscal 2002, 2003 and 2004, respectively. We do not manufacture consumer electronics products ourselves. Our licensing revenue from these manufacturers results primarily from royalties paid to us on shipments of their consumer electronic products, such as DVD players, DVD recorders, home theatre systems, video game consoles, personal audio and video players and in-car entertainment systems that incorporate our licensed technologies. We cannot control these manufacturers’ product development or commercialization efforts or predict their success. In addition, our license agreements, which typically require manufacturers of consumer electronics product and software developers to pay us a specified royalty for every consumer electronics product shipped that incorporates our technologies, do not require these manufacturers to include our technologies in any specific number or percentage of units, and only a few of these agreements guarantee us a minimum aggregate licensing fee. Moreover, we have a widespread presence in certain markets for consumer electronics products, such as the markets for DVD players, audio/video receivers and other home theatre consumer electronics products, and, as a result, there is little room for us to further penetrate such markets. Accordingly, if our licensees sell fewer products incorporating our technologies, or otherwise face significant economic difficulties, our revenue will decline. Lower sales of products incorporating our technologies could occur for a number of reasons. Changes in consumer tastes or trends, or changes in industry standards, may adversely affect our licensing revenue. Demand for new consumer electronics products could also be adversely affected by increasing market saturation, durability of products in the marketplace, new competing products and alternate consumer entertainment options. In addition, our licensees, for whatever reason, may not choose to or may not be able to incorporate our future technologies into their products.
8
Table of Contents
We do not expect sales of DVD players to continue to grow as quickly as they have in the past. To the extent that sales of DVD players and home theatre systems level off or decline, or alternative technologies in which we do not participate replace DVDs as a dominant medium for consumer video entertainment, our licensing revenue will be adversely affected.
Growth in our revenue over the past several years has been the result, in large part, of the rapid growth in sales of DVD players and home theatre systems incorporating our technologies. However, as the markets for DVD players mature, we do not expect sales of DVD players to continue to grow as quickly as they have in the past. To the extent that sales of DVD players and home theatre systems level off or decline, our licensing revenue will be adversely affected. In addition, if new technologies are developed for use with DVDs or new technologies are developed that substantially compete with or replace DVDs as a dominant medium for consumer video entertainment, and if we are unable to develop and successfully market technologies that are incorporated into or compatible with such new technologies, our revenue will be adversely affected.
If we fail to develop and deliver innovative technologies in response to changes in the entertainment industry, our business could decline.
The markets for our professional products and the markets for consumer electronics products utilizing our licensed technologies are characterized by rapid change and technological evolution. We will need to expend considerable resources on research and development in the future in order to continue to design and deliver enduring, innovative entertainment products and technologies. Despite our efforts, we may not be able to develop and effectively market new products, technologies and services that adequately or competitively address the needs of the changing marketplace. In addition, we may not correctly identify new or changing market trends at an early enough stage to capitalize on market opportunities. At times such changes can be dramatic, such as the shift from VHS tapes to DVDs for consumer playback of movies in homes and elsewhere. Our future success depends to a great extent on our ability to develop and deliver innovative technologies that are widely adopted in response to changes in the entertainment industry and that are compatible with the technologies or products introduced by other entertainment industry participants.
If our products and technologies fail to be adopted as industry standards, our business prospects could be limited and our operating results could be adversely affected.
The entertainment industry depends upon industry standards to ensure the compatibility of its content across a wide variety of entertainment systems and products. Accordingly, we expend significant efforts to ensure that our products and technologies either meet, or, more importantly, are adopted as, industry standards across the broad range of entertainment industry markets in which we participate, as well as the markets in which we hope to compete in the future, including digital cinema. It is important to our business and prospects that we continue to develop products and technologies that have the necessary capabilities and are of sufficient quality and acceptable cost such that the entertainment industry adopts them as industry standards. It is also important that those of our technologies that have already been adopted as industry standards continue to have that status. To have our products and technologies adopted as industry standards, we must convince a broad spectrum of professional organizations throughout the world to adopt them as such and to ensure that other industry standards are consistent with our products and technologies. In this regard, maintaining our long-standing relationships with our major customers and licensees is critical to our ability to have our technologies adopted as industry standards. If our technologies are not adopted or do not remain as industry standards, our business, operating results and prospects could be materially and adversely affected. We expect that meeting, maintaining and establishing industry standard technologies will continue to be critical to our business in the future. For example, we expect that the development of the market for digital cinema will be based upon industry standards. In addition, the market for broadcast technologies has traditionally been heavily based upon industry standards and we expect this to continue to be the case in the future. In the broadcast industry, governments or other regulatory bodies often set industry standards. If our technologies are not chosen as industry standards for broadcasting in a geographic area, this could adversely affect our ability to compete in these markets.
9
Table of Contents
Increasingly, standards-setting organizations are adopting or establishing technology standards for use in a wide-range of consumer electronics products. As a result, it is more difficult for individual companies to have their technologies adopted wholesale as an informal industry standard. We call this type of standard a “de facto” industry standard, meaning that the standard is not explicitly mandated by any industry standards-setting body but is nonetheless widely adopted. In addition, increasingly there are a large number of companies, including ones that typically compete against one another, involved in the development of new technologies for use in consumer entertainment products. As a result, these companies often license their collective intellectual property rights as a group, making it more difficult for any single company to have its technologies adopted widely as a de facto industry standard or to have its technologies adopted as an exclusive, explicit industry standard for consumer electronic products.
Even when our technologies are mandated for a particular market by a standards-setting body, which we call an “explicit” industry standard, our technologies may not be the sole technologies adopted for that market as an industry standard. Accordingly, our operating results depend upon participants in that market choosing to adopt our technologies instead of competitive technologies that also may be acceptable under such standard. The continued growth of our revenue from the broadcast market will depend upon both the continued adoption of digital television generally and the choice to use our technologies where it is an optional industry standard.
The licensing of patents constitutes a significant source of our revenue. If we are unable to replace expiring patents with new patents or proprietary technologies, our revenue could decline.
We hold patents covering much of the technology that we license to consumer electronics product manufacturers. Our licensing revenue is tied in large part to the life of those patents. Our right to receive royalties related to our patents terminates with the expiration of the last patent covering the relevant technologies. However, many of our licensees choose to continue to pay royalties for use of our trademarks and know-how after our patents have expired, but at a reduced royalty rate. Accordingly, to the extent that we do not continue to replace licensing revenue from technologies covered by expiring patents with licensing revenue based on new patents and proprietary technologies, our revenue could decline.
The 775 patents we currently hold are scheduled to expire at various times through April 2023. Of these, ten patents are scheduled to expire in calendar year 2005, 66 patents are scheduled to expire in calendar year 2006, and 44 patents are scheduled to expire in calendar year 2007. Patents relating to our Dolby Digital technologies expire between 2008 and 2017, and patents relating to our Dolby Digital Plus technologies, an extension of Dolby Digital, expire between 2019 and 2020.
In addition, we have relatively few or no issued patents in certain countries, including China and India. For example, in China we have only limited patent protection, especially with respect to our Dolby Digital technologies. In India, we have no issued patents. As such, growing our licensing revenue in developing countries such as China and India will depend on our ability to obtain patent rights in these counties for existing and new technologies, which is uncertain. Moreover, because of the limitations of the legal systems in many of these countries, the effectiveness of patents obtained or that may in the future be obtained, if any, is likewise uncertain.
We are, and may in the future be, subject to intellectual property rights claims, which are costly to defend, could require us to pay damages and could limit our ability to use certain technologies in the future.
Companies in the technology and entertainment industries own large numbers of patents, copyrights, trademarks and trade secrets and frequently enter into litigation based on allegations of infringement or other violations of intellectual property rights. We have faced such claims in the past, we currently face such claims and we expect to face similar claims in the future. For example, Lucent has asserted that we infringe certain patents held by them, prompting us to file a complaint for declaratory judgment of non-infringement and invalidity of such Lucent patents. These patents generally involve a process and means for encoding and decoding audio signals. Lucent contends that products incorporating our AC-3 technology infringe those patents. A determination against us in the Lucent litigation could materially impact our technology licensing business, which may seriously harm our financial condition and results of operations. As we face increasing competition and as we attempt to enter new markets, the possibility of new intellectual property rights claims against us grows. Our technologies may be vulnerable to third-party rights or claims against their use. Any intellectual
10
Table of Contents
property claims, with or without merit, could be time-consuming, expensive to litigate or settle and could divert management resources and attention. For example, in the past we have settled claims relating to infringement allegations and agreed to make payments in connection with such settlements. An adverse determination could require that we pay damages or stop using technologies found to be in violation of a third party’s rights and could prevent us from offering our products and services to others. In order to avoid these restrictions, we may have to seek a license for the technology. This license may not be available on reasonable terms, could require us to pay significant royalties and may significantly increase our operating expenses. The technologies also may not be available for license to us at all. As a result, we may be required to develop alternative non-infringing technologies, which could require significant effort and expense. If we cannot license or develop technology for the infringing aspects of our business, we may be forced to limit our product and service offerings and may be unable to compete effectively. In addition, at times in the past, we have chosen to defend our licensees from third-party intellectual property infringement claims even where such defense was not contractually required, and we may choose to take on such defense in the future. Any of these results could harm our brand, our operating results and our financial condition.
Primarily in connection with the licensing of our Dolby Digital technologies, in certain cases we license to our customers intellectual property such as patents that we have licensed from third parties in addition to our own intellectual property. Under our agreements with these third parties, in many cases we are required to pay them a royalty based on a percentage of the portion of the licensing revenue we receive from our customers related to their intellectual property. We believe we properly allocate these parties’ respective shares of the licensing revenue we receive from our customers. However, these third parties could challenge the basis on which we share our licensing revenue with them. Any successful challenge could increase the amount of royalties we have to pay to these third parties, decrease our gross margins and adversely affect our operating results. Such challenges could also impair our ability to continue to re-license the intellectual property of such third parties, which could adversely affect our business and prospects.
Our relationships with entertainment industry participants are particularly important to our professional products and production services and our technology licensing businesses, and if we fail to maintain such relationships our business could be materially harmed.
If we fail to maintain and expand our relationships with a broad range of participants throughout the entertainment chain, including motion picture studios, broadcasters, video game designers, music producers and manufacturers of consumer electronics products, our business and prospects could be materially harmed. Relationships have historically played an important role in the entertainment industries that we serve, both on the professional and consumer sides of our business. For example, our products and services business is particularly dependent upon our relationships with the major motion picture studios and broadcasters, and our technology licensing business is particularly dependent upon our relationships with consumer electronics product manufacturers, software developers and integrated circuit, or IC, manufacturers. If we fail to maintain and strengthen these relationships, these entertainment industry participants may be more likely not to purchase and use our products, services and technologies, which could materially harm our business and prospects. In addition to directly providing substantially all of our revenue, these relationships are critical to our ability to have our technologies adopted as industry standards. Moreover, if we fail to maintain our relationships, or if we are not able to develop relationships in new markets in which we intend to compete in the future, including markets for new technologies and expanding geographic markets such as China and India, our business, operating results and prospects could be materially and adversely affected. In addition, if major industry participants form strategic relationships that exclude us, whether on the professional products and production services side or the licensing side of our business, our business and prospects could be materially adversely affected.
We rely on the timeliness and accuracy of our licensees’ royalty reports for reporting and collecting our licensing revenue, and if these reports are untimely or inaccurate, our revenue could be delayed, inaccurately reported or materially adversely affected.
Our licensing revenue is generated primarily from consumer electronics product manufacturers and software developers who license and incorporate our technologies in their products. Under our existing arrangements,
11
Table of Contents
these licensees typically pay us a specified royalty for every consumer electronics product they ship that incorporates our technologies. We rely on our licensees to accurately report the number of units shipped as we calculate our license fees, prepare our financial reports, projections and budgets, and direct our sales and product development efforts based on these reports. However, it is often difficult for us to independently determine whether or not our licensees are reporting shipments accurately. This is especially true with respect to software incorporating our technologies because software can be copied relatively easily and we oftentimes do not have easy ways to determine how many copies have been made. Most of our license agreements permit us to audit our licensees’ records, but audits are generally expensive and time consuming and could harm our customer relationships. In particular, we have experienced in the past, and expect to continue to experience, problems with Chinese consumer electronics product manufacturers failing to report or underreporting shipments of their products that incorporate our technologies. To the extent that our licensees understate or fail to report the number of products incorporating our technologies that they ship, we will not collect and recognize revenue to which we are entitled, which would adversely affect our operating results. In addition, because we recognize license revenue only after we receive royalty reports from our licensees regarding the shipment of their products that incorporate our technologies, the timing of our revenue is dependent upon the timing of our receipt of those reports. Our quarterly operating results may fluctuate as a result of inaccurate royalty reports we receive from licensees that are ultimately corrected, or as a result of late or sporadic royalty reports we receive from licensees. Our licensees are required to report to us within 30 to 60 days following the end of the quarter in which they ship the product incorporating our technologies. Accordingly, even in the best of circumstances, there is a time lag between when our licensees ship their products and when they report those shipments, and pay the related royalties, for those products. Sometimes this time lag can be significant. In the past we have experienced lags greater than one year in certain cases. In addition, it is not uncommon for royalty reports to include corrective or retroactive royalties that cover extended periods of time. Also, there have been times in the past when we have recognized an unusually large amount of licensing revenue from a licensee in a given quarter because not all of our revenue recognition criteria were met in prior periods. This can result in a large amount of licensing revenue from a licensee being recorded in a given quarter that is not necessarily indicative of the amounts of licensing revenue to be received from that licensee in future quarters, thus causing fluctuations in our operating results.
Our licensing revenue depends in large part upon IC manufacturers incorporating our technologies into ICs for sale to our consumer electronics product licensees and if, for any reason, our technologies are not incorporated in these ICs or fewer ICs are sold that incorporate our technologies, our operating results would be adversely affected.
Our licensing revenue from consumer electronics product manufacturers depends in large part upon the availability of ICs that implement our technologies. IC manufacturers incorporate our technologies into these ICs, which are then incorporated in consumer electronics products that utilize our technologies. We do not manufacture these ICs, but rather depend on IC manufacturers to develop, produce and then sell them to licensed consumer electronics product manufacturers. We cannot control the IC manufacturers’ decision whether or not to incorporate our technologies into their ICs, and we cannot control their product development or commercialization efforts nor predict their success. As a result, if these IC manufacturers are unable or unwilling, for any reason, to implement our technologies into their ICs, or if, for any reason, they sell fewer ICs incorporating our technologies, our operating results will be adversely affected.
Our future success depends, in part, upon the growth of new markets for surround sound technologies and our ability to develop and adapt our technologies for those new markets. If such markets fail to grow or we are unable to develop successful products for them, our business prospects could be limited.
We expect that future growth of our licensing revenue will depend, in part, upon the growth of, and our successful participation in, new markets for surround sound technologies, including:
| · | Digital broadcasting; |
| · | HDTV; |
| · | Broadband Internet; |
| · | Home DVD recording; |
12
Table of Contents
| · | DVD-Audio; |
| · | Video games; |
| · | Personal audio and video players, including Internet music applications; and |
| · | In-car entertainment systems. |
The development of these markets depends on increased consumer demand for surround sound products, which may not occur. Any failure of such markets to develop or consumer demand to grow would have a material adverse effect on our business and prospects. For example, only a small number of automobile manufacturers currently offer in-car entertainment systems incorporating our surround sound technologies, and those that do typically limit those systems only to certain models. Additional manufacturers may not offer surround sound entertainment systems, and, even if they do, the car models on which surround sound may be offered are likely to be, at least initially, limited to the high end of these manufacturers’ lines. Similarly, whether our revenue from digital broadcast networks and broadband Internet services increases depends upon the expansion of digital broadcast technologies and broadband Internet as a medium of entertainment, which may not occur. In addition, even when our technologies are adopted as industry standards for a particular market, such market may not be fully developed. In such case, our success depends not only on whether our technology is adopted as an industry standard for such market, but also on the development of that market, which may not occur. For example, while our technologies have been adopted in many countries as a mandatory or optional industry standard for broadcast audio for digital television, many television broadcasters around the world do not yet broadcast digital television. Demand for our technologies in any of these developing markets may not continue to grow, and a sufficiently broad base of consumers and professionals may not adopt or continue to use these technologies. Demand and market acceptance for recently introduced services and products are subject to a high level of uncertainty. Our business could be limited if demand for products and services such as those described above do not expand as we expect, or if our technologies are not adopted by licensees for use with such products and services. In addition, our ability to generate revenue from these markets may be limited to the extent that service providers in these markets choose to provide certain technologies and entertainment for little or no cost, such as many of the services provided in connection with broadband Internet services. Moreover, some of these markets are ones in which we have not previously participated and, because of our limited experience, we may not be able to adequately adapt our business and our technologies to the needs of customers in these fields.
We also expect that growth in our licensing revenue will depend, in part, upon the growth of sales of consumer electronics products incorporating our technologies in other countries, including China and India, as consumers in these markets have more disposable income and are increasingly purchasing entertainment products with surround sound capabilities. However, if our licensing revenue from the use of our technologies in these new markets or geographic areas does not expand, our prospects could be adversely affected.
We face significant competition in various markets, and if we are unable to compete successfully, our business will suffer.
The markets for entertainment industry technologies are highly competitive, and we face competitive threats and pricing pressure in all of these industries. Our competitors on the professional side of our business include Avica, Digital Theater Systems, EVS, GDC, Kodak, Microsoft, NEC, Panastereo, Sony and UltraStereo. Competitors on the consumer side of our business include Coding Technologies, Digital Theater Systems, Fraunhofer Institute for Integrated Circuits, Microsoft, Philips, RealNetworks, Sony, SRS Labs and Thomson. In addition, other companies may become competitors in the future. The quality of sound produced by some of our competitors’ technologies may be perceived by some people as equivalent or superior to that produced by ours. In addition, some of our current and/or future competitors may have significantly greater financial, technical, marketing and other resources than we do, or may have more experience or advantages in the markets in which they compete. For example, Microsoft and RealNetworks may have an advantage over us in the market for Internet technologies because of their greater experience and presence in that market. In addition, some of our current or potential competitors, such as Microsoft and RealNetworks, may be able to offer integrated system solutions in certain markets for sound or non-sound entertainment technologies, including audio, video and rights management
13
Table of Contents
technologies related to personal computers or the Internet, which could make competing technologies that we develop unnecessary. By offering an integrated system solution, these potential competitors also may be able to offer competing technologies at lower prices than our technologies, which could adversely affect our operating results. We also face competitive risks in situations where our customers are also current or potential competitors. For example, Sony is a significant licensee customer and is a significant purchaser of our professional products and production services, but Sony is also a competitor with respect to certain of our professional and consumer technologies. Sony’s plan to acquire Metro-Goldwyn-Mayer, which is also a significant purchaser of our professional products and production services, is expected to increase this potential competitive risk. In addition, Universal, which is a purchaser of our professional products and production services, also has had an ownership interest in Digital Theater Systems, one of our competitors. Further, many of the consumer electronics products that include our sound technology also include sound technologies developed by our competitors. As a result, we must continue to invest significant resources in research and development in order to enhance our technologies and our existing products and services and introduce new high-quality products and services to meet the wide variety of such competitive pressures. Our business will suffer if we fail to do so successfully.
In addition, the market for the consumer electronics products in which our technologies are incorporated is intensely competitive and price sensitive. Retail prices for consumer electronics products that include our sound technology, such as DVD players and home theatre systems, have decreased significantly, and we expect prices to continue to decrease for the foreseeable future. In response, manufacturers have sought to reduce their product costs, which can result in downward pressure on the licensing fees we charge our customers who incorporate our technologies into the consumer electronics products that they sell. A decline in the licensing fees we charge would materially and adversely affect our operating results.
We believe that the success we have had licensing our surround sound technologies to consumer electronics product manufacturers is due, in part, to the strength of our brand and the perception that our technologies provide a high-quality solution for surround sound. However, as applications that incorporate surround sound technologies become increasingly prevalent, we expect more competitors to enter this field with other solutions. Furthermore, to the extent that these solutions are perceived, accurately or not, to provide the same advantages as our technologies, at a lower or comparable price, there is a risk that sound encoding technology such as ours will be treated as a commodity, resulting in loss of status of our technologies, decline in their use, and significant pricing pressure. To the extent that our audio technologies become a commodity, rather than a premium solution, our business, operating results and prospects could be adversely affected.
Awareness of our brand depends to a significant extent upon a decision by our customers to display our trademarks on their products, and if our customers do not display our trademarks on their products, our ability to increase our brand awareness may be harmed.
We engage in relatively little direct brand advertising, and we do not currently plan to increase our direct brand advertising activities in the future. Instead, the promotion of our brand depends upon entertainment industry participants displaying our trademarks on their products that incorporate our technologies. Although we do not require our customers to place our brand on their products, we actively encourage them to do so. For example, we license our trademarks to motion picture studios, broadcasters and distributors for placement in film prints, television programming, DVD packaging and promotional materials, such as movie posters, to signify that the content has been made utilizing high-quality Dolby Laboratories sound technologies, which we believe is very important to consumers. We also rely on consumer electronics product manufacturers that license our technologies to display our trademarks on their products in order to promote our brand. If our customers choose for any reason not to display our trademarks, our ability to maintain or increase our brand awareness may be harmed, which would have an adverse affect on our business and prospects.
We face a number of risks in conducting business in China.
The percentage of our licensing revenue from Chinese consumer electronics product manufacturers grew from 11% in fiscal 2002 to 16% in fiscal 2004. We expect this trend to continue in the future, as consumer electronics product manufacturing in China continues to increase due to the lower manufacturing cost structure
14
Table of Contents
there as compared to other industrial countries. We also expect that our sales of professional products and production services in China will expand in the future to the extent that the use of digital surround sound technologies increases in China, including in movies, broadcast television and video games. We further expect that the sale of consumer electronics products incorporating our technologies will increase in China to the extent that Chinese consumers become more affluent. However, we face many risks in China, in large part due to China’s historically limited recognition and enforcement of intellectual property and contractual rights. In particular, we have many times experienced, and expect to continue to experience, problems with Chinese consumer electronics product manufacturers failing to report or underreporting shipments of their products that incorporate our technologies or incorporating our technologies and trademarks into their products without our authorization and without paying us any licensing fees, which adversely affects our operating results. We may also experience difficulties in enforcing our intellectual property rights in China, where intellectual property rights are not as respected as they are in the United States, Japan and Europe. In addition, we have only limited patent protection in China, especially with respect to our Dolby Digital technologies, which may make it more difficult for us to enforce our intellectual property rights in China. We believe that it is critical that we strengthen existing relationships and develop new relationships with entertainment industry participants in China to increase our ability to enforce our intellectual property and contractual rights in China without relying solely on the Chinese legal system. If we are unable to develop, maintain and strengthen these relationships, our revenue from China could be adversely affected. However, developing, maintaining and strengthening relationships in China is especially difficult because of the multiple Chinese cultures and resulting fragmented nature of the Chinese economy. As a result, we must develop, maintain and strengthen relationships at each step of the entertainment chain in many different regions of China in order to successfully enforce our intellectual property and contractual rights in China.
We face diverse risks in our international business, which could adversely affect our operating results.
We are dependent on international sales for a substantial amount of our total revenue. For fiscal years ended 2002, 2003 and 2004, our sales outside the United States were 64%, 60% and 59%, respectively, of our professional products and production services revenue, and royalties from licensees outside the United States were 76%, 80% and 80%, respectively, of our licensing revenue. We expect that international and export sales will continue to represent a substantial portion of our revenue for the foreseeable future. This future revenue will depend to a large extent on the continued use and expansion of our technologies in entertainment industries worldwide. Increased worldwide use of our technologies is also an important factor in our future growth.
Due to our reliance on sales to customers outside the United States, we are subject to the risks of conducting business internationally, including:
| · | Our ability to enforce our contractual and intellectual property rights, especially in those foreign countries that do not respect and protect intellectual property rights to the same extent as do the United States, Japan and European countries, which increases the risk of unauthorized, and uncompensated, use of our technology; |
| · | United States and foreign government trade restrictions, including those which may impose restrictions on importation of programming, technology or components to or from the United States; |
| · | Foreign government taxes, regulations and permit requirements, including foreign taxes that we may not be able to offset against taxes imposed upon us in the United States, and foreign tax and other laws limiting our ability to repatriate funds to the United States; |
| · | Foreign labor laws, regulations and restrictions; |
| · | Changes in diplomatic and trade relationships; |
| · | Difficulty in staffing and managing foreign operations; |
| · | Fluctuations in foreign currency exchange rates, including risks related to any hedging activities we undertake; |
| · | Political instability, natural disasters, war and/or events of terrorism; and |
| · | The strength of international economies. |
15
Table of Contents
We expect that the percentage of our licensing revenue from consumer electronics product manufacturers in China and other developing countries, such as India, will continue to grow due to the lower cost structure in those countries as compared to other industrialized countries. As with consumer electronic product manufacturers in China, we expect to experience problems in these countries with manufacturers failing to report or underreporting shipments of their products that incorporate our technologies or incorporating our technologies into their products without our authorization. If we are unable to successfully identify and stop unauthorized use of our intellectual property and ensure compliance and accurate reporting by these manufacturers, we could experience increased operational and enforcement costs, and our revenue could be impaired. Moreover, because of the limitations of the legal systems in many developing countries, our ability to enforce claims based upon failures to pay royalties is limited. In this regard, we believe that it is critical that we strengthen existing relationships and develop new relationships with manufactures and distributors in developing countries, as well as other participants in the product distribution chain, to increase our ability to enforce our intellectual property and contractual rights. If we are unable to develop, maintain and strengthen these relationships, our revenue from developing countries could be adversely affected. In addition, we have relatively few or no issued patents in certain developing countries, which could prevent or substantially limit our ability to enforce intellectual property claims in those countries.
A loss of one or more of our key customers or licensees in any of our markets could adversely affect our operating results.
From time to time, one or a small number of our customers or licenses may represent a significant percentage of our professional or licensing revenue. Although we have agreements with many of these customers, these agreements typically do not require any minimum purchases or minimum royalty fees and do not prohibit customers from purchasing products and services from competitors. A decision by any of our major customers or licensees not to use our technologies, or their failure or inability to pay amounts owed to us in a timely manner, or at all, whether due to strategic redirections or adverse changes in their businesses or for other reasons, could have a significant effect on our operating results.
Our licensing of industry standard technologies can be subject to limitations that could adversely affect our business and prospects.
When our technologies are adopted as explicit industry standards by a standards-setting organization, we generally must agree to license such technologies on a fair, reasonable and non-discriminatory basis, which could limit our control over the use of these technologies. In these situations, we must often limit the royalty rates we charge for these technologies, which could adversely affect our gross margins. Furthermore, we may be unable to limit to whom we license such technologies, and may be unable to restrict many terms of the license. From time to time we may be subject to claims that our licenses of our industry standard technologies may not conform to the requirements of the standards-setting body. Private parties have raised this type of issue with us in the past. Allegations such as these could be asserted in private actions seeking monetary damages and injunctive relief, or in regulatory actions. Claimants in such cases could seek to restrict or change our licensing practices or our ability to license our technologies in ways that could injure our reputation and otherwise materially and adversely affect our business, operating results and prospects.
In fiscal 2002, we began licensing some of our patents through our wholly-owned subsidiary Via Licensing Corporation in “patent pools” with other companies in an effort to ensure that our technologies are compatible with other technologies in the entertainment industry and to promote our technologies as industry standards. These patent pools are comprised of a group of patents held by a number of companies, including us in some cases, and administered by Via Licensing, that allow product manufacturers streamlined access to certain foundational technologies. This is a different business model for us and we cannot predict all of the challenges we may face or whether we will be successful. For instance, Via Licensing licenses patents into areas such as wireless markets in which we have not competed previously. As a result, our control over the license of our technologies from these patent pools may be limited as compared to our traditional business model in which we license our patents as bundles of technologies and interact directly with our customers. In addition, our control over the application and quality control of our technologies that are included in these pools may be limited.
16
Table of Contents
In addition, standards setting bodies may require the use of so-called “open standards,” meaning that the technologies necessary to meet those standards are freely available without the payment of a licensing fee or royalty. The industry standards developed for digital cinema will be open standards. The use of open standards may reduce our opportunity to generate revenue by licensing our proprietary technologies and may also reduce, perhaps substantially, barriers to entry for our competitors, both of which could adversely affect our business and prospects.
We may be unable to significantly expand our current professional product sales in the cinema industry because our professional products are already used by the vast majority of major cinema operators and major motion picture studios in the United States and much of the rest of the world. If the cinema industry does not expand, or if it contracts, the demand for our professional products will be adversely affected.
Our ability to further penetrate the market for motion picture sound technologies is limited because of the widespread use of our current professional products by major motion picture content creators, distributors and cinema operators. As a result, our future revenue from our professional products for the cinema industry will depend, in part, upon events and conditions in that industry—specifically, the continued production and distribution of motion pictures, and the construction of new theatres and the renovation of existing theatres, using our products and services. For example, in the late 1990s cinema operators in the United States built a large number of new cinema megaplexes. This initially resulted in increased sales of our cinema processors, but also resulted in an oversupply of screens in some markets. This oversupply led to significant declines in new theatre construction in the United States in the early 2000s, resulting in a corresponding decline in sales of our cinema processors. As a result, future growth in sales of our existing cinema products may be limited, and may decrease in the future, as the number of new cinemas being built and the number of existing cinemas without our products continues to decline.
Events and conditions in the motion picture industry may affect sales of our professional products and production services.
Sales of our professional products and production services tend to fluctuate based on the underlying trends in the motion picture industry. In part, this is because our products have been so widely adopted in this industry. When box office receipts for the motion picture industry increase, we have typically seen sales of our professional products increase as well, as cinema owners are more likely to build new theatres and upgrade existing theatres with our more advanced cinema products when they are doing well financially. On the other hand, our production services revenue, both in the United States and internationally, is tied to the number of films being made by studios and independent filmmakers. The number of films that are produced can be affected by a number of factors, including strikes and work-stoppages within the motion picture industry as well as by the tax incentive arrangements that many foreign governments provide filmmakers to promote local filmmaking.
The construction of new screens and the renovation of existing theatres, as well as the continued production of new motion pictures, are also adversely impacted by the growth in piracy of motion pictures. Technological advances and the conversion of motion pictures into digital formats have made it easier to create, transmit and “share” high-quality unauthorized copies of motion pictures, including on pirated DVDs and on the Internet. If cinema operators decide to close a significant number of screens in the future or cut their capital spending as a result of piracy, demand for our playback systems and cinema processors will decline, which could negatively impact our operating results.
If the market for digital cinema does not develop, or if we are unable to compete successfully in this market, our future prospects could be limited and our business could be adversely affected.
Digital cinema is a term used to describe movies that are delivered to and stored in movie theatres in electronic form rather than on film, and that are projected on theatre screens using digital projectors. The cinema industry is in the early stages of the adoption of digital cinema for the distribution and exhibition of movies. We are committed to helping the motion picture industry develop system solutions for digital cinema; this is our major initiative in our products and services segment. However, the conversion of movie theatres from film to digital cinema will be a
17
Table of Contents
significant expense, and we cannot predict how quickly digital cinema will become widely adopted, if at all. There are at present only a very limited number of movie theatres that have been converted to digital cinema and we expect that the conversion of theatres to digital cinema technologies, if it occurs, will be a long-term process due to both technological and financial obstacles. Digital cinema may require a significant investment per screen by cinema operators. If the market for digital cinema fails to develop, or develops more slowly than expected, or if there is significant and sustained resistance by the motion picture industry or cinema operators to this technology or the cost of implementation, we may not realize significant returns on our investment in this area, which could adversely affect our operating results. In addition, because the conversion from film-based to digital cinema is in the early stages, it is impossible to predict accurately how the roles and allocation of costs among various industry participants may develop, if or how quickly digital cinema will be adopted and what, if any, industry standards may be adopted. In addition, it is possible that if a large number of cinema owners decide to convert their theatres to digital cinema over a relatively short period of time and our products are selected for these conversions, we may see an initial increase in professional product sales that will not likely be sustained over time.
Even if the market develops, we may not be successful in selling our products, technologies and services in this market. Our effort with respect to digital cinema is one of the areas where we are expanding our business beyond sound technology. As a result, our relative lack of experience in this area may harm our ability to compete successfully. A number of competitors and potential competitors, including Avica, EVS, GDC, Kodak, NEC, QuVis and Sony, are developing similar or alternative solutions for digital cinema, some of which may provide technological or cost advantages over our products, technologies and services. In addition, our products, technologies and services may not be compatible with the products and technologies developed by other companies for digital cinema. Moreover, it is possible that we will be selling components or technologies that will be incorporated into products sold by other companies, which would be a departure from our traditional business of manufacturing our own professional products and could limit our ability to control the distribution and use of our professional products. In addition, we are building components of the digital cinema delivery solution that are not solely related to sound and we do not have a long track record of providing these types of products, which may adversely affect our ability to compete in the digital cinema market. In this regard, our competitors may develop entire system solutions for digital cinema, which could make the technologies that we develop for incorporation in digital cinema systems unnecessary. It is also possible that the professional products used for digital cinema will be sold pursuant to large, long-term contracts at a fixed price, which will be bid upon by potential suppliers. This would be a departure from our traditional model of selling our professional products pursuant to one-time contracts, and could expose us to various risks we have not faced in the past, including an inability to adjust the prices we charge for such services if our costs were to increase. This model also could subject us to potentially higher warranty and intellectual property rights claims.
Furthermore, digital cinema will be based upon non-proprietary technology platforms, or “open standards,” in which no one company maintains ownership over the dominant technologies that develop. The use of open standards may reduce our opportunity to generate revenue by licensing our proprietary technologies and may also reduce, perhaps substantially, barriers to entry for our competitors, both of which could adversely affect our business and prospects. The products, technologies and services we expect to market may not achieve or sustain market acceptance, may not meet the needs of the movie industry, and may not be widely adopted. In addition, we expect that our digital cinema products, technologies and services may not be priced as low as those of our competitors, which may make it more difficult for us to compete or have our products and technologies become widely adopted. If we are unsuccessful in selling our products, technologies and services in the market for digital cinema, our business could be materially adversely affected. In addition, although we believe that many of the technological advances we may develop for digital cinema may have applicability in other areas, such as broadcasting or consumer electronics products, we may not ever be able to achieve these anticipated benefits in these other markets.
If the film industry broadly adopts digital cinema, the demand for our current professional products and production services could decline. Such a decline in our products and services business could also adversely affect our technology licensing business, because the strength of our brand and our ability to use professional
18
Table of Contents
developments to advance our consumer licensing technologies would be impaired. If, in such circumstances, we are unable to adapt our professional products and production services or introduce new products for the market for digital cinema successfully, our business could be materially adversely affected.
If we are unable to expand our business into non-sound technologies, our future growth could be limited.
Our future growth will depend, in part, upon our expansion into areas beyond sound technologies. For example, in addition to our digital cinema initiative, we are exploring other areas that facilitate delivery of digital entertainment, such as technologies for processing digital moving images and content protection. We will need to spend considerable resources on research and development in the future in order to deliver innovative non-sound technologies. However, we have limited experience in these markets and, despite our efforts, we cannot predict whether we will be successful in developing and marketing non-sound products, technologies and services. In addition, many of these markets are relatively new and may not grow as we currently anticipate. A number of competitors and potential competitors may develop non-sound technologies similar to those that we develop, some of which may provide advantages over our products, technologies and services. Some of these competitors have much greater experience and expertise in the non-sound fields we may enter. The non-sound products, technologies and services we expect to market may not achieve or sustain market acceptance, may not meet the needs of the movie industry, and may not be accepted as industry standards or as an industry standard. If we are unsuccessful in selling non-sound products, technologies and services, the future growth of our business may be limited. In addition, our efforts to enter or strengthen our positions in non-sound markets may be tied to the success of specific programs. For instance, our subsidiary, Cinea, is currently involved in a program to provide DVD players incorporating technologies intended to prevent the copying of DVDs to members of the Academy of Motion Picture Arts and Sciences for screening of Oscar nominated motion pictures before these DVDs are released to the general public. However, due to delays in our delivery of these DVD players to Academy members, we have received, and expect that we may continue to receive, negative publicity related to this program. If this program is not successful or there is continued adverse publicity associated with it, our reputation may be harmed and our ability to enter the market for content protection technologies, or markets for other non-sound technologies, could be adversely affected.
Fluctuations in our quarterly and annual operating results may adversely affect the value of our stock.
A number of factors, many of which are outside our control, may cause or contribute to significant fluctuations in our quarterly and annual revenue and operating results. These fluctuations may make financial planning and forecasting more difficult. In addition, these fluctuations may result in unanticipated decreases in our available cash, which could negatively impact our operations. As discussed more fully below, these fluctuations also could increase the volatility of our stock price. Factors that may cause or contribute to fluctuations in our operating results and revenue include:
| · | Fluctuations in demand for our products and for the consumer electronics products of our licensees; |
| · | Fluctuations in the timing of royalty reports we receive from our licensees, including late, sporadic or inaccurate reports; |
| · | Sporadic payments we may be able to recover from companies utilizing our technologies without a license; |
| · | Introduction or enhancement of products, services and technologies by us and our competitors, and market acceptance of these new or enhanced products, services and technologies; |
| · | Rapid, wholesale changes in technology in the entertainment industries in which we compete; |
| · | Events and conditions in the motion picture industry that affect the number of theatres constructed and the number of movies produced and exhibited, including box office receipts, the popularity of motion pictures generally and strikes by motion picture industry participants; |
| · | The financial resources of cinema operators available to buy our products or to equip their theatres to accommodate upgraded or new technologies; |
19
Table of Contents
| · | Consolidation by participants in the markets in which we compete, which could result among other things in pricing pressure; |
| · | The amount and timing of our operating costs and capital expenditures, including those related to the expansion of our business, operations and infrastructure; |
| · | Variations in the time-to-market of our technologies in the entertainment industries in which we operate; |
| · | Seasonal product purchasing patterns by customers of our professional products and seasonal product sales patterns by our consumer electronics product licensees; |
| · | The impact of, and our ability to react to, political instability, natural disasters, war and/or events of terrorism; |
| · | The impact of, and our ability to react to, interruptions in the entertainment distribution chain, including as a result of work stoppages at our facilities, our customers’ facilities and other points throughout the entertainment distribution chain; |
| · | Widespread illnesses such as the SARS illness and Avian Influenza, or Asian Bird Flu, in Asia that could impact our operations, or that could impact the operations of our professional products and production services customers or our consumer electronics product manufacturer licensees—for example, in the past our ability to visit our consumer electronics product manufacturer licensees in Asia was limited by travel restrictions imposed in response to SARS; |
| · | Changes in business cycles that affect the markets in which we sell our products and services or the markets for consumer electronics products incorporating our technologies; |
| · | Fluctuations in foreign currency exchange rates or our ability to hedge foreign currency risks; |
| · | Adverse outcomes of litigation or governmental proceedings, including any foreign, federal, state or local tax assessments or audits; and |
| · | Costs of litigation and intellectual property protection. |
One or more of the foregoing or other factors may cause our operating expenses to be disproportionately higher or lower or may cause our revenue and operating results to fluctuate significantly in any particular quarterly or annual period. Results from prior periods are thus not necessarily indicative of the results of future periods.
The loss of or interruption in operations of one or more of our key suppliers could materially delay or stop the production of our professional products and impair our ability to generate revenue.
Our reliance on outside suppliers for some of the key materials and components we use in the manufacture of our professional products involves risks, including limited control over the price, timely delivery and quality of such components. We have no agreements with our suppliers to ensure continued supply of materials and components. Although we have identified alternate suppliers for most of our key materials and components, any required changes in our suppliers could cause material delays in our production operations and increase our production costs. In addition, our suppliers may not be able to meet our future production demands as to volume, quality or timeliness. Moreover, we rely on sole source suppliers for some of the components that we use to manufacture our professional products, including certain charged coupled devices, light emitting diodes and digital signal processors. These sole source suppliers may become unable or unwilling to deliver these components to us at an acceptable cost or at all, which could force us to redesign certain of our products. Our inability to obtain timely delivery of key components of acceptable quality, any significant increases in the prices of components, or the redesign of our professional products could result in material production delays, increased costs and reductions in shipments of our products, any of which could increase our operating costs, harm our customer relationships or materially and adversely affect our business and operating results.
20
Table of Contents
Revenue from our professional products may suffer if our production processes encounter problems or if we are not able to match our production capacity to fluctuating levels of demand.
Our professional products are highly complex, and production difficulties or inefficiencies can interrupt production, resulting in our inability to deliver products on time in a cost effective, competitive manner. If production is interrupted at one of our two manufacturing facilities, we may not be able to shift production to the other facility on a timely basis, and customers may purchase products from our competitors. Likewise, we may be unable to respond to fluctuations in customer demand. A shortage of manufacturing capacity for our professional products could adversely affect our operating results and damage our customer relationships. In addition, because we cannot quickly adapt our manufacturing capacity to rapidly changing market conditions, at times we underutilize our manufacturing facilities as a result of reduced demand for certain of our professional products, which may adversely affect our gross margins.
Our professional products, from time to time, experience quality problems that can result in decreased sales and higher operating expenses.
Our professional products are complex and sometimes contain undetected software or hardware errors, particularly when first introduced or when new versions are released. In addition, our professional products are sometimes combined with or incorporated into products from other vendors, sometimes making it difficult to identify the source of a problem. These errors could result in a loss of or delay in market acceptance of our professional products or cause delays in delivering them and meeting customer demands, any of which could reduce our revenue and raise significant customer relations issues. In addition, if our professional products contain errors we could be required to replace or reengineer them, which could increase our costs. Moreover, if any such errors cause unintended consequences, we could face claims for product liability. Although we generally attempt to contractually limit liability for defective products to the cost of repairing or replacing these products, if these contract provisions are not enforced or are unenforceable for any reason, or if liabilities arise that are not effectively limited, we could incur substantial costs in defending and settling product liability claims.
We are subject to various environmental laws and regulations that could impose substantial costs upon us and may adversely affect our business, operating results and financial condition.
Some of our operations use substances regulated under various federal, state, local and international laws governing the environment, including those governing the discharge of pollutants into the air and water, the management, disposal and labeling of hazardous substances and wastes and the cleanup of contaminated sites. Certain of our products are subject to various federal, state and international laws governing chemical substances in electronic products. We could incur costs, fines and civil or criminal sanctions, third-party property damage or personal injury claims, or could be required to incur substantial investigation or remediation costs, if we were to violate or become liable under environmental laws. Liability under environmental laws can be joint and several and without regard to comparative fault. The ultimate costs under environmental laws and the timing of these costs are difficult to predict.
The European Parliament has recently finalized the Waste Electrical and Electronic Equipment Directive, or WEEE Directive, which makes producers of electrical goods financially responsible for specified collection, recycling, treatment and disposal of past and future covered products. As a producer of electronic equipment, we will incur financial responsibility for the collection, recycling, treatment or disposal of products covered under the WEEE Directive. In addition, the European Parliament has enacted the Restriction on Use of Hazardous Substances Directive, or RoHS Directive, which restricts the use of certain hazardous substances in electrical and electronic equipment that are vital components in products we manufacture, including mercury, lead, cadmium and hexavalent chromium. We may need to redesign or reformulate products containing hazardous substances regulated under the RoHS Directive to reduce or eliminate those regulated hazardous substances in our products. For some products, substitutions for regulated hazardous substances may be difficult or costly to obtain or redesign efforts could result in production delays. Individual European member states are required to enact
21
Table of Contents
legislation to implement the two Directives. Although the United Kingdom has not yet enacted legislation to implement these two Directives, we are continuing to review the applicability and impact of both Directives on the manufacturing of our professional products in our Wootton Bassett, England facility. We expect to incur increased manufacturing costs or production delays to comply with future legislation which implements these Directives, but we cannot currently estimate the extent of such increased costs or production delays. However, to the extent that such cost increases or delays are substantial, our operating results could be materially adversely affected. In addition, similar legislation may be enacted in other countries, including federal and state legislation in the United States, the cumulative impact of which could significantly increase our operating costs and adversely affect our operating results.
The WEEE Directive and the RoHS Directive likely will impact some customers who license our technology and pay us royalties upon the sale of electronic products. If the Directives result in fewer licensed consumer electronics products being sold, whether due to price increases, production delays, compromised product performance due to reformulation or redesign, or for other reasons, then we will receive less revenue in royalties. If the Directives materially impair or inhibit such sales, the reduction in licensing revenue could adversely affect our operating results.
We also expect that our operations, whether manufacturing or licensing, will be affected by other new environmental laws and regulations on an ongoing basis. Although we cannot predict the ultimate impact of any such new laws and regulations, they will likely result in additional costs, or decreased licensing revenue, and could require that we redesign or change how we manufacture our products, any of which could have a material adverse effect on our business.
Any inability to protect our intellectual property rights could reduce the value of our products, services and brand.
Our business is dependent upon our patents, trademarks, trade secrets, copyrights and other intellectual property rights. We derived 66%, 73% and 73% of our total revenue from licensing revenue in fiscal years 2002, 2003 and 2004, respectively. Effective intellectual property rights protection, however, may not be available under the laws of every country in which our products and services and those of our licensees are distributed. Also, the efforts we have taken to protect our proprietary rights may not be sufficient or effective. Any significant impairment of our intellectual property rights could harm our business or our ability to compete. In addition, protecting our intellectual property rights is costly and time consuming. We have taken steps in the past to enforce our intellectual property rights and expect to continue to do so in the future. However, it may not be practicable or cost effective for us to enforce our intellectual property rights fully, particularly in certain developing countries or where the initiation of a claim might harm our business relationships. For example, we have many times experienced, and expect to continue to experience, problems with Chinese consumer electronics product manufacturers incorporating our technologies into their products without our authorization. If we are unable to successfully identify and stop unauthorized use of our intellectual property, we could experience increased operational and enforcement costs both inside and outside China, which could adversely affect our financial condition and results of operations.
We generally seek patent protection for our innovations. It is possible, however, that some of these innovations may not be protectable. In addition, given the costs of obtaining patent protection, we may choose not to protect certain innovations that later turn out to be important. Moreover, we have limited or no patent protection in certain foreign jurisdictions. For example, in China we have only limited patent protection, especially with respect to our Dolby Digital technologies, and in India we have no issued patents. Furthermore, there is always the possibility, despite our efforts, that the scope of the protection gained will be insufficient or that an issued patent may later be found to be invalid or unenforceable. We also seek to maintain certain intellectual property as trade secrets. These trade secrets could be compromised by third parties, or intentionally or accidentally by our employees, which would cause us to lose the competitive advantage resulting from them.
22
Table of Contents
We may become subject to a personal holding company tax, which could materially and adversely affect our operating results and financial condition.
For United States federal income tax purposes, a corporation is generally considered to be a “personal holding company” under the United States Internal Revenue Code if (i) at any time during the last half of its taxable year more than 50% of its stock by value is owned, directly or indirectly, by virtue of the application of certain stock ownership attribution rules set forth in the Internal Revenue Code for purposes of applying the personal holding company rules, by five or fewer individuals and (ii) at least 60% of its adjusted ordinary gross income, as defined for United States federal income tax purposes, is “personal holding company income.” Personal holding company income is generally passive income, including royalty income, subject to certain exceptions such as qualifying software royalties. A personal holding company is subject to an additional tax on its undistributed after-tax income, equal to a statutory tax rate, which is currently 15%. Since the personal holding company tax is imposed only on undistributed income, a personal holding company can avoid or mitigate liability for the tax by paying a dividend to its stockholders.
Before this offering, more than 50% of the value of our stock was held by Ray Dolby and stockholders considered affiliated with him pursuant to the stock ownership attribution rules applicable to personal holding companies. We expect this will continue to be the case immediately after this offering. In addition, a significant portion of our income is from licensing fees, which may constitute personal holding company income. We believe, however, that neither we nor any of our subsidiaries are currently subject to, or liable for, the personal holding company tax. Moreover, we do not believe that we or any of our subsidiaries have previously been subject to, or liable for, the personal holding company tax.
However, the Internal Revenue Service may assert that we and any of our subsidiaries are currently, or previously have been, subject to, or liable for, the personal holding company tax. In addition, we and our subsidiaries may be subject to, or liable for, the personal holding company tax in the future. The treatment of certain items of our income, and the income of our subsidiaries, for purposes of the personal holding company tax may be subject to challenge. In the event that we or any of our subsidiaries were determined to be a personal holding company, or for prior taxable years, to have been a personal holding company, we could be liable for substantial additional taxes. In addition, we believe that there exists a meaningful risk that in the relatively near future the mix of our revenue will change so that more of our adjusted ordinary gross income may be classified as personal holding company income. In such event, it is possible that we or one of our subsidiaries could become subject to the personal holding company tax, assuming the ownership test continues to be met. In that case, we or our subsidiary, as the case may be, may be required to pay additional tax or, alternatively, we may choose to declare a dividend to our stockholders to avoid or mitigate liability for the tax. We are currently exploring options to reduce our exposure, and the exposure of our subsidiaries, to the personal holding company tax in the future.
If we or any of our subsidiaries were to pay personal holding company tax, this could significantly increase our consolidated tax expense and adversely affect our operating results. In addition, if the statutory tax rate increases in the future, the amount of any personal holding company tax we or any of our subsidiaries may have to pay could increase significantly, further impairing our operating results. In that regard, the statutory tax rate, which is currently 15%, is scheduled to return to ordinary income tax rate levels for tax years beginning on or after January 1, 2009. If we are deemed to be a personal holding company and, instead of paying the personal holding company tax, we elect to pay a dividend to our stockholders in an amount equal to all or a significant part of our undistributed personal holding company income, we may consume a significant amount of cash resources and be unable to retain or generate working capital. This would adversely affect our financial condition. As a result, if we pay such a dividend, we may decide to seek additional financing, although that financing may not be available to us when and as required on commercially reasonable terms, if at all.
Failure to comply with applicable current and future government regulations could have a negative effect on our business.
Our operations and business practices are subject to federal, state and local government laws and regulations, as well as international laws and regulations, including those relating to consumer and other safety-
23
Table of Contents
related compliance for electronic equipment, as well as compulsory license requirements as a prerequisite to being included as part of the industry standards, such as the United States HDTV standard. Any failure by us to comply with the laws and regulations applicable to us or our products could result in our inability to sell those products, additional costs to redesign products to meet such laws and regulations, fines or other administrative actions by the agencies charged with enforcing compliance and, possibly, damages awarded to persons claiming injury as the result of our non-compliance. Changes in or enactment of new statutes, rules or regulations applicable to us could have a material adverse effect on our business.
Acquisitions could result in operating difficulties, dilution to our stockholders and other harmful consequences.
We have evaluated, and expect to continue to evaluate, a wide array of possible strategic transactions and acquisitions. For example, we consider these types of transactions in connection with our efforts to expand our business beyond sound technologies, such as in digital cinema and other technologies related to the delivery of digital entertainment. Although we cannot predict whether or not we will complete any such acquisition or other transactions in the future, any of these transactions could be material in relation to our financial condition and results of operations. The process of integrating an acquired company, business or technology may create unforeseen difficulties and expenditures. The areas where we may face risks include:
| · | The need to implement or improve internal controls, procedures and policies appropriate for a public company at businesses that prior to the acquisition lacked these controls, procedures and policies; |
| · | Diversion of management time and focus from operating our business to acquisition integration challenges; |
| · | Cultural challenges associated with integrating employees from acquired businesses into our organization; |
| · | Retaining employees from businesses we acquire; |
| · | Possible write-offs or impairment charges resulting from acquisitions; |
| · | Unanticipated or unknown liabilities relating to acquired businesses; and |
| · | The need to integrate acquired businesses’ accounting, management information, manufacturing, human resources and other administrative systems to permit effective management. |
Foreign acquisitions involve unique risks in addition to those mentioned above, including those related to integration of operations across different geographies, cultures and languages, currency risks and risks associated with the particular economic, political and regulatory environment in specific countries. Also, the anticipated benefit of our acquisitions may not materialize. Future acquisitions could result in potentially dilutive issuances of our equity securities, the incurrence of debt, contingent liabilities or amortization expenses, or write-offs of goodwill, any of which could harm our operating results or financial condition. Future acquisitions may also require us to obtain additional equity or debt financing, which may not be available on favorable terms or at all.
The loss of members of our management team could substantially disrupt our business operations.
Our success depends to a significant degree upon the continued individual and collective contributions of our management team. A limited number of individuals have primary responsibility for managing our business, including our relationships with key customers and licensees. We have a number of key executives and senior technical people who have been with us for a number of years, including over 150 employees who have been with us for over 10 years. These individuals, as well as the rest of our management team and key employees, are at-will employees, and we do not maintain any key-person life insurance policies. Losing the services of any key member of our team, whether from retirement, competing offers or other causes, could prevent us from executing our business strategy, cause us to lose key customer or licensee relationships, or otherwise materially affect our operations.
24
Table of Contents
We rely on highly skilled personnel, and if we are unable to retain or motivate key personnel or hire qualified personnel, we may not be able to maintain our operations or grow effectively.
Our performance is largely dependent on the talents and efforts of highly skilled individuals. Our future success depends on our continuing ability to identify, hire, develop, motivate and retain highly skilled personnel for all areas of our organization. In this regard, we currently plan to hire a significant number of employees prior to the end of calendar 2005 in response to our growth and our current initiatives and if we are unable to hire and train a sufficient number of qualified employees for any reason, we may not be able to implement our current initiatives or grow effectively. However, competition in our industry for qualified employees is intense, and we are aware that certain of our competitors have directly targeted our employees. We have in the past maintained a rigorous, highly selective and time-consuming hiring process. We believe that our approach to hiring has significantly contributed to our success to date. However, our highly selective hiring process has made it more difficult for us to hire a sufficient number of qualified employees, and, as we grow, our hiring process may prevent us from hiring the personnel we need in a timely manner. In addition, the high cost of living in the San Francisco Bay Area, where our corporate headquarters and a significant portion of our operations are located, has been an impediment in attracting new employees and retaining existing employees in the past, and we expect that this high cost of living will continue to impair our ability to attract and retain employees in the future. Furthermore, for much of our history we have relied upon cash compensation arrangements, such as cash bonuses, rather than option grants, to motivate our employees. In recent years, we have granted options to key employees. Nonetheless, there is no assurance that either of these approaches will provide adequate incentives to attract, retain and motivate employees in the future. If we do not succeed in attracting excellent personnel and retaining and motivating existing personnel, our existing operations may suffer and we may be unable to grow effectively.
If we cannot maintain our corporate culture as we grow, we could lose the innovation, teamwork and focus that we believe our culture fosters, and our business may be harmed.
We believe that a critical contributor to our success has been our corporate culture, which we believe fosters innovation, teamwork and a focus both on developing and strengthening long-term relationships with entertainment industry participants and on developing practical, enduring technology solutions for the entertainment industry. As we grow and change in response to the requirements of being a public company, we may find it difficult to maintain important aspects of our corporate culture, which could negatively affect our future success. We intend to continue to focus on developing technologies for the entertainment industries that provide long-term benefits, and we intend to keep our focus on long-term results.
We will incur increased costs and demands upon management as a result of complying with the laws and regulations affecting public companies, which could affect our operating results.
As a public company we will incur significant legal, accounting and other expenses that we did not incur as a private company, including costs associated with public company reporting requirements. We also have incurred and will incur costs associated with recently adopted corporate governance requirements, including requirements under the Sarbanes-Oxley Act, as well as new rules implemented by the SEC and the NYSE. In addition, our management team will also have to adapt to the requirements of being a public company, as none of our senior executive officers has significant experience in the public company environment. We expect these rules and regulations to increase our legal and financial compliance costs and to make some activities more time-consuming and costly. We also expect these new rules and regulations may make it more difficult and more expensive for us to obtain director and officer liability insurance, and we may be required to accept reduced policy limits and coverage or incur substantially higher costs to obtain the same or similar coverage than used to be available. As a result, it may be more difficult for us to attract and retain qualified individuals to serve on our board of directors or as our executive officers.
If we fail to maintain proper and effective internal controls, our ability to produce accurate financial statements could be impaired, which could adversely affect our operating results, our ability to operate our business and investors’ views of us.
We have a complex business organization that is international in scope. Ensuring that we have adequate internal financial and accounting controls and procedures in place to help ensure that we can produce accurate
25
Table of Contents
financial statements on a timely basis is a costly and time-consuming effort that needs to be re-evaluated frequently. We are in the process of documenting, reviewing and, if appropriate, improving our internal controls and procedures in connection with Section 404 of the Sarbanes-Oxley Act, which requires annual management assessments of the effectiveness of our internal controls over financial reporting and a report by our independent auditors addressing these assessments. Both we and our independent auditors will be testing our internal controls in connection with the Section 404 requirements and could, as part of that documentation and testing, identify areas for further attention or improvement. Implementing any appropriate changes to our internal controls may require specific compliance training of our directors, officers and employees, entail substantial costs in order to modify our existing accounting systems, and take a significant period of time to complete. Such changes may not, however, be effective in maintaining the adequacy of our internal controls, and any failure to maintain that adequacy, or consequent inability to produce accurate financial statements on a timely basis, could increase our operating costs and could materially impair our ability to operate our business. In addition, investors’ perceptions that our internal controls are inadequate or that we are unable to produce accurate financial statements may seriously affect our stock price.
Issues arising from the implementation of our new enterprise resource planning system could affect our operating results and ability to manage our business effectively.
We are currently implementing a PeopleSoft enterprise resource planning, or ERP, system over a three-year period ending in 2007 that is critical to our accounting, financial, operating and manufacturing functions. Implementing a new ERP system raises costs and risks inherent in the conversion to a new computer system, including disruption to our normal accounting procedures and problems achieving accuracy in the conversion of electronic data. Failure to properly or adequately address these issues could result in increased costs, the diversion of management’s attention and resources and could materially adversely affect our operating results and ability to manage our business effectively. In addition, we do not know whether or not the pending Oracle acquisition bid for PeopleSoft will affect the implementation and future use of our ERP system. To the extent that this acquisition delays, complicates or prevents the full implementation, future use or service of our ERP system, our operating results and financial condition could be adversely affected.
Calamities, power shortages or power interruptions at our San Francisco and Burbank offices or our Brisbane manufacturing facilities could disrupt our business and adversely affect our operations, and could disrupt the businesses of our major professional products and production services customers.
Our principal operations are located in Northern California, including our corporate headquarters in San Francisco and one of our manufacturing facilities in Brisbane, California. Many of our motion picture production services operations are located in Burbank, California. In addition, many of our major professional products and production services customers in the motion picture and broadcast industries are located in Burbank and other Southern California locations. All of these locations are in areas of seismic activity near active earthquake faults. Any earthquake, terrorist attack, fire, power shortage or other calamity affecting our facilities or our customers’ facilities may disrupt our business and substantially affect our operations.
Accounting for employee stock options using the fair value method could significantly reduce our net income.
There has been ongoing public debate whether stock options granted to employees should be treated as a compensation expense and, if so, how to properly value such charges. Currently, we account for options using the intrinsic value method, which, given that we have generally granted employee options with exercise prices equal to the fair market value of the underlying stock at the time of grant, results in no compensation expense. If, however, we had used the fair value method of accounting for stock options granted to employees using a Black-Scholes option valuation formula, our net income would have been reduced to $31.9 million, rather than the $34.6 million reported, for the fiscal year ended September 24, 2004. If in the future we elect or are required to record expenses for our stock-based compensation plans using the fair value method, we could have on-going accounting charges significantly greater than those we would have recorded under our current method of accounting for stock options, which could have a material adverse affect on our operating results.
26
Table of Contents
We are exposed to foreign currency and interest rate risks.
We maintain sales, marketing and business operations in foreign countries, most significantly in the United Kingdom, and have exposure to adverse changes in exchange rates associated with operating expenses of our foreign operations. We are also exposed to interest rate risks on our facility debt obligations. We use various strategies to manage these risks. For example, our profit margins and competitive position in foreign markets are affected by the strength of the United States dollar versus the strength of the currencies in those countries where we manufacture and sell our products and services. From time to time we review our foreign currency exposure and evaluate whether we should enter into hedging transactions. Additionally, our investment portfolio is diversified and consists primarily of investment grade securities with maturities less than 90 days in order to minimize credit risk; we also use interest rate swap agreements to hedge our interest rate risks in the event of unexpected increases in interest rates. Nevertheless, we cannot completely hedge the foreign currency and interest rate risks we face. Adverse results with respect to these risks could therefore harm our financial condition and operating results.
Holders of our Class A common stock, which is the stock we are selling in this offering, are entitled to one vote per share, and holders of our Class B common stock are entitled to ten votes per share. The lower voting power of the Class A common stock may negatively affect the attractiveness of our Class A common stock to investors and, as a result, its market value.
Upon consummation of this offering, we will have two classes of common stock: Class A common stock, which is the stock we are selling in this offering and which is entitled to one vote per share, and Class B common stock, which is held primarily by Ray Dolby and persons and entities affiliated with Ray Dolby and which is entitled to ten votes per share. Except in certain limited circumstances required by applicable law, holders of Class A common stock and Class B common stock vote together as a single class on all matters to be voted on by our stockholders. As of September 24, 2004, 86,547,910 shares of Class B common stock are outstanding, and 12,599,820 shares of Class B common stock are issuable upon the exercise of outstanding options. Therefore, assuming the exercise of all outstanding options as of September 24, 2004, after completion of this offering approximately % of the total voting power of our outstanding shares will be held by the Class B common stockholders. Accordingly, our Class B common stockholders constitute, and are expected to continue to constitute, a significant portion of the shares entitled to vote on all matters requiring approval by our stockholders. The difference in the voting power of our Class A common stock and Class B common stock could diminish the market value of our Class A common stock if investors attribute value to the superior voting rights of our Class B common stock and the power those rights confer. There is no threshold or time deadline at which the shares of Class B common stock will automatically convert into shares of Class A common stock.
For the foreseeable future, Ray Dolby or his affiliates will be able to control the selection of all members of our board of directors, as well as virtually every other matter that requires stockholder approval, which will severely limit the ability of other stockholders to influence corporate matters.
Immediately following the completion of this offering, Ray Dolby and persons and entities affiliated with Ray Dolby will own approximately % of our Class B common stock, representing % of the combined voting power of our outstanding Class A and Class B common stock. Under our charter, holders of shares of Class B common stock may generally transfer such shares to family members, including spouses and domestic partners, and descendants without having the shares automatically convert into shares of Class A common stock. Because of this dual class structure, Ray Dolby, his affiliates, and his family members and descendents will, for the foreseeable future, have significant influence over our management and affairs, and will be able to control virtually all matters requiring stockholder approval, including the election of directors and significant corporate transactions such as mergers or other sales of our company or assets, even if they come to own considerably less than 50% of the total number of outstanding shares of our Class A and Class B common stock. Moreover, these persons may take actions in their own interests that you or our other stockholders do not view as beneficial. There is no threshold or time deadline at which the shares of Class B common stock will automatically convert into shares of Class A common stock. Assuming conversion of all shares of Class B common stock held by persons not affiliated with Ray Dolby, so long as Ray Dolby and his affiliates continue to hold shares of Class B
27
Table of Contents
common stock representing approximately 9% or more of the total number of outstanding shares of our Class A and Class B common stock, they will hold a majority of the combined voting power of the Class A and Class B common stock. See “Description of Capital Stock.”
An active, liquid and orderly trading market for our common stock may not develop.
Prior to this offering, there has been no public market for shares of our Class A common stock. We and the representatives of the underwriters will determine the initial public offering price of our Class A common stock through negotiation. This price will not necessarily reflect the price at which investors in the market will be willing to buy and sell our shares following this offering. In addition, the trading price of our Class A common stock following this offering is likely to be highly volatile and could be subject to wide fluctuations in response to various factors, some of which are beyond our control. These factors include:
| · | Quarterly variations in our results of operations or those of our competitors; |
| · | Our ability to develop and market new and enhanced products on a timely basis; |
| · | Announcements by us or our competitors of acquisitions, new products, significant contracts, commercial relationships or capital commitments; |
| · | The emergence of new markets, such as digital cinema, that may affect our existing business or in which we may not be able to compete effectively; |
| · | Whether we are successful in establishing our technologies as part of industry standards in new markets; |
| · | Commencement of, or our involvement in, litigation; |
| · | Changes in governmental regulations or in the status of our regulatory approvals; |
| · | Changes in earnings estimates or recommendations by securities analysts; |
| · | Any major change in our board or management; |
| · | General economic conditions and slow or negative growth of our markets; and |
| · | Political instability, natural disasters, war and/or events of terrorism. |
In addition, the stock market in general, and the market for technology companies in particular, has experienced extreme price and volume fluctuations that have often been unrelated or disproportionate to the operating performance of those companies. Broad market and industry factors may seriously affect the market price of companies’ stock, including ours, regardless of actual operating performance. These fluctuations may be even more pronounced in the trading market for our stock shortly following this offering. In addition, in the past, following periods of volatility in the overall market and the market price of a particular company’s securities, securities class action litigation has often been instituted against these companies. This litigation, if instituted against us, could result in substantial costs and a diversion of our management’s attention and resources.
Provisions in our charter documents and under Delaware law could discourage a takeover that stockholders may consider favorable.
Provisions in our amended and restated certificate of incorporation and amended and restated bylaws, as in effect upon the completion of this offering, may have the effect of delaying or preventing a change of control or changes in our management. These provisions include the following:
| · | Our amended and restated certificate of incorporation provides for a dual class common stock structure. As a result of this structure, Ray Dolby and his affiliates will have control for the foreseeable future over virtually all matters requiring stockholder approval, including the election of directors and significant corporate transactions, such as a merger or other sale of our company or its assets. This concentrated control could discourage others from initiating any potential merger, takeover or other change of control transaction that our other stockholders may view as beneficial. |
28
Table of Contents
| · | Our board of directors has the sole right to elect a director to fill a vacancy created by the expansion of the board of directors or the resignation, death or removal of a director, which prevents stockholders from being able to fill vacancies on our board of directors. |
| · | After such time as the holders of our Class B common stock hold less than a majority of the combined voting power of our outstanding shares of Class A and Class B common stock, our stockholders may not act by written consent. As a result, a holder or holders controlling a majority of the combined voting power of our outstanding shares of Class A and Class B common stock at such time would not be able to take certain actions without the convening of a stockholders’ meeting. |
| · | Our amended and restated certificate of incorporation prohibits cumulative voting in the election of directors. This limits the ability of holders of Class A common stock and minority stockholders to elect director candidates. |
| · | Stockholders must provide advance notice to nominate individuals for election to the board of directors or to propose matters to be acted upon at a stockholders’ meeting. These provisions may discourage or deter a potential acquiror from conducting a solicitation of proxies to elect the acquiror’s own slate of directors or otherwise attempting to obtain control of our company. |
As a Delaware corporation, we are also subject to certain Delaware anti-takeover provisions. Under Delaware law, a corporation may, in general, not engage in a business combination with any holder of 15% or more of its capital stock unless the holder has held the stock for three years or, among other things, the board of directors has approved the transaction.
Purchasers in this offering will experience immediate and substantial dilution in the book value of their investment.
The initial public offering price of our Class A common stock is substantially higher than the net tangible book value per share of our Class A common stock immediately after this offering. Therefore, if you purchase our Class A common stock in this offering, you will incur an immediate dilution of $ in net tangible book value per share from the price you paid, based on an assumed initial public offering price of $ per share. The exercise of outstanding options and warrants will result in further dilution. For a further description of the dilution that you will experience immediately after this offering, see “Dilution.”
Future sales of shares by existing stockholders could cause our stock price to decline.
If our existing stockholders sell, or indicate an intention to sell, substantial amounts of our Class A common stock, including shares of Class A common stock issuable upon conversion of shares of Class B common stock, in the public market after the lock-up and other legal restrictions on resale discussed in this prospectus lapse, the trading price of our Class A common stock could decline. Based on shares outstanding as of September 24, 2004, upon completion of this offering, we will have outstanding a total of shares of Class A and Class B common stock, assuming no exercise of the underwriters’ over-allotment option. Of these shares, only the shares of Class A common stock sold in this offering by us and the selling stockholders will be freely tradable, without restriction, in the public market. Our underwriters, however, may, in their sole discretion, permit our officers, directors and other current stockholders who are subject to the contractual lock-up to sell shares prior to the expiration of the lock-up agreements.
We expect that the lock-up agreements pertaining to this offering will expire 180 days from the date of this prospectus, although those lock-up agreements may be extended for up to an additional 35 days under certain circumstances. After the lock-up agreements expire, up to an additional shares of Class A common stock issuable upon conversion of outstanding shares of our Class B common stock will be eligible for sale in the public market, of which shares of Class B common stock are held by directors, executive officers and other affiliates and will be subject to volume limitations under Rule 144 under the Securities Act and various vesting agreements. In addition, shares of Class A or Class B common stock that are either subject to outstanding options or reserved for future issuance under our employee benefit plans will become eligible for
29
Table of Contents
sale in the public market to the extent permitted by the provisions of various vesting agreements, the lock-up agreements and Rules 144 and 701 under the Securities Act. If these additional shares are sold, or if it is perceived that they will be sold, in the public market, the trading price of our Class A common stock could decline.
30
Table of Contents
SPECIAL NOTE REGARDING FORWARD-LOOKING STATEMENTS AND INDUSTRY DATA
This prospectus includes forward-looking statements. All statements other than statements of historical facts contained in this prospectus, including statements regarding our future results of operations and financial position, business strategy and plans and objectives of management for future operations, are forward-looking statements. The words “believe,” “may,” “will,” “estimate,” “continue,” “anticipate,” “intend,” “expect” and similar expressions are intended to identify forward-looking statements. We have based these forward-looking statements largely on our current expectations and projections about future events and financial trends that we believe may affect our financial condition, results of operations, business strategy, short term and long term business operations and objectives, and financial needs. These forward-looking statements are subject to a number of risks, uncertainties and assumptions, including those described in “Risk Factors.” In light of these risks, uncertainties and assumptions, the forward-looking events and circumstances discussed in this prospectus may not occur and actual results could differ materially and adversely from those anticipated or implied in the forward-looking statements.
This prospectus contains statistical data regarding the consumer electronics product industry that we obtained from industry reports generated by Arbitron, the Consumer Electronics Association and International Data Corporation. These reports generally indicate that their information has been obtained from sources believed to be reliable, but do not guarantee the accuracy and completeness of their information. Although we believe that the reports are reliable, we have not independently verified their data.
31
Table of Contents
We estimate that we will receive net proceeds of $ from our sale of the shares of Class A common stock offered by us in this offering, based upon an assumed initial public offering price of $ per share, after deducting estimated underwriting discounts and commissions and estimated offering expenses payable by us. We will not receive any of the net proceeds from the sale of the shares by the selling stockholders.
The principal purposes of this offering are to create a public market for our Class A common stock, to facilitate our future access to the public equity markets and to obtain additional capital. We currently have no specific plans for the use of the net proceeds of this offering. We anticipate that we will use the net proceeds received by us from this offering for general corporate purposes, including working capital. In addition, we may use a portion of the proceeds of this offering for acquisitions of complementary businesses, technologies or other assets. We have no current agreements or commitments with respect to any material acquisitions. Pending such uses, we plan to invest the net proceeds in highly liquid, investment grade securities.
We have never declared or paid any cash dividend on our capital stock. We currently intend to retain any future earnings and do not expect to pay any dividends in the foreseeable future. However, if we are deemed to be a personal holding company for tax purposes, we may elect to pay a dividend to our stockholders in an amount equal to all or a significant part of our undistributed personal holding company income (which could be significant), rather than paying personal holding company tax on such undistributed personal holding company income, if any. See “Risk Factors—We may become subject to a personal holding company tax, which could materially and adversely affect our operating results and financial condition.”
32
Table of Contents
The following table sets forth our cash and cash equivalents and our capitalization as of September 24, 2004, as follows:
| · | On an actual basis; |
| · | On an as adjusted basis to give effect to the issuance by us of shares of Class A common stock in this offering and the receipt of the net proceeds from our sale of these shares at an assumed initial public offering price of $ per share, after deducting estimated underwriting discounts and commissions and estimated offering expenses payable by us. |
You should read this table together with the sections of this prospectus entitled “Selected Consolidated Financial Data” and “Management’s Discussion and Analysis of Financial Condition and Results of Operations” and our audited and pro forma consolidated financial statements and the related notes included elsewhere in this prospectus.
| As of September 24, 2004 | |||||||
| Actual | As Adjusted | ||||||
| (in thousands, except share data) | |||||||
Cash and cash equivalents | $ | 78,711 | $ | ||||
Total debt | $ | 14,870 | $ | ||||
Stockholders’ equity: | |||||||
Class A common stock, $0.001 par value, one vote per share, 500,000,000 shares authorized: no shares issued and outstanding, actual; shares issued and outstanding, as adjusted. | — | ||||||
Class B common stock, $0.001 par value, ten votes per share, 500,000,000 shares authorized: 86,547,910 shares issued and outstanding, actual; shares issued and outstanding, as adjusted | 87 | ||||||
Additional paid-in capital | 73,942 | ||||||
Deferred stock-based compensation | (51,594 | ) | |||||
Retained earnings | 119,860 | ||||||
Accumulated other comprehensive income | 3,079 | ||||||
Total stockholders’ equity | 145,374 | ||||||
Total capitalization | $ | 160,244 | $ | ||||
The table above excludes the following shares:
| · | 12,599,820 shares of Class B common stock issuable upon the exercise of options outstanding at September 24, 2004, at a weighted average exercise price of $1.61 per share; |
| · | 780,750 shares of Class B common stock issuable upon the exercise of options granted after September 24, 2004, at an exercise price of $6.28 per share; and |
| · | 6,000,000 shares of Class A common stock available for future issuance under our 2005 Stock Plan. |
33
Table of Contents
If you invest in our Class A common stock, your interest will be diluted to the extent of the difference between the initial public offering price per share of our Class A common stock and the as adjusted net tangible book value per share of our Class A and Class B common stock immediately after this offering. Net tangible book value per share represents the amount of our total tangible assets less total liabilities, divided by the number of shares of Class A and Class B common stock outstanding at September 24, 2004.
Our net tangible book value was $116.6 million, computed as total stockholders’ equity less goodwill and other intangible assets, or $1.35 per share of Class A and Class B common stock outstanding, at September 24, 2004. Assuming the sale by us of shares of Class A common stock offered in this offering at an initial public offering price of $ per share, and after deducting estimated underwriting discounts and commissions and estimated offering expenses payable by us, our as adjusted net tangible book value at September 24, 2004 would have been $ million, or $ per share of common stock. This represents an immediate increase in net tangible book value of $ per share to our existing stockholders and an immediate dilution of $ per share to the new investors purchasing shares in this offering. The following table illustrates this per share dilution:
Assumed initial public offering price per share of Class A common stock | $ | |||||
Net tangible book value per share of Class A and Class B common stock at September 24, 2004 | $ | |||||
Increase in net tangible book value per share attributable to this offering | ||||||
As adjusted net tangible book value per share after the offering | ||||||
Dilution per share to new investors | $ | |||||
The following table sets forth on an as adjusted basis, as of September 24, 2004, the number of shares of common stock purchased or to be purchased from us, the total consideration paid or to be paid and the average price per share paid or to be paid by existing holders of common stock and by the new investors, before deducting estimated underwriting discounts and estimated offering expenses payable by us.
| Shares Purchased | Total Consideration | Average Price Per Share | ||||||||||
| Number | Percent | Amount | Percent | |||||||||
Existing stockholders | % | $ | % | $ | ||||||||
New investors | ||||||||||||
Total | % | $ | % | |||||||||
The discussion and tables above are based on the number of shares of Class B common stock outstanding at September 24, 2004. The discussion and tables above exclude the following shares:
| · | 12,599,820 shares of Class B common stock issuable upon the exercise of options outstanding at September 24, 2004, at a weighted average exercise price of $1.61 per share; |
| · | 780,750 shares of Class B common stock issuable upon the exercise of options granted after September 24, 2004, at an exercise price of $6.28 per share; and |
| · | 6,000,000 shares of Class A common stock available for future issuance under our 2005 Stock Plan. |
To the extent outstanding options are exercised, new investors will experience further dilution.
34
Table of Contents
SELECTED CONSOLIDATED FINANCIAL DATA
The following selected consolidated financial data should be read in conjunction with “Management’s Discussion and Analysis of Financial Condition and Results of Operations” and our audited consolidated financial statements and the accompanying notes included elsewhere in this prospectus. The consolidated statements of operations data for the fiscal years ended September 27, 2002, September 26, 2003 and September 24, 2004 and balance sheet data as of such dates were derived from our audited consolidated financial statements that are included elsewhere in this prospectus. The consolidated statements of operations for the fiscal years ended September 29, 2000 and September 28, 2001 and balance sheet data as of such dates were derived from our unaudited consolidated financial statements. The unaudited consolidated financial statements were prepared on a basis consistent with our audited consolidated financial statements contained in this prospectus and include, in the opinion of management, all adjustments necessary for the fair presentation of the financial information contained in those statements. The historical results presented below are not necessarily indicative of financial results to be achieved in future periods.
| Fiscal Year Ended | ||||||||||||||||||||
| September 29, 2000 | September 28, 2001 | September 27, 2002 | September 26, 2003 | September 24, 2004 | ||||||||||||||||
| (unaudited) | (unaudited) | |||||||||||||||||||
| (in thousands, except per share data) | ||||||||||||||||||||
Consolidated Statements of Operations Data: | ||||||||||||||||||||
Revenue: | ||||||||||||||||||||
Licensing | $ | 49,489 | $ | 73,277 | $ | 106,640 | $ | 157,922 | $ | 211,395 | ||||||||||
Product sales | 50,538 | 39,300 | 41,377 | 44,403 | 57,981 | |||||||||||||||
Production services | 11,088 | 12,076 | 13,851 | 15,147 | 19,665 | |||||||||||||||
Total revenue | 111,115 | 124,653 | 161,868 | 217,472 | 289,041 | |||||||||||||||
Cost of revenue: | ||||||||||||||||||||
Cost of licensing | 10,520 | 19,644 | 25,063 | 40,001 | 53,838 | |||||||||||||||
Cost of product sales (includes $0.2 million in stock-based compensation for fiscal 2004) (1) | 30,219 | 25,754 | 26,694 | 26,684 | 30,096 | |||||||||||||||
Cost of production services (includes $0.1 million in stock-based compensation for fiscal 2004) (1) | 4,604 | 5,044 | 5,960 | 6,958 | 7,643 | |||||||||||||||
Total cost of revenue | 45,343 | 50,442 | 57,717 | 73,643 | 91,577 | |||||||||||||||
Gross margin | 65,772 | 74,211 | 104,151 | 143,829 | 197,464 | |||||||||||||||
Operating expenses: | ||||||||||||||||||||
Selling, general and administrative (includes $12.7 million in stock-based compensation for fiscal 2004) (1) | 44,714 | 48,244 | 64,269 | 76,590 | 113,477 | |||||||||||||||
Research and development (includes $1.2 million in stock-based compensation for fiscal 2004) (1) | 16,744 | 16,106 | 15,128 | 18,262 | 23,884 | |||||||||||||||
Settlements | — | — | 24,205 | — | (2,000 | ) | ||||||||||||||
In-process research and development | — | — | — | 1,310 | 1,738 | |||||||||||||||
Total operating expenses | 61,458 | 64,350 | 103,602 | 96,162 | 137,099 | |||||||||||||||
Operating income | 4,314 | 9,861 | 549 | 47,667 | 60,365 | |||||||||||||||
Other income (expenses), net | (356 | ) | (3,369 | ) | (747 | ) | (57 | ) | 229 | |||||||||||
Income (loss) before provision for income taxes and controlling interest | 3,958 | 6,492 | (198 | ) | 47,610 | 60,594 | ||||||||||||||
Provision for income taxes | 621 | 1,230 | 11 | 16,079 | 25,039 | |||||||||||||||
Income (loss) before controlling interest | 3,337 | 5,262 | (209 | ) | 31,531 | 35,555 | ||||||||||||||
Controlling interest in net (income) loss | (371 | ) | 389 | 104 | (562 | ) | (929 | ) | ||||||||||||
Net income (loss) | $ | 2,966 | $ | 5,651 | $ | (105 | ) | $ | 30,969 | $ | 34,626 | |||||||||
Basic net income (loss) per common share | $ | 0.03 | $ | 0.07 | $ | 0.00 | $ | 0.36 | $ | 0.40 | ||||||||||
Diluted net income (loss) per common share | $ | 0.03 | $ | 0.07 | $ | 0.00 | $ | 0.36 | $ | 0.36 | ||||||||||
Shares used in the calculation of basic net income (loss) per share | 85,000 | 85,000 | 85,008 | 85,009 | 85,556 | |||||||||||||||
Shares used in the calculation of diluted net income (loss) per share | 85,000 | 85,000 | 85,008 | 85,983 | 96,525 | |||||||||||||||
(1) Stock-based compensation recorded in fiscal 2004 was classified as follows: |
| |||||||||||||||||||
Cost of product sales | $ | 157 | ||||||||||||||||||
Cost of production services | 55 | |||||||||||||||||||
Selling, general and administrative | 12,711 | |||||||||||||||||||
Research and development | 1,215 | |||||||||||||||||||
Total stock-based compensation | $ | 14,138 | ||||||||||||||||||
35
Table of Contents
| Fiscal Year Ended | |||||||||||||||
| September 29, 2000 | September 28, 2001 | September 27, 2002 | September 26, 2003 | September 24, 2004 | |||||||||||
| (unaudited) | (unaudited) | ||||||||||||||
| (in thousands) | |||||||||||||||
Summary Consolidated Balance Sheet Data: | |||||||||||||||
Cash and cash equivalents | $ | 13,675 | $ | 22,602 | $ | 37,394 | $ | 61,922 | $ | 78,711 | |||||
Working capital | 17,918 | 23,484 | 35,854 | 54,213 | 82,450 | ||||||||||
Total assets | 115,030 | 125,635 | 157,313 | 202,707 | 261,897 | ||||||||||
Total debt | 21,461 | 19,510 | 16,775 | 15,598 | 14,870 | ||||||||||
Total stockholders’ equity | 54,508 | 60,645 | 61,742 | 93,775 | 145,374 | ||||||||||
36
Table of Contents
PRO FORMA UNAUDITED CONSOLIDATED STATEMENTS OF OPERATIONS DATA
The following selected pro forma unaudited consolidated statements of operations data give effect to the asset contribution to be made by Ray Dolby, which will occur prior to this offering, as well as the effects of a previous change in certain licensing arrangements with Ray Dolby in June 2002, as though such transactions had been completed prior to the beginning of fiscal 2002. Ray Dolby has licensed certain intellectual property rights to us in exchange for royalty payments. All of our licensing arrangements with, and royalty obligations to, Ray Dolby will terminate at the time the asset contribution is completed. See “Management’s Discussion and Analysis of Financial Condition and Results of Operations—Pro Forma Presentation.” The selected pro forma unaudited consolidated statements of operations data should be read together with “Management’s Discussion and Analysis of Financial Condition and Results of Operations” and our audited consolidated financial statements and the related notes included elsewhere in this prospectus. There will be no material change to our balance sheet as a result of the asset contribution. The pro forma results presented below are not necessarily indicative of financial results to be achieved in future periods.
| Pro Forma | ||||||||||||
| Fiscal Year Ended | ||||||||||||
| September 27, 2002 | September 26, 2003 | September 24, 2004 | ||||||||||
| (in thousands, except per share data) | ||||||||||||
Consolidated Statements of Operations Data: | ||||||||||||
Revenue: | ||||||||||||
Licensing | $ | 113,361 | $ | 157,922 | $ | 211,395 | ||||||
Product sales | 41,377 | 44,403 | 57,981 | |||||||||
Production services | 13,851 | 15,147 | 19,665 | |||||||||
Total revenue | 168,589 | 217,472 | 289,041 | |||||||||
Cost of revenue: | ||||||||||||
Cost of licensing | 8,685 | 14,875 | 20,070 | |||||||||
Cost of product sales (includes $0.2 million in stock-based compensation for fiscal 2004) (1) | 24,281 | 24,190 | 27,007 | |||||||||
Cost of production services (includes $0.1 million in stock-based compensation for fiscal 2004) (1) | 5,960 | 6,958 | 7,643 | |||||||||
Total cost of revenue | 38,926 | 46,023 | 54,720 | |||||||||
Gross margin | 129,663 | 171,449 | 234,321 | |||||||||
Operating expenses: | ||||||||||||
Selling, general and administrative (includes $12.7 million in stock-based compensation for fiscal 2004) (1) | 70,297 | 76,590 | 113,477 | |||||||||
Research and development (includes $1.2 million in stock-based compensation for fiscal 2004) (1) | 15,128 | 18,262 | 23,884 | |||||||||
Settlements | 24,205 | — | (2,000 | ) | ||||||||
In-process research and development | — | 1,310 | 1,738 | |||||||||
Total operating expenses | 109,630 | 96,162 | 137,099 | |||||||||
Operating income | 20,033 | 75,287 | 97,222 | |||||||||
Other income (expenses), net | (747 | ) | (57 | ) | 229 | |||||||
Income before provision for income taxes and controlling interest | 19,286 | 75,230 | 97,451 | |||||||||
Provision for income taxes | 7,884 | 26,714 | 39,267 | |||||||||
Income before controlling interest | 11,402 | 48,516 | 58,184 | |||||||||
Controlling interest in net (income) loss | 104 | (562 | ) | (929 | ) | |||||||
Net income | $ | 11,506 | $ | 47,954 | $ | 57,255 | ||||||
Basic net income per common share | $ | 0.14 | $ | 0.56 | $ | 0.67 | ||||||
Diluted net income per common share | $ | 0.14 | $ | 0.56 | $ | 0.59 | ||||||
Shares used in the calculation of basic net income per share | 85,008 | 85,009 | 85,556 | |||||||||
Shares used in the calculation of diluted net income per share | 85,010 | 85,983 | 96,525 | |||||||||
(1) Stock-based compensation recorded in fiscal 2004 was classified as follows: | ||||||||||||
Cost of product sales | $ | 157 | ||||||||||
Cost of production services | 55 | |||||||||||
Selling, general and administrative | 12,711 | |||||||||||
Research and development | 1,215 | |||||||||||
Total stock-based compensation | $ | 14,138 | ||||||||||
37
Table of Contents
MANAGEMENT’S DISCUSSION AND ANALYSIS
OF FINANCIAL CONDITION AND RESULTS OF OPERATIONS
The following discussion and analysis should be read in conjunction with our audited consolidated financial statements and the related notes that appear elsewhere in this prospectus. This discussion contains forward-looking statements reflecting our current expectations that involve risks and uncertainties. Actual results may differ materially from those discussed in these forward-looking statements due to a number of factors, including those set forth in the section entitled “Risk Factors” and elsewhere in this prospectus. Our fiscal year is a 52- or 53-week period ending on the last Friday in September. The fiscal years presented herein include the 52-week periods ended September 27, 2002, September 26, 2003 and September 24, 2004.
Overview
Dolby Laboratories develops and delivers innovative products and technologies that enrich the entertainment experience in theatres, homes, cars and elsewhere. Ray Dolby founded Dolby Laboratories in 1965 to develop noise reduction technologies. Today, we deliver a broad range of sound technologies for use in both professional and consumer applications. In addition, in recent years we have expanded our focus to include other technologies that facilitate the delivery of digital entertainment.
We conduct our business in two segments: our products and services segment and our technology licensing segment.
In our products and services segment, we sell professional products and related production services to filmmakers, broadcasters, music producers, video game designers, cinema operators and DVD producers. These products are used in sound recording, distribution and playback to improve sound quality, provide surround sound and increase the efficiency of sound storage and distribution. Our production services engineers work alongside artists and content producers throughout the world to help them record and reproduce the high quality sound they envision. Our engineers also work with cinema operators to help ensure that movie soundtracks are replayed with consistent high quality sound in their theatres.
In our technology licensing segment, we work with manufacturers of integrated circuits, or ICs, to help them incorporate our technologies into their ICs. These manufacturers then sell ICs to consumer electronics product manufacturers that license our technologies for incorporation in products such as DVD players, DVD recorders, audio/video receivers, television sets, set-top boxes, video game consoles, portable audio and video players, personal computers and in-car entertainment systems. We also license our technologies to software developers who implement our technologies for use in personal computer software DVD players. Our licensing arrangements typically entitle us to receive a royalty for every product that incorporates our technology shipped by our manufacturer and software developer licensees. We do not receive royalties from IC manufacturers.
We are a global organization. We sell our professional products and production services in over 50 countries. In fiscal 2002, 2003 and 2004, revenue from sales outside the United States represented 64%, 60% and 59% of our professional products sales and production services revenue, respectively. We have licensed our technologies to manufacturers of consumer electronics products in nearly 30 countries, including countries in North America, Europe and Asia. In fiscal 2002, 2003 and 2004, revenue from licensees outside the United States represented 76%, 80% and 80% of our licensing revenue, respectively. Our licensees distribute consumer electronics products incorporating our technologies throughout the world. Nearly all of our revenue is derived from transactions denominated in United States dollars.
Pro Forma Presentation
Throughout our history, Ray Dolby has retained ownership of the intellectual property rights he created relating to our business. We have licensed these intellectual property rights from him and paid him royalties in return. Prior to June 2002, we also administered the licensing of certain intellectual property rights for Ray Dolby, remitting to him the revenue derived from licensing these rights, net of the related administrative
38
Table of Contents
costs we incurred. As a result, prior to June 2002 these revenues were not recorded in our consolidated financial statements and Ray Dolby’s reimbursement to us of the administrative costs was reported as a reduction in selling, general and administrative expense in our consolidated statements of operations. In June 2002, we terminated this licensing administration arrangement and amended our licensing agreements with Ray Dolby to license from him the intellectual property rights we had previously administered on his behalf. In exchange, we agreed to pay him royalties in an amount that was intended to approximate the net revenue he would have received under our prior licensing administration arrangement.
Prior to the completion of this offering, Ray Dolby will contribute all intellectual property rights he holds related to our business so that Dolby Laboratories will have full ownership rights in this intellectual property once we are a public company. Upon completion of this asset contribution, all of our licensing arrangements with, and royalty obligations to, Ray Dolby will terminate.
The pro forma unaudited consolidated statements of operations and other pro forma data contained in this prospectus were prepared on the basis that both the June 2002 amendment to our licensing agreements with Ray Dolby and his asset contribution occurred prior to the beginning of fiscal 2002. The results of giving effect to the June 2002 amendment as though that amendment had occurred prior to the beginning of fiscal 2002 are a $6.7 million increase in our pro forma licensing revenue, representing the payment to us rather than to Ray Dolby of the royalties described above, and a $6.0 million increase in our selling, general and administrative expense in fiscal 2002, reflecting the absence of the reimbursement of administrative costs by Ray Dolby described above, in each case as compared to our actual results. In the absence of the asset contribution, the pro forma effect of the June 2002 amendment would also have resulted in an increase in our cost of licensing, representing the royalties we would have paid Ray Dolby under the amended licensing agreements. This increase, however, is not reflected in the pro forma unaudited consolidated statement of operations for fiscal 2002 because the pro forma effect of the asset contribution extinguishes all royalty payments to Ray Dolby.
The results of giving effect to the asset contribution as though that transaction had occurred prior to the beginning of fiscal 2002 was to adjust our pro forma consolidated results of operations to reverse the effects of $18.8 million, $27.6 million and $36.9 million in royalties payable to Ray Dolby that we recorded in fiscal 2002, 2003 and 2004, respectively. There will be no material change to our balance sheet as a result of the asset contribution.
Management Discussion Regarding Opportunities, Challenges and Risks
Our Technology Licensing Segment
Revenue from our technology licensing segment constitutes the majority of our total revenue, representing 66%, 73% and 73% of total revenue in fiscal 2002, 2003 and 2004, respectively. Our licensing revenue has grown from $49.5 million in fiscal 2000 to $211.4 million in fiscal 2004, principally as a result of the increase in sales of DVD players and in-home theatre systems that incorporate our surround sound technologies. Our licensing revenue is primarily dependent upon our licensees’ sales of DVD players, audio/video receivers and home theatre systems. We anticipate that the DVD player, recordable DVD player and home theatre system markets will continue to grow in fiscal 2005 and 2006. However, we do not expect our licensing revenue growth rates attributable to DVD player sales to remain as high as they have been in recent years, as the markets for DVD players mature. Because our technology is so widely adopted in DVD players, audio/video receivers and other home theatre consumer electronics products, our licensing revenue is subject to fluctuations based on consumer demand for these products. We are continuing to actively promote the incorporation of our surround sound technologies for use in other consumer products such as video game consoles, personal audio and video players, personal computers and in-car entertainment systems.
We license our sound technologies to consumer electronics product manufacturers throughout the world. Under our revenue recognition policy, we generally book licensing revenue upon receipt of our licensees’ royalty statements. As a result, our recognition of licensing revenue is dependent upon our receipt of royalty reports from our licensees, and our operating results can fluctuate based on the timing of our receipt of those reports. Moreover, our licensees are required to report to us within 30 to 60 days following the end of the quarter in
39
Table of Contents
which they ship the product incorporating our technologies, resulting in a time lag between when our licensees ship their products and when they report those shipments to us. Sometimes this time lag can be significant. In the past we have experienced lags of greater than one year. In addition, it is not uncommon for royalty reports to include corrective or retroactive royalties that cover extended periods of time. Also, there have been times in the past when we have recognized an unusually large amount of licensing revenue from a licensee in a given quarter because not all of our revenue recognition criteria were met in prior periods. This can result in a large amount of licensing revenue from a licensee being recorded in a given quarter that is not necessarily indicative of the amounts of licensing revenue to be received from that licensee in future quarters, thus causing fluctuations in our operating results.
We expect that sales of consumer electronics products incorporating our technologies in China and India will increase in the future, as consumers in these markets have more disposable income and are increasingly purchasing entertainment products with surround sound capabilities for use in homes, cars and elsewhere, although there can be no assurance that this will in fact occur. The percentage of our revenue derived from licenses to consumer electronics product manufacturers located in China has increased from 11% in fiscal 2002 to 16% in fiscal 2004. We expect that the percentage of our licensing revenue from Chinese consumer electronics product manufacturers will increase in fiscal 2005 as a result of the increased percentage of consumer electronics products being produced in China due to the lower manufacturing cost structure there as compared to other industrial countries. Doing business in China involves unique risks that have and will continue to affect our operating results. For example, we have experienced problems in the past with Chinese consumer electronics product manufacturers failing to report or underreporting shipments of their products that incorporate our technologies, and we expect to continue to experience such problems in the future. In addition, we may experience similar problems in other countries where intellectual property rights are not as respected as they are in the United States, Europe and Japan. We actively attempt to enforce our intellectual property rights and also focus on strengthening existing relationships and developing new ones with entertainment industry participants in these countries to increase our ability to enforce our intellectual property and contractual rights without relying solely on the legal systems in such countries. We do not recognize revenue until royalties are reported and are deemed collectible. See “Critical Accounting Policies—Revenue Recognition.”
We must continue to develop and deliver enduring, innovative entertainment technologies for use in consumer electronics products. As technologies for DVD players and other consumer electronics products with surround sound capabilities evolve, we must continue to design and deliver sound technologies that are sought by manufacturers and consumers alike. In addition, the widespread adoption of alternative formats to DVDs, or our inability to develop sound technology for these new formats successfully, could adversely affect our licensing revenue. We must also continue to strive to have our entertainment technologies adopted either as explicit or de facto industry standards for use in consumer electronics products. Increasingly, standards-setting organizations are adopting or establishing technology standards for use in a wide range of consumer electronics products. As a result, it is more difficult for individual companies to have their technologies adopted wholesale as an informal industry standard. We call this type of standard a “de facto” industry standard, meaning that the standard is not explicitly mandated by any industry standards-setting body but is nonetheless widely adopted. In addition, increasingly there are a large number of companies, including ones that typically compete against one another, involved in the development of new technologies for use in consumer entertainment products. As a result, these companies often end up licensing their collective intellectual property rights as a group, making it more difficult for any single company to have its technologies adopted widely as a de facto industry standard or to have its technologies adopted as an exclusive, explicit industry standard for consumer electronic products. Generally, in order for a technology to be chosen as an industry standard, the royalty rates that can be charged for that technology will be limited, either explicitly or implicitly, because industry standards will be adopted only if they are not excessively costly as compared to other potential alternatives. As a result, the royalty rates we can charge for our technologies that have been adopted as industry standards or that are adopted as industry standards in the future will likely be lower than the royalty rates received for technologies not adopted as industry standards, and our ability to raise these rates will likewise be limited. However, having technologies adopted as explicit industry standards may help increase the volume of products sold that incorporate these technologies. Furthermore, as we continue to expand our focus to include entertainment technologies that are not solely related to sound, such as
40
Table of Contents
technologies that process digital moving images and that protect content from piracy, we will be competing with many companies with longer experience and greater expertise in these areas, and there is a risk that we will not be able to develop technology innovations that are widely adopted in these markets.
Our Products and Services Segment
Revenue from our products and services segment represented 34%, 27% and 27% of total revenue in fiscal 2002, 2003 and 2004, respectively. We remain committed to developing technologies for use by professionals in the entertainment industry. We believe that filmmakers, broadcasters, music producers and video game designers will continue to push for technology solutions to help create, distribute and play back rich, high quality sounds and images. As a result, we believe that major advances in sound, imaging and other technologies for the recording, delivery and playback of entertainment will likely first be introduced in products designed for use by professionals.
Sales of our professional products and production services tend to fluctuate based on the underlying trends in the motion picture industry. In part, this is because our products have been so widely adopted in this industry. When box office receipts for the motion picture industry increase, we have typically seen sales of our professional products increase as well, as cinema owners are more likely to build new theatres and upgrade existing theatres with our more advanced cinema products when they are doing well financially. Our professional product sales are also subject to fluctuations based on events and conditions in the theatre industry generally that may or may not be tied to box office receipts in particular periods. For example, in the late 1990s cinema operators in the United States built a large number of new cinema megaplexes. This initially resulted in increased sales of our cinema processors, but also resulted in an oversupply of screens in some markets. This oversupply led to significant declines in new theatre construction in the United States in the early 2000s, resulting in a corresponding decline in sales of our cinema processors. Our production services revenue, both in the United States and internationally, is also tied to the strength of the motion picture production industry and, in particular, to the number of films being made by studios and independent filmmakers. The number of films that are produced can be affected by a number of factors, including strikes and work-stoppages within the motion picture industry as well as by the tax incentive arrangements that many foreign governments provide filmmakers to promote local filmmaking.
We are committed to helping the motion picture industry develop system solutions for digital cinema; this is our major initiative in our products and services segment. We believe that our experience and expertise developing and delivering technology solutions for both the motion picture and broadcast industries position us well to deliver technologies for digital cinema. Digital cinema offers the motion picture industry possible means to achieve substantial cost savings in printing and distributing movies, to combat piracy, and to enable movies to be played repeatedly without degradation in image quality. It also provides additional revenue opportunities for cinema operators, as concerts and sporting events already in digital format could be broadcast live via satellite to digitally equipped theatres. However, digital cinema may require a significant investment per screen by cinema operators. If the market for digital cinema develops more slowly than we anticipate, or if our technologies, products and services for this market are not widely adopted, our significant investment in developing digital cinema technology may not yield the returns we anticipate. In addition, if a large number of cinema owners decide to convert their theatres to digital cinema over a relatively short period of time and our products are selected for these conversions, we may see an initial increase in professional product sales that will not likely be sustained over time.
In recent years, our products and services segment has grown more slowly than our technology licensing segment. From fiscal 2002 to fiscal 2004, our annual revenue from professional product sales and production services grew at a compound annual growth rate of 19%, compared to a compound annual growth rate of 41% for our licensing revenue over that period. In addition, the profit margin for our products and services segment has been lower than our technology licensing segment. Our gross margin for our products and services segment was 41%, 44% and 51% in fiscal 2002, 2003 and 2004, respectively, compared to a gross margin of 76%, 75% and 75% for our technology licensing segment in those periods. On a pro forma basis, our gross margin for our products and services segment was 45%, 48% and 55% in fiscal 2002, 2003 and 2004, respectively, compared to a gross margin of 92%, 91% and 91% for our technology licensing segment in those periods.
41
Table of Contents
Transition to Being a Public Company
Since Ray Dolby founded Dolby Laboratories in 1965, we have been a privately held company and Ray Dolby has owned nearly all of our outstanding capital stock. As a privately held company with a highly concentrated ownership base, we have always run Dolby Laboratories with a view to the long term, consistent with the goals of our founder. We intend to keep our focus on long-term results.
We believe that a critical contributor to our success has been our corporate culture, which we believe fosters innovation, teamwork and a focus both on developing and strengthening long-term relationships with entertainment industry participants and on developing practical, enduring technology solutions for the entertainment industry. As we grow and change in response to the requirements of being a public company, we may find it difficult to maintain important aspects of our corporate culture, which could negatively affect our future success. We intend to continue to focus on developing technologies for entertainment industries that provide long-term benefits.
Our management team will also have to adapt to the requirements of being a public company, as none of our senior executive officers has significant experience in the public company environment. In addition, as part of our transition to being a public company, we expect our general and administrative expenses to increase, as we respond to the requirements of being a public company, including increased expenses associated with comprehensively documenting and analyzing our system of internal controls and maintaining our disclosure controls and procedures as a result of the requirements of the Sarbanes-Oxley Act. Furthermore, we are converting all of our systems to a new enterprise resource planning platform over a three-year period, and we expect to incur increased general and administrative expenses during this transition.
Critical Accounting Policies
The discussion and analysis of our financial condition and results of operations are based on our consolidated financial statements, which have been prepared in accordance with accounting principles generally accepted in the United States of America, or U.S. GAAP. The preparation of these financial statements in accordance with U.S. GAAP requires us to utilize accounting policies and make certain estimates and assumptions that affect the reported amounts of assets and liabilities, the disclosure of contingencies as of the date of the financial statements and the reported amounts of revenue and expenses during a fiscal period. The SEC considers an accounting policy to be critical if it is important to a company’s financial condition and results of operations, and if it requires significant judgment and estimates on the part of management in its application. We have discussed the selection and development of the critical accounting policies with the audit committee of our board of directors, and the audit committee has reviewed our related disclosures in this prospectus. Although we believe that our judgments and estimates are appropriate and correct, actual results may differ from those estimates.
We believe the following to be our critical accounting policies because they are both important to the portrayal of our financial condition and results of operations and they require critical management judgments and estimates about matters that are uncertain. If actual results or events differ materially from those contemplated by us in making these estimates, our reported financial condition and results of operation for future periods could be materially affected. See “Risk Factors” for certain matters bearing risks on our future results of operations.
Revenue Recognition
We evaluate revenue recognition for transactions to sell products and services and to license technology, trademarks and know-how using the criteria set forth by the SEC in Staff Accounting Bulletin 104, “Revenue Recognition,” or SAB 104. SAB 104 states that revenue is recognized when each of the following criteria are met: persuasive evidence of an arrangement exists, delivery has occurred or services have been rendered, the seller’s price to the buyer is fixed and determinable, and collectibility is reasonably assured.
Licensing. Our licensing revenue is primarily derived from royalties paid to us by licensees of our intellectual property rights, including patents, trademarks and know-how.Royalties are recorded at their gross
42
Table of Contents
amounts, prior to the deduction of foreign withholding taxes. We make judgments as to whether collectibility can be reasonably assured based on the licensee’s recent payment history or the existence of a standby letter-of-credit between the licensee’s financial institution and our financial institution. In the absence of a favorable collection history or a letter-of-credit, we recognize revenue upon receipt of cash, provided that all other revenue recognition criteria have been met.
Product Sales and Production Services. Our revenue from the sale of products is recognized when the risk of ownership has transferred to our customer as provided under the terms of the governing purchase agreement, typically the invoice we deliver to the customer, and all the other revenue recognition criteria have been met. Generally, these purchase agreements provide that the risk of ownership is transferred to the customer when the product is shipped. Production services revenue is recognized as the services related to a given project are performed and all the other revenue recognition criteria have been met.
Allowance for Doubtful Accounts
We continually monitor customer payments and maintain a reserve for estimated losses resulting from our customers’ inability to make required payments. In determining the reserve, we evaluate the collectibility of our accounts receivable based upon a variety of factors. In cases where we are aware of circumstances that may impair a specific customer’s ability to meet its financial obligations, we record a specific allowance against amounts due, and thereby reduce the net recognized receivable to the amount reasonably believed to be collectible. For all other customers, we recognize allowances for doubtful accounts based on our actual historical write-off experience in conjunction with the length of time the receivables are past due, customer creditworthiness, geographic risk and the current business environment. Actual future losses from uncollectible accounts may differ from our estimates and may have a material effect on our consolidated statements of operations and our financial condition. Our allowance for doubtful accounts totaled $2.1 million at September 24, 2004. An incremental change of 1% in our allowance for doubtful accounts as a percentage of accounts receivable would have a $0.2 million increase or decrease in our operating results.
Goodwill
In September 2002, we adopted Statement of Financial Accounting Standards No. 142, “Goodwill and Other Intangible Assets,” or SFAS 142, which, among other things, establishes new standards for goodwill acquired in a business combination, eliminates the amortization of goodwill and requires the carrying value of goodwill and certain non-amortizing intangibles to be evaluated for impairment on an annual basis. As required by SFAS 142, we perform an impairment test on recorded goodwill by comparing the estimated fair value of each of our reporting units to the carrying value of the assets and liabilities of each unit, including goodwill. We determine the fair value of the reporting units principally based upon the valuation analysis of Dolby Laboratories as a whole. This analysis is prepared by an independent third party each year and in consideration of a number of other factors, including our historical and projected financial results, risks facing us and the liquidity of our common stock. If the carrying value of the assets and liabilities, including goodwill, exceeded our estimation of the fair value of the reporting units, we would record an impairment charge in an amount equal to the excess of the carrying value of goodwill over its estimated fair value. Our fiscal 2004 impairment test of goodwill, which was performed in the third fiscal quarter, resulted in no impairment charge. Fluctuations in our fair value, which may result from changes in economic conditions, our results of operations and other factors, relative to the carrying value, could result in impairment charges in future periods. As of the last test for impairment, our estimated fair value would need to have decreased by approximately 65% in order for goodwill impairment to have been recognized.
Accounting for Income Taxes
In preparing our consolidated financial statements, we are required to make estimates and judgments that affect our accounting for income taxes. This process includes estimating actual current tax exposure together with assessing temporary differences resulting from differing treatment of items for tax and accounting purposes.
43
Table of Contents
These differences result in deferred tax assets and liabilities, which are included in our consolidated balance sheets. We also assess the likelihood that our deferred tax assets will be recovered from future taxable income and, to the extent that we believe that recovery is not likely, we have established a valuation allowance.
Significant judgment is required in determining the provision for income taxes, personal holding company tax, deferred tax assets and liabilities and any valuation allowance against our deferred tax assets. Our financial position and results of operations may be materially impacted if actual results significantly differ from these estimates or the estimates are adjusted in future periods.
Stock-Based Compensation
We have granted options to purchase Class B common stock to our employees with exercise prices equal to the value of the underlying stock, as determined by our board of directors on the date the equity award was granted. Our board of directors determined this value principally based upon valuation analyses prepared by an independent third party valuation firm each year and in consideration of a number of factors, including our historical and projected financial results, risks facing us and the liquidity of our common stock. In connection with the preparation of the financial statements for our initial public offering and solely for purposes of accounting for employee stock-based compensation, we have applied hindsight to reassess the fair value of our common stock for the equity awards granted during fiscal 2004. These reassessed values were determined based on a number of factors and methodologies, including an evaluation of our updated historical and projected financial results and a re-evaluation of our fair value based upon more recent valuation analyses provided by an independent third party valuation firm.
Based upon this reassessment of the fair value of our Class B common stock, we have recorded deferred stock-based compensation to the extent that the reassessed value of our Class B common stock at the date of grant exceeded the exercise price of the equity awards. Reassessed values are inherently uncertain and highly subjective. If we had made different assumptions, the amount of our deferred stock-based compensation, stock-based compensation expense, gross margin, net income and net income per share amounts could have been significantly different. We recorded deferred compensation of $58.8 million during fiscal 2004. The deferred stock-based compensation expense is being amortized on a straight-line basis over the stock option vesting period of four years. In fiscal 2004, we recognized $7.2 million in stock-based compensation expense related to Class B common stock options granted to employees based upon the reassessed values of the Class B common stock underlying the stock option awards. We also issued shares of fully vested Class B common stock to an executive officer in fiscal 2004. We recorded stock-based compensation expense in connection with the award calculated based on the reassessed value of our Class B common stock at the date the shares were issued, which resulted in $6.9 million expense recorded in selling, general and administrative expense in fiscal 2004.
In October 2004, subsequent to our 2004 fiscal year end, we granted additional options to purchase Class B common stock to our employees at exercise prices that were below the reassessed fair value at the date of grant. We expect to record deferred compensation of $7.3 million related to these equity awards, which will be amortized on a straight-line basis over the vesting schedule of the awards.
The amount of stock-based compensation expense expected to be recorded in future periods related to the October 2004 awards and awards previously issued to employees is as follows (in thousands):
| Expense by Fiscal Year | |||||||||||||||
| 2005 | 2006 | 2007 | 2008 | 2009 | |||||||||||
Stock-based compensation expense related to stock options granted to employees | $ | 16,366 | $ | 16,517 | $ | 16,517 | $ | 9,315 | $ | 152 | |||||
Note 1 of the Notes to Consolidated Financial Statements included as part of this prospectus describes what the effect would have been had we accounted for stock-based awards under the fair value recognition provisions of Statement of Financial Accounting Standards No. 123, “Accounting for Stock-Based Compensation.”
44
Table of Contents
Results of Operations
Fiscal Years Ended September 27, 2002, September 26, 2003 and September 24, 2004
The following table presents our audited actual and pro forma unaudited operating results as a percentage of total revenue for the periods indicated:
| Actual | Pro Forma | |||||||||||||||||
| Fiscal Year Ended | Fiscal Year Ended | |||||||||||||||||
| Sep 27, 2002 | Sep 26, 2003 | Sep 24, 2004 | Sep 27, 2002 | Sep 26, 2003 | Sep 24, 2004 | |||||||||||||
Consolidated Statements of Operations Data: | ||||||||||||||||||
Revenue: | ||||||||||||||||||
Licensing | 66 | % | 73 | % | 73 | % | 67 | % | 73 | % | 73 | % | ||||||
Product sales | 25 | 20 | 20 | 25 | 20 | 20 | ||||||||||||
Production services | 9 | 7 | 7 | 8 | 7 | 7 | ||||||||||||
Total revenue | 100 | 100 | 100 | 100 | 100 | 100 | ||||||||||||
Cost of revenue: | ||||||||||||||||||
Cost of licensing | 16 | 19 | 19 | 5 | 7 | 7 | ||||||||||||
Cost of product sales (1) | 16 | 12 | 10 | 14 | 11 | 9 | ||||||||||||
Cost of production services (1) | 4 | 3 | 3 | 4 | 3 | 3 | ||||||||||||
Total cost of revenue | 36 | 34 | 32 | 23 | 21 | 19 | ||||||||||||
Gross margin | 64 | 66 | 68 | 77 | 79 | 81 | ||||||||||||
Operating expenses: | ||||||||||||||||||
Selling, general and administrative (includes 4% in stock-based compensation for fiscal 2004) (1) | 40 | 35 | 39 | 42 | 35 | 39 | ||||||||||||
Research and development (includes 1% in stock-based compensation for fiscal 2004) (1) | 9 | 8 | 8 | 9 | 8 | 8 | ||||||||||||
Settlements | 15 | — | (1 | ) | 14 | — | (1 | ) | ||||||||||
In-process research and development | — | 1 | 1 | — | 1 | 1 | ||||||||||||
Total operating expenses | 64 | 44 | 47 | 65 | 44 | 47 | ||||||||||||
Operating income | 0 | 22 | 21 | 12 | 35 | 34 | ||||||||||||
Other income (expenses), net | 0 | 0 | 0 | 0 | 0 | 0 | ||||||||||||
Income (loss) before provision for income taxes and controlling interest | 0 | 22 | 21 | 12 | 35 | 34 | ||||||||||||
Provision for income taxes | 0 | 8 | 9 | 5 | 13 | 14 | ||||||||||||
Income (loss) before controlling interest | 0 | 14 | 12 | 7 | 22 | 20 | ||||||||||||
Controlling interest in net (income) loss | 0 | 0 | 0 | 0 | 0 | 0 | ||||||||||||
Net income (loss) | 0 | % | 14 | % | 12 | % | 7 | % | 22 | % | 20 | % | ||||||
(1) Stock-based compensation recorded in fiscal 2004 was classified as follows: |
| |||||||||||||||||
Cost of product sales | 0 | % | 0 | % | ||||||||||||||
Cost of production services | 0 | 0 | ||||||||||||||||
Selling, general and administrative | 4 | 4 | ||||||||||||||||
Research and development | 1 | 1 | ||||||||||||||||
Total stock-based compensation | 5 | % | 5 | % | ||||||||||||||
45
Table of Contents
Fiscal Years Ended September 26, 2003 and September 24, 2004
Revenue
| Fiscal Year Ended | Change | |||||||||||||
| September 26, 2003 | September 24, 2004 | In Dollars | Percentage | |||||||||||
| ($ in thousands) | ||||||||||||||
Revenue: | ||||||||||||||
Licensing | $ | 157,922 | $ | 211,395 | $ | 53,473 | 34 | % | ||||||
Percentage of total revenue | 73 | % | 73 | % | ||||||||||
Product sales | 44,403 | 57,981 | 13,578 | 31 | % | |||||||||
Percentage of total revenue | 20 | % | 20 | % | ||||||||||
Production services | 15,147 | 19,665 | 4,518 | 30 | % | |||||||||
Percentage of total revenue | 7 | % | 7 | % | ||||||||||
Total revenue | $ | 217,472 | $ | 289,041 | $ | 71,569 | 33 | % | ||||||
Licensing. The $53.5 million, or 34%, increase in licensing revenue from fiscal 2003 to fiscal 2004 resulted from increased sales by our licensees of their consumer electronics products that incorporate our technologies, principally attributable to the growth in sales of DVD players worldwide. Virtually all DVD players incorporate our Dolby Digital technologies. Aside from the growth in sales of DVD players, the increase in our licensing revenue was also attributable to growth in sales of personal computer software DVD players and, to a lesser extent, home theatre systems, set-top boxes and recordable DVD players. Sales of products such as home- theatre-in-a-box and audio/video receivers that incorporate multiple Dolby technologies also helped increase our licensing revenue, as we typically receive royalties for each of our technologies incorporated into a licensee’s product. We do not expect our licensees’ sales of DVD players, and thus our licensing revenue related to these products, to grow as rapidly in future periods as they have in the past.
Product Sales. The $13.6 million, or 31%, increase in our revenue from product sales from fiscal 2003 to fiscal 2004 was principally attributable to a $10.0 million increase in sales of our cinema products, primarily related to new theatre construction and the decisions by cinema operators to retrofit their existing theatres to include our cinema processors. To a lesser extent, the increase in product sales revenue was also attributable to $2.0 million in sales of sound reinforcement products by one of our consolidated subsidiaries, which was acquired in fiscal 2004 and was therefore not included in prior periods, and a $1.6 million increase in sales of our broadcast products to local television stations, cable networks and European satellite broadcasters. We believe that the growth in sales of our broadcast products to terrestrial, or over-the-air, broadcasters in the United States was principally attributable to their efforts to comply with the requirement of the FCC that such stations broadcast digital signals. We also believe that sales of our broadcast products have increased throughout the world as terrestrial, cable and satellite broadcasters seek to deliver programming that can utilize the capabilities of viewers’ home theatre systems.
Production Services. The $4.5 million, or 30%, increase in production services revenue from fiscal 2003 to fiscal 2004 was primarily attributable to an increase in the number of films made using our technologies, particularly in Korea, Scandinavia and Spain, as well as an increase in additional services such as print checking and screening services. To a lesser extent, our technical support services for digital cinema screenings have also contributed to the increase in production services revenue, as we did not offer these services previously.
46
Table of Contents
Gross Margin
| Actual | Pro Forma | |||||||||||||||
| Fiscal Year Ended | Fiscal Year Ended | |||||||||||||||
September 26, 2003 | September 24, 2004 | September 26, 2003 | September 24, 2004 | |||||||||||||
| ($ in thousands) | ||||||||||||||||
Gross margin: | ||||||||||||||||
Licensing gross margin | $ | 117,921 | $ | 157,557 | $ | 143,047 | $ | 191,325 | ||||||||
Licensing gross margin percentage | 75 | % | 75 | % | 91 | % | 91 | % | ||||||||
Product sales gross margin (includes $0.2 million in stock-based compensation expense in fiscal 2004) | 17,719 | 27,885 | 20,213 | 30,974 | ||||||||||||
Product sales gross margin percentage | 40 | % | 48 | % | 46 | % | 53 | % | ||||||||
Production services gross margin (includes $0.1 million in stock-based compensation expense in fiscal 2004) | 8,189 | 12,022 | 8,189 | 12,022 | ||||||||||||
Production services gross margin percentage | 54 | % | 61 | % | 54 | % | 61 | % | ||||||||
Total gross margin | $ | 143,829 | $ | 197,464 | $ | 171,449 | $ | 234,321 | ||||||||
Total gross margin percentage | 66 | % | 68 | % | 79 | % | 81 | % | ||||||||
Licensing Gross Margin. We license intellectual property rights that may be internally developed, acquired by us or licensed from other parties. Our cost of licensing consists principally of royalty payments we make to Ray Dolby and to other third parties for the licensing of intellectual property rights that we sublicense as part of our licensing arrangements with our customers. Our cost of licensing also includes amortization expenses associated with purchased intangibles. Our pro forma licensing gross margin for fiscal 2003 and 2004 excludes $25.1 million and $33.8 million, respectively, of expenses we recorded for sublicensing royalty payments we made to Ray Dolby.
Product Sales Gross Margin. Cost of product sales primarily consists of material costs related to the products sold, applied labor and manufacturing overhead and, to a lesser extent, royalty obligations for technologies we license from Ray Dolby. The increase in our product sales gross margin in fiscal 2004 was the result of increased production levels, but was partially offset by a $0.2 million stock-based compensation expense recorded in fiscal 2004. The increased production levels led to increased gross margins, as the higher production volumes were able to absorb greater amounts of relatively fixed labor and overhead costs due to the high level of automation in our manufacturing processes. Pro forma product sales gross margin excludes $2.5 million and $3.1 million for fiscal 2003 and 2004, respectively, in expenses we recorded for royalty payments we made to Ray Dolby.
Production Services Gross Margin. Cost of production services consists of the payroll and benefit costs of employees performing our professional services, the cost of outside consultants and reimbursable expenses incurred on behalf of the customer. The increase in production services gross margin in fiscal 2004 resulted primarily from an increase in the amount of engineering services provided by our professional services organization during the fiscal year, which was partially offset by a $0.1 million charge in stock-based compensation recorded in fiscal 2004.
47
Table of Contents
Operating Expenses
| Fiscal Year Ended | Change | ||||||||||||||
September 26, 2003 | September 24, 2004 | In Dollars | Percentage | ||||||||||||
| ($ in thousands) | |||||||||||||||
Operating expenses: | |||||||||||||||
Selling, general and administrative (includes $12.7 million in stock-based compensation expense in fiscal 2004) | $ | 76,590 | $ | 113,477 | $ | 36,887 | 48 | % | |||||||
Percentage of total revenue | 35 | % | 39 | % | |||||||||||
Research and development (includes $1.2 million in stock-based compensation expense in fiscal 2004) | 18,262 | 23,884 | 5,622 | 31 | % | ||||||||||
Percentage of total revenue | 8 | % | 8 | % | |||||||||||
Settlements | — | (2,000 | ) | (2,000 | ) | — | |||||||||
Percentage of total revenue | — | (1 | )% | ||||||||||||
In-process research and development | 1,310 | 1,738 | 428 | 33 | % | ||||||||||
Percentage of total revenue | 1 | % | 1 | % | |||||||||||
Total operating expenses | $ | 96,162 | $ | 137,099 | $ | 40,937 | 43 | % | |||||||
Selling, General and Administrative. Selling, general and administrative expense consists primarily of personnel and personnel related expenses, facility costs and professional service fees for our sales, marketing and administrative functions. The $36.9 million, or 48%, increase in selling, general and administrative expense from fiscal 2003 to 2004 was primarily due to a $13.8 million increase in payroll and benefits costs as a result of increased headcount and performance-based awards and a $12.7 million increase in stock-based compensation expense. To a lesser extent, our selling, general and administrative expense also increased in fiscal 2004 as compared to fiscal 2003 due to an increase of $7.1 million of expenses incurred in connection with professional and consulting fees related primarily to our preparations for being a public company. These professional and consulting fees included costs incurred in connection with the implementation of a new enterprise resource planning, or ERP, system, the augmentation of our internal controls related to the Sarbanes-Oxley Act, a reengineering project related to our royalty reporting processes, and additional tax and audit services. We expect that our selling, general and administrative expense will increase in absolute dollars in fiscal 2005, as we continue to build our infrastructure in order to accommodate growth and to meet the requirements of being a public company. We expect to continue to incur additional costs associated with Sarbanes-Oxley Act compliance efforts, royalty reporting reengineering projects and ancillary ERP implementations.
Research and Development. Research and development expense consists primarily of salary and related costs for personnel responsible for the research and development of new technologies. The $5.6 million, or 31%, increase in research and development expense from fiscal 2003 to 2004 was primarily due to a $3.3 million increase in payroll and benefit costs as a result of increased headcount and, to a lesser extent, to a $1.2 million charge related to stock-based compensation expense incurred in fiscal 2004. We anticipate that research and development expense will increase in absolute dollars in fiscal 2005, as we expect to hire additional personnel to support the development of new technologies.
Settlements. Settlements include interest and penalties related to the collection of royalties and resolution of disputes in our favor or against us. Settlements of royalty disputes from licensees that specifically represent unpaid royalties are recorded as licensing revenue in the period payment is received, if all other revenue recognition criteria have been met. Settlements of other disputes, such as disputes with implementation licensees from which we typically do not receive royalties, are recorded in settlements. In fiscal 2004, we received a $2.0 million payment in connection with the settlement of a dispute with one of our semiconductor manufacturing implementation licensees regarding violation of the terms of their implementation licensing agreement with us.
48
Table of Contents
In-process Research and Development. In fiscal 2004, we recorded a $1.7 million charge related to purchased in-process research and development that had no alternative uses and had not reached technological feasibility. See Note 3 of the Notes to Consolidated Financial Statements included as part of this prospectus for information on in-process research and development we acquired in connection with our acquisition transactions.
Other Income (Expenses), Net
Other income (expenses), net primarily consists of gains and losses on interest rate swap agreements and interest expense on outstanding balances on our facility debt obligations, offset by interest income earned on cash and cash equivalent balances. Other income, net was $0.2 million in fiscal 2004 compared to $0.1 million in other expenses, net in fiscal 2003. The fluctuation from fiscal 2003 was due to an increase in interest income as a result of higher average cash and cash equivalent balances for fiscal 2004.
Income Taxes
| Actual | Pro Forma | |||||||||||||||
| Fiscal Year Ended | Fiscal Year Ended | |||||||||||||||
| September 26, 2003 | September 24, 2004 | September 26, 2003 | September 24, 2004 | |||||||||||||
| ($ in thousands) | ||||||||||||||||
Income taxes: | ||||||||||||||||
Provision for income taxes | $ | 16,079 | $ | 25,039 | $ | 26,714 | $ | 39,267 | ||||||||
Effective tax rate | 34 | % | 42 | % | 36 | % | 41 | % | ||||||||
Our fiscal 2004 effective tax rate was higher than in fiscal 2003 primarily due to the impact of incentive stock-based compensation expense, which is nondeductible, and losses from our foreign subsidiaries that we incurred in fiscal 2004. Excluding the effect of incentive stock-based compensation expense, our effective tax rate for fiscal 2004 would have been 39%. For fiscal 2003, the effective tax rate was below the statutory tax rate of 35% primarily due to the impact of extraterritorial income exclusion and research and experimentation credits. Our pro forma provision for income taxes and effective tax rate for fiscal 2003 and 2004 reflect the increase in operating income due to the exclusion of $27.6 million and $36.9 million, respectively, in royalty expense payable to Ray Dolby.
Fiscal Years Ended September 27, 2002 and September 26, 2003
Revenue
| Actual | Pro Forma | |||||||||||||||
| Fiscal Year Ended | Fiscal Year Ended | |||||||||||||||
| September 27, 2002 | September 26, 2003 | September 27, 2002 | September 26, 2003 | |||||||||||||
| ($ in thousands) | ||||||||||||||||
Revenue: | ||||||||||||||||
Licensing | $ | 106,640 | $ | 157,922 | $ | 113,361 | $ | 157,922 | ||||||||
Percentage of total revenue | 66 | % | 73 | % | 67 | % | 73 | % | ||||||||
Product sales | 41,377 | 44,403 | 41,377 | 44,403 | ||||||||||||
Percentage of total revenue | 25 | % | 20 | % | 25 | % | 20 | % | ||||||||
Production services | 13,851 | 15,147 | 13,851 | 15,147 | ||||||||||||
Percentage of total revenue | 9 | % | 7 | % | 8 | % | 7 | % | ||||||||
Total revenue | $ | 161,868 | $ | 217,472 | $ | 168,589 | $ | 217,472 | ||||||||
Licensing. Licensing revenue increased $51.3 million, or 48%, from fiscal 2002 to fiscal 2003 principally due to increased sales by our licensees of their consumer electronics products that incorporate our technologies, reflecting the growth in sales of DVD players worldwide. Aside from the growth in sales of DVD players, the
49
Table of Contents
increase in our licensing revenue was also attributable to growth in sales of personal computer software DVD players and, to a lesser extent, home theatre systems and set-top boxes. Sales of products such as home-theatre-in-a-box and audio/video receivers that incorporate multiple Dolby technologies also helped increase our licensing revenue. In addition, a portion of the increase in licensing revenue was due to an amendment to our licensing agreements with Ray Dolby in the fourth quarter of 2002. Prior to June 2002, we administered the licensing of certain intellectual property rights for Ray Dolby, remitting to him the revenue derived from licensing these rights, net of the related administrative costs we incurred. These revenues were not recorded in our consolidated financial statements. In June 2002, we terminated this licensing administration arrangement and amended our licensing agreements with Ray Dolby to license from him the intellectual property rights we had previously administered on his behalf. In exchange, we agreed to pay him royalties in an amount that was intended to approximate the net revenue he would have received under our prior licensing administration arrangement. As a result, our fiscal 2003 licensing revenue reflects a full year of royalty revenue resulting from the June 2002 amendment of our licensing agreements, whereas our licensing revenue in fiscal 2002 reflects only one quarter of this additional royalty revenue stream. On a pro forma basis, our licensing revenue in fiscal 2002 increased by $6.7 million as compared to our actual results due to the amendments to our licensing agreements with Ray Dolby described above.
Product Sales. The $3.0 million, or 7%, increase in our revenue from product sales in absolute dollars from fiscal 2002 to fiscal 2003 was principally attributable to a $2.5 million increase in sales of our broadcast products to local television stations, cable networks and European satellite broadcasters. We believe this is principally attributable to the efforts of terrestrial broadcasters in the United States to comply with the requirement of the FCC that those stations broadcast digital signals and the desire of terrestrial, cable and satellite broadcasters throughout the world to deliver programming that can utilize the capabilities of viewers’ home theatre systems. To a lesser extent, the increase in product sales revenue was also attributable to a $0.5 million increase in sales of our cinema products. The decrease in product sales revenue as a percentage of revenue was attributable to increases in licensing revenue both in absolute dollars and as a percentage of total revenue.
Production Services. The $1.3 million, or 9%, increase in production services revenue in absolute dollars from fiscal 2002 to fiscal 2003 was primarily attributable to an increase in the number of billable service calls made as a result of an increase in the number of films released during this period. To a lesser extent, the increase in production services revenue was also attributable to an increase in the number of billable service calls made related to foreign language versions of films and commercial and trailer services. The decrease in production services revenue as a percentage of revenue was attributable to increases in licensing revenue both in absolute dollars and as a percentage of total revenue.
Gross Margin
| Actual | Pro Forma | |||||||||||||||
| Fiscal Year Ended | Fiscal Year Ended | |||||||||||||||
September 27, 2002 | September 26, 2003 | September 27, 2002 | September 26, 2003 | |||||||||||||
| ($ in thousands) | ||||||||||||||||
Gross margin: | ||||||||||||||||
Licensing gross margin | $ | 81,577 | $ | 117,921 | $ | 104,676 | $ | 143,047 | ||||||||
Licensing gross margin percentage | 76 | % | 75 | % | 92 | % | 91 | % | ||||||||
Product sales gross margin | 14,683 | 17,719 | 17,096 | 20,213 | ||||||||||||
Product sales gross margin percentage | 35 | % | 40 | % | 41 | % | 46 | % | ||||||||
Production services gross margin | 7,891 | 8,189 | 7,891 | 8,189 | ||||||||||||
Production services gross margin percentage | 57 | % | 54 | % | 57 | % | 54 | % | ||||||||
Total gross margin | $ | 104,151 | $ | 143,829 | $ | 129,663 | $ | 171,449 | ||||||||
Total gross margin percentage | 64 | % | 66 | % | 77 | % | 79 | % | ||||||||
50
Table of Contents
Licensing Gross Margin. The decrease in licensing gross margin from fiscal 2002 to fiscal 2003 was due to the increase in licensing revenue derived from royalties from product sales that incorporate technologies we license from third parties. Our pro forma licensing gross margin for fiscal 2002 and 2003 excludes $16.4 million and $25.1 million, respectively, in expenses we recorded for sublicensing royalty payments we made to Ray Dolby. Our fiscal 2002 pro forma licensing gross margin was also affected by the $6.7 million increase in our fiscal 2002 pro forma licensing revenue described above due to the June 2002 amendments to our licensing agreements with Ray Dolby.
Product Sales Gross Margin. The increase in product sales gross margin from fiscal 2002 to fiscal 2003 was the result of higher production levels as compared to fiscal 2002, as the higher production volumes were able to absorb greater amounts of relatively fixed labor and overhead costs. Pro forma product sales gross margin excludes expenses for royalties payable to Ray Dolby of $2.4 million and $2.5 million for fiscal 2002 and 2003, respectively.
Production Services Gross Margin. The decrease in production services gross margin was principally attributable to a $0.9 million increase in costs associated with higher staff and related expenses.
Operating Expenses
| Actual | Pro Forma | |||||||||||||||
| Fiscal Year Ended | Fiscal Year Ended | |||||||||||||||
| September 27, 2002 | September 26, 2003 | September 27, 2002 | September 26, 2003 | |||||||||||||
| ($ in thousands) | ||||||||||||||||
Operating expenses: | ||||||||||||||||
Selling, general and administrative | $ | 64,269 | $ | 76,590 | $ | 70,297 | $ | 76,590 | ||||||||
Percentage of total revenue | 40 | % | 35 | % | 42 | % | 35 | % | ||||||||
Research and development | 15,128 | 18,262 | 15,128 | 18,262 | ||||||||||||
Percentage of total revenue | 9 | % | 8 | % | 9 | % | 8 | % | ||||||||
Settlements | 24,205 | — | 24,205 | — | ||||||||||||
Percentage of total revenue | 15 | % | — | 14 | % | — | ||||||||||
In-process research and development | — | 1,310 | — | 1,310 | ||||||||||||
Percentage of total revenue | — | 1 | % | — | 1 | % | ||||||||||
Total operating expenses | $ | 103,602 | $ | 96,162 | $ | 109,630 | $ | 96,162 | ||||||||
Selling, General and Administrative. Selling, general and administrative expense increased $12.3 million, or 19%, from fiscal 2002 to fiscal 2003, primarily due to a change in our licensing agreements with Ray Dolby. Prior to June 2002, Ray Dolby reimbursed us for expenses we incurred in connection with administering licenses covering certain of his intellectual property rights. Ray Dolby reimbursed us $6.0 million in fiscal 2002 for these administrative services, which we recorded as a reduction in selling, general and administrative expense. In July 2002, we terminated this licensing administration arrangement and amended our licensing agreements with Ray Dolby to license from him the intellectual property rights we had previously administered on his behalf. As a result, selling, general and administrative expense for fiscal 2003 did not include any reimbursements by Ray Dolby. The increase in selling, general and administrative expense was also due to a $1.7 million increase in legal expenses incurred to address intellectual property and licensing revenue collection issues and to a $1.7 million increase in bad debt expense based on a reassessment of our allowance for doubtful accounts. To a lesser extent, selling, general and administrative expense was also affected by a $1.2 million increase in payroll and benefits costs resulting from an increase in headcount and $0.8 million in expenses related to our senior executive supplemental retirement plan in fiscal 2003. The decrease in selling, general and administrative expense as a percentage of total revenue was due primarily to our total revenue growing at a higher rate than our selling, general and administrative expense during such period. On a pro forma basis, our selling, general and administrative expense in fiscal 2002 increased $6.0 million as compared to our actual results due to the June 2002 amendments to our licensing agreements with Ray Dolby described above.
51
Table of Contents
Research and Development. Research and development expense increased $3.1 million, or 21%, from fiscal 2002 to fiscal 2003, primarily attributable to a $2.4 million increase in payroll and benefits costs due to increased headcount. The decrease in research and development expense as a percentage of total revenue was due primarily to our total revenue growing at a higher rate than our research and development expenses during such period.
Settlements. In fiscal 2002, we entered into a settlement agreement with a third party regarding an intellectual property dispute and agreed to pay a total of $30.0 million in ten equal annual installments of $3.0 million beginning in June 2002. We recorded this settlement liability in fiscal 2002 at its net present value of $24.2 million with a corresponding charge to our results of operations.
In-process Research and Development. In fiscal 2003, we recorded a $1.3 million charge related to purchased in-process research and development that had no alternative uses and had not reached technological feasibility. See Note 3 of the Notes to Consolidated Financial Statements included as part of this prospectus for information on in-process research and development we acquired in connection with our acquisition transactions.
Other Income (Expenses), Net
Other expenses, net decreased to $0.1 million in fiscal 2003 compared to $0.7 million in fiscal 2002, primarily due to a gain in the market value of our interest rate swap agreements, offset by an increase in interest expense as a result of the imputed interest on the intellectual property dispute settlement payment made in June 2003.
Income Taxes
| Actual | Pro Forma | |||||||||||||||
| Fiscal Year Ended | Fiscal Year Ended | |||||||||||||||
| September 27, 2002 | September 26, 2003 | September 27, 2002 | September 26, 2003 | |||||||||||||
| ($ in thousands) | ||||||||||||||||
Income taxes: | ||||||||||||||||
Provision for income taxes | $ | 11 | $ | 16,079 | $ | 7,884 | $ | 26,714 | ||||||||
Effective tax rate | 6 | % | 34 | % | 39 | % | 36 | % | ||||||||
The fiscal 2003 increase to the effective tax rate was attributable to lower taxable income in fiscal 2002 due to the charge associated with the settlement of the intellectual property dispute. For fiscal 2003, the effective tax rate was below the statutory tax rate of 35% primarily due to the impact of extraterritorial income exclusion and research and experimentation tax credits. Our pro forma provision for income taxes and effective tax rate for fiscal 2002 and 2003 reflect the increase in operating income due to the exclusion of the $18.8 million and $27.6 million, respectively, in royalty expense payable to Ray Dolby.
Quarterly Consolidated Results of Operations
Actual
The following tables present our unaudited quarterly consolidated results of operations and our unaudited quarterly consolidated results of operations as a percentage of revenue for the eight quarters ended September 24, 2004. The unaudited quarterly consolidated information has been prepared on the same basis as our audited consolidated financial statements for our full fiscal years. You should read the following tables presenting our quarterly consolidated results of operations in conjunction with our audited consolidated financial statements for our full fiscal years and the related notes included elsewhere in this prospectus. This table includes all adjustments, consisting only of normal recurring adjustments, that we consider necessary for the fair presentation of our consolidated financial position and operating results for the quarters presented. The operating results for any quarter are not necessarily indicative of the operating results for any future period.
52
Table of Contents
| Actual | ||||||||||||||||||||||||||||||||
| Fiscal Quarter Ended | ||||||||||||||||||||||||||||||||
Dec 27, 2002 | Mar 28, 2003 | Jun 27, 2003 | Sep 26, 2003 | Dec 26, 2003 | Mar 26, 2004 | Jun 25, 2004 | Sep 24, 2004 | |||||||||||||||||||||||||
| (in thousands, except per share data) | ||||||||||||||||||||||||||||||||
Consolidated Statements of Operations Data: | ||||||||||||||||||||||||||||||||
Revenue: | ||||||||||||||||||||||||||||||||
Licensing | $ | 35,670 | $ | 40,580 | $ | 40,032 | $ | 41,640 | $ | 47,799 | $ | 58,948 | $ | 55,487 | $ | 49,161 | ||||||||||||||||
Product sales | 11,111 | 11,344 | 9,593 | 12,355 | 13,392 | 14,386 | 15,355 | 14,848 | ||||||||||||||||||||||||
Production services | 3,493 | 3,871 | 3,670 | 4,113 | 4,232 | 5,357 | 5,208 | 4,868 | ||||||||||||||||||||||||
Total revenue | 50,274 | 55,795 | 53,295 | 58,108 | 65,423 | 78,691 | 76,050 | 68,877 | ||||||||||||||||||||||||
Cost of revenue (includes stock-based compensation for periods beginning in fiscal 2004; see table below): | ||||||||||||||||||||||||||||||||
Cost of licensing | 9,659 | 9,864 | 9,980 | 10,498 | 12,781 | 15,105 | 13,441 | 12,511 | ||||||||||||||||||||||||
Cost of product sales (1) | 6,401 | 7,035 | 6,173 | 7,075 | 6,896 | 7,717 | 7,848 | 7,635 | ||||||||||||||||||||||||
Cost of production services (1) | 1,466 | 1,532 | 1,632 | 2,328 | 1,587 | 1,931 | 1,945 | 2,180 | ||||||||||||||||||||||||
Total cost of revenue | 17,526 | 18,431 | 17,785 | 19,901 | 21,264 | 24,753 | 23,234 | 22,326 | ||||||||||||||||||||||||
Gross margin | 32,748 | 37,364 | 35,510 | 38,207 | 44,159 | 53,938 | 52,816 | 46,551 | ||||||||||||||||||||||||
Operating expenses (includes stock-based compensation for periods beginning in fiscal 2004; see table below): | ||||||||||||||||||||||||||||||||
Selling, general and administrative (1) | 17,662 | 19,043 | 19,462 | 20,423 | 20,303 | 31,075 | 29,167 | 32,932 | ||||||||||||||||||||||||
Research and development (1) | 3,952 | 4,535 | 4,835 | 4,940 | 4,934 | 5,700 | 6,388 | 6,862 | ||||||||||||||||||||||||
Settlements | — | — | — | — | — | — | (2,000 | ) | — | |||||||||||||||||||||||
In-process research and development | — | — | — | 1,310 | — | 1,540 | — | 198 | ||||||||||||||||||||||||
Total operating expenses | 21,614 | 23,578 | 24,297 | 26,673 | 25,237 | 38,315 | 33,555 | 39,992 | ||||||||||||||||||||||||
Operating income | 11,134 | 13,786 | 11,213 | 11,534 | 18,922 | 15,623 | 19,261 | 6,559 | ||||||||||||||||||||||||
Other income (expenses), net | (130 | ) | (351 | ) | 46 | 378 | 224 | 156 | 370 | (521 | ) | |||||||||||||||||||||
Income before provision for income taxes and controlling interest | 11,004 | 13,435 | 11,259 | 11,912 | 19,146 | 15,779 | 19,631 | 6,038 | ||||||||||||||||||||||||
Provision for income taxes | 3,973 | 4,899 | 3,443 | 3,764 | 6,840 | 5,877 | 8,633 | 3,689 | ||||||||||||||||||||||||
Income before controlling interest | 7,031 | 8,536 | 7,816 | 8,148 | 12,306 | 9,902 | 10,998 | 2,349 | ||||||||||||||||||||||||
Controlling interest in net income | (89 | ) | (102 | ) | (24 | ) | (347 | ) | (286 | ) | (70 | ) | (494 | ) | (79 | ) | ||||||||||||||||
Net income | $ | 6,942 | $ | 8,434 | $ | 7,792 | $ | 7,801 | $ | 12,020 | $ | 9,832 | $ | 10,504 | $ | 2,270 | ||||||||||||||||
Basic net income per common share | $ | 0.08 | $ | 0.10 | $ | 0.09 | $ | 0.09 | $ | 0.14 | $ | 0.12 | $ | 0.12 | $ | 0.03 | ||||||||||||||||
Diluted net income per common share | $ | 0.08 | $ | 0.10 | $ | 0.09 | $ | 0.09 | $ | 0.13 | $ | 0.11 | $ | 0.11 | $ | 0.02 | ||||||||||||||||
Shares used in the calculation of basic net income per share | 85,014 | 85,008 | 85,006 | 85,006 | 85,010 | 85,432 | 85,707 | 86,072 | ||||||||||||||||||||||||
Shares used in the calculation of diluted net income per share | 85,017 | 85,010 | 85,009 | 87,899 | 92,531 | 92,928 | 97,371 | 97,236 | ||||||||||||||||||||||||
(1) Stock-based compensation recorded in fiscal 2004 was classified as follows: |
| |||||||||||||||||||||||||||||||
Cost of product sales |
| $ | — | $ | — | $ | 78 | $ | 79 | |||||||||||||||||||||||
Cost of production services |
| — | — | 28 | 27 | |||||||||||||||||||||||||||
Selling, general and administrative |
| 23 | 7,005 | 2,772 | 2,911 | |||||||||||||||||||||||||||
Research and development |
| — | — | 607 | 608 | |||||||||||||||||||||||||||
Total stock-based compensation |
| $ | 23 | $ | 7,005 | $ | 3,485 | $ | 3,625 | |||||||||||||||||||||||
53
Table of Contents
| Actual | ||||||||||||||||||||||||
| Fiscal Quarter Ended | ||||||||||||||||||||||||
| Dec 27, 2002 | Mar 28, 2003 | Jun 27, 2003 | Sep 26, 2003 | Dec 26, 2003 | Mar 26, 2004 | Jun 25, 2004 | Sep 24, 2004 | |||||||||||||||||
As a percentage of revenue: | ||||||||||||||||||||||||
Revenue: | ||||||||||||||||||||||||
Licensing | 71 | % | 73 | % | 75 | % | 72 | % | 73 | % | 75 | % | 73 | % | 71 | % | ||||||||
Product sales | 22 | 20 | 18 | 21 | 20 | 18 | 20 | 22 | ||||||||||||||||
Production services | 7 | 7 | 7 | 7 | 7 | 7 | 7 | 7 | ||||||||||||||||
Total revenue | 100 | 100 | 100 | 100 | 100 | 100 | 100 | 100 | ||||||||||||||||
Cost of revenue (includes stock-based compensation for periods beginning in fiscal 2004; see table below): | ||||||||||||||||||||||||
Cost of licensing | 19 | 18 | 18 | 18 | 20 | 19 | 18 | 18 | ||||||||||||||||
Cost of product sales (1) | 13 | 13 | 12 | 12 | 11 | 10 | 10 | 11 | ||||||||||||||||
Cost of production services (1) | 3 | 3 | 3 | 4 | 2 | 2 | 3 | 3 | ||||||||||||||||
Total cost of revenue | 35 | 34 | 33 | 34 | 33 | 31 | 31 | 32 | ||||||||||||||||
Gross margin | 65 | 66 | 67 | 66 | 67 | 69 | 69 | 68 | ||||||||||||||||
Operating expenses (includes stock-based compensation for periods beginning in fiscal 2004; see table below): | ||||||||||||||||||||||||
Selling, general and administrative (1) | 35 | 34 | 37 | 35 | 31 | 40 | 38 | 48 | ||||||||||||||||
Research and development (1) | 8 | 8 | 9 | 9 | 8 | 7 | 8 | 10 | ||||||||||||||||
Settlements | — | — | — | — | — | — | (2 | ) | — | |||||||||||||||
In-process research and development | — | — | — | 2 | — | 2 | — | 0 | ||||||||||||||||
Total operating expenses | 43 | 42 | 46 | 46 | 39 | 49 | 44 | 58 | ||||||||||||||||
Operating income | 22 | 24 | 21 | 20 | 28 | 20 | 25 | 10 | ||||||||||||||||
Other income (expenses), net | 0 | 0 | 0 | 0 | 0 | 0 | 0 | (1 | ) | |||||||||||||||
Income before provision for income taxes and controlling interest | 22 | 24 | 21 | 20 | 28 | 20 | 25 | 9 | ||||||||||||||||
Provision for income taxes | 8 | 9 | 6 | 7 | 10 | 8 | 11 | 6 | ||||||||||||||||
Income before controlling interest | 14 | 15 | 15 | 13 | 18 | 12 | 14 | 3 | ||||||||||||||||
Controlling interest in net income | 0 | 0 | 0 | 0 | 0 | 0 | 0 | 0 | ||||||||||||||||
Net income | 14 | % | 15 | % | 15 | % | 13 | % | 18 | % | 12 | % | 14 | % | 3 | % | ||||||||
(1) Stock-based compensation recorded in fiscal 2004 was classified as follows: |
| |||||||||||||||||||||||
Cost of product sales |
| — | % | — | % | 0 | % | 0 | % | |||||||||||||||
Cost of production services |
| — | — | 0 | 0 | |||||||||||||||||||
Selling, general and administrative |
| 0 | 9 | 4 | 4 | |||||||||||||||||||
Research and development |
| — | — | 1 | 1 | |||||||||||||||||||
Total stock-based compensation |
| 0 | % | 9 | % | 5 | % | 5 | % | |||||||||||||||
Pro Forma
The following tables present our pro forma unaudited quarterly consolidated results of operations, and our pro forma unaudited quarterly consolidated results of operations as a percentage of revenue, for the eight quarters ended September 24, 2004. The unaudited quarterly consolidated financial information has been prepared on the same basis as our audited consolidated financial statements for our full fiscal years. You should read the following tables presenting our pro forma quarterly consolidated results of operations in conjunction with our audited consolidated financial statements for our full fiscal years and the related notes included elsewhere in this prospectus, as well as our pro forma unaudited consolidated statements of operations for full fiscal years set forth elsewhere in this prospectus. The pro forma operating results for any quarter are not necessarily indicative of the operating results for any future period.
54
Table of Contents
| Pro Forma | ||||||||||||||||||||||||||||||||
| Fiscal Quarter Ended | ||||||||||||||||||||||||||||||||
| Dec 27, 2002 | Mar 28, 2003 | Jun 27, 2003 | Sep 26, 2003 | Dec 26, 2003 | Mar 26, 2004 | Jun 25, 2004 | Sep 24, 2004 | |||||||||||||||||||||||||
| (in thousands, except per share data) | ||||||||||||||||||||||||||||||||
Consolidated Statements of Operations Data: | ||||||||||||||||||||||||||||||||
Revenue: | ||||||||||||||||||||||||||||||||
Licensing | $ | 35,670 | $ | 40,580 | $ | 40,032 | $ | 41,640 | $ | 47,799 | $ | 58,948 | $ | 55,487 | $ | 49,161 | ||||||||||||||||
Product sales | 11,111 | 11,344 | 9,593 | 12,355 | 13,392 | 14,386 | 15,355 | 14,848 | ||||||||||||||||||||||||
Production services | 3,493 | 3,871 | 3,670 | 4,113 | 4,232 | 5,357 | 5,208 | 4,868 | ||||||||||||||||||||||||
Total revenue | 50,274 | 55,795 | 53,295 | 58,108 | 65,423 | 78,691 | 76,050 | 68,877 | ||||||||||||||||||||||||
Cost of revenue (includes stock-based compensation for periods beginning in fiscal 2004; see table below): | ||||||||||||||||||||||||||||||||
Cost of licensing | 3,751 | 3,861 | 3,630 | 3,633 | 4,668 | 5,917 | 5,106 | 4,379 | ||||||||||||||||||||||||
Cost of product sales (1) | 5,774 | 6,390 | 5,662 | 6,364 | 6,139 | 6,946 | 7,029 | 6,893 | ||||||||||||||||||||||||
Cost of production services (1) | 1,466 | 1,532 | 1,632 | 2,328 | 1,587 | 1,931 | 1,945 | 2,180 | ||||||||||||||||||||||||
Total cost of revenue | 10,991 | 11,783 | 10,924 | 12,325 | 12,394 | 14,794 | 14,080 | 13,452 | ||||||||||||||||||||||||
Gross margin | 39,283 | 44,012 | 42,371 | 45,783 | 53,029 | 63,897 | 61,970 | 55,425 | ||||||||||||||||||||||||
Operating expenses (includes stock-based compensation for periods beginning in fiscal 2004; see table below): | ||||||||||||||||||||||||||||||||
Selling, general and administrative (1) | 17,662 | 19,043 | 19,462 | 20,423 | 20,303 | 31,075 | 29,167 | 32,932 | ||||||||||||||||||||||||
Research and development (1) | 3,952 | 4,535 | 4,835 | 4,940 | 4,934 | 5,700 | 6,388 | 6,862 | ||||||||||||||||||||||||
Settlements | — | — | — | — | — | — | (2,000 | ) | — | |||||||||||||||||||||||
In-process research and development, net | — | — | — | 1,310 | — | 1,540 | — | 198 | ||||||||||||||||||||||||
Total operating expenses | 21,614 | 23,578 | 24,297 | 26,673 | 25,237 | 38,315 | 33,555 | 39,992 | ||||||||||||||||||||||||
Operating income | 17,669 | 20,434 | 18,074 | 19,110 | 27,792 | 25,582 | 28,415 | 15,433 | ||||||||||||||||||||||||
Other income (expenses), net | (130 | ) | (351 | ) | 46 | 378 | 224 | 156 | 370 | (521 | ) | |||||||||||||||||||||
Income before provision for income taxes and controlling interest | 17,539 | 20,083 | 18,120 | 19,488 | 28,016 | 25,738 | 28,785 | 14,912 | ||||||||||||||||||||||||
Provision for income taxes | 6,352 | 7,344 | 5,556 | 7,462 | 10,257 | 9,714 | 12,180 | 7,116 | ||||||||||||||||||||||||
Income before controlling interest | 11,187 | 12,739 | 12,564 | 12,026 | 17,759 | 16,024 | 16,605 | 7,796 | ||||||||||||||||||||||||
Controlling interest in net income | (89 | ) | (102 | ) | (24 | ) | (347 | ) | (286 | ) | (70 | ) | (494 | ) | (79 | ) | ||||||||||||||||
Net income | $ | 11,098 | $ | 12,637 | $ | 12,540 | $ | 11,679 | $ | 17,473 | $ | 15,954 | $ | 16,111 | $ | 7,717 | ||||||||||||||||
Basic net income per common share | $ | 0.13 | $ | 0.15 | $ | 0.15 | $ | 0.14 | $ | 0.21 | $ | 0.19 | $ | 0.19 | $ | 0.09 | ||||||||||||||||
Diluted net income per common share | $ | 0.13 | $ | 0.15 | $ | 0.15 | $ | 0.13 | $ | 0.19 | $ | 0.17 | $ | 0.17 | $ | 0.08 | ||||||||||||||||
Shares used in the calculation of basic net income per share | 85,014 | 85,008 | 85,006 | 85,006 | 85,010 | 85,432 | 85,707 | 86,072 | ||||||||||||||||||||||||
Shares used in the calculation of diluted net income per share | 85,017 | 85,010 | 85,009 | 87,899 | 92,531 | 92,928 | 97,371 | 97,236 | ||||||||||||||||||||||||
(1) Stock-based compensation recorded in fiscal 2004 was classified as follows: |
| |||||||||||||||||||||||||||||||
Cost of product sales |
| $ | — | $ | — | $ | 78 | $ | 79 | |||||||||||||||||||||||
Cost of production services |
| — | — | 28 | 27 | |||||||||||||||||||||||||||
Selling, general and administrative |
| 23 | 7,005 | 2,772 | 2,911 | |||||||||||||||||||||||||||
Research and development |
| — | — | 607 | 608 | |||||||||||||||||||||||||||
Total stock-based compensation |
| $ | 23 | $ | 7,005 | $ | 3,485 | $ | 3,625 | |||||||||||||||||||||||
55
Table of Contents
| Pro Forma | ||||||||||||||||||||||||
| Fiscal Quarter Ended | ||||||||||||||||||||||||
Dec 27, 2002 | Mar 28, 2003 | Jun 27, 2003 | Sep 26, 2003 | Dec 26, 2003 | Mar 26, 2004 | Jun 25, 2004 | Sep 24, 2004 | |||||||||||||||||
As a percentage of revenue: | ||||||||||||||||||||||||
Revenue: | ||||||||||||||||||||||||
Licensing | 71 | % | 73 | % | 75 | % | 72 | % | 73 | % | 74 | % | 73 | % | 71 | % | ||||||||
Product sales | 22 | 20 | 18 | 21 | 20 | 19 | 20 | 22 | ||||||||||||||||
Production services | 7 | 7 | 7 | 7 | 7 | 7 | 7 | 7 | ||||||||||||||||
Total revenue | 100 | 100 | 100 | 100 | 100 | 100 | 100 | 100 | ||||||||||||||||
Cost of revenue (includes stock-based compensation for periods beginning in fiscal 2004; see table below): | ||||||||||||||||||||||||
Cost of licensing | 7 | 7 | 7 | 6 | 7 | 7 | 7 | 7 | ||||||||||||||||
Cost of product sales (1) | 11 | 11 | 10 | 11 | 9 | 9 | 9 | 10 | ||||||||||||||||
Cost of production services (1) | 4 | 3 | 3 | 4 | 3 | 3 | 3 | 3 | ||||||||||||||||
Total cost of revenue | 22 | 21 | 20 | 21 | 19 | 19 | 19 | 20 | ||||||||||||||||
Gross margin | 78 | 79 | 80 | 79 | 81 | 81 | 81 | 80 | ||||||||||||||||
Operating expenses (includes stock-based compensation for periods beginning in fiscal 2004; see table below): | ||||||||||||||||||||||||
Selling, general and administrative (1) | 35 | 34 | 37 | 35 | 30 | 40 | 38 | 48 | ||||||||||||||||
Research and development (1) | 8 | 8 | 9 | 9 | 8 | 7 | 9 | 10 | ||||||||||||||||
Settlements | — | — | — | — | — | — | (3 | ) | — | |||||||||||||||
In-process research and development, net | — | — | — | 2 | — | 2 | — | 0 | ||||||||||||||||
Total operating expenses | 43 | 42 | 46 | 46 | 38 | 49 | 44 | 58 | ||||||||||||||||
Operating income | 35 | 37 | 34 | 33 | 43 | 32 | 37 | 22 | ||||||||||||||||
Other income (expenses), net | 0 | (1 | ) | 0 | 1 | 0 | 0 | 1 | 0 | |||||||||||||||
Income before provision for income taxes and controlling interest | 35 | 36 | 34 | 34 | 43 | 32 | 38 | 22 | ||||||||||||||||
Provision for income taxes | 13 | 13 | 10 | 13 | 16 | 12 | 16 | 11 | ||||||||||||||||
Income before controlling interest | 22 | 23 | 24 | 21 | 27 | 20 | 22 | 11 | ||||||||||||||||
Controlling interest in net income | 0 | 0 | 0 | (1 | ) | 0 | 0 | (1 | ) | 0 | ||||||||||||||
Net income | 22 | % | 23 | % | 24 | % | 20 | % | 27 | % | 20 | % | 21 | % | 11 | % | ||||||||
(1) Stock-based compensation recorded in fiscal 2004 was classified as follows: |
| |||||||||||||||||||||||
Cost of product sales |
| — | % | — | % | 0 | % | 0 | % | |||||||||||||||
Cost of production services |
| — | — | — | — | |||||||||||||||||||
Selling, general and administrative |
| 0 | 9 | 4 | 4 | |||||||||||||||||||
Research and development |
| — | — | 1 | 1 | |||||||||||||||||||
Total stock-based compensation |
| 0 | % | 9 | % | 5 | % | 5 | % | |||||||||||||||
Our recognition of licensing revenue is dependent upon our receipt of royalty reports from our licensees, and our quarterly operating results can fluctuate based on the timing of our receipt of those reports. We generally experience seasonality in our licensing business, and we expect that business to continue to be affected by seasonality in the future. Because our licensees are required to deliver to us royalty reports based on their shipment of consumer electronics products that incorporate our technologies in the quarter following shipment, we have typically experienced higher licensing revenue in the second quarter of each fiscal year, principally due to the holiday sales of consumer electronics products in the preceding quarter. The growth in licensing revenue during the past few fiscal years has masked some of the seasonality we experience and expect to continue to experience in our licensing revenue.
56
Table of Contents
In addition to seasonality, we have experienced and expect to continue to experience fluctuations in our quarterly operating results as a result of the time lag between when our licensees ship their products and when they report those shipments to us, a lag that can sometimes be significant. In addition, it is not uncommon for royalty reports to include corrective or retroactive royalties that cover extended periods of time. In the past, we have experienced lags greater than one year. Also, there have been times in the past when we have recognized an unusually large amount of licensing revenue from a licensee in a given quarter because not all of our revenue recognition criteria were met in prior periods. This can result in a large amount of licensing revenue from a licensee being recorded in a given quarter that is not necessarily indicative of the amounts of licensing revenue to be received from that licensee in future quarters, thus causing fluctuations in our quarterly operating results.
In fiscal 2004, our licensing revenue for the quarters ended March 26, 2004, June 25, 2004, and September 24, 2004 were all affected by various factors relating to the royalty reports we received from licensees during such periods, including seasonality and, in certain cases, significant lag times between when licensees shipped products and when they delivered royalty reports to us. In addition, our quarterly operating results in fiscal 2004, both on an actual and pro forma basis, were significantly affected by stock-based compensation charges resulting from our decision, in connection with the preparation of the financial statements for our initial public offering, to reassess the fair value of our Class B common stock for purposes of accounting for employee stock-based compensation. These stock-based compensation charges affected our cost of product sales, cost of production services, total cost of revenue, selling, general and administrative expense, research and development expense, total operating expenses, and operating income in these periods. We expect that these stock-based compensation expenses, which are amortized over the four-year vesting periods of the related equity awards, will continue to affect our quarterly financial results through the fourth quarter of fiscal 2008.
Liquidity, Capital Resources and Financial Condition
Our financial position includes cash and cash equivalents of $61.9 million and $78.7 million at September 26, 2003 and September 24, 2004, respectively. We believe that our cash, cash equivalents and potential cash flow from operations will be sufficient to satisfy our cash requirements through at least the next 12 months.
Operating Activities
Our principal sources of liquidity are our cash and cash equivalents as well as the cash flow we generate from our operations. Our operating activities generated cash of $22.9 million, $39.6 million and $46.9 million in fiscal 2002, 2003 and 2004, respectively. The increase in cash flows provided by operating activities in fiscal 2004 as compared to fiscal 2003 was due primarily to an increase in net income, excluding the non-cash charge for stock-based compensation recorded during fiscal 2004.
Under licensing and royalty agreements with Ray Dolby, we recorded expenses for the use of certain patent and trademark rights in the amounts of $18.8 million, $27.6 million and $36.9 million in fiscal 2002, 2003 and 2004, respectively. In connection with the asset contribution by Ray Dolby, which will occur prior to the completion of this offering, these licensing and royalty agreements will terminate, and we will have no further obligation to pay royalties, or incur any costs or expenses, under these agreements.
Investing Activities
Our investing activities are primarily related to capital expenditures associated with the purchases of office equipment, building fixtures, computer hardware and software, leasehold improvements and production and test equipment. In fiscal 2002, we received $1.8 million in proceeds from the sale of a facility and recorded a gain of $0.5 million related to this property sale. Capital expenditures for fiscal 2004 increased as compared to fiscal 2003 principally due to additional costs associated with the implementation of a new ERP system and for increased leasehold improvement costs made to our various facilities.
57
Table of Contents
In both fiscal 2003 and 2004, we acquired complementary businesses related primarily to technologies that facilitate the delivery of digital entertainment, such as technologies that process digital moving images, digital signal processing technologies or technologies that protect content from piracy. We paid $7.1 million and $18.4 million in fiscal 2003 and 2004, respectively, in connection with these acquisition transactions. Under the terms of one of the acquisition agreements, we will pay approximately $3.0 million in September 2005, and we have future payment obligations equal to approximately 5% to 8% of revenue generated from products incorporating technologies we acquired in the transaction.
Financing Activities
Our financing activities consist primarily of principal payments made on our facility debt obligations. In fiscal 2004, we also received proceeds from the exercises of employee stock options, which were offset by the payments on our debt obligations. Our financing activities in fiscal 2002 were also affected by the retirement of an outstanding facility debt obligation in the amount of $1.3 million prior to its scheduled maturity date.
While we have never declared or paid any cash dividends on our capital stock and currently intend to retain any future earnings, if we are deemed to be a personal holding company for tax purposes, we may elect to pay a dividend to our stockholders in an amount equal to all or a significant part of our undistributed personal holding company income (which could be significant), rather than paying personal holding company tax on undistributed personal holding company income. See “Risk Factors—We may become subject to a personal holding company tax, which could materially and adversely affect our operating results and financial condition.”
Contractual Obligations and Commitments
The following table presents a summary of our contractual obligations and commitments as of September 24, 2004.
| Payments Due Within | |||||||||||||||
| 1 Year | 2-3 Years | 4-5 Years | More than 5 Years | Total | |||||||||||
| (in thousands) | |||||||||||||||
Litigation settlement | $ | 3,000 | $ | 6,000 | $ | 6,000 | $ | 6,000 | $ | 21,000 | |||||
Mortgages | 1,290 | 2,785 | 3,098 | 7,697 | 14,870 | ||||||||||
Operating leases | 4,483 | 1,857 | 436 | 957 | 7,733 | ||||||||||
Acquisition consideration | 2,979 | — | — | — | 2,979 | ||||||||||
Total | $ | 11,752 | $ | 10,642 | $ | 9,534 | $ | 14,654 | $ | 46,582 | |||||
Quantitative and Qualitative Disclosures About Market Risk
Interest Rate Sensitivity
Cash and Cash Equivalents. As of September 24, 2004, we had cash and cash equivalents of $78.7 million, which consisted of highly liquid money market instruments with original maturities of three months or less. Because of the short-term nature of these instruments, a sudden change in market interest rates would not be expected to have a material impact on our financial condition and/or results of operations.
Interest Rate Swap Agreements. We have entered into interest rate swap agreements to manage our exposure to interest rate changes on our facility debt obligations. The swap agreements involve the exchange of fixed and variable interest rate payments without exchanging the notional principal amount. Gains and losses associated with the swap agreements are included in other income (expenses), net in our consolidated statements of operations.
We do not utilize financial instruments for trading or other speculative purposes, nor do we utilize leveraged financial instruments.
58
Table of Contents
Foreign Currency Exchange Risk
Nearly all of our revenue is derived from transactions denominated in United States dollars, even though we maintain sales, marketing and business operations in foreign countries, most significantly in the United Kingdom. As such, we have exposure to adverse changes in exchange rates associated with operating expenses of our foreign operations, but we believe this exposure to be limited.
Recent Accounting Pronouncements
In May 2003, the FASB issued Statement of Financial Accounting Standards No. 150, “Accounting for Certain Financial Instruments with Characteristics of Both Liabilities and Equity,” or SFAS 150. SFAS 150 establishes standards for how an issuer classifies and measures in its statements of financial position certain financial instruments of both liabilities and equity. SFAS 150 requires issuers to classify as liabilities, or assets in some circumstances, three classes of freestanding instruments entered into or modified after May 31, 2003, at the beginning of the first interim period beginning after June 15, 2003 for all existing financial instruments. The adoption of SFAS 150 did not have an effect on our financial position, results of operation or cash flows. As of September 24, 2004, we did not have financial instruments within the scope of SFAS 150.
In January 2003, the FASB issued Financial Interpretation No. 46, “Consolidation of Variable Interest Entities,” or FIN 46. FIN 46 requires that if a company is the primary beneficiary of a variable interest entity, or VIE, the assets, liabilities and results of operations of the VIE should be included in our consolidated financial statements. In December 2003, the FASB published a revision to FIN 46, or FIN 46R, to clarify some of the provisions of FIN 46 and to exempt certain entities from its requirements. The adoption of FIN 46R required us to consolidate certain affiliated VIEs into our consolidated financial statements. Previously, we had been consolidating our VIEs under the provisions of Emerging Issues Task Force 90-15, “Impact of Nonsubstantive Lessors, Residual Value Guarantees, and Other Provisions in Leasing Transactions Abstract,” or EITF 90-15, and Emerging Issues Task Force Topic D-14, “Transactions Involving Special Purpose Entities,” or Topic D-14. Given our contemplation of an initial public offering, we adopted FIN 46R early, which rescinded the provisions of EITF 90-15 and Topic D-14. However, the adoption of FIN 46R did not have an effect on our financial position, results of operations or cash flows.
59
Table of Contents
Overview
Dolby Laboratories develops and delivers innovative products and technologies that make the entertainment experience more realistic and immersive in theatres, homes, cars and elsewhere. Since Ray Dolby founded Dolby Laboratories nearly 40 years ago, we have been at the forefront of developing sound technologies that enhance the entertainment experience for audiences and consumers. Our objective is to be an essential element in the best entertainment technology by delivering to both professionals and consumers innovative and enduring technologies that enrich the entertainment experience. Our technologies are used in sound recording, distribution and playback to faithfully recreate the original audio experience and enable digital audio and surround sound in applications such as movie soundtracks, DVDs, television, satellite and cable broadcasts, video games and personal computers. Our technologies have been adopted as standards throughout the entertainment industry. For example, virtually all major movie soundtracks throughout the world are encoded using our technologies and virtually all DVD players incorporate our technologies.
We develop technologies for both professional and consumer applications. On the professional side, we derive revenue from sales of products and production services to filmmakers, television broadcasters, music producers, video game designers and cinema operators. On the consumer side, we derive revenue from royalties collected from licensees who manufacture consumer electronics products that include our technologies, such as DVD players, home theatre systems, set-top boxes, video game consoles and personal computers.
Our products, services and technologies are used throughout the entertainment chain—from content creation, to distribution for large-scale playback, such as movie theatres, to repackaging and distribution for consumer media such as DVDs, to consumer playback, such as DVD players and home theatre systems. We have built strong, long-lasting relationships with industry professionals at every link in the entertainment chain, including filmmakers, motion picture studios, broadcasters, film distributors, cinema operators, DVD producers, manufacturers of a broad array of consumer electronics products and software developers. Industry professionals and consumers rely on Dolby to ensure consistent quality as content moves through the chain. Moreover, we believe that the use of our technologies by professionals in the creation and distribution of content increases demand for the adoption of our technologies for use in consumer applications. We believe that we are a trusted vendor for professionals and consumers alike, and that the Dolby brand is recognized globally for quality, excellence and innovation.
Key Dolby Strengths
We believe that the following key strengths uniquely position Dolby to develop and deliver innovative technologies to both professionals and consumers to enrich the entertainment experience.
Our culture of innovation
Since our inception, we have been at the forefront in addressing technology challenges for the entertainment industry. We create and deliver practical technology solutions for the entertainment industry that make a perceptible difference to audiences and consumers and have done so repeatedly throughout our nearly 40 year history. Our technologies are designed to provide outstanding quality while addressing the limitations inherent in a playback environment, such as cost, size, storage capacity or transmission bandwidth, power availability and portability constraints. We have repeatedly developed technologies that meet the needs of the ever-changing entertainment industry, and this has helped us develop, maintain and strengthen our relationships with a broad array of entertainment industry professionals. In the 1960s, we developed noise reduction technologies for use in professional recording studios and for consumer playback of music cassettes. In the 1970s, we worked with filmmakers to develop surround sound for their films by modifying Dolby Stereo to add a surround channel, which was first used inA Star is Born in 1976 andStar Wars in 1977. In the 1980s, we worked with consumer electronic product manufacturers to introduce surround sound in the home. In the 1990s, we worked with motion picture professionals to incorporate digital sound in movies by developing Dolby Digital, which was first introduced in a major motion picture withBatman Returns in 1992. Also in the 1990s, we worked with movie studios to incorporate
60
Table of Contents
multi-channel surround sound on DVDs within the limited space available for soundtracks, adapting Dolby Digital to accomplish this. As a result of our continuous innovation, Dolby Laboratories and our employees and products have received numerous industry awards related to our sound technologies. Dolby Laboratories or its employees have been recognized six times by the Academy of Television Arts and Sciences. In addition, the Academy of Motion Picture Arts and Sciences has presented Dolby Laboratories or its employees nine Scientific and Technical Awards, including one Oscar. We believe our track record of innovation is a good foundation for our ability to address future technology challenges and requirements for the entertainment industry.
Our longstanding relationships with industry participants throughout the entertainment chain
We collaborate closely on a global basis with entertainment industry participants throughout the entertainment chain, including filmmakers, music producers, broadcasters, video game designers, motion picture studios, DVD producers, manufacturers of consumer electronics products and professional organizations and standards setting bodies. We work with virtually all major motion picture studios, and many of our relationships with professionals in the motion picture industry date back more than 30 years. In addition, we have licensee relationships with approximately 500 consumer electronics product manufacturers, many dating back nearly 35 years. Our relationships with industry professionals at each link of the chain help us ensure that our products and technologies are designed and used throughout the sound recording, distribution and playback processes to deliver consistent, high quality sound to audiences and consumers as the content creators intended. Our longstanding relationships also help us determine our own product and technology development directions and play an important role in having our technologies adopted as industry standards.
Adoption of our technologies as industry standards
Throughout our history, we have repeatedly introduced technologies that have become industry standards in a wide range of entertainment industries and consumer electronics products. Industry standards can either be “explicit” when technologies are mandated by an industry standards-setting body, and “de facto” when technologies are widely adopted even though not specifically mandated by a standards-setting body. Our technologies are worldwide explicit or de facto industry standards for many types of professional and consumer applications. For example, Dolby Digital is one of the two global standard formats, along with PCM, or pulse code modulation, for encoding soundtracks on DVD-Video discs approved by the DVD Forum and, as a result, virtually all DVD players incorporate our Dolby Digital decoding technology. In the motion picture industry, Dolby SR and Dolby Digital have become de facto industry standards, in that virtually all major movie soundtracks throughout the world are encoded using one or both of these technologies. In broadcasting, Dolby Digital technologies have been selected as an explicit industry standard for terrestrial, or over-the-air, digital television in North America. Earlier examples of our industry standard technologies include: Dolby A, Dolby B and Dolby SR noise reduction technologies, which we introduced in 1965, 1968 and 1986, respectively; Dolby Stereo and Pro Logic technologies, which we introduced in 1976 and 1987, respectively; and our Dolby Digital technologies, which we introduced in 1991.
Our global market leadership
We have a broad, geographically diverse market presence on both the professional and consumer sides of our business, and we believe we are the global market leader for the delivery of surround sound technologies for professional products, including cinema products, as well as for consumer applications. Our professional products are distributed in over 50 countries, and we have sold over 73,000 cinema processors worldwide. Our products and technologies have been used in the production of over 16,000 movies, tens of thousands of DVD titles and hundreds of video game titles worldwide. Virtually all movies made by major studios include soundtracks encoded with Dolby SR or Dolby Digital technologies. In addition, over 40 television shows are currently produced using our sound encoding technologies. We license our sound technologies to approximately 500 consumer electronics product manufacturers in nearly 30 countries, and over 1.6 billion consumer electronics product units sold worldwide have incorporated our licensed technologies, including over 500 million consumer electronics product units since the beginning of fiscal 2002. Our Dolby Digital technologies alone have been
61
Table of Contents
incorporated in over 240 million DVD players and in over 50 million audio/video receivers and set-top boxes. We believe the large installed base of consumer electronics products with our surround sound capabilities ensures that content creators will continue to use our technologies to encode audio for their DVD, broadcast, video game and Internet entertainment.
Our neutrality
We do not align ourselves exclusively with any studio, manufacturer or other participant in the entertainment industry. We believe our neutrality encourages filmmakers, motion picture studios, broadcasters, film distributors, cinema operators, home media companies and consumer electronics product manufacturers to adopt our technologies more readily than if we had preferred relationships with other companies that these entities may compete against. We believe that our neutrality has helped us become a trusted participant in the entertainment industry, promoting the adoption of our technologies and enabling us to maintain strong relationships with a variety of companies that often compete against one another. For example, motion picture studios and cinema operators often call on our expertise to resolve technical problems between them, in part because we are not aligned primarily with either industry. We believe that our neutrality also helps us license our technologies to a broad range of consumer electronics product manufacturers because they do not face us as a competitor in their markets, nor are we aligned with their competitors.
The strength of our brand
We believe the Dolby brand is recognized globally and is synonymous with quality, excellence and innovation for content producers, consumer electronics product manufacturers and consumers alike. We also believe that a number of factors, including our history of developing and delivering innovative technology solutions, our commitment to quality and superior customer service, our broad, deep and long-standing industry relationships, and our broad market presence all contribute to the strength of our brand. Even though not required by contract to do so, our customers put the Dolby trademarks on their movie prints, posters, promotional materials, broadcasts, DVD packaging and consumer electronics products, demonstrating their belief that audiences and consumers associate the Dolby brand with qualities that help differentiate and sell their products.
Our high quality management team and employee base
Over the years, Ray Dolby, our founder, has assembled a strong, experienced management team that is focused on developing innovative and enduring technologies for the entertainment industry. In addition, we have a highly skilled engineering team with technical knowledge in a broad range of scientific disciplines. Many members of our management team and employee base have been with Dolby Laboratories for over 20 years. During this time, members of our management and engineering teams have developed many strong, long-term relationships with industry professionals throughout the entertainment chain, including filmmakers, motion picture studios, broadcasters, film distributors, cinema operators, home media companies, manufacturers of a broad array of consumer electronic products and software developers. Members of our management team and engineers also participate in professional organizations and industry standards bodies throughout the world.
Our Strategy
Our objective is to be an essential element in the best entertainment technology. We intend to capitalize on our innovative culture, our strong industry relationships, our global market presence and our strong brand to continue developing and delivering innovative, enduring technologies for both professionals and consumers that help make entertainment more realistic, intense and immersive in theatres, at home, in cars and elsewhere. Key elements of our strategy include:
Expanding markets for surround sound
Dolby Stereo, Dolby Surround and Dolby Digital have created a consumer expectation for surround sound in high-quality entertainment. We intend to continue to promote the expansion of markets for surround sound. In addition to home theatre systems, we are promoting the continued adoption of our surround sound technologies
62
Table of Contents
in video game consoles, personal audio and video players, personal computers, in-car entertainment systems and other consumer electronics products. We also believe that the large and growing installed base of surround sound systems offers attractive opportunities for content providers to deliver surround sound in new applications, regardless of whether the content is played back from a recording, such as a DVD, broadcast by television, satellite or cable, or streamed over the Internet. In particular, we intend to broaden our presence in the broadcast industry, as this industry increasingly produces live and recorded programming in surround sound. As the entertainment industry increasingly delivers content directly to consumers over broadband networks, we are working with content providers to include surround sound technologies in their Internet entertainment, including audio-only entertainment, movie downloads and on-line games.
Continuing to address the needs of industry professionals
We believe that technology innovations for entertainment will likely continue to be adopted first for professional use as filmmakers, music producers, broadcasters and video game designers look for ways to excite their audiences. We intend to continue to collaborate with industry professionals at each link in the entertainment chain to develop new technologies that facilitate and improve content recording, distribution and playback. Our professional-level technology solutions often have applicability to the consumer arena. When they do, we intend to continue to adapt these technologies for use in consumer applications. Our noise reduction, surround sound and digital audio technologies were all initially developed for professional use and later adapted for use in consumer electronics products. We believe that our success in developing technologies for professional use contributes greatly to the capabilities and attractiveness of our technologies in the consumer arena and also to the strength of our brand. We also believe that the use of our technologies by professionals in the creation and distribution of content creates demand for the adoption of our technologies for use in consumer applications.
Developing system solutions for digital cinema
The cinema industry is in the early stages of adopting digital cinema, an all digital medium for the distribution and exhibition of movies. Digital cinema offers the industry possible means to achieve substantial cost savings in printing and distributing movies, to combat piracy and to enable movies to be played repeatedly without degradation in image or sound quality. We are committed to this transition, and we believe that our experience and expertise in providing technology solutions for both the motion picture and broadcast industries position us well to develop and deliver sound and image technologies for digital cinema. Motion picture studios currently use our digital cinema mastering services at our facilities in Southern California to prepare movies for digital release, and filmmakers can review sound and image quality in our digital cinema screening rooms. In addition, our engineers assist motion picture studios and cinema operators with distributing and presenting digital movies, from site surveys and equipment installations to content loading and verification. Regardless of how quickly digital cinema is adopted, we believe that digital cinema also provides opportunities for the development of innovations to enhance the theatrical experience further, innovations that may also have applicability to broadcasting and the consumer arena.
Developing technologies for the entertainment industry beyond sound
We believe that our long history of developing innovative technology solutions for the entertainment industry and our well-established relationships with industry participants provide us with opportunities to deliver technology solutions in areas beyond sound. In recent years we have expanded our business to offer technologies to facilitate delivery of digital entertainment, including digital cinema technologies for processing digital moving images and content protection. We intend to apply the technologies for digital cinema to the broadcast and consumer arenas, as we believe they have the potential to provide significant benefits beyond the motion picture industry. In addition, we are exploring other areas where we may be able to develop and deliver technologies that enrich the entertainment experience, including technologies for home networking and wireless connectivity and technologies that facilitate ease of use of products and product features.
Continuing to promote adoption of our technologies as industry standards
We believe that the entertainment industry evolves toward an improved entertainment experience through the adoption of global technical standards, and we intend to continue to actively seek to have our technologies
63
Table of Contents
adopted as industry standards. We intend to continue to develop, maintain and strengthen our relationships with a broad spectrum of entertainment industry participants, professional organizations and standards-setting bodies throughout the world to help guide the development of new industry standards, as well as the direction of our own technologies to meet those standards. When appropriate, we intend to continue to be active in standards-setting bodies. We also intend to maintain our neutrality and not align ourselves exclusively with other industry participants in order to facilitate the adoption of our technologies as industry standards.
Building on the strength of the Dolby brand
We intend to continue to enhance and build on the strength of the Dolby brand and our reputation as a trusted provider of entertainment technologies for professional and consumer applications. We actively encourage our customers to place our trademarks on their products. In particular, we provide marketing materials such as posters, trailers and plaques to cinema operators for exhibition in their theatres to help them promote the quality of experience that is associated with our brand. We also have been working with personal computer and car manufacturers to incorporate our technologies in and display our trademark on their personal computers and in-car entertainment systems. The inclusion of the Dolby trademark on a product informs audiences and consumers that the product incorporates our technologies and meets our quality standards, and we believe this helps manufacturers sell their products. We intend to continue to increase the use of our trademarks throughout the entertainment chain so that entertainment industry professionals and consumers alike will know that we have helped ensure consistent quality as content moves through the chain. We believe that the strength of our brand in the entertainment industry also assists us in expanding our business to include technologies that are not solely related to sound. For example, we believe that the likelihood of succeeding with our digital cinema initiative is increased because the Dolby brand is already well known and well respected in the motion picture industry, as is our history of delivering innovative, yet practical, solutions in response to technology challenges.
Industry Background
The global entertainment industry is in the midst of a transition from analog to digital technologies. Advancements in digital entertainment technologies have led to enhanced consumer entertainment experiences through higher fidelity sound; more dynamic sound effects; discrete surround sound; higher resolution video images; smaller file sizes and reduced storage costs; greater portability; simpler, faster and higher capacity means to distribute content; and greater interoperability across a variety of playback devices. New digital media formats and products, such as DVD players, DVD recorders, HDTV, digital cable and personal computer-based video, music and game systems, have been introduced over the past several years. These technological advances have affected a broad range of entertainment formats, including movies, broadcasts, music, video games, personal computers and personal audio and video players, as well as a wide variety of playback environments, including theatres, homes and automobiles.
Consumers are helping to drive the transition to digital entertainment through their rapid adoption of new digital consumer electronics products that allow them to play back audio and video in their homes, cars and elsewhere. Growth in sales of digital-based consumer electronics products has increased significantly in recent years. For example, according to the October 2004 report “Worldwide and U.S. DVD Player Forecast and Analysis, 2004-2008” and the December 2001 report “U.S. DVD Player Market Forecast, 2000-2005” of independent market research firm International Data Corporation, or IDC, worldwide DVD player shipments increased from approximately 13.5 million in 2000 to approximately 89.9 million in 2003, resulting in a compound annual growth rate of approximately 88%. This growth in sales of digital-based consumer electronics products has coincided with increased consumer spending on electronic entertainment generally. According to the Consumer Electronics Association, or CEA, the average annual spending on consumer electronics per household in the United States has increased from approximately $600 in 1990 to approximately $1,100 in 2003. CEA defines consumer electronics to include consumer video products, home audio products and computers, peripherals and software, as well as video game hardware and software, portable audio products, mobile electronics, telephone and home office products, and blank media and accessories.
64
Table of Contents
Traditional Analog Entertainment
All recorded and broadcast sound—movie soundtracks, phonograph records, radio and TV—was originally delivered in a single-channel, or mono, format. Then, in the early 1950s, multichannel, or stereophonic, film sound was introduced in cinemas by means of a costly new magnetic soundtrack technology. This was followed in 1958 by the introduction to consumers of two-channel stereo via LP phonograph records. FM and television broadcasting, and later videocassettes, ultimately followed suit with two-channel stereo, which became the standard for home entertainment media.
In the mid-1960s through the early 1990s, we introduced analog noise reduction technologies that improved the fidelity of master tapes used in the making of phonograph records. Our noise reduction technologies also enabled high-quality professional multitrack music recording and helped turn the audio tape cassette into a high-fidelity medium. In the mid 1970s, we also applied noise reduction and other technologies to movie soundtracks, enabling a practical four-channel surround sound format for cinemas that soon became virtually standard worldwide. These same technologies brought surround sound into the home in the early 1980s via specially encoded stereo video cassettes and TV broadcasts, creating a new category of consumer entertainment product, home theatre.
Evolution to Digital Entertainment
In 1982, the consumer music-listening experience was revolutionized by digital audio technology with the introduction of the compact disc, or CD. The CD brought higher audio quality, virtual immunity to wear and tear and other advantages that underscored the limitations of analog audio technology, as refined as it had become. The CD soon overtook analog phonograph records and audio cassettes, and spurred the conversion of other entertainment media from analog to digital, beginning with motion picture sound.
In 1991, we introduced a digital film sound format that provides high-quality sound delivered via five separate, full-range audio channels: left, center and right front channels; independent left and right surround channels; and a sixth channel for low-frequency effects, often referred to as the “.1” channel. Dolby Digital 5.1 surround enabled filmmakers and cinema operators to deliver a more dramatic and involving entertainment experience, such that today virtually all major film studios worldwide release their feature films with 5.1 digital soundtracks, and most major cinema operators have installed digital surround sound playback systems.
The 5.1-channel digital revolution then spread to consumer video and home theatre via the DVD-Video disc, for which Dolby Digital is one of two global standard formats, the other being PCM, approved by the DVD Forum for encoding soundtracks on DVD-Video discs. DVD-Video was adopted by consumers in part because of the rich, realistic home theatre experience provided by its high-quality picture and 5.1 surround sound. And today the digital revolution, complete with Dolby Digital 5.1 surround sound, has spread to digital television, digital cable, and direct broadcast satellite as well.
The transition to digital technologies for the motion picture industry is now going beyond sound. The cinema industry is in the early stages of transitioning to digital cinema, where movies can be distributed and exhibited in an all digital format. Digital cinema delivers higher resolution images and enables movies to be played repeatedly without degradation in image or sound quality. Digital cinema also offers the motion picture industry a possible means to achieve substantial cost savings by eliminating the need to physically print and distribute multiple reels of celluloid film for each movie, as digital movies can be distributed to cinemas by satellite broadcast. Digital cinema also may offer means to combat piracy through watermarking, interference and other techniques. Digital cinema is in the early stages of adoption, but it is expected that many cinema operators will adopt digital cinema technologies both for their newly constructed theatres as well as for retrofitting their existing theatres.
Consumers at home in recent years have also been seeking an immersive entertainment experience similar to the cinema. The commercialization of the DVD in 1997, which provides a feature-rich media format with high image picture quality and 5.1 digital audio soundtracks, helps deliver to consumers a cinematic experience in their homes. In the 1990s and early 2000s, movies and other content became widely available on DVDs. DVD
65
Table of Contents
players quickly supplanted VCRs as the preferred home video player, with annual sales for DVDs surpassing videocassettes in 2001, helped in part by the ever decreasing prices of DVD players. More recently, there has been widespread adoption of digital-based home theatre systems. According to its October 2004 report, “Worldwide and U.S. DVD Player Forecast and Analysis, 2004-2008,” IDC expects worldwide DVD player shipments to grow at a compound annual growth rate of 16.4% from 2003 through 2008, with such growth coming primarily from DVD recorders, home-theatre-in-a-box systems and portable DVD players. The following chart details IDC’s estimates of total DVD player shipments worldwide through 2008.
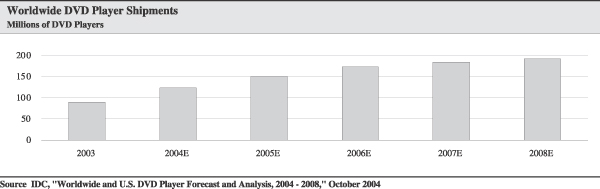
The large installed base of digital-based home theatre systems with surround sound capabilities also enables television broadcasters to offer to a large audience programming with digital audio that is comparable to or exceeds the quality available on DVDs. As a result, broadcasters can compete more effectively with DVD entertainment. Through digital cable and digital satellite television systems, broadcasters can deliver consumers improved image quality as well as digital audio surround sound, enabling audiences to experience a more realistic, immersive broadcast entertainment through their home theatre systems. Broadcasters, including ABC, CBS, ESPN, FOX, HBO, NBC and Showtime, currently offer high-definition video or surround sound for selected programming.
Governments worldwide are playing an important role in driving digital broadcasting by mandating that broadcasters transition to digital signals. Currently, all local terrestrial television stations in the United States are supposed to broadcast with digital signals. According to IDC’s May 2004 report, “Worldwide and U.S. Digital TV 2004-2008 Forecast,” there are approximately 275 million television sets in the United States, 9.2 million of which are digital. International markets are also planning to convert television signals to digital, although many are converting at a pace slower than the United States. For instance, analog broadcasts are expected to end by 2008 in Germany and 2012 in the United Kingdom. The following chart details IDC’s estimates of Digital TV shipments worldwide through 2008.
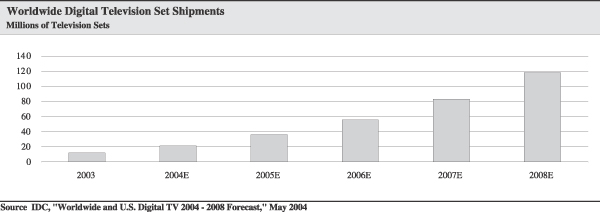
66
Table of Contents
An important factor driving the adoption of digital technologies for multimedia applications has been the proliferation of the personal computer. The affordability of personal computers, coupled with increases in processing power, functionality and storage, have enabled personal computers to become powerful and versatile multimedia devices. In recent years, people have increasingly used their computers to listen to music, view movies, play games and download content. In its March 2004 report, “U.S. Home Networking 2004-2008 Forecast,” IDC estimates that the number of households that have personal computers that store multimedia files and that are accessed by televisions, stereos or other devices will grow by over 70% in 2004 and is expected to be more than 10 million households in 2008. Personal computers can provide centralized management of DVDs, CDs, MP3s and other digital content. The following chart details IDC’s estimates of DVD drive shipments for personal computers worldwide through 2008.
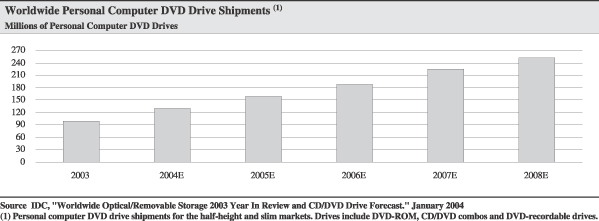
In addition, video game designers are incorporating surround sound technologies into their games to create a more immersive entertainment experience through the connection of the game console with a surround sound system. Video game designers who currently incorporate surround sound formats in their games include Electronic Arts, Microsoft Game Studio, Nintendo and SCEA. In addition, manufacturers of video game consoles have configured their consoles with outputs that enable consumers to enjoy their video games in surround sound.
The market for digital entertainment applications for use in factory installed automobile sound systems is also growing. Opportunities for entertainment technologies in this market include upgrading sound systems through the incorporation of satellite radio, digital audio and surround sound technologies, taking advantage of the multiple audio speakers already found in most cars, as well as additional growth and improvement in rear seat DVD entertainment systems. Currently Acura, Aston Martin, Cadillac, Infiniti, Maybach, Toyota and Volvo offer surround sound systems in some of their models, and many manufacturers already feature rear seat DVD entertainment systems as an option in some of their models, such as minivans or SUVs. Furthermore, manufacturers of factory installed entertainment systems such as Alpine, Eclipse, Kenwood, Panasonic and Pioneer also offer aftermarket multimedia systems for existing vehicle upgrades. According to Arbitron’s 2003 National In-Car Study, Americans report spending an average of 15 hours a week in their cars, either as a driver or a passenger. In addition, Arbitron reports that 39% of Americans say they are spending more time in their cars than one year ago. We believe that, as consumers spend more time in their cars, they will be more likely to seek high quality entertainment experiences for this environment.
Dolby Entertainment Chain
We deliver products, services and technologies throughout the entertainment chain, including to filmmakers, television producers, music producers, video game designers, movie distributors, cinema operators, DVD producers, television broadcasters, software developers and manufacturers of consumer electronic products. We participate in every link in the entertainment chain through the products we manufacture, the production services
67
Table of Contents
we provide and the technologies we license. In addition, the Dolby brand is recognized and used at each link in the chain.
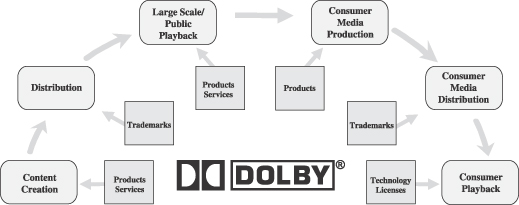
Content creation
Our products and services help artists and content producers create realistic and intense sound. Our technologies also help maintain sound quality while simultaneously enabling it to fit within the storage capacity and distribution limitations of the particular recording medium. Our products and technologies have been used in the production of over 16,000 movies, tens of thousands of DVD titles and hundreds of video game titles worldwide.
Filmmakers use our proprietary encoding products and services during post-production to help ensure that their movie soundtracks are recorded properly and will play back in theatres as the filmmaker envisions. Our encoders are used by filmmakers and studios in nearly 50 countries in making their movies. We do not sell encoders to filmmakers, but rather provide them for use in movie production under our production services agreements. Our global presence enables us to work closely with filmmakers and studios throughout the world to help accurately capture the filmmaker’s vision on the recorded soundtrack. We have longstanding relationships with filmmakers and virtually all major motion picture studios. Dolby SR, an analog technology, and Dolby Digital are de facto industry standards in motion picture production, meaning that virtually all major movie titles throughout the world are released with one or both soundtrack formats.
Television producers and broadcasters throughout the world purchase and use our professional encoders, decoders and processors to record and transmit both recorded and live television programming with surround sound. Over 40 television shows are currently produced using Dolby encoding technologies. Examples of recorded television shows broadcast with Dolby technologies include HBO’sThe Sopranos, ABC’sDesperate Housewives, PBS’sAustin City Limits and NBC’sAmerican Dreams. Examples of live programming broadcast with Dolby technologies include the Super Bowl, ABC’s broadcast ofThe Academy Awards, CBS’s broadcast ofThe Grammy Awards, FOX’s broadcast ofThe NFL on FOX, Athens Olympic Broadcasting’s broadcasts of certain events in the XXVIII Summer Games, Sat.1’s (Germany) broadcast of Champions League Football, ORF’s (Austria) broadcast of the Vienna New Year’s Day concert and NHK’s (Japan) broadcast of the Nodo Giman sing-along show.
With the advent of DVD technologies, music content is increasingly being produced in digital surround sound through the use of our encoding products. In addition, with the proliferation of home theatre systems with surround sound capabilities, video game designers are increasingly using our encoding products to produce games with surround sound. Our technologies are used to enhance the video game experience by making real-time sounds and cinematic clips more realistic and immersive, putting the player “inside the action.”
68
Table of Contents
Distribution of content for large-scale playback
We sell products that modify optical recording equipment to allow the Dolby Digital soundtrack from the film master to be recorded onto film prints for distribution to theatres worldwide. Film distributors use our engineering services to check prints for both sound and picture quality before distribution. Once the original film has been completed, distributors use our products and services to create foreign language versions. This process essentially involves replacing the original dialogue with the local languages and is usually done in the local country. We also license our trademarks to motion picture studios and distributors for placement in film prints and promotional materials, such as movie posters, to signify that a movie has been made utilizing our technologies.
Large-scale public playback
Cinema operators purchase and use our cinema processors, cinema adapters and sound readers to decode movie soundtracks encoded in Dolby SR or Dolby Digital, delivering to audiences the high quality sound the filmmaker intended them to hear. We have sold over 73,000 cinema processors worldwide. Our cinema processors can decode both analog and digital soundtracks on the film and separate the different sound channels for distribution to the specific speakers in the theatre. The sound characteristic and level of each loudspeaker are also vital elements of a theatre’s sound system that are controlled by our cinema processors. We can also provide training, system design expertise and on-site technical expertise to cinema operators throughout the world to help them configure their theatres and sound equipment to ensure that movie soundtracks are replayed with consistent high sound quality. Our engineers are often hired by the film’s distributor to check the calibration of a theatre’s sound system for important screenings, such as premieres and press screenings. In addition, our engineers can help optimize a theatre’s on-screen image using specialized test equipment and expertise. Our cinema operator customers include virtually all major theatre chains in the world.
Consumer media production
Movies and other types of entertainment such as television programs are often repackaged for viewing on DVDs. DVD producers purchase and use our professional encoders to encode the source audio on a DVD so that the soundtrack can be replayed as originally recorded on the master copy. Our digital audio coding technologies enable sound to be stored efficiently within the limited storage capacity of the DVD, allowing high picture quality while saving space on the disc for foreign language soundtracks, directors’ commentaries and other bonus material. Dolby Digital is one of the two global standard formats, along with PCM, approved by the DVD Forum for encoding soundtracks on DVD-Video discs, and as a result virtually all DVD players incorporate our Dolby Digital decoding technology.
Consumer media distribution
Just as we license film distributors the right to use the Dolby trademark on film prints and related promotional materials, we license motion picture studios and other DVD distributors the right to place the Dolby trademark on packaging of their DVDs. This enables consumers to identify the sound format of a DVD, and the motion picture studios and other distributors of DVDs to inform consumers that a DVD soundtrack meets our quality standards. Over the years, tens of thousands of DVD titles have been produced with Dolby Digital encoded soundtracks. Packaged media that incorporate our technologies, including video games and DVD-Audio, also generally carry our trademarks.
Broadcasters purchase and use our professional broadcasting products to encode program content for television, cable and satellite broadcast transmissions to deliver to their audiences high quality surround sound. Our digital audio compression technologies also enable sound to be recorded and transmitted efficiently, which is especially important in the broadcast industry because transmission bandwidth is limited. Our broadcasting products also can facilitate the editing and routing of surround sound in transmission facilities originally designed for stereo audio. Our decoding and monitoring products help content creators evaluate accurately how their soundtracks will be reproduced in broadcast transmissions. Our sound engineers can provide training, broadcast system design expertise and on-site technical expertise to broadcasters throughout the world. We also
69
Table of Contents
license the Dolby trademark to broadcasters who frequently include the Dolby trademarks in their broadcasts to signify that a program has been broadcast using our Dolby Surround or Dolby Digital technologies.
Dolby Digital audio is the sound format standard for digital terrestrial and cable television in North America. In addition, in Europe, Australia and Asia, broadcasters have the option of including Dolby Digital audio with their digital broadcasts services under the digital video broadcasting or the Advanced Television Systems Committee standards.
Our broadcasting technologies have also been used in North America and Europe in connection with radio services that are delivered through satellite and cable systems.
Consumer playback
We license our surround sound decoding technologies to manufacturers of DVD players, DVD recorders, home theatre systems, television sets, set-top boxes, video game consoles, portable audio and video players, personal computers, in-car entertainment systems and other consumer electronics products, as well as developers of software for personal computer software DVD players. Our licensees manufacture and distribute consumer electronics products incorporating our technology throughout the world, and are located in nearly 30 countries. Software developers typically design personal computer software DVD players to include a variety of sound capabilities, including basic stereo decoding, surround sound decoding and advanced rendering. In addition, we license our trademarks so that consumer electronics product manufacturers can indicate to consumers that their products meet the quality standards we have set. To date, manufacturers of consumer electronics products have sold over 1.6 billion units that have incorporated our technologies.
For many types of consumer electronics products, our technologies are included in explicit industry standards. Examples include DVD-Audio players and Digital Radio Mondiale digital radio service for short wave radio transmission worldwide, digital television receivers and set-top boxes in North America and high definition televisions in Australia. In addition, Dolby technologies are de facto industry standards in many consumer electronics products. For example, virtually all DVD players incorporate our Dolby Digital decoding technologies.
How We Derive Revenue
We conduct our business in two segments: selling professional products and related production services and licensing our technologies to manufacturers of consumer electronics products and software developers.
In our products and services segment, we design, manufacture and distribute audio products for the motion picture, broadcast, music and video game industries to improve sound quality, provide surround sound and increase the efficiency of sound storage and distribution. The majority of our professional product revenue is derived from sales of cinema processors, which theatres use to decode digital and analog film soundtracks that have been encoded using Dolby SR or Dolby Digital technologies. Our sound engineers work alongside filmmakers, television broadcasters, music producers and video game designers to help them use our products to create and reproduce the sound they envision. Our sound engineers provide training, system design expertise and on-site technical expertise to cinema operators to help them configure their theatres and sound equipment to ensure that movie soundtracks are replayed with consistent high sound quality. In fiscal 2002, 2003 and 2004, our professional products and services revenue represented 34%, 27% and 27% of our total revenue, respectively.
In our technology licensing segment, we license our technologies to manufacturers of DVD players, DVD recorders, audio/video receivers, television sets, set-top boxes, video game consoles, personal audio and video players, personal computers, in-car entertainment systems and other consumer electronics products, as well as to developers of software for personal computer software DVD players. Our licensing arrangements typically entitle us to receive a specified royalty for every consumer electronics product shipped by our licensees that incorporates our technologies. In fiscal 2002, 2003 and 2004, our licensing revenue represented 66%, 73% and 73% of our total revenue, respectively.
70
Table of Contents
Technology
Our core technologies are signal processing systems that improve basic sound quality or enable surround sound in movie soundtracks, DVDs, video games, television, satellite and cable broadcasts, and audio and videotapes. Many of our technologies are incorporated into professional audio products that we manufacture, including cinema sound processors and digital audio encoders and decoders. These products are used worldwide in recording and postproduction studios, broadcast facilities and theatres. We also license our technologies to manufacturers of consumer electronics products for incorporation into their products, including DVD players, audio/video receivers, television sets, set-top boxes, video game consoles, personal audio players, personal computers, in-car entertainment systems and other consumer electronics products.
Film Sound
The following table describes our film sound technologies:
Technology | Date First | First Feature | Description/Use | |||
Dolby System (mono) | February 1972 | Callan, 1974 | The first use of Dolby A-type noise reduction on analog optical film soundtracks. This technology increased the frequency response, lowered the noise level and lowered distortion. | |||
Dolby Stereo | November 1974 | Lisztomania, 1975 | Our original multi-channel analog optical soundtrack. Dolby Stereo prints have two soundtracks encoded with four sound channels: left, center and right for speakers behind the screen, and a fourth surround channel for ambient sound and special effects heard over speakers to the sides and rear of the cinema (added forA Star Is Born in 1976 andStar Wars in 1977). This format also uses Dolby A-type noise reduction to improve the fidelity of the optical track. The Dolby Stereo track was designed so that the print could be played in any theatre in the world that processes 35 mm film, even if the theatre did not have our decoding equipment. | |||
Dolby SR | March 1986 | Innerspace andRobocop, 1987 | Enhancement to Dolby Stereo, utilizing Dolby SR signal processing instead of A-type noise reduction. Dolby SR soundtracks feature a significantly improved dynamic range, and are found today on almost all major 35 mm release prints. | |||
Dolby Digital (for cinema) | February 1991 | Batman Returns, 1992 | Features a digital optical soundtrack located between the sprocket holes on one side of 35 mm release prints. Dolby Digital provides 5.1 digital audio surround sound. A Dolby Digital print also carries a Dolby SR analog soundtrack to make the print compatible with any theatre in the world that processes 35 mm film, even if it does not have Dolby Digital decoding equipment. | |||
| Dolby Digital Surround EX | October 1998 | Star Wars: Episode 1—The Phantom Menace, 1999 | Adds a third surround channel to the Dolby Digital format. The third channel is reproduced by rear-wall surround speakers, while the left and right surround channels are reproduced by speakers on the side walls. | |||
71
Table of Contents
Digital Audio Coding
We have developed digital audio coding technologies for use in a wide range of entertainment industries. Based on research into the characteristics of human hearing, the sophisticated algorithms used in our digital audio technologies make it possible to store or transmit digital audio using less data than would otherwise be necessary, without noticeable loss of sound quality. The following table describes the digital audio coding technologies that we use or license:
Technology | Date First | Description/Use | ||
Dolby AC-2 | October 1989 | Provides professional audio quality digital sound using less data and lower bandwidth, reducing the data capacity required in applications such as satellite and terrestrial transmissions. | ||
Dolby Digital (AC-3) | February 1991 | Used to provide surround sound in theatres from 35 mm film, and in the home from DVDs, digital broadcast television, cable and satellite systems, and laser discs. Enables the storage and transmission of up to five full-range audio channels, plus a low-frequency effects channel, using less data bandwidth than is required for just one channel of music on a compact disc. | ||
MLP Lossless | June 1998 | A “lossless” coding system specified for DVD-Audio that compacts data with bit-for-bit accuracy. MLP, or Meridian Lossless Packing, effectively doubles disc space without affecting the quality of high-resolution PCM audio. | ||
Dolby E | April 1999 | A professional digital audio coding system developed to assist the conversion of two-channel broadcast facilities to multi-channel audio. | ||
Advanced Audio Coding (AAC) | January 2001 | A high-quality audio coding technology appropriate for many broadcast and electronic music-distribution applications. Dolby Laboratories was one of the four developers of this technology. Although we have developed versions of AAC technology that also incorporate our proprietary technologies, we generally participate in licensing of AAC technology through patent pools comprised of groups of patents held by us and other companies and administered by Via Licensing, one of our wholly-owned subsidiaries. See “Technology Licensing Segment” for a further description of our patent pool licensing activities through Via Licensing. | ||
Dolby Digital Plus | October 2004 | Dolby Digital Plus is a new digital audio coding technology, built as an extension to Dolby Digital technologies. With the addition of new coding techniques and an expanded bitstream structure, Dolby Digital Plus offers greater efficiency for lower bitrates, as well as the option for more channels and higher bitrates. Dolby Digital Plus can support a wide range of current and emerging applications such as digital television, Internet delivered audio for interactive programs and high definition video disc formats. Dolby Digital Plus is compatible with all existing Dolby Digital decoders. | ||
72
Table of Contents
Analog Signal Processing Technologies
The following table describes our analog signal processing technologies, including our noise reduction technologies:
Technology | Date First Publicly | Description/Use | ||
A-type Noise Reduction | May 1966 | Used by professional recording studios and film studios to improve master tape and film sound. | ||
B-type and C-type Noise Reduction | B-type: June 1968
C-type: October 1980 | Designed for consumer tape recording and playback to reduce background noise. B-type is included in cassette recorders and players designed for use in home audio systems, and is also used in the preparation of almost all prerecorded cassettes. C-type is included along with B-type in many mid-price cassette units designed for use in home audio systems. | ||
| HX Pro | January 1982 | A technology for improving the ability of cassette tapes to record high-level, high frequency signals. | ||
Spectral Recording (SR) | March 1986 | Extends the overall dynamic range of analog media to rival that of digital formats. The analog soundtracks on virtually all 35 mm movie release prints from major motion picture studios worldwide are recorded with Dolby SR. | ||
S-type Noise Reduction | October 1989 | Our highest-performance system for analog cassette recording. It is included, along with B- and C-type noise reduction, in many mid-range to high-end cassette decks designed for use in home audio systems. | ||
Consumer Surround Sound
The following table describes our consumer surround sound technologies:
Technology | Date First Publicly | Description/Use | ||
| Dolby Surround | December 1982 | The consumer version of our original analog film surround sound format. When a Dolby Surround soundtrack is produced, four channels of audio information—left, center, right and surround—are encoded onto two audio tracks. These two tracks are then carried on stereo programs such as videotapes and television broadcasts into the home, where they can be decoded to recreate the original four channels and the surround sound experience. Thousands of feature films on home video, as well as dozens of television shows and specials, are encoded in Dolby Surround. | ||
Dolby Surround Pro Logic | January 1987 | An improved decoder for Dolby Surround. Like the professional decoder units used in cinemas, Dolby Surround Pro Logic reconstructs the original four channels—left, center, right and surround—that were encoded onto the program material’s two channel soundtracks. | ||
Dolby Digital (for consumer electronics products) | August 1992 | Technologies for digital audio encoding and decoding of consumer formats such as DVDs and DTV. As with film sound, Dolby Digital can provide up to five full-range channels for left, center and right channels and independent left and right surround channels, and a sixth channel for low-frequency effects. | ||
73
Table of Contents
Technology | Date First Publicly | Description/Use | ||
Virtual Dolby Surround and Virtual Dolby Digital | January 1997 | Enables a surround-sound experience using just two speakers in, for example, a stereo-capable TV set or other two channel playback system. | ||
| Dolby Headphone | January 2000 | A signal processing system that enables conventional stereo headphones to portray the sound of a multispeaker surround sound system found in actual listening rooms. | ||
Dolby Surround Pro Logic II | April 2001 | A further improved decoding technology that provides better spatiality and directionality on Dolby Surround program material. | ||
Dolby Virtual Speaker | October 2002 | Simulates 5.1 surround sound from both multi-channel and two channel programs over as few as two speakers. | ||
Content Protection Technologies
We intend to offer content protection technologies and services to the entertainment industry under the Cinea brand name. The following table describes our content protection technologies:
Technology | Description/Use | |
| Closed-Loop Key Management | Manages keys used for encrypting and decrypting content through automatic key generation, secure key transport, recipient authentication and validation, and auditing and logging feedback allowing for the detection of tampering. | |
| Forensic Watermarking | Deters piracy by enabling content owners to track pirated material back to its source by placing identifying data in copyrighted material. Our patented watermarking technologies determine mark placement, message creation and insertion while preserving image quality. | |
| Optical Technology | Inhibits movie piracy by degrading the quality of images made by hand-held camcorders in the theatre. Our optical technologies are designed to modulate light to create flicker patterns, which are embedded in the image, ultimately distorting the camcorder recording without impacting the audience. | |
Products and Services Segment
Professional Products
We design and manufacture professional audio products for a broad array of entertainment industries, including the motion picture, music, video game, home video and broadcast industries. Our professional products, which are distributed in over 50 countries, are used in content creation, distribution and playback to provide surround sound, improve sound quality and increase the efficiency of sound storage and distribution. We manufacture our professional products in our two manufacturing facilities, located in Brisbane, California and Wootton Bassett, England.
Content creators, distributors and broadcasters. Filmmakers, music producers, video game designers, broadcasters and DVD producers use our professional products to produce and distribute entertainment incorporating our sound technologies. We typically enter into service agreements with motion picture studios or filmmakers in connection with the production of a particular film. Under these agreements, we provide our encoders to the studio for use during sound mixing, enabling them to create films with Dolby soundtracks using
74
Table of Contents
our proprietary technologies. We sell products to the digital television, music, video game and home video industries. The professional products used by these content creators and distributors include the following:
Product Category | Products | Description/Use | ||||
| Dolby Digital | · DP569 Multi-channel Encoder | Utilized to encode and decode multi-channel audio in a variety of media, including cinema sound, DVDs, DTV, HDTV, music, video games and digital radio. | ||||
· DP564 Multi-channel Audio Decoder | ||||||
· Surround EX Encoder | ||||||
· Surround EX Decoder | ||||||
· DP570 Multi-channel Audio Tool | ||||||
| Dolby E | · DP571 Encoder | Developed for DTV and HDTV program producers and broadcasters. Enables the distribution of up to eight channels of high-quality digital audio plus Dolby Digital metadata — high-level descriptive information about the audio, video and other elements of a stored or transmitted entertainment program — through two-channel postproduction and broadcasting infrastructures. | ||||
· DP572 Decoder | ||||||
· DP570 Multi-channel Audio Tool
| ||||||
| Test and Measurement | · LM100 Broadcast Loudness Meter | Used for applications in postproduction and television broadcast facilities. | ||||
· DM100 Bitstream Analyzer | ||||||
· Model 737 Film Soundtrack Loudness Meter | ||||||
| Dolby Surround and Dolby Pro Logic II | · DP563 Dolby Surround and Pro Logic II Encoder | Enables any two-channel audio medium to carry four-channel sound. Used for applications in postproduction, television broadcast, video-game creation and recording facilities. | ||||
· DP564 Multi-channel Audio Decoder | ||||||
· Model SEU4 Dolby Surround Encoder | ||||||
· Model SDU4 Dolby Surround Decoder | ||||||
| Dolby SR and A-type | · Model 363 noise reduction unit | Improves the dynamic range and reduces noise of analog recordings and transmissions in professional audio production. | ||||
| Signal Processing | · Model 585 Time Scaling Processor | Used for recording and film production applications. | ||||
· Model 740 Spectral Processor | ||||||
| ISDN, Cable and Satellite Audio | · DP503 Digital Audio Encoder | Designed for transmission systems requiring high-quality audio with spectrum-efficient data rates. | ||||
· DP524 Digital Audio Decoder
| ||||||
| Tape Duplication | · Models 422 and 422B processors | Enables Dolby B-type and C-type noise reduction for audio and videotape duplication. | ||||
75
Table of Contents
Cinema Operators. Cinema operators use our professional products to play motion picture soundtracks that have been produced using our sound technologies. The professional products we sell to cinema operators include the following:
Product Category | Products | Description/Use | ||||
| Cinema Processors | · CP650XO, CP650, CP650D and CP650SR Digital Cinema Processors | Used to decode a film’s soundtrack and calibrate the sound system in a movie theatre. | ||||
· CP45, CP65 and CP200 Cinema Processors | ||||||
| Cinema Adapters | · Digital Media Adapter Model DMA 8 | Used to adapt existing cinema sound systems to the latest sound formats. | ||||
· DA20 Digital Film Sound Processor | ||||||
· SA10 Surround Adapter | ||||||
| Cinema Subtitle | · ScreenTalk | Provides full-color digital subtitles and audio commentary for the hearing and visually impaired. | ||||
| Sound Readers | · Dolby 702 Digital Soundhead | Attaches directly to many current and older cinema projectors, enabling playback of Dolby Digital and Dolby Digital Surround EX soundtracks. | ||||
Digital Cinema. We have designed professional products which will enable cinemas to store and playback films released in an all digital format. Our digital cinema products include the following:
Products | Description of Products | |
| Dolby Show Store | Loads and stores encrypted digital film files. | |
| Dolby Show Player | Decrypts and decodes digital film files for presentation on a digital projector. | |
Professional Services
We offer a variety of production services to support the motion picture, broadcast, recording and video game industries. Our sound engineers work alongside filmmakers, television broadcasters, music producers and video game designers to help them use our products to create and reproduce the sound they envision. We enter into service agreements with filmmakers on a film-by-film basis to provide them with sound production services related to the preparation of a Dolby soundtrack, such as equipment calibration, mixing room alignment and equalization. Under these service agreements, we also provide a Dolby encoder to the filmmaker for use during sound mixing. We sometimes also provide additional services under these service agreements, for an additional charge, such as print checking and theatre alignment for special screenings.
Our engineers can also provide training, system design expertise and on-site technical expertise to cinema operators throughout the world to help them configure their theatres and sound equipment to ensure that movie soundtracks are replayed with consistent high sound quality. In addition, our engineers can also check the calibration of a theatre’s sound system for important screenings, such as premieres, film festivals and press screenings. Our engineers can also help optimize a theatre’s on-screen image using specialized test equipment and expertise.
Technology Licensing Segment
We license our technologies to manufacturers of consumer electronics products. We utilize two models in our licensing business—a two-tier model and an integrated model. We also license some of our patents as well as patents owned by other entities through patent pools.
76
Table of Contents
Two-Tier Licensing Model
Most of our licensing business consists of a two-tier licensing model whereby our technology algorithms, embodied in C-language reference software code, are first provided under license to a semiconductor manufacturer who incorporates our technologies in a semiconductor chip such as an integrated circuit, or IC. Our licensed semiconductor manufacturers, which we refer to as “implementation licensees,” then sell their ICs to manufacturers of consumer electronics products which also hold licenses to use our technologies and which we refer to as “system licensees.” Our system licensees are separately licensed by us to make and sell end-user consumer electronics products, such as cassette decks, DVD players, DVD recorders, audio/video receivers, television sets, set-top boxes, video game consoles, personal audio and video players, personal computers and in-car entertainment systems, that incorporate ICs purchased from our implementation licensees.
Our implementation licensees may use our reference software and other licensed know-how directly, building and selling core technologies, such as ICs or software library modules. The implementation licensees pay us only a modest, one-time, up-front administrative fee, typically between $10,000 and $20,000, per license. In exchange, the licensee receives a licensing package, which includes certain information useful to build their implementation. Once the licensee has built its implementation, it sends us a sample for quality-control certification. If we certify the implementation, the licensee is permitted to sell the approved implementation to system licensees. We do not receive any royalties from implementation licensees. We work with over 40 semiconductor manufacturers, helping them incorporate our technologies into their ICs. Representative semiconductor manufacturers who are implementation licensees include Cirrus Logic, Industrial Technology Research Institute, Matsushita Electrical, MediaTek, Sony, Yamaha and Zoran.
Our system licensees pay us an initial fee for the technologies they choose to license from us, typically between $10,000 and $20,000. We deliver system licensees a licensing package that includes information useful in utilizing our technologies in their products. Once a system licensee has built a prototype of a product that incorporates our technologies, they send us a sample for quality-control certification. If certified, the licensee is permitted to buy approved implementations from any implementation licensee and to sell approved products to consumers. Unlike sales of ICs by implementation licensees, sales of consumer electronics products incorporating our technologies by system licensees are royalty bearing, generally based upon the number of units shipped by the system licensees that incorporate our technologies. We have licensing arrangements with approximately 500 consumer electronics product manufacturers and software developer licensees located in nearly 30 countries, which typically entitle us to receive a royalty for every product incorporating our technologies shipped by them.
Integrated Licensing Model
In addition to our two-tier licensing model, we also license our technologies, again as embodied in C-language reference software code, to independent software vendors, or ISVs. These ISVs act as combined implementation and system licensees, and incorporate our technologies in software applications such as personal computer software DVD players used in desktop or notebook computers. In these cases, the “implementation” and the “system” are one and the same, typically a software program compiled directly from our reference code. As with the two-tier licensing model, the ISV pays us an initial administrative fee, typically between $10,000 and $20,000. In exchange, the ISV receives a licensing package, which includes information useful in order to incorporate our technologies into the ISV’s software program. Once the ISV has built their software product, they send us a sample for quality-control certification. If certified by us, the ISV is permitted to sell the certified product to consumers, subject to the payment of royalties to us for each unit shipped.
Licensing of Patent Pools
Through our wholly owned subsidiary, Via Licensing, we administer the licensing of some of our patents in “patent pools” with patents owned by other companies. These patent pools allow product manufacturers streamlined access to certain foundational technologies, including aspects of audio coding, video coding, digital radio and wireless Ethernet technologies, among other technologies.
77
Table of Contents
Customers
We have customers in a wide range of entertainment industries, on both the professional products and production services and the technology licensing sides of our business.
Professional Products and Services Customers
We have a broad market presence on the professional products and services side of our business. Our professional products, including cinema processors, are distributed in over 50 countries and our products and technologies have been used in the production of over 16,000 movies, tens of thousands of DVDs and hundreds of video games worldwide. We have sold over 73,000 cinema processors to cinema operators in over 50 countries. We sell our professional products either directly to the end-user customer or, more commonly, through dealers and distributors. The table below lists some of the movie studios, cinema operators, film distributors, broadcasters, and video game designers that use our professional products and production services.
Category | Representative End-Users | |||
Movie Studios | · DreamWorks · New Line Cinema · Paramount · Sony Pictures Entertainment | · Universal Studios · Walt Disney · Warner Brothers | ||
Cinema Operators | · AMC Entertainment · Cinemark USA · EuroPalaces · Loews-Cineplex · National Amusements | · Regal Cinemas · UCI · UGC Cinemas Group · Warner Brothers International Theaters | ||
Film Distributors | · Buena Vista International · Columbia Tristar · Pathé | · 20th Century Fox · United International Pictures · Warner Brothers | ||
Broadcasters: | ||||
Television Networks | · ABC · CBS · FOX | · NBC · PBS | ||
Cable Network Channels | · HBO · Showtime | · Starz! Encore · Turner Broadcasting System | ||
U.S. Direct Satellite Television Broadcasters and Broadcast Services | · DirectTV · Echostar’s Dish Network | · Cablevision’s VOOM | ||
European Satellite Services | · BBC, Sky (UK) · ORF (Austria) · Premiere, ProSieben, ZDF and Sat.1 (Germany) · RAI, Mediaset (Italy) | · SVT and Canal Plus (Sweden) · TF1, TPS, Canal Plus (France) | ||
Asia-Pacific Broadcasting Networks and Satellite Broadcasters | · ABC, Nine Network, Channel Seven, Channel Ten, Foxtel (Australia) | · CCTV (China) · SkyLife (Korea) | ||
Video Game Designers | · Electronic Arts · Microsoft Game Studio | · Nintendo · SCEA | ||
78
Table of Contents
Licensing Customers
We also have a broad market presence on the licensing side of our business. We have licensed our sound technologies to consumer electronics product manufacturers in nearly 30 countries. Over 1.6 billion consumer electronics product units sold worldwide have incorporated our licensed technologies. The table below lists our major licensing customers by category based on those customers that generated the greatest portion of our licensing revenue by product category in fiscal 2004:
Category | Representative Customers/Brands | |||
| Home Audio/Video Products (e.g., DVD players, DVD recorders, high-definition televisions, audio/video receivers and cassette decks) | · LG Electronics · Mitsubishi · Onkyo · Panasonic · Philips | · Pioneer · Samsung · Sony · Thomson | ||
| Set-top Boxes | · Matsushita Pace · Motorola · Pioneer | · Scientific-Atlanta · Thomson | ||
| Personal Audio Players | · Apple (iPod) | · Sony | ||
| Personal Computers | · Hewlett Packard | · IBM | ||
| Video Game Consoles | · Microsoft X-Box | · Sony PS2 | ||
| In-Car Entertainment Systems | · Alpine | · Matsushita/Panasonic | ||
| Personal Computer Software DVD Developers | · Cyberlink | · InterVideo | ||
Industry Standards
We believe that the entertainment industry evolves toward an improved entertainment experience through the adoption of global technological standards. Industry standards may be created through formal “negotiated” standards processes, whereby governmental entities, industry standards bodies, trade associations and others evaluate and then select technology standards, which are then prescribed or, in certain cases, required for use by industry companies. We sometimes refer to these as “explicit” standards. In addition, industry standards may be created through a “de facto” process, whereby a technology is introduced directly in the marketplace and becomes widely used by industry participants.
We actively participate in a broad spectrum of professional organizations and industry standards boards worldwide that establish explicit industry standards, including the following organizations, among others:
· Advanced Television Systems Committee, or ATSC | · International Telecommunications Union, or ITU | |
· Consumer Electronics Association, or CEA | · Moving Pictures Experts Group, or MPEG | |
· Digital Living Network Alliance, or DLNA · Digital Video Broadcasting, or DVB, Project | · Society of Cable Telecommunications Engineers, or SCTE | |
· DVD Forum · International Electrotechnical Commission, or IEC | · Society of Motion Picture and Television Engineers, or SMPTE. |
Certain of our technologies have been adopted as the explicit or de facto industry standards on both the professional and consumer sides of our business, including the following:
| · | DVD. Dolby Digital is one of two global standard formats, along with PCM, approved by the DVD Forum for encoding movie soundtracks on DVD discs. As a result, virtually all DVD players incorporate our Dolby Digital decoding technologies. In addition, the DVD Forum has mandated the use of Dolby Digital Plus and MLP Lossless as audio formats for High-Definition DVD, and the Blu-ray Disc Association has mandated the use of Dolby Digital as an audio standard on its new Blu-ray Disc format. |
79
Table of Contents
| · | Movie soundtracks. Dolby SR and Dolby Digital are de facto industry standards in that virtually all major movie soundtracks throughout the world are encoded using one or both of these technologies. |
| · | Broadcasting. |
| · | Digital terrestrial television. Our digital AC-3 technology has been designated as an explicit industry standard by the ATSC as the audio system for digital terrestrial television, or DTV. In addition, the Federal Communications Commission has mandated the use of the ATSC specification for terrestrial DTV broadcasting in the United States. Government regulators in Canada, Mexico and Korea have also specified that the ATSC specification be used for DTV in those countries. |
| · | Digital cable. The Society of Cable Telecommunications Engineers has mandated the use of Dolby Digital for digital cable television in North America. |
| · | Music Recording. Our Dolby A-, B-, C-, SR- and S-type noise reduction technologies have been de facto industry standards both for professional analog tape music recordings and for consumer playback of tape cassettes, including in mid-range and high-end cassette players, portable cassette players and car stereos. |
Another example of our participation in industry standards institution is the loudness initiative, where we are active with the ATSC, European Broadcasting Union, ITU and SCTE industry groups, among others, to assist the industry in developing standards for measurement and control of program loudness for television broadcasts.
We also spearhead efforts to create standards in industries where historically there has been a lack of standardization. When we entered the film industry, there was no standard for the reproduction of stereo soundtracks and so each film sounded different as did each theatre. We led efforts to establish some standard playback characteristics still in use today. Currently, the lack of standardization for cinema advertising has led to many loud commercials. To address the loudness problem, we brought together companies selling advertising space on cinema screens around the world and established with them a technical specification for the audio of the commercials. Similarly, we worked with Hollywood film studios to standardize the loudness of film trailers following complaints from theatres. Our combined efforts resulted in the formation of the Trailer Audio Standards Association, or TASA. TASA and its equivalent international counterparts now monitor the levels of loudness in all trailers. In the United States, all film trailers must comply with the standards in order to receive a rating. We have also been a key participant in the Dye Track program to change the physical structure of analog soundtracks from a water-wasteful and ecologically unsound technique into a more environmentally friendly pure dye track. We developed the technology and have donated the patent to the industry. We have held the chairmanship of the driving committee since its inception in 1998. Other key companies in the Dye Track program include Kodak, Fuji, Technicolor and DeLuxe. Metro-Goldwyn-Mayer, Disney and Dreamworks all have recently announced their intention to release their films with the new process.
Sales and Marketing
Professional Products and Production Services
We sell our professional products through sales channels dedicated to specific industries. For cinema products, we sell to a combination of dealers, distributors and original equipment manufacturers, as well as directly to theatres themselves. Larger theatre chains, such as AMC and Regal, have their own purchasing departments and buy our products directly. Smaller chains and independents typically make their purchases through distributors. We also sell our professional products through cinema projector manufacturers that also act as distributors for other cinema equipment so that they can put together packages. Companies to whom we sell our equipment must typically first attend a training course in installation and alignment in order to ensure that our equipment is correctly installed and aligned, thus assuring a high quality experience for the audience.
80
Table of Contents
Our professional broadcast products are sold to companies specializing in broadcast equipment, as well as some system integrators who design and equip complete broadcast installations. We also sell circuit boards incorporating our broadcast technologies to other manufacturers to integrate into their own broadcast products. For large purchases, we also sell directly to the end-user.
Marketing for both our cinema and broadcast products is largely done at industry trade shows such as the Audio Engineering Society exhibitions, CineAsia, Cinema Expo, International Broadcasters Convention, National Association of Broadcasters, ShowEast and ShoWest. We also advertise in trade magazines on a limited basis.
For production services, we deal directly with the film production company, which typically enters into a service contract with us for a specific film. Under the terms of our licensing agreements, we provide the equipment required to perform the mastering to the film production companies. Any additional services provided, usually in the printing laboratory or in theatres, are then charged at our current engineering rates.
Consumer Licensing
We sell and market our licensed technologies to a wide range of consumer electronics product manufacturers through our account management team. This team markets our technologies to potential licensees on a worldwide basis from our headquarters in San Francisco and is supported by our liaison offices in Beijing, Hong Kong, London, Shanghai and Tokyo. We divide our sales and marketing efforts for our licensed technologies into different market segments: consumer electronics, broadcast, in-car entertainment systems, personal computers and video games. In the consumer electronics market, we focus our sales and marketing efforts on manufacturers of consumer electronics products such as DVD players, DVD recorders, home theatre systems, audio/video receivers, and personal audio and video players. In the broadcast market, we market our technologies to makers of digital televisions and set-top boxes. In the automotive market, we market our technologies directly to automotive manufacturers, as well as manufacturers of after-market in-car entertainment systems. In the personal computer market, we focus our marketing efforts on software developers, but also have begun to market our technologies directly to personal computer manufacturers. In the video game market, we have a dedicated team of marketers who focus their efforts on game developers and publishers.
Research and Development
For almost 40 years, we have concentrated research and development on audio signal processing technologies. However, we have recently expanded our research and development efforts into other areas important for future entertainment systems, including technologies for processing digital moving images and protecting content.
The research division conducts applied research in sound, image and related signal processing technologies. By focusing on creation, proof of feasibility and early-stage prototyping of patentable new sound, image and related technologies, the research division serves as a source of new technologies for the engineering and technology development teams in the professional and consumer divisions. The research division also helps identify, investigate and analyze new long-term opportunities, helps shape our technology strategy, and provides support for internally developed and externally acquired technologies.
Engineering and technology development teams in the professional and consumer divisions take the technologies developed by the research division and further implement such technologies in our professional products and licensed applications. Engineers in our professional division design and develop software and hardware products and systems that we manufacture and sell for professional applications. Engineers and technology development teams in the consumer division primarily focus on the development of reference designs, typically software, for the technology implementations that we license for consumer, and some professional, applications. In addition, our professional and consumer divisions are also involved in the commercialization of technologies created by third parties that may be of interest to us.
81
Table of Contents
In recent years, we have expanded our research and development efforts to include technologies that are not solely related to sound. These technologies include digital image signal processing and content protection technologies that facilitate the delivery of digital entertainment. In addition, we are continuing to explore other areas where we may be able to develop and deliver technologies that enrich the entertainment experience.
We conduct our research and development activities at a number of locations worldwide, including Burbank, California, San Francisco, California, Richmond, Virginia and Sydney, Australia. As of September 24, 2004, we had approximately 158 employees involved in research and development. Our research and development expenses were $15.1 million, $18.3 million and $23.9 million in fiscal 2002, 2003 and 2004, respectively.
Manufacturing
Our professional product manufacturing process is a low volume, material intense, low labor business operation, with core competencies of automation, quick set ups, experienced personnel and product testing. Due to the complex nature of most of our professional products as well as the low-volume nature, we believe that we can best ensure product quality by keeping our manufacturing processes entirely in-house and not outsourcing assembly or testing procedures.
We manufacture our professional products in our two manufacturing facilities located in Brisbane, California and Wootton Bassett, England. While both facilities manufacture our main cinema processors, the Brisbane facility also manufactures most of the professional and broadcast products, while Wootton Bassett manufactures lower volume and specialty cinema products. By having the same types of equipment, as well as assembly and testing, in both locations, we are able to balance production output between locations to meet customer demands.
Our manufacturing process is a circuit board assembly operation, meaning we do not manufacture circuit boards nor do we fabricate metal products in-house as those activities are outsourced to multiple suppliers in the United States and in Europe. Our product quality is ensured by a high level of automation to eliminate manual assembly as much as possible and provide for an efficient and consistent manufacturing process. Automated assembly capabilities include surface mount, through-hole and odd-form insertion. Our product testing includes in-circuit testing of finished circuit boards, functional testing of all parameters in the engineering specifications, and final testing to ensure that the product meets the published specifications. We utilize Teradyne in-circuit test systems and automated functional test equipment, such as Audio Precision.
We purchase components and fabricated parts from multiple suppliers in the United States and Europe. We rely on sole source suppliers for some of the components that we use to manufacture our professional products, including certain charged coupled devices, light emitting diodes and digital signal processors. If these sole source suppliers become unable or unwilling to deliver these components to us at an acceptable cost or at all, we could be forced to redesign certain of our products, which could result in material production delays, increased costs and reductions in shipments of our products, any of which could increase our operating costs, harm our customer relationships or materially and adversely affect our business and operating results. We source components and fabricated parts locally, but we also buy globally in order to ensure continued supply.
Competition
The markets for entertainment industry technologies, including motion picture, broadcasting, consumer electronics, computer, gaming and Internet technologies, are highly competitive, and we face competitive threats and pricing pressure in all of these industries. Our competitors in our products and services business include, among other companies, Avica, EVS, GDC, Kodak, Microsoft, NEC, Panastereo, Sony, Digital Theater Systems and UltraStereo. On the technology licensing side of our business, our competitors include Coding Technologies, Digital Theater Systems, Fraunhofer Institute for Integrated Circuits, Microsoft, Philips, RealNetworks, Sony, SRS Labs and Thomson. Other companies may become competitors in the future.
82
Table of Contents
Some of our current and future competitors may have significantly greater financial, technical, marketing and other resources than we do, or may have more experience or advantages in the markets in which they compete. For example, Microsoft and RealNetworks may have an advantage over us in the market for Internet technologies because of their greater experience in that market. In addition, some of our current or potential competitors, such as Microsoft and RealNetworks, may be able to offer integrated system solutions in certain markets for sound or non-sound entertainment technologies, including audio, video and rights management technologies related to personal computers or the Internet, which could make competing technologies that we develop unnecessary. By offering an integrated system solution, these potential competitors also may be able to offer competing technologies at lower prices than our technologies, which could adversely affect our operating results.
We also face competitive risks in situations where our customers are also current or potential competitors. For example, Sony is a significant customer and is also a competitor with respect to certain of our professional and consumer technologies. Sony’s announcement in September 2004 that it plans to acquire Metro-Goldwyn-Mayer, which is also a significant purchaser of our professional products and production services, is expected to increase this potential competitive risk. In addition, Universal, which is a purchaser of our professional products and production services, also has had an ownership interest in Digital Theater Systems, one of our competitors.
In addition, many of the consumer electronics products that include our sound technologies also include sound technologies developed by our competitors.
We believe that the principal competitive factors in each of our markets include some or all of the following:
| · | Inclusion in explicit industry standards; |
| · | Adoption as de facto industry standards; |
| · | Brand recognition and reputation; |
| · | Quality and reliability of products and services; |
| · | Technology performance, flexibility and range of application; |
| · | Relationships with film producers and distributors and with semiconductor and consumer electronics product manufacturers; |
| · | Availability of compatible high-quality audio content and the inclusion of Dolby Digital soundtracks on DVDs; |
| · | Price; and |
| · | Timeliness and relevance of new product introductions. |
We believe we compete favorably with respect to many of these factors.
Intellectual Property
We rely on a combination of patent, trademark, copyright and trade secret laws in the U.S. and other jurisdictions, as well as confidentiality procedures and contractual provisions, to protect our proprietary technologies and our brand. We have a substantial base of intellectual property assets, including patents, trademarks, copyrights and trade secrets such as know-how.
We have over 770 individual issued patents and over 700 pending patent applications in nearly 30 jurisdictions throughout the world. Our issued patents are scheduled to expire at various times through April 2023. Of these, ten patents are scheduled to expire in calendar year 2005, 66 patents are scheduled to expire in calendar year 2006, and 44 patents are scheduled to expire in calendar year 2007. Patents relating to our Dolby Digital technologies expire between 2008 and 2017, and patents relating to our Dolby Digital Plus technologies
83
Table of Contents
expire between 2019 and 2020. We pursue a general practice of filing patent applications for our technology in the United States and various foreign countries where our customers manufacture, distribute, or sell licensed products. We actively pursue new applications to expand our patent portfolio to address new technology innovations. We have multiple patents covering unique aspects and improvements for many of our technologies.
We have over 800 trademark registrations throughout the world for a variety of word marks, logos and slogans. Our marks cover our various products, technologies, improvements and features, as well as the services that we provide. Our trademarks are an integral part of our licensing program and licensees typically elect to place our trademarks on their products to inform consumers that their products incorporate our technology and meet our quality specifications. Our trademarks include the following:
Examples of our Word Trademarks
· Dolby · Dolby Digital · Dolby Headphone · Dolby SR | · Dolby Surround · EQ Assist · MLP · Surround EX |
Examples of our Logo Trademarks

We have a significant amount of copyright protected materials including software, textual materials and master audio materials. In addition, we also seek to maintain certain intellectual property as trade secrets.
Third parties may infringe or misappropriate our intellectual property rights, or our technologies may be alleged to infringe or misappropriate existing patents or other intellectual property rights of third parties. We may enter into litigation based on allegations of infringement or other violations of intellectual property rights. Intellectual property claims, with or without merit, could be time-consuming, expensive to litigate or settle and could divert management resources and attention. An adverse determination could require that we pay damages, pay royalties or stop using technologies found to be in violation of a third party’s rights, which could prevent us from offering our products and services to others. We may be required to enter into royalty or license agreements to use a third party’s technologies, which may not be available on reasonable terms, if at all. Alternatively, we may have to develop non-infringing technologies, at significant expense and effort. If we cannot license or develop technologies for the infringing aspects of our business, we may be forced to limit our product and service offerings and may be unable to compete effectively.
We also actively attempt to enforce our intellectual property rights in foreign countries. However, we have experienced problems in the past with consumer electronics product manufacturers, particularly in China, failing to report or underreporting shipments of their products that incorporate our technologies, and we expect to continue to experience such problems in the future. In addition, we may experience similar problems in other countries where intellectual property rights are not as respected as they are in the United States, Japan and Europe.
In addition, we have relatively few or no issued patents in certain countries. For example, in China we have only limited patent protection, especially with respect to our Dolby Digital technologies. In India, we have no
84
Table of Contents
issued patents. As such, growing our licensing revenue in developing countries such as China and India will depend on our ability to obtain patent rights in these counties for existing and new technologies, which is uncertain. Moreover, because of the limitations of the legal systems in many of these countries, the effectiveness of patents obtained or that may in the future be obtained, if any, is likewise uncertain.
Legal Proceedings
In May 2001, we filed a lawsuit against Lucent Technologies, Inc. and Lucent Technologies Guardian I, LLC, together “Lucent,” in the United States District Court for the Northern District of California. We seek a declaration that U.S. patents 5,627,938 and 5,341,457 are invalid and that we have not infringed, induced others to infringe or contributed to infringement of any of the claims of these patents. These patents generally involve a process and means for encoding and decoding audio signals. Lucent twice moved to dismiss our complaint. After its second motion was denied, Lucent filed an application with the United States Patent and Trademark Office to reissue one of these patents. The outcome of that proceeding is currently not determinable. In August 2002, Lucent filed counterclaims alleging that we have infringed the two patents-in-suit directly and by inducing or contributing to the infringement of those patents by others. Lucent contends that products incorporating our AC-3 technology infringe those patents. Lucent seeks injunctive relief and unspecified damages. The case is now set for jury trial in San Jose, California in April 2005. We believe Lucent’s claims are without merit, and we are vigorously litigating this matter. However, as with any litigation, the outcome is uncertain. A determination against us in the Lucent litigation could materially impact our technology licensing business, which may seriously harm our financial condition and results operations. Even if we prevail in this dispute, the litigation will be expensive and time-consuming and may distract our management from operating our business.
Employees
As of September 24, 2004, we had 750 employees worldwide consisting of 158 employees in product research and development, 319 employees in sales, marketing and support, 121 employees in manufacturing and distribution, and 152 employees in finance and administration. As of September 24, 2004, approximately 184 of our 750 employees were working outside of the United States. None of our employees is subject to a collective bargaining agreement. We believe that our employee relations are good.
Facilities
Our principal executive offices are located at 100 Potrero Avenue, San Francisco, California, occupying approximately 78,000 square feet of space. The lease for these offices expires on December 31, 2005, and we have an option to extend the term for an additional five years. We lease our principal executive offices from Ray Dolby. See “Certain Relationships and Related Party Transactions—Real Estate Transactions—Lease for 100 Potrero Avenue.”
Ray and Dagmar Dolby, the Ray Dolby Trust or the Dolby Family Trust owns a majority financial interest in real estate entities that own and lease to us certain of our other facilities in California and the United Kingdom. We own the remaining financial interests in these real estate entities. We lease from these real estate entities approximately 140,000 square feet of space at 999 Brannan Street, San Francisco, California for our principal administrative offices, approximately 45,000 square feet of space in Brisbane, California for manufacturing facilities, approximately 75,000 square feet of space in Wootton Bassett, England for manufacturing, sales, services and administrative facilities and approximately 19,000 square feet of space in Burbank, California for research and development, sales, services and administrative facilities. The leases for these facilities expire at various times through 2015. See “Certain Relationships and Related Party Transactions—Real Estate Transactions—Jointly Owned Real Estate Entities.”
We also lease additional research and development, sales and administrative facilities from third parties in California, New York and Virginia, and internationally, in Beijing, London, Hong Kong, Shanghai, Sydney, and Tokyo. The leases for these facilities expire at various times through 2017.
85
Table of Contents
We believe that our current facilities are adequate to meet our needs for the foreseeable future, and that suitable additional or alternative space will be available in the future on commercially reasonable terms to accommodate our foreseeable future operations.
86
Table of Contents
Executive Officers and Directors
The following table provides information regarding our executive officers and directors as of October 31, 2004:
Executive Officers and Directors | Age | Position(s) | ||
Ray Dolby | 71 | Founder and Chairman of the Board | ||
Bill Jasper | 56 | President, Chief Executive Officer and Director | ||
Mark Anderson | 46 | Vice President, General Counsel and Secretary | ||
Janet Daly | 55 | Vice President and Chief Financial Officer | ||
Steve Forshay | 50 | Senior Vice President, Research | ||
Marty Jaffe | 51 | Executive Vice President, Business and Finance | ||
Tim Partridge | 42 | Senior Vice President and General Manager, Professional Division | ||
Ed Schummer | 55 | Senior Vice President and General Manager, Consumer Division | ||
David Watts | 52 | Vice President and Managing Director, United Kingdom branch | ||
Peter Gotcher | 45 | Director | ||
Sanford Robertson | 73 | Director | ||
Roger Siboni | 49 | Director |
Ray Dolby, founder and chairman of Dolby Laboratories, was born in Portland, Oregon and grew up on the San Francisco peninsula. From 1949 through 1952 he worked on audio and instrumentation projects at Ampex Corporation, where from 1952 through 1957, as a student, he was mainly responsible for the development of the electronic aspects of the Ampex video tape recording system. He received his B.S. in electrical engineering from Stanford University in 1957 and, as a Marshall Scholar, left Ampex to pursue further studies at Cambridge University in England. He received a Ph.D. degree in physics from Cambridge in 1961.
In 1963, Dolby took up a two-year appointment as a United Nations technical advisor in India, then returned to England in 1965 to found Dolby Laboratories in London. In 1976 he established further offices, laboratories and manufacturing facilities in California. He holds more than 50 United States patents and has written papers on video tape recording, long wavelength X-ray analysis and noise reduction. Ray Dolby makes his home in San Francisco with his wife, Dagmar. He enjoys skiing, boating and flying.
Honors and Awards—Audio Engineering Society: Fellow and Past President; Silver Medal; Gold Medal. British Kinematograph Sound and Television Society: Fellow; Science and Technology Award. Society of Motion Picture and Television Engineers: Fellow; Samuel L. Warner Memorial Award; Alexander M. Poniatoff Gold Medal; Progress Medal; Honorary Member. Academy of Motion Picture Arts and Sciences: Science and Engineering Award; “Oscar” Award. National Academy of Television Arts and Sciences: “Emmy” Award. National Academy of Recording Arts and Sciences: “Grammy” Award. United States: National Medal of Technology. United Kingdom: Honorary O.B.E.
Bill Jasper, our president and chief executive officer, joined Dolby Laboratories in February 1979 and has also served as a director since June 2003. Mr. Jasper served in a variety of positions prior to becoming president in May 1983, including as our vice president, finance and administration and executive vice president. Mr. Jasper is a member of the Audio Engineering Society and the Society of Motion Picture and Television Engineers and an at-large member of the Academy of Motion Picture Arts and Sciences. He serves as chairman of the board of directors of FOCUS Enhancements and as a member of the board of trustees of Saint Mary’s College of California. Mr. Jasper holds a B.S. degree in industrial engineering from Stanford University and a M.B.A. from the University of California at Berkeley.
Mark Anderson has served as our vice president, general counsel since November 2003 and was also appointed our corporate secretary in March 2004. Prior to joining us, Mr. Anderson was an associate and then a partner at the law firm of Farella Braun & Martel LLP, from August 1989 to November 2003, and directed the
87
Table of Contents
firm’s commercial law department and business transactions practice group. Mr. Anderson is a certified public accountant and holds a B.S. degree in business administration from the University of North Carolina at Chapel Hill and a J.D. from Golden Gate University School of Law.
Janet Daly has served as our vice president and chief financial officer since June 1991. Prior to joining us, Ms. Daly held various positions in financial management, including chief financial officer for a retail software developer and controller of a major United States movie theatre exhibitor. Ms. Daly is a member of Financial Executives International, serves as a member of the board of Sunny Hills Children’s Garden Childrens’ Services and has been a certified public accountant in California since 1980. Ms. Daly has a B.A. degree in business from San Francisco State University.
Steve Forshay has served as our senior vice president, research since November 2004. Previously, Mr. Forshay served in a variety of other positions since joining us in 1982, including as our vice president, research and vice president, engineering. Mr. Forshay is a member of the Audio Engineering Society, the Institute of Electrical and Electronics Engineers and the Society of Motion Picture and Television Engineers. Mr. Forshay holds a B.S.E.E. degree in electrical engineering from the New Jersey Institute of Technology and a M.B.A. from Saint Mary’s College of California.
Marty Jaffehas served as our executive vice president, business and finance since March 2004. Previously, Mr. Jaffe served as our vice president, business affairs since joining us in November 2000 to March 2004. Prior to joining us, Mr. Jaffe served in a variety of positions at the Chronicle Publishing Company, a diversified media company, from June 1986 to October 2000, most recently as the vice president and chief financial officer. Mr. Jaffe is a certified public accountant and holds an A.B. degree in political and social behavior from Occidental College, a J.D. from the University of California Hastings College of Law and a M.B.A. from the University of California at Berkeley.
Tim Partridge has served as the senior vice president and general manager of our professional division since March 2004. Previously, Mr. Partridge served in a variety of other positions since joining us in 1984, including as the vice president and general manager of our professional division and vice president, marketing. Mr. Partridge holds a bachelor’s of music and electronics honors degree from the Tonmeister program at the University of Surrey.
Ed Schummer has served as the senior vice president and general manager of our consumer division since October 2001. Previously, Mr. Schummer served in a variety of other positions since joining us in 1978, including as the vice president and general manager of our consumer division, vice president, licensing and vice president, marketing. Mr. Schummer is a member of the Audio Engineering Society and the Licensing Executive Society. Mr. Schummer holds a B.S.E.E. degree in electrical engineering from the Illinois Institute of Technology.
David Watts has served as the vice president and managing director of our United Kingdom branch since January 2000. Previously, Mr. Watts served in a variety of other positions since joining us in 1977, including as our vice president, marketing. Mr. Watts holds a B.Sc. degree in mathematics from the University of Sussex.
Peter Gotcherhas served as a director since June 2003. Mr. Gotcher is an independent investor. Mr. Gotcher was a venture partner with Redpoint Ventures, a private investment firm, from September 1999 to January 2003. Prior to joining Redpoint Ventures, Mr. Gotcher was a venture partner with Institutional Venture Partners, a private investment firm, from 1997 to September 1999. Prior to joining Institutional Venture Partners, Mr. Gotcher founded and served as the president, chief executive officer and chairman of the board of Digidesign from 1984 to 1995. Digidesign was acquired by Avid Technology, a media software company, in 1995 and Mr. Gotcher served as the general manager of Digidesign and executive vice president of Avid Technology from January 1995 to May 1996. Mr. Gotcher serves on the boards of directors of several private companies. Mr. Gotcher holds a B.A. degree in English literature from the University of California at Berkeley.
88
Table of Contents
Sanford Robertsonhas served as a director since June 2003. Mr. Robertson has been a partner of Francisco Partners, a technology buyout fund, since 1999. Prior to founding Francisco Partners, Mr. Robertson was the founder and chairman of Robertson, Stephens & Co., a technology investment bank formed in 1978 and sold to BankBoston in 1998. Since the sale, Mr. Robertson has been a technology investor and advisor to several technology companies. Mr. Robertson was also the founder of Robertson, Colman, Siebel & Weisel, later renamed Montgomery Securities, another technology investment bank. Mr. Robertson also serves on the board of directors of Pain Therapeutics and salesforce.com. Mr. Robertson holds a B.B.A. and a M.B.A. from the University of Michigan.
Roger Siboni has served as a director since July 2004. Mr. Siboni is chairman of the board of directors of E.piphany, Inc., a provider of customer interaction software, and served as president and chief executive officer of E.piphany from August 1998 to July 2003. From July 1996 to August 1998, Mr. Siboni was deputy chairman and chief operating officer of KPMG Peat Marwick LLP, a member firm of KPMG International, an accounting and consulting firm. From July 1993 to June 1996, Mr. Siboni was managing partner of the KPMG Peat Marwick LLP’s information, communication and entertainment practice. Mr. Siboni also serves on the boards of directors of Cadence Design Systems and FileNET. Mr. Siboni holds a B.S. degree in business administration from the University of California at Berkeley.
Board of Directors
Our board of directors currently consists of five members. Our amended and restated bylaws permit our board of directors to establish by resolution the authorized number of directors, and five directors are currently authorized.
There are no family relationships among any of our directors or executive officers.
Committees of the Board of Directors
Our board of directors has an audit committee, a compensation committee, a nominating and governance committee and an outside director compensation committee, each of which have the composition and responsibilities described below as of the completion of this offering.
Audit Committee
Peter Gotcher, Sanford Robertson and Roger Siboni, each of whom is a non-employee member of our board of directors, comprise our audit committee. Mr. Siboni is the chairman of our audit committee. Our board has determined that each member of our audit committee meets the requirements for independence under the current requirements of the NYSE and SEC rules and regulations. The board of directors has also determined that each of Messrs. Gotcher, Robertson and Siboni are “audit committee financial experts” as defined in SEC rules. The audit committee is responsible for, among other things:
| · | Selecting and hiring our independent auditors, and approving the audit and non-audit services to be performed by our independent auditors; |
| · | Evaluating the qualifications, performance and independence of our independent auditors; |
| · | Monitoring the integrity of our financial statements and our compliance with legal and regulatory requirements as they relate to financial statements or accounting matters; |
| · | Reviewing the adequacy and effectiveness of our internal control policies and procedures; |
| · | Acting as our qualified legal compliance committee; and |
| · | Preparing the audit committee report that the SEC requires in our annual proxy statement. |
89
Table of Contents
Compensation Committee
Peter Gotcher, Sanford Robertson and Roger Siboni, each of whom is a non-employee member of our board of directors, comprise our compensation committee. Mr. Gotcher is the chairman of our compensation committee. Our board has determined that each member of our compensation committee meets the requirements for independence under the current requirements of the NYSE and SEC rules and regulations. The compensation committee is responsible for, among other things:
| · | Reviewing and recommending to the board for our chief executive officer and other executive officers: annual base salary, annual incentive bonus, including the specific goals and amount, equity compensation, employment agreements, severance arrangements and change in control agreements/provisions, and any other benefits, compensation or arrangements; |
| · | Evaluating and recommending to the board compensation plans, policies and programs for our chief executive officer and other executive officers; and |
| · | Preparing the compensation committee report that the SEC requires in our annual proxy statement. |
Nominating and Governance Committee
Peter Gotcher, Sanford Robertson and Roger Siboni, each of whom is a non-employee member of our board of directors, comprise our nominating and governance committee. Mr. Robertson is the chairman of our nominating and governance committee. Our board has determined that each member of our nominating and governance committee meets the requirements for independence under the current requirements of the NYSE and SEC rules and regulations. The nominating and governance committee is responsible for, among other things:
| · | Assisting the board in identifying prospective director nominees and recommending to the board director nominees for each annual meeting of stockholders; |
| · | Developing and recommending to the board governance principles applicable to us; |
| · | Overseeing the evaluation of the board of directors and management; and |
| · | Recommending to the board members for each board committee. |
Outside Director Compensation Committee
Ray Dolby and Bill Jasper comprise our outside director compensation committee. The outside director compensation committee is responsible for reviewing and recommending the form and amount of compensation awarded to our non-employee directors.
Director Compensation
Our non-employee directors have received options to purchase shares of our Class B common stock under our amended and restated 2000 Stock Incentive Plan. In June 2003, we granted options to purchase 60,000 shares of Class B common stock at an exercise price of $1.26 per share to each of Peter Gotcher and Sanford Robertson. In April 2004, we granted options to purchase 60,000 shares of Class B common stock at an exercise price of $2.07 to each of Messrs. Gotcher and Robertson. In August 2004, we granted options to purchase 100,000 shares of Class B common stock to Roger Siboni and 30,000 shares of Class B common stock to each of Messrs. Gotcher and Robertson at an exercise price of $2.07 per share. These options vest over three years at a rate of 1/3rd upon each anniversary of the vesting commencement date.
We also pay each of our non-employee directors $30,000 per year for their services as members of our board of directors. In addition, Mr. Siboni receives $20,000 for his services as chairman of our audit committee. We also reimburse our non-employee directors for reasonable travel expenses in connection with attendance at board and committee meetings.
90
Table of Contents
Effective upon the completion of this offering, our non-employee directors will receive $30,000 per year for their service on the board of directors, and the chairman of the audit committee will receive an additional $20,000 per year. Our non-employee directors will also receive automatic grants of options under our 2005 Stock Plan. Each non-employee director appointed to the board after the completion of this offering will receive an initial option to purchase 20,000 shares of our Class A common stock, which will vest over three years at a rate of 1/3rd upon each anniversary of the vesting commencement date. In addition, on July 15, 2005, and following each annual meeting of our stockholders beginning in 2006, non-employee directors who have been directors for at least six months will receive a subsequent option to purchase 10,000 shares of our Class A common stock, which will vest over three years at a rate of 1/3rd upon each anniversary of the vesting commencement date. These options will become fully vested and exercisable immediately prior to a change of control of us. See “Employee Benefit Plans—2005 Stock Plan.”
Compensation Committee Interlocks and Insider Participation
None of the members of our compensation committee is an officer or employee of our company. None of our executive officers currently serves, or in the past year has served, as a member of the board of directors or compensation committee of any entity that has one or more executive officers serving on our board of directors or compensation committee.
Executive Compensation
The following table provides information regarding the compensation of our chief executive officer and the four other most highly compensated executive officers during the fiscal year ended September 24, 2004. We refer to these executive officers as our named executive officers.
Summary Compensation Table
Name and Principal Position | Annual Compensation | Long-Term Compensation Awards | All Other | |||||||
| Salary ($) | Bonus ($) (1) | Securities Underlying Options | ||||||||
Bill Jasper | 592,949 | 1,618,165 | (3) | 900,000 | 220,316 | (4) | ||||
President and Chief Executive Officer | ||||||||||
Mark Anderson | 237,500 | 157,191 | (5) | 157,500 | 610 | (6) | ||||
Vice President, General Counsel and Secretary | ||||||||||
Marty Jaffe | 334,395 | 180,408 | 180,000 | 57,276 | (7) | |||||
Executive Vice President, Business and Finance | ||||||||||
Ed Schummer | 326,445 | 167,064 | 180,000 | 173,411 | (8) | |||||
Senior Vice President and General Manager, Consumer Division | ||||||||||
David Watts (9) | 311,034 | 153,209 | 180,000 | 56,753 | (10) | |||||
Vice President and Managing Director, United Kingdom branch | ||||||||||
| (1) | We generally pay bonuses in the fiscal year following the fiscal year in which they were earned. Unless otherwise noted, bonus amounts presented were earned in fiscal 2004 and paid in fiscal 2005, and include a nondiscretionary bonus based on financial performance targets for fiscal 2004. A discretionary bonus earned in fiscal 2004, but payable in fiscal 2005, is not calculable as of the date of this prospectus. |
| (2) | We previously paid premiums for split-dollar life insurance polices for certain of our executive officers. We ceased these payments in fiscal 2004 and transferred the full value of those policies to the executive officer. |
91
Table of Contents
In addition, in fiscal 2004 we received a cash dividend from an insurer on the split-dollar life insurance policies, which we allocated among the executive officers covered by policies with that insurer. |
| (3) | Includes $1,185,415 for a stock bonus of 571,560 shares granted in January 2004, based on the fair market value on the date of award of $2.07 per share. |
| (4) | Includes $33,386 in profit-sharing and matching 401(k) plan contributions under our retirement plan, $792 in life insurance premiums, $103,394 in contributions under our senior executive supplemental retirement plan, $53,048 received in connection with the transfer of a split-dollar life insurance policy and $29,696 received in connection with the allocation of a dividend received on split-dollar life insurance policies. |
| (5) | Includes a signing bonus of $50,000 paid in fiscal 2004. |
| (6) | Includes $610 in life insurance premiums. |
| (7) | Includes $26,694 in profit-sharing and matching 401(k) plan contributions under our retirement plan, $756 in life insurance premiums and $29,826 received in connection with the transfer of a split-dollar life insurance policy. |
| (8) | Includes $26,307 in profit-sharing and matching 401(k) plan contributions under our retirement plan, $732 in life insurance premiums, $45,646 in contributions under our senior executive supplemental retirement plan, $83,891 received in connection with the transfer of a split-dollar life insurance policy and $16,835 received in connection with the allocation of a dividend received on split-dollar life insurance policies. |
| (9) | Amounts derived from United Kingdom pounds have been expressed in U.S. dollars based on the noon buying rate for the United Kingdom pound of $1.8031 on September 24, 2004. |
| (10) | Includes $53,642 in contributions under our United Kingdom group personal pension plan and funded unapproved retirement benefits scheme and $3,110 in life insurance premiums. |
Stock Option Grants in Last Fiscal Year
The following table provides information regarding grants of stock options to each of the named executive officers during the fiscal year ended September 24, 2004. The percentage of total options set forth below is based on options to purchase an aggregate of 5,081,500 shares of our Class B common stock granted to employees during the fiscal year ended September 24, 2004. All options were granted at the fair market value of our Class B common stock, as determined by the board of directors on the date of grant.
These options were granted under our 2000 Stock Incentive Plan, as amended. The options vest over a four-year period, at a rate of 1/4th upon each anniversary of their vesting commencement dates. See “Employee Benefit Plans—2000 Stock Incentive Plan” for a further description of certain terms relating to these options.
The amounts shown in the table as potential realizable value represent hypothetical gains that could be achieved if options are exercised at the end of the option term. The assumed 5% and 10% rates of stock price appreciation are provided in accordance with SEC rules based on an assumed initial public offering price of $ per share, and do not represent our estimate or projection of the future stock price. Potential realizable values are net of exercise price.
92
Table of Contents
Stock Option Grants in 2004
Name | Number of Granted | Percent of in 2004 (%) | Exercise Share ($) | Expiration Date | Potential Realizable Value at for Option Terms ($) | |||||||
| 5% | 10% | |||||||||||
Bill Jasper | 900,000 | 17.7 | 2.07 | 04/20/14 | ||||||||
Mark Anderson | 120,000 37,500 | 2.4 0.7 | 2.07 2.07 | 04/20/14 12/04/13 | ||||||||
Marty Jaffe | 180,000 | 3.5 | 2.07 | 04/20/14 | ||||||||
Ed Schummer | 180,000 | 3.5 | 2.07 | 04/20/14 | ||||||||
David Watts | 180,000 | 3.5 | 2.07 | 04/20/14 | ||||||||
Option Exercises in Last Fiscal Year and Fiscal Year-End Option Values
The following table provides information regarding the exercise of stock options during the fiscal year ended September 24, 2004, by the named executive officers, and the value of securities underlying options held by our named executive officers at September 24, 2004.
There was no public trading market for our common stock as of September 24, 2004. The value realized and the value of unexercised in-the-money options at fiscal year end have been calculated based on an assumed initial public offering price of $ , less the applicable exercise price, in accordance with SEC rules.
Name | Shares Exercise | Value Realized ($) | Number of Securities Fiscal Year-End | Value of Unexercised In-the-Money Options at Fiscal Year-End ($) | ||||||||
| Exercisable | Unexercisable | Exercisable | Unexercisable | |||||||||
Bill Jasper | 196,330 | — | 1,132,110 | |||||||||
Mark Anderson | — | — | 157,500 | |||||||||
Marty Jaffe | 31,250 | — | 223,750 | |||||||||
Ed Schummer | 18,380 | 64,615 | 257,665 | |||||||||
David Watts (1) | — | — | 299,900 | |||||||||
| (1) | Mr. Watts holds options to purchase shares of Class B common stock, 64,930 shares of which were vested as of September 24, 2004 but none of which are exercisable until completion of this offering. |
Employment Agreements and Change in Control Arrangements
Employment Agreements
Marty Jaffe, our executive vice president, business and finance, executed an offer letter dated September 28, 2000, effective as of November 1, 2000. Mr. Jaffe’s current annual base salary is $338,000. He is eligible for annual bonus compensation under our annual incentive plan as well as a discretionary bonus based on meeting performance criteria set by our president and chief executive officer. In the event Mr. Jaffe’s employment terminates without cause, he will be entitled to receive severance equal to twelve months of his then current salary.
Mark Anderson, our vice president, general counsel and secretary, executed an offer letter dated October 23, 2003, effective as of November 20, 2003. Mr. Anderson’s current annual base salary is $285,000. He also received a signing bonus of $50,000 and is eligible for annual bonus compensation of up to 45% of his base salary under our annual incentive plan. In the event Mr. Anderson’s employment terminates without cause, he will be entitled to receive severance equal to twelve months of his then current salary, and his outstanding equity awards will vest in full.
93
Table of Contents
Change in Control Arrangements
Our 2000 Stock Incentive Plan and 2005 Stock Plan provide for the acceleration of vesting of awards in certain circumstances in connection with or following a change in control of us. See “Employee Benefit Plans.”
Employee Benefit Plans
Amended and Restated 2000 Stock Incentive Plan
Our board of directors and stockholders adopted the 2000 Stock Incentive Plan in October 2000, which was amended in April 2004 and September 2004. Our board of directors has decided not to grant any additional options under the plan following the completion of this offering. However, the plan will continue to govern the terms and conditions of the outstanding awards previously granted under the plan.
Share Reserve. A total of 15,131,730 shares of our Class B common stock are authorized for issuance under the amended and restated 2000 Stock Incentive Plan. As of September 24, 2004, awards to acquire a total of 12,599,820 shares of our Class B common stock were issued and outstanding at a weighted average exercise price of $1.61 per share. In addition, subsequent to September 24, 2004, options to purchase an aggregate of 780,750 shares of Class B common stock have been granted under the 2000 Stock Incentive Plan, at a weighted average exercise price of $6.28 per share.
Eligibility and Term of Awards. The amended and restated 2000 Stock Incentive Plan provides for the grant of nonstatutory stock options and restricted stock awards to our employees, directors and consultants and to employees, directors and consultants of any entity related to us, and for the grant of incentive stock options within the meaning of Section 422 of the Internal Revenue Code to our and our related entities’ employees. Our board of directors or a committee of our board administers the amended and restated 2000 Stock Incentive Plan. The administrator has the authority to determine the terms and conditions of the awards granted under the amended and restated 2000 Stock Incentive Plan.
Stock Options. The administrator determines the exercise price of options granted under our amended and restated 2000 Stock Incentive Plan. The exercise price of incentive stock options may not be less than 100% of the fair market value on the grant date and nonqualified stock options may not have an exercise price which is less than 85% of the fair market value on the grant date. The term of an incentive stock option may not exceed ten years, except that with respect to any participant who owns 10% of the voting power of all classes of our outstanding stock, the term must not exceed five years and the exercise price must equal at least 110% of the fair market value on the grant date. The administrator determines the term of all other options.
Upon termination of an employee, director or consultant, he or she may exercise his or her option for the period of time stated in the option agreement. Generally, if termination is due to death or disability, the option will remain exercisable for 12 months. In all other cases, the option will generally remain exercisable for three months. However, an option may never be exercised later than the expiration of its term.
Restricted Stock Awards. Restricted stock awards, which represent the right to purchase our Class B common stock, may be issued under our amended and restated 2000 Stock Incentive Plan. The administrator determines the purchase price of a restricted stock award granted under the plan, which may be not less than 85% of the fair market value on the grant date, except that with respect to any participant who owns 10% of the voting power of all classes of our outstanding stock, the purchase price must equal at least 100% of the fair market value on the grant date. The administrator determines the term of all other restricted stock awards. Upon termination of an employee, director or consultant, we generally will have the right to repurchase unvested stock held by the participant within ninety days following the participant’s termination of service with us.
Transferability. Our amended and restated 2000 Stock Incentive Plan generally does not allow for the transfer of awards, other than by will or the laws of descent and distribution, and only the recipient of an award may exercise an award during his or her lifetime.
94
Table of Contents
Effect of a Change in Control. Our amended and restated 2000 Stock Incentive Plan provides that in the event of a “corporate transaction,” generally defined as merger with or into another corporation or a change in control, the portion of each award that is assumed, substituted or replaced with a cash incentive program will become fully vested and exercisable upon termination of an employee, director or consultant if such termination occurs by us or the successor corporation without “cause” or voluntarily by such employee, director or consultant with “good reason” and within twelve months following such corporate transaction. For the portion of the award that is not assumed, substituted or replaced, such portion of the award will become automatically vested and exercisable immediately prior to the effective date of the corporate transaction. If an award is not assumed, substituted or replaced, each outstanding award will terminate upon the consummation of the corporate transaction.
Disposition of a Related Entity. In the event of a disposition of an entity related to us and outstanding awards of a participant performing services at such time to the related entity are not assumed, substituted or replaced, the plan provides that upon the consummation of such related entity disposition such participant will be deemed to have terminated service and any outstanding awards will be exercisable in accordance with the terms of the applicable award agreement. If awards are assumed, substituted or replaced and except as otherwise provided in any award agreement, the portion of each award that is assumed, substituted or replaced will become fully vested and exercisable upon termination of the participant’s service if such termination occurs by us or the successor corporation without cause or voluntarily by such participant with good reason and within twelve months following such related entity disposition. For the portion of the award that is not assumed, substituted or replaced, such portion of the award will become automatically vested and exercisable immediately prior to the effective date of the related entity disposition.
Amendment or Termination. Our amended and restated 2000 Stock Incentive Plan will automatically terminate in 2010, unless we terminate it sooner. In addition, our board of directors has the authority to amend, suspend or terminate the amended and restated 2000 Stock Incentive Plan, provided such action does not impair the rights of any participant.
Stock Equivalent Cash Bonus Program
Our board of directors adopted our Stock Equivalent Cash Bonus Program in January 2002. The stock equivalent program provides for the grant of stock equivalent units with an economic benefit equivalent to the grant of a stock option under our stock plans to our employees and consultants who provide services for our offices in China and France. We may cancel or change the stock equivalent program at any time and for any reason. In January 2002, we issued 31,500 stock appreciation rights to certain employees based outside of the U.S. All grants were made at the fair market value on the date of issuance of $1.25 per share and vest ratably over four years.
Stock equivalent units are granted with an initial value equal to the fair market value of a share of our Class B common stock on the date of grant. The initial value of each unit will be proportionately adjusted for any stock splits, stock combinations, stock dividends or other such events between the date the award is granted and the date the award becomes payable. Each unit will vest over four years at a rate of 1/4th per year from the date of grant as long as the participant continues to provide services for us on each vesting date. Upon termination of a participant’s service with us, any unvested units will automatically terminate.
Units are payable in cash upon the following events: (i) at a participant’s request at any time following the completion of this offering, (ii) upon the participant’s termination of service with us, or (iii) upon cancellation of the stock equivalent program. The amount due upon such payment date will be equal to the amount, if any, by which the value of a share of our Class B common stock on the payment date is greater than the initial value of the unit on the date of grant.
2005 Stock Plan
Our board of directors adopted our 2005 Stock Plan in November 2004, and we expect the stockholders to approve the 2005 Stock Plan prior to the completion of this offering. The 2005 Stock Plan will become effective
95
Table of Contents
on the day prior to the completion of this offering. Our 2005 Stock Plan provides for the grant of incentive stock options, nonstatutory stock options, restricted stock, stock appreciation rights, deferred stock units, performance units and performance shares.
Share Reserve. A total of 6,000,000 shares of our Class A common stock are authorized for issuance under the 2005 Stock Plan. Any shares subject to an award with a per share price less than the fair market value of our Class A common stock on the date of grant will be counted against the authorized share reserve as two shares for every one share subject to the award, and if returned to the 2005 Stock Plan such shares will be counted as two shares for every one share returned. Appropriate adjustments will be made in the number of authorized shares and in outstanding awards to prevent dilution or enlargement of participants’ rights in the event of a spin-off, stock split or other change in our capital structure. Shares subject to awards which expire or are cancelled or forfeited will again become available for issuance under the 2005 Stock Plan. The shares available will not be reduced by awards settled in cash or by shares withheld to satisfy the purchase price of an award or tax withholding obligations.
Eligibility, Term and Administration of Awards. Our board of directors or a committee of our board administers our 2005 Stock Plan. In the case of options intended to qualify as “performance-based compensation” within the meaning of Section 162(m) of the Internal Revenue Code, the committee will consist of two or more “outside directors” within the meaning of Section 162(m). The administrator has the power to determine the terms of the awards, including the exercise price, the number of shares subject to each such award, the exercisability of the awards and the form of consideration, if any, payable upon exercise.
Stock Options. The administrator determines the exercise price of options granted under our 2005 Stock Plan, but with respect to nonstatutory stock options intended to qualify as “performance-based compensation” within the meaning of Section 162(m) and all incentive stock options, the exercise price must at least be equal to the fair market value of our Class A common stock on the date of grant. The term of an incentive stock option may not exceed ten years, except that with respect to any participant who owns 10% of the voting power of all classes of our outstanding stock, the term must not exceed five years and the exercise price must equal at least 110% of the fair market value on the grant date. The administrator determines the term of all other options.
Upon termination of a participant’s service with us or with a subsidiary of us, he or she may exercise his or her option for the period of time stated in the option agreement. Generally, if termination is due to death or disability, the option will remain exercisable for 12 months. In all other cases, the option will generally remain exercisable for three months. However, an option may never be exercised later than the expiration of its term.
Restricted Stock. Restricted stock may be granted under our 2005 Stock Plan. Restricted stock awards are shares of our Class A common stock that vest in accordance with terms and conditions established by the administrator. The administrator will determine the number of shares of restricted stock granted to any employee. The administrator may impose whatever conditions to vesting it determines to be appropriate. For example, the administrator may set restrictions based on the achievement of specific performance goals. Shares of restricted stock that do not vest are subject to our right of repurchase or forfeiture.
Stock Appreciation Rights. Stock appreciation rights may be granted under our 2005 Stock Plan. Stock appreciation rights allow the recipient to receive the appreciation in the fair market value of our Class A common stock between the exercise date and the date of grant. The administrator determines the terms of stock appreciation rights, including when such rights become exercisable and whether to pay the increased appreciation in cash or with shares of our Class A common stock, or a combination thereof.
Performance Units and Performance Shares. Performance units and performance shares may be granted under our 2005 Stock Plan. Performance units and performance shares are awards that will result in a payment to a participant only if performance goals established by the administrator are achieved or the awards otherwise vest. The administrator will establish organizational or individual performance goals in its discretion, which, depending on the extent to which they are met, will determine the number and/or the value of performance units
96
Table of Contents
and performance shares to be paid out to participants. Performance units will have an initial dollar value established by the administrator on or before the grant date. Performance shares will have an initial value equal to the fair market value of our Class A common stock on the grant date.
Deferred Stock Units. Our 2005 Stock Plan permits the grant of deferred stock units, which may consist of restricted stock, performance shares or performance unit awards that are paid out in installments or on a deferred basis, as determined in the administrator’s sole discretion and in accordance with rules and procedures established by the administrator. Deferred stock units may be settled in cash, shares of our Class A common stock or a combination of cash and our common stock.
Outside Director Awards. The 2005 Stock Plan also provides for the automatic grant of nonstatutory stock options to our non-employee directors. Each non-employee director appointed to the board after the completion of this offering, except for those inside directors who cease to be inside directors but remain non-employee directors, will receive an initial option to purchase 20,000 shares. This initial option will vest over three years at a rate of 1/3rd upon each anniversary of the vesting commencement date, provided that the director continues to serve on the board. In addition, on July 15, 2005, and following each annual meeting of our stockholders beginning in 2006, non-employee directors who have been directors for at least six months will receive a subsequent option to purchase 10,000 shares. This subsequent option will vest over three years at a rate of 1/3rd upon each anniversary of the vesting commencement date, provided that the director continues to serve on the board. All options granted under the automatic grant provisions have a term of ten years and an exercise price equal to fair market value of our Class A common stock on the date of grant. The administrator may change the number of shares subject to the initial and subsequent options and the terms of such options, and may grant a different mix of equity awards of an equivalent value to such options as determined by our board of directors on the date of grant.
Effect of a Change in Control. Our 2005 Stock Plan provides that in the event of our “change in control,” the successor corporation will assume, substitute an equivalent award, or replace with a cash incentive program each outstanding award under the plan. With respect to awards made to a non-employee director, such awards will become fully vested and exercisable immediately prior to the change in control. With respect to awards made to our employees and consultants, such awards will be subject to an accelerated vesting schedule equal to one year of additional vesting for each year of service the employee or consultant provided to us on the date, following our change in control, such employee or consultant is terminated by us or a successor to us without “cause” or if such employee or consultant resigns for “good reason,” provided that the termination or resignation occurs within the 12 months following our change in control. If there is no assumption, substitution or replacement with a cash incentive program of outstanding awards, such awards will become fully vested and exercisable immediately prior to the change in control unless otherwise determined by the administrator, and the administrator will provide notice to the recipient that he or she has the right to exercise such outstanding awards for a period of 15 days from the date of the notice. The awards will terminate upon the expiration of the 15-day period.
Transferability. Our 2005 Stock Plan generally does not allow for the transfer of awards and only the recipient of an award may exercise an award during his or her lifetime.
Additional Provisions. Our 2005 Stock Plan will automatically terminate in 2015, unless we terminate it sooner. In addition, our board of directors has the authority to amend, suspend or terminate the 2005 Stock Plan provided such action does not impair the rights of any participant.
Retirement Plans
Senior Executive Supplemental Retirement Plan. We sponsor a nonqualified senior executive supplemental retirement plan, which provides supplemental retirement benefits for a select group of executive employees based on contributions we make to the plan and the gains and losses on the investment of those contributions. Even though distributions from the senior executive supplemental retirement plan are made in a single lump sum, we make annual contributions on behalf of each participant in an amount necessary to fund a
97
Table of Contents
hypothetical joint and 50% survivor annuity benefit payable to each participant commencing at age 65. The hypothetical monthly benefit is determined on the basis of an 8% interest rate and a standard mortality table by multiplying (i) 2% of a participant’s projected average annual compensation by (ii) a participant’s total expected years of service with us up to 30 years. A participant’s projected average annual compensation is determined by averaging the participant’s estimated annual compensation over the three consecutive years of service occurring in the participant’s final three plan years preceding attainment of age 65. Each participant is 100% vested in his or her interest in the senior executive supplemental retirement plan at all times. Upon a participant’s termination of service with us for any reason other than death, a participant is entitled to his or her account balance determined as of the valuation date immediately preceding his or her termination date, which amount will be paid in a single lump sum. Upon a participant’s death, the participant’s beneficiary will receive all amounts credited to the participant’s account as of the date of death and will be paid in a single lump sum. Amounts contributed by us under the senior executive supplemental retirement plan are held in a rabbi trust and a participant’s account will be credited with investment gains and losses based on investments selected by the participant. However, if a participant fails to make an investment election, the trustee of the senior executive supplemental retirement plan may direct such investments. Our board of directors may at any time amend or terminate the senior executive supplemental retirement plan.
401(k) Plan. We maintain a tax-qualified retirement plan that provides eligible employees with an opportunity to save for retirement on a tax advantaged basis. Eligible employees are able to participate in the 401(k) plan as of the first day of the quarter on or following the date they begin employment and participants are able to defer up to 100% of their eligible compensation subject to applicable annual Internal Revenue Code limits. Pre-tax contributions are allocated to each participant’s individual account and are then invested in selected investment alternatives according to the participants’ directions. Employee elective deferrals are 100% vested at all times. The 401(k) plan allows for matching contributions to be made by us as well as a discretionary profit sharing component for eligible employees starting on the first day of the quarter on or following one year of service. The matching and profit sharing contributions vest over a five year period based on years of service under the 401(k) plan. The 401(k) plan is intended to qualify under Sections 401(a) and 501(a) of the Internal Revenue Code. As a tax-qualified retirement plan, contributions to the 401(k) plan and earnings on those contributions are not taxable to the employees until distributed from the 401(k) plan and all contributions are deductible by us when made.
Other. We also sponsor a number of employee benefit plans outside the United States.
Limitation on Liability and Indemnification Matters
Our amended and restated certificate of incorporation contains provisions that limit the liability of our directors for monetary damages to the fullest extent permitted by Delaware law. Consequently, our directors will not be personally liable to us or our stockholders for monetary damages for any breach of fiduciary duties as directors, except liability for:
| · | Any breach of the director’s duty of loyalty to us or our stockholders; |
| · | Any act or omission not in good faith or that involves intentional misconduct or a knowing violation of law; |
| · | Unlawful payments of dividends or unlawful stock repurchases or redemptions as provided in Section 174 of the Delaware General Corporation Law; or |
| · | Any transaction from which the director derived an improper personal benefit. |
Our amended and restated bylaws provide that we are required to indemnify our directors and officers and may indemnify our employees and other agents to the fullest extent permitted by Delaware law. Our bylaws also provide that we shall advance expenses incurred by a director or officer in advance of the final disposition of any action or proceeding, and permit us to secure insurance on behalf of any officer, director, employee or other agent for any liability arising out of his or her actions in that capacity, regardless of whether our bylaws would
98
Table of Contents
otherwise permit indemnification. We have entered and expect to continue to enter into agreements to indemnify our directors, executive officers and other employees as determined by the board of directors. These agreements provide for indemnification for related expenses including attorneys’ fees, judgments, fines and settlement amounts incurred by any of these individuals in any action or proceeding. We believe that these bylaw provisions and indemnification agreements are necessary to attract and retain qualified persons as directors and officers. We also maintain directors’ and officers’ liability insurance.
The limitation of liability and indemnification provisions in our amended and restated certificate of incorporation and amended and restated bylaws may discourage stockholders from bringing a lawsuit against our directors for breach of their fiduciary duty. They may also reduce the likelihood of derivative litigation against our directors and officers, even though an action, if successful, might benefit us and other stockholders. Furthermore, a stockholder’s investment may be adversely affected to the extent that we pay the costs of settlement and damage awards against directors and officers as required by these indemnification provisions. At present, there is no pending litigation or proceeding involving any of our directors, officers or employees for which indemnification is sought, and we are not aware of any threatened litigation that may result in claims for indemnification.
99
Table of Contents
CERTAIN RELATIONSHIPS AND RELATED PARTY TRANSACTIONS
Asset Contribution; Licensing Agreements with Ray Dolby Regarding Intellectual Property
Ray Dolby founded Dolby Laboratories to develop noise reduction technologies he had invented. Throughout our nearly 40 year history, Ray Dolby has retained ownership of the intellectual property rights he created related to our business. These intellectual property rights are currently held by entities affiliated with him that have licensed this technology to us in exchange for royalty payments, including royalty payments related to certain trademark usage. Under these licensing and royalty agreements, we recorded expenses for royalties payable to Ray Dolby for the use of certain patent and trademark rights of $18.8 million, $27.6 million and $36.9 million in fiscal 2002, 2003 and 2004, respectively.
In addition, in fiscal 2002, Ray Dolby reimbursed us approximately $6.0 million for administering licenses covering certain of his intellectual property rights. In June 2002, we terminated this licensing administration arrangement and amended our licensing agreements with Ray Dolby to license from him the intellectual property rights we had previously administered on his behalf. In exchange, we agreed to pay him royalties in an amount that was intended to approximate the net revenue he would have received under our prior licensing administration arrangement.
Ray Dolby has agreed to contribute to us, prior to the completion of this offering, all rights in intellectual property related to our business that he and his affiliates hold, so that we will have full ownership rights in this intellectual property once we are a public company. In connection with the asset contribution, our current licensing arrangements with Ray Dolby will terminate, and we will have no further obligation to pay royalties to Ray Dolby. We have agreed to pay certain of Ray Dolby’s expenses in connection with this offering, currently estimated at approximately $ .
In connection with the asset contribution agreement, Ray Dolby has entered into an employee proprietary rights agreement substantially in the form that all employees of Dolby Laboratories enter into in connection with their employment. This agreement will become effective upon completion of this offering. Under the terms of this agreement, all future inventions created by Ray Dolby related to our business while he remains an employee will be assigned to Dolby Laboratories. Under this agreement, Ray Dolby also agreed to abide by a conflicts of interest policy substantially in the form that all other employees are required to sign. However, the conflict of interest policy that Ray Dolby has signed differs from our standard policy in that, among other matters, it permits him to use our equipment, supplies and facilities to conduct research and development on matters unrelated to our business; does not apply to any lease agreement we have entered into or may enter into with him; and permits him to have up to a ten percent interest, instead of up to a two percent interest, in a competitor, customer, licensee or supplier without being in violation of the policy and limits the provision of the policy related to having interests in these entities only to direct interests.
Real Estate Transactions
Lease for 100 Potrero Avenue
Since 1980, we have leased our principal executive offices located at 100 Potrero Avenue, San Francisco, California, from Ray Dolby. The lease for these offices expires on December 31, 2005, and we have an option to extend the term for an additional five years. We also lease additional parking and warehouse space from Ray Dolby in connection with our lease of 100 Potrero Avenue. Our rent expense for these facilities was $3.4 million, $3.5 million and $3.5 million in fiscal 2002, 2003 and 2004, respectively. We are responsible for the condition, operation, repair, maintenance, security and management of the property. We have also agreed to indemnify and hold Ray Dolby, as landlord, harmless from and against any liabilities, damages, claims, costs, penalties and expenses arising from our conduct related to the property.
100
Table of Contents
Jointly Owned Real Estate Entities
Ray and Dagmar Dolby, the Ray Dolby Trust or the Dolby Family Trust owns a majority financial interest in five real estate entities that own and lease commercial real property to us. We own the remaining financial interests in these real estate entities. The following table sets forth, for each of the five real estate entities, the person or entity that owns the majority financial interest in the real estate entity, the percentage interest owned by the majority owner in such real estate entity and the location of the property subject to the applicable lease. The leased property in San Francisco, California includes our principal administrative offices at 999 Brannan Street.
Real Estate Entity | Majority Owner | Majority Ownership Interest | Location of Property Leased to Us | |||
Dolby Properties, LLC | Ray Dolby Trust | 62.5% | San Francisco, California | |||
Dolby Properties Burbank, LLC | Dolby Family Trust | 51.0% | Burbank, California | |||
Dolby Properties Brisbane, LLC | Dolby Family Trust | 51.0% | Brisbane, California | |||
Dolby Properties UK, LLC | Dolby Family Trust | 51.0% | Wootton Bassett, England | |||
Dolby Properties, LP | Ray and Dagmar Dolby | 90.0% | Wootton Bassett, England |
Our expense recorded for rents payable to such entities was $4.5 million, $4.7 million and $5.1 million in fiscal 2002, 2003 and 2004, respectively, and we received $0.2 million, $0.2 million and $0.1 million in management fees for the same periods, respectively.
When we negotiate a lease agreement with Ray Dolby or any of the jointly owned real estate entities, we engage real estate brokers to provide fair market rent and lease terms based on a summary of comparable properties located in the area of the subject property. The brokers are instructed that the transaction is intended to be completed on an “arm’s-length” basis. We believe that all of our leases were entered into on a reasonable fair market basis.
The properties owned by Dolby Properties, LLC in San Francisco, California, Dolby Properties Burbank, LLC in Burbank, California, and Dolby Properties UK, LLC in Wootton Bassett, England were purchased with capital contributions and proceeds from bank loans. We guarantee each of these bank loans. As of September 24, 2004, the aggregate outstanding principal balance on all these bank loans was approximately $14.9 million.
Employment Arrangements and Indemnification Agreements
We have entered into employment arrangements with certain of our executive officers. See “Management—Employment Agreements and Change in Control Arrangements.”
We have also entered into indemnification agreements with each of our directors and officers. The indemnification agreements and our amended and restated certificate of incorporation and amended and restated bylaws require us to indemnify our directors and officers to the fullest extent permitted by Delaware law. See “Management—Limitations on Liability and Indemnification Matters.”
101
Table of Contents
PRINCIPAL AND SELLING STOCKHOLDERS
The following table sets forth certain information with respect to the beneficial ownership of our common stock at September 24, 2004, as adjusted to reflect the sale of Class A common stock offered by us in this offering, for:
| · | Each person who we know beneficially owns more than five percent of our common stock; |
| · | Each of our directors; |
| · | Each of our named executive officers; |
| · | All of our directors and executive officers as a group; and |
| · | All selling stockholders. |
We have determined beneficial ownership in accordance with the rules of the SEC. Except as indicated by the footnotes below, we believe, based on the information furnished to us, that the persons and entities named in the table below have sole voting and investment power with respect to all shares of Class B common stock that they beneficially own, subject to applicable community property laws.
No shares of Class A common stock are outstanding. Immediately prior to the completion of this offering, the selling stockholders will convert shares of Class B common stock into the shares of Class A common stock to be sold by them in this offering. Each share of Class B common stock is convertible into one share of Class A common stock. In addition, none of the persons and entities named in the table below will own any shares of Class A common stock immediately after the completion of this offering.
Applicable percentage ownership is based on no shares of Class A common stock and 86,547,910 shares of Class B common stock outstanding at September 24, 2004. For purposes of the table below, we have assumed that shares of Class A common stock and shares of Class B common stock will be outstanding upon completion of this offering. In computing the number of shares of common stock beneficially owned by a person and the percentage ownership of that person, we deemed to be outstanding all shares of common stock subject to options, warrants or other convertible securities held by that person or entity that are currently exercisable or exercisable within 60 days of September 24, 2004. We did not deem these shares outstanding, however, for the purpose of computing the percentage ownership of any other person. Beneficial ownership representing less than one percent is denoted with an “*.”
Percentage total voting power represents voting power with respect to all shares of our Class A and Class B common stock, as a single class. Each holder of Class A common stock is entitled to one vote per share of Class A common stock and each holder of Class B common stock is entitled to ten votes per share of Class B common stock. The Class A common stock and Class B common stock vote together as a single class on all matters submitted to our stockholders for a vote. The Class B common stock is convertible at any time by the holder into shares of Class A common stock, on a share-for-share basis.
Unless otherwise indicated, the address of each beneficial owner listed in the table below is c/o Dolby Laboratories, Inc., 100 Potrero Avenue, San Francisco, California 94103.
102
Table of Contents
Shares Beneficially Owned Prior to Offering | Shares Being Offered | Shares Beneficially Owned After Offering | ||||||||||||||
Class B Common Stock | % Total Voting Power | Class B Common Stock | % Total Common Stock | % Total Voting Power | ||||||||||||
Name of Beneficial Owner | Shares | % | Shares | % | ||||||||||||
5% Stockholders: | ||||||||||||||||
Ray Dolby Trust (1) | 77,500,000 | 89.5 | 89.5 | |||||||||||||
Ray and Dagmar Dolby Investments, L.P. (2) | 7,500,000 | 8.7 | 8.7 | |||||||||||||
Directors and Executive Officers: | ||||||||||||||||
Ray Dolby (3) | 85,000,000 | 98.2 | 98.2 | |||||||||||||
Bill Jasper (4) | 812,500 | * | * | — | 812,500 | * | * | |||||||||
Mark Anderson | — | — | — | — | — | — | — | |||||||||
Marty Jaffe | 31,250 | * | * | — | 31,250 | * | * | |||||||||
Ed Schummer (5) | 104,410 | * | * | — | 104,410 | * | * | |||||||||
David Watts (6) | — | — | — | 82,400 | * | * | ||||||||||
Peter Gotcher | 20,000 | * | * | — | 20,000 | * | * | |||||||||
Sanford Robertson (7) | 20,000 | * | * | — | 20,000 | * | * | |||||||||
Roger Siboni | — | — | — | — | — | — | — | |||||||||
All executive officers and directors as a group (12 persons) (8) | 86,217,675 | 99.4 | 99.4 | |||||||||||||
| * | Less than one percent. |
| (1) | Shares beneficially owned by the Ray Dolby Trust include 77,500,000 shares held of record by Ray Dolby as Trustee of the Ray Dolby Trust under the Dolby Family Trust Instrument dated May 7, 1999. |
| (2) | Investment power over the 7,500,000 shares held by Ray and Dagmar Dolby Investments, L.P. is held by Ray Dolby, as Trustee of the Ray Dolby Trust under the Dolby Family Instrument dated May 7, 1999. Voting power over 3,750,000 of the shares held by Ray and Dagmar Dolby Investments, L.P. is held by Thomas E. Dolby, son of Ray and Dagmar Dolby, as Special Trustee of the Ray Dolby 2002 Trust A, dated April 19, 2002. Voting power over 3,750,000 of the shares held by Ray and Dagmar Dolby Investments, L.P. is held by David E. Dolby, son of Ray and Dagmar Dolby, as Special Trustee of the Ray Dolby 2002 Trust B, dated April 19, 2002. |
| (3) | Shares beneficially owned by Ray Dolby represent the 77,500,000 shares held of record by Ray Dolby as Trustee of the Ray Dolby Trust under the Dolby Family Instrument dated May 7, 1999, and the 7,500,000 shares held of record by Ray and Dagmar Dolby Investments, L.P. over which Ray Dolby, as Trustee of the Ray Dolby Trust under the Dolby Family Instrument dated May 7, 1999, holds investment power. |
| (4) | Shares beneficially owned by Mr. Jasper represent 342,890 shares held of record by Mr. Jasper, 300,000 shares held of record by the N. William Jasper, Jr. 2004 Irrevocable Trust, 125,000 shares held of record by the Kristen L. McFarland 2004 Irrevocable Trust and options held by Mr. Jasper to purchase 44,610 shares of Class B common stock that are exercisable within 60 days of September 24, 2004. |
| (5) | Includes options held by Mr. Schummer to purchase 86,030 shares of Class B common stock that are exercisable within 60 days of September 24, 2004. |
| (6) | Mr. Watts holds options to purchase shares of Class B common stock, 82,400 shares of which were vested within 60 days of September 24, 2004; however, no shares are exercisable under Mr. Watts’s option until the completion of this offering. |
| (7) | Includes options held by Mr. Robertson to purchase 20,000 shares of Class B common stock that are exercisable within 60 days of September 24, 2004. |
| (8) | Includes options to purchase 215,730 shares of Class B common stock that are exercisable within 60 days of September 24, 2004. |
103
Table of Contents
General
The following is a summary of the rights of our common stock and related provisions of our amended and restated certificate of incorporation and amended and restated bylaws, as they will be in effect upon the completion of this offering. For more detailed information, please see our amended and restated certificate of incorporation and amended and restated bylaws, which are filed as exhibits to the registration statement of which this prospectus is part.
Our amended and restated certificate of incorporation provides that, upon the completion of this offering, we will have two classes of common stock: Class A common stock, which has one vote per share, and Class B common stock, which has ten votes per share. Any holder of Class B common stock may convert his or her shares at any time into shares of Class A common stock on a share-for-share basis. The rights of the two classes of common stock are otherwise identical. The rights of these classes of common stock are discussed in greater detail below.
Immediately following the completion of this offering, our authorized capital stock will consist of 1,000,000,000 shares, each with a par value of $0.001 per share, of which:
| · | 500,000,000 shares are designated as Class A common stock; and |
| · | 500,000,000 shares are designated as Class B common stock. |
At September 24, 2004, we had outstanding no shares of Class A common stock and 86,547,910 shares of Class B common stock, held of record by 49 stockholders. These amounts assume the conversion of all outstanding shares of our common stock into Class B common stock.
Common Stock
Voting Rights
Holders of our Class A and Class B common stock have identical rights, except that holders of our Class A common stock are entitled to one vote per share and holders of our Class B common stock are entitled to ten votes per share. Holders of shares of Class A common stock and Class B common stock will vote together as a single class on all matters, including the election of directors, submitted to a vote of stockholders, unless otherwise required by law. Delaware law could require either our Class A common stock or Class B common stock to vote separately as a single class if we amended our certificate of incorporation in a manner that altered or changed the powers, preferences or special rights of a class of stock in a manner that affects them adversely.
We have not provided for cumulative voting for the election of directors in our amended and restated certificate of incorporation.
Dividends
The holders of shares of Class A common stock and Class B common stock shall be entitled to share equally in any dividends that our board of directors may determine to issue from time to time. In the event a dividend is paid in the form of shares of common stock or rights to acquire shares of common stock, the holders of Class A common stock shall receive shares of Class A common stock or rights to acquire shares of Class A common stock, as the case may be, and the holders of shares of Class B common stock shall receive shares of Class B common stock or rights to acquire shares of Class B common stock, as the case may be.
Liquidation Rights
Upon our liquidation, dissolution or winding-up, the holders of shares of Class A common stock and shares of Class B common stock shall be entitled to share equally all assets remaining after the payment of any liabilities.
104
Table of Contents
Conversion
Our shares of Class A common stock are not convertible into any other shares of our capital stock. Each share of Class B common stock is convertible into one share of Class A common stock at any time at the option of the holder or upon the affirmative vote of the holders of majority of the shares of Class B common stock.
In addition, each share of Class B common stock shall convert automatically into one share of Class A common stock upon any transfer, whether or not for value, except for certain transfers described in our certificate of incorporation, which include transfers to:
| · | Holders of shares of Class B common stock or options exercisable for shares of Class B common stock as of the effectiveness of this offering; |
| · | Spouses or lineal descendants, or the spouses or domestic partners of such lineal descendants, of the holders of shares of Class B common stock or options exercisable for shares of Class B common stock as of the effectiveness of this offering; |
| · | The executor or administrator of the estate of holders of shares of Class B common stock or options exercisable for shares of Class B common stock as of the effectiveness of this offering, such persons’ spouses or lineal descendants, or the spouses or domestic partners of such lineal descendants; |
| · | A trust for the benefit of one or more of the holders of shares of Class B common stock or options exercisable for shares of Class B common stock as of the effectiveness of this offering, such persons’ spouses or lineal descendants, the spouses or domestic partners of such lineal descendants, the parents of the spouse of holders of shares of Class B common stock or options exercisable for shares of Class B common stock as of the effectiveness of this offering or such lineal descendents or the spouses or domestic partners of such lineal descendants, provided that the beneficiaries of such trusts may also include individuals or entities entitled to specific cash distributions or specific items of property other than shares of shares of Class B common stock and one or more charitable organizations; |
| · | A charitable organization established by holders of shares of Class B common stock or options exercisable for shares of Class B common stock as of the effectiveness of this offering, such persons’ spouses or lineal descendants, or the spouses or domestic partners of such lineal descendants; or |
| · | Any other entity controlled by holders of shares of Class B common stock or options exercisable for shares of Class B common stock as of the effectiveness of this offering, such persons’ spouses or lineal descendants, or the spouses or domestic partners of such lineal descendants, or one or more trusts for their benefit, or one or more charitable organizations established by them; |
provided, however, each share of Class B common stock shall automatically convert into one share of Class A common stock in any transfer by the above persons or entities in a brokerage transaction or transaction with a market maker, or in any similar open market transaction on any securities exchange, national quotation system or over-the-counter market.
We may not issue or sell any shares of Class B common stock, or any securities convertible or exercisable into shares of Class B common stock, except for the issuance or sale of shares:
| · | Pursuant to the exercise of options outstanding under our 2000 Stock Incentive Plan, as amended; or |
| · | Pursuant to any stock splits, stock dividends, subdivisions, combinations or recapitalizations with respect to our Class B common stock. |
Anti-Takeover Effects of Delaware Law and Our Certificate of Incorporation and Bylaws
Certain provisions of Delaware law, our amended and restated certificate of incorporation and our amended and restated bylaws contain provisions that could have the effect of delaying, deferring or discouraging another party from acquiring control of us. In particular, our dual class common stock structure concentrates voting
105
Table of Contents
power in the hands of certain stockholders. These provisions, which are summarized below, are expected to discourage coercive takeover practices and inadequate takeover bids. These provisions are also designed, in part, to encourage persons seeking to acquire control of us to first negotiate with our board of directors. We believe that the benefits of increased protection of our potential ability to negotiate with an unfriendly or unsolicited acquiror outweigh the disadvantages of discouraging a proposal to acquire us because negotiation of these proposals could result in an improvement of their terms.
Dual Class Structure
As discussed above, our Class B common stock has ten votes per share, while our Class A common stock, which is the class of stock we are selling in this offering and which will be the only class of stock that is publicly traded, has one vote per share. After the offering, Ray Dolby and persons and entitles affiliated with Ray Dolby will own approximately % of our Class B common stock, representing % of the voting power of our outstanding capital stock. Under our charter, holders of shares of Class B common stock may generally transfer such shares to family members, including spouses and domestic partners, and descendents without having the shares automatically convert into shares of Class A common stock.
Because of this dual class structure, Ray Dolby, his affiliates, and his family members and descendents are expected to retain, for the foreseeable future, significant influence over our management and affairs, and will be able to control all matters requiring stockholder approval, including the election of directors and significant corporate transactions such as mergers or other sales of our company or assets, even if they come to own considerably less than 50% of the outstanding shares of our common stock. Assuming the conversion of all shares of Class B common stock held by persons not affiliated with Ray Dolby, so long as Ray Dolby and his affiliates continue to hold shares of Class B common stock representing approximately 9% or more of our total outstanding common stock, they will hold a majority of the voting power of our common stock. This concentrated control will significantly limit the ability of stockholders other than Ray Dolby and his affiliates to influence corporate matters. Moreover, Ray Dolby and his affiliates may take actions that other stockholders do not view as beneficial.
There is no threshold or time deadline at which the shares of Class B common stock will automatically convert into shares of Class A common stock.
Limits on Ability of Stockholders to Act by Written Consent or Call a Special Meeting
We have provided in our amended and restated certificate of incorporation that our stockholders may not act by written consent after such time as the outstanding shares of Class B common stock represent less than a majority of the voting power of our common stock. This limit on the ability of our stockholders to act by written consent may lengthen the amount of time required to take stockholder actions. As a result, a holder controlling a majority of our capital stock would not be able to amend our bylaws or remove directors without holding a stockholders meeting.
In addition, our amended and restated certificate of incorporation provides that, unless otherwise required by law, special meetings of the stockholders may be called only by the chairman of the board, the chief executive officer, the president, or the board of directors acting pursuant to a resolution adopted by a majority of the board members. A stockholder may not call a special meeting, which may delay the ability of our stockholders to force consideration of a proposal or for holders controlling a majority of our capital stock to take any action, including the removal of directors.
Requirements for Advance Notification of Stockholder Nominations and Proposals
Our amended and restated bylaws establish advance notice procedures with respect to stockholder proposals and the nomination of candidates for election as directors, other than nominations made by or at the direction of the board of directors or a committee of the board of directors. The bylaws do not give the board of directors the power to approve or disapprove stockholder nominations of candidates or proposals regarding business to be conducted at a special or annual meeting of the stockholders. However, our bylaws may have the effect of
106
Table of Contents
precluding the conduct of certain business at a meeting if the proper procedures are not followed. These provisions may also discourage or deter a potential acquiror from conducting a solicitation of proxies to elect the acquirer’s own slate of directors or otherwise attempting to obtain control of our company.
Delaware Anti-Takeover Statute
We are subject to the provisions of Section 203 of the Delaware General Corporation Law regulating corporate takeovers. In general, Section 203 prohibits a publicly-held Delaware corporation from engaging, under certain circumstances, in a business combination with an interested stockholder for a period of three years following the date the person became an interested stockholder unless:
| · | Prior to the date of the transaction, the board of directors of the corporation approved either the business combination or the transaction which resulted in the stockholder becoming an interested stockholder; |
| · | Upon completion of the transaction that resulted in the stockholder becoming an interested stockholder, the interested stockholder owned at least 85% of the voting stock of the corporation outstanding at the time the transaction commenced, excluding for purposes of determining the voting stock outstanding, but not the outstanding voting stock owned by the interested stockholder, (1) shares owned by persons who are directors and also officers and (2) shares owned by employee stock plans in which employee participants do not have the right to determine confidentially whether shares held subject to the plan will be tendered in a tender or exchange offer; or |
| · | At or subsequent to the date of the transaction, the business combination is approved by the board and authorized at an annual or special meeting of stockholders, and not by written consent, by the affirmative vote of at least 66 2/3% of the outstanding voting stock which is not owned by the interested stockholder. |
Generally, a business combination includes a merger, asset or stock sale, or other transaction resulting in a financial benefit to the interested stockholder. An interested stockholder is a person who, together with affiliates and associates, owns or, within three years prior to the determination of interested stockholder status, did own 15% or more of a corporation’s outstanding voting stock. We expect the existence of this provision to have an anti-takeover effect with respect to transactions our board of directors does not approve in advance. We also anticipate that Section 203 may also discourage attempts that might result in a premium over the market price for the shares of common stock held by stockholders.
The provisions of Delaware law, our amended and restated certificate of incorporation and our amended and restated bylaws could have the effect of discouraging others from attempting hostile takeovers and, as a consequence, they may also inhibit temporary fluctuations in the market price of our common stock that often result from actual or rumored hostile takeover attempts. These provisions may also have the effect of preventing changes in our management. It is possible that these provisions could make it more difficult to accomplish transactions that stockholders may otherwise deem to be in their best interests.
Listing
We have applied to have our Class A common stock listed on the New York Stock Exchange under the symbol “DLB.”
Transfer Agent and Registrar
The transfer agent and registrar for our common stock is EquiServe Trust Company, N.A., located at 150 Royall Street, Canton, Massachusetts 02021.
107
Table of Contents
SHARES ELIGIBLE FOR FUTURE SALE
Before this offering, there has not been a public market for shares of our Class A stock. Future sales of substantial amounts of shares of our Class A common stock, including shares issued upon the exercise of outstanding options, in the public market after this offering, or the possibility of these sales occurring, could cause the prevailing market price for our Class A common stock to fall or impair our ability to raise equity capital in the future.
Upon the completion of this offering, a total of shares of our Class A and Class B common stock will be outstanding, assuming that there are no exercises of options that were granted after September 24, 2004 and no exercise of the underwriters’ over-allotment option. Of these shares, all shares of Class A common stock sold in this offering by us and the selling stockholders will be freely tradable in the public market without restriction or further registration under the Securities Act, unless these shares are held by “affiliates,” as that term is defined in Rule 144 under the Securities Act.
The remaining shares of common stock will be “restricted securities,” as that term is defined in Rule 144 under the Securities Act. These restricted securities are eligible for public sale only if they are registered under the Securities Act or if they qualify for an exemption from registration under Rules 144 or 701 under the Securities Act, which are summarized below.
Subject to the lock-up agreements described below and the provisions of Rules 144 and 701 under the Securities Act, these restricted securities will be available for sale in the public market as follows:
Date | Number of Shares | |
On the date of this prospectus | 0 | |
Between 90 and 180 days after the date of this prospectus | 0 | |
At various times beginning more than 180 days after the date of this prospectus |
In addition, as of September 24, 2004, a total of 12,599,820 shares of our Class B common stock were subject to outstanding options, of which options to purchase 4,500,698 shares of Class B common stock were vested and options to purchase 4,303,961 shares of Class B common stock were exercisable.
Rule 144
In general, under Rule 144 as currently in effect, a person who owns shares that were acquired from us or an affiliate of us at least one year prior to the proposed sale is entitled to sell upon the expiration of the lock-up agreements described below, within any three-month period beginning 90 days after the date of this prospectus, a number of shares that does not exceed the greater of:
| · | 1% of the number of shares of common stock then outstanding, which will equal approximately shares immediately after the offering; or |
| · | the average weekly trading volume of the common stock during the four calendar weeks preceding the filing of a notice on Form 144 with respect to such sale. |
Rule 144(k)
Under Rule 144(k), a person who is not deemed to have been one of our affiliates for purposes of the Securities Act at any time during the 90 days preceding a sale and who has beneficially owned the shares proposed to be sold for at least two years, including the holding period of any prior owner other than our affiliates, is entitled to sell such shares without complying with the manner of sale, public information, volume limitation or notice provisions of Rule 144. Therefore, unless otherwise restricted, “144(k) shares” may be sold immediately upon the completion of this offering.
108
Table of Contents
Rule 701
In general, under Rule 701 as currently in effect, any of our employees, consultants or advisors who purchase shares from us in connection with a compensatory stock or option plan or other written agreement in a transaction that was completed in reliance on Rule 701 and complied with the requirements of Rule 701 will be eligible to resell such shares 90 days after the effective date of this offering in reliance on Rule 144, but without compliance with certain restrictions, including the holding period, contained in Rule 144.
Lock-Up Agreements
We and all of our directors and officers and several of the other holders of shares of Class A and Class B common stock outstanding immediately prior to this offering, including each of the selling stockholders, have agreed that, without the prior written consent of Morgan Stanley & Co. Incorporated on behalf of the underwriters, we and they will not, during the period ending 180 days after the date of this prospectus:
| · | offer, pledge, sell, contract to sell, sell any option or contract to purchase, purchase any option or contract to sell, grant any option, right or warrant to purchase, lend or otherwise transfer or dispose of, directly or indirectly, any shares of our Class A or Class B common stock or any securities convertible into or exercisable or exchangeable for shares of our Class A or Class B common stock; |
| · | enter into any swap or other arrangement that transfers to another, in whole or in part, any of the economic consequences of ownership of our Class A or Class B common stock, |
whether any transaction described above is to be settled by delivery of shares of our Class A common stock or such other securities, in cash or otherwise. This agreement is subject to certain exceptions, and is also subject to extension for up to an additional 35 days, as set forth in “Underwriters.”
Registration Statements
We intend to file a registration statement on Form S-8/S-3 under the Securities Act covering shares of Class A common stock subject to options outstanding reserved for issuance under our stock plans and the resale of shares of our Class A common stock issuable upon conversion of the Class B common stock issued to employees, directors and consultants. We expect to file this registration statement as soon as practicable after this offering. However, none of the shares registered on Form S-8/S-3 will be eligible for resale until the expiration of the lock-up agreements to which they are subject.
109
Table of Contents
Under the terms and subject to the conditions contained in an underwriting agreement dated the date of this prospectus, the underwriters named below, for whom Morgan Stanley & Co. Incorporated, Goldman, Sachs & Co., J.P. Morgan Securities Inc., Adams Harkness, Inc. and William Blair & Company, L.L.C. are acting as representatives, have severally agreed to purchase, and we and the selling stockholders have agreed to sell to them, severally, the number of shares indicated below:
Name | Number of Shares | |
Morgan Stanley & Co. Incorporated | ||
Goldman, Sachs & Co. | ||
J.P. Morgan Securities Inc. | ||
Adams Harkness, Inc. | ||
William Blair & Company, L.L.C. | ||
Total | ||
The underwriters and the representatives are collectively referred to as the “underwriters” and the “representatives,” respectively. The underwriters are offering the shares of Class A common stock subject to their acceptance of the shares from us and subject to prior sale. The underwriting agreement provides that the obligations of the several underwriters to pay for and accept delivery of the shares of Class A common stock offered by this prospectus are subject to the approval of certain legal matters by their counsel and to certain other conditions. The underwriters are obligated to take and pay for all of the shares of Class A common stock offered by this prospectus if any such shares are taken. However, the underwriters are not required to take or pay for the shares covered by the underwriters’ over-allotment option described below.
The underwriters initially propose to offer part of the shares of Class A common stock directly to the public at the public offering price listed on the cover page of this prospectus and part to certain dealers at a price that represents a concession not in excess of $ per share under the public offering price. No underwriter may allow, and no dealer may reallow, any concession to other underwriters or to certain dealers. After the initial offering of the shares of Class A common stock, the offering price and other selling terms may from time to time be varied by the representatives.
We and the selling stockholders have granted to the underwriters an option, exercisable for 30 days from the date of this prospectus, to purchase up to an aggregate of additional shares of Class A common stock at the public offering price listed on the cover page of this prospectus, less underwriting discounts and commissions. The underwriters may exercise this option solely for the purpose of covering over-allotments, if any, made in connection with the offering of the shares of Class A common stock offered by this prospectus. To the extent the option is exercised, each underwriter will become obligated, subject to certain conditions, to purchase about the same percentage of the additional shares of Class A common stock as the number listed next to the underwriter’s name in the preceding table bears to the total number of shares of Class A common stock listed next to the names of all underwriters in the preceding table.
The following table shows the per share and total public offering price, underwriting discounts and commissions, and proceeds before expenses to us and the selling stockholders. These amounts are shown assuming both no exercise and full exercise of the underwriters’ option to purchase up to an additional shares of Class A common stock.
| Total | |||||||||
| Per Share | No Exercise | Full Exercise | |||||||
Public offering price | $ | $ | $ | ||||||
Underwriting discounts and commissions | $ | $ | $ | ||||||
Proceeds, before expenses, to Dolby Laboratories | $ | $ | $ | ||||||
Proceeds, before expenses, to selling stockholders | $ | $ | $ | ||||||
110
Table of Contents
The estimated offering expenses payable by us, exclusive of the underwriting discounts and commissions, are approximately $ , net of the expenses to be reimbursed by the underwriters as described below. The underwriters have agreed to reimburse us for certain of our expenses incurred in connection with this offering, estimated to be approximately $ .
The underwriters have informed us that they do not intend sales to discretionary accounts to exceed 5% of the total number of shares of Class A common stock offered by them.
We have applied to have our Class A common stock listed on the New York Stock Exchange under the trading symbol “DLB.”
We and all of our directors and officers and several of the other holders of shares of Class A and Class B common stock outstanding immediately prior to this offering, including each of the selling stockholders, have agreed that, without the prior written consent of Morgan Stanley & Co. Incorporated on behalf of the underwriters, we and they will not, during the period ending 180 days after the date of this prospectus:
| · | offer, pledge, sell, contract to sell, sell any option or contract to purchase, purchase any option or contract to sell, grant any option, right or warrant to purchase, lend or otherwise transfer or dispose of, directly or indirectly, any shares of our Class A or Class B common stock or any securities convertible into or exercisable or exchangeable for shares of our Class A or Class B common stock; |
| · | file any registration statement with the SEC relating to the offering of any shares of Class A or Class B common stock or any securities convertible into or exercisable or exchangeable for Class A or Class B common stock; or |
| · | enter into any swap or other arrangement that transfers to another, in whole or in part, any of the economic consequences of ownership of shares of our Class A or Class B common stock, |
whether any transaction described above is to be settled by delivery of our Class A common stock or such other securities, in cash or otherwise. Moreover, if:
| · | during the last 17 days of the 180-day restricted period referred to above we issue an earnings release or disclose material news or a material event relating to us occurs; or |
| · | prior to the expiration of the 180-day restricted period, we announce that we will release earnings results during the 16-day period beginning on the last day of the 180-day period; |
the restrictions described in the immediately preceding sentence will continue to apply until the expiration of the 18-day period beginning on the issuance of the earnings release, the disclosure of the material news or the occurrence of the material event.
The restrictions described in the immediately preceding paragraph do not apply to:
| · | the sale of shares to the underwriters; |
| · | transactions by any person other than us relating to shares of Class A common stock or other securities acquired in open market transactions after the completion of this offering; |
| · | the issuance by us of shares of, or options to purchase shares of, our Class A or Class B common stock to employees, officers, directors, advisors or consultants pursuant to employee benefit plans described above in “Management—Employee Benefit Plans” or an employee benefit plan assumed by us in a merger or acquisition transaction; |
| · | the issuance by us of shares of Class A or Class B common stock or securities convertible into or exchangeable for shares of our Class A or Class B common stock in connection with any mergers or acquisitions of securities, businesses, property or other assets, joint ventures or other strategic corporate transactions or any other transaction, the primary purpose of which is not to raise capital; |
111
Table of Contents
| · | the filing by us of any registration statement on Form S-8 or Form S-8/S-3 for the registration of shares of Class A or Class B common stock issued pursuant to employee benefit plans described above in “Management—Employee Benefit Plans” or an employee benefit plan assumed by us in a merger or acquisition transaction; |
| · | the establishment of a trading plan pursuant to Rule 10b5-1 under the Securities Exchange Act of 1934 by any person other than us relating to the sale of shares of Class A common stock, if then permitted by us, provided that no transfers occur under such plan during the 180-day restricted period, as the same may be extended as provided above; |
| · | transfers by any person other than us of shares of Class A or Class B common stock or any securities convertible into Class A or Class B common stock as a gift; |
| · | transfers by any person other than us of shares of Class A or Class B common stock to any trust for the direct or indirect benefit of the transferor or the immediate family of the transferor; |
| · | in the case of any stockholder that is a corporation, transfers of Class A or Class B common stock to any wholly-owned subsidiary or affiliate of that stockholder; or |
| · | in the case of any stockholder that is a limited liability company or partnership, transfers of shares of Class A or Class B common stock to its members or partners, as the case may be, or to a partnership or limited liability company affiliated with such stockholder; |
provided that, in the case of the transactions described in the fourth and the last four bullet points, each donee or transferee agrees to be subject to the restrictions described in the immediately preceding paragraph, subject to the applicable exceptions described above in this paragraph. In addition, the restrictions described in the immediately preceding paragraph will not prohibit us from repurchasing from any director, officer or other stockholder, or the right of any director, officer or other stockholder to sell to us, shares of Class A or Class B common stock issued under our amended and restated 2000 Stock Incentive Plan.
In order to facilitate the offering of the Class A common stock, the underwriters may engage in transactions that stabilize, maintain or otherwise affect the price of the Class A common stock. Specifically, the underwriters may sell more shares than they are obligated to purchase under the underwriting agreement, creating a short position. A short sale is covered if the short position is no greater than the number of shares available for purchase by the underwriters under the over-allotment option. The underwriters can close out a covered short sale by exercising the over-allotment option or purchasing shares in the open market. In determining the source of shares to close out a covered short sale, the underwriters will consider, among other things, the open market price of shares compared to the price available under the over-allotment option. The underwriters may also sell shares in excess of the over-allotment option, creating a naked short position. The underwriters must close out any naked short position by purchasing shares in the open market. A naked short position is more likely to be created if the underwriters are concerned that there may be downward pressure on the price of the Class A common stock in the open market after pricing that could adversely affect investors who purchase in this offering. As an additional means of facilitating this offering, the underwriters may bid for, and purchase, shares of Class A common stock in the open market to stabilize the price of the Class A common stock. Finally, the underwriting syndicate may reclaim selling concessions allowed to an underwriter or a dealer for distributing the Class A common stock in this offering if the syndicate repurchases previously distributed Class A common stock to cover syndicate short positions or to stabilize the price of the Class A common stock. These activities may raise or maintain the market price of the Class A common stock above independent market levels or prevent or retard a decline in the market price of the Class A common stock. The underwriters are not required to engage in these activities, and may end any of these activities at any time.
We, the selling stockholders and the underwriters have agreed to indemnify each other against certain liabilities, including liabilities under the Securities Act.
112
Table of Contents
Pricing of the Offering
Prior to this offering, there has been no public market for our Class A common stock. The initial public offering price will be determined by negotiations between us and the representatives. Among the factors considered in determining the initial public offering price will be our future prospects and those of our industry in general, our sales, earnings and certain other financial and operating information in recent periods, and the price-earnings ratios, price-sales ratios, market prices of securities, and certain financial and operating information of companies engaged in activities similar to ours. The estimated public offering price range set forth on the cover page of this preliminary prospectus is subject to change as a result of market conditions and other factors.
The validity of the shares of Class A common stock offered hereby will be passed upon for us by Wilson Sonsini Goodrich & Rosati, Professional Corporation, Palo Alto, California. Sidley Austin Brown & Wood LLP, San Francisco, California, will act as counsel to the underwriters.
The consolidated financial statements of Dolby Laboratories, Inc. as of September 26, 2003 and September 24, 2004 and for each of the years in the three-year period ended September 24, 2004 have been included herein and in the registration statement in reliance upon the report of KPMG LLP, independent registered public accounting firm, appearing elsewhere herein, and upon the authority of said firm as experts in accounting and auditing.
WHERE YOU CAN FIND ADDITIONAL INFORMATION
We have filed with the SEC a registration statement on Form S-1 under the Securities Act with respect to the shares of Class A common stock offered hereby. This prospectus, which constitutes a part of the registration statement, does not contain all of the information set forth in the registration statement or the exhibits and schedules filed therewith. For further information about us and the Class A common stock offered hereby, reference is made to the registration statement and the exhibits and schedules filed therewith. Statements contained in this prospectus regarding the contents of any contract or any other document that is filed as an exhibit to the registration statement are not necessarily complete, and each such statement is qualified in all respects by reference to the full text of such contract or other document filed as an exhibit to the registration statement. A copy of the registration statement and the exhibits and schedules filed therewith may be inspected without charge at the public reference room maintained by the SEC, located at 450 Fifth Street, N.W., Room 1200, Washington, D.C. 20549, and copies of all or any part of the registration statement may be obtained from such offices upon the payment of the fees prescribed by the SEC. Please call the SEC at 1-800-SEC-0330 for further information about the public reference room. The SEC also maintains an Internet web site that contains reports, proxy and information statements and other information regarding registrants that file electronically with the SEC. The address of the site is www.sec.gov.
113
Table of Contents
INDEX TO FINANCIAL STATEMENTS
| Page | ||
Form of Report of Independent Registered Public Accounting Firm | F-2 | |
| F-3 | ||
| F-4 | ||
Consolidated Statements of Stockholders’ Equity and Comprehensive Income | F-5 | |
| F-6 | ||
| F-7 | ||
F-1
Table of Contents
Form of Report of Independent Registered Public Accounting Firm
When the transactions referred to in Notes 12d and 12e to the Notes to Consolidated Financial Statements have been consummated, we will be in a position to render the following report.
/s/ KPMG LLP
The Board of Directors
Dolby Laboratories, Inc.:
We have audited the accompanying consolidated balance sheets of Dolby Laboratories, Inc. and subsidiaries (the Company) as of September 26, 2003 and September 24, 2004 and the related consolidated statements of operations, stockholders’ equity and comprehensive income, and cash flows for each of the years in the three year period ended September 24, 2004. In connection with our audits of the consolidated financial statements, we have also audited the financial statement schedule. These financial statements and financial statement schedule are the responsibility of the Company’s management. Our responsibility is to express an opinion on these financial statements and financial statement schedule based on our audits.
We conducted our audits in accordance with the standards of the Public Company Accounting Oversight Board (United States). Those standards require that we plan and perform the audit to obtain reasonable assurance about whether the financial statements are free of material misstatement. An audit includes examining, on a test basis, evidence supporting the amounts and disclosures in the financial statements. An audit also includes assessing the accounting principles used and significant estimates made by management, as well as evaluating the overall financial statement presentation. We believe that our audits provide a reasonable basis for our opinion.
In our opinion, the consolidated financial statements referred to above present fairly, in all material respects, the financial position of Dolby Laboratories, Inc. and subsidiaries as of September 26, 2003 and September 24, 2004 and the consolidated results of their operations and their cash flows for each of the years in the three-year period ended September 24, 2004 in conformity with accounting principles generally accepted in the United States of America. Also, in our opinion, the related financial statement schedule, when considered in relation to the basic financial statements as a whole, presents fairly, in all material respects, the information set forth therein.
San Francisco, California
November 18, 2004
F-2
Table of Contents
CONSOLIDATED BALANCE SHEETS
(in thousands, except share and per share amounts)
September 26, 2003 | September 24, 2004 | ||||||
ASSETS | |||||||
Current assets: | |||||||
Cash and cash equivalents | $ | 61,922 | $ | 78,711 | |||
Accounts receivable, net of allowances of $2,565 in 2003 and $2,110 in 2004 | 13,962 | 18,257 | |||||
Accounts receivable from related parties | 108 | 1,927 | |||||
Inventories | 4,234 | 7,163 | |||||
Income tax receivable | 1,729 | 4,246 | |||||
Deferred income taxes | 22,215 | 30,813 | |||||
Prepaid expenses and other current assets | 1,422 | 3,640 | |||||
Total current assets | 105,592 | 144,757 | |||||
Property, plant and equipment, net | 65,706 | 72,333 | |||||
Intangible assets, net | 5,634 | 6,778 | |||||
Goodwill | 8,712 | 22,030 | |||||
Investments | 3,773 | 244 | |||||
Long-term deferred income taxes | 5,934 | 6,700 | |||||
Other assets | 7,356 | 9,055 | |||||
Total assets | $ | 202,707 | $ | 261,897 | |||
LIABILITIES AND STOCKHOLDERS’ EQUITY | |||||||
Current liabilities: | |||||||
Accounts payable | $ | 1,994 | $ | 6,249 | |||
Accounts payable and accrued royalties due to related parties | 7,587 | 291 | |||||
Accrued compensation and benefits | 12,646 | 18,720 | |||||
Accrued royalties | 3,383 | 4,711 | |||||
Other accrued expenses | 17,737 | 26,860 | |||||
Income taxes payable | 4,246 | 1,624 | |||||
Current portion of debt | 1,050 | 1,290 | |||||
Deferred revenue | 2,736 | 2,562 | |||||
Total current liabilities | 51,379 | 62,307 | |||||
Long-term debt | 14,548 | 13,580 | |||||
Other non-current liabilities | 26,875 | 23,436 | |||||
Total liabilities | 92,802 | 99,323 | |||||
Controlling interest | 16,130 | 17,200 | |||||
Stockholders’ equity: | |||||||
Class A common stock, $0.001 par value, one vote per share, 500,000,000 shares authorized: none issued and outstanding | — | — | |||||
Class B common stock, $0.001 par value, ten votes per share, 500,000,000 shares authorized: 85,006,390 shares issued and outstanding in 2003 and 86,547,910 in 2004 | 85 | 87 | |||||
Additional paid-in capital | 6,993 | 73,942 | |||||
Deferred stock-based compensation | — | (51,594 | ) | ||||
Retained earnings | 85,234 | 119,860 | |||||
Accumulated other comprehensive income | 1,463 | 3,079 | |||||
Total stockholders’ equity | 93,775 | 145,374 | |||||
Total liabilities and stockholders’ equity | $ | 202,707 | $ | 261,897 | |||
See accompanying notes to consolidated financial statements
F-3
Table of Contents
CONSOLIDATED STATEMENTS OF OPERATIONS
(in thousands, except per share amounts)
| Fiscal Year Ended | ||||||||||||
| September 27, 2002 | September 26, 2003 | September 24, 2004 | ||||||||||
Revenue: | ||||||||||||
Licensing | $ | 106,640 | $ | 157,922 | $ | 211,395 | ||||||
Product sales | 41,377 | 44,403 | 57,981 | |||||||||
Production services | 13,851 | 15,147 | 19,665 | |||||||||
Total revenue | 161,868 | 217,472 | 289,041 | |||||||||
Cost of revenue: | ||||||||||||
Cost of licensing | 25,063 | 40,001 | 53,838 | |||||||||
Cost of product sales (includes $0.2 million in stock-based compensation for fiscal 2004)(1) | 26,694 | 26,684 | 30,096 | |||||||||
Cost of production services (includes $0.1 million in stock-based compensation for fiscal 2004)(1) | 5,960 | 6,958 | 7,643 | |||||||||
Total cost of revenue | 57,717 | 73,643 | 91,577 | |||||||||
Gross margin | 104,151 | 143,829 | 197,464 | |||||||||
Operating expenses: | ||||||||||||
Selling, general and administrative (includes $12.7 million in stock-based compensation for fiscal 2004)(1) | 64,269 | 76,590 | 113,477 | |||||||||
Research and development (includes $1.2 million in stock-based compensation for fiscal 2004)(1) | 15,128 | 18,262 | 23,884 | |||||||||
Settlements | 24,205 | — | (2,000 | ) | ||||||||
In-process research and development | — | 1,310 | 1,738 | |||||||||
Total operating expenses | 103,602 | 96,162 | 137,099 | |||||||||
Operating income | 549 | 47,667 | 60,365 | |||||||||
Interest income | 964 | 1,144 | 1,436 | |||||||||
Interest expense | (1,563 | ) | (2,292 | ) | (2,348 | ) | ||||||
Other income (expense), net | (148 | ) | 1,091 | 1,141 | ||||||||
Income (loss) before provision for income taxes and controlling interest | (198 | ) | 47,610 | 60,594 | ||||||||
Provision for income taxes | 11 | 16,079 | 25,039 | |||||||||
Income (loss) before controlling interest | (209 | ) | 31,531 | 35,555 | ||||||||
Controlling interest in net (income) loss | 104 | (562 | ) | (929 | ) | |||||||
Net income (loss) | $ | (105 | ) | $ | 30,969 | $ | 34,626 | |||||
Basic net income (loss) per share | $ | 0.00 | $ | 0.36 | $ | 0.40 | ||||||
Shares used in basic net income (loss) per share computation | 85,008 | 85,009 | 85,556 | |||||||||
Diluted net income (loss) per share | $ | 0.00 | $ | 0.36 | $ | 0.36 | ||||||
Shares used in diluted net income (loss) per share computation | 85,008 | 85,983 | 96,525 | |||||||||
Expense for royalties payable to related party | $ | 18,791 | $ | 27,620 | $ | 36,857 | ||||||
Expense for rent payable to related party | 3,361 | 3,459 | 3,492 | |||||||||
(1) Stock-based compensation recorded in fiscal 2004 was classified as follows: |
| |||||||||||
Cost of product sales | $ | 157 | ||||||||||
Cost of production services | 55 | |||||||||||
Selling, general and administrative | 12,711 | |||||||||||
Research and development | 1,215 | |||||||||||
Total stock-based compensation | $ | 14,138 | ||||||||||
See accompanying notes to consolidated financial statements
F-4
Table of Contents
CONSOLIDATED STATEMENTS OF STOCKHOLDERS’ EQUITY AND
COMPREHENSIVE INCOME
(in thousands)
| Shares of Class B common stock | Class B common stock | Additional paid-in capital | Deferred stock- based compensation | Retained earnings | Accumulated other comprehensive income (loss) | Total | Comprehensive income | |||||||||||||||||||||||
Balance at September 28, 2001 | 85,000 | $ | 85 | $ | 6,985 | $ | — | $ | 54,370 | $ | (795 | ) | $ | 60,645 | ||||||||||||||||
Net loss | — | — | — | — | (105 | ) | — | (105 | ) | $ | (105 | ) | ||||||||||||||||||
Translation adjustments, net of taxes of $416 | — | — | — | — | — | 1,189 | 1,189 | 1,189 | ||||||||||||||||||||||
Exercise of Class B stock options | 11 | — | 13 | — | — | — | 13 | — | ||||||||||||||||||||||
Balance at September 27, 2002 | 85,011 | $ | 85 | $ | 6,998 | $ | — | $ | 54,265 | $ | 394 | $ | 61,742 | $ | 1,084 | |||||||||||||||
Net income | — | — | — | — | 30,969 | — | 30,969 | 30,969 | ||||||||||||||||||||||
Translation adjustments, net of taxes of $366 | — | — | — | — | — | 1,069 | 1,069 | 1,069 | ||||||||||||||||||||||
Exercise of Class B stock options | 13 | — | 33 | — | — | — | 33 | — | ||||||||||||||||||||||
Repurchase of Class B common stock | (18 | ) | — | (38 | ) | — | — | — | (38 | ) | — | |||||||||||||||||||
Balance at September 26, 2003 | 85,006 | $ | 85 | $ | 6,993 | $ | — | $ | 85,234 | $ | 1,463 | $ | 93,775 | $ | 32,038 | |||||||||||||||
Net income | — | — | — | — | 34,626 | — | 34,626 | 34,626 | ||||||||||||||||||||||
Translation adjustments, net of taxes of $679 | — | — | — | — | — | 1,616 | 1,616 | 1,616 | ||||||||||||||||||||||
Deferred stock-based compensation related to Class B stock option grants | — | — | 58,797 | (58,797 | ) | — | — | — | — | |||||||||||||||||||||
Stock-based compensation expense | — | — | — | 7,203 | — | — | 7,203 | — | ||||||||||||||||||||||
Issuance of Class B common stock | 572 | 1 | 6,934 | — | — | 6,935 | — | |||||||||||||||||||||||
Exercise of Class B stock options | 1,084 | 1 | 1,362 | — | — | — | 1,363 | — | ||||||||||||||||||||||
Repurchase of Class B common stock | (114 | ) | — | (144 | ) | — | — | — | (144 | ) | — | |||||||||||||||||||
Balance at September 24, 2004 | 86,548 | $ | 87 | $ | 73,942 | $ | (51,594 | ) | $ | 119,860 | $ | 3,079 | $ | 145,374 | $ | 36,242 | ||||||||||||||
See accompanying notes to consolidated financial statements
F-5
Table of Contents
CONSOLIDATED STATEMENTS OF CASH FLOWS
(in thousands)
| Fiscal Year Ended | ||||||||||||
| September 27, 2002 | September 26, 2003 | September 24, 2004 | ||||||||||
Operating activities: | ||||||||||||
Net income (loss) | $ | (105 | ) | $ | 30,969 | $ | 34,626 | |||||
Adjustments to reconcile net income (loss) to net cash provided by operating activities: | ||||||||||||
Depreciation and amortization | 7,047 | 7,498 | 8,517 | |||||||||
Stock-based compensation expense | — | — | 14,138 | |||||||||
Provision for doubtful accounts | 55 | 1,753 | 402 | |||||||||
(Gain) loss on disposition of building and equipment | (448 | ) | 3 | 220 | ||||||||
(Gain) loss on interest rate swap agreements | 709 | (386 | ) | (504 | ) | |||||||
Equity in the loss of unconsolidated affiliates | 194 | 485 | 207 | |||||||||
Controlling interest in net income (loss) of consolidated affiliates | (104 | ) | 562 | 929 | ||||||||
In-process research and development | — | 1,310 | 1,738 | |||||||||
Litigation settlement | 24,205 | — | — | |||||||||
Deferred income taxes | (13,484 | ) | (2,987 | ) | (10,240 | ) | ||||||
Changes in operating assets and liabilities: | ||||||||||||
Accounts receivable | (3,848 | ) | (4,798 | ) | (5,921 | ) | ||||||
Inventories | 607 | 1,403 | (2,434 | ) | ||||||||
Prepaid expenses and other current assets | (311 | ) | (2,154 | ) | (1,514 | ) | ||||||
Accounts payable and accrued expenses | 7,873 | 3,018 | 20,428 | |||||||||
Accounts payable and accrued royalties due to related parties | 1,795 | 2,347 | (7,296 | ) | ||||||||
Income taxes | 2,635 | 1,565 | (4,263 | ) | ||||||||
Deferred revenue | 871 | 1,865 | (233 | ) | ||||||||
Other non-current liabilities | (1,812 | ) | 189 | 1,140 | ||||||||
Payment on litigation settlement | (3,000 | ) | (3,000 | ) | (3,000 | ) | ||||||
Net cash provided by operating activities | 22,879 | 39,642 | 46,940 | |||||||||
Investing activities: | ||||||||||||
Purchases of property, plant and equipment | (3,912 | ) | (6,750 | ) | (12,522 | ) | ||||||
Acquisitions, net of cash acquired | (1,000 | ) | (7,051 | ) | (18,440 | ) | ||||||
Proceeds from sale of equipment | 1,800 | — | 52 | |||||||||
Issuance of note receivable | (2,000 | ) | — | — | ||||||||
Investments in affiliates | (300 | ) | (250 | ) | — | |||||||
Net cash used in investing activities | (5,412 | ) | (14,051 | ) | (30,910 | ) | ||||||
Financing activities: | ||||||||||||
Payments on debt | (3,098 | ) | (1,397 | ) | (1,239 | ) | ||||||
Proceeds from the exercise of Class B stock options | 13 | 33 | 1,363 | |||||||||
Repurchases of Class B common stock | — | (38 | ) | (144 | ) | |||||||
Net cash used in financing activities | (3,085 | ) | (1,402 | ) | (20 | ) | ||||||
Effect of foreign exchange rate changes on cash and cash equivalents | 410 | 339 | 779 | |||||||||
Net increase in cash and cash equivalents | 14,792 | 24,528 | 16,789 | |||||||||
Cash and cash equivalents at beginning of year | 22,602 | 37,394 | 61,922 | |||||||||
Cash and cash equivalents at end of year | $ | 37,394 | $ | 61,922 | $ | 78,711 | ||||||
Supplemental disclosure: | ||||||||||||
Cash paid for income taxes | $ | 11,120 | $ | 18,057 | $ | 40,607 | ||||||
Cash paid for interest | 1,299 | 2,336 | 2,339 | |||||||||
See accompanying notes to consolidated financial statements
F-6
Table of Contents
NOTES TO CONSOLIDATED FINANCIAL STATEMENTS
1. Summary of Business and Significant Accounting Policies
Dolby Laboratories, Inc. (Dolby Laboratories, we or us), a Delaware corporation, develops and delivers innovative products and technologies that enrich the entertainment experience in theatres, homes, cars and elsewhere. Ray Dolby, our principal stockholder, founded Dolby Laboratories in 1965 to develop noise reduction technologies. Today, we deliver a broad range of sound technologies for use in both professional and consumer applications. In addition, in recent years we have expanded our focus to include other technologies that facilitate the delivery of digital entertainment. We conduct our business on a global basis.
Principles of Consolidation
The accompanying consolidated financial statements have been prepared in accordance with generally accepted accounting principles in the United States of America (U.S. GAAP). The consolidated financial statements include the accounts of Dolby Laboratories, our wholly-owned subsidiaries and subsidiaries in which we own a controlling interest. In addition, we have consolidated the financial results of affiliated companies we own jointly with our principal stockholder. The interest of our related parties in these consolidated affiliates is presented in the controlling interest line in the accompanying financial statements. All intercompany accounts and transactions have been eliminated in consolidation.
Use of Estimates
The preparation of the consolidated financial statements in accordance with U.S. GAAP requires management to make certain estimates and assumptions that affect the amounts reported and disclosed in our consolidated financial statements and accompanying notes. Significant items subject to such estimates and assumptions include valuation allowances for receivables, inventories, goodwill, intangible assets, stock-based compensation and deferred income tax assets. Actual results could differ from those estimates.
Fiscal Year
Our fiscal year is a 52- or 53-week period ending on the last Friday in September. The fiscal years presented herein include the 52-week periods ended September 27, 2002 (fiscal 2002), September 26, 2003 (fiscal 2003) and September 24, 2004 (fiscal 2004).
Cash and Cash Equivalents
Cash and cash equivalents consist of highly liquid investment instruments purchased with original maturities of three months or less. Our cash equivalents, which primarily consist of money market funds, are recorded at cost, which approximates fair value.
Concentration of Credit Risk
Our financial instruments that are exposed to concentrations of credit risk principally consist of cash and cash equivalents and accounts receivable. We deposit our cash and cash equivalents in accounts with major financial institutions and, at times, such investments may be in excess of federal insured limits. Our products are sold to businesses primarily in the Americas and Europe, and our licensing revenue is primarily generated from customers outside of the United States. We manage this risk by evaluating in advance the financial condition and creditworthiness of our product and production services customers. We perform regular evaluations of the creditworthiness of our licensing customers. In fiscal 2002, licensing revenue from our largest customer accounted for 11% of our total revenue. In fiscal 2003 and fiscal 2004, no customer accounted for more than 10% of our total revenue.
F-7
Table of Contents
DOLBY LABORATORIES, INC.
NOTES TO CONSOLIDATED FINANCIAL STATEMENTS—(Continued)
Allowance for Doubtful Accounts
We continually monitor customer payments and maintain a reserve for estimated losses resulting from our customers’ inability to make required payments. In determining the reserve, we evaluate the collectibility of our accounts receivable based upon a variety of factors. In cases where we are aware of circumstances that may impair a specific customer’s ability to meet its financial obligations, we record a specific allowance against amounts due, and thereby reduce the net recognized receivable to the amount reasonably believed to be collectible. For all other customers, we recognize allowances for doubtful accounts based on our actual historical write-off experience in conjunction with the length of time the receivables are past due, customer creditworthiness, geographic risk and the current business environment. Actual future losses from uncollectible accounts may differ from our estimates. Our allowance for doubtful accounts totaled $2.6 million at September 26, 2003 and $2.1 million at September 24, 2004.
Inventories
Inventories are stated at the lower of cost (first-in, first-out) or market (net realizable value). We evaluate our ending inventories for estimated excess quantities and obsolescence. Our evaluation includes the analysis of future sales demand by product, within specific time horizons. Inventories in excess of projected future demand are written down to net realizable value. In addition, we assess the impact of changing technology on our inventory balances and write-off inventories that are considered obsolete.
Property, Plant and Equipment
Property, plant and equipment are stated at cost less accumulated depreciation. Depreciation is computed using a straight-line method based on estimated useful lives as follows:
Systems and software | 3 to 5 years | |
Machinery and equipment | 5 to 8 years | |
Furniture and fixtures | 8 years | |
Buildings | 20 years | |
Leasehold improvements | Lesser of useful life or related lease term |
Internal Use Software
We account for the costs of computer software developed or obtained for internal use in accordance with the American Institute of Certified Public Accountants Statement of Position 98-1, “Accounting for the Costs of Computer Software Developed or Obtained for Internal Use.” We capitalize costs of materials, consultants and payroll and payroll-related costs for employees incurred in developing internal use computer software. These costs are included in property, plant and equipment, net on the accompanying consolidated balance sheets. Costs incurred during the preliminary project and post-implementation stages are charged to expense. Our capitalized internal use software costs are amortized on a straight-line basis over estimated useful lives of three to five years.
Goodwill and Intangible Assets
In September 2002, we adopted Statement of Financial Accounting Standards No. 142, “Goodwill and Other Intangible Assets,” (SFAS 142), which, among other things, establishes new standards for goodwill acquired in a business combination, eliminates the amortization of goodwill and requires the carrying value of goodwill and certain non-amortizing intangibles to be evaluated for impairment on an annual basis. As required by SFAS 142, we perform an impairment test on recorded goodwill by comparing the estimated fair value of each of our reporting units to the carrying value of the assets and liabilities of each unit, including goodwill. We determine the fair value of the reporting units principally based upon the valuation analysis of Dolby Laboratories as a
F-8
Table of Contents
DOLBY LABORATORIES, INC.
NOTES TO CONSOLIDATED FINANCIAL STATEMENTS—(Continued)
whole. This analysis is prepared by an independent third party valuation firm each year and in consideration of a number of other factors, including our historical and projected financial results, risks facing us and the liquidity of our common stock. If the carrying value of the assets and liabilities, including goodwill, exceeds our estimation of the fair value of the reporting units, we would record an impairment charge in an amount equal to the excess of the carrying value of goodwill over its estimated fair value. Our fiscal 2004 impairment test of goodwill, which was performed in the third fiscal quarter, resulted in no impairment charge.
Statement of Financial Accounting Standards No. 144, “Accounting for the Impairment or Disposal of Long-Lived Assets,” (SFAS 144) requires that intangible assets with definite lives be amortized over their estimated useful lives and reviewed for impairment whenever events or changes in circumstances indicate an asset’s carrying value many not be recoverable. Recoverability of an asset is measured by comparison of its carrying amount to the expected future undiscounted cash flows that the asset is expected to generate. If it is determined that an asset is not recoverable, an impairment loss is recorded in the amount by which the carrying amount of the asset exceeds its fair value. Our intangible assets principally consist of acquired technology, patents and trademarks and are amortized on a straight-line basis over their useful lives ranging from five to 15 years. No intangible or long-lived assets were impaired as of September 24, 2004.
Investments
Investments include equity securities, convertible notes receivable and investments in 20% to 50% owned affiliated companies, which are accounted for under the equity method. Refer to “Investments” in Note 2 for further detail.
Financial Instruments
We entered into interest rate swap arrangements to manage our exposure to interest rate changes on our facility debt obligations. The swap agreements involve the exchange of fixed and variable interest rate payments without exchanging the notional principal amount. The arrangements are presented at fair value in other non-current liabilities on the accompanying consolidated balance sheets. Gains and losses associated with the swap agreements are included in other income (expense), net in our consolidated statements of operations.
Revenue Recognition
We enter into transactions to sell products and services and to license technology, trademarks and know-how. We evaluate revenue recognition for these transactions using the criteria (Revenue Recognition Criteria) set forth by the SEC in Staff Accounting Bulletin 104, “Revenue Recognition,” (SAB 104). SAB 104 states that revenue is recognized when each of the following criteria are met: persuasive evidence of an arrangement exists, delivery has occurred or services have been rendered, the seller’s price to the buyer is fixed and determinable, and collectibility is reasonably assured.
Licensing. Licensing revenue represents amounts earned from licensing agreements (royalties) and fees for administering the licensing of “patent pools” containing patents owned by us and/or other companies. Royalties are recorded at their gross amounts, prior to deduction of foreign withholding taxes, and are recognized when we deem the amounts to be fixed and determinable. Royalties are deemed fixed and determinable upon the earlier of payment by the licensee or receipt of the licensee’s period statement if all other Revenue Recognition Criteria have been met. When cash is received but not all other Revenue Recognition Criteria have been met, we record deferred revenue. Initial contract fees for the administration of licensing patent pools are recognized ratably over the life of the contract as this revenue is related to an ongoing service requirement throughout the life of the related contract; administration fees are recognized upon collection of the royalties upon which the fees are based. Interest and penalties related to licensing agreement enforcement activities are recorded as settlements in our consolidated statements of operations.
F-9
Table of Contents
DOLBY LABORATORIES, INC.
NOTES TO CONSOLIDATED FINANCIAL STATEMENTS—(Continued)
Product sales. Revenue from the sale of products is recognized when the risk of ownership has transferred to our customer as provided under the terms of the governing purchase agreement, typically the invoice we deliver to the customer, and all the other Revenue Recognition Criteria have been met. Generally, these purchase agreements provide that the risk of ownership is transferred to the customer when the product is shipped.
Production services. Production services revenue is recognized as the services related to a given project are performed and all the other Revenue Recognition Criteria have been met.
Cost of Revenue
Cost of licensing. Cost of licensing consists principally of royalty payments we make to affiliated entities of Ray Dolby and to other third parties for the licensing of intellectual property rights that we sublicense as part of our licensing arrangements with our customers. Cost of licensing also includes amortization expenses associated with purchased intangibles.
Cost of product sales. Cost of product sales primarily consists of material costs related to the products sold, applied labor and manufacturing overhead and, to a lesser extent, royalty obligations for technologies we license from Ray Dolby affiliated entities.
Cost of production services. Cost of production services consists of the payroll and benefit costs of employees performing our professional services, the cost of outside consultants and reimbursable expenses incurred on behalf of the customer.
Research and Development
Research and development expense consists primarily of salary and related costs for personnel responsible for the research and development of new technologies; such costs are expensed as incurred.
Advertising and Promotional Costs
Advertising and promotional costs are charged to selling, general and administrative expense at the time the related event takes place and were $4.0 million, $4.2 million and $4.7 million for fiscal 2002, 2003 and 2004, respectively. At September 24, 2004, we had $2.1 million of prepaid advertising and promotional costs.
Settlements
Settlements include interest and penalties related to the collection of royalties and resolution of disputes in our favor or against us. Settlements of royalty disputes from licensees that specifically represent unpaid royalties are recorded as licensing revenue in the period payment is received, if all other Revenue Recognition Criteria have been met. Settlements of other disputes, such as disputes with implementation licensees from which we typically do not receive royalties, are recorded in settlements. In fiscal 2004, we received a $2.0 million payment in connection with the settlement of a dispute with one of our semiconductor manufacturing implementation licensees regarding violation of the terms of their implementation licensing agreement with us. In fiscal 2002, we settled a dispute with an unrelated third party regarding breach of a written agreement. See Note 11 for further detail.
Foreign Currency Translation
We maintain sales, marketing and business operations in foreign countries, most significantly in the United Kingdom. The translation of assets and liabilities denominated in foreign currency into United States dollars are made at the prevailing rate of exchange at the balance sheet date. Revenue, costs and expenses are translated at the average
F-10
Table of Contents
DOLBY LABORATORIES, INC.
NOTES TO CONSOLIDATED FINANCIAL STATEMENTS—(Continued)
exchange rates during the period. Translation adjustments are reflected in accumulated other comprehensive income on our consolidated balance sheets, while gains and losses resulting from foreign currency transactions are included in our consolidated statements of operations. Net transaction gains included in net income (loss) were $23,000, $0.1 million and $0.3 million in fiscal 2002, 2003 and 2004, respectively.
Income Taxes
We account for income taxes in accordance with Statement of Financial Accounting Standards No. 109, “Accounting for Income Taxes,” (SFAS 109). SFAS 109 requires the use of the asset and liability method, under which deferred income tax assets and liabilities are determined based upon the difference between the financial statement carrying amounts and the tax bases of assets and liabilities and are measured using the enacted tax rate expected to apply to taxable income in the years in which the differences are expected to be reversed. In assessing the realizability of deferred tax assets, we consider whether it is more likely than not that some portion or all of the deferred tax assets will not be realized. The realization of deferred tax assets is dependent upon the generation of future taxable income during the periods in which those temporary differences become deductible. We consider the scheduled reversal of deferred tax liabilities and projected future taxable income in making this assessment. We record a valuation allowance to reduce our deferred tax assets when uncertainty regarding their realizability exists.
Per Share Data
Basic net income (loss) per share is computed by dividing net income (loss) by the weighted average number of Class B common shares outstanding during the period. Diluted net income (loss) per share is computed by dividing net income by the sum of the weighted average number of Class B common shares outstanding and the potential number of dilutive Class B common equivalent shares outstanding during the period. The dilutive Class B common equivalent shares are comprised entirely of stock options to purchase shares of Class B common stock.
The following table sets forth the computation of basic and diluted net income (loss) per share (in thousands, except per share amounts):
| Fiscal Year Ended | ||||||||||
September 27, 2002 | September 26, 2003 | September 24, 2004 | ||||||||
Numerator: | ||||||||||
Net income (loss) | $ | (105 | ) | $ | 30,969 | $ | 34,626 | |||
Denominator: | ||||||||||
Weighted average Class B common shares outstanding (basic) | 85,008 | 85,009 | 85,556 | |||||||
Common equivalent shares from options to purchase Class B common stock | — | 974 | 10,969 | |||||||
Weighted average Class B common shares outstanding (diluted) | 85,008 | 85,983 | 96,525 | |||||||
Basic net income (loss) per share | $ | 0.00 | $ | 0.36 | $ | 0.40 | ||||
Diluted net income (loss) per share | $ | 0.00 | $ | 0.36 | $ | 0.36 | ||||
In fiscal 2002, diluted loss per share was computed using the basic weighted average number of shares of Class B common stock outstanding and excludes options to purchase 6.7 million shares of Class B common
F-11
Table of Contents
DOLBY LABORATORIES, INC.
NOTES TO CONSOLIDATED FINANCIAL STATEMENTS—(Continued)
stock as their effect is anti-dilutive when applied to losses. No options were excluded from the above calculation in fiscal 2003 and 2004, because their exercise prices were greater than or equal to the average fair value of Class B common stock during the period.
Stock-Based Compensation
We have granted options to purchase Class B common stock to our employees with exercise prices equal to the value of the underlying stock, as determined by our board of directors on the date the equity award was granted. Our board of directors determined this value principally based upon valuation analyses prepared by an independent third party valuation firm each year and in consideration of a number of factors, including our historical and projected financial results, risks facing us and the liquidity of our common stock. In connection with the preparation of the financial statements for our initial public offering and solely for purposes of accounting for employee stock-based compensation, we have applied hindsight to reassess the fair value of our common stock for the equity awards granted during fiscal 2004. These reassessed values were determined based on a number of factors and methodologies, including an evaluation of our updated historical and projected financial results and a re-evaluation of our fair value based upon more recent valuation analyses provided by an independent third party valuation firm.
Based upon this reassessment of the fair value of our Class B common stock, we have recorded deferred stock-based compensation to the extent that the reassessed value of our Class B common stock at the date of grant exceeded the exercise price of the equity awards. Reassessed values are inherently uncertain and highly subjective. If we had made different assumptions, our deferred stock-based compensation amount, stock-based compensation expense, gross margin, net income and net income per share amounts could have been significantly different. We recorded deferred compensation of $58.8 million during fiscal 2004. The deferred stock-based compensation is being amortized on a straight-line basis over the stock option vesting period of four years. In fiscal 2004, we recognized $7.2 million in stock-based compensation expense related to options granted to employees based upon the reassessed values of the Class B common stock underlying the stock option awards. We also issued shares of fully vested Class B common stock to an executive officer in fiscal 2004. We recorded stock-based compensation expense in connection with this award calculated using the reassessed value of our Class B common stock as of the date the shares were issued, which resulted in $6.9 million expense recorded in selling, general and administrative expense in January of fiscal 2004.
The expense associated with the amortization of deferred stock-based compensation and the fair value of Class B common stock issued is classified in our fiscal 2004 consolidated statement of operations as follows: $0.2 million in cost of revenue, $1.2 million in research and development and $12.7 million in selling, general and administrative. The table below shows the expected amortization of deferred stock-based compensation over the next four years, assuming no change in the accounting rules relating to stock-based awards and assuming all employees remain employed by us for their remaining vesting periods. The following table does not include any stock-based compensation expense associated with any options granted subsequent to September 24, 2004 (in thousands):
| Expense by Fiscal Year | ||||||||||||
| 2005 | 2006 | 2007 | 2008 | |||||||||
Stock-based compensation expense related to options granted to purchase shares of Class B common stock | $ | 14,699 | $ | 14,699 | $ | 14,699 | $ | 7,497 | ||||
The pro forma information regarding net income and net income per share detailed below has been accounted for as if we had accounted for our stock-based awards under the fair value method prescribed in
F-12
Table of Contents
DOLBY LABORATORIES, INC.
NOTES TO CONSOLIDATED FINANCIAL STATEMENTS—(Continued)
Statement of Financial Accounting Standards No. 123, “Accounting for Stock-Based Compensation” (SFAS 123). The fair value of our options to purchase Class B common stock was estimated as of the date of grant using a Black-Scholes option pricing model. Limitations on the effectiveness of the Black-Scholes option pricing model are that it was developed for use in estimating the fair value of traded options which have no vesting restrictions and are fully transferable, and that the model requires the use of highly subjective assumptions including expected stock price volatility.
The fair value of our stock-based awards was estimated using the following weighted average assumptions for fiscal 2002, 2003 and 2004:
| Fiscal Year Ended | |||||||||
| September 27, 2002 | September 26, 2003 | September 24, 2004 | |||||||
Expected life (in years) | 10 | 10 | 6 | ||||||
Interest rate | 4.7 | % | 3.9 | % | 4.4 | % | |||
Volatility | 84.8 | % | 84.8 | % | 82.4 | % | |||
Dividend yield | — | — | — | ||||||
Using the Black-Scholes pricing model, the estimated weighted average fair value of an option to purchase one share of Class B common stock granted during fiscal 2002, 2003 and 2004 was $1.08, $1.07 and $11.96 per option, respectively.
The following table illustrates the effect on net income (loss) and net income (loss) per share as if we had applied the fair value recognition provisions of SFAS 123 to stock-based awards for fiscal 2002, 2003 and 2004 (in thousands, except per share amounts):
| Fiscal Year Ended | ||||||||||||
| September 27, 2002 | September 26, 2003 | September 24, 2004 | ||||||||||
Net income (loss) | $ (105 | ) | $ | 30,969 | $ | 34,626 | ||||||
Add: Stock-based compensation expense included in reported net income (loss), net of tax | — | — | 10,592 | |||||||||
Deduct: Stock-based compensation expense under the fair value method, net of tax | (1,515 | ) | (2,123 | ) | (13,348 | ) | ||||||
Pro forma net income (loss) | $ | (1,620 | ) | $ | 28,846 | $ | 31,870 | |||||
Basic net income (loss) per share | ||||||||||||
As reported | $ | 0.00 | $ | 0.36 | $ | 0.40 | ||||||
Pro forma | (0.02 | ) | 0.34 | 0.37 | ||||||||
Diluted net income (loss) per share | ||||||||||||
As reported | $ | 0.00 | $ | 0.36 | $ | 0.36 | ||||||
Pro forma | (0.02 | ) | 0.34 | 0.33 | ||||||||
Recently Adopted and Recently Issued Accounting Standards
In May 2003, the Financial Accounting Standards Board (FASB) issued Statement of Financial Accounting Standards No. 150, “Accounting for Certain Financial Instruments with Characteristics of Both Liabilities and Equity” (SFAS 150). SFAS 150 establishes standards for how an issuer classifies and measures in its statements of financial position certain financial instruments of both liabilities and equity. SFAS 150 requires issuers to classify as liabilities (or assets in some circumstances) three classes of freestanding instruments entered into or
F-13
Table of Contents
DOLBY LABORATORIES, INC.
NOTES TO CONSOLIDATED FINANCIAL STATEMENTS—(Continued)
modified after May 31, 2003, at the beginning of the first interim period beginning after June 15, 2003 for all existing financial instruments. The adoption of SFAS 150 did not have an effect on our financial position, results of operation or cash flows. As of September 2004, we did not have financial instruments within the scope of SFAS No. 150.
In January 2003, the FASB issued Financial Interpretation No. 46, “Consolidation of Variable Interest Entities” (FIN 46). FIN 46 requires that if a company is the primary beneficiary of a variable interest entity (VIE), the assets, liabilities and results of operations of the VIE should be included in the consolidated financial statements of the company. In December 2003, the FASB published a revision to FIN 46 (FIN 46R) to clarify some of the provisions of FIN 46 and to exempt certain entities from its requirements. The adoption of FIN 46R required us to consolidate certain affiliated VIEs into our consolidated financial statements. Previously, we had been consolidating our VIEs under the provisions of Emerging Issues Task Force Issue 90-15 “Impact of Nonsubstantive Lessors, Residual Value Guarantees, and Other Provisions in Leasing Transactions Abstract” (EITF 90-15) and Emerging Issues Task Force Topic D-14, “Transactions Involving Special Purpose Entities” (Topic D-14). Given our contemplation of an initial public offering, we adopted FIN 46R early, which rescinded the provisions of EITF 90-15 and Topic D-14. However, the adoption of FIN 46R did not have an effect on our financial position, results of operations or cash flows. For further discussion on the nature, purpose, activities and our involvement with our consolidated VIEs, refer to Note 10.
2. Composition of Certain Financial Statement Captions
Inventories
Inventories are stated at the lower of cost (first-in, first-out) or market and consist of the following (in thousands):
| September 26, 2003 | September 24, 2004 | |||||
Raw materials | $ | 1,195 | $ | 2,215 | ||
Work in process | 851 | 1,689 | ||||
Finished goods | 2,188 | 3,259 | ||||
Total | $ | 4,234 | $ | 7,163 | ||
Property, Plant and Equipment
Property, plant and equipment are recorded at cost and consist of the following (in thousands):
| September 26, 2003 | September 24, 2004 | |||||||
Land | $ | 14,179 | $ | 14,640 | ||||
Buildings | 30,470 | 31,636 | ||||||
Leasehold improvements | 30,467 | 34,324 | ||||||
Machinery and equipment | 20,386 | 23,762 | ||||||
Systems and software | 12,987 | 16,491 | ||||||
Furniture and fixtures | 11,827 | 12,829 | ||||||
| $ | 120,316 | $ | 133,682 | |||||
Less: Accumulated depreciation | (54,610 | ) | (61,349 | ) | ||||
Property, plant and equipment, net | $ | 65,706 | $ | 72,333 | ||||
F-14
Table of Contents
DOLBY LABORATORIES, INC.
NOTES TO CONSOLIDATED FINANCIAL STATEMENTS—(Continued)
Depreciation expense of $7.0 million, $7.4 million and $7.8 million in fiscal 2002, 2003 and 2004, respectively, is included in cost of product sales, research and development, and selling, general and administrative expense in the accompanying consolidated statements of operations.
Goodwill and Intangible Assets
Following is a summary of intangible assets and goodwill (in thousands):
| September 26, 2003 | September 24, 2004 | |||||||
Amortized intangible assets: | ||||||||
Patents | $ | 2,700 | $ | 3,648 | ||||
Acquired technology | 2,680 | 3,470 | ||||||
Other intangibles | 340 | 498 | ||||||
| 5,720 | 7,616 | |||||||
Less: Accumulated amortization | (86 | ) | (838 | ) | ||||
Intangible assets, net | $ | 5,634 | $ | 6,778 | ||||
Non-amortized intangible assets: | ||||||||
Goodwill | $ | 8,712 | $ | 22,030 | ||||
Amortization expense associated with our intangible assets was $0.1 million and $0.8 million in fiscal 2003 and 2004, respectively, and is included in cost of licensing, cost of product sales and selling, general and administrative expenses in the accompanying consolidated statements of operations. We had no intangible assets or related amortization in fiscal 2002. Amortization of intangible assets is expected to be approximately $0.9 million per year for the next five fiscal years.
Investments
At September 24, 2004, investments include our investment in a limited liability company we formed in May 2000 with third parties to develop and market products to the entertainment technology industry. We invested $0.3 million in fiscal 2002 and $0.3 million in fiscal 2003 for our 49% ownership interest in the company. We account for this investment under the equity method.
At September 26, 2003, investments also included equity securities and debt instruments related to Lake Technology Limited (Lake). During fiscal 2004, we held a majority interest in Lake and have included their financial results in our consolidated financial statements since February 2004. All intercompany accounts and transactions have been eliminated in accordance with U.S. GAAP. Prior periods in which we did not have a 20% to 50% interest in Lake have been presented to reflect the results of applying the equity method from the date of the initial investment in accordance with Accounting Principles Board Opinion No. 18 “The Equity Method of Accounting for Investments in Common Stock” (APB 18). Under the equity method, our investment in Lake was recorded at cost and the carrying amount of the investment balance was adjusted to recognize our share of the losses of Lake after the initial investment date. The impact of applying the equity method on income (loss) before taxes and controlling interest was $10,000, $0.3 million and $0.1 million in fiscal 2002, 2003 and 2004, respectively.
Other Assets
Other assets consist primarily of supplemental retirement plan assets and capitalized expenses associated with our initial public offering, which will be offset against the gross proceeds received in such offering.
F-15
Table of Contents
DOLBY LABORATORIES, INC.
NOTES TO CONSOLIDATED FINANCIAL STATEMENTS—(Continued)
Other AccruedExpenses
Other accrued expenses consist of the following (in thousands):
September 26, 2003 | September 24, 2004 | |||||
Accrued professional fees | $ | 2,185 | $ | 5,254 | ||
Current portion of litigation settlement | 2,258 | 2,336 | ||||
Amounts payable to patent pool partners | 1,809 | 4,079 | ||||
Acquisition consideration | 3,797 | 2,979 | ||||
Other accrued liabilities | 7,688 | 12,212 | ||||
Total other accrued expenses | $ | 17,737 | $ | 26,860 | ||
Debt
We maintain three term loans through our consolidated affiliates Dolby Properties, LLC, Dolby Properties Burbank, LLC and Dolby Properties United Kingdom, LLC, for financing commercial and real property at various locations in which we are the primary tenant. The loans are collateralized by commercial real property and are guaranteed by Dolby Laboratories, Inc.
Following is a summary of our debt balances (in thousands):
| September 26, 2003 | September 24, 2004 | |||||||
$12.0 million term loan at 6.2% effective interest rate, repayable in monthly installments with remaining principal due May 2013 | $ | 9,136 | $ | 8,462 | ||||
$2.5 million term loan at 6.2% effective interest rate, repayable in monthly installments with remaining principal due April 2014 | 2,024 | 1,893 | ||||||
Term loan denominated in U.K. pounds at 6.9% effective interest rate, repayable in quarterly installments with the remaining principal due April 2015 | 4,438 | 4,515 | ||||||
Total debt | $ | 15,598 | $ | 14,870 | ||||
Less: current portion | (1,050 | ) | (1,290 | ) | ||||
Total debt, less current portion | $ | 14,548 | $ | 13,580 | ||||
The fair value of our debt approximates the carrying value based on borrowing rates currently available to us for loans with similar terms and remaining maturities.
We entered into interest rate swap arrangements to manage our exposure to unfavorable interest rate changes on our facility debt obligations. The swap agreements involve the exchange of fixed and variable interest rate payments without exchanging the notional principal amount. We do not enter into derivative instruments for any purpose other than cash flow hedging purposes. Gains and (losses) net of controlling interest associated with the swap agreements of $(0.3) million, $0.2 million and $0.2 million for fiscal 2002, 2003 and 2004, respectively, are included in our consolidated statements of operations.
Following is summary of the maturities of our debt balances at September 24, 2004 (in thousands):
Fiscal 2005 | $ | 1,290 | |
Fiscal 2006 | 1,357 | ||
Fiscal 2007 | 1,428 | ||
Fiscal 2008 | 1,510 | ||
Fiscal 2009 | 1,588 | ||
Thereafter | 7,697 | ||
Total debt | $ | 14,870 | |
F-16
Table of Contents
DOLBY LABORATORIES, INC.
NOTES TO CONSOLIDATED FINANCIAL STATEMENTS—(Continued)
Other Non-Current Liabilities
Following is a summary of the components of other non-current liabilities (in thousands):
| September 26, 2003 | September 24, 2004 | |||||
Long-term portion of litigation settlement | $ | 17,281 | $ | 15,166 | ||
Supplemental retirement plan obligation | 4,896 | 5,777 | ||||
Long-term deferred revenue | 224 | 851 | ||||
Interest rate swap agreements | 1,587 | 1,083 | ||||
Other liabilities | 2,887 | 559 | ||||
Total other non-current liabilities | $ | 26,875 | $ | 23,436 | ||
Other liabilities at September 26, 2003 include the $2.9 million final installment payment associated with consideration due for our acquisition of Cinea, Inc. This amount was reclassified to other accrued expenses in fiscal 2004. See Note 3 for further detail.
3. Business Combinations
Cinea, Inc.
In September 2003, we acquired all outstanding shares of Cinea Inc. (Cinea), to obtain its entertainment content protection technology. The aggregate purchase price was $12.4 million, of which the final installment of $2.9 million plus accrued interest is payable in September 2005. Under the terms of the agreement, we have future payment obligations that equal approximately 5% to 8% of the revenue generated from products incorporating certain technologies we acquired in the transaction. The additional purchase consideration, if any, will be recorded as additional goodwill on our consolidated balance sheet. This business combination was accounted for under the purchase method of accounting and the financial results of Cinea have been included in our consolidated financial statements since September 2003 (excluding those that are eliminated in consolidation). As of September 24, 2004, no additional purchase consideration has been earned. Cinea will continue operating as a wholly-owned subsidiary of Dolby Laboratories.
The total purchase price, including other acquisition related costs, was $12.4 million and was allocated as follows (in thousands):
Goodwill | $ | 8,551 | ||
Developed technology | 2,680 | |||
In-process research and development | 1,310 | |||
Other intangible assets | 340 | |||
Acquired liabilities, net | (516 | ) | ||
| $ | 12,365 | |||
Amounts allocated to in-process research and development were expensed and are reflected in the accompanying consolidated statements of operations because the purchased research and development had no alternative uses and had not reached technological feasibility. At the date of the acquisition, the Cinea product under development was approximately 50% complete.
In performing the purchase price allocation we considered, among other factors, future use of the acquired assets, cost to complete certain acquired technology and estimates of future performance of certain acquired
F-17
Table of Contents
DOLBY LABORATORIES, INC.
NOTES TO CONSOLIDATED FINANCIAL STATEMENTS—(Continued)
products. The projected incremental cash flows were discounted back to their present value using discount rates of 19% and 35% for developed and in-process technology, respectively. These discount rates were determined after consideration of our rate of return on debt capital and equity, the weighted average return on invested capital and the risks associated with achieving anticipated sales related to the technology acquired from Cinea. Risks included achieving anticipated levels of market acceptance and penetration, market growth rates and risks related to the impact of potential changes in future target markets.
Lake Technology Limited
In December 2001, we entered into an agreement to purchase an equity interest in Lake Technology Limited. In January 2002, we acquired $1.0 million of Lake’s equity for cash and were issued convertible promissory notes (the Notes) with a combined face value of $2.0 million, payable January 2007 and convertible into Lake equity at our option. In March 2003, we converted $0.5 million of the Notes, which increased our equity interest in Lake to approximately 8%. In September 2003, we began the process of acquiring the remaining outstanding equity of Lake to obtain its digital audio signal processing technologies. In February 2004, we acquired a controlling interest in Lake. As of September 24, 2004, we held 93% of the outstanding equity of Lake at a total cost of $17.0 million. We have initiated action under Australian law to allow the compulsory acquisition of the remaining shares outstanding. We have accounted for the business combination as a step-acquisition.
Due to our majority ownership, the financial results of Lake are included in our consolidated financial statements since February 2004 (excluding those that are eliminated in consolidation) in accordance with U.S. GAAP. For fiscal 2003, we have included the equity investment and the Notes in the investments line in the accompanying consolidated balance sheets as we did not have significant influence or a controlling interest in Lake during that period. In accordance with APB 18, prior periods in which we did not have a 20% to 50% interest in Lake have been presented to reflect the results of applying the equity method from the date of the initial acquisition. Under the equity method, the investment in Lake was recorded at cost and the carrying amount of the investment is adjusted to recognize our share of the losses of Lake after the acquisition date. The impact of applying the equity method on income (loss) before taxes and controlling interest was $10,000, $0.3 million and $0.1 million in fiscal 2002, 2003 and 2004, respectively. The carrying amount of the investment at September 26, 2003 was $3.4 million.
The total purchase price to-date, including other acquisition related costs, was $17.0 million and was allocated as follows (in thousands):
Goodwill | $ | 13,318 | |
Patents | 948 | ||
Developed technology | 790 | ||
In-process research and development | 1,738 | ||
Other intangible assets | 158 | ||
Acquired assets, net | 3 | ||
| $ | 16,955 | ||
Amounts allocated to in-process research and development were expensed and are reflected in the accompanying consolidated statements of operations because the purchased research and development had no alternative uses and had not reached technological feasibility. At the date of the acquisition, the technology under development was approximately 27% complete.
The effects of these acquisitions on prior periods were not significant.
F-18
Table of Contents
DOLBY LABORATORIES, INC.
NOTES TO CONSOLIDATED FINANCIAL STATEMENTS—(Continued)
4. Income Taxes
The components of our taxable income (loss) before income taxes are as follows (in thousands):
| Fiscal Year Ended | |||||||||||
| September 27, 2002 | September 26, 2003 | September 24, 2004 | |||||||||
United States | $ | (5,062 | ) | $ | 46,502 | $ | 60,753 | ||||
Foreign | 4,968 | 546 | (1,088 | ) | |||||||
Total | $ | (94 | ) | $ | 47,048 | $ | 59,665 | ||||
The provision for income taxes consists of the following (in thousands):
| Fiscal Year Ended | ||||||||||||
| September 27, 2002 | September 26, 2003 | September 24, 2004 | ||||||||||
Current: | ||||||||||||
Federal | $ | 3,596 | $ | 6,053 | $ | 15,955 | ||||||
State | 1,304 | 125 | 3,537 | |||||||||
Foreign | 8,595 | 12,888 | 15,787 | |||||||||
Total current | $ | 13,495 | $ | 19,066 | $ | 35,279 | ||||||
Deferred: | ||||||||||||
Federal | (11,621 | ) | (2,223 | ) | (8,574 | ) | ||||||
State | (1,863 | ) | (764 | ) | (1,666 | ) | ||||||
Total deferred | (13,484 | ) | (2,987 | ) | (10,240 | ) | ||||||
Total | $ | 11 | $ | 16,079 | $ | 25,039 | ||||||
F-19
Table of Contents
DOLBY LABORATORIES, INC.
NOTES TO CONSOLIDATED FINANCIAL STATEMENTS—(Continued)
Deferred income taxes reflect the net tax effects of temporary differences between the carrying amounts of assets and liabilities for financial reporting purposes and the amounts used for income tax purposes using enacted tax rates in effect for the year in which the differences are expected to reverse. A summary of the tax effects of the temporary differences is as follows (in thousands):
September 26, 2003 | September 24, 2004 | |||||||
Deferred income tax assets: | ||||||||
Investments | $ | 311 | $ | 394 | ||||
Accounts receivable | 988 | 815 | ||||||
Inventories | 654 | 1,052 | ||||||
Foreign net operating loss | — | 1,139 | ||||||
Unrealized gain on investments | 21 | 19 | ||||||
State taxes | 356 | 367 | ||||||
Other assets | 557 | 2,961 | ||||||
Accrued expenses | 2,264 | 2,103 | ||||||
Other non-current liabilities | 8,840 | 8,733 | ||||||
Revenue recognition | 17,396 | 25,108 | ||||||
Total gross deferred income tax assets | 31,387 | 42,691 | ||||||
Less: valuation allowance | — | (1,139 | ) | |||||
Total deferred income tax assets | 31,387 | 41,552 | ||||||
Deferred income tax liabilities: | ||||||||
Translation adjustment | (465 | ) | (1,372 | ) | ||||
Depreciation and amortization | (2,773 | ) | (2,667 | ) | ||||
Deferred income tax assets, net | $ | 28,149 | $ | 37,513 | ||||
Current deferred income tax assets | $ | 22,215 | $ | 30,813 | ||||
Long-term deferred income tax assets, net | 5,934 | 6,700 | ||||||
Deferred income tax assets, net | $ | 28,149 | $ | 37,513 | ||||
Based upon the level of historical taxable income and projections for future taxable income over periods in which the deferred tax assets are deductible, we believe it is more likely than not that the benefits of these deductible differences will be realized and, therefore, a valuation allowance is not required except for the foreign net operating loss (NOL) in Australia. This NOL of $3.8 million has no expiration date. The ultimate utilization of the Australian NOL will be dependent upon future taxable income being generated in Australia. We believe that sufficient uncertainty exists regarding the future realization of this NOL and have established a valuation allowance of $1.1 million against this deferred tax asset. The amount of the deferred income tax asset, however, could be reduced in the near term if estimates of future taxable income during the carryforward period are reduced.
F-20
Table of Contents
DOLBY LABORATORIES, INC.
NOTES TO CONSOLIDATED FINANCIAL STATEMENTS—(Continued)
Our effective tax rate was (11.7)%, 34.2% and 42.0% for fiscal 2002, 2003 and 2004, respectively. In fiscal 2004, our effective tax rate differs from the statutory tax rate of 35.0% primarily due to the impact of incentive stock-based compensation expense, which is nondeductible, and losses from our foreign subsidiaries. In fiscal 2003, our effective tax rate was below the statutory tax rate primarily due to the impact of extraterritorial income exclusion and research and experimentation credits. The sources and tax effects of the differences for fiscal 2002, 2003 and 2004 were as follows:
| Fiscal Year Ended | |||||||||
September 27, 2002 | September 26, 2003 | September 24, 2004 | |||||||
Federal statutory rate | 35.0 | % | 35.0 | % | 35.0 | % | |||
State income taxes, net of federal effect | 14.4 | 4.6 | 5.2 | ||||||
Stock-based compensation expense | — | — | 3.4 | ||||||
Loss from foreign corporations | — | — | 3.3 | ||||||
Tax credits (1) | (432.4 | ) | (4.5 | ) | (2.6 | ) | |||
Other (1) | 371.3 | (0.9 | ) | (2.3 | ) | ||||
Effective tax rate | (11.7 | )% | 34.2 | % | 42.0 | % | |||
| (1) | The impact of tax credits and other charges on our fiscal 2002 effective tax rate was due to the taxable loss of $(0.1) million. As a result, each of those items as a percentage of taxable loss yields a much larger percentage impact. |
We are under routine tax examinations. We believe the amounts provided are adequate to cover the ultimate outcomes of these tax examinations.
5. Stockholders’ Equity
Class A and Class B Common Stock
Our board of directors has authorized two classes of common stock, Class A and Class B. At September 24, 2004, we had authorized 500,000,000 Class A shares and 500,000,000 Class B shares. At September 24, 2004, we had no outstanding shares of Class A common stock and 86,547,910 shares of Class B common stock outstanding. Holders of our Class A and Class B common stock have identical rights, except that holders of our Class A common stock are entitled to one vote per share and holders of our Class B common stock are entitled to ten votes per share. See Note 12.
2000 Stock Incentive Plan
Effective October 2000, we adopted the 2000 Stock Incentive Plan. The 2000 Stock Incentive Plan, as amended in April 2004 and September 2004, provides for the issuance of incentive and nonqualified stock options to employees, directors and consultants of Dolby Laboratories to purchase up to 15.1 million shares of Class B common stock. Under the terms of this plan, options are generally granted at not less than fair market value at the date of grant, become exercisable as established by the board of directors (generally ratably over four years), and generally expire ten years after the date of the grant.
F-21
Table of Contents
DOLBY LABORATORIES, INC.
NOTES TO CONSOLIDATED FINANCIAL STATEMENTS—(Continued)
A summary of the status of the 2000 Stock Incentive Plan is as follows (in thousands, except for exercise prices):
Class B Shares Available for Grant | Outstanding Options | ||||||||
Number of Class B Shares | Weighted Average Exercise Price | ||||||||
Balance at September 28, 2001 | 8,324 | 6,676 | $ | 1.26 | |||||
Grants | (265 | ) | 265 | 1.25 | |||||
Exercises | — | (11 | ) | 1.26 | |||||
Cancellations | 224 | (224 | ) | 1.26 | |||||
Balance at September 27, 2002 | 8,283 | 6,706 | $ | 1.26 | |||||
Grants | (1,979 | ) | 1,979 | 1.26 | |||||
Exercises | — | (13 | ) | 1.26 | |||||
Cancellations | 199 | (199 | ) | 1.26 | |||||
Balance at September 26, 2003 | 6,503 | 8,473 | $ | 1.26 | |||||
Grants | (5,362 | ) | 5,362 | 2.07 | |||||
Exercises | — | (1,084 | ) | 1.26 | |||||
Cancellations | 151 | (151 | ) | 1.26 | |||||
Amendment to 2000 Stock Incentive Plan | 132 | — | — | ||||||
Balance at September 24, 2004 | 1,424 | 12,600 | $ | 1.61 | |||||
As of September 24, 2004, there were options outstanding to purchase 12.6 million shares of Class B common stock, of which 4.5 million were vested and 4.3 million were exercisable. The options outstanding have a remaining weighted average contractual life of nine years.
The following table summarizes the significant ranges of outstanding and exercisable stock options at September 24, 2004 (shares in thousands):
| Outstanding Options | Options Exercisable | |||||||||||
Range of Exercise Prices | Class B Shares | Weighted Average Remaining Life in Years | Weighted Average Exercise Price | Class B Shares | Weighted Average Exercise Price | |||||||
$1.25 - $1.75 | 7,238 | 8 | $ | 1.26 | 4,304 | $ | 1.26 | |||||
$1.76 - $2.07 | 5,362 | 10 | $ | 2.07 | — | — | ||||||
The outstanding options to purchase 12.6 million shares of Class B common stock have vested or will vest as follows (in thousands):
| Fiscal Year | ||||||||||||
| 2004 and Prior | 2005 | 2006 | 2007 | 2008 | Total | |||||||
Number of options | 4,501 | 3,182 | 1,865 | 1,782 | 1,270 | 12,600 | ||||||
Stock Appreciation Rights
In January 2002, we issued 31,500 stock appreciation rights to certain employees based outside of the United States. All grants were made at fair market value at the date of issuance of $1.25 per share and vest ratably over four years. The compensation expense related to this issuance due to changes in the fair value of our Class B common stock is recognized over the vesting period.
F-22
Table of Contents
DOLBY LABORATORIES, INC.
NOTES TO CONSOLIDATED FINANCIAL STATEMENTS—(Continued)
6. Retirement Plans
We maintain a tax-qualified 401(k) retirement plan for employees in the United States called the “Dolby Laboratories, Inc. Retirement Plan.” Eligible employees are able to defer up to 100% of their eligible compensation subject to applicable Internal Revenue Code limits. The plan provides for a company matching contribution as well as a discretionary profit sharing component. Our matching and profit sharing contributions vest over a five year period based on years of service under the plan.
Eligible employees in the United Kingdom may participate in the “Dolby Group Pension Plan,” and executives in the United Kingdom may participate in the “Dolby Laboratories Funded Unapproved Retirement Benefits Scheme.” Similar to the 401(k) plan, these plans allow eligible employees to defer a portion of their compensation and include matching and profit sharing components.
Pension expenses for the United States plan were $2.6 million, $3.9 million and $3.6 million for fiscal 2002, 2003 and 2004, respectively. Pension expenses for the United Kingdom plans were $0.3 million, $0.4 million and $0.5 million for fiscal 2002, 2003 and 2004, respectively. Pension expenses are included in cost of product sales, cost of production services, research and development, and selling, general and administrative expenses on the accompanying consolidated statements of operations.
We maintain a supplemental retirement plan for key executives. The plan is a defined contribution plan with a target benefit paid at age 65. Our contributions are based on the participant’s compensation and years of service. Expenses related to the plan of $0.4 million per year for fiscal 2002, 2003 and 2004 are included in selling, general and administrative expense in the accompanying consolidated statements of operations. Amounts due to participants are classified in other non-current liabilities and investments to fund the liability are segregated and included in other assets on the accompanying consolidated balance sheets.
7. Commitments and Contingencies
Lease Commitments
Rental expenses under operating leases were $4.0 million, $4.3 million and $5.0 million for fiscal 2002, 2003 and 2004, respectively. These amounts include expense for rent payable to our principal stockholder of $3.4 million, $3.5 million and $3.5 million for fiscal 2002, 2003 and 2004, respectively. We have future minimum rental commitments, including those payable to our principal stockholder, for non-cancelable operating leases on office space as of September 24, 2004 as follows (in thousands):
Total Operating Lease Payments | |||
Fiscal 2005 | $ | 4,483 | |
Fiscal 2006 | 1,593 | ||
Fiscal 2007 | 264 | ||
Fiscal 2008 | 252 | ||
Fiscal 2009 | 184 | ||
Thereafter | 957 | ||
Total minimum lease payments | $ | 7,733 | |
Other Cash Obligations
In March 1997, an unrelated third party filed a lawsuit against us alleging breach of a written agreement. In April 2002, we settled the dispute and agreed to pay a total of $30.0 million in ten equal annual installments of $3.0 million per year beginning in June 2002. As of September 24, 2004, we had $21.0 million remaining to be paid under this settlement. Refer to Note 11 for further discussion.
F-23
Table of Contents
DOLBY LABORATORIES, INC.
NOTES TO CONSOLIDATED FINANCIAL STATEMENTS—(Continued)
Terms of our agreement to acquire all outstanding shares of Cinea (see Note 3) call for a final installment payment of $2.9 million plus accrued interest to be paid in September 2005. Under the terms of the agreement, we have future payment obligations that equal approximately 5% to 8% of the revenue generated from products incorporating certain technologies we acquired in the transaction. As of September 24, 2004, no additional purchase consideration has been earned.
8. Segment Information
Operating Segments
Our chief operating decision maker is our Chief Executive Officer (CEO). While the CEO evaluates results in a number of different ways, the primary basis for which the allocation of resources and financial results are assessed is by examining our business in two operating segments: the technology licensing segment and the products and services segment. The technology licensing segment licenses technology, trademarks and know-how to consumer electronics, personal computer, broadcast and professional audio companies and administers third-party patent-only licenses. The products and services segment provides professional products to movie theaters and to the recording, broadcast, cable and video post-production industries. Additionally, this segment provides services to broadcast, film production and distribution companies.
Accounting policies for each of the operating segments are the same as those used on a consolidated basis. Our reportable segment information for fiscal 2002, 2003 and 2004 are as follows (in thousands):
| Revenue | ||||||||||||
| Fiscal Year Ended | ||||||||||||
September 27, 2002 | September 26, 2003 | September 24, 2004 | ||||||||||
Technology licensing | $ | 106,640 | $ | 157,922 | $ | 211,395 | ||||||
Products and services | 55,228 | 59,550 | 77,646 | |||||||||
Total revenue | $ | 161,868 | $ | 217,472 | $ | 289,041 | ||||||
| Gross Margin | ||||||||||||
| Fiscal Year Ended | ||||||||||||
| September 27, 2002 | September 26, 2003 | September 24, 2004 | ||||||||||
Technology licensing | $ | 81,577 | $ | 117,921 | $ | 157,557 | ||||||
Products and services | 22,574 | 25,908 | 39,907 | |||||||||
Total gross margin | $ | 104,151 | $ | 143,829 | $ | 197,464 | ||||||
| Reconciliation to Income before Provision for Income Taxes and Controlling Interest | ||||||||||||
| Fiscal Year Ended | ||||||||||||
| September 27, 2002 | September 26, 2003 | September 24, 2004 | ||||||||||
Total segment gross margin | $ | 104,151 | $ | 143,829 | $ | 197,464 | ||||||
Operating expenses | (103,602 | ) | (96,162 | ) | (137,099 | ) | ||||||
Other income (expenses), net | (747 | ) | (57 | ) | �� | 229 | ||||||
Income (loss) before provision for income taxes and controlling interest | $ | (198 | ) | $ | 47,610 | $ | 60,594 | |||||
F-24
Table of Contents
DOLBY LABORATORIES, INC.
NOTES TO CONSOLIDATED FINANCIAL STATEMENTS—(Continued)
Geographic Data
| Revenue by Geographic Region | |||||||||
| Fiscal Year Ended | |||||||||
| September 27, 2002 | September 26, 2003 | September 24, 2004 | |||||||
United States | $ | 46,230 | $ | 55,351 | $ | 74,144 | |||
International | 115,638 | 162,121 | 214,897 | ||||||
Total revenue | $ | 161,868 | $ | 217,472 | $ | 289,041 | |||
Revenue by geographic region was determined based on the location of our licensees for licensing revenue, the location of our direct customers for product sales, and the location where services were performed for production services revenue. We do not track capital expenditures or assets by geographic region. Consequently, it is not practical to show assets by geographic region. Revenue generated from customers in Japan accounted for 30%, 28% and 26% of total revenue in fiscal 2002, 2003 and 2004, respectively. Revenue generated from customers in China accounted for 9%, 15% and 13% of total revenue in fiscal 2002, 2003 and 2004, respectively.
9. Product Warranty Reserve
Product warranty reserves are recorded to reflect contractual liabilities relating to warranty commitments to our customers. Estimated warranty expense is based on historical warranty return rates and repair costs.
Changes in the carrying amount of product warranty reserves, which are included in other accrued expenses, for fiscal 2003 and 2004 are summarized as follows (in thousands):
| Total | ||||
Balance at September 27, 2002 | $ | — | ||
Provision | 401 | |||
Warranty claims | (140 | ) | ||
Balance at September 26, 2003 | 261 | |||
Provision | 237 | |||
Warranty claims | (226 | ) | ||
Balance at September 24, 2004 | $ | 272 | ||
10. Related Party Transactions
We have licensing and royalty agreements with Ray Dolby and his affiliates for the use of patents on which a portion of our operations are based. Under these agreements we recorded expenses for royalties payable to Ray Dolby of $18.8 million, $27.6 million and $36.9 million for fiscal 2002, 2003 and 2004, respectively. These amounts are included in cost of licensing and cost of product sales in the accompanying consolidated statements of operations, depending on the nature of the licenses. The amounts included in accounts payable and accrued royalties due to related parties under these agreements were $7.6 million at September 26, 2003. At September 24, 2004, we had a receivable due from the principal stockholder of $1.9 million related to a prepayment of royalties made prior to the end of fiscal 2004.
In fiscal 2002, Ray Dolby reimbursed us approximately $6.0 million for administering licenses covering certain of his intellectual property rights. In June 2002, we terminated this licensing administration arrangement and amended our licensing agreements with Ray Dolby to license from him the intellectual property rights we
F-25
Table of Contents
DOLBY LABORATORIES, INC.
NOTES TO CONSOLIDATED FINANCIAL STATEMENTS—(Continued)
had previously administered on his behalf. As a result of these amendments, no reimbursements were received from Ray Dolby in fiscal 2003 or 2004.
We lease our San Francisco corporate office space from our principal stockholder. The lease expires on December 31, 2005, with our having an option to extend the term for an additional five-year period. Annual rent under the lease was $3.4 million, $3.5 million and $3.5 million for fiscal 2002, 2003 and 2004, respectively.
We are the minority partner in entities which own and lease commercial property in the United States and United Kingdom. Our principal stockholder is the controlling partner in each of these entities. These entities were established for the purposes of purchasing and leasing commercial property primarily for our own use. While a portion of the property is leased to third parties, we occupy a majority of the space. The debt used to finance the purchases of property by these entities is collateralized by the acquired property and guaranteed by Dolby Laboratories. Therefore, given that these affiliated entities are an integrated part of our operations, we have consolidated the entities’ assets and liabilities and results of operations in our consolidated financial statements. The share of earnings and net assets of the entities attributable to the controlling partner is reflected as controlling interest in the accompanying consolidated financial statements.
Our ownership interest in the consolidated affiliated entities is as follows:
Company Name | Ownership interest as of September 24, 2004 | ||
Dolby Properties, LLC | 37.5 | % | |
Dolby Properties Brisbane, LLC | 49.0 | % | |
Dolby Properties Burbank, LLC | 49.0 | % | |
Dolby Properties United Kingdom, LLC | 49.0 | % | |
Dolby Properties, LP | 10.0 | % |
11. Legal Proceedings
In the ordinary course of business, we defend ourselves against various legal proceedings, claims and contingencies arising in the normal course of our business activities. Management believes that the outcome of these matters will not have a material adverse effect on our financial position or results of operations.
In May 2001, we filed a lawsuit against Lucent Technologies, Inc. and Lucent Technologies Guardian I, LLC, together “Lucent,” in the United States District Court for the Northern District of California. We seek a declaration that certain U.S. patents are invalid and that we have not infringed on these patents. Lucent twice moved to dismiss our complaint. After its second motion was denied, Lucent filed an application with the United States Patent and Trademark Office to reissue one of these patents. The outcome of that proceeding is currently not determinable. In August 2002, Lucent filed counterclaims alleging that we have infringed on these patents. Lucent seeks injunctive relief and unspecified damages. The case is now set for jury trial in San Jose, California in April 2005. We believe Lucent’s claims are without merit, and we are vigorously litigating this matter.
In March 1997, an unrelated third party filed a lawsuit against us alleging breach of a written agreement. In April 2002, we settled the dispute and agreed to pay a total of $30.0 million, without interest, in ten equal annual installments of $3.0 million per year beginning in June 2002. We recorded this liability at its present value of $24.2 million on the consolidated balance sheet using a discount rate of 5.125%, which approximates our incremental cost of borrowing rate. Interest related to this liability is recorded quarterly and is included in interest expense on the accompanying consolidated statements of operations. As of September 24, 2004, we had $21.0 million remaining to be paid under this settlement.
F-26
Table of Contents
DOLBY LABORATORIES, INC.
NOTES TO CONSOLIDATED FINANCIAL STATEMENTS—(Continued)
12. Subsequent Events
a. Stock-Option Grants
In October 2004, subsequent to our 2004 fiscal year end, we granted additional options to purchase shares of Class B common stock to our employees at exercise prices that were below the reassessed fair value at the date of grant. We expect to record deferred stock-based compensation of $7.3 million related to those equity awards, which will be amortized on a straight-line basis over the vesting schedule of the awards.
b. Adoption of 2005 Stock Plan
In November 2004, our board of directors adopted our 2005 Stock Plan, and we expect the stockholders to approve the 2005 Stock Plan prior to the completion of our initial public offering. The 2005 Stock Plan will become effective on the day prior to the completion of this offering. Our 2005 Stock Plan provides for the ability to grant incentive stock options, nonstatutory stock options, restricted stock, stock appreciation rights, deferred stock units, performance units and performance shares. A total of 6,000,000 shares of our Class A common stock is authorized for issuance under the 2005 Stock Plan. Any shares subject to an award with a per share price less than the fair market value of our Class A common stock on the date of grant will be counted against the authorized share reserve as two shares for every one share subject to the award, and if returned to the 2005 Stock Plan, such shares will be counted as two shares for every one share returned.
c. Initial Public Offering
In November 2004, our board of directors approved the filing of a registration statement with the Securities and Exchange Commission for our initial public offering of our Class A common stock.
d. Class A and Class B Common Stock
In November 2004, our board of directors approved an amendment to our certificate of incorporation which will, among other matters, authorize two classes of common stock, Class A and Class B. We expect the stockholders to approve the amendment and restatement of the certificate of incorporation and that such charter document will become effective prior to the completion of this offering. Class B common stock will represent shares that are outstanding immediately prior to an initial public offering or are reserved for issuance upon exercise of then outstanding options to purchase shares of Class B common stock. Holders of our Class A and Class B common stock will have identical rights, except that holders of our Class A common stock are entitled to one vote per share and holders of our Class B common stock are entitled to ten votes per share. Shares of Class B common stock will be able to be converted to shares of Class A common stock at any time at the option of the stockholder and automatically convert upon sale or transfer, except for certain transfers specified in the amendment. All references to Class A and Class B common stock shares have been retroactively restated to reflect the amendment as if it had taken place at our inception.
e. Stock Split
In November 2004, our board of directors authorized a five-for-one stock split to be effected in connection with the implementation of the dual class stock structure described above. All references to Class A and Class B common stock shares and related per share amounts have been retroactively restated to reflect the stock split as if it had taken place at our inception.
F-27
Table of Contents
DOLBY LABORATORIES, INC.
NOTES TO CONSOLIDATED FINANCIAL STATEMENTS—(Continued)
The amount of stock-based compensation expense expected to be recorded in future periods related to the October 2004 awards and awards previously issued to employees is as follows (in thousands):
| Expense by Fiscal Year | |||||||||||||||
| 2005 | 2006 | 2007 | 2008 | 2009 | |||||||||||
Stock-based compensation expense related to options to purchase shares of Class B common stock | $ | 16,366 | $ | 16,517 | $ | 16,517 | $ | 9,315 | $ | 152 | |||||
f. Contribution of Intellectual Property Rights
Throughout our history, Ray Dolby has retained ownership of the intellectual property rights he created related to our business. These intellectual property rights are currently held by entities affiliated with him that have licensed this technology to us in exchange for royalty payments, including royalty payments related to certain trademark usage. Under these licensing and royalty agreements, we recorded expenses for royalties payable to Ray Dolby for the use of certain patent and trademark rights of $18.8 million, $27.6 million and $36.9 million in fiscal 2002, 2003 and 2004, respectively.
In addition, in fiscal 2002, Ray Dolby reimbursed us approximately $6.0 million for administering licenses covering certain of his intellectual property rights. In June 2002, we terminated this licensing administration arrangement and amended our licensing agreements with Ray Dolby to license from him the intellectual property rights we had previously administered on his behalf. In exchange, we agreed to pay him royalties in an amount that was intended to approximate the net revenue he would have received under our prior licensing administration arrangement.
Ray Dolby will contribute to us, prior to the completion of an initial public offering, all rights in intellectual property related to our business that he and his affiliates hold, so that we will have full ownership rights in this intellectual property once we are a public company. In connection with the asset contribution, our current licensing arrangements with Ray Dolby will terminate, and we will have no further obligation to pay royalties to Ray Dolby.
F-28
Table of Contents

Table of Contents
PART II
INFORMATION NOT REQUIRED IN PROSPECTUS
ITEM 13. OTHER EXPENSES OF ISSUANCE AND DISTRIBUTION.
The following table sets forth all expenses to be paid by the registrant, other than estimated underwriting discounts and commissions, in connection with this offering. All amounts shown are estimates except for the registration fee and the New York Stock Exchange listing fee.
SEC registration fee | $ | 58,282 | |
New York Stock Exchange listing fee | |||
Printing and engraving | |||
Legal fees and expenses | |||
Accounting fees and expenses | |||
Blue sky fees and expenses (including legal fees) | |||
Transfer agent and registrar fees | |||
Miscellaneous | |||
Total | $ | ||
ITEM 14. INDEMNIFICATION OF DIRECTORS AND OFFICERS.
Section 145 of the Delaware General Corporation Law authorizes a court to award, or a corporation’s board of directors to grant, indemnity to officers, directors and other corporate agents in terms sufficiently broad to permit such indemnification under certain circumstances and subject to certain limitations.
As permitted by Section 145 of the Delaware General Corporation Law, the registrant’s amended and restated certificate of incorporation includes provisions that eliminate the personal liability of its directors and officers for monetary damages for breach of their fiduciary duty as directors and officers.
In addition, as permitted by Section 145 of the Delaware General Corporation Law, the amended and restated bylaws of the registrant provide that:
| · | The registrant shall indemnify its directors and officers for serving the registrant in those capacities or for serving other business enterprises at the registrant’s request, to the fullest extent permitted by Delaware law, if such person acted in good faith and in a manner such person reasonably believed to be in or not opposed to the best interests of the registrant and, with respect to any criminal proceeding, had no reasonable cause to believe such person’s conduct was unlawful. |
| · | The registrant may, in its discretion, indemnify employees and agents in those circumstances where indemnification is not required by law. |
| · | The registrant is required to advance expenses, as incurred, to its directors and officers in connection with defending a proceeding, except that such director or officer shall undertake to repay such advances if it is ultimately determined that such person is not entitled to indemnification. |
| · | The registrant will not be obligated pursuant to the bylaws to indemnify a person with respect to proceedings initiated by that person, except with respect to proceedings authorized by the registrant’s board of directors or brought to enforce a right to indemnification. |
| · | The rights conferred in the amended and restated bylaws are not exclusive, and the registrant is authorized to enter into indemnification agreements with its directors, officers, employees and agents and to obtain insurance to indemnify such persons. |
| · | The registrant may not retroactively amend the bylaw provisions to reduce its indemnification obligations to directors, officers, employees and agents. |
II-1
Table of Contents
The registrant’s policy is to enter into separate indemnification agreements with each of its directors and officers that provide the maximum indemnity allowed to directors and executive officers by Section 145 of the Delaware General Corporation Law and also provides for certain additional procedural protections. The registrant also maintains directors and officers insurance to insure such persons against certain liabilities.
These indemnification provisions and the indemnification agreements entered into between the registrant and its officers and directors may be sufficiently broad to permit indemnification of the registrant’s officers and directors for liabilities (including reimbursement of expenses incurred) arising under the Securities Act.
The underwriting agreement filed as Exhibit 1.1 to this registration statement provides for indemnification by the underwriters of the registrant and its officers and directors for certain liabilities arising under the Securities Act and otherwise.
ITEM 15. RECENT SALES OF UNREGISTERED SECURITIES.
In the three years prior to the filing of this registration statement, the registrant has issued the following unregistered securities:
(a) As of September 24, 2004, Dolby Laboratories, Inc., a California corporation, had issued and sold an aggregate of 1,679,640 shares of common stock upon exercise of options issued to certain employees, directors and consultants under the registrant’s amended and restated 2000 Stock Incentive Plan, for an aggregate consideration of $2,579,290. As of November 19, 2004, the registrant has issued and sold an additional 302,095 shares of common stock upon exercise of options issued to certain employees, directors and consultants under the registrant’s amended and restated 2000 Stock Incentive Plan, for an aggregate consideration of $380,036.
(b) In January 2004, Dolby Laboratories, Inc., a California corporation, issued 571,560 shares of common stock to N.W. Jasper, Jr., the registrant’s president and chief executive officer, under the registrant’s amended and restated 2000 Stock Incentive Plan.
(c) In connection with the registrant’s reincorporation into the State of Delaware on September 24, 2004, the registrant issued 86,547,910 shares of common stock to a total of 49 stockholders in exchange for the outstanding shares of common stock of Dolby Laboratories, Inc., a California corporation.
None of the foregoing transactions involved any underwriters, underwriting discounts or commissions, or any public offering, and the registrant believes the transaction was exempt from the registration requirements of the Securities Act in reliance on Rule 701 thereunder, with respect to item (a) above, and Section 4(2) thereof, with respect to items (b) and (c) above, as transactions by an issuer not involving a public offering or transactions pursuant to compensatory benefit plans and contracts relating to compensation as provided under such Rule 701. The recipients of securities in such transactions represented their intention to acquire the securities for investment only and not with a view to or for sale in connection with any distribution thereof, and appropriate legends were affixed to the share certificates and instruments issued in such transactions. All recipients either received adequate information about the registrant or had access, through their relationships with the registrant, to such information.
II-2
Table of Contents
ITEM 16. EXHIBITS AND FINANCIAL STATEMENT SCHEDULES.
(a) Exhibits. The following exhibits are included herein or incorporated herein by reference:
| Exhibit Number | Description | |
| 1.1* | Form of Underwriting Agreement. | |
| 3.1* | Form of Amended and Restated Certificate of Incorporation of the registrant, to be in effect upon the completion of this offering. | |
| 3.2 | Form of Amended and Restated Bylaws of the registrant, to be in effect upon the completion of this offering. | |
| 4.1* | Form of registrant’s Class A common stock certificate. | |
| 5.1* | Opinion of Wilson Sonsini Goodrich & Rosati, Professional Corporation. | |
| 10.1 | Form of Indemnification Agreement to be entered into between the registrant and its directors and officers. | |
| 10.2 | 2000 Stock Incentive Plan, as amended. | |
| 10.3 | Forms of Stock Option Agreements under the 2000 Stock Incentive Plan. | |
| 10.4 | 2005 Stock Plan. | |
| 10.5* | Form of Stock Option Agreement under the 2005 Stock Plan. | |
| 10.6 | Senior Executive Supplemental Retirement Plan. | |
| 10.7* | Description of Dolby Annual Incentive Plan. | |
| 10.8 | Lease for 100 Potrero Avenue, San Francisco, California. | |
| 10.9 | Lease for 999 Brannan Street, San Francisco, California. | |
| 10.10 | Lease for 175 South Hill Drive, Brisbane, California. | |
| 10.11 | Lease for 3601 West Alameda Avenue, Burbank, California. | |
| 10.12 | Leases for Wootton Bassett, England facilities. | |
| 10.13*† | License Agreement effective January 1, 1992 by and between GTE Laboratories Incorporated and Dolby Laboratories Licensing Corporation. | |
| 10.14 | Offer Letter dated September 28, 2000, by and between Martin A. Jaffe and Dolby Laboratories, Inc., a California corporation. | |
| 10.15 | Offer Letter dated October 23, 2003, by and between Mark S. Anderson and Dolby Laboratories, Inc., a California corporation. | |
| 10.16 | Funded Unapproved Retirement Benefits Scheme (United Kingdom) for David Watts. | |
| 21.1 | List of significant subsidiaries of the registrant. | |
| 23.1 | Consent of KPMG LLP, Independent Registered Public Accounting Firm. | |
| 23.2* | Consent of Wilson Sonsini Goodrich & Rosati, Professional Corporation (included in Exhibit 5.1). | |
| 24.1 | Power of Attorney (see page II-5 to this Form S-1). | |
| * | To be filed by amendment. |
| † | Confidential treatment will be requested for portions of this exhibit. These portions will be omitted from this Registration Statement and will be filed separately with the Securities and Exchange Commission. |
II-3
Table of Contents
(b) Financial Statement Schedules
Schedule II — Valuation and Qualifying Accounts
Other financial statement schedules have been omitted because they are inapplicable or not required or because the information is included elsewhere in the registrant’s consolidated financial statements and the related notes.
ITEM 17. UNDERTAKINGS.
The undersigned registrant hereby undertakes to provide to the underwriters at the closing specified in the underwriting agreement certificates in such denominations and registered in such names as required by the underwriters to permit prompt delivery to each purchaser.
Insofar as indemnification by the registrant for liabilities arising under the Securities Act may be permitted to directors, officers and controlling persons of the registrant pursuant to the foregoing provisions, or otherwise, the registrant has been advised that in the opinion of the Securities and Exchange Commission such indemnification is against public policy as expressed in the Securities Act, and is, therefore, unenforceable. In the event that a claim for indemnification against such liabilities (other than the payment by the registrant of expenses incurred or paid by a director, officer, or controlling person of the registrant in the successful defense of any action, suit or proceeding) is asserted by such director, officer or controlling person in connection with the securities being registered, the registrant will, unless in the opinion of its counsel the matter has been settled by controlling precedent, submit to a court of appropriate jurisdiction the question whether such indemnification by it is against public policy as expressed in the Securities Act and will be governed by the final adjudication of such issue.
The undersigned registrant hereby undertakes that:
(1) For purposes of determining any liability under the Securities Act, the information omitted from the form of prospectus filed as part of this registration statement in reliance upon Rule 430A and contained in a form of prospectus filed by the registrant pursuant to Rule 424(b)(1) or (4) or 497(h) under the Securities Act shall be deemed to be part of this registration statement as of the time it was declared effective.
(2) For the purpose of determining any liability under the Securities Act, each post-effective amendment that contains a form of prospectus shall be deemed to be a new registration statement relating to the securities offered therein, and the offering of such securities at the time shall be deemed to be the initial bona fide offering thereof.
II-4
Table of Contents
SIGNATURES
Pursuant to the requirements of the Securities Act of 1933, the registrant has duly caused this registration statement to be signed on its behalf by the undersigned, thereunto duly authorized, in the City of San Francisco, State of California, on this 19th day of November 2004.
| DOLBY LABORATORIES, INC. | ||
| By: | /s/ N. W. JASPER, JR. | |
| N. W. Jasper, Jr. | ||
| President and Chief Executive Officer | ||
POWER OF ATTORNEY
KNOW ALL PERSONS BY THESE PRESENTS, that each person whose signature appears below hereby constitutes and appoints N. W. Jasper, Jr. as his or her true and lawful attorney-in-fact and agent with full power of substitution, for him or her in any and all capacities, to sign any and all amendments to this registration statement (including post-effective amendments or any abbreviated registration statement and any amendments thereto filed pursuant to Rule 462(b) increasing the number of securities for which registration is sought), and to file the same, with all exhibits thereto and other documents in connection therewith, with the Securities and Exchange Commission, granting unto said attorney-in-fact and agent full power and authority to do and perform each and every act and thing requisite and necessary to be done in connection therewith, as fully for all intents and purposes as he or she might or could do in person, hereby ratifying and confirming all that said attorney-in-fact and agent, or his substitute, may lawfully do or cause to be done by virtue hereof.
Pursuant to the requirements of the Securities Act of 1933, this registration statement has been signed by the following persons in the capacities and on the dates indicated:
Signature | Title | Date | ||
/s/ RAY DOLBY Ray Dolby | Chairman of the Board | November 19, 2004 | ||
/s/ N. W. JASPER, JR. N. W. Jasper, Jr. | President, Chief Executive Officer and Director (Principal Executive Officer) | November 19, 2004 | ||
/s/ JANET DALY Janet Daly | Vice President and Chief Financial Officer (Principal Accounting and Financial Officer) | November 19, 2004 | ||
/s/ PETER GOTCHER Peter Gotcher | Director | November 19, 2004 | ||
/s/ SANFORD ROBERTSON Sanford Robertson | Director | November 19, 2004 | ||
/s/ ROGER SIBONI Roger Siboni | Director | November 19, 2004 | ||
II-5
Table of Contents
DOLBY LABORATORIES, INC.
SCHEDULE II — VALUATION AND QUALIFYING ACCOUNTS
Allowance for Doubtful Accounts | Balance at Beginning of Year | Charged to Operations | Deductions | Balance at End of Year | |||||||||
| ($ in thousands) | |||||||||||||
For the year ended September 27, 2002 | $ | 1,266 | $ | 55 | $ | — | $ | 1,321 | |||||
For the year ended September 26, 2003 | 1,321 | 1,753 | (509 | ) | 2,565 | ||||||||
For the year ended September 24, 2004 | 2,565 | 402 | (857 | ) | 2,110 | ||||||||
Table of Contents
EXHIBIT INDEX
| Exhibit Number | Description | |
| 1.1* | Form of Underwriting Agreement. | |
| 3.1* | Form of Amended and Restated Certificate of Incorporation of the registrant, to be in effect upon the completion of this offering. | |
| 3.2 | Form of Amended and Restated Bylaws of the registrant, to be in effect upon the completion of this offering. | |
| 4.1* | Form of registrant’s Class A common stock certificate. | |
| 5.1* | Opinion of Wilson Sonsini Goodrich & Rosati, Professional Corporation. | |
| 10.1 | Form of Indemnification Agreement to be entered into between the registrant and its directors and officers. | |
| 10.2 | 2000 Stock Incentive Plan, as amended. | |
| 10.3 | Forms of Stock Option Agreements under the 2000 Stock Incentive Plan. | |
| 10.4 | 2005 Stock Plan. | |
| 10.5* | Form of Stock Option Agreement under the 2005 Stock Plan. | |
| 10.6 | Senior Executive Supplemental Retirement Plan. | |
| 10.7* | Description of Dolby Annual Incentive Plan. | |
| 10.8 | Lease for 100 Potrero Avenue, San Francisco, California. | |
| 10.9 | Lease for 999 Brannan Street, San Francisco, California. | |
| 10.10 | Lease for 175 South Hill Drive, Brisbane, California. | |
| 10.11 | Lease for 3601 West Alameda Avenue, Burbank, California. | |
| 10.12 | Leases for Wootton Bassett, England facilities. | |
| 10.13*† | License Agreement effective January 1, 1992 by and between GTE Laboratories Incorporated and Dolby Laboratories Licensing Corporation. | |
| 10.14 | Offer Letter dated September 28, 2000, by and between Martin A. Jaffe and Dolby Laboratories, Inc., a California corporation. | |
| 10.15 | Offer Letter dated October 23, 2003, by and between Mark S. Anderson and Dolby Laboratories, Inc., a California corporation. | |
| 10.16 | Funded Unapproved Retirement Benefits Scheme (United Kingdom) for David Watts. | |
| 21.1 | List of significant subsidiaries of the registrant. | |
| 23.1 | Consent of KPMG LLP, Independent Registered Public Accounting Firm. | |
| 23.2* | Consent of Wilson Sonsini Goodrich & Rosati, Professional Corporation (included in Exhibit 5.1). | |
| 24.1 | Power of Attorney (see page II-5 to this Form S-1). | |
| * | To be filed by amendment. |
| † | Confidential treatment will be requested for portions of this exhibit. These portions will be omitted from this Registration Statement and will be filed separately with the Securities and Exchange Commission. |