Exhibit 99.1
. However, because adjusted net income, adjusted operating income and total segment adjusted operating income are non-GAAP measures, they should not be considered as a substitute for, or superior to, net income, operating income or cash flows from operating activities as determined in accordance with GAAP. In addition, adjusted net income, adjusted operating income and total Segment adjusted operating income as used by WEX may not be comparable to similarly titled measures employed by other companies.

WEX Third Quarter 2021 Earnings October 28, 2021

These earnings materials contain forward-looking statements, including statements regarding: assumptions underlying the Company's future financial performance, future operations; future growth opportunities and expectations; expectations for future revenue performance, future impacts from areas of investment, expectations for the macro environment; and, expectations for volumes. Any statements that are not statements of historical facts may be deemed to be forward-looking statements. When used in this earnings release, the words “anticipate,” “believe,” “continue,” “could,” “estimate,” “expect,” “intend,” “may,” “plan,” “project” and similar expressions are intended to identify forward-looking statements, although not all forward-looking statements contain such words. These forward-looking statements are subject to a number of risks and uncertainties that could cause actual results to differ materially, including: the demand for worldwide travel as a result of COVID-19 and the length of time it may take for the travel industry to rebound to and grow beyond pre-pandemic levels; the extent to which the coronavirus (COVID-19) pandemic and measures taken in response thereto impact our business, results of operations and financial condition in excess of current expectations; the impact of fluctuations in fuel prices and fuel spreads in our international markets, including the resulting impact on our revenues and net income; the effects of general economic conditions, including those caused by the effects of COVID-19, on overall employment, travel and fueling patterns as well as payment and transaction processing activity; failure to expand the Company’s technological capabilities and service offerings as rapidly as the Company’s competitors; limitations on interchange fees; failure to comply with the applicable requirements of MasterCard or Visa contracts and rules; the Company’s failure to maintain or renew key commercial agreements or to maintain volumes under such agreements; breaches of the Company’s technology systems or those of our third-party service providers and any resulting negative impact on our reputation, liabilities or relationships with customers or merchants; the actions of regulatory bodies, including banking and securities regulators, or possible changes in banking or financial regulations impacting the Company’s industrial bank, the Company as the corporate parent or other subsidiaries or affiliates; the Company’s ability to successfully finalize the recently announced Executive Leadership Team transition plan and to appoint additional officers; the success of the Company’s recently announced Executive Leadership Team and strategic reorganization; the effects of the Company’s business expansion and acquisition efforts; the failure of corporate investments to result in anticipated strategic value; the Company’s failure to comply with the Treasury Regulations applicable to non-bank custodians; potential adverse changes to business or employee relationships, including those resulting from the completion of an acquisition; competitive responses to any acquisitions; uncertainty of the expected financial performance of the combined operations following completion of an acquisition; the failure to complete or successfully integrate the Company’s acquisitions or the ability to realize anticipated synergies and cost savings from such transactions; unexpected costs, charges, or expenses resulting from an acquisition; the Company’s failure to successfully acquire, integrate, operate and expand commercial fuel card programs; the impact and size of credit losses; the impact of changes to the Company’s credit standards; failure to successfully implement the Company’s information technology strategies and capabilities in connection with its technology outsourcing and insourcing arrangements and any resulting cost associated with that failure; legal, regulatory, political and economic uncertainty surrounding the United Kingdom’s departure from the European Union and the resulting trade agreement; the impact of foreign currency exchange rates on the Company’s operations, revenue and income; changes in interest rates; the impact of the future transition from LIBOR as a global benchmark to a replacement rate; the impact of the Company’s debt instruments on the Company’s operations; the impact of increased leverage on the Company’s operations, results or borrowing capacity generally, and as a result of acquisitions specifically; the impact of sales or dispositions of significant amounts of our outstanding common stock into the public market, or the perception that such sales or dispositions could occur; the possible dilution to our stockholders caused by the issuance of additional shares of common stock or equity-linked securities, whether as result of our convertible notes or otherwise; the incurrence of impairment charges if our assessment of the fair value of certain of our reporting units changes; the uncertainties of litigation; as well as other risks and uncertainties identified in Item 1A of our Annual Report on Form 10-K for the year ended December 31, 2020 filed with the Securities and Exchange Commission on March 1, 2021 and in Item 1A of our quarterly report on Form 10-Q for the quarter ended June 30, 2021, filed with the Securities and Exchange Commission on August 4, 2021. The Company's forward-looking statements do not reflect the potential future impact of any alliance, merger, acquisition, disposition or stock repurchases. The forward-looking statements speak only as of the date of this earnings release and undue reliance should not be placed on these statements. The Company disclaims any obligation to update any forward-looking statements as a result of new information, future events or otherwise.Non-GAAP Information:For additional important information and disclosure regarding our use of non-GAAP metrics, specifically adjusted net income attributable to shareholders and adjusted operating income, please see our most recent earnings release, issued on October 28, 2021. See the Appendix to this presentation for an explanation and reconciliation of (i) non-GAAP adjusted net income attributable to shareholders (or “adjusted net income” or “ANI”) to GAAP net income (loss) attributable to shareholders, (ii) ANI per diluted share to GAAP net income (loss) per diluted share, and (iii) non-GAAP adjusted operating income to GAAP operating income.Note: The Company rounds amounts in the consolidated financial statements to thousands and calculates all percentages and per-share data from underlying whole-dollar amounts. Thus, certain amounts may not foot, crossfoot, or recalculate exactly based on reported numbers due to rounding. WEX Forward-Looking Statements

Highlights For The Quarter Fleet Travel & Corporate Health & Employee Benefits Up 26% Up 54% Up 93% 3Q 2021 Segment Revenue Growth Vs. 3Q 2020 +18% +42% +25% (1) (1) Health and Employee Benefit Solutions segment purchase volume represents US Healthcare purchase volume only (1) (1)

Executing on our Commitments ACHIEVEMENTS THIS QUARTER INNOVATION / EXECUTION / INTEGRITY / RELATIONSHIPS / COMMUNITY STRATEGIC PILLARS & CORE VALUES Exceeded high end of revenue and adjusted earnings expectations with growth rates of 26% and 54%Purchase volume processed at $26 billion across the organization during Q3, an increase of 93% Significantly expanded margins in Fleet and Travel & Corporate Solutions segments, with strong momentum in organic growth and continued progress integrating acquired businessesMigration of corporate payments card issuing platform to the cloud nearly completeShort term EV focus is on supporting customer needs; longer term looking at additional opportunitiesHosted the 3rd annual HSA day to promote awareness of the benefits of HSA’sRobert Deshaies named Chief Operating Officer, Americas, effective Jan 1, 2022

Electric Vehicle (EV) Vision As customers transition to the “new” mixed-fleet, WEX can help manage end-to-end reporting and payment needs with a full-suite of integrated solutions On-Route:Universal EV and Fuel Payment Solution At-Home:Home Charging and Employee Reimbursement At-Work:Depot/Workplace Charging Mixed-Fleet UX:Integrated Fleet Management, Billing and Reporting WEX EV Offering:On-route, depot and at-home charging solutionsStreamlined program enrollmentCentralized reporting and billingReal-time data on energy use to support driver reimbursement for commercial electric charging and installation servicesElement Fleet, the largest pure-play automotive fleet manager in the world, announced it will use the combined offering from WEX and ChargepointPlan to develop additional products and related services over time as the market is further defined

Weekly Volume Metrics Key UpdatesOctober month-to-date average domestic fuel price is $3.41Weekly purchase volume changes for March through October 2021 have been benchmarked to 2019 to provide a more meaningful comparisonIncludes purchase volume for eNett and Optal as if they were owned for the entire period shown Fleet Payment Processing Gallon Volume & Travel and Corporate Payments Purchase Volume

Weekly Volume Metrics Key Updates:Includes purchase volume for eNett and Optal as if they were owned for the entire period shownTravel customer purchase volume April - June 2021 not shown due to scale. Actual growth rates were between 200% and 1800% Fleet Payment Processing Gallon Volume & Travel and Corporate Payments Purchase Volume

Weekly Volume Metrics Key UpdatesSaaS account growth - driver of ~2/3 of health segment revenue - remains strongWeekly purchase volume changes for March through October 2021 have been benchmarked to both 2019 and 2020 to provide a more meaningful comparisonNOTE: Blue line represents year over year change in purchase volume. Green dots reflect the purchase volume benchmarked to 2019 levels for March 2021 and later periods SaaS Account Growth Rate and Health Purchase Volume US Healthcare Purchase Volume % Change Y-o-Y and Benchmarked to 2019 for March 2021 and later

WEX Third Quarter2021 Financial Results
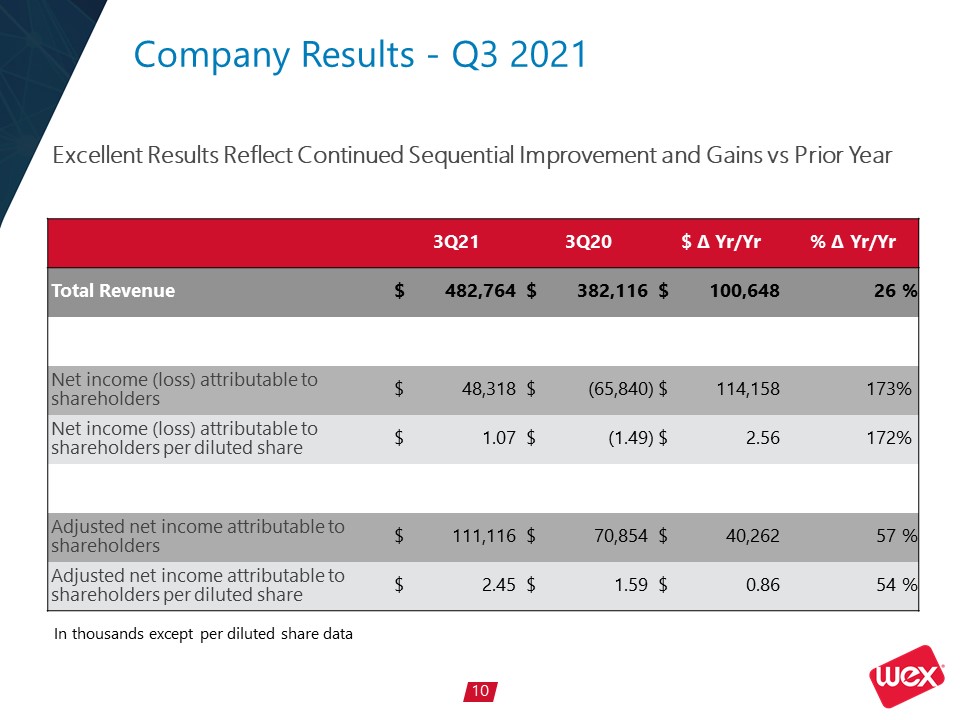
Company Results - Q3 2021 3Q21 3Q20 $ ∆ Yr/Yr % ∆ Yr/Yr Total Revenue $ 482,764 $ 382,116 $ 100,648 26 % Net income (loss) attributable to shareholders $ 48,318 $ (65,840 ) $ 114,158 173 % Net income (loss) attributable to shareholders per diluted share $ 1.07 $ (1.49 ) $ 2.56 172 % Adjusted net income attributable to shareholders $ 111,116 $ 70,854 $ 40,262 57 % Adjusted net income attributable to shareholders per diluted share $ 2.45 $ 1.59 $ 0.86 54 % In thousands except per diluted share data Excellent Results Reflect Continued Sequential Improvement and Gains vs Prior Year

Revenue Breakdown - Q3 2021 3Q21 3Q20 $ ∆ Yr/Yr % ∆ Yr/Yr Total Revenue $482,764 $382,116 $100,648 26 % Segment Revenue: Fleet Solutions $286,361 $228,704 $57,657 25 % Travel and Corporate Solutions $91,002 $64,296 $26,706 42 % Health and Employee Benefit Solutions $105,401 $89,116 $16,285 18 % Sequential and Year Over Year Growth in Revenue for Each Segment In thousands unless otherwise noted

Fleet Solutions 3Q21 3Q20 $ ∆ Yr/Yr % ∆ Yr/Yr Total Segment Revenue ($) 286,361 228,704 57,657 25 % Payment Processing Revenue ($) 130,006 102,418 27,588 27 % Finance Fee Revenue ($) 67,529 46,129 21,400 46 % All Other Revenue ($) 88,826 80,157 8,669 11 % Payment Processing Transactions 134,029 120,900 13,129 11 % Net Payment Processing Rate (%) 1.09 % 1.35 % (0.26 )% (19 )% Average US Fuel Price ($/gallon) 3.23 2.23 1.00 45 % Net Late Fee Rate (%) 0.45 % 0.48 % (0.03 )% (7 )% Strong Growth Rates With Revenue and Volume Exceeding Pre-Pandemic Levels In thousands unless otherwise noted
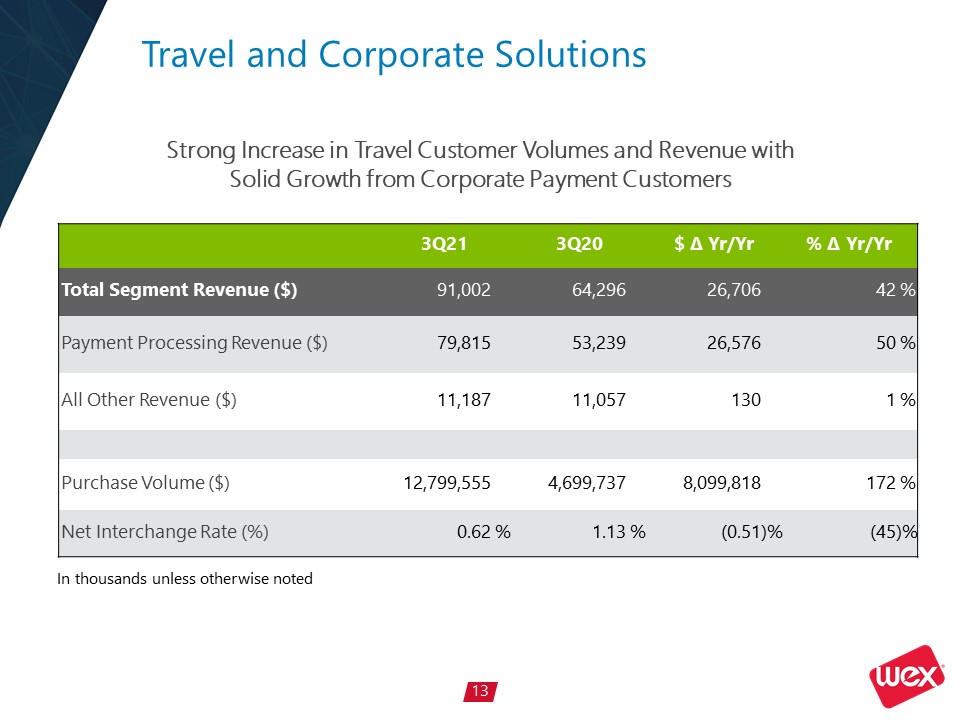
Travel and Corporate Solutions 3Q21 3Q20 $ ∆ Yr/Yr % ∆ Yr/Yr Total Segment Revenue ($) 91,002 64,296 26,706 42 % Payment Processing Revenue ($) 79,815 53,239 26,576 50 % All Other Revenue ($) 11,187 11,057 130 1 % Purchase Volume ($) 12,799,555 4,699,737 8,099,818 172 % Net Interchange Rate (%) 0.62 % 1.13 % (0.51 )% (45 )% Strong Increase in Travel Customer Volumes and Revenue with Solid Growth from Corporate Payment Customers In thousands unless otherwise noted

Health and Employee Benefit Solutions 3Q21 3Q20 $ ∆ Yr/Yr % ∆ Yr/Yr Total Segment Revenue ($) 105,401 89,116 16,285 18 % Payment Processing Revenue ($) 16,305 15,420 885 6 % Account Servicing Revenue ($) 83,145 63,103 20,042 32 % All Other Revenue ($) 5,951 10,593 (4,642 ) (44 )% Purchase Volume* ($) 1,173,913 1,120,786 53,127 5 % Average Number of SaaS Accounts* 16,912 14,599 2,313 16 % Double-Digit Revenue Growth and Continued Strong SaaS Account Growth In thousands unless otherwise noted* U.S. only

Operating Expenses and Segment Adjusted Operating Income Margins Increase in Fleet Solutions adjusted segment operating income margins reflects revenue growth, very low credit losses, higher fuel prices and operating leverage in expense baseIncrease in Travel and Corporate Solutions adjusted segment operating income margins reflects additional benefits from eNett and Optal synergies, and scale from increased revenueSlight decrease in Health and Employee Benefit Solutions adjusted segment operating income margins reflects acquisition of benefitexpress in JuneUnallocated Corporate costs as a percentage of total revenue were up slightly Segment Adjusted Operating Income Margin Three months ended September 30, June 30, 2021 2020 2021 Fleet Solutions 50.6% 44.7% 50.2% Travel and Corporate Solutions 34.1% 22.1% 21.0% Health and Employee Benefit Solutions 22.6% 26.7% 28.1% Adjusted operating income margin(1) 37.0% 32.8% 36.3% Cost of services Selling general and administrative (1) Adjusted operating income margin is derived by dividing adjusted operating income by the revenue of the corresponding segment (or the entire Company for adjusted operating income). See appendix for a reconciliation of GAAP operating income to total segment adjusted operating income and adjusted operating income.

Tax Rate Key UpdatesANI tax rate higher than prior year quarter due to change in jurisdictional mixGAAP tax rate in Q3 2020 unusually low due to a decrease in pre-tax income, a shift in jurisdictional earnings and sizable non deductible expenses primarily related to the sale of the Company’s Brazilian subsidiary, partially offset by a discrete tax benefit

Additional Balance Sheet Items Key UpdatesCorporate cash1 balance was $145 million As of September 30, 2021, available borrowing capacity of $665 million on revolving credit facilityAmended and restated credit facility dated April 1, 2021, increased borrowing capacity by $60 million and increased Tranche A term loans by approximately $117 million and extended maturities to 2026 and 2028Leverage ratio of 3.7X 1 Corporate cash is calculated in accordance with the terms of our consolidated leverage ratio in the Company’s Amended and Restated Credit Agreement as filed with the SEC.Note: Total Financing Debt includes outstanding borrowings on the revolving line of credit, term loans, and convertible notes.
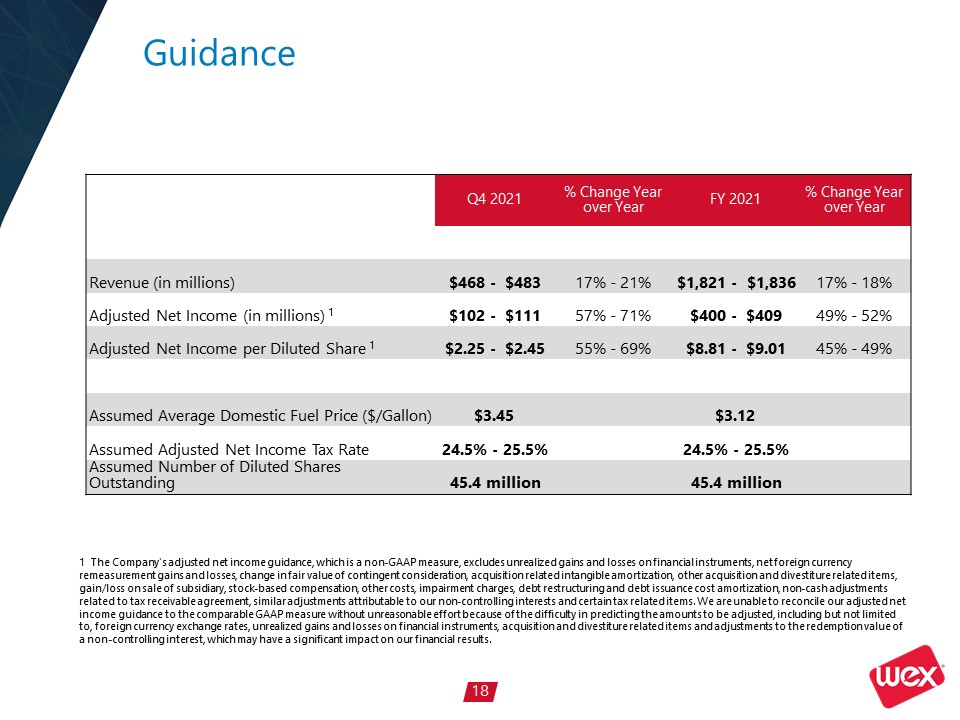
Guidance Q4 2021 % Change Year over Year FY 2021 % Change Year over Year Revenue (in millions) $468 - $483 17% - 21% $1,821 - $1,836 17% - 18% Adjusted Net Income (in millions) 1 $102 - $111 57% - 71% $400 - $409 49% - 52% Adjusted Net Income per Diluted Share 1 $2.25 - $2.45 55% - 69% $8.81 - $9.01 45% - 49% Assumed Average Domestic Fuel Price ($/Gallon) $3.45 $3.12 Assumed Adjusted Net Income Tax Rate 24.5% - 25.5% 24.5% - 25.5% Assumed Number of Diluted Shares Outstanding 45.4 million 45.4 million 1 The Company's adjusted net income guidance, which is a non-GAAP measure, excludes unrealized gains and losses on financial instruments, net foreign currency remeasurement gains and losses, change in fair value of contingent consideration, acquisition related intangible amortization, other acquisition and divestiture related items, gain/loss on sale of subsidiary, stock-based compensation, other costs, impairment charges, debt restructuring and debt issuance cost amortization, non-cash adjustments related to tax receivable agreement, similar adjustments attributable to our non-controlling interests and certain tax related items. We are unable to reconcile our adjusted net income guidance to the comparable GAAP measure without unreasonable effort because of the difficulty in predicting the amounts to be adjusted, including but not limited to, foreign currency exchange rates, unrealized gains and losses on financial instruments, acquisition and divestiture related items and adjustments to the redemption value of a non-controlling interest, which may have a significant impact on our financial results.

Appendix

Travel and Corporate Solutions Segment Actual Pro Forma YTD Q3 2021 YTD Q3 2021 Purchase volume $ 27,643,249 $ 27,643,249 Net interchange rate 0.74 % 0.55 % Revenue $ 243,406 $ 191,232 Operating expenses $ 188,177 $ 136,003 Adjusted operating income $ 55,229 $ 55,229 Adjusted operating income margin 22.7 % 28.9 % Pro Forma Impacts of Amended Contract on Travel and Corporate Solutions Segment Accounting presentation will change from gross revenue recognition to net, with a corresponding change in sales and marketing costsThere is no material impact on earnings from this changeSeveral of the segment metrics will change going forward For Q4 2020, this would have resulted in a reduction in both revenue and sales costs of approximately $15M

WEX Non-GAAP Reconciliation Three Months Ended September 30, 2021 2020 In thousands except per diluted share data per diluted share per diluted share Net income (loss) attributable to shareholders $ 48,318 $ 1.07 $ (65,840 ) $ (1.49 ) Unrealized gain on financial instruments (6,424 ) (0.14 ) (3,774 ) (0.09 ) Net foreign currency remeasurement loss 9,962 0.22 784 0.02 Change in fair value of contingent consideration (2,800 ) (0.06 ) — — Acquisition–related intangible amortization 46,965 1.04 42,831 0.97 Other acquisition and divestiture related items 3,395 0.07 20,328 0.46 Loss on sale of subsidiary — — 46,362 1.05 Stock–based compensation 22,166 0.49 18,170 0.41 Other costs 1,711 0.04 1,045 0.02 Debt restructuring and debt issuance cost amortization 2,879 0.06 5,329 0.12 ANI adjustments attributable to non–controlling interests 2,848 0.06 6,233 0.14 Tax related items (17,904 ) (0.40 ) (614 ) (0.01 ) Dilutive impact of stock awards1 — — — (0.01 ) Adjusted net income attributable to shareholders $ 111,116 $ 2.45 $ 70,854 $ 1.59 1 As the Company reported a net loss for the three months ended September 30, 2020 under U.S. Generally Accepted Accounting Principles ("GAAP"), the diluted weighted average shares outstanding equals the basic weighted average shares outstanding for those periods. The non-GAAP adjustments described above resulted in adjusted net income attributable to shareholders (versus a loss on a GAAP basis) for the three months ended September 30, 2020. Therefore, dilutive common stock equivalents have been included in the calculation of adjusted diluted weighted average shares outstanding to arrive at adjusted per share data.

WEX Non-GAAP Reconciliation Reconciliation of GAAP Operating Income to Total Segment Adjusted Operating Income and Adjusted Operating Income Three months ended September 30, Three months ended In thousands 2021 2020 June 30, 2021 Operating income $ 100,822 $ 1,845 $ 82,278 Unallocated corporate expenses 20,977 14,817 17,174 Acquisition-related intangible amortization 46,965 42,831 45,294 Other acquisition and divestiture related items 7,012 15,430 10,690 Loss on sale of subsidiary — 46,362 — Stock-based compensation 22,166 18,170 21,662 Other costs 1,711 1,045 1,705 Debt restructuring costs 120 (240 ) 5,299 Total Segment adjusted operating income $ 199,773 $ 140,260 $ 184,102 Unallocated corporate expenses (20,977 ) (14,817 ) (17,174 ) Adjusted operating income $ 178,796 $ 125,443 $ 166,928

WEX Non-GAAP Reconciliation The Company's non-GAAP adjusted net income excludes unrealized gains and losses on financial instruments, net foreign currency gains and losses, changes in fair value of contingent consideration, acquisition-related intangible amortization, other acquisition and divestiture related items, loss on sale of subsidiary, stock-based compensation, other costs, debt restructuring and debt issuance cost amortization, adjustments attributable to our non-controlling interests and certain tax related items. The Company's non-GAAP adjusted operating income excludes acquisition-related intangible amortization, other acquisition and divestiture related items, loss on sale of subsidiary, stock-based compensation, other costs, and debt restructuring costs. Total segment adjusted operating income incorporates these same adjustments and further excludes unallocated corporate expenses.Although adjusted net income, adjusted operating income and total segment adjusted operating income are not calculated in accordance with GAAP, these non-GAAP measures are integral to the Company's reporting and planning processes and the chief operating decision maker of the Company uses segment adjusted operating income to allocate resources among our operating segments. The Company considers these measures integral because they exclude the above specified items that the Company's management excludes in evaluating the Company's performance. Specifically, in addition to evaluating the Company's performance on a GAAP basis, management evaluates the Company's performance on a basis that excludes the above items because: Exclusion of the non-cash, mark-to-market adjustments on financial instruments, including interest rate swap agreements and investment securities, helps management identify and assess trends in the Company's underlying business that might otherwise be obscured due to quarterly non-cash earnings fluctuations associated with these financial instruments. Additionally, the non-cash mark-to-market adjustments on financial instruments are difficult to forecast accurately, making comparisons across historical and future quarters difficult to evaluate.Net foreign currency gains and losses primarily result from the remeasurement to functional currency of cash, accounts receivable and accounts payable balances, certain intercompany notes denominated in foreign currencies and any gain or loss on foreign currency hedges relating to these items. The exclusion of these items helps management compare changes in operating results between periods that might otherwise be obscured due to currency fluctuations. The change in fair value of contingent consideration, which is related to the acquisition of certain contractual rights to serve as custodian or sub-custodian to health savings accounts, is dependent upon changes in future interest rate assumptions and has no significant impact on the ongoing operations of the Company. Additionally, the non-cash, mark-to-market adjustments are difficult to forecast accurately, making comparisons across historical and future quarters difficult to evaluate.The Company considers certain acquisition-related costs, including investment banking fees, warranty and indemnity insurance, certain integration related expenses and amortization of acquired intangibles, as well as gains and losses from divestitures, to be unpredictable, dependent on factors that may be outside of our control and unrelated to the continuing operations of the acquired or divested business or the Company. In addition, the size and complexity of an acquisition, which often drives the magnitude of acquisition-related costs, may not be indicative of such future costs. The Company believes that excluding acquisition-related costs and gains or losses on divestitures facilitates the comparison of our financial results to the Company's historical operating results and to other companies in our industry. The loss on sale of subsidiary relates to the divestiture of the Company’s former Brazilian subsidiary as of the date of sale, September 30, 2020, and the associated write-off of its assets and liabilities. As previously discussed, gains and losses from divestitures are considered by the Company to be unpredictable and dependent on factors that may be outside of our control. The exclusion of these gains and losses are consistent with the Company’s practice of excluding other non-recurring items associated with strategic transactions. Stock-based compensation is different from other forms of compensation as it is a non-cash expense. For example, a cash salary generally has a fixed and unvarying cash cost. In contrast, the expense associated with an equity-based award is generally unrelated to the amount of cash ultimately received by the employee, and the cost to the Company is based on a stock-based compensation valuation methodology and underlying assumptions that may vary over time.We exclude certain other costs when evaluating our continuing business performance when such items are not consistently occurring and do not reflect expected future operating expense, nor provide insight into the fundamentals of current or past operations of our business. These include costs related to certain identified initiatives (including technology initiatives) to further streamline the business, improve the Company's efficiency, create synergies, and globalize the Company's operations, all with an objective to improve scale and efficiency and increase profitability going forward. For the nine months ended September 30, 2021, other costs additionally include a penalty of $10.3 million incurred on termination of a vendor contract. For the three and nine months ended September 30, 2020, other costs include certain costs incurred in association with COVID-19, including the cost of providing additional health, welfare and technological support to our employees as they work remotely.Debt restructuring and debt issuance cost amortization are unrelated to the continuing operations of the Company. Debt restructuring costs do not reflect expected future operating expense, nor do they provide insight into the fundamentals of current or past operations of our business. In addition, since debt issuance cost amortization is dependent upon the financing method, which can vary widely company to company, we believe that excluding these costs helps to facilitate comparison to historical results as well as to other companies within our industry.The adjustments attributable to non-controlling interests, including adjustments to the redemption value of a non-controlling interest, have no significant impact on the ongoing operations of the business. The tax related items are the difference between the Company’s U.S. GAAP tax provision and a pro forma tax provision based upon the Company’s adjusted net income before taxes as well as the impact from certain discrete tax items. The methodology utilized for calculating the Company’s adjusted net income tax provision is the same methodology utilized in calculating the Company’s U.S. GAAP tax provision. The Company does not allocate certain corporate expenses to our operating segments, as these items are centrally controlled and are not directly attributable to any reportable segment. For the same reasons, WEX believes that adjusted net income, adjusted operating income and total segment adjusted operating income may also be useful to investors when evaluating the Company's performance. However, because adjusted net income, adjusted operating income and total segment adjusted operating income are non-GAAP measures, they should not be considered as a substitute for, or superior to, net income, operating income or cash flows from operating activities as determined in accordance with GAAP. In addition, adjusted net income, adjusted operating income and total Segment adjusted operating income as used by WEX may not be comparable to similarly titled measures employed by other companies.