UNITED STATES
SECURITIES AND EXCHANGE COMMISSION
Washington, D.C. 20549
FORM 10-Q
(Mark One)
| ý | QUARTERLY REPORT PURSUANT TO SECTION 13 OR 15(d) OF THE SECURITIES EXCHANGE ACT OF 1934 |
For the quarterly period ended March 31, 2018
OR
| o | TRANSITION REPORT PURSUANT TO SECTION 13 OR 15(d) OF THE SECURITIES EXCHANGE ACT OF 1934 |
For the transition period from ________ to
Commission file number: 001-37563
KLONDEX MINES LTD.
(Exact name of registrant as specified in its charter)
| British Columbia | 98-1153397 | |
(State or other jurisdiction of incorporation or organization) | (IRS Employer Identification No.) | |
| 6110 Plumas Street, Suite A Reno, Nevada | 89519 | |
| (Address of principal executive offices) | (Zip Code) | |
(775) 284-5757
(Registrant’s telephone number, including area code)
N/A
(Former name, former address and former fiscal year, if changed since last report)
Indicate by check mark whether the registrant (1) has filed all reports required to be filed by Section 13 or 15(d) of the Securities Exchange Act of 1934 during the preceding 12 months (or for such shorter period that the registrant was required to file such reports), and (2) has been subject to such filing requirements for the past 90 days. Yes ý No o
Indicate by check mark whether the registrant has submitted electronically and posted on its corporate Web site, if any, every Interactive Data File required to be submitted and posted pursuant to Rule 405 of Regulation S-T (§232.405 of this chapter) during the preceding 12 months (or for such shorter period that the registrant was required to submit and post such files). Yes ý No o
Indicate by check mark whether the registrant is a large accelerated filer, an accelerated filer, a non-accelerated filer, a smaller reporting company or an emerging growth company. See the definitions of “large accelerated filer,” “accelerated filer,” “smaller reporting company” and emerging growth company" in Rule 12b-2 of the Exchange Act.
| Large accelerated filer | o | Accelerated filer | ý | |||
| Non-accelerated filer | o (Do not check if a smaller reporting company) | Smaller reporting company | o | |||
| Emerging growth company | ý | |||||
If an emerging growth company, indicate by check mark if the registrant has elected not to use the extended transition period for complying with any new or revised financial accounting standards provided pursuant to Section 13(a) of the Exchange Act. o
Indicate by check mark whether the registrant is a shell company (as defined in Rule 12b-2 of the Exchange Act). Yes o No ý
Indicate the number of shares outstanding of each of the issuer's classes of common stock, as of the latest practicable date.
On April 27, 2018, there were 179,668,072 common shares of the registrant, with no par value per share, outstanding.
KLONDEX MINES LTD.
FORM 10-Q
For the Quarter Ended March 31, 2018
INDEX
| Page | ||||
Cautionary statement regarding forward-looking statements
This Quarterly Report on Form 10-Q contains forward-looking information within the meaning of Canadian securities laws and forward-looking statements within the meaning of United States securities laws (collectively, "forward-looking statements") and are intended to be covered by the safe harbors provided by such regulations. Any statements that express or involve discussions with respect to predictions, expectations, beliefs, plans, projections, objectives, assumptions or future events or performance (often, but not always, identified by words or phrases such as “expects”, “is expected”, “anticipates”, “believes”, “plans”, “projects”, “estimates”, “assumes”, “intends”, “strategy”, “goals”, “objectives”, “potential”, “possible” or variations thereof or stating that certain actions, events, conditions or results “may”, “could”, “would”, “should”, “might” or “will” be taken, occur or be achieved, or the negative of any of these terms and similar expressions) are not statements of historical fact and may be forward-looking statements. Our forward-looking statements may include, without limitation, statements with respect to:
| • | estimates of future mineral production, mining activities and sales (including graphs or other visual representations of future production forecasts); |
| • | estimates of future production costs and other expenses for specific operations and on a consolidated basis; |
| • | estimates of future capital expenditures, construction or production activities and other cash needs, for specific operations and on a consolidated basis, and expectations as to the funding or timing thereof; |
| • | estimates as to the projected development of certain mineral projects, including the timing of such development, the costs of such development and other capital costs, financing plans for these deposits and expected production commencement dates; |
| • | estimates of mineral reserves and mineral resources, timing of updated studies and statements regarding future exploration; |
| • | statements regarding the availability of, and, terms and costs related to, future borrowing and financing; |
| • | estimates regarding future exploration expenditures, results and reserves and resources; |
| • | estimates regarding potential cost savings, productivity and operating performance; |
| • | expectations regarding the start-up time, ramp up time or ability to put a mine into production; |
| • | expectations regarding the design, mine life, mill availability, production and costs applicable to sales and exploration potential of our mines and projects; |
| • | recovery rate estimates; |
| • | statements regarding future transactions, including transactions contemplated under our arrangement agreement with Hecla Mining Company; and |
| • | statements regarding the impacts of changes in the legal and regulatory environment in which we operate. |
Forward-looking statements have been based upon our current business and operating plans, as approved by our Board of Directors; our cash and other funding requirements and timing and sources thereof; results of pre-feasibility and technical reports; mineral resource and reserve estimates; exploration activities; any required permitting processes; and current market conditions and project development plans. Forward-looking statements are subject to a variety of known and unknown risks, uncertainties and other factors that could cause actual events or results to differ from those reflected in the forward-looking statements, including, without limitation:
| • | the prices of gold, silver, and other metals and commodities; |
| • | the cost of operations; |
| • | capital expenditures; |
| • | currency fluctuations; |
| • | inflation or deflation; |
| • | geological and metallurgical assumptions; |
| • | risks and uncertainties relating to the interpretation of drill results, the geology, grade and continuity of our mineral deposits; |
| • | operating performance of equipment, processes and facilities; including the impact of weather on such operating performance; |
| • | timing of receipt of necessary governmental permits or approvals; |
| • | domestic and foreign laws or regulations, particularly relating to the environment, mining and processing; |
| • | changes in tax laws; |
| • | domestic and international economic and political conditions; |
| • | external stakeholders; |
| • | our ability to obtain or maintain necessary financing; |
| • | other risks and hazards associated with mining operations; |
i
| • | uncertainty of estimates of capital costs, operating costs, production and economic returns; |
| • | uncertainty related to inferred mineral resources; |
| • | labor relations and our need and/or ability to attract and retain qualified management and technical personnel; |
| • | failure to obtain the required shareholder approval or regulatory clearance for our proposed transaction with Hecla Mining Company; |
| • | the occurrence of any other event that could give rise to the termination of our proposed transaction with Hecla Mining Company; and |
| • | increased regulatory compliance costs relating to the Dodd-Frank Wall Street Reform and Consumer Protection Act. |
The foregoing list is not exhaustive of the factors that may affect any of our forward-looking statements. Forward-looking statements are statements about the future and are inherently uncertain, and our actual achievements or other future events or conditions may differ materially from those reflected in the forward-looking statements due to a variety of risks, uncertainties and other factors, including, without limitation, those referred to in this Quarterly Report on Form 10-Q and in our Annual Report on Form 10-K for fiscal year ended December 31, 2017.
Our forward-looking statements contained in this Quarterly Report on Form 10-Q are based on the beliefs, expectations and opinions of management as of the date of this report. We do not assume any obligation to update our forward-looking statements if circumstances or management’s beliefs, expectations or opinions should change, except as required by law. For the reasons set forth above, investors should not place undue reliance on forward-looking statements in this Quarterly Report on Form 10-Q.
Cautionary note to U.S. investors regarding estimates of measured, indicated and inferred resources and proven and probable reserves
As used in this Quarterly Report on Form 10-Q, the terms “mineral reserve”, “proven mineral reserve” and “probable mineral reserve” are Canadian mining terms as defined in accordance with Canadian National Instrument 43-101-Standards of Disclosure for Mineral Projects (“NI 43-101”) and the Canadian Institute of Mining, Metallurgy and Petroleum (CIM)-CIM Definition Standards on Mineral Resources and Mineral Reserves, adopted by the CIM Council, as amended (“CIM Definition Standards”).
These definitions differ from the definitions in the U.S. Securities and Exchange Commission's ("SEC") Industry Guide 7 (“SEC Industry Guide 7”) under the U.S. Securities Exchange Act of 1934 (the "Exchange Act"). However, despite the differences in the definition between NI 43-101 and SEC Industry Guide 7, the proven and probable reserves reported herein for Fire Creek, Midas, Hollister and True North are equivalent to those that would have been reported had they been prepared under SEC Industry Guide 7 standards.
The terms “mineral resource”, “measured mineral resource”, “indicated mineral resource” and “inferred mineral resource” are defined in, and required to be disclosed by NI 43-101; however, these terms are not defined terms under SEC Industry Guide 7 and are normally not permitted to be used in reports and registration statements filed with the SEC. Investors are cautioned not to assume that all or any part of a mineral deposit in these categories will ever be converted into reserves. “Inferred mineral resources” have a lower level of confidence than an "indicated mineral resource" and must not be converted to a mineral "reserve". The quantity and grade of reported "Inferred Resources" in this estimation are uncertain in nature and there has been insufficient exploration to define these "Inferred Resources" as an "Indicated or Measured" Mineral Resource and it is uncertain if further exploration will result in upgrading them to an "Indicated or Measured" Mineral Resource category. Under Canadian rules, estimates of inferred mineral resources may not form the basis of feasibility or pre-feasibility studies, except in rare cases.
Disclosure of “contained ounces” in a resource is permitted disclosure under Canadian regulations; however, the SEC normally only permits issuers to report in place tonnage and grade without reference to unit measures for mineralization that does not constitute “reserves” by SEC standards. Accordingly, information contained in this report and the documents incorporated by reference herein contain descriptions of our mineral deposits that may not be comparable to similar information made public by U.S. companies subject to the reporting and disclosure requirements under the United States federal securities laws and the rules and regulations thereunder.
The term “mineralized material” as used in this Quarterly Report on Form 10-Q, although permissible under SEC Industry Guide 7, does not indicate “reserves” by SEC Industry Guide 7 standards. We cannot be certain that any part of the mineralized material will ever be confirmed or converted into SEC Industry Guide 7 compliant “reserves”. Investors are cautioned not to assume that all or any part of the mineralized material will ever be confirmed or converted into reserves or that mineralized material can be economically or legally extracted.
Brian Morris, our Senior Vice President, Exploration (who is a "qualified person" for purposes of NI 43-101), has approved the disclosure of all the scientific and technical information contained in this Quarterly Report on Form 10-Q.
ii
Table of Contents
PART I - FINANCIAL INFORMATION Item 1. Financial Statements |
KLONDEX MINES LTD. CONDENSED CONSOLIDATED BALANCE SHEETS (Unaudited) (US dollars in thousands) |
| Note | March 31, 2018 | December 31, 2017 | ||||||||
| Assets | ||||||||||
| Current assets | ||||||||||
| Cash and cash equivalents | $ | 27,814 | $ | 23,674 | ||||||
| Inventories | 3 | 37,739 | 42,583 | |||||||
| Prepaid expenses and other | 4 | 4,440 | 7,580 | |||||||
| Derivative assets | 9 | 17 | 17 | |||||||
| Total current assets | 70,010 | 73,854 | ||||||||
| Mineral properties, plant and equipment, net | 5 | 276,040 | 289,450 | |||||||
| Restricted cash | 9,504 | 9,555 | ||||||||
| Deferred tax assets | 18,696 | 18,696 | ||||||||
| Total assets | $ | 374,250 | $ | 391,555 | ||||||
| Liabilities | ||||||||||
| Current liabilities | ||||||||||
| Accounts payable | $ | 23,081 | $ | 28,302 | ||||||
| Accrued compensation and benefits | 3,343 | 4,296 | ||||||||
| Derivative liabilities | 9 | 735 | 170 | |||||||
| Debt | 6 | 873 | 902 | |||||||
| Income taxes payable | 3,203 | 2,833 | ||||||||
| Total current liabilities | 31,235 | 36,503 | ||||||||
| Debt | 6 | 35,717 | 35,405 | |||||||
| Deferred share units liability | 8 | 847 | 945 | |||||||
| Asset retirement obligations | 7 | 21,389 | 21,108 | |||||||
| Deferred tax liabilities | 17,030 | 17,565 | ||||||||
| Total liabilities | 106,218 | 111,526 | ||||||||
| Shareholders' Equity | ||||||||||
| Unlimited common shares authorized, no par value; 179,660,245 and 179,614,947 issued and outstanding at March 31, 2018 and December 31, 2017, respectively | — | — | ||||||||
| Additional paid-in capital | 378,435 | 377,714 | ||||||||
| Accumulated deficit | (89,942 | ) | (81,944 | ) | ||||||
| Accumulated other comprehensive loss | (20,461 | ) | (15,741 | ) | ||||||
| Total shareholders' equity | 268,032 | 280,029 | ||||||||
| Total liabilities and shareholders' equity | $ | 374,250 | $ | 391,555 | ||||||
The accompanying notes are an integral part of the condensed consolidated financial statements.
1
Table of Contents
KLONDEX MINES LTD. CONDENSED CONSOLIDATED STATEMENTS OF INCOME (LOSS) (Unaudited) (US dollars in thousands, except per share amounts) |
| Three months ended March 31, | ||||||||||
| Note | 2018 | 2017 | ||||||||
| Revenues | $ | 56,771 | $ | 41,710 | ||||||
| Cost of sales | ||||||||||
| Production costs | 35,449 | 26,229 | ||||||||
| Depreciation and depletion | 13,103 | 7,728 | ||||||||
| Write-down of production inventories | 3 | 8,517 | 3,680 | |||||||
| (298 | ) | 4,073 | ||||||||
| Other operating expenses | ||||||||||
| General and administrative | 5,824 | 4,488 | ||||||||
| Exploration | 502 | 127 | ||||||||
| Development and projects costs | — | 5,505 | ||||||||
| Asset retirement and accretion | 334 | 381 | ||||||||
| Arrangement agreement costs | 3,616 | — | ||||||||
| Loss on equipment disposal | 20 | 116 | ||||||||
| (Loss) income from operations | (10,594 | ) | (6,544 | ) | ||||||
| Other income (expense) | ||||||||||
| (Loss) gain on derivatives, net | (128 | ) | (2,144 | ) | ||||||
| Interest expense, net | (599 | ) | (1,158 | ) | ||||||
| Foreign currency (loss) gain, net | 3,185 | (1,021 | ) | |||||||
| Interest income and other (expense), net | 6 | 17 | ||||||||
| Income (loss) before tax | (8,130 | ) | (10,850 | ) | ||||||
| Income tax benefit (expense) | 13 | 132 | 623 | |||||||
| Net (loss) income | $ | (7,998 | ) | $ | (10,227 | ) | ||||
| Net (loss) income per share | ||||||||||
| Basic | 14 | $ | (0.04 | ) | $ | (0.06 | ) | |||
| Diluted | 14 | $ | (0.04 | ) | $ | (0.06 | ) | |||
The accompanying notes are an integral part of the condensed consolidated financial statements.
2
Table of Contents
KLONDEX MINES LTD. CONDENSED CONSOLIDATED STATEMENTS OF COMPREHENSIVE INCOME (LOSS) (Unaudited) (US dollars in thousands) |
| Three months ended March 31, | ||||||||
| 2018 | 2017 | |||||||
| Net (loss) income | $ | (7,998 | ) | $ | (10,227 | ) | ||
| Other comprehensive income (loss), net of tax | ||||||||
| Foreign currency translation adjustments, net of tax benefit (expense) of $1,658 and ($495) for the three months ended March 31, 2018 and 2017, respectively. | (4,720 | ) | 1,410 | |||||
| Comprehensive income (loss) | $ | (12,718 | ) | $ | (8,817 | ) | ||
The accompanying notes are an integral part of the condensed consolidated financial statements.
3
Table of Contents
KLONDEX MINES LTD. CONDENSED CONSOLIDATED STATEMENTS OF CASH FLOWS (Unaudited) (US dollars in thousands) |
| Three months ended March 31, | ||||||||||
| Note | 2018 | 2017 | ||||||||
| Operating activities | ||||||||||
| Net (loss) income | $ | (7,998 | ) | $ | (10,227 | ) | ||||
| Significant items not involving cash | ||||||||||
| Depreciation and depletion | 13,103 | 7,890 | ||||||||
| Asset retirement and accretion | 334 | 381 | ||||||||
| Derivative fair value adjustments | 572 | 1,052 | ||||||||
| Write-down of production inventories | 3 | 1,883 | 1,446 | |||||||
| Foreign exchange, net | (2,405 | ) | 899 | |||||||
| Deferred tax expense (benefit) | (535 | ) | 240 | |||||||
| Share-based compensation | 12 | 713 | 716 | |||||||
Deliveries under Gold Purchase Agreement(1) | — | (1,860 | ) | |||||||
| Loss on equipment disposal | 20 | 116 | ||||||||
| Deferred share unit expense | 8 | (72 | ) | (91 | ) | |||||
| Non-cash interest expense | (82 | ) | 153 | |||||||
| 5,533 | 715 | |||||||||
| Changes in non-cash working capital | ||||||||||
| Inventories | 4,491 | (6,414 | ) | |||||||
| Prepaid expenses and other | 3,113 | (1,148 | ) | |||||||
| Accounts payable | (4,556 | ) | 3,339 | |||||||
| Accrued compensation and benefits | (941 | ) | (219 | ) | ||||||
| Income taxes payable | 370 | 633 | ||||||||
| Net cash provided by (used in ) operating activities | 8,010 | (3,094 | ) | |||||||
| Investing activities | ||||||||||
| Expenditures on mineral properties, plant and equipment | (2,810 | ) | (17,008 | ) | ||||||
| Change in accounts payable related to expenditures on mineral properties, plant and equipment | (461 | ) | (919 | ) | ||||||
| Net cash used in investing activities | (3,271 | ) | (17,927 | ) | ||||||
| Financing activities | ||||||||||
| Cash transactions related to share-based compensation | 8 | 1,528 | ||||||||
| Cash received from warrant exercises | — | 1,681 | ||||||||
| Repayment of capital lease obligations | (276 | ) | (112 | ) | ||||||
| Payment of debt issuance costs | (239 | ) | (217 | ) | ||||||
| Net cash (used in) provided by financing activities | (507 | ) | 2,880 | |||||||
| Effect of foreign exchange on cash balances | (143 | ) | 59 | |||||||
| Net increase (decrease) in cash, cash equivalents and restricted cash | 4,089 | (18,082 | ) | |||||||
| Cash, cash equivalents and restricted cash, beginning of period | 33,229 | 57,691 | ||||||||
| Cash, cash equivalents and restricted cash, end of period | $ | 37,318 | $ | 39,609 | ||||||
(1) Represents Revenue less Interest Expense attributable to the Gold Purchase Agreement (as defined herein). | ||||||||||
The accompanying notes are an integral part of the condensed consolidated financial statements.
4
Table of Contents
KLONDEX MINES LTD. CONDENSED CONSOLIDATED STATEMENTS OF SHAREHOLDERS' EQUITY (Unaudited) (US dollars in thousands, except shares) |
| Note | Common shares | Additional paid-in capital | Accumulated deficit | Accumulated other comprehensive loss | Total | ||||||||||||||||
| Balance at December 31, 2017 | 179,614,947 | $ | 377,714 | $ | (81,944 | ) | $ | (15,741 | ) | $ | 280,029 | ||||||||||
| Share-based compensation expense | 12 | — | 713 | — | — | 713 | |||||||||||||||
| Option exercises | 6,667 | 14 | — | — | 14 | ||||||||||||||||
| Restricted share unit vestings, net of shares withheld to satisfy tax withholding | 38,631 | (6 | ) | — | — | (6 | ) | ||||||||||||||
| Net loss | — | — | (7,998 | ) | — | (7,998 | ) | ||||||||||||||
| Foreign currency translation adjustments | — | — | — | (4,720 | ) | (4,720 | ) | ||||||||||||||
| Balance at March 31, 2018 | 179,660,245 | $ | 378,435 | $ | (89,942 | ) | $ | (20,461 | ) | $ | 268,032 | ||||||||||
The accompanying notes are an integral part of the condensed consolidated financial statements.
5
Klondex Mines Ltd.
Notes to Condensed Consolidated Financial Statements (Unaudited)
1. Basis of presentation
The accompanying unaudited Condensed Consolidated Financial Statements of Klondex Mines Ltd. and its wholly-owned subsidiaries (the "Company") have been prepared in accordance with United States generally accepted accounting principles ("GAAP") and applicable rules and regulations of the Securities and Exchange Commission ("SEC"). Certain information and note disclosures normally included in financial statements prepared in accordance with GAAP have been condensed or omitted pursuant to such rules and regulations of the SEC. Therefore, the information included in this Quarterly Report on Form 10-Q should be read in conjunction with the audited Consolidated Financial Statements and related note disclosures of the Company's Annual Report on Form 10-K for the year ended December 31, 2017. In the opinion of management, all adjustments and disclosures necessary to fairly present the interim financial information set forth herein have been included. These interim financial statements, with the exception of any recently adopted accounting pronouncements described in Note 2. Recent accounting pronouncements, follow the same significant accounting policies disclosed in the Company's most recent Annual Report on Form 10-K.
The results reported in these Condensed Consolidated Financial Statements are not necessarily indicative of the results that may be expected for the entire year or for future years.
All amounts are expressed and presented in thousands of United States dollars (unless otherwise noted) and references to "CDN$" refer to Canadian dollars.
2. Recent accounting pronouncements
Recently adopted
Effective January 1, 2018, the Company adopted ASU No. 2014-09, “Revenue from Contracts with Customers” and the applicable related accounting standard updates that followed (collectively referred to as “Topic 606”). The Company adopted Topic 606 using the modified retrospective method, which required it to apply the new revenue standard to (i) all new revenue contracts entered into after January 1, 2018, and (ii) revenue contracts which were not completed as of January 1, 2018. In accordance with this approach, the consolidated revenues for periods prior to January 1, 2018 were not revised and there was no cumulative effect of the adoption of Topic 606 as of January 1, 2018.
The Company’s current revenue recognition policy is consistent with Topic 606 which requires that revenue from contracts with customers be recognized when the performance condition to transfer a distinct good is satisfied. The recognition of revenue upon completion of the Company’s performance condition is generally satisfied when title transfers to the customer. As a result, the adoption of Topic 606 did not have an impact on the Company’s financial statements.
In August 2016, the FASB issued ASU No. 2016-15, "Statement of Cash Flows - Classification of Certain Cash Receipts and Cash Payments." ASU No. 2016-15 addresses eight specific cash flow issues with the objective of reducing the diversity in practice in how certain cash receipts and cash payments are presented and classified in the statement of cash flows. ASU No. 2016-15 is effective for fiscal years, and interim periods within those fiscal years, beginning after December 15, 2017, which for the Company meant the first quarter of the year ending December 31, 2018. The Company has adopted ASU 2016-15, which did not have a material impact on its financial statements.
In November 2016, the FASB issued ASU No. 2016-18, "Statement of Cash Flows - Restricted Cash." ASU No. 2016-18 requires that restricted cash or restricted cash equivalents be included with cash and cash equivalents when reconciling the beginning-of-period and end-of-period total amounts shown on the statements of cash flows. ASU No. 2016-18 is effective for fiscal years, and interim periods within those fiscal years, beginning after December 15, 2017, which for the Company meant the first quarter of the year ending December 31, 2018. The Company has adopted ASU 2016-18, which resulted in the inclusion of restricted cash in its beginning-of-period and end-of-period cash and cash equivalents amounts shown on the statements of cash flows. See Note 16. Supplemental cash flow information for additional detail.
In January 2017, the FASB issued ASU No. 2017-01, "Business Combinations." ASU No. 2017-01 clarifies the definition of a business and adds guidance to assist entities with evaluating whether transactions should be accounted for as acquisitions or disposals of assets or businesses. ASU No. 2017-01 is effective for fiscal years, and interim periods within those fiscal years, beginning after December 15, 2017, which for the Company meant the first quarter of the year ending December 31, 2018. The Company has adopted ASU 2017-01, which did not have a material impact on its financial statements.
In May 2017, the FASB issued ASU No. 2017-09, "Compensation - Stock Compensation." ASU No. 2017-09 provides guidance about which changes to the terms or conditions of a share-based payment award require an entity to apply modification accounting under Topic 718. ASU No. 2017-09 is effective for fiscal years, and interim periods within those fiscal years, beginning after December 15,
6
2017, which for the Company meant the first quarter of the year ending December 31, 2018. The Company has adopted ASU 2017-09, which did not have a material impact on its financial statements.
Recently issued
In February 2016, the FASB issued ASU No. 2016-02, "Leases." ASU No. 2016-02 requires lessees to recognize assets and liabilities on the balance sheet for the rights and obligations resulting from leases. ASU No. 2016-02 is effective for fiscal years beginning after December 15, 2018 and for interim periods within those fiscal years, which for the Company means the first quarter of the year ending December 31, 2019. The Company is currently evaluating the impact that ASU No. 2016-02 will have on its financial statements.
In August 2017, the FASB issued ASU No. 2017-12, "Derivatives and Hedging - Targeted Improvements to Accounting for Hedging Activities." ASU No. 2017-12 provides amendments that aim to simplify the derivative and hedging accounting guidance under Topic 815 and better align the measurement and presentation of qualifying hedging relationships with risk management activities. ASU No. 2017-12 is effective for fiscal years beginning after December 15, 2018 and for interim periods within those fiscal years, which for the Company means the first quarter of the year ending December 31, 2019. The Company is currently evaluating the impact that ASU No. 2017-12 will have on its financial statements.
In February 2018, the FASB issued ASU No. 2018-02, "Income Statement- Reporting Comprehensive Income - Reclassification of Certain Tax Effects from Accumulated Other Comprehensive Income." ASU No. 2018-02 allows a reclassification from accumulated other comprehensive income to retained earnings for stranded tax effects resulting from the Tax Cuts and Jobs Act. ASU No. 2018-02 is effective for fiscal years beginning after December 15, 2018 and for interim periods within those fiscal years, which for the Company means the first quarter of the year ending December 31, 2019. The Company is currently evaluating the impact that ASU No. 2018-02 will have on its financial statements.
3. Inventories
The following table provides the components of Inventories (in thousands):
| March 31, 2018 | December 31, 2017 | |||||||
| Supplies | $ | 8,966 | $ | 9,300 | ||||
| Production related inventories: | ||||||||
| Stockpiles | 16,501 | 18,749 | ||||||
| In-process | 9,980 | 12,516 | ||||||
| Doré finished goods | 2,292 | 2,018 | ||||||
| $ | 37,739 | $ | 42,583 | |||||
As of March 31, 2018 and December 31, 2017, the Company's stockpiles, in-process, and doré finished goods inventories included approximately $7.0 million and $7.2 million, respectively, of capitalized non-cash depreciation and depletion costs.
The period-end market value of the Company's production-related inventories is determined in part by using the period-end prices (per ounces) of gold and silver and is sensitive to these inputs. Write-downs have resulted solely from the Company's application of its lower of average cost or net realizable value accounting policy and were unrelated to any ounce adjustments or changes to recovery rates. Write-downs for the three months ended March 31, 2018 were related to Midas, Hollister and True North (as defined herein).
The following table provides information about the Company's write-downs (in thousands, except per ounce amounts):
| Three months ended March 31, | ||||||||
| Type of previously incurred cost | 2018 | 2017 | ||||||
| Cash production costs | $ | 6,634 | $ | 2,234 | ||||
| Allocated depreciation and depletion | 1,883 | 1,446 | ||||||
| Write-down of production inventories | $ | 8,517 | $ | 3,680 | ||||
The period-end prices used in the write-down calculation for March 31, 2018 were $1,324 and $16.28 per gold and silver ounce, respectively. Further declines from March 31, 2018 metal price levels and/or future production costs greater than the March 31, 2018 carrying value included in Inventories could result in, or contribute to, additional future write-downs of production-related inventories.
7
4. Prepaid expenses and other
The following table provides the components of Prepaid expenses and other (in thousands):
| March 31, 2018 | December 31, 2017 | |||||||
| Prepaid taxes | $ | 2,016 | $ | 3,496 | ||||
| Vendor prepayments | 1,049 | 696 | ||||||
| Prepaid claim maintenance and land holding costs | 505 | 847 | ||||||
| Canadian taxes receivable | 353 | 1,568 | ||||||
| Prepaid insurance | 134 | 178 | ||||||
| Other | 383 | 795 | ||||||
| $ | 4,440 | $ | 7,580 | |||||
5. Mineral properties, plant and equipment, net
The following table provides the components of Mineral properties, plant and equipment, net (in thousands):
| March 31, 2018 | December 31, 2017 | |||||||
| Mineral properties | $ | 170,759 | $ | 171,422 | ||||
| Facilities and equipment | 120,971 | 120,727 | ||||||
| Mine development | 114,843 | 112,887 | ||||||
| Land | 3,862 | 3,887 | ||||||
| Construction in progress | 1,528 | 1,956 | ||||||
| 411,963 | 410,879 | |||||||
| Less: accumulated depreciation and depletion | (135,923 | ) | (121,429 | ) | ||||
| $ | 276,040 | $ | 289,450 | |||||
Facilities and equipment included $3.7 million and $3.1 million at March 31, 2018 and December 31, 2017, respectively, for the gross amount of mobile mine equipment acquired under capital lease obligations. Accumulated depreciation on such mobile mine equipment totaled $1.4 million and $1.1 million at March 31, 2018 and December 31, 2017, respectively.
At March 31, 2018, construction in progress of $1.5 million was related to facilities and equipment.
8
6. Debt
The following table summarizes the components of Debt (in thousands):
| March 31, 2018 | December 31, 2017 | |||||||
| Debt, current: | ||||||||
| Capital lease obligations | $ | 873 | $ | 902 | ||||
| $ | 873 | $ | 902 | |||||
| Debt, non-current: | ||||||||
Revolver(1) | $ | 34,162 | $ | 34,173 | ||||
| Capital lease obligations | 1,555 | 1,232 | ||||||
| $ | 35,717 | $ | 35,405 | |||||
(1) Net of unamortized issuance costs of $0.8 million. | ||||||||
The following table summarizes the components of Interest expense, net (in thousands):
| Three months ended March 31, | ||||||||
| 2018 | 2017 | |||||||
| Gold Purchase Agreement | $ | — | $ | 783 | ||||
| Revolver interest and stand-by fees | 537 | 334 | ||||||
| Capital lease obligations | 28 | 9 | ||||||
| Other | 34 | 32 | ||||||
| $ | 599 | $ | 1,158 | |||||
Revolver
On March 23, 2016, the Company, as borrower, and Investec Bank PLC ("Investec"), as lender and security agent, entered into a $25.0 million secured revolving facility agreement (the "Revolver"). The Revolver was amended on October 27, 2016 to increase the borrowing capacity by $10.0 million to $35.0 million. During the year ended December 31, 2016, the Company drew $12.0 million from the Revolver to retire the Promissory Note (as defined herein) related to the acquisition of True North (as defined herein). Borrowings under the Revolver bear interest per annum at LIBOR plus margin plus risk premium, as such terms are defined in the Revolver. Margin is determined by the Company's gearing ratio (a measure of debt to EBITDA) and ranges from 2.75%-4.00% per annum. Revolver borrowings may be utilized by the Company for working capital requirements, general corporate purposes, and capital investments and expenditures.
On March 31, 2017, pursuant to an amendment, the Revolver's maturity date was extended from March 23, 2018 to December 31, 2019, unless otherwise extended by the parties, and the reserves and resources required to be maintained by the Company under the Revolver were amended. The Revolver is secured by all of the Company's assets.
On December 21, 2017, the Revolver was amended to increase the borrowing capacity by $5.0 million to $40.0 million. During the year ended December 31, 2017, the Company drew $23.0 million from the Revolver, of which approximately $10.0 million was utilized to purchase gold in order to completely fulfill the Gold Purchase Agreement.
On February 13, 2018, the Revolver was amended to increase the borrowing capacity by $5.0 million from December 31, 2017 borrowing capacity. This increase relates to an inventory draw, subject to certain adjustments, which added to the aggregate amount available to the Company under the Revolver, thereby increasing the borrowing capacity from $40.0 million to $45.0 million. This amendment expired on April 16, 2018. The total borrowing capacity of the Revolver remains at $40.0 million.
Capital lease obligations
The Company's capital lease obligations are for the purchase of mobile mine equipment and passenger vehicles, bear interest at approximately 4.0% per annum, and carry 36 or 48-month terms. The Company's capital lease obligations are secured by the underlying assets financed.
9
Debt covenants
The Company's debt agreements contain certain representations and warranties, restrictions, events of default, and covenants that are customary for agreements of these types. Additionally, the Revolver contains financial covenants which require the Company to maintain a Tangible Net Worth not less than $100.0 million, a Gearing Ratio (a measure of debt to EBITDA) not greater than 4.00:1, a Cash Balance not less than $10.0 million, and a Current Ratio not less than 1.10:1 (as such terms are defined in the Revolver). The Company was in compliance with all debt covenants as of March 31, 2018 and December 31, 2017.
7. Asset retirement obligations
The Company’s asset retirement obligations are related to its mining operations, projects, and exploration activities. The Company's asset retirement obligations are estimated based upon present value techniques of expected cash flows, estimates of inflation, and a credit adjusted risk-free discount rate. The following table provides a summary of changes in the asset retirement obligation (in thousands):
| March 31, 2018 | December 31, 2017 | |||||||
| Balance, beginning of period | $ | 21,108 | $ | 25,436 | ||||
| Changes in estimates | — | (5,945 | ) | |||||
| Accretion expense | 334 | 1,523 | ||||||
| Effect of foreign currency | (53 | ) | 94 | |||||
| Balance, end of period | $ | 21,389 | $ | 21,108 | ||||
As of March 31, 2018, the Company's asset retirement obligations were secured by surety bonds totaling $49.4 million, which were partially collateralized by Restricted cash totaling $9.5 million.
The following table provides a listing of the Company's asset retirement obligations by property (in thousands):
| March 31, 2018 | December 31, 2017 | |||||||
| Midas | $ | 8,529 | $ | 8,401 | ||||
| Hollister | 6,005 | 5,905 | ||||||
| Aurora | 3,807 | 3,752 | ||||||
| Fire Creek | 1,230 | 1,210 | ||||||
| True North | 1,818 | 1,840 | ||||||
| $ | 21,389 | $ | 21,108 | |||||
10
8. Deferred share units liability
In May 2016, the Board of Directors adopted the Deferred Share Unit Plan (the "DSU Plan") to: (1) assist the Company in the recruitment and retention of qualified non-employee directors and (2) further align the interests of directors with shareholders. The DSU Plan is administered by the Compensation and Governance Committee of the Board of Directors of the Company. Under the DSU Plan, non-employee directors may receive a portion of their annual compensation in the form of Deferred Share Units ("DSUs"). The value of a DSU is determined as the weighted average closing price of the Company's common shares on the TSX for the five days preceding such valuation date (the "DSU Value"). DSUs are fully vested at the time of grant and are retained until a director is separated or terminated from the Board of Directors of the Company, at which time the number of DSUs credited to such director's account multiplied by the DSU Value is to be paid out in cash. In the event the Company pays cash dividends, additional DSUs are to be credited to each director's account in an amount equal to the cash value that would have been received by the directors had the DSUs been held as common shares of the Company divided by the DSU Value. DSUs have no voting rights.
The fair value of DSUs granted each year, together with the change in fair value of all outstanding DSUs, is recorded within General and administrative and totaled $(0.1) million and $(0.1) million during the three months ended March 31, 2018 and 2017, respectively.
The following table provides a summary of the Company's outstanding DSUs:
| Three months ended March 31, 2018 | |||
| Outstanding at beginning of period | 360,366 | ||
| Granted | — | ||
| Redeemed | — | ||
| Outstanding at end of period | 360,366 | ||
9. Derivatives
The following table provides a listing of the Company's derivative instruments (in thousands):
| Description | Recorded Within | March 31, 2018 | December 31, 2017 | |||||||
| Forward metal sales | Derivative assets, current | $ | 17 | $ | 17 | |||||
| $ | 17 | $ | 17 | |||||||
| Gold Offering Agreement | Derivative liabilities, current | $ | — | $ | 170 | |||||
| Gold Collar and Forward Priced | Derivative liabilities, current | 735 | — | |||||||
| $ | 735 | $ | 170 | |||||||
The following table lists the net amounts recorded for (Loss) gain on derivatives, net (in thousands):
| Three months ended March 31, | ||||||||
| 2018 | 2017 | |||||||
| Gold Purchase Agreement embedded derivative | — | (1,407 | ) | |||||
| Gold Offering Agreement | 32 | (342 | ) | |||||
Forward metal sales(1) | 583 | (395 | ) | |||||
| Gold Collar and Forward Priced | (743 | ) | — | |||||
| $ | (128 | ) | $ | (2,144 | ) | |||
(1) (Loss) gain on settlement and revaluation of forward metal sales derivative instruments, which was determined by the difference in the fixed forward price received by the Company and the spot price on the applicable delivery date. See Forward Metal Sales discussed below. | ||||||||
Gold Purchase Agreement embedded derivative
The Company's Gold Purchase Agreement was settled during the year ended December 31, 2017. The Gold Purchase Agreement contained an embedded compound derivative for: 1) the prepayment option, which was at the discretion of the Company, and 2) the forward sales component, which was established on the transaction date and incorporated the then current forward gold prices. In addition to recurring fair value adjustments, gains and losses on the Gold Purchase Agreement's embedded derivative related to the difference in the forward gold price received by the Company and the spot price of gold on each delivery date. The following table summarizes information about past gold deliveries under the Gold Purchase Agreement:
11
| Three months ended March 31, | ||||||||
| 2018 | 2017 | |||||||
| Gold ounces | — | 2,000 | ||||||
| Average forward gold price | $ | — | $ | 1,322 | ||||
| Average gold spot price on delivery date | $ | — | $ | 1,238 | ||||
Gold Offering Agreement
In March 2011, the Company entered into a gold offering agreement, as amended in October 2011 (the "Gold Offering Agreement"), which granted the counterparty the right to purchase, on a monthly basis, the refined gold produced from the Fire Creek mine ("Fire Creek") for a five-year period which began in February 2013 and ended in February 2018. When/if the counterparty elected to purchase the refined gold, the purchase price was calculated as the average PM settlement price per gold ounce on the London Bullion Market Association for the 30 trading days immediately preceding the relevant purchase election date. In addition to recurring fair value adjustments, gains and losses on the Gold Offering Agreement related to: 1) the difference in the gold price paid to the Company from the counterparty and the spot price of gold on the applicable delivery date, and 2) losses incurred by the Company to net cash settle any obligations arising from the Gold Offering Agreement. The following table summarizes information about gold purchased under the Gold Offering Agreement:
| Three months ended March 31, | ||||||||
| 2018 | 2017 | |||||||
| Gold ounces purchased by counterparty | — | 22,040 | ||||||
| Average gold price paid to the Company | $ | — | $ | 1,206 | ||||
| Average gold spot price on delivery date | $ | — | $ | 1,250 | ||||
Forward metal sales
In order to increase the certainty of expected future cash flows, from time to time, the Company enters into fixed forward spot trades for a portion of its projected gold and silver sales. These agreements are considered derivative financial instruments. The following table summarizes information about the Company's forward trades entered into during the respective periods:
| Three months ended March 31, | ||||||||
| 2018 | 2017 | |||||||
| Gold ounces covered | 36,073 | 48,558 | ||||||
| Average price per gold ounce | $ | 1,322 | $ | 1,236 | ||||
| Silver ounces covered | — | 287,000 | ||||||
| Average price per silver ounce | $ | — | $ | 17.88 | ||||
Gold Collar & Forward Priced
The Company entered into short-term zero cost gold collars. The collars total 30,450 gold ounces from April 1, 2018 through December 31, 2018 with a floor ranging from $1,300 to $1,325 per ounce and a ceiling ranging from $1,340 to $ $1,376 per ounce. Forward priced ounces totaled 36,073 ounces at an average price per ounce of $1,322 per ounce. The value of these collars and forward priced ounces at March 31, 2018 was $(0.7) million.
10. Fair value measurements
Fair value is the price that would be received to sell an asset or paid to transfer a liability in an orderly transaction between market participants at the measurement date. Financial assets and liabilities recorded at fair value in the Condensed Consolidated Financial Statements are classified using a fair value hierarchy that reflects the significance of the inputs used in making the fair value measurements. The fair value hierarchy has the following levels:
Level 1 – Unadjusted quoted prices in active markets for identical assets or liabilities at the measurement date;
Level 2 – Quoted prices in markets that are not active, or inputs that are observable, either directly or indirectly, for the full term of the asset or liability; and
Level 3 – Prices or valuation techniques that require inputs that are both significant to the fair value measurement and are not observable.
12
Financial assets and liabilities are classified in their entirety based upon the lowest level of input that is significant to the fair value measurement. There were no transfers between fair value hierarchy levels during the three months ended March 31, 2018. The following table provides a listing (by level) of the Company's financial assets and liabilities which are measured at fair value on a recurring basis (in thousands):
| March 31, 2018 | December 31, 2017 | |||||||||||||||||||||||
| Assets: | Level 1 | Level 2 | Level 3 | Level 1 | Level 2 | Level 3 | ||||||||||||||||||
| Forward metal sales | $ | — | $ | 17 | $ | — | $ | — | $ | 17 | $ | — | ||||||||||||
| $ | — | $ | 17 | $ | — | $ | — | $ | 17 | $ | — | |||||||||||||
| Liabilities: | ||||||||||||||||||||||||
| Deferred share units liability | $ | — | $ | 847 | $ | — | $ | — | $ | 945 | $ | — | ||||||||||||
| Gold Offering Agreement | — | — | — | — | — | 170 | ||||||||||||||||||
| Gold Collar | — | 735 | — | — | — | — | ||||||||||||||||||
| $ | — | $ | 1,582 | $ | — | $ | — | $ | 945 | $ | 170 | |||||||||||||
Forward metal sales - Forward metal sales are valued using observable inputs, which are forward metal prices. Such instruments are classified within Level 2 of the fair value hierarchy.
Gold Collar and Forward Priced - The Company's gold collar is valued based on a Black-Scholes model with various observable inputs. These inputs include contractual terms, gold market prices, volatility of gold prices, and risk free interest rates. These derivatives are classified within Level 2 of the valuation hierarchy.
Deferred share units liability - This liability was valued using the number of outstanding DSUs and quoted closing prices of the Company’s common shares, which are traded in active markets, and as such is classified within Level 2 of the fair value hierarchy. The fair value was calculated as the number of DSUs outstanding multiplied by the period end DSU Value.
Gold Offering Agreement - This liability was valued by a third-party consultant (and reviewed by the Company) using a simulation-based pricing model and is classified within level 3 of the fair value hierarchy as it incorporates an estimate of the Company's future gold production from Fire Creek, which is not an observable input, as well as quoted prices from active markets and certain observable inputs, such as, forward gold prices and the volatility of such prices. The Gold Offering Agreement expired on February 28, 2018.
Items disclosed at fair value - Other than the above, the carrying values of financial assets and liabilities approximate their fair values, other than Debt, which is carried at amortized cost.
Level 3 information
The following table provides additional detail for the Company's Level 3 financial liability (in thousands):
| Gold Offering Agreement liability: | March 31, 2018 | |||
| Balance at beginning of the period | $ | 170 | ||
| Gain from change in fair value | (170 | ) | ||
| Balance at end of the period | $ | — | ||
| (Loss) gain on derivative, net: | ||||
| Settlement losses | $ | (138 | ) | |
| Gain from change in fair value | 170 | |||
| $ | 32 | |||
13
11. Share capital
Common shares
The authorized share capital of the Company is comprised of an unlimited number of common shares with no par value. Common shares are typically issued in conjunction with corporate financing efforts, the exercise of warrants (discussed below), and pursuant to share-based compensation arrangements (see 12. Share-based compensation).
Share Purchase Warrants
The Company has previously issued share purchase warrants in conjunction with its acquisition of Hollister (as defined herein) in 2016 and other past debt and equity financing transactions. The following table summarizes the Company's warrant activity:
| March 31, 2018 | |||||||
| Warrants | Number of Warrants | Weighted Average Exercise Price - CDN$ | |||||
| Outstanding, beginning of period | 10,001,242 | $ | 4.07 | ||||
| Exercised | — | — | |||||
| Outstanding, end of period | 10,001,242 | $ | 4.07 | ||||
| Exercisable, end of period | 10,001,242 | $ | 4.07 | ||||
The following table provides a summary of the Company's outstanding warrants:
| March 31, 2018 | |||||||||
| Exercise price per share - CDN$ | Number outstanding | Weighted average remaining life (years) | Weighted average exercise price - CDN$ | ||||||
| $2.00 - $2.49 | 5,001,242 | 10.87 | 2.15 | ||||||
| $6.00 | 5,000,000 | 14.01 | 6.00 | ||||||
| 10,001,242 | 12.44 | $ | 4.07 | ||||||
12. Share-based compensation
The Company has a Share Option and Restricted Share Unit Plan ("New Share Plan") to compensate eligible participants, which can include directors, officers, employees, and service providers to the Company. The New Share Plan is administered by the Board of Directors of the Company and is subject to conditions and restrictions over award terms, grant limits, and grant prices. The New Share Plan was approved at the June 15, 2016 annual and special meeting of shareholders. Subject to certain adjustments, the maximum number of common shares available for grant under the New Share Plan is equal to 8.9% of the common shares then outstanding less the aggregate number of common shares reserved for issuance under all of the Company's other share-based compensation plans. Additionally, the maximum number of common shares available for issuance pursuant to grants under the restricted share unit portion of the New Share Plan is subject to a sub-cap and cannot exceed 4.0% of the total number of common shares outstanding at the time of grant of the applicable award.
The New Share Plan replaced the Company's Share Incentive Plan (the "Legacy SIP"), which permitted the granting of share options and common share awards. Awards outstanding under the Legacy SIP will continue to vest in accordance with their grant terms and reduce the number of shares available for issuance under the New Share Plan (discussed above).
Share-based compensation costs
The following table summarizes the Company's share-based compensation cost by award type (in thousands):
| Three months ended March 31, | ||||||||
| Share-based compensation cost by award | 2018 | 2017 | ||||||
| Share options | $ | 56 | $ | 173 | ||||
| Restricted share units - time vesting criteria | 538 | 444 | ||||||
| Restricted share units - performance vesting criteria | 119 | 92 | ||||||
| Common share awards | — | 7 | ||||||
| $ | 713 | $ | 716 | |||||
14
The following table summarizes activity of the Company's share-based compensation for restricted share units ("RSUs") and share options:
| Three months ended March 31, 2018 | |||||||||
Restricted share units - time-based vesting(1) | Restricted share units - performance-based vesting | Share options | |||||||
| Outstanding, beginning of period | 1,456,481 | 507,633 | 4,067,583 | ||||||
| Forfeited | (110,732 | ) | (53,028 | ) | (34,445 | ) | |||
Vested and issued(2) | (39,830 | ) | (6,716 | ) | — | ||||
Exercised(3) | — | — | (6,667 | ) | |||||
| Outstanding, end of period | 1,305,919 | 447,889 | 4,026,471 | ||||||
(1) Includes awards with comparable terms and characteristics of RSUs, even if such awards are not called "RSUs" under the plan they were granted. | |||||||||
(2) Not applicable to Share options. | |||||||||
(3) Only applicable to Share options. | |||||||||
13. Income taxes
Major components of our income tax benefit (expense) for the three months ended March 31, 2018 and 2017 are as follows (in thousands):
| Three months ended March 31, | ||||||||
| 2018 | 2017 | |||||||
| Current: | ||||||||
| Canada | $ | — | $ | — | ||||
| United States | 294 | 864 | ||||||
| Total current income tax (expense) benefit | 294 | 864 | ||||||
| Deferred: | ||||||||
| Canada | — | — | ||||||
| United States | (162 | ) | (241 | ) | ||||
| Total deferred income tax (expense) | (162 | ) | (241 | ) | ||||
| Total income tax (expense) benefit | $ | 132 | $ | 623 | ||||
15
14. Net (loss) income per share
Basic net (loss) income per share is calculated by dividing net income by the weighted average number of shares outstanding for the period. Diluted net (loss) income per share reflects the potential dilution that would occur if outstanding share-based instruments were executed. The following table provides computations of the Company's basic and diluted net (loss) income per share (in thousands, except per share amounts):
| Three months ended March 31, | ||||||||
| 2018 | 2017 | |||||||
| Net (loss) income | $ | (7,998 | ) | $ | (10,227 | ) | ||
| Weighted average common shares: | ||||||||
| Basic | 179,615,936 | 175,570,592 | ||||||
| Effect of: | ||||||||
| Share options | — | — | ||||||
| Warrants | — | — | ||||||
| Common share awards | — | — | ||||||
Restricted share units(1) | — | — | ||||||
| Special warrants | — | — | ||||||
| Diluted | 179,615,936 | 175,570,592 | ||||||
| Net (loss) income per share | ||||||||
| Basic | $ | (0.04 | ) | $ | (0.06 | ) | ||
| Diluted | $ | (0.04 | ) | $ | (0.06 | ) | ||
(1) Represents restricted share units with time-based and performance-based vesting criteria. | ||||||||
For the three months ended March 31, 2018, the impact of dilutive share-based instruments was determined using the Company's average share price, which was CDN$2.43. For the three months ended March 31, 2017, the impact of dilutive share-based instruments was determined using the Company's average share price, which was CDN$6.66.
Diluted net (loss) income per share excludes common share-based instruments in periods where inclusion would be anti-dilutive. During the three months ended March 31, 2018, the Company's basic weighted average common shares and diluted weighted average common shares were the same because the effects of potential execution was anti-dilutive due to the Company's net loss. Had the Company generated net income during the three months ended March 31, 2018, the effects from executing 568,192 warrants, 330,660 share options, and 316,016 restricted share units would have been included in the weighted average common shares calculation. During the three months ended March 31, 2017, had the Company generated net income, the effects from executing 3,878,026 warrants, 2,595,078 share options, and 546,196 restricted share units would have been included in the diluted weighted average common shares calculation.
16
15. Segment information
The Company's reportable segments are comprised of operating units which have revenues, earnings or losses, or assets exceeding 10% of the respective consolidated totals, each of which is reviewed by the Company’s Chief Executive Officer to make decisions about resources to be allocated to the segments and to assess their performance. The tables below summarizes segment information:
| Three months ended March 31, 2018 | Fire Creek | Midas | Hollister | Aurora | True North | Corporate and other | Total | ||||||||||||||||||||
| Revenues | $ | 20,505 | $ | 14,038 | $ | 13,380 | $ | 1,981 | $ | 6,867 | $ | — | $ | 56,771 | |||||||||||||
| Cost of sales | |||||||||||||||||||||||||||
| Production costs | 7,569 | 10,382 | 7,323 | 2,007 | 8,168 | — | 35,449 | ||||||||||||||||||||
| Depreciation and depletion | 3,486 | 5,203 | 1,610 | 297 | 2,507 | — | 13,103 | ||||||||||||||||||||
| Write-down of production inventories | — | 1,715 | 5,342 | — | 1,460 | — | 8,517 | ||||||||||||||||||||
| 9,450 | (3,262 | ) | (895 | ) | (323 | ) | (5,268 | ) | — | (298 | ) | ||||||||||||||||
| Other operating expenses | |||||||||||||||||||||||||||
| General and administrative | 238 | 232 | 208 | 49 | 1,191 | 3,906 | 5,824 | ||||||||||||||||||||
| Exploration | 41 | 41 | 420 | — | — | — | 502 | ||||||||||||||||||||
| Asset retirement and accretion | 20 | 128 | 100 | 55 | 31 | — | 334 | ||||||||||||||||||||
| Arrangement agreement costs | — | — | — | — | — | 3,616 | 3,616 | ||||||||||||||||||||
| Loss on equipment disposal | — | 20 | — | — | — | — | 20 | ||||||||||||||||||||
| Income (loss) from operations | $ | 9,151 | $ | (3,683 | ) | $ | (1,623 | ) | $ | (427 | ) | $ | (6,490 | ) | $ | (7,522 | ) | $ | (10,594 | ) | |||||||
| Capital expenditures | $ | 1,265 | $ | 1,525 | $ | (19 | ) | $ | (2 | ) | $ | 26 | $ | 15 | $ | 2,810 | |||||||||||
| Total assets | $ | 52,128 | $ | 72,686 | $ | 126,255 | $ | 16,548 | $ | 55,873 | $ | 50,760 | $ | 374,250 | |||||||||||||
| Three months ended March 31, 2017 | Fire Creek | Midas | Hollister | Aurora | True North | Corporate and other | Total | ||||||||||||||||||||
| Revenues | $ | 20,451 | $ | 15,789 | $ | — | $ | — | $ | 5,470 | $ | — | $ | 41,710 | |||||||||||||
| Cost of sales | |||||||||||||||||||||||||||
| Production costs | 6,781 | 12,542 | — | — | 6,906 | — | 26,229 | ||||||||||||||||||||
| Depreciation and depletion | 1,657 | 4,536 | — | — | 1,535 | — | 7,728 | ||||||||||||||||||||
| Write-down of production inventories | — | 951 | — | — | 2,729 | — | 3,680 | ||||||||||||||||||||
| 12,013 | (2,240 | ) | — | — | (5,700 | ) | — | 4,073 | |||||||||||||||||||
| Other operating expenses | |||||||||||||||||||||||||||
| General and administrative | 191 | 156 | — | — | 253 | 3,888 | 4,488 | ||||||||||||||||||||
| Exploration | 127 | — | — | — | — | — | 127 | ||||||||||||||||||||
| Development and projects costs | — | — | 5,505 | — | — | — | 5,505 | ||||||||||||||||||||
| Asset retirement and accretion | 36 | 177 | 96 | 42 | 30 | — | 381 | ||||||||||||||||||||
| Loss on equipment disposal | 36 | 80 | — | — | — | — | 116 | ||||||||||||||||||||
| Income (loss) from operations | $ | 11,623 | $ | (2,653 | ) | $ | (5,601 | ) | $ | (42 | ) | $ | (5,983 | ) | $ | (3,888 | ) | $ | (6,544 | ) | |||||||
| Capital expenditures | $ | 6,804 | $ | 5,544 | $ | 298 | $ | 615 | $ | 3,458 | $ | 289 | $ | 17,008 | |||||||||||||
| Total assets | $ | 55,664 | $ | 109,636 | $ | 116,340 | $ | 16,199 | $ | 49,179 | $ | 28,474 | $ | 375,492 | |||||||||||||
17
16. Supplemental cash flow information
The following table provides a reconciliation of cash, cash equivalents and restricted cash to amounts reported within the Condensed Consolidated Statements of Cash Flows (in thousands):
| Three months ended March 31, | ||||||||
| 2018 | 2017 | |||||||
| Cash and cash equivalents | $ | 27,814 | $ | 29,554 | ||||
| Restricted cash | 9,504 | 10,055 | ||||||
Total cash, cash equivalents and restricted cash(1) | $ | 37,318 | $ | 39,609 | ||||
(1) The cash and cash equivalents and restricted cash balances were $23,674 and $9,555, respectively as of December 31, 2017, as shown on the Condensed Consolidated Balance Sheets. | ||||||||
Amounts included in restricted cash represent cash deposits which collateralize surety bonds associated with asset retirement obligations. See Note 7. Asset retirement obligations to the Notes to Condensed Consolidated Financial Statements for additional detail.
The following table provides a summary of significant supplemental cash flow information (in thousands):
| Three months ended March 31, | ||||||||
| 2018 | 2017 | |||||||
| Cash paid for federal and state income taxes | $ | — | $ | — | ||||
| Cash paid for interest | 599 | 1,181 | ||||||
| Mobile equipment acquired through capital lease obligations | 570 | — | ||||||
| Change in accounts payable related to purchase of mineral properties, plant, and equipment | 461 | 919 | ||||||
17. Commitments and contingencies
From time to time the Company is involved in legal actions related to our business; however, management does not believe, based on currently available information, that contingencies related to any pending or threatened legal matter will have a material adverse effect on the Company’s financial position, although a contingency could be material to the Company’s results of operations or cash flows for a particular period depending on the results of operations and cash flows for such period. Regardless of the outcome, litigation can have an adverse impact on the Company because of defense costs, diversion of management resources, and other factors.
Royalty commitments
Certain patented and unpatented mining claims at all mine sites are subject to lease and royalty agreements that require payments to holders based on minimum annual payment schedules and/or a percentage of the mineral values produced from, or transported through, the royalty claims. Amounts due pursuant to royalty agreements are not recorded in the Condensed Consolidated Financial Statements until such time when the amounts are actually payable. The primary type of royalty agreement applicable to the mine sites is a net smelter return ("NSR") royalty. Under an NSR royalty, the amount paid by the Company to the royalty holder is generally calculated as the royalty percentage multiplied by the market value of the minerals produced less charges and costs for milling, smelting, refining, and transportation. During the three months ended March 31, 2018, and 2017, the Company paid nil and nil, respectively, all of which were related to minimum and advance royalty payments.
18
Item 2. Management's Discussion and Analysis of Financial Condition and Results of Operations
This Management's Discussion & Analysis of Financial Condition and Results of Operations ("MD&A") contains forward-looking statements (as previously defined) which are subject to numerous risks and uncertainties, as more fully described in the Cautionary statement regarding forward-looking statements section of this Quarterly Report on Form 10-Q. This MD&A provides a discussion and analysis of the financial condition and results of operations of the Company and includes the Company's subsidiaries. This MD&A should be read in conjunction with our other reports filed with the U.S. Securities and Exchange Commission (the "SEC") as well as our interim unaudited Condensed Consolidated Financial Statements and notes thereto included in this Quarterly Report on Form 10-Q and our audited financial statements and notes thereto included in our Annual Report on Form 10-K for the year ended December 31, 2017. The following discussion has been prepared based on information available to us as of May 3, 2018. All dollar amounts included in this MD&A are expressed in thousands of United States dollars unless otherwise noted. References to CDN$ refer to Canadian dollars. References to "Notes" refer to the notes to Condensed Consolidated Financial Statements.
In this MD&A, we use the non-GAAP performance measures "Cash revenue from operations", "Cash production costs from operations", "Cash margin from operations", "Production cash costs per gold equivalent ounce sold", "All-in sustaining costs per gold ounce sold" and "All-in costs per gold ounce sold", which should not be considered in isolation or as a substitute for measures of performance prepared in accordance with GAAP. See the Non-GAAP performance measures section of this MD&A for additional detail.
Introduction and strategy
We are a junior–tier gold and silver mining company focused on exploration, development, and production in a safe, environmentally responsible, and cost–effective manner. As of March 31, 2018, we had 100% interests in three producing mines: (1) the Fire Creek mine ("Fire Creek"), (2) the Midas mine and ore milling facility ("Midas") and (3) the Hollister mine ("Hollister"), all of which are located in the state of Nevada, USA. The Company also has 100% interests in the True North gold mine and mill in Manitoba, Canada ("True North", formerly known as the Rice Lake mine) and the Aurora mine and ore milling facility ("Aurora", formerly known as Esmeralda), which is also located in Nevada, USA. The True North gold mine had production in 2017 and for part of Q1 of 2018. The mine is currently under care and maintenance while the Company reviews strategic options. During 2018, the Company will continue to process tailings through the mill. All of our mines are located in safe political jurisdictions.
Prior to February 2014, our only mine was Fire Creek, and since that time, we have experienced growth in our annual gold and silver production, total assets, and workforce largely due to growth at Fire Creek and to the acquisitions of Midas (February 2014), True North (January 2016), and Hollister and Aurora (October 2016).
Gold and silver sales represent 100% of our revenues, and the market prices of gold and silver significantly impact our financial position, operating results, and cash flows. Our primary strategy is to increase shareholder value by responsibly achieving our production, cost, and capital targets while attempting to extend our mine lives through development and exploration programs and reducing our costs through operational efficiencies. We also consider acquisitions or other arrangements in the normal course which strategically fit our future growth objectives.
Pending acquisition by Hecla
On March 16, 2018, we entered into an arrangement agreement (the “Arrangement Agreement”) with Hecla Mining Company (“Hecla”) and 1156291 B.C. Unlimited Liability Company, a wholly-owned subsidiary of Hecla. Under the terms of the Arrangement Agreement, Hecla will acquire all of our outstanding common shares (the “Klondex Shares”), and our shareholders will receive, for each Klondex Share, consideration with a value of $2.71. The consideration will consist of (i) the equivalent of $2.47 in either cash only, shares of Hecla's common stock (“Hecla Shares”) only, or a combination of cash and Hecla Shares, plus (ii) the equivalent of $0.24 in shares of a new company formed to hold our Canadian assets (the “Spinco Shares”).
Under the terms of the Arrangement Agreement, with respect to the portion of the consideration described in (i) above, our shareholders may elect to receive, for each Klondex Share, either (i) $2.47 in cash (the “Cash Alternative”), or (ii) 0.6272 of a Hecla Share (the “Share Alternative”), or (iii) $0.8411 in cash and 0.4136 of a Hecla Share (the “Combined Alternative”). The Cash Alternative and Share Alternative are subject to proration based on a maximum total cash consideration of $157,410,417 and a maximum total number of Hecla Shares of 77,411,859. Our shareholders who fail to properly elect either the Cash Alternative or the Share Alternative will be deemed to have elected the Combined Alternative.
If all of our shareholders elected either the Cash Alternative or the Share Alternative, as a result of proration, each shareholder would be entitled to receive, for each Klondex Share, $0.8411 in cash and 0.4136 of a Hecla Share, in addition to $0.24 in Spinco Shares. The $0.24 in Spinco Shares will amount to 0.125 of a Spinco Share (after giving effect to a 1-for-8 share consolidation of Spinco Shares).
The Arrangement Agreement contains certain termination provisions requiring payment by one party to the other party depending on the circumstances of the termination. Certain terminations require us to pay a termination fee of $21 million to Hecla and other terminations require us to reimburse Hecla for Hecla’s reasonable and documented out-of-pocket expenses incurred in connection with the transactions contemplated by the Arrangement Agreement. Terminations under certain circumstances require Hecla to pay a termination fee of $21 million to us.
19
The Arrangement Agreement contains provisions regarding the treatment of our options, restricted share units, deferred share units and warrants in connection with the Arrangement Agreement, as well as limited representations, warranties and covenants.
We expect to complete the Arrangement Agreement in the second quarter of 2018. However, completion of the Arrangement Agreement is subject to the satisfaction of certain covenants and approvals. It is possible that factors outside our or Hecla's control could delay the completion of the Arrangement Agreement or prevent it from being completed at all. We expect to complete the Arrangement Agreement promptly following the receipt of all required approvals.
Executive summary
Our first quarter 2018 highlights included the following, which are discussed in further detail throughout this MD&A or elsewhere in this Quarterly Report on Form 10-Q:
| • | Health, safety, and environmental - We remained committed to our most important core values by operating in an environmentally responsible manner while protecting the health and safety of our employees and contractors. No lost-time injuries occurred at our properties during the quarter and as of March 31, 2018, we had operated 1,993 days (~5.5 years) at Fire Creek, 1,273 days (~3.5 years) at Midas, 143 days (~0.4 years) at True North, and 544 days (~1.5 years) at Hollister and Aurora, without a lost-time injury. |
| • | Consolidated performance - We mined a total of 111,604 tons, in line with management’s expectations. Mined ounces are calculated using tons hauled from underground to surface (or tons hauled from tailings) multiplied by the assays from production sampling. We produced a total of 43,525 gold equivalent ounces ("GEOs") |
| • | Nevada performance - The Company's Nevada operations mined 92,303 ore tons at an average mined head grade of 0.51 GEOs per ton during the first quarter of 2018. Nevada operations produced 41,415 GEOs, an increase of 35% from 30,654 GEOs produced during the first quarter 2017. Total production was in line with expectations. |
| • | Fire Creek - At Fire Creek, the Company mined 30,409 ore tons in the first quarter at a grade of 0.80 GEOs per ton and produced 22,305 GEOs. Ounces produced in the first quarter were 16% higher as compared to the same quarter last year. The first quarter production, grade and recovery were in line with expectations. |
| • | Midas - The Midas mine mined 23,761 ore tons in the first quarter at an average head grade of 0.43 gold equivalent ounces per ton, and produced 9,878 GEOs. Gold equivalent mine head grade increased 23% in the first quarter of 2018 as compared to the first quarter of 2017. |
| • | Hollister - During the first quarter Hollister mined 27,282 ore tons at an average gold equivalent mined head grade of 0.43 ounces per ton. Recoveries have improved to 84.4% in the first quarter in part because of ore processed at a third party processor. Hollister ore recovery at the Midas mill is expected to be between 85% and 90% going forward after the addition of four screens to the existing circuit. During the first quarter the Company sold approximately 6,260 dry ore tons from the year end stockpile to a third party processor. |
| • | Midas Mill - Ore from Fire Creek, Midas and Hollister are processed at the Midas mill, which has a design capacity of 1,200 tons per day. Run-of-mine ore is crushed to 100% passing 1/2" in a conventional two-stage crushing circuit which utilizes a primary jaw crusher and a secondary cone crusher with the circuit closed by a double deck vibrating screen. During 2017 the Company added a tail thickener to the Midas mill. The addition of the thickener will extend the life of the tailings facilities and reduce future capital expenditures for tailing facilities following the completion of the 2018 expansion. The Company anticipates $16 to $18 million of capital to be spent in 2018 on the expansion of the tailings facility at the Midas mill. Mobilization started in March 2018 with construction scheduled to begin in the second quarter. |
| • | True North performance - During the first quarter the True North mine transitioned from operations to care and maintenance. During the transition True North continued to mine 19,301 ore tons producing 2,111 GEOs. The Company will continue to process tailings through the mill for the near future in order to maximize cash flow and offset expected care and maintenance costs. No tailings were processed during the first quarter. |
| • | Ounces sold and financial results - We sold 42,541 GEOs, consisting of 40,572 gold ounces and 158,239 silver ounces. Revenue was $56.8 million from average realized selling prices per gold and silver ounce of $1,334 and $16.61, respectively. Net loss was $8.0 million or ($0.04 per share - basic). |
| • | Cash flows and liquidity - Our ending cash balance was $27.8 million after $8.0 million of operating cash inflows, $3.3 million used in investing activities, and $0.5 million used in financing activities. Ending working capital was $38.8 million and total liquidity was $43.8 million when including the $5.0 million of Revolver availability. |
| • | Spending - Capital, exploration, and development spending totaled $1.3 million at Fire Creek, $1.6 million at Midas, $0.4 million at Hollister, nil at Aurora, nil at True North, and nil at corporate for total capital, exploration and development spending of $3.3 million. |
20
Critical accounting estimates
This MD&A is based on our Condensed Consolidated Financial Statements, which have been prepared in accordance with United States generally accepted accounting principles (“GAAP”). The preparation of these statements requires us to make assumptions, estimates, and judgments that affect the amounts of assets, liabilities, revenues, and expenses. For information on our most critical accounting estimates, see the Critical accounting estimates section included in Part II - Item 7. Management's Discussion and Analysis of Financial Condition and Results of Operations in our Annual Report on Form 10-K for the year ended December 31, 2017.
Results of operations
| Three months ended March 31, | ||||||||||||
| Revenues | 2018 | 2017 | Change | |||||||||
| Gold revenue | ||||||||||||
| Fire Creek | $ | 20,200 | $ | 20,251 | $ | (51 | ) | |||||
| Midas | 12,512 | 10,860 | 1,652 | |||||||||
| Hollister | 12,801 | — | 12,801 | |||||||||
| Aurora | 1,789 | — | 1,789 | |||||||||
| True North | 6,841 | 5,452 | 1,389 | |||||||||
| 54,143 | 36,563 | 17,580 | ||||||||||
| Silver revenue | ||||||||||||
| Fire Creek | 305 | 200 | 105 | |||||||||
| Midas | 1,526 | 4,929 | (3,403 | ) | ||||||||
| Hollister | 579 | — | 579 | |||||||||
| Aurora | 192 | — | 192 | |||||||||
| True North | 26 | 18 | 8 | |||||||||
| 2,628 | 5,147 | (2,519 | ) | |||||||||
| $ | 56,771 | $ | 41,710 | $ | 15,061 | |||||||
Revenues increased in the first quarter of 2018 compared to the first quarter of 2017 due to higher ounces sold and a higher price per ounce of gold. See the Mining operations review section of this MD&A for additional discussion on our operating results at each mine.
Gold revenue - The table below summarizes changes in gold revenue, ounces sold, and average realized prices (in thousands, except ounces sold and per ounce amounts):
| Three months ended March 31, | ||||||||
| 2018 | 2017 | |||||||
| Total gold revenue (thousands) | $ | 54,143 | $ | 36,563 | ||||
| Gold ounces sold | 40,573 | 29,559 | ||||||
| Average realized price (per ounce) | $ | 1,334 | $ | 1,237 | ||||
| The change in gold revenue was attributable to: | Change | |||||||
| Change in ounces sold | $ | 13,645 | ||||||
| Change in average realized price | 2,867 | |||||||
| Effect of average realized price change on ounces sold increase | 1,068 | |||||||
| $ | 17,580 | |||||||
21
Silver revenue - The table below summarizes changes in silver revenue, ounces sold, and average realized prices (in thousands, except ounces sold and per ounce amounts):
| Three months ended March 31, | ||||||||
| 2018 | 2017 | |||||||
| Total silver revenue (thousands) | $ | 2,628 | $ | 5,147 | ||||
| Silver ounces sold | 158,239 | 287,000 | ||||||
| Average realized price (per ounce) | $ | 16.61 | $ | 17.93 | ||||
| The change in silver revenue was attributable to: | Change | |||||||
| Change in ounces sold | $ | (2,310 | ) | |||||
| Change in average realized price | (379 | ) | ||||||
| Effect of average realized price change on ounces sold increase | 170 | |||||||
| $ | (2,519 | ) | ||||||
| Three months ended March 31, | ||||||||||||
| Cost of sales | 2018 | 2017 | Change | |||||||||
| Production costs | $ | 35,449 | $ | 26,229 | $ | 9,220 | ||||||
| Depreciation and depletion | 13,103 | 7,728 | 5,375 | |||||||||
| Write-down of production inventories | 8,517 | 3,680 | 4,837 | |||||||||
| $ | 57,069 | $ | 37,637 | $ | 19,432 | |||||||
| Cost of sales by mine | ||||||||||||
| Fire Creek | $ | 11,055 | $ | 8,438 | $ | 2,617 | ||||||
| Midas | 17,300 | 18,029 | (729 | ) | ||||||||
| Hollister | 14,275 | — | 14,275 | |||||||||
| Aurora | 2,304 | — | 2,304 | |||||||||
| True North | 12,135 | 11,170 | 965 | |||||||||
| $ | 57,069 | $ | 37,637 | $ | 19,432 | |||||||
Production costs - Increases in production costs during the three months ended March 31, 2018, as compared to the same period in 2017 was driven by the operations at Hollister and Aurora, which were not operating during the first quarter of 2017. See the Mining operations review section of this MD&A for a discussion of production costs at each mine.
Depreciation and depletion - Depreciation and depletion increased during the three months ended March 31, 2018, as compared to the same periods in 2017 primarily due to changes in volume of GEOs sold at Midas, Hollister.
Write-down of production inventories - Increases in production costs and depletion and depreciation led to write-downs of ending inventory balances at Midas, Hollister and True North in the three months ended March 31, 2018. See Note 3. Inventories to the Notes to Condensed Consolidated Financial Statements for additional detail.
| Three months ended March 31, | ||||||||||||
| 2018 | 2017 | Change | ||||||||||
| General and administrative | $ | 5,824 | $ | 4,488 | $ | 1,336 | ||||||
The increase during the three months ended March 31, 2018 as compared to the same periods in 2017 is primarily due to severance costs related to the restructuring of the True North operations in early January of 2018.
| Three months ended March 31, | ||||||||||||
| 2018 | 2017 | Change | ||||||||||
| Exploration | $ | 502 | $ | 127 | $ | 375 | ||||||
Exploration increased for the three months ended March 31, 2018 as compared to the same period of the prior year. Exploration for the three months ended March 31, 2018 was driven by the additional activity at mainly at Hollister related to the Velvet and South Velvet targets.
22
| Three months ended March 31, | ||||||||||||
| 2018 | 2017 | Change | ||||||||||
| Development and projects costs | $ | — | $ | 5,505 | $ | (5,505 | ) | |||||
Development and project costs during the three months ended March 31, 2018 were $0.0 million. For the same period in 2017 the Company was in the development phase for both the Hollister and Aurora projects.
| Three months ended March 31, | ||||||||||||
| 2018 | 2017 | Change | ||||||||||
| Asset retirement and accretion | $ | 334 | $ | 381 | $ | (47 | ) | |||||
These amounts relate to the accretion expense from existing asset retirement obligations and asset retirement increases at our mining and exploration properties. Asset retirement and accretion expense has decreased over the last year. See Note 7. Asset retirement obligations to the Notes to Condensed Consolidated Financial Statements for additional detail.
| Three months ended March 31, | ||||||||||||
| 2018 | 2017 | Change | ||||||||||
| Arrangement agreement costs | $ | 3,616 | $ | — | $ | 3,616 | ||||||
The 2018 costs relate to the Arrangement agreement between Klondex and Hecla. See "Pending acquisition by Hecla" for additional detail.
| Three months ended March 31, | ||||||||||||
| 2018 | 2017 | Change | ||||||||||
| (Loss) gain on derivatives, net | $ | (128 | ) | $ | (2,144 | ) | $ | 2,016 | ||||
Amounts recorded for derivatives are attributable to changes in the fair value of derivative instruments and gains or losses on derivative settlements and transactions, both of which are generally impacted by changes in gold and silver prices. See Note 9. Derivatives to the Notes to Condensed Consolidated Financial Statements for additional detail.
| Three months ended March 31, | ||||||||||||
| 2018 | 2017 | Change | ||||||||||
| Interest expense, net | $ | (599 | ) | $ | (1,158 | ) | $ | 559 | ||||
Interest expense decreased $0.8 million during the three months ended March 31, 2018 as compared to the same periods in 2017 due to repayment of the Gold Purchase Agreement in 2017. This decrease is partially offset by a $0.2 million increase due to additional borrowings under the Revolver. See Note 6. Debt to the Notes to Condensed Consolidated Financial Statements for additional detail.
| Three months ended March 31, | ||||||||||||
| 2018 | 2017 | Change | ||||||||||
| Foreign currency (loss) gain, net | $ | 3,185 | $ | (1,021 | ) | $ | 4,206 | |||||
Amounts recorded for foreign currency losses primarily relate to unrealized amounts on intercompany loan balances which we expect to settle in the foreseeable future which were partially offset by gains on U.S. dollar debt held in our Canadian companies.
| Three months ended March 31, | ||||||||||||
| 2018 | 2017 | Change | ||||||||||
| Income tax benefit (expense) | $ | 132 | $ | 623 | $ | (491 | ) | |||||
See Note 13. Income taxes to the Notes to Condensed Consolidated Financial Statements.
| Three months ended March 31, | ||||||||||||
| 2018 | 2017 | Change | ||||||||||
| Net (loss) income | $ | (7,998 | ) | $ | (10,227 | ) | $ | 2,229 | ||||
For the reasons discussed above and elsewhere in this MD&A, we reported the above amounts for Net (loss) income for the three months ended March 31, 2018 and 2017.
23
Exploration
Fire Creek - Nevada
During the first quarter we announced that seven surface holes were drilled in 2017 totaling 9,869 ft (3,008 m). The final results from the last four holes of the drill program were recently received. The focus of this drill program was to infill and step out from last year’s drilling with the intent to develop a resource within this mineralized structural corridor. This drilling has identified a zone of high grade mineralization within the Zeus structural corridor, approximately 900 ft (274 m) in length and 400 ft (122 m) vertical. This high grade zone is within 400 ft (122 m) of surface and is open in all directions.
On March 31, 2018, we also released an updated mineral reserve and resource at Fire Creek. Proven and probable Mineral Reserve was 229,000 gold equivalent ounces at a grade of 1.089 gold equivalent ounces per ton for proven and 0.524 gold equivalent ounces per ton for probable.
The table below summarizes the most recent mineral reserve estimate for Fire Creek:
| Category | Tons (k) | Au opt | Au g/t | Ag opt | Ag g/t | AuEq opt | Au Eq g/t | Au koz | Ag koz | AuEq koz | ||||||||||
| Proven | 108.0 | 1.079 | 37.0 | 1.03 | 35.42 | 1.089 | 37.3 | 117 | 112 | 118 | ||||||||||
| Probable | 211.0 | 0.517 | 17.7 | 0.51 | 17.61 | 0.524 | 18.0 | 109 | 108 | 111 | ||||||||||
| Total P&P | 319.0 | 0.708 | 24.3 | 0.69 | 23.66 | 0.716 | 24.6 | 226 | 220 | 229 | ||||||||||
A description of the data verification methods, quality assurance program and quality control measures applied can be found in the technical report titled "Technical Report for the Fire Creek Project, Lander County, Nevada Amended" dated as amended on March 2, 2018 with an effective date of November 30, 2017.
Hollister - Nevada
During the first quarter the Company reported that the final phase of the Hatter Graben exploration program was completed in December 2017 with ten surface core holes totaling 26,715 ft (8,143 m). Nine drill holes successfully tested the Hatter Graben vein system while one drill hole (H17-009) was lost short of the designed targets due to poor ground conditions. This program was designed to infill drilling completed during 2008 with the intent to develop an initial inferred resource at Hatter Graben.
Drilling from the most recent five holes continued to intersect multiple sub-parallel veins that extend mineralization along strike by approximately 800 ft (243.8 m) and down dip approximately 200 ft (61.0 m), bringing the known extent of the multiple sub-parallel mineralized veins to approximately 1,400 ft (426.7 m) of vertical height and 2,000 ft (609.6 m) of strike length. Mineralization remains open in all directions.
In addition, the drill data suggests that mineralization appears to be strengthening to the east and is hosted in more competent rock compared to the Hollister mine. The preferable ground conditions at Hatter Graben should allow for better vein development, superior dilution control and provides the option for the more efficient long-hole stoping mining method.
A description of the data verification methods, quality assurance program and quality control measures applied can be found in the technical report titled “Technical Report and Pre-Feasibility Study for the Hollister Underground Mine”, as amended on August 9, 2017 with an effective date of May 31, 2017.
Mining operations review
Actual vs. modeled reserve grades
Our average gold and gold equivalent mill head grades, on both a consolidated and individual mine site basis, can vary from the average grades of the mineral reserve estimates for each site. During our mining activities, we may encounter mineralization not included in the mineral reserve estimate that, in the opinion of management, can be processed economically. Often-times, rather than leaving such mineralized ore for future extraction, we mine the area when encountered so as not to potentially sterilize or incur additional costs to re-access and mine the ore at a later date. In other instances, additional design work, rehabilitation, and/or underground development may be required to enable access to mineralization included in the mineral resource estimate. Due to the above, actual mined gold and gold equivalent grades can differ from those which are stated in the current mineral reserve estimate.
Consolidated
The following table provides a summary of consolidated operating results for our producing properties which include our Nevada operations, Fire Creek, Midas, Hollister, which began mining activities during the end of the first quarter of 2017, and Aurora which began processing tailings in the fourth quarter of 2017 and our Canadian asset, True North, which had production in 2017 and for part of the first quarter of 2018.
24
| Three months ended March 31, | ||||||||||||||||
| 2018 | 2017 | |||||||||||||||
| Mine operations - consolidated | Nevada Total | True North(3) | Total | Total | ||||||||||||
| Ore tons mined | 92,303 | 19,301 | 111,604 | 107,519 | ||||||||||||
Average gold equivalent mined head grade (oz/ton)(1) | 0.51 | 0.12 | 0.45 | 0.54 | ||||||||||||
Gold equivalent mined (oz)(1) | 47,499 | 2,374 | 49,873 | 57,633 | ||||||||||||
| Gold mined (oz) | 45,113 | 2,374 | 47,487 | 52,273 | ||||||||||||
| Silver mined (oz) | 191,746 | — | 191,746 | 368,167 | ||||||||||||
| Ore tons milled | 89,772 | 19,390 | 109,162 | 89,903 | ||||||||||||
Average gold equivalent mill head grade (oz/ton)(1) | 0.54 | 0.12 | 0.40 | 0.41 | ||||||||||||
| Average gold mill head grade (oz/ton) | 0.49 | 0.12 | 0.37 | 0.37 | ||||||||||||
| Average silver mill head grade (oz/ton) | 2.88 | — | 3.45 | 3.45 | ||||||||||||
| Average gold recovery rate (%) | 88.9 | % | 92.3 | % | 93.4 | % | 93.4 | % | ||||||||
| Average silver recovery rate (%) | 65.3 | % | — | % | 84.2 | % | 84.2 | % | ||||||||
Gold equivalent produced (oz)(1) | 41,415 | 2,111 | 43,525 | 34,454 | ||||||||||||
| Gold produced (oz) | 39,317 | 2,091 | 41,408 | 30,654 | ||||||||||||
| Silver produced (oz) | 168,760 | 1,559 | 170,319 | 261,098 | ||||||||||||
Gold equivalent sold (oz)(1)(2) | 37,370 | 5,171 | 42,541 | 33,737 | ||||||||||||
| Gold sold (oz) | 35,421 | 5,151 | 40,572 | 29,559 | ||||||||||||
| Silver sold (oz) | 156,680 | 1,559 | 158,239 | 287,000 | ||||||||||||
| Revenues and realized prices | ||||||||||||||||
| Gold revenue (000s) | $ | 47,302 | $ | 6,841 | $ | 54,143 | $ | 36,563 | ||||||||
| Silver revenue (000s) | 2,602 | 26 | 2,628 | 5,147 | ||||||||||||
| Total revenues (000s) | $ | 49,904 | $ | 6,867 | $ | 56,771 | $ | 41,710 | ||||||||
| Average realized gold price ($/oz) | $ | 1,335 | $ | 1,328 | $ | 1,334 | $ | 1,237 | ||||||||
| Average realized silver price ($/oz) | $ | 16.61 | $ | 16.68 | $ | 16.61 | $ | 18.00 | ||||||||
| Non-GAAP Measures | ||||||||||||||||
Production cash costs per GEO sold(1)(2) | $ | 877 | $ | 1,802 | $ | 989 | $ | 844 | ||||||||
(1) Gold equivalent measures are the gold measure plus the silver measure divided by a GEO ratio. GEO ratios are computed by dividing the average realized gold price per ounce by the average realized silver price per ounce received by us in the respective period and match the ratios used to determine the production cash costs per GEO sold. Refer to the Non-GAAP Performance Measures section of this MD&A for additional detail. Mined ounces are calculated using tons hauled to surface multiplied by the assays from production sampling. | ||||||||||||||||
(2) This is a non-GAAP measure; refer to the Non-GAAP Performance Measures section of this MD&A for additional detail. | ||||||||||||||||
(3) The Company does not track this silver statistic at True North due to silver being immaterial to that operation. | ||||||||||||||||
Nevada operations
The Company's Nevada operations mined 92,303 ore tons at an average mined head grade of 0.51 GEOs per ton during the first quarter of 2018. Nevada operations produced 41,415 GEOs, an increase of 20% from 34,454 GEOs produced during the first quarter 2017. Total production was in line with expectations.
Canadian operations
During the first quarter the True North mine transitioned from operations to care and maintenance. During the transition True North continued to mine 19,301 ore tons and produced 2,111 GEOs. The Company will process tailings through the mill for the near future in order to maximize cash flow and offset expected care and maintenance costs. No tailings were processed during the first quarter.
All in sustaining costs
Total Company all in sustaining costs for the three months ended March 31, 2018 and 2017 were $1,191 and $1,487 per gold ounce sold, respectively. (This is a non-GAAP measure; refer to the Non-GAAP Performance Measures section of the MD&A for additional detail).
25
Fire Creek (Nevada Operations)
Fire Creek is 100% owned, fully-permitted, and was acquired by Klondex in 1975. Production began in 2014 under the bulk sample permit. Fire Creek is located in north-central Nevada in Lander County approximately 16 miles south of a major highway (Interstate-80) near other large gold deposits and mines which are owned and operated by major mining companies. Fire Creek is a high-grade, epithermal vein deposit, and the land package covers approximately 18,714 acres (~28.8 square miles). Ore mined from Fire Creek is trucked to Midas for processing in the milling facility. The following table provides a summary of Fire Creek operating results and period-over-period changes.
| Three months ended March 31, | ||||||||||||
| Mine Operations - Fire Creek | 2018 | 2017 | Change | |||||||||
| Ore tons mined | 30,409 | 31,730 | (1,321 | ) | ||||||||
Average gold equivalent mined head grade (oz/ton)(1) | 0.80 | 1.19 | (0.39 | ) | ||||||||
Gold equivalent mined (oz)(1) | 24,453 | 37,605 | (13,152 | ) | ||||||||
| Gold mined (oz) | 24,080 | 37,193 | (13,113 | ) | ||||||||
| Silver mined (oz) | 30,130 | 28,258 | 1,872 | |||||||||
| Ore tons milled | 30,699 | 21,659 | 9,040 | |||||||||
Average gold equivalent mill head grade (oz/ton)(1) | 0.79 | 0.95 | (0.16 | ) | ||||||||
| Average gold mill head grade (oz/ton) | 0.78 | 0.94 | (0.16 | ) | ||||||||
Average silver mill head grade (oz/ton)(2) | 1.01 | 0.84 | 0.17 | |||||||||
| Average gold recovery rate (%) | 91.9 | % | 93.4 | % | (1.5 | %) | ||||||
Average silver recovery rate (%)(2) | 79.4 | % | 83.2 | % | (3.8 | %) | ||||||
Gold equivalent produced (oz)(1) | 22,305 | 19,201 | 3,104 | |||||||||
| Gold produced (oz) | 22,000 | 18,981 | 3,019 | |||||||||
| Silver produced (oz) | 24,669 | 15,109 | 9,560 | |||||||||
Gold equivalent sold (oz)(1) | 15,241 | 16,540 | (1,299 | ) | ||||||||
| Gold sold (oz) | 15,014 | 16,378 | (1,364 | ) | ||||||||
| Silver sold (oz) | 18,340 | 11,145 | 7,195 | |||||||||
| Revenues and realized prices | ||||||||||||
| Gold revenue (000s) | $ | 20,200 | $ | 20,251 | $ | (51 | ) | |||||
| Silver revenue (000s) | 305 | 200 | 105 | |||||||||
| Total revenues (000s) | $ | 20,505 | $ | 20,451 | $ | 54 | ||||||
| Average realized gold price ($/oz) | $ | 1,345 | $ | 1,237 | $ | 108 | ||||||
| Average realized silver price ($/oz) | $ | 16.63 | $ | 18.00 | $ | (1.37 | ) | |||||
| Non-GAAP Measures | ||||||||||||
Production cash costs per GEO sold(1)(2) | $ | 497 | $ | 410 | $ | 87 | ||||||
(1) Gold equivalent measures are the gold measure plus the silver measure divided by a GEO ratio. GEO ratios are computed by dividing the average realized gold price per ounce by the average realized silver price per ounce received by us in the respective period and match the ratios used to determine the production cash costs per GEO sold. Refer to the Non-GAAP Performance Measures section of this MD&A for additional detail. Mined ounces are calculated using tons hauled to surface multiplied by the assays from production sampling. | ||||||||||||
(2) This is a non-GAAP measure; refer to the Non-GAAP Performance Measures section of this MD&A for additional detail. | ||||||||||||
Operations and costs - At Fire Creek, the Company mined 30,409 ore tons in the first quarter at a grade of 0.80 GEOs per ton and produced 22,305 GEOs. Ounces produced in the first quarter were 16% higher as compared to the same quarter last year. The first quarter production, grade and recovery were in line with expectations.
Spending - During the three months ended March 31, 2018, capital expenditures totaled $1.3 million. For details of capital expenditures refer to the Investing cash flows part of the Financial position, liquidity, and capital resources section of this MD&A.
26
Midas Mine (Nevada Operations)
Midas is 100% owned, fully-permitted, and was acquired by Klondex in February 2014. Midas is located in north-central Nevada in Elko County approximately 58 miles east of a major highway (Interstate-80) near other large gold deposits and mines which are owned and operated by major mining companies. Midas is a low-sulphidation, epithermal vein deposit, and the land package covers approximately 30,000 acres (~47.0 square miles). The following table provides a summary of Midas operating results and period-over-period changes.
| Three months ended March 31, | ||||||||||||
| Mine Operations - Midas | 2018 | 2017 | Change | |||||||||
| Ore tons mined | 23,761 | 40,153 | (16,392 | ) | ||||||||
Average gold equivalent mined head grade (oz/ton)(1) | 0.43 | 0.35 | 0.08 | |||||||||
Gold equivalent mined (oz)(1) | 10,174 | 14,065 | (3,891 | ) | ||||||||
| Gold mined (oz) | 9,398 | 9,279 | 119 | |||||||||
| Silver mined (oz) | 62,055 | 328,767 | (266,712 | ) | ||||||||
| Ore tons milled | 26,973 | 39,308 | (12,335 | ) | ||||||||
Average gold equivalent mill head grade (oz/ton)(1) | 0.42 | 0.32 | 0.1 | |||||||||
| Average gold mill head grade (oz/ton) | 0.36 | 0.22 | 0.14 | |||||||||
Average silver mill head grade (oz/ton)(2) | 4.98 | 7.43 | (2.45 | ) | ||||||||
| Average gold recovery rate (%) | 89.1 | % | 92.0 | % | (0.029 | ) | ||||||
Average silver recovery rate (%)(2) | 77.6 | % | 84.2 | % | (0.066 | ) | ||||||
Gold equivalent produced (oz)(1) | 9,878 | 11,453 | (1,575 | ) | ||||||||
| Gold produced (oz) | 8,583 | 7,873 | 710 | |||||||||
| Silver produced (oz) | 103,600 | 245,989 | (142,389 | ) | ||||||||
Gold equivalent sold (oz)(1) | 10,565 | 12,782 | (2,217 | ) | ||||||||
| Gold sold (oz) | 9,416 | 8,781 | 635 | |||||||||
| Silver sold (oz) | 91,897 | 274,855 | (182,958 | ) | ||||||||
| Revenues and realized prices | ||||||||||||
| Gold revenue (000s) | $ | 12,512 | $ | 10,860 | $ | 1,652 | ||||||
| Silver revenue (000s) | 1,526 | 4,929 | (3,403 | ) | ||||||||
| Total revenues (000s) | $ | 14,038 | $ | 15,789 | $ | (1,751 | ) | |||||
| Average realized gold price ($/oz) | $ | 1,329 | $ | 1,237 | $ | 92 | ||||||
| Average realized silver price ($/oz) | $ | 16.61 | $ | 18.00 | $ | (1.39 | ) | |||||
| Non-GAAP Measures | ||||||||||||
Production cash costs per GEO sold(1)(2) | $ | 1,092 | $ | 981 | $ | 111 | ||||||
(1) Gold equivalent measures are the gold measure plus the silver measure divided by a GEO ratio. GEO ratios are computed by dividing the average realized gold price per ounce by the average realized silver price per ounce received by us in the respective period and match the ratios used to determine the production cash costs per GEO sold. Refer to the Non-GAAP Performance Measures section of this MD&A for additional detail. Mined ounces are calculated using tons hauled to surface multiplied by the assays from production sampling. | ||||||||||||
(2) This is a non-GAAP measure; refer to the Non-GAAP Performance Measures section of this MD&A for additional detail. | ||||||||||||
Operations and costs - The Midas mine mined 23,761 ore tons in the first quarter at an average head grade of 0.43 gold equivalent ounces per ton, and produced 9,878 GEOs. Gold equivalent mined head grade increased 23% in the first quarter of 2018 as compared to the first quarter of 2017.
Spending - During the three months ended March 31, 2018 total capital spending was $1.5 million. For details of capital expenditures refer to the Investing cash flows part of the Financial position, liquidity, and capital resources section of this MD&A.
Midas Mill (Nevada Operations)
Ore from Fire Creek, Midas and Hollister are processed at the Midas mill, which has a design capacity of 1,200 tons per day. Run-of-mine ore is crushed to 100% passing 1/2" in a conventional two-stage crushing circuit which utilizes a primary jaw crusher and a secondary cone crusher with the circuit closed by a double deck vibrating screen. During 2017 the Company added a tail thickener to the Midas mill. The addition of the thickener will extend the life of the tailings facilities and reduce future capital expenditures for tailing facilities following the completion of the 2018 expansion. The Company anticipates $16 to $18 million of capital to be spent
27
in 2018 on the expansion of the tailings facility at the Midas mill. Mobilization started in March 2018 with construction scheduled to begin in the second quarter of 2018.
Hollister (Nevada Operations)
The Hollister mine is a fully-permitted past producing underground and open pit operation, located in north-central Nevada in Elko County. Hollister does not have milling or processing facilities but is located approximately 17 miles from the Midas mill, which currently has capacity to process additional tons. Hollister is an important asset to us since we believe there are significant synergies and cost savings with our Nevada operations through low transportation costs, reduced per ton milling costs, and shared general and administrative costs. Further, certain of our executives and management previously operated the historical underground operations and exploration programs at Hollister and believe that exploration targets with significant potential exist within the property boundary. We believe Hollister provides us with an opportunity to strategically and responsibly grow our business in Nevada, a mining friendly jurisdiction, while leveraging our technical expertise in narrow-vein underground mining and past experience with the project.
| Three months ended March 31, | |||||||||||
| Mine Operations - Hollister | 2018 | 2017 | Change | ||||||||
| Tons mined | 27,282 | 6,950 | 20,332 | ||||||||
Average gold equivalent mined head grade (oz/ton)(1) | 0.43 | 0.29 | 0.14 | ||||||||
Gold equivalent mined (oz)(1) | 11,864 | 2,047 | 9,817 | ||||||||
| Gold mined (oz) | 10,809 | 1,885 | 8,924 | ||||||||
| Silver mined (oz) | 84,321 | 11,142 | 73,179 | ||||||||
| Ore tons milled | 21,249 | 21,249 | |||||||||
Average gold equivalent mill head grade (oz/ton)(1) | 0.51 | 0.51 | |||||||||
| Average gold mill head grade (oz/ton) | 0.46 | 0.46 | |||||||||
| Average silver mill head grade (oz/ton) | 3.7 | 3.7 | |||||||||
| Average gold recovery rate (%) | 84.4 | % | 0.844 | ||||||||
| Average silver recovery rate (%) | 42.7 | % | 0.427 | ||||||||
Gold equivalent produced (oz)(2) | 8,701 | 8,701 | |||||||||
| Gold produced (oz) | 8,280 | 8,280 | |||||||||
| Silver produced (oz) | 33,620 | 33,620 | |||||||||
Gold equivalent sold (oz)(2) | 10,081 | 10,081 | |||||||||
| Gold sold (oz) | 9,645 | 9,645 | |||||||||
| Silver sold (oz) | 34,860 | 34,860 | |||||||||
| Revenues and realized prices | |||||||||||
| Gold revenue (000s) | $ | 12,801 | $ | 12,801 | |||||||
| Silver revenue (000s) | 579 | 579 | |||||||||
| Total revenues (000s) | $ | 13,380 | $ | 13,380 | |||||||
| Average realized gold price ($/oz) | $ | 1,327 | $ | 1,327 | |||||||
| Average realized silver price ($/oz) | $ | 16.61 | $ | 16.61 | |||||||
| Non-GAAP Measures | |||||||||||
Production cash costs per GEO sold(2)(3) | $ | 1,156 | $ | 1,156 | |||||||
(1) Gold equivalent measures are the gold measure plus the silver measure divided by a GEO ratio. GEO ratios are computed by dividing the average realized gold price per ounce by the average realized silver price per ounce received by us in the respective period and match the ratios used to determine the production cash costs per GEO sold. Refer to the Non-GAAP Performance Measures section of this MD&A for additional detail. Mined ounces are calculated using tons hauled to surface multiplied by the assays from production sampling. | |||||||||||
(2) This is a non-GAAP measure; refer to the Non-GAAP Performance Measures section of this MD&A for additional detail. | |||||||||||
Operations and costs - During the first quarter Hollister mined 27,282 ore tons at an average gold equivalent mined head grade of 0.43 ounces per ton. Recoveries have improved to 84.4% in the first quarter in part because of ore processed at a third party processor. Hollister ore recovery at the Midas mill is expected to be between 85% and 90% going forward after the addition of four screens to the existing circuit. During the first quarter the Company sold approximately 6,260 dry ore tons from the year end stockpile to a third party processor.
28
Spending - During the three months ended March 31, 2018 total capital spending was $0.4 million. Additional capital spending is planned for the second quarter. For details of capital expenditures refer to the Investing cash flows part of the Financial position, liquidity, and capital resources section of this MD&A.
Aurora updates
Aurora project overview
The Aurora project is a fully-permitted past producing underground and open pit operation, located in west-central Nevada in Mineral County. Aurora has a 350 ton per day milling and processing facility, which provides us an opportunity to reprocess tailings from an existing tailing facility on the property and to consider toll milling services. Further, certain of our executives and management previously operated Aurora and believe that exploration targets with significant potential exist within the property boundary. We believe Aurora provides us with an opportunity to strategically and responsibly grow our business in Nevada.
| Mine Operations - Aurora | March 31, 2018 | |||
Ore tons mined(1) | 10,851 | |||
Average gold equivalent mined head grade (oz/ton)(2) | 0.09 | |||
Gold equivalent mined (oz)(2) | 1,016 | |||
| Gold mined (oz) | 826 | |||
| Silver mined (oz) | 15,240 | |||
| Ore tons milled | 10,851 | |||
Average gold equivalent mill head grade (oz/ton)(2) | 0.10 | |||
| Average gold mill head grade (oz/ton) | 0.08 | |||
Average silver mill head grade (oz/ton)(3) | 1.40 | |||
| Average gold recovery rate (%) | 55.0 | % | ||
Average silver recovery rate (%)(3) | 45.1 | % | ||
Gold equivalent produced (oz)(2) | 540 | |||
| Gold produced (oz) | 454 | |||
| Silver produced (oz) | 6,871 | |||
Gold equivalent sold (oz)(2) | 1,492 | |||
| Gold sold (oz) | 1,347 | |||
| Silver sold (oz) | 11,583 | |||
| Revenues and realized prices | ||||
| Gold revenue (000s) | 1,789 | |||
| Silver revenue (000s) | 192 | |||
| Total revenues (000s) | $ | 1,981 | ||
| Average realized gold price ($/oz) | $ | 1,328 | ||
| Average realized silver price ($/oz) | $ | 16.58 | ||
| Non-GAAP Measures | ||||
Production cash costs per GEO sold(2)(3) | $ | 1,345 | ||
(1) Represents tons of tailings. | ||||
(2) Gold equivalent measures are the gold measure plus the silver measure divided by a GEO ratio. GEO ratios are computed by dividing the average realized gold price per ounce by the average realized silver price per ounce received by us in the respective period and match the ratios used to determine the production cash costs per GEO sold. Refer to the Non-GAAP Performance Measures section of this MD&A for additional detail. Mined ounces are calculated using tons hauled to surface multiplied by the assays from production sampling. | ||||
(3) This is a non-GAAP measure; refer to the Non-GAAP Performance Measures section of this MD&A for additional detail. | ||||
During the fourth quarter of 2016 and throughout 2017, we performed rehab work on the carbon stripping circuit, carbon regeneration circuit and mill. During the second quarter of 2017, we identified an opportunity to process mineralized material contained within the existing tailings facilities at the project. Processing of this material began in the fourth quarter of 2017. During the first quarter of 2018 we recovered 540 GEOs.
True North (Manitoba, Canada)
True North (formerly Rice Lake), located in Manitoba, Canada, is 100% owned, fully-permitted, and was acquired on January 22, 2016. True North is a past producing underground gold mining operation consisting of three underground deposits with a modern,
29
fully-permitted mill. Under previous ownership, mining took place at True North continuously from 2007 until May 2015, when the operation was placed on care and maintenance. True North was placed into production towards the end of the third quarter of 2016 following the release of an updated mineral reserve and resource estimate. Beginning in 2018 the mine was place on care and maintenance.
| Three months ended March 31, | ||||||||||||
| Mine Operations - True North | 2018 | 2017 | Change | |||||||||
| True North Total | True North Total | |||||||||||
| Ore tons mined | 19,301 | 28,686 | (9,385 | ) | ||||||||
Average gold equivalent mined head grade (oz/ton)(1) | 0.12 | 0.14 | (0.02 | ) | ||||||||
Gold equivalent mined (oz)(1) | 2,374 | 3,916 | (1,542 | ) | ||||||||
| Gold mined (oz) | 2,374 | 3,916 | (1,542 | ) | ||||||||
| Silver mined (oz) | — | — | — | |||||||||
| Ore tons milled | 19,390 | 28,936 | (9,546 | ) | ||||||||
Average gold equivalent mill head grade (oz/ton)(1) | 0.12 | 0.14 | (0.02 | ) | ||||||||
| Average gold mill head grade (oz/ton) | 0.12 | 0.14 | (0.02 | ) | ||||||||
Average silver mill head grade (oz/ton)(2)(3) | — | — | — | |||||||||
| Average gold recovery rate (%) | 92.3 | % | 96.1 | % | (3.8 | %) | ||||||
Average silver recovery rate (%)(2)(3) | — | % | — | % | — | % | ||||||
Gold equivalent produced (oz)(1) | 2,111 | 3,800 | (1,689 | ) | ||||||||
| Gold produced (oz) | 2,091 | 3,800 | (1,709 | ) | ||||||||
| Silver produced (oz) | 1,559 | — | 1,559 | |||||||||
Gold equivalent sold (oz)(1) | 5,171 | 4,415 | 756 | |||||||||
| Gold sold (oz) | 5,151 | 4,400 | 751 | |||||||||
| Silver sold (oz) | 1,559 | 1,000 | 559 | |||||||||
| Revenues and realized prices | — | |||||||||||
| Gold revenue (000s) | $ | 6,841 | $ | 5,452 | $ | 1,389 | ||||||
| Silver revenue (000s) | $ | 26 | 18 | 8 | ||||||||
| Total revenues (000s) | $ | 6,867 | $ | 5,470 | $ | 1,397 | ||||||
| Average realized gold price ($/oz) | $ | 1,328 | $ | 1,238 | $ | 90 | ||||||
| Average realized silver price ($/oz) | $ | 16.68 | $ | 18.00 | $ | (1.32 | ) | |||||
| Non-GAAP Measures | ||||||||||||
Production cash costs per GEO sold(1)(2) | $ | 1,802 | $ | 2,070 | $ | (268 | ) | |||||
(1) Gold equivalent measures are the gold measure plus the silver measure divided by a GEO ratio. GEO ratios are computed by dividing the average realized gold price per ounce by the average realized silver price per ounce received by us in the respective period and match the ratios used to determine the production cash costs per GEO sold. Refer to the Non-GAAP Performance Measures section of this MD&A for additional detail. Mined ounces are calculated using tons hauled to surface multiplied by the assays from production sampling. | ||||||||||||
(2) This is a non-GAAP measure; refer to the Non-GAAP Performance Measures section of this MD&A for additional detail. | ||||||||||||
(3) The Company does not track this silver statistic at True North due to silver being immaterial to that operation. | ||||||||||||
Operations and costs - During the first quarter the True North mine transitioned from operations to care and maintenance. During the transition True North continued to mine 19,301 ore tons and produced 2,111 GEOs. The Company process tailings through the mill for the near future in order to maximize cash flow and offset expected care and maintenance costs. No tailings were processed during the first quarter.
Spending - For the first three months of 2018, spending was nil for capital, development and project costs as the project is currently under care and maintenance. For details of capital expenditures refer to the Investing cash flows part of the Financial position, liquidity, and capital resources section of this MD&A.
Financial position, liquidity, and capital resources
General strategy
To maintain sufficient liquid assets and access to capital resources, we regularly perform short and long-term cash flow forecasts using current assumptions of future gold and silver prices, foreign exchange rates, production volumes, and operating and capital costs. Our liquidity and capital resources management strategy entails a disciplined approach by monitoring the timing and amount of any investment in our mines, projects, or exploration properties, while continually remaining in a position which we believe will allow us to respond to changes in our business environment, such as a decrease in metal prices, or other factors beyond our control.
30
Our capital structure consists of a mixture of debt and shareholders' equity. We regularly review our capital structure and evaluate various financing options and strategies that: (1) may improve our current liquidity and financial condition, (2) are attainable on favorable and reasonable terms, and (3) are permissible under our existing debt arrangements and other obligations. Such financing options may include, but are not limited to, additional or increases in revolving borrowing facilities, equipment financing, term loan facilities, refinancing existing obligations, and/or the issuance of equity securities, warrants, or other instruments.
Risk management contracts
In order to increase the certainty of expected future cash flows, from time to time we may enter into financial instruments for a portion of our forecast gold and silver sales over the next one to twelve months. During the three months ended March 31, 2018, we entered into forward trades which covered 36,073 gold ounces, at an average price of $1,322. We did not enter into any forward trades for silver ounces. Additionally, we entered into short-term zero cost gold collars. The collars total 30,450 gold ounces from April 1, 2018 through December 31, 2018 with a floor ranging from $1,300 to $1,325 per ounce and a ceiling ranging from $1,340 to $1,376 per ounce (see Note 9. Derivatives to the Notes to Condensed Consolidated Financial Statements for additional detail). Other than the aforementioned, we have not entered into any other significant contracts to hedge or manage market risks arising from changes in metal prices, diesel and propane costs, and currency and interest rates. We will continually and actively monitor applicable markets and quotes and may consider entering into additional hedging agreements and contracts if determined to be advantageous by management and the board of directors, and if such transactions are permissible under our existing debt agreements.
Liquidity and capital resources
As discussed below in the Sources and uses of cash section, at March 31, 2018, our Cash and cash equivalents balance totaled $27.8 million, increasing $4.1 million from the December 31, 2017 balance of $23.7 million largely due to cash provided by operating activities of $8.0 million, which was partially offset by investing cash outflows of $3.3 million related to capital expenditures and cash used by financing activities of $0.5 million.
Due to the nature of our operations and the composition of our balance sheet assets, as of March 31, 2018, our current assets, which included Cash and cash equivalents of $27.8 million and Inventories of $37.7 million, represented substantially all of our liquid assets on hand. We have access to additional liquidity under our $40.0 million Revolver, of which $5.0 million was available as of March 31, 2018. As of March 31, 2018, we had working capital of $38.8 million. The following chart provides a summary of our working capital, Revolver availability, and estimated liquidity as of the end of each of the last three years and March 31, 2018 (in thousands):
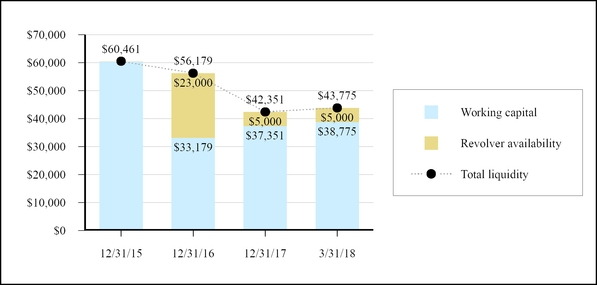
Our working capital increased by $1.4 million (approximately 4%) from December 31, 2017 to March 31, 2018, and our working capital ratio increased to 2.24. The following table summarizes working capital (in thousands, except working capital ratio):
| March 31, 2018 | December 31, 2017 | Change | ||||||||||
| Total current assets | $ | 70,010 | $ | 73,854 | $ | (3,844 | ) | |||||
| Total current liabilities | 31,235 | 36,503 | (5,268 | ) | ||||||||
| Working capital | $ | 38,775 | $ | 37,351 | $ | 1,424 | ||||||
Working capital ratio(1) | 2.24 | 2.02 | ||||||||||
(1) Current assets divided by current liabilities. | ||||||||||||
31
Working capital changes related to the decrease in total current assets were primarily attributable to a $4.1 million increase in Cash and cash equivalents (discussed below in the Sources and uses of cash section), offset by a $3.1 million decrease in prepaid expenses and a $4.8 million decrease in inventory in part as a result of processing of Hollister ore. Working capital changes related to a decrease in total current liabilities were primarily attributable to a decrease in accounts payable of $5.2 million.
Included in working capital are Inventories, which include production-related inventories that can provide us with additional cash liquidity in excess of their March 31, 2018 carrying value of $28.8 million due to a cash margin we expect to realize at the time of sale. The following table summarizes the estimated recoverable gold and silver ounces contained in our Inventories and the underlying amount of revenue which may be generated from their sale using March 31, 2018 period-end prices, which would be further reduced for any remaining processing and refining costs (in thousands, except ounces and period-end prices):
| March 31, 2018 | ||||||||||||
| Gold | Silver | Total | ||||||||||
Estimated ounces in Inventories | 27,667 | 109,449 | ||||||||||
| Period-end prices | $ | 1,324 | $ | 16.28 | ||||||||
| $ | 36,631 | $ | 1,782 | $ | 38,413 | |||||||
Our March 31, 2018 working capital, available sources of liquidity, and future operating cash flows will be used, in part, to fund recurring operating and production costs, make principal and interest payments on debt, and to fund capital expenditures and exploration and development costs at our mines and projects. At current gold and silver price levels, and when using our estimates of future production and costs, we believe our cash flows from operating activities together with our working capital and Revolver, will be sufficient to fund our business for at least the next 12 months. See the Contractual obligations section for additional detail on the timing and amounts of our future cash requirements.
Sources and uses of cash
| Three months ended March 31, | ||||||||
| 2018 | 2017 | |||||||
| Net (loss) income | $ | (7,998 | ) | $ | (10,227 | ) | ||
| Net non-cash adjustments | 13,531 | 10,942 | ||||||
| Net change in non-cash working capital | 2,477 | (3,809 | ) | |||||
| Net cash provided by (used in ) operating activities | 8,010 | (3,094 | ) | |||||
| Net cash used in investing activities | (3,271 | ) | (17,927 | ) | ||||
| Net cash (used in) provided by financing activities | (507 | ) | 2,880 | |||||
| Effect of foreign exchange on cash balances | (143 | ) | 59 | |||||
| Net increase (decrease) in cash, cash equivalents and restricted cash | 4,089 | (18,082 | ) | |||||
| Cash, cash equivalents and restricted cash, beginning of period | 33,229 | 57,691 | ||||||
| Cash, cash equivalents and restricted cash, end of period | $ | 37,318 | $ | 39,609 | ||||
Operating Cash Flows - Our cash flows from operations are largely impacted by the number of ounces sold, average realized prices, and production costs. As shown in the table below, during the three months ended March 31, 2018 and 2017, operating cash flows were positively impacted by GEO's sold (in thousands, except ounces).
32
| Three months ended March 31, | ||||||||
Cash revenue from operations(1) | 2018 | 2017 | ||||||
Consolidated gold equivalent ounces sold(1) | 42,541 | 33,737 | ||||||
Less: ounces delivered under Gold Purchase Agreement(2) | — | (2,000 | ) | |||||
| 42,541 | 31,737 | |||||||
| Average realized gold price ($/oz) | $ | 1,334 | $ | 1,237 | ||||
| $ | 56,750 | $ | 39,259 | |||||
Cash production costs from operations(1) | ||||||||
| Production costs | $ | 35,449 | $ | 26,229 | ||||
Add: Write-down of production inventories (cash portion) (see Note 5 - Inventories) | 6,634 | 2,234 | ||||||
| $ | 42,083 | $ | 28,463 | |||||
Cash margin from operations(1) | $ | 14,667 | 10,796 | |||||
(1) This is a non-GAAP measure; refer to the Non-GAAP Performance Measures section of this MD&A for additional detail. | ||||||||
(2) Ounces delivered under the Gold Purchase Agreement do not result in cash revenue. | ||||||||
Investing cash flows - During the three months ended March 31, 2018, net cash used in investing activities decreased by $14.7 million as a result of smaller capital expenditures as compared to the same period of the prior year. During the three months ended March 31, 2018 and 2017, we funded capital expenditures for mineral properties, plant and equipment. The following tables summarize our capital expenditures for the three months ended March 31, 2018 (in thousands):
| Three months ended March 31, 2018 | |||||||||||||||||||||||||||
| Capital expenditures | Fire Creek | Midas(1) | Hollister | Aurora | True North | Corporate and other | Total | ||||||||||||||||||||
| Mineral properties | $ | 44 | $ | — | $ | — | $ | — | $ | — | $ | — | $ | 44 | |||||||||||||
| Facilities and equipment | (20 | ) | 297 | 42 | (2 | ) | 10 | 15 | 342 | ||||||||||||||||||
| Mine development | 1,241 | 1,228 | (61 | ) | — | 16 | — | 2,424 | |||||||||||||||||||
| $ | 1,265 | $ | 1,525 | $ | (19 | ) | $ | (2 | ) | $ | 26 | $ | 15 | $ | 2,810 | ||||||||||||
(1) Midas includes $0.3 million for the milling facility. | |||||||||||||||||||||||||||
Financing Cash Flows - During the three months ended March 31, 2018, net cash provided by financing activities decreased by $3.4 million as a result of lower cash proceeds for share-based compensation and warrants.
Foreign Currency Effect on Cash - A portion of our Cash and cash equivalents is held in bank accounts denominated in Canadian dollars. Generally speaking, when the US dollar strengthens against the Canadian dollar, we experience negative foreign currency translation adjustments on our Canadian dollar cash balances (the opposite is true when the Canadian dollar strengthens against the U.S. dollar). Changes in exchange rates resulted in a decrease to our cash balances of $0.1 million during the three months ended March 31, 2018.
33
Contractual obligations
The following table provides a listing of our significant contractual obligations as of March 31, 2018 (in thousands):
| Payments due by period | ||||||||||||||||||||
| Contractual Obligations | Less than 1 year | 1-3 years | 3-5 years | More than 5 years | Total | |||||||||||||||
| Long-term debt obligations | ||||||||||||||||||||
Revolver(1) | — | 35,000 | — | — | 35,000 | |||||||||||||||
Interest on Revolver(1) | 1,654 | 1,241 | — | — | 2,895 | |||||||||||||||
| 1,654 | 36,241 | — | — | 37,895 | ||||||||||||||||
| Capital lease obligations | ||||||||||||||||||||
Capital lease obligations(2) | 873 | 1,520 | 35 | — | 2,428 | |||||||||||||||
Interest on capital lease obligations(2) | 85 | 95 | — | — | 180 | |||||||||||||||
| 958 | 1,615 | 35 | — | 2,608 | ||||||||||||||||
| Other long-term liabilities | ||||||||||||||||||||
Asset retirement obligations(3) | — | — | — | 38,213 | 38,213 | |||||||||||||||
| Total | $ | 2,612 | $ | 37,856 | $ | 35 | $ | 38,213 | $ | 78,716 | ||||||||||
(1) Amounts reflect the repayment of principal drawn and related cash interest on the Revolver through its current maturity date of December 31, 2019. See Note 6 - Debt for additional detail. | ||||||||||||||||||||
(2) Represents cash principal and interest. See Note 6 - Debt for additional detail. | ||||||||||||||||||||
(3) Asset retirement obligations are related to our mining operations, projects, and exploration activities. Classification of such amounts is based on our current estimates of when reclamation work will be performed. Amounts represent undiscounted estimates and are not reflective of inflation or third-party profits which may be incurred if reclamation work is performed externally. See Note 7 - Asset retirement obligations for additional detail. | ||||||||||||||||||||
As of March 31, 2018, we did not have any material operating lease obligations or firm purchase obligations. In addition to the above, our mines and projects are subject to certain royalty commitments as disclosed in Note 17. Commitments and contingencies.
Debt covenants
Our Revolver agreement contains financial covenants which require us to maintain a Tangible Net Worth not less than $100.0 million, a Gearing Ratio (a measure of debt to EBITDA) not greater than 4.00:1, a Cash Balance not less than $10.0 million, and a Current Ratio not less than 1.10:1 (as such terms are defined in the Revolver). The Company was in compliance with all debt covenants as of March 31, 2018.
Outstanding share capital
As of April 27, 2018, there were 179,668,072 common shares, 4,024,104 options, 10,001,242 warrants, 1,275,814 RSUs, 447,889 PSUs outstanding, and 195,417,121 common shares outstanding on a fully diluted basis.
Off-Balance Sheet Arrangements
As of March 31, 2018, there were no material off-balance sheet arrangements.
Non-GAAP performance measures
We have included the non-GAAP measures "Cash revenue from operations", "Cash production costs from operations", "Cash margin from operations", "Production cash costs per gold equivalent ounce sold", "All-in sustaining costs per gold ounce sold" and "All-in costs per gold ounce sold" in this MD&A (collectively, the "Non-GAAP Measures"). These Non-GAAP Measures are used internally to assess our operating and economic performance and to provide key performance information to management. We believe that these Non-GAAP Measures, in addition to conventional measures prepared in accordance with GAAP, provide investors with an improved ability to evaluate our performance and ability to generate cash flows required to fund and sustain our business. These Non-GAAP Measures are intended to provide additional information and should not be considered in isolation or as a substitute for measures of performance prepared in accordance with GAAP. These Non-GAAP Measures do not have any standardized meaning prescribed under GAAP, and therefore may not be comparable to or consistent with measures used by other issuers or with amounts presented in our financial statements.
Our primary business is gold production and our current and future operations, development, exploration, and life-of-mine plans primarily focus on maximizing returns from such gold production. As a result, our Non-GAAP Measures are calculated and disclosed on a per gold or gold equivalent ounce basis.
34
Production cash costs per gold equivalent ounce sold
Production cash costs per gold equivalent ounce sold presents our cash costs associated with the production of gold equivalent ounces and, as such, non-cash depreciation and depletion charges are excluded. Production cash costs per gold equivalent ounce sold is calculated on a per gold equivalent ounce sold basis, and includes all direct and indirect operating costs related to the physical activities of producing gold, including mining, processing, third-party refining expenses, on-site administrative and support costs, royalties, and cash portions of net realizable value write-downs on production-related inventories (State of Nevada net proceeds and other such taxes are excluded). We believe that converting the benefits from selling silver ounces into gold ounces is helpful to analysts and investors as it best represents the way we operate, which is to maximize returns from gold production. Gold equivalent ounces are computed using the number of silver ounces required to generate the revenue derived from the sale of one gold ounce, using average realized selling prices (in thousands, except ounces sold and per ounce amounts):
| Three months ended March 31, | ||||||||||||||||||||||||
| 2018 | 2017 | |||||||||||||||||||||||
| Consolidated | Nevada Total(1) | True North | Total | Nevada Total(1) | True North | Total | ||||||||||||||||||
| Average realized price per gold ounce sold | $ | 1,335 | $ | 1,328 | $ | 1,335 | $ | 1,237 | $ | 1,238 | $ | 1,237 | ||||||||||||
| Average realized price per silver ounce sold | $ | 16.61 | $ | 16.68 | $ | 16.61 | $ | 18.00 | $ | 18.00 | $ | 18.00 | ||||||||||||
| Silver ounces equivalent to revenue from one gold ounce | 80.4 | 79.6 | 80.4 | 68.7 | 68.8 | 68.7 | ||||||||||||||||||
| Silver ounces sold | 156,680 | 1,559 | 158,239 | 286,000 | 1,000 | 287,000 | ||||||||||||||||||
| GEOs from silver ounces sold | 1,949 | 20 | 1,968 | 4,163 | 15 | 4,178 | ||||||||||||||||||
| Gold ounces sold | 35,421 | 5,151 | 40,572 | 25,159 | 4,400 | 29,559 | ||||||||||||||||||
| Gold equivalent ounces | 37,370 | 5,171 | 42,540 | 29,322 | 4,415 | 33,737 | ||||||||||||||||||
| Production costs | $ | 27,281 | $ | 8,168 | $ | 35,449 | $ | 19,323 | $ | 6,906 | $ | 26,229 | ||||||||||||
Add: Write-down of production inventories (cash portion) (see Note 3 - Inventories) | 5,484 | 1,150 | 6,634 | — | 2,234 | 2,234 | ||||||||||||||||||
| $ | 32,765 | $ | 9,318 | $ | 42,083 | $ | 19,323 | $ | 9,140 | $ | 28,463 | |||||||||||||
| Production cash costs per GEO sold | $ | 877 | $ | 1,802 | $ | 989 | $ | 659 | $ | 2,070 | $ | 844 | ||||||||||||
(1) During Q1 2018, production was from Fire Creek, Midas, Hollister, and Aurora. During Q1 2017, production was only from Fire Creek and Midas. | ||||||||||||||||||||||||
The following tables present a reconciliation of Fire Creek, Midas, Hollister and Aurora to the "Nevada Total" for the three months ended March 31, 2018 and a reconciliation of Fire Creek and Midas for the three months ended March 31, 2017 (in thousands, except ounces sold and per ounce amounts):
35
| Three months ended March 31, | Three months ended March 31, | |||||||||||||||||||||||||||||||
| 2018 | 2017 | |||||||||||||||||||||||||||||||
| Nevada Total | Fire Creek | Midas | Hollister | Aurora | Nevada Total(1) | Fire Creek | Midas | Nevada Total(1) | ||||||||||||||||||||||||
| Average realized price per gold ounce sold | $ | 1,345 | $ | 1,329 | $ | 1,327 | $ | 1,328 | $ | 1,335 | $ | 1,237 | $ | 1,237 | $ | 1,237 | ||||||||||||||||
| Average realized price per silver ounce sold | $ | 16.63 | $ | 16.61 | $ | 16.61 | $ | 16.58 | $ | 16.61 | $ | 18.00 | $ | 18.00 | $ | 18.00 | ||||||||||||||||
| Silver ounces equivalent to revenue from one gold ounce | 80.9 | 80.0 | 79.9 | 80.1 | 80.4 | 68.7 | 68.7 | 68.7 | ||||||||||||||||||||||||
| Silver ounces sold | 18,340 | 91,897 | 34,860 | 11,583 | 156,680 | 11,145 | 274,855 | 286,000 | ||||||||||||||||||||||||
| GEOs from silver ounces sold | 227 | 1,149 | 436 | 145 | 1,949 | 162 | 4,001 | 4,163 | ||||||||||||||||||||||||
| Gold ounces sold | 15,014 | 9,416 | 9,645 | 1,347 | 35,421 | 16,378 | 8,781 | 25,159 | ||||||||||||||||||||||||
| Gold equivalent ounces | 15,241 | 10,565 | 10,081 | 1,492 | 37,370 | 16,540 | 12,782 | 29,322 | ||||||||||||||||||||||||
| Production costs | $ | 7,569 | $ | 10,382 | $ | 7,323 | $ | 2,007 | $ | 27,281 | $ | 6,781 | $ | 12,542 | $ | 19,323 | ||||||||||||||||
Add: Write-down of production inventories (cash portion) (see Note 3 - Inventories) | — | 1,154 | 4,330 | — | 5,484 | — | — | — | ||||||||||||||||||||||||
| $ | 7,569 | $ | 11,536 | $ | 11,653 | $ | 2,007 | $ | 32,765 | $ | 6,781 | $ | 12,542 | $ | 19,323 | |||||||||||||||||
| Production cash costs per GEO sold | $ | 497 | $ | 1,092 | $ | 1,156 | $ | 1,345 | $ | 877 | $ | 410 | $ | 981 | $ | 659 | ||||||||||||||||
(1) During Q1 2018, production was from Fire Creek, Midas, Hollister, and Aurora. During Q1 2017, production was only from Fire Creek and Midas. | ||||||||||||||||||||||||||||||||
36
All-in sustaining costs per gold ounce sold
All-in sustaining cost ("AISC") amounts are intended to provide additional information only and do not have any standardized meaning prescribed by GAAP and should not be considered in isolation or as a substitute for measures of performance prepared in accordance with GAAP. The measures are not necessarily indicative of operating profit or cash flow from operations as determined under GAAP.
Our calculation of AISC per gold ounce sold is consistent with the June 2013 guidance released by the World Gold Council, a non-regulatory, non-profit market development organization for the gold industry. AISC per gold ounce sold reflects the varying costs of producing gold over the life-cycle of a mine or project, including costs required to discover and develop new sources of production; therefore, capital amounts related to expansion and growth projects are included.
AISC per gold ounce includes all: (1) direct and indirect operating cash costs related to the physical activities of producing gold, including mining, processing, third-party refining expenses, on-site administrative and support costs, royalties, and cash portions of net realizable value write-downs on production-related inventories (2) general and administrative expenses, (3) asset retirement and accretion expenses, and (4) sustaining capital expenditures, the total of which is reduced for revenues earned from silver sales. Certain cash expenditures, including State of Nevada net proceeds and other related taxes, federal tax payments, and financing costs are excluded.
All-in costs per gold ounce sold
All-in costs per gold ounce sold includes additional costs which reflect the varying costs of producing gold over the life-cycle of a mine or project. We calculate our all-in costs per gold ounce sold by beginning with the AISC total and adding non-sustaining (growth) capital expenditures and exploration and development expenditures.
37
AISC per gold ounce sold and all-in costs per gold ounce sold are presented in the tables below (in thousands, except ounces sold and per ounce amounts):
| Three months ended March 31, | ||||||||||||||||||||||||||||||||
| 2018 | 2017 | |||||||||||||||||||||||||||||||
Nevada Total(1) | True North | Corporate | Total | Nevada Total(1) | True North | Corporate(2) | Total | |||||||||||||||||||||||||
| Production costs | $ | 27,281 | $ | 8,168 | $ | — | $ | 35,449 | $ | 19,323 | $ | 6,906 | $ | — | $ | 26,229 | ||||||||||||||||
| Add: Write-down of production inventories (cash portion) | 5,484 | 1,150 | — | 6,634 | — | 2,234 | — | 2,234 | ||||||||||||||||||||||||
| 32,765 | 9,318 | — | 42,083 | 19,323 | 9,140 | — | 28,463 | |||||||||||||||||||||||||
| General and administrative | 727 | 1,191 | 3,906 | 5,824 | 347 | 253 | 3,888 | 4,488 | ||||||||||||||||||||||||
| Asset retirement cost assets and accretion | 303 | 31 | — | 334 | 213 | 30 | 138 | 381 | ||||||||||||||||||||||||
| Sustaining capital expenditures | 2,705 | 16 | — | 2,721 | 12,152 | 3,458 | 156 | 15,766 | ||||||||||||||||||||||||
| Less: silver revenue | (2,602 | ) | (26 | ) | — | (2,628 | ) | (5,129 | ) | (18 | ) | — | (5,147 | ) | ||||||||||||||||||
| All-in sustaining costs | 33,898 | 10,530 | 3,906 | 48,334 | 26,906 | 12,863 | 4,182 | 43,951 | ||||||||||||||||||||||||
| Gold ounces sold | 35,422 | 5,151 | — | 40,573 | 25,159 | 4,400 | — | 29,559 | ||||||||||||||||||||||||
| All-in sustaining costs per gold ounce sold | $ | 957 | $ | 2,044 | $ | — | $ | 1,191 | $ | 1,069 | $ | 2,923 | $ | — | $ | 1,487 | ||||||||||||||||
| All-in sustaining costs | 33,898 | 10,530 | 3,906 | 48,334 | 26,906 | 12,863 | 4,182 | 43,951 | ||||||||||||||||||||||||
| Non-sustaining capital expenditures | 64 | 10 | 15 | 89 | 196 | — | 1,046 | 1,242 | ||||||||||||||||||||||||
| Exploration | 502 | — | — | 502 | 127 | — | — | 127 | ||||||||||||||||||||||||
| Development and projects costs | — | — | — | — | — | — | 5,505 | 5,505 | ||||||||||||||||||||||||
| All-in costs | $ | 34,464 | $ | 10,540 | $ | 3,921 | $ | 48,925 | $ | 27,229 | $ | 12,863 | $ | 10,733 | $ | 50,825 | ||||||||||||||||
| Gold ounces sold | 35,422 | 5,151 | — | 40,573 | 25,159 | 4,400 | — | 29,559 | ||||||||||||||||||||||||
| All-in costs per gold ounce sold | $ | 973 | $ | 2,046 | $ | — | $ | 1,206 | $ | 1,082 | $ | 2,923 | $ | — | $ | 1,719 | ||||||||||||||||
(1) The Nevada Total includes Fire Creek, Midas, Hollister, and Aurora for the three months ended March 31, 2018. The Nevada Total includes Fire Creek and Midas for the three months ended March 31, 2017. | ||||||||||||||||||||||||||||||||
(2) Corporate includes Hollister and Aurora for the three months ended March 31, 2017. There were no production costs during the three months ended March 31, 2017, Hollister and Aurora were both in the pre-development phase. | ||||||||||||||||||||||||||||||||
For a listing of our total capital expenditures see the Investing cash flows part of the Financial position, liquidity, and capital resources section.
Item 3. Quantitative and Qualitative Disclosures About Market Risk
Metal price risk
During the three months ended March 31, 2018, 100% of our revenues were from the sale of gold and silver. Our financial results can vary significantly as a result of fluctuations in gold and silver prices. The prices of gold and silver are volatile and are affected by many factors beyond our control, such as interest rates, inflation rates and expectations, speculation, currency values, central bank activities, governmental decisions regarding the disposal of precious metals stockpiles, global and regional demand and production, political and economic conditions, and other factors. See the Financial position, liquidity, and capital resources section of our Management's Discussion and Analysis of Financial Condition and Results of Operations for additional detail. In order to increase the certainty of expected future cash flows, from time to time we may enter into financial instruments for a portion of our forecast gold and silver sales over the next one to twelve months. See the discussion under the sub-heading "Risk management contracts" for more details.
38
There have been no material changes in our market risks during the three months ended March 31, 2018, from what was disclosed in Part II - Item 7A. Quantitative and Qualitative Disclosures About Market Risk of our Annual Report on Form 10-K for the year ended December 31, 2017.
Item 4. Controls and Procedures
Disclosure Controls and Procedures
Disclosure controls and procedures are designed to ensure that information required to be disclosed in reports filed or submitted by the Company under U.S. and Canadian securities legislation is recorded, processed, summarized and reported within the time periods specified in those rules, including providing reasonable assurance that material information is gathered and reported to senior management, including the Chief Executive Officer (“CEO”) and Chief Financial Officer (“CFO”), as appropriate, to permit timely decisions regarding public disclosure. Management, including the CEO and CFO, has evaluated the effectiveness of the design and operation of the Company’s disclosure controls and procedures, as defined in Rule 13a-15(e) and15d-15(e) of the Exchange Act and the rules of the Canadian Securities Administrators, as at March 31, 2018. Based on this evaluation, the CEO and CFO have concluded that the Company’s disclosure controls and procedures were effective as at March 31, 2018. There were no changes in our internal control over financial reporting during the quarter ended March 31, 2018 that have materially affected, or are reasonably likely to materially affect, our internal control over financial reporting.
Inherent Limitations on Effectiveness of Controls
Our management, including the CEO and CFO, does not expect that our disclosure controls and procedures or our internal control over financial reporting will prevent or detect all errors and all fraud. A control system, no matter how well-designed and operated, can provide only reasonable, not absolute, assurance that the control system’s objectives will be met. The design of a control system must reflect the fact that there are resource constraints, and the benefits of controls must be considered relative to their costs. Further, because of the inherent limitations in all control systems, no evaluation of controls can provide absolute assurance that misstatements due to error or fraud will not occur or that all control issues and instances of fraud, if any, have been detected. The design of any system of controls is based in part on certain assumptions about the likelihood of future events, and there can be no assurance that any design will succeed in achieving its stated goals under all potential future conditions. Projections of any evaluation of the effectiveness of controls to future periods are subject to risks. Over time, controls may become inadequate because of changes in conditions or deterioration in the degree of compliance with policies or procedures.
PART II - OTHER INFORMATION
Item 1. Legal Proceedings
From time to time we are involved in legal actions related to our business; however, management does not believe, based on currently available information, that contingencies related to any pending or threatened legal matter will have a material adverse effect on the Company’s financial position, although a contingency could be material to the Company’s results of operations or cash flows for a particular period depending on the results of operations and cash flows for such period. Regardless of the outcome, litigation can have an adverse impact on the Company because of defense costs, diversion of management resources, and other factors. Refer to Note 17. Commitments and contingencies to the Notes to Condensed Consolidated Financial Statements for additional detail.
Item 1A. Risk Factors
There have been no material changes to our risk factors discussed in Part I - Item 1A. Risk Factors in our Annual Report on Form 10-K for the year ended December 31, 2017.
Item 2. Unregistered Sales of Equity Securities and Use of Proceeds
None.
Item 3. Defaults Upon Senior Securities and Use of Proceeds
None.
Item 4. Mine Safety Disclosures
The information concerning mine safety violations or other regulatory matters required by Section 1503(a) of the Dodd-Frank Wall Street Reform and Consumer Protection Act and Item 104 of Regulation S-K is included in Exhibit 95.1 to this Quarterly Report on Form 10-Q.
Item 5. Other Information
None
39
Item 6. Exhibits
The following exhibits are filed herewith:
EXHIBIT INDEX
| Exhibit | Filed with this | Incorporated by Reference | |||||
| Number | Exhibit Title | Form 10-Q | Form | File No. | Exhibit | Date Filed | |
| 8-K | 001-37563 | 2.1 | March 19, 2018 | ||||
| X | |||||||
| X | |||||||
| X | |||||||
| X | |||||||
| X | |||||||
| 101.INS | XBRL Instance Document** | X | |||||
| 101.SCH | XBRL Taxonomy Extension Schema** | X | |||||
| 101.CAL | XBRL Taxonomy Extension Calculation Linkbase** | X | |||||
| 101.DEF | XBRL Taxonomy Extension Definition Linkbase** | X | |||||
| 101.LAB | XBRL Taxonomy Extension Label Linkbase** | X | |||||
| 101.PRE | XBRL Taxonomy Extension Presentation Linkbase** | X | |||||
| *Certain schedules have been omitted from this agreement. We will furnish supplementally a copy of any omitted schedule to the Securities and Exchange Commission upon request. | |||||||
| **The following financial information from Klondex Mines Ltd.'s Quarterly Report on Form 10-Q for the three months ended March 31, 2018, formatted in XBRL (Extensible Business Reporting Language): Condensed Consolidated Balance Sheets, Condensed Consolidated Statements of Income (Loss), Condensed Consolidated Statements of Comprehensive Income (Loss), Condensed Consolidated Statements of Cash Flows, and Condensed Consolidated Statements of Shareholders' Equity. | |||||||
40
SIGNATURES
Pursuant to the requirements of the Securities Exchange Act of 1934, the registrant has duly caused this report to be signed on its behalf by the undersigned, thereunto duly authorized.
| KLONDEX MINES LTD. | ||||
| Registrant | ||||
| Date: | May 3, 2018 | By: | /s/ Paul Andre Huet | |
| Paul Andre Huet | ||||
| Chief Executive Officer | ||||
| (Duly Authorized Officer) | ||||
| Date: | May 3, 2018 | /s/ Barry Dahl | ||
| Barry Dahl | ||||
| Chief Financial Officer | ||||
| (Principal Financial Officer and Chief Accounting Officer) | ||||
41