united states
securities and exchange commission
washington, d.c. 20549
form n-csr
certified shareholder report of registered management
investment companies
Investment Company Act file number 811-21720
Northern Lights Fund Trust
(Exact name of registrant as specified in charter)
225 Pictoria Drive, Suite 450 Dincinnati, OH, 45246
(Address of principal executive offices) (Zip code)
The Corporation Trust Company
1209 Orange Street Wilmington, DE 19801
(Name and address of agent for service)
Registrant's telephone number, including area code: 631-470-2619
Date of fiscal year end: 12/31
Date of reporting period: 12/31/22
Item 1. Reports to Stockholders.
 | ||
| Annual Report | ||
| December 31, 2022 | ||
| Investor Information: 1-855-224-7204 | ||
| www.PROBABILITIESFUND.com | ||
| This report and the financial statements contained herein are submitted for the general information of shareholders and are not authorized for distribution to prospective investors unless preceded or accompanied by an effective prospectus. Nothing herein contained is to be considered an offer to buy shares of the Probabilities Fund. Such offering is made only by prospectus, which includes details as to offering price and other material information. | ||
| Distributed by Northern Lights Distributors, LLC | ||
| Member FINRA | ||
 | ProbabilitiesFund.com |
Dear Fellow Shareholders:
We are pleased to present you with the Probabilities Fund Semiannual Report. For the six-month period ended December 30, 2022, Probabilities Fund’s (Class I) (the “Fund”) total return was -24.1%, compared with -18.11% for the S&P 500 Index*.
During the period under review, the Fund’s market exposure alternated between a neutral, long, leveraged, or inverse position as dictated by its investment policy rules and guidelines that shift it to a more aggressive position during the “Best Six Months” (November to April), as defined in the annual Stock Trader’s Almanac, and more conservative and inverse positions during the “Worst Six Months” (May to October). While there were certain leveraged and below-market equity exposure trades that benefited the Fund relative to the market, there were also periods where these bets worked against the portfolio.
During 2022, the Fund continued to utilize the enhanced model that was implemented in the first quarter of 2019 with the addition of Probabilities Fund Management’s (PFM), data-driven risk management metric, DVAM (Dynamic Volatility Adjustment Metric). DVAM utilizes the CBOE Volatility Index (VIX)* as an input to adjust the Fund’s investment strategy market exposure, predominately when leverage is used. DVAM is designed to systematically reduce the strategy’s equity exposure as market volatility is rising and then return equity exposure to strategy targets as volatility recedes. By reducing exposure during high volatility periods, future Fund drawdowns may also be mitigated. DVAM is anticipated to keep the Fund’s investment strategy from fully exiting the market so any future market rebound during elevated market volatility may not be missed. Looking back over the twelve-month period, the Fund started the period positioned with 1x equity market (bullish) exposure and oscillated between a 0x (neutral), 0.5x (long), 1x (long),1.5x (leveraged) and 2x (leveraged) position during the period. The Fund’s Portfolio was actively managed to obtain equity exposure, at times leveraged, and at times defensive (equity neutral) exposure throughout the period, pursuing gains based on its strategic rules. Market exposure was adjusted in the period as dictated by policy rules to increase exposure when anticipated return is positive and decreased when downside risk is expected to be elevated based upon historical market trends and patterns. Overall Fund performance lagged primarily due to being leveraged on days the market was down or inverse or in cash on days the market was up. At times, particularly in the third quarter, inverse market exposure helped the Funds performance relative to the market, however these gains were not sufficient to offset cumulative underperformance over the course of the year.
The war in Ukraine, Fed rate increases, and inflation, COVID-19, and supply chain disruptions were major factors impacting the global economies. Elevated residential real estate prices are beginning to come down from their peak as increased mortgage rates lower demand. At the same time, the yield curve has inverted, signaling a possible recession and expectation of future interest rate cuts. Major firms have announced layoffs as they adjust to expectations of slower growth and implement cost reduction measures
During the latter half of the “Best Six Months” period (January through early April 2022, the Fund’s investment strategy had a bullish bias. During that period the Fund declined -7.64% compared to a - 5.21% decline of -for S&P 500 TR. During the subsequent “Worst Six Months” period the Fund outperformed negative S&P 500 performance. After the fund shifted back to a more aggressive stance in October, it trailed the S&P 500 mostly in December due to leverage on days the market was down.
| 10655 Main Street | Suite 612 | Bellevue, WA 98004 | (800) 519-0438 | www.probabilitiesfund.com |
1
| ProbabilitiesFund.com |
Our overall outlook for 2023 is cautious. The Fed’s aggressive policy of interest rate increases has slowed but we expect several more smaller hikes until inflation gets back to a 2-3% level. A recession would cause further economic slowdown and lower than expected earnings could negatively impact stocks. As always, our mandate of following historical trends and patterns will position us neutral, long, leveraged or short during the seasonal cycles throughout the year 2023.
In place strategic rules and investment policy implemented by the Fund are aligned to weather any weakness that may manifest during the balance of the “Worst Six Months,” while still capitalizing on anticipated limited periods of strength. The Fund is expected to vary equity exposure from short (–1x) to a limited number of long (1x) through mid-October with frequent periods of neutral (0x) equity exposure. From late October through the end of the year, the beginning of the next “Best Six Months” period, the fund is expected to vary equity exposure from 1x (long) to a maximum of 2x (leveraged long) on a limited number of high conviction days.
Thank you for being a Probabilities Fund shareholder.
Sincerely,
Joseph B. Childrey
Founder & CIO
Probabilities Fund Management, LLC
Index Definitions: The CBOE Volatility Index, VIX, is a real-time market index representing the market's expectations for volatility over the coming 30 days. The S&P 500 Index is an unmanaged composite of 500 large capitalization companies. This index is widely used by professional investors as a performance benchmark for large-cap stocks.
| * | Past performance is no guarantee of future results. Investment return and principal value will vary. Investors’ shares when redeemed may be worth more or less than original cost. Returns do not reflect the deduction of taxes a shareholder would pay on distributions or redemption of Fund’s shares. The Fund’s prospectus contains more complete information, including fees, expenses and risks involved in investing in newly public companies and should be read carefully before investing. |
Important Disclosures
Investors should carefully consider the investment objectives, risks, charges, and expenses of the Probabilities Fund. This and other important information about the Fund are contained in the Prospectus, which can be obtained by contacting your financial advisor, or by calling 1.888.868.9501. The Prospectus should be read carefully before investing. Probabilities Fund is distributed by Northern Lights Distributors, LLC member FINRA/SIPC.
Probabilities Fund Management, LLC and Northern Lights Distributors are not affiliated.
3053-NLD-03/07/2023.
| 10655 Main Street | Suite 612 | Bellevue, WA 98004 | (800) 519-0438 | www.probabilitiesfund.com |
2
| Probabilities Fund |
| PORTFOLIO REVIEW |
| December 31, 2022 |
| The Fund’s performance figures for the periods ended December 31, 2022 compared to its benchmark | |||||
| Annualized | Annualized | Annualized | Annualized | ||
| One Year | Five Years | Ten Years | Since Inception* | Since Inception** | |
| Probabilities Fund - Class A | (24.10)% | (4.18)% | N/A | (0.45)% | N/A |
| Probabilities Fund - Class A with load | (28.46)% | (5.31)% | N/A | (1.11)% | N/A |
| Probabilities Fund - Class C | (24.67)% | (4.89)% | N/A | (1.19)% | N/A |
| Probabilities Fund - Class I *** | (23.90)% | (3.94)% | 1.48% | N/A | 5.88% |
| S&P 500 Total Return Index **** | (18.11)% | 9.42% | 12.56% | 10.61% | 8.81% |
| * | Class A and Class C each commenced operations on January 16, 2014. |
| ** | Class I commenced operations on January 1, 2008. |
| *** | The Fund is the successor to the Probabilities Fund, LP (the “Predecessor Fund”), which transferred its assets to the Fund in connection with the Fund’s commencement of operations. The Predecessor Fund was managed by Probabilities Fund Management, LLC, and had substantially similar investment objectives and strategies to those of the Fund. Class I performance includes the performance of the Predecessor Fund prior to the commencement of the Fund’s operations as a series of the Trust on December 12, 2013. The Predecessor Fund was not registered as a mutual fund under the Investment Company Act of 1940, as amended (the “1940 Act”), and therefore was not subject to certain investment restrictions, limitations and diversification requirements imposed by the 1940 Act and the Internal Revenue Code of 1986, as amended (the “Code”). |
| **** | The S&P 500 Total Return Index is an unmanaged market capitalization-weighted index which is comprised of 500 of the largest U.S. domiciled companies and includes the reinvestment of all dividends. Investors cannot invest directly in an index or benchmark. |
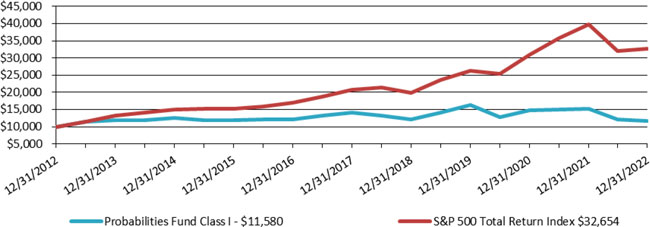
The performance data quoted is historical. Past performance is no guarantee of future results. The investment return and principal value of an investment will fluctuate. An investor’s shares, when redeemed, may be worth more or less than the original cost. Total return is calculated assuming reinvestment of all dividends and distributions. For the periods from inception through September 30, 2014 and for the year ended September 30, 2019 through the period ended December 31, 2020, total returns would have been lower had the Adviser not waived its fees and reimbursed a portion of the Fund’s expenses. For the period ended September 30, 2017, total returns would have been higher had the Adviser not recaptured some of its prior waived fees and a portion of the Fund’s prior period reimbursed Fund expenses. The Fund’s gross annual operating expense as a percentage of average net assets, including underlying funds, is 2.66%, 3.42% and 2.41% for Class A, Class C and Class I shares, respectively, per the Fund’s May 1, 2022 prospectus. Class A shares are subject to a maximum sales charge imposed on purchases of 5.75%. The chart does not reflect the deduction of taxes that a shareholder would have to pay on fund distributions or the redemption of the Fund’s shares. For performance information current to the most recent month-end, please call 1-855-224-7204.
Comparison of the Change in Value of a $10,000 Investment
| Portfolio Composition as of | ||||
| December 31, 2022* | ||||
| Exchange-Traded Funds - Equity | 59.9 | % | ||
| Other Assets in Excess of Liabilities | 40.1 | % | ||
| Total | 100.0 | % | ||
| * | Based on a percentage of Net Assets |
Please refer to the Schedule of Investments in this report for detailed listing of the Fund’s holdings.
3
| PROBABILITIES FUND |
| SCHEDULE OF INVESTMENTS |
| December 31, 2022 |
| Shares | Fair Value | |||||||
| EXCHANGE-TRADED FUNDS — 59.9% | ||||||||
| EQUITY - 59.9% | ||||||||
| 20,030 | Direxion Daily S&P 500 Bull 3X | $ | 1,244,063 | |||||
| 9,430 | Invesco QQQ Trust Series 1 | 2,511,020 | ||||||
| 21,950 | ProShares UltraPro Dow30 | 1,244,565 | ||||||
| 72,340 | ProShares UltraPro QQQ | 1,251,482 | ||||||
| 7,570 | SPDR Dow Jones Industrial Average ETF Trust | 2,508,168 | ||||||
| 7,140 | Vanguard S&P 500 ETF | 2,508,568 | ||||||
| 11,267,866 | ||||||||
| TOTAL EXCHANGE-TRADED FUNDS (Cost $11,858,491) | 11,267,866 | |||||||
| TOTAL INVESTMENTS - 59.9% (Cost $11,858,491) | $ | 11,267,866 | ||||||
| OTHER ASSETS IN EXCESS OF LIABILITIES - 40.1% | 7,535,952 | |||||||
| NET ASSETS - 100.0% | $ | 18,803,818 | ||||||
| ETF | - Exchange-Traded Fund |
| SPDR | - Standard & Poor’s Depositary Receipt |
The accompanying notes are an integral part of these financial statements.
4
| Probabilities Fund |
| STATEMENT OF ASSETS AND LIABILITIES |
| December 31, 2022 |
| Assets: | ||||
| Investments in Securities at Fair Value (Identified cost $11,858,491) | $ | 11,267,866 | ||
| Cash | 4,364,736 | |||
| Receivable for Securities Sold | 3,201,321 | |||
| Dividends and Interest Receivable | 5,921 | |||
| Due from Investment Adviser | 4,179 | |||
| Prepaid Expenses and Other Assets | 76,722 | |||
| Total Assets | 18,920,745 | |||
| Liabilities: | ||||
| Accrued Audit Fees | 14,894 | |||
| Payable to Related Parties | 27,873 | |||
| Accrued Distribution Fees | 2,427 | |||
| Payable for Fund Shares Redeemed | 68,473 | |||
| Accrued Expenses and Other Liabilities | 3,260 | |||
| Total Liabilities | 116,927 | |||
| Net Assets | $ | 18,803,818 | ||
| Net Assets Consist Of: | ||||
| Paid-in-Capital | $ | 26,221,561 | ||
| Accumulated Loss | (7,417,743 | ) | ||
| Net Assets | $ | 18,803,818 | ||
| Class A Shares: | ||||
| Net Assets | $ | 2,632,084 | ||
| Shares of beneficial interest outstanding (a) | 310,620 | |||
| Net Asset Value (Net Assets ÷ Shares Outstanding) and Redemption Price Per Share | $ | 8.47 | ||
| Offering Price Per Share | ||||
| ($8.47/0.9425) Includes a maximum sales charge of 5.75% | $ | 8.99 | ||
| Class C Shares: | ||||
| Net Assets | $ | 634,831 | ||
| Shares of beneficial interest outstanding (a) | 79,975 | |||
| Net Asset Value (Net Assets ÷ Shares Outstanding) and Redemption Price Per Share | $ | 7.94 | ||
| Class I Shares: | ||||
| Net Assets | $ | 15,536,903 | ||
| Shares of beneficial interest outstanding (a) | 1,793,562 | |||
| Net Asset Value (Net Assets ÷ Shares Outstanding) and Redemption Price Per Share | $ | 8.66 | ||
| (a) | Unlimited shares of no par value beneficial interest authorized. |
The accompanying notes are an integral part of these financial statements.
5
| Probabilities Fund |
| STATEMENT OF OPERATIONS |
| For the Year Ended December 31, 2022 |
| Investment Income: | ||||
| Dividend Income | $ | 158,406 | ||
| Total Investment Income | 158,406 | |||
| Expenses: | ||||
| Investment Advisory Fees | 334,283 | |||
| Distribution Fees (12b-1) | ||||
| Class A | 9,261 | |||
| Class C | 10,337 | |||
| Registration & Filing Fees | 39,944 | |||
| Administration Fees | 39,653 | |||
| Fund Accounting Fees | 38,412 | |||
| Printing Expense | 25,537 | |||
| Transfer Agent Fees | 24,710 | |||
| Chief Compliance Officer Fees | 21,925 | |||
| Trustees’ Fees | 15,303 | |||
| Audit and Tax Fees | 15,244 | |||
| Legal Fees | 14,681 | |||
| Third party administrative servicing fees | 11,870 | |||
| Custody Fees | 4,434 | |||
| Insurance Expense | 1,107 | |||
| Miscellaneous Expenses | 5,546 | |||
| Total Expenses | 612,247 | |||
| Less: Fees waived/expenses reimbursed by the Advisor | (125,441 | ) | ||
| Net Expenses | 486,806 | |||
| Net Investment Loss | (328,400 | ) | ||
| Net Realized and Unrealized Loss on Investments: | ||||
| Net Realized Loss on Investments | (3,922,128 | ) | ||
| Net Change in Unrealized Depreciation on Investments | (3,016,199 | ) | ||
| Net Realized and Unrealized Loss on Investments | (6,938,327 | ) | ||
| Net Decrease in Net Assets Resulting From Operations | $ | (7,266,727 | ) | |
The accompanying notes are an integral part of these financial statements.
6
| Probabilities Fund |
| STATEMENT OF CHANGES IN NET ASSETS |
| For the | For the | |||||||
| Year Ended | Year Ended | |||||||
| December 31, 2022 | December 31, 2021 | |||||||
| Operations: | ||||||||
| Net Investment Loss | $ | (328,400 | ) | $ | (540,992 | ) | ||
| Net Realized Gain (Loss) on Investments | (3,922,128 | ) | 4,015,480 | |||||
| Net Change in Unrealized Depreciation on Investments | (3,016,199 | ) | (2,810,397 | ) | ||||
| Net Increase (Decrease) in Net Assets Resulting From Operations | (7,266,727 | ) | 664,091 | |||||
| Capital Transactions: | ||||||||
| Class A Shares: | ||||||||
| Proceeds from Shares Issued | 44,188 | 274,584 | ||||||
| Cost of Shares Redeemed | (1,579,587 | ) | (2,073,039 | ) | ||||
| Net Decrease from Capital Transactions | (1,535,399 | ) | (1,798,455 | ) | ||||
| Class C Shares: | ||||||||
| Proceeds from Shares Issued | 16,780 | 25,980 | ||||||
| Cost of Shares Redeemed | (661,384 | ) | (1,969,903 | ) | ||||
| Net Decrease from Capital Transactions | (644,604 | ) | (1,943,923 | ) | ||||
| Class I Shares: | ||||||||
| Proceeds from Shares Issued | 8,128,392 | 6,244,658 | ||||||
| Cost of Shares Redeemed | (13,135,511 | ) | (10,048,500 | ) | ||||
| Net Decrease from Capital Transactions | (5,007,119 | ) | (3,803,842 | ) | ||||
| Net Decrease in Net Assets from Capital Transactions | (7,187,122 | ) | (7,546,220 | ) | ||||
| Total Decrease in Net Assets | (14,453,849 | ) | (6,882,129 | ) | ||||
| Net Assets: | ||||||||
| Beginning of Year | 33,257,667 | 40,139,796 | ||||||
| End of Year | $ | 18,803,818 | $ | 33,257,667 | ||||
| Share Activity: | ||||||||
| Class A Shares: | ||||||||
| Shares Issued | 4,677 | 24,756 | ||||||
| Shares Redeemed | (168,217 | ) | (187,043 | ) | ||||
| Net Decrease in shares of beneficial interest | (163,540 | ) | (162,287 | ) | ||||
| Class C Shares: | ||||||||
| Shares Issued | 1,890 | 2,499 | ||||||
| Shares Redeemed | (75,387 | ) | (188,856 | ) | ||||
| Net Decrease in shares of beneficial interest | (73,497 | ) | (186,357 | ) | ||||
| Class I Shares: | ||||||||
| Shares Issued | 860,664 | 550,102 | ||||||
| Shares Redeemed | (1,381,496 | ) | (903,369 | ) | ||||
| Net Decrease in shares of beneficial interest | (520,832 | ) | (353,267 | ) | ||||
The accompanying notes are an integral part of these financial statements.
7
| Probabilities Fund - Class A |
| FINANCIAL HIGHLIGHTS |
| Per share data and ratios for a share of beneficial interest outstanding through out each period presented. |
| For the | For the | For the Period | For the | For the | For the | |||||||||||||||||||
| Year Ended | Year Ended | October 1, 2020 to | Year Ended | Year Ended | Year Ended | |||||||||||||||||||
| December 31, 2022 | December 31, 2021 | December 31, 2020 | September 30, 2020 | September 30, 2019 | September 30, 2018 | |||||||||||||||||||
| Net Asset Value, Beginning of Period | $ | 11.16 | $ | 10.93 | $ | 9.86 | $ | 11.07 | $ | 10.10 | $ | 11.31 | ||||||||||||
| Increase (Decrease) From Operations: | ||||||||||||||||||||||||
| Net investment loss (a) | (0.14 | ) | (0.18 | ) | (0.04 | ) | (0.12 | ) | (0.04 | ) | (0.07 | ) | ||||||||||||
| Net gain (loss) from investments (both realized and unrealized) | (2.55 | ) | 0.41 | 1.11 | (1.08 | ) | 1.02 | 0.08 | (e) | |||||||||||||||
| Total from operations | (2.69 | ) | 0.23 | 1.07 | (1.20 | ) | 0.98 | 0.01 | ||||||||||||||||
| Less Distributions: | ||||||||||||||||||||||||
| From net realized gains on investments | — | — | — | (0.01 | ) | (0.01 | ) | (1.10 | ) | |||||||||||||||
| From return of capital | — | — | — | — | — | (0.12 | ) | |||||||||||||||||
| Total Distributions | — | — | — | (0.01 | ) | (0.01 | ) | (1.22 | ) | |||||||||||||||
| Net Asset Value, End of Period | $ | 8.47 | $ | 11.16 | $ | 10.93 | $ | 9.86 | $ | 11.07 | $ | 10.10 | ||||||||||||
| Total Return (b) | (24.10 | )% | 2.10 | % | 10.85 | % (g) | (8.45 | )% | 9.73 | % | (0.63 | )% | ||||||||||||
| Ratios/Supplemental Data | ||||||||||||||||||||||||
| Net assets, end of period (in 000’s) | $ | 2,632 | $ | 5,293 | $ | 6,955 | $ | 8,267 | $ | 8,577 | $ | 10,389 | ||||||||||||
| Ratio of gross expenses to average net assets (c) | 2.64 | % | 2.37 | % | 2.42 | % (f) | 2.23 | % | 2.20 | % | 2.02 | % | ||||||||||||
| Ratio of net expenses to average net assets (c) | 2.14 | % | 2.14 | % | 2.14 | % (f) | 2.14 | % | 2.14 | % | 2.02 | % | ||||||||||||
| Ratio of net investment loss to average net assets (c) (d) | (1.51 | )% | (1.61 | )% | (1.51 | )% (f) | (1.10 | )% | (0.34 | )% | (0.62 | )% | ||||||||||||
| Portfolio turnover rate | 1,338 | % | 1,492 | % | 212 | % (g) | 1,465 | % | 2,212 | % | 2,238 | % | ||||||||||||
| (a) | Per share amounts are calculated using the average shares method, which more appropriately presents the per share data for the period. |
| (b) | Total returns are historical in nature and assume changes in share price, reinvestment of dividends and capital gains distributions, if any. In periods where the advisor recaptures a portion of the Fund’s expenses, total returns would have been higher. In periods where the advisor waived a portion of the Fund’s expenses, total returns would have been lower. |
| (c) | Does not include expenses of other investment companies in which the Fund invests. |
| (d) | Recognition of investment income is affected by timing of and declaration of dividends by the underlying investment companies in which the Fund invests. |
| (e) | Net realized and unrealized gain on investments does not agree with the net amount reported on the Statement of Operations for the year ended September 30, 2018 due to the timing of shareholder subscriptions and redemptions relative to fluctuating net asset values during the year. |
| (f) | Annualized. |
| (g) | Not annualized. |
The accompanying notes are an integral part of these financial statements.
8
| Probabilities Fund - Class C |
| FINANCIAL HIGHLIGHTS |
| Per share data and ratios for a share of beneficial interest outstanding through out each period presented. |
| For the | For the | For the Period | For the | For the | For the | |||||||||||||||||||
| Year Ended | Year Ended | October 1, 2020 to | Year Ended | Year Ended | Year Ended | |||||||||||||||||||
| December 31, 2022 | December 31, 2021 | December 31, 2020 | September 30, 2020 | September 30, 2019 | September 30, 2018 | |||||||||||||||||||
| Net Asset Value, Beginning of Period | $ | 10.54 | $ | 10.39 | $ | 9.40 | $ | 10.56 | $ | 9.71 | $ | 11.00 | ||||||||||||
| Increase (Decrease) From Operations: | ||||||||||||||||||||||||
| Net investment loss (a) | (0.21 | ) | (0.25 | ) | (0.05 | ) | (0.19 | ) | (0.11 | ) | (0.17 | ) | ||||||||||||
| Net gain (loss) from investments (both realized and unrealized) | (2.39 | ) | 0.40 | 1.04 | (0.96 | ) | 0.97 | 0.10 | (e) | |||||||||||||||
| Total from operations | (2.60 | ) | 0.15 | 0.99 | (1.15 | ) | 0.86 | (0.07 | ) | |||||||||||||||
| Less Distributions: | ||||||||||||||||||||||||
| From net realized gains on investments | — | — | — | (0.01 | ) | (0.01 | ) | (1.10 | ) | |||||||||||||||
| From return of capital | — | — | — | — | — | (0.12 | ) | |||||||||||||||||
| Total Distributions | — | — | — | (0.01 | ) | (0.01 | ) | (1.22 | ) | |||||||||||||||
| Net Asset Value, End of Period | $ | 7.94 | $ | 10.54 | $ | 10.39 | $ | 9.40 | $ | 10.56 | $ | 9.71 | ||||||||||||
| Total Return (b) | (24.67 | )% | 1.44 | % | 10.53 | % (g) | (9.04 | )% | 8.88 | % | (1.35 | )% | ||||||||||||
| Ratios/Supplemental Data | ||||||||||||||||||||||||
| Net assets, end of period (in 000’s) | $ | 635 | $ | 1,617 | $ | 3,531 | $ | 3,572 | $ | 4,594 | $ | 5,781 | ||||||||||||
| Ratio of gross expenses to average net assets (c) | 3.37 | % | 3.13 | % | 3.15 | % (f) | 2.97 | % | 2.95 | % | 2.82 | % | ||||||||||||
| Ratio of net expenses to average net assets (c) | 2.89 | % | 2.89 | % | 2.89 | % (f) | 2.89 | % | 2.89 | % | 2.82 | % | ||||||||||||
| Ratio of net investment loss to average net assets (c) (d) | (2.29 | )% | (2.39 | )% | (2.22 | )% (f) | (1.88 | )% | (1.11 | )% | (1.62 | )% | ||||||||||||
| Portfolio turnover rate | 1,338 | % | 1,492 | % | 212 | % (g) | 1,465 | % | 2,212 | % | 2,238 | % | ||||||||||||
| (a) | Per share amounts are calculated using the average shares method, which more appropriately presents the per share data for the period. |
| (b) | Total returns are historical in nature and assume changes in share price, reinvestment of dividends and capital gains distributions, if any. In periods where the advisor recaptures a portion of the Fund’s expenses, total returns would have been higher. In periods where the advisor waived a portion of the Fund’s expenses, total returns would have been lower. |
| (c) | Does not include expenses of other investment companies in which the Fund invests. |
| (d) | Recognition of investment income is affected by timing of and declaration of dividends by the underlying investment companies in which the Fund invests. |
| (e) | Net realized and unrealized gain on investments does not agree with the net amount reported on the Statement of Operations for the year ended September 30, 2018 due to the timing of shareholder subscriptions and redemptions relative to fluctuating net asset values during the year. |
| (f) | Annualized. |
| (g) | Not annualized. |
The accompanying notes are an integral part of these financial statements.
9
| Probabilities Fund - Class I |
| FINANCIAL HIGHLIGHTS |
| Per share data and ratios for a share of beneficial interest outstanding through out each period presented. |
| For the | For the | For the Period | For the | For the | For the | |||||||||||||||||||
| Year Ended | Year Ended | October 1, 2020 to | Year Ended | Year Ended | Year Ended | |||||||||||||||||||
| December 31, 2022 | December 31, 2021 | December 31, 2020 | September 30, 2020 | September 30, 2019 | September 30, 2018 | |||||||||||||||||||
| Net Asset Value, Beginning of Period | $ | 11.38 | $ | 11.12 | $ | 10.03 | $ | 11.24 | $ | 10.22 | $ | 11.42 | ||||||||||||
| Increase (Decrease) From Operations: | ||||||||||||||||||||||||
| Net investment loss (a) | (0.12 | ) | (0.15 | ) | (0.03 | ) | (0.10 | ) | (0.01 | ) | (0.07 | ) | ||||||||||||
| Net gain (loss) from investments (both realized and unrealized) | (2.60 | ) | 0.41 | 1.12 | (1.10 | ) | 1.04 | 0.09 | (e) | |||||||||||||||
| Total from operations | (2.72 | ) | 0.26 | 1.09 | (1.20 | ) | 1.03 | 0.02 | ||||||||||||||||
| Less Distributions: | ||||||||||||||||||||||||
| From net realized gains on investments | — | — | — | (0.01 | ) | (0.01 | ) | (1.10 | ) | |||||||||||||||
| From return of capital | — | — | — | — | — | (0.12 | ) | |||||||||||||||||
| Total Distributions | — | — | — | (0.01 | ) | (0.01 | ) | (1.22 | ) | |||||||||||||||
| Net Asset Value, End of Period | $ | 8.66 | $ | 11.38 | $ | 11.12 | $ | 10.03 | $ | 11.24 | $ | 10.22 | ||||||||||||
| Total Return (b) | (23.90 | )% | 2.34 | % | 10.87 | % (g) | (8.17 | )% | 10.10 | % | (0.45 | )% | ||||||||||||
| Ratios/Supplemental Data | ||||||||||||||||||||||||
| Net assets, end of period (in 000’s) | $ | 15,537 | $ | 26,347 | $ | 29,653 | $ | 25,481 | $ | 31,798 | $ | 41,472 | ||||||||||||
| Ratio of gross expenses to average net assets (c) | 2.40 | % | 2.12 | % | 2.14 | % (f) | 1.95 | % | 1.95 | % | 1.83 | % | ||||||||||||
| Ratio of net expenses to average net assets (c) | 1.89 | % | 1.89 | % | 1.89 | % (f) | 1.89 | % | 1.89 | % | 1.83 | % | ||||||||||||
| Ratio of net investment loss to average net assets (c) (d) | (1.25 | )% | (1.36 | )% | (1.17 | )% (f) | (0.88 | )% | (0.14 | )% | (0.66 | )% | ||||||||||||
| Portfolio turnover rate | 1,338 | % | 1,492 | % | 212 | % (g) | 1,465 | % | 2,212 | % | 2,238 | % | ||||||||||||
| (a) | Per share amounts are calculated using the average shares method, which more appropriately presents the per share data for the period. |
| (b) | Total returns are historical in nature and assume changes in share price, reinvestment of dividends and capital gains distributions, if any. In periods where the advisor recaptures a portion of the Fund’s expenses, total returns would have been higher. In periods where the advisor waived a portion of the Fund’s expenses, total returns would have been lower. |
| (c) | Does not include expenses of other investment companies in which the Fund invests. |
| (d) | Recognition of investment income is affected by timing of and declaration of dividends by the underlying investment companies in which the Fund invests. |
| (e) | Net realized and unrealized gain on investments does not agree with the net amount reported on the Statement of Operations for the year ended September 30, 2018 due to the timing of shareholder subscriptions and redemptions relative to fluctuating net asset values during the year. |
| (f) | Annualized. |
| (g) | Not annualized. |
The accompanying notes are an integral part of these financial statements.
10
| Probabilities Fund |
| NOTES TO FINANCIAL STATEMENTS |
| December 31, 2022 |
| 1. | ORGANIZATION |
Probabilities Fund (the “Fund”) is a diversified series of shares of beneficial interest of Northern Lights Fund Trust (the “Trust”), a Delaware statutory trust organized on January 19, 2005. The Trust is registered under the Investment Company Act of 1940, as amended, (the “1940 Act”), as an open-end management investment company. The investment objective of the Fund is to seek capital appreciation.
The Fund is the successor to the Predecessor Fund, a limited partnership organized on January 1, 2008. Effective as of the close of business on December 11, 2013, the Predecessor Fund was reorganized into a Delaware statutory trust as a registered investment company. The Fund currently offers Class A, Class C and Class I shares. Class I commenced operations on December 12, 2013 with a contribution of cash from the Predecessor Fund. Class A and Class C both commenced operations on January 16, 2014. Class A shares are offered at net asset value (“NAV”) plus a maximum sales charge of 5.75%. Class C and Class I shares are offered at NAV. The Fund’s income, expenses (other than class specific distribution fees) and realized and unrealized gains and losses are allocated proportionally each day based upon the relative net assets of each class.
Effective December 31, 2020, the Fund changed the fiscal year-end from September 30 to December 31 for operational efficiencies.
| 2. | SUMMARY OF SIGNIFICANT ACCOUNTING POLICIES |
The following is a summary of significant accounting policies followed by the Fund in preparation of its financial statements. The policies are in conformity with accounting principles generally accepted in the United States of America (“GAAP”). The preparation of the financial statements requires management to make estimates and assumptions that affect the reported amounts of assets and liabilities and disclosure of contingent assets and liabilities at the date of the financial statements and the reported amounts of income and expenses for the period. Actual results could differ from those estimates. The Fund is an investment company and accordingly follows the investment company accounting and reporting guidance of the Financial Accounting Standards Board (“FASB”) Accounting Standard Codification Topic 946.
Security Valuation – Securities listed on an exchange are valued at the last reported sale price at the close of the regular trading session of the primary exchange on the business day the value is being determined, or in the case of securities listed on NASDAQ at the NASDAQ Official Closing Price (“NOCP”). In the absence of a sale, such securities shall be valued at the mean of the bid and ask prices on the day of valuation. Investments valued in currencies other than the U.S. dollar are converted to U.S. dollars using exchange rates obtained from pricing services. The independent pricing service does not distinguish between smaller-sized bond positions known as “odd lots” and larger institutional-sized bond positions known as “round lots”. The Fund may fair value a particular bond if the adviser does not believe that the round lot value provided by the independent pricing service reflects fair value of the Fund’s holding. Short-term debt obligations having 60 days or less remaining until maturity, at time of purchase may be valued at amortized cost. Investments in open-end investment companies are valued at net asset value.
Valuation of Fund of Funds – The Fund may invest in portfolios of open-end or closed-end investment companies (the “Underlying Funds”). The Underlying Funds value securities in their portfolios for which market quotations are readily available at their market values (generally the last reported sale price) and all other securities and assets at their fair value to the methods established by the board of directors of the Underlying Funds.
The Fund may hold securities, such as private investments, interests in commodity pools, other non-traded securities or temporarily illiquid securities, for which market quotations are not readily available or are determined to be unreliable. These securities are valued using the “fair value” procedures approved by the Board. The Board has designated the adviser as its valuation designee (the “Valuation Designee”) to execute these procedures. The Board may also enlist third party consultants such a valuation specialist at a public accounting firm, valuation consultant or financial officer of a security issuer on an as-needed basis to assist the Valuation Designee in
11
| Probabilities Fund |
| NOTES TO FINANCIAL STATEMENTS (Continued) |
| December 31, 2022 |
determining a security-specific fair value. The Board is responsible for reviewing and approving fair value methodologies utilized by the Valuation Designee, approval of which shall be based upon whether the Valuation Designee followed the valuation procedures established by the Board.
Fair Valuation Process – The applicable investments are valued by the Valuation Designee pursuant to valuation procedures established by the Board. For example, fair value determinations are required for the following securities: (i) securities for which market quotations are insufficient or not readily available on a particular business day (including securities for which there is a short and temporary lapse in the provision of a price by the regular pricing source); (ii) securities for which, in the judgment of the Valuation Designee, the prices or values available do not represent the fair value of the instrument; factors which may cause the Valuation Designee to make such a judgment include, but are not limited to, the following: only a bid price or an ask price is available; the spread between bid and ask prices is substantial; the frequency of sales; the thinness of the market; the size of reported trades; and actions of the securities markets, such as the suspension or limitation of trading; (iii) securities determined to be illiquid; and (iv) securities with respect to which an event that affects the value thereof has occurred (a “significant event”) since the closing prices were established on the principal exchange on which they are traded, but prior to a Fund’s calculation of its net asset value. Specifically, interests in commodity pools or managed futures pools are valued on a daily basis by reference to the closing market prices of each futures contract or other asset held by a pool, as adjusted for pool expenses. Restricted or illiquid securities, such as private investments or non-traded securities are valued based upon the current bid for the security from two or more independent dealers or other parties reasonably familiar with the facts and circumstances of the security (who should take into consideration all relevant factors as may be appropriate under the circumstances). If a current bid from such independent dealers or other independent parties is unavailable, the Valuation Designee shall determine the fair value of such security using the following factors: (i) the type of security; (ii) the cost at date of purchase; (iii) the size and nature of the Fund’s holdings; (iv) the discount from market value of unrestricted securities of the same class at the time of purchase and subsequent thereto; (v) information as to any transactions or offers with respect to the security; (vi) the nature and duration of restrictions on disposition of the security and the existence of any registration rights; (vii) how the yield of the security compares to similar securities of companies of similar or equal creditworthiness; (viii) the level of recent trades of similar or comparable securities; (ix) the liquidity characteristics of the security; (x) current market conditions; and (xi) the market value of any securities into which the security is convertible or exchangeable.
The Fund utilizes various methods to measure the fair value of its investments on a recurring basis. GAAP establishes a hierarchy that prioritizes inputs to valuation methods. The three levels of input are:
Level 1 – Unadjusted quoted prices in active markets for identical assets and liabilities that the Fund has the ability to access.
Level 2 – Observable inputs other than quoted prices included in level 1 that are observable for the asset or liability, either directly or indirectly. These inputs may include quoted prices for the identical instrument on an inactive market, prices for similar instruments, interest rates, prepayment speeds, credit risk, yield curves, default rates and similar data.
Level 3 – Unobservable inputs for the asset or liability, to the extent relevant observable inputs are not available, representing the Fund’s own assumptions about the assumptions a market participant would use in valuing the asset or liability, and would be based on the best information available.
The availability of observable inputs can vary from security to security and is affected by a wide variety of factors, including, for example, the type of security, whether the security is new and not yet established in the marketplace, the liquidity of markets, and other characteristics particular to the security. To the extent that valuation is based on models or inputs that are less observable or unobservable in the market, the determination of fair value requires more judgment. Accordingly, the degree of judgment exercised in determining fair value is greatest for instruments categorized in Level 3.
The inputs used to measure fair value may fall into different levels of the fair value hierarchy. In such cases, for disclosure purposes, the level in the fair value hierarchy within which the fair value measurement falls in its
12
| Probabilities Fund |
| NOTES TO FINANCIAL STATEMENTS (Continued) |
| December 31, 2022 |
entirety, is determined based on the lowest level input that is significant to the fair value measurement in its entirety.
The inputs or methodology used for valuing securities are not necessarily an indication of the risk associated with investing in those securities. The following tables summarize the inputs used as of December 31, 2022 for the Fund’s assets measured at fair value:
| Assets* | Level 1 | Level 2 | Level 3 | Total | ||||||||||||
| Exchange-Traded Funds | $ | 11,267,866 | $ | — | $ | — | $ | 11,267,866 | ||||||||
| Total | $ | 11,267,866 | $ | — | $ | — | $ | 11,267,866 | ||||||||
| * | Please refer to the Schedule of Investments for industry classifications. |
The Fund did not hold any Level 2 or Level 3 securities during the year.
Security Transactions and Investment Income – Investment security transactions are accounted for on a trade date basis. Cost is determined and gains and losses are based upon the specific identification method for both financial statement and federal income tax purposes. Dividend income is recorded on the ex-dividend date and interest income is recorded on an accrual basis. Purchase discounts and premiums on securities are accreted and amortized over the life of the respective securities.
Exchange Traded Funds – The Fund may invest in exchange traded funds (“ETFs”). ETFs are a type of fund bought and sold on a securities exchange. An ETF trades like common stock and represents a fixed portfolio of securities. The Fund may purchase an ETF to temporarily gain exposure to a portion of the U.S. or a foreign market while awaiting purchase of underlying securities. The risks of owning an ETF generally reflect the risks of owning the underlying securities they are designed to track, although the lack of liquidity on an ETF could result in it being more volatile. Additionally, ETFs have fees and expenses that reduce their value.
Cash – Cash may include cash and overnight investments in interest-bearing demand deposits with a financial institution with original maturities of three months or less. The assets of the Fund may be placed in deposit accounts at U.S. banks and such deposits generally exceed Federal Deposit Insurance Corporation (“FDIC”) insurance limits. The FDIC insures deposit accounts up to $250,000 for each accountholder. The counterparty is generally a single bank or other financial institution, rather than a group of financial institutions; thus there may be a greater counterparty credit risk. The Fund places deposits only with those counterparties which are believed to be creditworthy.
Expenses – Expenses of the Trust that are directly identifiable to a specific fund are charged to that fund. Expenses which are not readily identifiable to a specific fund are allocated in such a manner as deemed equitable, taking into consideration the nature and type of expense and the relative sizes of the funds in the Trust.
Federal Income Taxes – The Fund complies with the requirements of the Internal Revenue Code applicable to regulated investment companies and to distribute all of its taxable income to its shareholders. Therefore, no provision for Federal income tax is required. The Fund recognizes the tax benefits of uncertain tax positions only where the position is “more likely than not” to be sustained assuming examination by tax authorities. Management has analyzed the Fund’s tax positions and has concluded that no liability for unrecognized tax benefits should be recorded related to uncertain tax positions taken on returns filed for open tax years September 30, 2019 through September 30, 2020 and through December 31, 2021, or expected to be taken in the Fund’s December 31, 2022 tax returns. The Fund identifies its major tax jurisdictions as U.S. federal, Ohio and foreign jurisdictions where the Fund makes significant investments; however, the Fund is not aware of any tax positions for which it is reasonably possible that the total amounts of unrecognized tax benefits will change materially in the next twelve months. The Fund recognizes interest and penalties, if any, related to unrecognized tax benefits as income tax expense in the Statement of Operations. During the year, the Fund did not incur any interest or penalties. Generally, tax authorities can examine tax returns filed for the last three years.
13
| Probabilities Fund |
| NOTES TO FINANCIAL STATEMENTS (Continued) |
| December 31, 2022 |
Distributions to Shareholders – Distributions from net investment income and distributions from net realized capital gains, if any, are declared and paid at least annually and are recorded on the ex-dividend date. The amounts and character of income and gains to be distributed is determined in accordance with income tax regulations, which may differ from GAAP. To the extent these book/tax differences are permanent; they are charged or credited to paid-in-capital in the period that the differences arise. All short-term capital gains are included in ordinary income for tax purposes.
Indemnification – The Trust indemnifies its Officers and Trustees for certain liabilities that may arise from the performance of their duties to the Trust. Additionally, in the normal course of business, the Fund enters into contracts that contain a variety of representations and warranties and which provide general indemnities. The Fund’s maximum exposure under these arrangements is unknown, as this would involve future claims that may be made against the Fund that have not yet occurred. However, based on experience, the Trust expects the risk of loss due to these warranties and indemnities to be remote.
ETF Risk – ETFs are subject to investment advisory fees and other expenses, which will be indirectly paid by the Fund. As a result, your cost of investing in the Fund will be higher than the cost of investing directly in the ETFs and may be higher than other mutual funds that invest directly in stocks and bonds. ETFs are listed on national stock exchanges and are traded like stocks listed on an exchange. ETF shares may trade at a discount or a premium in market price if there is a limited market in such shares. ETFs are also subject to brokerage and other trading costs, which could result in greater expenses to the Fund. Finally, because the value of ETF shares depends on the demand in the market, the adviser may not be able to liquidate the Fund’s holdings at the most optimal time, adversely affecting performance. You will indirectly bear fees and expenses charged by the ETFs in addition to the Fund’s direct fees and expenses.
Management Risk – Your investment in the Fund varies with the effectiveness of the adviser’s research, analysis and asset allocation among portfolio securities. The adviser’s judgment about the attractiveness, value and potential appreciation of the particular security or derivative in which the Fund invests or sells short may prove to be incorrect and may not produce the desired results.
Market and Geopolitical Risk – The increasing interconnectivity between global economies and financial markets increases the likelihood that events or conditions in one region or financial market may adversely impact issuers in a different country, region or financial market. Securities in the Fund may underperform due to inflation (or expectations for inflation), interest rates, global demand for particular products or resources, natural disasters, pandemics, epidemics, terrorism, international conflicts, regulatory events and governmental or quasi-governmental actions. The occurrence of global events similar to those in recent years, such as terrorist attacks around the world, natural disasters, social and political discord or debt crises and downgrades, among others, may result in market volatility and may have long term effects on both the U.S. and global financial markets. It is difficult to predict when similar events affecting the U.S. or global financial markets may occur, the effects that such events may have and the duration of those effects. Any such event(s) could have a significant adverse impact on the value and risk profile of the Fund. The novel coronavirus (COVID-19) global pandemic and the aggressive responses taken by many governments, including closing borders, restricting international and domestic travel, and the imposition of prolonged quarantines or similar restrictions, as well as the forced or voluntary closure of, or operational changes to, many retail and other businesses, had negative impacts, and in many cases severe negative impacts, on markets worldwide. It is not known how long such impacts, or any future impacts of other significant events described above, will or would last, but there could be a prolonged period of global economic slowdown, which may impact your investment. Therefore, the Fund could lose money over short periods due to short-term market movements and over longer periods during more prolonged market downturns. During a general market downturn, multiple asset classes may be negatively affected. Changes in market conditions and interest rates can have the same impact on all types of securities and instruments. In times of severe market disruptions you could lose your entire investment.
Stock Market Risk – Stock markets can be volatile. In other words, the prices of stocks can fall rapidly in response to developments affecting a specific company or industry, or to changing economic, political or market conditions.
14
| Probabilities Fund |
| NOTES TO FINANCIAL STATEMENTS (Continued) |
| December 31, 2022 |
The Fund’s investments may decline in value if the stock markets perform poorly. There is also a risk that the Fund’s investments will underperform either the securities markets generally or particular segments of the securities markets.
Turnover Risk – The Fund’s trading strategy results in a significantly higher turnover rate. A higher portfolio turnover may result in higher transactional and brokerage costs associated with the turnover which may reduce the Fund’s return, unless the securities traded can be bought and sold without corresponding commission costs. Active trading of securities may also increase the Fund’s realized capital gains or losses, which may affect the taxes you pay as a Fund shareholder.
| 3. | INVESTMENT ADVISORY AGREEMENT AND TRANSACTIONS WITH RELATED PARTIES |
Probabilities Fund Management, LLC serves as the Fund’s investment adviser (the “Adviser”). Pursuant to an investment advisory agreement with the Trust, on behalf of the Fund, the Adviser, under the oversight of the Board, directs the daily operations of the Fund and supervises the performance of administrative and professional services provided by others. As compensation for these services and the related expenses borne by the Adviser, the Fund pays the Adviser an advisory fee, computed and accrued daily and paid monthly, at an annual rate of 1.35% of the average daily net assets. For the year ended December 31, 2022, the Fund incurred advisory fees of $334,283.
The Adviser has contractually agreed to waive all or part of its advisory fees and/or make payments to limit Fund expenses exclusive of any front-end or contingent deferred loads; brokerage fees and commissions; acquired fund fees and expenses; fees and expenses associated with investments in other collective investment vehicles or derivative instruments (including for example options and swap fees and expenses); borrowing costs (such as interest and dividend expense on securities sold short); taxes and extraordinary expenses, such as litigation expenses (which may include indemnification of Fund officers and Trustees, and contractual indemnification of Fund services providers (other than the Adviser)), at least until April 30, 2023, so that the total annual operating expenses of the Fund do not exceed 2.14%, 2.89% and 1.89% of the Fund’s average daily net assets for Class A, Class C and Class I shares, respectively. Waivers and expense payments may be recouped by the Adviser from the Fund, within three fiscal years of when the amounts were waived or reimbursed, to the extent that overall expenses fall below the expense limitation at the time of the waiver or recoupment. However, no recoupment payment will be made if it would result in the Fund exceeding the contractual expense limitation described above. This agreement may be terminated by the Board only on 60 days written notice to the Adviser. During the year ended December 31, 2022, the Adviser waived fess of $125,441.
As of December 31, 2022, the Adviser has $233,680 of waived fees within 3 years of reimbursement that may be recovered by the following dates:
| December 31, 2023 | December 31, 2024 | December 31, 2025 | Total | |||||||||||
| $ | 24,147 | $ | 84,092 | $ | 125,441 | $ | 233,680 | |||||||
Distributor – The Trust, on behalf of the Fund, has adopted the Trust’s Master Distribution and Shareholder Servicing Plans (“12b-1 Plans” or “Plans”) with respect to the Fund’s Class A and Class C shares, pursuant to which the Fund pays Northern Lights Distributors, LLC (the “Distributor”) an annual fee for distribution and shareholder servicing expenses calculated by the Fund as a percentage of the average daily net assets attributable to the respective class of shares:
| Class A | Class C | |
| Distribution Fee | 0.25% | 1.00% |
The Distributor and other entities are paid under the Plans for services provided and the expenses borne by the distributor and others in the distribution of Fund shares, including the payment of commissions for sales of the
15
| Probabilities Fund |
| NOTES TO FINANCIAL STATEMENTS (Continued) |
| December 31, 2022 |
shares and incentive compensation to and expenses of dealers and others who engage in or support distribution of shares or who service shareholder accounts, including overhead and telephone expenses; printing and distribution of prospectuses and reports used in connection with the offering of the Fund’s shares to other than current shareholders; and preparation, printing and distribution of sales literature and advertising materials. In addition, the Distributor or other entities may utilize fees paid pursuant to the Plans to compensate dealers or other entities for their opportunity costs in advancing such amounts, which compensation would be in the form of a carrying charge on any un-reimbursed expenses. During the year ended December 31, 2022, the distribution fees incurred under the Plans amounted to $9,261 and $10,337 for Class A and Class C shares, respectively.
The Distributor acts as the Fund’s principal underwriter in a continuous public offering of the Fund’s shares. For the year ended December 31, 2022, the Distributor received $536 in underwriting commissions for sales of the Fund’s shares, of which $81 was retained by the principal underwriter or other affiliated broker-dealers.
In addition, certain affiliates of the Distributor provide services to the Fund as follows:
Ultimus Fund Solutions, LLC (“UFS”) – UFS, an affiliate of the Distributor, provides administration, fund accounting, and transfer agent services to the Fund. Pursuant to a separate servicing agreement with UFS, the Fund pays UFS customary fees for providing administration, fund accounting and transfer agency services to the Fund. Certain officers of the Trust are also officers of UFS, and are not paid any fees directly by the Fund for serving in such capacities.
Northern Lights Compliance Services, LLC (“NLCS”) – NLCS, an affiliate of UFS and the Distributor, provides a Chief Compliance Officer to the Fund, as well as related compliance services, pursuant to a consulting agreement between NLCS and the Fund. Under the terms of such agreement, NLCS receives customary fees from the Fund. An officer of the Fund is also an officer of NLCS, and is not paid any fees directly by the Fund for serving in such capacity.
Blu Giant, LLC (“Blu Giant”) – Blu Giant, an affiliate of UFS and the Distributor, provides EDGAR conversion and filing services as well as print management services for the Fund on an ad-hoc basis. For the provision of these services, Blu Giant receives customary fees from the Fund.
| 4. | INVESTMENT TRANSACTIONS |
The cost of purchases and proceeds from the sale of securities, other than short-term securities, for the year ended December 31, 2022, amounted to $220,312,386 and $222,383,203, respectively.
| 5. | CONTROL OWNERSHIP |
The beneficial ownership, either directly or indirectly, of more than 25% of the voting securities of a Fund creates presumption of control of the fund, under Section 2(a)(9) of the 1940 Act. As of December 31, 2022, Axos Clearing, LLC held approximately 37.2% of the voting securities of the Fund.
| 6. | AGGREGATE UNREALIZED APPRECIATION AND DEPRECIATION – TAX BASIS |
The identified cost of investments in securities owned by the Fund for federal income tax purposes and its respective gross unrealized appreciation and depreciation at December 31, 2022, was as follows:
| Cost for Federal Tax purposes | $ | 20,042,865 | ||
| Unrealized Appreciation | 81,425 | |||
| Unrealized Depreciation | (4,491,687 | ) | ||
| Tax Net Unrealized Depreciation | $ | (4,410,262 | ) |
16
| Probabilities Fund |
| NOTES TO FINANCIAL STATEMENTS (Continued) |
| December 31, 2022 |
| 7. | TAX COMPONENTS OF CAPITAL |
There were no Fund distributions for the year ended December 31, 2021, and December 31, 2022.
As of December 31, 2022, the components of accumulated earnings/(deficit) on a tax basis were as follows:
| Undistributed | Undistributed | Post October Loss | Capital Loss | Other | Unrealized | Total | ||||||||||||||||||||
| Ordinary | Long-Term | and | Carry | Book/Tax | Appreciation/ | Distributable Earnings/ | ||||||||||||||||||||
| Income | Gains | Late Year Loss | Forwards | Differences | (Depreciation) | (Accumulated Deficit) | ||||||||||||||||||||
| $ | — | $ | — | $ | — | $ | (3,007,481 | ) | $ | — | $ | (4,410,262 | ) | $ | (7,417,743 | ) | ||||||||||
The difference between book basis and tax basis undistributed net investment income/(loss), accumulated net realized gain/(loss), and unrealized appreciation/(depreciation) from investments is primarily attributable to the tax deferral of losses on wash sales.
At December 31, 2022, the Fund had capital loss carry forwards for federal income tax purposes available to offset future capital gains and utilized capital loss carryforwards, as follows:
| Short-Term | Long-Term | Total | CLCF Utilized | |||||||||||
| $ | 3,007,481 | $ | — | $ | 3,007,481 | $ | — | |||||||
Permanent book and tax differences, primarily attributable to the book/tax basis treatment of net operating losses, resulted in reclassifications for the Fund for the fiscal year ended December 31, 2022, as follows:
| Paid | ||||||
| In | Accumulated | |||||
| Capital | Deficit | |||||
| $ | (328,400 | ) | $ | 328,400 | ||
| 8. | SUBSEQUENT EVENTS |
Subsequent events after the date of the Statement of Assets and Liabilities have been evaluated through the date the financial statements were issued. Management has determined that no events or transactions occurred requiring adjustment or disclosure in the financial statements.
17
REPORT OF INDEPENDENT REGISTERED PUBLIC ACCOUNTING FIRM
To the Board of Trustees of the Northern Lights Fund Trust and shareholders of Probabilities Fund
Opinion on the Financial Statements and Financial Highlights
We have audited the accompanying statement of assets and liabilities, including the schedule of investments, of Probabilities Fund, one of the funds constituting the Northern Lights Fund Trust (the “Fund”), as of December 31, 2022, the related statement of operations for the year then ended, the statements of changes in net assets for each of the two years in the period then ended, and the financial highlights for each of the two years in the period then ended and the period from October 1, 2020 through December 31, 2020, and the related notes. In our opinion, the financial statements and financial highlights present fairly, in all material respects, the financial position of the Fund as of December 31, 2022, and the results of its operations for the year then ended, the changes in its net assets for each of the two years in the period then ended, and the financial highlights for each of the two years in the period then ended and the period from October 1, 2020 through December 31, 2020 in conformity with accounting principles generally accepted in the United States of America. The financial highlights for each of the three years in the period ended September 30, 2020 for the Fund, were audited by other auditors whose report, dated November 30, 2020, expressed an unqualified opinion on those statements.
Basis for Opinion
These financial statements and financial highlights are the responsibility of the Fund’s management. Our responsibility is to express an opinion on the Fund’s financial statements and financial highlights based on our audit. We are a public accounting firm registered with the Public Company Accounting Oversight Board (United States) (PCAOB) and are required to be independent with respect to the Fund in accordance with the U.S. federal securities laws and the applicable rules and regulations of the Securities and Exchange Commission and the PCAOB.
We conducted our audit in accordance with the standards of the PCAOB. Those standards require that we plan and perform the audit to obtain reasonable assurance about whether the financial statements and financial highlights are free of material misstatement, whether due to error or fraud. The Fund is not required to have, nor were we engaged to perform, an audit of its internal control over financial reporting. As part of our audit, we are required to obtain an understanding of internal control over financial reporting but not for the purpose of expressing an opinion on the effectiveness of the Fund’s internal control over financial reporting. Accordingly, we express no such opinion.
Our audit included performing procedures to assess the risks of material misstatement of the financial statements and financial highlights, whether due to error or fraud, and performing procedures that respond to those risks. Such procedures included examining, on a test basis, evidence regarding the amounts and disclosures in the financial statements and financial highlights. Our audit also included evaluating the accounting principles used and significant estimates made by management, as well as evaluating the overall presentation of the financial statements and financial highlights. Our procedures included confirmation of securities owned as of December 31, 2022, by correspondence with the custodian and brokers: when replies were not received from broker, we performed other auditing procedures. We believe that our audit provides a reasonable basis for our opinion.

Costa Mesa, California
February 28, 2023
We have served as the auditor of one or more Probabilities Fund Management, LLC investment companies since 2020.
18
| Probabilities Fund |
| DISCLOSURE OF FUND EXPENSES (Unaudited) |
| December 31, 2022 |
As a shareholder of the Fund, you incur two types of costs: (1) transaction costs, such as sales charges; and (2) ongoing costs, including management fees, distribution and/or shareholder servicing fees, and other Fund expenses. This example is intended to help you understand your ongoing costs (in dollars) of investing in the Fund and to compare these costs with the ongoing costs of investing in other mutual funds.
The example is based on an investment of $1,000 invested and held for the entire period of July 1, 2022 through December 31, 2022.
Actual Expenses
The “Actual” lines in the table below provide information about actual account values and actual expenses. You may use the information below, together with the amount you invested, to estimate the expenses that you paid over the period. Simply divide your account value by $1,000 (for example, an $8,600 account value divided by $1,000 = 8.6), then multiply the result by the number in the table under the heading entitled “Expenses Paid During Period” to estimate the expenses you paid on your account during this period.
Hypothetical Example for Comparison Purposes
The “Hypothetical” lines in the table below provide information about hypothetical account values and hypothetical expenses based on the Fund’s actual expense ratio and an assumed rate of return of 5% per year before expenses, which is not the Fund’s actual return. The hypothetical account values and expenses may not be used to estimate the actual ending account balances or expenses you paid for the period. You may use this information to compare this 5% hypothetical example with the 5% hypothetical examples that appear in the shareholder reports of other funds.
Please note that the expenses shown in the table are meant to highlight your ongoing costs only and do not reflect any transactional costs, such as sales charges (loads), or redemption fees. Therefore, the table is useful in comparing ongoing costs only, and will not help you determine the relative total costs of owning different funds. In addition, if these transactional costs were included, your costs would have been higher.
| Expenses Paid | ||||
| Beginning Account Value | Ending Account Value | Annualized | During Period* | |
| (7/1/22) | (12/31/22) | Expense Ratio | (7/1/22 to 12/31/22) | |
| Actual | ||||
| Class A | $1,000.00 | $961.40 | 2.14% | $10.58 |
| Class C | $1,000.00 | $958.90 | 2.89% | $14.27 |
| Class I | $1,000.00 | $963.30 | 1.89% | $9.35 |
| Hypothetical | ||||
| (5% return before expenses) | ||||
| Class A | $1,000.00 | $1,014.42 | 2.14% | $10.87 |
| Class C | $1,000.00 | $1,010.64 | 2.89% | $14.65 |
| Class I | $1,000.00 | $1,015.68 | 1.89% | $9.60 |
| * | Expenses are equal to the average account value over the period, multiplied by the Fund’s annualized expense ratio, multiplied by the number of days in the period (184) divided by the number of days in the fiscal year (365). |
19
Probabilities Fund Management, LLC (Adviser to Probabilities Fund)*
In connection with the regular meeting held on December 14-15, 2022 of the Board of Trustees (the “Trustees” or the “Board”) of the Northern Lights Fund Trust (the “Trust”), including a majority of the Trustees who are not “interested persons,” as that term is defined in the Investment Company Act of 1940, as amended, discussed the renewal of an investment advisory agreement (the “Advisory Agreement”) between Probabilities Fund Management, LLC (the “Adviser”) and the Trust, with respect to the Probabilities Fund (the “Fund”). In considering the renewal of the Advisory Agreement, the Board received materials specifically relating to the Advisory Agreement.
The Trustees were assisted by independent legal counsel throughout the Advisory Agreement review process. The Trustees relied upon the advice of independent legal counsel and their own business judgment in determining the material factors to be considered in evaluating the Advisory Agreement and the weight to be given to each such factor. The conclusions reached by the Trustees were based on a comprehensive evaluation of all of the information provided and were not the result of any one factor. Moreover, each Trustee may have afforded different weight to the various factors in reaching his conclusions with respect to the Advisory Agreement.
Nature, Extent and Quality of Services. The Board noted that the Adviser was founded in 2007 and had approximately $34.5 million in assets under management for high net worth and institutional investors. The Board reviewed the background information of the key personnel responsible for managing the Fund and acknowledged their financial experience with managing hedge funds and registered funds. They considered the adviser’s investment process and its active management of the portfolio’s exposure using a data driven risk management metric called DVAM, which was designed to reduce equity exposure during extreme market volatility. They acknowledged that there were no cybersecurity incidents, material litigation or compliance issues reported to the Board. The Board concluded that the adviser was expected to continue providing high quality service to the Fund and its shareholders.
Performance. The Board considered the Fund’s performance, commenting that it underperformed its peer group median, category median and benchmark for all periods presented in the report. They noted that the Fund was a one-star Morningstar fund in the long-short equity category. The Board acknowledged the adviser’s assertions that defensive positions added to reduce volatility contributed to the Fund’s underperformance. The observed that the Fund’s Sortino and Sharpe ratios were in the second quartile related to its peer group over the one-year period. The Board concluded that the adviser should be given additional time to improve the Fund’s performance.
Fees and Expenses. The Board noted that the Fund paid the adviser an annual advisory fee of 1.35%, which was higher than the peer group and category average and median for the Fund, but well within the range of both comparable metrics. They considered the adviser’s assertion that the Fund’s above average fee was warranted given the specialized information, amount of time and knowledge, personnel and resources used by the adviser. The Board agreed that the Fund’s advisory fee was not unreasonable given the tactical nature of the Fund.
20
Profitability. The Board reviewed the profitability analysis provided by the adviser and noted that the adviser realized a modest profit over the past 12 months with respect to the Fund. The Board concluded that the adviser’s profitability was not excessive.
Economies of Scale. The Board considered whether economies of scale had been realized in connection with the advisory services provided to the Fund. They noted that based on the Fund’s current asset size, it was unlikely that any material economies of scale had been realized by the adviser. They also noted that PFM would consider a breakpoint for the Fund at higher asset levels and thus, the absence of breakpoints was acceptable at this time.
Conclusion. Having requested and received such information from the adviser as the Board believed to be reasonably necessary to evaluate the terms of each advisory agreement, and as assisted by the advice of counsel, the Board concluded that renewal of each advisory agreement was in the best interests of the Fund and its respective shareholders.
| * | Due to the timing of the contract renewal schedule, these deliberations may or may not relate to the current performance results of the Fund. |
21
| Probabilities Fund |
| SUPPLEMENTAL INFORMATION |
| December 31, 2022 |
LIQUIDITY RISK MANAGEMENT PROGRAM
The Fund has adopted and implemented a written liquidity risk management program as required by Rule 22e-4 (the “Liquidity Rule”) under the 1940 Act. The program is reasonably designed to assess and manage the Fund’s liquidity risk, taking into consideration, among other factors, the Fund’s investment strategies and the liquidity of their portfolio investments during normal and reasonably foreseeable stressed conditions; its short and long-term cash flow projections; and their cash holdings and access to other funding sources.
During the year ended December 31, 2022, the Trust’s Liquidity Risk Management Program Committee (the “Committee”) reviewed the Fund’s investments and determined that the Fund held adequate levels of cash and highly liquid investments to meet shareholder redemption activities in accordance with applicable requirements. Accordingly, the Committee concluded that (i) the Fund’s liquidity risk management program is reasonably designed to prevent violations of the Liquidity Rule and (ii) the Fund’s liquidity risk management program has been effectively implemented.
22
| Probabilities Fund |
| SUPPLEMENTAL INFORMATION (Unaudited) |
| December 31, 2022 |
The Trustees and the executive officers of the Trust are listed below with their present positions with the Trust and principal occupations over at least the last five years. The business address of each Trustee and Officer is 225 Pictoria Drive, Suite 450, Cincinnati, OH 45246. All correspondence to the Trustees and Officers should be directed to c/o Ultimus Fund Solutions, LLC, P.O. Box 541150, Omaha, Nebraska 68154.
Independent Trustees
| Name, Address and Year of Birth | Position/Term of Office* | Principal Occupation During the Past Five Years | Number of Portfolios in Fund Complex** Overseen by Trustee | Other Directorships held by Trustee During the Past Five Years |
| Mark Garbin Born in 1951 | Trustee Since 2013 | Managing Principal, Coherent Capital Management LLC (since 2007). | 1 | Northern Lights Fund Trust (for series not affiliated with the Funds since 2013); Two Roads Shared Trust (since 2012); Forethought Variable Insurance Trust (since 2013); Northern Lights Variable Trust (since 2013); OHA Mortgage Strategies Fund (offshore), Ltd. (2014-2017); and Altegris KKR Commitments Master Fund (since 2014); Carlyle Tactical Private Credit Fund (since March 2018) and Independent Director OHA CLO Enhanced Equity II Genpar LLP (since June 2021). |
| Mark D. Gersten Born in 1950 | Trustee Since 2013 | Independent Consultant (since 2012). | 1 | Northern Lights Fund Trust (for series not affiliated with the Funds since 2013); Northern Lights Variable Trust (since 2013); Two Roads Shared Trust (since 2012); Altegris KKR Commitments Master Fund (since 2014); previously, Ramius Archview Credit and Distressed Fund (2015-2017); and Schroder Global Series Trust (2012 to 2017). |
| Anthony J. Hertl Born in 1950 | Trustee Since 2005; Chairman of the Board since 2013 | Retired, previously held several positions in a major Wall Street firm including Capital Markets Controller, Director of Global Taxation, and CFO of the Specialty Finance Group. | 1 | Northern Lights Fund Trust (for series not affiliated with the Funds since 2005); Northern Lights Variable Trust (since 2006); Alternative Strategies Fund (since 2010); Satuit Capital Management Trust (2007-2019). |
| Gary W. Lanzen Born in 1954 | Trustee Since 2005 | Retired (since 2012). Formerly, Founder, President, and Chief Investment Officer, Orizon Investment Counsel, Inc. (2000-2012). | 1 | Northern Lights Fund Trust (for series not affiliated with the Funds since 2005) Northern Lights Variable Trust (since 2006); AdvisorOne Funds (since 2003); Alternative Strategies Fund (since 2010); and previously, CLA Strategic Allocation Fund (2014-2015). |
| John V. Palancia Born in 1954 | Trustee Since 2011 | Retired (since 2011). Formerly, Director of Futures Operations, Merrill Lynch, Pierce, Fenner & Smith Inc. (1975-2011). | 1 | Northern Lights Fund Trust (for series not affiliated with the Funds since 2011); Northern Lights Fund Trust III (since February 2012); Alternative Strategies Fund (since 2012) and Northern Lights Variable Trust (since 2011). |
| Mark H. Taylor Born in 1964 | Trustee Since 2007; Chairman of the Audit Committee since 2013 | Director, Lynn Pippenger School of Accountancy Muma College of Business, University of South Florida, Tampa FL (since 2019); Chair, Department of Accountancy and Andrew D. Braden Professor of Accounting and Auditing, Weatherhead School of Management, Case Western Reserve University (2009-2019); Vice President-Finance, American Accounting Association (2017-2020); President, Auditing Section of the American Accounting Association (2012-15). AICPA Auditing Standards Board Member (2009-2012). | 1 | Northern Lights Fund Trust (for series not affiliated with the Funds since 2007); Alternative Strategies Fund (since 2010); Northern Lights Fund Trust III (since 2012); and Northern Lights Variable Trust (since 2007). |
12/31/22 – NLFT_v1
23
| Probabilities Fund |
| SUPPLEMENTAL INFORMATION (Unaudited) (Continued) |
| December 31, 2022 |
Officers
| Name, Address and Year of Birth | Position/Term of Office* | Principal Occupation During the Past Five Years | Number of Portfolios in Fund Complex** Overseen by Trustee | Other Directorships held by Trustee During the Past Five Years |
| Kevin E. Wolf Born in 1969 | President Since June 2017 | Executive Vice President, Head of Fund Administration, and Product; Ultimus Fund Solutions, LLC (since 2020); Vice President of The Ultimus Group, LLC (since 2019); Executive Vice President, Gemini Fund Services, LLC (2019-2020); President, Gemini Fund Services, LLC (2012-2019); Treasurer of the Trust (2006-June 2017). | N/A | N/A |
| Eric Kane Born in 1981 | Vice President Since December 2022 | Vice President and Senior Managing Counsel, Ultimus Fund Solutions, LLC (since 2022); Vice President and Managing Counsel, Ultimus Fund Solutions, LLC (2020- 2022); Vice President and Counsel, Gemini Fund Services, LLC (2017-2020); Assistant Vice President, Gemini Fund Services, LLC (2014- 2017). | N/A | N/A |
| James Colantino Born in 1969 | Treasurer Since June 2017 | Senior Vice President Fund Administration, Ultimus Fund Solutions (since 2020); Senior Vice President Fund Administration, Gemini Fund Services, LLC (2012-2020); Assistant Treasurer of the Trust (2006-June 2017). | N/A | N/A |
| Stephanie Shearer Born in 1979 | Secretary Since February 2017 | Assistant Secretary of the Trust (2012-February 2017); Associate Director, Ultimus Fund Solutions (since 2022); Manager of Legal Administration, Ultimus Fund Solutions (2020-2022); Manager of Legal Administration, Gemini Fund Services, LLC (2018-2020); Senior Paralegal, Gemini Fund Services, LLC (2013-2018). | N/A | N/A |
| Michael J. Nanosky Born in 1966 | Chief Compliance Officer Since January 2021 | Chief Compliance Officer, of the Trust (since January 2021); Vice President-Senior Compliance Officer, Ultimus Fund Solutions (since 2020); Vice President, Chief Compliance Officer for Williamsburg Investment Trust (2020-current); Senior Vice President-Chief Compliance Officer, PNC Funds (2014-2019). | N/A | N/A |
| * | The term of office for each Trustee and officer listed above will continue indefinitely until the individual resigns or is removed. |
| ** | As of December 31, 2022, the Trust was comprised of 67 active portfolios managed by unaffiliated investment advisers. The term “Fund Complex” applies only to the Funds in the Trust advised by the Fund’s Adviser. The Funds do not hold themselves out as related to any other series within the Trust that is not advised by the Fund’s Adviser. |
The Funds’ SAI includes additional information about the Trustees and is available free of charge, upon request, by calling toll-free at 1-855-224-7204.
12/31/22 – NLFT_v1
24
PRIVACY NOTICE
Northern Lights Fund Trust
Rev. February 2014
| FACTS | WHAT DOES NORTHERN LIGHTS FUND TRUST DO WITH YOUR PERSONAL INFORMATION? |
| Why? | Financial companies choose how they share your personal information. Federal law gives consumers the right to limit some, but not all sharing. Federal law also requires us to tell you how we collect, share, and protect your personal information. Please read this notice carefully to understand what we do. |
| What? | The types of personal information we collect and share depends on the product or service that you have with us. This information can include:
● Social Security number and wire transfer instructions
● account transactions and transaction history
● investment experience and purchase history
When you are no longer our customer, we continue to share your information as described in this notice. |
| How? | All financial companies need to share customers’ personal information to run their everyday business. In the section below, we list the reasons financial companies can share their customers’ personal information; the reasons Northern Lights Fund Trust chooses to share; and whether you can limit this sharing. |
| Reasons we can share your personal information: | Does Northern Lights Fund Trust share information? | Can you limit this sharing? |
| For our everyday business purposes - such as to process your transactions, maintain your account(s), respond to court orders and legal investigations, or report to credit bureaus. | YES | NO |
| For our marketing purposes - to offer our products and services to you. | NO | We don’t share |
| For joint marketing with other financial companies. | NO | We don’t share |
| For our affiliates’ everyday business purposes - information about your transactions and records. | NO | We don’t share |
| For our affiliates’ everyday business purposes - information about your credit worthiness. | NO | We don’t share |
| For nonaffiliates to market to you | NO | We don’t share |
| QUESTIONS? | Call 1-402-493-4603 |
25
PRIVACY NOTICE
Northern Lights Fund Trust
| Page 2 |
| What we do: | |
How does Northern Lights Fund Trust protect my personal information? | To protect your personal information from unauthorized access and use, we use security measures that comply with federal law. These measures include computer safeguards and secured files and buildings.
Our service providers are held accountable for adhering to strict policies and procedures to prevent any misuse of your nonpublic personal information. |
How does Northern Lights Fund Trust collect my personal information? | We collect your personal information, for example, when you ● open an account or deposit money
● direct us to buy securities or direct us to sell your securities
● seek advice about your investments
We also collect your personal information from others, such as credit bureaus, affiliates, or other companies. |
Why can’t I limit all sharing? | Federal law gives you the right to limit only: ● sharing for affiliates’ everyday business purposes – information about your creditworthiness.
● affiliates from using your information to market to you.
● sharing for nonaffiliates to market to you.
State laws and individual companies may give you additional rights to limit sharing. |
| Definitions | |
| Affiliates | Companies related by common ownership or control. They can be financial and nonfinancial companies.
● Northern Lights Fund Trust does not share with our affiliates. |
| Nonaffiliates | Companies not related by common ownership or control. They can be financial and nonfinancial companies.
● Northern Lights Fund Trust does not share with nonaffiliates so they can market to you. |
| Joint marketing | A formal agreement between nonaffiliated financial companies that together market financial products or services to you.
● Northern Lights Fund Trust doesn’t jointly market. |
26
Investment Adviser
Probabilities Fund Management, LLC
200 Mamaroneck Ave, Suite 300
White Plains, NY 10601
Administrator
Ultimus Fund Solutions, LLC
80 Arkay Drive, Suite 110
Hauppauge, NY 11788
How to Obtain Proxy Voting Information
Information regarding how the Fund voted proxies relating to portfolio securities for the most recent 12 month period ended June 30th as well as a description of the policies and procedures that the Fund used to determine how to vote proxies is available without charge, upon request, by calling 1-855-224-7204 or by referring to the Securities and Exchange Commission’s (“SEC”) website at http://www.sec.gov.
How to Obtain 1st and 3rd Fiscal Quarter Portfolio Holdings
The Fund files its complete schedule of portfolio holdings with the SEC for the first and third quarters of each fiscal year on Form N-PORT. Form N-PORT is available on the SEC’s website at http://www.sec.gov and may be reviewed and copied at the SEC’s Public Reference Room in Washington, DC (1-800-SEC-0330). The information on Form N-PORT is available without charge, upon request, by calling 1-855-224-7204.
Probabilities-A22
Item 2. Code of Ethics.
(a) As of the end of the period covered by this report, the registrant has adopted a code of ethics that applies to the registrant's principal executive officer, principal financial officer, principal accounting officer or controller, or persons performing similar functions, regardless of whether these individuals are employed by the registrant or a third party.
(b) For purposes of this item, “code of ethics” means written standards that are reasonably designed to deter wrongdoing and to promote:
| (1) | Honest and ethical conduct, including the ethical handling of actual or apparent conflicts of interest between personal and professional relationships; |
| (2) | Full, fair, accurate, timely, and understandable disclosure in reports and documents that a registrant files with, or submits to, the Commission and in other public communications made by the registrant; | |
| (3) | Compliance with applicable governmental laws, rules, and regulations; |
| (4) | The prompt internal reporting of violations of the code to an appropriate person or persons identified in the code; and | |
| (5) | Accountability for adherence to the code. |
(c) Amendments: During the period covered by the report, there have not been any amendments to the provisions of the code of ethics.
(d) Waivers: During the period covered by the report, the registrant has not granted any express or implicit waivers from the provisions of the code of ethics.
(e) The Code of Ethics is not posted on Registrant’ website.
(f) A copy of the Code of Ethics is attached as an exhibit.
Item 3. Audit Committee Financial Expert.
(a) The Registrant’s board of trustees has determined that Anthony J. Hertl is an audit committee financial expert, as defined in Item 3 of Form N-CSR. Mr. Hertl is independent for purposes of this Item
Item 4. Principal Accountant Fees and Services.
| (a) | Audit Fees |
12/31/2022 - $14,050
12/31/2021 - $14,000
12/31/2020 - $9,500
9/30/2020 - $15,500
| (b) | Audit-Related Fees |
12/31/2022 - None
12/31/2021 - None
12/31/2020 - None
9/30/2020 - None
| (c) | Tax Fees |
12/31/2022 - $3,440
12/31/2021 - $3,100
12/31/2020 - $3,100
9/30/2020 - $3,400
Preparation of Federal & State income tax returns, assistance with calculation of required income, capital gain and excise distributions and preparation of Federal excise tax returns.
| (d) | All Other Fees |
12/31/2022 - None
12/31/2021 - None
12/31/2020 - None
9/30/2020 - None
| (e) | (1) Audit Committee’s Pre-Approval Policies |
The registrant’s Audit Committee is required to pre-approve all audit services and, when appropriate, any non-audit services (including audit-related, tax and all other services) to the registrant. The registrant’s Audit Committee also is required to pre-approve, when
appropriate, any non-audit services (including audit-related, tax and all other services) to its adviser, or any entity controlling, controlled by or under common control with the adviser that provides ongoing services to the registrant, to the extent that the services may be determined to have an impact on the operations or financial reporting of the registrant. Services are reviewed on an engagement by engagement basis by the Audit Committee.
| (2) | Percentages of Services Approved by the Audit Committee |
2022 2021
Audit-Related Fees: 0.00% 0.00%
Tax Fees: 0.00% 0.00%
All Other Fees: 0.00% 0.00%
| (f) | During the audit of registrant's financial statements for the most recent fiscal year, less than 50 percent of the hours expended on the principal accountant's engagement were attributed to work performed by persons other than the principal accountant's full-time, permanent employees. |
| (g) | The aggregate non-audit fees billed by the registrant's accountant for services rendered to the registrant, and rendered to the registrant's investment adviser (not including any sub-adviser whose role is primarily portfolio management and is subcontracted with or overseen by another investment adviser), and any entity controlling, controlled by, or under common control with the adviser that provides ongoing services to the registrant: |
12/31/2022 - $3,440
12/31/2021 - $3,100
12/31/2020 - $3,100
9/30/2020 - $3,250
(h) The registrant's audit committee has considered whether the provision of non-audit services to the registrant's investment adviser (not including any sub-adviser whose role is primarily portfolio management and is subcontracted with or overseen by another investment adviser), and any entity controlling, controlled by, or under common control with the investment adviser that provides ongoing services to the registrant, that were not pre-approved pursuant to paragraph (c)(7)(ii) of Rule 2-01 of Regulation S-X, is compatible with maintaining the principal accountant's independence.
Item 5. Audit Committee of Listed Companies. Not applicable to open-end investment companies.
Item 6. Schedule of Investments. Schedule of investments in securities of unaffiliated issuers is included under Item 1.
Item 7. Disclosure of Proxy Voting Policies and Procedures for Closed-End Funds. Not applicable to open-end investment companies.
Item 8. Portfolio Managers of Closed-End Management Investment Companies. Not applicable to open-end investment companies.
Item 9. Purchases of Equity Securities by Closed-End Funds. Not applicable to open-end investment companies.
Item 10. Submission of Matters to a Vote of Security Holders. None
Item 11. Controls and Procedures.
(a) Based on an evaluation of the Registrant’s disclosure controls and procedures as of a date within 90 days of filing date of this Form N-CSR, the principal executive officer and principal financial officer of the Registrant have concluded that the disclosure controls and procedures of the Registrant are reasonably designed to ensure that the information required in filings on Form N-CSR is recorded, processed, summarized, and reported by the filing date, including that information required to be disclosed is accumulated and communicated to the Registrant’s management, including the Registrant’s principal executive officer and principal financial officer, as appropriate to allow timely decisions regarding required disclosure.
(b) There were no significant changes in the Registrant’s internal control over financial reporting that occurred during the Registrant’s last fiscal half-year that have materially affected, or are reasonably likely to materially affect, the Registrant’s internal control over financial reporting.
Item 12. Disclosure of securities lending activities for closed-end management investment companies. Not applicable to open-end investment companies.
Item 13. Exhibits.
(a)(1) Code of Ethics filed herewith.
(a)(3) Not applicable for open-end investment companies.
SIGNATURES
Pursuant to the requirements of the Securities Exchange Act of 1934 and the Investment Company Act of 1940, the registrant has duly caused this report to be signed on its behalf by the undersigned, thereunto duly authorized.
(Registrant) Northern Lights Fund Trust
By (Signature and Title)
*/s/ Kevin E. Wolf
Kevin E. Wolf, Principal Executive Officer/President
Date 3/10/23
Pursuant to the requirements of the Securities Exchange Act of 1934 and the Investment Company Act of 1940, this report has been signed below by the following persons on behalf of the registrant and in the capacities and on the dates indicated.
By (Signature and Title)
*/s/ Kevin E. Wolf
Kevin E. Wolf, Principal Executive Officer/President
Date 3/10/23
By (Signature and Title)
*/s/ Jim Colantino
Jim Colantino, Principal Financial Officer/Treasurer
Date 3/10/23