Exhibit 99.2
|

IHS AND MARKIT TO MERGE
Creating a global leader in critical information, analytics and solutions
March 21, 2016
|
Forward-looking statements
This communication contains “forward-looking statements” within the meaning of the federal securities laws, including Section 27A of the Securities Act of 1933, as amended, and Section 21E of the Securities Exchange Act of 1934, as amended. In this context, forward-looking statements often address expected future business and financial performance and financial condition, and often contain words such as “expect,” “anticipate,” “intend,” “plan,” “believe,” “seek,” “see,” “will,” “would,” “target,” similar expressions, and variations or negatives of these words. Forward-looking statements by their nature address matters that are, to different degrees, uncertain, such as statements about the consummation of the proposed transaction and the anticipated benefits thereof. These and other forward-looking statements, including the failure to consummate the proposed transaction or to make or take any filing or other action required to consummate such transaction on a timely matter or at all, are not guarantees of future results and are subject to risks, uncertainties and assumptions that could cause actual results to differ materially from those expressed in any forward-looking statements. Important risk factors that may cause such a difference include, but are not limited to, (i) the completion of the proposed transaction on anticipated terms and timing, including obtaining shareholder or stockholder (as applicable) and regulatory approvals, anticipated tax treatment, unforeseen liabilities, future capital expenditures, revenues, expenses, earnings, synergies, economic performance, indebtedness, financial condition, losses, future prospects, business and management strategies for the management, expansion and growth of the combined company’s operations and other conditions to the completion of the merger, (ii) the ability of IHS and Markit to integrate the business successfully and to achieve anticipated synergies, risks and costs, (iii) potential litigation relating to the proposed transaction that could be instituted against IHS, Markit or their respective directors, (iv) the risk that disruptions from the proposed transaction will harm IHS’s and Markit’s business, including current plans and operations, (v) the ability of IHS or Markit to retain and hire key personnel, (vi) potential adverse reactions or changes to business relationships resulting from the announcement or completion of the merger, (vii) continued availability of capital and financing and rating agency actions, (viii) legislative, regulatory and economic developments, (ix) potential business uncertainty, including changes to existing business relationships, during the pendency of the merger that could affect IHS’s and/or Markit’s financial performance, (x) certain restrictions during the pendency of the merger that may impact IHS’s or Markit’s ability to pursue certain business opportunities or strategic transactions and (xi) unpredictability and severity of catastrophic events, including, but not limited to, acts of terrorism or outbreak of war or hostilities, as well as management’s response to any of the aforementioned factors. These risks, as well as other risks associated with the proposed merger, will be more fully discussed in the joint proxy statement/prospectus that will be included in the registration statement on Form F-4 that will be filed with the SEC in connection with the proposed merger. While the list of factors presented here is, and the list of factors to be presented in the registration statement on Form F-4 are, considered representative, no such list should be considered to be a complete statement of all potential risks and uncertainties. Unlisted factors may present significant additional obstacles to the realization of forward-looking statements. Consequences of material differences in results as compared with those anticipated in the forward-looking statements could include, among other things, business disruption, operational problems, financial loss, legal liability to third parties and similar risks, any of which could have a material adverse effect on IHS’ or Markit’s consolidated financial condition, results of operations, credit rating or liquidity. Neither IHS nor Markit assumes any obligation to publicly provide revisions or updates to any forward-looking statements, whether as a result of new information, future developments or otherwise, should circumstances change, except as otherwise required by securities and other applicable laws.
Non-IFRS and non-GAAP financial measures
Non-GAAP and non-IFRS results are presented only as a supplement to IHS’s and Markit’s financial statements based on GAAP and IFRS, respectively. Non-GAAP and non-IFRS financial information is provided to enhance understanding of IHS’s and Markit’s financial performance, but none of these non-GAAP and non-IFRS financial measures are recognized terms under IFRS or GAAP and non-GAAP and non-IFRS measures should not be considered in isolation from, or as a substitute analysis for, IHS’s or Markit’s results of operations as determined in accordance with GAAP and IFRS, respectively. Definitions and reconciliations of non-GAAP and non-IFRS measures to the most directly comparable GAAP or IFRS measures are provided within the appendix to this presentation.
IHS and Markit use non-GAAP and non-IFRS measures in their respective operational and financial decision making, and believe that it is useful to exclude certain items in order to focus on what they regard to be a more reliable indicator of the underlying operating performance of the business. As a result, internal management reports feature non-GAAP and non-IFRS measures which are also used to prepare strategic plans and annual budgets and review management compensation. IHS and Markit also believe that investors may find non-GAAP and non-IFRS financial measures useful for the same reasons, although investors are cautioned that non-GAAP and non-IFRS financial measures are not a substitute for GAAP and IFRS disclosures.
Non-GAAP and non-IFRS measures are frequently used by securities analysts, investors and other interested parties in their evaluation of companies comparable to IHS and Markit, many of which present non-GAAP and non-IFRS measures when reporting their results. Non-GAAP and non-IFRS measures have limitations as an analytical tool. They are not presentations made in accordance with GAAP or IFRS, are not measures of financial condition or liquidity and should not be considered as an alternative to profit or loss for the period determined in accordance with GAAP or IFRS or operating cash flows determined in accordance with GAAP or IFRS. Non-GAAP and non-IFRS measures are not necessarily comparable to similarly titled measures used by other companies. As a result, you should not consider such performance measures in isolation from, or as a substitute analysis for, IHS’s and Markit’s respective results of operations as determined in accordance with GAAP and IFRS, respectively.
This presentation also includes certain forward-looking non-IFRS or non-GAAP financial measures, such as combined free cash flow, adjusted diluted EPS and Adjusted EBITDA Margin. We are unable to present a quantitative reconciliation of this forward-looking non-IFRS or non-GAAP financial information because management cannot reliably predict all of the necessary components of such measures. Accordingly, investors are cautioned not to place undue reliance on this information.
Finally, IHS operates under a fiscal year that ends on November 30th of each year, while Markit operates under a fiscal year that ends on December 31st of each year. Unless otherwise indicated, the combined information in this presentation is based on the results of IHS and Markit for each of their respective fiscal years, without any adjustment for the fact that the companies have different fiscal year ends.
2
|
Important Information About the Transaction and Where to Find It
In connection with the proposed transaction, Markit will file with the Securities and Exchange Commission (“SEC”) a registration statement on Form F-4 that will include a joint proxy statement of IHS and Markit. IHS and Markit may also file other documents with the SEC regarding the proposed transaction. This document is not a substitute for the joint proxy statement/prospectus or registration statement or any other document which IHS or Markit may file with the SEC. INVESTORS AND SECURITY HOLDERS OF IHS AND MARKIT ARE URGED TO READ THE REGISTRATION STATEMENT, THE JOINT PROXY STATEMENT/PROSPECTUS AND ANY OTHER RELEVANT DOCUMENTS THAT ARE FILED OR WILL BE FILED WITH THE SEC, AS WELL AS ANY AMENDMENTS OR SUPPLEMENTS TO THESE DOCUMENTS, CAREFULLY AND IN THEIR ENTIRETY BECAUSE THEY CONTAIN OR WILL CONTAIN IMPORTANT INFORMATION ABOUT THE PROPOSED TRANSACTION AND RELATED MATTERS. Investors and security holders may obtain free copies of the registration statement and the joint proxy statement/prospectus (when available) and other documents filed with the SEC by IHS and Markit through the web site maintained by the SEC at www.sec.gov or by contacting the investor relations department of IHS or Markit at the following:
IHS MARKIT
15 Inverness Way East 4th Floor, Ropemaker Place,
Englewood, CO 80112 25 Ropemaker Street, London England EC2Y 9LY Attention: Investor Relations Attention: Investor Relations
+1 989-636-1463 +44 20 7260 2000
Participants in the Solicitation
IHS, Markit, and their respective directors and executive officers may be deemed to be participants in the solicitation of proxies in respect of the proposed transaction. Information regarding IHS’s directors and executive officers, and their direct or indirect interests in the transaction, by security holdings or otherwise, is contained in IHS’s Form 10-K for the year ended November 30, 2015 and its proxy statement filed on February 24, 2016, which are filed with the SEC. Information regarding the directors and executive officers of Markit, and their direct or indirect interests in the transaction, by security holdings or otherwise, is contained in Markit’s 20-F for the year ended December 31, 2015, and Markit’s proxy statement filed on Form 6-K on March 27, 2015, which are filed with the SEC. A more complete description will be available in the registration statement on Form F-4 and the joint proxy statement/prospectus.
No Offer or Solicitation
This communication is not intended to and shall not constitute an offer to sell or the solicitation of an offer to sell or the solicitation of an offer to buy any securities or a solicitation of any vote of approval, nor shall there be any sale of securities in any jurisdiction in which such offer, solicitation or sale would be unlawful prior to registration or qualification under the securities laws of any such jurisdiction. No offer of securities shall be made except by means of a prospectus meeting the requirements of Section 10 of the Securities Act of 1933, as amended.
3
|

Leadership
Jerre Stead
Chairman & CEO
Lance Uggla
President, Board Member
4
|
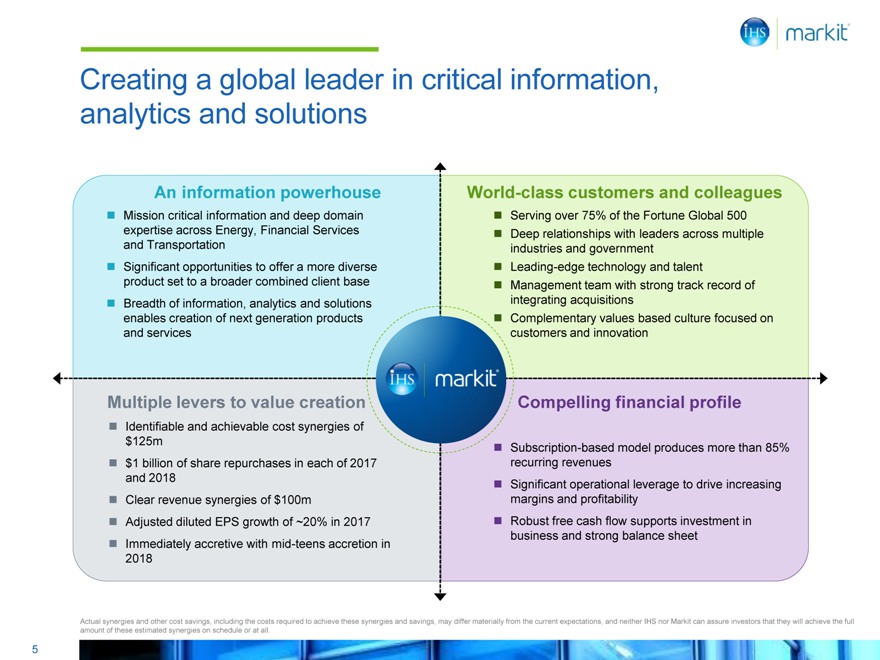
Creating a global leader in critical information, analytics and solutions
An information powerhouse
Mission critical information and deep domain expertise across Energy, Financial Services and Transportation Significant opportunities to offer a more diverse product set to a broader combined client base Breadth of information, analytics and solutions enables creation of next generation products and services
World-class customers and colleagues
Serving over 75% of the Fortune Global 500 Deep relationships with leaders across multiple industries and government Leading-edge technology and talent Management team with strong track record of integrating acquisitions Complementary values based culture focused on customers and innovation
Multiple levers to value creation
Identifiable and achievable cost synergies of $125m $1 billion of share repurchases in each of 2017 and 2018 Clear revenue synergies of $100m Adjusted diluted EPS growth of ~20% in 2017 Immediately accretive with mid-teens accretion in 2018
Compelling financial profile
Subscription-based model produces more than 85% recurring revenues Significant operational leverage to drive increasing margins and profitability Robust free cash flow supports investment in business and strong balance sheet
Actual synergies and other cost savings, including the costs required to achieve these synergies and savings, may differ materially from the current expectations, and neither IHS nor Markit can assure investors that they will achieve the full amount of these estimated synergies on schedule or at all.
5
|
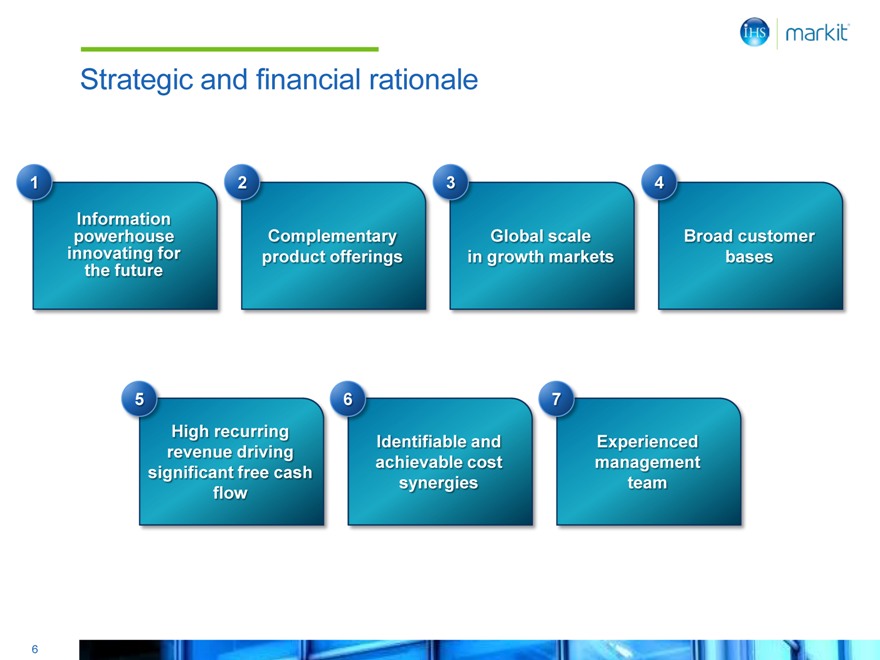
Strategic and financial rationale
1 2 3 4
Information
powerhouse Complementary Global scale Broad customer
innovating for product offerings in growth markets bases
the future
5 6 7
High recurring Identifiable and Experienced
revenue driving achievable cost management
significant free cash synergies team
flow
6
|
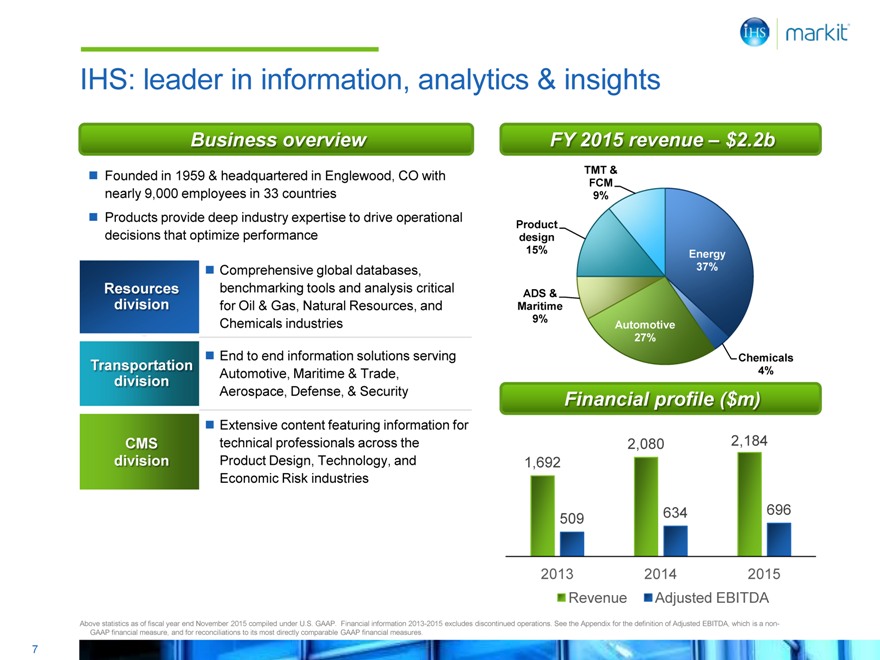
IHS: leader in information, analytics & insights
Business overview
Founded in 1959 & headquartered in Englewood, CO with nearly 9,000 employees in 33 countries Products provide deep industry expertise to drive operational decisions that optimize performance
Comprehensive global databases, benchmarking tools and analysis critical for Oil & Gas, Natural Resources, and Chemicals industries
End to end information solutions serving Automotive, Maritime & Trade, Aerospace, Defense, & Security
Extensive content featuring information for technical professionals across the Product Design, Technology, and Economic Risk industries
Resources division
Transportation division
CMS division
FY 2015 revenue – $ 2.2b
TMT &
FCM
9%
Product
design
15% Energy
37%
ADS &
Maritime
9% Automotive
27%
Chemicals
4%
Financial profile ($m)
2,080 2,184
1,692
509 634 696
2013 2014 2015
Revenue Adjusted EBITDA
Above statistics as of fiscal year end November 2015 compiled under U.S. GAAP. Financial information 2013-2015 excludes discontinued operations. See the Appendix for the definition of Adjusted EBITDA, which is a non-GAAP financial measure, and for reconciliations to its most directly comparable GAAP financial measures.
7
|
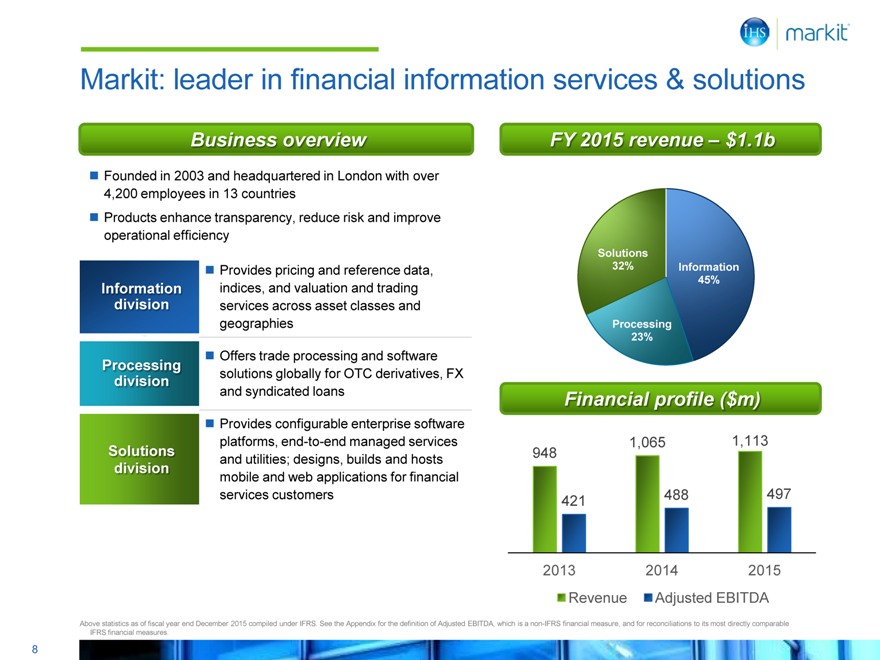
Markit: leader in financial information services & solutions
Business overview
Founded in 2003 and headquartered in London with over 4,200 employees in 13 countries Products enhance transparency, reduce risk and improve operational efficiency
Provides pricing and reference data, indices, and valuation and trading services across asset classes and geographies
Offers trade processing and software solutions globally for OTC derivatives, FX and syndicated loans
Provides configurable enterprise software platforms, end-to-end managed services and utilities; designs, builds and hosts mobile and web applications for financial services customers
Information division
Processing division
Solutions division
FY 2015 revenue – $ 1.1b
Solutions
32% Information
45%
Processing
23%
Financial profile ($m)
948 1,065 1,113
421 488 497
2013 2014 2015
Revenue Adjusted EBITDA
Above statistics as of fiscal year end December 2015 compiled under IFRS. See the Appendix for the definition of Adjusted EBITDA, which is a non-IFRS financial measure, and for reconciliations to its most directly comparable IFRS financial measures.
8
|
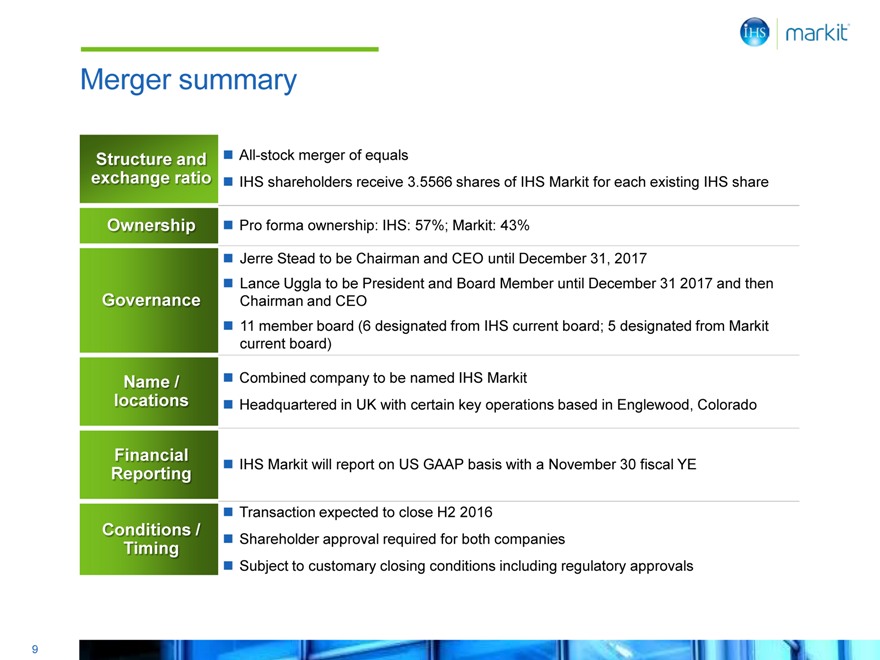
Merger summary
All-stock merger of equals
IHS shareholders receive 3.5566 shares of IHS Markit for each existing IHS share
Pro forma ownership: IHS: 57%; Markit: 43%
Jerre Stead to be Chairman and CEO until December 31, 2017
Lance Uggla to be President and Board Member until December 31 2017 and then Chairman and CEO
11 member board (6 designated from IHS current board; 5 designated from Markit current board)
Combined company to be named IHS Markit
Headquartered in UK with certain key operations based in Englewood, Colorado
IHS Markit will report on US GAAP basis with a November 30 fiscal YE
Transaction expected to close H2 2016
Shareholder approval required for both companies
Subject to customary closing conditions including regulatory approvals
Structure and exchange ratio
Ownership
Governance
Name / locations
Financial Reporting
Conditions / Timing
9
|
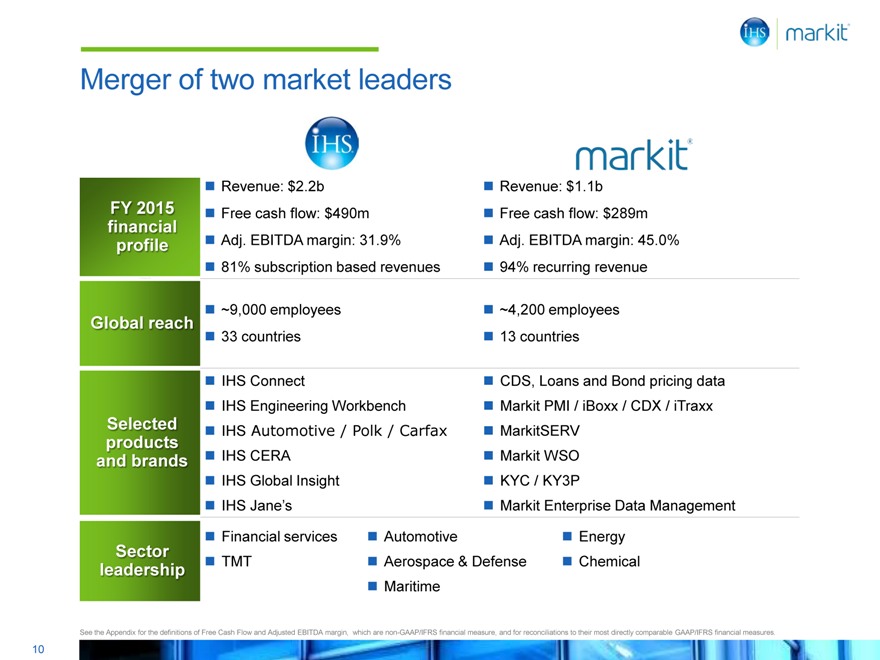
Merger of two market leaders
FY 2015 financial profile
Global reach
Selected products and brands
Sector leadership
Revenue: $2.2b Free cash flow: $490m Adj. EBITDA margin: 31.9% 81% subscription based revenues
~9,000 employees 33 countries
IHS Connect
IHS Engineering Workbench
IHS Automotive / Polk / Carfax
IHS CERA IHS Global Insight IHS Jane’s
Revenue: $1.1b Free cash flow: $289m Adj. EBITDA margin: 45.0% 94% recurring revenue
~4,200 employees 13 countries
CDS, Loans and Bond pricing data Markit PMI / iBoxx / CDX / iTraxx MarkitSERV
Markit WSO KYC / KY3P
Markit Enterprise Data Management
Financial services TMT
Automotive
Aerospace & Defense Maritime
Energy Chemical
See the Appendix for the definitions of Free Cash Flow and Adjusted EBITDA margin, which are non-GAAP/IFRS financial measure, and for reconciliations to their most directly comparable GAAP/IFRS financial measures.
10
|
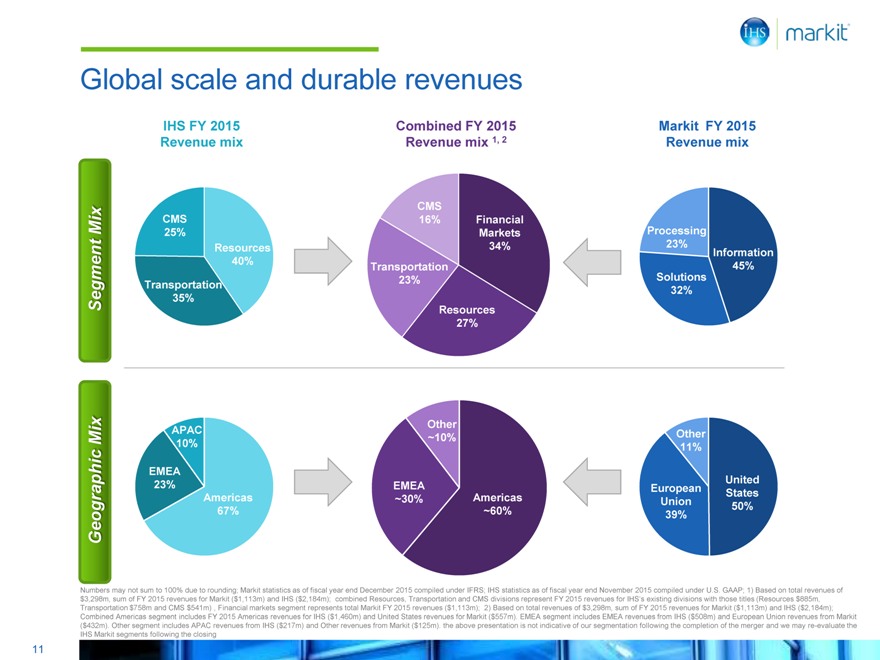
Global scale and durable revenues
IHS FY 2015 Combined FY 2015 Markit FY 2015
Revenue mix Revenue mix 1, 2 Revenue mix
CMS
Mix CMS 16% Financial
25% Markets Processing
Resources 34% 23% Information
40% Transportation 45%
Transportation 23% Solutions
Segment 35% 32%
Resources
27%
Mix APAC Other ~10% Other
10% 11%
EMEA
United
23% Americas EMEA ~30% Americas European Union States
Geographic 67% ~60% 39% 50%
Numbers may not sum to 100% due to rounding; Markit statistics as of fiscal year end December 2015 compiled under IFRS; IHS statistics as of fiscal year end November 2015 compiled under U.S. GAAP; 1) Based on total revenues of $3,298m, sum of FY 2015 revenues for Markit ($1,113m) and IHS ($2,184m); combined Resources, Transportation and CMS divisions represent FY 2015 revenues for IHS’s existing divisions with those titles (Resources $885m, Transportation $758m and CMS $541m) , Financial markets segment represents total Markit FY 2015 revenues ($1,113m); 2) Based on total revenues of $3,298m, sum of FY 2015 revenues for Markit ($1,113m) and IHS ($2,184m); Combined Americas segment includes FY 2015 Americas revenues for IHS ($1,460m) and United States revenues for Markit ($557m). EMEA segment includes EMEA revenues from IHS ($508m) and European Union revenues from Markit
($432m). Other segment includes APAC revenues from IHS ($217m) and Other revenues from Markit ($125m). the above presentation is not indicative of our segmentation following the completion of the merger and we may re-evaluate the IHS Markit segments following the closing
11
|
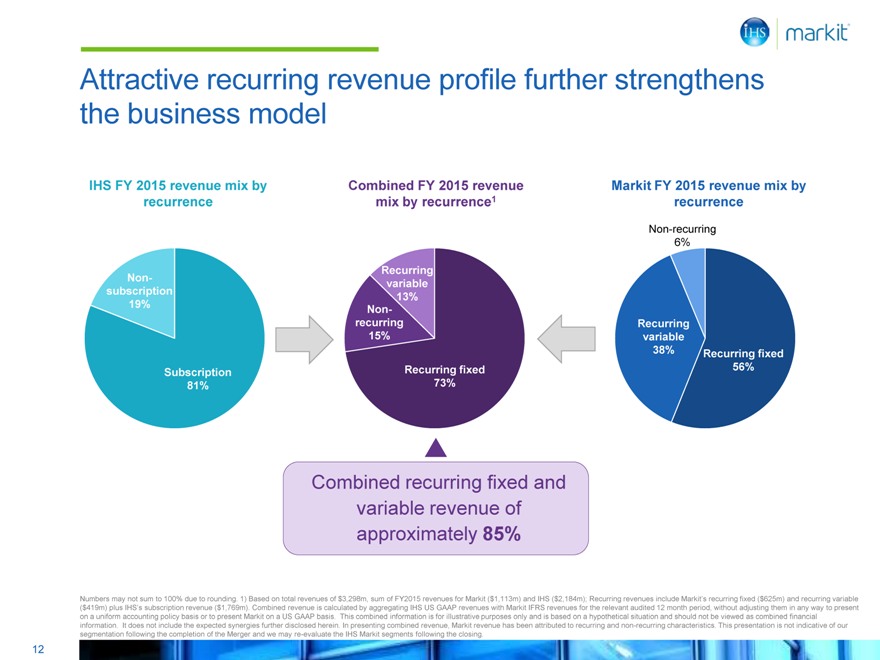
Attractive recurring revenue profile further strengthens the business model
IHS FY 2015 revenue mix by Combined FY 2015 revenue Markit FY 2015 revenue mix by
recurrence mix by recurrence1 recurrence
Non-recurring
6%
Recurring
Non- variable
subscription 13%
19% Non-
recurring Recurring
15% variable
38% Recurring fixed
Subscription Recurring fixed 56%
81% 73%
Combined recurring fixed and
variable revenue of
approximately 85%
Numbers may not sum to 100% due to rounding. 1) Based on total revenues of $3,298m, sum of FY2015 revenues for Markit ($1,113m) and IHS ($2,184m); Recurring revenues include Markit’s recurring fixed ($625m) and recurring variable
($419m) plus IHS’s subscription revenue ($1,769m). Combined revenue is calculated by aggregating IHS US GAAP revenues with Markit IFRS revenues for the relevant audited 12 month period, without adjusting them in any way to present on a uniform accounting policy basis or to present Markit on a US GAAP basis. This combined information is for illustrative purposes only and is based on a hypothetical situation and should not be viewed as combined financial information. It does not include the expected synergies further disclosed herein. In presenting combined revenue, Markit revenue has been attributed to recurring and non-recurring characteristics. This presentation is not indicative of our segmentation following the completion of the Merger and we may re-evaluate the IHS Markit segments following the closing.
12
|
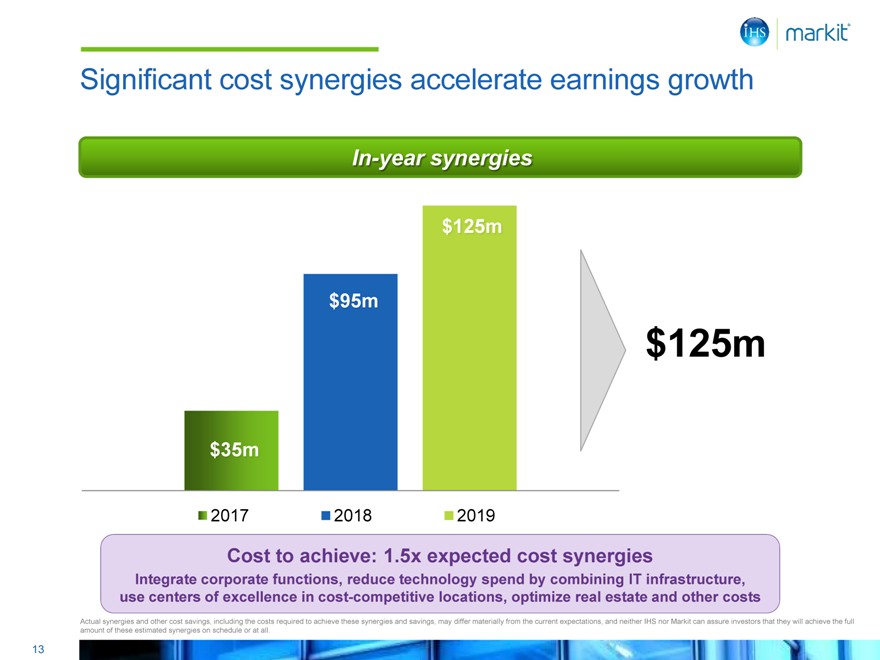
Significant cost synergies accelerate earnings growth
In-year synergies
$125m
$95m
$125m
$35m
2017 2018 2019
Cost to achieve: 1.5x expected cost synergies
Integrate corporate functions, reduce technology spend by combining IT infrastructure, use centers of excellence in cost-competitive locations, optimize real estate and other costs
Actual synergies and other cost savings, including the costs required to achieve these synergies and savings, may differ materially from the current expectations, and neither IHS nor Markit can assure investors that they will achieve the full amount of these estimated synergies on schedule or at all.
13
|
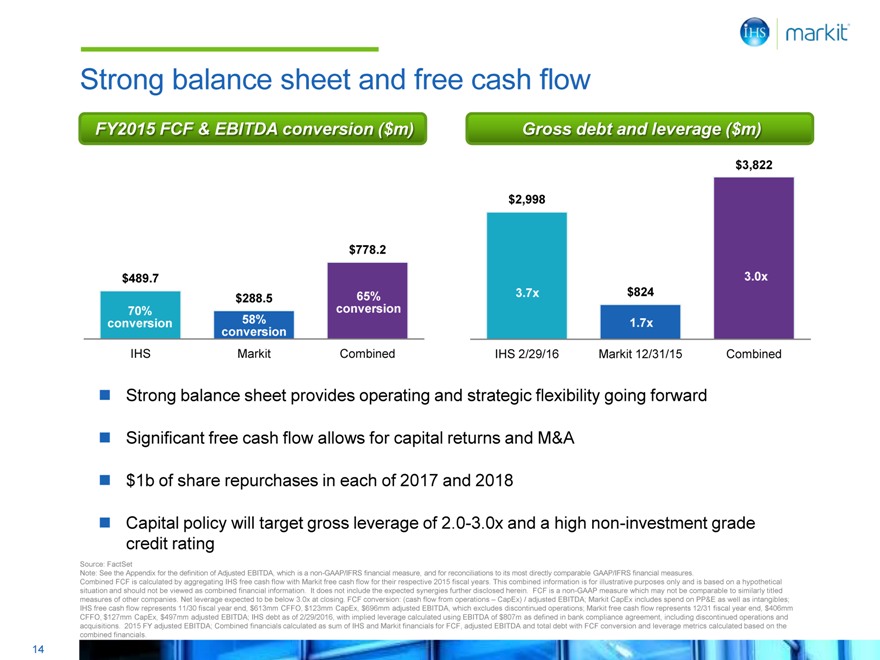
Strong balance sheet and free cash flow
FY2015 FCF & EBITDA conversion ($m) Gross debt and leverage ($m)
$3,822
$2,998
$778.2
$489.7
3.0x
$288.5
65% 3.7x $824
70% conversion
conversion 58% 1.7x
conversion
IHS Markit Combined IHS 2/29/16 Markit 12/31/15 Combined
Strong balance sheet provides operating and strategic flexibility going forward Significant free cash flow allows for capital returns and M&A $1b of share repurchases in each of 2017 and 2018
Capital policy will target gross leverage of 2.0-3.0x and a high non-investment grade credit rating
Source: FactSet
Note: See the Appendix for the definition of Adjusted EBITDA, which is a non-GAAP/IFRS financial measure, and for reconciliations to its most directly comparable GAAP/IFRS financial measures.
Combined FCF is calculated by aggregating IHS free cash flow with Markit free cash flow for their respective 2015 fiscal years. This combined information is for illustrative purposes only and is based on a hypothetical situation and should not be viewed as combined financial information. It does not include the expected synergies further disclosed herein. FCF is a non-GAAP measure which may not be comparable to similarly titled measures of other companies. Net leverage expected to be below 3.0x at closing. FCF conversion: (cash flow from operations – CapEx) / adjusted EBITDA; Markit CapEx includes spend on PP&E as well as intangibles; IHS free cash flow represents 11/30 fiscal year end, $613mm CFFO, $123mm CapEx, $696mm adjusted EBITDA, which excludes discontinued operations; Markit free cash flow represents 12/31 fiscal year end, $406mm CFFO, $127mm CapEx, $497mm adjusted EBITDA; IHS debt as of 2/29/2016, with implied leverage calculated using EBITDA of $807m as defined in bank compliance agreement, including discontinued operations and acquisitions. 2015 FY adjusted EBITDA; Combined financials calculated as sum of IHS and Markit financials for FCF, adjusted EBITDA and total debt with FCF conversion and leverage metrics calculated based on the combined financials.
14
|
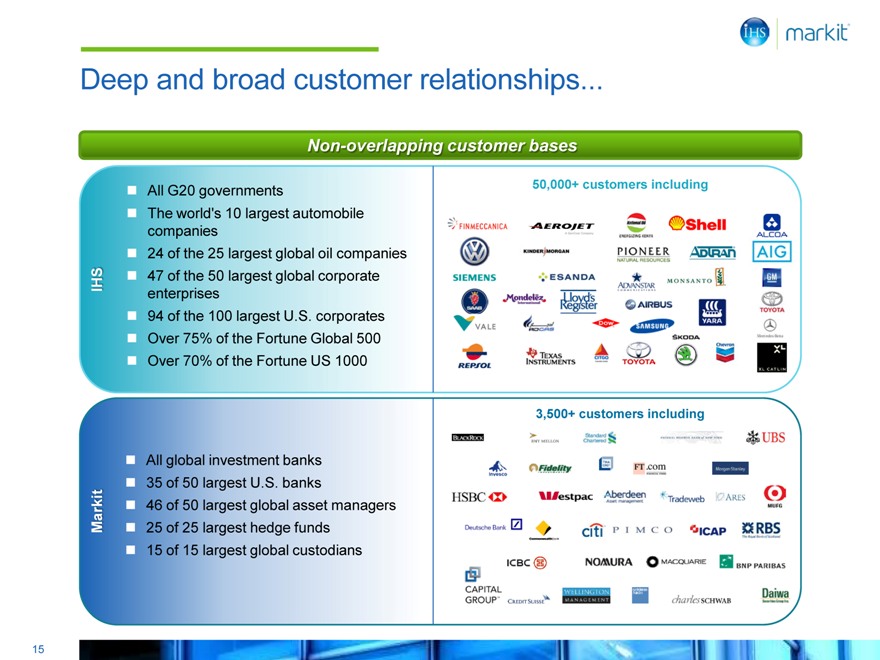
Deep and broad customer relationships
Non-overlapping customer bases
All G20 governments
The world’s 10 largest automobile companies 24 of the 25 largest global oil companies 47 of the 50 largest global corporate enterprises 94 of the 100 largest U.S. corporates Over 75% of the Fortune Global 500 Over 70% of the Fortune US 1000
All global investment banks 35 of 50 largest U.S. banks
46 of 50 largest global asset managers 25 of 25 largest hedge funds 15 of 15 largest global custodians
50,000+ customers including
Markit IHS
3,500+ customers including
15
|
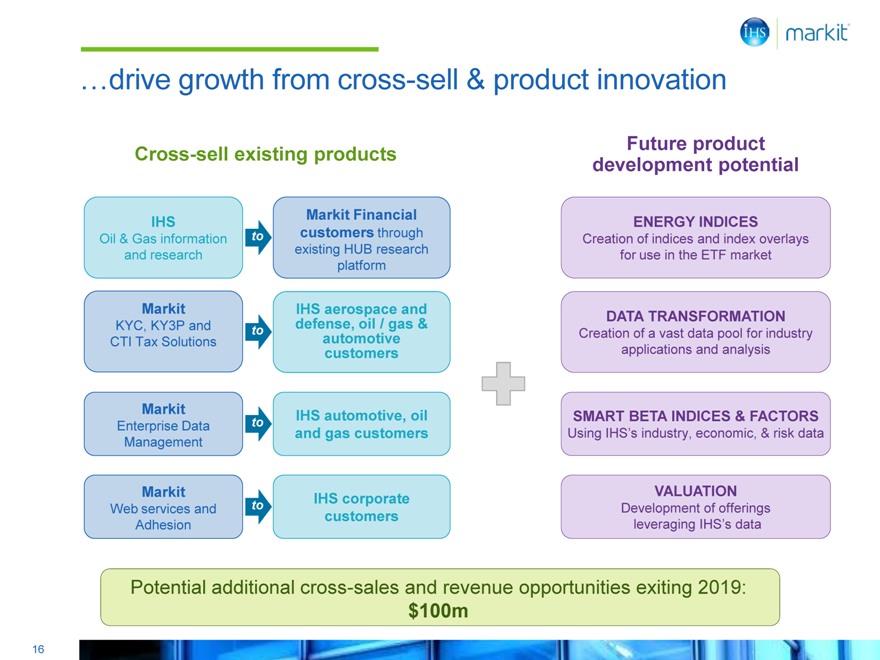
…drive growth from cross-sell & product innovation
Cross-sell existing products Future product
development potential
IHS Markit Financial ENERGY INDICES
Oil & Gas information to customers through Creation of indices and index overlays
and research existing HUB research for use in the ETF market
platform
Markit IHS aerospace and
KYC, KY3P and to defense, oil / gas & Creation DATA of a TRANSFORMATION vast data pool for industry
CTI Tax Solutions automotive
customers applications and analysis
Markit IHS automotive, oil SMART BETA INDICES & FACTORS
Enterprise Data to and gas customers Using IHS’s industry, economic, & risk data
Management
Markit IHS corporate VALUATION
Web services and to Development of offerings
customers
Adhesion leveraging IHS’s data
Potential additional cross-sales and revenue opportunities exiting 2019: $100m
16
|
Driving value through M&A integration
Successful integration of acquisitions built into business model of both firms
Track record of synergy achievement through cross- and up-selling of acquired products / customer bases
Shared culture will promote smooth integration
Management teams fully aligned on integration and strategic goals
17
|
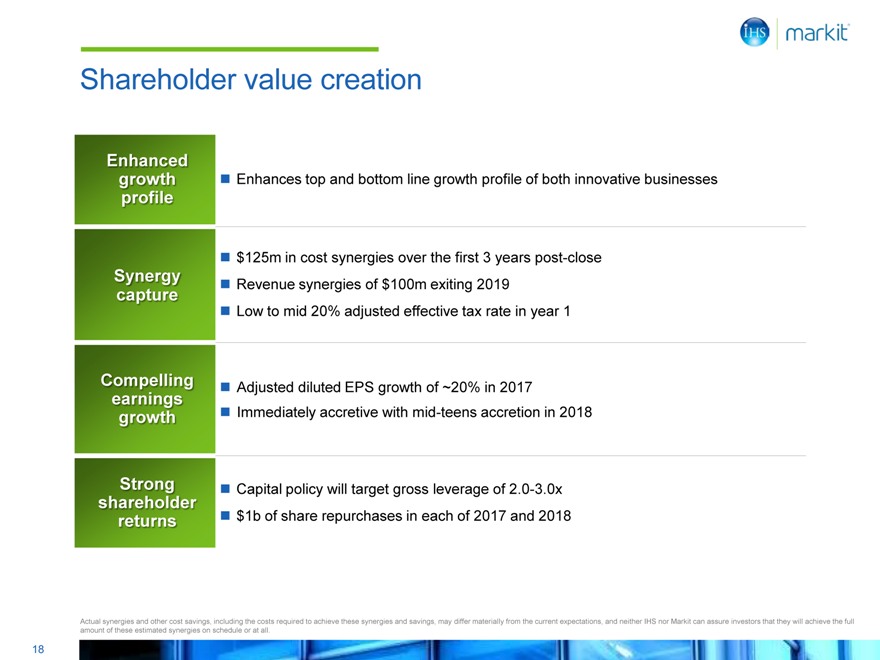
Shareholder value creation
Enhances top and bottom line growth profile of both innovative businesses
$125m in cost synergies over the first 3 years post-close Revenue synergies of $100m exiting 2019 Low to mid 20% adjusted effective tax rate in year 1
Adjusted diluted EPS growth of ~20% in 2017
Immediately accretive with mid-teens accretion in 2018
Capital policy will target gross leverage of 2.0-3.0x $1b of share repurchases in each of 2017 and 2018
Enhanced growth profile
Synergy capture
Compelling earnings growth
Strong shareholder returns
Actual synergies and other cost savings, including the costs required to achieve these synergies and savings, may differ materially from the current expectations, and neither IHS nor Markit can assure investors that they will achieve the full amount of these estimated synergies on schedule or at all.
18
|
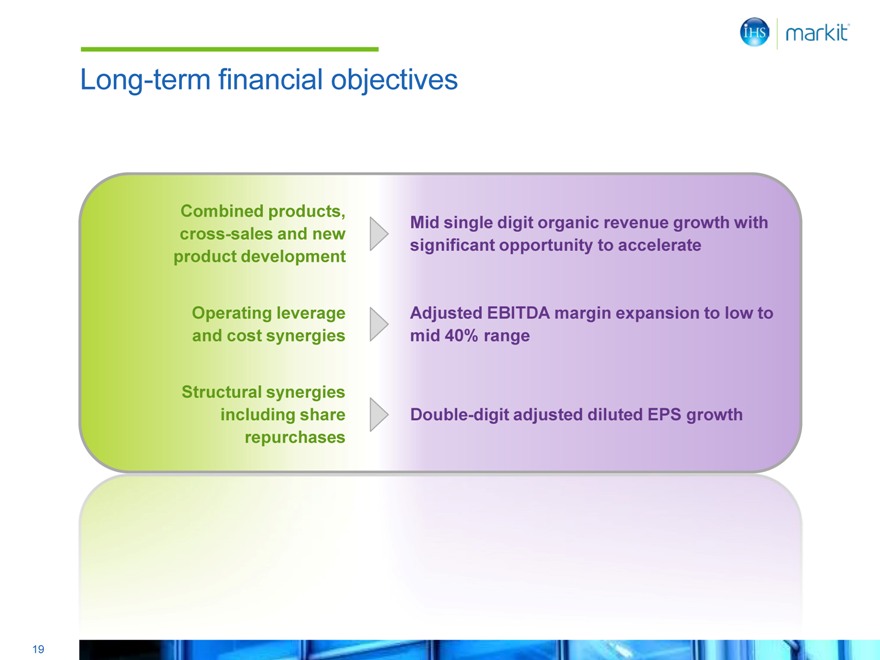
Long-term financial objectives
Combined products,
cross-sales and new Mid single digit organic revenue growth with
product development significant opportunity to accelerate
Operating leverage Adjusted EBITDA margin expansion to low to
and cost synergies mid 40% range
Structural synergies
including share Double-digit adjusted diluted EPS growth
repurchases
19
|

Appendix
20
|
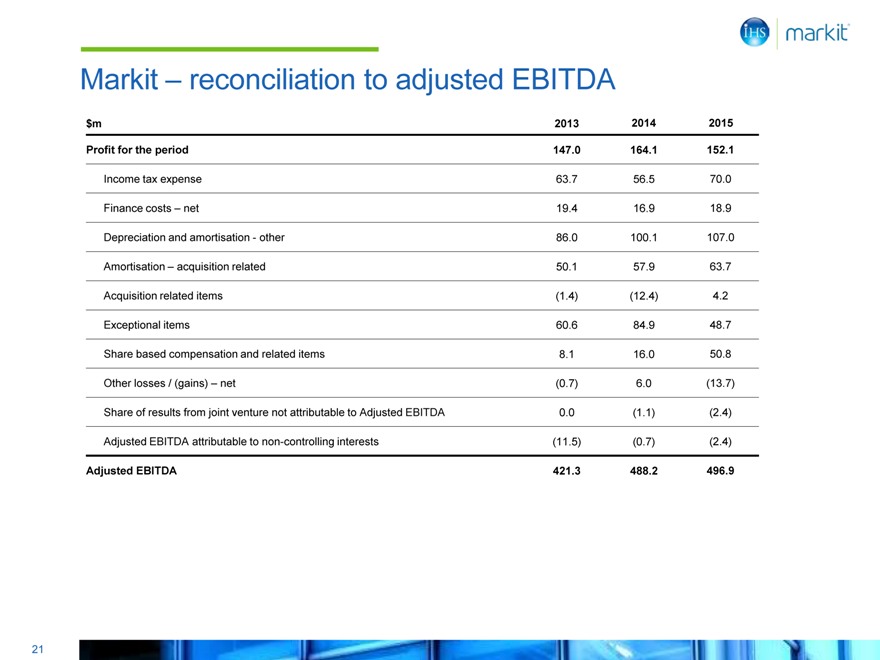
Markit – reconciliation to adjusted EBITDA
$m 2013 2014 2015
Profit for the period 147.0 164.1 152.1
Income tax expense 63.7 56.5 70.0
Finance costs – net 19.4 16.9 18.9
Depreciation and amortisation—other 86.0 100.1 107.0
Amortisation – acquisition related 50.1 57.9 63.7
Acquisition related items (1.4) (12.4) 4.2
Exceptional items 60.6 84.9 48.7
Share based compensation and related items 8.1 16.0 50.8
Other losses / (gains) – net (0.7) 6.0 (13.7)
Share of results from joint venture not attributable to Adjusted EBITDA 0.0 (1.1) (2.4)
Adjusted EBITDA attributable to non-controlling interests (11.5) (0.7) (2.4)
Adjusted EBITDA 421.3 488.2 496.9
21
|
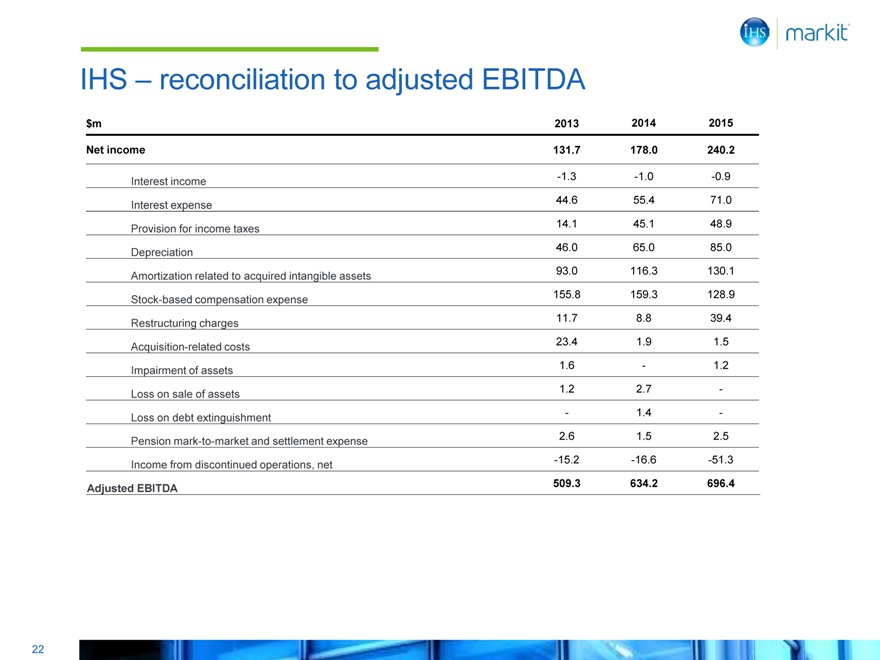
IHS – reconciliation to adjusted EBITDA
$m 2013 2014 2015
Net income 131.7 178.0 240.2
Interest income -1.3 -1.0 -0.9
Interest expense 44.6 55.4 71.0
Provision for income taxes 14.1 45.1 48.9
Depreciation 46.0 65.0 85.0
Amortization related to acquired intangible assets 93.0 116.3 130.1
Stock-based compensation expense 155.8 159.3 128.9
Restructuring charges 11.7 8.8 39.4
Acquisition-related costs 23.4 1.9 1.5
Impairment of assets 1.6 — 1.2
Loss on sale of assets 1.2 2.7 -
Loss on debt extinguishment — 1.4 -
Pension mark-to-market and settlement expense 2.6 1.5 2.5
Income from discontinued operations, net -15.2 -16.6 -51.3
Adjusted EBITDA 509.3 634.2 696.4
22
|
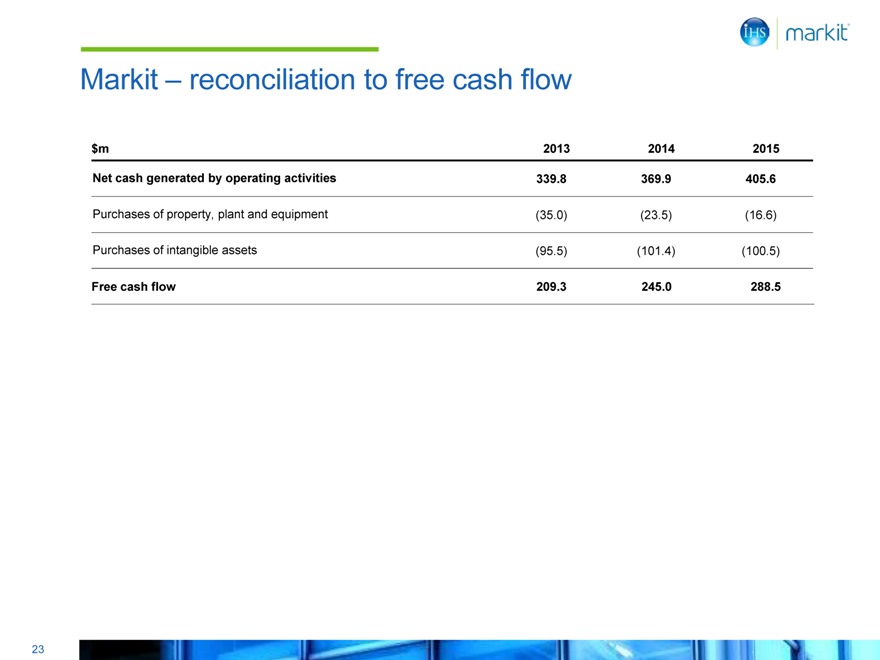
Markit – reconciliation to free cash flow
$m 2013 2014 2015
Net cash generated by operating activities 339.8 369.9 405.6
Purchases of property, plant and equipment (35.0) (23.5) (16.6)
Purchases of intangible assets (95.5) (101.4) (100.5)
Free cash flow 209.3 245.0 288.5
23
|
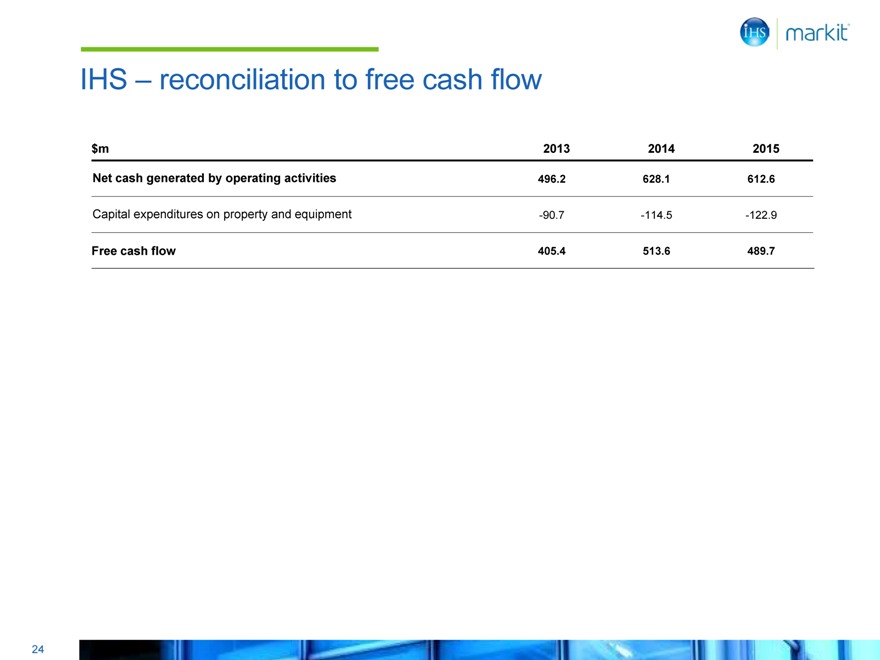
IHS – reconciliation to free cash flow
$m 2013 2014 2015
Net cash generated by operating activities 496.2 628.1 612.6
Capital expenditures on property and equipment -90.7 -114.5 -122.9
Free cash flow 405.4 513.6 489.7
24
|
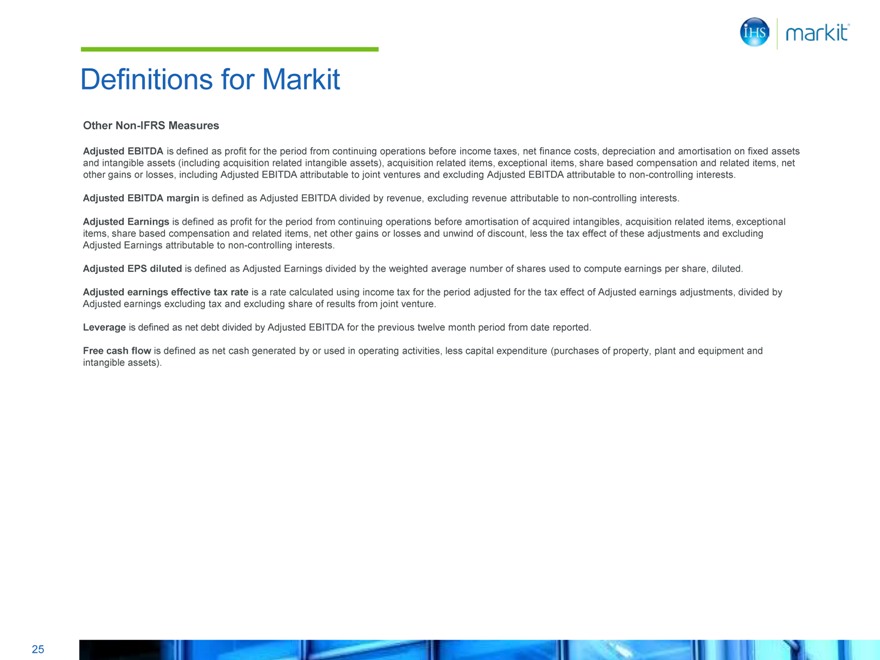
Definitions for Markit
Other Non-IFRS Measures
Adjusted EBITDA is defined as profit for the period from continuing operations before income taxes, net finance costs, depreciation and amortisation on fixed assets and intangible assets (including acquisition related intangible assets), acquisition related items, exceptional items, share based compensation and related items, net other gains or losses, including Adjusted EBITDA attributable to joint ventures and excluding Adjusted EBITDA attributable to non-controlling interests.
Adjusted EBITDA margin is defined as Adjusted EBITDA divided by revenue, excluding revenue attributable to non-controlling interests.
Adjusted Earnings is defined as profit for the period from continuing operations before amortisation of acquired intangibles, acquisition related items, exceptional items, share based compensation and related items, net other gains or losses and unwind of discount, less the tax effect of these adjustments and excluding Adjusted Earnings attributable to non-controlling interests.
Adjusted EPS diluted is defined as Adjusted Earnings divided by the weighted average number of shares used to compute earnings per share, diluted.
Adjusted earnings effective tax rate is a rate calculated using income tax for the period adjusted for the tax effect of Adjusted earnings adjustments, divided by Adjusted earnings excluding tax and excluding share of results from joint venture.
Leverage is defined as net debt divided by Adjusted EBITDA for the previous twelve month period from date reported.
Free cash flow is defined as net cash generated by or used in operating activities, less capital expenditure (purchases of property, plant and equipment and intangible assets).
25
|
Definitions for IHS
Other Non-GAAP Measures
Adjusted EBITDA further excludes from EBITDA primarily non-cash items and other items that we do not consider to be useful in assessing our operating performance (e.g., stock-based compensation expense, restructuring charges, acquisition-related costs, asset impairment charges, gain or loss on sale of assets, gain or loss on debt extinguishment, pension mark-to-market and settlement expense, and income or loss from discontinued operations).
Free cash flow is defined as net cash provided by operating activities less capital expenditures.
26