QuickLinks -- Click here to rapidly navigate through this document
As filed with the Securities and Exchange Commission on April 15, 2005
Registration No. 333-122749
Securities and Exchange Commission
Washington, D.C. 20549
Amendment No. 1
to
FORM S-1
REGISTRATION STATEMENT UNDER THE SECURITIES ACT OF 1933
COFFEYVILLE RESOURCES, INC.
(Exact Name of Registrant as Specified in Its Charter)
| Delaware | 2911 | 22-2269010 | ||
| (State or Other Jurisdiction of Incorporation or Organization) | (Primary Standard Industrial Classification Code Number) | (I.R.S. Employer Identification Number) |
10 East Cambridge Circle Drive
Kansas City, Kansas 66103
(913) 982-0500
(Address, Including Zip Code, and Telephone Number, Including Area Code, of Registrant's Principal Executive Offices)
Philip L. Rinaldi
Coffeyville Resources, Inc.
10 East Cambridge Circle Drive
Kansas City, Kansas 66103
(913) 982-0500
(Name, Address, Including Zip Code, and Telephone Number, Including Area Code, of Agent for Service)
With a copy to:
| Bruce S. Mendelsohn Akin, Gump, Strauss, Hauer & Feld, L.L.P. Robert S. Strauss Building 1333 New Hampshire Avenue Washington, D.C. 20036 Telephone: (202) 887-4000 | Peter M. Labonski Latham & Watkins LLP 885 Third Avenue New York, NY 10022 Telephone: (212) 906-1200 |
Approximate date of commencement of proposed sale to the public: As soon as practicable on or after the effective date of this Registration Statement.
If any of the securities being registered on this form are to be offered on a delayed or continuous basis pursuant to Rule 415 under the Securities Act of 1933, check the following box. o
If this form is filed to register additional securities for an offering pursuant to Rule 462(b) under the Securities Act, please check the following box and list the Securities Act registration statement number of the earlier effective registration statement for the same offering. o
If this form is a post-effective amendment filed pursuant to Rule 462(c) under the Securities Act, check the following box and list the Securities Act registration statement number of the earlier effective registration statement for the same offering. o
If this form is a post-effective amendment filed pursuant to Rule 462(d) under the Securities Act, check the following box and list the Securities Act registration statement number of the earlier effective registration statement for the same offering. o
If delivery of the prospectus is expected to be made pursuant to Rule 434, please check the following box. o
CALCULATION OF REGISTRATION FEE
| Title of Shares to be Registered | Proposed Maximum Aggregate Offering Price(1)(2) | Amount of Registration Fee | ||
|---|---|---|---|---|
| Common Stock, $0.01 par value | $300,000,000 | $35,310(3) | ||
- (1)
- Includes offering price of shares which the underwriters have the option to purchase solely to cover over-allotments, if any.
- (2)
- Estimated solely for the purpose of calculating the registration fee pursuant to Rule 457(o) of the Securities Act of 1933, as amended.
- (3)
- Previously paid.
The registrant hereby amends this registration statement on such date or dates as may be necessary to delay its effective date until the registrant shall file a further amendment which specifically states that this registration statement shall thereafter become effective in accordance with Section 8(a) of the Securities Act of 1933, as amended, or until the registration statement shall become effective on such date as the Securities and Exchange Commission, acting pursuant to said Section 8(a), may determine.
SUBJECT TO COMPLETION, DATED APRIL 15, 2005.
The information in this prospectus is not complete and may be changed. We may not sell these securities until the registration statement filed with the Securities and Exchange Commission is effective. This prospectus is not an offer to sell these securities and it is not soliciting an offer to buy these securities in any state where the offer or sale is not permitted.
Shares

Coffeyville Resources, Inc.
Common Stock
Prior to this offering there has been no public market for our common stock. The initial public offering price of the common stock is expected to be between $ and $ per share. We intend to apply to list our common stock on the Nasdaq National Market under the symbol " ."
We are selling shares of common stock in this offering and the selling stockholders are selling shares of common stock in this offering. We will not receive any proceeds from the sale of shares by the selling stockholders.
The underwriters have an option to purchase a maximum of additional shares from the selling stockholders to cover over-allotments.
Investing in our common stock involves risks. See "Risk Factors" on page 11.
| | Price to Public | Underwriting Discounts and Commissions | Proceeds to Coffeyville Resources, Inc. | Proceeds to the Selling Stockholders | ||||
|---|---|---|---|---|---|---|---|---|
| Per Share | $ | $ | $ | $ | ||||
| Total | $ | $ | $ | $ |
Delivery of the shares of common stock will be made on or about , 2005.
Neither the Securities and Exchange Commission nor any state securities commission has approved or disapproved of these securities or determined if this prospectus is truthful or complete. Any representation to the contrary is a criminal offense.
| Credit Suisse First Boston | Jefferies & Company, Inc. |
The date of this prospectus is , 2005.
| | Page | |
|---|---|---|
| PROSPECTUS SUMMARY | 1 | |
| RISK FACTORS | 11 | |
| CAUTIONARY NOTE REGARDING FORWARD-LOOKING STATEMENTS | 25 | |
| USE OF PROCEEDS | 26 | |
| DIVIDEND POLICY | 26 | |
| CAPITALIZATION | 27 | |
| DILUTION | 28 | |
| UNAUDITED PRO FORMA CONDENSED CONSOLIDATED STATEMENTS OF OPERATIONS | 29 | |
| SELECTED HISTORICAL CONSOLIDATED FINANCIAL DATA | 32 | |
| MANAGEMENT'S DISCUSSION AND ANALYSIS OF FINANCIAL CONDITION AND RESULTS OF OPERATIONS | 36 | |
| INDUSTRY OVERVIEW | 62 | |
| BUSINESS | 75 | |
| MANAGEMENT | 102 | |
| PRINCIPAL AND SELLING STOCKHOLDERS | 108 | |
RELATED PARTY TRANSACTIONS | 110 | |
| DESCRIPTION OF OUR INDEBTEDNESS | 113 | |
| DESCRIPTION OF CAPITAL STOCK | 118 | |
| SHARES ELIGIBLE FOR FUTURE SALE | 120 | |
| UNDERWRITING | 121 | |
| NOTICE TO CANADIAN RESIDENTS | 125 | |
| LEGAL MATTERS | 126 | |
| EXPERTS | 126 | |
| WHERE YOU CAN FIND MORE INFORMATION | 127 | |
| GLOSSARY OF SELECTED TERMS | 128 | |
| INDEX TO CONSOLIDATED FINANCIAL STATEMENTS | F-1 |
You should rely only on the information contained in this document or to which we have referred you. We have not authorized anyone to provide you with information that is different. This document may only be used where it is legal to sell these securities. The information in this document may only be accurate on the date of this document. We will amend or supplement this document as required by law.
Dealer Prospectus Delivery Obligation
Until , 2005, all dealers that effect transactions in these securities, whether or not participating in this offering, may be required to deliver a prospectus. This is in addition to the dealer's obligation to deliver a prospectus when acting as an underwriter and with respect to unsold allotments or subscriptions.
i
This summary highlights information about Coffeyville Resources, Inc. and the offering contained elsewhere in this prospectus. You should carefully read the entire prospectus, including the "Risk Factors" and our consolidated financial statements and related notes included elsewhere in this prospectus before making an investment decision. In this prospectus, all references to "Coffeyville," "the Company," "we," "us," and "our" refer to Coffeyville Resources, Inc. and its consolidated subsidiaries, unless the context otherwise requires or where otherwise indicated. You should also see the "Glossary of Selected Terms" beginning on page 128 for definitions of some of the terms we use to describe our business and industry.
Our Company
We are one of the largest independent high complexity petroleum refiners and marketers in the mid-continental U.S. and the lowest cost producer and marketer of upgraded nitrogen fertilizer products in North America. Our operations are organized into two business segments: petroleum and nitrogen fertilizer. Our petroleum business includes a complex cracking/coking oil refinery in Coffeyville, Kansas, a crude oil gathering system throughout Kansas and Northern Oklahoma, and storage and terminalling facilities for asphalt and refined fuels in Phillipsburg, Kansas. Our refinery operates in close proximity to our primary customer base and benefits from favorable crude oil supply and product distribution logistics. Our nitrogen fertilizer business in Coffeyville, Kansas, includes a petroleum coke gasification plant that produces high purity hydrogen that is converted to ammonia at our ammonia plant and upgraded to urea ammonium nitrate (UAN) at our UAN plant. Our position as the only commercial nitrogen fertilizer plant in North America utilizing a coke gasification process to produce nitrogen fertilizers provides us with a significant competitive advantage due to high prevailing and volatile natural gas prices. On a pro forma basis, we generated revenue of $1.3 billion and $1.7 billion during the fiscal years ended December 31, 2003 and 2004, respectively, an increase of 31%. On a pro forma basis for the same periods, net income was $17.9 million and $59.8 million, respectively, an increase of 234% and our earnings before net interest, taxes, depreciation and amortization (EBITDA), was $32.5 million and $116.5 million, respectively, an increase of 258%.
Petroleum Business
We produce at a throughput of 100,000 barrels per day (bpd), which accounts for approximately 15% of the production of the seven fuels refineries located in the mid-continental U.S. Our cracking/coking refinery has a modified Solomon complexity of approximately 8.8 and Nelson complexity of approximately 9.7, making ours one of the more complex refineries in our region. This complexity allows us to process heavier, less expensive, crude oil compared to competitors with less complex facilities, and still produce a high percentage of high-value, clean transportation fuels such as gasoline and diesel.
We primarily target customers in the Midwestern states where regional demand for petroleum products has exceeded regional refining production. As a result of our geographic location, we do not incur the high cost of transporting refined products to customers in the Midwest compared to refiners located outside the Midwest. Consequently, we estimate our region's refining margins have exceeded Gulf Coast refining margins by approximately $1.93 per barrel on average for the last four years.
Nitrogen Fertilizer Business
We operate the only commercial nitrogen fertilizer plant in North America utilizing a coke gasification process to generate hydrogen feedstock that is converted to ammonia and UAN. By using petroleum coke rather than natural gas as a raw material, we currently have a significant cost advantage over North American natural gas based fertilizer producers. In addition, we benefit
1
economically from high prevailing natural gas prices because fertilizer prices tend to rise with natural gas prices.
We obtain approximately 80% of the petroleum coke we use at our nitrogen fertilizer plant from our adjacent refinery. The use of coke as a raw material in our fertilizer plant also provides a superior value to our refinery's coke, which would otherwise be sold at significantly lower economic value, as is the current practice in the industry. Coke is also readily available in the open market. Our plant produces approximately 370,000 tons per annum of ammonia. We upgrade approximately two-thirds of our ammonia into approximately 638,000 tons per annum of high value UAN (5.6% of U.S. demand), bringing our salable product to approximately 755,000 tons per annum. Due to our close proximity to our nitrogen fertilizer customers and favorable access to transportation logistics, we believe we also enjoy a freight advantage over U.S. Gulf Coast ammonia importers of approximately $65 per ton and over U.S. Gulf Coast UAN importers of approximately $37 per ton. Such cost differentials represent a significant portion of the market price of these commodities.
Market Trends
We have identified several key factors we believe lead to a favorable outlook for the refining and nitrogen fertilizer industries for the next several years.
For the refining industry, these factors include:
- •
- Continued strong demand as well as supply restrictions experienced since the 1990s are expected to continue as the demand for refined products continues to exceed increases in refining capacity.
- •
- Continued excess availability of lower cost sour and heavy sour crude oil is expected to provide a cost advantage to complex refiners with the ability to process these crude oils.
- •
- Increasing reliance on imports to satisfy demand for refined products and lower ability to meet region-specific refined products specifications will favor regional refiners with transportation cost advantages.
- •
- More products based on new and evolving fuel specifications, such as ultra-low sulfur content, will require refiners to blend and process these boutique fuels and exert pressure on product availability.
- •
- High capital costs, excess capacity, and environmental regulatory requirements have severely limited the construction of new refineries in the U.S. over the past thirty years.
For the nitrogen fertilizer industry, these factors include:
- •
- Persistently high natural gas prices, a deficit in natural gas supply and increased demand for natural gas in North America are expected to result in reduced production of natural gas based nitrogen fertilizer products in the U.S. and will help maintain high nitrogen fertilizer prices in the central Midwestern U.S., or the U.S. farm belt, the largest market for nitrogen fertilizer products in the U.S.
- •
- The combined impact of a growing world population, improving diets, and low grain inventories will drive grain prices and productions worldwide and consequently drive high nitrogen and nitrogen based fertilizer prices.
2
Competitive Strengths
Strong Oil Refining Industry Fundamentals
Throughout the U.S., expected annual increases in demand continue to exceed expected increases in refining capacity. As a consequence, there has been a shortage of refined products as evidenced by inventories of refined products, especially gasoline, below their historical averages. These nationwide trends are more pronounced in our marketing region and have benefited us economically.
Strong Nitrogen Fertilizer Industry Fundamentals
We expect the current high nitrogen fertilizer prices to prevail in North America for the foreseeable future due to strong demand from the farming industry and rising grain prices, as well as strong natural gas prices, a deficit in North American ammonia and UAN production and a shortage of fertilizer transportation infrastructure into the mid-continent market where nitrogen fertilizer is primarily consumed.
Regional Focus and Strategic Location
We are located in close proximity to our customers and we benefit from favorable crude oil supply and product distribution logistics, including access to pipelines and railroads in our petroleum and nitrogen fertilizer businesses, respectively. As a result, we believe that our low transportation costs enable us to capture higher margins than similar refineries outside the Midwest.
Efficient, Modern Asset Base
Since 1994, approximately $188 million has been invested to modernize our oil refinery to make it one of the more advanced in our region and to meet environmental regulations. Similarly, between 1999 and 2002, approximately $370 million was invested in our nitrogen fertilizer plant. Our nitrogen fertilizer plant's gasification process uses less than 1% of the natural gas used by natural gas based nitrogen fertilizer plants and emits significantly less pollutants during normal operations compared to other nitrogen fertilizer facilities.
Low Input and Operational Costs
Our refinery is capable of processing heavy sour crude oil, which has become an increasing share of global crude oil production and which tends to be less expensive than lighter, sweeter crudes and contributes to higher margins. In addition, we estimate that our fertilizer plant retains its competitive advantage at natural gas prices in the range of $1.50 to $2.50 per million Btu and above, depending on variations in the UAN premium and logistics costs. This price level is generally low by historical industry standards and our cost advantage is more pronounced at current natural gas prices, which have generally fluctuated between $5.00 and $8.00 per million Btu since the end of 2003.
Experienced Management Team
We have a highly experienced management team, averaging over 23 years of industry experience. Under the leadership of our chief executive officer, Philip L. Rinaldi, we have made significant operational improvements, which have reduced operating costs and increased stockholder value.
Our Business Strategy
We have executed several key strategic initiatives that we believe have significantly enhanced our competitive position and improved our financial and operational performance. Our goal is to continue to be a premier independent refiner and marketer of high-value, clean transportation fuels and
3
producer of ammonia and UAN. We believe that this offering will strengthen our ability to execute the following strategic objectives:
- •
- Continue to take advantage of favorable supply and demand dynamics in the Midwest.
- •
- Selectively invest in high-return projects that enhance our operating efficiency and expand our capacity while rigorously controlling costs.
- •
- Increase our sales and supply capabilities of boutique fuels, UAN, and other high-value products, while finding cheaper sources of raw materials.
- •
- Continue to focus on being a reliable, low-cost supplier to our existing and new customers.
- •
- Continue to devote significant time and resources toward improving the reliability, safety and environmental performance of our operations.
Our History
Prior to March 3, 2004, our assets were operated as a small component of Farmland Industries, Inc. (Farmland), an agricultural cooperative. Farmland filed for bankruptcy protection on May 31, 2002. Coffeyville Resources, LLC, a subsidiary of Coffeyville Group Holdings, LLC, won the bankruptcy court auction for Farmland's petroleum business and a nitrogen fertilizer plant and completed the purchase of these assets on March 3, 2004. Throughout this prospectus we refer to this purchase as the Acquisition.
Other Transactions
Prior to the completion of this offering:
- •
- We intend to complete a reorganization pursuant to which the five direct subsidiaries of Coffeyville Group Holdings, LLC will merge with and into us, in exchange for which we will issue 74,852,941 shares of our common stock to Coffeyville Group Holdings, LLC. Coffeyville Group Holding, LLC will then distribute shares of our common stock to certain of its members.
- •
- We intend to liquidate our joint venture with The Leiber Group, Inc., which may include, to the extent required by the terms of the joint venture, a distribution of cash by Coffeyville Resources, LLC to the joint venture which will then distribute the cash to The Leiber Group, Inc. to fully redeem its interest in the joint venture.
- •
- Coffeyville Resources, LLC intends to enter into a new $ million senior secured credit facility, including one or more term loan facilities aggregating $ million and a $ million revolving loan facility.
- •
- Coffeyville Resources, LLC intends to offer $ million aggregate principal amount of % senior notes.
- •
- Coffeyville Resources, LLC intends to repay its existing senior secured credit facility.
- •
- We intend to pay a $ million dividend to Coffeyville Group Holdings, LLC.
Our reorganization and the liquidation of our joint venture with The Leiber Group, Inc. will be completed prior to the offering. The repayment of our existing senior secured credit facility, the entry by Coffeyville Resources LLC into a new senior secured credit facility, the offering by Coffeyville Resources, LLC of the % senior notes, and the payment of a dividend to Coffeyville Group Holdings, LLC are not conditions to the completion of this offering and are referred to in this prospectus as the "related transactions." See "Use of Proceeds," "Related Party Transactions," and "Description of Our Indebtedness."
4
Post-Offering Organizational Structure
The following chart illustrates our organizational and capital structure upon completion of this offering and the related transactions:
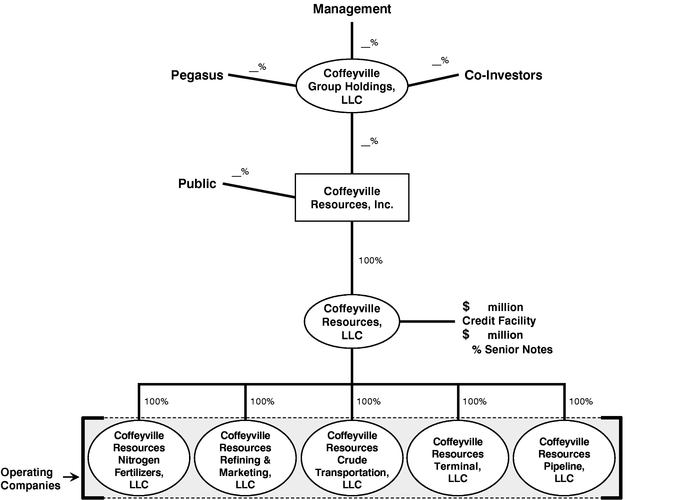
5
| Issuer | Coffeyville Resources, Inc. | |
Common stock offered by us | shares. | |
Common stock offered by the selling stockholders | shares ( shares if the underwriters' over-allotment option is fully exercised). | |
Common stock outstanding after the offering | shares. | |
Use of proceeds | We estimate that the net proceeds to us in this offering, after deducting underwriters' discounts and commissions of $ million, will be $ million. We plan to use the proceeds from the related transactions (1) to repay existing debt under our senior secured credit facility and (2) to pay a dividend to Coffeyville Group Holdings, LLC. We intend to use the net proceeds from this offering and any remaining net proceeds from the related transactions for general corporate purposes including maintaining available cash. We will not receive any proceeds from the sale of shares by the selling stockholders, including any proceeds from the purchase by the underwriters of up to shares from the selling stockholders to cover over-allotments. See "Use of Proceeds." | |
Proposed Nasdaq National Market symbol | " ." | |
Risk Factors | See "Risk Factors" beginning on page 11 of this prospectus for a discussion of factors that you should carefully consider before deciding to invest in shares of our common stock. |
Prior to the completion of this offering (i) Coffeyville Resources, LLC intends to enter into a new $ million senior secured credit facility and issue $ million aggregate principal amount of % senior notes and (ii) we intend to repay our existing senior secured credit facility and to pay a $ million dividend to Coffeyville Group Holdings, LLC. None of the repayment of our existing senior secured credit facility, the entry into a new senior secured credit facility, the payment of a dividend to Coffeyville Group Holdings, LLC or the offering of senior notes is a condition to the completion of this offering.
Unless we specifically state otherwise, the information in this prospectus does not take into account the sale of up to shares of common stock, which the underwriters have the option to purchase from the selling stockholders to cover over-allotments.
Coffeyville Resources, Inc., was incorporated in Delaware in January 2005. Our principal executive offices are located at 10 East Cambridge Circle Drive, Kansas City, Kansas 66103, and our telephone number is (913) 982-0500. Our website address is www.coffeyvillegroup.com. Information contained on our website is not a part of this prospectus.
Pegasus Partners II, L.P., which is referred to in this prospectus as Pegasus, was the principal investor in the transaction that created Coffeyville Group Holdings, LLC. Pegasus Capital Advisors, L.P. is the manager of Pegasus. See "Related Party Transactions."
6
Summary Consolidated Financial Information
The summary consolidated financial information presented below under the caption Statement of Operations Data for the years ended December 31, 2002 and 2003, for the 62 day period ended March 2, 2004, and for the 304 day period ended December 31, 2004, and the summary consolidated financial information presented below under the caption Balance Sheet Data as of December 31, 2003 and 2004, have been derived from our consolidated financial statements included elsewhere in this prospectus, which consolidated financial statements have been audited by KPMG LLP, independent registered public accounting firm.
The summary unaudited pro forma condensed consolidated statement of operations data, other financial data and key operating statistics set forth below, give pro forma effect to the acquisition of the assets of the former Petroleum Division and one facility within the eight-plant Nitrogen Fertilizer Manufacturing and Marketing Division of Farmland Industries, Inc. (Farmland) (which we refer to collectively as the Predecessor) and to reflect the refinancing of our senior secured credit facility on May 10, 2004 and the distribution of $ to The Leiber Group, Inc. in connection with the liquidation of a joint venture, in the manner described under "Unaudited Pro Forma Condensed Consolidated Statements of Operations" as if each had occurred as of January 1, 2004. In addition, the summary unaudited pro forma condensed consolidated statement of operations data, other financial data and key operating statistics set forth below give pro forma effect to (i) the repayment of our existing senior secured credit facility, (ii) the entry into a new senior secured credit facility by Coffeyville Resources, LLC, (iii) the issuance of $ million in aggregate principal amount of % senior notes by Coffeyville Resources, LLC, and (iv) the payment of a $ million dividend to Coffeyville Group Holdings, LLC, in the manner described under "Unaudited Pro Forma Condensed Consolidated Statements of Operations" as if each had occurred on January 1, 2004. We refer to our acquisition of the Predecessor as the Acquisition. The summary unaudited pro forma information has been adjusted to include estimated general corporate expenses that would have been incurred if the Predecessor had operated as a stand-alone entity. The summary unaudited pro forma information does not purport to represent what our results of operations would have been if the Acquisition had occurred as of the date indicated or what these results will be for future periods.
Prior to March 3, 2004, our assets were operated as a component of Farmland. Farmland filed for bankruptcy protection under Chapter 11 of the U.S. Bankruptcy Code on May 31, 2002. On March 3, 2004, Coffeyville Resources, LLC completed the purchase of these assets from Farmland in a sales process under Chapter 11 of the U.S. Bankruptcy Code. See note 1 to our consolidated financial statements included elsewhere in this prospectus. As a result of certain adjustments made in connection with the Acquisition, a new basis of accounting was established on the date of the Acquisition and the results of operations for the 304 days ended December 31, 2004 are not comparable to prior periods.
During the Predecessor periods, Farmland allocated certain general corporate expenses and interest expense to the Predecessor. The allocation of these costs is not necessarily indicative of the costs that would have been incurred if the Predecessor had operated as a stand-alone entity. Further, the historical results are not necessarily indicative of the results to be expected in future periods.
We calculate earnings per share for the Successor on a pro forma basis, based on an assumed number of shares outstanding at the time of the initial public offering with respect to the existing shares. All information in this prospectus assumes that prior to this offering, the five direct subsidiaries of Coffeyville Group Holdings, LLC will merge with and into us, in exchange for which we will issue 74,852,941 shares of our common stock to Coffeyville Group Holdings, LLC. No effect has been given to any incremental shares that might be issued in this offering.
We have omitted per share data for the Predecessor because, under Farmland's cooperative structure, earnings of the Predecessor were distributed as patronage dividends to members and
7
associate members based on the level of business conducted with the Predecessor as opposed to a common shareholder's proportionate share of underlying equity in the Predecessor.
The Predecessor was not a separate legal entity, and its operating results were included with the operating results of Farmland and its subsidiaries in filing consolidated federal and state income tax returns. As a cooperative, Farmland was subject to income taxes on all income not distributed to patrons as qualifying patronage refunds and Farmland did not allocate income taxes to its divisions. As a result, the Predecessor periods do not reflect any provision for income taxes.
The historical data presented below has been derived from financial statements that have been prepared using U.S. generally accepted accounting principles and the pro forma data presented below has been derived from the "Unaudited Pro Forma Condensed Consolidated Statements of Operations" included elsewhere in this prospectus. This data should be read in conjunction with the financial statements and related notes and "Management's Discussion and Analysis of Financial Condition and Results of Operations" included elsewhere in this prospectus.
| | | | | | | Pro Forma to Give Effect to the Related Transactions | |||||||||||||
|---|---|---|---|---|---|---|---|---|---|---|---|---|---|---|---|---|---|---|---|
| | Predecessor | | | ||||||||||||||||
| | Successor | Pro Forma | |||||||||||||||||
| | Year Ended December 31, | | |||||||||||||||||
| | 62 Days Ended March 2, 2004 | 304 Days Ended December 31, 2004 | Year Ended December 31, 2004 | Year Ended December 31, 2004 | |||||||||||||||
| | 2002 | 2003 | |||||||||||||||||
| | | | | | (unaudited) | (unaudited) | |||||||||||||
| | (in millions, except as otherwise indicated) | ||||||||||||||||||
| Statement of Operations Data: | |||||||||||||||||||
| Net sales | $ | 887.5 | $ | 1,262.2 | $ | 261.1 | $ | 1,479.9 | $ | 1,741.0 | $ | ||||||||
| Gross profit (loss) | (58.5 | ) | 63.9 | 15.9 | 116.5 | 132.5 | |||||||||||||
| Selling, general and administrative expenses | 16.3 | 23.6 | 4.7 | 16.5 | 19.5 | ||||||||||||||
| Impairment, and other charges(1) | 375.1 | 10.9 | — | — | — | ||||||||||||||
| Operating income (loss) | $ | (449.9 | ) | $ | 29.4 | $ | 11.2 | $ | 100.0 | $ | 113.0 | $ | |||||||
| Other (income) expense(2) | 4.1 | 0.2 | — | 6.4 | (0.8 | ) | |||||||||||||
| Interest expense | 11.7 | 1.3 | — | 10.1 | 13.4 | ||||||||||||||
| Income (loss) before taxes | $ | (465.7 | ) | $ | 27.9 | $ | 11.2 | $ | 83.5 | $ | 100.4 | $ | |||||||
| Income tax provision | — | — | — | 33.8 | 40.6 | ||||||||||||||
| Net income (loss) | $ | (465.7 | ) | $ | 27.9 | $ | 11.2 | $ | 49.7 | $ | 59.8 | $ | |||||||
| Pro forma earnings per share, basic and diluted | $ | 0.67 | $ | $ | |||||||||||||||
Pro forma weighted average shares, basic and diluted | 74.7 | ||||||||||||||||||
Other Financial Data: | |||||||||||||||||||
| Depreciation and amortization | $ | 30.8 | $ | 3.3 | $ | 0.4 | $ | 2.4 | $ | 2.7 | $ | ||||||||
| EBITDA(3) | (423.2 | ) | 32.5 | 11.6 | 96.0 | 116.5 | |||||||||||||
| Adjusted EBITDA(4) | (47.8 | ) | 42.1 | 11.6 | 103.2 | 116.5 | |||||||||||||
| Capital expenditures for property, plant and equipment | 272.4 | 0.8 | — | 14.2 | 14.2 | ||||||||||||||
Petroleum Business | |||||||||||||||||||
| Production (barrels per day) | 84,343 | 95,701 | 106,645 | 102,046 | 102,825 | ||||||||||||||
| Crude oil throughput (barrels per day) | 74,446 | 85,501 | 92,596 | 90,418 | 90,787 | ||||||||||||||
Nitrogen Fertilizer Business | |||||||||||||||||||
| Production Volume: | |||||||||||||||||||
| Ammonia (tons in thousands) | 265.1 | 335.7 | 56.4 | 252.8 | 309.2 | ||||||||||||||
| UAN (tons in thousands) | 434.6 | 510.6 | 93.4 | 439.2 | 532.7 | ||||||||||||||
8
| | Predecessor | Successor | ||||
|---|---|---|---|---|---|---|
| | December 31, 2003 | December 31, 2004 | ||||
| | (in millions, except as otherwise indicated) | |||||
| Balance Sheet Data: | ||||||
| Cash, cash equivalents and short-term investments | $ | — | $ | 52.7 | ||
| Working capital(5) | 150.5 | 106.6 | ||||
| Total assets | 199.0 | 229.2 | ||||
| Liabilities subject to compromise | 105.2 | — | ||||
| Total debt, including current portion | — | 148.9 | ||||
| Divisional/members equity | 58.2 | 14.1 | ||||
- (1)
- Includes the following:
- •
- During the year ended December 31, 2002, we recorded a $375.1 million asset impairment related to the write-down of the refinery and nitrogen fertilizer plant to fair market value.
- •
- During the year ended December 31, 2003, we recorded an additional charge of $9.6 million related to the asset impairment of the refinery and nitrogen fertilizer plant based on the expected sales price of the assets in the Acquisition. In addition, we recorded a charge of $1.3 million for the rejection of existing contracts.
- (2)
- During the 304 days ended December 31, 2004, we recognized a loss of $7.2 million on early extinguishment of debt.
- (3)
- EBITDA represents earnings before net interest, taxes, depreciation and amortization. Management believes that EBITDA is a useful adjunct to net income and other measurements under GAAP because it is a meaningful measure for evaluating our performance in a given period compared to prior periods and compared to other companies in our industry, as interest, taxes, depreciation and amortization can vary significantly across periods and between companies due in part to differences in accounting policies, tax strategies, levels of indebtedness, capital purchasing practices and interest rates. EBITDA also assists management in evaluating operating performance. EBITDA, with adjustments specified in our credit agreement, is also the basis for calculating our financial debt covenants under our existing credit facility. Accordingly, management believes that EBITDA is an accepted indicator of our ability to incur and service debt obligations. EBITDA has distinct limitations as compared to GAAP information, such as net income, income from continuing operations or operating income. By excluding interest and income taxes for example, it may not be apparent that both represent a reduction in cash available to us. Likewise, depreciation and amortization, while non-cash items, represent generally the decreases in value of assets that produce revenue for us. EBITDA should not be substituted as an alternative to net income or income from operations, which are measures of performance in accordance with accounting principles generally accepted in the United States of America (GAAP). We believe EBITDA assists the investing community in evaluating our performance. Our computation of EBITDA for this purpose may not be comparable to other similarly titled measures computed for other purposes or by other companies because all companies do not calculate EBITDA in the same fashion. The following is a reconciliation of EBITDA to net income:
| | Predecessor | | | |||||||||||||
|---|---|---|---|---|---|---|---|---|---|---|---|---|---|---|---|---|
| | Successor | Pro Forma | ||||||||||||||
| | Year Ended December 31, | | ||||||||||||||
| | 62 Days Ended March 2, 2004 | 304 Days Ended December 31, 2004 | Year Ended December 31, 2004 | |||||||||||||
| | 2002 | 2003 | ||||||||||||||
| | | | | | (unaudited) | |||||||||||
| | (in millions) | |||||||||||||||
| EBITDA | $ | (423.2 | ) | $ | 32.5 | $ | 11.6 | $ | 96.0 | $ | 116.5 | |||||
| Less: | ||||||||||||||||
| Income tax (benefit) provision for taxes | — | — | — | 33.8 | 40.6 | |||||||||||
| Interest expense | 11.7 | 1.3 | — | 10.1 | 13.4 | |||||||||||
| Depreciation and amortization | 30.8 | 3.3 | 0.4 | 2.4 | 2.7 | |||||||||||
| Net income (loss) | $ | (465.7 | ) | $ | 27.9 | $ | 11.2 | $ | 49.7 | $ | 59.8 | |||||
- (4)
- For the periods presented, Adjusted EBITDA represents EBITDA plus or minus the items described below. We believe additional adjustments to EBITDA for these special charges provides a meaningful comparison of period-to-period results. We present Adjusted EBITDA as a further supplemental measure of our performance and ability to service debt. We prepare Adjusted EBITDA by adjusting EBITDA to eliminate the impact of a number of items we do not consider indicative of our ongoing operating performance. As an analytical tool, Adjusted EBITDA is subject to all of the limitations applicable to EBITDA. In addition, in evaluating Adjusted EBITDA, you should be aware that in the future we may incur expenses similar to the
9
adjustments in this presentation. Our presentation of Adjusted EBITDA should not be construed as an inference that our future results will be unaffected by unusual items.
| | Predecessor | | | |||||||||||||
|---|---|---|---|---|---|---|---|---|---|---|---|---|---|---|---|---|
| | Successor | Pro Forma | ||||||||||||||
| | Year Ended December 31, | | ||||||||||||||
| | 62 Days Ended March 2, 2004 | 304 Days Ended December 31, 2004 | Year Ended December 31, 2004 | |||||||||||||
| | 2002 | 2003 | ||||||||||||||
| | | | | | (unaudited) | |||||||||||
| | (in millions) | |||||||||||||||
| Adjusted EBITDA | $ | (47.8 | ) | $ | 42.1 | $ | 11.6 | $ | 103.2 | $ | 116.5 | |||||
| Less: | ||||||||||||||||
| Impairment of property, plant and equipment(a) | 375.1 | 9.6 | — | — | — | |||||||||||
| Fertilizer lease payments(b) | 0.3 | — | — | — | — | |||||||||||
| Loss on extinguishment of debt(c) | — | — | — | 7.2 | — | |||||||||||
| EBITDA | $ | (423.2 | ) | $ | 32.5 | $ | 11.6 | $ | 96.0 | $ | 116.5 | |||||
- (a)
- During the year ended December 31, 2002, we recorded a $375.1 million asset impairment related to the write-down of our refinery and nitrogen fertilizer plant to fair market value. During the year ended December 31, 2003, we recorded an additional charge of $9.6 million related to the asset impairment of our refinery and nitrogen fertilizer plant based on the expected sales price of the assets in the Acquisition.
- (b)
- Reflects the impact of an operating lease structure utilized by Farmland to finance the nitrogen fertilizer plant. The cost of this plant under the operating lease was $263.0 million and the rental payments were $0.3 million for the period ended December 31, 2002. In February 2002, Farmland refinanced the operating lease into a secured loan structure, which effectively terminated the lease and all of Farmland's obligations under the lease.
- (c)
- Represents the write-off of $7.2 million of deferred financing costs in connection with the refinancing of our senior secured credit facility on May 10, 2004.
- (5)
- Excludes liabilities subject to compromise due to the Predecessor's bankruptcy of $105.2 million as of December 31, 2003 in calculating the Predecessor's working capital.
10
You should carefully consider each of the following risks and all of the information set forth in this prospectus before deciding to invest in our common stock. If any of the following risks and uncertainties develops into actual events, our business, financial condition or results of operations could be materially adversely affected. In that case, the price of our common stock could decline and you could lose part or all of your investment.
Risks Related to Our Petroleum Business
Volatile margins in the refining industry may cause volatility or a decline in our future results of operations and decrease our cash flow.
Our petroleum business' financial results are primarily affected by the relationship, or margin, between refined product prices and the prices for crude oil and other feedstocks. Future volatility in refining industry margins may cause volatility or a decline in our results of operations, since the margin between refined product prices and feedstock prices may decrease below the amount needed for us to generate net cash flow sufficient for our needs. Although an increase or decrease in the price for crude oil generally results in a similar increase or decrease in prices for refined products, there is normally a time lag in the realization of the similar increase or decrease in prices for refined products. The effect of changes in crude oil prices on our results of operations therefore depends in part on how quickly and how fully refined product prices adjust to reflect these changes. A substantial or prolonged increase in crude oil prices without a corresponding increase in refined product prices, a substantial or prolonged decrease in refined product prices without a corresponding decrease in crude oil prices, or a substantial or prolonged decrease in demand for refined products could have a significant negative impact on our earnings, results of operations and cash flows.
If we are required to obtain our crude oil supply without the benefit of our credit intermediation agreement, our exposure to the risks associated with volatile crude prices may increase and our liquidity may be reduced.
We currently obtain the majority of our crude oil supply through a crude oil credit intermediation agreement with BP Oil Supply Company, which minimizes the amount of in transit inventory and mitigates crude pricing risks by ensuring pricing takes place extremely close to the time when the crude is refined and the yielded products are sold. In the event this agreement is terminated or is not renewed prior to expiration we may be unable to obtain similar services from another party at the same or better terms as our existing agreement. Our current credit intermediation agreement expires on December 31, 2005. We cannot assure you that we will be able to renegotiate a new credit intermediation agreement on similar terms, or at all. Further, if we were required to obtain our crude oil supply without the benefit of an intermediation agreement, our exposure to crude pricing risks may increase, even despite any hedging activity in which we may engage, and our liquidity would be negatively impacted due to the increased inventory and the negative impact of market volatility.
Disruption of our ability to obtain an adequate supply of crude oil could reduce our liquidity and increase our costs.
Our refinery requires approximately 80,000 bpd of crude oil in addition to the light sweet crude oil we gather locally in Kansas and Northern Oklahoma. We obtain a significant amount of our non-gathered crude oil, approximately 40% to 60% in any given month, from Latin America and South America. If these supplies become unavailable to us, we may be required to seek supplies from the Middle East, West Africa and the North Sea. We are subject to the political, geographic, and economic risks attendant to doing business with suppliers located in those regions. In the event that one or more of our traditional suppliers becomes unavailable to us, we may be unable to obtain an adequate supply of crude oil, or we may only able to obtain our crude oil supply at unfavorable prices. As a result, we
11
may experience a reduction in our liquidity and our results of operations could be materially adversely affected.
Our profitability is linked to the light/heavy crude oil price spread, which increased significantly in 2004. A decrease in the spread would negatively impact our profitability.
Our profitability is linked to the price spread between light and heavy crude oil. We prefer to refine heavier sour crude oils because they have historically provided wider refining margins than light sweet crude. Accordingly, any tightening of the light/heavy spread will reduce our profitability. During 2004 relatively high demand for lighter sweet crude due to increasing demand for more highly refined fuels resulted in an attractive light/heavy crude oil price spread. However, crude oil prices may not remain at current levels and the light/heavy spread may decline, which could result in a decline in profitability or operating losses, particularly if there is a worldwide softening of product demand that lessens the need for marginal sweet crude refining.
Our refinery faces operating hazards and interruptions, including unscheduled maintenance or downtime. The limits on insurance coverage could expose us to potentially significant liability costs to the extent such hazards or interruptions are not fully covered.
Our operations are subject to significant operating hazards and interruptions. If our refinery experiences a major accident or fire, is damaged by severe weather or other natural disaster, or is otherwise forced to curtail its operations or shut down, we could incur significant losses which would have an adverse impact on our financial results. In addition, a major accident, fire or other event could damage our refinery or the environment or result in injuries or loss of life. If our refinery experiences a major accident or fire or other event or an interruption in supply or operations, our business could be materially adversely affected if the damage or liability exceeds the amounts of business interruption, property, terrorism and other insurance that we maintain against these risks. We maintain insurance capped at $300 million. In the event of a business interruption we would not be entitled to recover our loses until such interruption exceeds 45 days in the aggregate. We are fully exposed to losses in excess of this cap and that occur in the 45 days of our deductible period.
Our refinery consists of many processing units, a number of which have been in operation for a long time. One or more of the units may require unscheduled down time for unanticipated maintenance or repairs that is more frequent than our scheduled turnaround every one to five years for each unit, or our planned turnarounds may last longer than anticipated. Scheduled and unscheduled maintenance could reduce our revenues during the period of time that our units are not operating.
If our access to the pipelines on which we rely for the supply of our feedstock and the distribution of our products is interrupted, our inventory and costs may increase and we may be unable to efficiently distribute our products.
If one of the pipelines on which we rely for one supply of our crude oil becomes inoperative, we would be required to obtain crude oil for our refinery through an alternative pipeline or from additional tank trucks, which could increase our costs and result in lower production levels and profitability. Similarly, if a major refined fuels pipeline becomes inoperative, we would be required to keep refined fuels in inventory or supplied to our customers through an alternative pipeline or by additional tank trucks from the refinery, which could increase our costs and result in a decline in profitability.
Our petroleum business' financial results are seasonal and generally lower in the first and fourth quarters of the year, which may cause volatility in the price of our common stock.
Demand for gasoline products is generally higher during the summer months than during the winter months due to seasonal increases in highway traffic and road construction work. As a result, our
12
results of operations for the first and fourth calendar quarters are generally lower than for those for the second and third quarters, which may cause volatility in the price of our common stock. Further, reduced agricultural work during the winter months somewhat depresses demand for diesel in the winter months. In addition to the overall seasonality of our business, unseasonably cool weather in the summer months and/or unseasonably warm weather in the winter months in the markets in which we sell our petroleum products could have the effect of reducing demand for gasoline and diesel which could result in lower prices and reduce operating margins.
We face significant competition, both within and outside of our industry. Competitors who produce their own supply of feedstocks, have extensive retail outlets, make alternative fuels or have greater financial resources than we do may have a competitive advantage over us.
The refining industry is highly competitive with respect to both feedstock supply and refined product markets. If we are unable to compete effectively with our competitors within and outside of our industry, we may be unable to sustain our current level of profitability. We compete with numerous other companies for available supplies of crude oil and other feedstocks and for outlets for our refined products. We are not engaged in the petroleum exploration and production business and therefore do not produce any of our crude oil feedstocks. We do not have a retail business and therefore are dependent upon others for outlets for our refined products. We do not have any long-term arrangements for much of our output. Many of our competitors in the U.S. as a whole, and one of our regional competitors, obtain a significant portion of their feedstocks from company-owned production and have extensive retail outlets. Competitors that have their own production or extensive retail outlets with brand-name recognition are at times able to offset losses from refining operations with profits from producing or retailing operations, and may be better positioned to withstand periods of depressed refining margins or feedstock shortages. A number of our competitors also have materially greater financial and other resources than us. These competitors have a greater ability to bear the economic risks inherent in all phases of the refining industry. In addition, we compete with other industries that provide alternative means to satisfy the energy and fuel requirements of our industrial, commercial and individual consumers.
Governmental regulations and policies affect the prices and demand for our petroleum products and will require us to make substantial capital expenditures in the future.
We expect to make significant capital expenditures over the next several years in order to comply with federal and local environmental regulations. The United States Environmental Protection Agency (EPA) has promulgated regulations under the federal Clean Air Act that establish stringent low sulfur content specifications for our petroleum products, including the Tier II gasoline standards, as well as regulations with respect to on- and off- road diesel fuel, which are designed to reduce air emissions from the use of these products. In addition, in May 2004 the EPA finalized regulations to reduce sulfur in off-road diesel fuel by 2010. Depending on our compliance strategy for the off-road diesel rules, we estimate our capital expenditures required to comply with the on- and off-road diesel standards will range between $75 to $85 million over the next two years. Based on our preliminary estimates, we believe that compliance with the Tier II gasoline standards will require us to spend approximately $35 million between 2008 and 2010. See "Business—Environmental Matters—Fuel Regulations."
There have been numerous recently promulgated National Emission Standards for Hazardous Air Pollutants (NESHAP or MACT). Some or all of these MACT standards may require us to install controls or changes to our operations in order to comply. These new requirements, other requirements of the federal Clean Air Act, or other presently existing or future environmental laws and regulations could cause us to expend substantial amounts to permit our refinery to produce products that meet applicable requirements and could have an adverse impact on our operations, financial condition or cash flows for any given period.
13
In March 2004, we entered into a Consent Decree with EPA and KDHE to address certain allegations of Clean Air Act violations by Farmland at the oil refinery in order to reduce environmental risks and liabilities going forward, including sulfur dioxide emissions. Pursuant to the Consent Decree, in the short-term, we will increase sulfur dioxide—reducing catalyst additives to the fluid catalytic cracking unit at the facility to reduce emissions of sulfur dioxide. We will install controls to minimize sulfur dioxide emissions in the long-term. In addition, we will undertake an investigation to verify the facility's compliance with the Benzene Waste Oil NESHAP. Depending upon the results of that investigation, we may need to install additional controls on the facility's wastewater treatment system. In addition, pursuant to the Consent Decree, we assumed certain cleanup obligations at the refinery. There are other permitting, monitoring, recordkeeping and reporting requirements associated with the Consent Decree. The overall costs of complying with the Consent Decree over the next six years are expected to be approximately $20 to $30 million.
Changes in our credit profile may affect our relationship with our suppliers, which could have a material adverse effect on our liquidity.
Changes in our credit profile may affect the way crude oil suppliers view our ability to make payments and induce them to shorten the payment terms of their invoices. Given the large dollar amounts and volume of our feedstock purchases, a change in payment terms may have a material adverse effect on our liquidity and our ability to make payments to our suppliers.
We have additional capital needs for which our internally generated cash flows and other sources of liquidity may not be adequate.
If we cannot generate cash flow or otherwise secure sufficient liquidity to support our short term and long term capital requirements, we may be unable to comply with certain environmental standards or pursue our business strategies, in which case our operations may not perform as well as we currently expect. We have substantial short term and long term capital needs, including for capital expenditures we will make to comply with Tier II gasoline standards, on-road diesel regulations, off-road diesel regulations and the Consent Decree. Most of these expenditures will occur during the next two years. Our short-term working capital needs are primarily crude oil purchase requirements, which fluctuate with the pricing and sourcing of crude oil. We also have significant long-term needs for cash. We currently estimate that mandatory capital and turnaround expenditures, excluding the non-recurring capital expenditures required to comply with Tier II gasoline standards, on-road diesel regulations, off-road diesel regulations and the Consent Decree described above, to be between $14.3 million and $27.2 million per year over the next five years.
Risks Related to Our Nitrogen Fertilizer Business
Our nitrogen fertilizer plant has high fixed costs. If natural gas prices fall below a certain level, our nitrogen fertilizer business may not generate sufficient revenue to operate profitably or cover its costs.
Our nitrogen fertilizer plant has high fixed costs. As a result, downtime or low productivity due to reduced demand, weather interruptions, equipment failures, low prevailing prices for our products or other causes can result in significant operating losses. Unlike our competitors, whose primary costs are related to the purchase of natural gas and whose fixed costs are minimal, we have high fixed costs not dependent on the price of natural gas. A decline in natural gas prices has the effect of reducing the base price for our products without a corresponding reduction in our costs. Any decline in the price of our fertilizer products for whatever reason would have a negative impact on our profitability and results of operations.
14
Our nitrogen fertilizer business is cyclical, which exposes us to potentially significant fluctuations in our financial condition and results of operations, which could result in volatility in the price of our common stock.
A significant portion of our nitrogen fertilizer product sales consists of sales of agricultural commodity products, exposing us to fluctuations in supply and demand in the agricultural industry. These fluctuations historically have had and could in the future have significant effects on prices across all of our nitrogen fertilizer products and, in turn, our nitrogen fertilizer business' results of operations and financial condition, which could result in significant volatility in the price of our common stock. The prices of nitrogen fertilizer products depend on a number of factors which are largely outside of our control, including general economic conditions, cyclical trends in end-user markets, supply and demand imbalances, and weather conditions, which have a greater relevance because of the seasonal nature of fertilizer application. Changes in supply result from capacity additions or reductions and from changes in inventory levels. Demand for fertilizer products is dependent, in part, on demand for crop nutrients by the global agricultural industry. Periods of high demand, high capacity utilization, and increasing operating margins have tended to result in new plant investment and increased production until supply exceeds demand, followed by periods of declining prices and declining capacity utilization until the cycle is repeated.
Adverse weather conditions during peak fertilizer application periods may have a negative effect upon our results of operations and financial condition, as our agricultural customers are geographically concentrated.
Sales of our fertilizer products to agricultural customers are concentrated in the Great Plains and Midwest states and are seasonal in nature. For example, our nitrogen fertilizer business generates greater net sales and operating income in the spring. Accordingly, an adverse weather pattern affecting agriculture in these regions or during this season could have a negative effect on fertilizer demand, which could, in turn, result in a decline in our net sales, lower margins and otherwise negatively affect our financial condition and results of operations. Our quarterly results may vary significantly from one year to the next due primarily to weather-related shifts in planting schedules and purchase patterns, as well as the relationship between natural gas and nitrogen fertilizer product prices.
If China begins to export urea on a large scale, the global market for fertilizer could be destabilized, which could negatively affect our margins, financial condition, and results of operations.
Given the rapid expansion of Chinese urea production and the possibility that other nitrogen based fertilizers may meet an increasing share of Chinese domestic demand, China may begin to export large volumes of urea, thereby putting downward pressure on the price of urea and UAN globally. Because we convert a significant portion of our ammonia production to UAN, and because UAN currently generates higher margins than ammonia, lower UAN prices could negatively affect our results of operations, margins and financial condition.
Our margins and results of operations may be adversely affected by the supply and price levels of petroleum coke and other essential raw materials.
Petroleum coke is a key raw material used in the manufacture of our nitrogen fertilizer products. Increases in the price of petroleum coke could result in a decrease in our profit margins or results of operations. Our profitability is directly affected by the price and availability of petroleum coke obtained from our oil refinery and purchased from third parties. If we are unable to obtain the majority of the coke we need from our adjacent oil refinery we will be required to purchase coke on the open market, which would subject us to fluctuations in the price of petroleum coke on the open market. We have no way of predicting to what extent petroleum coke prices will rise in the future. In addition, the air separation plant that provides oxygen, nitrogen, and compressed dry air to our nitrogen fertilizer plant's gasifier has experienced numerous short term (one to five minute) interruptions in our gasifier operations. If we cannot maintain a reliable supply of raw materials for our operations, we may be
15
unable to produce our products at current levels and our reputation, customer relationships and results of operations may be harmed.
We cannot assure you that we will be able to maintain an adequate supply of petroleum coke and other essential raw materials or that this supply will not be delayed or interrupted, resulting in production delays or in cost increases if alternative sources of supply prove to be more expensive or difficult to obtain. If our cost of raw materials were to increase, or if we were to experience an extended interruption in the supply of raw materials, including petroleum coke, to our production facilities, we could lose sale opportunities, damage our relationships with or lose customers, suffer lower margins, and experience other negative effects to our business, results of operations and financial condition. In addition, if natural gas prices in the U.S. were to decline to a level that prompts those U.S. producers who have permanently or temporarily closed production facilities to resume fertilizer production, this would likely contribute to a global supply/demand imbalance that could negatively affect our margins, results of operations and financial condition.
Ammonia can be very volatile. If we are held liable for accidents involving ammonia that cause severe damage to property and/or injury to the environment and human health, our financial condition and the price of our common stock could decline.
We manufacture, process, store, handle, distribute and transport ammonia, which is very volatile. Accidents, releases or mishandling involving ammonia could cause severe damage or injury to property, the environment and human health, as well as a possible disruption of supplies and markets. Such an event could result in civil lawsuits and regulatory enforcement proceedings, both of which could lead to significant liabilities. Any damage to persons, equipment or property or other disruption of our ability to produce or distribute our products could result in a significant decrease in operating revenues and significant additional cost to replace or repair and insure our assets, which could negatively affect our operating results and financial condition. In addition, we may incur significant losses or costs relating to the operation of railcars used for the purpose of carrying various products, including ammonia. Due to the dangerous and potentially destructive nature of the cargo, in particular ammonia, on board the railcars, a railcar accident may result in uncontrolled or catastrophic circumstances, including fires, explosions, accidents and severe pollution. Such circumstances may result in severe damage and/or injury to property, the environment and human health. Litigation from any such event may result in our being named as a defendant in lawsuits asserting claims for large amounts of damages. In the event of pollution, we may be strictly liable. If we are strictly liable, we could be held responsible even if we are not at fault and we complied with the laws and regulations in effect at the time, which could have a material adverse effect on our financial condition and the price of our common stock.
Prior to our acquisition of the nitrogen fertilizer plant and continuing into our ownership, the facility experienced an equipment failure that resulted in air releases of ammonia into the environment. We replaced the equipment in August 2004 and the new equipment also experienced difficulties and was subsequently replaced by a redesigned exchanger with upgraded metallurgy, which was operated without additional ammonia emissions. We have reported the excess emissions of ammonia to EPA and KDHE as part of an air permitting audit of the facility. The results of an air permitting compliance audit may reveal the need for additional controls which could require us to make significant capital expenditures. We cannot assure you that additional equipment or repairs will not be required or that government enforcement or third-party claims will not result from the excess ammonia emissions and ongoing operational difficulties continuing to be experienced at the fertilizer plant.
Governmental regulations and policies affect the prices and demand for our fertilizer products and changes in government regulations could require us to make substantial capital expenditures in the future.
We manufacture, process, store, handle, distribute and transport fertilizer products, including ammonia, that are subject to federal, state and local laws and regulations. Presently existing or future
16
environmental laws and regulations could cause us to expend substantial amounts to install controls or make operational changes to comply with changes in environmental requirements. In addition, future environmental laws and regulations, or new interpretations of existing laws or regulations, could limit our ability to market and sell our products to end users. We cannot assure you that any such future environmental laws or governmental regulations will not have a significant impact on the results of our operations.
The results of an air permitting compliance audit may reveal the need for additional controls which could require us to make significant capital expenditures.
When we acquired the fertilizer plant, we agreed to undertake a voluntary federal and state air permitting compliance audit. EPA and KDHE agreed not to seek civil penalties if we disclosed and corrected any discovered noncompliance in accordance with their policies. The audit has been completed and we are in the process of correcting noncompliance that was discovered. No penalties are expected to be imposed for the violations that were self-disclosed and corrected, but we have not reached a final resolution with the agencies. We cannot be certain that additional controls will not have to be installed in order to return the fertilizer plant to compliance. We also cannot be certain that each and every instance of noncompliance has been detected by the audit or will be covered by the agencies' audit policies so that no penalties would be imposed or liability would result from the audit.
Our nitrogen fertilizer operations are dependent on a few third-party suppliers. Failure by key third-party suppliers of elemental oxygen, nitrogen and electricity to perform in accordance with their contractual obligations may have a negative effect upon our results of operations and financial condition.
Our operations depend in large part on the performance of third-party suppliers, including The BOC Group, for the supply of oxygen and nitrogen, and the City of Coffeyville for the supply of electricity. Should either of those two suppliers fail to perform in accordance with the existing contractual arrangements, our gasification operation would be forced to a halt. We may be unable to obtain alternate sources of supply of elemental oxygen, nitrogen or electricity on similar terms or at all. Any shutdown of our operations would have a negative effect upon our results of operations and financial condition.
Risks Related to Our Entire Business
Our operations involve environmental risks that may require us to make substantial capital expenditures to remain in compliance or to remediate current or future contamination that could otherwise give rise to material liabilities.
Our results of operations may be affected by increased costs resulting from compliance with the extensive federal, state and local environmental laws to which our facilities are subject and from contamination of our facilities as a result of accidental spills, discharges or other releases of petroleum or hazardous substances.
Our operations are subject to a variety of federal, state and local environmental laws and regulations relating to the protection of the environment, including those governing the emission or discharge of pollutants into the environment, product specifications and the generation, treatment, storage, transportation and disposal, or remediation of solid and hazardous waste and materials. Environmental laws and regulations that affect the operations, processes and margins for our refined products are extensive and have become progressively more stringent. Violations of these laws and regulations or permit conditions can result in substantial penalties, injunctive orders compelling installation of additional controls, civil and criminal sanctions, permit revocations and/or facility shutdowns. Additional legislation or regulatory requirements or administrative policies could be imposed with respect to our products or activities. Compliance with more stringent laws or regulations or changes in compliance policies and guidance of the regulatory agencies could increase our costs,
17
which may adversely affect our financial position and results of operations and could require us to make substantial expenditures.
Our business is inherently subject to accidental spills, discharges or other releases of petroleum or hazardous substances into the environment. Past or future spills related to any of our operations, including our refinery, pipelines, product terminals, fertilizer plant or transportation of products or hazardous substances from those facilities, may give rise to liability (including strict liability, or liability without fault, and potential cleanup responsibility) to governmental entities or private parties under federal, state or local environmental laws, as well as under common law. For example, we could be held strictly liable under the Comprehensive Environmental Responsibility, Compensation and Liability Act (CERCLA) for past or future spills without regard to fault or whether our actions were in compliance with the law at the time of the spill. This may involve contamination associated with facilities we currently own or operate, facilities we used to own or operate, certain facilities Farmland used to own or operate and facilities to which we transported or arranged for the transportation of wastes or by-products for use, treatment, storage, or disposal. Accidental discharges could occur in the future, future action may be taken in connection with past discharges, governmental agencies may assess penalties against us in connection with past or future contamination or compel us to clean-up or reimburse another party for cleanup, and third parties may assert claims against us for damages allegedly arising out of any past or future contamination. The potential penalties and clean-up costs for past or future releases or spills, the failure of some prior owners of our facilities to complete their clean-up obligations, liability to third parties for damage to their property or exposure to hazardous substances, or the need to address newly discovered information or conditions that may require a response could be significant and the payment of these amounts could have a material adverse effect on our business, financial condition and results of operations.
We are subject to current liability for the investigation and clean-up of environmental contamination at two of our facilities and may be potentially liable for currently unknown or future contamination at each of the properties we own or operate and at contiguous, adjacent and off-site locations where we may have, or certain contiguous adjacent and off-site locations where Farmland may have, disposed of or arranged for the disposal of hazardous substances. We cannot assure you that we will not become involved in litigation or any other proceedings or that, if we were to be held responsible for damages or required to reimburse costs in any future litigation or other proceedings, such damages or costs would be covered by insurance or would not be material. For example, there is extensive contamination present at the refinery (which includes portions of the fertilizer plant), and the Phillipsburg terminal (which operated as a refinery until 1991). We have assumed Farmland Industries, Inc.'s responsibilities under certain Resource Conservation and Recovery Act (RCRA) corrective action orders related to contamination at or that originated from the refinery (which includes portions of the fertilizer plant) and the Phillipsburg terminal. If significant unforeseen liabilities arise in the areas where we have assumed liability for the corrective action, such liability could have a material adverse effect on our results of operations and financial condition and that may not be covered by insurance.
In addition, we may face liability for alleged personal injury or property damage due to exposure to chemicals or other hazardous substances located at or released from our facilities. We may also face liability for personal injury, property damage, natural resource damage or for clean-up costs for the alleged migration of contamination or other hazardous substances from our facilities to adjacent and other nearby properties. See "Business—Environmental Matters."
We may face future liability for disposal of hazardous wastes off-site. CERCLA may impose strict liability on generators of hazardous waste that is disposed of off-site when the off-site disposal area requires remediation. Although we have not been identified as a potentially responsible party under CERCLA for off site disposal of our hazardous wastes, we cannot assure you that we will not become involved in litigation or any other proceedings or that, if we were to be held responsible for damages or
18
required to reimburse costs in any future litigation or other proceedings relating to off-site disposal of our hazardous wastes, such damages or costs would be covered by insurance or would not be material.
We have a limited operating history as a stand-alone company and previous financial statements may not be indicative of our future performance.
Coffeyville Group Holdings, LLC was formed in March 2004 specifically for an investor group led by Pegasus for the Acquisition. Our limited historical financial performance as a stand-alone company makes it difficult for you to evaluate our business and results of operations to date and to assess our future prospects and viability. Further, our brief operating history has resulted in period over period revenue and profitability growth rates that may not be indicative of our future results of operations. As a result, our results of operations may be lower than we currently expect and the price of our common stock may be volatile.
The requirements of being a public company, including compliance with the reporting requirements of the Exchange Act and the requirements of the Sarbanes-Oxley Act, may strain our resources, increase our costs and distract management, and we may be unable to comply with these requirements in a timely or cost-effective manner.
As a public company, we will be subject to the reporting requirements of the Securities Exchange Act of 1934, or the Exchange Act, and the corporate governance standards of the Sarbanes-Oxley Act of 2002, or the Sarbanes-Oxley Act. These requirements may place a strain on our management, systems and resources. The Exchange Act will require that we file annual, quarterly and current reports with respect to our business and financial condition. The Sarbanes-Oxley Act will require that we maintain effective disclosure controls and procedures and internal controls for financial reporting. Due to our limited operating history as a stand-alone company, our disclosure controls and procedures and internal controls may not meet all of the standards applicable to public companies. In order to maintain and improve the effectiveness of our disclosure controls and procedures and internal control over financial reporting, significant resources and management oversight will be required. This may divert management's attention from other business concerns, which could have a material adverse effect on our business, financial condition, results of operations and the price of our common stock.
We intend to hire additional accounting and financial staff with public company accounting and periodic reporting experience in order to facilitate our compliance with the reporting requirements of the Exchange Act and compliance with the Sarbanes-Oxley Act, but we cannot assure you that we will be able to do so in a cost-effective or timely fashion, or at all. We have temporarily engaged outside accounting services to assist us on an interim basis in the preparation of our financial statements, but we cannot assure you that we will be able to comply with the requirements of the Exchange Act or the Sarbanes-Oxley Act, even with outside services, or that we will be able to find qualified personnel with adequate experience to replace the outside service personnel in a cost-effective or timely manner, or at all.
If we are unable to implement improvements to our disclosure controls and procedures or to our internal controls in a timely manner, our independent registered public accounting firm may not be able to certify as to the effectiveness of our internal controls over financial reporting pursuant to an audit of our internal controls over financial reporting which is required to be reported on in our annual report for fiscal 2006 and thereafter. This may subject us to adverse regulatory consequences or a loss of confidence in the reliability of our financial statements. We could also suffer a loss of confidence in the reliability of our financial statements if our independent registered public accounting firm reports a material weakness in our internal controls, if we are unable to develop and maintain effective controls and procedures or if we are otherwise unable to deliver timely and reliable financial information. Any loss of confidence in the reliability of our financial statements or other negative reaction to our failure to develop timely or adequate disclosure controls and procedures or internal controls could result in a decline in the price of our common stock.
19
We may not be able to successfully implement our business strategies.
One of our business strategies is to implement a number of high-return capital expenditure projects designed to increase productivity and profitability of our facilities. Many factors beyond our control may prevent or hinder our implementation of some or all of these projects, including compliance with or liability under environmental regulations, a downturn in refining margins, technical or mechanical problems, lack of availability of capital and other factors. Failure to successfully implement this profit-enhancing strategy may adversely affect our business prospects and competitive position in the industry.
We depend upon our subsidiaries for cash to meet our debt obligations.
We are a holding company. Our subsidiaries conduct all of our operations and own substantially all of our assets. Consequently, our cash flow and our ability to meet our debt service obligations depend upon the cash flow of our subsidiaries and the payment of funds by our subsidiaries to us in the form of dividends, tax sharing payments or otherwise. Their ability to make any payments will depend on their earnings, the terms of their indebtedness, including our existing senior secured credit facility, Coffeyville Resources, LLC's new senior secured credit facility and Coffeyville Resources, LLC's % senior notes, tax considerations and legal restrictions.
Our significant indebtedness may affect our ability to operate our business, and may have a material adverse effect on our financial condition and results of operation.
In May 2004, we entered into a senior secured credit facility for a revolving credit facility of up to $75.0 million and a term loan facility of $150.0 million. As of December 31, 2004, we had $148.9 million of outstanding borrowings under the term loan and no outstanding borrowings under the revolving credit facility. Prior to the completion of this offering, Coffeyville Resources, LLC intends to enter into a new $ million senior secured credit facility and issue $ million aggregate principal amount of % senior notes, and we intend to repay our existing senior secured credit facility. Assuming that we had completed this offering and repaid our existing senior secured credit facility and that Coffeyville Resources, LLC had entered into a new senior secured credit facility and issued $ million aggregate principal amount of % senior notes as of December 31, 2004, on an as adjusted basis, our total indebtedness would have been $ million. We may incur other indebtedness in the future, including additional borrowings under the agreement governing the proposed new senior secured credit facility. Additionally, we expect that the indenture governing the proposed % senior notes will not prohibit us from incurring additional indebtedness, so long as we satisfy a fixed charge coverage ratio after giving effect to the incurrence of such indebtedness. See "Description of Our Indebtedness."
Our high level of indebtedness could have important consequences, such as:
- •
- limiting our ability to obtain additional financing to fund our working capital, expenditures, debt service requirements or for other purposes;
- •
- limiting our ability to use operating cash flow in other areas of our business because we must dedicate a substantial portion of these funds to service debt;
- •
- limiting our ability to compete with other companies who are not as highly leveraged; and
- •
- limiting our ability to react to changing market conditions, in our industry and in our customers' industries and economic downturns.
20
Our ability to satisfy our debt obligations will depend upon our future operating performance. Prevailing economic conditions and financial, business and other factors, many of which are beyond our control, will affect our ability to make payments on our debt obligations. If we cannot generate sufficient cash from operations to meet our other obligations, we may need to refinance or sell assets, which may have a material adverse effect on our financial condition and results of operations. Our business may not generate sufficient cash flow, or we may not be able to obtain sufficient funding, to make the payments required by all of our debt.
We may incur more indebtedness, which could exacerbate the risks described above.
We may be able to incur additional indebtedness in the future. As described above, under our existing senior secured credit facility, as of March 31, 2005, we had additional borrowing capacity of $70.8 million. Additionally, we anticipate that the terms of the agreement governing the proposed senior secured credit facility and the indenture governing the proposed % senior notes will not prohibit us from incurring indebtedness, subject to certain limitations and restrictions regarding additional indebtedness. If new indebtedness is added to our current indebtedness, the risks described above could increase.
If we lose any of our key personnel, we may be unable to effectively manage our business or continue our growth.
Our future performance depends to a significant degree upon the continued contributions of our senior management team and key technical personnel. The loss or unavailability to us of any member of our senior management team or a key technical employee could negatively effect our ability to operate our business and pursue our strategy. We face competition for these professionals from our competitors, our customers and other companies operating in our industry. To the extent that the services of members of our senior management team and key technical personnel would be unavailable to us for any reason, we would be required to hire other personnel to manage and operate our company and to develop our products and strategy. We cannot assure you that we would be able to locate or employ such qualified personnel on acceptable terms or at all. Members of our management may spend a portion of their time on a project that is currently the subject of a non-binding letter of intent, involving the construction of two ammonia and UAN plants in the Republic of Trinidad and Tobago, West Indies. It is currently intended that neither Coffeyville Resources, Inc. nor its subsidiaries will have no ownership interest in or obligations, including financing, with respect to this project. Any time and resources that management devotes to this project could detract from their time available to us, which could have an adverse impact on our results of operations and cause a decline in the price of our common stock. In addition, upon completion these new ammonia plants may produce products that compete directly with our products. Any such competition may have a negative impact on the price at which we are able to sell our nitrogen fertilizer products or the volume of nitrogen fertilizer products we are able to sell, which may have a negative impact on our financial condition or results of operations.
A substantial portion of our workforce is unionized and we are subject to the risk of labor disputes and adverse employee relations, which may disrupt our business and increase our costs.
As of December 31, 2004, approximately 44% of our employees were represented by labor unions under collective bargaining agreements expiring in 2009. We may not be able to renegotiate our collective bargaining agreements when they expire on satisfactory terms or at all. A failure to do so may increase our costs. In addition, our existing labor agreements may not prevent a strike or work stoppage at any of our facilities in the future, and any such work stoppage could negatively affect our results of operations and financial condition.
21
We may incur significant costs to comply with, or as a result of, health, safety, environmental and other laws and regulations.
Our operations are subject to extensive and frequently changing federal, state and local environmental laws and regulations in the various jurisdictions in which we conduct our business, including those relating to the discharge of materials into the air, water and on, under or about the land, solid and hazardous waste management, the use, composition, handling, distribution and transportation of hazardous, or exposure to, materials, pollution prevention, remediation of contaminated sites and the characteristics and composition of gasoline and diesel fuels. In addition our operations require numerous permits and authorizations under some of these laws and regulations. These permits are subject to revocation, renewal or modification. These laws, regulations and permits can often require expensive pollution control equipment or operational changes to limit impacts or potential impacts on the environment and/or health and safety. A violation of these laws and regulations or permit conditions can result in substantial fines, criminal sanctions, permit revocations, injunctions, and/or facility shutdowns. Compliance with environmental laws and regulations significantly contributes to our operating costs. In addition, we have made and expect to make substantial capital expenditures on an ongoing basis to comply with environmental laws and regulations. Major modifications of our operations can also require modifications to our existing permits or upgrades to our existing pollution control equipment. Further, as described in "Risks Related to Our Entire Business." Our operations involve environmental risks that may require us to make substantial capital expenditures to remain in compliance to remediate current or future contamination that could otherwise give rise to material liabilities. We could incur significant costs and liabilities related to present and future contamination at our properties or at properties owned by third parties.
In addition, new laws and regulations, new interpretations of existing laws and regulations, increased governmental enforcement of environmental laws and regulations or other developments could require us to make additional unforeseen expenditures. Many of these laws and regulations are becoming increasingly stringent, and the cost of compliance with these requirements can be expected to increase over time. We are not able to predict the impact of new or changed laws or regulations or changes in the ways that such laws or regulations are administered, interpreted or enforced. The requirements to be met, as well as the technology and length of time available to meet those requirements, continue to develop and change. To the extent that the costs associated with meeting any of these requirements are substantial and not adequately provided for our operating results and financial condition could suffer. These expenditures or costs for environmental compliance could have a material adverse effect on our financial condition and results of operations. See "Management's Discussion and Analysis of Financial Condition and Results of Operations—Liquidity and Capital Resources—Cash Flows—Investing Activities."
New regulations concerning the transportation of hazardous chemicals, risks of terrorism and the security of chemical manufacturing facilities could result in higher operating costs.
The costs of complying with regulations relating to the transportation of hazardous chemicals and security associated with our refining and nitrogen fertilizer facilities may have a negative impact on our operating results and cause the price of our common stock to decline. Targets such as refining and chemical manufacturing facilities may be at greater risk of future terrorist attacks than other targets in the U.S. As a result, the petroleum and chemical industries have responded to the issues that arose due to the terrorist attacks of September 11, 2001 by starting new initiatives relating to the security of petroleum and chemical industry facilities and the transportation of hazardous chemicals in the U.S. Simultaneously, local, state and federal governments have begun a regulatory process that could lead to new regulations impacting the security of refinery and chemical plant locations and the transportation of petroleum and hazardous chemicals. Our business or our customers' businesses could be adversely affected because of the cost of complying with new regulations.
22
Our hedging activities could result in losses.
The nature of our operations results in exposure to fluctuations in commodity prices. If we do not effectively manage our hedging activities, we could incur significant losses. We monitor our exposure and, when appropriate, utilize derivative financial instruments and physical delivery contracts to mitigate the potential impact of declines in crude oil prices. If commodity prices decrease below those levels specified in our various hedging agreements, a fixed price contract or an option capped price structure could limit us from receiving the full benefit of commodity price decreases. In addition, by entering into these hedging activities, we may suffer financial loss if we are unable to produce oil to fulfill our obligations. In the event we are required to pay a margin call on a hedge contract we may be unable to benefit fully from an increase in the value of the commodities we sell. In addition, we may be required to make a margin payment before we realize a gain on a sale resulting in a short term reduction in cash flow.
We are currently undergoing a period of modernization and enhancement of our operations which is placing a significant strain on our management and other resources. We cannot assure you that we will be able to manage these changes effectively, or at all.
We are currently engaging in a continuing process of modernizing and enhancing our operations. This investment has placed, and our anticipated future investment in our operations will continue to place, a significant strain on our management and other resources. As part of this investment we intend to implement new operational and financial systems, procedures and controls. If we are unable to manage these changes effectively, our business could be adversely affected.
Risks Related to this Offering
There is no existing market for our common stock, and we do not know if one will develop to provide you with adequate liquidity. If our stock price fluctuates after this offering, you could lose a significant part of your investment.
Prior to this offering, there has not been a public market for our common stock. If an active trading market does not develop, you may have difficulty selling any of our common stock that you buy. We cannot predict the extent to which investor interest in our company will lead to the development of an active trading market on the Nasdaq National Market or otherwise or how liquid that market might become. The initial public offering price for the shares will be determined by negotiations between us, the selling stockholders and the underwriters and may not be indicative of prices that will prevail in the open market following this offering. Consequently, you may not be able to sell shares of our common stock at prices equal to or greater than the price paid by you in this offering. The market price of our common stock may be influenced by many factors, some of which are beyond our control, including:
- •
- the failure of securities analysts to cover our common stock after this offering or changes in financial estimates by analysts;
- •
- announcements by us or our competitors of significant contracts or acquisitions;
- •
- variations in quarterly results of operations;
- •
- loss of a large customer or supplier;
- •
- general economic conditions;
- •
- terrorist acts;
- •
- future sales of our common stock; and
- •
- investor perceptions of us and the industries in which our products are used.
23
As a result of these factors, investors in our common stock may not be able to resell their shares at or above the initial offering price. In addition, the stock market in general has experienced extreme price and volume fluctuations that have often been unrelated or disproportionate to the operating performance of companies like us. These broad market and industry factors may materially reduce the market price of our common stock, regardless of our operating performance.
Following consummation of this offering, Pegasus will continue to control us and may have conflicts of interest with other stockholders.
Upon completion of this offering, Pegasus will control % of our outstanding common stock, or % if the underwriters exercise their over-allotment option in full, through its controlling interest in Coffeyville Group Holdings, LLC, which will own shares of our common stock. As a result, Pegasus will continue to be able to control the election of our directors, determine our corporate and management policies and determine, without the consent of our other stockholders, the outcome of any corporate transaction or other matter submitted to our stockholders for approval, including potential mergers or acquisitions, asset sales and other significant corporate transactions. Pegasus will also have sufficient voting power to amend our organization documents. Further, Pegasus is in the business of making investments in companies and may, from time to time, acquire and hold interests in businesses that compete directly or indirectly with us. Pegasus may also pursue acquisition opportunities that may be complementary to our business, and as a result, those acquisition opportunities may not be available to us. So long as Pegasus continues to control a significant amount of the outstanding shares of our common stock, Pegasus will continue to be able to strongly influence or effectively control our decisions, including potential mergers or acquisitions, asset sales and other significant corporate transactions. We cannot assure you that the interests of Pegasus will coincide with the interests of other holders of our common stock.
Certain unitholders of our principal stockholder, Coffeyville Group Holdings, LLC, including members of our management, may pursue a project involving the construction of two ammonia and UAN plants in the Republic of Trinidad and Tobago, West Indies. This project is currently the subject of a non-binding memorandum of understanding with the Government of the Republic of Trinidad and Tobago and will require significant equity financing to complete. However, our management may spend a portion of their time on this project, may have an equity interest in this project and may receive separate compensation for this project. Any time and resources that our management devotes to this project could detract from their time available to us, which could have an adverse effect on our results of operations and the price of our common stock.
You will incur immediate and substantial dilution.
The initial public offering price of our common stock is substantially higher than the adjusted net tangible book value per share of our outstanding common stock. As a result, if you purchase shares in this offering, you will incur immediate and substantial dilution in the amount of $ per share. See "Dilution."
Shares eligible for future sale may cause the price our common stock to decline.
Sales of substantial amounts of our common stock in the public market, or the perception that these sales may occur, could cause the market price of our common stock to decline. This could also impair our ability to raise additional capital through the sale of our equity securities. Under our amended and restated articles of incorporation, we are authorized to issue up to shares of common stock, of which shares of common stock will be outstanding following this offering. Of these shares, shares of common stock sold in this offering will be freely transferable without restriction or further registration under the Securities Act by persons other than "affiliates," as that term is defined in Rule 144 under the Securities Act. Our principal stockholders, our directors and executive officers entered into a lock-up agreements described under the caption "Underwriting", pursuant to which it agreed, subject to certain exceptions, not to sell or transfer, directly or indirectly, any shares of our common stock for a period of 180 days from the date of this prospectus. We cannot predict the size of future issuances of our common stock or the effect, if any, that future sales and issuances of shares of our common stock would have on the market price of our common stock. See "Shares Eligible for Future Sale."
24
CAUTIONARY NOTE REGARDING FORWARD-LOOKING STATEMENTS
This prospectus contains forward-looking statements. Statements that are predictive in nature, that depend upon or refer to future events or conditions or that include the words "believe," "expect," "anticipate," "intend," "estimate" and other expressions that are predictions of or indicate future events and trends and that do not relate to historical matters identify forward-looking statements. These statements involve known and unknown risks, uncertainties and other factors, including the factors described under "Risk Factors," that may cause our actual results and performance to be materially different from any future results or performance expressed or implied by these forward-looking statements. You should not place undue reliance on these forward-looking statements. Although forward-looking statements reflect our good faith beliefs, reliance should not be placed on forward-looking statements because they involve known and unknown risks, uncertainties and other factors, which may cause our actual results, performance or achievements to differ materially from anticipated future results, performance or achievements expressed or implied by such forward-looking statements. We undertake no obligation to publicly update or revise any forward-looking statement, whether as a result of new information, future events, changed circumstances or otherwise.
25
We expect to receive $ million of gross proceeds from the sale of shares by us in this offering, based on an assumed initial public offering price of $ per share, the mid-point of the range set forth on the cover page of this prospectus. We will not receive any proceeds from the sale of shares by the selling stockholders, including any proceeds from the purchase by the underwriters of up to shares from the selling stockholders to cover over-allotments.
The table below sets forth our estimate of the sources and uses of funds for this offering and the related transactions. See "Summary—Other Transactions."
| Sources of Funds | Amounts | Uses of Funds | Amounts | ||||||
|---|---|---|---|---|---|---|---|---|---|
| | (dollars in millions) | | (dollars in millions) | ||||||
| Common stock offered by us in this offering(1) | $ | Repayment of existing senior secured credit facility(3) | $ | ||||||
| % senior notes due 20 New senior secured credit facility (2) | Payment of dividend to Coffeyville Group Holdings, LLC Fees and expenses (4) | ||||||||
| Available cash | |||||||||
Total sources | $ | Total uses | $ | ||||||
- (1)
- Assumes an initial public offering price of $ per share, the mid-point of the range shown on the cover of this prospectus.
- (2)
- Consists of a $ million term loan facility and a $ million revolving credit facility.
- (3)
- The interest rate, maturity and certain other terms of our existing senior secured credit facility are described under "Description of Our Indebtedness."
- (4)
- Consists of underwriters and initial purchases discounts and commissions, lenders fees, SEC registration fee, NASD filing fee, Nasdaq listing fee, accounting and legal fees and expenses, transfer agent's fees and expenses, printing and engraving expenses and other miscellaneous fees and expenses.
On May 10, 2004, Coffeyville Group Holdings, LLC distributed an aggregate dividend of approximately $100 million to its preferred and common unit holders. Prior to the completion of this offering, we intend to (i) make a cash distribution from Coffeyville Resources, LLC to our joint venture which will then make a distribution to The Leiber Group, Inc. in connection with the dissolution of our joint venture, and (ii) pay a $ million dividend to Coffeyville Group Holdings, LLC. See "Related Party Transactions." Following the completion of this offering, we do not anticipate paying any cash dividends in the foreseeable future. We currently intend to retain future earnings, if any, to finance operations and the expansion of our business. Any future determination to pay cash dividends will be at the discretion of the board of directors and will be dependent upon our financial condition, results of operations, capital requirements and other factors that the board deems relevant. Our senior secured credit facility currently limits our ability to pay dividends and make distributions to our stockholders and we anticipate that the agreement governing the new senior secured credit facilities and the indenture governing the % senior notes will contain similar limitations. See "Description of Our Indebtedness."
26
The following table describes our consolidated capitalization as of December 31, 2004:
- •
- on an actual basis;
- •
- on an as adjusted basis to give effect to the distribution of $ million to The Lieber Group, Inc. in connection with the liquidation of a joint venture;
- •
- on an as further adjusted basis to give effect to the sale by us of shares in this offering at an assumed initial offering price of $ per share (the mid point of the range); and
- •
- on an as further adjusted basis to give effect to (i) the repayment of our existing senior secured credit facility and the related write off of loan issuance costs (ii) the entry into of a new senior secured credit facility by Coffeyville Resources, LLC, (iii) the offering of $ million aggregate principal amount of % senior notes by Coffeyville Resources, LLC, and (iv) the payment of a $ million dividend to Coffeyville Group Holdings, LLC.
You should read this table in conjunction with "Use of Proceeds," "Selected Historical Consolidated Financial Data," "Management's Discussion and Analysis of Financial Condition and Results of Operations," and the consolidated financial statements and related notes included elsewhere in this prospectus.
| | As of December 31, 2004 | ||||||||||||
|---|---|---|---|---|---|---|---|---|---|---|---|---|---|
| | Actual | As Adjusted for Leiber Distribution | As Further Adjusted for the Offering | As Further Adjusted for the Refinancing and Senior Notes | |||||||||
| | (in millions) | ||||||||||||
| Existing senior secured credit facilities: | |||||||||||||
| Revolving credit facility | $ | 0.1 | $ | $ | $ | ||||||||
| Term loan facility (including current portion) | 148.9 | ||||||||||||
| New senior secured credit facilities: | |||||||||||||
| Revolving credit facility | — | ||||||||||||
| Term loan facility | — | ||||||||||||
| % senior notes | — | ||||||||||||
| Total debt | 149.0 | ||||||||||||
Stockholders' equity | 14.1 | ||||||||||||
| Total capitalization | $ | 163.1 | $ | $ | $ | ||||||||
27
Purchasers of common stock offered by this prospectus will suffer immediate and substantial dilution in net tangible book value per share. Our pro forma net tangible book value as of December 31, 2004 was approximately $ million, or approximately $ per share of common stock. Pro forma net tangible book value per share represents the amount of tangible assets less total liabilities, divided by the number of shares of common stock outstanding.
Dilution in net tangible book value per share represents the difference between the amount per share paid by purchasers of our common stock in this offering and the pro forma net tangible book value per share of our common stock immediately after this offering. After giving effect to the sale of shares of common stock in this offering at an assumed initial public offering price of $ per share and after deduction of the estimated underwriting discounts and commissions and estimated offering expenses payable by us, our pro forma net tangible book value as of December 31, 2004 would have been approximately $ million, or $ per share. This represents an immediate increase in net tangible book value of $ per share of common stock to our existing stockholders and an immediate pro forma dilution of $ per share to purchasers of common stock in this offering. The following table illustrates this dilution on a per share basis.
| Assumed initial public offering price per share | $ | |||
| Net tangible book value per share as of December 31, 2004 | $ | |||
| Increase per share attributable to new investors | ||||
| Net tangible book value per share after the offering | $ | |||
| Dilution per share to new investors | $ | |||
The following table sets forth as of December 31, 2004, the number of shares of common stock purchased or to be purchased from us, total consideration paid or to be paid and the average price per share paid by our existing stockholders and by new investors, before deducting estimated underwriting discounts and commissions and estimated offering expenses payable by us at an assumed initial public offering price of $ per share.
| | Shares Purchased | Total Consideration | | ||||||||||
|---|---|---|---|---|---|---|---|---|---|---|---|---|---|
| | Average Price Per Share | ||||||||||||
| | Number | Percent | Amount | Percent | |||||||||
| Existing stockholders | % | $ | % | $ | |||||||||
| New investors | |||||||||||||
| Total | 100.0 | % | $ | 100.0 | % | $ | |||||||
28
UNAUDITED PRO FORMA CONDENSED CONSOLIDATED STATEMENTS OF OPERATIONS
The following unaudited pro forma condensed consolidated statements of operations of Coffeyville Resources, Inc. have been derived from the historical statements of operations of the Farmland petroleum business and one facility within Farmland's eight-plant nitrogen fertilizer manufacturing and marketing division (collectively, the Predecessor) for the 62 day period ended March 2, 2004 and Coffeyville Group Holdings, LLC and subsidiaries, excluding the operations of Leiber Holdings, LLC, which will be separated from Coffeyville Resources, Inc., as more fully described in note 1 to our consolidated financial statements included elsewhere in this prospectus (the Successor), for the 304 day period ended December 31, 2004, adjusted to give pro forma effect to the Acquisition, to reflect the refinancing of our senior secured credit facility on May 10, 2004, and to give pro forma effect to the distribution of $ to The Leiber Group, Inc. in connection with the liquidation of a joint venture as if each had occurred as of January 1, 2004. In addition, the following unaudited pro forma condensed consolidated statements of operations have been adjusted to give pro forma effect to (i) the repayment of our existing senior secured credit facility, (ii) the entry into a new senior secured credit facility by Coffeyville Resources, LLC, (iii) the offering of $ million aggregate principal amount of % senior notes by Coffeyville Resources, LLC, and (iv) the payment of a $ million dividend to Coffeyville Group Holdings, LLC, as if each had occurred on January 1, 2004.
The unaudited pro forma condensed consolidated statements of operations for the year ended December 31, 2004, based on the audited financial statements of Coffeyville Resources, Inc., included elsewhere in this prospectus, give pro forma effect to the Acquisition as if it had occurred on January 1, 2004.
The unaudited pro forma condensed consolidated statements of operations are not necessarily indicative of our operations had any or all of the events described above taken place on the date indicated and are not intended to project our results of operations for any future period.
The pro forma adjustments are based on available information and certain assumptions that we believe are reasonable. The pro forma adjustments and certain assumptions are described in the accompanying notes. Other information included under this heading has been presented to provide additional analysis. The allocation of the purchase price to the net assets acquired has been performed in accordance with Statement of Financial Accounting Standards (SFAS) 141.
The unaudited pro forma statements of operations set forth below should be read in conjunction with our financial statements, the related notes and "Management's Discussion and Analysis of Financial Condition and Results of Operations" included elsewhere in this prospectus.
29
Coffeyville Resources, Inc.
Unaudited Pro Forma Condensed Consolidated Statements of Operations
For the Year Ended December 31, 2004
| | Historical Predecessor | Historical Successor | | | | | Pro Forma to Give Effect to the Related Transactions | ||||||||||||||
|---|---|---|---|---|---|---|---|---|---|---|---|---|---|---|---|---|---|---|---|---|---|
| | Combined | | | | |||||||||||||||||
| | Pro Forma Adjustments to Give Effect to the Acquisition, Refinancing and Leiber Distribution | | | ||||||||||||||||||
| | 62 Days Ended March 2, 2004 | 304 Days Ended December 31, 2004 | | Pro Forma Year Ended December 31, 2004 | Pro Forma Adjustments to Give Effect to the Related Transactions | ||||||||||||||||
| | Year Ended December 31, 2004 | Year Ended December 31, 2004 | |||||||||||||||||||
| | (in millions, except as otherwise indicated) | ||||||||||||||||||||
| Net sales | $ | 261.1 | $ | 1,479.9 | $ | 1,741.0 | — | $ | 1,741.0 | ||||||||||||
| Cost of goods sold | 245.2 | 1,363.4 | 1,608.6 | (0.1) | (a) | 1,608.5 | |||||||||||||||
| Gross profit | 15.9 | 116.5 | 132.4 | 0.1 | 132.5 | ||||||||||||||||
Operating expenses: | |||||||||||||||||||||
| Selling, general,and administrative expenses | 4.7 | 16.5 | 21.2 | (1.7) | (b) | 19.5 | |||||||||||||||
| Total operating expenses | 4.7 | 16.5 | 21.2 | (1.7 | ) | 19.5 | |||||||||||||||
| Operating income | 11.2 | 100.0 | 111.2 | 1.8 | 113.0 | ||||||||||||||||
Other (income) expense | — | 6.4 | 6.4 | (7.2) | (c) | (0.8 | ) | ||||||||||||||
| Interest expense | — | 10.1 | 10.1 | 3.3 | (d) | 13.4 | |||||||||||||||
| Income before taxes | 11.2 | 83.5 | 94.7 | 5.7 | 100.4 | ||||||||||||||||
| Provision for income taxes | — | 33.8 | 33.8 | 6.8 | (e) | 40.6 | |||||||||||||||
| Net income | $ | 11.2 | $ | 49.7 | $ | 60.9 | $ | (1.1 | ) | $ | 59.8 | ||||||||||
Pro forma earnings per share, basic and diluted (f) | $ | 0.67 | |||||||||||||||||||
Pro forma weighted average shares, basic and diluted (f) | 74.7 | ||||||||||||||||||||
30
- (a)
- To reflect the decrease in depreciation on the revalued property, plant, and equipment resulting from the allocation of the purchase price using a straight-line basis over 3 – 30 years, due to an increase in the acquired assets useful lives compared to the predecessor period based on management's assessment of the acquired assets' condition at the Acquisition date.
- The allocation of the purchase price at March 3, 2004, the date of the Acquisition, as more fully described in note 1 to the consolidated financial statements, is as follows (in millions):
| Assets acquired | |||||
Inventories | $ | 100.5 | |||
| Prepaid expenses and other current assets | 1.1 | ||||
| Property, plant, and equipment | 38.2 | ||||
| Total assets acquired | $ | 139.8 | |||
Liabilities assumed | |||||
Deferred revenue | $ | 9.9 | |||
| Capital lease obligations | 1.2 | ||||
| Environmental obligations | 10.8 | ||||
| Other long term liabilities | 1.3 | ||||
| Total liabilities assumed | $ | 23.2 | |||
Cash paid for acquisition of Predecessor | $ | 116.6 | |||
- (b)
- To adjust general corporate expenses allocated to the Predecessor to estimated costs that would have been incurred if the Predecessor had operated as a stand-alone entity.
- (c)
- To reverse the write-off of $7.2 million of deferred financing costs incurred in connection with the refinancing of our senior secured credit facility on May 10, 2004.
- (d)
- To increase interest expense for (1) interest resulting from the issuance of debt to refinance our senior secured credit facility on May 10, 2004 giving pro forma effect to the refinancing of our debt as if it had occurred on January 1, 2004 and (2) amortization of deferred financing cost resulting from $10.0 million of deferred financing charges amortized on an effective interest amortization method over the term of the debt. An assumed interest rate of 6.10% based on the interest rate in effect on the term loan as of May 10, 2004 was used to calculate interest expense on an average balance of $150.0 million of term debt outstanding as of May 10, 2004. A change of 1% in the interest rate would result in a change in interest expense and net income of $1,517,958 and $903,519 before and after tax, respectively.
- (e)
- To reflect the income tax effect of pro forma pre-tax earnings of $100.4 million for the year ended December 31, 2004, based on a combined federal and state statutory income tax rate of approximately 40%. Predecessor was not a separate legal entity, and its operating results were included with the operating results of Farmland and its subsidiaries in filing consolidated federal and state income tax returns. Farmland did not allocate income taxes to its divisions. As a result, the accompanying historical predecessor consolidated financial statements do not reflect any provisions for income taxes.
- (f)
- To calculate earnings per share on a pro forma basis, based on an assumed number of shares outstanding at the time of the initial public offering with respect to the existing shares. All information in this prospectus assumes that prior to this offering, Coffeyville Group Holdings, LLC's five direct subsidiaries will merge with and into us, in exchange for which we will issue 74,852,941 shares of our common stock to Coffeyville Group Holdings, LLC. No effect has been given to any incremental shares that might be issued in this offering.
31
SELECTED HISTORICAL CONSOLIDATED FINANCIAL DATA
You should read the selected historical consolidated financial data presented below in conjunction with "Management's Discussion and Analysis of Financial Condition and Results of Operations" and our consolidated financial statements and the related notes included elsewhere in this prospectus. The selected consolidated statement of operations data presented below for the years ended December 31, 2002 and 2003, for the 62 day period ended March 2, 2004, and for the 304 days ended December 31, 2004, and the selected balance sheet data as of December 31, 2003 and 2004 have been derived from our audited consolidated financial statements included elsewhere in this prospectus, which financial statements have been audited by KPMG LLP, independent registered public accounting firm. The consolidated statements of operations data for the years ended December 31, 2001, and the balance sheet data at December 31, 2001 and 2002 and at March 2, 2004 are derived from our audited consolidated financial statements that are not included in this prospectus. The consolidated statements of operations data for the year ended December 31, 2000 and the balance sheet data at December 31, 2000, are derived from our unaudited consolidated financial statements that are not included in this prospectus.
Prior to March 3, 2004, our assets were operated as a component of Farmland. Farmland filed for bankruptcy protection under Chapter 11 of the U.S. Bankruptcy Code on May 31, 2002. On March 3, 2004, Coffeyville Resources, LLC completed the purchase of these assets from Farmland in a sales process under Chapter 11 of the U.S. Bankruptcy Code. See note 1 to our consolidated financial statements included elsewhere in this prospectus. As a result of certain adjustments made in connection with the Acquisition, a new basis of accounting was established on the date of the Acquisition and the results of operations for the 304 days ended December 31, 2004 are not comparable to prior periods.
During the Predecessor periods, Farmland allocated certain general corporate expense and interest expense to the Predecessor. The allocation of these costs is not necessarily indicative of the costs that would have been incurred if the Predecessor had operated as a stand-alone entity. The historical results are not necessarily indicative of the results to be expected in future periods.
We calculate earnings per share for the Successor on a pro forma basis, based on an assumed number of shares outstanding at the time of the initial public offering with respect to the existing shares. All information in this prospectus assumes that prior to this offering, Coffeyville Group Holdings, LLC's five direct subsidiaries will merge with and into us, in exchange for which we will issue 74,852,941 shares of our common stock to Coffeyville Group Holdings, LLC. No effect has been given to any incremental shares that might be issued in this offering.
We have omitted per share data for the Predecessor because, under Farmland's cooperative structure, earnings of the Predecessor were distributed as patronage dividends to members and associate members based on the level of business conducted with the Predecessor as opposed to a common shareholder's proportionate share of underlying equity in the Predecessor.
The Predecessor was not a separate legal entity, and its operating results were included with the operating results of Farmland and its subsidiaries in filing consolidated federal and state income tax returns. As a cooperative, Farmland was subject to income taxes on all income not distributed to patrons as qualifying patronage refunds and Farmland did not allocate income taxes to its divisions. As a result, the Predecessor periods do not reflect any provision for income taxes.
32
| | Predecessor | Successor | |||||||||||||||||
|---|---|---|---|---|---|---|---|---|---|---|---|---|---|---|---|---|---|---|---|
| | Year Ended December 31, | 62 Days Ended March 2, 2004 | 304 Days Ended December 31, 2004 | ||||||||||||||||
| | 2000 | 2001 | 2002 | 2003 | |||||||||||||||
| (unaudited) | |||||||||||||||||||
| (in millions, except as otherwise indicated) | |||||||||||||||||||
| Statement of Operations Data: | |||||||||||||||||||
| Net sales | $ | 1,440.6 | $ | 1,630.2 | $ | 887.5 | $ | 1,262.2 | $ | 261.1 | $ | 1,479.9 | |||||||
| Gross profit (loss) | (28.6 | ) | 6.8 | (58.5 | ) | 63.9 | 15.9 | 116.5 | |||||||||||
Selling, general and administrative expenses | 11.7 | 24.8 | 16.3 | 23.6 | 4.7 | 16.5 | |||||||||||||
| Impairment, (earnings) losses in joint ventures, and other charges(1) | (29.0 | ) | 2.8 | 375.1 | 10.9 | — | — | ||||||||||||
| Operating income (loss) | $ | (11.3 | ) | $ | (20.8 | ) | $ | (449.9 | ) | $ | 29.4 | $ | 11.2 | $ | 100.0 | ||||
| Other (income) expense and (gain) loss on sale in joint ventures(2) | (0.5 | ) | (19.7 | ) | 4.1 | 0.2 | — | 6.4 | |||||||||||
| Interest expense | 18.9 | 18.3 | 11.7 | 1.3 | — | 10.1 | |||||||||||||
| Income (loss) before taxes | $ | (29.7 | ) | $ | (19.4 | ) | $ | (465.7 | ) | $ | 27.9 | $ | 11.2 | $ | 83.5 | ||||
| Income tax (benefit) provision for taxes | — | — | — | — | — | 33.8 | |||||||||||||
| Net income (loss) | $ | (29.7 | ) | $ | (19.4 | ) | $ | (465.7 | ) | $ | 27.9 | $ | 11.2 | $ | 49.7 | ||||
Pro forma earnings per share, basic and diluted | $ | 0.67 | |||||||||||||||||
Pro forma weighted average shares, basic and diluted | 74.7 | ||||||||||||||||||
Historical dividends per unit: | |||||||||||||||||||
| Preferred | — | — | — | — | — | $ | 1.50 | ||||||||||||
| Common | — | — | — | — | — | $ | 0.48 | ||||||||||||
Balance Sheet Data: | |||||||||||||||||||
| Cash, cash equivalents and short-term investments | $ | — | $ | — | $ | — | $ | — | $ | — | $ | 52.7 | |||||||
| Working capital | 147.7 | 71.2 | 122.2 | 150.5 | 103.6 | 106.6 | |||||||||||||
| Liabilities subject to compromise | — | — | $ | 105.2 | $ | 105.2 | $ | 99.1 | — | ||||||||||
| Total assets | 452.5 | 300.3 | 172.3 | 199.0 | 158.9 | 229.2 | |||||||||||||
| Total debt | — | — | — | — | — | 148.9 | |||||||||||||
| Divisional/members' equity | 344.1 | 241.4 | 49.8 | 58.2 | 16.2 | 14.1 | |||||||||||||
Other Financial Data: | |||||||||||||||||||
| Depreciation and amortization | $ | 17.3 | $ | 19.1 | $ | 30.8 | $ | 3.3 | $ | 0.4 | $ | 2.4 | |||||||
| EBITDA(3) | 6.5 | 18.0 | (423.2 | ) | 32.5 | 11.6 | 96.0 | ||||||||||||
| Adjusted EBITDA(4) | 6.5 | 18.7 | (47.8 | ) | 42.1 | 11.6 | 103.2 | ||||||||||||
| Capital expenditures for property, plant and equipment | 9.2 | 8.2 | 272.4 | 0.8 | — | 14.2 | |||||||||||||
Key Operating Statistics: | |||||||||||||||||||
Petroleum Business | |||||||||||||||||||
| Production (barrels per day) | 94,730 | 94,758 | 84,343 | 95,701 | 106,645 | 102,046 | |||||||||||||
| Crude oil throughput (barrels per day) | 85,423 | 84,605 | 74,446 | 85,501 | 92,596 | 90,418 | |||||||||||||
Nitrogen Fertilizer Business | |||||||||||||||||||
| Production Volume: | |||||||||||||||||||
| Ammonia (tons in thousands) | 12.4 | 198.5 | 265.1 | 335.7 | 56.4 | 252.8 | |||||||||||||
| UAN (tons in thousands) | 8.3 | 286.2 | 434.6 | 510.6 | 93.4 | 439.2 | |||||||||||||
33
- (1)
- Includes the following:
- •
- During the year ended December 31, 2000, we recorded earnings of $29.0 million related to our joint venture interest in Cooperative Refining LLC and Country Energy, LLC.
- •
- During the year ended December 31, 2001, we recognized expenses of $2.8 million for our share of losses of Country Energy, LLC.
- •
- During the year ended December 31, 2002, we recorded a $375.1 million asset impairment related to the write-down of the refinery and nitrogen fertilizer plant to fair market value.
- •
- During the year ended December 31, 2003, we recorded an additional charge of $9.6 million related to the asset impairment of the refinery and nitrogen plant based on the expected sales price of the assets in the Acquisition. In addition, we recorded a charge of $1.3 million for the rejection of existing contracts.
- (2)
- Includes a gain on sale of joint venture interest of $18.0 million that was recorded in 2001 for the disposition of our share in Country Energy, LLC. During the 304 days ended December 31, 2004, we recognized a loss of $7.2 million on early extinguishment of debt.
- (3)
- EBITDA represents earnings before net interest, taxes, depreciation and amortization. Management believes that EBITDA is a useful adjunct to net income and other measurements under GAAP because it is a meaningful measure for evaluating our performance in a given period compared to prior periods and compared to other companies in our industry as interest, taxes, depreciation and amortization can vary significantly across periods and between companies due in part to differences in accounting policies, tax strategies, levels of indebtedness, capital purchasing practices and interest rates. EBITDA also assists management in evaluating operating performance. EBITDA, with adjustments specified in our credit facility, is also the basis for calculating our financial debt covenants under our existing credit facility. Accordingly, management believes that EBITDA is an accepted indicator of our ability to incur and service debt obligations. EBITDA has distinct limitations as compared to GAAP information such as net income, income from continuing operations or operating income. By excluding interest and income taxes for example, it may not be apparent that both represent a reduction in cash available to us. Likewise, depreciation and amortization, while non-cash items, represent generally the decreases in value of assets that produce revenue for us. EBITDA should not be substituted as an alternative to net income or income from operations, which are measures of performance in accordance with GAAP. We believe EBITDA assists the investing community in evaluating our performance. Our computation of EBITDA may not be comparable to other similarly titled measures computed for other purposes or by other companies, because all companies do not calculate EBITDA in the same fashion. The following is a reconciliation of EBITDA to Net income:
| | | Predecessor | | Successor | |||||||||||||||
|---|---|---|---|---|---|---|---|---|---|---|---|---|---|---|---|---|---|---|---|
| | | Year Ended December 31, | 62 Days Ended March 2, 2004 | 304 Days Ended December 31, 2004 | |||||||||||||||
| | | 2000 | 2001 | 2002 | 2003 | ||||||||||||||
| | | (in millions) | |||||||||||||||||
| EBITDA | $ | 6.5 | $ | 18.0 | $ | (423.2 | ) | $ | 32.5 | $ | 11.6 | $ | 96.0 | ||||||
| Less: | |||||||||||||||||||
| Income tax provision | — | — | — | — | — | 33.8 | |||||||||||||
| Interest expense | 18.9 | 18.3 | 11.7 | 1.3 | — | 10.1 | |||||||||||||
| Depreciation and amortization | 17.3 | 19.1 | 30.8 | 3.3 | 0.4 | 2.4 | |||||||||||||
| Net income | $ | (29.7 | ) | $ | (19.4 | ) | $ | (465.7 | ) | $ | 27.9 | $ | 11.2 | $ | 49.7 | ||||
- (4)
- For the periods presented, Adjusted EBITDA represents EBITDA plus or minus these special items described below. Management believes additional adjustments to EBITDA for these special charges provides a meaningful comparison of period-to-period results. We present Adjusted EBITDA as a further supplemental measure of our performance and ability to service debt. We prepare adjusted EBITDA by adjusting EBITDA to eliminate the impact of a number of items we do not consider indicative of our ongoing operating performance. As an analytical tool, Adjusted EBITDA is subject to all of the limitations applicable to EBITDA. In addition, in evaluating Adjusted EBITDA, you should be aware that in the future we
34
may incur expenses similar to the adjustments in this presentation. Our presentation of Adjusted EBITDA should not be construed as an inference that our future results will be unaffected by unusual items.
| | | Predecessor | Successor | ||||||||||||||||
|---|---|---|---|---|---|---|---|---|---|---|---|---|---|---|---|---|---|---|---|
| | | Year Ended December 31, | 62 Days Ended March 2, 2004 | 304 Days Ended December 31, 2004 | |||||||||||||||
| | | 2000 | 2001 | 2002 | 2003 | ||||||||||||||
| | | (in millions) | |||||||||||||||||
| Adjusted EBITDA | $ | 6.5 | $ | 18.7 | $ | (47.8 | ) | $ | 42.1 | $ | 11.6 | $ | 103.2 | ||||||
| Less: | |||||||||||||||||||
| Impairment of property, plant and equipment(a) | — | — | 375.1 | 9.6 | — | — | |||||||||||||
| Fertilizer lease payments(b) | — | 18.7 | 0.3 | — | — | — | |||||||||||||
| Gain on sale of joint venture interest(c) | — | (18.0 | ) | — | — | — | — | ||||||||||||
| Loss on extinguishment of debt(d) | — | — | — | — | — | 7.2 | |||||||||||||
| EBITDA | $ | 6.5 | $ | 18.0 | $ | (423.2 | ) | $ | 32.5 | $ | 11.6 | $ | 96.0 | ||||||
- (a)
- During the year ended December 31, 2002, we recorded a $375.1 million asset impairment related to the write-down of our refinery and nitrogen fertilizer plant to fair market value. During the year ended December 31, 2003, we recorded an additional charge of $9.6 million related to the asset impairment of our refinery and nitrogen fertilizer plant based on the expected sales price of the assets in the Acquisition.
- (b)
- Reflects the impact of an operating lease structure utilized by Farmland to finance the nitrogen fertilizer plant. The cost of this plant under the operating lease was $263.0 million and the rental payments were $18.7 million and $0.3 million for the periods ended December 31, 2001 and 2002, respectively. In February 2002, Farmland refinanced the operating lease into a secured loan structure, which effectively terminated the lease and all of Farmland's obligations under the lease.
- (c)
- Reflects the gain on sale of $18.0 million, which was recorded for the disposition of the Predecessor's share in Country Energy, LLC.
- (d)
- Represents the write-off of $7.2 million of deferred financing costs in connection with the refinancing of our senior secured credit facility on May 10, 2004.
35
MANAGEMENT'S DISCUSSION AND ANALYSIS OF FINANCIAL CONDITION
AND RESULTS OF OPERATIONS
You should read the following discussion and analysis of our financial condition and results of operations in conjunction with our financial statements and related notes included elsewhere in this prospectus. This discussion and analysis contains forward-looking statements that involve risks, uncertainties and assumptions. Our actual results may differ materially from those anticipated in these forward-looking statements as a result of a number of factors, including, but not limited to those set forth under "Risk Factors" and elsewhere in this prospectus.
Overview and Executive Summary
We are one of the largest independent high complexity petroleum refiners and marketers in the mid-continental U.S. and the lowest cost producer and marketer of upgraded nitrogen fertilizer products in North America. Our operations are organized into two business segments: petroleum and nitrogen fertilizer. Our petroleum business includes a complex cracking/coking oil refinery in Coffeyville, Kansas, a crude oil gathering system throughout Kansas and Northern Oklahoma, and storage and terminalling facilities for asphalt and refined fuels in Phillipsburg, Kansas. Our refinery operates in close proximity to our primary customer base and benefits from favorable crude oil supply and product distribution logistics. Our nitrogen fertilizer business in Coffeyville, Kansas, includes a petroleum coke gasification plant that produces high purity hydrogen that is converted to ammonia at our ammonia plant and upgraded to UAN at our UAN plant. We operate the only commercial nitrogen fertilizer plant in North America utilizing a coke gasification process to generate hydrogen feedstock that is further converted to ammonia for the production of nitrogen fertilizers. This currently provides us with a significant competitive advantage due to the high prevailing and volatile natural gas prices.
Factors Affecting Comparability
Our results over the past three years have been influenced by the following factors, which are fundamental to understanding comparisons of our period-to-period financial performance.
Coffeyville Group Holdings, LLC was formed in 2003 by an investor group led by Pegasus specifically for the acquisition of Farmland's petroleum business and a nitrogen fertilizer plant. On March 3, 2004, Coffeyville Resources, LLC completed the acquisition of the former Farmland petroleum division and one facility within Farmland's eight-plant nitrogen fertilizer manufacturing and marketing division which now comprise our business. As a result, financial information as of and for the periods prior to March 3, 2004 discussed below and included elsewhere in this prospectus was derived from the financial statements and reporting systems of Farmland. Prior to March 3, 2004, Farmland's petroleum division was primarily comprised of our current petroleum business. Our nitrogen fertilizer plant, however, was only one facility within Farmland's eight-plant nitrogen fertilizer manufacturing and marketing division.
A new basis of accounting was established on the date of the Acquisition and, therefore, the financial position and operating results after March 3, 2004 are not consistent with the operating results before the Acquisition date. However, management believes the most practical way to comment on the statement of operations data due to the short period from January 1, 2004 to March 2, 2004 is to compare the sum of the operating results for both periods in 2004 with the corresponding period in 2003. Management believes it is not practical to comment on the cash flows from operating activities in the same manner because the Acquisition resulted in certain comparisons not being meaningful. For instance, we did not assume the accounts receivable or the accounts payable of Farmland. Farmland collected and made payments on these accounts after March 3, 2004 and these transactions are not included in our consolidated statements of cash flows.
36
Our financial statements prior to March 3, 2004 reflect an allocation of certain general corporate expenses of Farmland, including general and corporate insurance, property insurance, corporate retirement and benefits, human resource and payroll department salaries, facility costs, information services, and information systems support. For the years ended December 31, 2002 and 2003, and for the 62 day period ended March 2, 2004, these costs allocated to our businesses were approximately $6.3 million, $12.7 million and $3.8 million, respectively. Our financial statements prior to March 3, 2004 also reflect an allocation of interest expense from Farmland. These allocations were made by Farmland on a basis deemed meaningful for their internal management needs and may not be representative of the actual expense levels required to operate the businesses at that time or as they have been operated after March 3, 2004. With the exception of insurance, the net impact to our financial statements as a result of these allocations is higher selling, general and administrative expense for the period from January 1, 2003 to March 2, 2004. For periods prior to December 31, 2002, allocations result in less selling, general and administrative expense since Farmland was able to allocate corporate costs across multiple divisions. Our insurance costs are greater than the period prior to March 3, 2004 as we have elected to obtain additional insurance coverage that had not been carried by Farmland. Examples of this additional insurance coverage are business interruption insurance and a remediation cost cap policy related to assumed RCRA corrective orders related to contamination at or that originated from the refinery and the Phillipsburg terminal. The preceding examples and other coverage changes resulted in additional insurance costs for us.
The financial statements for our nitrogen fertilizer business prior to February 2002 reflect the impact of an operating lease structure utilized by Farmland to finance our nitrogen fertilizer plant. The cost of this plant under the operating lease was $263.0 million and the rental payment was $0.3 million for the year ended December 31, 2002. In February 2002, Farmland refinanced the operating lease into a secured loan structure, which effectively terminated the lease and all of Farmland's obligations under the lease. We have included the rental payments under these operating leases in the gross margin excluding operating expenses and operating expenses of the Predecessor for a portion of 2002. In addition, the rental payments on the nitrogen fertilizer plant were not added back to net income in the calculation of EBITDA. Subsequent to the refinancing of the operating lease into a secured loan structure, the nitrogen fertilizer plant assets were capitalized onto Farmland's financial statements. This resulted in the reporting of depreciation and interest expense, which are both added back to net income in our calculation of EBITDA.
During 2002, our refinery was shut down for approximately six weeks in order to perform planned major maintenance. We reported costs of $17.0 million associated with this shutdown using the direct expense method of accounting and included this expense in the cost of sales during 2002. Due to the planned major maintenance, our financial statements were impacted by the $17.0 million of maintenance expenses, $8.0 million of unrecoverable fixed costs and a loss of refinery crude throughput of approximately 2.6 million barrels. We have planned major maintenance at our refinery for late in the third quarter or early in the fourth quarter in 2006 and 2010.
In December 2002, Farmland implemented Statement of Financial Accounting Standards (SFAS) No. 144, resulting in a reorganization expense from the impairment of long-lived assets. Under this Statement, recoverability of assets to be held and used is measured by comparison of the carrying amount of an asset to the estimated undiscounted future net cash flows expected to be generated by the asset. It was determined that the carrying amount of the petroleum assets and the carrying amount of our nitrogen fertilizer plant in Coffeyville exceeded their estimated future undiscounted net cash flow. As a result, impairment charges of $144.3 million and $230.8 million were recognized for each of the refinery and fertilizer assets, based on Farmland's debt assumptions regarding the use and eventual disposition of those assets, primarily from indications of value received from potential bidders through the bankruptcy sale process. In 2003, as a result of receiving a stalking horse bid from Coffeyville Resources, LLC in the bankruptcy court's sales process, Farmland revised its estimate for the amount
37
to be generated from the disposition of these assets, and an additional impairment charge was taken. The charge to earnings in 2003 was $4.0 million and $5.7 million, respectively, for the refinery and fertilizer assets.
In December 2001, Farmland entered into an agreement to sell to CHS, Inc. all of Farmland's refined products produced at the Coffeyville refinery through November 2003. The selling price for this production was set by reference to daily market prices within a defined geographic region. Subsequent to the expiration of this contract, the petroleum business began marketing its refined products in the open market to multiple customers.
The revenue received by the petroleum business under the CHS agreement was limited due to the pricing formula and product mix. From December 2001 through November 2003, under the CHS agreement both sales of bulk pipeline shipments and truckload quantities at the Coffeyville truck rack were priced at Group III Platts Low. Currently, all sales at the Coffeyville truck rack are sold at the Platts mean price or higher. Our term contracted bulk product sales are priced between the Platts low and Platts mean prices. All other bulk sales are sold at spot market prices. In addition, we are selling several value added products that were not produced under the CHS agreement.
For the periods ending December 31, 2002 and 2003 and the first 62 days of 2004, Farmland's sales of nitrogen fertilizer products were subject to a marketing agreement with Agriliance, LLC. Under the agreement, Agriliance was responsible for marketing substantially all of the nitrogen made by Farmland on a basis deemed meaningful to their internal management. Following the Acquisition, we began marketing nitrogen fertilizer products directly to distributors and dealers. As a result, we have been able to generate higher average netbacks on sales of fertilizer products as a percentage of market average prices. For example, in 2004, we generated average netbacks as a percentage of market averages of 90.1% and 80.2% for ammonia and UAN, respectively, compared to average netbacks as a percentage of market averages of 86.6% and 75.9% for ammonia and UAN, respectively, in 2003.
Industry Factors
Earnings for our petroleum business depend largely on refining industry margins, which have been and continue to be volatile. Crude oil and refined product prices depend on factors beyond our control. While it is impossible to predict refining margins due to the uncertainties associated with global crude oil supply and global and domestic demand for refined products, we believe that refining margins for U.S. refineries will generally remain above those experienced in the period from and including 1998 through 2003 as growth in demand for refining products in the U.S., particularly transportation fuels, continues to exceed the ability of domestic refiners to increase capacity. In addition, global supply and other factors have constricted the extent to which product importation to the U.S. can relieve domestic supply deficits. This phenomenon is more pronounced in our marketing region, where demand for refined products has exceeded refining production by approximately 38% since 1997.
During 2004, the market price of distillates relative to crude oil was above average due to low industry inventories and strong consumer demand brought about by the relatively cold winter weather in the Midwest and high natural gas prices. This phenomenon led to an increase in industrial users switching from natural gas to fuel oil and the markets anticipation of a fuel oil deficit in the winter of 2003-2004. In addition, gasoline margins were above average, and substantially so during the spring and summer driving seasons, primarily because of very low pre-driving season inventories exacerbated by high demand growth. The increased demand for refined products due to the relatively cold winter and the decreased supply due to high turnaround activity led to increasing refining margins during the early part of 2004.
When product demand spikes, this demand is met largely by refineries capable of processing only light sweet crude. This is due to the fact that a majority of refineries are equipped to process only light sweet crude. This puts upward pressure on light sweet crude pricing. As a result, refineries such as
38
ours, which can process heavy sour crudes are able to benefit. This is evident in market conditions such as those that existed in 2004 when refining margins widened.
Average discounts for sour and heavy sour crude oil compared to sweet crude increased in 2004 from already favorable 2003 levels due to increasing worldwide production of sour and heavy sour crude oil relative to the worldwide production of light sweet crude oil coupled with the continuing demand for light sweet crude oil. In 2003, the discount for West Texas Sour (WTS) versus West Texas Intermediate (WTI) widened to $2.75 per barrel and this sweet/sour spread continues to exceed recent average historic levels. WTI continues to trade at a premium to WTS due to continued high demand for sweet crude oil resulting from the more stringent fuel specifications implemented in the United States and Europe and the higher margins for light products. We expect to continue to recognize significant benefits from our ability to meet current fuel specifications using predominantly heavy and medium sour crude oil feedstocks as the discount for heavy and medium sour crude oil compared to WTI continues at its current level.
We expect refined product supply and demand balances to tighten worldwide as growth in demand for refined products is expected to exceed net capacity growth, particularly for transportation fuels. We expect that a portion of the supply growth due to new capacity built by foreign refiners and the continued de-bottlenecking and expansion of existing refineries will likely be offset by more stringent environmental specifications that will place further supply pressure on clean fuel availability resulting from the high capital requirements to meet worldwide low-sulfur gasoline and diesel specifications. We expect that the worldwide growth in the production of sour and heavy sour crude oil will continue to exceed increases in the production of light sweet crude oil and that this, along with the continuing demand for light sweet crude oil, will support a wide spread between the prices of light sweet and heavy sour crude oil. Our refinery is able to extract economic benefit under these conditions because of its ability to accommodate heavy crude in the crude slate and retain value from the by-products of that refining process.
Earnings for our nitrogen fertilizer business depend largely on the prices of nitrogen fertilizer products, the floor price of which is directly influenced by natural gas prices. Natural gas prices have been and continue to be volatile. We expect nitrogen fertilizer product prices to remain high by historical standards as well as continued growth in demand for nitrogen fertilizer products in the U.S., particularly for UAN. This trend is more pronounced in our region, the Midwest, where demand for nitrogen fertilizer products has exceeded production and there is limited fertilizer transportation infrastructure. We believe this will continue to provide us with relatively high margins on our nitrogen fertilizer products.
Factors Affecting Results
Petroleum Business
In our petroleum business, earnings and cash flow from operations are primarily affected by the relationship between refined product prices and the prices for crude oil and other feedstocks. The cost to acquire feedstocks and the price for which refined products are ultimately sold depends on factors beyond our control, including the supply of, and demand for, crude oil, as well as gasoline and other refined products which, in turn, depend on, among other factors, changes in domestic and foreign economies, weather conditions, domestic and foreign political affairs, production levels, the availability of imports, the marketing of competitive fuels and the extent of government regulation. While our net sales fluctuate significantly with movements in crude oil prices, these prices do not generally have a direct long-term relationship to net earnings. Because we apply first-in, first-out accounting to value our inventory, crude oil price movements may impact net earnings in the short term because of instantaneous changes in the value of the minimally required, unhedged on hand inventory. The effect
39
of changes in crude oil prices on our results of operations is influenced by the rate at which the prices of refined products adjust to reflect such changes.
Feedstock and refined product prices are also affected by other factors, such as product pipeline capacity, local market conditions and the operating levels of competing refineries. Crude oil costs and the price of refined products have historically been subject to wide fluctuations. An expansion or upgrade of our competitors' facilities, price volatility, international political and economic developments and other factors beyond our control are likely to continue to play an important role in refining industry economics. These factors can impact, among other things, the level of inventories in the market, resulting in price volatility and a reduction in product margins. Moreover, the refining industry typically experiences seasonal fluctuations in demand for refined products, such as increases in the demand for gasoline during the summer driving season and for home heating oil during the winter, primarily in the Northeast. For further details on the economics of refining, see "Industry Overview—Oil Refining Industry—Economics of Refining."
In order to assess our operating performance, we compare our gross margin excluding operating expenses against an industry gross margin benchmark. The industry gross margin is calculated by assuming that five barrels of benchmark light sweet crude oil is converted, or cracked, into three barrels of conventional gasoline and two barrels of distillate. This benchmark is referred to as the 5-3-2 crack spread. Because we calculate the benchmark margin using the market value of New York gasoline and diesel fuel against the market value of West Texas Intermediate crude oil, we refer to the benchmark as the New York 5-3-2 crack spread, or simply, the 5-3-2 crack spread. The 5-3-2 crack spread is expressed in dollars per barrel and is a proxy for the per barrel margin that a sweet crude refinery would earn assuming it produced and sold the benchmark production of conventional gasoline and distillate.
Because our refinery has certain feedstock costs and/or logistical advantages as compared to a benchmark refinery, our gross margin excluding operating expenses generally exceeds the 5-3-2 crack spread by a significant amount. Our refinery is able to process significant quantities of heavy and medium sour crude oil that has historically cost less than WTI crude oil. We measure the cost advantage of our crude oil slate by calculating the spread between the price of our delivered crude oil, to the price of WTI crude oil, a light crude oil. The spread is referred to as our consumed crude differential. Our consumed crude differential will move directionally with changes in the WTS differential to WTI and the Maya differential to WTI as both these differentials indicate the relative price of heavier, more sour slate to WTI. The correlation between our consumed crude differential and published differentials will vary depending on the volume of heavy medium sour crude we purchase as a percent of our total crude volume and will correlate more closely with such published differentials the heavier and more sour the crude oil slate.
The value of our products is also an important consideration in understanding our results. We produce a high volume of high value products, such as gasoline, diesel and heating oil. We benefit from the fact that our marketing region consumes more refined products than it produces so that the market prices of our products have to be high enough to cover the logistics cost for Gulf Coast refineries to ship into our region.
Our operating cost structure is also important to our profitability. Major operating costs include energy, employee labor, maintenance, contract labor, and environmental compliance. Our predominant variable cost is energy and the most important benchmark for energy costs is the value of natural gas. Our variable operating costs are largely energy related and therefore sensitive to the movements of crude price. We believe our fixed operations costs are low as compared to our peers, partially because of the flexibility our current union contracts provide us.
Consistent, safe, and reliable operations at our refineries are key to our financial performance and results of operations. Unplanned downtime of our refinery may result in lost margin opportunity,
40
increased maintenance expense and a temporary increase in working capital investment and related inventory position. The financial impact of planned downtime, such as major turnaround maintenance, is mitigated through a diligent planning process that takes into account margin environment, the availability of resources to perform the needed maintenance, feedstock logistics and other factors.
Other than crude we gather ourselves, we purchase crude oil from third parties using a credit intermediation agreement. Our credit intermediation agreement is structured such that we take title, and the price of the crude oil is set, when it is delivered at the crude oil tank farm adjacent to our refinery. The terms of this agreement provide that we will obtain all of the crude oil for our refinery, other than the crude we obtain through our own gathering system, through BP Oil Supply Company (BP). Once we identify cargos of crude oil and pricing terms that meet our requirements, we notify BP and BP then provides credit, transportation and other logistical services to us for a fee. This agreement significantly reduces the investment that we are required to maintain in petroleum inventories relative to our competitors and reduces the time we are exposed to market fluctuations before the inventory is priced to a customer. Our agreement with BP expires at the end of 2005 at which time we may renegotiate the agreement with BP, seek a similar arrangement with another party, or choose to obtain our crude supply directly without the use of an intermediary.
Because petroleum feedstocks and products are essentially commodities, we have no control over the changing market value of our investment. Therefore, the lower target inventory we are able to maintain significantly reduces the impact of commodity price volatility on our hydrocarbon inventory position relative to other refiners. This target inventory position is generally not hedged. To the extent our inventory position deviates from the target level, we consider risk mitigation activities usually through the purchase or sale of futures contracts on the New York Mercantile Exchange (NYMEX). Our hedging activities carry customary time, location and product grade basis risks generally associated with hedging activities. Because most of our titled inventory is valued under the first-in, first-out costing method, price fluctuations on our target level of titled inventory have a major effect on our financial results unless the market value of our target inventory is increased above cost.
Nitrogen Fertilizer Business
In our nitrogen fertilizer business, earnings and cash flow from operations are primarily affected by the relationship between nitrogen fertilizer product prices and operating costs. Unlike our competitors, we use minimal natural gas as feedstock and, as a result, are not directly heavily impacted in terms of cost, by high or volatile swings in natural gas prices. Instead, our coke feedstock is primarily supplied by our adjacent oil refinery. The price at which nitrogen fertilizer products are ultimately sold depends on numerous factors beyond our control, including the supply of, and demand for, nitrogen fertilizer products which, in turn, depends on, among other factors, the price of natural gas, cost and availability of fertilizer transportation infrastructure, changes in the world population, weather conditions, grain production levels, the availability of imports, and the extent of government intervention in agriculture markets. While our net sales could fluctuate significantly with movements in natural gas prices during periods when fertilizer markets are weak and sell at the floor price, high natural gas prices do not force us to shut down our operations because we employ coke as a feedstock to produce ammonia and UAN.
Nitrogen fertilizer prices are also affected by other factors, such as local market conditions and the operating levels of competing facilities. Natural gas costs and the price of nitrogen fertilizer products have historically been subject to wide fluctuations. An expansion or upgrade of our competitors' facilities, price volatility, international political and economic developments and other factors beyond our control are likely to continue to play an important role in nitrogen fertilizer industry economics. These factors can impact, among other things, the level of inventories in the market resulting in price volatility and a reduction in product margins. Moreover, the industry typically experiences seasonal fluctuations in demand for nitrogen fertilizer products. For further details on the economics of fertilizer, see "Industry Overview—Nitrogen Fertilizer Industry—Pricing of Fertilizer Products."
41
In order to assess our operating performance, we calculate netbacks, or plant gate price, to determine our operating margin. Netbacks refers to the unit price of fertilizer, in dollars per ton, offered on a delivered basis, excluding shipment costs. Given our use of low cost petroleum coke, we are not presently subjected to the high raw materials costs of competitors who use natural gas. Instead of experiencing high variability in the cost of raw materials, we utilize less than 1% of the natural gas relative to other natural gas based fertilizers and we estimate that we maintain our competitive advantage at natural gas spot prices in the range of $1.50 to $2.50 per million Btu and above. The spot price for natural gas at Henry Hub on December 31, 2004 was $6.13 per million Btu.
Because our fertilizer plant has certain logistical advantages relative to end users of ammonia and UAN and demand relative to production remains high, we can afford to target freight-advantaged destinations in the U.S. farm belt. We do not incur any intermediate transfer, storage, barge freight or pipeline freight charges. Currently, our freight advantage over U.S. Gulf Coast importers is approximately $65 per ton for ammonia production and $37 per ton for UAN production. Such cost differentials represent a significant portion of the market price of these commodities. For example, since the end of 2003, ammonia prices have fluctuated between $268 and $329 per ton, and UAN prices have fluctuated between $156 and $195 per ton. Selling products to customers in close proximity to our fertilizer plant while keeping transportation costs low is key to maintaining profitability and understanding our results.
The value of our nitrogen fertilizer products is also an important consideration in understanding our results. We upgrade two-thirds of our ammonia production into UAN, a product that presently generates a greater value for the upgraded ammonia. As the largest fully integrated single train UAN production facility in North America, UAN production is a major contributor to our profitability. Furthermore, given the high demand for UAN relative to production and transportation costs that Gulf Coast importers face, we anticipate favorable operating results from our UAN production capabilities.
Our operating cost structure is also important to our profitability. Using a coke gasification process, we have significantly higher fixed costs than natural gas based fertilizer plants. Major operating costs include electrical energy, employee labor, maintenance, including contract labor, and outside services. The predominant variable cost is the cost of petroleum coke that we obtain primarily from our refinery.
Consistent, safe, and reliable operations at our nitrogen fertilizer plant are critical to our financial performance and results of operations. Unplanned downtime of our nitrogen fertilizer plant may result in lost margin opportunity, increased maintenance expense and a temporary increase in working capital investment and related inventory position. The financial impact of planned downtime, such as major turnaround maintenance, is mitigated through a diligent planning process that takes into account margin environment, the availability of resources to perform the needed maintenance, feedstock logistics and other factors.
Results of Operations
The following tables provide supplementary income statement and operating data and do not represent income statements presented in accordance with GAAP. Selected items in each of the periods are discussed separately below. Our consolidated results of operations include certain other unallocated corporate activities and the elimination of intercompany transactions and therefore are not a sum of only the operating results of our petroleum and nitrogen fertilizer businesses.
Net sales consist principally of sales of refined fuel and nitrogen fertilizer products. For the petroleum business, net sales are mainly affected by crude oil and refined product prices, changes to the input mix and volume changes caused by operations. Product mix refers to the percentage of production represented by higher value light products, such as gasoline, rather than lower value
42
finished products, such as petroleum coke. In the nitrogen fertilizer business, net sales are primarily impacted by manufactured tons and nitrogen fertilizer prices.
Gross margin excluding operating expenses is net sales less raw material cost, inclusive of transportation, and all other components of cost of sales except operating expenses which are displayed separately for discussion purposes. Industry-wide petroleum results are driven and measured by the relationship, or margin, between refined products and the prices for crude oil referred to as crack spreads, see "—Factors Affecting Results." We discuss our results of petroleum operations in the context of per barrel consumed crack spreads and gross margin excluding operating expenses. Our nitrogen fertilizer gross margin excluding operating expenses is principally driven by the relationship or margin between nitrogen fertilizer products and the cost of petroleum coke. In contrast to our petroleum business, gross margin excluding operating expenses is not a significant indicator of profitability in the nitrogen business as the vast majority of expenses associated with our nitrogen business are classified as operating expenses.
We define Adjusted EBITDA as EBITDA plus or minus the following items: (1) for the petroleum business, (a) during the year ended December 31, 2002 an asset impairment charge of $144.3 million related to the write-down of our refinery to fair market value, (b) during the year ended December 31, 2003, an additional charge of $3.9 million related to the asset impairment of our refinery based on the expected sale price of the assets in the Acquisition, and (c) for the 304 day period ended December 31, 2004, a write-off of $6.2 million of deferred financing costs in connection with refinancing of our indebtedness on May 10, 2004, and (2) for the nitrogen fertilizer business, (w) for the year ended December 31, 2002, a rental payment of $0.3 million to reflect the termination of such rental payment under an operating lease structure utilized by Farmland to finance the nitrogen fertilizer plant, (x) during the year ended December 31, 2002, an asset impairment charge of $230.8 million related to the write-down of our nitrogen fertilizer plant to fair market value, (y) during the year ended December 31, 2003, an additional charge of $5.7 million related to the asset impairment of our nitrogen fertilizer plant based on the expected sale price of the assets in the Acquisition, and (z) during the 304 day period ended December 31, 2004, a write-off of $1.0 million of deferred financing costs in connection with refinancing of our senior secured credit facility on May 10, 2004.
For a reconciliation of EBITDA and Adjusted EBITDA to net income, see notes 3 and 4 to "Selected Historical Consolidated Financial Data."
We believe that gross margin excluding operating expenses is a useful supplement to gross profit and other measures under GAAP because it is commonly used in the refining industry to compare operating performance against the industry gross margin benchmark, known as crack spread. Therefore, we believe it assists investors in evaluating our performance. Gross margin excluding operating expenses has distinct limitations as compared to gross profit and should not be substituted as an alternative to gross profit, which is a measure of performance under GAAP. By excluding operating expenses (including depreciation, amortization, and overhead), the total cost of products may not be apparent.
43
The operating expenses shown in the tables below are included in the calculation of gross profit but are excluded from gross margin excluding operating expenses.
| | Predecessor | Successor and Predecessor Combined | |||||||
|---|---|---|---|---|---|---|---|---|---|
| | Year Ended December 31, | Year Ended December 31, | |||||||
| Consolidated Financial Results | |||||||||
| 2002 | 2003 | 2004 | |||||||
| | (in millions) | ||||||||
| Net sales | $ | 887.5 | $ | 1,262.2 | $ | 1,741.0 | |||
| Gross margin excluding operating expenses (1) | 125.3 | 205.7 | 283.3 | ||||||
| Operating expenses | 183.5 | 141.8 | 150.9 | ||||||
| Depreciation and amortization | 30.8 | 3.3 | 2.8 | ||||||
| Operating income (loss) | (449.9 | ) | 29.4 | 111.2 | |||||
| Net income (loss) | (465.7 | ) | 27.9 | 60.9 | |||||
| EBITDA | (423.2 | ) | 32.5 | 107.6 | |||||
| Adjusted EBITDA | (47.8 | ) | 42.1 | 114.8 | |||||
| | Predecessor | Successor and Predecessor Combined | |||||||
|---|---|---|---|---|---|---|---|---|---|
| | Year Ended December 31, | Year Ended December 31, | |||||||
| Petroleum Business Financial Results | |||||||||
| 2002 | 2003 | 2004 | |||||||
| | (in millions) | ||||||||
| Net sales | $ | 829.0 | $ | 1,161.3 | $ | 1,632.4 | |||
| Gross margin excluding operating expenses | 82.6 | 121.3 | 188.7 | ||||||
| Operating expenses | 112.8 | 82.2 | 91.5 | ||||||
| Depreciation and amortization | 15.8 | 2.1 | 1.8 | ||||||
| Operating income (loss) | (183.9 | ) | 21.5 | 84.8 | |||||
| EBITDA | (172.1 | ) | 23.5 | 81.1 | |||||
| Adjusted EBITDA | (27.9 | ) | 27.4 | 89.8 | |||||
| | Predecessor | Successor and Predecessor Combined | |||||||
|---|---|---|---|---|---|---|---|---|---|
| | Year Ended December 31, | Year Ended December 31, | |||||||
| Nitrogen Fertilizer Business Financial Results | |||||||||
| 2002 | 2003 | 2004 | |||||||
| | (in millions) | ||||||||
| Net sales | $ | 58.5 | $ | 100.9 | $ | 112.9 | |||
| Gross margin excluding operating expenses | 42.7 | 84.4 | 94.6 | ||||||
| Operating expenses | 70.7 | 59.6 | 59.4 | ||||||
| Depreciation and amortization | 15.0 | 1.2 | 1.0 | ||||||
| Operating income (loss) | (266.1 | ) | 7.8 | 26.4 | |||||
| EBITDA | (251.1 | ) | 9.0 | 26.4 | |||||
| Adjusted EBITDA | (20.0 | ) | 14.7 | 27.8 | |||||
- (1)
- The following is a reconciliation of gross margin excluding operating expenses to gross profit:
| | Predecessor | Successor and Predecessor Combined | ||||||||
|---|---|---|---|---|---|---|---|---|---|---|
| | Year Ended December 31, | Year Ended December 31, | ||||||||
| | 2002 | 2003 | 2004 | |||||||
| | (in millions) | |||||||||
| Gross margin excluding operating expenses | $ | 125.3 | $ | 205.7 | $ | 283.3 | ||||
| Less: | ||||||||||
| Operating expenses | 183.5 | 141.8 | 150.9 | |||||||
| Operating lease payments | 0.3 | — | — | |||||||
| Gross profit | $ | (58.5 | ) | $ | 63.9 | $ | 132.4 | |||
44
Petroleum Business Results of Operations
| | Year Ended December 31, | ||||||||||
|---|---|---|---|---|---|---|---|---|---|---|---|
| Market Indicators | |||||||||||
| 2002 | 2003 | 2004 | |||||||||
| (dollars per barrel) | | | | ||||||||
| West Texas Intermediate (WTI) crude oil | $ | 25.33 | $ | 31.10 | $ | 41.47 | |||||
| NYMEX 5-3-2 Crack Spread | $ | 5.68 | $ | 5.58 | $ | 7.77 | |||||
| Crude Oil Differentials: | |||||||||||
| WTI less WTS (sour) | $ | 1.37 | $ | 2.75 | $ | 3.97 | |||||
| WTI less Maya (heavy sour) | $ | 5.26 | $ | 6.95 | $ | 11.44 | |||||
| WTI less Dated Brent (foreign) | $ | 1.11 | $ | 2.27 | $ | 3.15 | |||||
PADD 2 Group III versus NYMEX Basis: | |||||||||||
| Gasoline | $ | (0.16 | ) | $ | 0.62 | $ | (0.62 | ) | |||
| Heating Oil | $ | 0.29 | $ | 0.52 | $ | 0.88 | |||||
| | Predecessor | Successor and Predecessor Combined | ||||||||
|---|---|---|---|---|---|---|---|---|---|---|
| | Year Ended December 31, | Year Ended December 31, | ||||||||
| Company Operating Statistics | ||||||||||
| 2002 | 2003 | 2004 | ||||||||
| (dollars per barrel) | | | | |||||||
| Per barrel margin/expense of crude oil throughput: | ||||||||||
| Gross margin excluding operating expenses | $ | 3.05 | $ | 3.89 | $ | 5.68 | ||||
| Operating expense | $ | 4.15 | $ | 2.63 | $ | 2.75 | ||||
(dollars per gallon) | ||||||||||
| Per gallon sales price: | ||||||||||
| Gasoline | $ | 0.75 | $ | 0.91 | $ | 1.19 | ||||
| Distillate | $ | 0.71 | $ | 0.84 | $ | 1.15 | ||||
| | Predecessor | Successor and Predecessor Combined | |||||||||||
|---|---|---|---|---|---|---|---|---|---|---|---|---|---|
| | | | | | Year Ended December 31, | ||||||||
| | Year Ended December 31, | ||||||||||||
| Selected Company Volumetric Data | |||||||||||||
| 2002 | 2003 | 2004 | |||||||||||
| | Barrels Per Day | % | Barrels Per Day | % | Barrels Per Day | % | |||||||
| Production: | |||||||||||||
| Total gasoline | 41,457 | 49.2 | 48,230 | 50.4 | 48,420 | 47.1 | |||||||
| Total distillate | 29,779 | 35.3 | 34,363 | 35.9 | 38,104 | 37.1 | |||||||
| Total other | 13,107 | 15.5 | 13,108 | 13.7 | 16,301 | 15.9 | |||||||
| Total all production | 84,343 | 100.0 | 95,701 | 100.0 | 102,825 | 100.0 | |||||||
Crude oil throughput | 74,446 | 92.4 | 85,501 | 93.4 | 90,787 | 92.8 | |||||||
| All other inputs | 6,109 | 7.6 | 6,085 | 6.6 | 7,023 | 7.2 | |||||||
| Total feedstocks | 80,555 | 100.0 | 91,586 | 100.0 | 97,810 | 100.0 | |||||||
| | Predecessor | Successor and Predecessor Combined | |||||||||||
|---|---|---|---|---|---|---|---|---|---|---|---|---|---|
| | Year Ended December 31, | Year ended December 31, | |||||||||||
| | 2002 | 2003 | 2004 | ||||||||||
| | Total Barrels | % | Total Barrels | % | Total Barrels | % | |||||||
| Crude oil throughput by crude type: | |||||||||||||
| Sweet | 14,991,867 | 55.2 | 18,187,215 | 58.3 | 15,232,022 | 45.8 | |||||||
| Light/medium sour | 9,902,688 | 36.4 | 12,311,203 | 39.4 | 17,995,949 | 54.2 | |||||||
| Heavy sour | 2,278,275 | 8.4 | 709,300 | 2.3 | — | — | |||||||
| Total crude oil throughput | 27,172,830 | 100.0 | 31,207,718 | 100.0 | 33,227,971 | 100.0 | |||||||
45
Year ended December 31, 2004 compared to year ended December 31, 2003.
Net Sales. Petroleum net sales increased $471.1 million, or 41%, to $1,632.4 million in the year ended December 31, 2004 from $1,161.3 million in the year ended December 31, 2003. This revenue increase is attributable to increased production volumes and higher refined product prices, which reacted favorably to the increase in global crude oil prices over the period. The higher prices resulted in additional net sales of $365.1 million in 2004 compared to 2003. In 2004, crude oil throughput increased by an average of 5,286 bpd, or 6.2%, versus 2003. The higher crude throughput experienced in 2004 compared to 2003 was directly attributable to Farmland's inability, because of its impending reorganization, to purchase optimum crude oil blends necessary to operate the refinery at 2004 levels in 2003. During 2004, our petroleum business experienced increases in gasoline and distillate prices of 30% and 36%, respectively compared to the same period in 2003.
Gross Margin Excluding Operating Expenses. Petroleum gross margin excluding operating expenses increased by $67.4 million, or 56%, to $188.7 million in the year ended December 31, 2004 from $121.3 million in the year ended December 31, 2003. This increase was attributable to historically high differentials between refined products prices and crude oil prices as exemplified in the average NYMEX crack spread of $7.77 per barrel in 2004 and the increased discount for heavy crude oils demonstrated by the $4.49, or 65%, increase in the spread between the WTI price, which is a market indicator for the price of light sweet crude, and the Maya price, which an indicator for the price of heavy crude, in the year ended December 31, 2004 compared to the same period in 2003. In 2004 we also benefited from increased production volume versus the comparable period of 2003. Gross margin excluding operating expenses per barrel increased by $1.79, or 46%, to $5.68 in 2004 from $3.89 in the corresponding period in 2003.
Our gross margin excluding operating expenses for the year ended December 31, 2004 improved as a result of the termination of a single customer product marketing agreement in November 2003. During 2003 Farmland was party to a marketing agreement that required them to sell all refined products to a single customer at a fixed differential to an index price. Subsequent to the conclusion of the contract, we have expanded our customer base and increased the realized differential to that index. In addition, we have been able to supply value added fuels such as boutique blends for Kansas City and Denver markets that trade at a premium price to regular unleaded gasoline.
We blend light and heavy crude oil to create a medium gravity crude oil in order to utilize our refinery's coking capacity to derive economic benefit from the heavier crude. In 2004, we reduced the percent of light sweet WTI crude from 58.3% of the purchased crude in 2003 to 45.8%. Shifting from WTI crude to heavier crude has allowed us to take advantage of the wider spread between light and heavy crudes. In 2003, Farmland was restricted to one foreign cargo per month due to its bankruptcy. As a result, our ability to optimize our crude slate to take advantage of the discount associated with medium sour and medium heavy crudes resulting in a lower total crude charge rate as well as a lower discount to WTI was restricted.
Operating Expenses. Petroleum operating expenses increased by $9.3 million, or 11%, to $91.5 million in 2004 from $82.2 million in the corresponding period of 2003, primarily due to higher energy costs. Operating expense per barrel for the year ended December 31, 2004 increased by $0.12 per barrel compared to operating expense per barrel of $2.63 in 2003.
Depreciation and Amortization. Petroleum depreciation and amortization decreased by $0.3 million to $1.8 million in the year ended December 31, 2004 compared to the year ended December 31, 2003. The decrease is primarily the result of the petroleum assets' useful lives being reset to longer periods in the Acquisition compared to the prior period based on management's assessment of the condition of the petroleum assets acquired offset by the impact of the step-up in value of the acquired assets in the Acquisition.
46
Operating Income. Operating income increased $63.3 million, or 294%, to $84.8 million in the year ended December 31, 2004 from $21.5 million in the year ended December 31, 2003. This increase was due to the factors discussed above, and particularly driven by favorable market conditions in the domestic refining industry.
Year ended December 31, 2003 compared to year ended December 31, 2002.
Net Sales. Petroleum net sales increased $332.3 million or 40%, to $1,161.3 million in 2003 from $829.0 million in 2002. This revenue increase is attributable to higher crude oil throughput of 85,501 barrels per day (bpd) in 2003 compared to 74,446 bpd in 2002, representing a 14.9% increase, and higher refined fuel pricing in 2003. Higher refined fuel prices contributed $164.6 million of the $332.3 million increase in revenue over this period. Gasoline price increases were the largest contributor, increasing 21% from $0.75 per gallon to $0.91 per gallon, contributing $102.5 million to the revenue increases. The price of distillate increased by 19% to $0.84 per gallon in 2003, as compared to $0.71 per gallon in 2002.
Increased crude throughput during 2003 compared to 2002 was primarily the result of a major maintenance turnaround at the refinery in March 2002, which halted production at the refinery for four weeks. Problems with the start up of the modified fluid catalytic cracking unit (FCCU) resulted in a delay in reaching normal operations for an additional two week period in 2002. In 2003, refined fuel production volume was 4.2 million barrels higher than 2002 resulting in a revenue increase of $157.7 million.
Gross Margin Excluding Operating Expenses. Petroleum gross margin excluding operating expenses increased by $38.7 million, or 47%, to $121.3 million in 2003 from $82.6 million in 2002. The increase was primarily due to increased volume over 2002, as described above, during which a major turnaround at the refinery was completed. In addition, earnings were favorably impacted by an increase in the gross margin excluding operating expenses per barrel as a result of an improved pricing in our marketing region and a widening crude oil differential for heavy crude.
Crude oil throughput increased 15% to 31.2 million barrels in 2003 compared to 27.2 million barrels in 2002 resulting in a margin increase of approximately $15.7 million.
As demand in our marketing region increased by higher than historical rates, the price basis in the region increased relative to the NYMEX price by an average of $0.55 per barrel in 2003 over 2002 resulting in additional gross margin excluding operating expenses. In addition, the spread between WTI and heavy medium sour crude oils widened as indicated by the crude oil differentials. Both of these factors contributed to an improved gross margin excluding operating expenses per barrel in a time the NYMEX crack spread remained largely unchanged. The per barrel gross margin excluding operating expenses increased $0.84 to $3.89 in 2003 from $3.05 in 2002.
Operating Expenses. Petroleum operating expenses decreased by $30.6 million, or 27%, to $82.2 million in 2003 from $112.8 million in 2002. This decrease was principally attributable to expenses related to the major maintenance turnaround in March 2002 of approximately $17.0 million. This decrease in operating expenses was partially offset by higher usage of natural gas in 2003 as compared to 2002 due to increased throughput. Operating expense per barrel of total plant throughput decreased to $2.63 in 2003 from $4.15 in 2002.
Depreciation and Amortization. Petroleum depreciation and amortization decreased $13.7 million to $2.1 million in 2003 from $15.8 million in 2002 This change in depreciation and amortization is directly attributable to the $144.3 million impairment charge to reduce the carrying amount of the fixed assets of the petroleum business recorded in 2002, as more fully described in note 3 to our financial statements included elsewhere in this prospectus.
47
Operating Income. Petroleum operating income increased by $205.4 million to $21.5 million in 2003 from an operating loss of $183.9 million in 2002. Excluding the reorganization expense associated with the impairment of property, plant and equipment in 2002 of $144.3 million and $4.0 million in 2003, petroleum operating income increased by $65.1 million in 2003 versus 2002, primarily as a result of the reasons described above.
Nitrogen Fertilizer Business Results of Operations
| | Year Ended December 31, | ||||||||
|---|---|---|---|---|---|---|---|---|---|
| Market Indicators | |||||||||
| 2002 | 2003 | 2004 | |||||||
| Natural gas (dollars per million Btu) | $ | 3.22 | $ | 5.36 | $ | 6.13 | |||
| Ammonia — southern plains (dollars per ton) | 168 | 272 | 295 | ||||||
| UAN — corn belt (dollars per ton) | 108 | 141 | 170 | ||||||
| | Predecessor | Predecessor and Successor Combined | ||||||||||
|---|---|---|---|---|---|---|---|---|---|---|---|---|
| | Year Ended December 31, | Year Ended December 31, | ||||||||||
| | 2002 | 2003 | 2004 | |||||||||
| Company Operating Statistics | ||||||||||||
| Production (thousand tons): | ||||||||||||
| Ammonia | 265.1 | 335.7 | 309.2 | |||||||||
| UAN | 434.6 | 510.6 | 532.6 | |||||||||
| Total | 699.7 | 846.3 | 841.8 | |||||||||
Sales (thousand tons)(1): | ||||||||||||
| Ammonia | 85.3 | 134.8 | 103.9 | |||||||||
| UAN | 450.0 | 528.9 | 541.6 | |||||||||
| Total | 535.3 | 663.7 | 645.5 | |||||||||
Product pricing (plant gate) (dollars per ton)(1): | ||||||||||||
| Ammonia | $ | 147 | $ | 235 | $ | 266 | ||||||
| UAN | 76 | 107 | 136 | |||||||||
On-stream factor: | ||||||||||||
| Gasification | 78.6 | % | 90.1 | % | 92.4 | % | ||||||
| Ammonia | 75.3 | % | 89.6 | % | 79.9 | % | ||||||
| UAN | 78.6 | % | 81.6 | % | 83.3 | % | ||||||
Capacity utilization: | ||||||||||||
| Ammonia | 66.0 | % | 83.6 | % | 76.8 | % | ||||||
| UAN | 79.4 | % | 93.3 | % | 97.0 | % | ||||||
Reconciliation to net sales: | ||||||||||||
| Freight in revenue (dollars in thousands) | $ | 11,338 | $ | 12,535 | $ | 11,429 | ||||||
| Sales net plant gate | 47,191 | 88,373 | 101,439 | |||||||||
| Total net sales | 58,529 | 100,908 | 112,868 | |||||||||
- (1)
- Plant gate sales per ton represents net sales less freight revenue divided by sales tons. Plant gate pricing per ton is shown in order to provide industry comparability.
Year ended December 31, 2004 compared to year ended December 31, 2003.
Net Sales. Nitrogen fertilizer net sales increased $12.0 million or 12%, to $112.9 million in 2004 from $100.9 million in 2003. The revenue increase was entirely attributable to increased nitrogen
48
fertilizer prices, which more than offset a slight decline in total production volume due to a planned turnaround in August 2004. For 2004, southern plains ammonia and corn belt UAN prices increased 8% and 21%, respectively versus the comparable period in 2003. In addition, due to our direct marketing efforts, our actual plant gate prices, relative to the market indices presented above have improved substantially. Plant gate prices are prices FOB the delivery point less any freight cost we absorb to deliver the product. We believe plant gate price is meaningful because we sell products both FOB our plant gate (sold plant) and FOB the customers designated deliver site (sold delivered) and the percentage of sold plant versus sold delivered can change month to month or year to year. The plant gate price provides a measure that is consistently comparable period to period. The improvement in plant gate price relative to the market index is the result of eliminating the reseller discount offered to Agriliance under the terms of the prior marketing agreement and maximizing shipments to customers that are more freight logical to our facility.
Operating Expenses. Nitrogen fertilizer operating expenses were relatively unchanged at $59.4 million during the year ended December 31, 2004 and $59.6 million during the year ended December 31, 2003.
Depreciation and Amortization. Nitrogen fertilizer depreciation and amortization decreased by $0.2 million, or 17%, to $1.0 million in 2004 from $1.2 million in 2003. This decrease was principally due to the nitrogen fertilizer assets' useful lives being reset to longer periods in the Acquisition compared to the prior period based on management's assessment of the condition of the nitrogen fertilizer assets acquired offset by the impact of the step-up in value of the acquired nitrogen fertilizer assets in the Acquisition.
Operating Income. Operating income increased $18.6 million, or 238%, to $26.4 million in 2004 from $7.8 million in 2003. This increase was due to continued strong market conditions in the domestic nitrogen fertilizer industry described above. For the 304 day period ended December 31, 2004 the nitrogen fertilizer business was charged $4.3 million for petroleum coke transferred from our refinery. During the Predecessor period, petroleum coke was transferred at zero value.
Year ended December 31, 2003 compared to year ended December 31, 2002.
Net Sales. Nitrogen fertilizer net sales increased $42.4 million or 72%, to $100.9 million in 2003 from $58.5 million in 2002. Prices accounted for $21.1 million of the revenue increase while the remaining $21.3 million was attributable to increased volume. In 2003, southern plains ammonia and corn belt UAN prices increased 62% and 31%, respectively versus 2002.
The remaining $21.3 million attributable to increased volume directly correlates to the improvement in operating days. The most significant factor was our increased gasifier on-stream time due to improvements in our operations and maintenance groups. Our ability to transition from our main gasifier to our spare gasifier without discontinuing ammonia production significantly reduced downtime.
Operating Expenses. Nitrogen fertilizer operating expenses decreased by $11.0 million, or 16%, to $59.6 million in 2003 from $70.7 million in 2002. The most significant factor in the decrease was $13.8 million reduction in depreciation expense as result of the asset impairment charge of $230.8 million in 2002, reductions in repairs and maintenance, reduced vendor fees associated with oxygen and nitrogen supply and lower payments made for royalties and operating assistance related to gasifier operations. This was offset by increased expenses for refractory brick and electricity.
Electricity costs increased $1.0 million due to a 5% increase in power usage in 2003 over 2002 as a result of the improved operating rates. Increased refractory brick costs in 2003 of $1.9 million resulted from replacing damaged brickwork in our gasifier.
49
The reduction in both oxygen and nitrogen supply payments and gasifier royalty and operating assistance payments resulted in Farmland's election to discontinue these payments subsequent to the bankruptcy filing. In both cases, resolutions were reached between Farmland and the counterparty and payments have already been made or agreed to by Farmland. These two items comprise approximately $1.8 million in cost improvements in 2003 compared to 2002.
Depreciation and Amortization. Nitrogen fertilizer depreciation and amortization decreased $13.8 million, or 91%, to $1.2 million from $15.0 million in 2002. This decrease in depreciation and amortization is directly attributable to the $230.8 million impairment charge to reduce the carrying amount of the fixed assets of the nitrogen fertilizer plant in 2002.
Operating Income. Nitrogen fertilizer operating income increased $273.9 million to $7.8 million in 2003 from a net loss of $266.0 million. Excluding the reorganization expense associated with the impairment of the nitrogen fertilizer plant in 2002 of $230.8 million and $5.8 million in 2003, operating income increased by $46 million to $10.7 million in 2003 from an operating loss of $35.3 million in 2002, primarily for the reasons described above.
Consolidated Results of Operations
Selling, General and Administrative Expenses. Consolidated selling, general and administrative expenses for the period from March 2, 2004 through December 31, 2004 were $16.6 million. These expenses represent the cost associated with corporate governance, legal expenses, treasury, accounting, marketing, human resources and maintaining corporate offices in New York and Kansas City. During the predecessor periods, Farmland allocated corporate overhead based on internal needs, which may not be representative of the actual cost to operate the businesses. In addition, during the year ended December 31, 2003, Farmland incurred a number of charges related to the bankruptcy. As a result of the charges and issues related to allocations, a comparison of selling, general and administrative expenses for the year ended December 31, 2004 to the year ended December 31, 2003 is not meaningful.
Interest Expense. For the Predecessor periods, all interest expense prior to May 31, 2002, and interest on secured borrowings subsequent to May 31, 2002 were allocated to the Predecessor by Farmland based on identifiable net assets of each of Farmland's divisions. Under bankruptcy law, payment of interest on Farmland's unsecured debt was stayed beginning May 31, 2002. Accordingly, Farmland did not allocate any interest on its unsecured borrowings to the Predecessor since May 31, 2002. Interest expense in the Successor period represents the interest recognized on our long-term borrowings and amortization of deferred financing costs associated with these borrowings.
Provision for Income Taxes. The Predecessor was not a separate legal entity, and its operating results were included with the operating results of Farmland and its subsidiaries in filing consolidated federal and state income tax returns. Farmland did not allocate income taxes to its divisions. As a result, the Predecessor periods do not reflect any provision for income taxes.
Year ended December 31, 2004 compared to year ended December 31, 2003.
Extinguishment of Debt. On May 10, 2004, we used proceeds from a $150.0 million dollar term loan to pay off our existing debt which was originally incurred on March 3, 2004. In connection with the extinguishment of debt, we recognized $7.2 million as a loss on extinguishment of debt in the 304 day period ended December 31, 2004.
Net Income. Net income increased $33.0 million in 2004 to $60.9 million from $27.9 million for the comparable period in 2003. The increase was due to both the change in ownership and improved results in both the petroleum business and the nitrogen fertilizer business as discussed in greater detail for each business above.
50
Year ended December 31, 2003 compared to year ended December 31, 2002.
Other Income (Expense). Other expense was $0.2 million in 2003 compared to $4.1 million in 2002, primarily relating to changes in value of the Predecessor's derivative contracts.
Reorganization Expense; Impairment of Property Plant and Equipment. Reorganization expense represents the impairment of long-lived assets in accordance with the SFAS No. 144 implemented by Farmland. Recoverability of assets to be held and used is measured by comparison of the carrying amount of an asset to the estimated undiscounted future net cash flows expected to be generated by the asset. In 2003, Farmland determined the carrying amount of the assets of the petroleum and nitrogen fertilizer business exceeded the expected value to be received in a bankruptcy approved sale. As a result, an impairment charge of $9.6 million was recognized.
Net Income. Net income increased $493.6 million in 2003 to $27.9 million from a loss of $465.7 million in 2002. The asset impairment described above accounted for $365.4 million of the improvement. In addition, both facilities benefited from improved volumes, the nitrogen fertilizer market improved dramatically, the refined fuel price in the region improved and crude differentials improved.
Critical Accounting Policies
The preparation of financial statements in accordance with GAAP requires management to make estimates and assumptions that affect the amounts reported in the financial statements and accompanying notes. Actual results could differ from those estimates. The following summary provides further information about our critical accounting policies and should be read in conjunction with the Notes to Financial Statements, which summarizes our significant accounting policies.
Major Maintenance Turnarounds. The direct-expense method of accounting is used for planned major maintenance activities. Maintenance costs are recognized as expense as maintenance services are performed. During 2002, our refinery was shut down for approximately six weeks in order to perform planned major maintenance. Costs associated with this shutdown are included in costs of goods sold in 2002 and were approximately $17.0 million. Most refiners accrue for future planned turnarounds or defer the costs associated with turnarounds, which lessens the earnings impact in the year of the turnaround. As a result, comparison of our results to other refineries must take into account the impact of the difference in accounting for turnaround highlighted above. We expect that our next major maintenance will occur in 2006 at an estimated cost of approximately $12.0 million and $1.3 million for the petroleum business and nitrogen fertilizer business, respectively.
Impairment of Long-Lived Assets. During 2001, Farmland accounted for long-lived assets in accordance with Statement of Financial Accounting Standards No. 121, Accounting for Impairment of Long-Lived Assets and for Long-Lived Assets to be Disposed of (SFAS 121). SFAS 121 was superseded by SFAS 144, Accounting for the Impairment or Disposal of Long-Lived Assets (SFAS 144), which was adopted by Farmland effective January 1, 2002.
In accordance with both SFAS No. 144 and SFAS No. 121, Farmland reviewed its long-lived assets for impairment whenever events or changes in circumstances indicated that the carrying amount of an asset may not be recoverable. Recoverability of assets to be held and used is measured by a comparison of the carrying amount of an asset to estimate undiscounted future net cash flows expected to be generated by the asset. If the carrying amount of an asset exceeded its estimated future undiscounted net cash flows, an impairment charge was recognized by the amount by which the carrying amount of the assets exceeded the fair value of the assets. Assets to be disposed of are reported at the lower of the carrying value or fair value less cost to sell, and are no longer depreciated.
In its Plan of Reorganization, Farmland stated, among other things, its intent to dispose of its petroleum and nitrogen fertilizer assets. Despite this stated intent, these assets were not classified as
51
held for sale under SFAS 144 until October 7, 2003 because, ultimately, any disposition must be approved by the bankruptcy court and the bankruptcy court did not approve such disposition until that date. Since Farmland determined that it was more likely than not that its assets would be disposed of, those assets were tested for impairment in 2002 pursuant to SFAS 144, using projected undiscounted net cash flows. Based on Farmland's best assumptions regarding the use and eventual disposition of those assets, primarily from indications of value received from potential bidders in the bankruptcy sales process, the assets were determined to exceed the fair value expected to be received on this disposition by approximately $375.1 million. Accordingly, an impairment charge was recognized for such amount in 2002. The ultimate proceeds from disposition of these assets were decided in a bidding and auction process conducted in the bankruptcy proceedings. In 2003, as a result of receiving a stalking horse bid from Coffeyville Resources, LLC, Farmland revised its estimate of the amount to be generated from the disposition of these assets and an additional impairment charge of $9.6 million was taken in the year ended December 31, 2003.
Derivative Commodity Instruments. We use futures contracts, options, and forward contracts primarily to reduce our exposure to changes in crude oil prices and to provide economic hedges of inventory positions and forecasted transactions. Although management considers these derivatives economic hedges, these instruments have not been designated as hedges for accounting purposes and are recorded at fair value in the balance sheet. Accordingly, changes in the fair value of these derivative instruments are recorded into earnings as a component of other income (expense) in the period of change. Our petroleum business recorded net gains from derivative instruments of $0.3 million and $0.5 million in other income (expense) for the year ended December 31, 2003 and the 304 days ended December 31, 2004.
Environmental Expenditures. Liabilities related to remediation of contaminated properties are recognized when the related costs are considered probable and can be reasonably estimated. Estimates of these costs are based upon currently available facts, existing technology, site-specific costs, and currently enacted laws and regulations. In reporting environmental liabilities, no offset is made for potential recoveries. All liabilities are monitored and adjusted as new facts or changes in law or technology occur. Environmental expenditures are capitalized when such costs provide future economic benefits. Changes in laws, regulations or assumptions used in estimating these costs could have a material impact to our financial statements. The amount recorded for environmental obligations at December 31, 2004 totaled $10.3 million, including $1.2 million included in current liabilities.
Purchase Price Accounting and Allocation. The Acquisition described in note 1 to our financial statements related to the purchase of our assets from Farmland has been accounted for using the purchase method of accounting as of March 3, 2004. The allocation of the purchase price to the net assets acquired has been performed in accordance with SFAS 141, Business Combinations. In connection with the allocation of the purchase price, management used estimates and assumptions to determine the fair value of the assets acquired and liabilities assumed. Changes in these assumptions and estimates such as discount rates and future cash flows used in the appraisal process could have a material impact on how the purchase price was allocated at the date of acquisition.
Valuation of Our Equity. In connection with the Acquisition, Coffeyville Group Holdings, LLC issued preferred and common units. The preferred unit holders were entitled to a preference distribution of $63.2 million plus a preferred yield prior to any distribution to the residual interests, which was split 85% to the preferred unit holders and 15% to the common unit holders. Management determined the fair value of the equity based on the amount paid to Farmland in the Chapter 11 auction process less the amount borrowed. The fair value allocated to the preferred units and common units was estimated based on the estimated relative fair values on March 3, 2004. Changes in the assumptions used and the use of a different valuation technique could have a material impact on the financial statements.
52
Liquidity and Capital Resources
Our principal sources of liquidity are from cash and cash equivalents, cash from operations and borrowings under our senior secured credit facility.
Cash Balance and Other Liquidity
As of December 31, 2004, we had cash, cash equivalents and short-term investments of $52.7 million. Prior to March 3, 2004, Farmland centralized its cash management operations and did not segregate cash balances by business. We believe our December 31, 2004 cash levels as well as the availability of borrowings under our revolving credit agreement are adequate to fund our cash requirements for at least the next 12 months. As of December 31, 2004, we had available up to $56.2 million under our revolving credit facility, which is discussed in more detail below. Assuming that we had completed this offering and repaid our existing senior secured credit facility and that Coffeyville Resources, LLC had entered into a new $ million senior secured credit facility and completed the offering of $ million aggregate principal amount of % senior notes as of December 31, 2004, on an as adjusted basis, our total indebtedness would have been $ million.
Debt
Our current debt structure is used to fund our business operations, and our revolving credit facility is a source of liquidity. At December 31, 2004, our long-term debt, including current maturities, totaled $148.9 million. Debt outstanding under the term loan and the revolving credit facility bore interest at variable rates.
On May 10, 2004, we completed a refinancing of substantially all of our outstanding long-term debt with a new $150.0 million senior secured term loan due in 2010 and a senior secured $75.0 million revolving credit facility which terminates in 2009. We used the net proceeds from the term loan as follows:
- •
- $34.3 million to repay all outstanding amounts under our then-existing revolving credit facility and term loan, including accrued and unpaid interest, fees and a $1.1 million make-whole premium to the previous lenders;
- •
- $9.3 million to pay costs associated with the refinancing that were capitalized and that will be amortized over the term of the new debt;
- •
- $6.4 million of cash to fund our operating account and a debt service account; and
- •
- $100.0 million to distribute to unit holders for earnings distributions, preferred returns and return of capital.
The senior secured revolving credit facility provides for direct cash borrowings and the issuance of letters of credit up to the lesser of: (i) the borrowing base calculated with respect to our cash and eligible cash equivalents, eligible accounts receivables and eligible inventories, and (ii) $75.0 million. Letters of credit issued under the revolving loans are subject to an issuance sub-limit of $30.0 million. After May 2006, the issuance sub-limit will increase to $50 million. Borrowings under the revolving loans are secured by a first priority security interest in our accounts receivable and inventory and contract rights, chattel paper, instruments, documents, deposit accounts and intangible assets related thereto. The $75.0 million senior secured revolving loans bear interest at either LIBOR plus 3.00%, or at our election prime rate plus 1.00%, in each case subject to a 0.5% per annum unused capacity commitment fee. As of December 31, 2004, we had $0.06 million of outstanding borrowings under the revolving credit facility and $4.1 million of standby letters of credit issued and outstanding under this facility for total outstanding of $4.2 million under the revolving credit facility. Our total borrowing base under the revolving credit facility as of that date was $56.3 million, resulting in available borrowing capacity of $52.1 million.
53
The senior secured term loan is subject to quarterly principal amortization of payments of approximately $0.4 million that began on June 30, 2004 with the balance due at maturity in 2010. Mandatory prepayments are required to be made with the proceeds of certain asset sales and casualty events subject, in some instances, to reinvestment provisions. In addition, the senior secured credit facility also requires prepayment of any outstanding balance subject to excess cash flow provisions as determined under the credit agreement. The senior secured term loan is secured by a first priority lien on all our property, plant and equipment as well as a second priority lien on the primary collateral of the senior secured revolving loans. The senior secured term loan bears interest at LIBOR plus 5.00%, or at our election at the prime rate plus 4.00%. The outstanding principal balance of the term loan at December 31, 2004 was $148.9 million, and the effective interest rate was 8.68%.
Under the credit agreement, in certain circumstances we are required to prepay all or part of the senior secured loans. In addition, we may, at our option, elect to prepay all or part of the senior secured loans, subject to LIBOR breakage costs and, in some circumstances, a prepayment penalty. The prepayment penalty is calculated as a declining percentage of the total senior secured term debt or senior secured revolving commitment retired. The prepayment penalty is dependent upon the actual date the prepayment occurs. No prepayment penalties exist for the senior revolving loans and the senior secured term loan after May 10, 2006 and May 10, 2007, respectively. This offering will not trigger a mandatory prepayment of the senior secured loans. If, after May 10, 2005, but on or prior to May 10, 2006, we voluntarily prepay the senior secured loans and terminate the senior secured revolving loan commitment, the prepayment penalty for the senior secured term loan would be 2.0% and the prepayment penalty for the termination of the senior secured revolving loan commitment would be 0.25%, or a total of approximately $3.2 million.
The credit agreement contains customary covenants and events of default. Accordingly, this agreement imposes significant operating and financial restrictions on us. These restrictions, among other things, limit incurrence of additional indebtedness, payment of dividends, significant investments and sales of assets. These limitations are subject to important exceptions and exclusions and are not designed to protect investors in our common stock.
The credit agreement requires us to maintain specified financial ratios as follows:
- •
- minimum fixed charge coverage ratio of 1.25 to 1.00;
- •
- maximum leverage ratio of 3.50 to 1.00; and
- •
- minimum interest coverage ratio of 2.00 to 1.00.
The computation of these ratios is governed by the specific terms of the credit agreement and may not be comparable to other similarly titled measures computed for other purposes or by other companies.
Our existing credit agreement limits the amount of our capital expenditures to $45.0 million in 2005, $60.0 million in 2006, and $30.0 million for each year during the term of the credit agreement after 2006. We are entitled to increase our capital expenditures above the specified applicable maximum amount for a given year by (i) up to 75% of the amount by which the specified capital expenditure limit for the preceding year exceeded the amount of our actual capital expenditures in that year; and (ii) up to 25% of our specified capital expenditure limit for a subsequent year, with a corresponding reduction in the capital expenditure limit for that subsequent year. Under these provisions, we are permitted to make a maximum of $71.9 million of capital expenditures in 2005.
On March 30, 2005, we entered into an amendment to our credit agreement. The amendment includes a change to the maximum leverage ratio covenant from a ratio of 3.5:1.0 to a ratio of 2.0:1.0 in the event our joint venture with The Lieber Group, Inc. is liquidated as described in note 1 to the consolidated financial statements and we do not, within 90 days of the liquidation, (i) successfully
54
consummate a public offering or (ii) prepay in full all loan obligations immediately prior to or simultaneously with a sale of Coffeyville Group Holdings, LLC or substantially all of our assets.
We believe we are currently in compliance with all of the covenants and reporting requirements contained in our credit agreement. We are required to measure our compliance with the financial ratios under our senior secured credit facility quarterly and we were in compliance with those ratios as of December 31, 2004. We intend to refinance our existing senior secured credit facility and to repay all borrowings thereunder prior to the completion of this offering.
A more detailed summary of the credit agreement is provided below under the heading "Description of Our Indebtedness."
Capital Spending
We divide our capital spending needs into two categories, non-discretionary, which is either capitalized or expensed, and discretionary, which is capitalized. Non-discretionary capital spending, such as for planned turnarounds and other maintenance, is required to maintain safe and reliable operations or to comply with environmental, health and safety regulations. We estimate that our total non-discretionary capital spending needs, including turnaround expenditures, will be approximately $56 million in 2005, approximately $71 million in 2006 and approximately $84 million in the aggregate over the three-year period beginning 2007. These estimates include the capital costs necessary to comply with environmental regulations, including Tier II gasoline standards and on-road diesel regulations.
We estimate that compliance with the Tier II gasoline and on-road diesel standards will require us to spend approximately $34 million in 2005, approximately $43 million in 2006, approximately $20 million during 2008 and 2009 and an additional $15 million thereafter. See "Business—Environmental Matters—The Clean Air Act—Fuel Regulations—Tier II, Low Sulfur Fuels."
The following table sets forth our estimate of our non-discretionary capital spending for the years presented:
| | 2005 | 2006 | 2007 | 2008 | 2009 | Cumulative Through 2009 | |||||||||||||
|---|---|---|---|---|---|---|---|---|---|---|---|---|---|---|---|---|---|---|---|
| | (in millions) | ||||||||||||||||||
| Environmental capital needs | $ | 36.5 | $ | 45.8 | $ | 3.0 | $ | 13.2 | $ | 33.0 | $ | 131.4 | |||||||
| Sustaining capital needs | 19.7 | 11.6 | 11.3 | 11.6 | 10.0 | 64.2 | |||||||||||||
| Planned turnaround capital needs | — | 13.3 | — | 1.6 | — | 14.9 | |||||||||||||
| Total estimated capital needs | $ | 56.2 | $ | 70.6 | $ | 14.2 | $ | 26.4 | $ | 43.0 | $ | 210.4 | |||||||
We undertake capital spending based on the expected return on incremental capital employed. Discretionary capital projects generally involve an expansion of existing capacity, improvement in product yields, and/or a reduction in operating costs. As of December 31, 2004, we had committed approximately $13.7 million towards discretionary capital spending in 2005.
Cash Flows
Operating Activities
Year ended December 31, 2004 compared to year ended December 31, 2003.
Comparability of cash flows from operating activities for the year ended December 31, 2004 to 2003 has been impacted by the closing of the Acquisition on March 3, 2004. We did not assume the accounts receivable or the accounts payable of Farmland. As a result, Farmland collected and made payments on these accounts after March 3, 2004 and these transactions are not included on our consolidated statements of cash flows. Therefore, this discussion of the cash flow from operations has
55
been separated into three periods: the year ended December 31, 2003, the 62 days ended March 2, 2004, and the 304 days ended December 31, 2004.
Net cash flow from operating activities for the 304 days ended December 31, 2004 was $89.8 million. The primary driver for the positive cash flow from operations over this period was cash earnings and favorable changes in working capital. For purposes of this cash flow discussion, we define working capital as accounts receivable, inventories, prepaid expenses and other current assets less accounts payable, accrued income taxes, other current liabilities and deferred revenue. During this period, we experienced favorable market conditions in our petroleum and nitrogen fertilizers businesses. Working capital produced cash flow of approximately $36.3 million during this period. For the 304 days ended December 31, 2004, we experienced a $20.1 million decrease in inventory due to an effort to reduce inventory carrying levels and a $31.1 million increase in accounts payable due to the extension of credit terms by several crude oil vendors and a large electricity vendor. In addition, other current liabilities increased by $13.0 million as a result of accruals for personnel, taxes other than income taxes, leases, freight and professional services. These positive cash flows from operations were partially offset by an increase in accounts receivable of $26.3 million as we assumed ownership of the business.
Net cash flow from operating activities for the 62 days ended March 2, 2004 was $53.2 million. The positive cash flow generated over this period was primarily driven by cash earnings and favorable changes in working capital of $40.9 million. The $40.9 million of cash flow generated from working capital was mainly the result of a $19.6 million decrease in accounts receivable due to the collection of a large past due petroleum account, $25.7 million in prepaid expenses and other current assets due to the reduction in prepaid crude oil required by Farmland due to the Acquisition and $8.3 million of deferred revenue resulting primarily from prepaid contract activity related to our nitrogen fertilizer business.
Net cash flow from operating activities for the year ended December 31, 2003 was $20.3 million. The positive cash flow from operations over this period is directly attributable to cash earnings offset by unfavorable changes in working capital. The positive cash earnings were the result of an improvement in the environment for both our petroleum and nitrogen fertilizer businesses versus the prior period. The $28.4 million cash outflow resulting from changes in working capital was primarily attributable to a $25.3 million increase in accounts receivable due to the delinquency of a large petroleum customer and a $23.8 million increase in prepaid expenses and other current assets directly attributable to the necessity for Farmland to prepay its crude oil supply during its bankruptcy. These cash outflows were partially offset by a reduction in inventory by $10.4 million and an $8.3 million increase in accounts payable.
Year ended December 31, 2003 compared to year ended December 31, 2002.
Operating activities generated $20.3 million in 2003 compared to a use of cash of $1.7 million in 2002. The $22.0 million improvement in cash flows was due to a $128.2 million improvement in income from operations, as adjusted for the impairment charges of $375.1 million in 2002 and $9.6 million in 2003, offset by unfavorable changes in working capital. Changes in components of working capital used cash of $28.5 million in 2003, compared to $52.6 million of cash provided in 2002, an increase of $81.1 million. In 2003, accounts receivable increased by $25.3 million due to higher average selling prices and an increase in volume from the nitrogen fertilizer segment, while prepaid and other current assets increased by $23.8 million as a result of both increases in the price and volume of prepaid crude oil. The resulting effect on operating cash flows was offset by an increase in accounts payable of $8.3 million due to price increases and returning to normal payment terms with some vendors as time had elapsed from the bankruptcy of Farmland and a $10.4 million dollar decrease in inventory primarily as a result of lower raw material prices. The primary reason for the $52.6 million source of cash in components of working capital for 2002 was a $56.2 million increase in accounts payable as result of
56
the bankruptcy filing of Farmland and the suspension of terms by nearly all of Farmland's raw material suppliers.
Investing Activities
Year ended December 31, 2004 compared to year ended December 31, 2003.
Net cash used in investing activities for 2004, was $130.8 million compared to $0.8 million in 2003. This difference is directly attributable to an increase in capital expenditures and the acquisition of the Farmland assets during the comparable periods. Throughout its bankruptcy, Farmland maintained capital expenditures for its petroleum and nitrogen assets to a minimum.
Year ended December 31, 2003 compared to year ended December 31, 2002.
Net cash from investing activities was a use of $0.8 million in 2003 compared to a use of $272.4 million in 2002. Capital expenditures accounted for $0.8 million and $12.2 million in 2003 and 2002, respectively. These capital expenditures were related to operational improvements, maintenance capital, safety and environmental related projects. In 2002, an additional $260.3 million was spent acquiring the nitrogen fertilizer complex that had previously been financed under an operating lease arrangement.
Financing Activities
Year ended December 31, 2004 compared to year ended December 31, 2003.
Net cash provided by financing activities in 2004 was $40.4 million. The uses of cash for financing activities over this period related primarily to the prepayment of the $23.0 million term loan, a $100.0 million cash distribution to the holders of the preferred and common units issued by Coffeyville Group Holdings, LLC, $1.2 million repayment of a capital lease obligation, $16.3 million in financing costs and $53.2 million in net divisional equity distribution to Farmland. We used cash from operations and a new term loan for $150.0 million completed on May 10, 2004 to finance the aforementioned cash outflows in 2004. In 2003, we used $19.5 million in cash to fund a net divisional equity distribution.
Prior to the Acquisition, our petroleum and nitrogen fertilizer businesses were organized as divisions within Farmland. As such, these divisions did not have a discreet legal structure from Farmland and the cash flows from these operations were collected and disbursed under Farmland's centralized approach to cash management and the financing of its operations. The net divisional equity distribution characterized on the accompanying financial statements represents the net cash generated by these divisions and funded to Farmland to finance its overall operations.
Year ended December 31, 2003 compared to year ended December 31, 2002.
For the 2003 and 2002, the petroleum and nitrogen fertilizer businesses were financed by the parent company. All cash generated or used was immediately disbursed to the parent, Farmland, in the form of a net divisional equity distribution or contribution. Neither the petroleum business nor the fertilizer business had incremental access to capital beyond that available from Farmland.
Capital and Commercial Commitments
In addition to long-term debt, we are required to make payments relating to various types of obligations. The following table summarizes our minimum payments as of December 31, 2004 relating to long-term debt and unconditional purchase obligations and operating leases for the five-year period following December 31, 2004 and thereafter.
57
Our ability to make payments on and to refinance our indebtedness and to fund planned capital expenditures will depend on our ability to generate cash flow in the future. This, to a certain extent, is subject to general economic financial, competitive, legislative, regulatory and other factors that are beyond our control. Based on our current level of operations, we believe our cash flow from operations, available cash and available borrowings under our revolving credit facility will be adequate to meet our future liquidity needs for the foreseeable future.
| | Payments Due by Period | ||||||||||||||||||||||
|---|---|---|---|---|---|---|---|---|---|---|---|---|---|---|---|---|---|---|---|---|---|---|---|
| | Total | 2005 | 2006 | 2007 | 2008 | 2009 | Thereafter | ||||||||||||||||
| | (in millions) | ||||||||||||||||||||||
| Contractual Obligations | |||||||||||||||||||||||
| Long-term debt (1) | $ | 148.9 | $ | 1.5 | $ | 1.5 | $ | 1.5 | $ | 1.5 | $ | 1.5 | $ | 141.4 | |||||||||
| Operating leases (2) | 15.6 | 3.3 | 3.1 | 2.9 | 2.9 | 1.9 | 1.5 | ||||||||||||||||
| Unconditional purchase obligations (3) | 199.2 | 14.0 | 14.0 | 14.0 | 10.0 | 10.0 | 137.1 | ||||||||||||||||
| Other long-term liabilities included in the balance sheet (4) | 1.8 | 1.0 | 0.8 | — | — | — | — | ||||||||||||||||
| Environmental liabilities (5) | 15.1 | 1.2 | 0.6 | 0.5 | 2.6 | 3.5 | 6.7 | ||||||||||||||||
| Interest payments (6) | 59.5 | 11.4 | 11.2 | 11.1 | 11.0 | 10.9 | 3.9 | ||||||||||||||||
| Total | $ | 440.1 | $ | 32.4 | $ | 31.2 | $ | 30.0 | $ | 28.0 | $ | 27.8 | $ | 290.6 | |||||||||
Other Commercial Commitments | |||||||||||||||||||||||
| Standby letters of credit (7) | $ | 4.1 | $ | 4.1 | $ | — | $ | — | $ | — | $ | — | $ | — | |||||||||
- (1)
- Long-term debt amortization is based on the contractual terms of the credit agreement governing our existing senior secured credit facility. We intend to repay our existing senior secured credit facility prior to the completion of this offering. See "Description of Our Indebtedness."
- (2)
- We lease various facilities and equipment, primarily railcars for our nitrogen fertilizer business under noncancelable operating leases for various periods.
- (3)
- The amount includes (1) commitments under a pipeline construction, operation and transportation agreement related to the delivery of crude oil from Cushing, Oklahoma to our Broom Station pipeline system near Caney, Kansas and (2) commitments under an electric supply agreement with the City of Coffeyville.
- (4)
- The amount includes contractual payments due to Farmland related to rejection damages for the electricity contract with the City of Coffeyville.
- (5)
- Environmental liabilities represents our estimated payments required by Federal and/or state environmental agencies related to sites in Coffeyville and Phillipsburg, Kansas.
- (6)
- Interest payments are based on interest rate in effect at December 31, 2004 and assume contractual amortization payments.
- (7)
- Standby letters of credit include our obligations under $3.1 million of letters of credit issued in connection with environmental liabilities and $1.0 million issued in connection with motor fuel tax for the state of Oklahoma.
Our business may not generate sufficient cash flow from operations, and future borrowings may not be available to us under our revolving credit facility in an amount sufficient to enable us to pay our indebtedness or to fund our other liquidity needs. We may need to refinance all or a portion of our indebtedness on or before maturity. We may not be able to refinance any of our indebtedness on commercially reasonable terms or at all.
Recently Issued Accounting Standards
In December 2004, the FASB issued FASB Statement No. 123 (revised 2004),Share-Based Payment, which addresses the accounting for transactions in which an entity exchanges its equity instruments for goods or services, with a primary focus on transactions in which an entity obtains employee services in
58
share-based payment transactions. This Statement is a revision to Statement 123 and supersedes APB Opinion No. 25,Accounting for Stock Issued to Employees, and its related implementation guidance. This Statement will require us to measure the cost of employee services received in exchange for an award of equity based on the grant-date fair value of the award (with limited exceptions). Incremental compensation costs arising from subsequent modifications of awards after the grant date must be recognized. This Statement will be effective for us beginning with its third quarter in 2005. Management is currently assessing the impacts this new standard will have on our consolidated financial statements.
In December 2004, the FASB issued FASB Statement No. 151,Inventory Costs, which clarifies the accounting for abnormal amounts of idle facility expense, freight, handling costs, and wasted material (spoilage). Under Statement No. 151, such items will be recognized as current-period charges. In addition, Statement No. 151 requires that allocation of fixed production overheads to the costs of conversion be based on the normal capacity of the production facilities. Statement No. 151 will be effective for us for inventory costs incurred on or after January 1, 2006.
Off-Balance Sheet Arrangements
As of December 31, 2004, we had several operating lease agreements with payments due on a monthly, quarterly or annual basis. The expiration dates for the lease agreements range from June 30, 2006 to March 31, 2012 with the majority of contracts expiring in 2009. The primary assets financed under these agreements were railcars utilized in the delivery of finished products for the nitrogen fertilizer business. For the period ended December 31, 2004, we had approximately 591 railcars subject to eight separate lease agreements.
Several of the lease agreements require us to pay for maintenance, taxes and fees associated with the operation of the leased facilities. In addition, we are also required under certain lease agreements to furnish financial statements on a quarterly and/or annual basis.
Quantitative and Qualitative Disclosures About Market Risk
The risk inherent in our market risk sensitive instruments and positions is the potential loss from adverse changes in commodity prices and interest rates. None of our market risk sensitive instruments are held for trading.
Commodity Price Risk
We, as a manufacturer of refined petroleum products and nitrogen fertilizer products, are "naturally long" processing capacity. In order to realize value from this processing capacity, a positive spread between the cost of raw materials and the value of finished products must be achieved (i.e., gross margin or crack spread). The physical commodities that comprise our raw materials and finished goods are typically bought and sold at a spot or index price that can be highly variable.
We use a crude oil purchasing intermediary which allows us to take title and price of our crude oil at the refinery, as opposed to the crude origination point, reducing our risk associated with volatile commodity prices by shortening the commodity conversion cycle time. The commodity conversion cycle time refers to the time elapsed between raw material acquisition and the sale of finished goods. In addition, we seek to reduce the variability of commodity price exposure by engaging in hedging strategies and transactions that will serve to protect gross margins as forecasted in the annual operating plan. Accordingly, we use financial derivatives to hedge future cash flows (i.e., gross margin or crack spreads) and product inventories. With regard to its hedging activities, we intend to:
- •
- lock in or fix a percentage of the anticipated or planned gross margin in future periods when the derivative market offers commodity spreads that generate positive cash flows; and
59
- •
- hedge the value of inventories in excess of minimum required inventories.
Further, we intend to engage only in risk mitigating activities directly related to our business.
Basis Risk
The effectiveness of our hedging strategies is dependent upon the correlation of the price index utilized for the hedging activity and the cash or spot price of the physical commodity for which price risk is being mitigated. Basis risk is a term we use to define such relationship. Basis risk can exist due to several factors including time or location differences between the derivative instrument and the underlying physical commodity. Our selection of the appropriate index to utilize in a hedging strategy is a prime consideration in our basis risk exposure.
Examples of our basis risk exposure are as follows:
- •
- Time Basis — In entering over-the-counter swap agreements, the settlement price of the swap is typically the average price of the underlying commodity for the calendar month. This settlement price is based on the assumption the underling physical commodity will price ratably over the swap period. If the commodity does not move ratably over the period then weighted average physical prices will be weighted differently than the swap price as the result of timing.
- •
- Location Basis — In hedging NYMEX crack spreads, we experience location basis as the price of refined products at New York harbor (basis for the NYMEX crack spread quotes) may be different than the prices of refined products in our trade area (PADD II, Group 3).
Price and Basis Risk Management Activities. Our most prevalent risk management activity is to sell forward the crack spread when opportunities exist to lock in a margin sufficient to meet cash obligations or the operating plan. Selling forward derivative contracts for which the underlying commodity is the crack spread enables us to lock in a margin on the spread between the price of crude oil and price of refined products. The commodity derivate contracts are either exchange-traded contracts in the form of futures contracts or over-the-counter contracts in the form of commodity price swaps.
In the event our inventories exceed our target base level of inventory and we seek to reduce inventory levels in a short period of time, we enter into commodity derivative contracts to manage our price exposure to our inventory positions that are in excess of our base level. Excess inventories are typically the result of plant operations such as a turnaround or other plant maintenance. The commodity derivative contracts are either exchange-traded contracts in the form of futures contracts or over-the-counter contracts in the form of commodity price swaps.
To eliminate the basis risk between the price of products in New York harbor and PADD II, Group 3 associated with selling forward derivative contracts for crack spreads, we enter basis swap positions to lock the price difference at the same time we sell the NYMEX forward contracts. If the difference between the price of products in New York harbor and our group is greater than the value contracted in the swap, then we will receive from or owe to the counterparty the difference on each unit of product that contracted in the swap thereby completing the locking of our margin. An example of our use of a basis swap is in the winter heating oil season. The risk associated with not hedging the basis when using NYMEX forward contracts to fix future margins is if the crack spread increases based on prices at the New York harbor and basis to PADD II, Group 3 narrows such that actual pricing in the group remains flat or decreases then we would be in a position to lose money on the derivative position and not earn additional margin on the physical position in PADD II, Group 3.
60
At December 31, 2004, we had the following open commodity derivative contracts whose unrealized gains and losses are included in other (income) expense in the consolidated statements of operations:
- •
- Derivative contracts on 625,000 barrels of heating oil crack spreads, the price spread between crude oil and heating oil, to fix the margin on forecasted sales in January and February 2005. These open contracts had total unrealized net gains at December 31, 2004 of approximately $529,000.
- •
- Derivative contracts on 600,000 barrels of heating oil basis spreads, the price spread between NYMEX heating oil and the Group III heating oil, to fix the margin on forecasted sales in
January and February 2005. These open contracts had total unrealized net gains at December 31, 2004 of approximately $236,000.
As of December 31, 2004, a $1.00 change in quoted futures price for the crack spreads described above would result in a $625,000 change to the fair market value of the derivative commodity position and the same change in operating income.
As of December 31, 2004, a $0.01 change in the quoted basis price for the basis spreads described above would result in a $252,000 change in the fair market value of the derivative commodity position and the same change in operating income.
During the tweleve months ended December 31, 2004 we utilized additional derivative contracts on gasoline crack spreads and heating oil crack spreads to fix the refining margin to the NYMEX spread between light crude oil contract price and unleaded gasoline and heating oil price for a portion of forecasted refined products production. During the twelve months ended December 31, 2004, we also utilized additional derivative contracts on heating oil basis spreads to fix the refining margin to the Group III basis between NYMEX heating oil price and Group III heating oil price for a portion of forecasted heating oil production. During the twelve months ended December 31, 2004, we recorded realized losses of approximately $219,000 (included in other income (expense)) on these contracts. These losses are in addition to the unrealized gains on open positions described above.
Interest Rate Risk
Borrowings under our term loan and revolving credit facility bear a current market rate of interest such that we are subject to interest rate risk on these borrowings. As of December 31, 2004, a 100 basis point change in interest rates on our floating rate loans, which totaled $148.9 million, would result in a $1.5 million change in pretax income on an annual basis.
61
Oil Refining Industry
Oil refining is the process of separating the wide spectrum of hydrocarbons present in crude oil, and in certain processes, modifying the constituent molecular structures, for the purpose of converting them into marketable finished petroleum products optimized for specific end uses. According to the Energy Information Association, as of January 1, 2004, there were 147 oil refineries operating in the U.S., with the 16 smallest each having a capacity under 13,000 bpd, and the 12 largest having capacities ranging from 300,000 to 550,000 bpd.
The current refining industry is characterized by capacity shortage, high utilization rates, and reliance on imported products to meet the demand for finished petroleum products. The last major oil refinery in the U.S. was built in 1976. Over the past three decades, more than 150 generally small and unsophisticated refineries that were unable to process heavy crude into a marketable product mix were permanently closed down. According to the Energy Information Association, while domestic refining capacity has decreased 1.5%, from 6.5 billion barrels in 1983 to 6.4 billion barrels in 2003, domestic demand for refined fuels has increased 30.4%, from 5.6 billion barrels to 7.3 billion barrels over the same period.
The following overview explains the basics of the refining process and certain factors that influence the refining industry.
Refining Basics
Refineries are uniquely designed to process and convert crude oils having a specific range of characteristics into the products required by the market of interest. In general, the different process units inside a refinery perform one of three functions:
Distillation: Separating the many types of hydrocarbons present in crude oil into distinct hydrocarbon fractions with specific boiling point ranges, such as gasoline, diesel oil and heavier hydrocarbons. Atmospheric and vacuum distillation are the primary distillation processes;
Conversion: Chemically changing the various hydrocarbon fractions into more desirable products by (a) rearranging the molecular structure through catalytic reforming, (b) creating larger, useable fractions from highly volatile light components through alkylation and isomerization, and/or (c) catalytically or thermally breaking down low value, very high molecular weight fractions into lighter gasoline and distillate range materials through fluid catalytic cracking and delayed coking; and
Treating: Removing unwanted contaminant elements and compounds such as sulfur, nitrogen, metals, and aromatics, typically via hydrotreating and contaminant recovery.
Each step in the refining process is designed to maximize the product realization for each level of the feedstocks, particularly the crude oil, processed through the refinery.
Typically, the first step in the refining process is to remove any chloride and solid impurities from the crude oil that would prove to be destructive to the downstream refining processes. This is accomplished in a water washing process called desalting.
The desalted crude oil is then processed through an atmospheric distillation unit where it is separated into various components based on the boiling ranges. Two principal side streams are withdrawn, a naphtha fraction whose boiling point range is similar to that of gasoline and the next heavier fraction, a middle distillate cut whose boiling point is similar to those of diesel oil and heating oil. The temperature at the bottom of the atmospheric distillation tower is held at approximately 650 degrees Fahrenheit since the non volatilized tower bottoms would thermally degrade at temperatures
62
above that level. Atmospheric distillation tower bottoms, generally referred to as atmospheric residuum or long residuum, is that part of the crude oil that is not volatile at 650 degrees Fahrenheit. Atmospheric residuum still contains valuable fractions, which are processed through a vacuum distillation tower, which allows, by virtue of the vacuum conditions, the useable hydrocarbons to distill off at actual temperatures that do not exceed the degradation point, but simulate the theoretical separation that would occur at a 1050 degree Fahrenheit boiling point. The principal side stream is a vacuum gas oil (VGO) that becomes further upgraded in the refinery as it is charged to the fluid catalytic cracking unit. The non-volatilized bottoms of the vacuum unit are generally referred to as vacuum tower bottoms (VTBs) or asphaltic residuum.
Our Refinery Configuration
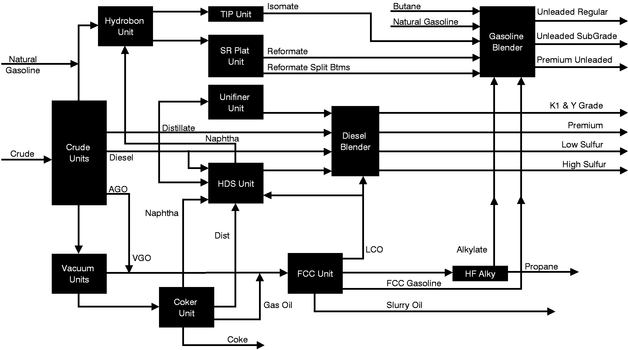
The next step in the refining process is to convert the major hydrocarbon fractions into distinct and marketable products. These major fractions include the naphtha and mid-distillate streams from the atmospheric distillation unit, and the VGO and VTBs fractions from the vacuum distillation unit. The VGO stream is processed in a fluid catalytic cracker (FCC) where it is chemically altered to produce fractions that boil in the mid-distillate and gasoline boiling range. Some of the material produced in the FCC is not of adequate quality to directly produce gasoline and mid-distillate fuels, and cannot be recycled, so these intermediates are withdrawn from the FCC and fed to the delayed coker for further upgrading to a finished product. The VTBs, a very heavy tar, is processed through a delayed coking unit where it is exposed to high temperature and moderate pressure for long time periods. During that process, the vacuum residuum is thermally fractionated into naphtha, distillate and gas oil streams that get further upgraded to finished products, and to a solid coke byproduct. The most important conversion units in this refinery are the delayed coking unit and the fluid catalytic cracking unit, which combine to convert heavy crude oil into gasoline and diesel oil range products.
The light end products from the delayed coking unit and FCC are upgraded into high octane, low volatility, low aromaticity blend stocks in an alkylation unit catalyzed with hydrofluoric acid.
The light portion of the naphtha is separated and processed in an isomerization unit. In this unit the straight chain molecules are converted into branched chain molecules that have more valuable blending properties.
63
Both the virgin heavy naphthas that are produced directly from the crude oil as well as the cracked naphthas produced by the coker and the FCC are upgraded to gasoline in the catalytic reformer where molecular structure is substantially rearranged, creating octane value in the gasoline pool, and generating the hydrogen needed in the refinery to reduce the sulfur content of the product pool.
Refinery Products
Major refinery products include:
Gasoline. The most significant refinery product is motor gasoline. The most important product characteristics of gasoline include octane level (high levels of which command a premium), vapor pressure and sulfur content. Various gasoline blendstocks are blended to achieve specifications for regular and premium grades in both summer and winter gasoline formulations. Refiners also produce different grades of reformulated gasoline from time to time as required by their markets. Reformulated gasolines are special blends containing oxygenates, which contain ethers such as Methyl Tertiary Butyl Ether or, more frequently, ethyl alcohol. These formulations are tailored to areas of the country with severe ozone pollution.
Distillate Fuels. Distillates are diesel fuels and domestic heating oils. The most important characteristic of diesel fuel is its cetane number, analogous, but diametrically opposite to octane number in gasoline, and sulfur content. As with gasoline, the market pays a premium for high cetane fuels, but unlike gasoline, there is a two tier sulfur content market since different limits apply to on-road diesel than to off-road diesel such as that used by railroads or farm machinery.
Kerosene. Kerosene is a more highly refined middle-distillate petroleum product that is used for jet fuel, cooking, space heating, lighting, solvents and for blending into diesel fuel. It generally commands a premium over distillate fuels, except when used in bulk for space heating.
Liquefied Petroleum Gas. Liquefied petroleum gases, consisting primarily of propane and butane, are produced for use as a fuel and as an intermediate material in the manufacture of petrochemicals. It may also be consumed in the refinery or sold.
Residual Fuels. Many marine vessels, power plants, commercial buildings and industrial facilities use residual fuels or combinations of residual and distillate fuels for heating and processing. Asphalts are also made from residual fuels and are used primarily for roads and roofing materials. However, such applications generate the lowest value. Many modern refineries, including ours, upgrade all residual fuels into gasoline and diesel oil.
Crude Oil
The quality of crude oil dictates the level of processing and conversion necessary to achieve the optimal mix of finished products. Crude oils are classified by their density (light to heavy) and sulfur content (sweet to sour). Light sweet crude oils are more expensive than heavy sour crude oils because (a) there is a limited supply of crude oil of these grades, and (b) there is more demand for light sweet crude oils given the large number of refineries that lack the process equipment needed to either crack the heavy materials to usable products (delayed coking, catalytic cracking) or to safely remove the contained sulfur to the levels required by the market. Heavy sour crude oils typically sell at a discount to the lighter, sweet crude oils because they produce a greater percentage of lower-value products with simple distillation and require additional processing to produce higher-value light products. Refiners strive to process the optimal mix, or slate, of crude oils through their refineries, depending on each refinery's conversion and treating equipment, the desired product output, and the relative price of available crude oils.
64
Refinery Complexity
Refinery complexity refers to a refinery's ability to process less-expensive feedstock, such as heavier and higher-sulfur content crude oils, into value-added products. Generally, the higher the complexity and the more flexible the feedstock slate options are, the better positioned the refinery will be to take advantage of these more cost-effective crude oils. This will result in incremental gross margin opportunities for the refinery. Refinery complexity is a measure of its cost in terms of its process capabilities. A complexity factor is assigned to each process unit based on its relative conversion value compared with the crude distillation unit. A refinery's overall complexity rating is an aggregate of the value assigned to each process unit multiplied by the capacity of the unit as a percentage of the crude distillation unit's capacity. The modified Solomon and Nelson complexity factors are standard measures of complexity that are the most widely used in the industry. Both modified Solomon and Nelson complexity indices are based on assigned factors for the various refinery process units in relation to atmospheric distillation at 1.0. A higher factor is assigned to more technologically demanding, capital intensive units. Both methods provide a measure of how complex the refinery is relative to others in the industry, with higher indices indicating higher conversion capability to value added products from heavier and higher sulfur crude oils.
U.S. Refining Capacity
We believe the fundamental drivers of profitability in the refining industry support a favorable outlook for U.S. refining margins for the next several years. Expected annual increases in demand exceed estimated increases in refining capacity, both on a global basis and in the U.S. By way of example, the Gulf Coast refining margins per barrel of crude oil between 1992 and 1999 were above $5.00 per barrel approximately 3% of the time. As a result of the underlying fundamental factors beginning in 2000, these margins have been over $5.00 per barrel almost 40% of the time.
It has become increasingly difficult over the last several years for U.S. refiners to meet the growth in demand for light products. Between 1985 and 2000 refinery utilization increased from 78% to over 92%. Since 2000 refinery utilization has continued to increase and is approaching the effective maximum rate. The trend toward greater capacity utilization has been driven by several factors:
- •
- no new major refineries have been built in the U.S. since 1976;
- •
- demand for refined products is increasing;
- •
- many small refineries have been closed; and
- •
- permitting requirements have constrained refiners' ability to increase capacity.
Number of U.S. Refineries vs. Utilization
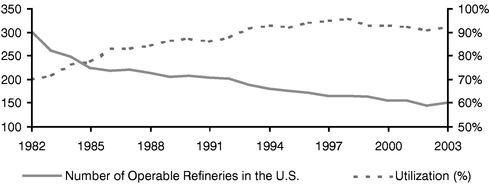
Source: EIA and Purvin & Gertz, Inc.
65
Existing refineries have exhausted almost all opportunities to increase light product yields in a cost effective manner. The implementation of the Federal Tier II low sulfur fuel regulations is expected to further reduce existing refining capacity.
In 2003, demand for gasoline and other refined products has continued to increase. According to Energy Information Agency, gasoline demand is up 1.4% in the year ended December 31, 2004 compared to the same period in 2003, due primarily to an improving economy and a continued increase in the number of higher gas consumption vehicles utilized by U.S. consumers. At the same time, gasoline supplies have tightened due to more stringent fuel specifications. This has caused gasoline margins to reach historic highs. Product demand has driven margins in 2004 to substantially exceed those experienced in 2003, and the expectation is for margins to continue at high levels beyond 2004. The inventory balances of refined products, especially gasoline, are well below their historical averages which provides evidence of the supply reduction.
Changes in the crude oil market also support better margins for complex U.S. refiners as growth in the production of heavy sour crude oil is expected to exceed that of light sweet crude oil. The price discounts available to refiners of heavy sour crude oil have widened as many refiners have turned to sweeter crude oils to meet lower sulfur fuel specifications, which has resulted in increasing the surplus of sour crude oils. In addition, as the global economy has improved, world-wide crude oil demand has increased, resulting in greater sour crude oil production. We expect all of these factors will result in increased sour crude discounts as compared to light sweet crude.
Refinery Locations
A refinery's location can have an important impact on its refining margins because location can influence access to feedstocks and efficient distribution. There are five regions in the United States, the Petroleum Administration for Defense Districts (PADDs), that have historically experienced varying levels of refining profitability due to regional market conditions. For example, refiners located in the U.S. Gulf Coast region operate in a highly competitive market due to the fact that this region (PADD III) accounts for approximately 35% of the total number of U.S. refineries and approximately 45% of the country's refining capacity. Since 1997, demand for gasoline and distillates has historically exceeded refining production by approximately 22% in the Midwest (PADD II). PADD I represents the East Coast, PADD IV the Rocky Mountains and PADD V is the West Coast. Our refinery is located in PADD II, Group 3. Since 1997, this region has imported nearly 38% of its requirement for petroleum products from the U.S. Gulf Coast. These imported products have higher prices due to the additional transportation costs associated with importing products from the U.S. Gulf Coast, the effect of which is overall higher prices for petroleum products in our region.
Structure of Refining Companies
Refiners typically are structured as part of a fully or partially integrated oil company, or as an independent entity. Refineries can be part of an integrated petroleum products business, beginning with exploration and production of crude oil (upstream) and ending with refining and/or participating in retail product distribution (downstream). Integrated multi-national oil companies are generally integrated throughout all aspects of the petroleum industry. Generally, an independent refiner and marketer neither has a source of proprietary crude oil production nor does it have significant downstream operations.
Refiners primarily distribute their products as either wholesalers or retailers. Refiners who operate as wholesalers principally sell their refined products under spot and term contracts to bulk and truck rack customers. Wholesalers who sell their products on an unbranded basis are called merchant refiners. Many refiners, both integrated and independent, distribute their refined products through their own retail outlets.
66
Economics of Refining
Refining is primarily a margin-based business where both the feedstocks and refined finished products are commodities. Although it is important to maintain high throughput rates and on-stream factors in refining because of the substantial fixed costs. There are also material variable costs associated with the fuel and byproduct components that become increasingly expensive as crude prices increase. The refiner's goal is to maximize the yields of high-value products and to minimize feedstock costs.
The refining industry uses a number of benchmarks to measure market values and margins:
West Texas Intermediate. In the U.S., West Texas Intermediate (WTI) crude oil is the reference quality crude oil. WTI is a light sweet crude oil and forms the price benchmark used in both the spot and futures markets.
Crack Spreads. A variety of crack spreads are used to track the profitability of the market place. Among those of most relevance to our refinery are the gas crack spread, the heat crack spread and the 5-3-2 crack spread. The gas crack spread is the simple difference in per barrel value of regular unleaded gasoline in New York Harbor as traded on the New York Mercantile Exchange (NYMEX) and the NYMEX prompt price of WTI on any given day. This provides a measure of the profitability when producing gasoline. The heat crack spread is the similar measure of the price of Number 2, low sulfur heating oil in New York Harbor as traded on the NYMEX, again, relative to the value of WTI crude which provided a measure of the profitability of producing diesel and heating oil. The 5-3-2 crack spread is a composite spread that assumes for simplification and comparability purposes that for every five barrels of WTI consumed, a refinery produces three barrels of gasoline and two barrels of heating oil; the spread is again based on the NYMEX price and delivery of gasoline and heating oil in New York Harbor. The 5-3-2 crack spread provides a measure of the general profitability of a well operated, medium high complexity refinery on the day that the spread is computed.
Our refinery uses a consumed 5-3-2 crack spread to measure its specific daily performance in the market. The consumed 5-3-2 crack spread assumes the same relative production of gasoline and heating oil from crude, so like the NYMEX based 5-3-2 crack spread, it has an inherent inaccuracy because the refinery does not produce exactly five barrels of high valued products for each five barrels of crude oil, and the relative proportions of gasoline to heating oil will vary somewhat from the 3:2 relationship. However, the consumed 5-3-2 crack spread is an economically more accurate measure of performance since the crude price used represents the price of our actual charged crude slate and is based on the actual sale values in our marketing region, PADD II, Group 3, rather than on New York Harbor NYMEX numbers. Average 5-3-2 crack spreads vary from region to region depending on the supply and demand balances of crude oils and refined products and can vary seasonally and from year to year reflecting more macroeconomic factors.
Heavy/Light Differential. The heavy/light differential is the price differential between Maya, a heavy, sour crude oil, and WTI crude oil. Maya crude oil typically trades at a discount to WTI crude oil.
Sweet/Sour Differential. The sweet/sour differential is the price differential between West Texas Sour, a medium sour crude oil and WTI crude oil. West Texas Sour crude oil trades at a discount to WTI crude oil. Typically, the sweet/sour differential is less than the heavy/light differential.
Product Differentials. Because refineries produce many other products that are not reflected in the crack spread, product differentials to regular unleaded gasoline and high-sulfur diesel are calculated to analyze the product mix advantage of a given refinery. Those refineries that produce relatively high volumes of premium products such as premium and reformulated gasoline, low-sulfur diesel fuel and
67
jet fuel and relatively low volumes of by-products such as liquefied petroleum gas, residual fuel oil, petroleum coke, and sulfur have an economic advantage.
Operating Expenses. Major operating expenses include labor, energy and repairs and maintenance. Labor and repairs and maintenance are relatively fixed costs that generally increase proportionally to inflation. The predominant variable cost is energy and the most reliable price indicator for energy costs is the cost of natural gas and crude oil.
Nitrogen Fertilizer Industry
Plant Nutrition Fundamentals
Commercially produced fertilizers give plants the primary nutrients needed in a form they can readily absorb and use. Nitrogen is an essential element for plant growth. Absorbed by plants in larger amounts than other nutrients, nitrogen makes plants green and healthy and is most responsible for increasing yields in crop plants. Although plants will absorb nitrogen from organic matter and soil materials, this is usually not sufficient to satisfy the demands of crop plants. The supply of nutrients must, accordingly, be supplemented with fertilizers to meet the requirements of crops during periods of plant growth, to replenish nutrients removed from the soil through crop harvesting and to provide those nutrients that are not already available in appropriate amounts in the soil. The two most important sources of nutrients are manufactured or mineral fertilizers and organic manures. Farmers determine the types, quantities and proportions of fertilizer to apply to their fields depending on, among other factors, the crop, soil and weather conditions, regional farming practices, and fertilizer and crop prices.
Consumption of Commercially Produced Fertilizers; Historical Development and Projected Growth
Global demand for fertilizers typically grows at predictable rates and tends to correspond to growth in grain production. Global fertilizer demand is driven in the long-term primarily by population growth, increases in disposable income and associated improvements in diet. Short-term demand depends on world economic growth rates and factors creating temporary imbalances in supply and demand. These factors include weather patterns, the level of world grain stocks relative to consumption, agricultural commodity prices, energy prices, crop mix, fertilizer application rates, farm income and temporary disruptions in fertilizer trade from government intervention, such as changes in the buying patterns of large countries like China or India. According to the International Fertilizer Industry Association, or IFA, over the last 40 years global fertilizer demand has grown 3.8% annually and global nitrogen demand has grown at a faster rate of 5.2% annually. According to the IFA, during that 40 year period, North American fertilizer demand has grown 2.7% annually with North American nitrogen demand growing at a faster rate of 3.7% annually.
In addition, the world's dietary standard has improved significantly during this period, as reflected by a rise in the per capita caloric intake. Data from The Food and Agriculture Organization of the United Nations (FAO) indicate that, on a per capita basis, the human average daily caloric intake increased by approximately 25% from 1961 to 2001. The shift in dietary pattern has further spurred demand for higher crop yields and consequently, fertilizer demand.
Commercially produced fertilizer has played, and is expected to continue to play, an increasingly important role in crop nutrition over time. Using a typical grain crop as an example, natural soil fertility can only sustain a production of approximately 0.67 tons per acre of land over time. Traditional agricultural practices with animal, grass and grain production combined, and full use of the manures produced by the animals, can enhance this yield to approximately 0.89 tons per acre. Through the use of commercially produced fertilizers, together with other advances in agricultural technologies and practices, the present production has increased to approximately 2.68 tons per acre.
68
In a report entitledFertilizer Requirements in 2015 and 2030 prepared in 2000, the FAO projected an increase in major world crop production from 1995/97 to 2030 of approximately 76%. In order to attain the yields projected by the FAO, the FAO forecasts that fertilizer consumption will have to increase from the average level of 147 million tons per year during the mid to late 1990s period to between 184 and 219 million tons per year by 2030. This forecast conservatively assumes a slow-down in the growth of the world's population and crop production, and an improvement in fertilizer use efficiency. These figures represent a projected annual growth rate of between 0.7% and 1.3% per year, compared to an actual average annual increase of 2.4% per year between 1970 and 2000.
Nitrogen Products
Nitrogen, which typically accounts for approximately 60% of worldwide fertilizer consumption in any planting season, is an essential element for most organic compounds in plants as it promotes protein formation and is a major component of chlorophyll, which helps to promote green healthy growth and high yields. There are no substitutes for nitrogen fertilizers in the cultivation of high-yield crops. Ammonia is the basic building block for producing virtually all forms of nitrogen based fertilizers. To a lesser extent, it is also used directly as a commercial fertilizer. Ammonia is produced by reacting gaseous nitrogen with hydrogen at high pressure and temperature in the presence of a catalyst. Nearly all hydrogen produced for the manufacture of nitrogen based fertilizers is produced by reforming natural gas at a high temperature and pressure in the presence of water and a catalyst. This process is profitable in a low cost natural gas environment. Hydrogen can also be produced by gasifying petroleum coke. This process, which is commercially employed our nitrogen fertilizer plant and a few other plants, takes advantage of the large cost differential between petroleum coke and natural gas in current markets. Because of the wide availability of feedstocks capable of being reformed into hydrogen, ammonia and nitrogen fertilizers are produced in many countries.
The production of virtually all nitrogen based fertilizers starts with the production of ammonia. There are a number of processes that produce the various fertilizers derived from ammonia, the most common of which include: urea, ammonium nitrate, urea ammonium nitrate, and ammoniated phosphates, (often referred to as MAP and DAP). The diversity of products facilitates site-specific agricultural applications, which take into account factors such as soil type and the requirements of the crop, thus making it possible to achieve optimal plant nutrition.
The four principal nitrogen based fertilizer products are:
Ammonia. Ammonia is used in limited quantities as a direct application fertilizer, and is primarily used as a building block for other nitrogen products, including intermediate products for industrial applications and finished fertilizer products. Ammonia, consisting of 82% nitrogen, is stored either as a refrigerated liquid at minus 27 degrees, or under pressure if not refrigerated. It is gaseous at ambient temperatures and is injected into the soil as a gas. The direct application of ammonia requires farmers to make a considerable investment in pressurized storage tanks and injection machinery, and can only take place under a narrow range of ambient conditions. We produce approximately 370,000 tons per annum of ammonia, of which approximately two-thirds is upgraded into 638,000 tons per annum of UAN.
Urea. Urea is formed by reacting ammonia with carbon dioxide (CO2) at high pressure. From the warm urea liquid produced in the first, wet stage of the process, the finished product is mostly produced as a coated, granular solid containing 46% nitrogen and suitable for use in bulk fertilizer blends containing the other two principal fertilizer nutrients, phosphate and potash. We do not produce merchant urea.
Ammonium Nitrate. Ammonium nitrate is another dry, granular form of nitrogen based fertilizer. It is produced by converting ammonia to nitric acid in the presence of a platinum catalyst reaction,
69
then further reacting the nitric acid with additional volumes of ammonia to form ammonium nitrate. We do not produce this product.
Urea Ammonia Nitrate Solution (UAN). Urea can be combined with ammonium nitrate solution to make liquid nitrogen fertilizer (urea ammonium nitrate or UAN). These solutions contain 32% nitrogen and are easy to store, transport and provide the farmer with the most flexibility in tailoring fertilizer, pesticide and fungicide applications.
Global Ammonia Market
Historical global ammonia supply and demand is presented in the table below, on the basis of thousands of tons per year of nitrogen. Global ammonia demand totaled 121.7 million tons of nitrogen in 2003, which represented 2.5% growth over 2002 demand. Ammonia demand is largely driven by nitrogen fertilizer demand. Demand fell in the early 1990s, primarily due to the collapse of the former Soviet Union, but began to recover in 1993. Ammonia growth in demand continued through 2000 and more recently, and consequently, such that nitrogen fertilizer demand grew by approximately 8.2 million tons of nitrogen between 1995 and 2000. Global food supplies were extremely tight during this period, and grain inventories fell to the lowest level in twenty years. Despite grain utilization exceeding production for the third consecutive year, agricultural commodity prices remained low and world grain production fell 1.7% to 2.0 billion tons of nitrogen in 2003. Global nitrogen fertilizer demand growth averaged 1.0% between the years 1990 to 2003.
Global Ammonia Supply and Demand Balance
(thousand tons of nitrogen)
| | | | | | | | Average Annual Growth Rate (%) | |||||||
|---|---|---|---|---|---|---|---|---|---|---|---|---|---|---|
| | 1998 | 1999 | 2000 | 2001 | 2002 | 2003 | 1998-2003 | |||||||
| Ammonia Nominal Capacity | 138,020 | 141,477 | 144,970 | 145,910 | 147,652 | 149,802 | 1.7% | |||||||
| Effective Utilization Rate | 82 | % | 83 | % | 83 | % | 79 | % | 80 | % | 79 | % | NM | |
| Ammonia Production | 113,800 | 117,307 | 119,819 | 115,709 | 118,427 | 118,281 | 0.8% | |||||||
| Non Ammonia Nitrogen | 672 | 694 | 717 | 717 | 717 | 772 | 2.8% | |||||||
| Total Production | 114,472 | 118,001 | 120,536 | 116,426 | 119,144 | 119,053 | 0.8% | |||||||
| Ammonia Industrial Use | 16,204 | 16,535 | 16,755 | 16,755 | 16,755 | 17,023 | 1.0% | |||||||
| Processing and Distribution Loss | 9,673 | 9,972 | 10,184 | 9,835 | 10,066 | 10,054 | 0.8% | |||||||
| Stock Changes | (893 | ) | 1,133 | 4,035 | (346 | ) | (338 | ) | (3,419 | ) | NM | |||
| Nitrogen Fertilizer Consumption | 89,488 | 90,361 | 89,562 | 90,182 | 92,661 | 95,395 | 1.3% | |||||||
| Total Consumption | 114,472 | 118,001 | 120,536 | 116,426 | 119,144 | 119,053 | 0.8% |
Source: Nexant/Chemsystems
70
The figure below shows regional ammonia trade in 2003. Latin America is a large ammonia exporter to North America, but North America also imports additional supplies, primarily from the Middle East and the former Soviet Union, which are large exporters. Nexant/Chemsystems' projected global ammonia supply and demand outlook is presented in the table below, on the basis of millions of tons per annum of nitrogen. Beyond 2003, Ammonia demand is expected to continue to be largely driven by nitrogen fertilizer demand. Globally, ammonia demand is projected to increase 1.0% per year from 121.7 million tons of nitrogen in 2003 to 130.6 million tons of nitrogen by 2010.
Global Ammonia Net Trade, 2003
(thousand tons of nitrogen)
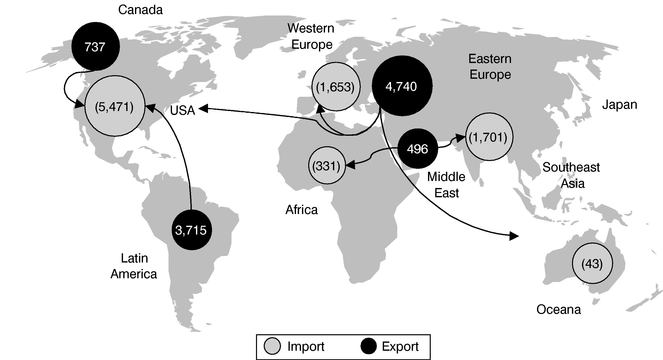
Source: Nexant/ChemSystems.
71
Global Ammonia Supply and Demand Balance
(thousand tons of nitrogen)
| | | | | | Average Annual Growth Rate (%) | |||||
|---|---|---|---|---|---|---|---|---|---|---|
| | 2003 | 2004 | 2005 | 2010 | 2003-2010 | |||||
| Ammonia Nominal Capacity | 149,802 | 150,470 | 152,111 | 169,575 | 1.8% | |||||
| Effective Utilization Rate | 79 | % | 82 | % | 82 | % | 77 | % | NM | |
| Ammonia Production | 118,281 | 123,072 | 125,252 | 130,571 | 1.4% | |||||
| Non Ammonia Nitrogen | 772 | 882 | 772 | 882 | 1.9% | |||||
| Total Production | 119,053 | 123,954 | 126,024 | 131,453 | 1.4% | |||||
| Ammonia Industrial Use | 17,023 | 17,295 | 17,572 | 19,024 | 1.6% | |||||
| Processing and Distribution Loss | 10,054 | 10,461 | 10,646 | 11,098 | 1.4% | |||||
| Stock Changes | (3,419 | ) | 1 | — | 1 | NM | ||||
| Nitrogen Fertilizer Consumption | 95,395 | 96,197 | 97,806 | 101,330 | 0.9% | |||||
| Total Consumption | 119,053 | 123,954 | 126,024 | 131,453 | 1.4% | |||||
Source: Nexant/ChemSystems.
Global nitrogen fertilizer demand rebounded by growing 3% in 2002 and continued at a more robust pace in 2003. However, demand growth is projected to revert to historical levels and continue along a more moderate growth pattern of 0.9% per year through 2010, comparable to long-term historical growth between 1990 and 2003. This demand is being driven by a recovery in global economic growth and population growth, which is expected to continue. Despite the rebound in demand growth in 2002 and 2003, the average global capacity utilization rate remains at approximately 80% through 2005. This reflects two fundamental circumstances: (1) with high U.S. natural gas prices, many U.S. Gulf Coast plants are effectively "swing plants" which commence or cease production based on profitability which is primarily dependent on natural gas prices; and (2) globally, some plants are limited by seasonal gas demands on gas for fuel or electric power, or by limitations on gas supplies as fields tend to decline in natural gas production capability.
Pricing of Fertilizer Products
The nitrogen fertilizer industry is cyclical, reflecting the commodity nature of ammonia and the major finished fertilizer products (e.g., urea). In the normal course of business, industry participants are exposed to fluctuations in supply and demand, which can have significant effects on prices across all participants' commodity business areas and products and, in turn, their operating results and profitability. Changes in supply can result from capacity additions or reductions and from changes in inventory levels. Demand for fertilizer products is dependent on demand for crop nutrients by the global agricultural industry, which, in turn, depends on, among other things, weather conditions in particular geographical regions. Periods of high demand, high capacity utilization and increasing operating margins tend to result in new plant investment, higher crop pricing and increased production until supply exceeds demand, followed by periods of declining prices and declining capacity utilization, until the cycle is repeated.
Prices of nitrogen based fertilizers are relatively volatile because this segment of the industry is affected by raw material cost swings. However, sales volumes of nitrogen based fertilizers vary relatively little from one fertilizer season to the next, because nitrogen must be applied every year to maintain crop yields. The global nitrogen fertilizer industry has been undergoing a period of considerable change during recent years. In addition to the normal issues of weather and climate that cause disruptions in the usage of fertilizer, the industry has mainly been influenced globally by the volatility in feedstock prices. These are primarily related to natural gas prices, but oil prices are a factor as well.
72
In the U.S., volatile and generally rising natural gas prices over the last five years have fundamentally changed the U.S. nitrogen fertilizer industry outlook. Combined with the demand for natural gas that has developed during the last 10 to 20 years, in particular, the use of natural gas for base load electricity production in the U.S., it is generally believed that the outlook for the next five years will be characterized by historically high natural gas prices. In addition to high natural gas prices, the supply of crude oil is now tight globally. This is primarily attributed to rapid growth in economic development in Asia and elsewhere, combined with sustained economic growth in the most significant developed economies, has resulted in growing crude oil demand. The recent pattern of U.S. natural gas prices and U.S. and global crude oil prices is detailed in the table below.
Historical Average Energy Prices
| Year | Natural Gas ($/million btu) | WTI ($/bbl) | Ammonia ($/ton) | |||
|---|---|---|---|---|---|---|
| 1990 | 1.78 | 24.53 | 105 | |||
| 1991 | 1.53 | 21.55 | 106 | |||
| 1992 | 1.73 | 20.57 | 95 | |||
| 1993 | 2.11 | 18.43 | 109 | |||
| 1994 | 1.94 | 17.16 | 191 | |||
| 1995 | 1.69 | 18.38 | 207 | |||
| 1996 | 2.50 | 22.01 | 189 | |||
| 1997 | 2.48 | 20.59 | 173 | |||
| 1998 | 2.16 | 14.43 | 120 | |||
| 1999 | 2.32 | 19.26 | 108 | |||
| 2000 | 4.32 | 30.28 | 169 | |||
| 2001 | 4.06 | 25.92 | 182 | |||
| 2002 | 3.39 | 26.19 | 137 | |||
| 2003 | 5.49 | 31.03 | 243 | |||
| 2004 | 5.90 | 41.47 | 327 | |||
| First Quarter 2005 | 6.44 | 49.85 | 332 |
Source: Bloomberg and Chemical Marketing Associates, Inc.
Most important to U.S. nitrogen fertilizer producers are the prices of natural gas. We believe the recent gas prices of over $5.00 per million Btu are especially significant for two reasons. First, U.S. nitrogen fertilizer producers that employ natural gas as feedstock to produce ammonia and urea (which, does not include our nitrogen fertilizer plant) become generally uneconomical at prices of between $3.50 and $5.00 per million Btu. Determination these uneconomical prices depends on many factors, such as the level of oil prices, cost and availability of ocean transport for ammonia, and the supply/demand and seasonal dynamics in the fertilizer and agricultural sectors. The level of energy prices, primarily natural gas, has been the single most important variable in U.S. nitrogen fertilizer prices.
We also believe the prevailing level of natural gas prices is significant, because economic and energy supply fundamentals are now pointing to higher gas prices for the foreseeable future, as evidenced by the current futures market for U.S. natural gas contracts.
73
NYMEX Forward Natural Gas Prices—Henry Hub
($/million Btu)
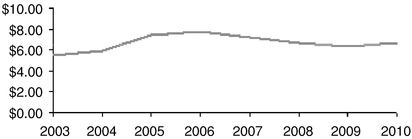
Source: Bloomberg (as of January 25, 2005).
Farm Belt Nitrogen Market
The volumes of ammonia and UAN sold into the markets set forth in the table below are as follows:
Current U.S. Ammonia and UAN Demand in Selected Mid-continent Areas
(thousand tons per year)
| State | Ammonia Quantity | UAN Quantity | ||
|---|---|---|---|---|
| Texas | 2,430 | 940 | ||
| Oklahoma | 125 | 150 | ||
| Kansas | 460 | 750 | ||
| Missouri | 240 | 180 | ||
| Iowa | 600 | 920 | ||
| Nebraska | 400 | 965 | ||
| Minnesota | 325 | 185 |
According to Blue Johnson & Associates Inc., approximately 38.9% and 17.9% of the total U.S. supply of ammonia and UAN, respectively, for 2003 were imported.
Sales and Distribution of Nitrogen Fertilizers
Sales of nitrogen fertilizer products to end users are generally made through independent retailers, resellers, farmer cooperatives, affiliated dealer organizations and brokers. Markets for nitrogen fertilizer products are seasonal within a given geographical market, with the timing of application determined by the overall cycle of crop growth, local weather conditions, soil conditions and the type of agricultural activity.
The agricultural ammonia market is seasonal and dependent on proper weather and soil moisture for maximum demand. Most ammonia storage is held at the manufacturer or wholesale distributor level. Dealers typically have small storage capacities relative to their annual demand.
The UAN market is characterized by large storage capacities at the dealer and reseller levels. Most customers choose to purchase products and fill their storage during the summer, fall and winter in preparation for the spring demand. Typically there is a higher cash market price in the spring for UAN, so customers are motivated to fill storage in the off-season. This off-season fill constitutes over three-fourths of the total annual demand.
74
Overview
We are one of the largest independent high complexity petroleum refiners and marketers in the mid-continental U.S. and the lowest cost producer and marketer of upgraded nitrogen fertilizer products in North America. Our operations are organized into two business segments: petroleum and nitrogen fertilizer. Our petroleum business includes a complex cracking/coking oil refinery in Coffeyville, Kansas, a crude oil gathering system throughout Kansas and Northern Oklahoma, and storage and terminalling facilities for asphalt and refined fuels in Phillipsburg, Kansas. Our refinery operates in close proximity to our primary customer base and benefits from favorable crude oil supply and product distribution logistics. Our nitrogen fertilizer business in Coffeyville, Kansas, includes a petroleum coke gasification plant that produces high purity hydrogen that is converted to ammonia at our ammonia plant and upgraded to urea ammonium nitrate (UAN) at our UAN plant. We operate the only commerical nitrogen fertilizer plant in North America utilizing a coke gasification process to generate hydrogen feedstock that is further converted to ammonia for the production of nitrogen fertilizers. This currently provides us with a significant competitive advantage due to the high prevailing and volatile natural gas prices. On a pro forma basis, we generated revenue of $1.3 billion and $1.7 billion during the fiscal year ended December 31, 2003 and 2004, respectively, an increase of 31%. On a forma basis for the same periods, net income was $17.9 million and $59.8 million, respectively, an increase of 234% and our earnings before net interest, taxes, depreciation and amortization (EBITDA), was $32.5 million and $116.5 million, respectively, an increase of 258%.
Petroleum Business
We operate one of the seven fuels refineries located in the mid-continental U.S. We produce at a throughput of 100,000 bpd, which accounts for approximately 15% of those fuels refineries' production. Our cracking/coking refinery has a modified Solomon complexity of approximately 8.8 and a Nelson complexity of approximately 9.7, which are standard industry measures, indicating that, due to our use of certain technologically demanding processing units, we are able to process heavier and higher-sulfur content crude oils into value added products compared to less complex competitors. The current excess availability of heavy crude oil relative to light sweet crude in world markets has resulted in an increasing price differential between the cheaper heavier, higher-sulfur content fuels that we are able to process, and the more expensive lighter, lower sulfur-content crudes that our less complex competitors refine. These market conditions provide us with a significant cost advantage over less complex refineries. During the year ended December 31, 2004, our heavy and medium sour crude processing capacity was approximately 40% to 50% of our throughput, and high-value products represented approximately a 84% product yield on a crude oil basis.
We primarily target a diverse customer base in the Midwestern states where regional demand for petroleum products has exceeded regional refining production. As a result of our geographic location, we do not incur the high cost of transporting refined products to customers in the Midwest compared to refiners located outside the Midwest. We estimate our region's refining margins have exceeded Gulf Coast refining margins by approximately $1.93 per barrel on average for the last four years based on the four year average Gulf Coast 5-3-2 crack spread compared to the average 5-3-2 crack spread in PADD II, Group 3 over the same period, in each case assuming a 50/50 mix of WTI and WTS. All of our non-gathered crude is purchased through a credit intermediation agreement, which mitigates crude pricing risks and allows us to reduce our inventory position. We also derive additional revenue by leasing storage and charging for terminalling services at Phillipsburg, Kansas, on a throughput basis to third parties in need of asphalt and refined fuels.
75
Nitrogen Fertilizer Business
We operate the only commercial nitrogen fertilizer plant in North America utilizing a coke gasification process to generate hydrogen feedstock that is further converted to ammonia and UAN. By using petroleum coke rather than natural gas as a raw material, we currently have a significant cost advantage over North American natural gas based fertilizer producers. In addition, we benefit economically from high prevailing natural gas prices because fertilizer prices tend to rise with natural gas prices. We estimate that our cost advantage over natural gas based fertilizer producers is realized when natural gas prices are in the range of $1.50 to $2.50 per million Btu and above. This level is generally low by historical industry prices and our cost advantage is more pronounced at current natural gas prices, which have generally fluctuated between $5.00 and $8.00 per million Btu since the end of 2003.
We obtain approximately 80% of the petroleum coke we use at our nitrogen fertilizer plant from our adjacent refinery. The use of coke as a raw material in our fertilizer plant also provides a superior value to our refinery's coke, which would otherwise be sold at significantly lower economic value, as is the current practice in the industry. Any coke not obtained from our oil refinery is readily available and purchased on the open market. Our plant produces 370,000 tons per annum of ammonia. We upgrade approximately two-thirds of our ammonia into 638,000 tons per annum of high value UAN, bringing salable tonnage to 755,000 tons per annum of finished product. As the largest single train UAN production facility in North America, our UAN production represents 5.6% of U.S. demand. Our nitrogen products are delivered by trucks and our own fleet of rail cars to retailers and distributors in the mid-continental agricultural and industrial markets and to certain locations served by the Union Pacific (UP) railroad. Our nitrogen fertilizer customers are located in close proximity to us, enabling us to avoid intermediate, transfer, storage, barge freight, or pipeline freight charges. As a result, we believe we enjoy a freight advantage over U.S. Gulf Coast ammonia importers of approximately $65 per ton and over U.S. Gulf Coast UAN importers of approximately $37 per ton. Such cost differentials represent a significant portion of the market price of these commodities. For example, since the end of 2003, ammonia prices have fluctuated between $268 and $329 per ton, and UAN prices have fluctuated between $156 and $195 per ton.
Market Trends
We have identified several key factors we believe lead to a favorable outlook for the refining and nitrogen fertilizer industries for the next several years.
For the refining industry, these factors include:
- •
- The supply and demand fundamentals of the domestic refining industry have improved since the 1990s, and are expected to continue as the demand for refined products continue to exceed increases in refining capacity in the U.S.
- •
- Continued excess availability of lower cost sour and heavy sour crude oil is expected to provide a cost advantage to complex refiners with the ability to process these crude oils.
- •
- Increasing reliance on imports to satisfy demand for refined products, especially gasoline, and lower ability to deliver region-specific refined products due in part to varying product specifications from state to state will favor regional refiners with transportation cost advantages.
- •
- More products based on new and evolving fuel specifications, including ultra-low sulfur content, reduced vapor pressure, and the addition of oxygenates such as ethanol, will require refiners to blend and process these boutique fuels and exert pressure on product availability.
- •
- High capital costs, excess capacity, and environmental regulatory requirements have limited the construction of new refineries in the U.S. over the past thirty years. No new major refinery has
76
been built in the U.S. since 1976. More than 150 small and unsophisticated refineries, however, have been shut down in recent years.
For the nitrogen fertilizer industry, these factors include:
- •
- Persistently high natural gas prices, a deficit in natural gas supply and increased demand for natural gas in North America as an environmentally friendly fuel are expected to result in reduced production of natural gas based nitrogen fertilizer products in the U.S. Imports of nitrogen fertilizer product will only partially address this shortfall due to the lack of surplus of natural gas and a shortage of fertilizer transportation infrastructure, such as terminals, pipelines, barges and railcars. These factors will help maintain high nitrogen fertilizer prices in the central Midwestern U.S., or the U.S. farm belt, the largest market for nitrogen fertilizer products in the U.S.
- •
- The combined impact of a growing world population, improving diets, and low grain inventories will drive grain prices and productions worldwide and consequently drive high nitrogen and nitrogen based fertilizer prices in order to stimulate increased grain production.
- •
- Continued high prices of petroleum and natural gas will result in a cost preferential position for coke gasification technology.
Competitive Strengths
Strong Oil Refining Industry Fundamentals
We believe attractive demand and supply dynamics for refined products favor us because of our ability to receive and process crude efficiently, produce high-value products, and transport our refined products cost-effectively to our customers. Throughout the U.S., expected annual increases in demand continue to exceed expected increases in refining capacity. There has also been a shortage of refined products as evidenced by inventories of refined products, especially gasoline, below their historical averages. These nationwide trends are more pronounced in our marketing region, where demand for refined products has exceeded refining production by approximately 38% since 1997.
Strong Nitrogen Fertilizer Industry Fundamentals
The combined impact of growing world population and low grain inventories results in rising grain prices and strong projections for acres of corn and wheat planted in North America, which we believe will drive the demand for nitrogen fertilizer. Consequently, we expect the current high nitrogen fertilizer prices to prevail in North America for the foreseeable future. This projection is further supported by strong natural gas prices, a deficit in North American ammonia and UAN production and a shortage of fertilizer transportation infrastructure, such as pipelines, barges, and railcars that are needed to transport imported products into the mid-continent market where nitrogen fertilizer is primarily consumed. The total UAN capacity of our nitrogen fertilizer business is well suited to reach into premium agricultural markets in Kansas, Missouri, Nebraska, Iowa, Illinois and Texas.
Regional Focus and Strategic Location
As one of the seven fuels refineries in the Midwest, we are located in close proximity to our customers and we benefit from favorable crude oil supply and product distribution logistics, including access to pipelines and railroads in our petroleum and nitrogen fertilizer businesses, respectively. As a result, we do not incur high transportation costs. We believe our low transportation costs enable us to capture higher margins than similar refineries outside the Midwest. We have ready and economical access to international crudes available in the U.S. Gulf Coast through the Seaway pipeline, which was designed to transport foreign crude oil to the mid-continent region. The Seaway pipeline currently has excess capacity available and offers a discounted tariff rate by the pipeline operator, and potentially in
77
Canada through a proposed future pipeline connection. In addition, our favorable plant location relative to end users of ammonia and UAN, as well as high product demand relative to production volume allow us to target freight-advantaged destinations in the U.S. farm belt.
Efficient, Modern Asset Base
Since 1994, approximately $188 million has been invested to modernize our oil refinery to make it one of the more advanced in our region and to meet environmental regulations. Improvements include the addition of a crude and vacuum unit, a new bottom loading truck terminal, expansion of the HDS unit, a new light ends recovery unit, and upgrade of the FCCU and coker. Modernization of the refinery control system with addition of Advanced Process Control on selected units was also completed. These improvements have enhanced our crude sourcing flexibility, increased our net yield of high value transportation fuels and reduced our structural costs of refining. Similarly, between 1999 and 2002, approximately $370 million was invested to create our nitrogen fertilizer plant. Our nitrogen fertilizer plant's gasification process uses less than 1% of the natural gas used by natural gas based nitrogen fertilizer plants and emits significantly less pollutants during normal operations compared to other nitrogen fertilizer facilities.
Low Input and Operational Costs
Our refinery is capable of processing a broad array of crude oils from both foreign and domestic sources, with approximately 40% to 50% of its feedstock comprised of heavy and medium sour crude. As a result, we believe we are well positioned to benefit from the increasing share of global crude oil production represented by heavy sour crude oil, which has become an increasing share of global crude oil and which production tends to be less expensive than lighter, sweeter types of crudes and contributes to higher margins. In addition, we estimate that our fertilizer plant, which has lower feedstock costs and capital requirements than natural gas based fertilizer plants, retains its competitive advantage at natural gas prices in the range of $1.50 to $2.50 per million Btu and above. This price level is generally low by historical industry standards and our cost advantage is more pronounced at current natural gas prices, which have generally fluctuated between $5.00 and $8.00 per million Btu since the end of 2003.
Experienced Management Team
We have a highly experienced management team, averaging over 23 years of industry experience. Our management compensation is directly tied to achieving certain performance objectives. Under the leadership of our chief executive officer, Philip L. Rinaldi, we have made significant operational improvements, which have reduced operating costs and increased stockholder value. We have made the operational improvements in the following areas:
- •
- Crude oil supply logistics—we have improved our our terminalling and staging facilities, entered into a credit intermediation agreement and increased our heavier crude slate, all of which have allowed us to maximize our refining margins;
- •
- Fertilizer marketing—we have adjusted our discount structure and altered the geographic profile of our nitrogen fertilizer customer base, which have allowed us to increase margins on our nitrogen fertilizer products;
- •
- Petroleum marketing—we have increased production of value added products, negotiated tariff improvements, improved our contract terms, and improved rack margins; and
- •
- Operations—we have optimized our staffing through reassignment and reductions, reduced the maintenance costs of our gasifier operation, and improved the reliability of our refinery operations, resulting in less unscheduled downtime.
78
Our Business Strategy
Our goal is to continue to be a premier independent refiner and marketer of high-value, clean transportation fuels and producer of ammonia and UAN. We believe that this offering will strengthen our ability to execute the following strategic objectives:
- •
- We intend to continue to take advantage of favorable supply and demand dynamics in the Midwest by capitalizing on our position as one of the largest refiners in the mid-continental U.S. and through internal growth.
- •
- We intend to improve our competitive position in our refining and fertilizer operations by selectively investing in high-return projects that enhance our operating efficiency and expand our capacity while rigorously controlling costs.
- •
- We intend to increase our sales and supply capabilities of boutique fuels, UAN, and other high-value products, while finding cheaper sources of raw materials, such as crude oil from Canada.
- •
- We intend to maximize our location and transportation cost advantages and continue to focus on being a reliable, low-cost supplier of to our existing customers and identify new customers.
- •
- We intend to continue to devote significant time and resources toward improving the reliability, safety and environmental performance of our operations and build on our status as a premier employer in Southeastern Kansas, serving as a beneficial economic presence in our communities and with our employees.
Our History
Prior to March 3, 2004, our assets were operated as a small component of Farmland, an agricultural cooperative. Farmland filed for bankruptcy protection on May 31, 2002. Coffeyville Resources, LLC, a subsidiary of Coffeyville Group Holdings, LLC, won the bankruptcy court auction for Farmland's petroleum business and a nitrogen fertilizer plant and completed the purchase of these assets on March 3, 2004. Prior to consummation of the Acquisition, we expended significant time and money preparing for our proposed post-closing implementation of several key strategic initiatives that we believed would significantly enhance our competitive position and improve our financial and operational performance following the Acquisition. Specifically, the following initiatives were implemented:
- •
- We contracted to construct a crude pipeline which would enable us to control our crude oil supply chain from Cushing, Oklahoma, a major mid-continental hub, to Coffeyville, at no capital cost to us and at tariffs similar to or lower than we are currently paying.
- •
- We negotiated new collective bargaining agreements with the existing unions, which would enable us to improve the overall work force and reward our employees for increasing productivity and diversifying their skills.
- •
- We negotiated new agreements with respect to potential environmental liabilities with the EPA and the KDHE and obtained significant insurance coverage for certain historical and potential future liabilities.
- •
- We negotiated a long-term electric supply agreement with the City of Coffeyville.
- •
- We renegotiated a number of key supplier contracts on favorable terms.
- •
- We identified a new management team, consisting of experienced non-Farmland industry managers as well as certain key Farmland employees.
79
Following the consummation of the Acquisition, we significantly improved our coke gasifiers' performance and optimized operations at our nitrogen fertilizer plant, enabling us to be one of the top performers in our industry. We have also reduced operating costs at our refinery.
Petroleum Business
Our petroleum business includes an oil refinery in Coffeyville, Kansas, crude oil gathering system throughout Kansas, and terminalling facilities in Phillipsburg, Kansas:
- •
- Oil Refinery. Our oil refinery is located on approximately 440 acres in Southeast Kansas. It is a catalytic cracking/delayed coking refinery that processes crude oil from a broad array of sources and produces fuel products such as gasoline, diesel and propane. The oil refinery has undergone numerous expansions and upgrades over the last 10 years, with aggregate non-maintenance capital expenditures of approximately $187.0 million. The oil refinery converts its feedstock into higher value products such as gasoline, diesel, jet fuel and petrochemicals, representing approximately a 94% product yield on a crude oil basis. Other products include slurry, light cycle oil, vacuum tower bottom (VTB), reformer feeds, gas oil, petroleum coke and sulfur. All of our petroleum coke byproduct is consumed by our adjacent nitrogen fertilizer business, thus providing the fertilizer plant a superior economic value, because the coke is utilized in lieu of high priced natural gas.
- •
- Crude Oil Gathering System. We own and operate a 25,000 bpd crude oil gathering system comprised of over 300 miles of feeder and truck pipelines and 18 trucks for gathering light, sweet Kansas and Oklahoma crude oils as purchased from independent crude producers.
- •
- Phillipsburg Terminal. We own storage and terminalling facilities for asphalt and refined fuels at Phillipsburg, Kansas. The asphalt facilities are leased to third parties on a throughput basis.
Modern, Strategically-Located Midwest Refinery
Our oil refinery is one of only seven fuels refineries located in the mid-continental U.S. The strategic location of our oil refinery provides it with access to markets in our region for petroleum products, where demand for products has exceeded refining production by approximately 38% since 1997. The Seaway pipeline provides additional supply from the U.S. Gulf Coast and has excess capacity availability. Also, we are an initial subscriber in a potential pipeline project that will supply Canadian crude to the Cushing, Oklahoma distribution hub. We are not aware of any other new pipeline construction projects. Our oil refinery is capable of capturing higher margins than similar refineries outside our operating region because it does not incur the high cost of transporting refined products via pipelines to the Midwest. Because of its higher complexity, it is also capable of processing cheaper, more readily available heavier crude oil relative to less complex refineries located both within and outside our refinery region. In addition, it is uniquely positioned to benefit from the aforementioned potential crude oil pipeline connections from Canada.
On average, based on an assumed typical regional crude slate composed of 50% of West Texas Sour and 50% WTI, the oil refineries in our region (PADD II, Group 3) have generated higher crack spreads than Gulf Coast refineries by $0.83 over the last 17 years, $1.20 over the last 10 years, $1.54 over the last six years, $1.70 over the last five years and $1.93 over the last four years.
Our region typically enjoys a higher product price than the Gulf Coast due to the aforementioned supply and demand imbalance and to the tariff of $2.43 per gallon on the Explorer pipeline for transportation from the Gulf Coast to our region. Additionally, we process a broad array of crudes which are purchased at a discount to WTI. This is because our refinery's crude slate is generally heavier and less sweet (and therefore less expensive) compared to WTI. This situation is enhanced by the fact that the gasoline and heating oil prices are often higher given the different supply and demand
80
dynamics of our marketing region, PADD II, Group 3, rather than New York Harbor NYMEX. The chronic product shortage in this region, approximately 40% of demand, means that the product shortfall has to be made up by imports from the Gulf Coast, virtually all of which come into the region on the Explorer Pipeline. This line runs at capacity, and small demand spikes and/or small pipeline supply interruptions generally translate into higher product prices in the region as demand competition drives up the price of the scarce barrel.
Raw Material Supply
Our oil refinery has the capability to process a blend of heavy sour crudes and light sweet crudes. Our refinery processes crude from a broad array of sources, approximately one-third domestic and two-thirds foreign. We purchase foreign crudes originally from Latin America, South America, the Middle East, West Africa and the North Sea. We purchase domestic crudes that meet pipeline specifications from Kansas, Oklahoma, Texas, and offshore wells in the U.S. Gulf Coast.
All of our non-gathered crude is purchased through a credit intermediation agreement, which reduces our inventory position and mitigates crude pricing risks. We obtain the rest of our crude from independent producers in Kansas and northern Oklahoma through our associated 25,000 bpd gathering system. In the year ended December 31, 2004, our gathering system collected approximately 18% of our crude oil feedstock, providing a substantial cost advantage over our competitors. Given our refinery's ability to process a wide variety of crudes and ready access to multiple sources of crude, we have never had to stop production due to lack of crude access.
Generally, we select crude oil approximately 35 to 50 days in advance of the time the related refined products are to be marketed. To ensure quality of purchase, oil is tested for basic sediment and water, temperature and gravity at stock tanks.
Below is a summary of our historical inputs:
| | Year Ended December 31, | ||||||||||||
|---|---|---|---|---|---|---|---|---|---|---|---|---|---|
| (in barrels) | |||||||||||||
| 1999 | 2000 | 2001 | 2002 | 2003 | 2004 | ||||||||
| Crude oil | 32,037,813 | 31,286,728 | 30,880,860 | 27,172,830 | 31,207,718 | 33,227,971 | |||||||
| Natural gasoline | 1,223,988 | 766,228 | 694,552 | 1,093,629 | 483,362 | 317,874 | |||||||
| Normal butane | — | — | — | — | — | 530,575 | |||||||
| Isobutane | 885,080 | 924,875 | 1,142,098 | 1,037,855 | 1,627,989 | 1,615,898 | |||||||
| Vacuum tower bottom | 134,304 | 53,453 | 32,951 | 98,371 | 109,974 | 105,981 | |||||||
| Total Inputs | 34,281,185 | 33,031,284 | 32,750,461 | 29,402,685 | 33,429,043 | 35,798,299 | |||||||
We own and lease a 145,000 bpd proprietary pipeline that connects Caney, Kansas and our oil refinery. The bulk of our crude is delivered by common carrier pipelines to the Enbridge Terminal in Cushing, Oklahoma, where it is blended. The Cushing to Chicago Pipeline (CCPS) pipeline then runs from Cushing, Oklahoma to Caney, Kansas. In early 2005, a new Cushing to Coffeyville crude pipeline is expected to be completed and dedicated to Coffeyville service. The following table provides the pipelines used by the oil refinery for its inputs and its suppliers' delivery capacity:
| Delivery | Capacity (bpd) | |
|---|---|---|
| Seaway Pipeline from U.S. Gulf Coast to Cushing, Oklahoma | 350,000 | |
| CCPS Pipeline from Cushing to Caney, Kansas | 300,000 | |
| Coffeyville Crude Oil Pipeline System from Caney, Kansas to Oil Refinery | 145,000 | |
| Coffeyville Crude Oil Gathering and Trucking System | 25,000 | |
| Natural Gas Liquid (NGL) Connection from Conway, Kansas through MAPCO | 15,000 | |
| Plains Cushing to Caney, Kansas (expected in 2005) | 80,000 |
81
Petroleum Products
- •
- Gasoline. Gasoline typically accounts for approximately 50% of our refinery's production. Our oil refinery produces various grades of gasoline, ranging from 84 sub-octane regular unleaded to 91 octane premium unleaded and uses a computerized component blending system to optimize gasoline blending.
- •
- Distillates. Kerosene, diesel and off-road diesel typically account for approximately 40% of the refinery's production. The majority of the diesel fuel we produce is low-sulfur.
- •
- By-Products. Liquid by-products such as propane, slurry, light cycle oil, VTB, reformer feed and gas oils typically account for approximately 10% of the refinery's production. On the other hand, solid by- products such as coke and sulfur account for approximately 4% of production. The majority of the coke produced is supplied to the adjacent Nitrogen Fertilizer Plant for conversion to ammonia and UAN.
Our oil refinery's long-term capacity utilization has steadily improved over the years. To further enhance capacity utilization, we are constantly striving for improved crude slate flexibility, inbound NGL pipeline capacity, strategic initiatives regarding raw materials and in-process feedstock and capital investments to improve processes.
82
Oil Refinery Yields
| | Year Ended December 31, | ||||||||||||
|---|---|---|---|---|---|---|---|---|---|---|---|---|---|
| (in barrels) | |||||||||||||
| 2000 | 2001 | 2002 | 2003 | 2004 | |||||||||
| Gasoline: | |||||||||||||
| Regular unleaded | 14,783,990 | 15,118,607 | 14,071,304 | 16,531,362 | 16,703,566 | ||||||||
| Premium unleaded | 430,648 | 423,898 | 306,334 | 298,789 | 220,908 | ||||||||
| Suboctane unleaded | 673,512 | 803,590 | 754,264 | 773,831 | 797,416 | ||||||||
| Total gasoline | 15,888,150 | 16,346,095 | 15,131,902 | 17,603,982 | 17,721,890 | ||||||||
Distillate: | |||||||||||||
| Kerosene | 29,360 | 25,675 | 26,085 | 25,149 | 23,256 | ||||||||
| Jet fuel | — | 97,354 | — | — | — | ||||||||
| No. 1 distillate | 331,342 | 278,325 | 124,741 | 342,363 | 99,832 | ||||||||
| No. 2 low sulfur distillate | 6,571,959 | 6,708,536 | 6,526,883 | 7,899,132 | 8,896,701 | ||||||||
| No. 2 high sulfur distillate | 3,000,458 | 3,138,236 | 2,268,116 | 3,017,785 | 3,500,351 | ||||||||
| Diesel | 2,563,976 | 2,105,709 | 1,923,370 | 1,258,279 | 1,425,897 | ||||||||
| Total distillate | 12,497,095 | 12,353,835 | 10,869,195 | 12,542,708 | 13,946,037 | ||||||||
Liquid by-products: | |||||||||||||
| LNG (propane, butane) | 543,204 | 676,753 | 583,095 | 734,737 | 1,137,645 | ||||||||
| Slurry | 492,577 | 507,407 | 445,784 | 532,236 | 500,692 | ||||||||
| Light cycle oil sales | 201,078 | 214,504 | 84,146 | 42,571 | — | ||||||||
| VTB sales | 132,022 | 188,684 | 8,212 | 26,438 | 150,700 | ||||||||
| Reformer feed sales | 424,015 | 207,154 | — | — | 79,906 | ||||||||
| Gas oil sales | — | — | 84,673 | — | — | ||||||||
| Total liquid by-products | 1,792,896 | 1,794,502 | 1,205,910 | 1,335,982 | 1,868,943 | ||||||||
Solid by-products: | |||||||||||||
| Coke | 2,349,863 | 2,751,298 | 2,068,031 | 1,956,619 | 2,384,414 | ||||||||
| Sulfur | 84,508 | 92,918 | 74,226 | 131,137 | 88,744 | ||||||||
| Total solid by-products | 2,434,371 | 2,844,216 | 2,142,257 | 2,087,756 | 2,473,158 | ||||||||
NGL production | 86,463 | 226,159 | 52,682 | (8,539 | ) | — | |||||||
| In process change | 218,532 | (347,599 | ) | 114,945 | (120,122 | ) | (12,369 | ) | |||||
| Produced fuel | 1,527,404 | 1,369,413 | 1,268,388 | 1,489,030 | 1,636,665 | ||||||||
| Processing loss (gain) | (1,413,627 | ) | (1,836,160 | ) | (1,382,594 | ) | (1,501,754 | ) | (1,836,025 | ) | |||
| Total yields | 33,031,284 | 32,750,461 | 29,402,685 | 33,429,043 | 35,798,299 | ||||||||
83
The following table summarizes storage capacity at the oil refinery:
| Product | Capacity (barrels) | |
|---|---|---|
| Gasoline | 716,000 | |
| Distillates | 1,005,000 | |
| Intermediates | 900,000 | |
| Crude oil(1) | 1,250,000 | |
| NGL Connection to Conway, Kansas through MAPCO | 12,000 | |
| Truck Loading Rack Delivery System | 40,000 |
- (1)
- Crude oil storage consists of 730,000 barrels of refinery storage capacity and 520,000 barrels of field storage capacity.
Our storage capacity is sufficient for our current needs.
Distribution Pipelines and Product Terminals
We can distribute all of our petroleum products into the Magellan, Enterprise, Kaneb Products and Chase pipelines and we can also distribute gasoline and diesel fuel by truck. A Magellan pipeline transports products to Kansas City and other northern cities. The Kaneb Products and Chase pipelines are also accessible via Magellan and Enterprise pipelines.
Below is a detailed summary of our distribution pipelines and their capacities:
Oil Refinery Offtake
| Pipeline | Capacity (bpd) | |
|---|---|---|
| Magellan Pipeline #1 Line (from Coffeyville to northern cities via Caney, Kansas) | 24,000 | |
| Magellan Pipeline #2 Line (from Coffeyville to northern cities via Barnsdall, Oklahoma) | 95,000 | |
| Chase Pipeline (accessible via Enterprise Pipeline at El Dorado, Kansas) | 12,000 | |
| Kaneb Products Pipeline (accessible via Enterprise Pipeline at El Dorado, Kansas) | 12,000 | |
| Truck Loading Rack Delivery System | 40,000 |
Our modern, three-bay, bottom-loading fuels loading rack has been in service since July 1998 with a maximum delivery capability of 225 trucks per day or 40,000 bpd of finished gasoline and diesel fuels. The loading rack has averaged over 14,400 bpd of actual volume over the last three years. The terminal includes one spot propane facility that can load approximately 30 trucks per day. Heavy oil loading is available for truck and rail cars. Shipments of NGL products are loaded from four connections with a capacity of approximately 60 trucks per day. The daily loading rates for propane have averaged over 1,200 bpd over the last three years.
Costs for using the Magellan and Kaneb pipelines are identified in the tariffs published by each pipeline. We decide how much to ship in the pipeline; typically all production that is not sold at the Coffeyville truck terminal is shipped through these pipelines. We can control how much volume is sold through the truck terminal and there is insignificant incremental cost to selling more volume at the truck terminal.
84
The following map depicts part of the Magellan pipeline, which the oil refinery uses for the majority of its distribution:
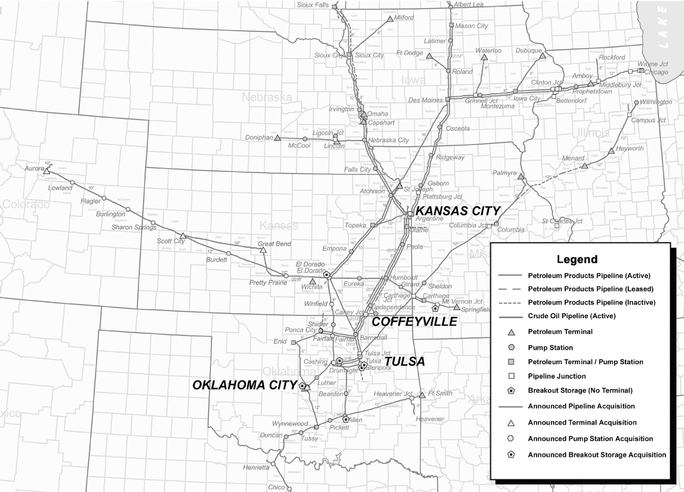
Source: Magellan Midstream Partners, L.P.
Crude Oil Gathering System
We own and operate a 25,000 bpd crude oil gathering and trucking system that feeds our refinery. This gathering system provides approximately 17% of our refinery's feedstock at a substantially lower price than other equivalent crudes. We obtain our North Central Kansas crude from a crude oil purchase agreement with National Cooperative Refinery Association (NCRA) and Oklahoma and Southeast Kansas crude from independent producers.
Our agreement with NCRA covering 46 counties in central Kansas provides us with a 33.7% share of all the crude oil NCRA gathered in those counties. Currently this makes approximately 12,000 bpd of central Kansas crude available to us for processing or resale. This agreement's initial term lasts through December 31, 2005, with an evergreen provision, unless cancelled by either party with six months prior notice. This contract provides that we will retain a pro rata share of the gathered crude in that region if and when the agreement is terminated.
We are the direct first purchaser from leases in Southeast Kansas and Northeast Oklahoma. This provides 6,500 bpd of crude to the refinery. Additional volumes, which had been lost due to the Farmland bankruptcy, are expected to return to our crude oil gathering system based on our superior service.
85
Phillipsburg Terminal
We own storage and terminalling facilities in Phillipsburg, Kansas. We lease this storage and charge for the terminalling services performed for third parties who use these facilities. The truck terminal includes three loading locations with a capacity of approximately 72 trucks per day.
Asphalt. In 2003, our terminal delivered 432,000 barrels of roofing flux and 90,000 barrels of tar to the Tamko Asphalt Products, Inc. plant adjacent to the terminal. Approximately 105,000 barrels of road asphalt moved through the terminal in 2003. Total storage capacity for asphalt is 420,000 barrels.
We have an agreement with Sinclair Oil Corporation pursuant to which Sinclair uses our asphalt terminalling facilities on a non-exclusive basis to unload and store roll saturate and roofing flux and have the products delivered offsite. We have allocated 150,000 barrels of roofing flux storage and 25,000 barrels of roll saturate storage to Sinclair. Sinclair pays us a fee of $125,000 per month, plus $200.00 for each $0.01/million Btu that the Panhandle Eastern Pipe Line Company natural gas index price exceeds $2.50. Either party may terminate the agreement with 90 days notice.
Refined Fuels. The Phillipsburg rack receives refined fuels from the Kaneb pipeline system. A new, automated, bottom loading fuels loading rack became operable in February 1999. Total throughput volumes at the Phillipsburg rack averaged 1.6 million barrels over the last two years with a capacity of up to 144 trucks per day, or approximately 27,000 bpd. Storage capacity for refined fuels at the Phillipsburg facility is approximately 380,000 barrels.
Nitrogen Fertilizer Business
We operate the largest single train UAN production facility in North America, with annual capacity of 638,000 tons per annum. Economies of scale provide significant advantages in labor, maintenance, and energy unit costs. Consequently, our plant benefits from a UAN cash conversion cost among the lowest in the industry.
Low Cost Producer
Our nitrogen fertilizer plant's gasification process uses less than 1% of the natural gas relative to other nitrogen based fertilizer facilities that are heavily dependent upon natural gas and thus heavily impacted by natural gas price swings. This is due to the fact that our fertilizer plant uses petroleum coke produced at our adjacent refinery as a raw material for our gasification process. We estimate that our plant retains its competitive advantage over Gulf Coast ammonia producers at natural gas prices in the range of $1.50 to $2.50 per million Btu and above. Our nitrogen fertilizer plant has higher operating costs but lower feedstock costs and lower capital expenditure levels. Because we use petroleum coke, our nitrogen fertilizer plant increases confidence levels of our customers that we will be a more reliable supplier and will not be subject to a production shutdown. After years of stability, natural gas prices have become more volatile and have significantly increased over the past few years, thus impacting the profitability of several U.S. nitrogen producers.
The advantage of our nitrogen fertilizer plant compared to conventional, natural gas-based U.S. Gulf Coast ammonia plants is composed of three major components: (1) significantly lower raw material costs as a result of using coke rather than natural gas as a feedstock, (2) substantial product transportation costs savings resulting from proximity to the consuming marketplace, and (3) higher product prices resulting from the upgrading of two-thirds of our ammonia production to UAN.
Strategic Location with Transportation Advantage
We believe that selling products to customers in close proximity to our UAN plant and reducing transportation costs are key to maintaining our profitability. Due to our favorable location relative to end users and high product demand relative to production volume all product shipments are targeted
86
to freight advantaged destinations located in the farm belt. The available ammonia production at our nitrogen fertilizer plant is small and easily sold into truck and rail delivery points with optimal price return to the plant. Our products leave the plant either in trucks for direct shipment to customers or in railcars for principally UP Railroad destinations. We do not incur any intermediate transfer, storage, barge freight, or pipeline freight charges. Consequently, our plant enjoys a freight advantage over U.S. Gulf Coast ammonia importers of approximately $65 per ton and over U.S. Gulf Coast UAN importers of approximately $37 per ton. Such cost differentials represent a significant portion of the market price of these commodities. For example, since the end of 2003, ammonia prices have fluctuated between $268 and $329 per ton, and UAN prices have fluctuated between $156 and $195 per ton.
High and Increasing Capacity Utilization
Our facility uses a gasification process licensed from General Electric to convert petroleum coke to high purity hydrogen for subsequent conversion to ammonia. It uses between 925 to 1,000 tons per day of petroleum coke from the refinery and another 150 to 300 tons per day from third-party sources and converts it all to 1,175 tons per day of ammonia. A portion of the ammonia is converted to 1,850 tons per day of UAN. Capacity utilization has increased steadily over the first three years of operation and was 93% for the UAN plant in calendar year 2003. The gasifier on-stream factor (a measure of how long the gasifier has been operational over a period) from the beginning of 2004 through September 2004 is above 95% when adjusted for turnaround in the third quarter of 2004.
| | Year Ended December 31, | |||||||
|---|---|---|---|---|---|---|---|---|
| | 2001 | 2002 | 2003 | 2004 | ||||
| Gasifier on-stream | 66.8% | 78.6% | 90.1% | 92.4% | ||||
| Ammonia capacity utilization (1) | 49.5% | 66.0% | 83.6% | 76.8% | ||||
| UAN capacity utilization (2) | 52.3% | 79.4% | 93.3% | 97.0% | ||||
- (1)
- Based on nameplate capacity of 1,100 tons per day.
- (2)
- Based on nameplate capacity of 1,500 tons per day.
Our nitrogen fertilizer business employs 106 people and the nitrogen fertilizer plant operates seven days per week, 24 hours per day with two twelve-hour shifts (including regular maintenance).
Raw Material Supply
Our nitrogen fertilizer facility's primary input is petroleum coke, approximately 80% of which is supplied by our adjacent oil refinery at market prices. Historically we have obtained a small amount of coke from third parties. We have had a reliable and sufficient supply of third-party coke from other Midwestern refineries at spot prices. We believe that optimization of the use of our oil refinery's coker would eliminate any need for third-party coke. If necessary, the gasifier can also operate on low grade coal, which provides an additional raw material source. There are significant supplies of low grade coal within a 60 mile radius of the plant.
The BOC Group owns, operates, and maintains the air separation plant that provides contract volumes of oxygen, nitrogen, and compressed dry air to the gasifier for a monthly fee. We provide and pay for all utilities required for operation of the air separation unit. The air separator plant has not experienced any long term operating problems. The nitrogen fertilizer plant is covered for business insurance for up to $300 million in case of any interruption in the supply of oxygen from The BOC Group. Our agreement with The BOC Group expires in 2020.
We import start-up steam for the fertilizer plant from our adjacent oil refinery, and then export steam back to the oil refinery once all units are in service. Monthly charges and credits are booked with steam valued at the gas price for the month.
87
Production
Our nitrogen fertilizer plant uses approximately 1,125 to 1,300 tons per day of petroleum coke from the oil refinery and third-party sources and converts it to 1,125 to 1,300 tons per day of ammonia. It uses a gasification process licensed from General Electric to convert the coke to high purity hydrogen for subsequent conversion to ammonia. A portion of the ammonia is converted to 1,850 tons per day of UAN.
Our fertilizer plant is based on the relocation and refurbishment of the gasification section of the Cool Water Integrated Gasification Combined Cycle Demonstration Program. The relocation and re-use of this equipment required a significant modification of the existing design with the objective of increasing throughput and increasing sulfur-handling capacity, all with the additional objective of containing the capital cost. New units were added to convert carbon monoxide to carbon dioxide and to purify the hydrogen product.
Petroleum coke is first ground and blended with water and a fluxant to form a slurry that is then pumped into the partial oxidation gasifier. The slurry is then contacted with oxygen from an air separation unit (ASU). Partial oxidation reactions take place and the synthesis gas (syngas), consisting predominantly of hydrogen and carbon monoxide, is formed. The mineral residue from the slurry is a molten slag and flows along with the syngas into a quench chamber. The syngas and slag are rapidly cooled and the syngas is separated from the slag.
Nitrogen Fertilizer Plant Process Flow Chart
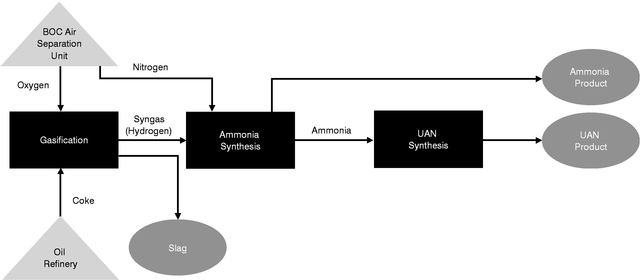
The slag becomes a by-product of the process. The syngas is scrubbed and saturated with moisture. The syngas next flows through a shift unit where the carbon monoxide in the syngas is reacted with the moisture to form hydrogen and carbon dioxide. The heat from this reaction generates saturated steam. This steam is combined with steam produced in the ammonia unit and the excess steam not consumed by the process is sent to the adjacent oil refinery.
After additional heat recovery, the high-pressure syngas is cooled and processed in the acid gas removal (AGR) unit, which operates in two stages. The first-stage selectively removes the hydrogen sulfide (H2S) to very low levels in the product syngas. The bulk of the carbon dioxide is removed from the syngas in the second stage and a portion is sent to the UAN unit for use as feed to the urea reaction. The syngas is then fed to a pressure swing absorption (PSA) unit, where the remaining impurities are extracted. The PSA reduces residual carbon monoxide and carbon dioxide levels to trace levels, and the moisture-free, high-purity hydrogen is sent directly to the ammonia synthesis loop.
88
The hydrogen is reacted with nitrogen from the ASU in the ammonia unit to form the ammonia product. A portion of the ammonia is converted to UAN. This unit is designed to produce 1,850 tons per day of UAN. The UAN plant is the largest of its kind in North America, with 638,000 tons per annum produced.
Our UAN capacity utilization has increased steadily over the first three years of operation and was 93% and 97% for the years ended December 31, 2003 and 2004, respectively, after adjusting for a recent turnaround. We expect that efficiency of the plant will improve with operator training, replacement of unreliable equipment, and reduced dependence on contract maintenance.
Our nitrogen fertilizer business' ongoing sustaining capital expenditure is projected to be modest at $2.0 million per year. We currently operate one of our two gasifier units at a time. Our UAN plant is also cycled every 10 weeks for catalyst replacement. Consequently, while the plant anticipates a turnaround every two years for the air separation plant, at an approximate cost of $1.0 million per turnaround, little work is actually done in the gasifier and UAN facilities during these turnarounds. The next scheduled turnaround is in October 2006.
Critical equipment is set up on routine maintenance schedules using our own maintenance technicians. Completion of sustaining capital projects will eliminate high maintenance equipment, reducing repair costs and increasing reliability. We have a Technical Services Agreement with General Electric who licensed the gasification technology to us. Under this agreement, General Electric experts provide technical advise and technological updates from their ongoing research as well as other licensees operating experiences.
Distribution
Ammonia and UAN are distributed by truck or by railcar. If delivered by truck, products are sold on a freight-on-board basis, and freight is normally arranged by the customer. We also own and lease a fleet of railcars. We also negotiate with distributors that have their own leased railcars to utilize these assets to deliver products. We own all of the truck and rail loading equipment at our facility. We operate two truck loading and eight rail loading racks for ammonia and UAN.
Suppliers
Petroleum Business. We obtain crude oil for our refinery from a broad array of sources. We locate crude that meet our needs and negotiate the terms of the purchase. We then use an intermediary to purchase and arrange for transport of crude that we have selected. This arrangement is structured such that we take title, and the price of the crude oil is set, when it is delivered at the crude oil tank farm adjacent to our refinery. We believe the use of a credit intermediary allows us to mitigate pricing risk and keep our inventory at a minimum. BP Oil Supply Company currently provides this credit intermediation service for us for a fee pursuant to an agreement that will expire at the end of 2005. Upon expiration, we may attempt to renegotiate our existing agreement with BP, seek a similar arrangement with another party or choose to obtain our crude supply directly without the use of a credit intermediary.
Nitrogen Fertilizer Business. The primary input in our nitrogen fertilizer plant is petroleum coke, approximately 80% of which is supplied by our adjacent oil refinery at market prices (currently $15.00 per ton). We obtain the rest of our petroleum coke supply from other Midwestern refineries at spot prices. If necessary, our gasifier can operate on low grade coal, which provides an additional raw material source.
Contract specified volumes of oxygen, nitrogen, and compressed dry air, the other raw materials for our nitrogen fertilizer business, are supplied to our gasifier for a monthly fee from an air separation plant owned, operated, and maintained by The BOC Group. We provide and pay for all utilities required for operation of the air separation unit. Our agreement with The BOC Group expires in 2020.
89
We obtain electricity for our nitrogen fertilizer plant from the City of Coffeyville at approximately 3.5 cents per kwh pursuant to an electric service agreement that expires in 2019. We import start-up steam for our nitrogen fertilizer plant from our oil refinery, and then export steam back to the oil refinery once all units are in service.
Sales and Marketing
Petroleum Business. We focus our marketing efforts on the Midwestern states of Oklahoma, Kansas, Missouri, Nebraska, and Iowa for the sale of our petroleum products because of their relative proximity to our oil refinery and their pipeline access. Our refinery produces approximately 100,000 bpd of gasoline and distillates, which we estimate was approximately 10% of the market demand for gasoline and distillates in our target states in 2004.
Nitrogen Fertilizer Business. The primary geographic markets for our fertilizer products are Kansas, Missouri, Nebraska, Iowa, Illinois, and Texas. We market our ammonia products to industrial and agricultural customers and our UAN products to agricultural customers. The direct application agricultural demand from our nitrogen fertilizer plant occurs in three main use periods. The summer wheat pre-plant occurs in August and September. The fall pre-plant occurs in late October and November. The largest ammonia demand occurs in the spring pre-plant period, from March through May. There are also small fill volumes that move in the off-season to fill the available storage at the dealer level.
We currently sell approximately 30% of our agricultural products through Agriliance, LLC, a farm cooperative system which resells our products to retailers. We are currently aggressively pursuing sales directly to retail customers. For example, we have two salesmen working in our target geographic market to develop business directly with fertilizer dealers. We market our agricultural products to destinations that produce the best margins for our business. These markets are primarily located on the UP railroad. We are also aggressively pursuing the truck business, by targeting customers that have lower cost rail freight or can be supplied by truck. By securing this business directly, we reduce our dependence on distributors serving the same customer base, which will enable us to capture a larger margin and allow us to better control our product distribution. In the first half of 2004, we added two members to our sales staff who have a combined 30 years of experience in the trade to assist in the sales process. Most of our agricultural sales are made on a competitive spot basis. We also offer products on a prepay basis for in-season demand. The heavy in-season demand periods are spring and fall in the corn belt and summer in the wheat belt. Some of our industrial sales are spot sales, but most are on annual or multiyear contracts. Industrial demand for ammonia provides ratable sales and allows us to better manage inventory control and generate consistent cash flow.
Customers
Petroleum Business. Customers for our petroleum products include refiners, convenience store companies, railroads and farm cooperatives. We have bulk term contracts in place with most of these customers, which typically extend from a few months to one year in length. Our sales to these customers are typically in the 10,000 to 60,000 barrel range (420,000 to 2,250,000 gallons) and are delivered by pipeline. We enter into these types of contracts in order to lock in a committed volume at market prices to ensure an outlet for our refinery production. For the year ended December 31, 2004, CHS Inc., QuikTrip Corporation, GROWMARK, Inc., and Conoco Phillips accounted for 18%, 17%, 15% and 10% of our petroleum business sales, respectively. We sell bulk products on industry market related indexes such as Platt's or NYMEX related Group Market (Midwest) prices.
Our longer term, target customers include truck rack customers such as convenience store companies, petroleum jobbers, truck stops, industrial and commercial end users, railroads, and farm cooperatives that buy in truckload quantities. We will sell truck terminal deliveries at rack prices, based on competitor prices and spot market prices. Rack prices are typically higher than bulk contract prices.
90
To maximize profits, our marketing staff is closely coordinated with our production and crude purchasing staff. The feedstock purchases and the refining process are optimized to produce outputs that respond to seasonal market demand.
Nitrogen Fertilizer Business. We sell ammonia to agricultural and industrial customers. We sell approximately 76% of the ammonia we produce to agricultural customers, such as farmers in the mid-continental area between North Texas and Canada, and approximately 30% to industrial customers. Our agricultural customers include distributors such as Missouri Farmers Association, United Suppliers, Inc., Brandt Consolidated Inc., Interchem, GROWMARK, Inc., Royster-Clark, Inc., Mid West Fertilizer Inc., DeBruce Grain, Inc., and Agriliance, LLC. Our industrial customers include Tessenderlo Kerley, Inc., Lyondell Chemical Company, Huntsman LLC, and Truth Industries Inc. We sell UAN products to retailers and distributors. For the year ended December 31, 2004, our top five ammonia customers represented 67.3% of our ammonia sales, and our top five UAN customers represented 48.4% of our UAN sales. During that period, Brandt Consolidated Inc. and Missouri Farmers Association accounted for 24.7% and 13.3% of our ammonia sales, respectively, and Agriliance and ConAgra Foods, Inc. accounted for 23.8% and 6.3% of our UAN sales, respectively.
Competition
We compete in markets that are intensely competitive and rapidly evolving. We have experienced and expect to continue to experience intense competition from current and potential competitors, many of which have significantly greater financial and other resources.
Petroleum Business. Our oil refinery is located in Coffeyville, Kansas and ranks third in processing capacity and fifth in refinery complexity among the seven mid-continent fuels refineries. The following table presents certain information about us and the six other major mid-continent fuel oil refineries with which we compete:
| Company | Location | Crude Capacity (barrels per calendar day) | Nelson Complexity Index | ||||
|---|---|---|---|---|---|---|---|
| ConocoPhillips | Ponca City, OK | 194,000 | 11.6 | ||||
| Frontier Oil | El Dorado, KS | 110,000 | 12.9 | ||||
| Coffeyville | Coffeyville, KS | 100,000 | (1) | 9.7 | |||
| Valero | Ardmore, OK | 85,000 | 10.3 | ||||
| NCRA | McPherson, KS | 79,000 | 12.3 | ||||
| Gary Williams Energy | Wynnewood, OK | 53,000 | 8.1 | ||||
| Sinclair | Tulsa, OK | 50,000 | 7.5 | ||||
| Mid-continent Total: | 671,000 | ||||||
- (1)
- While the Coffeyville refinery has crude oil distillation capacity of 120,000 barrels per day we have a run rate capacity of 100,000 barrels per day, as presented above.
Source: Turner, Mason & Company. A Sunoco refinery located in Tulsa, Oklahoma was excluded from this table because it is not a stand-alone fuels refinery.
The principal competitive factors affecting our refining operations are costs of crude oil and other feedstock costs, refinery complexity, refinery efficiency, refinery product mix and product distribution and transportation costs. In the mid-continent region, ConocoPhillips has the only materially larger refinery and as a result, may have lower per barrel costs or higher margins per barrel of throughput than we do. We believe the location of our refinery provides us with a secure supply of crude oil and a transportation cost advantage over some of our competitors since pipeline tariffs to certain terminals in Missouri, Kansas and Iowa are substantially lower than those to which some of our competitors are subject. We also believe that our marketing costs are significantly below those of our branded competitors.
91
Our primary unbranded competitor is Flint Hill Resources, LP. The main competitive advantage of its Gulf coast refinery is the economies of scale resulting from the operation of a large refinery. The main competitive advantage of its Minneapolis refinery is its proximity to customers and suppliers in that region. Our other competitors include trading companies such as Seminole, Western, Center Oil and Transmontigne. In addition to competing refineries located in the mid-continental U.S., our oil refinery also competes with other refineries located outside the region that are linked to the mid-continent market through an extensive product pipeline system. These competitors include refineries located near the U.S. Gulf Coast and the Texas Panhandle region.
Our oil refinery's competitors also include branded, integrated and independent oil refining companies such as BP, Shell/Texaco, ConocoPhillips, Valero and Citgo, whose strengths are their size and access to capital. Their branded stations give them a stable outlet for refinery production. We believe their weaknesses include their lack of mobility due to size and branded marketing structure. The branded strategy requires more working capital and a much more expensive marketing organization.
Nitrogen Fertilizer Business. Competition in the nitrogen fertilizer industry is dominated by price considerations. However, during the spring and fall application seasons, farming activities intensify and delivery capacity is a significant competitive factor. We invest capital in our distribution assets and make a seasonal investment in inventory to enhance our manufacturing and distribution operations.
Domestic competition, mainly from regional cooperatives and integrated multinational fertilizer companies, is intense due to customers' sophisticated buying tendencies and production strategies that focus on cost and service. Also, foreign competition exists from producers of fertilizer products manufactured in countries with lower cost natural gas supplies (the principal raw material in nitrogen-based plant foods). In certain cases, foreign producers of fertilizer who export to the U.S. may be subsidized by their respective governments. Our major competitors include Koch Nitrogen, Terra and CF Industries, among others.
Our nitrogen fertilizer plant's main competition in ammonia marketing are Koch's plants at Beatrice, Nebraska, Dodge City, Kansas and Enid, Oklahoma, as well as Terra's plants in Verdigris and Woodward, Oklahoma and Port Neal, Iowa.
Based on Fertecon and Blue Johnson research, our UAN production represents approximately 5.6% of the total U.S. demand. We estimate our market share in our primary geographic markets to be between 5% and 15%. The net ammonia produced and marketed at Coffeyville represents less than 1% of the total U.S. demand. Market share in the target states is projected to be less than 5%.
Environmental Matters
We and our business and operations, as can be expected in our industry, are subject to extensive and frequently changing federal, state and local laws and regulations relating to the protection of the environment. These laws, their underlying regulatory requirements and the enforcement thereof, some of which are described below, impact our business and operations by imposing:
- •
- restrictions on operations and/or the need to install enhanced or additional controls;
- •
- the need to obtain and comply with permits and authorizations;
- •
- liability for exceeding applicable permit limits or legal requirements, in certain cases for the remediation of contaminated soil and groundwater at our facilities, contiguous and adjacent properties and other properties owned and/or operated by third parties; and
- •
- specifications for the products we market, primarily gasoline, diesel fuel, UAN and ammonia.
92
The petroleum refining industry is subject to frequent public scrutiny and governmental investigation of its environmental compliance. As a result, the laws and regulations to which we are subject are often new and constantly evolving and many of them have become more stringent or become subject to more stringent interpretation or enforcement. The ultimate impact of complying with existing laws and regulations is not always clearly known or determinable due in part to the fact that our operations may change over time and certain implementing regulations for laws such as the Resource Conservation and Recovery Act (RCRA) and the Clean Air Act have not yet been finalized, are under governmental or judicial review or are being revised. These regulations and other new air and water quality standards and stricter fuel regulations could result in increased capital, operating and compliance costs.
When we acquired the refinery, we entered into a Consent Decree with EPA and KDHE to address unresolved allegations of Clean Air Act violations by Farmland Industries, Inc. at the refinery and to investigate the refinery's current compliance with other standards in order to reduce environmental risks and liabilities going forward.
When we acquired the fertilizer plant, we agreed to undertake a voluntary federal and state air permitting compliance audit. EPA and KDHE agreed not to seek civil penalties if we disclosed and corrected any discovered noncompliance in accordance with their policies. The audit has been completed and we are in the process of correcting noncompliance that was discovered. We cannot be certain that additional controls will not have to be installed in order to return the fertilizer plant to compliance. We also cannot be certain that each and every instance of noncompliance has been detected by the audit or will be covered by the agencies' audit policies so that no liability would result from the audit.
Prior to our acquisition of the fertilizer plant and continuing into our ownership, the facility experienced an equipment failure that resulted in air releases of ammonia into the environment. We replaced the equipment in August 2004 and have reported the excess emissions of ammonia to EPA and KDHE under the audit described above and to other appropriate reporting agencies. The new equipment continues to experience operational difficulties, which have caused additional ammonia emissions. We cannot assure you that additional equipment, repairs to existing equipment or changes to operations will not be required in order to address the ammonia emissions. We also cannot assure you that government enforcement or third-party claims will not result from the excess ammonia emissions and ongoing operational difficulties continuing to be experienced at the fertilizer plant. Additional equipment, repairs to existing equipment, changes to current operations, government enforcement or third-party claims could result in significant expenditures by Coffeyville Resources.
At the present time, we believe that we have obtained or are in the process of obtaining all required material environmental permits for the operation of the facilities. We expect to renew our current permits in the ordinary course of business on or before the date of their expiration and the costs and difficulty of securing the renewals are not expected to be material. The refinery is required to apply for a Title V operating air permit pursuant to the pre-closing Consent Decree, but is currently authorized to operate under the air permit "application shield." The fertilizer plant has agreed to file a new Title V operating air permit application because the voluntary fertilizer plant audit (described in more detail below) revealed that the fertilizer plant should be permitted as a "major source" of certain air pollutants. In the meantime, the fertilizer plant is operating under the "application shield," the current construction permits and the protections of the federal and state audit policies. We do not anticipate significant cost or difficulty in obtaining these permits. However, in the event that the EPA or KDHE determines that additional controls are required, we may incur significant expenditures to comply. With the exception of the refinery and fertilizer plant air permits, which have been or are being addressed through the Consent Decree (for the refinery) or the audit (for the fertilizer plant) as described above, we are in substantial compliance with existing permits.
93
The principal environmental risks associated with our operations are air emissions, releases of hazardous substances into the environment, and the treatment and discharge of wastewater. The legislative and regulatory programs that affect these areas are outlined below.
The Clean Air Act
The Clean Air Act and its underlying regulations as well as the corresponding state laws and regulations that regulate emissions of pollutants into the air affect our operations both directly and indirectly. Direct impacts may occur through Clean Air Act permitting requirements and/or emission control requirements relating to specific air pollutants. The Clean Air Act indirectly affects our operations by extensively regulating the air emissions of sulfur dioxide, volatile organic compounds, nitrogen oxides and other compounds including those emitted by mobile sources, which are direct or indirect users of our products.
The Clean Air Act imposes stringent limits on air emissions, establishes a federally mandated permit program and authorizes civil and criminal sanctions and injunctions for any failure to comply. The Clean Air Act also establishes National Ambient Air Quality Standards (NAAQS) that states must attain. If a state cannot attain the NAAQS (i.e., is in nonattainment) the state will be required to reduce air emissions to bring the state into attainment. A geographic area's attainment status is based on the severity of air pollution. A change in the attainment status in the area where our facilities are located could necessitate the installation of additional controls.
There have been numerous other recently promulgated National Emission Standards for Hazardous Air Pollutants (NESHAP or MACT), including, but not limited to, the Organic Liquid Distribution MACT, the Miscellaneous Organic NESHAP, Gasoline Distribution Facilities MACT, Reciprocating Internal Combustion Engines MACT, Asphalt Processing MACT, Commercial and Institutional Boilers and Process Heaters standards (Heater/Boiler MACT). Some or all of these MACT standards may require the installation of controls or changes to our operations in order to comply. If we are required to install controls or change our operations, the costs could be significant. These new requirements, other requirements of the federal Clean Air Act, or other presently existing or future environmental regulations could cause us to expend substantial amounts to comply and/or permit our refinery to produce products that meet applicable requirements.
Air Emissions. The regulation of the air emissions under the Clean Air Act requires us to obtain various operating permits and to incur capital expenditures for the installation of certain air pollution control devices at our refinery. Various regulations specific to or that directly impact our industry have been implemented, including regulations that seek to reduce emissions from refineries' flare systems, sulfur plants, large heaters and boilers, fugitive emission sources and wastewater treatment systems. Some of the applicable programs are the Benzene Waste Oil NESHAP, New Source Performance Standards, New Source Review, and Leak Detection and Repair. We have incurred, and expect to continue to incur, substantial capital expenditures to maintain compliance with these and other air emission regulations.
The EPA recently embarked on a Petroleum Refining Initiative (Initiative) alleging industry-wide noncompliance with four "marquee" issues—New Source Review, flaring, leak detection and repair, and the Benzene Waste Oil NESHAP. The Initiative has resulted in many refiners entering into consent decrees imposing civil penalties and requiring substantial expenditures for additional or enhanced pollution control. At this time, we do not know how or if the Initiative will affect us. However, in March 2004, we entered into a Consent Decree with the EPA and the KDHE to resolve air compliance concerns raised by the EPA and KDHE related to Farmland's prior operations of our oil refinery. The Consent Decree covers some, but not all of the Initiative's marquee issues.
Under the Consent Decree, we will install controls on certain process equipment and make certain operational changes at the refinery. As a result of our agreement to install certain controls and
94
implement certain operational changes, we have avoided civil penalties, received a broad release from the EPA and KDHE related to Farmland's alleged noncompliance and have until 2010 to install the controls and make the operational changes. Pursuant to the Consent Decree, as an interim measure, we will increase sulfur dioxide—reducing catalyst additives to the fluid catalytic cracking unit at the facility to reduce emissions of sulfur dioxide. We also will install controls to minimize sulfur dioxide emissions in the long-term. In addition, we will undertake an investigation to verify the facility's compliance with the Benzene Waste Oil NESHAP. Depending upon the results of that investigation, we may need to install additional controls on the facility's wastewater treatment system. In addition, the Consent Decree contains our agreement to assume certain cleanup obligations at the refinery. There are other permitting, monitoring, recordkeeping and reporting requirements associated with the Consent Decree. The overall cost of complying with the Consent Decree is expected to be approximately $25 to $30 million, of which approximately $17 million is expected to be capital expenditures and which does not include the cleanup obligations. No penalties are expected to be imposed as a result of the Consent Decree.
Fertilizer Plant Audit. We conducted an air permitting compliance audit of our fertilizer plant pursuant to agreements with EPA and KDHE immediately after the closing. The audit revealed that the fertilizer plant was not properly permitted under the Clean Air Act and its implementing regulations and the Kansas environmental statutes and regulations. As a result, the fertilizer plant is performing air modeling to demonstrate the current emissions from the facility are in compliance with local air quality standards, that the air pollution controls that are in place are the controls that are required to be in place. In the event that the EPA or KDHE determines that additional controls are required, we may incur significant expenditures to comply. At the end of this process, we will submit a new permit application. The audit also revealed that the fertilizer plant was experiencing ongoing, unpermitted emissions of ammonia resulting from equipment failures. Finally, the audit also revealed recordkeeping and reporting violations that have been corrected and will continue to be corrected until a new air permit application is submitted. We are in the process of correcting these issues.
Air Permitting. The petroleum refinery is a "major source" of air emissions under the Title V permitting program of the federal Clean Air Act. It is expected that a final Class I (major source) operating permit will be issued for our oil refinery in 2005 or 2006. Prior to the issuance of the final Class I (major source) operating permit, pursuant to the terms of the March 2004 Consent Decree, we will operate our oil refinery pursuant to the terms of the permit application shield and certain operating restrictions agreed to in the Consent Decree. The permit application shield provides an exception to the general Clean Air Act rule that no facility that is covered by the Title V program may operate without a permit. Under the permit application shield, a facility may continue to operate while the permitting authority is reviewing a timely filed and conforming permit application. Under our permit application and the Consent Decree, throughput at the refinery is limited to 115,000 bpd of crude per stream day or 112,000 barrels per calendar day. We have undertaken an air permitting compliance audit at the nitrogen fertilizer plant and will be submitting a new Title V operating permit application to KDHE to correct discrepancies in permits previously issued to Farmland. We believe that a final Class I (major source) operating permit also will be issued for our nitrogen fertilizer plant in 2005 or 2006. Prior to the issuance of that permit, we will operate the nitrogen fertilizer plant under the application shield and the existing construction permits.
The Phillipsburg Terminal was issued its final Class I operating permit in 2004.
Our Crude Transportation company holds the necessary Clean Air Act permits for its storage tank facilities at the various pipeline terminal and station locations.
95
Release Reporting
The release of hazardous substances or extremely hazardous substances into the environment is subject to release reporting under federal and state environmental laws. In addition, releases of hazardous substances and extremely hazardous substances into the environment can violate environmental permits. Our operations periodically experience releases of hazardous substance and extremely hazardous substances that could cause us to become the subject of a government enforcement action or third party claims.
Fuel Regulations
Tier II, Low Sulfur Fuels. The Clean Air Act may authorize the EPA to require modifications in the formulation of the refined transportation fuel products we manufacture in order to limit the emissions associated with their final use. The EPA believes such limits are necessary to protect new automobile emission control systems that may be inhibited by sulfur in the fuel. For example, in February 2000, EPA promulgated the Tier II Motor Vehicle Emission Standards Final Rule for all passenger vehicles, establishing standards for sulfur content in gasoline. These regulations mandate that the sulfur content of gasoline at any refinery shall not exceed 30 ppm during any calendar year beginning January 1, 2006. These requirements began being phased in during 2004. In addition, in January 2001, EPA promulgated its on-road diesel regulations, which will require a 97% reduction in the sulfur content of diesel sold for highway use by June 1, 2006, with full compliance by January 1, 2010. EPA adopted a rule for off-road diesel in May 2004. The off-road diesel regulations will generally require a 97% reduction in the sulfur content of diesel sold for off-road use by June 1, 2010.
Modifications will be required at our refinery as a result of the Tier II gasoline and low sulfur diesel standards. Depending upon the compliance strategy we adopt to comply with the off-road diesel rules, we estimate that our capital expenditures required to comply with the diesel standards will range between $75 to $85 million over the next two years. Based on our preliminary estimates, we believe that compliance with the Tier II gasoline standards will require us to spend approximately $35 million between 2008 and 2010. We have been granted an extension of time to comply with the gasoline and on-road diesel rules by EPA, with which we expect to be able to comply.
MTBE. The EPA requires gasoline to contain a specified amount of oxygen in certain regions that exceed the National Ambient Air Quality Standards for either ozone or carbon monoxide. This oxygen requirement may be satisfied by adding to gasoline one of many oxygen containing materials including, among others, MTBE. We are aware of a growing public concern regarding possible groundwater contamination resulting from the use of MTBE as a source of required oxygen in gasoline. To the best of our knowledge, neither Coffeyville Resources nor our predecessor, Farmland, used MTBE in our petroleum products. We cannot make any guarantee as to whether MTBE was added to our petroleum products after those products left our facilities or whether MTBE containing products were distributed through our pipelines.
The Clean Water Act
The federal Clean Water Act of 1972 affects our operations by regulating the treatment of wastewater and imposing restrictions on effluent discharge into, or impacting, navigable water. Regular monitoring, reporting requirements and performance standards are preconditions for the issuance and renewal of permits governing the discharge of pollutants into water. We maintain numerous discharge permits as required under the National Pollutant Discharge Elimination System program of the Clean Water Act and have implemented internal programs to oversee our compliance efforts.
All of our facilities are subject to Spill Prevention, Control and Countermeasures (SPCC) requirements under the Clean Water Act. The SPCC rules were modified in 2002 with the
96
modifications to go into effect in 2004. In 2004, certain requirements of the rule were extended. Changes may be required to comply with the modified SPCC rule.
In addition, we are regulated under the Oil Pollution Act, which amended the Clean Water Act. Among other requirements, the Oil Pollution Act requires the owner or operator of a tank vessel or facility to maintain an emergency oil response plan to respond to releases of oil or hazardous substances. We have developed and implemented such a plan for each of our facilities covered by the Oil Pollution Act. Also, in case of such releases, the Oil Pollution Act requires responsible parties to pay the resulting removal costs and damages, provides for substantial civil penalties, and authorizes the imposition of criminal and civil sanctions for violations. States where we have operations have similar laws to the Oil Pollution Act. As a result of our operations, spills of oil and other hazardous substances could occur at our facilities.
Wastewater Management. We have a wastewater treatment plant at our refinery permitted to handle an average flow of 2.2 million gallons per day. The facility uses a complete mix activated sludge (CMAS) system with three CMAS basins. The plant operates pursuant to a KDHE permit. We are also implementing a comprehensive spill response plan in accordance with the EPA rules and guidance.
Ongoing fuels terminal and asphalt plant operations at Phillipsburg generate only limited wastewater flows (e.g., boiler blowdown, asphalt loading rack condensate, groundwater treatment). These flows are handled in a treatment plant that includes a primary clarifier, aerated secondary clarifier, and a final clarifier to a lagoon system. The plant operates pursuant to a KDHE Water Pollution Control Permit. To control facility runoff, management implements a comprehensive Spill Response Plan. Phillipsburg also has a timely and current application on file with the KDHE for a separate storm water control permit.
Resource Conservation and Recovery Act (RCRA)
Our operations are subject to RCRA requirements for the treatment, storage and disposal of hazardous wastes. When feasible, RCRA materials are recycled instead of being disposed of on-site or off-site. RCRA establishes standards for the management of solid and hazardous wastes. Besides governing current waste disposal practices, RCRA also addresses the environmental effects of certain past waste disposal operations, the recycling of wastes and the regulation of underground storage tanks containing regulated substances. In addition, new laws are being enacted and regulations are being adopted by various regulatory agencies on a continuing basis, and the costs of compliance with these new rules can only be broadly appraised until their implementation becomes more accurately defined.
Waste management. The Phillipsburg Terminal is a small quantity hazardous waste generator, mostly for parts washing wastes from terminal operations currently serviced by a licensed hazardous waste disposal company. No active hazardous waste treatment or disposal is carried on at the facility, although one closed interim status hazardous waste landfarm located at Phillipsburg is under long term post closure care.
Our refining operation is considered a large quantity generator, which manages its wastes in accordance with RCRA and applicable state laws, including use of a licensed hazardous waste transporter and approved off-site disposal facility. There are two closed hazardous waste units at the refinery and eight other hazardous waste units in the process of being closed pending state agency approval.
We have set aside approximately $3 million in financial assurance for closure/post-closure care for hazardous waste management units at the Phillipsburg Terminal and the Coffeyville Refinery.
The Plainville Pipeline station is also a small quantity hazardous waste generator and is currently serviced by a licensed hazardous waste disposal company. No active hazardous waste treatment or disposal is carried on at this facility.
97
Impacts of Past Manufacturing. We are subject to an administrative order from 1994 related to investigation of possible past releases of hazardous materials to the environment at Coffeyville. In accordance with the order, we have documented existing soil and ground water conditions, which require investigation or remediation projects. Phillipsburg is subject to an administrative order from 1996 related to investigation of possible past releases of hazardous materials to the environment at the Phillipsburg facility, which operated as a refinery until 1991.
The anticipated remediation costs through 2010 were estimated, as of March 3, 2004, to be as follows:
| Facility | Site Investigation Costs | Capital Costs | Total O&M Costs Through 2010 | Total Estimated Costs Through 2010 | |||||||||
|---|---|---|---|---|---|---|---|---|---|---|---|---|---|
| Coffeyville Oil Refinery | $ | 159,756 | $ | 4,264,726 | $ | 1,694,896 | $ | 6,119,381 | |||||
| Phillipsburg Terminal | 125,067 | 3,376,924 | 2,041,187 | 5,543,181 | |||||||||
| Total Estimated Costs: | $ | 284,823 | $ | 7,641,650 | $ | 3,736,082 | $ | 11,662,562 | |||||
These estimates are based on current information and could go up or down as additional information becomes available through our ongoing remediation and investigation activities. At this point, we have estimated, that over ten years, it will spend between $10 and $15 million to remedy impacts from past manufacturing activity at its Coffeyville facilities and to address existing soil and groundwater contamination at Phillipsburg. It is possible that additional costs will be required after this ten year period.
Environmental Insurance. We have extensive cost cap ($25 million limit for costs of remediation exceeding $16 million) insurance for the remediation program in addition to pollution legal liability ($50 million limit with $1 million deductible) insurance for third party claims as a result of unknown and/or known existing and future pollution and environmental business interruption insurance ($25 million limit and a 10 day waiting period) for a total prepaid cost of insurance of approximately $4.5 million for coverage under the terms of the policies. Each of these policies contains substantial exclusions; as such, we cannot guarantee coverage for all or any particular liabilities.
Following is a summary of our environmental insurance coverage:
| Coverage | Limit | Retention | |||
|---|---|---|---|---|---|
| | (dollars in millions) | ||||
| Pollution Liability | $ | 50 | $1 | ||
| Cost Cap / Remediation | 25 | 16 | |||
| Business Interruption | 25 | 10 Days | |||
| Terrorism | 10 | 1 | |||
| Financial Assurance | 4/8 | (1) | — | ||
- (1)
- Represents a $4.0 million limit per pollution incident and an $8.0 million limit in the aggregate.
Financial Assurance. We are required in the Consent Decree to establish $15 million in financial assurance. In accordance with the Consent Decree, this financial assurance is currently provided by a bond posted by the previous owner, Farmland. Ultimately, we will replace the financial assurance currently provided by Farmland. At this point, it is not clear what the amount of financial assurance will be when replaced, although it may be significant, or over what time period it will be replaced. The form of this financial assurance that will be required by EPA and the state (cash, letter of credit, financial test, etc.) has not been determined.
98
Environmental Remediation
Under the Comprehensive Environmental Response, Compensation and Liability Act (CERCLA), RCRA, and related state laws, certain persons may be liable for the release or threatened release of hazardous substances. These persons include the current owner or operator of property where the release or threatened release occurred, any persons who owned or operated the property when the release occurred, and any persons who arranged for the disposal of hazardous substances at the property. Liability under CERCLA is strict, retroactive and joint and several, so that any responsible party may be held liable for the entire cost of investigating and remediating the release of hazardous substances. The liability of a party is determined by the cost of investigation and remediation, the portion of the hazardous substance(s) the party contributed, the number of solvent potentially responsible parties, and other factors.
As is the case with all companies engaged in similar industries, we face potential exposure from future claims and lawsuits involving environmental matters. The matters include soil and water contamination, personal injury and property damage allegedly caused by substances which we, or potentially Farmland, manufactured, handled, used, stored, transported, spilled, released or disposed of. We cannot assure you that we will not become involved in future proceedings related to our release of hazardous or extremely hazardous substances or that, if we were held responsible for damages in any existing or future proceedings, such costs would be covered by insurance or would not be material.
Additional Environmental Compliance Matters
Pipeline and Gathering System. Our pipeline operations management has implemented comprehensive spill planning in accordance with EPA and US Department of Transportation regulations and has registered the operations with the local emergency planning commissions. Compliance implementation is handled on a decentralized basis from the Bartlesville and Plainville Pipeline offices with support and oversight from our corporate environmental services office.
Compliance Management Systems. We implement environmental compliance locally. Our corporate environmental services office provides technical assistance and oversight. In order to ensure consistent compliance with established environmental compliance programs, we operate in compliance with the our corporate Environmental Management System (EMS). Our EMS is designed to ensure ongoing and consistent compliance with applicable environmental regulatory requirements and is embodied in policies issued by our board of directors and through mandatory operating procedures adopted by senior management. Despite our efforts to achieve excellence in our compliance, we cannot assure you that there will not be violations of applicable environmental requirements.
Environmental Outlook
We have incurred and will continue to incur substantial capital, operating and maintenance, and remediation expenditures as a result of environmental laws and regulations. To the extent additional unforeseen expenditures are not ultimately reflected in the prices of the products and services we offer, our operating results will be adversely affected. We believe that substantially all of our competitors are subject to similar environmental laws and regulations. However, the specific impact on each competitor may vary depending on a number of factors, including the age and location of its operating facilities, marketing areas, production processes and whether or not it is engaged in the petrochemical business or the marine transportation of crude oil or refined products.
99
Employees
As of December 31, 2004, we had a total of 442 employees, of which 315 were employed in our petroleum business and 106 were employed by our nitrogen fertilizer business. The remaining 21 employees were employed at our corporate headquarters.
We entered into collective bargaining agreements with the Metal Trades Union and the Paper, Allied-Industrial, Chemical Workers International Union which expire in March 2009. Approximately 44% of our total workforce is unionized. We believe that our relationship with our employees is excellent.
Properties
Our executive offices are located at 10 East Cambridge Circle in Kansas City, Kansas. We lease 11,400 square feet at that location for $11,875 per month. Our lease obligation will increase to a maximum of $14,345 per month during the last year of our five-year lease term which expires on March 31, 2009. The following table contains certain information regarding our other principal properties:
| Location | Acres | Own/Lease | Use | |||
|---|---|---|---|---|---|---|
| Coffeyville, KS | 440 | Own | Oil refinery, nitrogen plant and office buildings | |||
Phillipsburg, KS | 120 | Own | Terminal facility | |||
Montgomery County, KS (Coffeyville Station) | 20 | Own | Crude oil storage | |||
Montgomery County, KS (Tyro Station) | 20 | Own | Crude oil storage | |||
Bartlesville, OK | 75 | Own | Truck storage and office buildings our gathering system | |||
Winfield, KS | 75 | Own | Truck storage |
We expect that our current owned and leased facilities will be sufficient for our needs over the next 12 months.
Safety and Health Matters
We believe that we have established a history of outstanding safety performance. We operate a strong and comprehensive safety program, involving active participation of employees at all levels of the organization. We measure our success in this area primarily through the use of injury frequency rates administered by the Occupational Safety and Health Administration (OSHA). Our oil refinery has seen a 50% improvement in fewer OSHA lost time accidents and a 60% reduction in OSHA recordable incidents during the past three years. The recordable injury rate reflects the number of recordable incidents per 200,000 hours worked, and for the year ended December 31, 2004, we had a recordable injury rate of 3.2 in our petroleum business and 4.89 in our nitrogen fertilizer business. Despite our efforts to achieve excellence in our safety and health performance, we cannot assure you that there will not be accidents resulting in injuries or even fatalities.
Process Safety Management. We have implemented a Process Safety Management program. This program is designed to address all facets associated with OSHA guidelines for developing and maintaining a Process Safety Management program.
100
We may be required to investigate and implement improvements at the refinery's alkylation unit, underground process piping and emergency isolation valves for control of process flows. We currently estimate the costs for implementing any recommended improvements to be between $2 and $3 million over a period of four years. These improvements, if warranted, would be intended to reduce the risk of releases, spills, discharges, leaks, accidents, fires or other events and minimize the potential effects thereof. We may also be required to assess the potential impacts on building occupancy caused by the location and design of our refinery and fertilizer plant control rooms and operator shelters. In the event that improvements are warranted, we expect the costs to upgrade or relocate these areas would be between $4 and $5 million over two to five years.
Emergency Planning and Response. We have an emergency response plan that describes the organization, responsibilities and plans for responding to emergencies. This plan is communicated to local regulatory and community groups. We have on-site warning siren systems and personal radios.
Legal Proceedings
We are, and will continue to be, subject to litigation from time to time in the ordinary course of our business, including matters such as those described above under "—Environmental Matters." We are not party to any pending legal proceedings that we believe will have a material impact on our business.
In February 2005, we received two letters on behalf of GAF Holdings LLC (GAF) related to GAF's attempted acquisition of the assets we acquired from Farmland in the Acquisition. In these letters, GAF threatened to institute proceedings against us and certain of our affiliates to seek damages for unspecified acts that allegedly deprived GAF of the opportunity to acquire our business. On February 7, 2005, we commenced an adversary proceeding in the United States Bankruptcy Court for the Western District of Missouri against GAF seeking declaratory and injunctive relief preventing the defendants from commencing any action seeking damages or any other relief based on claims arising from our purchase of the Coffeyville assets from Farmland. The bankruptcy court denied our motion for a temporary restraining order and dismissed our complaint on grounds that the controversy was not ripe for adjudication. We believe that any claims brought against us or our affiliates by GAF would be without any merit and we intend to vigorously contest any such claims if and when they are asserted.
In December 2004, The BOC Group sued Coffeyville Resources, LLC in the District Court of Johnson County, Kansas, in connection with a dispute under our On-Site Product Supply Agreement (the supply agreement) with The BOC Group regarding excess electrical usage by The BOC Group and payments withheld by us in connection therewith. Pursuant to the supply agreement, which expires in 2020, we pay approximately $300,000 per month for the supply of oxygen and nitrogen to our fertilizer plant. This lawsuit is in the very early stages of discovery. If we are unsuccessful in our defense of the suit, our operating expenses could increase by approximately $800,000 per year for the remaining 15 years of the supply agreement. We intend to vigorously defend against this claim and anticipate that resolution of the suit could take approximately two years.
101
Executive Officers and Directors
Our executive officers and directors and their ages and positions as of March 31, 2005 are as follows:
| Name | Age | Position | ||
|---|---|---|---|---|
| Philip L. Rinaldi | 58 | Chief Executive Officer and Director | ||
| Abraham H. Kaplan | 68 | Chief Commercial Officer, Refining and Marketing | ||
| George W. Dorsey | 55 | Chief Development Officer, Nitrogen Fertilizer Plant | ||
| Stanley A. Riemann | 53 | Chief Operating Officer and Director | ||
| James T. Rens | 39 | Chief Financial Officer | ||
| Keith D. Osborn | 46 | Executive Vice President, General Manager Refining | ||
| Kevan A. Vick | 51 | Executive Vice President, General Manager Nitrogen Fertilizer | ||
| Edmund Gross | 54 | Vice President and General Counsel | ||
| Rodney Cohen | 39 | Director | ||
| Jonathan Berger | 35 | Director | ||
| Eric Gribetz | 31 | Director | ||
| Alec Machiels | 32 | Director |
Philip L. Rinaldi has served as our chief executive officer since March 3, 2004 and as a member of our board of directors since we were incorporated on January 12, 2005. Mr. Rinaldi has been an operating advisor to Pegasus and its affiliates since August 2002. From June 1993 through August 2001, Mr. Rinaldi was the president and chief executive officer of Mulberry Corporation, a phosphate production company. Mulberry Corporation filed for Chapter 11 bankruptcy protection in February 2001 and voluntarily converted to Chapter 7 liquidation proceedings in August 2001. Mr. Rinaldi has worked extensively in both the oil and fertilizer industries, including at several prominent petroleum industry companies such as Exxon, Phibro, and Tosco, where he was a director and a principal investor in Argus Energy, and fertilizer industry companies, such as Conserv, Seminole and Mulberry Corporation where he was an investor and the principal executive. Mr. Rinaldi received a bachelor of science and a master of science in chemical engineering from the New Jersey Institute of Technology where he presently serves as Vice Chairman of its Board of Overseers.
Abraham H. Kaplan has served as our chief commercial officer for refining and marketing since March 3, 2004. Prior to joining Coffeyville Resources, Mr. Kaplan had been retired from a career in the oil industry, where he held positions at Skelly Oil Eldorado Refinery, Allied Chemical Nuclear Program, Olin Matheson, and Exxon International Oil Trading. He was also President of Phibro Energy Trading and Refining and served as Phibro's chief oil trader. He was a principal investor in Argus Energy/Tosco. Mr. Kaplan is Mr. Cohen's stepfather. Mr. Kaplan received a bachelor of science in chemical engineering from the University of Tulsa and an MBA from the Leonard N. Stern School of Business at New York University.
George W. Dorsey has served as our chief development officer for our nitrogen fertilizer business since March 3, 2004. Mr. Dorsey has been an operating advisor to Pegasus and its affiliates since August 2002. From August 2001 through June 2002, Mr. Dorsey served as vice president of chemical trading for Aquila, Inc., and electric and natural gas utility company. From October 2000 through June 2001, Mr. Dorsey served as a consultant for chemical activity at El Paso Corporation, a natural gas pipeline operator. From June 1999 though October 2000, Mr. Dorsey served as vice president of coal and fertilizer trading at Duke Energy, a natural gas and electric company. Mr. Dorsey's extensive industry experience also includes positions at Merrill Lynch as a commodity specialist and president of Five Rivers Nitrogen. He was a lead investor in CNC and Nitrogen 2000 World Scale Ammonia Projects in Trinidad. Mr. Dorsey received a bachelor of arts from the University of Vermont and a master of arts from the University of Kansas.
102
Stanley A. Riemann has served as our chief operating officer since March 3, 2004 and as a member of our board of directors since we were incorporated on January 12, 2005. Mr. Riemann has also served as an operating advisor to Pegasus and its affiliates since March 3, 2004. Prior to Coffeyville's inception in March 2004, Mr. Riemann held various positions with Farmland over 29 years, including, most recently as an executive vice president of Farmland Industries, Inc. On May 31, 2002, Farmland Industries, Inc. filed for Chapter 11 bankruptcy protection. Mr. Riemann received a bachelor of science from the University of Nebraska and an MBA from Rockhurst University.
James T. Rens has served as our chief financial officer since March 3, 2004. Mr. Rens has spent 15 years in financial positions associated with the fertilizer and energy industry including six years of experience as the chief financial officer of Farmland MissChem Limited and Farmland Hydro, L.P. After the divestiture of a significant portion of the fertilizer assets Mr. Rens was offered and accepted a position with the successful bidder, Koch Industries where he was employed until accepting the position of Chief Financial Officer with us. Mr. Rens was a member of the Board of Directors of Community First Credit Union in Mulberry Florida from 1999 until 2001. Mr. Rens received a Bachelor of Science degree in accounting from Central Missouri State University.
Keith Osborn has served as our executive vice president and general manager of petroleum operations since March 3, 2004. Mr. Osborn has 23 years of petroleum refining experience. His experience includes responsibilities in process engineering, economics and planning, process and technical management, plant and crude acquisition/pipeline management, and divisional management. Mr. Osborn's career includes corporate and plant experience covering plant and unit start up, labor negotiations, capital budgeting and expense planning, production planning and raw material selection/evaluation; environmental and safety compliance, and refinery process management. Mr. Osborn received a bachelor of science in chemical engineering from University of Missouri—Rolla and an MBA from Rockhurst University.
Kevan A. Vick has served as our executive vice president and general manager of Coffeyville Resources Nitrogen Fertilizers Manufacturing since March 3, 2004. He has served on the Board of Directors of Farmland MissChem Limited in Trinidad and SF Phosphates. He has nearly 30 years of experience in the Farmland organization and is one of the most highly respected executives in the nitrogen fertilizer industry, known for both his technical expertise and his in depth knowledge of the commercial marketplace. Mr. Vick received a bachelor of science in chemical engineering from the University of Kansas and is a licensed professional engineer in Kansas, Oklahoma, and Iowa.
Edmund Gross has served as our general counsel since July 2004. Prior to joining Coffeyville Resources, Mr. Gross was a partner at Weeks, Thomas & Lysaught, a law firm in Kansas City, Kansas, was Senior Corporate Counsel with Farmland Industries, Inc. and was Of Counsel at Stinson Morrison Hecker LLP in Kansas City, Missouri. Mr. Gross received a Bachelor of Arts degree in history from Tulane University, a Juris Doctorate from the University of Kansas and an MBA from the University of Kansas.
Rodney Cohen has been a member of our board of directors since we were incorporated on January 12, 2005. Mr. Cohen has been a Partner at Pegasus since 1999. Mr. Cohen is Mr. Kaplan's stepson. Mr. Cohen is a graduate of Columbia Law School and Franklin & Marshall College.
Jonathan Berger has been a member of our board of directors since we were incorporated on January 12, 2005. Mr. Berger has been a Partner at Pegasus since 1999. Mr. Berger is a graduate of the University of Pennsylvania's Wharton School of Business.
Eric Gribetz has been a member of our board of directors since we were incorporated on January 12, 2005. Mr. Gribetz has been a Partner at Pegasus since 1999. Mr. Gribetz graduated with honors from the University of Pennsylvania's Wharton School of Business.
Alec Machiels has been a member of our board of directors since we were incorporated on January 12, 2005. Mr. Machiels is a Vice President at Pegasus, where he has been employed since
103
August 2002. From July 2001 to July 2002, Mr. Machiels served as chief executive officer and chairman of Potentia Pharmaceuticals, Inc. From December 2001 to July 2002, Mr. Machiels served as a consultant to Radius Ventures. Mr. Machiels attended Harvard Business School from August 1999 to June 2001 and received an MBA. Mr. Machiels also received a masters in law from KU Leuven Law School in Belgium and a masters in international economics in Konstanz University in Germany.
Board of Directors
Our directors are elected annually to serve until the next annual meeting of stockholders or until their successors are duly elected and qualified.
Our board has an audit committee, a compensation committee, a corporate governance committee and a risk management committee.
Following the completion of this offering, we intend to appoint additional committees or committee members to our board of directors, as applicable, for purposes of complying with all applicable corporate governance standards of .
Audit Committee. Our Audit Committee is currently comprised of Mr. Machiels. The Audit Committee reviews the accounting and auditing principles and procedures of our company with a view to providing for the safeguard of our assets and the reliability of our financial records, recommending to the Board of Directors the engagement of our independent accountants, reviewing with the independent accountants the plans and results of the auditing engagement, and considering the independence of our accountants. Membership on the Audit Committee is restricted to directors who are independent of management and free from any relationship that, in the opinion of the Board of Directors, would interfere with the exercise of independent judgment as a committee member.
Compensation Committee. Our Compensation Committee is currently comprised of Messrs. Gribetz, Machiels, Rinaldi, and Riemann. The principal responsibilities of the Compensation Committee are to establish policies and periodically determine matters involving executive compensation, recommend changes in employee benefit programs, grant or recommend the grant of stock options and stock awards and provide counsel regarding key personnel selection.
Corporate Governance Committee. Our Corporate Governance Committee is currently comprised of Mr. Riemann. The Corporate Governance Committee develops and recommends to the board of directors corporate governance guidelines for us and reviews and makes recommendations with respect to a variety of other governance matters.
Financial Risk Management Committee. Our Financial Risk Management Committee is currently comprised of Messrs. Gribetz, Rinaldi, Riemann, Kaplan, Dorsey and Rens. The Financial Risk Management Committee is responsible for developing a financial risk management policy for us subject to approval by our board of directors. This committee also advises on and approved all hedging, hedge standards and standards for managing hedges.
Compensation Committee Interlocks and Insider Participation
No interlocking relationship exists between our board of directors or compensation committee and the board of directors or compensation committee of any other company, nor has any such interlocking relationship existed in the past.
Director Compensation
Non-employee directors are entitled to receive an annual retainer of $ and a $ per meeting fee for attendance at meetings of our board of directors or any committee of which the director is a member. In addition, all directors are reimbursed for travel expenses and other out-of-pocket costs incurred in connection with their attendance at meetings.
104
Executive Compensation
The following table sets forth certain information with respect to compensation for the year ended December 31, 2004 earned by our chief executive officer and our four other most highly compensated executive officers as of December 31, 2004. In this prospectus, we refer to these individuals as our named executive officers.
| | | Annual Compensation | ||||
|---|---|---|---|---|---|---|
| Name and Principal Position | Year | Salary ($) | Bonus ($)(1) | |||
| Philip L. Rinaldi Chief Executive Officer | 2004 | 306,403 | 416,836 | |||
Abraham H. Kaplan Chief Commercial Officer, Refining and Marketing | 2004 | 225,719 | 130,000 | |||
George W. Dorsey Chief Development Officer, Nitrogen Fertilizer | 2004 | 225,597 | 130,000 | |||
Stanley A. Riemann Chief Operating Officer | 2004 | 243,283 | 161,070 | |||
Keith D. Osborn Executive Vice President, General Manager Refining | 2004 | 145,919 | 96,200 | |||
- (1)
- Bonuses are reported for the year in which they were earned, though they may have been paid the following year.
Employment Agreements and Change-in-Control Arrangements
Mr. Rinaldi is party to an employment agreement, dated March 3, 2004. Under the agreement, Mr. Rinaldi receives an annual salary of $350,000, and was granted an equity interest representing 5% of the outstanding units of Coffeyville Group Holdings, LLC. The units issued under this agreement are subject to the terms of the Executive Purchase and Vesting Agreement described below. The initial term of Mr. Rinaldi's employment is four years from the date of the agreement and may be renewed or extended by mutual agreement. If Mr. Rinaldi is terminated without cause, he will be entitled to receive continued payment of his base salary for the lesser of either (a) six months from the effective date of his termination or (b) through the date Mr. Rinaldi commences employment on a full-time basis with a new employer and he shall receive reasonable outplacement services during that period. Mr. Rinaldi shall only be entitled to severance in the event of a termination without cause if he executes and delivers to us a release in form and substance acceptable to us releasing us from any obligations and liabilities of any type under his employment agreement or otherwise arising in connection with his employment with us. Mr. Rinaldi has also agreed not to engage in certain specified activities that compete with us during his employment with us and for a period of six months after the termination of his employment with us.
Mr. Kaplan is party to an employment agreement dated March 3, 2004. Under the agreement, Mr. Kaplan receives an annual salary of $250,000, and was granted an equity interest representing 3% of the outstanding units of Coffeyville Group Holdings, LLC. The units issued under this agreement are subject to the terms of the Executive Purchase and Vesting Agreement described below. The initial term of Mr. Kaplan's employment is four years from the date of the agreement and may be renewed or extended by mutual agreement. If Mr. Kaplan is terminated without cause, he will be entitled to receive continued payment of his base salary for the lesser of either (a) six months from the effective date of his termination or (b) through the date Mr. Kaplan commences employment on a full-time basis with a new employer and he shall receive reasonable outplacement services during that period.
105
Mr. Kaplan shall only be entitled to severance in the event of a termination without cause if he executes and delivers to us a release in form and substance acceptable to us releasing us from any obligations and liabilities of any type under his employment agreement or otherwise arising in connection with his employment with us. Mr. Kaplan has also agreed not to engage in certain specified activities that compete with us during his employment with us and for a period of six months after the termination of his employment with us.
Mr. Dorsey is party to an employment agreement dated March 3, 2004. Under the agreement, Mr. Dorsey receives an annual salary of $250,000, and was granted an equity interest representing 3% of the outstanding units of Coffeyville Group Holdings, LLC. The units issued under this agreement are subject to the terms of the Executive Purchase and Vesting Agreement described below. The initial term of Mr. Dorsey's employment is four years from the date of the agreement and may be renewed or extended by mutual agreement. If Mr. Dorsey is terminated without cause, he will be entitled to receive continued payment of his base salary for the lesser of either (a) six months from the effective date of his termination or (b) through the date Mr. Dorsey commences employment on a full-time basis with a new employer and he shall receive reasonable outplacement services during that period. Mr. Dorsey shall only be entitled to severance in the event of a termination without cause if he executes and delivers to us a release in form and substance acceptable to us releasing us from any obligations and liabilities of any type under his employment agreement or otherwise arising in connection with his employment with us. Mr. Dorsey has also agreed not to engage in certain specified activities that compete with us during his employment with us and for a period of six months after the termination of his employment with us.
Mr. Riemann is party to an employment agreement, dated March 3, 2004. Under the agreement, we agreed to pay Mr. Riemann an annual salary of $309,750, and granted him an equity interest representing 1.75% of the outstanding units of Coffeyville Group Holdings, LLC. The units issued under this agreement are subject to the terms of the Executive Purchase and Vesting Agreement described below. Mr. Riemann is also eligible to receive a retention bonus of up to $368,750 based on his continued tenure with us over a three year period. The initial term of Mr. Riemann's employment is four years from the date of the agreement and may be renewed or extended by mutual agreement. Upon the termination of Mr. Riemann's employment for any reason, the payment dates for any outstanding installments of his retention bonus shall be accelerated and become due and payable within 30 days after the effective date of his termination. If Mr. Riemann is terminated without cause during the third or fourth year of his employment, then in addition to the acceleration of his retention bonus payment (to the extent not yet fully paid), he will be entitled to receive continued payment of his base salary for the lesser of either (a) six months from the effective date of his termination or (b) through the date Mr. Riemann commences employment on a full-time basis with a new employer and he shall receive reasonable outplacement services during that period. Mr. Riemann shall only be entitled to severance in the event of a termination without cause if he executes and delivers to us a release in form and substance acceptable to us releasing us from any obligations and liabilities of any type under his employment agreement or otherwise arising in connection with his employment with us. In the event of a change of control of the company, Mr. Riemann has also agreed not to engage in certain specified activities that compete with us during his employment with us and for a period of six months after the termination of his employment with us.
Mr. Osborn is party to an employment agreement dated March 3, 2004. Under the agreement, Mr. Osborn receives an annual salary of $185,000, and granted him an equity interest representing 0.875% of the outstanding units of Coffeyville Group Holdings, LLC. The units issued under this agreement are subject to the terms of the Executive Purchase and Vesting Agreement described below. Mr. Osborn is also eligible to receive a retention bonus of up to $148,837 based on his continued tenure with us over a three year period. The initial term of Mr. Osborn's employment is four years from the date of the agreement and may be renewed or extended by mutual agreement. Upon the termination of Mr. Osborn's employment for any reason, the payment dates for any outstanding
106
installments of his retention bonus shall be accelerated and become due and payable within 30 days after the effective date of his termination. If Mr. Osborn is terminated without cause during the third or fourth year of his employment, then in addition to the acceleration of his retention bonus payment (to the extent not yet fully paid), he will be entitled to receive continued payment of his base salary for the lesser of either (a) six months from the effective date of his termination or (b) through the date Mr. Osborn commences employment on a full-time basis with a new employer and he shall receive reasonable outplacement services during that period. Mr. Osborn shall only be entitled to severance in the event of a termination without cause if he executes and delivers to us a release in form and substance acceptable to us releasing us from any obligations and liabilities of any type under his employment agreement or otherwise arising in connection with his employment with us. In the event of a change of control of the company, Mr. Osborn has also agreed not to engage in certain specified activities that compete with us during his employment with us and for a period of six months after the termination of his employment with us.
401(k) Plan
All of our employees are eligible to participate in the Coffeyville Resources, LLC 401(k) Plan or the Coffeyville Resources, LLC 401(k) Plan of Union Employees. These 401(k) Plans are intended to be qualified under the Internal Revenue Code of 1986, as amended. Our 401(k) Plans permits participants to make pre-tax contributions of up 50% of their salary subject to limits established by the Internal Revenue Service, and participants who are age 50 or older are permitted to make additional catch-up contributions.
Under our non-union 401(k) plan, we make matching contributions in an amount equal to 75% of the participant's contribution up to a maximum of 6% of a participant's contribution and under our 401(k) plan for union employees, we make matching contributions in an amount equal to 50% of the participant's contribution up to a maximum of 6% of the participant's contribution.
Participants are always 100% fully vested in their own contributions and in our company's matching contributions. The 401(k) Plan may be terminated at any time.
Income Sharing Program
The 2004 Coffeyville Resources, LLC and Affiliated Companies Income Sharing Program rewards certain of our employees, including our executive officers, for achieving company and individual performance goals. Employees are rewarded based on an assigned payout levels. Under this plan, our executive officers are eligible to receive up to 52% of their actual earnings subject to achieving the performance thresholds set forth in the plan. The minimum payout is made upon achieving 70% of the target and the maximum payout is achieved at 130% of the target. All payments under this plan are made in cash.
107
PRINCIPAL AND SELLING STOCKHOLDERS
The following table presents information regarding beneficial ownership of our common stock as of March 31, 2005, and as adjusted to reflect the sale of common stock in this offering by:
- •
- each of our directors;
- •
- each of our named executive officers;
- •
- each stockholder known by us to beneficially hold five percent or more of our common stock, all of whom are selling stockholders;
- •
- each selling stockholder who beneficially owns less than five percent of our common stock; and
- •
- all of our executive officers and directors as a group.
Beneficial ownership is determined under the rules of the Securities and Exchange Commission and generally includes voting or investment power with respect to securities. Unless indicated below, to our knowledge, the persons and entities named in the table have sole voting and sole investment power with respect to all shares beneficially owned, subject to community property laws where applicable. Shares of common stock subject to options that are currently exercisable or exercisable within 60 days of December 31, 2004 are deemed to be outstanding and to be beneficially owned by the person holding the options for the purpose of computing the percentage ownership of that person but are not treated as outstanding for the purpose of computing the percentage ownership of any other person. Except as otherwise indicated, the business address for each of our beneficial owners is c/o Coffeyville Resources, Inc., 10 Cambridge Circle Drive, Kansas City, Kansas 66103. Prior to this offering, Coffeyville Group Holdings, LLC's five direct subsidiaries will merge with and into us, in exchange for which we will issue 74,852,941 shares of our common stock to Coffeyville Group Holdings, LLC.
108
| | Shares Beneficially Owned Prior to the Offering | Number of Shares to be Sold in the Offering | Shares Beneficially Owned After Offering | |||||||||
|---|---|---|---|---|---|---|---|---|---|---|---|---|
| Name and Address | ||||||||||||
| Number | Percent | Number | Percent | Number | Percent | |||||||
| Coffeyville Group Holdings, LLC (1)(2)(3) | ||||||||||||
| Pegasus Partners II, L.P. (3) 99 River Road Cos Cob, Connecticut 06807 | ||||||||||||
| Belfer Corporation 767 Fifth Avenue, 46th Floor New York, NY 10153 | ||||||||||||
| Lime Partners, LLC 767 Fifth Avenue, 46th Floor New York, NY 10153 | ||||||||||||
| Richard Siegal 5 East 59th street, 5th Floor New York, NY 10022 | ||||||||||||
| Prodigal Son, LLC (4) | ||||||||||||
| Philip L. Rinaldi (2) | ||||||||||||
| Abraham H. Kaplan (2)(3) | ||||||||||||
| George W. Dorsey (2) | ||||||||||||
| Stanley A. Riemann (2) | ||||||||||||
| Keith D. Osborn (2) | ||||||||||||
| Rodney Cohen (3) | ||||||||||||
| Jonathan Berger (2) | ||||||||||||
| Eric Gribetz (3) | ||||||||||||
| Alec Machiels (3) | ||||||||||||
| All directors and executive officers, as a group (12 persons)(1)(2)(3) | ||||||||||||
- (1)
- Coffeyville Resources Management, Inc. is the managing member of Coffeyville Group Holdings, LLC and Coffeyville Group Holdings, LLC is the sole stockholder of Coffeyville Resources Management, Inc.
- (2)
- Coffeyville Group Holdings, LLC currently has issued and outstanding 11,652,941 common units, of which 4,217,647 are held by Philip L. Rinaldi, 2,230,589 are held by Abraham L. Kaplan, 2,230,589 are held by George W. Dorsey, 1,301,176 are held by Stanley A. Riemann, 650,588 are held by Keith D. Osborn, 650,588 are held by Kevan Vick, and 371,764 are held by James T. Rens.
- (3)
- Coffeyville Group Holdings, LLC currently has issued and outstanding 63,200,000 preferred units, of which 3,000,000 are held by Prodigal Son, LLC, an entity wholly owned by Abraham L. Kaplan, and 52,500,000 are held by Pegasus. The manager of Pegasus is Pegasus Capital Advisors, L.P. Pegasus and Pegasus Capital Advisors, L.P. are ultimately controlled by Craig M. Cogut. Messrs. Cohen and Berger are partners at Pegasus Capital Advisor, L.P. and Messrs. Gribetz and Machiels are employees of Pegasus Capital Advisors, L.P. and may be deemed to beneficially own the common stock held by Pegasus. Messrs. Cohen, Berger, Gribetz and Machiels disclaim beneficial ownership of these shares. The remaining 7,700,000 Coffeyville Group Holdings, LLC preferred units are held by persons or entities not afiliated with us, our management, our principal stockholders or its managing member.
- (4)
- Prodigal Son, LLC is wholly owned by Abraham L. Kaplan.
109
On March 3, 2004, Coffeyville Resources, LLC acquired the assets of the former Farmland petroleum division and one facility within Farmland's nitrogen fertilizer manufacturing and marketing division through a bankruptcy court auction process for approximately $107 million and the assumption of approximately $23 million of liabilities.
On March 3, 2004, Coffeyville Group Holdings, LLC entered into a management services agreement with Pegasus Capital Advisors, L.P., pursuant to which Pegasus Capital Advisors, L.P. provides Coffeyville Group Holdings, LLC with managerial and advisory services. In consideration for these services, Coffeyville Group Holdings, LLC agreed to pay Pegasus Capital Advisors, L.P. an annual fee of up to $1.0 million plus reimbursement for any out of pocket expenses. During the year ended December 31, 2004, we paid an aggregate of approximately $545,000 to Pegasus Capital Advisors, L.P. in fees under this agreement. In addition, we paid approximately $455,000 in legal fees on behalf of Pegasus Capital Advisors, L.P. in lieu of the remaining amount owed under the management fee. The initial term of the management services agreement is through March 3, 2009 and will automatically renew for additional one year terms thereafter unless one party provides notice of termination to the other at least 90 days prior to the then existing term. Pegasus Capital Advisors, L.P. is the manager of Pegasus, the principal stockholder of our parent, Coffeyville Group Holdings, LLC. Messrs. Cohen and Berger are partners at Pegasus Capital Advisors, L.P. and Messrs. Gribetz and Machiels are employees of Pegasus Capital Advisors, L.P.
Coffeyville Group Holdings, LLC paid Pegasus Capital Advisors, L.P. a $4.0 million transaction fee upon closing of the acquisition on March 3, 2004. The transaction fee relates to a $2.5 million merger and acquisition fee and a $1.5 million in deferred financing costs. In addition, in conjunction with the refinancing of our senior secured credit facility on May 10, 2004, Coffeyville Group Holdings, LLC paid an additional $1.25 million fee to Pegasus Capital Advisors, L.P. as a deferred financing cost.
On March 3, 2004, Coffeyville Group Holdings, LLC entered into Executive Purchase and Vesting Agreements with the executive officers listed below providing for the sale by us to them of the number of our common units to the right of each executive officer's name at a purchase price of approximately $0.0056 per unit. Pursuant to the terms of these agreements, as amended, each executive officer's common units were to vest at a rate of 16.66% every six months with the first 16.66% vesting on November 10, 2004. These agreements provide that in the event of a capital event, the vesting of all unvested common units will accelerate. For purposes of these agreement, a capital event is defined as the consummation of either of the following transactions: (i) (A) our merger or consolidation into or with one or more other companies, (B) the merger or consolidation of one or more companies into or with us, or (C) a tender offer or other business combination if, in the case of (A), (B) or (C), the holders of our outstanding capital stock prior to such merger or consolidation do not retain at least a majority of the voting power of the surviving entity, (ii) the voluntary sale or transfer by the holders of the units on the date hereof of a majority of the units to any person that is not a member of Coffeyville Group Holdings, LLC on the date hereof or an affiliate of any common such member, or (iii) the sale of all or substantially all of the assets of either the Coffeyville Group Holdings, LLC or Coffeyville Resources, LLC, and its subsidiaries, taken as a whole. In connection with their purchase of the common units pursuant to the Executive Purchase and Vesting Agreements, each of the executive
110
officers issued promissory notes in the amounts indicated below. These notes were paid in full on May 10, 2004.
| Executive Officer | Number of Common Units | Amount of Promissory Note | |||
|---|---|---|---|---|---|
| Philip L. Rinaldi | 3,717,647 | $ | 21,000 | ||
| Abraham H. Kaplan | 2,230,589 | $ | 12,600 | ||
| George W. Dorsey | 2,230,589 | $ | 12,600 | ||
| Stanley A. Riemann | 1,301,176 | $ | 7,350 | ||
| James T. Rens | 371,764 | $ | 2,100 | ||
| Keith D. Osborn | 650,588 | $ | 3,675 | ||
| Kevan A. Vick | 650,588 | $ | 3,675 | ||
On May 10, 2004, Mr. Rinaldi entered into another Executive Purchase and Vesting Agreement under the same terms as described above providing for the purchase of an additional 500,000 common units of Coffeyville Group Holdings, LLC for an aggregate purchase price of $2,850.
On October 8, 2004, we entered into a joint venture with The Leiber Group, Inc., a company whose majority stockholder is Pegasus Partners II, L.P., our principal stockholder. In connection with the joint venture, we contributed approximately 68.7% of our membership interests in Coffeyville Resources, LLC to CL JV Holdings, LLC a Delaware limited liability company (CL JV Holdings) and The Leiber Group, Inc. contributed the Judith Leiber business to CL JV Holdings. Pursuant to the terms of the limited liability company agreement governing CL JV Holdings, net profits and net losses of the joint venture are shared 80.5% and 19.5% between us and The Leiber Group, Inc., respectively, based on the relative values of our contributions as of the contribution date. In addition, we and The Leiber Group, Inc. share in 10% of the appreciation and depreciation in the value of the business contributed by the other party. We intend to liquidate CL JV Holdings prior to the completion of this offering.
In connection with the liquidation, CL JV Holdings intends to distribute the contributed businesses back to the respective contributing parties so that The Leiber Group, Inc. will receive the Judith Leiber business and we will receive the approximately 68.7% membership interest in Coffeyville Resources, LLC. To the extent The Leiber Group, Inc.'s capital account in the joint venture (taking into account the allocations that would be made if CL JV Holdings sold all of its assets for fair market value immediately prior to the distribution), exceeds the fair market value of the Leiber business as of the liquidation date, it may be necessary for Coffeyville Resources LLC to make a distribution of cash to CL JV Holdings which would then distribute the cash to The Leiber Group, Inc. in an amount equal to the excess in order to fully redeem The Leiber Group, Inc.'s interest in the joint venture. We currently estimate that this distribution will be approximately $ . Following the liquidation, we will own 100% of the membership interests in Coffeyville Resources, LLC.
In December 2004, we entered into a non-binding memorandum of understanding (MOU) relating to a project involving the construction of two ammonia and UAN plants in the Republic of Trinidad and Tobago, West Indies. We intend to assign all of our rights and obligations under this MOU to Union Estate Fertilizers Cayman Islands Limited (UEF), an entity which is wholly owned by Pegasus. UEF will reimburse us for the expenses we have incurred to date in connection with the MOU. Further, members of our management may spend a portion of their time on this project, may have an equity interest in this project and may receive separate compensation for their participation in this project. See "Risk Factors—Following consummation of this offering, Pegasus will continue to control us and may have conflicts of interest with other stockholders."
111
On January 13, 2005, our board of directors authorized the following bonus payments to the following executive officers in recognition of the importance of retaining their services:
| Executive Officer | Bonus Amount | ||
|---|---|---|---|
| Philip L. Rinaldi | $ | 1,000,000 | |
| Abraham H. Kaplan | $ | 600,000 | |
| George W. Dorsey | $ | 300,000 | |
| Stanley A. Riemann | $ | 700,000 | |
| James T. Rens | $ | 150,000 | |
| Keith D. Osborn | $ | 150,000 | |
| Kevan A. Vick | $ | 150,000 | |
| Edmund S. Gross | $ | 200,000 | |
We share office space with Pegasus in New York, New York for which we are currently paying Pegasus $10,000 per month.
Prior to the completion of this offering, we intend to pay a dividend of approximately $ million to Coffeyville Group Holdings, LLC.
112
DESCRIPTION OF OUR INDEBTEDNESS
Overview
Prior to the completion of this offering we intend to repay our existing senior secured credit facility, and Coffeyville Resources, LLC intends to enter into a new senior secured credit facility and issue $ aggregate principal amount of % senior notes. Neither the repayment of our existing senior secured credit facility, the entry into the new senior secured credit facility, nor the issuance of the % senior notes are conditions to the completion of this offering. The following is a summary description of (a) certain terms of our existing senior secured credit facility, (b) certain anticipated terms of the new $ million senior secured credit facility, and (c) certain anticipated terms of the indenture that will govern the % senior notes. The terms of the documentation relating to the $ million senior secured credit facility and the % senior notes are currently under discussion, and accordingly, their definitive terms may vary from those described below.
Existing Senior Secured Credit Facility
Our senior secured credit facility has been provided by a syndicate of banks and financial institutions and institutional lenders, with Credit Suisse First Boston, acting through its Cayman Islands branch, acting as administrative agent and collateral agent for the term loan facility and Congress Financial Corporation (Southwest) acting as administrative agent and collateral agent for the revolving credit facility. The senior secured credit facility provides for (1) a $150.0 million term loan facility maturing on May 10, 2010, of which $148.9 million was outstanding as of December 31, 2004 and (2) a $75.0 million revolving credit facility, subject to a borrowing base and other availability criteria, maturing on May 10, 2009, of which up to $30.0 million prior to May 10, 2006 and $50.0 million thereafter will be available for letters of credit. The term loan facility is subject to amortization of principal. The term loan facility amortizes at a rate of 1% of the original principal amount during the first five years, payable in quarterly installments, with the balance payable on May 10, 2010.
Prepayments
The loans under our senior secured credit facility are required to be prepaid in an amount equal to, (a) 75% of excess cash flow, which may reduced to 50% depending on the achievement and maintenance of a specified leverage ratio, (b) 100% of the net cash proceeds of all asset sales or other dispositions of property by Coffeyville Group Holdings, LLC or its subsidiaries, subject to certain exceptions and reinvestment rights, (c) 100% of the net cash proceeds of all insurance proceeds paid on account of any loss of any of our property or assets, subject to certain exceptions and reinvestment rights, (d) 100% of the net cash proceeds of issuances or incurrences of certain debt obligations by Coffeyville Group Holdings, LLC or its subsidiaries and (e) 50% of the net cash proceeds of issuances of equity securities by Coffeyville Group Holdings, LLC or its subsidiaries, subject to certain exceptions and to reduction to 25% or zero percent in certain circumstances. Such mandatory prepayments and reductions will be allocated to the term loan facility principal repayment installments on a pro rata basis, and then to the revolving credit facility, subject to certain exceptions. Term loan voluntary prepayments and revolving credit commitment reductions are permitted in whole or in part, subject to certain minimum prepayment requirements and certain other premiums and exceptions as set forth in the credit agreement.
Under the credit agreement, in certain circumstances we are required to prepay all or part of the senior secured loans. In addition, we may, at our option, elect to prepay all or part of the senior secured loans, subject to LIBOR breakage costs and, in some circumstances, a prepayment penalty. The prepayment penalty is calculated as a declining percentage of the total senior secured term debt or senior secured revolving commitment retired. The prepayment penalty is dependent upon the actual date the prepayment occurs. No prepayment penalties exist for the senior revolving loans and the
113
senior secured term loan after May 10, 2006 and May 10, 2007, respectively. This offering will not trigger a mandatory prepayment of the senior secured loans. If, after May 10, 2005, but on or prior to May 10, 2006, we voluntarily prepay the senior secured loans and terminate the senior secured revolving loan commitment, the prepayment penalty for the senior secured term loan would be 2.0% and the prepayment penalty for the termination of the senior secured revolving loan commitment would be 0.25%, or a total of approximately $3.2 million.
Interest and Fees
The interest rates under our senior secured credit facility are as follows: (a) loans under the revolving credit facility, at our option either the Index Rate (as defined, based on the prime rate) plus 1% per annum or LIBOR Rate (as defined) plus 3% per annum; and (b) loans under the term loan facility, at our option either the Index Rate plus 4% per annum or LIBOR Rate plus 5% per annum. We may elect LIBOR interest periods of 1, 2, 3 or 6 months.
The revolving credit facility has (1) a letter of credit fee equal to 1.5% per annum on the outstanding letters of credit under the revolving credit facility, and (2) an unused line of credit fee of 0.5% per annum.
The interest otherwise payable under the senior secured credit facility will increase by 2% per annum during the continuance of an event of default.
Collateral and Guarantees
The obligations under the senior secured credit facility are guaranteed by Coffeyville Group Holdings, LLC and all of its direct and indirect subsidiaries.
Our obligations under the senior secured credit facility are secured by (a) a pledge of all of the capital stock of our subsidiaries and (b) all or substantially all of the tangible and intangible assets, real or personal, now owned or hereafter acquired by us or our subsidiaries (including in cash reserves for debt repayment and environmental capital expenditures).
Representations and Warranties and Covenants
The credit agreement documentation contains certain customary representations and warranties and contains customary covenants restricting our ability to, among others: (i) declare dividends or redeem or repurchase capital stock; (ii) prepay, redeem or purchase debt; (iii) incur liens and engage in sale-leaseback transactions; (iv) make loans and investments; (v) incur additional indebtedness; (vi) amend or otherwise alter debt and other material agreements; (vii) make capital expenditures; (viii) engage in mergers, acquisitions and asset sales; (ix) transact with affiliates; and (x) alter the business we conduct. We are required to indemnify the agents and lenders and comply with customary covenants.
Events of Default
Events of default under the credit agreement include, but are not limited to: (i) our failure to pay principal or interest when due; (ii) our material breach of any representation or warranty; (iii) covenant defaults; (iv) events of bankruptcy; (v) a change of control; (vi) cross-defaults to other indebtedness; (vii) monetary judgment defaults; (viii) impairment of loan documentation or security; and (ix) customary ERISA defaults.
New Senior Secured Credit Facility
Coffeyville Resources, LLC intends to enter into a new senior secured credit facility prior to the completion of this offering. The following is a summary of the proposed material provisions that we
114
anticipate will govern the new senior secured credit facility. It does not purport to be complete, and is subject to and qualified in its entirety by reference to the provisions of those documents, the terms of which are currently under discussion, and may vary materially from those described below.
We expect that the new senior secured credit facility will provide for (1) a $ million term loan facility that will mature on , 20 , and (2) a $ million revolving credit facility that will mature on , 20 .
Prepayments
We anticipate that the loans under the new senior secured credit facility will be required to be prepaid in an amount equal to (a) % of our excess cash flow, which may be reduced subject to achievement and maintenance of a specified leverage ratio, (b) % of the net cash proceeds of asset sales, subject to certain exceptions, (c) % of the net cash proceeds of issuances or incurrences of debt obligations, subject to certain exceptions, and (d) % of the net cash proceeds of issuances of equity securities, subject to certain exceptions.
Interest and Fees
We expect that the interest rates under the new senior secured credit facility will be as follows: (a) loans under the revolving credit facility ; and (b) loans under the term loan facility . We may elect interest periods of .
The revolving credit facility has (1)��a letter of credit fee equal to , and (2) an unused line of credit fee of per annum.
The interest otherwise payable under the senior secured credit facility will increase by per annum during the continuance of an event of default.
Collateral and Guarantees
We anticipate that the obligations under the new senior secured credit facility will be secured by first priority liens on substantially all assets, real or personal, now owned or hereafter acquired by us or our subsidiaries.
We anticipate that the obligations under the new senior secured credit facility will be guaranteed by Coffeyville Resources, Inc. and each of its direct and indirect subsidiaries.
Representations and Warranties and Covenants
We anticipate that the documentation governing the new senior secured credit facility will contain certain customary representations and warranties and negative covenants restricting our ability to, among other things: (a) declare dividends or redeem or repurchase capital stock, (b) prepay, redeem, guarantee or purchase debt, (c) incur additional debt, (d) incur liens, (e) make loans and investments, (f) make capital expenditures, (g) engage in mergers, acquisitions or asset sales, and (h) alter the business we conduct.
We anticipate that we will also be required to comply with customary financial covenants and customary affirmative covenants.
Events of Default
We anticipate that the credit agreement governing the new senior secured credit facility will contain customary events of default, including, but not limited to: (a) our failure to pay principal or interest when due, (b) our material breach of a representation or warranty, (c) certain covenant
115
defaults, (d) certain bankruptcy events or monetary judgment defaults, (e) the impairment of the loan documentation or security and (f) certain ERISA defaults.
Senior Notes
Prior to the consummation of this offering, Coffeyville Resources, LLC intends to issue $ million aggregate principal amount of % senior notes. The notes will be subject to the terms and conditions of an indenture, to be entered into on the issue date. The following is a summary of the proposed material provisions of the notes and the indenture. It does not purport to be complete, and is subject to and qualified in its entirety by reference to the provisions of the indenture, the terms of which are currently under discussion, and may vary materially from those described below.
General
We anticipate that the notes will bear interest at a rate of %, will be payable semi-annually in arrears and will mature in 20 . The notes will be our general unsecured obligations and will rank equal in right of payment to all of our existing and future senior debt. The notes will be unconditionally guaranteed, on an unsecured basis, jointly and severally, by all of our restricted subsidiaries.
Optional Redemption
We anticipate that the notes will be subject to redemption at any time, at our option, in whole or in part, on or after , 20 , at redemption prices (plus accrued and unpaid interest) to be set forth in the indenture.
We anticipate that prior to , 2008, we will have the right, on any one or more occasions, to redeem up to an aggregate of 35% of the notes originally issued at a redemption price to be set forth in the indenture, with the net cash proceeds of certain equity offerings; provided that at least 65% of the notes originally issued remain outstanding after the occurrence of each such redemption.
Change of Control
We anticipate that upon the occurrence of certain circumstances constituting a change of control, each holder of the notes will have the right to require us to repurchase all or a portion of such holder's notes at a purchase price equal to 101% of the principal amount (plus accrued and unpaid interest and liquidated damages, if any). The occurrence of a change of control will include, among other things, the following events, in each case subject to certain exceptions:
- •
- the disposition of all or substantially all of our assets to any person;
- •
- the adoption of a plan relating to our liquidation or dissolution; or
- •
- the first day on which a majority of the members of our board of directors are not continuing directors.
Certain Covenants
We anticipate that the indenture governing the notes will contain a number of covenants restricting our operations, limiting our ability to incur additional indebtedness, pay dividends or make distributions, sell assets, restrict distributions from subsidiaries, create liens, enter into mergers or consolidations and enter into certain affiliate transactions. These covenants will be subject to important exceptions and limitations and will not be designed to protect investors in our common stock.
116
Events of Default
Events of default under the indenture are expected to include, among other things, the following:
- •
- default for 30 days in the payment when due of interest on, or liquidated damages, if any, with respect to the notes;
- •
- default in the payment when due of the principal of or premium, if any, on the notes;
- •
- failure by us to comply with certain provisions in the indenture (subject, in certain cases, to notice and cure periods);
- •
- failure by us or any restricted subsidiary to pay final judgments, which judgments are not paid, discharged or stayed for a period of 60 days;
- •
- default under other indebtedness by us or any restricted subsidiary, which default results in the acceleration of such indebtedness prior to its stated maturity;
- •
- if any guarantee of the notes shall be held to be unenforceable or invalid or shall cease for any reason to be in full force and effect or any guarantor, or any person acting on behalf of any guarantor shall deny or disaffirm its obligations under its guarantee; or
- •
- certain events of bankruptcy or insolvency.
Upon the occurrence of an event of default under the indenture, with certain exceptions, the trustee or the holders of at least 25% in principal amount of the then outstanding notes will have the right to accelerate the maturity of all the notes in accordance with the terms of the indenture.
117
Immediately following the consummation of this offering, our authorized capital stock will consist of shares of common stock, par value $0.01 per share, and shares of preferred stock, par value $0.01 per share, the rights and preferences of which may be established from time to time by our board of directors. As of , there were shares of common stock outstanding that were held of record by approximately stockholders. Upon completion of this offering, there will be outstanding shares of common stock and no outstanding shares of preferred stock. The following description of our capital stock does not purport to be complete and is subject to and qualified by our certificate of incorporation and bylaws, which are included as exhibits to the registration statement of which this prospectus forms a part, and by the provisions of applicable Delaware law.
Common Stock
Holders of our common stock are entitled to one vote for each share on all matters voted upon by our stockholders, including the election of directors and do not have cumulative voting rights. Subject to the rights of holders of any then outstanding shares of our preferred stock, our common stockholders are entitled to any dividends that may be declared by our board of directors. Holders of our common stock are entitled to share ratably in our net assets upon our dissolution or liquidation after payment or provision for all liabilities and any preferential liquidation rights of our preferred stock then outstanding. Holders of our common stock have no preemptive rights to purchase shares of our stock. The shares of our common stock are not subject to any redemption provisions and are not convertible into any other shares of our capital stock. All outstanding shares of our common stock are, and the shares of common stock to be issued in the offering will be, upon payment therefor, fully paid and nonassessable. The rights, preferences and privileges of holders of our common stock will be subject to those of the holders of any shares of our preferred stock we may issue in the future.
Preferred Stock
Our board of directors may, from time to time, authorize the issuance of one or more classes or series of preferred stock without stockholder approval. Subject to the provisions of our certificate of incorporation and limitations prescribed by law, our board of directors is authorized to adopt resolutions to issue shares, establish the number of shares, change the number of shares constituting any series, and provide or change the voting powers, designations, preferences and relative rights, qualifications, limitations or restrictions on shares of our preferred stock, including dividend rights, terms of redemption, conversion rights and liquidation preferences, in each case without any action or vote by our stockholders. We have no current intention to issue any shares of preferred stock.
One of the effects of undesignated preferred stock may be to enable our board of directors to discourage an attempt to obtain control of our company by means of a tender offer, proxy contest, merger or otherwise. The issuance of preferred stock may adversely affect the rights of our common stockholders by, among other things:
- •
- restricting dividends on the common stock;
- •
- diluting the voting power of the common stock;
- •
- impairing the liquidation rights of the common stock; or
- •
- delaying or preventing a change in control without further action by the stockholders.
118
Limitation of Liability of Officers and Directors
Our restated certificate of incorporation limits the liability of directors to the fullest extent permitted by Delaware law. The effect of these provisions is to eliminate the rights of our company and our stockholders, through stockholders' derivative suits on behalf of our company, to recover monetary damages against a director for breach of fiduciary duty as a director, including breaches resulting from grossly negligent behavior. However, our directors will be personally liable to us and our stockholders for monetary damages if they acted in bad faith, knowingly or intentionally violated the law, authorized illegal dividends or redemptions or derived an improper benefit from their actions as directors. In addition, our restated certificate of incorporation provides that we will indemnify our directors and officers to the fullest extent permitted by Delaware law. We expect to enter into indemnification agreements with our current directors and executive officers prior to the completion of this offering. We also maintain directors and officers insurance.
Delaware Anti-Takeover Law
We are subject to Section 203 of the Delaware General Corporation law which regulates corporate acquisitions. This law provides that specified persons who, together with affiliates and associates, own, or within three years did own, 15% or more of the outstanding voting stock of a corporation may not engage in business combinations with the corporation for a period of three years after the date on which the person became an interested stockholder. The law defines the term "business combination" to include mergers, asset sales and other transactions in which the interested stockholder receives or could receive a financial benefit on other than a pro rata basis with other stockholders. This provision has an anti-takeover effect with respect to transactions not approved in advance by our board of directors, including discouraging takeover attempts that might result in a premium over the market price for the shares of our market price. With approval of our stockholders, we could amend our certificate of incorporation in the future to avoid the restrictions imposed by this anti-takeover law.
Transfer Agent and Registrar
The transfer agent and registrar for our common stock is .
119
SHARES ELIGIBLE FOR FUTURE SALE
Upon completion of this offering, we will have outstanding shares of common stock. The shares sold in this offering plus any additional shares sold by the selling stockholders upon exercise of the underwriters' over-allotment option and any shares sold in our directed share program will be freely tradable without restriction under the Securities Act, unless purchased by our "affiliates" as that term is defined in Rule 144 under the Securities Act. In general, affiliates include executive officers, directors and our largest stockholders. Shares of common stock purchased by affiliates will remain subject to the resale limitations of Rule 144.
The remaining shares outstanding prior to this offering are restricted securities within the meaning of Rule 144. Restricted securities may be sold in the public market only if registered or if they qualify for an exemption from registration under Rules 144, 144(k) or Rule 701 promulgated under the Securities Act, which are summarized below.
The selling stockholders have entered into lock-up agreements in connection with this offering, generally providing that they will not offer, sell, contract to sell, or grant any option to purchase or otherwise dispose of our common stock or any securities exercisable for or convertible into our common stock owned by it for a period of 180 days after the date of this prospectus without the prior written consent of Credit Suisse First Boston LLC.
The underwriters have advised us that they have no present intent to release any shares subject to lock-up agreements early.
Despite possible earlier eligibility for sale under the provisions of Rules 144, 144(k) and 701, shares subject to lock-up agreements will not be salable until this agreement expires or is waived by Credit Suisse First Boston LLC. These agreements are more fully described in the section of this prospectus entitled "Underwriting." Taking into account the lock-up agreement, and assuming Credit Suisse First Boston LLC does not release Coffeyville Group Holdings, LLC from this agreement, the following shares will be eligible:
- •
- beginning 180 days after the effective date of the registration statement of which this prospectus forms a part, approximately:
- •
- additional shares held by affiliates will be eligible for sale, subject to volume, manner-of-sale and other limitations under Rule 144;
- •
- additional shares will be eligible for sale pursuant to Rule 144(k).
In general, under Rule 144 as currently in effect, after the expiration of the lock-up agreement, a person who has beneficially owned restricted securities for at least one year would be entitled to sell within any three-month period a number of shares that does not exceed the greater of the following:
- •
- one percent of the number of shares of common stock then outstanding, which will equal approximately shares immediately after this offering; or
- •
- the average weekly trading volume of the common stock during the four calendar weeks preceding the sale.
Sales under Rule 144 are also subject to requirements with respect to manner-of-sale requirements, notice requirements and the availability of current public information about us. Under Rule 144(k), a person who is not deemed to have been our affiliate at any time during the three months preceding a sale, and who has beneficially owned the shares proposed to be sold for at least two years, is entitled to sell his or her shares without complying with the manner-of-sale, public information, volume limitation, or notice provisions of Rule 144.
120
Under the terms and subject to the conditions contained in an underwriting agreement dated , 2005, we and the selling stockholders have agreed to sell to Credit Suisse First Boston LLC and Jefferies & Company, Inc., the following respective number of shares of common stock:
| Underwriter | Number of Shares | ||
|---|---|---|---|
| Credit Suisse First Boston LLC | |||
| Jefferies & Company, Inc. | |||
| Total | |||
The underwriting agreement provides that the underwriters are obligated to purchase all of the shares of common stock in the offering if any are purchased, other than those shares covered by the over-allotment option described below.
The selling stockholders have granted to the underwriters a 30-day option to purchase on a pro rata basis up to additional shares from the selling stockholders at the initial public offering price less the underwriting discounts and commissions. The option may be exercised only to cover any over-allotments of common stock.
The underwriters propose to offer the shares of common stock initially at the public offering price on the cover page of this prospectus and to selling group members at that price less a selling concession of $ per share on sales to other broker/dealers. The underwriters and selling group members may allow a discount of $ per share on sales to other broker/dealers. After the initial public offering, the underwriters may change the public offering price and concession and discount to broker/dealers.
The following table summarizes the compensation and estimated expenses we and the selling stockholders will pay:
| | Per Share | Total | ||||||||||
|---|---|---|---|---|---|---|---|---|---|---|---|---|
| | Without Over-allotment | With Over-allotment | Without Over-allotment | With Over-allotment | ||||||||
| Underwriting discounts and commissions paid by us | $ | $ | $ | $ | ||||||||
| Expenses payable by us | $ | $ | $ | $ | ||||||||
| Underwriting discounts and commissions paid by the selling stockholders | $ | $ | $ | $ | ||||||||
| Expenses payable by the selling stockholders | $ | $ | $ | $ | ||||||||
The underwriters will not confirm sales to any accounts over which they exercise discretionary authority without first receiving a written consent from those accounts.
We have agreed that we will not offer, sell, contract to sell, pledge or otherwise dispose of, directly or indirectly, or file with the Securities and Exchange Commission, or exercise any right with respect to the filing of a registration statement under the Securities Act of 1933 (the "Securities Act") relating to, any shares of our common stock or securities convertible into or exchangeable or exercisable for any shares of our common stock, or publicly disclose the intention to make any offer, sale, pledge disposition or filing without the prior written consent of Credit Suisse First Boston LLC for a period of 180 days after the date of this prospectus.
The selling stockholders, our directors and our executive officers have entered into lock-up agreements, pursuant to which each has agreed not to offer, sell, contract to sell, pledge or otherwise dispose of, directly or indirectly, any shares of our common stock or securities convertible into or
121
exchangeable or exercisable for any shares of our common stock, enter into a transaction that would have the same effect, or enter into any swap, hedge or other arrangement that transfers, in whole or in part, any of the economic consequences of ownership of our common stock, whether any of these transactions are to be settled by delivery of our common stock or other securities, in cash or otherwise, or publicly disclose the intention to make any offer, sale, pledge or disposition, or to enter into any transaction, swap, hedge or other arrangement, without, in each case, the prior written consent of Credit Suisse First Boston LLC for a period of 180 days after the date of this prospectus. However, in the event that either (1) during the last 17 days of the lock-up period, we release earnings results or material news or a material event relating to us occurs or (2) prior to the expiration of the lock-up period, we announce that we will release earnings results during the 16-day period beginning on the last day of the lock-up period, then in either case the expiration of the lock-up will be extended until the expiration of the 18-day period beginning on the date of the release of the earnings results or the occurrence of the material news or event, as applicable, unless Credit Suisse First Boston LLC waives, in writing, such an extension.
The underwriters have advised us that they have no present intent to release any shares subject to lock-up agreements early.
The underwriters have reserved for sale at the initial public offering price up to shares of common stock for employees, directors and other persons associated with us who have expressed an interest in purchasing common stock in the offering. The number of shares available for sale to the general public in the offeirng will be reduced to the extent these persons purchase the reserved shares. Any reserved shares not so purchased will be offered by the underwriters to the general public on the same terms as the other shares.
We and the selling stockholders have agreed to indemnify the underwriters against liabilities under the Securities Act, or to contribute to payments that the underwriters may be required to make in that respect.
We intend to apply to list the shares of common stock on the Nasdaq National Market under the symbol " ".
An affiliate of Credit Suisse First Boston LLC currently acts as administrative agent and collateral agent under our senior secured term loan facility, for which it receives customary fees and expenses. Credit Suisse First Boston LLC, Jefferies & Company, Inc. and their affiliates have previously and may in the future engage in financial advisory, commercial banking and investment banking services with us for which they will receive customary compensation. Affiliates of certain of the underwriters may act as agents and lenders under Coffeyville Resources, LLC's proposed senior secured credit facility, for which we expect they will receive customary fees and expenses. Certain of the underwriters may act as initial purchasers in the proposed offering of Coffeyville Resources, LLC's proposed senior notes for which we expect they will receive customary compensation.
Prior to this offering, there has been no public market for our common stock. The initial public offering price for our common stock will be determined by negotiation between us and the underwriter. The principal factors to be considered in determining the initial public offering price include the following:
- •
- the information included in this prospectus and otherwise available to the underwriter;
- •
- market conditions for initial public offerings;
- •
- the history of and prospects for our business, our past and present operations;
- •
- the history and prospects for the industry in which we compete;
- •
- our past and present earnings and current financial position;
122
- •
- an assessment of our management;
- •
- the market of securities of companies in businesses similar to ours; and
- •
- the general condition of the securities markets.
There can be no assurance that the initial public offering price will correspond to the price at which our common stock will trade in the public market subsequent to this offering or that an active trading market will develop and continue after this offering.
In connection with this offering, the underwriters may engage in stabilizing transactions, over-allotment transactions, syndicate covering transactions and penalty bids in accordance with Regulation M under the Securities Exchange Act of 1934.
- •
- Stabilizing transactions permit bids to purchase the underlying security so long as the stabilizing bids do not exceed a specified maximum.
- •
- Over-allotments involves sales by the underwriters of shares in excess of the number of shares the underwriters are obligated to purchase, which creates a syndicate short position. The short position may be either a covered short position or a naked short position. In a covered short position, the number of shares over-allotted by the underwriters is not greater than the number of shares that it may purchase in the over-allotment option. In a naked short position, the number of shares involved is greater than the number of shares in the over-allotment option. The underwriters may close out any covered short position by either exercising their over-allotment option and/or purchasing shares in the open market.
- •
- Syndicate covering transactions involve purchases of the common stock in the open market after the distribution has been completed in order to cover syndicate short positions. In determining the source of shares to close out the short position, the underwriters will consider, among other things, the price of shares available for purchase in the open market as compared to the price at which they may purchase shares through the over-allotment option. If the underwriters sell more shares than could be covered by the over-allotment option, a naked short position, the position can only be closed out by buying shares in the open market. A naked short position is more likely to be created if the underwriters are concerned that there could be downward pressure on the price of the shares in the open market after pricing that could adversely affect investors who purchase in this offering.
- •
- Penalty bids permit the underwriters to reclaim a selling concession from a syndicate member when the common stock originally sold by the syndicate member is purchased in a stabilizing or syndicate covering transaction to cover syndicate short positions.
- •
- In passive market making, market makers in the common stock who are underwriters or prospective underwriters may, subject to limitations, make bids for or purchases of our common stock until the time, if any, at which a stabilizing bid is made.
These stabilizing transactions, over-allotment transactions, syndicate covering transactions and penalty bids may have the effect of raising or maintaining the market price of our common stock or preventing or retarding a decline in the market price of the common stock. As a result the price of our common stock may be higher than the price that might otherwise exist in the open market. These transactions may be effected on the Nasdaq National Market and, if commenced, may be discontinued at any time.
A prospectus in electronic format may be made available on the web sites maintained by the underwriters, or selling group members, if any, participating in this offering and one or more of the underwriters participating in the offering may distribute prospectuses electronically. Credit Suisse First Boston LLC may agree to allocate a number of shares to underwriters and selling group members for
123
sale to their online brokerage account holders. Internet distributions will be allocated by the underwriters and selling group members that will make internet distributions on the same basis as other allocations.
Each underwriter has represented, warranted and agreed that: (i) it has not offered or sold and, prior to the expiry of a period of six months from the closing date, will not offer or sell any shares to persons in the United Kingdom except to persons whose ordinary activities involve them in acquiring, holding, managing or disposing of investments (as principal or agent) for the purposes of their businesses or otherwise in circumstances which have not resulted and will not result in an offer to the public in the United Kingdom within the meaning of the Public Offers of Securities Regulations 1995; (ii) it has only communicated or caused to be communicated and will only communicate or cause to be communicated any invitation or inducement to engage in investment activity (within the meaning of section 21 of the Financial Services and Markets Act 2000 (FSMA)) received by it in connection with the issue or sale of any shares in circumstances in which section 21(1) of the FSMA does not apply to the Issuer; and (iii) it has complied and will comply with all applicable provisions of the FSMA with respect to anything done by it in relation to the shares in, from or otherwise involving the United Kingdom.
The shares of our common stock may not be offered or sold, transferred or delivered, as part of their initial distribution or at any time thereafter, directly or indirectly, to any individual or legal entity in the Netherlands other than to individuals or legal entities who or which trade or invest in securities in the conduct of their profession or trade, which includes banks, securities intermediaries, insurance companies, pension funds, other institutional investors and commercial enterprises which, as an ancillary activity, regularly trade or invest in securities.
The shares of our common stock may not be offered or sold by means of any document other than to persons whose ordinary business is to buy or sell shares or debentures, whether as principal or agent, or in circumstances which do not constitute an offer to the public within the meaning of the Companies Ordinance (Cap. 32) of Hong Kong, and no advertisement, invitation or document relating to the shares may be issued, whether in Hong Kong or elsewhere, which is directed at, or the contents of which are likely to be accessed or read by, the public in Hong Kong (except if permitted to do so under the securities laws of Hong Kong) other than with respect to shares which are or are intended to be disposed of only to persons outside Hong Kong or only to "professional investors" within the meaning of the Securities and Futures Ordinance (Cap. 571) of Hong Kong and any rules made thereunder.
This prospectus has not been registered as a prospectus with the Monetary Authority of Singapore. Accordingly, this prospectus and any other document or material in connection with the offer or sale, or invitation or subscription or purchase, of the securities may not be circulated or distributed, nor may the securities be offered or sold, or be made the subject of an invitation for subscription or purchase, whether directly or indirectly, to persons in Singapore other than under circumstances in which such offer, sale or invitation does not constitute an offer or sale, or invitation for subscription or purchase, of the securities to the public in Singapore.
The shares of our common stock have not been and will not be registered under the Securities and Exchange Law of Japan (the Securities and Exchange Law) and each underwriter has agreed that it will not offer or sell any securities, directly or indirectly, in Japan or to, or for the benefit of, any resident of Japan (which term as used herein means any person resident in Japan, including any corporation or other entity organized under the laws of Japan), or to others for re-offering or resale, directly or indirectly, in Japan or to a resident of Japan, except pursuant to an exemption from the registration requirements of, and otherwise in compliance with, the Securities and Exchange Law and any other applicable laws, regulations and ministerial guidelines of Japan.
124
Resale Restrictions
The distribution of our common stock in Canada is being made only on a private placement basis exempt from the requirement that we and the selling stockholder prepare and file a prospectus with the securities regulatory authorities in each province where trades of common stock are made. Any resale of the common stock in Canada must be made under applicable securities laws which will vary depending on the relevant jurisdiction, and which may require resales to be made under available statutory exemptions or under a discretionary exemption granted by the applicable Canadian securities regulatory authority. Purchasers are advised to seek legal advice prior to any resale of the common stock.
Representations of Purchasers
By purchasing common stock in Canada and accepting a purchase confirmation a purchaser is representing to us, the selling stockholder and the dealer from whom the purchase confirmation is received that:
- •
- the purchaser is entitled under applicable provincial securities laws to purchase the common stock without the benefit of a prospectus qualified under those securities laws,
- •
- where required by law, that the purchaser is purchasing as principal and not as agent, and
- •
- the purchaser has reviewed the text above under Resale Restrictions.
Rights of Action—Ontario Purchasers Only
Under Ontario securities legislation, a purchaser who purchases a security offered by this prospectus during the period of distribution will have a statutory right of action for damages, or while still the owner of the common stock, for rescission against us and the selling stockholder in the event that this circular contains a misrepresentation. A purchaser will be deemed to have relied on the misrepresentation. The right of action for damages is exercisable not later than the earlier of 180 days from the date the purchaser first had knowledge of the facts giving rise to the cause of action and three years from the date on which payment is made for the common stock. The right of action for rescission is exercisable not later than 180 days from the date on which payment is made for the common stock. If a purchaser elects to exercise the right of action for rescission, the purchaser will have no right of action for damages against us or the selling stockholder. In no case will the amount recoverable in any action exceed the price at which the common stock were offered to the purchaser and if the purchaser is shown to have purchased the securities with knowledge of the misrepresentation, we and the selling stockholder will have no liability. In the case of an action for damages, we and the selling stockholder will not be liable for all or any portion of the damages that are proven to not represent the depreciation in value of the common stock as a result of the misrepresentation relied upon. These rights are in addition to, and without derogation from, any other rights or remedies available at law to an Ontario purchaser. The foregoing is a summary of the rights available to an Ontario purchaser. Ontario purchasers should refer to the complete text of the relevant statutory provisions.
Enforcement of Legal Rights
All of our directors and officers as well as the experts named herein and the selling stockholder may be located outside of Canada and, as a result, it may not be possible for Canadian purchasers to effect service of process within Canada upon us or those persons. All or a substantial portion of our assets and the assets of those persons may be located outside of Canada and, as a result, it may not be possible to satisfy a judgment against us or those persons in Canada or to enforce a judgment obtained in Canadian courts against us or those persons outside of Canada.
Taxation and Eligibility for Investment
Canadian purchasers of common stock should consult their own legal and tax advisors with respect to the tax consequences of an investment in the common stock in their particular circumstances and about the eligibility of the common stock for investment by the purchaser under relevant Canadian legislation.
125
The validity of the shares of common stock offered by this prospectus will be passed upon for our company by Akin, Gump, Strauss, Hauer & Feld, L.L.P. Certain legal matters in connection with shares of common stock offered in this prospectus will be passed upon for the underwriters by Latham & Watkins LLP, New York, New York.
The consolidated financial statements of Coffeyville Resources, Inc. which collectively refer to the consolidated financial statements as of December 31, 2003 and for the years ended December 31, 2002 and 2003 and for the 62 day period ended March 2, 2004 for the former Farmland Industries, Inc. (Farmland) Petroleum Division and one facility within Farmland's eight-plant Nitrogen Fertilizer Manufacturing and Marketing Division (collectively, the Predecessor) and the consolidated financial statements as of December 31, 2004 and for the 304 day period ended December 31, 2004 for Coffeyville Group Holdings, LLC excluding Leiber Holdings LLC, as discussed in note 1 to the consolidated financial statements (the Successor), have been included herein (and in the registration statement) in reliance upon the report of KPMG LLP, independent registered public accounting firm, appearing elsewhere herein, and upon the authority of said firm as experts in accounting and auditing.
The audit report covering the consolidated financial statements of Coffeyville Resources, Inc. noted above contains an explanatory paragraph that states that as discussed in note 1 to the consolidated financial statements, effective March 3, 2004, the Successor acquired the net assets of the Predecessor in a business combination accounted for as a purchase. As a result of the acquisition, the consolidated financial statements for the period after the acquisition are presented on a different cost basis than that for the periods before the acquisition and, therefore, are not comparable. The audit report covering the consolidated financial statements of Coffeyville Resources, Inc. noted above also contains an emphasis paragraph that states, as discussed in note 2 to the consolidated financial statements, Farmland Industries, Inc. allocated certain general corporate expenses and interest expense to the Predecessor for the years ended December 31, 2002 and 2003, and for the 62 day period ended March 2, 2004. The allocation of these costs is not necessarily indicative of the costs that would have been incurred if the Predecessor had operated as a stand-alone entity.
126
WHERE YOU CAN FIND MORE INFORMATION
We have filed with the Securities and Exchange Commission a registration statement on Form S-1 under the Securities Act with respect to the common stock. This prospectus does not contain all of the information set forth in the registration statement and the exhibits and schedule to the registration statement. For further information with respect to us and our common stock, we refer you to the registration statement and the exhibits and schedules filed as a part of the registration statement. Statements contained in this prospectus concerning the contents of any contract or any other document are not necessarily complete. If a contract or document has been filed as an exhibit to the registration statement, we refer you to the copy of the contract or document that has been filed as an exhibit is qualified in all respects by the filed exhibit. The registration statement, including exhibits and schedule, may be inspected without charge at the Public Reference Room of the Securities and Exchange Commission at 450 Fifth Street, N.W., Washington, D.C. 20549, and copies of all or any part of it may be obtained from that office after payment of fees prescribed by the Securities and Exchange Commission. Information on the operation of the Public Reference Room may be obtained by calling the SEC at 1-800-SEC-0330. The Securities and Exchange Commission maintains a Web site that contains reported, proxy and information statements and other information regarding registrants that file electronically with the Securities and Exchange Commission athttp://www.sec.gov.
127
The following are definitions of certain industry terms used in this prospectus.
Alkylation | A polymerization process uniting olefins and isoparaffins; particularly the reacting of butylene and isobutane, with sulfuric acid or hydrofluoric acid as a catalyst, to produce a high-octane, low-sensitivity blending agent for gasoline. | |
Barrel | Common unit of measure in the oil industry which equates to 42 gallons. | |
Blendstocks | Various compounds that are combined with gasoline from the crude oil refining process to make finished gasoline and diesel fuel; these may include natural gasoline, FCC unit gasoline, ethanol, reformate or butane, among others. | |
bpd | Abbreviation for barrels per day. | |
Btu | British thermal units: a measure of energy. One Btu of heat is required to raise the temperature of one pound of water one degree Fahrenheit. | |
By-products | Products that result from extracting high value products such as gasoline and diesel fuel from crude oil; these include black oil, sulfur, propane, petroleum coke and other products. | |
Catalyst | A substance that alters, accelerates, or instigates chemical changes, but is neither produced, consumed nor altered in the process. | |
Coker unit | A refinery unit that utilizes the lowest value component of crude oil remaining after all higher value products are removed, further breaks down the component into more valuable products and converts the rest into petroleum coke. | |
Crack spread | A simplified model that measures the difference between the price for light products and crude oil. For example, 5-3-2 crack spread is often referenced and represents the approximate gross margin resulting from processing one barrel of crude oil, being five barrels of crude oil to produce three barrels of gasoline and two barrels of diesel fuel. | |
Crude unit | The initial refinery unit to process crude oil by separating the crude oil according to boiling point under high heat and low pressure to recover various hydrocarbon fractions. | |
Distillates | Primarily diesel fuel, kerosene and jet fuel. | |
Farm belt | Refers to the states of Iowa, Kansas, Montana, Missouri, Nebraska, North Dakota, Oklahoma and South Dakota. | |
Feedstocks | Hydrocarbon compounds, such as crude oil and natural gas liquids, that are processed and blended into refined products. | |
Fluid catalytic cracking unit | Converts gas oil from the crude unit or coker unit into liquefied petroleum gas, distillate and gasoline blendstocks by applying heat in the presence of a catalyst. | |
128
Heavy crude oil | A relatively inexpensive crude oil characterized by high relative density and viscosity. Heavy crude oils require greater levels of processing to produce high value products such as gasoline and diesel fuel. | |
Independent refiner | A refiner that does not have crude oil exploration or production operations. An independent refiner purchases the crude oil used as feedstock in its refinery operations from third parties. | |
Light crude oil | A relatively expensive crude oil characterized by low relative density and viscosity. Light crude oils require lower levels of processing to produce high value products such as gasoline and diesel fuel. | |
Liquefied petroleum gas | Light hydrocarbon material gaseous at atmospheric temperature and pressure, held in the liquid state by pressure to facilitate storage, transport and handling. | |
Lost time accident | An incident, illness or injury that results in the employee missing his or her next scheduled workday. | |
MTBE | Methyl Tertiary Butyl Ether, an ether produced from the reaction of isobutylene and methanol specifically for use as a gasoline blendstock. The EPA requires MTBE or other oxygenates to be blended into reformulated gasoline. | |
Maya | A heavy, sour crude oil from Mexico characterized by an API gravity of approximately 21.5 and a sulfur content of approximately 3.6 weight percent. | |
Merchant refiner | A refiner that is not vertically integrated to distribute its refinery products through branded retail outlets. | |
Naphtha | The major constituent of gasoline fractionated from crude oil during the refining process, which is later processed in the reformer unit to increase octane. | |
Netbacks | Refers to the unit price of fertilizer, in dollars per ton, offered on a delivered basis and excludes shipment costs. Also referred to as plant gate price. | |
PADD I | East Coast Petroleum Area for Defense District which includes Connecticut, Delaware, District of Columbia, Florida, Georgia, Maine, Massachusetts, Maryland, New Hampshire, New Jersey, New York, North Carolina Pennsylvania, Rhode Island, South Carolina, Vermont, Virginia and West Virginia. | |
PADD II | Midwest Petroleum Area for Defense District which includes Illinois, Indiana, Iowa, Kansas, Kentucky, Michigan, Minnesota, Missouri, Nebraska, North Dakota, Ohio, Oklahoma, South Dakota, Tennessee, and Wisconsin. | |
PADD III | Gulf Coast Petroleum Area for Defense District which includes Alabama, Arkansas, Louisiana, Mississippi, New Mexico, and Texas. | |
PADD IV | Rocky Mountains Petroleum Area for Defense District which includes Colorado, Idaho, Montana, Utah, and Wyoming. | |
PADD V | West Coast Petroleum Area for Defense District which includes Alaska, Arizona, California, Hawaii, Nevada, Oregon, and Washington. | |
129
Petroleum coke | A coal-like substance that can be burned to generate electricity or used as a hardener in concrete. | |
Recordable incident | An injury, as defined by OSHA. All work-related deaths and illnesses, and those work-related injuries which result in loss of consciousness, restriction of work or motion, transfer to another job, or require medical treatment beyond first aid. | |
Recordable injury rate | The number of recordable injuries per 200,000 hours rate worked. | |
Refined products | Hydrocarbon compounds, such as gasoline, diesel fuel, jet fuel and residual fuel, that are produced by a refinery. | |
Reformer unit | A refinery unit that processes naphtha and converts it to high-octane gasoline by using a platinum/rhenium catalyst. Also known as a platformer. | |
Reformulated gasoline | The composition and properties of which meet the requirements of the reformulated gasoline regulations. | |
Sour crude oil | A crude oil that is relatively high in sulfur content, requiring additional processing to remove the sulfur. Sour crude oil is typically less expensive than sweet crude oil. | |
Spot market | A market in which commodities are bought and sold for cash and delivered immediately. | |
Sweet crude oil | A crude oil that is relatively low in sulfur content, requiring less processing to remove the sulfur. Sweet crude oil is typically more expensive than sour crude oil. | |
Syngas | A mixture of gases (largely carbon monoxide and hydrogen) that results from heating coal in the presence of steam. | |
Throughput | The volume per day processed through a unit or a refinery. | |
Ton | One ton is equal to 2,000 pounds. | |
Turnaround | A periodically required standard procedure to refurbish and maintain a refinery that involves the shutdown and inspection of major processing units and occurs every three to four years. | |
Unbranded | A term used in connection with fuel or the sale of fuel into the spot or wholesale markets, rather than fuel or the sale of fuel directly to retail outlets. | |
Utilization | Ratio of total refinery throughput to the rated capacity of the refinery. | |
WTI | West Texas Intermediate crude oil, a light, sweet crude oil, characterized by an API gravity between 38 and 40 and a sulfur content of approximately 0.3 weight percent that is used as a benchmark for other crude oils. | |
Yield | The percentage of refined products that are produced from feedstocks. |
130
Coffeyville Resources, Inc.
INDEX TO CONSOLIDATED FINANCIAL STATEMENTS
| Audited Financial Statements: | |||
| Report of Independent Registered Public Accounting Firm | F-2 | ||
| Consolidated Balance Sheets as of December 31, 2003 and December 31, 2004 | F-3 | ||
| Consolidated Statements of Operations for the years ended December 31, 2002 and 2003, for the 62 day period ended March 2, 2004 and for the 304 day period ended December 31, 2004 | F-4 | ||
| Consolidated Statements of Equity for the years ended December 31, 2002 and 2003, for the 62 day period ended March 2, 2004 and for the 304 day period ended December 31, 2004 | F-5 | ||
| Consolidated Statements of Cash Flows for the years ended December 31, 2002 and 2003, for the 62 day period ended March 2, 2004 and for the 304 day period ended December 31, 2004 | F-6 | ||
| Notes to Consolidated Financial Statements | F-7 | ||
F-1
When the transaction referred to in note 1 of the Notes to Consolidated Financial Statements has been consummated, we will be in a position to render the following report.
/s/ KPMG LLP
Report of Independent Registered Public Accounting Firm
The Board of Directors
Coffeyville Resources, Inc.:
We have audited the accompanying consolidated balance sheets of the Coffeyville Resources, Inc. (the Company), which collectively refers to the consolidated balance sheet as of December 31, 2003 for the former Farmland Industries, Inc. (Farmland) Petroleum Division and one facility within Farmland's eight-plant Nitrogen Fertilizer Manufacturing and Marketing Division (collectively, the Predecessor), and the consolidated balance sheet as of December 31, 2004 for Coffeyville Group Holdings, LLC and subsidiaries, excluding Leiber Holdings, LLC, as discussed in note 1 to the consolidated financial statements (the Successor), and the related consolidated statements of operations, equity and cash flows for the Predecessor for the years ended December 31, 2002 and 2003 and for the 62-day period ended March 2, 2004 and for the Successor for the 304-day period ended December 31, 2004. These consolidated financial statements are the responsibility of the Company's management. Our responsibility is to express an opinion on these consolidated financial statements based on our audits.
We conducted our audits in accordance with the standards of the Public Company Accounting Oversight Board (United States). Those standards require that we plan and perform the audit to obtain reasonable assurance about whether the financial statements are free of material misstatement. An audit includes examining, on a test basis, evidence supporting the amounts and disclosures in the financial statements. An audit also includes assessing the accounting principles used and significant estimates made by management, as well as evaluating the overall financial statement presentation. We believe that our audits provide a reasonable basis for our opinion.
As discussed in note 2 the consolidated financial statements, Farmland Industries, Inc. allocated certain general corporate expense and interest expense to the Predecessor for the years ended December 31, 2002 and 2003, and for the 62-day period ended March 2, 2004. The allocation of these costs is not necessarily indicative of the costs that would have been incurred if the Predecessor had operated as a stand-alone entity.
In our opinion, the consolidated financial statements referred to above present fairly, in all material respects, the financial position of the Predecessor as of December 31, 2003 and the Successor as of December 31, 2004, and the results of the Predecessor's operations and cash flows for the years ended December 31, 2002 and 2003 and the 62-day period ended March 2, 2004 and the Successor's operations and cash flows for the 304-day period ended December 31, 2004, in conformity with U.S. generally accepted accounting principles.
As discussed in note 1 to the consolidated financial statements, effective March 3, 2004, the Successor acquired the net assets of the Predecessor in a business combination accounted for as a purchase. As a result of the acquisition, the consolidated financial statements for the period after the acquisition are presented on a different cost basis than that for the periods before the acquisition and, therefore, are not comparable.
Kansas City, Missouri
March 30, 2005,
except as to note 1, which is as of , 2005
F-2
Coffeyville Resources, Inc.
BALANCE SHEETS
| | Predecessor | Successor | Pro forma Successor | |||||||||
|---|---|---|---|---|---|---|---|---|---|---|---|---|
| | December 31, 2003 | December 31, 2004 | December 31, 2004 | |||||||||
| | | | (unaudited) | |||||||||
| ASSETS | ||||||||||||
| Current assets: | ||||||||||||
| Cash and cash equivalents | $ | 2,250 | $ | 52,651,952 | $ | 52,651,952 | ||||||
| Accounts receivable net of allowance for doubtful accounts of $313,679, and $190,468, respectively | 53,686,833 | 26,070,610 | 26,070,610 | |||||||||
| Inventories | 86,902,406 | 80,422,506 | 80,422,506 | |||||||||
| Prepayments for crude oil | 24,986,936 | — | — | |||||||||
| Prepaid expenses and other current assets | 5,207,525 | 5,157,472 | 5,157,472 | |||||||||
| Deferred income taxes | — | 264,246 | 264,246 | |||||||||
| Total current assets | $ | 170,785,950 | $ | 164,566,786 | $ | 164,566,786 | ||||||
| Property, plant, and equipment, net of accumulated depreciation | 27,007,602 | 50,005,847 | 50,005,847 | |||||||||
Other assets | 1,163,558 | 14,233,270 | 14,233,270 | |||||||||
| Deferred income taxes | — | 351,434 | 351,434 | |||||||||
| Total assets | $ | 198,957,110 | $ | 229,157,337 | $ | 229,157,337 | ||||||
| LIABILITIES AND EQUITY | ||||||||||||
| Current liabilities: | ||||||||||||
| Current portion of long term debt | $ | — | $ | 1,500,000 | $ | 1,500,000 | ||||||
| Revolving debt | — | 56,510 | 56,510 | |||||||||
| Accounts payable | 11,676,768 | 31,059,282 | 31,059,282 | |||||||||
| Personnel accruals | 4,237,130 | 6,591,495 | 6,591,495 | |||||||||
| Accrued taxes other than income taxes | 1,840,725 | 2,652,948 | 2,652,948 | |||||||||
| Accrued income taxes | — | 1,301,160 | 1,301,160 | |||||||||
| Deferred revenue | 1,545,894 | 11,119,905 | 11,119,905 | |||||||||
| Other current liabilities | 954,732 | 3,723,057 | 3,723,057 | |||||||||
| Dividend payable to the Leiber Group, Inc. | — | — | ||||||||||
| Total current liabilities | $ | 20,255,249 | $ | 58,004,357 | $ | |||||||
| Long-term liabilities: | ||||||||||||
| Long-term debt, less current portion | — | 147,375,000 | 147,375,000 | |||||||||
| Liabilities subject to compromise | 105,184,274 | — | — | |||||||||
| Accrued environmental liabilities | 15,326,098 | 9,100,937 | 9,100,937 | |||||||||
| Other long-term liabilities | — | 592,881 | 592,881 | |||||||||
| Total long-term liabilities | 120,510,372 | 157,068,818 | ||||||||||
| Members and division equity: | ||||||||||||
| Farmland Industries, Inc. divisional equity | 58,191,489 | — | — | |||||||||
| Members equity | — | 14,084,162 | ||||||||||
| 58,191,489 | 14,084,162 | |||||||||||
| Commitments and contingencies | ||||||||||||
| Total liabilities and equity | $ | 198,957,110 | $ | 229,157,337 | $ | 229,157,337 | ||||||
See accompanying notes to consolidated financial statements.
F-3
Coffeyville Resources, Inc.
CONSOLIDATED STATEMENTS OF OPERATIONS
| | Predecessor | | ||||||||||||||
|---|---|---|---|---|---|---|---|---|---|---|---|---|---|---|---|---|
| | Successor | |||||||||||||||
| | Years ended December 31, | | ||||||||||||||
| | 62 days ended March 2, 2004 | 304 days ended December 31, 2004 | ||||||||||||||
| | 2002 | 2003 | ||||||||||||||
| Net sales | $ | 887,495,126 | $ | 1,262,196,894 | $ | 261,086,529 | $ | 1,479,893,189 | ||||||||
| Cost of goods sold | 945,997,617 | 1,198,332,922 | 245,234,642 | 1,363,369,459 | ||||||||||||
| Gross profit (loss) | (58,502,491 | ) | 63,863,972 | 15,851,887 | 116,523,730 | |||||||||||
Operating expenses: | ||||||||||||||||
| Selling, general and administrative expenses | 16,373,726 | 23,617,264 | 4,649,145 | 16,552,393 | ||||||||||||
| Reorganization expenses: | ||||||||||||||||
| Impairment of property, plant, and equipment | 375,068,359 | 9,638,626 | — | — | ||||||||||||
| Rejection of executory contracts | — | 1,250,000 | — | — | ||||||||||||
| Total operating expenses | 391,442,085 | 34,505,890 | 4,649,145 | 16,552,393 | ||||||||||||
| Operating income (loss) | (449,944,576 | ) | 29,358,082 | 11,202,742 | 99,971,337 | |||||||||||
Other income (expense): | ||||||||||||||||
| Other income (expense) | (4,053,567 | ) | (154,772 | ) | 9,345 | 768,915 | ||||||||||
| Loss on extinguishment of debt | — | — | — | (7,166,110 | ) | |||||||||||
| Interest expense | (11,689,075 | ) | (1,281,513 | ) | — | (10,058,450 | ) | |||||||||
| Total other income (expense) | (15,742,642 | ) | (1,436,285 | ) | 9,345 | (16,455,645 | ) | |||||||||
| Income (loss) before provision for income tax | $ | (465,687,218 | ) | $ | 27,921,797 | $ | 11,212,087 | $ | 83,515,692 | |||||||
| Provision for income taxes | — | — | — | 33,805,480 | ||||||||||||
| Net income (loss) | $ | (465,687,218 | ) | $ | 27,921,797 | $ | 11,212,087 | $ | 49,710,212 | |||||||
| Pro forma earnings per share (unaudited): | ||||||||||||||||
| Pro forma earnings per share-basic and diluted | 0.67 | |||||||||||||||
| Pro forma weighted average shares-basic and diluted | 74,739,454 | |||||||||||||||
See accompanying notes to consolidated financial statements.
F-4
Coffeyville Resources, Inc.
CONSOLIDATED STATEMENTS OF EQUITY
| | Divisional Equity | Voting Preferred | Non-voting Common | Unearned Compensation | Total | ||||||||||||
|---|---|---|---|---|---|---|---|---|---|---|---|---|---|---|---|---|---|
| Predecessor | |||||||||||||||||
For years ended December 31, 2002 and 2003 and for the 62 days ended March 2, 2004 | |||||||||||||||||
Balance, January 1, 2001 | $ | 241,356,030 | $ | — | $ | — | $ | — | $ | 241,356,030 | |||||||
Net loss | (465,687,218 | ) | — | — | — | (465,687,218 | ) | ||||||||||
| Net contribution from Farmland Industries, Inc. | 274,104,793 | — | — | — | 274,104,793 | ||||||||||||
Balance, December 31, 2002 | 49,773,605 | — | — | — | 49,773,605 | ||||||||||||
Net income | 27,921,797 | — | — | — | 27,921,797 | ||||||||||||
| Net distribution to Farmland Industries, Inc. | (19,503,913 | ) | — | — | — | (19,503,913 | ) | ||||||||||
Balance, December 31, 2003 | 58,191,489 | — | — | — | 58,191,489 | ||||||||||||
Net income | 11,212,087 | — | — | — | 11,212,087 | ||||||||||||
| Net distribution to Farmland Industries, Inc. | (53,216,357 | ) | — | — | — | (53,216,357 | ) | ||||||||||
Balance, March 2, 2004 | $ | 16,187,219 | $ | — | $ | — | $ | — | $ | 16,187,219 | |||||||
| Successor | |||||||||||||||||
For 304 days ended December 31, 2004 | |||||||||||||||||
Members Equity, March 3, 2004 | $ | — | $ | — | $ | — | $ | — | $ | — | |||||||
| Issuance of 63,200,000 preferred units for cash | — | 63,200,000 | — | — | 63,200,000 | ||||||||||||
| Issuance of 11,152,941 common units to management for recourse promissory notes and unearned compensation | — | — | 3,100,000 | (3,037,000 | ) | 63,000 | |||||||||||
| Issuance of 500,000 common units to management for recourse promissory notes and unearned compensation | — | — | 2,047,450 | (2,044,600 | ) | 2,850 | |||||||||||
| Recognition of earned compensation expense related to common units | — | — | — | 1,095,609 | 1,095,609 | ||||||||||||
| Dividends on preferred ($1.50 per unit) | — | (94,686,276 | ) | — | — | (94,686,276 | ) | ||||||||||
| Dividends to management on common ($0.48 per unit) | — | — | (5,301,233 | ) | — | (5,301,233 | ) | ||||||||||
| Net income | — | 41,971,436 | 7,738,776 | — | 49,710,212 | ||||||||||||
| Members Equity, December 31, 2004 | $ | — | $ | 10,485,160 | $ | 7,584,993 | $ | (3,985,991 | ) | $ | 14,084,162 | ||||||
See accompanying notes to consolidated financial statements.
F-5
Coffeyville Resources, Inc.
CONSOLIDATED STATEMENTS OF CASH FLOWS
| | Predecessor | | |||||||||||||||
|---|---|---|---|---|---|---|---|---|---|---|---|---|---|---|---|---|---|
| | Successor | ||||||||||||||||
| | Years ended December 31, | | |||||||||||||||
| | 62 days ended March 2, 2004 | 304 days ended December 31, 2004 | |||||||||||||||
| | 2002 | 2003 | |||||||||||||||
| Cash flows from operating activities: | |||||||||||||||||
| Net income (loss) | $ | (465,687,218 | ) | $ | 27,921,797 | $ | 11,212,087 | $ | 49,710,212 | ||||||||
| Adjustments to reconcile net income (loss) to net cash provided by (used in) operating activities: | |||||||||||||||||
| Depreciation and amortization | 30,779,408 | 3,313,526 | 432,003 | 2,445,961 | |||||||||||||
| Provision for doubtful accounts | — | — | — | 190,468 | |||||||||||||
| Amortization of deferred financing costs | — | — | — | 1,332,890 | |||||||||||||
| Loss on extinguishment of debt | — | — | — | 7,166,110 | |||||||||||||
| Deferred income taxes | — | — | — | (615,680 | ) | ||||||||||||
| Reorganization expenses-impairment of property, plant, and equipment | 375,068,359 | 9,638,626 | — | — | |||||||||||||
| Earned stock compensation | — | — | — | 1,095,609 | |||||||||||||
| Changes in assets and liabilities net of acquisition: | |||||||||||||||||
| Accounts receivable | (11,050,472 | ) | (25,301,358 | ) | 19,635,303 | (26,258,228 | ) | ||||||||||
| Inventories | 10,390,924 | 10,371,108 | (6,399,677 | ) | 20,068,625 | ||||||||||||
| Prepaid expenses and other current assets | (4,942,016 | ) | (23,806,340 | ) | 25,716,107 | (4,071,874 | ) | ||||||||||
| Other assets | 179,551 | (90,733 | ) | 715,132 | (5,379,727 | ) | |||||||||||
| Accounts payable | 56,238,681 | 8,347,575 | (6,759,702 | ) | 31,059,282 | ||||||||||||
| Accrued income taxes | — | — | — | 1,301,160 | |||||||||||||
| Deferred revenue | — | 1,545,894 | 8,319,913 | 1,209,008 | |||||||||||||
| Other current liabilities | $ | 1,800,369 | $ | 419,415 | $ | 364,555 | 12,967,500 | ||||||||||
| Accrued environmental liabilities | 5,486,235 | 7,958,165 | (20,057 | ) | (1,746,043 | ) | |||||||||||
| Other long term liabilities | — | — | — | (689,372 | ) | ||||||||||||
| Net cash provided by (used in) operating activities | (1,736,179 | ) | 20,317,675 | 53,215,664 | 89,785,901 | ||||||||||||
Cash flows from investing activities: | |||||||||||||||||
| Cash paid for acquisition of Predecessor | — | — | — | (116,599,329 | ) | ||||||||||||
| Capital expenditures | (272,378,244 | ) | (813,762 | ) | — | (14,160,280 | ) | ||||||||||
| Net cash used in investing activities | (272,378,244 | ) | (813,762 | ) | — | (130,759,609 | ) | ||||||||||
Cash flows from financing activities: | |||||||||||||||||
| Revolving debt payments | — | — | — | (57,686,789 | ) | ||||||||||||
| Revolving debt borrowings | — | — | — | 57,743,299 | |||||||||||||
| Proceeds from issuance of long-term debt | — | — | — | 171,900,000 | |||||||||||||
| Principal payments on long-term debt | — | — | — | (23,025,000 | ) | ||||||||||||
| Repayment of capital lease obligation | — | — | — | (1,176,424 | ) | ||||||||||||
| Net divisional equity (distribution) contribution | 274,104,793 | (19,503,913 | ) | (53,216,357 | ) | — | |||||||||||
| Payment of deferred financing costs | — | — | — | (16,309,917 | ) | ||||||||||||
| Prepayment penalty on extinguishment of debt | — | — | — | (1,095,000 | ) | ||||||||||||
| Issuance of members equity | — | — | — | 63,263,000 | |||||||||||||
| Distribution of members' equity | — | — | — | (99,987,509 | ) | ||||||||||||
| Net cash provided by (used in) financing activities | 274,104,793 | (19,503,913 | ) | (53,216,357 | ) | 93,625,660 | |||||||||||
| Net increase (decrease) in cash | (9,630 | ) | — | (693 | ) | 52,651,952 | |||||||||||
| Cash and cash equivalents, beginning of period | 11,880 | 2,250 | 2,250 | — | |||||||||||||
| Cash and cash equivalents, end of period | $ | 2,250 | $ | 2,250 | $ | 1,557 | $ | 52,651,952 | |||||||||
| Supplemental disclosures: | |||||||||||||||||
| Cash paid for income taxes | — | — | — | $ | 33,820,000 | ||||||||||||
| Cash paid during the year for interest | — | — | — | $ | 8,570,069 | ||||||||||||
See accompanying notes to consolidated financial statements.
F-6
Coffeyville Resources, Inc.
NOTES TO CONSOLIDATED FINANCIAL STATEMENTS
(1) Organization and Nature of Business and the Acquisition
General
Coffeyville Resources, Inc. (Coffeyville) was incorporated in Delaware in January 2005. It is expected that prior to this offering, the five direct subsidiaries of Coffeyville Group Holdings, LLC (Successor) will merge with and into Coffeyville and that Coffeyville, as the registrant, will issue 74,852,941 shares of common stock to Successor.
Successor is a Delaware limited liability company formed in October 2003. There was no financial statement activity until March 3, 2004, when Successor, acting through wholly-owned subsidiaries, acquired the assets of the former Farmland Industries, Inc. (Farmland) Petroleum Division and one facility located in Coffeyville, Kansas within Farmland's eight-plant Nitrogen Fertilizer Manufacturing and Marketing Division (collectively, the Predecessor) (the Acquisition). Farmland was a farm supply cooperative and a processing and marketing cooperative. The Predecessor operated as a division of Farmland (Petroleum), and a plant within a division of Farmland (Nitrogen Fertilizer). The accompanying Predecessor financial statements principally reflect the refining, crude oil gathering, and petroleum distribution operations of Farmland and the only coke gasification plant of Farmland's nitrogen fertilizer operations. Successor, acting through wholly-owned subsidiaries, is an independent petroleum refiner and marketer in the mid-continental United States and a producer and marketer of upgraded nitrogen fertilizer products in North America. Since the assets and liabilities of the Successor are presented on a new basis of accounting, the financial information for the Successor is not comparable to the financial information of the Predecessor prior to March 3, 2004.
As of March 3, 2004, Successor owned 100% of Coffeyville Refining and Marketing, Inc. (CRM); Coffeyville Nitrogen Fertilizers, Inc. (CNF); Coffeyville Crude Transportation, Inc. (CCT); Coffeyville Pipeline, Inc. (CP); and Coffeyville Terminal, Inc. (CT) (collectively, CRIncs). CRIncs own 100% of Coffeyville Resources, LLC (CRLLC) and its wholly owned subsidiaries, Coffeyville Resources Refining and Marketing, LLC (CRRM); Coffeyville Resources Nitrogen Fertilizer, LLC (CRNF); Coffeyville Resources Crude Transportation, LLC (CRCT); Coffeyville Resources Pipeline, LLC (CRP); and Coffeyville Resources Terminal, LLC (CRT).
On October 8, 2004, Successor, acting through its wholly owned subsidiaries, CRM and CNF, contributed 68.7% of its membership interest in CRLLC to CL JV Holdings, LLC (CLJV), a Delaware limited liability company formed on September 27, 2004, in exchange for a controlling interest in CLJV. Concurrently, The Leiber Group, Inc., a company whose majority stockholder is Pegasus Partners II, L.P., the Successor's principal stockholder, contributed to CLJV its interest in the Judith Leiber business, which is a designer hand-bag business, in exchange for a minority interest in CLJV. The Judith Leiber business is owned through Leiber Holdings, LLC (LH), a Delaware limited liability company wholly owned by CLJV. Based on the relative values of the properties at the time of contribution to CLJV, CRM and CRF collectively are entitled to 80.5% of CLJV's net profits and net losses. Under the terms of CRLLC's credit agreement, CRLLC is permitted to make tax distributions to its members, including CLJV, in amounts equal to the tax liability which would be incurred by CRLLC if its net income were subject to corporate level income tax. From the tax distributions CLJV received from CRLLC as of December 31, 2004, CLJV contributed $1,600,000 to LH as an additional capital investment.
On , 2005, CLJV liquidated and distributed the contributed businesses back to the respective contributing parties so that The Lieber Group, Inc. received the Judith Lieber business and CRM and CNF received their membership interests in CRLLC. In connection with the liqudation, CRLLC distributed $ million to CLJV which then distributed the same amount to The Leiber
F-7
Group, Inc, in order to fully redeem its interest in CLJV. The amount of the cash distribution represented the difference between The Leiber Group, Inc.'s capital account in CLJV (taking into account the allocations that would be made if CLJV sold all of its assets for fair market value immediately prior to the distribution) and the fair market value of the Leiber business as of the liquidation date.
The operations of LH and its subsidiaries (Leiber) have not been included in the accompanying consolidated financial statements of Coffeyville because Leiber's operations are unrelated to and will not be part of the ongoing operations of Coffeyville. CLJV's contributions to LH of $1,600,000 have been reflected as a reduction to accrued income taxes in the accompanying consolidated balance sheets to appropriately reflect the accrued income tax obligation of the Successor as of December 31, 2004.
The pro forma balance sheet as of December 31, 2004 contains a pro forma adjustment for the estimated distribution of approximately $ million to CLJV which will then distribute the same amount to The Leiber Group, Inc. This distribution is shown as a dividend payable in the pro forma balance sheet as of December 31, 2004 and reflected as a reduction in members' equity.
Farmland Industries, Inc.'s Bankruptcy Proceedings and the Acquisition
On May 31, 2002 (the Petition Date), Farmland Industries, Inc. and four of its subsidiaries, Farmland Foods, Inc., Farmland Pipeline Company, Inc., Farmland Transportation, Inc., and SFA, Inc. (collectively, the Debtors or Farmland), filed voluntary petitions for protection under Chapter 11 of the United States Bankruptcy Code (the Bankruptcy Code) in the United States Bankruptcy Court, Western District of Missouri (the Court). The Petroleum and Nitrogen Divisions were divisions of Farmland, and therefore their assets and liabilities were included in the bankruptcy filings. Farmland continued to manage the business as debtor-in-possession but could not engage in transactions outside the ordinary course of business without the approval of the Court.
As a result of the filing on May 31, 2002 of petitions under Chapter 11 of the Bankruptcy Code by the Debtors, the accompanying Predecessor's financial statements have been prepared in accordance with AICPA Statement of Position (SOP) 90-7,Financial Reporting by Entities in Reorganization Under the Bankruptcy Code, and accounting principles generally accepted in the United States of America, applicable to a going concern, which, unless otherwise noted, assume the realization of assets and the payment of liabilities in the ordinary course of business. See note 3,Summary of Significant Accounting Policies—Liabilities Subject to Compromise, for additional information regarding SOP 90-7.
As debtors-in-possession, the Debtors, subject to any required Court approval, may elect to assume or reject real estate leases, employment contracts, personal property leases, service contracts, and other unexpired executory pre-petition contracts. Damages related to rejected contracts are a pre-petition claim. The Petroleum Segment had no material accruals for any damages as of December 31, 2003. The Nitrogen Fertilizer Segment rejected an operating and maintenance agreement with a vendor resulting in an accrual of approximately $1,250,000 as of December 31, 2003 which was charged to reorganization expenses in the year ended December 31, 2003.
Pursuant to the provisions of the Bankruptcy Code, on November 27, 2002, the Debtors filed with the Court a Plan of Reorganization under which the Debtors' liabilities and equity interests would be restructured. Subsequently, on July 31, 2003, the Debtors filed with the Court an Amended Plan of Reorganization. The Amended Plan of Reorganization, (the Amended Plan) as filed, in effect contemplated that the Debtors would continue in existence solely for the purpose of liquidating any
F-8
remaining assets of the estate, including the Petroleum and Nitrogen Fertilizer Segments. In accordance with the Amended Plan, on October 10, 2003 the Court entered an order approving the auction and bid procedures for the sale of the Petroleum Division and Coffeyville nitrogen fertilizer plant to subsidiaries of Successor. Through an auction process conducted by the court on March 3, 2004, the assets of the Predecessor were sold to the Successor for $106,727,365 and the assumption of $23,216,554 of liabilities. The Successor also paid transactions costs of $9,871,964, which consisted of legal, accounting, and advisory fees of $7,371,964 paid to various parties, and a finder's fee of $2,500,000 paid to Pegasus Capital Advisors, L.P. (see note 13). The Successor's primary reason for the purchase was the belief that long-term fundamentals for the refining industry were strengthening and the capital requirement was within their desired investment range. The cost of the Acquisition was financed through long-term borrowings of approximately $60.7 million and the issuance of preferred units of approximately $63.2 million. The allocation of the purchase price at March 3, 2004, the date of the Acquisition, is as follows:
| Assets acquired | ||||
Inventories | $ | 100,491,131 | ||
| Prepaid expenses and other current assets | 1,085,598 | |||
| Property plant and equipment | 38,239,154 | |||
| Total assets acquired | $ | 139,815,883 | ||
Liabilities assumed | ||||
Deferred revenue | $ | 9,910,897 | ||
| Capital lease obligations | 1,176,424 | |||
| Environmental obligations | 10,846,980 | |||
| Other long term liabilities | 1,282,253 | |||
| Total liabilites assumed | $ | 23,216,554 | ||
Cash paid for acquistion of Predecessor | $ | 116,599,329 | ||
Pro forma revenue would be unchanged for the periods presented. Pro forma net income as if the Acquisition and subsequent debt refinancing had occurred on January 1, 2003 compared to the historical net income presented below is as follows (in thousands):
| | Historical | Pro Forma | ||||
|---|---|---|---|---|---|---|
| Year ended December 31, 2004 | $ | 60,922 | (1) | $ | 59,753 | |
| Year ended December 31, 2003 | $ | 27,922 | $ | 17,909 | ||
- (1)
- Reflects the sum of the results of operations for the periods ended March 2, 2004 and December 31, 2004.
F-9
(2) Basis of Presentation
The accompanying Predecessor financial statements reflect an allocation of certain general corporate expenses of Farmland, including general and corporate insurance, corporate retirement and benefits, human resources and payroll department salaries, facility costs, information services, and information systems support. Those costs allocated to the Predecessor were $6,324,513, $12,709,178 and $3,802,996 for 2002, 2003, and the 62 day period ended March 2, 2004, respectively, and are included in selling, general and administrative expenses. These allocations were based on a variety of factors dependent on the nature of the costs, including fixed asset levels, administrative headcount, and production headcount. Beginning in 2002, the Petroleum Division and Coffeyville nitrogen plant represented a continually increasing percentage of Farmland's business as a result of Farmland's restructuring efforts, which by December 2003 included the disposition of nearly all Farmland's operating assets with the exception of the Petroleum Division and Coffeyville nitrogen plant. As a result, the Petroleum Division and Coffeyville nitrogen plant were allocated a higher percentage of corporate cost in 2003 than 2002 and an even larger percentage in the 62 day period ended on March 2, 2004. The costs of these services are not necessarily indicative of the costs that would have been incurred if Coffeyville had operated as a stand-alone entity. Reorganization expenses for legal and professional fees incurred by Farmland in connection with the bankruptcy proceedings were not allocated to the Predecessor. In addition, umbrella property insurance premiums were allocated across Farmland's divisions based on recoverable values. Property insurance costs allocated to the Predecessor were $2,111,004, $2,060,532 and $357,324 for the years ended 2002, 2003, and the 62 day period ended March 2, 2004, respectively and are included in costs of goods sold. All interest expense prior to the Petition Date and interest on secured borrowings subsequent to the Petition Date were allocated based on identifiable net assets of each of Farmland's divisions. Under bankruptcy law, payment of interest on Farmland's unsecured debt was stayed beginning on the Petition Date. Accordingly, Farmland did not allocate any interest on its unsecured borrowings to the Predecessor since its Petition Date. Management believes all allocations described above were made on a reasonable basis.
Farmland used a centralized approach to cash management and the financing of its operations. As a result, amounts owed to or from Farmland are reflected as a component of divisional equity on the accompanying balance sheets. The Farmland divisional equity represents the net investment Farmland had in the reporting entity.
(3) Summary of Significant Accounting Policies
Principles of Consolidation
The accompanying consolidated financial statements include the accounts of Coffeyville. All significant intercompany balances and transactions have been eliminated in consolidation.
Cash and Cash Equivalents
For purpose of the statements of cash flows, Coffeyville considers all highly liquid debt instruments with original maturities of three months or less be cash equivalents. Coffeyville has restricted cash held for debt repayment of $0 and $3,500,000 at December 31, 2003 and 2004, respectively, that is reflected in other assets on the balance sheet as the restriction is for the term of the debt (see note 6).
F-10
Accounts Receivable
Coffeyville grants credit to its customers. Credit is extended based on the evaluation of a customer's financial condition; generally, collateral is not required. Accounts receivable are due on negotiated terms and are stated at amounts due from customers, net of an allowance for doubtful accounts. Accounts outstanding longer than their contractual payment terms are considered past due. Coffeyville determines its allowance for doubtful accounts by considering a number of factors including the length of time trade accounts are past due, the customer's ability to pay its obligations to Coffeyville, and the condition of the general economy and the industry as a whole. Coffeyville writes off accounts receivable when they become uncollectible, and payments subsequently received on such receivables are credited to the allowance for doubtful accounts. At December 31, 2003, 38% of the accounts receivable balance was from one customer. At December 31, 2004, three customers each individually represented greater than 10% and collectively represented 38% of the accounts receivable balance. The largest concentration to any one customer at December 31, 2004 was 15% of the accounts receivable balance.
Inventories
Inventories consist primarily of crude oil, blending stock and components, work in progress, fertilizer products, and refined fuels and by-products which are valued at the lower of moving average cost, which approximates first-in first-out (FIFO), or market for fertilizer products and lower of FIFO cost or market for refined fuels and by-products for all periods presented. Refinery unfinished and finished products inventory values were determined using the "ability to bare" process, whereby raw materials and production costs are allocated to work-in-process and finished products based on their relative fair values. Other inventories, including other raw materials, spare parts, and supplies, are valued at the lower of average cost, which approximates FIFO, or market. The cost of inventories includes inbound freight costs.
In connection with the initial distribution of the accompanying Predecessor financial statements for purposes of effecting a business combination, the Predecessor changed its method of accounting for inventories from the last-in, first-out (LIFO) method to the FIFO method. Management believes the FIFO method is preferable in the circumstances because the FIFO method is considered to represent a better matching of costs with related revenues under current volatile market conditions. Accordingly, crude oil, blending stock and components, work in progress, and refined fuels and by-products are valued at the lower of FIFO cost or market for all years presented.
Prepayment for Crude Oil
Subsequent to the Petition Date, Predecessor was required to prepay for crude oil deliveries to the refinery. As of December 31, 2003, $24,986,936 had been paid for crude oil for which title had not transferred to the Predecessor.
F-11
Property, Plant, and Equipment
Assets are stated at cost. Depreciation is computed using principally the straight-line method over the estimated useful lives of the assets. The useful lives are as follows:
| | Range of useful lives, in years | |
|---|---|---|
| Improvements to land | 15 to 20 | |
| Buildings | 20 to 30 | |
| Machinery and equipment | 5 to 30 | |
| Automotive equipment | 5 | |
| Furniture and fixtures | 3 to 5 |
The Coffeyville nitrogen plant fixed assets were financed through an operating lease through February 8, 2002. On February 8, 2002, Farmland prepaid the outstanding balance of the operating lease and collateralized the assets into its newly refinanced credit facility. These assets of approximately $260 million were recorded in 2002 through a contribution of divisional equity.
Planned Major Maintenance Costs
The direct-expense method of accounting is used for planned major maintenance activities. Maintenance costs are recognized as expense as maintenance services are performed. During 2002, the Coffeyville petroleum refinery was shut down for approximately four weeks in order to perform planned major maintenance. Normal operation levels were not reached for an additional two weeks. Costs associated with this shutdown are included in cost of goods sold for the year ended December 31, 2002, and were approximately $16,998,000. During the 304 day period ended December 31, 2004, the Coffeyville nitrogen plant completed a major scheduled turnaround. Costs associated with the turnaround of approximately $1,800,000 are included in cost of goods sold for that period.
Income Taxes
The Predecessor was not a separate legal entity, and its operating results were included with the operating results of Farmland and its subsidiaries in filing consolidated Federal and state income tax returns. As a cooperative, Farmland was subject to income taxes on all income not distributed to patrons as qualified patronage refunds and Farmland did not allocate income taxes to its divisions. As a result, the accompanying Predecessor financial statements do not reflect any provision for income taxes.
Deferred income taxes for the Successor are recognized for the tax consequences of temporary differences by applying enacted statutory tax rates applicable to future years for differences between the financial statement carrying amounts and the tax bases of existing assets and liabilities.
Impairment of Long-Lived Assets
Coffeyville accounts for long-lived assets in accordance with Statement of Financial Accounting Standards No. 144 (SFAS 144),Accounting for the Impairment or Disposal of Long-Lived Assets. In accordance with SFAS No. 144, Coffeyville reviews long-lived assets for impairment whenever events or changes in circumstances indicate that the carrying amount of an asset may not be recoverable. Recoverability of assets to be held and used is measured by a comparison of the carrying amount of an
F-12
asset to estimated undiscounted future net cash flows expected to be generated by the asset. If the carrying amount of an asset exceeds its estimated future undiscounted net cash flows, an impairment charge is recognized by the amount by which the carrying amount of the assets exceeds the fair value of the assets. Assets to be disposed of are reported at the lower of the carrying value or fair value less cost to sell.
In its Plan of Reorganization, Farmland stated, among other things, its intent to dispose of its petroleum and nitrogen assets. Despite this stated intent, these assets were not classified as held for sale under SFAS 144 because, ultimately, any disposition required approval of the Court and the Court did not ultimately approve such disposition until March 3, 2004. Since Farmland determined that it was more likely than not that its petroleum and nitrogen fertilizer assets would be disposed of, those assets were tested for impairment in 2002 pursuant to SFAS 144, using projected undiscounted net cash flows based on Farmland's best assumptions regarding the use and eventual disposition of those assets, primarily from indications of value received from potential bidders through the bankruptcy sales process. Based on the tests, assumptions and determinations as of the impairment testing date, the assets were determined to be impaired. Farmland's best estimate at December 31, 2002 was that the carrying value of these assets exceeded the fair value expected to be received on disposition of these assets by $375,068,359. Accordingly, an impairment charge was recognized for such amount in 2002. The ultimate proceeds from disposition of these assets resulted from a bidding and auction process conducted in the bankruptcy proceedings. In 2003, as a result of receiving a stalking horse bid from Coffeyville Resources, LLC in the bankruptcy court's sales process, Farmland revised its estimate for the amount to be generated from the disposition of these assets, and an additional impairment charge of $9,638,626 was taken.
Revenue Recognition
Sales are recognized when the product is delivered and all significant obligations of Coffeyville have been satisfied. Deferred sales represent customer prepayments under contracts to guarantee a price and supply of nitrogen fertilizer in quantities expected to be delivered in the next 12 months in the normal course of business.
Shipping Costs
Pass-through finished goods delivery costs reimbursed by customers are reported in sales, while an offsetting expense is included in cost of goods sold.
Derivative Commodity Instruments and Fair Value of Financial Instruments
Coffeyville uses futures contracts, options, and forward contracts primarily to reduce the exposure to changes in crude oil prices and to provide economic hedges of inventory positions and forecasted transactions. These derivative instruments have not been designated as hedges for accounting purposes. Accordingly, these instruments are recorded in the consolidated balance sheets at fair value, and each period's gain or loss is recorded as a component of other income (expense) in accordance with Statement of Financial Accounting Standards No. 133,Accounting for Derivative Instruments and Hedging Activities, as amended by No. 149 (SFAS 149)Amendment of Statement 133 on Derivative Instruments and Hedging Activities.
F-13
Financial instruments consisting of cash and cash equivalents, accounts receivable, and accounts payable are carried at cost, which approximates fair value, as a result of the short-term nature of the instruments. The carrying value of long-term and revolving debt approximates fair value as a result of the floating interest rates assigned to these financial instruments.
Environmental Expenditures
Liabilities related to remediation of past environmental contamination of properties are recognized when the related costs are considered probable and can be reasonably estimated. Estimates of these costs are based upon currently available facts, existing technology, site-specific costs, and currently enacted laws and regulations. In reporting environmental liabilities, no offset is made for potential recoveries. All liabilities are monitored and adjusted as new facts or changes in law or technology occur. Environmental expenditures are capitalized when such costs provide future economic benefits.
Liabilities Subject to Compromise
As a result of the filed petitions under Chapter 11 of the Bankruptcy Code, the Predecessor's financial statements have been prepared in accordance with SOP'S 90-7,Financial Reporting by Entities in Reorganization Under the Bankruptcy Code. Virtually all liabilities, litigation, and other claims against the Debtors that were in existence as of the Petition Date are stayed unless the stay is modified or lifted or the Court authorizes payment. SOP 90-7 does not change the application of accounting principles generally accepted in the United States of America in the preparation of financial statements. However, it does require that the financial statements for the periods including and subsequent to filing the Chapter 11 petition distinguish transactions and events which are directly associated with the reorganization from the ongoing operations of the business.
SOP 90-7 requires (a) that pre-petition liabilities which are subject to compromise be segregated in the balance sheet as liabilities subject to compromise, and (b) that revenues, expenses, realized gains and losses, and provisions for losses resulting from the reorganization of the Debtors be reported separately as reorganization expenses in the statement of operations. Liabilities subject to compromise were not assumed by the Successor in the Acquisition described in note 1.
As a result of the Chapter 11 filings, substantially all pre-petition indebtedness of the Debtors was subject to compromise or other treatment under the Plan of Reorganization. Generally, actions to enforce or otherwise effect payment of pre-Chapter 11 liabilities are stayed. These claims are reflected in the accompanying balance sheets as liabilities subject to compromise. Pre-petition claims secured by the Debtors' assets are also stayed, although the holders of such claims have the right to move the Court for relief from the stay. Accordingly, secured claims have not been reflected as liabilities subject to compromise. Following the Chapter 11 filings, the Petroleum and Nitrogen Fertilizer Divisions paid
F-14
undisputed post-petition claims of all vendors and suppliers in the ordinary course of business. As of December 31, 2003 liabilities subject to compromise consisted of the following (in thousands):
| | Predecessor | ||
|---|---|---|---|
| | December 31, | ||
| | 2003 | ||
| Trade accounts payable | $ | 103,934 | |
| Rejection damages on executory contracts | 1,250 | ||
| $ | 105,184 | ||
Use of Estimates
The preparation of financial statements in conformity with U.S. generally accepted accounting principles requires management to make estimates and assumptions that affect the reported amounts of assets and liabilities and the disclosure of contingent assets and liabilities at the date of the financial statements and the reported amounts of revenues and expenses during the reporting period. Actual results could differ from those estimates.
Earnings Per Share
Earnings per share for the Successor is calculated on a pro forma basis, based on an assumed number of shares outstanding at the time of the public offering with respect to the existing shares. Coffeyville has assumed that prior to this offering, the five direct subsidiaries of Coffeyville Group Holdings, LLC will merge with and into Coffeyville Resources, Inc. and that Coffeyville Resources, Inc. will issue 74,852,941 shares of common stock to Coffeyville Group Holdings, LLC. No effect has been given to any incremental shares that might be issued in the initial public offering.
Per share data has been omitted for the Predecessor because, under Farmland's cooperative structure, earnings of the Predecessor were distributed as patronage dividends to members and associate members based on the level of business conducted with the Predecessor as opposed to a common shareholder's proportionate share of underlying equity in the Predecessor.
Recently Adopted Accounting Standards
In June of 2001, the FASB issued SFAS No. 143, "Accounting for Asset Retirement Obligations". This statement provides accounting and disclosure requirements for retirement obligations associated with long-lived assets and became effective January 1, 2003. SFAS No. 143 requires that the fair value of a liability for an asset retirement obligation be recognized in the period in which it is incurred with the associated asset retirement costs being capitalized as a part of the carrying amount of the long-lived asset. SFAS No. 143 also includes disclosure requirements that provide a description of asset retirement obligations and reconciliation of changes in the components of those obligations. The Predecessor increased its environmental accrual by $1,018,461 as result of its implementation of SFAS No. 143. The accrued amount was recognized in the selling, general and administrative expenses in the year ended December 31, 2003.
F-15
In April 2003, the FASB issued Statement of Financial Accounting Standards No. 149 (SFAS 149),Amendment of Statement 133 on Derivative Instruments and Hedging Activities. SFAS 149 amends and clarifies financial accounting and reporting for derivative instruments, including certain derivative instruments embedded in other contracts and for hedging activities under FASB Statement No. 133,Accounting for Derivative Instruments and Hedging Activities. SFAS 149 is effective for contracts entered into or modified after June 30, 2003 except for contracts entered into during fiscal quarters that began prior to June 15, 2003 and for hedging relationships designated after June 30, 2003. All provisions of this statement have been applied prospectively with no significant impact to Coffeyville's financial condition or results of operations.
In May 2003, the FASB issued Statement of Financial Accounting Standards No. 150 (SFAS 150),Accounting for Certain Financial Instruments with Characteristics of both Liabilities and Equity. SFAS 150 establishes standards for how an issuer classifies and measures certain financial instruments with characteristics of both liabilities and equity. It requires that an issuer classify a financial instrument which is within its scope as a liability (or an asset in some circumstances). SFAS 150 is effective for the first interim period beginning after June 15, 2003. Coffeyville does not have financial instruments with characteristics of both liabilities and equity; therefore, the adoption of this statement has not had an impact on Coffeyville's consolidated financial condition or results of operations.
In December 2003, the FASB issued FASB Interpretation No. 46(R) (FIN 46(R)),Consolidation of Variable-Interest Entities. FIN 46(R) requires that variable-interest entities be consolidated by their primary beneficiary. FIN 46(R) became effective for all public entities by the end of the first reporting period ended after December 15, 2003. Coffeyville does not have investments in or any relationships with any variable-interest entities, and therefore the adoption of this statement has not had an impact on Coffeyville's consolidated financial condition or results of operations.
(4) Member's Equity
The Successor issued 63,200,000 voting preferred units at $1 par value for cash to finance the Acquisition, as described in note 1. The preferred units are the only voting units of the Successor and, prior to May 10, 2004, had preferential rights to distributions. The preference required that the holders of preferred units were to be distributed $63,200,000, plus a preferred yield equal to 15% per annum compounded monthly, before any distributions could be made to holders of common units.
Concurrent with the issuance of the preferred units, management of the Successor were issued 11,152,941 nonvoting, restricted common units for recourse promissory notes aggregating $63,000. Based on the estimated relative fair value of the restricted common units on March 3, 2004, $3,100,000 was allocated to the common units. Accordingly, unearned compensation of $3,037,000 was recognized as a contra-equity balance in the accompanying consolidated balance sheet. The holders of common units were not vested at the date of issuance and do not have voting rights. Prior to May 10, 2004, distribution rights were subordinated to the preferred unit holders, as described above. On May 10, 2004, the promissory notes were repaid with cash and an additional 500,000 nonvoting, restricted common units were issued to an officer of the Successor for a recourse promissory note of $2,850. Based on the estimated fair value of the units on May 10, 2004, unearned compensation of $2,044,600 was recognized as a contra-equity balance in the accompanying consolidated balance sheet. As of
F-16
December 31, 2004 162/3% of the restricted common units were vested. The units vest in accordance with the following schedule:
| Vesting Date | Percentage Vested on Vesting Date | ||
|---|---|---|---|
| May 10, 2005 | 162/3 | % | |
| November 10, 2005 | 162/3 | % | |
| May 10, 2006 | 162/3 | % | |
| November 10, 2006 | 162/3 | % | |
| May 10, 2007 | 162/3 | % |
Based on the vesting schedule above, the Successor recognized $1,095,609 in compensation expense as of December 31, 2004 related to the unearned compensation.
On May 10, 2004, the Successor refinanced its existing long term debt with a $150 million term loan and used the proceeds of the borrowings to repay the outstanding borrowings under the Successor's previous credit facility. The borrowings were also used to distribute a $99,987,509 dividend, which included the preference payment of $63,200,000 plus the yield of $1,802,956 to the preferred unit holders and a $63,000 payment to the common unit holders for undistributed capital per the LLC agreement. The remaining $34,921,553 was distributed to the preferred and common unit holders pro rata according to their ownership percentages, as determined in the aggregate combining both the common and preferred units.
All distributions subsequent to May 10, 2004 will be based on the relative ownership percentages, as determined by dividing the number of units held by a holder (consisting of preferred or common units) by the sum total of the preferred and common when added together.
(5) Inventories
Inventories at December 31, 2003 and 2004 consisted of the following (in thousands):
| | Predecessor | Successor | ||||
|---|---|---|---|---|---|---|
| | December 31, 2003 | December 31, 2004 | ||||
| Finished goods | $ | 19,608 | $ | 24,704 | ||
| Raw material and catalyst | 43,561 | 26,136 | ||||
| In process inventories | 10,224 | 14,059 | ||||
| Parts and supplies | 13,509 | 15,524 | ||||
| $ | 86,902 | $ | 80,423 | |||
F-17
(6) Other Assets
Other assets at December 31 2003 and 2004 consisted of the following (in thousands):
| | Predecessor | Successor | ||||
|---|---|---|---|---|---|---|
| | December 31, 2003 | December 31, 2004 | ||||
| Deferred financing costs | $ | — | $ | 7,207 | ||
| Restricted cash held for | ||||||
| debt repayment | — | 3,500 | ||||
| Prepaid insurance charges | — | 3,047 | ||||
| Other assets | 1,164 | 479 | ||||
| $ | 1,164 | $ | 14,233 | |||
Deferred financing costs of $6,300,727 were paid in the Acquisition described in note 1. Additional deferred financing costs of $10,009,193 were paid with the debt refinancing on May 10, 2004, as described in notes 4 and 8. The initial deferred financing costs were written off when the related debt was extinguished and refinanced with the existing credit facility. A prepayment penalty of $1,095,000 on the previous credit facility was also paid and expensed and included in loss of extinguishment of debt in 2004. For the 304 days ended December 31, 2004, amortization of deferred financing costs reported as interest expense was $1,332,890, using the effective interest amortization method.
On March 3, 2004, the Successor prepaid two environmental insurance policies. One for environmental site protection and the other is a cost cap remediation policy for costs to be incurred beyond the next twelve months. See note 11 for a further description of the environmental commitment and contingencies.
Estimated amortization of deferred financing charges and prepaid insurance for the next five years is as follows (in thousands):
| Year ending December 31, | Deferred Financing | Prepaid Insurance | ||||||
|---|---|---|---|---|---|---|---|---|
| 2005 | $ | 1,699 | $ | 1,241 | ||||
| 2006 | 1,682 | 689 | ||||||
| 2007 | 1,665 | 382 | ||||||
| 2008 | 1,652 | 321 | ||||||
| 2009 | 1,631 | 321 | ||||||
| Thereafter | 577 | 1,334 | ||||||
| $ | 8,906 | $ | 4,288 | |||||
| Less current portion | (1,699 | ) | (1,241 | ) | ||||
| Total long-term | $ | 7,207 | $ | 3,047 | ||||
F-18
(7) Property, Plant, and Equipment
A summary of costs for property, plant, and equipment at December 31, is as follows
(in thousands):
| | Predecessor | Successor | ||||
|---|---|---|---|---|---|---|
| | December 31, 2003 | December 31, 2004 | ||||
| Land and improvements | $ | 6,427 | $ | 1,061 | ||
| Buildings | 3,805 | 768 | ||||
| Machinery and equipment | 289,613 | 39,617 | ||||
| Automotive equipment | 5,282 | 660 | ||||
| Furniture and fixtures | 4,295 | 1,372 | ||||
| Construction in progress | 1,868 | 8,738 | ||||
| 311,290 | 52,216 | |||||
| Accumulated depreciation | 284,282 | 2,210 | ||||
| $ | 27,008 | $ | 50,006 | |||
(8) Long-term Debt
At March 3, 2004, the Successor entered into an agreement with a financial institution for a term loan of $21,900,000 with an interest rate based on the greater of the Index Rate (the greater of prime or federal funds rate plus 50 basis points per annum) plus 4.5% or 9%, and a $100,000,000 revolving credit facility with interest at the borrower's election of either the Index Rate plus 3% or the LIBOR rate plus 3.5%. $21,900,000 of the term loan and $38,821,970 of the revolving credit facility were used to finance the Acquisition on March 3, 2004 as described in note 1. These borrowings were repaid on May 10, 2004 in connection with the refinancing described below.
Effective May 10, 2004, the Successor entered into a $75,000,000 revolving loan facility with a syndicate of banks, financial institutions, and institutional lenders, which expires on May 10, 2009. Borrowings are limited to 80% of eligible accounts receivable plus 75% of eligible inventories less the face amount of any outstanding letters of credit. The maximum commitment fee payable on the unused portion of the revolving loan facility is 0.50%. There were outstanding borrowings of $56,510 at December 31, 2004.
Effective May 10, 2004, the Successor entered into a $150,000,000 term loan and security agreement with a syndicate of banks, financial institutions, and institutional lenders. Principal payments in the amount of $375,000 are due quarterly commencing on the last day of the fiscal quarter in which the term loan was made and continue quarterly with a final payment of the aggregate remaining unpaid principal balance due on May 10, 2010.
On both the revolving loan facility and the term loan, the Successor has the option of a LIBOR rate or an Index Rate (rate based on the current prime rate). Interest is paid quarterly when using the Index Rate and at the expiration of the LIBOR term selected when using the LIBOR rate and varies with the Index Rate or LIBOR rate in effect at the time of the borrowing. An applicable margin is added with respect to the revolving loan facility as follows: (a) for Index Rate advances, plus 1.00% per annum, (b) for LIBOR Rate advances, plus 3.00% per annum. For the term loan, the applicable rates
F-19
are the Index Rate plus 4.0% per annum or the LIBOR rate plus 5% per annum. The interest rate on the term loan on December 31, 2004 was 7.55%.
Both loan facilities are secured by substantially all of the Successor's real and personal property, including receivables, contract rights, general intangibles, inventories, equipment, and financial assets.
The loan and security agreements contain customary restrictive covenants applicable to the Successor including limitations on the level of additional indebtedness, capital expenditures, payment of dividends, creation of liens, and sale of assets. These covenants also require the Successor to maintain specified financial ratios as follows:
- •
- minimum fixed charge coverage ratio of 1.25 to 1.00;
- •
- maximum leverage ratio of 3.50 to 1.00; and
- •
- minimum interest coverage ratio of 2.00 to 1.00.
Failure to comply with the various restrictive and affirmative covenants of the loan agreement could negatively impact the Successor's ability to incur additional indebtedness and/or pay required distributions. The Successor is required to measure these financial tests and covenants quarterly and was in compliance with all covenants and reporting requirements under the terms of the agreement at December 31, 2004. Effective March 30, 2005, the Successor entered into an amendment to its credit agreement. The amendment includes a change to the maximum leverage ratio covenant from a ratio of 3.5:1.0 to a ratio of 2.0:1.0 in the event CLJV is liquidated as described in Note 1 and the Successor does not, within 90 days after such liquidation, (1) successfully consummate a public offering or (2) prepay in full all loan obligations immediately prior to or simultaneously with a disposition by Pegasus, its Affiliates and the other unit holders of Coffeyville Group Holdings, LLC or a disposition of all, or substantially all of the assets of the Credit Parties.
Long-term debt consisted of the following at December 31, 2004:
| Long-term debt | $ | 148,875,000 | ||
| Less current portion of long-term debt | (1,500,000 | ) | ||
| $ | 147,375,000 | |||
Future maturities of long-term debt are as follows:
| Years ending December 31, | | |||
|---|---|---|---|---|
| 2005 | $ | 1,500,000 | ||
| 2006 | 1,500,000 | |||
| 2007 | 1,500,000 | |||
| 2008 | 1,500,000 | |||
| 2009 | 1,500,000 | |||
| Thereafter | 141,375,000 | |||
| $ | 148,875,000 | |||
F-20
At December 31, 2004, Successor had $4.1 million in letters of credit outstanding to secure the Successor's environmental obligations and for motor fuels tax. The letters of credit expire in June, July, and August 2005. There were no letters of credit outstanding at December 31, 2003.
(9) Benefit Plans
The Successor sponsors two defined-contribution 401(k) plans (the Plans) for all employees. Participants in the Plans may elect to contribute up to 50% of their annual salaries. The Successor matches up to 75% of the first 6% of the participant's contribution for the non-union plan and 50% of the first 6% of the participant's contribution for the union plan. The union plans are not administered by the Successor, and contributions are determined in accordance with provisions of negotiated labor contracts. Participants are always 100% vested in both their individual contributions and in the Successor's matching funds. Employer contributions under the plans were $647,054 for the 304 days ended December 31, 2004.
(10) Income Taxes
Income tax expense (benefit) for the Successor for the 304 days ended December 31, 2004 is summarized below (in thousands):
| Current—Federal | $ | 27,902 | ||
| —State | 6,519 | |||
| 34,421 | ||||
| Deferred—Federal | (499 | ) | ||
| —State | (117 | ) | ||
| (616 | ) | |||
| Total income taxes | $ | 33,805 | ||
Income tax expense for the 304 days ended December 31, 2004 differed from the "expected" income tax (computed by applying the federal income tax rate of 35% to earnings before income taxes) as follows (in thousands):
| Computed expected taxes | $ | 29,230 | ||
| State taxes net of federal benefit | 4,162 | |||
| Non-deductible items | 413 | |||
| Total income tax expense | $ | 33,805 | ||
F-21
The income tax effect of temporary differences that give rise to significant portions of the deferred tax assets and deferred tax liabilities at December 31, 2004 are summarized below (in thousands):
| Deferred tax assets: | |||||
| Allowance for doubtful accounts | $ | 74 | |||
| Personnel accruals | 342 | ||||
| Inventories | 215 | ||||
| Environmental obligations | 166 | ||||
| Electricity contract | 229 | ||||
| Deferred tax assets | 1,026 | ||||
| Deferred tax liabilities: | |||||
| Unrealized derivative gains | 326 | ||||
| Property, plant and equipment | 73 | ||||
| Other | 11 | ||||
| Deferred tax liabilities | 410 | ||||
| Net deferred tax assets | $ | 616 | |||
In assessing the realizability of deferred tax assets, management considers whether it is more likely than not that some portion or all of the deferred tax assets will not be realized. The ultimate realization of deferred tax assets is dependent upon the generation of future taxable income during the periods in which those temporary differences become deductible. Management considers the scheduled reversal of deferred tax liabilities, projected future taxable income, and tax planning strategies in making this assessment. Based upon the level of historical taxable income and projections for future taxable income over the periods in which the deferred tax assets are deductible, management believes it is more likely than not that the Successor will realize the benefits of these deductible differences. The Successor has not recorded any valuation allowances against deferred income tax assets as of December 31, 2004.
(11) Commitments and Contingent Liabilities
The Successor and Predecessor leased various equipment and real properties under long-term operating leases. For the years ended December 31, 2002, 2003, the 62 day period ended March 2, 2004 and the 304 day period ended December 31, 2004, lease expense included on cost of goods sold totaled approximately $3,325,495, $2,985,022, $518,918 and $2,372,270, respectively. Lease expense for two months in 2002 included $316,958 for the lease of fixed assets of the nitrogen fertilizer plant that was prepaid and capitalized into a new secured financial arrangement in February 2002. The lease agreements have various remaining terms. Some agreements are renewable, at the Successor's option, for additional periods. It is expected, in the ordinary course of business, that leases will be renewed or replaced as they expire.
F-22
The minimum required payments for the Successor's agreements are as follows:
| Years ending December 31, | Amount | |||
|---|---|---|---|---|
| 2005 | 3,274,737 | |||
| 2006 | 3,103,901 | |||
| 2007 | 2,897,902 | |||
| 2008 | 2,861,330 | |||
| 2009 | 1,947,208 | |||
| Thereafter | 1,508,108 | |||
| $ | 15,593,186 | |||
The Successor licenses a gasification process from a third party associated with gasifier equipment used in the Nitrogen Fertilizer Division. The royalty fees for this license are incurred as the equipment is used and is subject to a cap which is expected to be paid in full by June 2007 at an estimated total cost of $5.5 million. Royalty fee expense for the 304 days ended December 31, 2004 was $1,403,304 and was reflected in Cost of goods sold.
Coffeyville Nitrogen Fertilizer LLC ("CRN") has an agreement with the City of Coffeyville pursuant to which it must make a series of future minimum payments for electrical generation transmission and city margin. As of December 31, 2004 the remaining minimum obligations of CRN totaled $37.5 million through a period ending December 31, 2019. Total contractually minimum committed payments under the agreement will be $5.7 million for each of the fiscal years 2005, 2006 and 2007, and $1.7 million per year for each subsequent year. The Successor is contractually liable for payments to Farmland as part of deferred purchased consideration related to the electricity contract with the City of Coffeyville in the amount of approximately $2 million to be paid in equal installments through September 2006.
Coffeyville Refining & Marketing, LLC ("CRRM") entered into a Pipeline Construction, Operation and Transportation Commitment Agreement with Plains Pipeline, L.P. pursuant to which Plains is constructing a crude oil pipeline from Cushing, Oklahoma to Caney, Kansas. The term of the agreement is 20 years from when the pipeline becomes operational, which occurred on February 17, 2005. Pursuant to the agreement, CRRM must transport approximately 80,000 barrels per day of its crude oil requirements for the Coffeyville refinery at a rate of $0.2844 per barrel.
The Successor is contingently liable for future adjustments to its workers compensation insurance plan that is held through a state fund. A maximum adjustment of approximately $400,000 may be assessed within 18 months of the policy date. The workers compensation expense for the 304 days ended December 31, 2004 was $374,834 and was reflected in cost of goods sold.
Coffeyville Resources Nitrogen Fertilizers, LLC ("CRN") was sued by The BOC Group, Inc. in connection with a dispute under an On-Site Product Supply Agreement regarding excess electrical usage by BOC and payments withheld by CRN in connection therewith. Pursuant to the agreement, which expires in 2020, CRNF pays approximately $300,000 per month for the supply of oxygen and nitrogen to the fertilizer operation. This lawsuit is in the very early stages of discovery. While the Successor believes that its position is strong, if it is unsuccessful in its defense of the suit, operating expenses could increase by approximately $800,000 per year for the 15 year remaining term of the agreement. The Successor anticipates that resolution of the suit could take approximately two years. Although it is reasonably possible the Successor could incur additional incremental expenses related to
F-23
this dispute, the amounts are not estimatable at this time, and accordingly, no amounts are accrued for this contingency.
The Successor is involved in various lawsuits arising in the normal course of business. In the opinion of management, the ultimate resolution of these litigation matters is not expected to have a material adverse effect on the accompanying financial statements.
Environmental Matters
The Successor is subject to various stringent federal, state, and local environmental laws and regulations. Liabilities related to remediation of contaminated properties are recognized when the related costs are probable and can be reasonably estimated. Estimates of these costs are based upon currently available facts, existing technology, site-specific costs, and currently enacted laws and regulations. In reporting environmental liabilities, no offset is made for potential recoveries. Such liabilities include estimates of the Predecessor's share of costs attributable to potentially responsible parties which are insolvent or otherwise unable to pay. All liabilities are monitored and adjusted regularly as new facts emerge or changes in law or technology occur.
The Successor owns and/or operates manufacturing properties and has potential responsibility for environmental conditions at some properties. Through administrative orders issued under authority of the Resource Conservation and Recovery Act of 1976 (RCRA), the Predecessor was designated as a party responsible for conducting corrective action projects at its Coffeyville and Phillipsburg sites.
As of December 31, 2003 and 2004, environmental accruals of $15,326,098 and $10,310,600, respectively, were reflected in the balance sheet for probable and estimable costs for remediation of environmental contamination and compliance with the Clean Air Act, including $0 and $1,209,662, respectively, included in other current liabilities. The Predecessor accrual was increased in 2003 by approximately $5.5 million based on information obtained from environmental studies while preparing for the sale and negotiating with potential purchasers of the Petroleum Division. The $10,310,600 accrual recorded by the Successor was determined based on an estimate of payment costs through 2033, which scope of remediation was arranged with the EPA. The estimated future payments for these required obligations are as follows (in thousands):
| Years ending December 31, | Amount | ||||||
|---|---|---|---|---|---|---|---|
| 2005 | $ | 1,210 | |||||
| 2006 | 561 | ||||||
| 2007 | 481 | ||||||
| 2008 | 2,575 | ||||||
| 2009 | 3,567 | ||||||
| Thereafter | 6,690 | ||||||
| Undiscounted Total | 15,084 | ||||||
| Less amount representing interest at 5% | (4,773 | ) | |||||
| Accrued environmental liabilities at December 31, 2004 | $ | 10,311 | |||||
The Successor has purchased insurance to cover any costs above the amount accrued related to this contaminated property. See note 6 on prepaid environmental insurance. Management periodically reviews and, as appropriate, revises its environmental accruals. Based on current information and
F-24
regulatory requirements, management believes that the accruals established for environmental expenditures are adequate.
Under the RCRA, the Successor has one closure plan and two post-closure plans in place for two locations. Closure and post-closure plans are also in place for two landfills as required by state regulations and are estimated at $1,975,100, which is reflected in the $10,310,600 environmental liability referred to above.
The Environmental Protection Agency has issued rules limiting sulfur in gasoline to 30 parts per million and limiting sulfur in diesel fuel to 15 parts per million. The EPA has granted the Successor's petition for a temporary hardship relief with respect to the date for compliance with the low-sulfur-level regulations. The Successor spent approximately $2 million in 2004 and based on information currently available anticipates that expenditures in amounts of approximately $34 million in 2005, $43 million in 2006, a combined total of $20 million in 2008 and 2009, and $15 million in 2010 will be required to achieve compliance with these new rules. The entire amount is expected to be capitalized.
As of March 2, 2004, the Predecessor had been engaged in negotiations with the EPA to resolve certain Clean Air Act allegations concerning the Coffeyville refinery. Farmland's management believed the penalty stemming from the allegations was probable and estimated to be settled for $500,000 which is included in the accrual of $15,326,098 and $10,310,600 for environmental liabilities described above.
Environmental expenditures are capitalized when such expenditures provide future economic benefits. For 2002, 2003, the 62 days ended March 2, 2004 and the 304 days ended December 31, 2004 capital expenditures were approximately $649,000, $334,235, $0, and $2,434,259 respectively, to improve the environmental compliance and efficiency of the operations.
Prior to the acquisition of the nitrogen fertilizer plant and continuing into Successor's ownership, the facility experienced an equipment failure that resulted in air releases of ammonia into the environment. The Successor replaced the equipment in August 2004 and the new equipment also experienced difficulties and was subsequently replaced by a redesigned exchanger with upgraded metallurgy, which has operated without additional ammonia emissions. Although it is reasonably possible that additional equipment, repairs to existing equipment, changes to current operations, government enforcement or third party claims could result in significant expenditures by Coffeyville, no amounts have been accrued for this matter as of December 31, 2004.
Management believes the Successor is currently in substantial compliance with existing environmental rules and regulations. There can be no assurance that the environmental matters described above or other environmental matters which may develop in the future, will not have a material adverse effect on the business, financial condition, or results of operations.
(12) Derivative Financial Instruments
Coffeyville is subject to crude oil price fluctuations caused by supply conditions, weather, economic conditions, and other factors. To manage volatility associated with these exposures, Coffeyville may enter into various derivative transactions pursuant to its established policies. Generally, Coffeyville purchases derivative contracts for a portion of its anticipated consumption of commodity inputs for periods of up to six months. Coffeyville may enter into longer-term contracts if deemed appropriate.
For purposes of these financial statements, Coffeyville adopted SFAS No. 133,Accounting for Derivative Instruments and Hedging Activities, as amended. This standard imposes extensive record-
F-25
keeping requirements in order to designate a derivative financial instrument as a hedge. From time to time, the Petroleum Segment held derivative instruments, such as exchange-traded crude oil futures and options contracts and certain over-the-counter forward swap agreements, which it believed provided an economic hedge on future transactions, but such instruments were not designated as hedges. Gains or losses related to the change in fair value of these derivative instruments were classified as a component of other income (expense). The Petroleum Segment has recorded margin account balances in cash and cash equivalents of $0 and $8,373,417, at December 31, 2003 and 2004, respectively. The Petroleum Segment also recorded mark to market net (gains) losses in other (income) expense of $4,175,929, $303,742, $0 and $546,604 for the periods ended December 31 2002 and 2003 and March 2, 2004 and the 304 days ended December 31, 2004, respectively.
(13) Related Party Transactions
Pegasus Partners II, L.P., (Pegasus) is the majority owner of Successor.
On March 3, 2004, the Successor entered into a management services agreement with an affiliate company of Pegasus, Pegasus Capital Advisors, L.P. (Affiliate) pursuant to which the Affiliate provides the Successor with managerial and advisory services. In consideration for these services, the Affiliate is paid an annual fee up to $1.0 million plus reimbursement for any out-of-pocket expenses. The agreement has an initial term through March 3, 2009 and will automatically renew for additional one-year terms thereafter unless one party provides notice of termination to the other at least 90 days prior to the then existing term. Approximately $545,000 relating to the agreement was expensed in selling, general, and administrative expenses for the 304 days ended December 31, 2004. Successor expensed approximately $455,000 in selling, general and administrative expenses for legal fees paid on behalf of Affiliate in lieu of the remaining amounts owed under the management fee.
Successor paid the Affiliate a $4.0 million transaction fee upon closing of the Acquisition referred to in note 1. The transaction fee relates to a $2.5 million finder's fee included in the cost of the Acquisition and $1.5 million in deferred financing charges, which were subsequently written off in May 2004 as part of the refinancing. In conjunction with the debt refinancing on May 10, 2004, a $1.25 million fee was paid to the Affiliate as a deferred financing charge.
(14) Business Segments
Coffeyville measures segment profit as operating income for Petroleum and Nitrogen Fertilizer, Coffeyville's two reporting segments, based on the definitions provided in SFAS No. 131,Disclosures About Segments of an Enterprise and Related Information.
Petroleum—Principal products of the petroleum division are refined fuels, propane and petroleum refining by-products including coke. Coffeyville uses the coke in the manufacture of nitrogen fertilizer at the adjacent nitrogen fertilizer plant. For the Successor, a $15 per ton transfer price is used to record intercompany sales on the part of the Petroleum Segment and corresponding intercompany cost of goods sold for the Nitrogen Segment. The intercompany transactions are eliminated in the Other Segment. For the Predecessor, the coke was transferred from the Petroleum Segment to the Nitrogen Fertilizer Segment at zero value such that no sales revenue on the part of the Petroleum Segment or corresponding cost of goods sold for the Nitrogen Segment are recorded. Because the Predecessor did not record these transfers in its segment results, and the information to restate these segment results in the Predecessor periods is not available, the Predecessor periods have not been restated. As a result, the results of operations for the Successor and Predecessor periods are not comparable.
F-26
Nitrogen Fertilizer—The principal product of the Nitrogen Fertilizer Segment is nitrogen fertilizer. Nitrogen fertilizer sales increased throughout the periods presented as the on-stream factor improved.
Other Segment—The Other Segment reflects intercompany eliminations and other corporate activities that are not allocated to the operating segments.
| | Predecessor | Successor | |||||||||||||
|---|---|---|---|---|---|---|---|---|---|---|---|---|---|---|---|
| | Years ended December 31, | | 304 day period ended December 31, 2004 | ||||||||||||
| | 62 day period ended March 2, 2004 | ||||||||||||||
| | 2002 | 2003 | |||||||||||||
| Net sales | |||||||||||||||
| Petroleum | $ | 828,967,424 | $ | 1,161,287,249 | $ | 241,640,365 | $ | 1,390,768,126 | |||||||
| Nitrogen fertilizer | 58,527,702 | 100,909,645 | 19,446,164 | 93,422,503 | |||||||||||
| Other | — | — | — | (4,297,440 | ) | ||||||||||
| Total | $ | 887,495,126 | $ | 1,262,196,894 | $ | 261,086,529 | $ | 1,479,893,189 | |||||||
| Depreciation and amortization | |||||||||||||||
| Petroleum | $ | 15,784,280 | $ | 2,094,627 | $ | 271,284 | $ | 1,522,464 | |||||||
| Nitrogen fertilizer | 14,995,128 | 1,218,899 | 160,719 | 855,289 | |||||||||||
| Other | — | — | — | 68,208 | |||||||||||
| Total | $ | 30,779,408 | $ | 3,313,526 | $ | 432,003 | $ | 2,445,961 | |||||||
| Operating income (loss) | |||||||||||||||
| Petroleum | $ | (183,866,871 | ) | $ | 21,544,374 | $ | 7,687,745 | $ | 77,094,034 | ||||||
| Nitrogen fertilizer | (266,077,705 | ) | 7,813,708 | 3,514,997 | 22,874,227 | ||||||||||
| Other | — | — | — | 3,076 | |||||||||||
| Total | $ | (449,944,576 | ) | $ | 29,358,082 | $ | 11,202,742 | $ | 99,971,337 | ||||||
| Capital expenditures | |||||||||||||||
| Petroleum | $ | 11,614,134 | $ | 489,083 | $ | $ | 11,267,244 | ||||||||
| Nitrogen fertilizer | 260,764,110 | 324,679 | — | 2,697,852 | |||||||||||
| Other | — | — | — | 195,184 | |||||||||||
| Total | $ | 272,378,244 | $ | 813,762 | $ | — | $ | 14,160,280 | |||||||
| Reorganization expenses—Impairment of property, plant, and equipment | |||||||||||||||
| Petroleum | $ | 144,270,221 | $ | 3,950,519 | $ | — | $ | — | |||||||
| Nitrogen fertilizer | 230,798,138 | 5,688,107 | — | — | |||||||||||
| Total | $ | 375,068,359 | $ | 9,638,626 | $ | — | $ | — | |||||||
| Total assets | |||||||||||||||
| Petroleum | $ | 165,041,070 | $ | 145,861,715 | |||||||||||
| Nitrogen fertilizer | 33,916,040 | 83,561,149 | |||||||||||||
| Other | — | (265,527 | ) | ||||||||||||
| Total | $ | 198,957,110 | $ | 229,157,337 | |||||||||||
F-27
(15) Major Customers and Suppliers
Sales to major customers were as follows:
| | Predecessor | | |||||||
|---|---|---|---|---|---|---|---|---|---|
| | Successor | ||||||||
| | Years ended December 31, | | |||||||
| | | 304 days ended December 31, 2004 | |||||||
| | 62 days ended March 2, 2004 | ||||||||
| | 2002 | 2003 | |||||||
| Petroleum | |||||||||
| Customer A | 98 | % | 89 | % | 10 | % | 18 | % | |
| Customer B | — | 3 | % | 25 | % | 10 | % | ||
| Customer C | — | 1 | % | 18 | % | 17 | % | ||
| 98 | % | 93 | % | 53 | % | 45 | % | ||
Nitrogen Fertilizer | |||||||||
| Customer D | 92 | % | 66 | % | 47 | % | 24 | % | |
A contract with Customer A granting it the exclusive right to purchase petroleum products was discontinued on November 30, 2003.
The Nitrogen Fertilizer Segment maintains long-term contracts with one supplier. Purchases from this supplier as a percentage of the total cost of goods sold were as follows:
| | Predecessor | | |||||||
|---|---|---|---|---|---|---|---|---|---|
| | Successor | ||||||||
| | Years ended December 31, | | |||||||
| | | 304 days ended December 31, 2004 | |||||||
| | 62 days ended March 2, 2004 | ||||||||
| | 2002 | 2003 | |||||||
| Supplier | 2 | % | 1 | % | 2 | % | 3 | % | |
The Petroleum Segment maintains long-term contracts with one supplier for the purchase of its crude oil. This agreement expires at the end of 2005, at which time the Successor may renegotiate the agreement, seek a similar arrangement with another party or choose to obtain its crude supply through alternate sources. Purchases from this supplier as a percentage of the total cost of goods sold were as follows:
| | Predecessor | | |||||||
|---|---|---|---|---|---|---|---|---|---|
| | Successor | ||||||||
| | Years ended December 31, | | |||||||
| | | 304 days ended December 31, 2004 | |||||||
| | 62 days ended March 2, 2004 | ||||||||
| | 2002 | 2003 | |||||||
| Supplier | 32 | % | 28 | % | 32 | % | 68 | % | |
(16) Subsequent Event
On January 13, 2005 the Board and management of the Successor authorized a payment to 36 employees totaling $3,850,000 plus withholding taxes. The payment was paid in recognition of the importance of retaining these employees through the upcoming recapitalization efforts. No accrual is reflected in the Consolidated Balance Sheet as of December 31, 2004 as payment was discretionary and not based on prior service.
F-28
PART II
INFORMATION NOT REQUIRED IN PROSPECTUS
Item 13. Other Expenses of Issuance and Distribution.
The following table sets forth the costs and expenses to be paid by the Registrant in connection with the sale of the shares of common stock being registered hereby. All amounts are estimates except for the Securities and Exchange Commission registration fee, the NASD filing fee and the Nasdaq listing fee.
| Securities and Exchange Commission registration fee | $ | 35,310 | ||
| NASD filing fee | 30,500 | |||
| Nasdaq listing fee | 5,000 | |||
| Accounting fees and expenses | ||||
| Legal fees and expenses | ||||
| Printing and engraving expenses | ||||
| Blue Sky qualification fees and expenses | ||||
| Transfer agent and registrar fees and expenses | ||||
| Miscellaneous expenses | ||||
| Total | $ | |||
Item 14. Indemnification of Directors and Officers.
Section 145 of the Delaware General Corporation Law authorizes a court to award, or a corporation's board of directors to grant, indemnity to directors and officers in terms sufficiently broad to permit such indemnification under certain circumstances for liabilities (including reimbursement for expenses incurred) arising under the Securities Act of 1933, as amended (the "Securities Act").
As permitted by the Delaware General Corporation Law, the Registrant's Certificate of Incorporation includes a provision that eliminates the personal liability of its directors for monetary damages for breach of fiduciary duty as a director, except for liability:
- •
- for any breach of the director's duty of loyalty to the Registrant or its stockholders;
- •
- for acts or omissions not in good faith or that involve intentional misconduct or a knowing violation of law;
- •
- under section 174 of the Delaware General Corporation law regarding unlawful dividends and stock purchases; or
- •
- for any transaction for which the director derived an improper personal benefit.
As permitted by the Delaware General Corporation Law, the Registrant's Bylaws provide that:
- •
- the Registrant is required to indemnify its directors and officers to the fullest extend permitted by the Delaware General Corporation Law, subject to very limited exceptions;
- •
- the Registrant may indemnify its other employees and agents to the fullest extent permitted by the Delaware General Corporation Law, subject to very limited exceptions;
- •
- the Registrant is required to advance expenses, as incurred, to its directors and officers in connection with a legal proceeding to the fullest extent permitted by the Delaware General Corporation Law, subject to very limited exceptions;
- •
- the Registrant may advance expenses, as incurred, to its employees and agents in connection with a legal proceeding; and
- •
- the rights conferred in the Bylaws are not exclusive.
II-1
The Registrant intends to enter into Indemnity Agreements with each of its current directors and officers to give these directors and officers additional contractual assurances regarding the scope of the indemnification set forth in the Registrant's Certificate of Incorporation and to provide additional procedural protections. At present, there is no pending litigation or proceeding involving a director, officer or employee of the Registrant regarding which indemnification is sought, nor is the Registrant aware of any threatened litigation that may result in claims for indemnification.
The indemnification provisions in the Registrant's Certificate of Incorporation and Bylaws and the Indemnity Agreements entered into between the Registrant and each of its directors and officers may be sufficiently broad to permit indemnification of the Registrant's directors and officers for liabilities arising under the Securities Act.
Coffeyville Resources, Inc. and its subsidiaries are covered by liability insurance policies which indemnify their directors and officers against loss arising from claims by reason of their legal liability for acts as such directors, officers or trustees, subject to limitations and conditions as set forth in the policies.
Item 15. Recent Sales of Unregistered Securities
We currently have no capital stock outstanding.
Item 16. Exhibits and Financial Statement Schedules.
- (a)
- The following exhibits are filed herewith:
| Number | Exhibit Title | |
|---|---|---|
| 1.1* | Form of Underwriting Agreement. | |
| 3.1* | Form of Amended and Restated Certificate of Incorporation of Coffeyville Resources, Inc. | |
| 3.2* | Form of Amended and Restated Bylaws of Coffeyville Resources, Inc. | |
| 4.1* | Specimen Common Stock Certificate. | |
| 5.1 | Form of opinion of Akin, Gump, Strauss, Hauer & Feld, L.L.P. | |
| 10.1† | Credit Agreement, dated as of May 10, 2004, among Coffeyville Resources, LLC, Coffeyville Resources Nitrogen Fertilizers, LLC, Coffeyville Resources Refining & Marketing, LLC, Coffeyville Resources Crude Transportation, LLC, and Coffeyville Resources Terminal, LLC, the credit parties signatory thereto, Credit Suisse First Boston, acting through its Cayman Islands Branch, sole lead arranger, syndication agent, documentation agent, term agent and a lender, Congress Financial Corporation (Southwest), as administrative agent and the lenders party thereto. | |
| 10.2† | Guaranty dated as of May 10, 2004, by and among Coffeyville Refining & Marketing, Inc., Coffeyville Nitrogen Fertilizers, Inc., Coffeyville Crude Transportation, Inc., Coffeyville Terminal, Inc., Coffeyville Resources Management, Inc., Coffeyville Group Holdings, LLC, Coffeyville Resources Pipeline, LLC, and Coffeyville Resources Management, Inc. and Congress Financial Corporation (Southwest). | |
| 10.3† | Guaranty dated as of May 10, 2004, by and among Coffeyville Refining & Marketing, Inc., Coffeyville Nitrogen Fertilizers, Inc., Coffeyville Crude Transportation, Inc., Coffeyville Terminal, Inc., Coffeyville Resources Management, Inc., Coffeyville Group Holdings, LLC, Coffeyville Resources Pipeline, LLC, and Coffeyville Resources Management, Inc. and Credit Suisse First Boston, acting through its Cayman Islands Branch. | |
II-2
| 10.4† | Pledge Agreement, dated as of May 10, 2004, among the Coffeyville Crude Transportation, Inc., Coffeyville Group Holdings, LLC, Coffeyville Nitrogen Fertilizers, Inc., Coffeyville Pipeline, Inc., Coffeyville Refining & Marketing, Inc., Coffeyville Resources, LLC, Coffeyville Terminal, Inc., Congress Financial Corporation (Southwest) and Credit Suisse First Boston, acting through its Cayman Islands Branch | |
| 10.5† | Security Agreement, dated as of May 10, 2004, among Coffeyville Resources, LLC, Coffeyville Resources Nitrogen Fertilizers, LLC, Coffeyville Resources Refining & Marketing, LLC, Coffeyville Resources Crude Transportation, LLC, Coffeyville Resources Terminal, LLC, Coffeyville Pipeline, Inc., Coffeyville Refining & Marketing, Inc., Coffeyville Nitrogen Fertilizers, Inc., Coffeyville Crude Transportation, Inc., Coffeyville Terminal, Inc., Coffeyville Resources Management, Inc., Coffeyville Group Holdings, LLC, Coffeyville Resources Pipeline, LLC, Congress Financial Corporation (Southwest), as administrative agent for the Revolver Secured Parties, and Credit Suisse First Boston, acting through its Cayman Islands Branch, as administrative agent for the Term Secured Parties. | |
| 10.6† | First Amendment to Credit Agreement, dated as of October 8, 2004, among Coffeyville Resources, LLC, Coffeyville Resources Nitrogen Fertilizers, LLC, Coffeyville Resources Refining & Marketing, LLC, Coffeyville Resources Crude Transportation, LLC, and Coffeyville Resources Terminal, LLC, the credit parties signatory thereto, Credit Suisse First Boston, acting through its Cayman Islands Branch, sole lead arranger, syndication agent, documentation agent, term agent and a lender, Congress Financial Corporation (Southwest), as administrative agent and the lenders party thereto. | |
| 10.7† | Second Amendment to Credit Agreement dated as November 24, 2004, among Coffeyville Resources, LLC, Coffeyville Resources Nitrogen Fertilizers, LLC, Coffeyville Resources Refining & Marketing, LLC, Coffeyville Resources Crude Transportation, LLC, and Coffeyville Resources Terminal, LLC, the credit parties signatory thereto, Credit Suisse First Boston, acting through its Cayman Islands Branch, sole lead arranger, syndication agent, documentation agent, term agent and a lender, Congress Financial Corporation (Southwest), as administrative agent and the lenders party thereto. | |
| 10.8† | Third Amendment to Credit Agreement dated as December 13, 2004, among Coffeyville Resources, LLC, Coffeyville Resources Nitrogen Fertilizers, LLC, Coffeyville Resources Refining & Marketing, LLC, Coffeyville Resources Crude Transportation, LLC, and Coffeyville Resources Terminal, LLC, the credit parties signatory thereto, Credit Suisse First Boston, acting through its Cayman Islands Branch, sole lead arranger, syndication agent, documentation agent, term agent and a lender, Congress Financial Corporation (Southwest), as administrative agent and the lenders party thereto. | |
| 10.9† | On-Site Product Supply Agreement dated as of December 3, 1997, between The BOC Group, Inc. and Farmland Industries, Inc. | |
| 10.10† | Amendment No. 1 to the On-Site Product Supply Agreement dated as of December 3, 1997, between The BOC Group, Inc. and Farmland Industries, Inc. dated as of December 31, 1999. | |
| 10.11† | Executive Purchase and Vesting Agreement by and among Coffeyville Group Holdings, LLC, and Keith Osborn dated March 3, 2004. | |
| 10.12† | Executive Purchase and Vesting Agreement by and among Coffeyville Group Holdings, LLC, and Philip Rinaldi dated March 3, 2004. | |
| 10.13† | Executive Purchase and Vesting Agreement by and among Coffeyville Group Holdings, LLC, and Stan Riemann dated March 3, 2004. | |
| 10.14† | Executive Purchase and Vesting Agreement by and among Coffeyville Group Holdings, LLC, and James T. Rens dated March 3, 2004. |
II-3
| Number | Exhibit Title | |
|---|---|---|
| 10.15† | Executive Purchase and Vesting Agreement by and among Coffeyville Group Holdings, LLC, and Kevan Vick dated March 3, 2004. | |
| 10.16† | Executive Purchase and Vesting Agreement by and among Coffeyville Group Holdings, LLC, and Abraham Kaplan dated March 3, 2004. | |
| 10.17† | Executive Purchase and Vesting Agreement by and among Coffeyville Group Holdings, LLC, and George Dorsey dated March 3, 2004. | |
| 10.18† | Amendment No. 1 to Executive Purchase and Vesting Agreement by and among Coffeyville Group Holdings, LLC, and Keith Osborn, Philip Rinaldi, Stanley A. Riemann, James T. Rens, Kevan Vick, Abraham Kaplan and George Dorsey dated May 10, 2004. | |
| 10.19† | 2004 Coffeyville Resources, LLC and affiliated companies income sharing program. | |
| 10.20* | Employment Agreement dated as of March 3, 2004, by and between Coffeyville Resources Refining and Marketing, LLC and Keith Osborn. | |
| 10.21* | Employment Agreement dated as of March 3, 2004, by and between Coffeyville Resources, LLC and Philip Rinaldi. | |
| 10.22* | Employment Agreement dated as of March 3, 2004, by and between Coffeyville Resources, LLC and Stanley A. Riemann. | |
| 10.23* | Employment Agreement dated as of March 3, 2004, by and between Coffeyville Resources, LLC and James T. Rens. | |
| 10.24* | Employment Agreement dated as of March 3, 2004, by and between Coffeyville Nitrogen Fertilizers, LLC and Kevan Vick. | |
| 10.25* | Employment Agreement dated as of March 3, 2004, by and between Coffeyville Resources Refining and Marketing, LLC and Abraham Kaplan. | |
| 10.26* | Employment Agreement dated as of March 3, 2004, by and between Coffeyville Nitrogen Fertilizers, LLC and George Dorsey. | |
| 10.27* | Employment Agreement dated as of June 1, 2004, by and between Coffeyville Resources, LLC and Edmund S. Gross. | |
| 10.28 | Fourth Amendment to Credit Agreement dated as of March 30, 2005, among Coffeyville Resources, LLC, Coffeyville Resources Nitrogen Fertilizers, LLC, Coffeyville Resources Refining & Marketing, LLC, Coffeyville Resources Crude Transportation, LLC, and Coffeyville Resources Terminal, LLC, the credit parties signatory thereto, Credit Suisse First Boston, acting through its Cayman Islands Branch, sole lead arranger, syndication agent, documentation agent, term agent and a lender, Congress Financial Corporation (Southwest), as administrative agent, and the lenders party thereto. | |
| 10.29 | Electric Services Agreement dated January 13, 2004, between Coffeyville Resources Nitrogen Fertilizers, LLC and the City of Coffeyville, Kansas. | |
| 21.1* | List of Subsidiaries of Coffeyville Resources, Inc. | |
| 23.1 | Consent of KPMG LLP. | |
| 23.2* | Consent of Akin, Gump, Strauss, Hauer & Feld, L.L.P. (included in Exhibit 5.1). | |
| 24.1† | Power of Attorney. |
- *
- To be filed by amendment.
- †
- Previously filed.
- (b)
- None.
II-4
Item 17. Undertakings.
The undersigned Registrant hereby undertakes to provide to the Underwriters at the closing specified in the Underwriting Agreement certificates in such denominations and registered in such names as required by the Underwriters to permit prompt delivery to each purchaser.
Insofar as indemnification for liabilities arising under the Securities Act may be permitted to directors, officers and controlling persons of the Registrant pursuant to the provisions described in Item 14 above, or otherwise, the Registrant has been advised that in the opinion of the Securities and Exchange Commission such indemnification is against public policy as expressed in the Securities Act and is, therefore, unenforceable. In the event that a claim for indemnification against such liabilities (other than the payment by the Registrant of expenses incurred or paid by a director, officer or controlling person of the Registrant in the successful defense of any action, suit or proceeding) is asserted by such director, officer or controlling person in connection with the securities being registered hereunder, the Registrant will, unless in the opinion of its counsel the matter has been settled by controlling precedent, submit to a court of appropriate jurisdiction the question whether such indemnification by it is against public policy as expressed in the Securities Act and will be governed by the final adjudication of such issue.
The undersigned Registrant hereby undertakes that:
- (1)
- For purposes of determining any liability under the Securities Act, the information omitted from the form of prospectus filed as part of this Registration Statement in reliance upon Rule 430A and contained in a form of prospectus filed by the Registrant pursuant to Rule 424(b)(1) or (4) or 497(h) under the Securities Act shall be deemed to be part of this Registration Statement as of the time it was declared effective; and
- (2)
- For the purpose of determining any liability under the Securities Act, each post-effective amendment that contains a form of prospectus shall be deemed to be a new registration statement relating to the securities offered therein, and the offering of such securities at the time shall be deemed to be the initial bona fide offering thereof.
II-5
Pursuant to the requirements of the Securities Act, the Registration has duly caused this Registration Statement to be signed on its behalf by the undersigned, thereunto duly authorized, in Kansas City, State of Kansas, on this 15th day of April, 2005.
| COFFEYVILLE RESOURCES, INC. | |||
By: | /s/ PHILIP L. RINALDI Philip L. Rinaldi Chief Executive Officer | ||
Pursuant to the requirements of the Securities Act, this Registration Statement has been signed by the following persons in the capacities and on the date indicated.
| Signature | Title | Date | ||
|---|---|---|---|---|
| /s/ PHILIP L. RINALDI Philip L. Rinaldi | Chief Executive Officer and Director (Principal Executive Officer) | April 15, 2005 | ||
/s/ JAMES T. RENS James T. Rens | Chief Financial Officer (Principal Financial and Accounting Officer) | April 15, 2005 | ||
* Stanley A. Riemann | Director | April 15, 2005 | ||
* Rodney Cohen | Director | April 15, 2005 | ||
* Jonathan Berger | Director | April 15, 2005 | ||
* Eric Gribetz | Director | April 15, 2005 | ||
* Alec Machiels | Director | April 15, 2005 |
*By: | /s/ PHILIP L. RINALDI Philip L. Rinaldi Attorney-in-fact |
II-6
| Number | Exhibit Title | |
|---|---|---|
| 1.1* | Form of Underwriting Agreement. | |
3.1* | Form of Amended and Restated Certificate of Incorporation of Coffeyville Resources, Inc. | |
3.2* | Form of Amended and Restated Bylaws of Coffeyville Resources, Inc. | |
4.1* | Specimen Common Stock Certificate. | |
5.1 | Form of opinion of Akin, Gump, Strauss, Hauer & Feld, L.L.P. | |
10.1† | Credit Agreement, dated as of May 10, 2004, among Coffeyville Resources, LLC, Coffeyville Resources Nitrogen Fertilizers, LLC, Coffeyville Resources Refining & Marketing, LLC, Coffeyville Resources Crude Transportation, LLC, and Coffeyville Resources Terminal, LLC, the credit parties signatory thereto, Credit Suisse First Boston, acting through its Cayman Islands Branch, sole lead arranger, syndication agent, documentation agent, term agent and a lender, Congress Financial Corporation (Southwest), as administrative agent and the lenders party thereto. | |
10.2† | Guaranty dated as of May 10, 2004, by and among Coffeyville Refining & Marketing, Inc., Coffeyville Nitrogen Fertilizers, Inc., Coffeyville Crude Transportation, Inc., Coffeyville Terminal, Inc., Coffeyville Resources Management, Inc., Coffeyville Group Holdings, LLC, Coffeyville Resources Pipeline, LLC, and Coffeyville Resources Management, Inc. and Congress Financial Corporation (Southwest). | |
10.3† | Guaranty dated as of May 10, 2004, by and among Coffeyville Refining & Marketing, Inc., Coffeyville Nitrogen Fertilizers, Inc., Coffeyville Crude Transportation, Inc., Coffeyville Terminal, Inc., Coffeyville Resources Management, Inc., Coffeyville Group Holdings, LLC, Coffeyville Resources Pipeline, LLC, and Coffeyville Resources Management, Inc. and Credit Suisse First Boston, acting through its Cayman Islands Branch. | |
10.4† | Pledge Agreement, dated as of May 10, 2004, among the Coffeyville Crude Transportation, Inc., Coffeyville Group Holdings, LLC, Coffeyville Nitrogen Fertilizers, Inc., Coffeyville Pipeline, Inc., Coffeyville Refining & Marketing, Inc., Coffeyville Resources, LLC, Coffeyville Terminal, Inc., Congress Financial Corporation (Southwest) and Credit Suisse First Boston, acting through its Cayman Islands Branch | |
10.5† | Security Agreement, dated as of May 10, 2004, among Coffeyville Resources, LLC, Coffeyville Resources Nitrogen Fertilizers, LLC, Coffeyville Resources Refining & Marketing, LLC, Coffeyville Resources Crude Transportation, LLC, Coffeyville Resources Terminal, LLC, Coffeyville Pipeline, Inc., Coffeyville Refining & Marketing, Inc., Coffeyville Nitrogen Fertilizers, Inc., Coffeyville Crude Transportation, Inc., Coffeyville Terminal, Inc., Coffeyville Resources Management, Inc., Coffeyville Group Holdings, LLC, Coffeyville Resources Pipeline, LLC, Congress Financial Corporation (Southwest), as administrative agent for the Revolver Secured Parties, and Credit Suisse First Boston, acting through its Cayman Islands Branch, as administrative agent for the Term Secured Parties. | |
10.6† | First Amendment to Credit Agreement, dated as of October 8, 2004, among Coffeyville Resources, LLC, Coffeyville Resources Nitrogen Fertilizers, LLC, Coffeyville Resources Refining & Marketing, LLC, Coffeyville Resources Crude Transportation, LLC, and Coffeyville Resources Terminal, LLC, the credit parties signatory thereto, Credit Suisse First Boston, acting through its Cayman Islands Branch, sole lead arranger, syndication agent, documentation agent, term agent and a lender, Congress Financial Corporation (Southwest), as administrative agent and the lenders party thereto. | |
10.7† | Second Amendment to Credit Agreement dated as November 24, 2004, among Coffeyville Resources, LLC, Coffeyville Resources Nitrogen Fertilizers, LLC, Coffeyville Resources Refining & Marketing, LLC, Coffeyville Resources Crude Transportation, LLC, and Coffeyville Resources Terminal, LLC, the credit parties signatory thereto, Credit Suisse First Boston, acting through its Cayman Islands Branch, sole lead arranger, syndication agent, documentation agent, term agent and a lender, Congress Financial Corporation (Southwest), as administrative agent and the lenders party thereto. | |
10.8† | Third Amendment to Credit Agreement dated as December 13, 2004, among Coffeyville Resources, LLC, Coffeyville Resources Nitrogen Fertilizers, LLC, Coffeyville Resources Refining & Marketing, LLC, Coffeyville Resources Crude Transportation, LLC, and Coffeyville Resources Terminal, LLC, the credit parties signatory thereto, Credit Suisse First Boston, acting through its Cayman Islands Branch, sole lead arranger, syndication agent, documentation agent, term agent and a lender, Congress Financial Corporation (Southwest), as administrative agent and the lenders party thereto. | |
10.9† | On-Site Product Supply Agreement dated as of December 3, 1997, between The BOC Group, Inc. and Farmland Industries, Inc. | |
10.10† | Amendment No. 1 to the On-Site Product Supply Agreement dated as of December 3, 1997, between The BOC Group, Inc. and Farmland Industries, Inc. dated as of December 31, 1999. | |
10.11† | Executive Purchase and Vesting Agreement by and among Coffeyville Group Holdings, LLC, and Keith Osborn dated March 3, 2004. | |
10.12† | Executive Purchase and Vesting Agreement by and among Coffeyville Group Holdings, LLC, and Philip Rinaldi dated March 3, 2004. | |
10.13† | Executive Purchase and Vesting Agreement by and among Coffeyville Group Holdings, LLC, and Stan Riemann dated March 3, 2004. | |
10.14† | Executive Purchase and Vesting Agreement by and among Coffeyville Group Holdings, LLC, and James T. Rens dated March 3, 2004. | |
10.15† | Executive Purchase and Vesting Agreement by and among Coffeyville Group Holdings, LLC, and Kevan Vick dated March 3, 2004. | |
10.16† | Executive Purchase and Vesting Agreement by and among Coffeyville Group Holdings, LLC, and Abraham Kaplan dated March 3, 2004. | |
10.17† | Executive Purchase and Vesting Agreement by and among Coffeyville Group Holdings, LLC, and George Dorsey dated March 3, 2004. | |
10.18† | Amendment No. 1 to Executive Purchase and Vesting Agreement by and among Coffeyville Group Holdings, LLC, and Keith Osborn, Philip Rinaldi, Stanley A. Riemann, James T. Rens, Kevan Vick, Abraham Kaplan and George Dorsey dated May 10, 2004. | |
10.19† | 2004 Coffeyville Resources, LLC and affiliated companies income sharing program. | |
10.20* | Employment Agreement dated as of March 3, 2004, by and between Coffeyville Resources Refining and Marketing, LLC and Keith Osborn. | |
10.21* | Employment Agreement dated as of March 3, 2004, by and between Coffeyville Resources, LLC and Philip Rinaldi. | |
10.22* | Employment Agreement dated as of March 3, 2004, by and between Coffeyville Resources, LLC and Stanley A. Riemann. | |
10.23* | Employment Agreement dated as of March 3, 2004, by and between Coffeyville Resources, LLC and James T. Rens. | |
10.24* | Employment Agreement dated as of March 3, 2004, by and between Coffeyville Nitrogen Fertilizers, LLC and Kevan Vick. | |
10.25* | Employment Agreement dated as of March 3, 2004, by and between Coffeyville Resources Refining and Marketing, LLC and Abraham Kaplan. | |
10.26* | Employment Agreement dated as of March 3, 2004, by and between Coffeyville Nitrogen Fertilizers, LLC and George Dorsey. | |
10.27* | Employment Agreement dated as of June 1, 2004, by and between Coffeyville Resources, LLC and Edmund S. Gross. | |
10.28 | Fourth Amendment to Credit Agreement dated as of March 30, 2005, among Coffeyville Resources, LLC, Coffeyville Resources Nitrogen Fertilizers, LLC, Coffeyville Resources Refining & Marketing, LLC, Coffeyville Resources Crude Transportation, LLC, and Coffeyville Resources Terminal, LLC, the credit parties signatory thereto, Credit Suisse First Boston, acting through its Cayman Islands Branch, sole lead arranger, syndication agent, documentation agent, term agent and a lender, Congress Financial Corporation (Southwest), as administrative agent, and the lenders party thereto. | |
10.29 | Electric Services Agreement dated January 13, 2004, between Coffeyville Resources Nitrogen Fertilizers, LLC and the City of Coffeyville, Kansas. | |
21.1* | List of Subsidiaries of Coffeyville Resources, Inc. | |
23.1 | Consent of KPMG LLP. | |
23.2* | Consent of Akin, Gump, Strauss, Hauer & Feld, L.L.P. (included in Exhibit 5.1) | |
24.1† | Power of Attorney. |
- *
- To be filed by amendment.
- †
- Previously filed.
TABLE OF CONTENTS
Dealer Prospectus Delivery Obligation
PROSPECTUS SUMMARY
Post-Offering Organizational Structure
The Offering
Summary Consolidated Financial Information
RISK FACTORS
CAUTIONARY NOTE REGARDING FORWARD-LOOKING STATEMENTS
USE OF PROCEEDS
DIVIDEND POLICY
CAPITALIZATION
DILUTION
UNAUDITED PRO FORMA CONDENSED CONSOLIDATED STATEMENTS OF OPERATIONS
Coffeyville Resources, Inc. Unaudited Pro Forma Condensed Consolidated Statements of Operations For the Year Ended December 31, 2004
SELECTED HISTORICAL CONSOLIDATED FINANCIAL DATA
MANAGEMENT'S DISCUSSION AND ANALYSIS OF FINANCIAL CONDITION AND RESULTS OF OPERATIONS
INDUSTRY OVERVIEW
BUSINESS
MANAGEMENT
Summary Compensation Table
PRINCIPAL AND SELLING STOCKHOLDERS
RELATED PARTY TRANSACTIONS
DESCRIPTION OF OUR INDEBTEDNESS
DESCRIPTION OF CAPITAL STOCK
SHARES ELIGIBLE FOR FUTURE SALE
UNDERWRITING
NOTICE TO CANADIAN RESIDENTS
LEGAL MATTERS
EXPERTS
WHERE YOU CAN FIND MORE INFORMATION
GLOSSARY OF SELECTED TERMS
Coffeyville Resources, Inc. INDEX TO CONSOLIDATED FINANCIAL STATEMENTS
Coffeyville Resources, Inc. BALANCE SHEETS
Coffeyville Resources, Inc. CONSOLIDATED STATEMENTS OF OPERATIONS
Coffeyville Resources, Inc. CONSOLIDATED STATEMENTS OF EQUITY
Coffeyville Resources, Inc. CONSOLIDATED STATEMENTS OF CASH FLOWS
Coffeyville Resources, Inc. NOTES TO CONSOLIDATED FINANCIAL STATEMENTS
PART II INFORMATION NOT REQUIRED IN PROSPECTUS
SIGNATURES
EXHIBIT INDEX