 INVESTOR PRESENTATION February 10, 2016 Exhibit 99.2 |
 2 Safe Harbor Forward-Looking Statements. This presentation contains "forward-looking statements" within the meaning of the Private Securities Litigation Reform Act of 1995. These statements are not guarantees of future performance. These forward-looking statements are based on management’s expectations as of February 10, 2016 and assumptions which are inherently subject to uncertainties, risks and changes in circumstances that are difficult to predict. The use of words such as "intends" and “expects,” among others, generally identifies forward-looking statements. However, these words are not the exclusive means of identifying such statements. In addition, any statements that refer to expectations, projections or other characterizations of future events or circumstances are forward-looking statements and may include statements relating to future revenues, expenses, margins, profitability, net income / (loss), earnings per share and other measures of results of operations and the prospects for future growth of Expedia, Inc.’s business. Actual results and the timing and outcome of events may differ materially from those expressed or implied in the forward-looking statements for a variety of reasons, including, among others: an increasingly competitive global environment; modifications to our current business models and practices or our adoption of new business models or practices in order to compete; changes in search engine algorithms and dynamics or other traffic-generating arrangements; our failure to maintain and expand our relationships and contractual agreements with travel suppliers or travel distribution partners; our failure to maintain and expand our brand awareness or increased costs to do so; our failure to adapt to technological developments or industry trends; risks related to our acquisitions, investments or significant commercial arrangements; risks relating to our operations in international markets; our failure to comply with current laws, rules and regulations, or changes to such laws, rules and regulations; adverse application of existing tax or unclaimed property laws, rules or regulations are subject to interpretation by taxing authorities; unfavorable amendment to existing tax laws, rules or regulations or enactment of new unfavorable laws, rules or regulations; adverse outcomes in legal proceedings to which we are a party; declines or disruptions in the travel industry; risks related to payments and fraud; fluctuations in foreign exchange rates; volatility in our stock price; liquidity constraints or our inability to access the capital markets when necessary or desirable; interruption, security breaches and lack of redundancy in our information systems; our failure to comply with governmental regulation and other legal obligations related to our processing, storage, use, disclosure and protection of personal information, payment card information and other consumer data; our failure to retain or motivate key personnel or hire, retain and motivate qualified personnel, including senior management; changes in control of the Company; management and director conflicts of interest; risks related to actions taken by our business partners and third party service providers, including failure to comply with our requirements or standards or the requirements or standards of governmental authorities, or any cessation of their operations; risks related to the failure of counterparties to perform on financial obligations; risks related to our long-term indebtedness, including our failure to effectively operate our businesses due to restrictive covenants in the agreements governing our indebtedness; our failure to protect our intellectual property and proprietary information from copying or use by others, including potential competitors; and other risks detailed in Expedia, Inc.’s public filings with the SEC, including our annual report on Form 10-K for the year ended December 31, 2015. Except as required by law, we undertake no obligation to update any forward-looking or other statements in this presentation, whether as a result of new information, future events or otherwise. Non-GAAP Measures. Reconciliations to GAAP measures of non-GAAP measures included in this presentation are included in the Appendix. These measures are intended to supplement, not substitute for, GAAP comparable measures. Investors are urged to consider carefully the comparable GAAP measures and reconciliations. Industry / Market Data. Industry and market data used in this presentation have been obtained from industry publications and sources as well as from research reports prepared for other purposes. We have not independently verified the data obtained from these sources and cannot assure you of the data’s accuracy or completeness. Trademarks & Logos. Trademarks and logos are the property of their respective owners. © 2016 Expedia, Inc. All rights reserved. CST: 2029030-50 July 2014 |
 3 Important Note In May 2015, Expedia sold its 62.4% equity stake in eLong for approximately $671 million to several purchasers including Ctrip. Expedia and Ctrip also reached agreement on cooperation for certain travel products in specified geographic markets. Unless otherwise noted, due to Expedia’s sale of its eLong stake, all discussion in these slides refers to results for Expedia, Inc. excluding eLong. July 2014 |
 4 Investment Highlights A Leading Global Player in ~$1.4 Trillion 1 Travel Market Significant Growth Opportunities Across Geographies Consistently Strong Financial Execution Technology Platform Innovation Driving Higher Conversion Success in Growing Mobile Channels A Growth Company High Growth Advertising & Media Business Rapid Expansion in Highly Fragmented Lodging Industry Supported by Multi-Product Offering Solid Track Record of Disciplined Capital Allocation 1 Travel market size estimates based on Phocuswright data for full year 2016. |
 5 One of the Largest Travel Companies in the World Depth and Breadth of SUPPLY ~269,000 Hotels & 1.2 Million Vacation Rentals In 200+ Countries 400+ Airlines 7.1 Million Packages Mutually Beneficial Supply Agreements Value to Travelers Scale Enables Virtuous Circle Diverse Demand: Geography AND Travel Type 8.6 Billion+ Flight Searches Travelers in ~75 Countries Corporate and Leisure Travel; Online and Offline Volume and Diversity of Global Travel DEMAND |
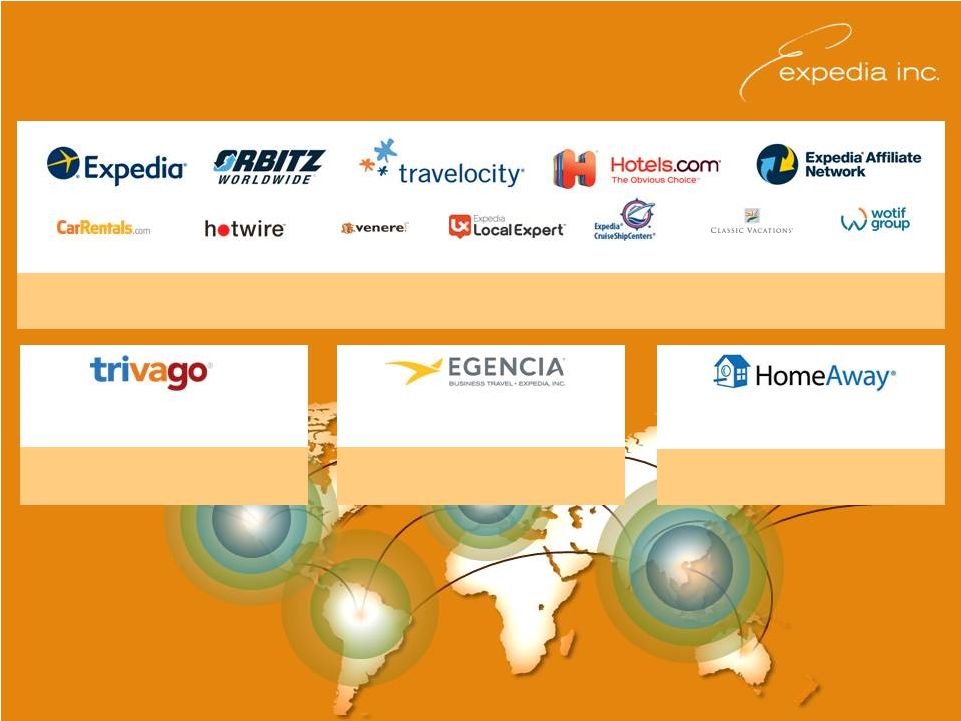 6 Established Brands with Global Reach Brand Recognition in EVERY Established Market Solid Foothold in Emerging Markets Presence in 65 Countries Sites in 55 Countries 1.2M Vacation Properties across 190 Countries A Leading Hotel Metasearch Company A Leader in Global Corporate Travel A Leader in Alternative Lodging Dynamic portfolio of travel brands with more than 200 sites in over 60 countries featuring the world’s broadest supply portfolio including 269,000 properties in 200 countries, 400 airlines, packages, rental cars, cruises and destination services and activities |
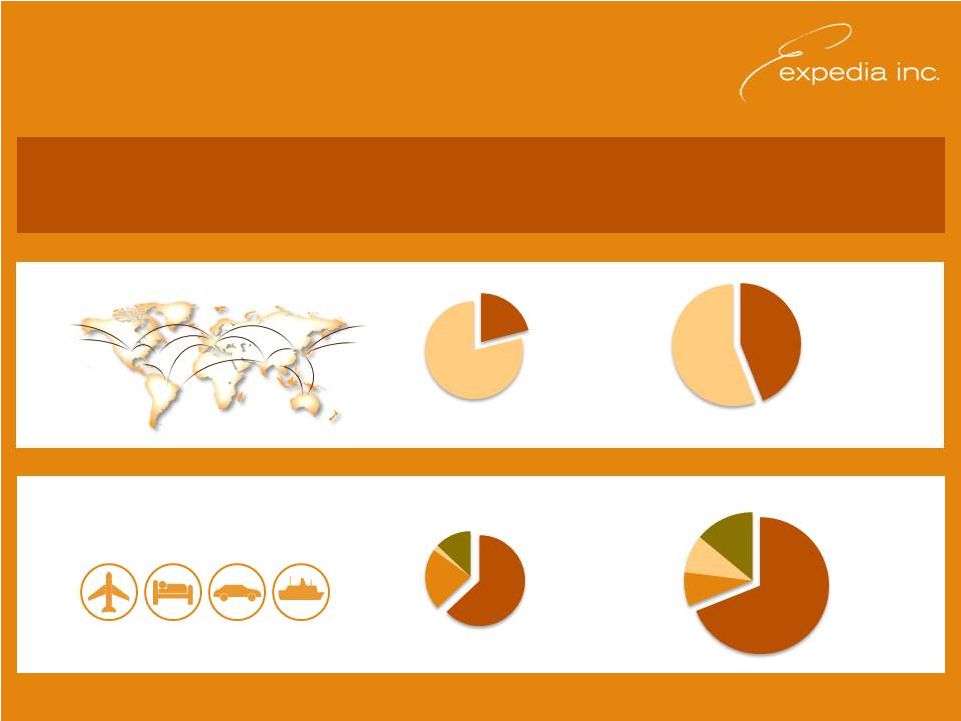 7 Diversifying Revenue Mix Reduces Risk and Positions the Business for Growth 2005 Revenue 1 2015 Revenue 1 2005 Geography excludes eLong; Product includes eLong GEOGRAPHY International 21% Domestic 79% International 44% Domestic 56% Ad & Media 2% Car, Cruise & Other 13% Ad & Media 9% PRODUCT Hotels 63% Hotels 69% Car, Cruise & Other 14% Air 8% Air 22% |
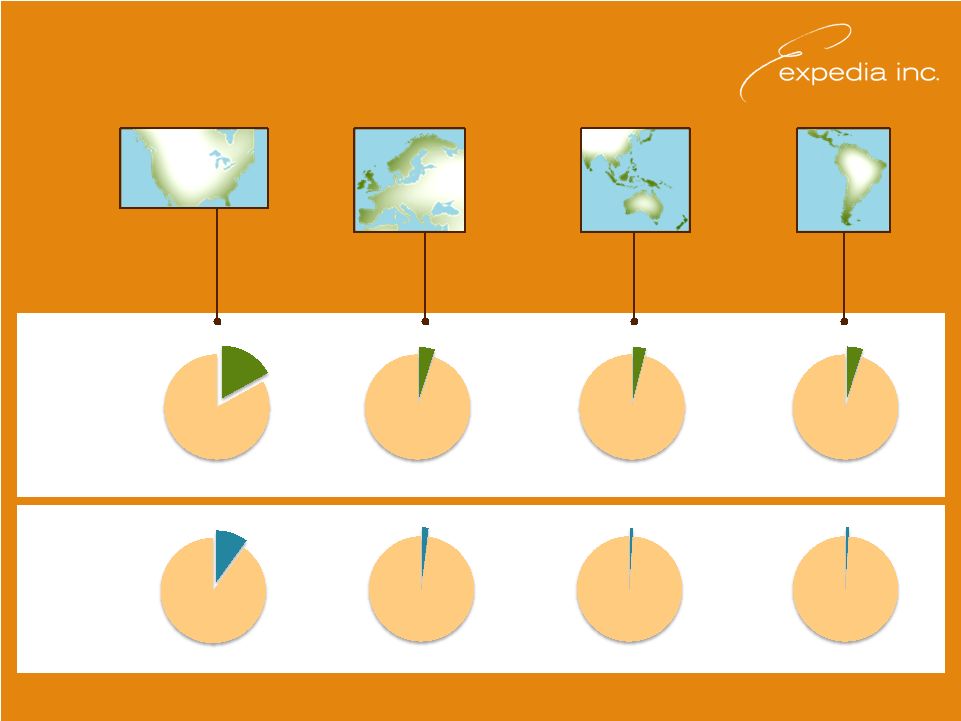 8 Expedia 4% Other Expedia 5% Other Expedia 17% Other Expedia 5% Other ONLINE TRAVEL SEGMENT 56% 25% 47% 35% 45% of Total Travel Market Global Leader and Significant Headroom for Further Growth Sources: Phocuswright estimates and Expedia data; travel market size estimates based on Phocuswright data for full year 2016. Note: Expedia’s share of travel market defined as gross bookings during FY15. Beginning in Q4 2014, total travel market definition was expanded to include Canada, Eastern Europe and Middle East. Expedia Share: UNITED STATES + . CANADA LATIN AMERICA EMEA Expedia 10% Other 2016 TOTAL TRAVEL MARKET Other Expedia 1% Expedia 2% Expedia 1% Other Other $388B $99B $492B $393B Total Travel Market ~$1.4T ASIA PACIFIC |
 9 Expedia Already Has Scale in Hotels… Leading Position in Attractive Lodging Market … And HomeAway Adds Significantly More Lodging Alternatives 1 Other includes Car, Advertising, Destination Services, Insurance, Cruise, Agency Packages, and Other. 2 Sources: Smith Travel Research and Expedia data. 3 Hotel data for TripAdvisor and Booking.com obtained from respective company websites. TripAdvisor and Booking.com numbers include 740,000 and 393,000 vacation rental properties, respectively. 4 Total assumes no overlap between HomeAway and Expedia properties. 4 Hotels 69% $6.6B 2015 Revenues ~269k Hotels in 200+ Countries ~Only 8% Share of Rooms Booked in the US Number of Hotels / Lodging Alternatives 1,690,000 Air Other 1,508,000 1,239,000 269,000 855,000 1 2 3 |
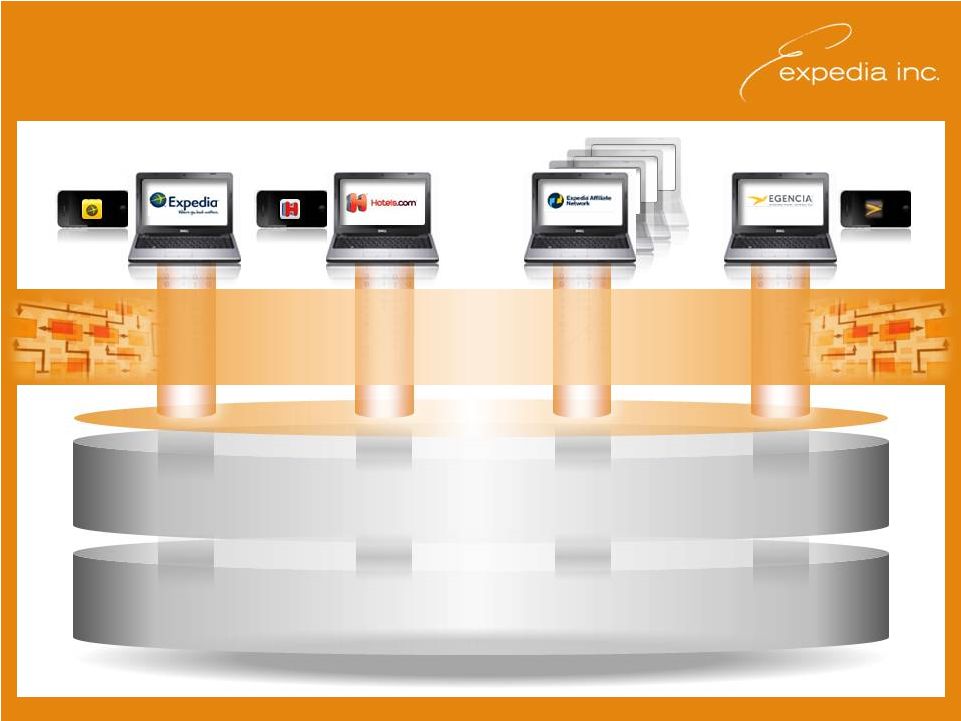 10 Have Completed Significant Technology Investments That Fortify the Business CUSTOMIZED Front-End Technology for Rapid Innovation and Powerful Analytics … Improving Conversion CENTRALIZED Transactional Infrastructure: Financials / Order Management / Inventory Management CENTRALIZED Customer Operations Technology |
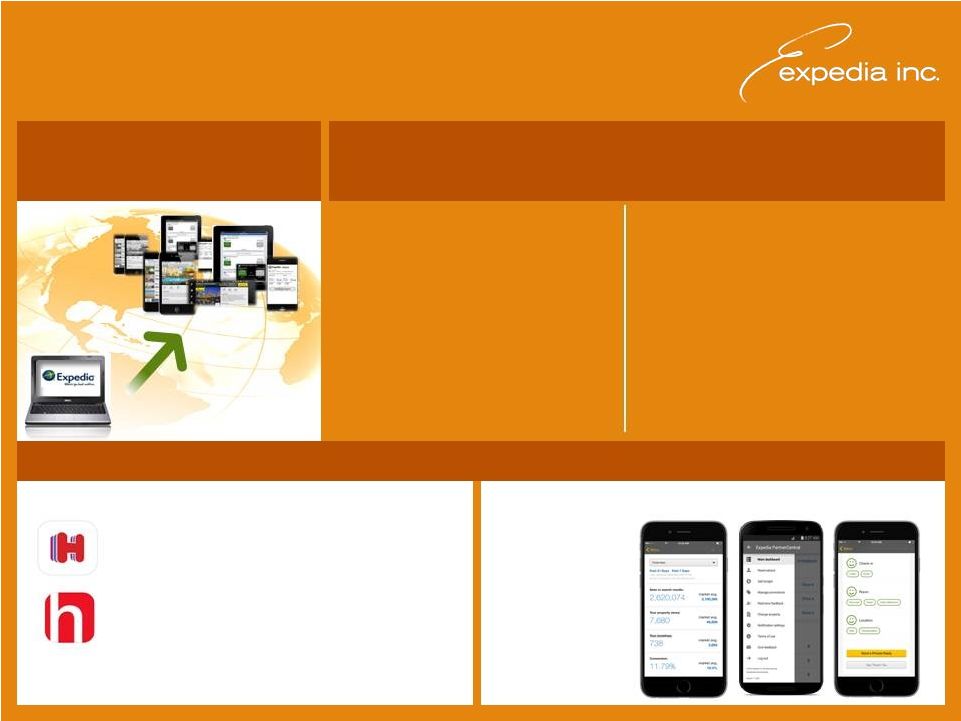 11 Opening Up Significant Opportunities in Travel Industry Leading Mobile Initiatives Drive Traffic and Revenue …Expedia, Inc. Leads the Way The World Is Changing … PC-Connected Users 24 x 7 Mobile Users Over 40% of Traffic Arrives Via Mobile 2 More than One in Four Room Nights 1 Booked on a Mobile Device • Hotels.com recognized as the 2015 Travel Weekly Silver Magellan Award Winner in the Online Travel Services App category • Hotwire included in the Top 10 Best Car Rental Apps for Android • Hotwire included in the Best Apps for Booking Travel by CNET • Hotwire ranked as one of the “Best Travel Apps of 2015” by PCMag 1 Based on global mobile bookings in Q4 2015. Based on Brand Expedia, Hotels.com, Travelocity and Orbitz mobile traffic in Q4 2015. Expedia PartnerCentral App for Hoteliers Helping hoteliers manage their Expedia business and solve everyday problems via Apple and Android mobile devices 2 Mobile Accolades |
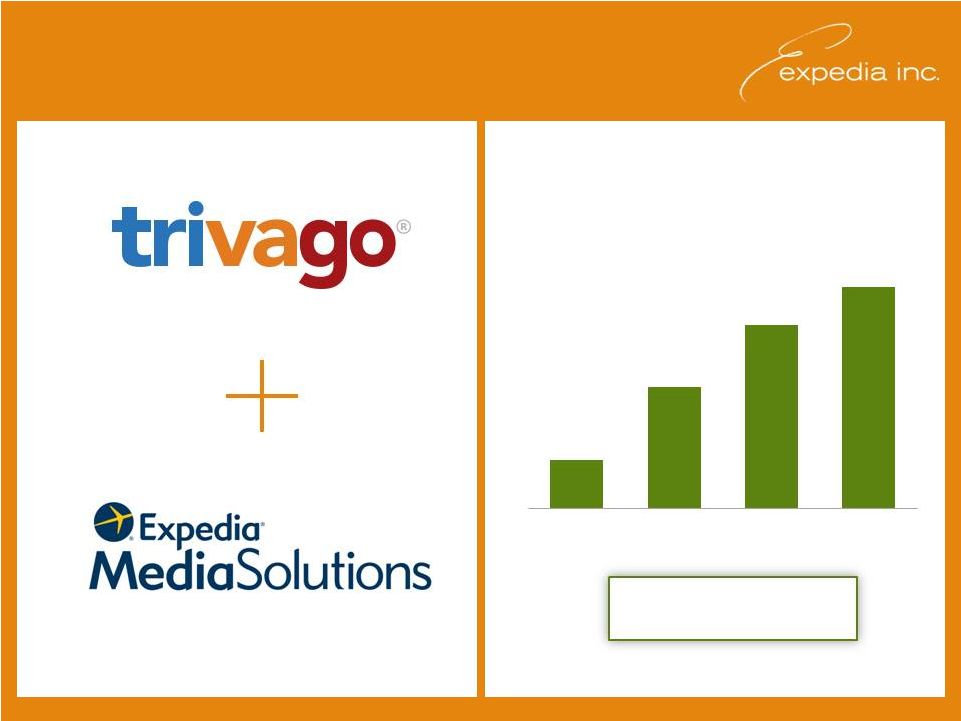 12 Significant Acceleration in the Advertising and Media Business ADVERTISING & MEDIA REVENUE $ Millions ’12-’15 CAGR : 65.8% ’12-’15 CAGR : 65.8% Note: Reported numbers are net of any intercompany revenue 1 Controlling interest in trivago GmbH (”trivago”) acquired in March 2013 #1 hotel metasearch in Europe 12 $124 $310 1 $469 $564 2012 2013 2014 2015 |
 13 $33 $38 $48 $60 2012 2013 2014 2015 ’12-’15 CAGR: 22.2% $804 $891 $1,051 $1,165 2012 2013 2014 2015 Consistent Financial Execution ADJUSTED EBITDA ROOM NIGHTS $ Millions 103 120 150 203 2012 2013 2014 2015 REVENUE $ Billions $3.9 $4.6 $5.6 $6.6 2012 2013 2014 2015 1 Non-GAAP measure. See Appendix A for Non-GAAP to GAAP Reconciliation ’12-’15 CAGR: 19.2% ’12-’15 CAGR: 13.2% ’12-’15 CAGR: 25.3% Millions GROSS BOOKINGS $ Billions 1 1 |
 14 Solid Track Record of Disciplined Capital Allocation FREE CASH FLOW 1 $495 $469 $618 $1,001 $455 $1,039 $581 2009 2010 2011 2012 2013 2014 2015 1 Non-GAAP measure, including eLong. See Appendix for Non-GAAP to GAAP Reconciliation. 2 Expedia acquired an additional 25% equity interest in the former joint venture in March 2015. 3 On May 22, Expedia sold its 62.4% ownership in eLong to a group of purchasers based in China $ Millions ’09-’15 CAGR: 3% SHARE REPURCHASES AND DIVIDENDS KEY TRANSACTIONS $489 $283 $397 $515 $537 $45 $79 $77 $130 $76 $85 $108 $0 $100 $200 $300 $400 $500 $600 2010 2011 2012 2013 2014 2015 Share Repurchases Dividends $ in Millions 2 3 2011 | 2012 | 2013 | 2014 | 2015 |
 15 Orbitz and HomeAway Impact to Adjusted EBITDA Q4 2015 $ millions FY 2015 $ millions Q4 2015 Y/Y Growth FY 2015 Y/Y Growth Expedia (excluding eLong) Adjusted EBITDA* 280 1,165 1% 11% Total impact from Orbitz Worldwide (including deal & integration costs) 2 (25) n/a n/a Total impact from HomeAway (including deal & integration costs) (14) (14) n/a n/a Expedia Adjusted EBITDA (excluding eLong, Orbitz Worldwide and HomeAway)* 292 1,204 6% 15% • 2016 Guidance: • Full Year 2016 Expedia (excluding eLong) Adjusted EBITDA y/y growth of 35% to 45%. • We expect a full year Adjusted EBITDA contribution from Orbitz Worldwide and HomeAway combined of $275 million to $325 million. • In terms of the shape of the year, we are not expecting any adjusted EBITDA dollar growth in the first half, with particular pressure on Q1. * Non-GAAP measure. See Appendix A for Non-GAAP to GAAP Reconciliation. |
 16 Investment Highlights A Leading Global Player in ~$1.4 Trillion Travel Market Significant Growth Opportunities Across Geographies Consistently Strong Financial Execution Technology Platform Innovation Driving Higher Conversion Success in Growing Mobile Channels A Growth Company High Growth Advertising & Media Business Rapid Expansion in Highly Fragmented Lodging Industry Supported by Multi-Product Offering Solid Track Record of Disciplined Capital Allocation |
 17 APPENDICES |
 18 Non-GAAP Definitions Expedia, Inc. (excluding eLong). Expedia sold its ownership interest in eLong, Inc. on May 22, 2015. In order to allow comparison with prior periods for the ongoing Expedia businesses, Expedia, Inc. (excluding eLong) gross bookings, revenue, adjusted EBITDA, operating income (loss), adjusted net income (loss), adjusted EPS, Net income (loss) attributable to the Company, Diluted EPS and free cash flow each exclude the impact of eLong. Adjusted EBITDA is defined as operating income plus: (1) stock-based compensation expense, including compensation expense related to certain subsidiary equity plans; (2) acquisition-related impacts, including (i) amortization of intangible assets and goodwill and intangible asset impairment, (ii) gains (losses) recognized on changes in the value of contingent consideration arrangements; and (iii) upfront consideration paid to settle employee compensation plans of the acquiree; (3) certain infrequently occurring items, including restructuring; (4) items included in Legal reserves, occupancy tax and other, which includes reserves for potential settlement of issues related to transactional taxes (e.g. hotel and excise taxes), related to court decisions and final settlements, and charges incurred, if any, for monies that may be required to be paid in advance of litigation in certain transactional tax proceedings; (5) gains (losses) realized on revenue hedging activities that are included in other, net; and (6) depreciation. The above items are excluded from our Adjusted EBITDA measure because these items are noncash in nature, or because the amount and timing of these items is unpredictable, not driven by core operating results and renders comparisons with prior periods and competitors less meaningful. We believe Adjusted EBITDA is a useful measure for analysts and investors to evaluate our future on-going performance as this measure allows a more meaningful comparison of our performance and projected cash earnings with our historical results from prior periods and to the results of our competitors. Moreover, our management uses this measure internally to evaluate the performance of our business as a whole and our individual business segments. In addition, we believe that by excluding certain items, such as stock-based compensation and acquisition-related impacts, Adjusted EBITDA corresponds more closely to the cash operating income generated from our business and allows investors to gain an understanding of the factors and trends affecting the ongoing cash earnings capabilities of our business, from which capital investments are made and debt is serviced. Free Cash Flow is defined as net cash flow provided by operating activities less capital expenditures. Management believes Free Cash Flow is useful to investors because it represents the operating cash flow that our operating businesses generate, less capital expenditures but before taking into account other cash movements that are not directly tied to the core operations of our businesses, such as financing activities, foreign exchange or certain investing activities. Free Cash Flow has certain limitations in that it does not represent the total increase or decrease in the cash balance for the period, nor does it represent the residual cash flow for discretionary expenditures. Therefore, it is important to evaluate Free Cash Flow along with the consolidated statements of cash flows. |
 19 Non-GAAP / GAAP Reconciliation: Revenue Note: Numbers may not sum due to rounding and include eLong $ Millions 2012 2013 2014 2015 Revenue excluding eLong $3,912 $4,607 $5,585 $6,631 eLong Revenue 118 164 178 42 Revenue Attributable to Expedia, Inc. $4,030 $4,771 $5,763 $6,672 |
 20 $ Millions 2012 2013 2014 2015 Adjusted EBITDA excluding eLong $804 $891 $1,051 $1,165 eLong Adjusted EBITDA (1) (12) (27) (62) Adjusted EBITDA $803 $879 $1,025 $1,103 Depreciation (164) (212) (266) (337) Amortization of Intangible Assets (32) (72) (80) (164) Legal Reserves , Occupancy Tax and Other (117) (78) (42) 105 Stock-Based Compensation (65) (130) (85) (178) Acquisition-related and Other - (10) - - Restructuring Charges - - (26) (72) Realized Loss (Gain) on Revenue Hedges 6 (11) (9) (44) Operating Income (Loss) $432 $366 $518 $414 Gain on Sale of Business - - - 509 Total Other Expense, Net (82) (65) (53) 4 Income (Loss) from Continuing Operations before Income Taxes 350 301 465 926 Provision for Income Taxes (47) (84) (92) (203) Income (Loss) from Continuing Operations 303 216 373 723 Discontinued Operations, Net of Taxes (23) - - - Net Income (Loss) 280 216 373 723 Net (Income) Loss Attributable to Noncontrolling Interests - 16 25 42 Net Income (Loss) Attributable to Expedia, Inc. $280 $233 $398 $764 Non-GAAP / GAAP Reconciliation: Adjusted EBITDA Note: Numbers may not sum due to rounding |
 21 Non-GAAP / GAAP Reconciliation: Free Cash Flow Note: Numbers may not sum due to rounding and include eLong $ Millions 2009 2010 2011 2012 2013 2014 2015 Cash provided by operations $574 $605 $826 $1,237 $763 $1,367 $1,368 Capital expenditures (79) (136) (208) (236) (309) (328) (787) Free cash flow $495 $469 $618 $1,001 $455 $1,039 $581 |
 22 $ Millions 4Q15 FY15 Expedia (excluding eLong) Adjusted EBITDA excluding the Impacts of Orbitz Worldwide and HomeAway $292 $1,204 Total Impact from Orbitz Worldwide 2 (25) Total Impact from HomeAway (14) (14) Expedia (excluding eLong) Adjusted EBITDA $280 $1,165 eLong Adjusted EBITDA - (62) Adjusted EBITDA $280 $1,103 Depreciation (96) (337) Amortization of Intangible Assets (80) (164) Legal Reserves , Occupancy Tax and Other (2) 105 Stock-Based Compensation (44) (178) Restructuring Charges (19) (72) Realized Loss (Gain) on Revenue Hedges (9) (44) Operating Income (Loss) $29 $414 Interest Expense, Net (34) (110) Gain on Sale of Business - 509 Other Expense, Net (1) 113 Income (Loss) from Continuing Operations before Income Taxes (6) 926 Provision for Income Taxes (7) (203) Income (Loss) from Continuing Operations (13) 723 Net (Income) Loss Attributable to Noncontrolling Interests - 42 Net Income (Loss) Attributable to Expedia, Inc. ($13) $764 Non-GAAP / GAAP Reconciliation: Adjusted EBITDA Note: Numbers may not sum due to rounding |