Exhibit 99.2
| Williams Partners L.P. 2006 1st Quarter Earnings May 2, 2006 |
| Williams Partners L.P. is a limited partnership recently formed by The Williams Companies, Inc. Our reports, filings, and other public announcements might contain or incorporate by reference statements that do not directly or exclusively relate to historical facts. Such statements are "forward-looking statements" within the meaning of the Private Securities Litigation Reform Act of 1995. You typically can identify forward-looking statements by the use of forward- looking words, such as "anticipate," believe," "could," "continue," "estimate," "expect," "forecast," "may," "plan," "potential," "project," "schedule," "will," and other similar words. These statements are based on our intentions, beliefs, and assumptions about future events and are subject to risks, uncertainties, and other factors. Actual results could differ materially from those contemplated by the forward-looking statements. In addition to any assumptions and other factors referred to specifically in connection with such statements, other factors could cause our actual results to differ materially from the results expressed or implied in any forward-looking statements. Those factors include, among others: We may not have sufficient cash from operations to enable us to pay the minimum quarterly distribution following establishment of cash reserves and payment of fees and expenses, including payments to our general partner. Because of the natural decline in production from existing wells and competitive factors, the success of our gathering and transportation business depends on our ability to connect new sources of natural gas supply, which is dependent on factors beyond our control. Any decrease in supplies of natural gas could adversely affect our business and operating results. Our processing, fractionation and storage businesses could be affected by any decrease in the price of natural gas liquids or a change in the price of natural gas liquids relative to the price of natural gas. Williams' revolving credit facility and Williams' public indentures contain financial and operating restrictions that may limit our access to credit. In addition, our ability to obtain credit in the future will be affected by Williams' credit ratings. Our general partner and its affiliates have conflicts of interest and limited fiduciary duties, which may permit them to favor their own interests to the detriment of our unitholders. Even if unitholders are dissatisfied, they cannot currently remove our general partner without its consent. Unitholders may be required to pay taxes on their share of our income even if unitholders do not receive any cash distributions from us. Lower natural gas and oil prices could adversely affect our fractionation and storage businesses. We depend on certain key customers and producers for a significant portion of our revenues and supply of natural gas and natural gas liquids. The loss of any of these key customers or producers could result in a decline in our revenues and cash available to pay distributions. If third-party pipelines and other facilities interconnected to our pipelines and facilities become unavailable to transport natural gas and natural gas liquids or to treat natural gas, our revenues and cash available to pay distributions could be adversely affected. Our operations are subject to operational hazards and unforeseen interruptions for which we may or may not be adequately insured. In light of these risks, uncertainties, and assumptions, the events described in the forward-looking statements might not occur or might occur to a different extent or at a different time that we have described. We undertake no obligation to publicly update or revise any forward-looking statements, whether as a result of new information, future events or otherwise. Forward Looking Statements |
| Agenda Strong 1Q06 earnings Cash distribution increased 8.6% Operations Update Growth Prospects |
| Financial Overview Don Chappel Chief Financial Officer |

| Partnership Results Financial Overview 1st Qtr Dollars in millions 2006 2005 Revenues 17.1 $ 11.4 $ Total costs and expenses 16.5 10.3 Operating income 0.6 1.1 Equity earnings - Discovery 3.8 2.2 Interest expense - net (0.2) (3.0) Net income 4.2 $ 0.3 $ |
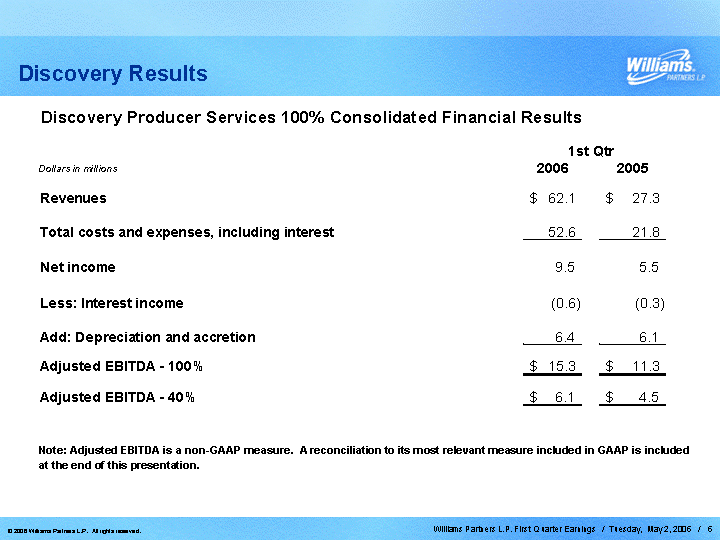
| Discovery Results Discovery Producer Services 100% Consolidated Financial Results 1st Qtr Dollars in millions 2006 2005 Revenues 62.1 $ 27.3 $ Total costs and expenses, including interest 52.6 21.8 Net income 9.5 5.5 Less: Interest income (0.6) (0.3) Add: Depreciation and accretion 6.4 6.1 Adjusted EBITDA - 100% 15.3 $ 11.3 $ Adjusted EBITDA - 40% 6.1 $ 4.5 $ Note: Adjusted EBITDA is a non-GAAP measure. A reconciliation to its most relevant measure included in GAAP is included at the end of this presentation. |

| Adjusted EBITDA 1st Qtr Dollars in millions 2006 2005 Adjusted EBITDA: Williams Partners L.P. excluding Discovery 2.8 $ 2.0 $ Discovery - our 40% interest (1) 6.1 4.5 Total 8.9 $ 6.5 $ (1) Includes a $3.3 million favorable impact from Discovery's hurricane-related open seasons in 2006. The 2005 period includes $0.6 million favorable impact from a volume-deficiency payment. Both of these numbers represent the 40% of the effect. Note: Adjusted EBITDA is a non-GAAP measure. A reconciliation to its most relevant measure included in GAAP is included at the end of this presentation. |

| Distributable Cash Flow 1st Qtr Dollars in millions 2006 2005 Distributable Cash Flow: Williams Partners L.P. excluding Discovery 2.8 $ 1.6 $ Discovery - our 40% interest 6.1 3.9 Total 8.9 $ 5.5 $ Cash Balance at December 31, 2005 6.8 $ Significant 1st quarter cash transactions: Operational: Product imbalance decrease (0.5) Deferred revenue liability decrease (a) (3.3) Other cash provided by operating activities 1.8 Discovery distribution 4.4 2.4 Investing: Capital expenditures (1.1) Financing: WPZ distribution (b) (5.0) Omnibus agrmt. contributions 1.2 (3.8) Cash Balance at March 31, 2006 4.3 $ * Cash Balance at April 30, 2006 17.8 $ (a) Due to the normal amortization of Conway annual storage cash payments received in April-May of each year. (b) Minimum quarterly distribution to unitholders *Cash balance reaches low balance just prior to the receipt of annual storage cash payments in April. Note: Distributable Cash Flow is a non-GAAP measure. A reconciliation to its most relevant measure included in GAAP is included at the end of this presentation. |

| Operations Review Alan Armstrong Chief Operating Officer |
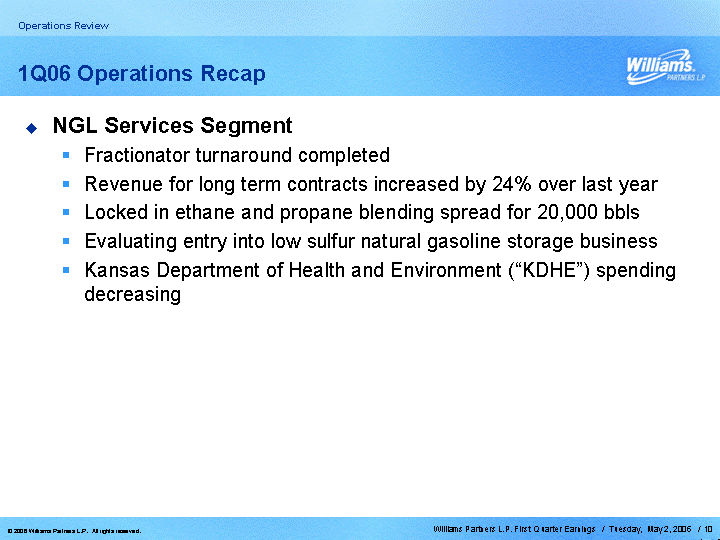
| 1Q06 Operations Recap Operations Review NGL Services Segment Fractionator turnaround completed Revenue for long term contracts increased by 24% over last year Locked in ethane and propane blending spread for 20,000 bbls Evaluating entry into low sulfur natural gasoline storage business Kansas Department of Health and Environment ("KDHE") spending decreasing |
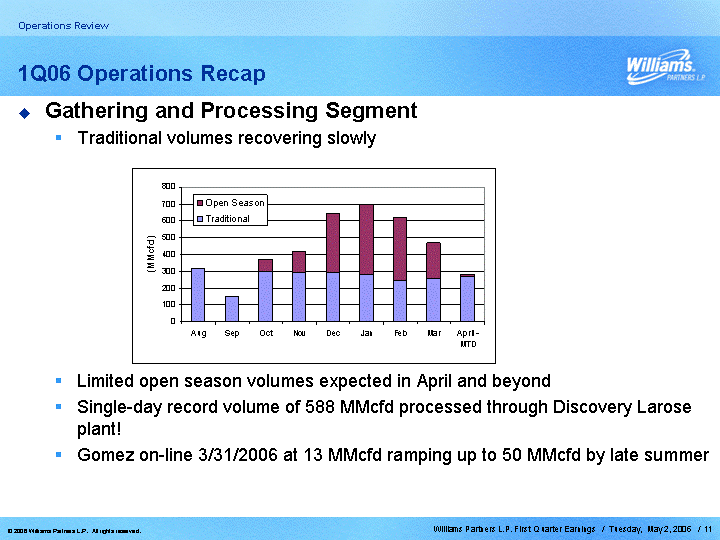
| 1Q06 Operations Recap Gathering and Processing Segment Traditional volumes recovering slowly Limited open season volumes expected in April and beyond Single-day record volume of 588 MMcfd processed through Discovery Larose plant! Gomez on-line 3/31/2006 at 13 MMcfd ramping up to 50 MMcfd by late summer Operations Review |
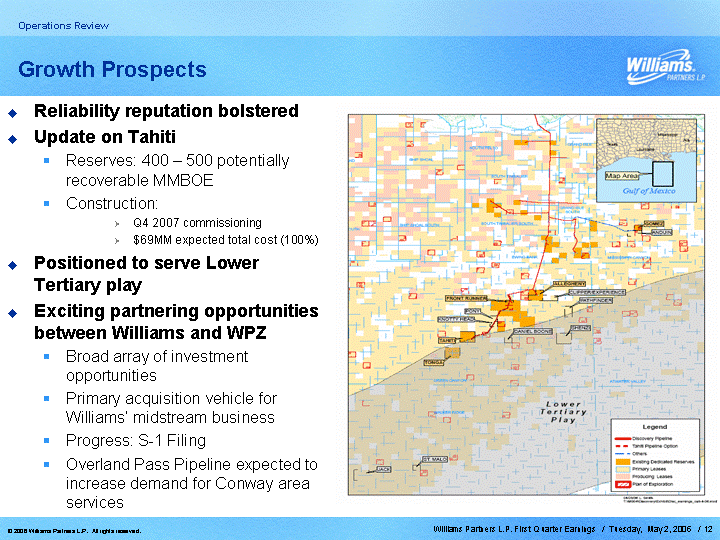
| Growth Prospects Reliability reputation bolstered Update on Tahiti Reserves: 400 - 500 potentially recoverable MMBOE Construction: Q4 2007 commissioning $69MM expected total cost (100%) Positioned to serve Lower Tertiary play Exciting partnering opportunities between Williams and WPZ Broad array of investment opportunities Primary acquisition vehicle for Williams' midstream business Progress: S-1 Filing Overland Pass Pipeline expected to increase demand for Conway area services Operations Review |
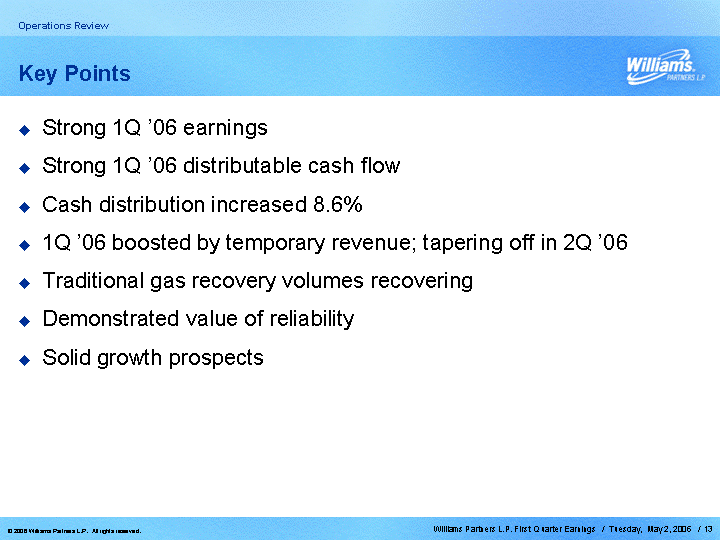
| Key Points Strong 1Q '06 earnings Strong 1Q '06 distributable cash flow Cash distribution increased 8.6% 1Q '06 boosted by temporary revenue; tapering off in 2Q '06 Traditional gas recovery volumes recovering Demonstrated value of reliability Solid growth prospects Operations Review |

| Q&A |
| Non-GAAP Reconciliations |

| Non-GAAP Disclaimer This presentation includes certain financial measures, Adjusted EBITDA Excluding Investment in Discovery, in our case, and, Adjusted EBITDA in Discovery's case, and Distributable Cash Flow that are non-GAAP financial measures as defined under the rules of the Securities and Exchange Commission. For Williams Partners L.P., we define Adjusted EBITDA Excluding Investment in Discovery as the sum of net income (loss) plus interest (income) expense and depreciation and accretion, and the amortization of a natural gas contract, less our equity earnings in Discovery and we also adjust for certain non-cash, non-recurring items. For Discovery, we define Adjusted EBITDA as net income plus interest (income) expense, depreciation and accretion. Our equity share of Discovery's Adjusted EBITDA is 40%. For Williams Partners L.P. we define Distributable Cash Flow as net income (loss) plus the non-cash affiliate interest expense associated with the advances from affiliate that were forgiven by Williams, depreciation and accretion, and the amortization of a natural gas contract, less our equity earnings in Discovery, as well as adjustments for certain non-cash, non-recurring items, plus reimbursements from Williams under an omnibus agreement and less maintenance capital expenditures. For Discovery we define Distributable Cash Flow as net income (loss) plus depreciation and accretion and less maintenance capital expenditures. Our equity share of Discovery's Distributable Cash Flow is 40%. This presentation is accompanied by a reconciliation of these non-GAAP financial measures to their nearest GAAP financial measures. Management uses these financial measures because they are widely accepted financial indicators used by investors to compare company performance. In addition, management believes that these measures provide investors an enhanced perspective of the operating performance of the Partnership's assets and the cash that the business is generating. Neither Adjusted EBITDA nor Distributable Cash Flow are intended to represent cash flows for the period, nor are they presented as an alternative to net income (loss) or cash flow from operations. They should not be considered in isolation or as substitutes for a measure of performance prepared in accordance with United States generally accepted accounting principles. |
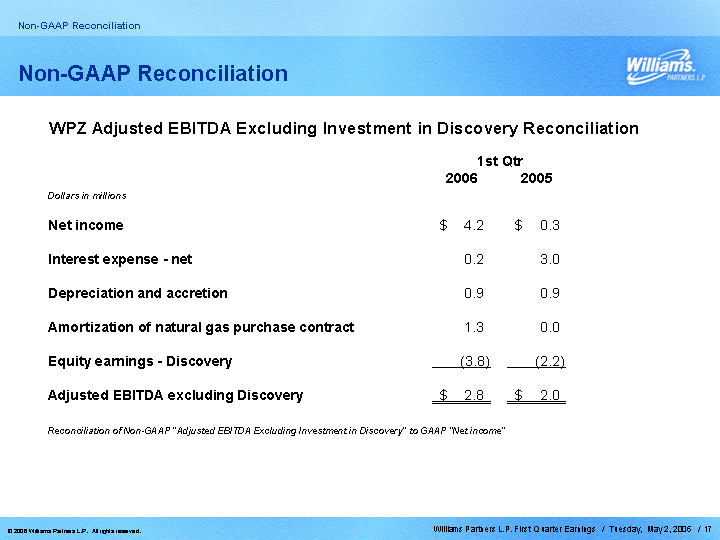
| Non-GAAP Reconciliation Non-GAAP Reconciliation WPZ Adjusted EBITDA Excluding Investment in Discovery Reconciliation 1st Qtr 2006 2005 Dollars in millions Net income 4.2 $ 0.3 $ Interest expense - net 0.2 3.0 Depreciation and accretion 0.9 0.9 Amortization of natural gas purchase contract 1.3 0.0 Equity earnings - Discovery (3.8) (2.2) Adjusted EBITDA excluding Discovery 2.8 $ 2.0 $ Reconciliation of Non-GAAP "Adjusted EBITDA Excluding Investment in Discovery" to GAAP "Net income" |

| Non-GAAP Reconciliation Non-GAAP Reconciliation Discovery Producer Services Adjusted EBITDA Reconciliation 1st Qtr 2006 2005 Dollars in millions Net Income 9.5 $ 5.5 $ Interest income (0.6) (0.3) Depreciation and accretion 6.4 6.1 Adjusted EBITDA - 100% 15.3 $ 11.3 $ Adjusted EBITDA - 40% 6.1 $ 4.5 $ Reconciliation of Non-GAAP "Adjusted EBITDA" to GAAP "Net income" |
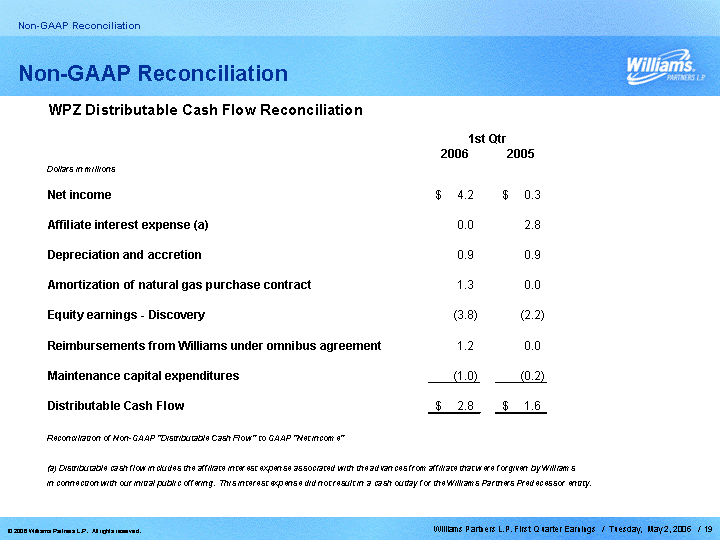
| Non-GAAP Reconciliation Non-GAAP Reconciliation WPZ Distributable Cash Flow Reconciliation 1st Qtr 2006 2005 Dollars in millions Net income 4.2 $ 0.3 $ Affiliate interest expense (a) 0.0 2.8 Depreciation and accretion 0.9 0.9 Amortization of natural gas purchase contract 1.3 0.0 Equity earnings - Discovery (3.8) (2.2) Reimbursements from Williams under omnibus agreement 1.2 0.0 Maintenance capital expenditures (1.0) (0.2) Distributable Cash Flow 2.8 $ 1.6 $ Reconciliation of Non-GAAP "Distributable Cash Flow" to GAAP "Net income" (a) Distributable cash flow includes the affiliate interest expense associated with the advances from affiliate that were forgiven by Williams in connection with our initial public offering. This interest expense did not result in a cash outlay for the Williams Partners Predecessor entity. |

| Non-GAAP Reconciliation Non-GAAP Reconciliation Discovery Producer Services Distributable Cash Flow Reconciliation 1st Qtr 2006 2005 Dollars in millions Net Income 9.5 $ 5.5 $ Depreciation and accretion 6.4 6.1 Maintenance capital expenditures (0.6) (1.9) Distributable Cash Flow - 100% 15.3 $ 9.7 $ Distributable Cash Flow - 40% 6.1 $ 3.9 $ Reconciliation of Non-GAAP "Distributable Cash Flow" to GAAP "Net income" |

| Williams Partners L.P. |