United States
Securities and Exchange Commission
Washington, D.C. 20549
Form N-CSR
Certified Shareholder Report of Registered Management Investment Companies
811-1
(Investment Company Act File Number)
Federated Global Allocation Fund
_______________________________________________________________
(Exact Name of Registrant as Specified in Charter)
Federated Investors Funds
4000 Ericsson Drive
Warrendale, Pennsylvania 15086-7561
(Address of Principal Executive Offices)
(412) 288-1900
(Registrant's Telephone Number)
John W. McGonigle, Esquire
Federated Investors Tower
1001 Liberty Avenue
Pittsburgh, Pennsylvania 15222-3779
(Name and Address of Agent for Service)
(Notices should be sent to the Agent for Service)
Date of Fiscal Year End: 11/30/15
Date of Reporting Period: 11/30/15
Item 1. Reports to Stockholders

| Share Class | Ticker |
| A | FSTBX |
| B | FSBBX |
| C | FSBCX |
| R | FSBKX |
| Institutional | SBFIX |

| 1 | Please see the footnotes to the line graphs under “Fund Performance and Growth of a $10,000 Investment” below for the definition of, and more information about, the Blended Index. |
| 2 | The Fund's broad-based security market indexes are the S&P 500 Index and the Barclays U.S. Aggregate Bond Index, which had total returns of 2.75% and 0.97%, respectively. Please see the footnotes to the line graphs under “Fund Performance and Growth of a $10,000 Investment” below for the definition of, and more information about, the S&P 500 Index and the Barclays U.S. Aggregate Bond Index. |
| 3 | Please see the footnotes to the line graphs under “Fund Performance and Growth of a $10,000 Investment” below for the definition of, and more information about, the MWAFA. |
| 4 | The MSCI USA Index is a free float adjusted market capitalization index that is designed to measure large- and mid-cap U.S. equity market performance. The index is unmanaged, and it is not possible to invest directly in an index. |
| 5 | The CBOE Volatility Index® (VIX®) is a key measure of market expectations of near-term volatility conveyed by S&P 500 stock index option prices. The index is unmanaged, and it is not possible to invest directly in an index. |
| 6 | The Russell 2000® Index measures the performance of the small-cap segment of the U.S. equity universe. The Russell 2000® Index is a subset of the Russell 3000® Index representing approximately 10% of the total market capitalization of that index. It includes approximately 2000 of the smallest securities based on a combination of their market cap and current index membership. The Russell 2000® Index is constructed to provide a comprehensive and unbiased small-cap barometer and is completely reconstituted annually to ensure larger stocks do not distort the performance and characteristics of the true small-cap opportunity set. The index is unmanaged, and it is not possible to invest directly in an index. |
| 7 | The S&P 500 Index is a capitalization-weighted index of 500 stocks designed to measure performance of the broad domestic economy through changes in the aggregate market value of 500 stocks representing all major industries. The index is unmanaged, and it is not possible to invest directly in an index. |
| 8 | International investing involves special risks including currency risk, increased volatility, political risks, and differences in auditing and other financial standards. |
| 9 | The MSCI EAFE Index is an equity index which captures large- and mid-cap representation across developed markets countries around the world, excluding the United States and Canada. With 906 constituents, the index covers approximately 85% of the free float-adjusted market capitalization in each country. The index is unmanaged, and it is not possible to invest directly in an index. |
| 10 | The MSCI country indexes are designed to measure the performance of the large- and mid-cap segments of the respective country's market. The index covers approximately 85% of the free float-adjusted market capitalization in each country. The index is unmanaged, and it is not possible to invest directly in an index. |
| 11 | The MSCI Europe Index captures large- and mid-cap representation across 15 developed markets countries in Europe. The index is unmanaged, and it is not possible to invest directly in an index. |
| 12 | Prices of emerging markets securities can be significantly more volatile than the prices of securities in developed countries, and currency risk and political risks are accentuated in emerging markets. |
| 13 | The MSCI Emerging Markets Index captures large- and mid-cap representation across 21 Emerging Markets (EM) countries. The index covers approximately 85% of the free float-adjusted market capitalization in each country. The index is unmanaged, and it is not possible to invest directly in an index. |
| 14 | The U.S. Dollar Index indicates the general international value of the U.S. dollar by averaging the exchange rates between the U.S. dollar and six major world currencies. The index is unmanaged, and it is not possible to invest directly in an index. |
| 15 | Bond prices are sensitive to changes in interest rates, and a rise in interest rates can cause a decline in their prices. |
| 16 | High-yield, lower-rated securities generally entail greater market, credit and liquidity risks than investment-grade securities and may include higher volatility and higher risk of default. |
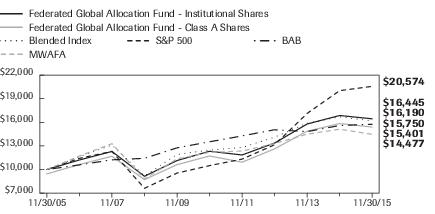
| Federated Global Allocation Fund - | Institutional Shares | Class A Shares | Blended Index | S&P 500 | BAB | MWAFA |
| F | F | I | I | I | I | |
| 11/30/2005 | 10,000 | 9,450 | 10,000 | 10,000 | 10,000 | 10,000 |
| 11/30/2006 | 11,219 | 10,636 | 11,633 | 11,423 | 10,594 | 11,717 |
| 11/30/2007 | 12,301 | 11,687 | 13,112 | 12,305 | 11,235 | 13,284 |
| 11/30/2008 | 9,149 | 8,720 | 9,209 | 7,618 | 11,430 | 8,815 |
| 11/30/2009 | 11,143 | 10,625 | 11,915 | 9,552 | 12,759 | 11,352 |
| 11/30/2010 | 12,324 | 11,725 | 12,478 | 10,501 | 13,527 | 12,191 |
| 11/30/2011 | 11,852 | 10,933 | 12,802 | 11,324 | 14,274 | 12,350 |
| 11/30/2012 | 13,370 | 12,634 | 14,116 | 13,150 | 15,060 | 13,310 |
| 11/30/2013 | 15,787 | 14,874 | 15,885 | 17,134 | 14,818 | 14,493 |
| 11/30/2014 | 16,868 | 15,845 | 16,695 | 20,023 | 15,599 | 15,126 |
| 11/30/2015 | 16,445 | 15,401 | 16,190 | 20,574 | 15,750 | 14,477 |
| ■ | Total returns shown for the Class A Shares include the maximum sales charge of 5.50% ($10,000 investment minus $550 sales charge = $9,450). |
| 1 Year | 5 Years | 10 Years | |
| Class A Shares | -8.15% | 5.45% | 4.70% |
| Class B Shares | -8.41% | 5.47% | 4.60% |
| Class C Shares | -4.43% | 5.85% | 4.47% |
| Class R Shares | -3.26% | 6.20% | 4.81% |
| Institutional Shares6 | -2.51% | 6.98% | 5.38% |
| Blended Index | -3.02% | 5.35% | 4.94% |
| S&P 500 | 2.75% | 14.40% | 7.48% |
| BAB | 0.97% | 3.09% | 4.65% |
| MWAFA | -4.13% | 4.76% | 4.73% |
| 1 | Represents a hypothetical investment of $10,000 in the Fund after deducting applicable sales charges: For Class A Shares, the maximum sales charge of 5.50% ($10,000 investment minus $550 sales charge = $9,450); for Class B Shares, the maximum contingent deferred sales charge is 5.50% on any redemption of shares held up to one year from the purchase date; for Class C Shares, the maximum contingent deferred sales charge is 1.00% on any redemption less than one year from the purchase date. The Fund's performance assumes the reinvestment of all dividends and distributions. The Blended Index, S&P 500 and BAB have been adjusted to reflect reinvestment of dividends on securities in the indexes. |
| 2 | The Blended Index is a custom blended index comprised of 60% of the MSCI ACWI and 40% of the BGA. The MSCI ACWI captures large- and mid-cap representation across 23 developed markets countries and 23 emerging markets countries. The index covers approximately 85% of the global investable equity opportunity set. The BGA is a measure of global investment grade debt from 24 different local currency markets. This multi-currency benchmark includes fixed-rate treasury, government-related, corporate and securitized bonds from both developed and emerging markets issuers. The indexes are not adjusted to reflect sales loads, expenses or other fees that the Securities and Exchange Commission (SEC) requires to be reflected in the Fund's performance. The indexes are unmanaged and, unlike the Fund, are not affected by cash flows. It is not possible to invest directly in an index. |
| 3 | The S&P 500 is an unmanaged, capitalization-weighted index of 500 stocks designed to measure performance of the broad domestic economy through changes in the aggregate market value of 500 stocks representing all major industries. The index is not adjusted to reflect sales loads, expenses or other fees that the SEC requires to be reflected in the Fund's performance. The index is unmanaged and, unlike the Fund, is not affected by cash flows. It is not possible to invest directly in an index. |
| 4 | The BAB is a broad-based benchmark that measures the investment grade, U.S. dollar-denominated, fixed-rate taxable bond market, including Treasuries, government-related and corporate securities, mortgage-backed securities (agency fixed-rate and hybrid ARM pass-throughs), asset-backed securities and commercial mortgage-backed securities. The index is not adjusted to reflect sales loads, expenses or other fees that the SEC requires to be reflected in the Fund's performance. The index is unmanaged and, unlike the Fund, is not affected by cash flows. It is not possible to invest directly in an index. |
| 5 | Morningstar figures represent the average of the total returns reported by all the mutual funds designated by Morningstar as falling into the respective category indicated. They do not reflect sales charges. |
| 6 | The Fund's Institutional Shares commenced operation on June 12, 2009. The Fund offers four other classes of shares: Class A Shares, Class B Shares, Class C Shares and Class R Shares. For the period prior to the commencement of operations of Institutional Shares, the performance information shown is for the Fund's Class A Shares. The performance of Class A Shares has not been adjusted to reflect the expenses of Institutional Shares since Institutional Shares have a lower expense ratio than the expense ratio of the Class A Shares. The performance of Class A Shares has been adjusted to remove any voluntary waiver of Fund expenses related to the Class A Shares that may have occurred during the period prior to the commencement of operations of Institutional Shares. Additionally, the performance information shown below has been adjusted to reflect the absence of sales charges applicable to Class A Shares. |
| Portfolio Composition | Percentage of Total Net Assets2 |
| Domestic Equity Securities | 28.5% |
| International Equity Securities | 25.8% |
| Corporate Debt Securities | 13.5% |
| Foreign Debt Securities | 9.7% |
| Mortgage-Backed Securities3 | 3.1% |
| Trade Finance Agreements | 2.6% |
| U.S. Treasury and Agency Securities | 1.2% |
| Collateralized Mortgage-Backed Obligations | 1.1% |
| Floating Rate Loan | 0.7% |
| Asset-Backed Securities | 0.3% |
| Municipal Securities4 | 0.0% |
| Other Security Type5 | 6.0% |
| Derivative Contracts6 | 0.3% |
| Cash Equivalents7 | 1.7% |
| Other Assets and Liabilities—Net8 | 5.5% |
| TOTAL | 100.0% |
| 1 | See the Fund's Prospectus and Statement of Additional Information for a description of these security types. |
| 2 | As of the date specified above, the Fund owned shares of one or more affiliated investment companies. For purposes of this table, the affiliated investment company (other than an affiliated money market mutual fund) is not treated as a single portfolio security, but rather the Fund is treated as owning a pro rata portion of each security and each other asset and liability owned by the affiliated investment company. Accordingly, the percentages of total net assets shown in the table will differ from those presented on the Portfolio of Investments. |
| 3 | For purposes of this table, Mortgage-Backed Securities include mortgage-backed securities guaranteed by Government Sponsored Entities and adjustable rate mortgage-backed securities. |
| 4 | Represents less than 0.1%. |
| 5 | Other Security Type consists of exchange-traded funds and purchased put options. |
| 6 | Based upon net unrealized appreciation (depreciation) or value of the derivative contracts as applicable. Derivative contracts may consist of futures, forwards, options and swaps. The impact of a derivative contract on the Fund's performance may be larger than its unrealized appreciation (depreciation) or value may indicate. In many cases, the notional value or amount of a derivative contract may provide a better indication of the contract's significance to the portfolio. More complete information regarding the Fund's direct investments in derivative contracts, including unrealized appreciation (depreciation), value and notional values or amounts of such contracts, can be found in the table at the end of the Portfolio of Investments included in this Report. |
| 7 | Cash Equivalents include any investments in money market mutual funds and/or overnight repurchase agreements. |
| 8 | Assets, other than investments in securities and derivative contracts, less liabilities. See Statement of Assets and Liabilities. |
| Sector Composition of Equity Holdings | Percentage of Equity Securities |
| Financials | 23.0% |
| Consumer Discretionary | 15.5% |
| Health Care | 13.6% |
| Information Technology | 12.4% |
| Industrials | 12.2% |
| Utilities | 5.5% |
| Energy | 4.9% |
| Consumer Staples | 4.8% |
| Telecommunication Services | 4.6% |
| Materials | 3.5% |
| TOTAL | 100.0% |
| 9 | Sector classifications are based upon, and individual portfolio securities are assigned to, the classifications of the Global Industry Classification Standard (GICS) except that the Adviser assigns a classification to securities not classified by the GICS and to securities for which the Adviser does not have access to the classification made by the GICS. |
| Shares or Principal Amount | Value in U.S. Dollarsi | ||
| COMMON STOCKS—54.3% | |||
| Consumer Discretionary—8.4% | |||
| 800 | 1 | Amazon.com, Inc. | $531,840 |
| 6,030 | 1 | Apollo Education Group, Inc. | 42,572 |
| 5,285 | Aristocrat Leisure Ltd. | 36,351 | |
| 900 | 1 | Asbury Automotive Group, Inc. | 67,590 |
| 1,015 | Bayerische Motoren Werke AG | 110,753 | |
| 4,094 | Bloomin' Brands, Inc. | 70,867 | |
| 13,500 | Bridgestone Corp. | 480,994 | |
| 1,625 | 1 | Burlington Stores, Inc. | 78,179 |
| 6,873 | 1 | Caesars Entertainment Corp. | 58,214 |
| 2,164 | Caleres, Inc. | 60,808 | |
| 1,900 | Carnival Corp. | 96,007 | |
| 10,300 | Carter's, Inc. | 888,169 | |
| 35,100 | Comcast Corp., Class A | 2,136,186 | |
| 4,532 | 1 | Container Store Group, Inc. | 46,544 |
| 5,471 | Continental Ag | 1,321,663 | |
| 5,900 | 1 | CROCs, Inc. | 65,638 |
| 32,587 | D. R. Horton, Inc. | 1,052,886 | |
| 26,700 | Daihatsu Motor Co. Ltd. | 346,912 | |
| 3,866 | Daimler AG | 345,913 | |
| 4,600 | Dana Holding Corp. | 75,624 | |
| 15,200 | Darden Restaurants, Inc. | 853,784 | |
| 4,369 | Delphi Automotive PLC | 383,948 | |
| 6,000 | 1 | Denny's Corp. | 57,840 |
| 16,750 | Dollarama, Inc. | 1,120,053 | |
| 1,100 | 1 | Drew Industries, Inc. | 66,473 |
| 297 | 1 | Express, Inc. | 4,972 |
| 990 | Extended Stay America, Inc. | 16,939 | |
| 63,000 | Ford Motor Co. | 902,790 | |
| 1,221 | 1 | G-III Apparel Group Ltd. | 56,007 |
| 1,626 | Gannett Co., Inc. | 27,772 | |
| 890 | Gildan Activewear, Inc. | 27,611 | |
| 3,200 | 1 | Gray Television, Inc. | 53,600 |
| 1,800 | Harman International Industries, Inc. | 185,688 | |
| 1,971 | Hilton Worldwide Holdings, Inc. | 45,767 |
| Shares or Principal Amount | Value in U.S. Dollarsi | ||
| COMMON STOCKS—continued | |||
| Consumer Discretionary—continued | |||
| 2,052 | Home Depot, Inc. | $274,722 | |
| 4,200 | Husqvarna AB, Class B | 27,358 | |
| 200 | 1 | IRobot Corp. | 6,618 |
| 306,924 | ITV PLC | 1,252,719 | |
| 50,600 | Isuzu Motors Ltd. | 569,888 | |
| 700 | Jack in the Box, Inc. | 51,898 | |
| 2,900 | Johnson Controls, Inc. | 133,400 | |
| 208,015 | Kingfisher PLC | 1,107,171 | |
| 4,329 | 1 | La Quinta Holdings, Inc. | 64,892 |
| 2,500 | La-Z-Boy, Inc. | 67,025 | |
| 38,000 | Li & Fung Ltd. | 25,971 | |
| 21,613 | 1 | Liberty Media Corp., Class C | 845,068 |
| 3,500 | Lowe's Cos., Inc. | 268,100 | |
| 3,552 | Luxottica Group S.p.A | 237,282 | |
| 56,400 | MGM China Holdings Ltd. | 74,443 | |
| 4,200 | Macy's, Inc. | 164,136 | |
| 23,706 | Magna International, Inc. | 1,078,215 | |
| 1,041 | Marriott Vacations Worldwide Corp. | 63,324 | |
| 6,100 | McDonald's Corp. | 696,376 | |
| 29,448 | 1 | Michael Kors Holdings Ltd. | 1,266,853 |
| 11,754 | Michelin, Class B | 1,177,205 | |
| 800 | 1 | NVR, Inc. | 1,345,984 |
| 5,300 | New York Times Co., Class A | 74,624 | |
| 1,300 | Nexstar Broadcasting Group, Inc., Class A | 76,167 | |
| 19,100 | Nike, Inc., Class B | 2,526,548 | |
| 129,800 | Nissan Motor Co. Ltd. | 1,387,590 | |
| 2,700 | Nutri/System, Inc. | 61,938 | |
| 1,106 | 1 | Ollie's Bargain Outlet Holdings, Inc. | 19,532 |
| 6,300 | Panasonic Corp. | 71,600 | |
| 648 | Pandora A/S | 76,717 | |
| 3,175 | 1 | Party City Holdco, Inc. | 40,323 |
| 33,902 | Persimmon PLC | 977,795 | |
| 700 | 1 | Pinnacle Entertainment, Inc. | 22,953 |
| 11,400 | Polaris Industries, Inc. | 1,201,902 | |
| 2,332 | ProSiebenSat.1 Media SE | 122,437 | |
| 16,509 | Realestate.com.au Ltd. | 597,557 | |
| 3,359 | Relx PLC | 60,607 |
| Shares or Principal Amount | Value in U.S. Dollarsi | ||
| COMMON STOCKS—continued | |||
| Consumer Discretionary—continued | |||
| 181,000 | SJM Holdings Ltd. | $134,107 | |
| 45,600 | Sands China Ltd. | 153,266 | |
| 4,000 | Sekisui Chemical Co. Ltd. | 47,716 | |
| 2,200 | 1 | Select Comfort Corp. | 51,964 |
| 2,855 | 1 | ServiceMaster Global Holdings, Inc. | 107,005 |
| 262,173 | 1 | Sirius XM Holdings, Inc. | 1,077,531 |
| 2,797 | Six Flags Entertainment Corp. | 145,164 | |
| 9,682 | 1 | Skechers USA, Inc., Class A | 292,396 |
| 3,883 | 1 | Smith & Wesson Holding Corp. | 71,214 |
| 2,400 | Sonic Corp. | 69,744 | |
| 7,289 | Starbucks Corp. | 447,472 | |
| 900 | Starwood Hotels & Resorts | 64,656 | |
| 500 | Sturm Ruger & Co., Inc. | 26,050 | |
| 12,200 | Suzuki Motor Corp. | 375,479 | |
| 5,292 | TJX Cos., Inc. | 373,615 | |
| 14,445 | 1 | Tegna, Inc. | 408,071 |
| 5,000 | Time Warner, Inc. | 349,900 | |
| 17,700 | Toyota Motor Corp. | 1,097,987 | |
| 4,596 | Travelport Worldwide Ltd. | 61,173 | |
| 1,300 | V.F. Corp. | 84,110 | |
| 32,686 | Vivendi SA | 687,554 | |
| 58 | Volkswagen AG | 8,654 | |
| 61,200 | WPP PLC | 1,414,859 | |
| 14,900 | Walt Disney Co. | 1,690,703 | |
| 3,900 | Whirlpool Corp. | 633,828 | |
| 3,300 | Wynn Macau Ltd. | 4,117 | |
| TOTAL | 39,712,227 | ||
| Consumer Staples—2.6% | |||
| 400 | Andersons, Inc. | 13,788 | |
| 3,100 | Alimentation Couche-Tard, Inc., Class B | 141,322 | |
| 15,723 | CVS Health Corp. | 1,479,377 | |
| 257 | Cal-Maine Foods, Inc. | 14,009 | |
| 1,255 | Calavo Growers, Inc. | 71,008 | |
| 800 | Casey's General Stores, Inc. | 93,016 | |
| 2,349 | 1 | Coca-Cola HBC AG | 56,994 |
| 6,500 | Colgate-Palmolive Co. | 426,920 | |
| 5,877 | ConAgra Foods, Inc. | 240,546 |
| Shares or Principal Amount | Value in U.S. Dollarsi | ||
| COMMON STOCKS—continued | |||
| Consumer Staples—continued | |||
| 3,900 | Dean Foods Co. | $73,164 | |
| 2,115 | Delhaize Group | 211,759 | |
| 200 | 1 | Diamond Foods, Inc. | 8,096 |
| 1,100 | FamilyMart Co. Ltd. | 49,103 | |
| 700 | Fresh Del Monte Produce, Inc. | 30,597 | |
| 6,600 | 1 | Herbalife Ltd. | 381,018 |
| 45,200 | Japan Tobacco, Inc. | 1,621,280 | |
| 6,117 | Kimberly-Clark Corp. | 728,841 | |
| 5,000 | Kellogg Co. | 343,850 | |
| 60,269 | Koninklijke Ahold NV | 1,310,034 | |
| 11,073 | Metro, Inc. | 318,894 | |
| 5,000 | Molson Coors Brewing Co., Class B | 460,150 | |
| 12,060 | Nestle SA | 893,666 | |
| 5,133 | Philip Morris International, Inc. | 448,573 | |
| 6,400 | Procter & Gamble Co. | 478,976 | |
| 38,176 | Sainsbury (J) PLC | 145,927 | |
| 1,000 | Sanderson Farms, Inc. | 74,810 | |
| 21,200 | Swedish Match AB | 730,730 | |
| 300 | 1 | USANA, Inc. | 40,182 |
| 100 | WD 40 Co. | 9,877 | |
| 17,644 | Walgreens Boots Alliance, Inc. | 1,482,625 | |
| TOTAL | 12,379,132 | ||
| Energy—2.7% | |||
| 3,717 | Alon USA Energy, Inc. | 65,382 | |
| 272,890 | BP PLC | 1,583,375 | |
| 14,500 | Baker Hughes, Inc. | 784,015 | |
| 10,815 | California Resources Corp. | 44,342 | |
| 14,000 | Chevron Corp. | 1,278,480 | |
| 8,261 | Columbia Pipeline Group, Inc. | 158,363 | |
| 760 | Delek Group Ltd. | 171,036 | |
| 2,500 | Delek US Holdings, Inc. | 69,225 | |
| 2,900 | Devon Energy Corp. | 133,429 | |
| 23,770 | 1 | EP Energy Corp. | 134,538 |
| 37,440 | Exxon Mobil Corp. | 3,057,350 | |
| 9,063 | Frank's International N.V. | 153,165 | |
| 3,143 | Green Plains, Inc. | 74,458 | |
| 5,052 | Halliburton Co. | 201,322 |
| Shares or Principal Amount | Value in U.S. Dollarsi | ||
| COMMON STOCKS—continued | |||
| Energy—continued | |||
| 800 | HollyFrontier Corp. | $38,464 | |
| 101,000 | Inpex Corp. | 1,006,597 | |
| 40,447 | Kinder Morgan, Inc. | 953,336 | |
| 10,574 | Marathon Petroleum Corp. | 617,627 | |
| 4,368 | Nordic American Tanker Shipping Ltd. | 64,646 | |
| 538 | OMV AG | 15,349 | |
| 1,828 | Repsol YPF SA | 23,734 | |
| 10,093 | Royal Dutch Shell PLC, Class B | 251,122 | |
| 1,800 | Schlumberger Ltd. | 138,870 | |
| 21,102 | Suncor Energy, Inc. | 583,072 | |
| 1,400 | Teekay Tankers Ltd., Class A | 9,856 | |
| 400 | Tesoro Petroleum Corp. | 46,068 | |
| 5,828 | Total SA | 289,125 | |
| 7,685 | Valero Energy Corp. | 552,244 | |
| 1,800 | Western Refining, Inc. | 81,468 | |
| TOTAL | 12,580,058 | ||
| Financials—12.5% | |||
| 6,569 | AGEAS | 287,234 | |
| 3,114 | ARMOUR Residential REIT, Inc. | 65,799 | |
| 48,756 | AXA SA | 1,317,251 | |
| 1,969 | Alexander and Baldwin, Inc. | 74,645 | |
| 8,858 | Allianz SE | 1,568,695 | |
| 8,100 | Allstate Corp. | 508,356 | |
| 460 | Altisource Residential Corp. | 6,090 | |
| 4,135 | American Capital Mortgage Investment Corp. | 61,984 | |
| 4,000 | Apollo Commercial Real Estate Finance, Inc. | 70,200 | |
| 199 | Argo Group International Holdings Ltd. | 12,642 | |
| 4,099 | BBCN Bancorp, Inc. | 77,512 | |
| 337,000 | BOC Hong Kong (Holdings) Ltd. | 1,038,741 | |
| 233 | Banco Bilbao Vizcaya Argentaria SA | 1,932 | |
| 2,800 | Bancorpsouth, Inc. | 75,320 | |
| 12,705 | Bank Hapoalim Ltd. | 65,674 | |
| 86,713 | 1 | Bank Leumi Le-Israel | 313,218 |
| 120,000 | Bank of America Corp. | 2,091,600 | |
| 1,600 | Bank of Montreal | 92,385 | |
| 5,915 | Bank of Nova Scotia | 269,695 | |
| 96,000 | Bank Of Yokohama Ltd. | 565,528 |
| Shares or Principal Amount | Value in U.S. Dollarsi | ||
| COMMON STOCKS—continued | |||
| Financials—continued | |||
| 143,165 | Barclays PLC | $481,228 | |
| 17,662 | 1 | Berkshire Hathaway, Inc., Class B | 2,368,298 |
| 900 | Blackrock, Inc. | 327,348 | |
| 2,300 | Boston Private Financial Holdings | 27,830 | |
| 6,468 | Brookfield Asset Management, Inc., Class A | 222,066 | |
| 4,400 | CNO Financial Group, Inc. | 89,012 | |
| 10,001 | CNP Assurances | 139,198 | |
| 4,200 | CVB Financial Corp. | 77,700 | |
| 8,744 | CYS Investments, Inc. | 66,280 | |
| 14,100 | Canadian Imperial Bank of Commerce | 1,058,780 | |
| 4,500 | Capital One Financial Corp. | 353,295 | |
| 6,300 | Capstead Mortgage Corp. | 59,787 | |
| 200 | Cash America International, Inc. | 6,750 | |
| 2,500 | Cathay Bancorp, Inc. | 85,800 | |
| 18,700 | Chugoku Bank Ltd. | 259,572 | |
| 10,700 | Citigroup, Inc. | 578,763 | |
| 31,188 | Citizens Financial Group, Inc. | 830,536 | |
| 3,519 | Colony Capital, Inc., Class A | 71,999 | |
| 51,637 | 1 | Commerzbank AG | 568,452 |
| 249,423 | Corp Mapfre Sa | 682,324 | |
| 700 | 1 | Credit Acceptance Corp. | 140,294 |
| 5,603 | Credit Agricole SA | 67,527 | |
| 12,400 | Danske Bank | 332,245 | |
| 20,331 | Delta Lloyd NV | 146,201 | |
| 2,505 | Deutsche Wohnen AG | 68,919 | |
| 13,130 | 1 | Direct Line Insurance Group PLC | 81,434 |
| 7,100 | Discover Financial Services | 402,996 | |
| 14,756 | DnB ASA | 194,127 | |
| 21,400 | 1 | E*Trade Financial Corp. | 651,202 |
| 3,695 | EverBank Financial Corp. | 63,776 | |
| 5,700 | FNB Corp. | 82,764 | |
| 5,567 | 1 | FNFV Group | 62,295 |
| 1,200 | First American Financial Corp. | 47,328 | |
| 3,900 | First Midwest Bancorp, Inc. | 76,206 | |
| 5,066 | 1 | Four Corners Property Trust, Inc. | 100,307 |
| 157,000 | Fukuoka Financial Group, Inc. | 762,146 | |
| 3,032 | General Property Trust Group | 10,155 |
| Shares or Principal Amount | Value in U.S. Dollarsi | ||
| COMMON STOCKS—continued | |||
| Financials—continued | |||
| 28,084 | Gjensidige Forsikring ASA | $453,157 | |
| 1,400 | Goldman Sachs Group, Inc. | 266,028 | |
| 2,362 | Great Western Bancorp, Inc. | 71,380 | |
| 1,600 | Great-West Lifeco, Inc. | 43,479 | |
| 2,194 | Groupe Bruxelles Lambert SA | 180,162 | |
| 2,000 | 1 | HFF, Inc. | 68,740 |
| 274,146 | HSBC Holdings PLC | 2,184,546 | |
| 34,000 | Hang Seng Bank Ltd. | 615,191 | |
| 10,068 | Hannover Rueck SE | 1,178,287 | |
| 7,100 | Hartford Financial Services Group, Inc. | 324,044 | |
| 4,377 | Hatteras Financial Corp. | 61,628 | |
| 1,800 | Home Bancshares, Inc. | 81,216 | |
| 3,359 | ICAP PLC | 25,750 | |
| 2,468 | InfraREIT, Inc. | 49,780 | |
| 667 | Intact Financial Corp. | 44,462 | |
| 23,614 | Intesa Sanpaolo SpA | 80,775 | |
| 8,539 | Invesco Ltd. | 287,679 | |
| 5,477 | Invesco Mortgage Capital, Inc. | 73,501 | |
| 39,785 | Investec PLC | 338,549 | |
| 33,000 | Investor AB, Class B | 1,256,573 | |
| 7,178 | Investors Bancorp, Inc., NEW | 92,022 | |
| 5,100 | 1 | iStar Financial, Inc. | 67,320 |
| 44,140 | JPMorgan Chase & Co. | 2,943,255 | |
| 1,700 | Janus Capital Group, Inc. | 26,843 | |
| 4,487 | 1 | Julius Baer Group Ltd. | 214,258 |
| 13,240 | KBC Groupe | 789,742 | |
| 670 | Kearny Financial Corp. | 8,442 | |
| 3,115 | Kennedy-Wilson Holdings, Inc. | 81,301 | |
| 1,300 | Kinnevik Investment AB | 39,960 | |
| 337 | LegacyTexas Financial Group, Inc. | 10,282 | |
| 315,001 | Legal & General Group PLC | 1,287,104 | |
| 80,642 | LendLease Group | 745,734 | |
| 5,400 | Lincoln National Corp. | 296,946 | |
| 53,500 | Link REIT | 326,975 | |
| 8,700 | 1 | MBIA, Inc. | 57,159 |
| 8,700 | 1 | MGIC Investment Corp. | 82,998 |
| 17,300 | MSCI, Inc., Class A | 1,213,076 |
| Shares or Principal Amount | Value in U.S. Dollarsi | ||
| COMMON STOCKS—continued | |||
| Financials—continued | |||
| 6,483 | Macquarie Group Ltd. | $380,495 | |
| 28,600 | Manulife Financial Corp. | 470,724 | |
| 1,142 | 1 | Marcus & Millichap Co., Inc. | 37,469 |
| 4,000 | Mitsubishi Estate Co. Ltd. | 84,245 | |
| 29,700 | Morgan Stanley | 1,018,710 | |
| 19,863 | NASDAQ, Inc. | 1,164,369 | |
| 1,258 | NN Group NV | 42,947 | |
| 1,700 | National Bank of Canada, Montreal | 55,718 | |
| 5,900 | National Penn Bancshares, Inc. | 73,691 | |
| 4,560 | 1 | Nationstar Mortgage Holdings, Inc. | 62,107 |
| 9,006 | Natixis | 54,538 | |
| 65,355 | Navient Corp. | 778,378 | |
| 6,200 | New Residential Investment Corp. | 78,864 | |
| 6,600 | Nordea Bank AB | 73,083 | |
| 5,203 | Northwest Bancshares, Inc. | 72,530 | |
| 297,664 | Old Mutual PLC | 936,971 | |
| 800 | Old National Bancorp. | 11,800 | |
| 2,000 | Oversea-Chinese Banking Corp. Ltd. | 12,288 | |
| 4,300 | PNC Financial Services Group | 410,693 | |
| 3,105 | Partners Group Holding AG | 1,120,719 | |
| 1,749 | Pennymac Mortgage Investment Trust | 29,103 | |
| 113,647 | Platinum Asset Management Ltd. | 665,292 | |
| 15,300 | Popular, Inc. | 454,563 | |
| 2,100 | Potlatch Corp. | 70,182 | |
| 1,500 | Primerica, Inc. | 76,860 | |
| 1,900 | PrivateBancorp, Inc. | 83,809 | |
| 14,628 | Prudential Corp. PLC | 339,171 | |
| 4,605 | RSA Insurance Group PLC | 30,491 | |
| 5,200 | Radian Group, Inc. | 74,100 | |
| 402 | Raiffeisen Bank International AG | 6,287 | |
| 4,800 | Redwood Trust, Inc. | 66,144 | |
| 600 | Regions Financial Corp. | 6,084 | |
| 24,200 | Royal Bank of Canada, Montreal | 1,378,663 | |
| 5,400 | SEI Investments Co. | 293,706 | |
| 13,631 | Sampo Oyj, Class A | 674,426 | |
| 22,763 | Santander Consumer USA Holdings, Inc. | 401,539 | |
| 25,526 | Schroders PLC | 1,150,889 |
| Shares or Principal Amount | Value in U.S. Dollarsi | ||
| COMMON STOCKS—continued | |||
| Financials—continued | |||
| 16,575 | Scor Regroupe | $649,549 | |
| 1,800 | Skand Enskilda BKN, Class A | 19,128 | |
| 4,842 | Societe Generale, Paris | 230,757 | |
| 3,400 | 1 | St. Joe Co. | 66,028 |
| 4,599 | Sterling Bancorp | 80,666 | |
| 24,700 | Sumitomo Mitsui Financial Group, Inc. | 943,418 | |
| 9,000 | Sumitomo Mitsui Trust Holdings, Inc. | 34,414 | |
| 500 | Sun Life Financial Services of Canada | 16,489 | |
| 40,500 | Suntec Real Estate Investment | 44,098 | |
| 4,433 | 1 | Svenska Handelsbanken AB - A Shares | 59,626 |
| 1,518 | Swiss Re AG | 144,431 | |
| 7,096 | 1 | Synchrony Financial | 225,866 |
| 807 | Talmer Bancorp, Inc., Class A | 14,744 | |
| 23,700 | The Bank of New York Mellon Corp. | 1,039,008 | |
| 153,148 | Three I Group | 1,158,147 | |
| 4,200 | Tokio Marine Holdings, Inc. | 155,074 | |
| 20,600 | Toronto-Dominion Bank | 841,307 | |
| 1,200 | Trustmark Corp. | 30,300 | |
| 14,431 | UBS Group AG | 276,470 | |
| 11,283 | United Mizrahi Bank Ltd. | 133,400 | |
| 700 | Universal Insurance Holdings, Inc. | 13,825 | |
| 2,662 | Virtu Financial, Inc., Class A | 59,229 | |
| 26,934 | Voya Financial, Inc. | 1,096,214 | |
| 182 | 1 | Walker & Dunlop, Inc. | 5,376 |
| 48,400 | Wells Fargo & Co. | 2,666,840 | |
| 1,549 | WisdomTree Investments, Inc. | 33,691 | |
| TOTAL | 58,957,528 | ||
| Health Care—7.4% | |||
| 1,700 | 1 | AMAG Pharmaceutical, Inc. | 45,254 |
| 14,199 | Amgen, Inc. | 2,287,459 | |
| 4,857 | AbbVie, Inc. | 282,435 | |
| 8,886 | 1 | Actelion Ltd. | 1,245,939 |
| 4,200 | 1 | Affymetrix, Inc. | 39,774 |
| 31,810 | Agilent Technologies, Inc. | 1,330,294 | |
| 600 | Alfresa Holdings Corp. | 11,906 | |
| 2,082 | 1 | Allergan PLC | 653,519 |
| 1,700 | 1 | Amedisys, Inc. | 69,003 |
| Shares or Principal Amount | Value in U.S. Dollarsi | ||
| COMMON STOCKS—continued | |||
| Health Care—continued | |||
| 398 | 1 | Anacor Pharmaceuticals, Inc. | $46,459 |
| 3,150 | Anthem, Inc. | 410,697 | |
| 5,800 | 1 | Bio Rad Laboratories, Inc., Class A | 810,376 |
| 1,000 | 1 | BioCryst Pharmaceuticals, Inc. | 10,610 |
| 5,400 | Bristol-Myers Squibb Co. | 361,854 | |
| 19,440 | CSL Ltd. | 1,404,306 | |
| 1,500 | 1 | Cambrex Corp. | 80,445 |
| 2,850 | 1 | Catalent, Inc. | 79,372 |
| 2,570 | 1 | Celgene Corp. | 281,286 |
| 16,972 | Cochlear Ltd. | 1,160,097 | |
| 600 | Coloplast, Class B | 48,640 | |
| 1,700 | 1 | Cynosure, Inc., Class A | 71,502 |
| 2,000 | 1 | Emergent Biosolutions, Inc. | 75,340 |
| 2,767 | 1 | FibroGen, Inc. | 82,291 |
| 14,261 | Fresenius SE & Co. KGaA | 1,046,403 | |
| 13,600 | Gilead Sciences, Inc. | 1,441,056 | |
| 2,100 | 1 | Haemonetics Corp. | 67,704 |
| 4,200 | 1 | Halozyme Therapeutics, Inc. | 74,760 |
| 2,232 | 1 | Halyard Health, Inc. | 71,402 |
| 1,300 | 1 | Heartware International, Inc. | 62,218 |
| 1,395 | 1 | INC Research Holdings, Inc., Class A | 65,983 |
| 467 | 1 | INSYS Therapeutics, Inc. | 14,879 |
| 37,600 | Johnson & Johnson | 3,806,624 | |
| 6,091 | 1 | Juno Therapeutics, Inc. | 343,471 |
| 21,200 | Lilly (Eli) & Co. | 1,739,248 | |
| 1,248 | 1 | Magellan Health, Inc. | 65,707 |
| 1,576 | 1 | Mallinckrodt PLC | 107,026 |
| 2,000 | 1 | MedAssets, Inc. | 60,260 |
| 7,200 | Medtronic PLC | 542,448 | |
| 44,000 | Merck & Co., Inc. | 2,332,440 | |
| 300 | 1 | Merit Medical Systems, Inc. | 5,811 |
| 6,569 | 1 | Merrimack Pharmaceuticals, Inc. | 61,814 |
| 6,283 | 1 | MiMedx Group, Inc. | 56,296 |
| 2,100 | Mitsubishi Tanabe Pharma Corp. | 36,736 | |
| 21,840 | 1 | Mylan NV | 1,120,392 |
| 17,895 | Novo Nordisk A/S, Class B | 983,759 | |
| 1,500 | 1 | Natus Medical, Inc. | 73,170 |
| Shares or Principal Amount | Value in U.S. Dollarsi | ||
| COMMON STOCKS—continued | |||
| Health Care—continued | |||
| 6,681 | Novartis AG - REG | $569,985 | |
| 900 | 1 | Omnicell, Inc. | 27,144 |
| 20,500 | Otsuka Holdings Co., Ltd. | 680,161 | |
| 1,583 | 1 | PRA Health Sciences, Inc. | 71,678 |
| 1,300 | 1 | Parexel International Corp. | 88,205 |
| 103,622 | Pfizer, Inc. | 3,395,693 | |
| 2,300 | 1 | PharMerica Corp. | 78,246 |
| 1,270 | 1 | Press Ganey Holdings, Inc. | 41,008 |
| 25,760 | 1 | Qiagen NV | 681,094 |
| 4,700 | Quality Systems, Inc. | 76,375 | |
| 9,412 | Ramsay Health Care Ltd. | 455,472 | |
| 500 | 1 | Regeneron Pharmaceuticals, Inc. | 272,250 |
| 2,000 | 1 | Repligen Corp. | 56,860 |
| 10,003 | Roche Holding AG-GENUSSCHEIN | 2,674,257 | |
| 5,272 | Sanofi | 468,356 | |
| 1,400 | 1 | Sucampo Pharmaceuticals, Inc. | 24,010 |
| 3,673 | 1 | Supernus Pharmaceuticals, Inc. | 59,356 |
| 157 | 1 | Surgical Care Affiliates, Inc. | 5,836 |
| 6,189 | 1 | Wright Medical Group NV | 132,568 |
| 113 | 1 | Zafgen, Inc. | 1,911 |
| TOTAL | 34,928,930 | ||
| Industrials—6.6% | |||
| 2,800 | AAR Corp. | 68,768 | |
| 2,900 | Actuant Corp. | 71,804 | |
| 2,705 | Adecco SA | 184,730 | |
| 5,100 | 1 | AerCap Holdings NV | 231,744 |
| 16,144 | Alaska Air Group, Inc. | 1,287,161 | |
| 86,500 | Amada Co. | 852,466 | |
| 1,089 | Andritz AG | 56,950 | |
| 2,402 | ArcBest Corp. | 57,840 | |
| 35,062 | Ashtead Group PLC | 576,725 | |
| 180,100 | BAE Systems PLC | 1,400,998 | |
| 2,478 | Boeing Co. | 360,425 | |
| 19,887 | Bouygues SA | 747,849 | |
| 140 | Brenntag AG | 7,648 | |
| 300 | 1 | Builders Firstsource, Inc. | 4,038 |
| 39,674 | Bunzl PLC | 1,147,257 |
| Shares or Principal Amount | Value in U.S. Dollarsi | ||
| COMMON STOCKS—continued | |||
| Industrials—continued | |||
| 57,300 | CSX Corp. | $1,629,039 | |
| 12,398 | Canadian National Railway, Co. | 740,009 | |
| 3,700 | Central Japan Railway Co. | 661,437 | |
| 5,464 | Cobham PLC | 24,953 | |
| 2,700 | 1 | Continental Building Product, Inc. | 49,248 |
| 6,550 | DSV, De Sammensluttede Vognmad AS | 254,327 | |
| 53,000 | Dai Nippon Printing Co. Ltd. | 518,661 | |
| 3,700 | Danaher Corp. | 356,643 | |
| 26,700 | Delta Air Lines, Inc. | 1,240,482 | |
| 30,766 | Deutsche Post AG | 899,380 | |
| 3,600 | 1 | DigitalGlobe, Inc. | 60,840 |
| 46,185 | Edenred | 955,831 | |
| 5,100 | Expeditors International Washington, Inc. | 247,554 | |
| 24,000 | Fuji Electric Co. | 110,645 | |
| 3,509 | Geberit International AG | 1,171,625 | |
| 2,500 | General Dynamics Corp. | 366,150 | |
| 8,800 | General Electric Co. | 263,472 | |
| 8,086 | Grupo Ferrovial, S.A. | 191,133 | |
| 5,900 | Harsco Corp. | 61,596 | |
| 2,000 | 1 | Hawaiian Holdings, Inc. | 72,400 |
| 2,362 | Hillenbrand, Inc. | 71,545 | |
| 619,000 | Hutchison Port Holdings TR-U | 333,774 | |
| 6,100 | Ingersoll-Rand PLC | 357,887 | |
| 1,457 | Insperity, Inc. | 62,884 | |
| 2,669 | Interface, Inc. | 53,060 | |
| 1,356 | 1 | International Consolidated Airlines Group SA | 11,545 |
| 50,400 | 1 | Jet Blue Airways Corp. | 1,246,896 |
| 2,905 | Knoll, Inc. | 64,723 | |
| 174 | Kone Corp. OYJ, Class B | 7,410 | |
| 2,000 | Korn/Ferry International | 73,600 | |
| 5,555 | 1 | MRC Global, Inc. | 82,158 |
| 3,900 | 1 | Mastec, Inc. | 79,677 |
| 5,803 | 1 | Meritor, Inc. | 62,324 |
| 2,300 | Miller Herman, Inc. | 72,933 | |
| 17,000 | Mitsubishi Electric Corp. | 188,443 | |
| 2,295 | Mueller Industries, Inc. | 72,270 | |
| 7,817 | Mueller Water Products, Inc. | 72,854 |
| Shares or Principal Amount | Value in U.S. Dollarsi | ||
| COMMON STOCKS—continued | |||
| Industrials—continued | |||
| 1,000 | NWS Holdings Ltd. | $1,411 | |
| 15,453 | Nielsen Holdings PLC | 721,346 | |
| 20,300 | Nsk Ltd. | 255,698 | |
| 13,219 | Osram Licht AG | 558,107 | |
| 16,041 | Randstad Holdings N.V. | 1,002,169 | |
| 20,968 | Rexel SA | 286,970 | |
| 3,872 | 1 | Rexnord Corp. | 79,105 |
| 2,441 | Sandvik AB | 25,266 | |
| 1,223 | Schindler Holding AG | 200,906 | |
| 2,800 | Securitas AB, Class B | 42,702 | |
| 11,900 | Singapore Technologies Engineering Ltd. | 24,094 | |
| 350 | SkyWest, Inc. | 7,214 | |
| 38,200 | Southwest Airlines Co. | 1,752,616 | |
| 2,900 | Stanley Black & Decker, Inc. | 316,564 | |
| 3,700 | Steelcase, Inc., Class A | 74,000 | |
| 90,000 | Sumitomo Heavy Industries | 427,464 | |
| 4,300 | 1 | Swift Transportation Co. | 68,671 |
| 75,764 | TNT Express NV | 616,783 | |
| 2,304 | The ADT Corp. | 81,723 | |
| 500 | Toto Ltd. | 17,281 | |
| 3,170 | 1 | TriMas Corp. | 68,567 |
| 800 | 1 | TrueBlue, Inc. | 23,432 |
| 18,393 | Union Pacific Corp. | 1,544,092 | |
| 25,819 | 1 | United Continental Holdings, Inc. | 1,438,893 |
| 5,200 | United Parcel Service, Inc. | 535,652 | |
| 357 | 1 | Univar, Inc. | 6,762 |
| 2,450 | Vestas Wind Systems A/S | 159,579 | |
| 18,002 | West Japan Railway Co. | 1,137,918 | |
| 1,900 | Yamato Holdings Co. Ltd. | 36,360 | |
| 4,200 | Yangzijiang Shipbuilding Holdings Ltd. | 3,264 | |
| TOTAL | 31,360,420 | ||
| Information Technology—6.7% | |||
| 3,285 | 1 | ACI Worldwide, Inc. | 77,263 |
| 2,866 | AVG Technologies NV | 60,444 | |
| 2,400 | 1 | Advanced Energy Industries, Inc. | 70,008 |
| 31,900 | 1 | Advanced Micro Devices, Inc. | 75,284 |
| 1,600 | 1 | Alliance Data Systems Corp. | 458,960 |
| Shares or Principal Amount | Value in U.S. Dollarsi | ||
| COMMON STOCKS—continued | |||
| Information Technology—continued | |||
| 867 | 1 | Alphabet, Inc., Class A | $661,391 |
| 10,000 | 1 | Amkor Technology, Inc. | 68,000 |
| 71,049 | Apple, Inc. | 8,405,097 | |
| 6,200 | Applied Materials, Inc. | 116,374 | |
| 5,466 | 1 | Bankrate, Inc. | 79,694 |
| 2,988 | 1 | Benchmark Electronics, Inc. | 64,123 |
| 1,834 | 1 | Benefitfocus, Inc. | 74,314 |
| 7,314 | CDW Corp. | 315,745 | |
| 77,000 | Cisco Systems, Inc. | 2,098,250 | |
| 43 | Constellation Software, Inc. | 18,455 | |
| 2,200 | 1 | Cornerstone OnDemand, Inc. | 79,002 |
| 11,800 | Corning, Inc. | 221,014 | |
| 18,700 | 1 | Cypress Semiconductor Corp. | 202,334 |
| 11,000 | EMC Corp. Mass | 278,740 | |
| 1,700 | EarthLink Network, Inc. | 15,623 | |
| 4,000 | 1 | eBay, Inc. | 118,360 |
| 4,911 | 1 | Endurance International Group Holdings, Inc. | 68,607 |
| 8,925 | Ericsson LM - B | 86,853 | |
| 3,767 | Evertec, Inc. | 64,717 | |
| 4,071 | 1 | Facebook, Inc. | 424,361 |
| 4,400 | 1 | Fairchild Semiconductor International, Inc., Class A | 85,976 |
| 5,900 | 1 | Finisar Corp. | 71,213 |
| 34,000 | 1 | Freescale Semiconductor Ltd. | 1,322,940 |
| 29,000 | Fujitsu Ltd. | 146,628 | |
| 2,343 | 1 | Gigamon, Inc. | 63,472 |
| 226,000 | 1 | GungHo Online Entertainment, Inc. | 698,879 |
| 61,500 | 1 | HP, Inc. | 771,210 |
| 61,500 | Hewlett Packard Enterprise Co. | 913,890 | |
| 35,400 | Ibiden Co. Ltd. | 555,475 | |
| 3,878 | 1 | Infoblox, Inc. | 58,325 |
| 103,700 | Intel Corp. | 3,605,649 | |
| 1,400 | InterDigital, Inc. | 73,766 | |
| 5,362 | 1 | InvenSense, Inc. | 62,146 |
| 34,391 | 1 | Keysight Technologies, Inc. | 1,059,587 |
| 1,500 | Lam Research Corp. | 117,300 | |
| 2,004 | 1 | MA-COM Technology Solutions Holdings, Inc. | 74,048 |
| 2,900 | Mentor Graphics Corp. | 54,317 |
| Shares or Principal Amount | Value in U.S. Dollarsi | ||
| COMMON STOCKS—continued | |||
| Information Technology—continued | |||
| 6,000 | 1 | Micron Technology, Inc. | $95,580 |
| 11,900 | NVIDIA Corp. | 377,468 | |
| 900 | 1 | Netgear, Inc. | 39,699 |
| 4,500 | Nexon Co., Ltd. | 71,503 | |
| 123,000 | Nippon Electric Glass Co. Ltd. | 682,945 | |
| 25,674 | Nokia Oyj | 184,965 | |
| 104,800 | 1 | ON Semiconductor Corp. | 1,148,608 |
| 12,000 | Omron Corp. | 441,558 | |
| 4,000 | 1 | PMC-Sierra, Inc. | 47,320 |
| 4,000 | 1 | PayPal Holdings, Inc. | 141,040 |
| 5,300 | 1 | Polycom, Inc. | 72,239 |
| 2,500 | 1 | Progress Software Corp. | 59,975 |
| 5,200 | 1 | Qlogic Corp. | 67,080 |
| 2,300 | Qualcomm, Inc. | 112,217 | |
| 1,600 | 1 | Red Hat, Inc. | 130,256 |
| 1,658 | 1 | Rovi Corporation | 19,581 |
| 1,605 | STMicroelectronics N.V. | 11,650 | |
| 1,700 | 1 | Salesforce.com, Inc. | 135,473 |
| 1,630 | Science Applications International Corp. | 81,891 | |
| 5,500 | Skyworks Solutions, Inc. | 456,610 | |
| 3,666 | TE Connectivity Ltd. | 245,952 | |
| 21,800 | Teradyne, Inc. | 453,004 | |
| 14,300 | Texas Instruments, Inc. | 831,116 | |
| 7,300 | 1 | TiVo, Inc. | 65,627 |
| 40,900 | 1 | Trimble Navigation Ltd. | 936,610 |
| 1,986 | 1 | Universal Display Corp. | 104,384 |
| 2,700 | 1 | VMware, Inc., Class A | 165,807 |
| 6,213 | 1 | Vantiv, Inc. | 327,487 |
| 1,700 | 1 | Verint Systems, Inc. | 79,645 |
| 6,500 | Vishay Intertechnology, Inc. | 77,480 | |
| 2,786 | 1 | Web.com Group, Inc. | 67,449 |
| 1,600 | 1 | WebMd Health Corp. | 72,784 |
| 2,800 | Western Digital Corp. | 174,748 | |
| TOTAL | 31,917,585 | ||
| Materials—1.9% | |||
| 100,344 | ArcelorMittal | 491,550 | |
| 38,000 | Asahi Kasei Corp. | 260,142 |
| Shares or Principal Amount | Value in U.S. Dollarsi | ||
| COMMON STOCKS—continued | |||
| Materials—continued | |||
| 2,930 | Ashland, Inc. | $330,064 | |
| 2,580 | 1 | Berry Plastics Group, Inc. | 93,809 |
| 1,500 | 1 | Chemtura Corp. | 46,080 |
| 4,885 | Commercial Metals Corp. | 72,249 | |
| 2,458 | EMS-Chemie Holdings Ag | 1,000,998 | |
| 3,100 | Eagle Materials, Inc. | 214,148 | |
| 356 | 1 | Flotek Industries, Inc. | 4,066 |
| 368,155 | Fortescue Metals Group Ltd. | 519,456 | |
| 21 | Givaudan SA | 37,846 | |
| 2,000 | Greif, Inc., Class A | 70,940 | |
| 3,400 | 1 | Headwaters, Inc. | 65,178 |
| 2,100 | Hitachi Chemical Co. | 35,010 | |
| 2,429 | James Hardie Industries PLC | 28,789 | |
| 91,500 | Kuraray Co. Ltd. | 1,165,748 | |
| 6,216 | LyondellBasell Industries NV, Class A | 595,617 | |
| 1,600 | Martin Marietta Materials | 251,840 | |
| 1,500 | Newmarket Corp. | 619,725 | |
| 11,200 | Nitto Denko Corp. | 755,667 | |
| 13,000 | Potash Corp. of Saskatchewan, Inc. | 263,125 | |
| 8,400 | Sealed Air Corp. | 381,024 | |
| 4,000 | Sherwin-Williams Co. | 1,104,280 | |
| 83 | Sika AG | 280,725 | |
| 2,344 | 1 | Summit Materials, Inc., Class A | 53,373 |
| 6,116 | UPM - Kymmene Oyj | 116,522 | |
| 868 | 1 | US Concrete, Inc. | 50,978 |
| 2,109 | Voest-alpine Stahl | 68,575 | |
| 94 | Yara International ASA | 4,349 | |
| TOTAL | 8,981,873 | ||
| Telecommunication Services—2.5% | |||
| 611 | 1 | 8x8, Inc. | 7,210 |
| 1,900 | BCE, Inc. | 81,779 | |
| 219,192 | BT Group PLC | 1,638,905 | |
| 400 | Cogent Communications Group | 13,424 | |
| 85,526 | Deutsche Telekom AG | 1,577,668 | |
| 35,300 | 1 | Globalstar, Inc. | 76,954 |
| 555,095 | HKT Trust and HKT Ltd. | 696,356 | |
| 238 | Inteliquent, Inc. | 4,572 |
| Shares or Principal Amount | Value in U.S. Dollarsi | ||
| COMMON STOCKS—continued | |||
| Telecommunication Services—continued | |||
| 24,500 | KDDI Corp. | $609,141 | |
| 66,200 | NTT DOCOMO, Inc. | 1,257,746 | |
| 33,100 | Nippon Telegraph and Telephone Corp. | 1,230,131 | |
| 11,736 | Orange SA | 202,657 | |
| 22,300 | SoftBank Group Corp. | 1,185,250 | |
| 357,300 | StarHub Ltd. | 918,471 | |
| 3,051 | 1 | T-Mobile USA, Inc. | 108,310 |
| 73,690 | Tele2 AB, Class B | 749,793 | |
| 11,000 | TeliaSonera AB | 53,958 | |
| 269,246 | Telstra Corp. Ltd. | 1,046,001 | |
| 10,100 | Verizon Communications | 459,045 | |
| 1,300 | 1 | Vonage Holdings Corp. | 8,385 |
| TOTAL | 11,925,756 | ||
| Utilities—3.0% | |||
| 86,400 | AES Corp. | 863,136 | |
| 3,422 | Abengoa Yield PLC | 49,551 | |
| 200 | American States Water Co. | 8,366 | |
| 1,600 | Black Hills Corp. | 68,672 | |
| 6,394 | CMS Energy Corp. | 223,918 | |
| 33,874 | Electricite De France | 504,280 | |
| 37,542 | Enagas SA | 1,116,669 | |
| 207,046 | Enel S.p.A | 912,174 | |
| 60,131 | 1 | Engie | 1,046,250 |
| 28,800 | Exelon Corp. | 786,528 | |
| 29,300 | FirstEnergy Corp. | 919,727 | |
| 180,094 | Iberdrola SA | 1,259,239 | |
| 1,200 | Idacorp, Inc. | 81,648 | |
| 4,509 | NRG Yield, Inc. | 63,757 | |
| 77,736 | National Grid PLC | 1,083,909 | |
| 100 | New Jersey Resources Corp. | 3,005 | |
| 1,606 | ONE Gas, Inc. | 78,292 | |
| 14,500 | Power Assets Holdings Ltd. | 129,681 | |
| 15,600 | Public Service Enterprises Group, Inc. | 609,960 | |
| 2,098 | Red Electrica de Espana | 179,872 | |
| 38,648 | SSE PLC | 834,699 | |
| 1,500 | Sempra Energy | 148,845 | |
| 81,848 | Snam Rete Gas S.p.A | 415,661 |
| Shares or Principal Amount | Value in U.S. Dollarsi | ||
| COMMON STOCKS—continued | |||
| Utilities—continued | |||
| 55,956 | Suez Environnement SA | $1,059,372 | |
| 168,152 | Terna S.p.A | 827,401 | |
| 129,000 | Tokyo Gas Co. Ltd. | 616,718 | |
| 1,300 | WGL Holdings, Inc. | 80,158 | |
| TOTAL | 13,971,488 | ||
| TOTAL COMMON STOCKS (IDENTIFIED COST $237,601,410) | 256,714,997 | ||
| ASSET-BACKED SECURITIES—0.1% | |||
| 150,000 | American Express Credit Account Master Trust 2014-1, A, 0.567%, 12/15/2021 | 149,273 | |
| 300,000 | AmeriCredit Automobile Receivables Trust 2015-1, A3, 1.260%, 11/08/2019 | 299,015 | |
| 150,000 | Navient Student Loan Trust 2014-1, A2, 0.531%, 03/27/2023 | 148,189 | |
| TOTAL ASSET-BACKED SECURITIES (IDENTIFIED COST $599,983) | 596,477 | ||
| COLLATERALIZED MORTGAGE OBLIGATIONS—0.3% | |||
| 200,000 | Citigroup Commercial Mortgage Trust 2015-GC33 AS, 4.114%, 9/10/2058 | 206,290 | |
| 450,000 | Commercial Mortgage Trust 2015-DC1 AM, 3.724%, 2/10/2048 | 450,485 | |
| 50,000 | WF-RBS Commercial Mortgage Trust 2012-C6 B, 4.697%, 4/15/2045 | 53,434 | |
| 400,000 | WF-RBS Commercial Mortgage Trust 2014-C25 AS, 3.984%, 11/15/2047 | 409,969 | |
| 100,000 | WF-RBS Commercial Mortgage Trust 2014-C25 B, 4.236%, 11/15/2047 | 102,560 | |
| TOTAL COLLATERALIZED MORTGAGE OBLIGATIONS (IDENTIFIED COST $1,254,942) | 1,222,738 | ||
| CORPORATE BONDS—5.3% | |||
| Basic Industry - Chemicals—0.2% | |||
| $300,000 | Albemarle Corp., Sr. Unsecd. Note, 5.450%, 12/01/2044 | 291,910 | |
| 50,000 | RPM International, Inc., 6.500%, 02/15/2018 | 54,221 | |
| 285,000 | RPM International, Inc., Sr. Unsecd. Note, 5.250%, 6/01/2045 | 268,969 | |
| 15,000 | RPM International, Inc., Sr. Unsecd. Note, 6.125%, 10/15/2019 | 16,591 | |
| 250,000 | Valspar Corp., Sr. Unsecd. Note, 3.300%, 2/01/2025 | 239,763 | |
| TOTAL | 871,454 | ||
| Basic Industry - Metals & Mining—0.1% | |||
| 90,000 | Allegheny Technologies, Inc., Sr. Note, 9.375%, 06/01/2019 | 90,113 | |
| 100,000 | Reliance Steel & Aluminum Co., Sr. Unsecd. Note, 4.500%, 04/15/2023 | 94,875 | |
| 300,000 | Southern Copper Corp., Note, 6.750%, 04/16/2040 | 269,407 | |
| TOTAL | 454,395 |
| Shares or Principal Amount | Value in U.S. Dollarsi | ||
| CORPORATE BONDS—continued | |||
| Basic Industry - Paper—0.0% | |||
| $150,000 | 1,2,3 | Pope & Talbot, Inc., 8.375%, 12/01/2099 | $0 |
| Capital Goods - Aerospace & Defense—0.1% | |||
| 140,000 | Halliburton Co., Sr. Unsecd. Note, 3.800%, 11/15/2025 | 141,185 | |
| 180,000 | Lockheed Martin Corp., Sr. Unsecd. Note, 3.550%, 01/15/2026 | 182,121 | |
| 90,000 | 4,5 | Textron Financial Corp., Jr. Sub. Note, Series 144A, 6.000%, 2/15/2067 | 66,375 |
| TOTAL | 389,681 | ||
| Capital Goods - Building Materials—0.1% | |||
| 185,000 | Masco Corp., Unsecd. Note, 4.450%, 4/01/2025 | 181,994 | |
| 300,000 | Valmont Industries, Inc., 5.250%, 10/01/2054 | 258,276 | |
| TOTAL | 440,270 | ||
| Capital Goods - Diversified Manufacturing—0.1% | |||
| 100,000 | General Electric Co., Sr. Unsecd. Note, 4.125%, 10/09/2042 | 98,042 | |
| 200,000 | 4,5 | Hutchison Whampoa International 14 Ltd., Unsecd. Note, Series 144A, 1.625%, 10/31/2017 | 199,570 |
| 100,000 | Roper Industries, Inc., Sr. Unsecd. Note, 6.250%, 09/01/2019 | 111,685 | |
| TOTAL | 409,297 | ||
| Capital Goods - Environmental—0.0% | |||
| 110,000 | Republic Services, Inc., Company Guarantee, 5.500%, 9/15/2019 | 121,743 | |
| Communications - Cable & Satellite—0.1% | |||
| 200,000 | 4,5 | CCO Safari II LLC, Series 144A, 4.908%, 7/23/2025 | 203,423 |
| 300,000 | DIRECTV Holdings LLC, Sr. Unsecd. Note, 5.150%, 03/15/2042 | 288,213 | |
| 20,000 | Time Warner Cable, Inc., Company Guarantee, 8.250%, 04/01/2019 | 23,173 | |
| TOTAL | 514,809 | ||
| Communications - Media & Entertainment—0.1% | |||
| 100,000 | 21st Century Fox America, Inc., Sr. Unsecd. Note, 5.400%, 10/01/2043 | 107,314 | |
| 310,000 | 4,5 | British Sky Broadcasting Group PLC, 3.75%, Series 144A, 9/16/2024 | 308,449 |
| 70,000 | Grupo Televisa S.A., Sr. Unsecd. Note, 6.125%, 01/31/2046 | 71,639 | |
| 200,000 | Viacom, Inc., Sr. Unsecd. Note, 3.875%, 04/01/2024 | 190,885 | |
| TOTAL | 678,287 | ||
| Communications - Telecom Wirelines—0.0% | |||
| 15,000 | CenturyLink, Inc., Sr. Note, Series Q, 6.150%, 09/15/2019 | 15,487 | |
| 200,000 | Verizon Communications, Inc., Sr. Unsecd. Note, 4.150%, 03/15/2024 | 209,994 | |
| TOTAL | 225,481 | ||
| Consumer Cyclical - Automotive—0.1% | |||
| 70,000 | General Motors Co., Sr. Unsecd. Note, 4.000%, 4/01/2025 | 67,690 | |
| 200,000 | General Motors Financial, Sr. Unsecd. Note, 3.100%, 01/15/2019 | 200,300 | |
| 200,000 | Magna International, Inc., 3.625%, 6/15/2024 | 196,677 |
| Shares or Principal Amount | Value in U.S. Dollarsi | ||
| CORPORATE BONDS—continued | |||
| Consumer Cyclical - Automotive—continued | |||
| $50,000 | 4,5 | RCI Banque SA, Sr. Unsecd. Note, Series 144A, 4.600%, 04/12/2016 | $50,579 |
| TOTAL | 515,246 | ||
| Consumer Cyclical - Retailers—0.2% | |||
| 100,000 | Advance Auto Parts, Inc., 4.500%, 12/01/2023 | 102,986 | |
| 300,000 | AutoZone, Inc., Sr. Unsecd. Note, 3.250%, 4/15/2025 | 292,801 | |
| 131,370 | 4,5 | CVS Caremark Corp., Pass Thru Cert., Series 144A, 5.298%, 1/11/2027 | 141,600 |
| 110,000 | Dollar General Corp., Sr. Unsecd. Note, 4.150%, 11/01/2025 | 108,865 | |
| 300,000 | Tiffany & Co., Sr. Unsecd. Note, 4.900%, 10/01/2044 | 279,795 | |
| 50,000 | Wal-Mart Stores, Inc., Sr. Unsecd. Note, 3.300%, 04/22/2024 | 51,700 | |
| TOTAL | 977,747 | ||
| Consumer Non-Cyclical - Food/Beverage—0.2% | |||
| 500,000 | 4,5 | HJ Heinz Co., Sr. Unsecd. Note, Series 144A, 3.950%, 7/15/2025 | 511,505 |
| 120,000 | Mead Johnson Nutrition Co., Sr. Unsecd. Note, 4.125%, 11/15/2025 | 121,630 | |
| 150,000 | PepsiCo, Inc., 2.750%, 4/30/2025 | 146,567 | |
| 70,000 | PepsiCo, Inc., Sr. Unsecd. Note, 4.450%, 4/14/2046 | 72,357 | |
| TOTAL | 852,059 | ||
| Consumer Non-Cyclical - Pharmaceuticals—0.2% | |||
| 300,000 | AbbVie, Inc., Sr. Unsecd. Note, 2.500%, 5/14/2020 | 298,447 | |
| 450,000 | Eli Lilly & Co., 3.700%, 3/01/2045 | 422,420 | |
| 90,000 | Gilead Sciences, Inc., Sr. Unsecd. Note, 3.650%, 3/01/2026 | 90,851 | |
| TOTAL | 811,718 | ||
| Consumer Non-Cyclical - Tobacco—0.1% | |||
| 24,000 | Altria Group, Inc., 9.250%, 08/06/2019 | 29,513 | |
| 60,000 | Altria Group, Inc., Sr. Unsecd. Note, 4.000%, 01/31/2024 | 62,790 | |
| 400,000 | Reynolds American, Inc., Sr. Unsecd. Note, 5.850%, 8/15/2045 | 449,643 | |
| TOTAL | 541,946 | ||
| Energy - Independent—0.1% | |||
| 100,000 | Apache Corp., 4.250%, 1/15/2044 | 90,272 | |
| 225,000 | Marathon Oil Corp., Sr. Unsecd. Note, 3.850%, 6/01/2025 | 202,108 | |
| 20,000 | XTO Energy, Inc., 6.750%, 08/01/2037 | 27,859 | |
| TOTAL | 320,239 | ||
| Energy - Integrated—0.1% | |||
| 155,000 | Husky Energy, Inc., 4.000%, 04/15/2024 | 147,348 | |
| 100,000 | Husky Energy, Inc., Sr. Unsecd. Note, 3.950%, 04/15/2022 | 96,816 | |
| 35,000 | Petro-Canada, Deb., 7.000%, 11/15/2028 | 43,710 | |
| 100,000 | Petroleos Mexicanos, 6.500%, 06/02/2041 | 95,125 |
| Shares or Principal Amount | Value in U.S. Dollarsi | ||
| CORPORATE BONDS—continued | |||
| Energy - Integrated—continued | |||
| $150,000 | Petroleos Mexicanos, Sr. Unsecd. Note, 4.875%, 1/18/2024 | $147,705 | |
| TOTAL | 530,704 | ||
| Energy - Midstream—0.2% | |||
| 325,000 | Energy Transfer Partners , Sr. Unsecd. Note, 4.050%, 3/15/2025 | 279,179 | |
| 350,000 | Energy Transfer Partners , Sr. Unsecd. Note, 5.150%, 3/15/2045 | 265,882 | |
| 100,000 | Kinder Morgan, Inc., 5.05%, 2/15/2046 | 71,832 | |
| 100,000 | Williams Partners LP, 4.9%, 1/15/2045 | 69,711 | |
| 300,000 | Williams Partners LP, 5.1%, 9/15/2045 | 217,117 | |
| TOTAL | 903,721 | ||
| Energy - Oil Field Services—0.0% | |||
| 100,000 | Nabors Industries, Inc., Company Guarantee, 5.000%, 09/15/2020 | 95,241 | |
| 100,000 | Weatherford International Ltd., Sr. Unsecd. Note, 5.950%, 04/15/2042 | 63,250 | |
| TOTAL | 158,491 | ||
| Energy - Refining—0.1% | |||
| 250,000 | Marathon Petroleum Corp., Sr. Unsecd. Note, 4.750%, 9/15/2044 | 225,032 | |
| 25,000 | Valero Energy Corp., 9.375%, 03/15/2019 | 30,124 | |
| 100,000 | Valero Energy Corp., Sr. Unsecd. Note, 6.625%, 06/15/2037 | 108,691 | |
| TOTAL | 363,847 | ||
| Financial Institution - Banking—0.9% | |||
| 340,000 | Associated Banc-Corp., Sub., 4.250%, 1/15/2025 | 342,203 | |
| 100,000 | Bank of America Corp., Sr. Unsecd. Note, Series MTN, 4.875%, 4/01/2044 | 106,407 | |
| 355,000 | Bank of America Corp., Sub. Note, Series L, 3.950%, 4/21/2025 | 351,835 | |
| 300,000 | Bank of America Corp., Sub. Note, Series MTN, 4.000%, 1/22/2025 | 298,370 | |
| 180,000 | Capital One Financial Corp., Sr. Sub., 4.200%, 10/29/2025 | 179,806 | |
| 250,000 | Citigroup, Inc., Sr. Unsecd. Note, 3.300%, 4/27/2025 | 247,685 | |
| 100,000 | Citigroup, Inc., Sr. Unsecd. Note, 4.950%, 11/07/2043 | 105,295 | |
| 150,000 | Citigroup, Inc., Sub. Note, 4.450%, 9/29/2027 | 150,663 | |
| 250,000 | Compass Bank, Birmingham, Sub. Note, Series BKNT, 3.875%, 4/10/2025 | 232,936 | |
| 330,000 | Fifth Third Bancorp, Sr. Unsecd. Note, 2.875%, 7/27/2020 | 331,536 | |
| 400,000 | Goldman Sachs Group, Inc., Sr. Unsecd. Note, 3.500%, 1/23/2025 | 398,286 | |
| 5,000 | Goldman Sachs Group, Inc., Sr. Unsecd. Note, 5.750%, 01/24/2022 | 5,741 | |
| 50,000 | Goldman Sachs Group, Inc., Sr. Unsecd. Note, 6.125%, 02/15/2033 | 60,253 | |
| 100,000 | J.P. Morgan Chase & Co., 6.750%, 1/29/2049 | 108,475 | |
| 50,000 | J.P. Morgan Chase & Co., Sub. Note, 3.375%, 05/01/2023 | 49,675 | |
| 300,000 | Morgan Stanley, Sr. Unsecd. Note, 1.462%, 1/27/2020 | 301,556 |
| Shares or Principal Amount | Value in U.S. Dollarsi | ||
| CORPORATE BONDS—continued | |||
| Financial Institution - Banking—continued | |||
| $100,000 | Morgan Stanley, Sr. Unsecd. Note, 6.375%, 07/24/2042 | $126,381 | |
| 60,000,000 | Rabobank Nederland NV, Utrecht, 1.850%, Series EMTN, 4/12/2017 | 497,968 | |
| 162,039 | 3,4 | Regional Diversified Funding, Series 144A, 9.250%, 03/15/2030 | 83,197 |
| 135,000 | Wells Fargo & Co., Sub. Note, Series GMTN, 4.900%, 11/17/2045 | 137,797 | |
| 40,000 | Wilmington Trust Corp., Sub. Note, 8.500%, 04/02/2018 | 45,364 | |
| TOTAL | 4,161,429 | ||
| Financial Institution - Broker/Asset Mgr/Exchange—0.1% | |||
| 140,000 | Invesco Finance PLC, Sr. Unsecd. Note, 3.750%, 1/15/2026 | 142,156 | |
| 95,000 | Jefferies Group LLC, Sr. Unsecd. Note, 8.500%, 07/15/2019 | 111,621 | |
| 240,000 | Stifel Financial Corp., Sr. Unsecd. Note, 3.500%, 12/01/2020 | 239,371 | |
| 70,000 | 4,5 | TIAA Asset Management Finance Co., LLC, Sr. Unsecd. Note, Series 144A, 4.125%, 11/01/2024 | 70,890 |
| TOTAL | 564,038 | ||
| Financial Institution - Finance Companies—0.0% | |||
| 30,000 | General Electric Capital, Note, Series MTNA, 6.750%, 3/15/2032 | 39,454 | |
| Financial Institution - Insurance - Health—0.0% | |||
| 50,000 | Wellpoint, Inc., 5.850%, 01/15/2036 | 55,877 | |
| Financial Institution - Insurance - Life—0.5% | |||
| 100,000 | Aflac, Inc., Sr. Unsecd. Note, 6.450%, 08/15/2040 | 123,242 | |
| 100,000 | American International Group, Inc., Sr. Unsecd. Note, 6.250%, 05/01/2036 | 117,148 | |
| 400,000 | American International Group, Inc., Unsecd. Note, 3.875%, 1/15/2035 | 362,087 | |
| 10,000 | MetLife, Inc., Jr. Sub. Note, 10.750%, 8/01/2039 | 15,825 | |
| 330,000 | MetLife, Inc., Sr. Unsecd. Note, 4.050%, 3/01/2045 | 311,332 | |
| 100,000 | 4,5 | Principal Life Global Funding II, Series 144A, 2.200%, 4/08/2020 | 99,274 |
| 200,000 | Prudential Financial, Inc., Sr. Unsecd. Note, Series MTN, 4.600%, 05/15/2044 | 202,047 | |
| 750,000 | 4 | Union Central Life Ins Co, Note, Series 144A, 8.200%, 11/01/2026 | 991,085 |
| TOTAL | 2,222,040 | ||
| Financial Institution - Insurance - P&C—0.1% | |||
| 160,000 | ACE INA Holdings, Inc., 3.350%, 5/03/2026 | 159,785 | |
| 75,000 | ACE INA Holdings, Inc., Sr. Unsecd. Note, 3.350%, 05/15/2024 | 75,888 | |
| 50,000 | Horace Mann Educators Corp., Sr. Note, 6.850%, 04/15/2016 | 51,028 | |
| 300,000 | 4,5 | Liberty Mutual Group., Inc, Sr. Unsecd. Note, Series 144A, 6.500%, 3/15/2035 | 356,822 |
| 30,000 | 4,5 | Nationwide Mutual Insurance Co., Sub. Note, Series 144A, 9.375%, 08/15/2039 | 45,666 |
| TOTAL | 689,189 |
| Shares or Principal Amount | Value in U.S. Dollarsi | ||
| CORPORATE BONDS—continued | |||
| Financial Institution - REIT - Apartment—0.1% | |||
| $220,000 | Mid-America Apartment Communities LP, 4.000%, 11/15/2025 | $219,870 | |
| 300,000 | Mid-America Apartment Communities LP, Sr. Unsecd. Note, 3.750%, 06/15/2024 | 292,599 | |
| TOTAL | 512,469 | ||
| Financial Institution - REIT - Healthcare—0.0% | |||
| 100,000 | Health Care REIT, Inc., Sr. Unsecd. Note, 4.125%, 04/01/2019 | 104,945 | |
| Financial Institution - REIT - Office—0.1% | |||
| 300,000 | Alexandria Real Estate Equities, Inc., Sr. Unsecd. Note, 4.500%, 7/30/2029 | 296,892 | |
| Financial Institution - REIT - Other—0.1% | |||
| 40,000 | Liberty Property LP, 6.625%, 10/01/2017 | 43,160 | |
| 100,000 | ProLogis LP, Sr. Unsecd. Note, 3.350%, 02/01/2021 | 101,720 | |
| 160,000 | WP Carey, Inc., Sr. Unsecd. Note, 4.600%, 04/01/2024 | 162,539 | |
| TOTAL | 307,419 | ||
| Financial Institution - REIT - Retail—0.0% | |||
| 40,000 | Equity One, Inc., Bond, 6.000%, 09/15/2017 | 42,537 | |
| 30,000 | Kimco Realty Corp., Sr. Unsecd. Note, 3.400%, 11/01/2022 | 29,929 | |
| TOTAL | 72,466 | ||
| Financial Institution - REITs—0.0% | |||
| 200,000 | Host Hotels & Resorts LP, Sr. Unsecd. Note, Series E, 4.000%, 6/15/2025 | 193,560 | |
| Foreign-Local-Government—0.1% | |||
| 50,000 | Quebec, Province of, Note, Series MTNA, 7.035%, 03/10/2026 | 63,910 | |
| 255,000 | 4,5 | Queensland Treasury Corp., Sr. Unsecd. Note, 4.000%, 06/21/2019 | 193,993 |
| TOTAL | 257,903 | ||
| Municipal Services—0.1% | |||
| 140,000 | 4,5 | Army Hawaii Family Housing, Series 144A, 5.524%, 6/15/2050 | 153,938 |
| 100,000 | 4,5 | Camp Pendleton & Quantico Housing LLC, Series 144A, 5.572%, 10/01/2050 | 108,334 |
| TOTAL | 262,272 | ||
| Sovereign—0.1% | |||
| 30,000,000 | KfW, 2.050%, 02/16/2026 | 289,061 | |
| Technology—0.4% | |||
| 300,000 | Adobe Systems, Inc., Sr. Unsecd. Note, 3.250%, 2/01/2025 | 296,767 | |
| 250,000 | Apple, Inc., Sr. Unsecd. Note, 3.450%, 2/09/2045 | 215,561 | |
| 50,000 | Autodesk, Inc., Sr. Unsecd. Note, 4.375%, 6/15/2025 | 49,673 | |
| 270,000 | Automatic Data Processing, Inc., 3.375%, 9/15/2025 | 277,255 | |
| 210,000 | Fidelity National Informa, Sr. Unsecd. Note, 5.000%, 10/15/2025 | 218,074 |
| Shares or Principal Amount | Value in U.S. Dollarsi | ||
| CORPORATE BONDS—continued | |||
| Technology—continued | |||
| $100,000 | Fidelity National Information Services, Inc., Sr. Unsecd. Note, 3.875%, 06/05/2024 | $96,807 | |
| 150,000 | 4,5 | Hewlett Packard Enterprise Co., Sr. Unsecd. Note, Series 144A, 3.600%, 10/15/2020 | 151,355 |
| 300,000 | Keysight Technologies, Inc., 4.550%, 10/30/2024 | 287,242 | |
| 380,000 | 4,5 | Molex Electronics Technologies LLC, Unsecd. Note, Series 144A, 3.900%, 4/15/2025 | 365,645 |
| TOTAL | 1,958,379 | ||
| Transportation - Railroads—0.1% | |||
| 140,000 | Burlington Northern Santa Fe Corp., Sr. Unsecd. Note, 4.150%, 4/01/2045 | 129,207 | |
| 45,000 | Union Pacific Corp., Bond, 6.625%, 02/01/2029 | 58,238 | |
| 135,000 | Union Pacific Corp., Sr. Unsecd. Note, 3.875%, 2/01/2055 | 120,935 | |
| TOTAL | 308,380 | ||
| Transportation - Services—0.1% | |||
| 75,000 | 4,5 | Enterprise Rent-A-Car USA Finance Co., Series 144A, 6.375%, 10/15/2017 | 81,102 |
| 62,000 | 4,5 | Enterprise Rent-A-Car USA Finance Co., Sr. Unsecd. Note, Series 144A, 3.850%, 11/15/2024 | 62,636 |
| 100,000 | 4,5 | Penske Truck Leasing Co. LP & PTL Finance Corp., Series 144A, 2.500%, 06/15/2019 | 98,845 |
| 335,000 | 4,5 | Penske Truck Leasing Co. LP & PTL Finance Corp., Sr. Unsecd. Note, Series 144A, 3.375%, 2/01/2022 | 327,887 |
| 100,000 | Ryder System, Inc., Sr. Unsecd. Note, Series MTN, 2.450%, 11/15/2018 | 100,098 | |
| TOTAL | 670,568 | ||
| Utility - Electric—0.3% | |||
| 130,000 | Ameren Corp., Sr. Unsecd. Note, 3.650%, 2/15/2026 | 130,361 | |
| 300,000 | Consolidated Edison Co., Sr. Unsecd. Note, 4.500%, 12/01/2045 | 304,842 | |
| 19,199 | 4,5 | Great River Energy, 1st Mtg. Note, Series 144A, 5.829%, 7/01/2017 | 19,760 |
| 300,000 | National Rural Utilities Cooperative Finance Corp., 2.000%, 1/27/2020 | 295,321 | |
| 200,000 | NextEra Energy Capital Holdings, Inc., Sr. Unsecd. Note, 2.400%, 09/15/2019 | 198,192 | |
| 400,000 | Northeast Utilities, Sr. Unsecd. Note, Series H, 3.150%, 1/15/2025 | 394,190 | |
| 75,000 | PSEG Power LLC, Sr. Unsecd. Note, 4.300%, 11/15/2023 | 75,306 | |
| 40,000 | Progress Energy, Inc., 7.050%, 03/15/2019 | 45,737 | |
| 125,000 | Wisconsin Electric Power Co., Sr. Unsecd. Note, 4.300%, 12/15/2045 | 127,441 | |
| TOTAL | 1,591,150 | ||
| Utility - Natural Gas—0.1% | |||
| 200,000 | Sempra Energy, Sr. Unsecd. Note, 2.850%, 11/15/2020 | 201,113 |
| Shares or Principal Amount | Value in U.S. Dollarsi | ||
| CORPORATE BONDS—continued | |||
| Utility - Natural Gas—continued | |||
| $300,000 | Sempra Energy, Sr. Unsecd. Note, 3.550%, 06/15/2024 | $302,091 | |
| TOTAL | 503,204 | ||
| TOTAL CORPORATE BONDS (IDENTIFIED COST $25,829,109) | 25,141,830 | ||
| MORTGAGE-BACKED SECURITIES—0.1% | |||
| 2,834 | Federal Home Loan Mortgage Corp. Pool C00592, 7.000%, 3/1/2028 | 3,280 | |
| 2,067 | Federal Home Loan Mortgage Corp. Pool C00896, 7.500%, 12/1/2029 | 2,450 | |
| 4,105 | Federal Home Loan Mortgage Corp. Pool C17281, 6.500%, 11/1/2028 | 4,711 | |
| 2,942 | Federal Home Loan Mortgage Corp. Pool C19588, 6.500%, 12/1/2028 | 3,375 | |
| 1,290 | Federal Home Loan Mortgage Corp. Pool C25621, 6.500%, 5/1/2029 | 1,483 | |
| 3,856 | Federal Home Loan Mortgage Corp. Pool C76361, 6.000%, 2/1/2033 | 4,409 | |
| 6,859 | Federal Home Loan Mortgage Corp. Pool E01545, 5.000%, 15 Year, 1/1/2019 | 7,158 | |
| 1,004 | Federal Home Loan Mortgage Corp. Pool E99510, 5.500%, 9/1/2018 | 1,053 | |
| 4,288 | Federal Home Loan Mortgage Corp. Pool G01444, 6.500%, 8/1/2032 | 4,995 | |
| 3,214 | Federal National Mortgage Association Pool 251697, 6.500%, 30 Year, 5/1/2028 | 3,682 | |
| 11,249 | Federal National Mortgage Association Pool 252334, 6.500%, 30 Year, 2/1/2029 | 12,737 | |
| 5,963 | Federal National Mortgage Association Pool 254720, 4.500%, 5/1/2018 | 6,169 | |
| 6,902 | Federal National Mortgage Association Pool 254802, 4.500%, 7/1/2018 | 7,141 | |
| 7,337 | Federal National Mortgage Association Pool 254905, 6.000%, 10/1/2033 | 8,354 | |
| 13,134 | Federal National Mortgage Association Pool 255075, 5.500%, 2/1/2024 | 14,652 | |
| 10,057 | Federal National Mortgage Association Pool 255079, 5.000%, 2/1/2019 | 10,491 | |
| 1,214 | Federal National Mortgage Association Pool 303168, 9.500%, 30 Year, 2/1/2025 | 1,443 | |
| 530 | Federal National Mortgage Association Pool 323159, 7.500%, 4/1/2028 | 619 | |
| 4,766 | Federal National Mortgage Association Pool 323640, 7.500%, 4/1/2029 | 5,556 | |
| 2,183 | Federal National Mortgage Association Pool 428865, 7.000%, 6/1/2028 | 2,338 | |
| 482 | Federal National Mortgage Association Pool 443215, 6.000%, 10/1/2028 | 545 | |
| 11,387 | Federal National Mortgage Association Pool 545993, 6.000%, 11/1/2032 | 12,979 | |
| 4,781 | Federal National Mortgage Association Pool 555272, 6.000%, 3/1/2033 | 5,449 | |
| 4,784 | Federal National Mortgage Association Pool 713974, 5.500%, 7/1/2033 | 5,405 | |
| 8,683 | Federal National Mortgage Association Pool 721502, 5.000%, 7/1/2033 | 9,614 | |
| 10,367 | Government National Mortgage Association Pool 2796, 7.000%, 8/20/2029 | 12,140 |
| Shares or Principal Amount | Value in U.S. Dollarsi | ||
| MORTGAGE-BACKED SECURITIES—continued | |||
| $5,389 | Government National Mortgage Association Pool 3040, 7.000%, 2/20/2031 | $6,325 | |
| 12,901 | Government National Mortgage Association Pool 3188, 6.500%, 1/20/2032 | 14,995 | |
| 19,810 | Government National Mortgage Association Pool 3239, 6.500%, 5/20/2032 | 23,067 | |
| 572 | Government National Mortgage Association Pool 352214, 7.000%, 4/15/2023 | 643 | |
| 2,352 | Government National Mortgage Association Pool 451522, 7.500%, 30 Year, 10/15/2027 | 2,792 | |
| 2,209 | Government National Mortgage Association Pool 462556, 6.500%, 2/15/2028 | 2,510 | |
| 385 | Government National Mortgage Association Pool 462739, 7.500%, 5/15/2028 | 457 | |
| 213 | Government National Mortgage Association Pool 464835, 6.500%, 9/15/2028 | 246 | |
| 5,622 | Government National Mortgage Association Pool 469699, 7.000%, 11/15/2028 | 6,558 | |
| 4,557 | Government National Mortgage Association Pool 486760, 6.500%, 12/15/2028 | 5,250 | |
| 659 | Government National Mortgage Association Pool 780339, 8.000%,30 Year, 12/15/2023 | 755 | |
| 6,260 | Government National Mortgage Association Pool 780453, 7.500%, 30 Year, 12/15/2025 | 7,288 | |
| 4,756 | Government National Mortgage Association Pool 780584, 7.000%, 30 Year, 6/15/2027 | 5,470 | |
| TOTAL MORTGAGE-BACKED SECURITIES (IDENTIFIED COST $203,703) | 228,584 | ||
| FOREIGN GOVERNMENTS/AGENCIES—6.3% | |||
| Sovereign—6.3% | |||
| 280,000 | 4,5 | Belgium Kingdom 3.75% Series 46, 9/28/2015, 0.8%, Series 74, 6/22/2025 | 296,272 |
| 500,000 | Belgium, Government of, Series 68, 2.250%, 06/22/2023 | 600,807 | |
| 1,235,000 | Bonos Y Oblig Del Estado, 2.750%, 04/30/2019 | 1,416,142 | |
| 1,360,000 | 4,5 | Bonos Y Oblig Del Estado, Sr. Unsecd. Note, 2.750%, 10/31/2024 | 1,594,867 |
| 400,000 | 4,5 | Bonos Y Oblig Del Estado, Sr. Unsub., 4.000%, 04/30/2020 | 487,872 |
| 600,000 | Bundesrepublic Deutschland, Unsecd. Note, 1.00%, 8/15/2024 | 671,448 | |
| 650,000 | Buoni Poliennali Del Tes, 2.15%, 12/15/2021 | 743,345 | |
| 200,000 | Buoni Poliennali Del Tes, 2.50%, 5/01/2019 | 227,959 | |
| 1,000,000 | Buoni Poliennali Del Tes, 3.750%, 05/01/2021 | 1,232,794 | |
| 220,000 | Buoni Poliennali Del Tes, 4.250%, 03/01/2020 | 270,974 | |
| 2,200,000 | Buoni Poliennali Del Tes, 4.500%, 05/01/2023 | 2,895,986 |
| Shares or Principal Amount | Value in U.S. Dollarsi | ||
| FOREIGN GOVERNMENTS/AGENCIES—continued | |||
| Sovereign—continued | |||
| $58,000 | 4,5 | Buoni Poliennali Del Tes, Unsecd. Note, 3.25%, 9/01/2046 | $70,203 |
| 200,000 | Canada, Government of, Bond, 3.250%, 06/01/2021 | 167,454 | |
| 400,000 | Canada, Government of, Bond, 4.000%, 06/01/2016 | 304,898 | |
| 536,000 | France, Government of, 0.50%, 05/25/2025 | 555,405 | |
| 1,500,000 | France, Government of, 3.250%, 10/25/2021 | 1,878,239 | |
| 400,000 | France, Government of, Bond, 4.500%, 04/25/2041 | 663,580 | |
| 2,000,000 | Germany, Government of, 1.75%, 2/15/2024 | 2,375,418 | |
| 170,000,000 | Japan, Government of, Series 65, 1.900%, 12/20/2023 | 1,570,946 | |
| 120,000,000 | Japan, Government of, Series 87, 2.200%, 03/20/2026 | 1,157,488 | |
| 247,000,000 | Japan, Government of, Sr. Unsecd. Note, Series 114, 2.10%, 12/20/2029 | 2,405,832 | |
| 320,000,000 | Japan-313(10 Year Issue), Series 313, 1.30%, 3/20/2021 | 2,770,976 | |
| 850,000 | 4,5 | Netherlands, Government of, 1.750%, 07/15/2023 | 995,741 |
| 240,000 | 4,5 | Spain, Government of, Sr. Unsecd. Note, 1.95%, 7/30/2030 | 249,687 |
| 3,950,000 | Sweden, Government of, Series 1058, 2.50%, 5/12/2025 | 524,584 | |
| 1,410,000 | United Kingdom, Government of, 1.750%, 09/07/2022 | 2,156,622 | |
| 180,000 | United Kingdom, Government of, 3.250%, 01/22/2044 | 310,014 | |
| 670,000 | United Kingdom, Government, 2.75%, 9/07/2024 | 1,092,084 | |
| 30,000 | United Mexican States, Series MTNA, 6.750%, 09/27/2034 | 36,975 | |
| TOTAL FOREIGN GOVERNMENTS/AGENCIES (IDENTIFIED COST $31,565,774) | 29,724,612 | ||
| MUNICIPAL BOND—0.0% | |||
| Illinois—0.0% | |||
| 90,000 | Chicago, IL Metropolitan Water Reclamation District, Direct Payment Taxable Limited GO Build America Bonds, 5.720%, 12/01/2038 (IDENTIFIED COST $90,000) | 102,903 | |
| U.S. TREASURY—1.1% | |||
| 1,016,130 | U.S. Treasury Inflation-Protected Note, 0.125%, 4/15/2020 | 1,008,126 | |
| 2,755,000 | United States Treasury Note, 1.375%, 10/31/2020 | 2,718,159 | |
| 1,650,000 | United States Treasury Note, 2.250%, 11/15/2025 | 1,655,156 | |
| TOTAL U.S. TREASURY (IDENTIFIED COST $5,351,325) | 5,381,441 | ||
| EXCHANGE-TRADED FUND—6.0% | |||
| 683,708 | iShares Core MSCI Emerging Markets ETF (IDENTIFIED COST $33,518,465) | 28,285,000 | |
| INVESTMENT COMPANIES—20.2%6 | |||
| 1,324,502 | Emerging Markets Fixed Income Core Fund | 45,557,365 | |
| 334,858 | Federated Bank Loan Core Fund | 3,288,309 |
| Shares or Principal Amount | Value in U.S. Dollarsi | ||
| INVESTMENT COMPANIES—continued6 | |||
| $1,919,615 | Federated Mortgage Core Portfolio | $18,984,988 | |
| 1,526,203 | Federated Project and Trade Finance Core Fund | 14,269,998 | |
| 2,220,152 | High Yield Bond Portfolio | 13,298,709 | |
| TOTAL INVESTMENT COMPANIES (IDENTIFIED COST $99,789,893) | 95,399,369 | ||
| TOTAL INVESTMENTS—93.7% (IDENTIFIED COST $435,804,604)7 | 442,797,951 | ||
| OTHER ASSETS AND LIABILITIES - NET—6.3%8 | 29,746,191 | ||
| TOTAL NET ASSETS—100% | $472,544,142 |
| Description | Number of Contracts | Notional Value | Expiration Date | Unrealized Appreciation (Depreciation) |
| 1Amsterdam Index Short Futures | 86 | $8,078,840 | December 2015 | $21,158 |
| 1Australia 10-Year Bond Short Futures | 1 | $126,843 | December 2015 | $141 |
| 1DJIA Mini E-CBOT Short Futures | 52 | $4,605,640 | December 2015 | $11,385 |
| 1Euro BTP Short Futures | 23 | $3,241,620 | December 2015 | $(41,071) |
| 1Euro STOXX 50 Short Futures | 48 | $1,682,400 | December 2015 | $(10,777) |
| 1FTSE 100 Index Short Futures | 326 | $20,709,150 | December 2015 | $(430,832) |
| 1FTSE/MIB Index Short Futures | 78 | $8,852,220 | December 2015 | $(76,415) |
| 1KOSPI2 Index Short Futures | 183 | $22,403,775,000 | December 2015 | $50,512 |
| 1Long GILT Short Futures | 53 | $6,239,690 | March 2016 | $(55,207) |
| 1MSCI Singapore IX ETS Short Futures | 418 | $13,325,840 | December 2015 | $232,054 |
| 1Mini MSCI Emerging Market Short Futures | 122 | $5,002,000 | December 2015 | $(19,496) |
| 1OMXS 30 Index Short Futures | 604 | $92,985,800 | December 2015 | $(163,488) |
| 1S&P 500 E-Mini Short Futures | 111 | $11,542,890 | December 2015 | $54,751 |
| 1SGX Nifty 50 Short Futures | 489 | $7,803,951 | December 2015 | $(30,984) |
| 1SPI 200 Short Futures | 227 | $29,430,550 | December 2015 | $(56,065) |
| 1United States Treasury Notes 10-Year Short Futures | 236 | $29,839,250 | March 2016 | $(73,481) |
| 1BIST 30 Long Futures | 1,039 | $9,725,040 | December 2015 | $(29,191) |
| 1CAC 40 10 Euro Long Futures | 111 | $5,501,160 | December 2015 | $33,031 |
| 1Canada 10-Year Bond Long Futures | 158 | $21,933,560 | March 2016 | $35,129 |
| 1DAX Index Long Futures | 43 | $12,231,888 | December 2015 | $108,354 |
| 1Euro BUND Long Futures | 56 | $8,865,360 | December 2015 | $(8,431) |
| 1FTSE JSE Top 40 Long Futures | 812 | $377,458,200 | December 2015 | $(123,379) |
| 1Hang Seng Index Long Futures | 34 | $37,245,300 | December 2015 | $(32,187) |
| Description | Number of Contracts | Notional Value | Expiration Date | Unrealized Appreciation (Depreciation) |
| 1IBEX 35 Index Long Futures | 53 | $5,498,538 | December 2015 | $50,888 |
| 1Japan 10-Year Bond Long Futures | 3 | $445,590,000 | December 2015 | $3,161 |
| 1MSCI Taiwan Index Long Futures | 65 | $1,989,000 | December 2015 | $(45,035) |
| 1NIKKEI 225 Long Futures | 29 | $572,750,000 | December 2015 | $(35,869) |
| 1Russell 2000 Mini Long Futures | 14 | $1,674,260 | December 2015 | $74,713 |
| 1S&P 500 E-Mini Long Futures | 546 | $56,778,540 | December 2015 | $1,070,613 |
| 1S&P/TSX 60 Index Long Futures | 169 | $26,745,940 | December 2015 | $524,637 |
| 1Swiss Market Index Long Futures | 148 | $13,330,360 | December 2015 | $472,277 |
| 1TOPIX Index Long Futures | 110 | $1,740,200,000 | December 2015 | $100,764 |
| 1United States Treasury Notes 2-Year Long Futures | 38 | $8,266,781 | March 2016 | $(2,464) |
| 1United States Ultra Bond Long Futures | 25 | $3,960,938 | March 2016 | $44,277 |
| NET UNREALIZED APPRECIATION ON FUTURES CONTRACTS | $1,653,473 | |||
| Settlement Date | Counterparty | Foreign Currency Units to Deliver/Receive | In Exchange For | Unrealized Gain/Loss |
| Contracts Purchased: | ||||
| 12/01/2015 | JPMorgan Chase | 1,600,000 AUD | $1,131,382 | $25,738 |
| 12/01/2015 | JPMorgan Chase | 1,984,680 CAD | 2,300,000 NZD | $(27,824) |
| 12/01/2015 | JPMorgan Chase | 732,242 CAD | $550,000 | $(1,689) |
| 12/01/2015 | JPMorgan Chase | 733,028 CAD | $550,000 | $(1,100) |
| 12/01/2015 | JPMorgan Chase | 737,802 CAD | $550,000 | $2,475 |
| 12/01/2015 | JPMorgan Chase | 755,632 CAD | $564,650 | $1,176 |
| 12/01/2015 | JPMorgan Chase | 350,000 EUR | $394,064 | $(24,271) |
| 12/01/2015 | JPMorgan Chase | 1,000,000 EUR | $1,123,039 | $(66,489) |
| 12/01/2015 | JPMorgan Chase | 1,000,000 EUR | $1,127,545 | $(70,995) |
| 12/01/2015 | Goldman Sachs | 1,650,000 EUR | $1,822,805 | $(79,497) |
| 12/01/2015 | Bank of America, N.A. | 980,000 GBP | 12,392,786 SEK | $55,079 |
| 12/01/2015 | JPMorgan Chase | 927,000 GBP | $1,411,780 | $(15,627) |
| 12/01/2015 | Goldman Sachs | 264,055,440 JPY | $2,200,000 | $(54,952) |
| 12/03/2015 | JPMorgan Chase | 5,401,000 AUD | $3,898,939 | $6,841 |
| 12/03/2015 | JPMorgan Chase | 14,661,000 CAD | $11,012,849 | $(34,645) |
| 12/03/2015 | JPMorgan Chase | 2,213,000 CHF | $2,170,904 | $(19,887) |
| 12/03/2015 | JPMorgan Chase | 12,054,000 EUR | $12,814,683 | $(78,861) |
| 12/03/2015 | JPMorgan Chase | 240,500 GBP | $365,909 | $(3,695) |
| 12/03/2015 | JPMorgan Chase | 410,003,000 JPY | $3,331,120 | $(447) |
| 12/03/2015 | JPMorgan Chase | 217,162,000 MXN | $13,114,007 | $(15,693) |
| 12/03/2015 | JPMorgan Chase | 58,491,500 NOK | $6,771,825 | $(41,485) |
| Settlement Date | Counterparty | Foreign Currency Units to Deliver/Receive | In Exchange For | Unrealized Gain/Loss |
| 12/03/2015 | JPMorgan Chase | 7,436,000 NZD | $4,850,779 | $43,616 |
| 12/03/2015 | JPMorgan Chase | 46,934,000 SEK | $5,409,294 | $(27,983) |
| 12/03/2015 | JPMorgan Chase | 7,258,000 SGD | $5,128,836 | $16,498 |
| 12/03/2015 | JPMorgan Chase | 37,309,000 TRY | $13,080,505 | $(281,427) |
| 12/09/2015 | JPMorgan Chase | 257,500 AUD | $185,053 | $1,097 |
| 12/09/2015 | JPMorgan Chase | 17,913,000 CAD | $13,408,996 | $3,973 |
| 12/09/2015 | JPMorgan Chase | 4,988,500 CHF | $4,894,950 | $(45,202) |
| 12/09/2015 | JPMorgan Chase | 12,604,000 EUR | $13,348,388 | $(30,376) |
| 12/09/2015 | JPMorgan Chase | 3,714,000 GBP | $5,639,029 | $(45,638) |
| 12/09/2015 | JPMorgan Chase | 219,474,000 JPY | $1,784,800 | $(1,821) |
| 12/09/2015 | JPMorgan Chase | 222,070,000 MXN | $13,372,217 | $16,624 |
| 12/09/2015 | JPMorgan Chase | 26,339,000 NOK | $3,026,189 | $4,160 |
| 12/09/2015 | JPMorgan Chase | 1,330,000 NZD | $868,325 | $6,708 |
| 12/09/2015 | JPMorgan Chase | 45,078,000 SEK | $5,166,479 | $2,501 |
| 12/09/2015 | JPMorgan Chase | 10,628,000 SGD | $7,516,425 | $16,409 |
| 12/09/2015 | JPMorgan Chase | 19,057,500 TRY | $6,486,706 | $39,565 |
| 12/15/2015 | JPMorgan Chase | 2,060,037 AUD | 1,400,000 EUR | $9,118 |
| 12/15/2015 | JPMorgan Chase | 2,000,000 CAD | 189,431,060 JPY | $(41,779) |
| 12/15/2015 | JPMorgan Chase | 1,200,000 GBP | $1,872,165 | $(64,837) |
| 12/15/2015 | JPMorgan Chase | 1,200,000 GBP | $1,879,463 | $(72,134) |
| 12/15/2015 | JPMorgan Chase | 71,915,802 JPY | $600,000 | $(15,597) |
| 12/15/2015 | JPMorgan Chase | 180,058,200 JPY | $1,500,000 | $(36,809) |
| 12/15/2015 | JPMorgan Chase | 198,379,280 JPY | $1,600,000 | $12,072 |
| 12/16/2015 | JPMorgan Chase | 13,034,000 CAD | $9,747,005 | $12,722 |
| 12/16/2015 | JPMorgan Chase | 2,929,500 CHF | $2,845,316 | $4,604 |
| 12/16/2015 | JPMorgan Chase | 5,846,500 GBP | $8,791,115 | $14,418 |
| 12/30/2015 | JPMorgan Chase | 1,937,052 DKK | 260,000 EUR | $(277) |
| 02/02/2016 | State Street Bank | 2,000,000 GBP | $3,006,320 | $6,398 |
| Contracts Sold: | ||||
| 12/01/2015 | JPMorgan Chase | 1,600,000 AUD | $1,168,799 | $11,678 |
| 12/01/2015 | JPMorgan Chase | 1,977,741 CAD | 2,300,000 NZD | $33,020 |
| 12/01/2015 | JPMorgan Chase | 147,617 CAD | $110,000 | $(537) |
| 12/01/2015 | JPMorgan Chase | 147,617 CAD | $110,000 | $(537) |
| 12/01/2015 | JPMorgan Chase | 147,617 CAD | $110,000 | $(537) |
| 12/01/2015 | JPMorgan Chase | 151,549 CAD | $112,930 | $(551) |
| 12/01/2015 | JPMorgan Chase | 590,850 CAD | $440,000 | $(2,435) |
| 12/01/2015 | JPMorgan Chase | 590,850 CAD | $440,000 | $(2,435) |
| 12/01/2015 | JPMorgan Chase | 590,850 CAD | $440,000 | $(2,435) |
| 12/01/2015 | JPMorgan Chase | 606,588 CAD | $451,720 | $(2,500) |
| Settlement Date | Counterparty | Foreign Currency Units to Deliver/Receive | In Exchange For | Unrealized Gain/Loss |
| 12/01/2015 | JPMorgan Chase | 2,000,000 EUR | $2,233,760 | $120,661 |
| 12/01/2015 | Goldman Sachs | 2,000,000 EUR | $2,272,126 | $159,027 |
| 12/01/2015 | Bank of America, N.A. | 980,000 GBP | 12,214,230 SEK | $(75,552) |
| 12/01/2015 | JPMorgan Chase | 927,000 GBP | $1,409,189 | $13,035 |
| 12/01/2015 | Goldman Sachs | 130,615,815 JPY | $1,093,439 | $32,385 |
| 12/01/2015 | Goldman Sachs | 132,183,205 JPY | $1,106,561 | $32,773 |
| 12/03/2015 | JPMorgan Chase | 5,401,000 AUD | $3,837,286 | $(68,494) |
| 12/03/2015 | JPMorgan Chase | 14,661,000 CAD | $10,974,908 | $(3,296) |
| 12/03/2015 | JPMorgan Chase | 2,213,000 CHF | $2,201,077 | $50,060 |
| 12/03/2015 | JPMorgan Chase | 12,054,000 EUR | $12,934,357 | $198,534 |
| 12/03/2015 | JPMorgan Chase | 240,500 GBP | $365,171 | $2,957 |
| 12/03/2015 | JPMorgan Chase | 410,003,000 JPY | $3,334,066 | $3,393 |
| 12/03/2015 | JPMorgan Chase | 96,491,000 MXN | $5,759,410 | $(60,528) |
| 12/03/2015 | JPMorgan Chase | 120,671,000 MXN | $7,218,774 | $(59,602) |
| 12/03/2015 | JPMorgan Chase | 58,491,500 NOK | $6,738,382 | $8,042 |
| 12/03/2015 | JPMorgan Chase | 7,436,000 NZD | $4,811,232 | $(83,163) |
| 12/03/2015 | JPMorgan Chase | 46,934,000 SEK | $5,378,468 | $(2,843) |
| 12/03/2015 | JPMorgan Chase | 7,258,000 SGD | $5,100,521 | $(44,813) |
| 12/03/2015 | JPMorgan Chase | 37,309,000 TRY | $12,896,689 | $97,612 |
| 12/09/2015 | JPMorgan Chase | 257,500 AUD | $185,824 | $(325) |
| 12/09/2015 | JPMorgan Chase | 17,913,000 CAD | $13,395,684 | $(17,285) |
| 12/09/2015 | JPMorgan Chase | 4,988,500 CHF | $4,843,933 | $(5,816) |
| 12/09/2015 | JPMorgan Chase | 12,604,000 EUR | $13,400,478 | $82,465 |
| 12/09/2015 | JPMorgan Chase | 3,714,000 GBP | $5,584,766 | $(8,625) |
| 12/09/2015 | JPMorgan Chase | 219,474,000 JPY | $1,787,292 | $4,313 |
| 12/09/2015 | JPMorgan Chase | 222,070,000 MXN | $13,403,627 | $14,786 |
| 12/09/2015 | JPMorgan Chase | 26,339,000 NOK | $3,048,893 | $18,544 |
| 12/09/2015 | JPMorgan Chase | 1,330,000 NZD | $867,225 | $(7,809) |
| 12/09/2015 | JPMorgan Chase | 45,078,000 SEK | $5,157,114 | $(11,866) |
| 12/09/2015 | JPMorgan Chase | 10,628,000 SGD | $7,507,272 | $(25,562) |
| 12/09/2015 | JPMorgan Chase | 19,057,500 TRY | $6,669,606 | $143,336 |
| 12/15/2015 | JPMorgan Chase | 1,058,033 AUD | 700,000 EUR | $(24,805) |
| 12/15/2015 | JPMorgan Chase | 1,118,894 AUD | 700,000 EUR | $(68,789) |
| 12/15/2015 | JPMorgan Chase | 2,000,000 CAD | 188,814,400 JPY | $36,768 |
| 12/15/2015 | JPMorgan Chase | 4,000,000 EUR | $4,486,008 | $258,431 |
| 12/15/2015 | JPMorgan Chase | 1,200,000 GBP | $1,869,810 | $62,481 |
| 12/15/2015 | JPMorgan Chase | 1,200,000 GBP | $1,892,078 | $84,749 |
| 12/15/2015 | JPMorgan Chase | 72,120,828 JPY | $600,000 | $13,931 |
| 12/15/2015 | JPMorgan Chase | 180,562,845 JPY | $1,500,000 | $32,708 |
| Settlement Date | Counterparty | Foreign Currency Units to Deliver/Receive | In Exchange For | Unrealized Gain/Loss |
| 12/16/2015 | JPMorgan Chase | 6,807,500 AUD | $4,890,292 | $(29,176) |
| 12/16/2015 | JPMorgan Chase | 11,918,000 EUR | $12,623,400 | $26,850 |
| 12/16/2015 | JPMorgan Chase | 353,375,000 JPY | $2,878,095 | $6,357 |
| 12/16/2015 | JPMorgan Chase | 66,326,500 MXN | $3,991,684 | $(5,360) |
| 12/16/2015 | JPMorgan Chase | 30,960,500 NOK | $3,556,637 | $(5,139) |
| 12/16/2015 | JPMorgan Chase | 6,478,500 NZD | $4,227,482 | $(32,900) |
| 12/16/2015 | JPMorgan Chase | 48,243,000 SEK | $5,519,391 | $(14,368) |
| 12/16/2015 | JPMorgan Chase | 17,837,000 SGD | $12,611,064 | $(28,489) |
| 12/16/2015 | JPMorgan Chase | 32,830,500 TRY | $11,150,547 | $(69,954) |
| NET UNREALIZED DEPRECIATION ON FOREIGN EXCHANGE CONTRACTS | $(116,875) | |||
| 1 | Non-income-producing security. |
| 2 | Issuer in default. |
| 3 | Market quotations and price evaluations are not available. Fair value determined in accordance with procedures established by and under the general supervision of the Trustees. |
| 4 | Denotes a restricted security that either: (a) cannot be offered for public sale without first being registered, or being able to take advantage of an exemption from registration, under the Securities Act of 1933; or (b) is subject to a contractual restriction on public sales. At November 30, 2015, these restricted securities amounted to $8,386,572, which represented 1.8% of total net assets. |
| 5 | Denotes a restricted security that may be resold without restriction to “qualified institutional buyers” as defined in Rule 144A under the Securities Act of 1933 and that the Fund has determined to be liquid under criteria established by the Fund's Board of Trustees (the “Trustees”). At November 30, 2015, these liquid restricted securities amounted to $7,312,290, which represented 1.5% of total net assets. |
| 6 | Affiliated holdings. |
| 7 | The cost of investments for federal tax purposes amounts to $436,819,279. |
| 8 | Assets, other than investments in securities, less liabilities. See Statement of Assets and Liabilities. |
| Valuation Inputs | ||||
| Level 1— Quoted Prices | Level 2— Other Significant Observable Inputs | Level 3— Significant Unobservable Inputs | Total | |
| Equity Securities: | ||||
| Common Stocks | ||||
| Domestic | $134,860,142 | $— | $— | $134,860,142 |
| International | 16,389,830 | 105,465,0251 | — | 121,854,855 |
| Debt Securities: | ||||
| Asset-Backed Securities | — | 596,477 | — | 596,477 |
| Collateralized Mortgage Obligations | — | 1,222,738 | — | 1,222,738 |
| Corporate Bonds | — | 25,058,633 | 83,197 | 25,141,830 |
| Foreign Governments/Agencies | — | 29,724,612 | — | 29,724,612 |
| Mortgage-Backed Securities | — | 228,584 | — | 228,584 |
| Municipal | — | 102,903 | — | 102,903 |
| U.S. Treasury | — | 5,381,441 | — | 5,381,441 |
| Exchange-Traded Funds | 28,285,000 | — | — | 28,285,000 |
| Investment Companies2 | — | 95,399,3693 | — | 95,399,369 |
| TOTAL SECURITIES | $179,534,972 | $263,179,782 | $83,197 | $442,797,951 |
| Other Financial Instruments:4 | ||||
| Assets | $2,887,845 | $1,850,688 | $— | $4,738,533 |
| Liabilities | (1,234,372) | (1,967,563) | — | (3,201,935) |
| TOTAL OTHER FINANCIAL INSTRUMENTS4 | $1,653,473 | $(116,875) | $— | $1,536,598 |
| 1 | Includes $75,817,887 of securities transferred from Level 1 to Level 2 because fair value factors were applied to equity securities traded principally in foreign markets to account for significant post market close activity. Transfers shown represent the value of the investments at the beginning of the period. |
| 2 | Emerging Markets Fixed Income Core Fund, Federated Mortgage Core Portfolio, Federated Project and Trade Finance Core Fund and High Yield Bond Portfolio are affiliated holdings offered only to registered investment companies and other accredited investors. Investments in these funds are deemed Level 2 due to the fact that the net asset value (the NAV) is not publicly available and, with respect to Federated Project and Trade Finance Core Fund, due to the fact that the price of shares redeemed may be determined as of the closing NAV of the fund up to twenty-four days after receipt of a shareholder redemption request. |
| 3 | Includes $68,867,887 of affiliated investment company holdings transferred from Level 1 to Level 2 because the Adviser determined that these investments more appropriately meet the definition of Level 2. Transfers shown represent the value of the investments at the beginning of the period. |
| 4 | Other financial instruments include futures contracts and foreign exchange contracts. |
| AUD | —Australian Dollar |
| CAD | —Canadian Dollar |
| CHF | —Swiss Franc |
| DKK | —Danish Krone |
| EUR | —Euro |
| GBP | —British Pound |
| GO | —General Obligation |
| JPY | —Japanese Yen |
| MBIA | —National Public Finance Guarantee Corp. (as restructured from MBIA Insurance Corp.) |
| MTN | —Medium Term Note |
| MXN | —Mexican Peso |
| NOK | —Norwegian Krone |
| NZD | —New Zealand Dollar |
| REIT(s) | —Real Estate Investment Trust(s) |
| SEK | —Swedish Krona |
| SGD | —Singapore Dollar |
| TRY | —Turkish Lira |
| Year Ended November 30 | 2015 | 2014 | 2013 | 2012 | 2011 |
| Net Asset Value, Beginning of Period | $20.29 | $21.47 | $18.68 | $16.98 | $16.87 |
| Income From Investment Operations: | |||||
| Net investment income | 0.271 | 0.181 | 0.171 | 0.181 | 0.201 |
| Net realized and unrealized gain (loss) on investments, futures contracts, swap contracts, written options and foreign currency transactions | (0.80) | 1.10 | 3.07 | 1.74 | 0.08 |
| TOTAL FROM INVESTMENT OPERATIONS | (0.53) | 1.28 | 3.24 | 1.92 | 0.28 |
| Less Distributions: | |||||
| Distributions from net investment income | (0.17) | (0.12) | (0.16) | (0.22) | (0.17) |
| Distributions from net realized gain on investments, futures contracts, swap contracts, written options and foreign currency transactions | (1.72) | (2.34) | (0.29) | — | — |
| TOTAL DISTRIBUTIONS | (1.89) | (2.46) | (0.45) | (0.22) | (0.17) |
| Redemption Fees | — | 0.002 | — | — | — |
| Net Asset Value, End of Period | $17.87 | $20.29 | $21.47 | $18.68 | $16.98 |
| Total Return3 | (2.80)% | 6.53% | 17.73% | 11.38% | 1.62% |
| Ratios to Average Net Assets: | |||||
| Net expenses | 1.16% | 1.14% | 1.17% | 1.22% | 1.25%4 |
| Net investment income | 1.45% | 0.93% | 0.88% | 1.01% | 1.14% |
| Expense waiver/reimbursement5 | 0.13% | 0.10% | 0.10% | 0.07% | 0.10% |
| Supplemental Data: | |||||
| Net assets, end of period (000 omitted) | $187,183 | $196,067 | $193,678 | $185,414 | $178,971 |
| Portfolio turnover | 76% | 100% | 106% | 85% | 215% |
| 1 | Per share numbers have been calculated using the average shares method. |
| 2 | Represents less than $0.01. |
| 3 | Based on net asset value, which does not reflect the sales charge, redemption fee or contingent deferred sales charge, if applicable. |
| 4 | The net expense ratio is calculated without reduction for expense offset arrangements. The net expense ratio is 1.25% for the year ended November 30, 2011, after taking into account this expense reduction. |
| 5 | This expense decrease is reflected in both the net expense and the net investment income ratios shown above. |
| Year Ended November 30 | 2015 | 2014 | 2013 | 2012 | 2011 |
| Net Asset Value, Beginning of Period | $19.86 | $21.17 | $18.46 | $16.78 | $16.69 |
| Income From Investment Operations: | |||||
| Net investment income | 0.121 | 0.021 | 0.011 | 0.031 | 0.061 |
| Net realized and unrealized gain (loss) on investments, futures contracts, swap contracts, written options and foreign currency transactions | (0.78) | 1.07 | 3.04 | 1.72 | 0.08 |
| TOTAL FROM INVESTMENT OPERATIONS | (0.66) | 1.09 | 3.05 | 1.75 | 0.14 |
| Less Distributions: | |||||
| Distributions from net investment income | (0.05) | (0.06) | (0.05) | (0.07) | (0.05) |
| Distributions from net realized gain on investments, futures contracts, swap contracts, written options and foreign currency transactions | (1.72) | (2.34) | (0.29) | — | — |
| TOTAL DISTRIBUTIONS | (1.77) | (2.40) | (0.34) | (0.07) | (0.05) |
| Redemption Fees | — | 0.002 | — | — | — |
| Net Asset Value, End of Period | $17.43 | $19.86 | $21.17 | $18.46 | $16.78 |
| Total Return3 | (3.59)% | 5.67% | 16.82% | 10.39% | 0.80% |
| Ratios to Average Net Assets: | |||||
| Net expenses | 1.97% | 1.95% | 1.99% | 2.05% | 2.05%4 |
| Net investment income | 0.64% | 0.12% | 0.06% | 0.19% | 0.33% |
| Expense waiver/reimbursement5 | 0.12% | 0.10% | 0.10% | 0.07% | 0.12% |
| Supplemental Data: | |||||
| Net assets, end of period (000 omitted) | $21,384 | $26,163 | $30,675 | $28,853 | $30,424 |
| Portfolio turnover | 76% | 100% | 106% | 85% | 215% |
| 1 | Per share numbers have been calculated using the average shares method. |
| 2 | Represents less than $0.01. |
| 3 | Based on net asset value, which does not reflect the sales charge, redemption fee or contingent deferred sales charge, if applicable. |
| 4 | The net expense ratio is calculated without reduction for expense offset arrangements. The net expense ratio is 2.05% for the year ended November 30, 2011, after taking into account this expense reduction. |
| 5 | This expense decrease is reflected in both the net expense and the net investment income ratios shown above. |
| Year Ended November 30 | 2015 | 2014 | 2013 | 2012 | 2011 |
| Net Asset Value, Beginning of Period | $19.80 | $21.11 | $18.40 | $16.72 | $16.62 |
| Income From Investment Operations: | |||||
| Net investment income | 0.131 | 0.031 | 0.021 | 0.041 | 0.061 |
| Net realized and unrealized gain (loss) on investments, futures contracts, swap contracts, written options and foreign currency transactions | (0.78) | 1.07 | 3.03 | 1.71 | 0.09 |
| TOTAL FROM INVESTMENT OPERATIONS | (0.65) | 1.10 | 3.05 | 1.75 | 0.15 |
| Less Distributions: | |||||
| Distributions from net investment income | (0.06) | (0.07) | (0.05) | (0.07) | (0.05) |
| Distributions from net realized gain on investments, futures contracts, swap contracts, written options and foreign currency transactions | (1.72) | (2.34) | (0.29) | — | — |
| TOTAL DISTRIBUTIONS | (1.78) | (2.41) | (0.34) | (0.07) | (0.05) |
| Redemption Fees | — | 0.002 | — | — | — |
| Net Asset Value, End of Period | $17.37 | $19.80 | $21.11 | $18.40 | $16.72 |
| Total Return3 | (3.55)% | 5.70% | 16.89% | 10.51% | 0.90% |
| Ratios to Average Net Assets: | |||||
| Net expenses | 1.91% | 1.89% | 1.95% | 1.98% | 2.02%4 |
| Net investment income | 0.70% | 0.17% | 0.10% | 0.24% | 0.36% |
| Expense waiver/reimbursement5 | 0.15% | 0.13% | 0.10% | 0.07% | 0.10% |
| Supplemental Data: | |||||
| Net assets, end of period (000 omitted) | $89,640 | $81,703 | $71,450 | $60,315 | $52,187 |
| Portfolio turnover | 76% | 100% | 106% | 85% | 215% |
| 1 | Per share numbers have been calculated using the average shares method. |
| 2 | Represents less than $0.01. |
| 3 | Based on net asset value, which does not reflect the sales charge, redemption fee or contingent deferred sales charge, if applicable. |
| 4 | The net expense ratio is calculated without reduction for expense offset arrangements. The net expense ratio is 2.02% for the year ended November 30, 2011, after taking into account this expense reduction. |
| 5 | This expense decrease is reflected in both the net expense and the net investment income ratios shown above. |
| Year Ended November 30 | 2015 | 2014 | 2013 | 2012 | 2011 |
| Net Asset Value, Beginning of Period | $20.16 | $21.40 | $18.62 | $16.92 | $16.81 |
| Income From Investment Operations: | |||||
| Net investment income | 0.191 | 0.101 | 0.091 | 0.111 | 0.121 |
| Net realized and unrealized gain (loss) on investments, futures contracts, swap contracts, written options and foreign currency transactions | (0.80) | 1.08 | 3.07 | 1.73 | 0.09 |
| TOTAL FROM INVESTMENT OPERATIONS | (0.61) | 1.18 | 3.16 | 1.84 | 0.21 |
| Less Distributions: | |||||
| Distributions from net investment income | (0.09) | (0.08) | (0.09) | (0.14) | (0.10) |
| Distributions from net realized gain on investments, futures contracts, swap contracts, written options and foreign currency transactions | (1.72) | (2.34) | (0.29) | — | — |
| TOTAL DISTRIBUTIONS | (1.81) | (2.42) | (0.38) | (0.14) | (0.10) |
| Redemption Fees | — | 0.002 | — | — | — |
| Net Asset Value, End of Period | $17.74 | $20.16 | $21.40 | $18.62 | $16.92 |
| Total Return3 | (3.26)% | 6.06% | 17.29% | 10.90% | 1.23% |
| Ratios to Average Net Assets: | |||||
| Net expenses | 1.59% | 1.57% | 1.57% | 1.65% | 1.68%4 |
| Net investment income | 1.02% | 0.50% | 0.48% | 0.58% | 0.71% |
| Expense waiver/reimbursement5 | 0.14% | 0.09% | 0.10% | 0.07% | 0.10% |
| Supplemental Data: | |||||
| Net assets, end of period (000 omitted) | $59,229 | $67,588 | $67,769 | $62,627 | $54,878 |
| Portfolio turnover | 76% | 100% | 106% | 85% | 215% |
| 1 | Per share numbers have been calculated using the average shares method. |
| 2 | Represents less than $0.01. |
| 3 | Based on net asset value. |
| 4 | The net expense ratio is calculated without reduction for expense offset arrangements. The net expense ratio is 1.68% for the year ended November 30, 2011, after taking into account this expense reduction. |
| 5 | This expense decrease is reflected in both the net expense and the net investment income ratios shown above. |
| Year Ended November 30 | 2015 | 2014 | 2013 | 2012 | 2011 |
| Net Asset Value, Beginning of Period | $20.40 | $21.54 | $18.74 | $17.04 | $16.91 |
| Income From Investment Operations: | |||||
| Net investment income | 0.321 | 0.241 | 0.231 | 0.241 | 0.241 |
| Net realized and unrealized gain (loss) on investments, futures contracts, swap contracts, written options and foreign currency transactions | (0.80) | 1.10 | 3.08 | 1.74 | 0.10 |
| TOTAL FROM INVESTMENT OPERATIONS | (0.48) | 1.34 | 3.31 | 1.98 | 0.34 |
| Less Distributions: | |||||
| Distributions from net investment income | (0.22) | (0.14) | (0.22) | (0.28) | (0.21) |
| Distributions from net realized gain on investments, futures contracts, swap contracts, written options and foreign currency transactions | (1.72) | (2.34) | (0.29) | — | — |
| TOTAL DISTRIBUTIONS | (1.94) | (2.48) | (0.51) | (0.28) | (0.21) |
| Redemption Fees | — | 0.002 | — | — | — |
| Net Asset Value, End of Period | $17.98 | $20.40 | $21.54 | $18.74 | $17.04 |
| Total Return3 | (2.51)% | 6.85% | 18.07% | 11.69% | 1.99% |
| Ratios to Average Net Assets: | |||||
| Net expenses | 0.87% | 0.85% | 0.89% | 0.94% | 0.95%4 |
| Net investment income | 1.74% | 1.21% | 1.16% | 1.29% | 1.40% |
| Expense waiver/reimbursement5 | 0.14% | 0.12% | 0.10% | 0.07% | 0.10% |
| Supplemental Data: | |||||
| Net assets, end of period (000 omitted) | $115,108 | $62,451 | $48,353 | $35,929 | $33,979 |
| Portfolio turnover | 76% | 100% | 106% | 85% | 215% |
| 1 | Per share numbers have been calculated using the average shares method. |
| 2 | Represents less than $0.01. |
| 3 | Based on net asset value. |
| 4 | The net expense ratio is calculated without reduction for expense offset arrangements. The net expense ratio is 0.95% for the year ended November 30, 2011, after taking into account this expense reduction. |
| 5 | This expense decrease is reflected in both the net expense and the net investment income ratios shown above. |
| Assets: | ||
| Total investment in securities, at value including $95,399,369 of investment in affiliated holdings (Note 5) (identified cost $435,804,604) | $442,797,951 | |
| Cash | 13,087,533 | |
| Cash denominated in foreign currencies (identified cost $325,233) | 311,065 | |
| Restricted cash (Note 2) | 17,461,141 | |
| Income receivable | 1,142,820 | |
| Receivable for shares sold | 757,946 | |
| Unrealized appreciation on foreign exchange contracts | 1,850,688 | |
| TOTAL ASSETS | 477,409,144 | |
| Liabilities: | ||
| Payable for investments purchased | $239,074 | |
| Payable for shares redeemed | 516,354 | |
| Unrealized depreciation on foreign exchange contracts | 1,967,563 | |
| Payable for daily variation margin on futures | 1,763,313 | |
| Payable to adviser (Note 5) | 7,572 | |
| Payable for transfer agent fee | 105,352 | |
| Payable for auditing fees | 31,180 | |
| Payable for distribution services fee (Note 5) | 92,646 | |
| Payable for other service fees (Notes 2 and 5) | 59,288 | |
| Payable for share registration costs | 31,512 | |
| Accrued expenses (Note 5) | 51,148 | |
| TOTAL LIABILITIES | 4,865,002 | |
| Net assets for 26,602,745 shares outstanding | $472,544,142 | |
| Net Assets Consist of: | ||
| Paid-in capital | $467,845,085 | |
| Net unrealized appreciation of investments, futures contracts and translation of assets and liabilities in foreign currency | 8,519,820 | |
| Accumulated net realized loss on investments, futures contracts, written options and foreign currency transactions | (5,124,361) | |
| Undistributed net investment income | 1,303,598 | |
| TOTAL NET ASSETS | $472,544,142 |
| Net Asset Value, Offering Price and Redemption Proceeds Per Share | ||
| Class A Shares: | ||
| Net asset value per share ($187,183,329 ÷ 10,474,681 shares outstanding), no par value, unlimited shares authorized | $17.87 | |
| Offering price per share (100/94.50 of $17.87) | $18.91 | |
| Redemption proceeds per share | $17.87 | |
| Class B Shares: | ||
| Net asset value per share ($21,384,086 ÷ 1,227,031 shares outstanding), no par value, unlimited shares authorized | $17.43 | |
| Offering price per share | $17.43 | |
| Redemption proceeds per share (94.50/100 of $17.43) | $16.47 | |
| Class C Shares: | ||
| Net asset value per share ($89,639,802 ÷ 5,159,283 shares outstanding), no par value, unlimited shares authorized | $17.37 | |
| Offering price per share | $17.37 | |
| Redemption proceeds per share (99.00/100 of $17.37) | $17.20 | |
| Class R Shares: | ||
| Net asset value per share ($59,228,598 ÷ 3,338,132 shares outstanding), no par value, unlimited shares authorized | $17.74 | |
| Offering price per share | $17.74 | |
| Redemption proceeds per share | $17.74 | |
| Institutional Shares: | ||
| Net asset value per share ($115,108,327 ÷ 6,403,618 shares outstanding), no par value, unlimited shares authorized | $17.98 | |
| Offering price per share | $17.98 | |
| Redemption proceeds per share | $17.98 |
| Investment Income: | |||
| Dividends (including $2,030,620 received from affiliated holdings (Note 5) and net of foreign taxes withheld of $326,837) | $8,499,399 | ||
| Investment income allocated from affiliated partnership (Note 5) | 2,128,788 | ||
| Interest | 1,203,029 | ||
| TOTAL INCOME | 11,831,216 | ||
| Expenses: | |||
| Investment adviser fee (Note 5) | $3,069,354 | ||
| Administrative fee (Note 5) | 354,658 | ||
| Custodian fees | 173,202 | ||
| Transfer agent fee (Note 2) | 790,440 | ||
| Directors'/Trustees' fees (Note 5) | 9,998 | ||
| Auditing fees | 32,480 | ||
| Legal fees | 8,954 | ||
| Portfolio accounting fees | 169,360 | ||
| Distribution services fee (Note 5) | 1,139,942 | ||
| Other service fees (Notes 2 and 5) | 755,235 | ||
| Share registration costs | 94,394 | ||
| Printing and postage | 39,179 | ||
| Miscellaneous (Note 5) | 74,238 | ||
| EXPENSES BEFORE ALLOCATION | 6,711,434 | ||
| Expenses allocated from affiliated partnership (Note 2) | 24,018 | ||
| TOTAL EXPENSES | 6,735,452 | ||
| Waivers and Reimbursement: | |||
| Waiver/reimbursement of investment adviser fee (Note 5) | $(449,199) | ||
| Waiver of other operating expenses (Note 2) | (161,929) | ||
| TOTAL WAIVERS AND REIMBURSEMENT | (611,128) | ||
| Net expenses | 6,124,324 | ||
| Net investment income | 5,706,892 |
| Realized and Unrealized Gain (Loss) on Investments, Futures Contracts and Foreign Currency Transactions: | |||
| Net realized gain on investments (including realized loss of $(1,323,358) on sales of investments in affiliated holdings (Note 5)) and foreign currency transactions | $9,233,178 | ||
| Net realized loss on futures contracts | (4,797,087) | ||
| Net realized loss on investments and foreign currency transactions allocated from affiliated partnership (Note 5) | (2,876,851) | ||
| Realized gain distribution from affiliated investment company shares (Note 5) | 85,779 | ||
| Net change in unrealized appreciation of investments and translation of assets and liabilities in foreign currency | (19,428,157) | ||
| Net change in unrealized appreciation of futures contracts | (2,928,334) | ||
| Net realized and unrealized loss on investments, futures contracts and foreign currency transactions | (20,711,472) | ||
| Change in net assets resulting from operations | $(15,004,580) |
| Year Ended November 30 | 2015 | 2014 |
| Increase (Decrease) in Net Assets | ||
| Operations: | ||
| Net investment income | $5,706,892 | $2,985,480 |
| Net realized gain on investments including allocation from affiliated partnerships, futures contracts, written options and foreign currency transactions | 1,645,019 | 39,378,019 |
| Net change in unrealized appreciation/depreciation of investments, futures contracts and translation of assets and liabilities in foreign currency | (22,356,491) | (16,551,533) |
| CHANGE IN NET ASSETS RESULTING FROM OPERATIONS | (15,004,580) | 25,811,966 |
| Distributions to Shareholders: | ||
| Distributions from net investment income | ||
| Class A Shares | (1,712,110) | (1,122,430) |
| Class B Shares | (59,916) | (95,208) |
| Class C Shares | (245,024) | (239,144) |
| Class R Shares | (294,064) | (265,178) |
| Institutional Shares | (930,301) | (394,367) |
| Distributions from net realized gain on investments, futures contracts and foreign currency transactions | ||
| Class A Shares | (16,482,726) | (21,054,666) |
| Class B Shares | (2,242,453) | (3,369,971) |
| Class C Shares | (7,164,821) | (7,922,335) |
| Class R Shares | (5,737,474) | (7,365,552) |
| Institutional Shares | (5,179,616) | (5,424,526) |
| CHANGE IN NET ASSETS RESULTING FROM DISTRIBUTIONS TO SHAREHOLDERS | (40,048,505) | (47,253,377) |
| Share Transactions: | ||
| Proceeds from sale of shares | 173,670,988 | 90,680,055 |
| Net asset value of shares issued to shareholders in payment of distributions declared | 37,916,243 | 44,798,299 |
| Cost of shares redeemed | (117,963,371) | (92,043,932) |
| CHANGE IN NET ASSETS RESULTING FROM SHARE TRANSACTIONS | 93,623,860 | 43,434,422 |
| Redemption Fees | — | 55,498 |
| Change in net assets | 38,570,775 | 22,048,509 |
| Net Assets: | ||
| Beginning of period | 433,973,367 | 411,924,858 |
| End of period (including undistributed net investment income of $1,303,598 and $421,047, respectively) | $472,544,142 | $433,973,367 |
| ■ | Equity securities listed on an exchange or traded through a regulated market system are valued at their last reported sale price or official closing price in their principal exchange or market. |
| ■ | Fixed-income securities acquired with remaining maturities greater than 60 days are fair valued using price evaluations provided by a pricing service approved by the Trustees. |
| ■ | Fixed-income securities and repurchase agreements acquired with remaining maturities of 60 days or less are valued at their cost (adjusted for the accretion of any discount or amortization of any premium), unless the issuer's creditworthiness is impaired or other factors indicate that amortized cost is not an accurate estimate of the investment's fair value, in which case it would be valued in the same manner as a longer-term security. |
| ■ | Shares of other mutual funds or non-exchange-traded investment companies are valued based upon their reported NAVs. |
| ■ | Derivative contracts listed on exchanges are valued at their reported settlement or closing price, except that options are valued at the mean of closing bid and asked quotations. |
| ■ | Over-the-counter (OTC) derivative contracts are fair valued using price evaluations provided by a pricing service approved by the Trustees. |
| ■ | For securities that are fair valued in accordance with procedures established by and under the general supervision of the Trustees, certain factors may be considered such as: the last traded or purchase price of the security, information obtained by contacting the issuer or dealers, analysis of the issuer's financial statements or other available documents, fundamental analytical data, the nature and duration of restrictions on disposition, the movement of the market in which the security is normally traded, public trading in similar securities or derivative contracts of the issuer or comparable issuers, movement of a relevant index, or other factors including but not limited to industry changes and relevant government actions. |
| ■ | With respect to securities traded principally in foreign markets, significant trends in U.S. equity markets or in the trading of foreign securities index futures contracts; |
| ■ | Political or other developments affecting the economy or markets in which an issuer conducts its operations or its securities are traded; |
| ■ | Announcements concerning matters such as acquisitions, recapitalizations, litigation developments, or a natural disaster affecting the issuer's operations or regulatory changes or market developments affecting the issuer's industry. |
| Transfer Agent Fees Incurred | Transfer Agent Fees Waived by Unaffiliated Third Parties | |
| Class A Shares | $281,385 | $(50,012) |
| Class B Shares | 47,256 | (4,927) |
| Class C Shares | 148,263 | (47,854) |
| Class R Shares | 213,560 | (23,512) |
| Institutional Shares | 99,976 | (35,624) |
| TOTAL | $790,440 | $(161,929) |
| Other Service Fees Incurred | |
| Class A Shares | $481,543 |
| Class B Shares | 59,307 |
| Class C Shares | 214,385 |
| TOTAL | $755,235 |
| Security | Acquisition Date | Cost | Market Value |
| Regional Diversified Funding, Series 144A, 9.250%, 03/15/2030 | 3/10/2000 | $157,264 | $83,197 |
| Union Central Life Ins Co, Note, Series 144A, 8.200%, 11/01/2026 | 3/31/1999 | $790,785 | $991,085 |
| Fair Value of Derivative Instruments | ||||
| Asset | Liability | |||
| Statement of Assets and Liabilities Location | Fair Value | Statement of Assets and Liabilities Location | Fair Value | |
| Derivatives not accounted for as hedging instruments under ASC Topic 815 | ||||
| Interest rate contracts | — | $— | Payable for daily variation margin on futures | $97,946* |
| Fair Value of Derivative Instruments | ||||
| Asset | Liability | |||
| Statement of Assets and Liabilities Location | Fair Value | Statement of Assets and Liabilities Location | Fair Value | |
| Equity contracts | — | $— | Payable for variation margin on futures | $(1,751,419)* |
| Foreign exchange contracts | Unrealized appreciation on foreign exchange contracts | $1,850,688 | Unrealized depreciation on foreign exchange contracts | $1,967,563 |
| Total derivatives not accounted for as hedging instruments under ASC Topic 815 | $1,850,688 | $314,090 | ||
| * | Includes cumulative appreciation/depreciation of futures contracts as reported in the footnotes to the Portfolio of Investments. Only the current day's variation margin is reported within the Statement of Assets and Liabilities. |
| Amount of Realized Gain or (Loss) on Derivatives Recognized in Income | ||||
| Futures Contracts | Forward Exchange Contracts | Purchased Option Contracts | Total | |
| Interest rate contracts | $85,926 | $— | $— | $85,926 |
| Foreign exchange contracts | — | 3,947,130 | (97,988) | 3,849,142 |
| Equity contracts | (4,883,013) | — | — | (4,883,013) |
| TOTAL | $(4,797,087) | $3,947,130 | $(97,988) | $(947,945) |
| Change in Unrealized Appreciation or (Depreciation) on Derivatives Recognized in Income | |||
| Futures Contracts | Forward Exchange Contracts | Total | |
| Interest rate contracts | $(20,363) | $— | $(20,363) |
| Foreign exchange contracts | — | (628,115) | (628,115) |
| Equity contracts | (2,907,971) | — | (2,907,971) |
| TOTAL | $(2,928,334) | $(628,115) | $(3,556,449) |
| Gross Amounts Not Offset in the Statement of Assets and Liabilities | ||||
| Transaction | Gross Asset Derivatives Presented in Statement of Assets and Liabilities | Financial Instruments | Collateral Received | Net Amount (not less than $0) |
| Foreign exchange contracts | $1,850,688 | $(2,603,697) | $— | $(213,009) |
| TOTAL | $1,850,688 | $(2,603,697) | $— | $(213,009) |
| Transaction | Gross Liability Derivatives Presented in Statement of Assets and Liabilities | Financial Instruments | Collateral Received | Net Amount (not less than $0) |
| Foreign exchange contracts | $1,967,563 | $(2,603,697) | $— | $(96,134) |
| TOTAL | $1,967,563 | $(2,603,697) | $— | $(96,134) |
| Year Ended November 30 | 2015 | 2014 | ||
| Class A Shares: | Shares | Amount | Shares | Amount |
| Shares sold | 2,138,430 | $39,609,988 | 1,271,707 | $24,983,624 |
| Shares issued to shareholders in payment of distributions declared | 931,229 | 17,079,639 | 1,077,269 | 20,848,247 |
| Shares redeemed | (2,257,896) | (41,553,323) | (1,704,879) | (33,509,425) |
| NET CHANGE RESULTING FROM CLASS A SHARE TRANSACTIONS | 811,763 | $15,136,304 | 644,097 | $12,322,446 |
| Year Ended November 30 | 2015 | 2014 | ||
| Class B Shares: | Shares | Amount | Shares | Amount |
| Shares sold | 166,063 | $3,010,179 | 144,477 | $2,789,113 |
| Shares issued to shareholders in payment of distributions declared | 121,434 | 2,179,856 | 172,063 | 3,273,298 |
| Shares redeemed | (377,949) | (6,851,605) | (447,961) | (8,651,857) |
| NET CHANGE RESULTING FROM CLASS B SHARE TRANSACTIONS | (90,452) | $(1,661,570) | (131,421) | $(2,589,446) |
| Year Ended November 30 | 2015 | 2014 | ||
| Class C Shares: | Shares | Amount | Shares | Amount |
| Shares sold | 2,094,560 | $37,590,508 | 1,353,586 | $26,117,531 |
| Shares issued to shareholders in payment of distributions declared | 386,550 | 6,915,927 | 409,657 | 7,768,862 |
| Shares redeemed | (1,447,890) | (25,984,851) | (1,022,069) | (19,706,161) |
| NET CHANGE RESULTING FROM CLASS C SHARE TRANSACTIONS | 1,033,220 | $18,521,584 | 741,174 | $14,180,232 |
| Year Ended November 30 | 2015 | 2014 | ||
| Class R Shares: | Shares | Amount | Shares | Amount |
| Shares sold | 807,794 | $14,882,182 | 859,978 | $16,854,161 |
| Shares issued to shareholders in payment of distributions declared | 327,830 | 5,976,139 | 395,870 | 7,623,369 |
| Shares redeemed | (1,150,660) | (21,202,613) | (1,070,155) | (20,977,412) |
| NET CHANGE RESULTING FROM CLASS R SHARE TRANSACTIONS | (15,036) | $(344,292) | 185,693 | $3,500,118 |
| Year Ended November 30 | 2015 | 2014 | ||
| Institutional Shares: | Shares | Amount | Shares | Amount |
| Shares sold | 4,247,690 | $78,578,131 | 1,009,592 | $19,935,626 |
| Shares issued to shareholders in payment of distributions declared | 313,172 | 5,764,682 | 271,859 | 5,284,523 |
| Shares redeemed | (1,219,122) | (22,370,979) | (463,970) | (9,199,077) |
| NET CHANGE RESULTING FROM INSTITUTIONAL SHARE TRANSACTIONS | 3,341,740 | $61,971,834 | 817,481 | $16,021,072 |
| NET CHANGE RESULTING FROM TOTAL FUND SHARE TRANSACTIONS | 5,081,235 | $93,623,860 | 2,257,024 | $43,434,422 |
| Increase (Decrease) | ||
| Paid-In Capital | Undistributed Net Investment Income (Loss) | Accumulated Net Realized Gain (Loss) |
| $(1,106) | $(1,582,926) | $1,584,032 |
| 2015 | 2014 | |
| Ordinary income1 | $10,734,944 | $18,488,219 |
| Long-term capital gains | $29,313,561 | $28,765,158 |
| 1 | For tax purposes, short-term capital gain distributions are considered as ordinary income distributions. |
| Undistributed ordinary income | $1,576,458 |
| Undistributed long-term capital gains | $156,650 |
| Net unrealized appreciation | $6,362,994 |
| Capital loss carryforwards | $(3,397,045) |
| Expiration Year | Short-Term | Long-Term | Total |
| 2018 | $3,397,045 | NA | $3,397,045 |
| Administrative Fee | Average Daily Net Assets of the Investment Complex |
| 0.150% | on the first $5 billion |
| 0.125% | on the next $5 billion |
| 0.100% | on the next $10 billion |
| 0.075% | on assets in excess of $20 billion |
| Share Class Name | Percentage of Average Daily Net Assets of Class |
| Class B Shares | 0.75% |
| Class C Shares | 0.75% |
| Class R Shares | 0.50% |
| Distribution Services Fees Incurred | |
| Class B Shares | $177,922 |
| Class C Shares | 643,155 |
| Class R Shares | 318,865 |
| TOTAL | $1,139,942 |
| Emerging Markets Fixed Income Core Fund | Federated Bank Loan Core Fund | Federated Mortgage Core Portfolio | Federated Prime Value Obligations Fund, Institutional Shares | Federated Project and Trade Finance Core Fund | High Yield Bond Portfolio | Total of Affiliated Transactions | |
| Balance of Shares Held 11/30/2014 | 1,389,580 | — | 676,871 | 53,040,222 | 656,892 | 873,938 | 56,637,503 |
| Purchases/Additions | 680,365 | 637,277 | 2,183,204 | 201,289,761 | 869,311 | 3,064,269 | 208,724,187 |
| Sales/ Reductions | (745,443) | (302,419) | (940,460) | (254,329,983) | — | (1,718,055) | (258,036,360) |
| Balance of Shares Held 11/30/2015 | 1,324,502 | 334,858 | 1,919,615 | — | 1,526,203 | 2,220,152 | 7,325,330 |
| Value | $45,557,365 | $3,288,309 | $18,984,988 | $— | $14,269,998 | $13,298,709 | $95,399,369 |
| Dividend Income/ Allocated Investment Income | $2,128,788 | $113,515 | $520,107 | $28,307 | $487,033 | $881,658 | $4,159,408 |
| Realized Gain Distribution/Allocated Net Realized Gain (Loss) | $(2,876,851) | $— | $— | $— | $— | $85,779 | $(2,791,072) |
| Purchases | $376,757,795 |
| Sales | $288,743,198 |
January 25, 2016
| Beginning Account Value 6/1/2015 | Ending Account Value 11/30/2015 | Expenses Paid During Period1 | |
| Actual: | |||
| Class A Shares | $1,000 | $955.00 | $5.78 |
| Class B Shares | $1,000 | $951.10 | $9.68 |
| Class C Shares | $1,000 | $951.20 | $9.39 |
| Class R Shares | $1,000 | $952.50 | $7.83 |
| Institutional Shares | $1,000 | $956.60 | $4.32 |
| Hypothetical (assuming a 5% return before expenses): | |||
| Class A Shares | $1,000 | $1,019.15 | $5.97 |
| Class B Shares | $1,000 | $1,015.14 | $10.00 |
| Class C Shares | $1,000 | $1,015.44 | $9.70 |
| Class R Shares | $1,000 | $1,017.05 | $8.09 |
| Institutional Shares | $1,000 | $1,020.66 | $4.46 |
| 1 | Expenses are equal to the Fund's annualized net expense ratios, multiplied by the average account value over the period, multiplied by 183/365 (to reflect the one-half-year period). The annualized net expense ratios are as follows: |
| Class A Shares | 1.18% |
| Class B Shares | 1.98% |
| Class C Shares | 1.92% |
| Class R Shares | 1.60% |
| Institutional Shares | 0.88% |
| Name Birth Date Positions Held with Trust Date Service Began | Principal Occupation(s) for Past Five Years, Other Directorships Held and Previous Position(s) |
| John F. Donahue* Birth Date: July 28, 1924 Trustee Indefinite Term Began serving: December 1956 | Principal Occupations: Director or Trustee of the Federated Fund Family; Chairman and Director, Federated Investors, Inc.; Chairman of the Federated Fund Family's Executive Committee. Previous Positions: Chairman of the Federated Fund Family; Trustee, Federated Investment Management Company; Chairman and Director, Federated Investment Counseling. |
| J. Christopher Donahue* Birth Date: April 11, 1949 President and Trustee Indefinite Term Began serving: November 1998 | Principal Occupations: Principal Executive Officer and President of certain of the Funds in the Federated Fund Family; Director or Trustee of the Funds in the Federated Fund Family; President, Chief Executive Officer and Director, Federated Investors, Inc.; Chairman and Trustee, Federated Investment Management Company; Trustee, Federated Investment Counseling; Chairman and Director, Federated Global Investment Management Corp.; Chairman, Federated Equity Management Company of Pennsylvania and Passport Research, Ltd. (investment advisory subsidiary of Federated); Trustee, Federated Shareholder Services Company; Director, Federated Services Company. Previous Positions: President, Federated Investment Counseling; President and Chief Executive Officer, Federated Investment Management Company, Federated Global Investment Management Corp. and Passport Research, Ltd. |
| * | Family relationships and reasons for “interested” status: John F. Donahue is the father of J. Christopher Donahue; both are “interested” due to their beneficial ownership of shares of Federated Investors, Inc. and the positions they hold with Federated and its subsidiaries. |
| Name Birth Date Positions Held with Trust Date Service Began | Principal Occupation(s) for Past Five Years, Other Directorships Held, Previous Position(s) and Qualifications |
| John T. Collins Birth Date: January 24, 1947 Trustee Indefinite Term Began serving: October 2013 | Principal Occupations: Director or Trustee of the Federated Fund Family; Retired. Other Directorships Held: Director, Chair of the Compensation Committee, Audit Committee member, KLX Corp. Qualifications: Mr. Collins has served in several business and financial management roles and directorship positions throughout his career. Mr. Collins previously served as Chairman and CEO, The Collins Group, Inc. (a private equity firm). Mr. Collins serves as Chairman Emeriti, Bentley University. Mr. Collins previously served as Director, FleetBoston Financial Corp.; Director and Audit Committee Member, Bank of America Corp. and Director, Beth Israel Deaconess Medical Center (Harvard University Affiliate Hospital). |
| G. Thomas Hough Birth Date: February 28, 1955 Trustee Indefinite Term Began serving: August 2015 | Principal Occupations: Director or Trustee of the Federated Fund Family; Retired. Other Directorships Held: Director, Chair of the Audit Committee, Governance Committee, Publix Super Markets, Inc. Qualifications: Mr. Hough has served in accounting, business management and directorship positions throughout his career. Mr. Hough most recently held the position of Americas Vice Chair of Assurance with Ernst & Young LLP. Mr. Hough is an Executive Committee member of the United States Golf Association, he serves on the President's Cabinet and Business School Board of Visitors for the University of Alabama and is on the Business School Board of Visitors for Wake Forest University. |
| Maureen Lally-Green Birth Date: July 5, 1949 Trustee Indefinite Term Began serving: August 2009 | Principal Occupations: Director or Trustee of the Federated Fund Family; Adjunct Professor of Law, Duquesne University School of Law. Other Directorships Held: Director, CONSOL Energy Inc. Qualifications: Judge Lally-Green has served in various legal and business roles and directorship positions throughout her career. Judge Lally-Green previously served as: Associate General Secretary, Diocese of Pittsburgh; a member of the Superior Court of Pennsylvania; and as a Professor of Law, Duquesne University School of Law. Judge Lally-Green also holds the positions on either a public or not for profit Board of Directors as follows: Member, Pennsylvania State Board of Education (public); Director and Chair, UPMC Mercy Hospital; Regent, St. Vincent Seminary; Director, Epilepsy Foundation of Western and Central Pennsylvania; Director and Vice Chair, Our Campaign for the Church Alive!, Inc.; Director, Saint Vincent College; Director, Pennsylvania Bar Institute; and Director and Chair, Cardinal Wuerl North Catholic High School, Inc. Judge Lally-Green has held the positions of: Director, Auberle; Director, Ireland Institute of Pittsburgh; Director, Saint Thomas More Society; and Director, Catholic High Schools of the Diocese of Pittsburgh, Inc. |
| Name Birth Date Positions Held with Trust Date Service Began | Principal Occupation(s) for Past Five Years, Other Directorships Held, Previous Position(s) and Qualifications |
| Peter E. Madden Birth Date: March 16, 1942 Trustee Indefinite Term Began serving: August 1991 | Principal Occupation: Director or Trustee, and Chair of the Board of Directors or Trustees, of the Federated Fund Family; Retired. Other Directorships Held: None. Qualifications: Mr. Madden has served in several business management, mutual fund services and directorship positions throughout his career. Mr. Madden previously served as President, Chief Operating Officer and Director, State Street Bank and Trust Company (custodian bank) and State Street Corporation (financial services). He was Director, VISA USA and VISA International and Chairman and Director, Massachusetts Bankers Association. Mr. Madden served as Director, Depository Trust Corporation and Director, The Boston Stock Exchange. Mr. Madden also served as a Representative to the Commonwealth of Massachusetts General Court. |
| Charles F. Mansfield, Jr. Birth Date: April 10, 1945 Trustee Indefinite Term Began serving: November 1998 | Principal Occupations: Director or Trustee of the Federated Fund Family; Management Consultant. Other Directorships Held: None. Qualifications: Mr. Mansfield has served in several banking, business management and educational roles and directorship positions throughout his career. Mr. Mansfield previously served as Chief Executive Officer, PBTC International Bank; Partner, Arthur Young & Company (now Ernst & Young LLP); Chief Financial Officer of Retail Banking Sector, Chase Manhattan Bank; Senior Vice President, HSBC Bank USA (formerly, Marine Midland Bank); Vice President, Citibank; Assistant Professor of Banking and Finance, Frank G. Zarb School of Business, Hofstra University; Executive Vice President DVC Group, Inc. (marketing, communications and technology). |
| Thomas M. O'Neill Birth Date: June 14, 1951 Trustee Indefinite Term Began serving: October 2006 | Principal Occupations: Director or Trustee, Chair of the Audit Committee of the Federated Fund Family; Sole Proprietor, Navigator Management Company (investment and strategic consulting). Other Directorships Held: None. Qualifications: Mr. O'Neill has served in several business, mutual fund and financial management roles and directorship positions throughout his career. Mr. O'Neill serves as Director, Medicines for Humanity and Director, The Golisano Children's Museum of Naples, Florida. Mr. O'Neill previously served as Chief Executive Officer and President, Managing Director and Chief Investment Officer, Fleet Investment Advisors; President and Chief Executive Officer, Aeltus Investment Management, Inc.; General Partner, Hellman, Jordan Management Co., Boston, MA; Chief Investment Officer, The Putnam Companies, Boston, MA; Credit Analyst and Lending Officer, Fleet Bank; Director and Consultant, EZE Castle Software (investment order management software); and Director, Midway Pacific (lumber). |
| Name Birth Date Positions Held with Trust Date Service Began | Principal Occupation(s) for Past Five Years, Other Directorships Held, Previous Position(s) and Qualifications |
| P. Jerome Richey Birth Date: February 23, 1949 Trustee Indefinite Term Began serving: October 2013 | Principal Occupations: Director or Trustee of the Federated Fund Family; Management Consultant. Other Directorships Held: None. Qualifications: Mr. Richey has served in several business and legal management roles and directorship positions throughout his career. Mr. Richey most recently held the positions of Senior Vice Chancellor and Chief Legal Officer, University of Pittsburgh. Mr. Richey serves as Board Member, Epilepsy Foundation of Western Pennsylvania and Board member, World Affairs Council of Pittsburgh. Mr. Richey previously served as Chief Legal Officer and Executive Vice President, CONSOL Energy Inc. and Shareholder, Buchanan Ingersoll & Rooney PC (a law firm). |
| John S. Walsh Birth Date: November 28, 1957 Trustee Indefinite Term Began serving: November 1998 | Principal Occupations: Director or Trustee of the Federated Fund Family; President and Director, Heat Wagon, Inc. (manufacturer of construction temporary heaters); President and Director, Manufacturers Products, Inc. (distributor of portable construction heaters); President, Portable Heater Parts, a division of Manufacturers Products, Inc. Other Directorships Held: None. Qualifications: Mr. Walsh has served in several business management roles and directorship positions throughout his career. Mr. Walsh previously served as Vice President, Walsh & Kelly, Inc. (paving contractors). |
| Name Birth Date Address Positions Held with Trust Date Service Began | Principal Occupation(s) for Past Five Years and Previous Position(s) |
| John W. McGonigle Birth Date: October 26, 1938 EXECUTIVE VICE PRESIDENT AND SECRETARY Officer since: September 1969 | Principal Occupations: Executive Vice President and Secretary of the Federated Fund Family; Vice Chairman, Executive Vice President, Secretary and Director, Federated Investors, Inc. Previous Positions: Trustee, Federated Investment Management Company and Federated Investment Counseling; Director, Federated Global Investment Management Corp., Federated Services Company and Federated Securities Corp. |
| Name Birth Date Address Positions Held with Trust Date Service Began | Principal Occupation(s) for Past Five Years and Previous Position(s) |
| Lori A. Hensler Birth Date: January 6, 1967 TREASURER Officer since: April 2013 | Principal Occupations: Principal Financial Officer and Treasurer of the Federated Fund Family; Senior Vice President, Federated Administrative Services; Financial and Operations Principal for Federated Securities Corp. and Edgewood Services, Inc.; and Assistant Treasurer, Federated Investors Trust Company. Ms. Hensler has received the Certified Public Accountant designation. Previous Positions: Controller of Federated Investors, Inc.; Senior Vice President and Assistant Treasurer, Federated Investors Management Company; Treasurer, Federated Investors Trust Company; Assistant Treasurer, Federated Administrative Services, Federated Administrative Services, Inc., Federated Securities Corp., Edgewood Services, Inc., Federated Advisory Services Company, Federated Equity Management Company of Pennsylvania, Federated Global Investment Management Corp., Federated Investment Counseling, Federated Investment Management Company, Passport Research, Ltd., and Federated MDTA, LLC; Financial and Operations Principal for Federated Securities Corp., Edgewood Services, Inc. and Southpointe Distribution Services, Inc. |
| Peter J. Germain Birth Date: September 3, 1959 CHIEF LEGAL OFFICER Officer since: January 2005 | Principal Occupations: Mr. Germain is Chief Legal Officer of the Federated Fund Family. He is General Counsel and Vice President, Federated Investors, Inc.; President, Federated Administrative Services and Federated Administrative Services, Inc.; Vice President, Federated Securities Corp.; Secretary, Federated Private Asset Management, Inc.; and Secretary, Retirement Plan Service Company of America. Mr. Germain joined Federated in 1984 and is a member of the Pennsylvania Bar Association. Previous Positions: Deputy General Counsel, Special Counsel, Managing Director of Mutual Fund Services, Federated Investors, Inc.; Senior Vice President, Federated Services Company; and Senior Corporate Counsel, Federated Investors, Inc. |
| Richard B. Fisher Birth Date: May 17, 1923 VICE PRESIDENT Officer since: May 1976 | Principal Occupations: Vice Chairman or Vice President of some of the Funds in the Federated Fund Family; Vice Chairman, Federated Investors, Inc.; Chairman, Federated Securities Corp. Previous Positions: President and Director or Trustee of some of the Funds in the Federated Fund Family; Executive Vice President, Federated Investors, Inc.; Director and Chief Executive Officer, Federated Securities Corp. |
| Stephen Van Meter Birth Date: June 5, 1975 CHIEF COMPLIANCE OFFICER AND SENIOR VICE PRESIDENT Officer since: July 2015 | Principal Occupations: Senior Vice President and Chief Compliance Officer of the Federated Fund Family; Vice President and Chief Compliance Officer of Federated Investors, Inc. and Chief Compliance Officer of certain of its subsidiaries. Mr. Van Meter joined Federated in October 2011. He holds FINRA licenses under Series 3, 7, 24 and 66. Previous Positions: Mr. Van Meter previously held the position of Compliance Operating Officer, Federated Investors, Inc. Prior to joining Federated, Mr. Van Meter served at the United States Securities and Exchange Commission in the positions of Senior Counsel, Office of Chief Counsel, Division of Investment Management and Senior Counsel, Division of Enforcement. |
| Name Birth Date Address Positions Held with Trust Date Service Began | Principal Occupation(s) for Past Five Years and Previous Position(s) |
| Stephen F. Auth Birth Date: September 3, 1956 101 Park Avenue 41st Floor New York, NY 10178 CHIEF INVESTMENT OFFICER Officer since: November 2002 | Principal Occupations: Stephen F. Auth is Chief Investment Officer of various Funds in the Federated Fund Family; Executive Vice President, Federated Investment Counseling, Federated Global Investment Management Corp. and Federated Equity Management Company of Pennsylvania. Previous Positions: Executive Vice President, Federated Investment Management Company and Passport Research, Ltd. (investment advisory subsidiary of Federated); Senior Vice President, Global Portfolio Management Services Division; Senior Vice President, Federated Investment Management Company and Passport Research, Ltd.; Senior Managing Director and Portfolio Manager, Prudential Investments. |

4000 Ericsson Drive
Warrendale, PA 15086-7561
or call 1-800-341-7400.
CUSIP 314183203
CUSIP 314183302
CUSIP 314183401
CUSIP 314183500
2016 ©Federated Investors, Inc.
Item 2. Code of Ethics
(a) As of the end of the period covered by this report, the registrant has adopted a code of ethics (the "Section 406 Standards for Investment Companies - Ethical Standards for Principal Executive and Financial Officers") that applies to the registrant's Principal Executive Officer and Principal Financial Officer; the registrant's Principal Financial Officer also serves as the Principal Accounting Officer.
(c) There was no amendment to the registrant’s code of ethics described in Item 2(a) above during the period covered by the report.
(d) There was no waiver granted, either actual or implicit, from a provision to the registrant’s code of ethics described in Item 2(a) above during the period covered by the report.
(e) Not Applicable
(f)(3) The registrant hereby undertakes to provide any person, without charge, upon request, a copy of the code of ethics. To request a copy of the code of ethics, contact the registrant at 1-800-341-7400, and ask for a copy of the Section 406 Standards for Investment Companies - Ethical Standards for Principal Executive and Financial Officers.
Item 3. Audit Committee Financial Expert
The registrant's Board has determined that each of the following members of the Board's Audit Committee is an “audit committee financial expert,” and is "independent," for purposes of this Item: John T. Collins and Thomas M. O'Neill.
Item 4. Principal Accountant Fees and Services
(a) Audit Fees billed to the registrant for the two most recent fiscal years:
Fiscal year ended 2015 - $31,180
Fiscal year ended 2014 - $30,300
(b) Audit-Related Fees billed to the registrant for the two most recent fiscal years:
Fiscal year ended 2015 - $0
Fiscal year ended 2014 - $0
Amount requiring approval of the registrant’s audit committee pursuant to paragraph (c)(7)(ii) of Rule 2-01 of Regulation S-X, $0 and $0 respectively.
(c) Tax Fees billed to the registrant for the two most recent fiscal years:
Fiscal year ended 2015 - $0
Fiscal year ended 2014 - $0
Amount requiring approval of the registrant’s audit committee pursuant to paragraph (c)(7)(ii) of Rule 2-01 of Regulation S-X, $0 and $0 respectively.
(d) All Other Fees billed to the registrant for the two most recent fiscal years:
Fiscal year ended 2015 - $0
Fiscal year ended 2014 - $0
Amount requiring approval of the registrant’s audit committee pursuant to paragraph (c)(7)(ii) of Rule 2-01 of Regulation S-X, $0 and $0 respectively.
(e)(1) Audit Committee Policies regarding Pre-approval of Services.
The Audit Committee is required to pre-approve audit and non-audit services performed by the independent auditor in order to assure that the provision of such services do not impair the auditor’s independence. Unless a type of service to be provided by the independent auditor has received general pre-approval, it will require specific pre-approval by the Audit Committee. Any proposed services exceeding pre-approved cost levels will require specific pre-approval by the Audit Committee.
Certain services have the general pre-approval of the Audit Committee. The term of the general pre-approval is 12 months from the date of pre-approval, unless the Audit Committee specifically provides for a different period. The Audit Committee will annually review the services that may be provided by the independent auditor without obtaining specific pre-approval from the Audit Committee and may grant general pre-approval for such services. The Audit Committee will revise the list of general pre-approved services from time to time, based on subsequent determinations. The Audit Committee will not delegate its responsibilities to pre-approve services performed by the independent auditor to management.
The Audit Committee has delegated pre-approval authority to its Chairman. The Chairman will report any pre-approval decisions to the Audit Committee at its next scheduled meeting. The Committee will designate another member with such pre-approval authority when the Chairman is unavailable.
AUDIT SERVICES
The annual Audit services engagement terms and fees will be subject to the specific pre-approval of the Audit Committee. The Audit Committee must approve any changes in terms, conditions and fees resulting from changes in audit scope, registered investment company (RIC) structure or other matters.
In addition to the annual Audit services engagement specifically approved by the Audit Committee, the Audit Committee may grant general pre-approval for other Audit Services, which are those services that only the independent auditor reasonably can provide. The Audit Committee has pre-approved certain Audit services, all other Audit services must be specifically pre-approved by the Audit Committee.
AUDIT-RELATED SERVICES
Audit-related services are assurance and related services that are reasonably related to the performance of the audit or review of the Company’s financial statements or that are traditionally performed by the independent auditor. The Audit Committee believes that the provision of Audit-related services does not impair the independence of the auditor, and has pre-approved certain Audit-related services, all other Audit-related services must be specifically pre-approved by the Audit Committee.
TAX SERVICES
The Audit Committee believes that the independent auditor can provide Tax services to the Company such as tax compliance, tax planning and tax advice without impairing the auditor’s independence. However, the Audit Committee will not permit the retention of the independent auditor in connection with a transaction initially recommended by the independent auditor, the purpose of which may be tax avoidance and the tax treatment of which may not be supported in the Internal Revenue Code and related regulations. The Audit Committee has pre-approved certain Tax services, all Tax services involving large and complex transactions must be specifically pre-approved by the Audit Committee.
ALL OTHER SERVICES
With respect to the provision of services other than audit, review or attest services the pre-approval requirement is waived if:
| (1) | The aggregate amount of all such services provided constitutes no more than five percent of the total amount of revenues paid by the registrant, the registrant’s adviser (not including any sub-adviser whose role is primarily portfolio management and is subcontracted with or overseen by another investment adviser), and any entity controlling, controlled by, or under common control with the investment adviser that provides ongoing services to the registrant to its accountant during the fiscal year in which the services are provided; |
| (2) | Such services were not recognized by the registrant, the registrant’s adviser (not including any sub-adviser whose role is primarily portfolio management and is subcontracted with or overseen by another investment adviser), and any entity controlling, controlled by, or under common control with the investment adviser that provides ongoing services to the registrant at the time of the engagement to be non-audit services; and |
| (3) | Such services are promptly brought to the attention of the Audit Committee of the issuer and approved prior to the completion of the audit by the Audit Committee or by one or more members of the Audit Committee who are members of the board of directors to whom authority to grant such approvals has been delegated by the Audit Committee. |
The Audit Committee may grant general pre-approval to those permissible non-audit services classified as All Other services that it believes are routine and recurring services, and would not impair the independence of the auditor.
The SEC’s rules and relevant guidance should be consulted to determine the precise definitions of prohibited non-audit services and the applicability of exceptions to certain of the prohibitions.
PRE-APPROVAL FEE LEVELS
Pre-approval fee levels for all services to be provided by the independent auditor will be established annually by the Audit Committee. Any proposed services exceeding these levels will require specific pre-approval by the Audit Committee.
PROCEDURES
Requests or applications to provide services that require specific approval by the Audit Committee will be submitted to the Audit Committee by both the independent auditor and the Principal Accounting Officer and/or Internal Auditor, and must include a joint statement as to whether, in their view, the request or application is consistent with the SEC’s rules on auditor independence.
(e)(2) Percentage of services identified in items 4(b) through 4(d) that were approved by the registrants audit committee pursuant to paragraph (c)(7)(i)(C) of Rule 2-01 of Regulation S-X:
4(b)
Fiscal year ended 2015– 0%
Fiscal year ended 2014- 0%
Percentage of services provided to the registrants investment adviser and any entity controlling, controlled by, or under common control with the investment adviser that provides ongoing services to the registrant that were approved by the registrants audit committee pursuant to paragraph (c)(7)(i)(C) of Rule 2-01 of Regulation S-X, 0% and 0% respectively.
4(c)
Fiscal year ended 2015– 0%
Fiscal year ended 2014– 0%
Percentage of services provided to the registrants investment adviser and any entity controlling, controlled by, or under common control with the investment adviser that provides ongoing services to the registrant that were approved by the registrants audit committee pursuant to paragraph (c)(7)(i)(C) of Rule 2-01 of Regulation S-X, 0% and 0% respectively.
4(d)
Fiscal year ended 2015– 0%
Fiscal year ended 2014– 0%
Percentage of services provided to the registrants investment adviser and any entity controlling, controlled by, or under common control with the investment adviser that provides ongoing services to the registrant that were approved by the registrants audit committee pursuant to paragraph (c)(7)(i)(C) of Rule 2-01 of Regulation S-X, 0% and 0% respectively.
| (f) | NA |
| (g) | Non-Audit Fees billed to the registrant, the registrant’s investment adviser, and certain entities controlling, controlled by or under common control with the investment adviser: |
Fiscal year ended 2015- $0
Fiscal year ended 2014- $20,081
(h) The registrant’s Audit Committee has considered that the provision of non-audit services that were rendered to the registrant’s adviser (not including any sub-adviser whose role is primarily portfolio management and is subcontracted with or overseen by another investment adviser), and any entity controlling, controlled by, or under common control with the investment adviser that provides ongoing services to the registrant that were not pre-approved pursuant to paragraph (c)(7)(ii) of Rule 2-01 of Regulation S-X is compatible with maintaining the principal accountant’s independence.
Item 5. Audit Committee of Listed Registrants
Not Applicable
Item 6. Schedule of Investments
(a) The registrant’s Schedule of Investments is included as part of the Report to Stockholders filed under Item 1 of this form.
(b) Not Applicable; Fund had no divestments during the reporting period covered since the previous Form N-CSR filing.
Item 7. Disclosure of Proxy Voting Policies and Procedures for Closed-End Management Investment Companies
| Not Applicable |
Item 8. Portfolio Managers of Closed-End Management Investment Companies
| Not Applicable |
Item 9. Purchases of Equity Securities by Closed-End Management Investment Company and Affiliated Purchasers
| Not Applicable |
Item 10. Submission of Matters to a Vote of Security Holders
No Changes to Report
Item 11. Controls and Procedures
(a) The registrant’s President and Treasurer have concluded that the
registrant’s disclosure controls and procedures (as defined in rule 30a-3(c) under the Act) are effective in design and operation and are sufficient to form the basis of the certifications required by Rule 30a-(2) under the Act, based on their evaluation of these disclosure controls and procedures within 90 days of the filing date of this report on Form N-CSR.
(b) There were no changes in the registrant’s internal control over financial reporting (as defined in rule 30a-3(d) under the Act) during the second fiscal quarter of the period covered by this report that have materially affected, or are reasonably likely to materially affect, the registrant’s internal control over financial reporting.
Item 12. Exhibits
(a)(1) Code of Ethics- Not Applicable to this Report.
(a)(2) Certifications of Principal Executive Officer and Principal Financial Officer.
(a)(3) Not Applicable.
(b) Certifications pursuant to 18 U.S.C. Section 1350.
SIGNATURES
Pursuant to the requirements of the Securities Exchange Act of 1934 and the Investment Company Act of 1940, the registrant has duly caused this report to be signed on its behalf by the undersigned, thereunto duly authorized.
Registrant Federated Global Allocation Fund
By /S/ Lori A. Hensler
Lori A. Hensler, Principal Financial Officer
Date January 25, 2016
Pursuant to the requirements of the Securities Exchange Act of 1934 and the Investment Company Act of 1940, this report has been signed below by the following persons on behalf of the registrant and in the capacities and on the dates indicated.
By /S/ J. Christopher Donahue
J. Christopher Donahue, Principal Executive Officer
Date January 25, 2016
By /S/ Lori A. Hensler
Lori A. Hensler, Principal Financial Officer
Date January 25, 2016