United States
Securities and Exchange Commission
Washington, D.C. 20549
Form N-CSR
Certified Shareholder Report of Registered Management Investment Companies
811-1
(Investment Company Act File Number)
Federated Hermes Global Allocation Fund
_______________________________________________________________
(Exact Name of Registrant as Specified in Charter)
Federated Hermes Funds
4000 Ericsson Drive
Warrendale, Pennsylvania 15086-7561
(Address of Principal Executive Offices)
(412) 288-1900
(Registrant's Telephone Number)
Peter J. Germain, Esquire
1001 Liberty Avenue
Pittsburgh, Pennsylvania 15222-3779
(Name and Address of Agent for Service)
(Notices should be sent to the Agent for Service)
Date of Fiscal Year End: 11/30/22
Date of Reporting Period: 11/30/22
| Item 1. | Reports to Stockholders |

Share Class | Ticker | A | FSTBX | B | FSBBX | C | FSBCX |
R | FSBKX | Institutional | SBFIX | R6 | FSBLX |
Federated Hermes Global Allocation Fund
Dear Valued Shareholder,

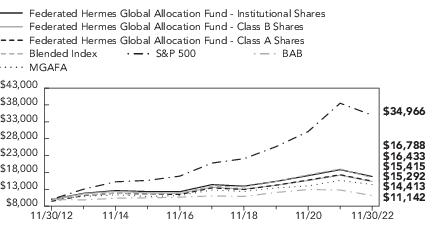
1 Year | 5 Years | 10 Years | |
Class A Shares | -15.89% | 1.69% | 4.42% |
Class B Shares | -15.91% | 1.70% | 4.34% |
Class C Shares | -12.43% | 2.06% | 4.38% |
Class R Shares | -11.37% | 2.41% | 4.57% |
Institutional Shares | -10.72% | 3.15% | 5.32% |
Class R6 Shares6 | -10.67% | 3.18% | 5.23% |
Blended Index | -13.54% | 3.38% | 5.09% |
S&P 500 | -9.23% | 10.98% | 13.34% |
BAB | -12.84% | 0.21% | 1.09% |
MGAFA | -7.72% | 2.95% | 4.45% |
Security Type | Percentage of Total Net Assets |
Domestic Equity Securities | 34.2% |
International Equity Securities | 19.5% |
Emerging Markets Core Fund | 8.7% |
Foreign Debt Securities | 7.0% |
Mortgage Core Fund | 6.9% |
Corporate Debt Securities | 6.7% |
U.S. Treasuries | 5.3% |
Project and Trade Finance Core Fund | 1.4% |
Asset-Backed Securities | 1.0% |
High Yield Bond Core Fund2 | 0.8% |
Collateralized Mortgage-Backed Securities | 0.4% |
Government Agencies | 0.2% |
Bank Loan Core Fund | 0.1% |
Cash Equivalents3 | 7.5% |
Derivative Contracts4 | 0.0% |
Mortgage-Backed Securities5 | 0.0% |
Other Assets and Liabilities—Net6 | 0.3% |
TOTAL | 100.0% |
1 | See the Fund’s Prospectus and Statement of Additional Information for a description of these security types. |
2 | The High Yield Bond Core Fund is a diversified portfolio of below investment grade bonds. |
3 | Cash Equivalents include any investments in money market mutual funds and/or overnight repurchase agreements. |
4 | Based upon net unrealized appreciation (depreciation) or value of the derivative contracts as applicable. Derivative contracts may consist of futures, forwards, options and swaps. The impact of a derivative contract on the Fund’s performance may be larger than its unrealized appreciation (depreciation) or value may indicate. In many cases, the notional value or amount of a derivative contract may provide a better indication of the contract’s significance to the portfolio. More complete information regarding the Fund’s direct investments in derivative contracts, including unrealized appreciation (depreciation), value and notional values or amounts of such contracts, can be found in the table at the end of the Portfolio of Investments included in this Report. |
5 | For purposes of this table, Mortgage-Backed Securities include mortgage-backed securities guaranteed by Government Sponsored Entities and adjustable rate mortgage-backed securities. |
6 | Assets, other than investments in securities, less liabilities. See Statement of Assets and Liabilities. |
Sector Composition of Equity Holdings | Percentage of Equity Securities |
Information Technology | 19.3% |
Financials | 16.7% |
Health Care | 13.5% |
Consumer Discretionary | 10.7% |
Industrials | 10.3% |
Consumer Staples | 7.9% |
Energy | 6.1% |
Materials | 4.7% |
Communication Services | 4.5% |
Utilities | 3.2% |
Real Estate | 3.1% |
TOTAL | 100% |
1 | Sector classifications are based upon, and individual portfolio securities are assigned to, the classifications of the Global Industry Classification Standard (GICS) except that the Adviser assigns a classification to securities not classified by the GICS and to securities for which the Adviser does not have access to the classification made by the GICS. |
Shares or Principal Amount | Value | ||
COMMON STOCKS— 53.7% | |||
Communication Services— 2.4% | |||
787 | Adevinta ASA | $ 6,366 | |
13,756 | 1 | Alphabet, Inc., Class A | 1,389,218 |
12,090 | 1 | Alphabet, Inc., Class C | 1,226,530 |
94,990 | America Movil S.A.B. de C.V. | 92,312 | |
19,444 | AT&T, Inc. | 374,880 | |
7,300 | Baidu, Inc. | 98,644 | |
1 | 1 | CarGurus, Inc. | 13 |
1 | Cheil Communications, Inc. | 19 | |
502,000 | China Tower Corp Ltd. | 54,447 | |
334 | Cogent Communications Holdings, Inc. | 19,389 | |
4,300 | Cyber Agent Ltd. | 39,072 | |
383 | Elisa Communications Oyj | 19,933 | |
4,836 | Etihad Etisalat Co. | 47,115 | |
11,752 | Fox Corp. | 381,352 | |
660 | 1 | Frontier Communications Parent, Inc. | 17,008 |
46,000 | HKT Trust and HKT Ltd. | 55,933 | |
929 | Info Edge India Ltd. | 46,125 | |
2,967 | 1 | Integral Ad Science Holding LLC | 29,522 |
300 | KDDI Corp. | 8,979 | |
293 | Krafton, Inc. | 51,697 | |
11,200 | Kuaishou Technology | 81,732 | |
4,632 | LG Uplus Corp. | 42,854 | |
2,774 | 1 | Lumen Technologies, Inc. | 15,174 |
977 | 1 | Meta Platforms, Inc. | 115,384 |
11,922 | Mobile Telecommunications Co. Saudi Arabia | 35,625 | |
2,478 | NetEase, Inc. | 35,012 | |
57 | NHN Corp. | 8,288 | |
9,230 | Paramount Global, Class B | 185,338 | |
17,560 | Pearson PLC | 211,135 | |
410 | Proximus | 4,269 | |
64,900 | PT Telekomunikasi Indonesia Tbk | 16,688 | |
2,499 | Publicis Groupe | 165,282 | |
7,184 | Quebecor, Inc., Class B | 154,826 | |
18,079 | 1 | Qurate Retail, Inc. | 42,486 |
7,604 | Saudi Telecom Co. | 78,183 | |
269 | Scholastic Corp. | 11,061 |
Shares or Principal Amount | Value | ||
COMMON STOCKS— continued | |||
Communication Services— continued | |||
57,600 | SoftBank Corp. | $ 628,092 | |
5,042 | Spark New Zealand Ltd. | 16,433 | |
100 | Swisscom AG | 53,754 | |
95,009 | Telefonica Deutschland Holding AG | 226,521 | |
1,886 | Telenor ASA | 18,262 | |
14,174 | Telstra Group Ltd. | 38,290 | |
15,396 | Tencent Holdings Ltd. | 578,531 | |
16,773 | TIM S.A./Brazil | 42,019 | |
1,617 | 1 | T-Mobile USA, Inc. | 244,911 |
4,219 | Universal Music Group | 101,073 | |
11,415 | Verizon Communications, Inc. | 444,957 | |
12 | Vivendi SA | 109 | |
3,319 | Vodacom Group Ltd. | 24,276 | |
2,834 | WPP PLC | 30,140 | |
25,200 | Yahoo Japan Corp. | 68,670 | |
TOTAL | 7,677,929 | ||
Consumer Discretionary— 5.8% | |||
207 | 1 | Abercrombie & Fitch Co., Class A | 4,964 |
568 | Academy Sports and Outdoors, Inc. | 28,673 | |
430 | Adidas AG | 54,832 | |
42,208 | 1 | Alibaba Group Holding Ltd. | 460,647 |
20,056 | 1 | Amazon.com, Inc. | 1,936,206 |
733 | 1 | Aptiv PLC | 78,189 |
25 | 1 | Asbury Automotive Group, Inc. | 4,690 |
257,100 | Asset World Corp PCL | 45,983 | |
1,661 | Balkrishna Industries Ltd. | 42,113 | |
1,768 | Bayerische Motoren Werke AG | 158,796 | |
985 | Berkeley Group Holdings PLC | 45,435 | |
1,920 | Block (H&R), Inc. | 83,923 | |
2,213 | Bloomin Brands, Inc. | 49,837 | |
638 | BorgWarner, Inc. | 27,121 | |
372 | 1 | Bowlero Corp. | 5,193 |
9,456 | Burberry Group PLC | 249,561 | |
3,570 | BYD Co. Ltd. | 89,675 | |
1,500 | BYD Co. Ltd. | 55,223 | |
1,486 | Canadian Tire Corp. Ltd. | 168,291 | |
120 | 1 | Cavco Industries, Inc. | 27,556 |
1,485 | Cheesecake Factory, Inc. | 52,034 | |
497 | 1 | Chegg, Inc. | 14,830 |
Shares or Principal Amount | Value | ||
COMMON STOCKS— continued | |||
Consumer Discretionary— continued | |||
6 | 1 | Chicos Fas, Inc. | $ 35 |
24,726 | Chongqing Changan Automobile Co. Ltd. | 47,143 | |
1,443 | 1 | Churchill Capital Corp. IV | 14,632 |
1,848 | Cie Financiere Richemont SA | 245,823 | |
748 | CJ Home Shopping | 48,339 | |
692 | Coway Co. Ltd. | 30,353 | |
239 | 1 | CROCs, Inc. | 24,139 |
67 | D’ieteren Group | 12,781 | |
90 | Dillards, Inc., Class A | 32,373 | |
436 | Dollarama, Inc. | 26,685 | |
80,000 | Dongfeng Motor Group Co. Ltd. | 45,154 | |
103 | 1 | Dorman Products, Inc. | 9,233 |
46,015 | 1 | DraftKings, Inc. | 704,950 |
1,129 | Eicher Motors Ltd. | 48,796 | |
2,264 | 1 | Everi Holdings, Inc. | 37,854 |
2,128 | Evolution AB | 218,026 | |
475 | Ferrari NV | 105,277 | |
451 | 1 | Flutter Entertainment PLC | 67,941 |
10,697 | Ford Motor Co. | 148,688 | |
2,089 | Ford Otomotiv Sanayi A.S. | 50,231 | |
346 | 1 | Fox Factory Holding Corp. | 36,711 |
3 | 1 | Frontdoor, Inc. | 70 |
3,947 | General Motors Co. | 160,090 | |
634 | Gentex Corp. | 18,323 | |
1,216 | 1 | G-III Apparel Group Ltd. | 26,302 |
177 | 1 | Golden Entertainment, Inc. | 7,843 |
2 | 1 | GoPro, Inc. | 11 |
1,400 | Gree Electric Appliances, Inc. of Zhuhai | 6,329 | |
348 | 1 | Green Brick Partners, Inc. | 8,415 |
243 | Group 1 Automotive, Inc. | 46,982 | |
64,000 | Guangzhou Automobile Group Co. Ltd. | 46,092 | |
12,800 | Haier Smart Home Co. Ltd. | 44,219 | |
20,800 | Haier Smart Home Co. Ltd. | 68,940 | |
1 | Halla Climate Control Co. | 7 | |
1,337 | Hankook Tire Co. Ltd. | 34,968 | |
363 | Harley-Davidson, Inc. | 17,108 | |
177 | Hermes International | 290,933 | |
731 | Hilton Worldwide Holdings, Inc. | 104,255 | |
5,065 | Home Depot, Inc. | 1,641,009 |
Shares or Principal Amount | Value | ||
COMMON STOCKS— continued | |||
Consumer Discretionary— continued | |||
76 | Hyundai Motor Co. | $ 9,882 | |
24,658 | Industria de Diseno Textil SA | 639,306 | |
1,202 | International Game Technology PLC | 29,497 | |
7,181 | JD.com, Inc. | 204,499 | |
745 | Jumbo S.A. | 11,787 | |
5,024 | Just Eat Takeaway.com NV | 117,605 | |
1 | Kangwon Land, Inc. | 19 | |
342 | KB HOME | 10,735 | |
1,500 | Kia Corp. | 79,048 | |
2 | 1 | Latham Group, Inc. | 7 |
161 | Lear Corp. | 23,223 | |
124 | LG Electronics, Inc. | 9,363 | |
4,115 | Lowe’s Cos., Inc. | 874,643 | |
923 | LVMH Moet Hennessy Louis Vuitton SA | 714,643 | |
51 | Maruti Suzuki India Ltd. | 5,651 | |
9,455 | Meituan | 203,067 | |
591 | 1 | Meritage Corp. | 51,068 |
56,000 | Minor International PCL | 49,346 | |
1 | 1 | Modine Manufacturing Co. | 21 |
3,799 | Mr. Price Group Ltd. | 37,337 | |
35 | Murphy USA, Inc. | 10,353 | |
248 | Naspers Ltd., Class N | 38,189 | |
404 | Next PLC | 28,830 | |
3,552 | OPAP S.A. | 49,145 | |
1,945 | 2 | Ozon Holdings PLC, ADR | 0 |
74 | Page Industries Ltd. | 43,325 | |
19,500 | Pan Pacific International Holdings Corp. | 340,527 | |
61,700 | Panasonic Holdings Corp. | 576,149 | |
374 | Patrick Industries, Inc. | 20,918 | |
49,000 | Pou Chen Corp. | 51,770 | |
143,200 | PT Astra International Tbk | 55,346 | |
68,400 | PTT Oil & Retail Business PCL | 47,393 | |
5,423 | Puma AG Rudolf Dassler Sport | 274,986 | |
674 | 1 | QuantumScape Corp. | 5,048 |
651 | Red Rock Resorts, Inc. | 29,334 | |
1,590 | Rent-A-Center, Inc. | 38,303 | |
1,407 | 1 | Rivian Automotive, Inc. | 45,080 |
19,600 | SAIC Motor Corp. Ltd. | 41,847 | |
20,100 | Sekisui Chemical Co. | 284,080 |
Shares or Principal Amount | Value | ||
COMMON STOCKS— continued | |||
Consumer Discretionary— continued | |||
16,400 | Sekisui House Ltd. | $ 307,387 | |
19,400 | Sharp Corp. | 138,710 | |
41 | 1 | Skyline Corp. | 2,132 |
1,916 | Smith & Wesson Brands, Inc. | 22,551 | |
2 | 1 | Solid Power, Inc. | 7 |
143 | Standard Motor Products, Inc. | 5,493 | |
5,231 | Target Corp. | 873,943 | |
408 | 1 | Target Hospitality Corp. | 5,900 |
6,910 | 1 | Tesla, Inc. | 1,345,377 |
51,611 | The Lottery Corp. | 163,415 | |
59,351 | The Wendy’s Co. | 1,338,959 | |
142 | Thor Industries, Inc. | 12,232 | |
2,007 | Titan Industries Ltd. | 65,992 | |
1,287 | TJX Cos., Inc. | 103,024 | |
2,378 | Trent Ltd. | 43,349 | |
161 | 1 | Tri Pointe Homes, Inc. | 2,969 |
216 | 1 | Ulta Beauty, Inc. | 100,405 |
1 | 1 | Vacasa, Inc. | 2 |
13,642 | Vibra Energia SA | 43,455 | |
237 | 1 | Vista Outdoor, Inc. | 6,629 |
1 | Winnebago Industries, Inc. | 59 | |
554 | 1,3 | XPEL, Inc. | 37,977 |
30,000 | Yadae Group Holdings Ltd. | 56,511 | |
1,958 | Yum China Holding, Inc. | 107,925 | |
9,275 | Zhongsheng Group Holdings | 47,478 | |
51,877 | Zomato Ltd. | 42,614 | |
TOTAL | 18,086,697 | ||
Consumer Staples— 4.2% | |||
8,881 | Albertsons Cos., Inc. | 186,057 | |
32,745 | Altria Group, Inc. | 1,525,262 | |
24,854 | Ambev SA | 76,248 | |
2,336 | Anheuser-Busch InBev NV | 137,282 | |
5,182 | Archer-Daniels-Midland Co. | 505,245 | |
3,100 | Asahi Group Holdings Ltd. | 99,692 | |
1,122 | Avenue Supermarts Ltd. | 56,056 | |
3,122 | Bid Corp. Ltd. | 60,191 | |
5,418 | BIM Birlesik Magazalar AS | 39,231 | |
41 | 1 | BJ’s Wholesale Club Holdings, Inc. | 3,085 |
656 | Cal-Maine Foods, Inc. | 38,232 |
Shares or Principal Amount | Value | ||
COMMON STOCKS— continued | |||
Consumer Staples— continued | |||
8,952 | Campbell Soup Co. | $ 480,454 | |
90 | 1 | Chefs Warehouse, Inc. | 3,497 |
3 | Chocoladefabriken Lindt & Sprungli AG | 310,882 | |
4 | Chocoladefabriken Lindt & Sprungli AG | 42,325 | |
106 | Coca-Cola Bottling Co. | 52,131 | |
8,393 | Coca-Cola Femsa S.A.B. de C.V. | 57,360 | |
476 | Colgate-Palmolive (India) Ltd. | 9,582 | |
17,299 | Diageo PLC | 803,806 | |
768 | Edgewell Personal Care Co. | 33,185 | |
264 | Empire Co. Ltd., Class A | 7,189 | |
33,681 | Endeavour Group Ltd. | 160,583 | |
923 | Estee Lauder Cos., Inc., Class A | 217,634 | |
4,176 | Fomento Economico Mexicano, SA de C.V. | 33,327 | |
444 | Fresh Del Monte Produce, Inc. | 12,290 | |
3,954 | General Mills, Inc. | 337,276 | |
154 | George Weston Ltd. | 19,285 | |
4,187 | Gruma S.A., Class B | 51,835 | |
15,919 | Grupo Bimbo S.A.B. de CV, Class A | 67,549 | |
16,500 | Guangdong Wens Foodstuff Group Co. Ltd. | 41,706 | |
3,097 | HelloFresh SE | 75,690 | |
1,259 | Hindustan Lever Ltd. | 41,639 | |
17,733 | Imperial Brands PLC | 455,522 | |
38 | Ingles Markets, Inc., Class A | 3,842 | |
231 | Inter Parfums, Inc. | 22,012 | |
16,695 | ITC Ltd. | 70,247 | |
9,769 | JBS S.A. | 41,509 | |
763 | Jeronimo Martins SGPS SA | 16,832 | |
8,900 | Kao Corp. | 355,174 | |
429 | Kerry Group PLC | 40,528 | |
737 | Kesko | 15,917 | |
6,697 | Koninklijke Ahold NV | 194,166 | |
843 | Korea Tobacco & Ginseng Corp. | 63,935 | |
27,656 | Kroger Co. | 1,360,399 | |
2,632 | Loblaw Cos. Ltd. | 237,538 | |
1,365 | L’Oreal SA | 516,251 | |
19,585 | Mondelez International, Inc. | 1,324,142 | |
1,116 | Mowi ASA | 100,705 | |
236 | Nestle India Ltd. | 58,691 | |
5,300 | Nestle S.A. | 630,696 |
Shares or Principal Amount | Value | ||
COMMON STOCKS— continued | |||
Consumer Staples— continued | |||
22,700 | New Hope Liuhe Co. Ltd. | $ 43,420 | |
54 | Orion Corp. | 4,844 | |
2,027 | Orkla ASA | 14,419 | |
300 | Perlis Plantations Bhd | 1,165 | |
397 | Philip Morris International, Inc. | 39,569 | |
5,690 | 1 | Pilgrim’s Pride Corp. | 148,850 |
10,190 | Raia Drogasil S.A. | 45,262 | |
37,981 | Reynolds Consumer Products, Inc. | 1,213,873 | |
159 | Salmar ASA | 5,658 | |
263 | Sanfilippo (John B. & Sons), Inc. | 22,273 | |
5,463 | Savola Group Co. | 41,585 | |
2,600 | Seven & I Holdings Co. Ltd. | 106,088 | |
4,295 | Shoprite Holdings Ltd. | 63,356 | |
94 | SpartanNash Co. | 3,088 | |
92,100 | Thai Union Frozen Products Public Co. Ltd. | 44,687 | |
85 | The Anderson’s, Inc. | 3,273 | |
74 | 1 | The Simply Good Foods Co. | 2,953 |
29,166 | Tingyi (Cayman Isln) Hldg Co. | 47,645 | |
6,700 | Tongwei Co. Ltd. | 40,852 | |
6,000 | Tsingtao Brewery Co. Ltd. | 56,676 | |
1,200 | Tsingtao Brewery Co. Ltd. | 17,136 | |
2,564 | Tyson Foods, Inc., Class A | 169,942 | |
438 | 1 | United Natural Foods, Inc. | 20,884 |
1,353 | 1 | Veru, Inc. | 7,685 |
17,259 | Wal-Mart de Mexico SAB de C.V. | 68,208 | |
34,000 | Want Want China Holdings Ltd. | 23,084 | |
43 | Weis Markets, Inc. | 3,750 | |
TOTAL | 13,354,137 | ||
Energy— 3.3% | |||
855 | Aker BP ASA | 29,829 | |
131 | Ampol Ltd. | 2,550 | |
125 | Arch Resources, Inc. | 19,344 | |
1 | Borr Drilling Ltd. | 5 | |
140,482 | BP PLC | 840,459 | |
677 | Brigham Minerals, Inc. | 23,986 | |
186 | Canadian Natural Resources Ltd. | 11,105 | |
7,865 | Cheniere Energy, Inc. | 1,379,206 | |
572 | Chevron Corp. | 104,853 | |
50,000 | China Coal Energy Co. | 46,074 |
Shares or Principal Amount | Value | ||
COMMON STOCKS— continued | |||
Energy— continued | |||
26,000 | China Oilfield Services Ltd. | $ 32,572 | |
425 | Chord Energy Corp. | 64,825 | |
16,037 | Coal India Ltd. | 45,264 | |
14,459 | ConocoPhillips | 1,785,831 | |
4,881 | Coterra Energy, Inc., Class A | 136,229 | |
1,285 | CVR Energy, Inc. | 47,352 | |
26,700 | ENEOS Holdings, Inc. | 90,385 | |
2,644 | Equinor ASA | 101,840 | |
3,994 | Exxaro Resources Ltd. | 52,392 | |
20,144 | Exxon Mobil Corp. | 2,242,833 | |
1,351 | Galp Energia SGPS SA | 16,568 | |
1,335 | Helmerich & Payne, Inc. | 68,192 | |
233 | Hyundai Robotics Co. Ltd. | 11,520 | |
9,672 | Imperial Oil Ltd. | 550,272 | |
2,465 | Magnolia Oil & Gas Corp. | 64,287 | |
6,886 | Marathon Oil Corp. | 210,918 | |
1,112 | Matador Resources Co. | 73,792 | |
220 | Murphy Oil Corp. | 10,384 | |
1,141 | Neste Oyj | 58,710 | |
28,476 | Oil & Natural Gas Corp. Ltd. | 49,508 | |
397 | OMV AG | 21,059 | |
1,215 | PBF Energy, Inc. | 48,320 | |
53,177 | PetroChina Co. Ltd. | 24,198 | |
15,919 | Petroleo Brasileiro SA | 93,225 | |
8,388 | Polski Koncern Naftowy Orlen SA | 122,924 | |
185,000 | PT Adaro Energy | 45,509 | |
22,500 | PT United Tractors | 44,046 | |
3,200 | PTT Exploration and Production Public Co. | 17,111 | |
600 | PTT Public Co. Ltd. | 569 | |
7,684 | Reliance Industries Ltd. | 259,153 | |
1,421 | Repsol SA | 21,935 | |
4,610 | RPC, Inc. | 42,689 | |
2,751 | Saudi Arabian Oil Co. (Aramco) | 24,589 | |
604 | Scorpio Tankers, Inc. | 30,816 | |
2,264 | Shell PLC | 66,236 | |
1,421 | SM Energy Co. | 61,259 | |
220 | S-Oil Corp. | 14,527 | |
11,958 | Suncor Energy, Inc. | 393,192 | |
12,123 | 2 | Tatneft | 0 |
Shares or Principal Amount | Value | ||
COMMON STOCKS— continued | |||
Energy— continued | |||
7,015 | TotalEnergies SE | $ 438,203 | |
16,211 | Ultrapar Participacoes SA | 44,359 | |
1,940 | VAALCO Energy, Inc. | 10,049 | |
8,604 | Woodside Energy Group Ltd. | 217,101 | |
14,606 | Yankuang Energy Group Co. Ltd., Class H | 48,577 | |
500 | Yanzhou Coal Mining Co. Ltd. | 2,843 | |
TOTAL | 10,263,574 | ||
Financials— 9.0% | |||
1,139 | AB Industrivarden | 29,571 | |
5,748 | ABSA Group Ltd. | 68,617 | |
5,317 | Aegon NV | 26,286 | |
435 | Ageas | 17,550 | |
31,400 | AIA Group Ltd. | 320,248 | |
3,822 | Al Rajhi Bank | 82,449 | |
6,425 | Alinma Bank | 59,456 | |
10,141 | Allstate Corp. | 1,357,880 | |
4,221 | Ameriprise Financial, Inc. | 1,401,161 | |
1,118 | Ameris Bancorp | 59,120 | |
712 | Argo Group International Holdings Ltd. | 19,352 | |
110,340 | Aviva PLC | 598,546 | |
16,129 | AXA SA | 461,399 | |
3,412 | Axis Bank Ltd. | 38,102 | |
29,375 | B3 SA - Brasil Bolsa Balcao | 72,060 | |
390 | Bajaj Finance Ltd. | 32,685 | |
15,849 | Banco Bradesco SA | 42,025 | |
536,682 | Banco de Chile | 50,775 | |
22,160 | Banco de Oro | 51,259 | |
1,109,362 | Banco Santander Chile SA | 43,129 | |
1,905 | 1 | Bancorp, Inc., DE | 57,093 |
97,800 | Bangkok Commercial Asset Management PLC | 41,764 | |
32,160 | 1 | Bank Hapoalim BM | 313,799 |
48,910 | Bank of America Corp. | 1,851,243 | |
178,388 | Bank of China Ltd. | 63,545 | |
91,456 | Bank of Communications Ltd. | 51,741 | |
20,700 | Bank of Hangzhou Co. Ltd. | 38,451 | |
400 | Bank of Jiangsu Co. Ltd. | 417 | |
23,520 | Bank of The Philippine Islands | 44,240 | |
279 | Bank Pekao SA | 5,342 | |
222 | Bank Zachodni WBK S.A. | 13,854 |
Shares or Principal Amount | Value | ||
COMMON STOCKS— continued | |||
Financials— continued | |||
8,341 | BB Seguridade Participacoes SA | $ 50,342 | |
3,777 | Berkshire Hathaway, Inc., Class B | 1,203,352 | |
4,840 | BGC Partners, Inc., Class A | 20,860 | |
1 | 1 | Bright Health Group, Inc. | 1 |
470 | Brookline Bancorp, Inc. | 6,683 | |
1,504 | 1 | BRP Group, Inc. | 45,180 |
885 | Bupa Arabia For Cooperative Insurance Co. | 41,978 | |
1 | Byline Bancorp, Inc. | 23 | |
49,153 | Cathay Financial Holding Co. Ltd. | 70,195 | |
83,000 | Chang Hwa Bank | 47,377 | |
7,803 | Chimera Investment Corp. | 53,451 | |
410,000 | China Cinda Asset Management Co. Ltd. | 54,112 | |
67,000 | China CITIC Bank Corp. Ltd. | 29,757 | |
209,501 | China Construction Bank Corp. | 127,264 | |
19,000 | China Everbright Bank Co. Ltd. | 5,663 | |
3,545 | China Merchants Bank Co. Ltd. | 18,023 | |
31,200 | China Pacific Insurance Group Co. Ltd. | 71,205 | |
100,422 | Chinatrust Financial Holding Co. Ltd. | 75,504 | |
50,600 | CIMB Group Holdings Berhad | 66,258 | |
19,649 | Citizens Financial Group, Inc. | 832,725 | |
21,927 | Commerzbank AG, Frankfurt | 183,333 | |
1,974 | ConnectOne Bancorp, Inc. | 51,798 | |
620 | 1 | Customers Bancorp, Inc. | 20,007 |
32,800 | Daiwa Securities Group, Inc. | 145,852 | |
2,226 | Danske Bank A/S | 40,334 | |
9,373 | DBS Group Holdings Ltd. | 243,712 | |
28,189 | Deutsche Bank AG | 297,641 | |
151 | Deutsche Boerse AG | 27,699 | |
10,202 | Discover Financial Services | 1,105,489 | |
2,514 | DNB Bank ASA | 49,230 | |
286 | 1 | Donnelley Financial Solutions, Inc. | 10,919 |
64 | 1 | Encore Capital Group, Inc. | 3,226 |
558 | 1 | Enova International, Inc. | 22,510 |
22,404 | EQT AB | 521,197 | |
26,117 | Equitable Holdings, Inc. | 828,954 | |
927 | Erste Group Bank AG | 29,183 | |
1,488 | Essent Group Ltd. | 59,654 | |
2,188 | Exor NV | 172,708 | |
1,064 | Fairfax Financial Holdings Ltd. | 610,470 |
Shares or Principal Amount | Value | ||
COMMON STOCKS— continued | |||
Financials— continued | |||
19,412 | FinecoBank Banca Fineco SPA | $ 318,716 | |
10,889 | First American Financial Corp. | 595,084 | |
3,568 | First BanCorp | 54,876 | |
1,233 | First Merchants Corp. | 54,511 | |
937 | First PacTrust Bancorp, Inc. | 15,901 | |
24,551 | FirstRand Ltd. | 95,220 | |
36,535 | Fubon Financial Holdings Co. Ltd. | 72,725 | |
539 | Gjensidige Forsikring ASA | 10,445 | |
21,997 | Great-West Lifeco, Inc. | 524,599 | |
268 | Groupe Bruxelles Lambert SA | 21,733 | |
7,880 | 1 | Grupo Financiero Banorte S.A. de C.V. | 63,243 |
30,457 | Grupo Financiero Inbursa, S.A. de C.V., Class O | 57,429 | |
1,099 | Hancock Whitney Corp. | 60,269 | |
19,956 | Hargreaves Lansdown PLC | 205,946 | |
1 | HomeStreet, Inc. | 27 | |
5,019 | Hong Kong Exchanges & Clearing Ltd. | 200,303 | |
10,100 | Hong Leong Bank Berhad | 47,372 | |
9,800 | Hong Leong Credit Berhad | 40,826 | |
3,832 | Housing Development Finance Corp. Ltd. | 127,805 | |
23,899 | HSBC Holdings PLC | 147,317 | |
77,510 | Hua Nan Financial Holdings Co. Ltd. | 57,475 | |
11,747 | ICICI Bank Ltd. | 139,013 | |
3,114 | ICICI Lombard General Insurance Co. Ltd. | 46,440 | |
6,389 | ICICI Prudential Life Insurance Company Ltd. | 37,633 | |
5,780 | IGM Financial, Inc. | 167,709 | |
242,813 | Industrial & Commercial Bank of China | 122,406 | |
1,582 | James River Group Holdings Ltd. | 38,000 | |
7,900 | Japan Exchange Group, Inc. | 114,678 | |
2,146 | KB Financial Group, Inc. | 86,195 | |
675 | KBC Groupe | 37,777 | |
129 | Kinsale Capital Group, Inc. | 39,759 | |
111 | Kotak Mahindra Bank Ltd. | 2,677 | |
58,200 | Krung Thai Bank PLC | 29,121 | |
3,772 | Lazard Ltd., Class A | 138,093 | |
24,465 | Legal & General Group PLC | 75,440 | |
408 | Mahindra and Mahindra Ltd. | 6,616 | |
2,200 | Malayan Banking BHD | 4,269 | |
9,175 | Manulife Financial Corp. | 165,268 | |
280,899 | Medibank Private Ltd. | 562,255 |
Shares or Principal Amount | Value | ||
COMMON STOCKS— continued | |||
Financials— continued | |||
49 | Merchants Bancorp, Inc. | $ 1,254 | |
1,774 | Meritz Fire & Marine Insurance Co. Ltd. | 62,827 | |
46,130 | Metro Bank and Trust Co. | 47,091 | |
364 | 1 | Metropolitan Bank Holding Corp. | 23,129 |
2,052 | MFA Financial, Inc. | 22,941 | |
900 | Mitsubishi HC Capital, Inc. | 4,292 | |
291 | 1 | Mizrahi Tefahot Bank Ltd. | 10,839 |
130 | Muenchener Rueckversicherungs-Gesellschaft AG | 40,960 | |
673 | National Bank Holdings Corp. | 31,301 | |
3,153 | Navient Corp. | 52,245 | |
4,395 | Nedbank Group Ltd. | 58,168 | |
1 | New York Mortgage Trust, Inc. | 3 | |
2,344 | 1 | NMI Holdings, Inc. | 50,466 |
1,844 | OFG Bancorp. | 53,421 | |
2,443 | Old National Bancorp | 46,686 | |
171 | Origin Bancorp, Inc. | 6,997 | |
36,400 | ORIX Corp. | 587,542 | |
1 | Oscar Health, Inc. | 3 | |
943 | OTP Bank RT | 25,912 | |
30,685 | Oversea-Chinese Banking Corp. Ltd. | 281,678 | |
5 | 1 | Palomar Holdings, Inc. | 314 |
2 | Pennymac Financial Services, Inc. | 119 | |
162,000 | People’s Insurance, Co. (Group) of China Ltd. | 54,618 | |
58,000 | PICC Property and Casualty Co. Ltd., Class H | 58,464 | |
7,682 | Ping An Insurance (Group) Co. of China Ltd. | 47,589 | |
400 | Piper Jaffray Cos., Inc. | 57,464 | |
810 | PNC Financial Services Group | 136,291 | |
90,000 | Postal Savings Bank of China Co. Ltd. | 54,078 | |
60,600 | Postal Savings Bank of China Co. Ltd. | 38,030 | |
4,999 | Power Corp. of Canada | 125,760 | |
487 | Preferred Bank Los Angeles, CA | 36,812 | |
10,423 | Principal Financial Group, Inc. | 934,735 | |
1,321 | Progressive Corp., OH | 174,570 | |
13,474 | Prudential Financial, Inc. | 1,455,596 | |
88,840 | PT Bank Central Asia | 52,861 | |
106,500 | PT Bank Mandiri Tbk | 71,557 | |
25,900 | PT Bank Negara Indonesia | 16,414 | |
65,800 | PT Bank Rakyat Indonesia Tbk | 20,921 | |
53,600 | Public Bank Berhad | 54,331 |
Shares or Principal Amount | Value | ||
COMMON STOCKS— continued | |||
Financials— continued | |||
3,383 | QBE Insurance Group Ltd. | $ 29,980 | |
891 | QCR Holdings, Inc. | 46,876 | |
30,602 | Regions Financial Corp. | 710,272 | |
2,065 | Royal Bank of Canada | 205,372 | |
1,291 | Sampo Oyj, Class A | 65,668 | |
171 | Samsung Fire & Marine Insurance | 26,772 | |
6,635 | Sanlam Ltd. | 21,602 | |
16,100 | SCB X PCL | 48,185 | |
98,233 | Sinopac Holdings Co. | 58,396 | |
1 | Siriuspoint Ltd. | 7 | |
16,229 | SLM Corp. | 283,358 | |
42 | Sofina | 9,194 | |
7,676 | Standard Bank Group Ltd. | 80,617 | |
10,089 | State Bank of India | 75,480 | |
736 | Stellar Bancorp, Inc. | 24,884 | |
59,369 | Suncorp Group Ltd. | 485,916 | |
1,116 | Swiss Re AG | 17,672 | |
19,732 | Synchrony Financial | 741,529 | |
2,026 | Synovus Financial Corp. | 85,355 | |
70,860 | Taiwan Cooperative Financial Holding Co. Ltd. | 61,661 | |
3,766 | The National Commercial Bank | 51,822 | |
31,060 | UBS Group AG | 577,967 | |
2,700 | United Overseas Bank Ltd. | 62,290 | |
7,088 | Webster Financial Corp. Waterbury | 385,162 | |
3,377 | Woori Financial Group, Inc. | 33,727 | |
248 | 1 | World Acceptance Corp. | 17,586 |
84,151 | Yuanta Financial Holding Co. Ltd. | 62,047 | |
TOTAL | 28,209,875 | ||
Health Care— 7.2% | |||
5,326 | Abbott Laboratories | 572,971 | |
9,856 | 1,2 | Achillion Pharmaceuticals, Inc. | 4,534 |
187 | 1 | Addus Homecare Corp. | 20,622 |
1 | 1 | ADMA Biologics, Inc. | 3 |
4,259 | Agilent Technologies, Inc. | 660,060 | |
5,432 | Alector, Inc. | 46,118 | |
491 | 1 | AMN Healthcare Services, Inc. | 60,737 |
164 | 1 | Amphastar Pharmaceuticals, Inc. | 4,836 |
20,064 | 1 | Antigenics, Inc. | 54,173 |
2,039 | 1 | Arcus Biosciences, Inc. | 71,712 |
Shares or Principal Amount | Value | ||
COMMON STOCKS— continued | |||
Health Care— continued | |||
100 | Asahi Intecc Co. Ltd. | $ 1,781 | |
4,100 | Astellas Pharma, Inc. | 63,790 | |
56 | AstraZeneca PLC | 7,578 | |
402 | 1 | Avanos Medical, Inc. | 10,814 |
1,449 | 1 | Avantor, Inc. | 32,284 |
82,500 | Bangkok Dusit Medical Services Public Co. Ltd. | 70,963 | |
6,100 | Beijing Tongrentang Co. Ltd. | 42,012 | |
2 | 1 | BioNano Genomics, Inc. | 4 |
626 | Carl Zeiss Meditec AG | 84,241 | |
4 | 1 | Catalyst Pharmaceutical Partners, Inc. | 67 |
84,000 | China Traditional Chinese Medicine Holdings Co. Ltd. | 42,065 | |
1,409 | CIGNA Corp. | 463,406 | |
3,818 | Cipla Ltd. | 53,871 | |
2,944 | 1 | Cogent Biosciences, Inc. | 37,035 |
4,067 | Coherus Biosciences, Inc. | 27,900 | |
319 | 1 | Corvel Corp. | 48,797 |
2 | 1 | CTI BioPharma Corp. | 12 |
7,253 | CVS Health Corp. | 738,936 | |
6,139 | Danaher Corp. | 1,678,464 | |
1,221 | 1 | Definitive Healthcare Corp. | 13,883 |
1,161 | Divi’s Laboratories Ltd. | 48,918 | |
139 | Elevance Health, Inc. | 74,076 | |
3,866 | Eli Lilly & Co. | 1,434,595 | |
284 | Ensign Group, Inc. | 26,980 | |
6,819 | 1 | EQRx, Inc. | 25,639 |
1 | 1 | Evolent Health, Inc. | 29 |
1,554 | Fisher & Paykel Healthcare Corp. Ltd. | 23,348 | |
303 | 1 | Fulgent Genetics, Inc. | 10,990 |
3 | 1 | Geron Corp. | 7 |
9 | Green Cross Corp. | 895 | |
38,182 | GSK PLC | 648,605 | |
2,444 | HCA Healthcare, Inc. | 587,098 | |
1,744 | HilleVax, Inc. | 34,880 | |
1 | Hims & Hers Health, Inc. | 6 | |
7,200 | Huadong Medicine Co. Ltd. | 41,619 | |
3,849 | Hypermarcas SA | 32,962 | |
6 | 1 | Immunogen, Inc. | 31 |
4,433 | 1 | Immunovant, Inc. | 58,117 |
723 | 1 | Inari Medical, Inc. | 53,198 |
Shares or Principal Amount | Value | ||
COMMON STOCKS— continued | |||
Health Care— continued | |||
3,172 | 1 | Incyte Genomics, Inc. | $ 252,713 |
1 | 1 | Inovio Pharmaceuticals, Inc. | 2 |
104 | 1 | Integer Holdings Corp. | 7,729 |
2,418 | Ipsen SA | 270,515 | |
237 | 1 | iTeos Therapeutics, Inc. | 4,776 |
940 | Johnson & Johnson | 167,320 | |
829 | Koninklijke Philips NV | 12,487 | |
2 | 1 | Lyell Immunopharma, Inc. | 8 |
2 | 1 | Mannkind Corp. | 9 |
3,321 | 1 | MaxCyte, Inc. | 19,893 |
286 | 1 | Medpace Holdings, Inc. | 60,029 |
11,722 | Medtronic PLC | 926,507 | |
15,916 | Merck & Co., Inc. | 1,752,670 | |
1,004 | Merck KGAA | 181,911 | |
294 | 1 | Meridian Bioscience, Inc. | 9,408 |
346 | 1 | ModivCare, Inc. | 26,642 |
2,581 | 1 | Motion Acquisition Corp. | 18,970 |
769 | Mouwasat Medical Services Co. | 38,614 | |
3 | 1 | Nektar Therapeutics | 8 |
954 | 1 | NextGen Healthcare, Inc. | 19,843 |
7,364 | Novartis AG | 656,545 | |
5,152 | Novo Nordisk A/S | 644,977 | |
22,172 | 1 | Nuvation Bio, Inc. | 42,348 |
399 | 1 | Option Care Health, Inc. | 12,014 |
287 | Orion Oyj | 15,200 | |
1,140 | Owens & Minor, Inc. | 23,495 | |
1 | 1 | Pacific Biosciences of California, Inc. | 11 |
130 | Patterson Cos., Inc. | 3,697 | |
20,121 | Pfizer, Inc. | 1,008,666 | |
6,885 | 1,2 | Progenics Pharmaceuticals, Inc. | 0 |
1,057 | Progyny, Inc. | 38,718 | |
6,119 | 1 | Qiagen NV | 303,135 |
2,666 | 1 | Qiagen NV | 131,533 |
2,375 | Quest Diagnostics, Inc. | 360,596 | |
1,683 | 1 | Regeneron Pharmaceuticals, Inc. | 1,265,111 |
520 | Roche Holding AG | 169,019 | |
1,267 | Roche Holding AG | 507,343 | |
1 | Sana Biotechnology, Inc. | 5 | |
5 | 1 | Sangamo BioSciences, Inc. | 18 |
Shares or Principal Amount | Value | ||
COMMON STOCKS— continued | |||
Health Care— continued | |||
2,163 | Sanofi | $ 195,420 | |
1,882 | SD Biosensor, Inc. | 47,737 | |
1,936 | Seegene, Inc. | 45,346 | |
1,000 | Shanghai Fosun Pharmaceutical Co. Ltd. | 3,345 | |
30,800 | Shanghai Pharmaceuticals Holding Co. Ltd. | 51,414 | |
178 | 1 | Shockwave Medical, Inc. | 45,141 |
108,000 | Sino Biopharmaceutical Ltd. | 64,043 | |
23,739 | Sinopharm Group Co. Ltd. | 56,115 | |
441 | SK Bioscience Co. Ltd. | 28,305 | |
4,676 | Smith & Nephew PLC | 61,198 | |
2 | 1 | SomaLogic, Inc. | 6 |
13,384 | Sonic Healthcare Ltd. | 296,910 | |
340 | Sonova Holding AG | 87,138 | |
6 | 1 | Sorrento Therapeutics, Inc. | 8 |
237 | 1 | Staar Surgical Co. | 13,535 |
5,548 | Sun Pharmaceutical Industries Ltd. | 71,922 | |
5,500 | Sysmex Corp. | 337,059 | |
14,200 | Terumo Corp. | 420,499 | |
2 | 1 | Tg Therapeutics, Inc. | 18 |
1 | 1 | Travere Thrapeutics, Inc. | 20 |
340 | UCB SA | 27,256 | |
4,450 | UnitedHealth Group, Inc. | 2,437,532 | |
3,610 | 1 | Vanda Pharmaceuticals, Inc. | 39,385 |
1 | 1 | Varex Imaging Corp. | 21 |
2,051 | 1 | Vertex Pharmaceuticals, Inc. | 648,936 |
1,518 | West Pharmaceutical Services, Inc. | 356,214 | |
1,000 | WuXi PharmaTech, Inc. | 6,548 | |
3,005 | Zoetis, Inc. | 463,191 | |
TOTAL | 22,772,409 | ||
Industrials— 5.6% | |||
33 | A P Moller-Maersk A/S | 70,493 | |
140 | A.P. Moller-Maersk A/S, Class B | 305,463 | |
1,406 | Airbus Group SE | 162,332 | |
269 | Alexander and Baldwin, Inc. | 17,151 | |
69,588 | Alfa, S.A. de C.V., Class A | 48,691 | |
2,741 | Allison Transmission Holdings, Inc. | 122,797 | |
3,004 | Ametek, Inc. | 427,830 | |
120 | Apogee Enterprises, Inc. | 5,790 | |
492 | Applied Industrial Technologies, Inc. | 65,185 |
Shares or Principal Amount | Value | ||
COMMON STOCKS— continued | |||
Industrials— continued | |||
519 | ArcBest Corp. | $ 42,958 | |
473 | 1 | Atkore, Inc. | 57,777 |
3,373 | 1 | Auckland International Airport Ltd. | 17,100 |
57,092 | Aurizon Holdings Ltd. | 148,242 | |
2 | Barrett Business Services, Inc. | 197 | |
86 | 1 | Beacon Roofing Supply, Inc. | 5,022 |
37,107 | Bharat Electronics Ltd. | 48,278 | |
3,996 | Bidvest Group Ltd. | 53,772 | |
31 | 1 | BlueLinx Holdings, Inc. | 2,151 |
788 | Boise Cascade Co. | 58,344 | |
1,612 | Brambles Ltd. | 13,191 | |
1,263 | Brenntag AG | 78,938 | |
64 | Brinks Co. (The) | 3,824 | |
909 | 1 | Brookfield Business Corp. | 20,162 |
490 | 1 | Builders Firstsource, Inc. | 31,326 |
2,043 | Bunzl PLC | 75,039 | |
3,499 | Carrier Global Corp. | 155,076 | |
1,106 | 1 | CBIZ, Inc. | 54,913 |
163 | Cheil Jedang Corp. | 9,581 | |
46,000 | China Airlines | 27,443 | |
43,049 | China COSCO Holdings Co. Ltd., Class H | 46,673 | |
121,300 | China Energy Engineering Corp Ltd. | 41,681 | |
34,768 | China Railway Group Ltd. | 19,585 | |
49,100 | China Railway Group Ltd. | 40,602 | |
59,000 | China State Construction Engineering Corp. Ltd. | 48,739 | |
44,000 | China State Construction International Holdings Ltd. | 53,147 | |
18,038 | Cia de Concessoes Rodoviarias | 41,051 | |
2,091 | Cintas Corp. | 965,582 | |
3,500 | CK Hutchison Holdings Ltd. | 20,516 | |
316 | Comfort Systems USA, Inc. | 40,056 | |
346 | Compagnie de St. Gobain | 16,128 | |
1,275 | Costamare, Inc. | 12,291 | |
377 | CRA International, Inc. | 46,469 | |
16,544 | CSX Corp. | 540,823 | |
2,300 | Daifuku Co. | 119,629 | |
3,379 | Dassault Aviation SA | 537,104 | |
9,727 | Deutsche Post AG | 383,670 | |
1,707 | Doosan Bobcat, Inc. | 46,756 | |
474 | Emcor Group, Inc. | 73,423 |
Shares or Principal Amount | Value | ||
COMMON STOCKS— continued | |||
Industrials— continued | |||
3,945 | Emerson Electric Co. | $ 377,813 | |
183 | Encore Wire Corp. | 26,738 | |
11,644 | Epiroc AB | 195,570 | |
1,322 | Ferguson PLC | 149,897 | |
1,557 | GEA Group AG | 62,855 | |
1 | Genco Shipping & Trading Ltd. | 15 | |
3,769 | General Dynamics Corp. | 951,258 | |
122 | 1 | GMS, Inc. | 5,990 |
3,118 | GrafTech International Ltd. | 16,837 | |
4,113 | Grupo Aeroportuario del Pacifico SA, Class B | 66,807 | |
348 | Grupo Aeroportuario del Sureste SAB de CV, Class B | 8,631 | |
1,369 | H&E Equipment Services, Inc. | 57,402 | |
1,283 | Hillenbrand, Inc. | 64,150 | |
321 | Huron Consulting Group, Inc. | 24,993 | |
203 | Hyundai Merchant Marine Co. Ltd. | 3,502 | |
259 | IDEX Corp. | 61,510 | |
1,160 | IMCD Group NV | 172,645 | |
4,532 | Indian Railway Catering & Tourism Corp., Ltd. | 41,470 | |
6,700 | Itochu Corp. | 211,088 | |
314 | 1 | JELD-WEN Holding, Inc. | 3,247 |
3,300 | Jiangsu Zhongtian Technologies Co. Ltd. | 7,730 | |
416 | Kingspan Group PLC | 23,324 | |
917 | Kone Corp. OYJ, Class B | 46,098 | |
241 | Kongsberg Gruppen ASA | 9,981 | |
920 | Korn Ferry | 52,468 | |
21,200 | Kubota Corp. | 315,074 | |
1,470 | Kuehne & Nagel International AG | 357,400 | |
1,485 | L3Harris Technologies, Inc. | 337,214 | |
918 | LG Corp. | 59,302 | |
2,108 | Lockheed Martin Corp. | 1,022,781 | |
494 | 1 | Masonite International Corp. | 37,183 |
1 | Matthews International Corp., Class A | 32 | |
22,400 | Minebea Co. Ltd. | 372,633 | |
37,600 | Mitsubishi Electric Corp. | 379,738 | |
12,700 | MonotaRO Co. Ltd. | 219,285 | |
624 | 1 | MRC Global, Inc. | 7,338 |
810 | Mueller Industries, Inc. | 55,704 | |
27 | 1 | MYR Group, Inc. | 2,579 |
22,098 | NIBE Industrier AB | 210,915 |
Shares or Principal Amount | Value | ||
COMMON STOCKS— continued | |||
Industrials— continued | |||
2,299 | Nordson Corp. | $ 543,690 | |
4,264 | 1 | NuScale Power Corp. | 46,478 |
2 | nVent Electric PLC | 80 | |
258 | Old Dominion Freight Lines, Inc. | 78,073 | |
2,469 | OshKosh Truck Corp. | 227,321 | |
1 | Owens Corning, Inc. | 89 | |
317 | 1 | P.A.M. Transportation Services, Inc. | 8,886 |
10,758 | Pan Ocean Co. Ltd. | 44,775 | |
3,921 | Parker-Hannifin Corp. | 1,172,144 | |
1 | Pitney Bowes, Inc. | 4 | |
12,600 | Power Construction Corp of China Ltd. | 13,521 | |
6,003 | Promotora y Operadora de Infraestructura SAB de CV | 53,222 | |
7,200 | Recruit Holdings Co. Ltd. | 229,812 | |
8,046 | Relx PLC | 225,273 | |
2,270 | Robert Half International, Inc. | 178,831 | |
474 | Ryder System, Inc. | 44,314 | |
889 | S1 Corp. | 43,590 | |
25,974 | Schneider National, Inc. | 669,090 | |
3,900 | SG Holdings Co. Ltd. | 60,782 | |
9,056 | Smiths Group PLC | 174,116 | |
12,000 | TBEA Co. Ltd. | 36,332 | |
862 | Terex Corp. | 39,574 | |
535 | TFI International, Inc. | 58,068 | |
1,639 | Thales SA | 208,498 | |
4,590 | Thomson Reuters Corp. | 540,468 | |
840 | 1 | Titan International, Inc. | 12,037 |
414 | 1 | Titan Machinery, Inc. | 18,228 |
100 | Toto Ltd. | 3,478 | |
362 | 1 | Transdigm Group, Inc. | 227,517 |
364 | 1 | TriNet Group, Inc. | 26,379 |
231 | UFP Industries, Inc. | 18,910 | |
3,371 | United Parcel Service, Inc. | 639,580 | |
566 | Universal Truckload Services, Inc. | 21,491 | |
44 | Veritiv Corp. | 5,920 | |
5,057 | Wabtec Corp. | 511,212 | |
17,895 | Wan Hai Lines Ltd. | 45,061 | |
1,278 | Wartsila OYJ, Class B | 11,151 | |
TOTAL | 17,480,183 |
Shares or Principal Amount | Value | ||
COMMON STOCKS— continued | |||
Information Technology— 10.3% | |||
60,658 | Acer Sertek, Inc. | $ 48,784 | |
934 | 1 | ACI Worldwide, Inc. | 19,521 |
539 | Advanced Energy Industries, Inc. | 49,933 | |
25 | Adyen BV | 38,978 | |
125 | 1 | Alarm.com Holdings, Inc. | 6,237 |
2,241 | Amkor Technology, Inc. | 62,793 | |
437 | 1 | AppFolio, Inc. | 49,857 |
41,842 | Apple, Inc. | 6,193,871 | |
1,217 | ASML Holding N.V. | 740,266 | |
6,783 | Asustek Computer, Inc. | 59,272 | |
847 | Automatic Data Processing, Inc. | 223,727 | |
1 | AvePoint, Inc. | 5 | |
2,534 | 1 | AvidXchange Holdings, Inc. | 21,843 |
8,000 | Azbil Corp. | 245,819 | |
3,279 | Bechtle AG | 117,242 | |
5,439 | 1 | Black Knight, Inc. | 337,164 |
765 | 1 | Blackline, Inc. | 51,783 |
671 | Capgemini SE | 122,169 | |
362 | Cass Information Systems, Inc. | 15,740 | |
3,679 | CDW Corp. | 694,007 | |
1,003 | CGI, Inc., Class A | 87,568 | |
3,672 | 1 | Cirrus Logic, Inc. | 274,335 |
14,643 | Cisco Systems, Inc. | 728,050 | |
2,459 | Cognizant Technology Solutions Corp. | 152,974 | |
66,537 | Compal Electronics, Inc. | 46,926 | |
89 | Concentrix Corp. | 10,892 | |
613 | CSG Systems International, Inc. | 37,908 | |
4,426 | 1 | Datadog, Inc. | 335,402 |
600 | Delta Electronics (Thailand) PLC | 11,507 | |
507 | Digitalocean Holdings, Inc. | 15,124 | |
549 | 1 | DocuSign, Inc. | 25,841 |
20,515 | 1 | Dropbox, Inc. | 483,333 |
498 | 1 | DXC Technology Co. | 14,776 |
2 | 1 | E2open Parent Holdings, Inc. | 12 |
413 | 1 | Fabrinet | 55,098 |
9,914 | 1 | Fortinet, Inc. | 527,028 |
3,357 | 1 | Gartner, Inc., Class A | 1,176,192 |
7,448 | 1 | Globalfoundries, Inc. | 479,279 |
4,694 | 1 | GoDaddy, Inc. | 371,436 |
Shares or Principal Amount | Value | ||
COMMON STOCKS— continued | |||
Information Technology— continued | |||
5,867 | HCL Technologies Ltd. | $ 80,874 | |
22,367 | Hon Hai Precision Industry Co. Ltd. | 73,449 | |
388 | 1 | HubSpot, Inc. | 117,576 |
10,772 | Infosys Ltd. | 220,282 | |
352 | 1 | Insight Enterprises, Inc. | 36,576 |
1 | 1 | Instructure Holdings, Inc. | 25 |
4,900 | Ja Solar Technology Co. Ltd. | 40,144 | |
924 | Jabil, Inc. | 66,704 | |
2,631 | 1 | Knowles Corp. | 41,044 |
1 | Kulicke & Soffa Industries | 48 | |
582 | Larsen & Toubro Ltd. | 14,942 | |
733 | Larsen & Toubro Ltd. | 43,590 | |
23,389 | 1 | Lattice Semiconductor Corp. | 1,703,421 |
70,000 | Lenovo Group Ltd. | 60,292 | |
3,632 | LG Display Co. Ltd. | 40,530 | |
93 | LG Innotek Co. Ltd. | 22,495 | |
23,145 | Lite-On Technology Corp. | 49,574 | |
298 | Logitech International SA | 18,083 | |
320 | LTIMindtree Ltd. | 19,272 | |
600 | Luxshare Precision Industry Co. Ltd. | 2,640 | |
5,189 | Mastercard, Inc. | 1,849,360 | |
620 | Maximus, Inc. | 43,586 | |
732 | 1 | MaxLinear, Inc. | 26,791 |
1,197 | MediaTek, Inc. | 29,056 | |
1,047 | 1 | MeridianLink, Inc. | 15,370 |
142 | Methode Electronics, Inc., Class A | 6,487 | |
6,125 | Micron Technology, Inc. | 353,106 | |
18,218 | Microsoft Corp. | 4,648,141 | |
12,000 | Micro-Star International Co. | 48,568 | |
1,604 | Mphasis Ltd. | 40,360 | |
653 | Nemetschek AG | 31,776 | |
4,291 | NetApp, Inc. | 290,114 | |
3,900 | Ninestar Corp. | 29,629 | |
14,626 | Nokia Oyj | 71,645 | |
11,900 | Nomura Research Institute Ltd. | 264,101 | |
300 | Omron Corp. | 15,653 | |
17,614 | 1 | ON Semiconductor Corp. | 1,324,573 |
6,041 | Open Text Corp. | 177,392 | |
2,086 | 1 | Pagerduty, Inc. | 46,393 |
Shares or Principal Amount | Value | ||
COMMON STOCKS— continued | |||
Information Technology— continued | |||
25,503 | 1 | Palantir Technologies, Inc. | $ 191,272 |
7,000 | Prime View International Co. Ltd. | 41,941 | |
1,066 | Progress Software Corp. | 56,839 | |
2,263 | PTC, Inc. | 287,876 | |
129 | 1 | Qualys, Inc. | 15,908 |
24,000 | Quanta Computer, Inc. | 56,129 | |
1 | 1 | Rackspace Technology, Inc. | 5 |
1,385 | 1 | Rambus, Inc. | 53,156 |
34,400 | Ricoh Co. Ltd. | 274,028 | |
9,514 | Sage Group PLC/The | 91,757 | |
586 | Samsung Electro-Mechanics Co. | 64,077 | |
13,667 | Samsung Electronics Co. Ltd. | 656,340 | |
77 | Samsung SDI Co. Ltd. | 43,359 | |
300 | Samsung SDS Co. Ltd. | 29,367 | |
71 | 1 | Sanmina Corp. | 4,692 |
2,154 | SAP SE | 233,128 | |
65 | 1 | ScanSource, Inc. | 1,941 |
1,494 | SK Hynix, Inc. | 98,823 | |
2,245 | 1 | SMART Global Holdings, Inc. | 37,963 |
407 | 1 | Snowflake, Inc. | 58,160 |
1 | 1 | SPS Commerce, Inc. | 142 |
5,181 | STMicroelectronics N.V. | 200,477 | |
18,800 | Sumisho Computer Systems Corp. | 303,846 | |
200 | 1 | Super Micro Computer, Inc. | 18,046 |
25,655 | Synnex Technology International Corp. | 48,868 | |
304 | 1 | Synopsys, Inc. | 103,220 |
56,122 | Taiwan Semiconductor Manufacturing Co. Ltd. | 896,616 | |
3,325 | Tata Consultancy Services Ltd. | 140,284 | |
502 | Tata Elxsi Ltd. | 43,146 | |
7,000 | Tcl Zhonghuan Renewable Energy Technology Co. Ltd. | 40,947 | |
4,349 | Tech Mahindra Ltd. | 58,514 | |
16,914 | Telefonaktiebolaget LM Ericsson | 106,518 | |
9 | TEMENOS Group AG | 559 | |
302 | 1 | Tenable Holdings, Inc. | 11,530 |
432 | TTEC Holdings, Inc. | 20,714 | |
13,000 | Unimicron Technology Corp. | 67,598 | |
59,568 | United Microelectronics Corp. | 90,724 | |
9,212 | Visa, Inc., Class A | 1,999,004 | |
2,673 | Vishay Intertechnology, Inc. | 61,586 |
Shares or Principal Amount | Value | ||
COMMON STOCKS— continued | |||
Information Technology— continued | |||
1,424 | Wisetech Global Ltd. | $ 56,627 | |
1 | 1 | Yext, Inc. | 5 |
4,100 | Zhejiang Jingsheng Mechanical & Electrical Co. Ltd. | 37,390 | |
23,400 | ZTE Corp. | 51,315 | |
401 | 1 | Zuora, Inc. | 3,080 |
TOTAL | 32,553,871 | ||
Materials— 2.5% | |||
1,250 | AdvanSix, Inc. | 51,450 | |
3,242 | Alcoa Corp. | 162,521 | |
57 | Alpha Metallurgical Resources, Inc. | 9,760 | |
44,236 | 2 | Alrosa AO | 0 |
42,000 | Aluminum Corp. of China Ltd. | 17,815 | |
1 | American Vanguard Corp. | 23 | |
9,952 | ArcelorMittal SA | 270,018 | |
22,900 | Asahi Kasei Corp. | 170,677 | |
4,754 | Ashland, Inc. | 531,830 | |
193 | Asian Paints (India) Ltd. | 7,611 | |
12,697 | BHP Steel Ltd. | 153,015 | |
753 | Boliden AB | 28,489 | |
1,988 | CF Industries Holdings, Inc. | 215,082 | |
11,914 | Chemours Co./The | 369,930 | |
3,401 | 2 | Cherepovets MK Severstal | 0 |
21,877 | China Hongqiao Group Ltd. | 20,581 | |
22,000 | China National Building Material Co. Ltd. | 19,627 | |
603 | Clariant AG | 9,857 | |
115 | 1 | Clearwater Paper Corp. | 4,488 |
90,000 | CMOC Group Ltd. | 42,138 | |
36,600 | CMOC Group Ltd. | 24,000 | |
1 | Commercial Metals Corp. | 49 | |
13,785 | Companhia Vale Do Rio Doce | 227,680 | |
1,669 | 1 | Constellium SE | 20,779 |
2,060 | CRH PLC | 82,465 | |
2,643 | Dow, Inc. | 134,714 | |
7,295 | Eagle Materials, Inc. | 994,600 | |
5,107 | 1,2 | Ferroglobe Representation & Warranty Insurance Trust | 0 |
5,000 | Formosa Plastic Corp. | 14,700 | |
80 | Givaudan SA | 272,847 | |
40,328 | Glencore PLC | 272,824 | |
138 | Greif, Inc., Class A | 9,703 |
Shares or Principal Amount | Value | ||
COMMON STOCKS— continued | |||
Materials— continued | |||
646 | Hawkins, Inc. | $ 26,874 | |
1 | Hecla Mining Co. | 5 | |
3,776 | HeidelbergCement AG | 204,624 | |
10,925 | Hindalco Industries Ltd. | 61,284 | |
1,793 | Hyundai Steel Co. | 46,999 | |
520 | 1 | Intrepid Potash, Inc. | 18,746 |
451 | Korea Kumho Petrochemical Co. Ltd. | 51,854 | |
48 | L.G. Chemical Ltd. | 27,447 | |
802 | Linde PLC | 269,857 | |
2,450 | Nitto Denko Corp. | 155,162 | |
362 | 2 | Norilsk Nickel | 0 |
3,629 | Norsk Hydro ASA | 27,383 | |
23,929 | 2 | Novolipetski Metallurgicheski Komb OAO | 0 |
4,764 | Nuevo Grupo Mexico SA, Class B | 19,383 | |
5,678 | Nutrien Ltd. | 456,342 | |
3,038 | Oci NV | 128,858 | |
5,952 | Olin Corp. | 339,145 | |
26,790 | Orbia Advance Corp. SAB de CV | 52,486 | |
26,700 | Petronas Chemicals BHD | 51,460 | |
4 | 2 | Polymetal International PLC | 0 |
274 | 2 | Polyus PJSC | 0 |
352 | POSCO Holdings, Inc. | 80,226 | |
137,400 | PT Aneka Tambang Tbk | 17,590 | |
4,315 | 1 | Queen’s Road Capital Investment Ltd. | 2,213 |
1 | 1 | Resolute Forest Products | 21 |
4,995 | Rio Tinto PLC | 339,334 | |
22,500 | Rongsheng Petrochemical Co. Ltd. | 39,255 | |
66,277 | 2 | Rusal | 0 |
1,024 | Ryerson Holding Corp. | 30,198 | |
1,252 | Sahara International Petrochemical Co. | 12,041 | |
1,472 | Saudi Arabian Fertilizers Co. | 56,837 | |
737 | Saudi Arabian Mining Co. | 13,547 | |
4,079 | Saudi Basic Industries Corp. | 90,460 | |
667 | Smurfit Kappa Group PLC | 24,311 | |
200 | Solvay S.A. | 19,625 | |
201,358 | South32 Ltd. | 556,677 | |
1,527 | SRF Ltd. | 44,922 | |
1,486 | Stora Enso Oyj, Class R | 22,017 | |
47,851 | Tata Steel Ltd. | 63,965 |
Shares or Principal Amount | Value | ||
COMMON STOCKS— continued | |||
Materials— continued | |||
345 | 1 | TimkenSteel Corp. | $ 6,452 |
14,400 | Toray Industries, Inc. | 78,102 | |
310 | Trinseo PLC | 7,642 | |
1,375 | Trox Holdings Plc | 19,429 | |
714 | Ultra Tech Cement, Ltd. | 62,268 | |
565 | Umicore SA | 20,517 | |
1,439 | UPM - Kymmene Oyj | 53,088 | |
313 | Va Stahl Ag | 8,523 | |
998 | Valhi, Inc. | 22,216 | |
954 | Warrior Met Coal, Inc. | 35,126 | |
447 | Yara International ASA | 20,464 | |
31,054 | Zijin Mining Group Co. Ltd. | 40,543 | |
TOTAL | 7,864,791 | ||
Real Estate— 1.7% | |||
3,780 | American Tower Corp. | 836,325 | |
4,324 | Armada Hoffler Properties, Inc. | 52,537 | |
1 | Brandywine Realty Trust | 7 | |
7,554 | British Land Co. PLC/The | 36,477 | |
382 | 1 | CBRE Group, Inc. | 30,407 |
285,000 | 2 | China Evergrande Group | 24,015 |
19,400 | China Merchants Shekou Industrial Zone Holdings Co. Ltd. | 41,781 | |
3 | 1 | Compass, Inc. | 9 |
3,583 | Crown Castle, Inc. | 506,744 | |
4,623 | 1 | Cushman & Wakefield PLC | 52,795 |
12,200 | Daiwa House Industry Co. Ltd. | 282,419 | |
1,835 | DigitalBridge Group, Inc. | 26,479 | |
3 | DLF Ltd. | 15 | |
5,165 | Douglas Elliman, Inc. | 21,280 | |
1,425 | Equinix, Inc. | 984,176 | |
2,629 | Essential Properties Realty Trust, Inc. | 61,019 | |
126 | Extra Space Storage, Inc. | 20,247 | |
3,588 | Farmland Partners, Inc. | 47,649 | |
13 | FirstService Corp. | 1,684 | |
2,752 | 1 | Forestar Group, Inc. | 40,812 |
36,000 | Franshion Properties of China Ltd. | 8,472 | |
808 | Global Medical REIT, Inc. | 8,161 | |
2,607 | 1 | Godrej Properties Ltd. | 42,304 |
14,820 | Goodman Group | 195,837 | |
34,411 | Greentown China Holdings Ltd. | 58,729 |
Shares or Principal Amount | Value | ||
COMMON STOCKS— continued | |||
Real Estate— continued | |||
659 | Independence Realty Trust | $ 11,941 | |
1,478 | Klepierre SA | 34,438 | |
181,000 | Land & Houses Public Co. Ltd. | 49,404 | |
81 | Land Securities Group PLC | 610 | |
749 | LEG Immobilien SE | 47,119 | |
3,000 | Mitsubishi Estate Co. Ltd. | 42,613 | |
2,849 | Newmark Group, Inc. | 24,160 | |
1 | Paramount Group, Inc. | 7 | |
320 | Plymouth Industrial REIT, Inc. | 6,624 | |
18,400 | Poly Real Estate Group Co. Ltd. | 42,899 | |
2,000 | ProLogis, Inc. | 235,580 | |
2,193 | Public Storage | 653,426 | |
350 | RioCan REIT | 5,500 | |
46,500 | Ruentex Development Co. Ltd. | 70,557 | |
1 | STAG Industrial, Inc. | 33 | |
42,500 | Sun Hung Kai Properties Ltd. | 513,935 | |
17,000 | 2 | Sunac China Holdings | 8,208 |
2,325 | UMH Properties, Inc. | 40,943 | |
6,883 | Uniti Group, Inc. | 52,448 | |
11,373 | Vicinity Centres | 15,862 | |
435 | Warehouses De Pauw SCA | 11,665 | |
37,000 | Yuexiu Property Co. Ltd. | 46,813 | |
TOTAL | 5,295,165 | ||
Utilities— 1.7% | |||
63 | Adani Gas Ltd. | 2,845 | |
12,000 | Beijing Enterprises Holdings Ltd. | 38,231 | |
1,277 | Brookfield Infrastructure Corp. | 59,866 | |
942 | CEZ A.S. | 32,378 | |
27,100 | China National Nuclear Power Co. Ltd. | 23,786 | |
37,000 | China Power International Development Ltd. | 14,344 | |
4,109 | 1 | Companhia de Saneamento Basico do Estado de Sao Paulo | 47,738 |
6,017 | CPFL Energia SA | 40,466 | |
777 | EDP Renovaveis SA | 17,828 | |
54,200 | Enel SpA | 295,310 | |
7,486 | Energias de Portugal SA | 35,203 | |
7,864 | Engie | 120,363 | |
5,302 | Engie Brasil Energia SA | 40,357 | |
9,317 | Entergy Corp. | 1,083,288 | |
1,196 | Fortum Oyj | 18,927 |
Shares or Principal Amount | Value | ||
COMMON STOCKS— continued | |||
Utilities— continued | |||
37,733 | Gail India Ltd. | $ 44,008 | |
386 | Hawaiian Electric Industries, Inc. | 15,857 | |
102,000 | Huaneng Power International, Inc. | 47,102 | |
18,400 | Huaneng Power International, Inc. | 20,048 | |
6,535 | Hydro One Ltd. | 182,765 | |
5,978 | Iberdrola SA | 67,664 | |
3 | Indraprastha Gas Ltd. | 16 | |
57 | Korea Electric Power Corp. | 904 | |
3,469 | Meridian Energy Ltd. | 10,769 | |
1,861 | Mighty River Power Ltd. | 6,476 | |
8,940 | Naturgy Energy Group SA | 250,347 | |
183 | Oesterreichische Elektrizitaetswirtschafts AG | 16,611 | |
1,951 | OGE Energy Corp. | 78,937 | |
1,181,504 | 2 | OJSC Inter Rao Ues | 0 |
96 | ONE Gas, Inc. | 8,347 | |
5,235 | Origin Energy Ltd. | 28,398 | |
751 | Otter Tail Corp. | 44,782 | |
5,895 | Pinnacle West Capital Corp. | 461,696 | |
1,101 | PNM Resources, Inc. | 53,949 | |
1,066 | Portland General Electric Co. | 52,479 | |
3,539 | RWE AG | 155,167 | |
7,474 | Saudi Electricity Global, Class SECO AB | 49,413 | |
37,730 | Terna SpA | 290,908 | |
3,200 | Tokyo Gas Co. Ltd. | 59,012 | |
16,558 | United Utilities Group PLC | 205,444 | |
13,521 | WEC Energy Group, Inc. | 1,340,472 | |
TOTAL | 5,362,501 | ||
TOTAL COMMON STOCKS (IDENTIFIED COST $145,061,124) | 168,921,132 | ||
FOREIGN GOVERNMENTS/AGENCIES— 7.0% | |||
Sovereign— 7.0% | |||
AUD 650,000 | Australia, Government of, Sr. Unsecd. Note, Series 148, 2.750%, 11/21/2027 | 430,406 | |
EUR 390,000 | Belgium, Government of, Series 68, 2.250%, 6/22/2023 | 406,030 | |
180,000 | Belgium, Government of, Series 74, 0.800%, 6/22/2025 | 181,242 | |
400,000 | Belgium, Government of, Sr. Unsecd. Note, Series 86, 1.250%, 4/22/2033 | 370,292 | |
CAD 350,000 | Canada, Government of, 5.750%, 6/1/2033 | 324,079 | |
480,000 | Canada, Government of, Series WL43, 5.750%, 6/1/2029 | 415,223 | |
200,000 | Canada, Government of, Unsecd. Note, 1.250%, 3/1/2027 | 136,816 |
Shares or Principal Amount | Value | ||
FOREIGN GOVERNMENTS/AGENCIES— continued | |||
Sovereign— continued | |||
CAD 460,000 | Canada, Government of, Unsecd. Note, 2.250%, 6/1/2025 | $ 330,647 | |
EUR 6,000 | France, Government of, 0.500%, 5/25/2025 | 5,986 | |
400,000 | France, Government of, 5.750%, 10/25/2032 | 538,962 | |
150,000 | France, Government of, Bond, 4.500%, 4/25/2041 | 196,588 | |
850,000 | France, Government of, O.A.T., 5.500%, 4/25/2029 | 1,054,431 | |
450,000 | France, Government of, Unsecd. Note, 1.250%, 5/25/2036 | 395,764 | |
200,000 | France, Government of, Unsecd. Note, 1.750%, 5/25/2066 | 167,206 | |
300,000 | France, Government of, Unsecd. Note, 1.750%, 6/25/2039 | 277,951 | |
600,000 | Germany, Government of, 0.250%, 2/15/2027 | 582,554 | |
500,000 | Germany, Government of, Bond, Series 03, 4.750%, 7/4/2034 | 669,841 | |
300,000 | Germany, Government of, Bond, Series 08, 4.750%, 7/4/2040 | 438,148 | |
500,000 | Germany, Government of, Unsecd. Note, 0.500%, 2/15/2025 | 503,349 | |
680,000 | Italy, Government of, Sr. Unsecd. Note, 0.650%, 10/15/2023 | 696,694 | |
800,000 | Italy, Government of, Sr. Unsecd. Note, 4.750%, 9/1/2028 | 892,960 | |
1,250,000 | Italy, Government of, Unsecd. Note, 1.600%, 6/1/2026 | 1,237,877 | |
208,000 | Italy, Government of, Unsecd. Note, 3.250%, 9/1/2046 | 196,051 | |
JPY 80,000,000 | JAPAN (40 YEAR ISSUE), Sr. Unsecd. Note, Series 12, 0.500%, 3/20/2059 | 411,975 | |
122,000,000 | Japan, Government of, Sr. Unsecd. Note, Series 114, 2.100%, 12/20/2029 | 999,518 | |
100,000,000 | Japan, Government of, Sr. Unsecd. Note, Series 122, 1.800%, 9/20/2030 | 809,776 | |
185,000,000 | Japan, Government of, Sr. Unsecd. Note, Series 153, 1.300%, 6/20/2035 | 1,448,410 | |
90,000,000 | Japan, Government of, Sr. Unsecd. Note, Series 351, 0.100%, 6/20/2028 | 650,022 | |
155,000,000 | Japan, Government of, Sr. Unsecd. Note, Series 44, 1.700%, 9/20/2044 | 1,226,777 | |
90,000,000 | Japan, Government of, Sr. Unsecd. Note, Series 58, 0.800%, 3/20/2048 | 572,881 | |
$ 30,000 | Mexico, Government of, Series MTNA, 6.750%, 9/27/2034 | 31,865 | |
MXN 15,000,000 | Mexico, Government of, Sr. Unsecd. Note, Series M, 5.750%, 3/5/2026 | 693,301 | |
EUR 250,000 | Netherlands, Government of, Unsecd. Note, 2.500%, 1/15/2033 | 266,128 | |
60,000 | Netherlands, Government of, Unsecd. Note, 2.750%, 1/15/2047 | 70,699 | |
80,000 | Netherlands, Government of, Unsecd. Note, 3.750%, 1/15/2042 | 103,458 | |
250,000 | Spain, Government of, 4.200%, 1/31/2037 | 292,712 | |
600,000 | Spain, Government of, Sr. Unsecd. Note, 1.500%, 4/30/2027 | 599,397 | |
340,000 | Spain, Government of, Sr. Unsecd. Note, 1.950%, 7/30/2030 | 335,193 | |
480,000 | Spain, Government of, Sr. Unsecd. Note, 2.750%, 10/31/2024 | 503,188 | |
100,000 | Spain, Government of, Sr. Unsecd. Note, 2.900%, 10/31/2046 | 99,336 |
Shares or Principal Amount | Value | ||
FOREIGN GOVERNMENTS/AGENCIES— continued | |||
Sovereign— continued | |||
GBP 200,000 | United Kingdom, Government of, 2.750%, 9/7/2024 | $ 238,489 | |
430,000 | United Kingdom, Government of, 3.250%, 1/22/2044 | 493,236 | |
270,000 | United Kingdom, Government of, Bond, 4.250%, 3/7/2036 | 353,322 | |
480,000 | United Kingdom, Government of, Unsecd. Deb., 1.625%, 10/22/2028 | 529,509 | |
600,000 | United Kingdom, Government of, Unsecd. Note, 1.500%, 7/22/2047 | 484,431 | |
380,000 | United Kingdom, Government of, Unsecd. Note, 4.250%, 6/7/2032 | 498,541 | |
TOTAL FOREIGN GOVERNMENTS/AGENCIES (IDENTIFIED COST $25,855,375) | 22,161,261 | ||
CORPORATE BONDS— 6.7% | |||
Basic Industry - Metals & Mining— 0.0% | |||
$ 100,000 | Reliance Steel & Aluminum Co., Sr. Unsecd. Note, 4.500%, 4/15/2023 | 99,764 | |
Capital Goods - Aerospace & Defense— 0.3% | |||
350,000 | Boeing Co., Sr. Unsecd. Note, 4.875%, 5/1/2025 | 346,955 | |
145,000 | Huntington Ingalls Industries, Inc., Sr. Unsecd. Note, Series WI, 3.844%, 5/1/2025 | 139,949 | |
300,000 | Leidos, Inc., Sr. Unsecd. Note, Series WI, 2.300%, 2/15/2031 | 232,540 | |
215,000 | Leidos, Inc., Sr. Unsecd. Note, Series WI, 3.625%, 5/15/2025 | 207,389 | |
90,000 | Lockheed Martin Corp., Sr. Unsecd. Note, 3.550%, 1/15/2026 | 88,013 | |
90,000 | 4 | Textron Financial Corp., Jr. Sub. Note, 144A, 6.341% (3-month USLIBOR +1.735%), 2/15/2042 | 63,178 |
TOTAL | 1,078,024 | ||
Capital Goods - Building Materials— 0.0% | |||
125,000 | Allegion PLC, Sr. Unsecd. Note, 3.500%, 10/1/2029 | 108,483 | |
Capital Goods - Construction Machinery— 0.1% | |||
315,000 | Ashtead Capital, Inc., Sr. Unsecd. Note, 144A, 2.450%, 8/12/2031 | 244,297 | |
195,000 | Deere & Co., Sr. Unsecd. Note, 2.750%, 4/15/2025 | 187,656 | |
TOTAL | 431,953 | ||
Capital Goods - Diversified Manufacturing— 0.0% | |||
17,000 | General Electric Capital Corp., Note, Series MTNA, 6.750%, 3/15/2032 | 19,323 | |
75,000 | Lennox International, Inc., Sr. Unsecd. Note, 1.700%, 8/1/2027 | 64,259 | |
TOTAL | 83,582 | ||
Communications - Cable & Satellite— 0.0% | |||
30,000 | Charter Communications Operating, LLC/Charter Communications Operating Capital Corp., 5.050%, 3/30/2029 | 28,562 | |
Communications - Media & Entertainment— 0.2% | |||
20,000 | Discovery Communications LLC, Sr. Unsecd. Note, 4.900%, 3/11/2026 | 19,451 | |
70,000 | Grupo Televisa S.A., Sr. Unsecd. Note, 6.125%, 1/31/2046 | 69,687 | |
500,000 | Meta Platforms, Inc., Sr. Unsecd. Note, 144A, 4.450%, 8/15/2052 | 411,598 |
Shares or Principal Amount | Value | ||
CORPORATE BONDS— continued | |||
Communications - Media & Entertainment— continued | |||
$ 178,000 | Paramount Global, Sr. Unsecd. Note, 4.750%, 5/15/2025 | $ 176,485 | |
TOTAL | 677,221 | ||
Communications - Telecom Wireless— 0.2% | |||
80,000 | T-Mobile USA, Inc., 2.250%, 11/15/2031 | 63,754 | |
300,000 | T-Mobile USA, Inc., Sec. Fac. Bond, 3.400%, 10/15/2052 | 210,005 | |
500,000 | T-Mobile USA, Inc., Series WI, 2.700%, 3/15/2032 | 410,803 | |
TOTAL | 684,562 | ||
Communications - Telecom Wirelines— 0.1% | |||
364,000 | AT&T, Inc., Sr. Unsecd. Note, 3.550%, 9/15/2055 | 255,882 | |
Consumer Cyclical - Automotive— 0.1% | |||
70,000 | General Motors Co., Sr. Unsecd. Note, 4.200%, 10/1/2027 | 66,660 | |
235,000 | General Motors Financial Co., Inc., Sr. Unsecd. Note, 3.100%, 1/12/2032 | 188,734 | |
TOTAL | 255,394 | ||
Consumer Cyclical - Retailers— 0.3% | |||
600,000 | Advance Auto Parts, Inc., Sr. Unsecd. Note, Series WI, 3.900%, 4/15/2030 | 529,533 | |
225,000 | AutoNation, Inc., Sr. Unsecd. Note, 4.750%, 6/1/2030 | 202,944 | |
300,000 | AutoZone, Inc., Sr. Unsecd. Note, 3.250%, 4/15/2025 | 288,634 | |
55,812 | CVS Health Corp., Pass Thru Cert., 144A, 5.298%, 1/11/2027 | 55,359 | |
TOTAL | 1,076,470 | ||
Consumer Cyclical - Services— 0.1% | |||
200,000 | Alibaba Group Holding Ltd., Sr. Unsecd. Note, 2.800%, 6/6/2023 | 197,590 | |
130,000 | Visa, Inc., Sr. Unsecd. Note, 3.150%, 12/14/2025 | 125,254 | |
TOTAL | 322,844 | ||
Consumer Non-Cyclical - Food/Beverage— 0.1% | |||
210,000 | Flowers Foods, Inc., Sr. Unsecd. Note, 3.500%, 10/1/2026 | 198,076 | |
120,000 | Mead Johnson Nutrition Co., Sr. Unsecd. Note, 4.125%, 11/15/2025 | 118,363 | |
TOTAL | 316,439 | ||
Consumer Non-Cyclical - Health Care— 0.3% | |||
210,000 | Agilent Technologies, Inc., Sr. Unsecd. Note, 2.750%, 9/15/2029 | 183,916 | |
180,000 | Dentsply Sirona, Inc., Sr. Unsecd. Note, 3.250%, 6/1/2030 | 149,350 | |
105,000 | GE Healthcare Holding LLC, Sr. Unsecd. Note, 144A, 6.377%, 11/22/2052 | 117,005 | |
400,000 | PerkinElmer, Inc., Sr. Unsecd. Note, 3.300%, 9/15/2029 | 349,581 | |
TOTAL | 799,852 | ||
Consumer Non-Cyclical - Pharmaceuticals— 0.0% | |||
90,000 | Gilead Sciences, Inc., Sr. Unsecd. Note, 3.650%, 3/1/2026 | 87,172 | |
Consumer Non-Cyclical - Products— 0.1% | |||
220,000 | Church & Dwight Co., Inc., Sr. Unsecd. Note, 2.300%, 12/15/2031 | 178,914 |
Shares or Principal Amount | Value | ||
CORPORATE BONDS— continued | |||
Consumer Non-Cyclical - Tobacco— 0.4% | |||
EUR 520,000 | Philip Morris International, Inc., Sr. Unsecd. Note, 2.875%, 5/14/2029 | $ 503,530 | |
$ 450,000 | Philip Morris International, Inc., Sr. Unsecd. Note, 5.750%, 11/17/2032 | 463,744 | |
200,000 | Reynolds American, Inc., Sr. Unsecd. Note, 5.850%, 8/15/2045 | 175,120 | |
TOTAL | 1,142,394 | ||
Energy - Independent— 0.1% | |||
400,000 | Diamondback Energy, Inc., Sr. Unsecd. Note, 6.250%, 3/15/2053 | 402,895 | |
Energy - Integrated— 0.1% | |||
340,000 | Exxon Mobil Corp., Sr. Unsecd. Note, 2.992%, 3/19/2025 | 329,545 | |
35,000 | Petro-Canada, Deb., 7.000%, 11/15/2028 | 37,839 | |
TOTAL | 367,384 | ||
Energy - Midstream— 0.3% | |||
130,000 | Boardwalk Pipeline Partners LP, Sr. Unsecd. Note, 3.600%, 9/1/2032 | 109,150 | |
325,000 | Energy Transfer Partners LP, Sr. Unsecd. Note, 4.050%, 3/15/2025 | 315,785 | |
80,000 | MPLX LP, Sr. Unsecd. Note, 4.125%, 3/1/2027 | 76,395 | |
190,000 | ONEOK, Inc., Sr. Unsecd. Note, 6.100%, 11/15/2032 | 193,629 | |
70,000 | Targa Resources, Inc., Sr. Unsecd. Note, 4.200%, 2/1/2033 | 61,287 | |
250,000 | Targa Resources, Inc., Sr. Unsecd. Note, 6.250%, 7/1/2052 | 242,042 | |
TOTAL | 998,288 | ||
Energy - Refining— 0.1% | |||
250,000 | Marathon Petroleum Corp., Sr. Unsecd. Note, 4.750%, 9/15/2044 | 213,344 | |
Financial Institution - Banking— 0.8% | |||
500,000 | Bank of America Corp., Sr. Unsecd. Note, 5.015%, 7/22/2033 | 483,067 | |
100,000 | Bank of America Corp., Sr. Unsecd. Note, Series MTN, 4.875%, 4/1/2044 | 91,408 | |
300,000 | Bank of America Corp., Sub. Note, Series MTN, 4.000%, 1/22/2025 | 294,262 | |
115,000 | Citigroup, Inc., Sr. Unsecd. Note, 3.057%, 1/25/2033 | 94,613 | |
300,000 | Citigroup, Inc., Sr. Unsecd. Note, 3.785%, 3/17/2033 | 262,170 | |
250,000 | Citizens Bank N.A., Sr. Unsecd. Note, Series BKNT, 3.750%, 2/18/2026 | 239,790 | |
250,000 | Compass Bank, Birmingham, Sub. Note, Series BKNT, 3.875%, 4/10/2025 | 243,335 | |
250,000 | FNB Corp. (PA), Sr. Unsecd. Note, 5.150%, 8/25/2025 | 248,028 | |
100,000 | JPMorgan Chase & Co., Series S, 6.750%, 8/1/2071 | 99,216 | |
50,000 | JPMorgan Chase & Co., Sub. Note, 3.375%, 5/1/2023 | 49,676 | |
70,000 | Morgan Stanley, Sr. Unsecd. Note, Series MTN, 1.794%, 2/13/2032 | 53,341 | |
13,485 | 2 | Regional Diversified Funding, 144A, 9.250%, 3/15/2030 | 5,664 |
300,000 | US Bancorp, Sr. Unsecd. Note, Series MTN, 1.375%, 7/22/2030 | 234,083 | |
TOTAL | 2,398,653 |
Shares or Principal Amount | Value | ||
CORPORATE BONDS— continued | |||
Financial Institution - Broker/Asset Mgr/Exchange— 0.1% | |||
$ 140,000 | Invesco Finance PLC, Sr. Unsecd. Note, 3.750%, 1/15/2026 | $ 134,729 | |
70,000 | TIAA Asset Management Finance Co. LLC, Sr. Unsecd. Note, 144A, 4.125%, 11/1/2024 | 68,109 | |
TOTAL | 202,838 | ||
Financial Institution - Finance Companies— 0.1% | |||
220,000 | Air Lease Corp., Sr. Unsecd. Note, 5.850%, 12/15/2027 | 218,621 | |
Financial Institution - Insurance - Life— 0.0% | |||
10,000 | MetLife, Inc., Jr. Sub. Note, 10.750%, 8/1/2039 | 13,226 | |
105,000 | Northwestern Mutual Life Insurance Co., Sr. Unsecd. Note, 144A, 3.625%, 9/30/2059 | 74,132 | |
TOTAL | 87,358 | ||
Financial Institution - Insurance - P&C— 0.0% | |||
75,000 | Nationwide Mutual Insurance Co., Sub., 144A, 4.350%, 4/30/2050 | 57,650 | |
Financial Institution - REIT - Apartment— 0.1% | |||
300,000 | Mid-America Apartment Communities LP, Sr. Unsecd. Note, 3.750%, 6/15/2024 | 293,342 | |
140,000 | UDR, Inc., Sr. Unsecd. Note, Series MTN, 2.950%, 9/1/2026 | 128,610 | |
TOTAL | 421,952 | ||
Financial Institution - REIT - Healthcare— 0.1% | |||
500,000 | Welltower, Inc., Sr. Unsecd. Note, 2.750%, 1/15/2032 | 397,519 | |
Financial Institution - REIT - Other— 0.1% | |||
160,000 | WP Carey, Inc., Sr. Unsecd. Note, 4.600%, 4/1/2024 | 159,102 | |
Financial Institution - REITs— 0.0% | |||
70,000 | Camden Property Trust, Sr. Unsecd. Note, 2.800%, 5/15/2030 | 60,260 | |
Food Products— 0.0% | |||
INR 73,689 | Britannia Industries Ltd., Unsecd. Note, Series N3, 5.500%, 6/3/2024 | 879 | |
Foreign-Local-Government— 0.0% | |||
$ 50,000 | Quebec, Province of, Note, Series MTNA, 7.035%, 3/10/2026 | 53,383 | |
Municipal Services— 0.0% | |||
100,000 | Camp Pendleton & Quantico Housing LLC, 5.572%, 10/1/2050 | 92,782 | |
Sovereign— 0.1% | |||
JPY 30,000,000 | KFW, 2.050%, 2/16/2026 | 229,916 | |
Technology— 0.7% | |||
$ 45,000 | Broadcom, Inc., Sr. Unsecd. Note, 144A, 3.750%, 2/15/2051 | 31,833 | |
250,000 | CDW LLC / CDW Finance, Sr. Unsecd. Note, 2.670%, 12/1/2026 | 222,046 | |
320,000 | Dell International LLC / EMC Corp., Sr. Unsecd. Note, 6.020%, 6/15/2026 | 326,974 | |
280,000 | Intel Corp., Sr. Unsecd. Note, 3.400%, 3/25/2025 | 273,449 | |
300,000 | Keysight Technologies, Inc., Sr. Unsecd. Note, 4.550%, 10/30/2024 | 296,164 |
Shares or Principal Amount | Value | ||
CORPORATE BONDS— continued | |||
Technology— continued | |||
$ 380,000 | Molex Electronics Technologies LLC, Unsecd. Note, 144A, 3.900%, 4/15/2025 | $ 362,503 | |
500,000 | Oracle Corp., Sr. Unsecd. Note, 6.250%, 11/9/2032 | 528,088 | |
TOTAL | 2,041,057 | ||
Technology Services— 0.1% | |||
270,000 | Global Payments, Inc., Sr. Unsecd. Note, 2.900%, 11/15/2031 | 214,455 | |
Transportation - Airlines— 0.0% | |||
140,000 | Southwest Airlines Co., Sr. Unsecd. Note, 5.250%, 5/4/2025 | 140,890 | |
Transportation - Railroads— 0.1% | |||
240,000 | Canadian Pacific Railway Co., Sr. Unsecd. Note, 3.000%, 12/2/2041 | 181,025 | |
Transportation - Services— 0.1% | |||
62,000 | Enterprise Rent-A-Car USA Finance Co., Sr. Unsecd. Note, 144A, 3.850%, 11/15/2024 | 60,064 | |
160,000 | United Parcel Service, Inc., Sr. Unsecd. Note, 3.900%, 4/1/2025 | 157,989 | |
TOTAL | 218,053 | ||
Utility - Electric— 1.2% | |||
150,000 | Alabama Power Co., Sr. Unsecd. Note, 3.000%, 3/15/2052 | 103,309 | |
185,000 | Ameren Corp., Sr. Unsecd. Note, 1.950%, 3/15/2027 | 163,014 | |
155,000 | Berkshire Hathaway Energy Co., Sr. Unsecd. Note, Series WI, 4.050%, 4/15/2025 | 153,621 | |
400,000 | Dominion Energy, Inc., Sr. Unsecd. Note, Series C, 2.250%, 8/15/2031 | 320,594 | |
275,000 | Electricite de France SA, Sr. Unsecd. Note, 144A, 4.500%, 9/21/2028 | 260,221 | |
190,000 | Emera US Finance LP, Sr. Unsecd. Note, 4.750%, 6/15/2046 | 150,894 | |
400,000 | Enel Finance International NV, Sr. Unsecd. Note, 144A, 2.650%, 9/10/2024 | 382,478 | |
500,000 | EverSource Energy, Sr. Unsecd. Note, 4.600%, 7/1/2027 | 495,419 | |
300,000 | Exelon Corp., Sr. Unsecd. Note, 3.400%, 4/15/2026 | 286,928 | |
160,000 | Florida Power & Light Co., Sec. Fac. Bond, 2.850%, 4/1/2025 | 153,676 | |
140,000 | National Rural Utilities Cooperative Finance Corp., Sr. Sub. Note, 5.250%, 4/20/2046 | 125,801 | |
200,000 | NiSource Finance Corp., Sr. Unsecd. Note, 3.950%, 3/30/2048 | 158,171 | |
400,000 | Northeast Utilities, Sr. Unsecd. Note, Series H, 3.150%, 1/15/2025 | 384,544 | |
300,000 | Oncor Electric Delivery Co. LLC, Sec. Fac. Bond, 144A, 4.950%, 9/15/2052 | 296,194 | |
155,000 | WEC Energy Group, Inc., Sr. Unsecd. Note, 2.200%, 12/15/2028 | 131,593 | |
125,000 | Wisconsin Electric Power Co., Sr. Unsecd. Note, 4.300%, 12/15/2045 | 102,393 | |
TOTAL | 3,668,850 | ||
Utility - Natural Gas— 0.2% | |||
495,000 | National Fuel Gas Co., Sr. Unsecd. Note, 5.500%, 1/15/2026 | 496,342 |
Shares or Principal Amount | Value | ||
CORPORATE BONDS— continued | |||
Utility - Natural Gas— continued | |||
$ 230,000 | ONE Gas, Inc., Sr. Unsecd. Note, 4.250%, 9/1/2032 | $ 220,250 | |
TOTAL | 716,592 | ||
TOTAL CORPORATE BONDS (IDENTIFIED COST $23,248,460) | 21,171,258 | ||
U.S. TREASURIES— 5.3% | |||
U.S. Treasury Bond— 1.0% | |||
175,000 | United States Treasury Bond, 1.875%, 2/15/2051 | 115,555 | |
1,950,000 | United States Treasury Bond, 1.875%, 11/15/2051 | 1,284,867 | |
910,000 | United States Treasury Bond, 2.250%, 2/15/2052 | 658,328 | |
510,000 | United States Treasury Bond, 2.375%, 5/15/2051 | 379,967 | |
225,000 | United States Treasury Bond, 2.875%, 5/15/2052 | 187,342 | |
3,000 | United States Treasury Bond, 3.000%, 11/15/2045 | 2,529 | |
25,000 | United States Treasury Bond, 3.250%, 5/15/2042 | 22,486 | |
400,000 | United States Treasury Bond, 4.000%, 11/15/2052 | 416,500 | |
TOTAL | 3,067,574 | ||
U.S. Treasury Note— 4.3% | |||
1,000,000 | United States Treasury Note, 0.375%, 10/31/2023 | 960,848 | |
400,000 | United States Treasury Note, 0.500%, 11/30/2023 | 383,464 | |
200,000 | United States Treasury Note, 0.750%, 8/31/2026 | 177,767 | |
2,400,000 | United States Treasury Note, 1.125%, 10/31/2026 | 2,156,466 | |
700,000 | United States Treasury Note, 1.250%, 12/31/2026 | 630,068 | |
1,300,000 | United States Treasury Note, 1.375%, 10/31/2028 | 1,134,530 | |
1,770,000 | United States Treasury Note, 1.875%, 2/15/2032 | 1,526,763 | |
675,000 | United States Treasury Note, 2.375%, 3/31/2029 | 621,983 | |
150,000 | United States Treasury Note, 2.500%, 3/31/2027 | 141,776 | |
725,000 | United States Treasury Note, 2.625%, 5/31/2027 | 688,817 | |
300,000 | United States Treasury Note, 2.625%, 7/31/2029 | 280,241 | |
200,000 | United States Treasury Note, 2.750%, 7/31/2027 | 190,752 | |
100,000 | United States Treasury Note, 2.750%, 5/31/2029 | 94,184 | |
175,000 | United States Treasury Note, 2.750%, 8/15/2032 | 162,313 | |
625,000 | United States Treasury Note, 2.875%, 4/30/2029 | 593,036 | |
370,000 | United States Treasury Note, 2.875%, 5/15/2032 | 347,232 | |
1,700,000 | United States Treasury Note, 3.000%, 6/30/2024 | 1,659,992 | |
300,000 | United States Treasury Note, 3.000%, 7/31/2024 | 292,934 | |
650,000 | United States Treasury Note, 3.250%, 6/30/2029 | 630,577 | |
600,000 | United States Treasury Note, 4.000%, 10/31/2029 | 609,952 | |
200,000 | United States Treasury Note, 4.125%, 11/15/2032 | 208,054 |
Shares or Principal Amount | Value | ||
U.S. TREASURIES— continued | |||
U.S. Treasury Note— continued | |||
$ 150,000 | United States Treasury Note, 4.250%, 9/30/2024 | $ 149,584 | |
TOTAL | 13,641,333 | ||
TOTAL U.S. TREASURIES (IDENTIFIED COST $18,476,890) | 16,708,907 | ||
ASSET-BACKED SECURITIES— 1.0% | |||
Auto Receivables— 0.3% | |||
150,015 | Santander Drive Auto Receivables Trust 2020-2, Class C, 1.460%, 9/15/2025 | 149,160 | |
500,000 | Toyota Auto Receivables Owner Trust 2020-B, Class A4, 1.660%, 9/15/2025 | 481,819 | |
285,000 | World Omni Auto Receivables Trust 2021-A, Class C, 0.890%, 8/16/2027 | 263,411 | |
TOTAL | 894,390 | ||
Credit Card— 0.1% | |||
500,000 | Master Credit Card Trust 2022-2A, Class C, 2.730%, 7/21/2028 | 445,976 | |
Equipment Lease— 0.4% | |||
120,066 | CNH Equipment Trust 2020-A, Class A3, 1.160%, 6/16/2025 | 118,024 | |
500,000 | HPEFS Equipment Trust 2020-2A, Class C, 2.000%, 7/22/2030 | 495,897 | |
550,000 | HPEFS Equipment Trust 2022-1A, Class C, 1.960%, 5/21/2029 | 506,019 | |
TOTAL | 1,119,940 | ||
Other— 0.1% | |||
300,000 | PFS Financing Corp. 2020-G, Class A, 0.970%, 2/15/2026 | 281,867 | |
Student Loans— 0.1% | |||
82,158 | Navient Student Loan Trust 2021-A, Class A, 0.840%, 5/15/2069 | 70,118 | |
259,546 | Navient Student Loan Trust 2021-GA, Class A, 1.580%, 4/15/2070 | 219,043 | |
TOTAL | 289,161 | ||
TOTAL ASSET-BACKED SECURITIES (IDENTIFIED COST $3,245,870) | 3,031,334 | ||
COMMERCIAL MORTGAGE-BACKED SECURITIES— 0.3% | |||
Agency Commercial Mortgage-Backed Securities— 0.2% | |||
61,235 | Federal Home Loan Mortgage Corp. REMIC, Series K055, Class A1, 2.263%, 4/25/2025 | 59,192 | |
500,000 | Federal Home Loan Mortgage Corp. REMIC, Series K737, Class A2, 2.525%, 10/25/2026 | 466,034 | |
TOTAL | 525,226 | ||
Commercial Mortgage— 0.1% | |||
300,000 | JPMDB Commercial Mortgage Securities Trust 2016-C4, Class A3, 3.141%, 12/15/2049 | 275,572 | |
TOTAL COMMERCIAL MORTGAGE-BACKED SECURITIES (IDENTIFIED COST $886,433) | 800,798 |
Shares or Principal Amount | Value | ||
GOVERNMENT AGENCIES— 0.2% | |||
Federal Home Loan Bank System— 0.0% | |||
$ 200,000 | Federal Home Loan Bank System Notes, 0.500%, 4/14/2025 | $ 183,175 | |
Federal National Mortgage Association— 0.2% | |||
635,000 | Federal National Mortgage Association Notes, 0.625%, 4/22/2025 | 582,545 | |
TOTAL GOVERNMENT AGENCIES (IDENTIFIED COST $834,933) | 765,720 | ||
COLLATERALIZED MORTGAGE OBLIGATION— 0.1% | |||
Commercial Mortgage— 0.1% | |||
255,000 | Bank, Class A4, 3.488%, 11/15/2050 (IDENTIFIED COST $262,641) | 235,091 | |
MORTGAGE-BACKED SECURITIES— 0.0% | |||
Federal Home Loan Mortgage Corporation REMIC— 0.0% | |||
612 | Federal Home Loan Mortgage Corp., Pool C00592, 7.000%, 3/1/2028 | 634 | |
494 | Federal Home Loan Mortgage Corp., Pool C00896, 7.500%, 12/1/2029 | 521 | |
772 | Federal Home Loan Mortgage Corp., Pool C19588, 6.500%, 12/1/2028 | 798 | |
364 | Federal Home Loan Mortgage Corp., Pool C25621, 6.500%, 5/1/2029 | 377 | |
614 | Federal Home Loan Mortgage Corp., Pool C76361, 6.000%, 2/1/2033 | 638 | |
1,059 | Federal Home Loan Mortgage Corp., Pool G01444, 6.500%, 8/1/2032 | 1,112 | |
TOTAL | 4,080 | ||
Federal National Mortgage Association— 0.0% | |||
601 | Federal National Mortgage Association, Pool 251697, 6.500%, 5/1/2028 | 615 | |
2,337 | Federal National Mortgage Association, Pool 252334, 6.500%, 2/1/2029 | 2,387 | |
1,599 | Federal National Mortgage Association, Pool 254905, 6.000%, 10/1/2033 | 1,660 | |
489 | Federal National Mortgage Association, Pool 255075, 5.500%, 2/1/2024 | 487 | |
86 | Federal National Mortgage Association, Pool 303168, 9.500%, 2/1/2025 | 88 | |
108 | Federal National Mortgage Association, Pool 323159, 7.500%, 4/1/2028 | 113 | |
871 | Federal National Mortgage Association, Pool 323640, 7.500%, 4/1/2029 | 902 | |
2,600 | Federal National Mortgage Association, Pool 545993, 6.000%, 11/1/2032 | 2,689 | |
1,092 | Federal National Mortgage Association, Pool 555272, 6.000%, 3/1/2033 | 1,130 |
Shares or Principal Amount | Value | ||
MORTGAGE-BACKED SECURITIES— continued | |||
Federal National Mortgage Association— continued | |||
$ 575 | Federal National Mortgage Association, Pool 713974, 5.500%, 7/1/2033 | $ 591 | |
2,103 | Federal National Mortgage Association, Pool 721502, 5.000%, 7/1/2033 | 2,117 | |
TOTAL | 12,779 | ||
Government National Mortgage Association— 0.0% | |||
2,611 | Government National Mortgage Association, Pool 2796, 7.000%, 8/20/2029 | 2,708 | |
1,635 | Government National Mortgage Association, Pool 3040, 7.000%, 2/20/2031 | 1,708 | |
4,079 | Government National Mortgage Association, Pool 3188, 6.500%, 1/20/2032 | 4,255 | |
5,383 | Government National Mortgage Association, Pool 3239, 6.500%, 5/20/2032 | 5,628 | |
911 | Government National Mortgage Association, Pool 451522, 7.500%, 10/15/2027 | 942 | |
35 | Government National Mortgage Association, Pool 462556, 6.500%, 2/15/2028 | 36 | |
175 | Government National Mortgage Association, Pool 462739, 7.500%, 5/15/2028 | 181 | |
69 | Government National Mortgage Association, Pool 464835, 6.500%, 9/15/2028 | 71 | |
1,236 | Government National Mortgage Association, Pool 469699, 7.000%, 11/15/2028 | 1,272 | |
1,112 | Government National Mortgage Association, Pool 486760, 6.500%, 12/15/2028 | 1,142 | |
9 | Government National Mortgage Association, Pool 780339, 8.000%, 12/15/2023 | 9 | |
592 | Government National Mortgage Association, Pool 780453, 7.500%, 12/15/2025 | 603 | |
614 | Government National Mortgage Association, Pool 780584, 7.000%, 6/15/2027 | 624 | |
TOTAL | 19,179 | ||
TOTAL MORTGAGE-BACKED SECURITIES (IDENTIFIED COST $35,098) | 36,038 | ||
INVESTMENT COMPANIES— 25.4% | |||
30,857 | Bank Loan Core Fund | 268,458 | |
3,483,930 | Emerging Markets Core Fund | 27,453,367 | |
23,484,089 | Federated Hermes Institutional Prime Value Obligations Fund, Institutional Shares, 3.86%5 | 23,474,696 | |
472,456 | 6 | High Yield Bond Core Fund | 2,499,290 |
2,591,048 | Mortgage Core Fund | 21,894,355 |
Shares or Principal Amount | Value | ||
INVESTMENT COMPANIES— continued | |||
496,070 | Project and Trade Finance Core Fund | $ 4,320,769 | |
TOTAL INVESTMENT COMPANIES (IDENTIFIED COST $84,579,043) | 79,910,935 | ||
TOTAL INVESTMENT IN SECURITIES—99.7% (IDENTIFIED COST $302,485,867)7 | 313,742,474 | ||
OTHER ASSETS AND LIABILITIES - NET—0.3%8 | 958,819 | ||
TOTAL NET ASSETS—100% | $314,701,293 |
Description | Number of Contracts | Notional Value | Expiration Date | Value and Unrealized Appreciation (Depreciation) |
Long Futures: | ||||
United States Treasury Notes 2-Year Long Futures | 9 | $1,848,234 | March 2023 | $4,208 |
AUST 10-Year Bond Long Futures Long Futures | 13 | $1,064,669 | December 2022 | $5,734 |
United States Treasury Notes 5-Year Long Futures | 32 | $3,474,250 | March 2023 | $17,431 |
JPN 10-Year Bond Long Futures Long Futures | 1 | $1,076,979 | December 2022 | $(6,809) |
United States Treasury Long Bond Long Futures | 1 | $127,000 | March 2023 | $1,240 |
United States Treasury Notes 10-Year Ultra Long Futures | 16 | $1,914,500 | March 2023 | $19,225 |
United States Treasury Ultra Bond Long Futures | 3 | $408,844 | March 2023 | $4,118 |
Short Futures: | ||||
United States Treasury Notes 10-Year Short Futures | 5 | $567,500 | March 2023 | $(4,699) |
NET UNREALIZED APPRECIATION ON FUTURES CONTRACTS | $40,448 | |||
Settlement Date | Counterparty | Foreign Currency Units to Deliver/Receive | In Exchange For | Net Unrealized Appreciation/ (Depreciation) | |
Contracts Purchased: | |||||
12/13/2022 | Morgan Stanley Capital | 80,234 | AUD | $54,967 | $(486) |
12/13/2022 | Morgan Stanley Capital | 164,007 | CAD | $125,755 | $(3,813) |
12/13/2022 | Bank Of America, N.A. | 54,883 | CHF | $57,596 | $482 |
12/13/2022 | Bank Of America, N.A. | 352,665 | EUR | $356,372 | $10,922 |
12/13/2022 | Bank Of America, N.A. | 104,718 | GBP | $121,400 | $4,856 |
12/13/2022 | Bank Of America, N.A. | 21,976,812 | JPY | $155,679 | $3,680 |
12/13/2022 | Morgan Stanley Capital | 2,091,625 | MXN | $103,478 | $4,723 |
12/15/2022 | Barclays Bank Plc | 13,926,100 | JPY | $100,000 | $1,010 |
12/19/2022 | Morgan Stanley Capital | 6,894,338 | JPY | $50,000 | $35 |
12/19/2022 | Morgan Stanley Capital | 6,953,336 | JPY | $50,000 | $463 |
12/19/2022 | Morgan Stanley Capital | 13,858,300 | JPY | $100,000 | $575 |
12/19/2022 | Morgan Stanley Capital | 13,940,500 | JPY | $100,000 | $1,171 |
1/26/2023 | Credit Agricole CIB | 248,229 | CAD | $180,000 | $4,695 |
1/26/2023 | Morgan Stanley | 270,898 | CAD | 200,000 EUR | $3,876 |
1/26/2023 | Bank Of America, N.A. | 272,663 | CAD | 200,000 EUR | $2,483 |
1/26/2023 | Bank Of America, N.A. | 663,212 | CAD | $500,000 | $(6,538) |
1/26/2023 | Bank Of America, N.A. | 200,000 | EUR | 340,582 NZD | $14,031 |
1/26/2023 | State Street Bank & Trust Co. | 200,000 | EUR | 338,891 NZD | $12,452 |
1/26/2023 | Morgan Stanley | 400,000 | EUR | 57,601,964 JPY | $28,063 |
1/26/2023 | Bank Of America, N.A. | 400,000 | EUR | 544,068 CAD | $17,263 |
1/26/2023 | Bank Of America, N.A. | 650,000 | EUR | $654,041 | $25,344 |
1/26/2023 | Morgan Stanley Capital | 800,000 | EUR | $840,031 | $(3,865) |
1/26/2023 | Bank Of America, N.A. | 100,000 | GBP | $113,207 | $7,541 |
1/26/2023 | Bank Of America, N.A. | 400,000 | GBP | 65,284,240 JPY | $9,232 |
1/26/2023 | Bank Of America, N.A. | 58,646,996 | JPY | 400,000 EUR | $29,991 |
1/26/2023 | Morgan Stanley Capital | 65,799,712 | JPY | 400,000 GBP | $36,057 |
1/26/2023 | Bank Of America, N.A. | 66,183,200 | JPY | 400,000 GBP | $14,219 |
1/26/2023 | JPMorgan Chase Bank, N.A. | 198,078,972 | JPY | $1,400,000 | $44,884 |
1/26/2023 | Bank Of America, N.A. | 391,066,470 | JPY | $2,660,000 | $192,628 |
1/26/2023 | Citibank N.A. | 400,000 | NZD | $228,276 | $23,978 |
1/26/2023 | Morgan Stanley Capital | 693,216 | NZD | 400,000 EUR | $32,501 |
1/30/2023 | BNP Paribas SA | 1,600,000 | CNY | $224,114 | $953 |
Settlement Date | Counterparty | Foreign Currency Units to Deliver/Receive | In Exchange For | Net Unrealized Appreciation/ (Depreciation) | |
Contracts Sold: | |||||
12/13/2022 | Morgan Stanley Capital | 120,451 | USD | 164,007 CAD | $(1,491) |
12/13/2022 | State Street Bank & Trust Co. | 105,236 | USD | 2,091,625 MXN | $(2,965) |
12/13/2022 | Credit Agricole CIB | 148,918 | USD | 21,976,812 JPY | $(10,441) |
12/15/2022 | Barclays Bank Plc | 100,000 | USD | 13,889,900 JPY | $(748) |
12/19/2022 | Morgan Stanley Capital | 100,000 | USD | 13,823,500 JPY | $(322) |
12/19/2022 | Morgan Stanley Capital | 200,000 | USD | 27,800,000 JPY | $(1,755) |
12/21/2022 | Morgan Stanley Capital | 59,198 | USD | 50,000 GBP | $(1,107) |
1/26/2023 | Bank Of America, N.A. | 544,068 | CAD | 400,000 EUR | $(3,994) |
1/26/2023 | Morgan Stanley | 200,000 | EUR | 270,898 CAD | $(11,357) |
1/26/2023 | Bank Of America, N.A. | 200,000 | EUR | 272,663 CAD | $(8,649) |
1/26/2023 | Bank Of America, N.A. | 400,000 | EUR | 58,646,996 JPY | $(20,274) |
1/26/2023 | Morgan Stanley | 400,000 | EUR | 693,216 NZD | $(13,418) |
1/26/2023 | Morgan Stanley | 400,000 | GBP | 65,799,712 JPY | $(39,074) |
1/26/2023 | Bank Of America, N.A. | 400,000 | GBP | 66,183,200 JPY | $(14,439) |
1/26/2023 | Morgan Stanley | 57,601,964 | JPY | 400,000 EUR | $(30,157) |
1/26/2023 | Bank Of America, N.A. | 65,284,240 | JPY | 400,000 GBP | $(2,455) |
1/26/2023 | State Street Bank & Trust Co. | 338,891 | NZD | 200,000 EUR | $(17,126) |
1/26/2023 | Bank Of America, N.A. | 340,582 | NZD | 200,000 EUR | $(19,772) |
1/26/2023 | State Street Bank & Trust Co. | 1,442,701 | USD | 1,450,000 EUR | $(72,850) |
1/26/2023 | Bank Of America, N.A. | 1,400,000 | USD | 199,270,358 JPY | $(53,575) |
1/26/2023 | Citibank N.A. | 232,628 | USD | 200,000 GBP | $(8,868) |
1/26/2023 | Citibank N.A. | 200,000 | USD | 3,949,943 MXN | $(2,770) |
1/26/2023 | Bank Of America, N.A. | 230,303 | USD | 400,000 NZD | $(21,951) |
1/26/2023 | BNP Paribas SA | 450,000 | USD | 9,136,762 MXN | $(19,035) |
NET UNREALIZED APPRECIATION ON FOREIGN EXCHANGE CONTRACTS | $134,813 | ||||
Affiliates | Value as of 11/30/2021 | Purchases at Cost | Proceeds from Sales |
Bank Loan Core Fund | $2,166,166 | $64,226 | $(1,825,000) |
Emerging Markets Core Fund | $37,151,573 | $12,543,700 | $(17,300,000) |
Federated Hermes Institutional Prime Value Obligations Fund, Institutional Shares | $9,050,517 | $134,473,086 | $(120,039,275) |
High Yield Bond Core Fund | $4,702,760 | $1,149,864 | $(2,888,040) |
Mortgage Core Fund | $18,767,503 | $11,939,149 | $(6,200,900) |
Project and Trade Finance Core Fund | $4,184,049 | $193,203 | $— |
TOTAL OF AFFILIATED TRANSACTIONS | $76,022,568 | $160,363,228 | $(148,253,215) |
Change in Unrealized Appreciation/ Depreciation | Net Realized Gain/ (Loss) | Value as of 11/30/2022 | Shares Held as of 11/30/2022 | Dividend Income | Gain Distributions Received |
$(101,152) | $(35,782) | $268,458 | 30,857 | $64,227 | $— |
$(3,014,557) | $(1,927,349) | $27,453,367 | 3,483,930 | $1,743,702 | $— |
$4,897 | $(14,529) | $23,474,696 | 23,484,089 | $403,283 | $2,005 |
$(435,137) | $(30,157) | $2,499,290 | 472,456 | $186,864 | $— |
$(2,140,267) | $(471,130) | $21,894,355 | 2,591,048 | $566,800 | $— |
$(56,483) | $— | $4,320,769 | 496,070 | $193,202 | $— |
$(5,742,699) | $(2,478,947) | $79,910,935 | 30,558,450 | $3,158,078 | $2,005 |
1 | Non-income-producing security. |
2 | Market quotations and price valuations are not available. Fair value determined using significant unobservable inputs in accordance with procedures established by and under the general supervision of the Fund’s Adviser acting through its Valuation Committee. |
3 | Denotes a restricted security that either: (a) cannot be offered for public sale without first being registered, or availing of an exemption from registration, under the Securities Act of 1933; or (b) is subject to a contractual restriction on public sales. At November 30, 2022, these restricted securities amounted to $37,977, which represented 0.0% of total net assets. |
4 | Floating/variable note with current rate and current maturity or next reset date shown. |
5 | 7-day net yield. |
6 | The High Yield Bond Core Fund is a diversified portfolio of below investment grade bonds. |
7 | The cost of investments for federal tax purposes amounts to $338,951,475. |
8 | Assets, other than investments in securities, less liabilities. See Statement of Assets and Liabilities. |
The following is a summary of the inputs used, as of November 30, 2022, in valuing the Fund’s assets carried at fair value:
Valuation Inputs | ||||
Level 1— Quoted Prices | Level 2— Other Significant Observable Inputs | Level 3— Significant Unobservable Inputs | Total | |
Equity Securities: | ||||
Common Stocks | ||||
Domestic | $105,421,734 | $— | $4,534 | $105,426,268 |
International | 9,571,000 | 53,891,641 | 32,223 | 63,494,864 |
Debt Securities: | ||||
Foreign Governments/Agencies | — | 22,161,261 | — | 22,161,261 |
Corporate Bonds | — | 21,165,594 | 5,664 | 21,171,258 |
U.S. Treasuries | — | 16,708,907 | — | 16,708,907 |
Asset-Backed Securities | — | 3,031,334 | — | 3,031,334 |
Commercial Mortgage-Backed Securities | — | 800,798 | — | 800,798 |
Government Agencies | — | 765,720 | — | 765,720 |
Collateralized Mortgage Obligation | — | 235,091 | — | 235,091 |
Mortgage-Backed Securities | — | 36,038 | — | 36,038 |
Investment Companies1 | 75,590,166 | — | — | 79,910,935 |
TOTAL SECURITIES | $190,582,900 | $118,796,384 | $42,421 | $313,742,474 |
Other Financial Instruments: | ||||
Assets | ||||
Futures Contracts | $51,956 | $— | $— | $51,956 |
Foreign Exchange Contracts | — | 528,108 | — | 528,108 |
Liabilities | ||||
Futures Contracts | (11,508) | — | — | (11,508) |
Foreign Exchange Contracts | — | (393,295) | — | (393,295) |
TOTAL OTHER FINANCIAL INSTRUMENTS | $40,448 | $134,813 | $— | $175,261 |
1 | As permitted by U.S. generally accepted accounting principles (GAAP), an Investment Company valued at $4,320,769 is measured at fair value using the net asset value (NAV) per share practical expedient and has not been categorized in the chart above but is included in the Total column. The amount included herein is intended to permit reconciliation of the fair value classifications to the amounts presented on the Statement of Assets and Liabilities. The price of shares redeemed of Project and Trade Finance Core Fund may be determined as of the closing NAV of the fund up to twenty-four days after receipt of a shareholder redemption request. |
The following acronym(s) are used throughout this portfolio: | ||
ADR | —American Depositary Receipt | |
AUD | —Australian Dollar | |
BKNT | —Bank Notes | |
CAD | —Canadian Dollar | |
CHF | —Swiss Franc | |
CNY | —Chinese Yuan Renminbi | |
EUR | —Euro Currency | |
GBP | —British Pound | |
INR | —Indian Rupee | |
JPY | —Japanese Yen | |
LIBOR | —London Interbank Offered Rate | |
MTN | —Medium Term Note | |
MXN | —Mexican Peso | |
NZD | —New Zealand Dollar | |
REIT | —Real Estate Investment Trust | |
REMIC | —Real Estate Mortgage Investment Conduit | |
Year Ended November 30, | |||||
2022 | 2021 | 2020 | 2019 | 2018 | |
Net Asset Value, Beginning of Period | $23.08 | $21.46 | $19.83 | $19.08 | $20.09 |
Income From Investment Operations: | |||||
Net investment income (loss)1 | 0.31 | 0.28 | 0.25 | 0.31 | 0.31 |
Net realized and unrealized gain (loss) | (2.45) | 1.87 | 1.82 | 1.44 | (0.99) |
Total From Investment Operations | (2.14) | 2.15 | 2.07 | 1.75 | (0.68) |
Less Distributions: | |||||
Distributions from net investment income | (0.30) | (0.29) | (0.27) | (0.36) | (0.33) |
Distributions from net realized gain | (2.89) | (0.24) | (0.17) | (0.64) | — |
Total Distributions | (3.19) | (0.53) | (0.44) | (1.00) | (0.33) |
Net Asset Value, End of Period | $17.75 | $23.08 | $21.46 | $19.83 | $19.08 |
Total Return2 | (11.01)% | 10.09% | 10.70% | 9.89% | (3.46)% |
Ratios to Average Net Assets: | |||||
Net expenses3 | 1.14% | 1.14% | 1.14% | 1.15% | 1.15% |
Net investment income | 1.66% | 1.24% | 1.28% | 1.65% | 1.53% |
Expense waiver/reimbursement4 | 0.23% | 0.14% | 0.18% | 0.20% | 0.11% |
Supplemental Data: | |||||
Net assets, end of period (000 omitted) | $143,502 | $183,613 | $176,368 | $181,579 | $146,323 |
Portfolio turnover5 | 114% | 101% | 80% | 85% | 66% |
1 | Per share numbers have been calculated using the average shares method. |
2 | Based on net asset value, which does not reflect the sales charge, redemption fee or contingent deferred sales charge, if applicable. |
3 | Amount does not reflect net expenses incurred by investment companies in which the Fund may invest. |
4 | This expense decrease is reflected in both the net expense and the net investment income ratios shown above. Amount does not reflect expense waiver/reimbursement recorded by investment companies in which the Fund may invest. |
5 | Securities that mature are considered sales for purposes of this calculation. |
Year Ended November 30, | |||||
2022 | 2021 | 2020 | 2019 | 2018 | |
Net Asset Value, Beginning of Period | $22.46 | $20.89 | $19.30 | $18.60 | $19.58 |
Income From Investment Operations: | |||||
Net investment income (loss)1 | 0.15 | 0.09 | 0.09 | 0.16 | 0.14 |
Net realized and unrealized gain (loss) | (2.36) | 1.82 | 1.78 | 1.39 | (0.96) |
Total From Investment Operations | (2.21) | 1.91 | 1.87 | 1.55 | (0.82) |
Less Distributions: | |||||
Distributions from net investment income | (0.14) | (0.10) | (0.11) | (0.21) | (0.16) |
Distributions from net realized gain | (2.89) | (0.24) | (0.17) | (0.64) | — |
Total Distributions | (3.03) | (0.34) | (0.28) | (0.85) | (0.16) |
Net Asset Value, End of Period | $17.22 | $22.46 | $20.89 | $19.30 | $18.60 |
Total Return2 | (11.69)% | 9.19% | 9.83% | 8.94% | (4.20)% |
Ratios to Average Net Assets: | |||||
Net expenses3 | 1.93% | 1.96% | 1.97% | 1.96% | 1.96% |
Net investment income | 0.82% | 0.42% | 0.46% | 0.86% | 0.72% |
Expense waiver/reimbursement4 | 0.19% | 0.12% | 0.15% | 0.20% | 0.12% |
Supplemental Data: | |||||
Net assets, end of period (000 omitted) | $2,219 | $4,447 | $5,809 | $7,880 | $9,758 |
Portfolio turnover5 | 114% | 101% | 80% | 85% | 66% |
1 | Per share numbers have been calculated using the average shares method. |
2 | Based on net asset value, which does not reflect the sales charge, redemption fee or contingent deferred sales charge, if applicable. |
3 | Amount does not reflect net expenses incurred by investment companies in which the Fund may invest. |
4 | This expense decrease is reflected in both the net expense and the net investment income ratios shown above. Amount does not reflect expense waiver/reimbursement recorded by investment companies in which the Fund may invest. |
5 | Securities that mature are considered sales for purposes of this calculation. |
Year Ended November 30, | |||||
2022 | 2021 | 2020 | 2019 | 2018 | |
Net Asset Value, Beginning of Period | $22.35 | $20.80 | $19.22 | $18.52 | $19.51 |
Income From Investment Operations: | |||||
Net investment income (loss)1 | 0.16 | 0.10 | 0.09 | 0.16 | 0.15 |
Net realized and unrealized gain (loss) | (2.35) | 1.80 | 1.78 | 1.40 | (0.96) |
Total From Investment Operations | (2.19) | 1.90 | 1.87 | 1.56 | (0.81) |
Less Distributions: | |||||
Distributions from net investment income | (0.15) | (0.11) | (0.12) | (0.22) | (0.18) |
Distributions from net realized gain | (2.89) | (0.24) | (0.17) | (0.64) | — |
Total Distributions | (3.04) | (0.35) | (0.29) | (0.86) | (0.18) |
Net Asset Value, End of Period | $17.12 | $22.35 | $20.80 | $19.22 | $18.52 |
Total Return2 | (11.66)% | 9.20% | 9.87% | 9.06% | (4.20)% |
Ratios to Average Net Assets: | |||||
Net expenses3 | 1.93% | 1.93% | 1.93% | 1.92% | 1.90% |
Net investment income | 0.87% | 0.45% | 0.50% | 0.89% | 0.78% |
Expense waiver/reimbursement4 | 0.19% | 0.12% | 0.15% | 0.20% | 0.14% |
Supplemental Data: | |||||
Net assets, end of period (000 omitted) | $38,482 | $52,288 | $58,092 | $64,600 | $64,095 |
Portfolio turnover5 | 114% | 101% | 80% | 85% | 66% |
1 | Per share numbers have been calculated using the average shares method. |
2 | Based on net asset value, which does not reflect the sales charge, redemption fee or contingent deferred sales charge, if applicable. |
3 | Amount does not reflect net expenses incurred by investment companies in which the Fund may invest. |
4 | This expense decrease is reflected in both the net expense and the net investment income ratios shown above. Amount does not reflect expense waiver/reimbursement recorded by investment companies in which the Fund may invest. |
5 | Securities that mature are considered sales for purposes of this calculation. |
Year Ended November 30, | |||||
2022 | 2021 | 2020 | 2019 | 2018 | |
Net Asset Value, Beginning of Period | $22.89 | $21.30 | $19.67 | $18.94 | $19.94 |
Income From Investment Operations: | |||||
Net investment income (loss)1 | 0.23 | 0.18 | 0.17 | 0.24 | 0.22 |
Net realized and unrealized gain (loss) | (2.42) | 1.84 | 1.82 | 1.41 | (0.98) |
Total From Investment Operations | (2.19) | 2.02 | 1.99 | 1.65 | (0.76) |
Less Distributions: | |||||
Distributions from net investment income | (0.22) | (0.19) | (0.19) | (0.28) | (0.24) |
Distributions from net realized gain | (2.89) | (0.24) | (0.17) | (0.64) | — |
Total Distributions | (3.11) | (0.43) | (0.36) | (0.92) | (0.24) |
Net Asset Value, End of Period | $17.59 | $22.89 | $21.30 | $19.67 | $18.94 |
Total Return2 | (11.37)% | 9.55% | 10.31% | 9.38% | (3.86)% |
Ratios to Average Net Assets: | |||||
Net expenses3 | 1.57% | 1.57% | 1.57% | 1.56% | 1.58% |
Net investment income | 1.24% | 0.81% | 0.85% | 1.26% | 1.09% |
Expense waiver/reimbursement4 | 0.24% | 0.13% | 0.16% | 0.19% | 0.12% |
Supplemental Data: | |||||
Net assets, end of period (000 omitted) | $36,898 | $45,723 | $43,197 | $42,860 | $43,452 |
Portfolio turnover5 | 114% | 101% | 80% | 85% | 66% |
1 | Per share numbers have been calculated using the average shares method. |
2 | Based on net asset value. |
3 | Amount does not reflect net expenses incurred by investment companies in which the Fund may invest. |
4 | This expense decrease is reflected in both the net expense and the net investment income ratios shown above. Amount does not reflect expense waiver/reimbursement recorded by investment companies in which the Fund may invest. |
5 | Securities that mature are considered sales for purposes of this calculation. |
Year Ended November 30, | |||||
2022 | 2021 | 2020 | 2019 | 2018 | |
Net Asset Value, Beginning of Period | $23.23 | $21.60 | $19.95 | $19.19 | $20.21 |
Income From Investment Operations: | |||||
Net investment income (loss)1 | 0.37 | 0.35 | 0.31 | 0.37 | 0.37 |
Net realized and unrealized gain (loss) | (2.46) | 1.87 | 1.84 | 1.45 | (1.00) |
Total From Investment Operations | (2.09) | 2.22 | 2.15 | 1.82 | (0.63) |
Less Distributions: | |||||
Distributions from net investment income | (0.36) | (0.35) | (0.33) | (0.42) | (0.39) |
Distributions from net realized gain | (2.89) | (0.24) | (0.17) | (0.64) | — |
Total Distributions | (3.25) | (0.59) | (0.50) | (1.06) | (0.39) |
Net Asset Value, End of Period | $17.89 | $23.23 | $21.60 | $19.95 | $19.19 |
Total Return2 | (10.72)% | 10.39% | 11.06% | 10.21% | (3.21)% |
Ratios to Average Net Assets: | |||||
Net expenses3 | 0.85% | 0.85% | 0.85% | 0.86% | 0.86% |
Net investment income | 1.93% | 1.52% | 1.58% | 1.95% | 1.81% |
Expense waiver/reimbursement4 | 0.26% | 0.16% | 0.19% | 0.22% | 0.14% |
Supplemental Data: | |||||
Net assets, end of period (000 omitted) | $87,202 | $130,562 | $100,317 | $99,564 | $95,613 |
Portfolio turnover5 | 114% | 101% | 80% | 85% | 66% |
1 | Per share numbers have been calculated using the average shares method. |
2 | Based on net asset value. |
3 | Amount does not reflect net expenses incurred by investment companies in which the Fund may invest. |
4 | This expense decrease is reflected in both the net expense and the net investment income ratios shown above. Amount does not reflect expense waiver/reimbursement recorded by investment companies in which the Fund may invest. |
5 | Securities that mature are considered sales for purposes of this calculation. |
Year Ended November 30, | |||||
2022 | 2021 | 2020 | 2019 | 2018 | |
Net Asset Value, Beginning of Period | $23.08 | $21.47 | $19.84 | $19.09 | $20.10 |
Income From Investment Operations: | |||||
Net investment income (loss)1 | 0.37 | 0.35 | 0.31 | 0.38 | 0.36 |
Net realized and unrealized gain (loss) | (2.44) | 1.86 | 1.82 | 1.44 | (0.98) |
Total From Investment Operations | (2.07) | 2.21 | 2.13 | 1.82 | (0.62) |
Less Distributions: | |||||
Distributions from net investment income | (0.36) | (0.36) | (0.33) | (0.43) | (0.39) |
Distributions from net realized gain | (2.89) | (0.24) | (0.17) | (0.64) | — |
Total Distributions | (3.25) | (0.60) | (0.50) | (1.07) | (0.39) |
Net Asset Value, End of Period | $17.76 | $23.08 | $21.47 | $19.84 | $19.09 |
Total Return2 | (10.67)% | 10.41% | 11.04% | 10.26% | (3.16)% |
Ratios to Average Net Assets: | |||||
Net expenses3 | 0.83% | 0.83% | 0.83% | 0.84% | 0.84% |
Net investment income | 2.03% | 1.54% | 1.58% | 1.97% | 1.79% |
Expense waiver/reimbursement4 | 0.21% | 0.12% | 0.15% | 0.19% | 0.11% |
Supplemental Data: | |||||
Net assets, end of period (000 omitted) | $6,399 | $4,866 | $7,056 | $6,275 | $4,890 |
Portfolio turnover5 | 114% | 101% | 80% | 85% | 66% |
1 | Per share numbers have been calculated using the average shares method. |
2 | Based on net asset value. |
3 | Amount does not reflect net expenses incurred by investment companies in which the Fund may invest. |
4 | This expense decrease is reflected in both the net expense and the net investment income ratios shown above. Amount does not reflect expense waiver/reimbursement recorded by investment companies in which the Fund may invest. |
5 | Securities that mature are considered sales for purposes of this calculation. |
November 30, 2022
Assets: | |
Investment in securities, at value including $79,910,935 of investments in affiliated holdings* (identified cost $302,485,867) | $313,742,474 |
Cash denominated in foreign currencies (identified cost $289,060) | 317,114 |
Due from broker (Note 2) | 165,575 |
Income receivable | 1,501,789 |
Receivable for shares sold | 218,905 |
Unrealized appreciation on foreign exchange contracts | 528,108 |
Receivable for variation margin on futures contracts | 146,222 |
Total Assets | 316,620,187 |
Liabilities: | |
Payable for investments purchased | 907,592 |
Payable for shares redeemed | 217,739 |
Unrealized depreciation on foreign exchange contracts | 393,295 |
Bank overdraft | 1,890 |
Payable for investment adviser fee (Note 5) | 3,384 |
Payable for administrative fee (Note 5) | 663 |
Payable for auditing fees | 44,039 |
Payable for custodian fees | 91,190 |
Payable for insurance premiums | 5,190 |
Payable for portfolio accounting fees | 40,625 |
Payable for share registration costs | 28,280 |
Payable for transfer agent fees (Note 2) | 71,081 |
Payable for distribution services fee (Note 5) | 39,171 |
Payable for other service fees (Notes 2 and 5) | 37,518 |
Accrued expenses (Note 5) | 37,237 |
Total Liabilities | 1,918,894 |
Net assets for 17,794,248 shares outstanding | $314,701,293 |
Net Assets Consist of:** | |
Paid-in capital | $370,650,074 |
Total distributable earnings (loss) | (55,948,781) |
Total Net Assets | $314,701,293 |
Net Asset Value, Offering Price and Redemption Proceeds Per Share: | |
Class A Shares: | |
Net asset value per share ($143,502,331 ÷ 8,084,502 shares outstanding), no par value, unlimited shares authorized | $17.75 |
Offering price per share (100/94.50 of $17.75) | $18.78 |
Redemption proceeds per share | $17.75 |
Class B Shares: | |
Net asset value per share ($2,218,583 ÷ 128,815 shares outstanding), no par value, unlimited shares authorized | $17.22 |
Offering price per share | $17.22 |
Redemption proceeds per share (94.50/100 of $17.22) | $16.27 |
Class C Shares: | |
Net asset value per share ($38,481,545 ÷ 2,247,807 shares outstanding), no par value, unlimited shares authorized | $17.12 |
Offering price per share | $17.12 |
Redemption proceeds per share (99.00/100 of $17.12) | $16.95 |
Class R Shares: | |
Net asset value per share ($36,897,709 ÷ 2,097,416 shares outstanding), no par value, unlimited shares authorized | $17.59 |
Offering price per share | $17.59 |
Redemption proceeds per share | $17.59 |
Institutional Shares: | |
Net asset value per share ($87,201,670 ÷ 4,875,281 shares outstanding), no par value, unlimited shares authorized | $17.89 |
Offering price per share | $17.89 |
Redemption proceeds per share | $17.89 |
Class R6 Shares: | |
Net asset value per share ($6,399,455 ÷ 360,427 shares outstanding), no par value, unlimited shares authorized | $17.76 |
Offering price per share | $17.76 |
Redemption proceeds per share | $17.76 |
* | See information listed after the Fund’s Portfolio of Investments. |
** | Immaterial offsetting adjustments have been made to the opening balances of paid-in capital and total distributable earnings (loss) as a result of a prior period correction. |
Year Ended November 30, 2022
Investment Income: | |
Dividends (including $3,158,078 received from affiliated holdings* and net of foreign taxes withheld of $275,944) | $8,514,982 |
Interest | 1,478,220 |
TOTAL INCOME | 9,993,202 |
Expenses: | |
Investment adviser fee (Note 5) | 2,411,119 |
Administrative fee (Note 5) | 296,330 |
Custodian fees | 273,054 |
Transfer agent fees (Note 2) | 611,031 |
Directors’/Trustees’ fees (Note 5) | 9,240 |
Auditing fees | 36,299 |
Legal fees | 22,451 |
Portfolio accounting fees | 161,452 |
Distribution services fee (Note 5) | 558,285 |
Other service fees (Notes 2 and 5) | 512,842 |
Share registration costs | 89,889 |
Printing and postage | 39,313 |
Miscellaneous (Note 5) | 95,300 |
TOTAL EXPENSES | 5,116,605 |
Waiver and Reimbursements: | |
Waiver/reimbursement of investment adviser fee (Note 5) | (688,972) |
Reimbursement of other operating expenses (Notes 2 and 5) | (112,993) |
TOTAL WAIVER AND REIMBURSEMENTS | (801,965) |
Net expenses | 4,314,640 |
Net investment income | 5,678,562 |
Realized and Unrealized Gain (Loss) on Investments, Foreign Currency Transactions, Foreign Exchange Contracts, Futures Contracts, Written Options and Swap Contracts: | |
Net realized loss on investments (including foreign taxes withheld of $(42,269) and (including net realized loss of $(2,478,947) on sales of investments in affiliated holdings*) | $(10,906,774) |
Net realized loss on foreign currency transactions | (321,671) |
Net realized loss on foreign exchange contracts | (1,049,188) |
Net realized gain on futures contracts | 1,103,144 |
Net realized gain on written options | 2,789 |
Net realized gain on swap contracts | 4,659 |
Realized gain distribution from affiliated investment company shares* | 2,005 |
Net change in unrealized appreciation of investments (including net change in unrealized appreciation of $(5,742,699) on investments in affiliated holdings*) | (39,495,709) |
Net change in unrealized appreciation/depreciation of translation of assets and liabilities in foreign currency | 117,191 |
Net change in unrealized depreciation of foreign exchange contracts | 292,057 |
Net change in unrealized depreciation of futures contracts | 68,913 |
Net change in unrealized appreciation of written options | (362) |
Net realized and unrealized gain (loss) on investments, foreign currency transactions, foreign exchange contracts, futures contracts, written options and swap contracts | (50,182,946) |
Change in net assets resulting from operations | $(44,504,384) |
* | See information listed after the Fund’s Portfolio of Investments. |
Year Ended November 30 | 2022 | 2021 |
Increase (Decrease) in Net Assets | ||
Operations: | ||
Net investment income | $5,678,562 | $4,797,511 |
Net realized gain (loss) | (11,165,036) | 57,481,588 |
Net change in unrealized appreciation/depreciation | (39,017,910) | (23,781,031) |
CHANGE IN NET ASSETS RESULTING FROM OPERATIONS | (44,504,384) | 38,498,068 |
Distributions to Shareholders: | ||
Class A Shares | (25,477,599) | (4,261,725) |
Class B Shares | (572,916) | (89,405) |
Class C Shares | (7,081,494) | (954,588) |
Class R Shares | (6,260,667) | (868,369) |
Institutional Shares | (18,549,980) | (2,834,995) |
Class R6 Shares | (701,453) | (183,084) |
CHANGE IN NET ASSETS RESULTING FROM DISTRIBUTIONS TO SHAREHOLDERS | (58,644,109) | (9,192,166) |
Share Transactions: | ||
Proceeds from sale of shares | 42,238,032 | 51,984,707 |
Proceeds from shares issued in connection with the tax-free transfer of assets from Hancock Horizon Dynamic Asset Allocation Fund | — | 20,174,759 |
Net asset value of shares issued to shareholders in payment of distributions declared | 56,475,067 | 8,804,975 |
Cost of shares redeemed | (102,361,868) | (79,611,494) |
CHANGE IN NET ASSETS RESULTING FROM SHARE TRANSACTIONS | (3,648,769) | 1,352,947 |
Change in net assets | (106,797,262) | 30,658,849 |
Net Assets: | ||
Beginning of period | 421,498,555 | 390,839,706 |
End of period | $314,701,293 | $421,498,555 |
Hancock Fund | Share Class Exchanged | Fund Shares Received |
Hancock Horizon Dynamic Asset Allocation Fund | A | 0.801 |
IS | 0.795 |
Shares of the Fund Issued | Acquired Fund’s Net Assets Received | Unrealized Appreciation | Net Assets of the Fund Immediately Prior to Combination | Net Assets of the Fund Immediately After Combination |
1,075,357 | $20,174,759 | $3,571,100 | $411,356,095 | $431,530,854 |
Net investment income | $4,968,894 |
Net realized and unrealized gain on investments | 36,057,773 |
Net increase in net assets resulting from operations | $41,026,667 |
Transfer Agent Fees Incurred | Transfer Agent Fees Reimbursed | |
Class A Shares | $240,924 | $(37,584) |
Class B Shares | 4,897 | — |
Class C Shares | 72,266 | — |
Class R Shares | 135,764 | (12,869) |
Institutional Shares | 153,733 | (62,540) |
Class R6 Shares | 3,447 | — |
TOTAL | $611,031 | $(112,993) |
Other Service Fees Incurred | |
Class A Shares | $393,745 |
Class B Shares | 7,693 |
Class C Shares | 111,404 |
TOTAL | $512,842 |
Fair Value of Derivative Instruments | ||||
Assets | Liabilities | |||
Statement of Assets and Liabilities Location | Fair Value | Statement of Assets and Liabilities Location | Fair Value | |
Derivatives not accounted for as hedging instruments under ASC Topic 815 | ||||
Interest rate contracts | Receivable for variation margin on futures contracts | $40,448* | $— | |
Foreign exchange contracts | Unrealized appreciation on foreign exchange contracts | 528,108 | Unrealized depreciation on foreign exchange contracts | 393,295 |
Total derivatives not accounted for as hedging instruments under ASC Topic 815 | $568,556 | $393,295 | ||
* | Includes cumulative appreciation of futures contracts as reported in the footnotes to the Portfolio of Investments. Only the current day’s variation margin is reported within the Statement of Assets and Liabilities. |
Amount of Realized Gain or (Loss) on Derivatives Recognized in Income | ||||||
Credit Default Swaps | Futures Contracts | Foreign Exchange Contracts | Purchased Options Contracts1 | Written Options Contracts | Total | |
Interest rate contracts | $— | $301,712 | $— | $— | $— | $301,712 |
Equity contracts | — | 801,432 | — | — | — | 801,432 |
Foreign exchange contracts | — | — | (1,049,188) | (24,111) | 2,789 | (1,070,510) |
Credit contracts | 4,659 | — | — | — | — | 4,659 |
TOTAL | $4,659 | $1,103,144 | $(1,049,188) | $(24,111) | $2,789 | $37,293 |
1 | The net realized loss on Purchased Options Contracts is found within the Net realized loss on investments on the Statement of Operations. |
Change in Unrealized Appreciation or (Depreciation) on Derivatives Recognized in Income | |||||
Futures Contracts | Foreign Exchange Contracts | Purchased Options Contracts2 | Written Options Contracts | Total | |
Interest rate contracts | $(17,370) | $— | $— | $— | $(17,370) |
Equity contracts | 86,283 | — | — | — | 86,283 |
Foreign exchange contracts | — | 292,057 | 21 | (362) | 291,716 |
TOTAL | $68,913 | $292,057 | $21 | $(362) | $360,629 |
2 | The net change in unrealized appreciation of Purchased Options is found within the Net change in unrealized appreciation of investments on the Statement of Operations. |
Gross Amounts Not Offset In the Statement of Assets and Liabilities | ||||||||
Transaction | Gross Asset Derivatives Presented In Statement of Assets and Liabilities | Financial Instrument | Collateral Received | Net Amount | ||||
Foreign Exchange Contracts | $528,108 | $(288,978) | $— | $239,130 | ||||
TOTAL | $528,108 | $(288,978) | $— | $239,130 | ||||
Transaction | Gross Liability Derivatives Presented In Statement of Assets and Liabilities | Financial Instrument | Collateral Received | Net Amount |
Foreign Exchange Contracts | $393,295 | $(288,978) | $— | $104,317 |
TOTAL | $393,295 | $(288,978) | $— | $104,317 |
Year Ended 11/30/2022 | Year Ended 11/30/2021 | |||
Class A Shares: | Shares | Amount | Shares | Amount |
Shares sold | 515,866 | $9,842,217 | 618,890 | $14,235,556 |
Proceeds from shares issued in connection with the tax-free transfer of assets from the Acquired Fund | — | — | 14,439 | 271,217 |
Shares issued to shareholders in payment of distributions declared | 1,163,150 | 23,853,023 | 178,781 | 3,980,160 |
Shares redeemed | (1,551,270) | (29,058,530) | (1,072,477) | (24,627,612) |
NET CHANGE RESULTING FROM CLASS A SHARE TRANSACTIONS | 127,746 | $4,636,710 | (260,367) | $(6,140,679) |
Year Ended 11/30/2022 | Year Ended 11/30/2021 | |||
Class B Shares: | Shares | Amount | Shares | Amount |
Shares sold | 10,234 | $196,417 | 2,247 | $51,381 |
Shares issued to shareholders in payment of distributions declared | 26,902 | 539,155 | 3,895 | 83,632 |
Shares redeemed | (106,325) | (1,980,897) | (86,165) | (1,917,731) |
NET CHANGE RESULTING FROM CLASS B SHARE TRANSACTIONS | (69,189) | $(1,245,325) | (80,023) | $(1,782,718) |
Year Ended 11/30/2022 | Year Ended 11/30/2021 | |||
Class C Shares: | Shares | Amount | Shares | Amount |
Shares sold | 376,714 | $6,855,700 | 342,034 | $7,597,210 |
Shares issued to shareholders in payment of distributions declared | 354,857 | 7,067,319 | 44,425 | 950,415 |
Shares redeemed | (823,200) | (14,700,482) | (839,634) | (18,667,845) |
NET CHANGE RESULTING FROM CLASS C SHARE TRANSACTIONS | (91,629) | $(777,463) | (453,175) | $(10,120,220) |
Year Ended 11/30/2022 | Year Ended 11/30/2021 | |||
Class R Shares: | Shares | Amount | Shares | Amount |
Shares sold | 426,376 | $7,914,014 | 412,096 | $9,374,927 |
Shares issued to shareholders in payment of distributions declared | 306,892 | 6,260,614 | 39,452 | 868,338 |
Shares redeemed | (633,012) | (11,644,687) | (482,605) | (11,011,690) |
NET CHANGE RESULTING FROM CLASS R SHARE TRANSACTIONS | 100,256 | $2,529,941 | (31,057) | $(768,425) |
Year Ended 11/30/2022 | Year Ended 11/30/2021 | |||
Institutional Shares: | Shares | Amount | Shares | Amount |
Shares sold | 758,095 | $14,762,162 | 607,862 | $19,162,920 |
Proceeds from shares issued in connection with the tax-free transfer of assets from the Acquired Fund | — | — | 1,060,918 | 19,903,542 |
Shares issued to shareholders in payment of distributions declared | 877,291 | 18,104,224 | 122,335 | 2,748,683 |
Shares redeemed | (2,381,202) | (44,351,822) | (814,369) | (18,888,419) |
NET CHANGE RESULTING FROM INSTITUTIONAL SHARE TRANSACTIONS | (745,816) | $(11,485,436) | 976,746 | $22,926,726 |
Year Ended 11/30/2022 | Year Ended 11/30/2021 | |||
Class R6 Shares: | Shares | Amount | Shares | Amount |
Shares sold | 151,080 | $2,667,522 | 67,391 | $1,562,713 |
Shares issued to shareholders in payment of distributions declared | 31,903 | 650,732 | 7,798 | 173,747 |
Shares redeemed | (33,373) | (625,450) | (192,947) | (4,498,197) |
NET CHANGE RESULTING FROM CLASS R6 SHARE TRANSACTIONS | 149,610 | $2,692,804 | (117,758) | $(2,761,737) |
NET CHANGE RESULTING FROM TOTAL FUND SHARE TRANSACTIONS | (529,022) | $(3,648,769) | 34,366 | $1,352,947 |
2022 | 2021 | |
Ordinary income1 | $22,030,158 | $9,192,166 |
Long-term capital gains | $36,613,951 | $— |
1 | For tax purposes, short-term capital gains are considered ordinary income in determining distributable earnings. |
Undistributed ordinary income2 | $1,640,816 |
Net unrealized depreciation | $(25,261,373) |
Capital loss carryforwards and deferrals | $(32,328,224) |
TOTAL | $(55,948,781) |
2 | For tax purposes, short-term capital gains are considered ordinary income in determining distributable earnings. |
Short-Term | Long-Term | Total |
$32,328,224 | $— | $32,328,224 |
Administrative Fee | Average Daily Net Assets of the Investment Complex |
0.100% | on assets up to $50 billion |
0.075% | on assets over $50 billion |
Percentage of Average Daily Net Assets of Class | |
Class B Shares | 0.75% |
Class C Shares | 0.75% |
Class R Shares | 0.50% |
Distribution Services Fees Incurred | |
Class B Shares | $23,079 |
Class C Shares | 334,212 |
Class R Shares | 200,994 |
TOTAL | $558,285 |
Purchases | $351,382,533 |
Sales | $423,002,703 |

January 23, 2023
Beginning Account Value 6/1/2022 | Ending Account Value 11/30/2022 | Expenses Paid During Period1 | |
Actual: | |||
Class A Shares | $1,000 | $957.10 | $5.64 |
Class B Shares | $1,000 | $953.60 | $9.262 |
Class C Shares | $1,000 | $953.00 | $9.45 |
Class R Shares | $1,000 | $955.00 | $7.69 |
Institutional Shares | $1,000 | $958.30 | $4.22 |
Class R6 Shares | $1,000 | $959.20 | $4.13 |
Hypothetical (assuming a 5% return before expenses): | |||
Class A Shares | $1,000 | $1,019.30 | $5.82 |
Class B Shares | $1,000 | $1,015.59 | $9.552 |
Class C Shares | $1,000 | $1,015.39 | $9.75 |
Class R Shares | $1,000 | $1,017.20 | $7.94 |
Institutional Shares | $1,000 | $1,020.76 | $4.36 |
Class R6 Shares | $1,000 | $1,020.86 | $4.26 |
1 | Expenses are equal to the Fund’s annualized net expense ratios, multiplied by the average account value over the period, multiplied by 183/365 (to reflect the one-half-year period). The annualized net expense ratios are as follows: |
Class A Shares | 1.15% |
Class B Shares | 1.89% |
Class C Shares | 1.93% |
Class R Shares | 1.57% |
Institutional Shares | 0.86% |
Class R6 Shares | 0.84% |
2 | Actual and Hypothetical expenses paid during the period utilizing the Fund’s Class B Shares current Fee Limit of 1.98% (as reflected in the Notes to Financial Statements, Note 5 under Expense Limitation), multiplied by the average account value over the period, multiplied by 183/365 (to reflect expenses paid as if they had been in effect throughout the most recent one-half-year period) would be $9.70 and $10.00, respectively. |
Name Birth Date Positions Held with Trust Date Service Began | Principal Occupation(s) for Past Five Years, Other Directorships Held and Previous Position(s) |
J. Christopher Donahue* Birth Date: April 11, 1949 President and Trustee Indefinite Term Began serving: November 1998 | Principal Occupations: Principal Executive Officer and President of certain of the Funds in the Federated Hermes Fund Family; Director or Trustee of the Funds in the Federated Hermes Fund Family; President, Chief Executive Officer and Director, Federated Hermes, Inc.; Chairman and Trustee, Federated Investment Management Company; Trustee, Federated Investment Counseling; Chairman and Director, Federated Global Investment Management Corp.; Chairman and Trustee, Federated Equity Management Company of Pennsylvania; Trustee, Federated Shareholder Services Company; Director, Federated Services Company. Previous Positions: President, Federated Investment Counseling; President and Chief Executive Officer, Federated Investment Management Company, Federated Global Investment Management Corp. and Passport Research, Ltd; Chairman, Passport Research, Ltd. |
Name Birth Date Positions Held with Trust Date Service Began | Principal Occupation(s) for Past Five Years, Other Directorships Held and Previous Position(s) |
John B. Fisher* Birth Date: May 16, 1956 Trustee Indefinite Term Began serving: May 2016 | Principal Occupations: Principal Executive Officer and President of certain of the Funds in the Federated Hermes Fund Family; Director or Trustee of certain of the Funds in the Federated Hermes Fund Family; Director and Vice President, Federated Hermes, Inc.; President, Director/Trustee and CEO, Federated Advisory Services Company, Federated Equity Management Company of Pennsylvania, Federated Global Investment Management Corp., Federated Investment Counseling, Federated Investment Management Company, and Federated MDTA LLC; Director, Federated Investors Trust Company. Previous Positions: President and Director of the Institutional Sales Division of Federated Securities Corp.; President and CEO of Passport Research, Ltd.; Director and President, Technology, Federated Services Company. |
Name Birth Date Positions Held with Trust Date Service Began | Principal Occupation(s) for Past Five Years, Other Directorships Held, Previous Position(s) and Qualifications |
John T. Collins Birth Date: January 24, 1947 Trustee Indefinite Term Began serving: October 2013 | Principal Occupations: Director or Trustee, and Chair of the Board of Directors or Trustees, of the Federated Hermes Fund Family; formerly, Chairman and CEO, The Collins Group, Inc. (a private equity firm) (Retired). Other Directorships Held: Director, KLX Energy Services Holdings, Inc. (oilfield services); former Director of KLX Corp. (aerospace). Qualifications: Mr. Collins has served in several business and financial management roles and directorship positions throughout his career. Mr. Collins previously served as Chairman and CEO of The Collins Group, Inc. (a private equity firm) and as a Director of KLX Corp. Mr. Collins serves as Chairman Emeriti, Bentley University. Mr. Collins previously served as Director and Audit Committee Member, Bank of America Corp.; Director, FleetBoston Financial Corp.; and Director, Beth Israel Deaconess Medical Center (Harvard University Affiliate Hospital). |
Name Birth Date Positions Held with Trust Date Service Began | Principal Occupation(s) for Past Five Years, Other Directorships Held, Previous Position(s) and Qualifications |
G. Thomas Hough Birth Date: February 28, 1955 Trustee Indefinite Term Began serving: August 2015 | Principal Occupations: Director or Trustee, Chair of the Audit Committee of the Federated Hermes Fund Family; formerly, Vice Chair, Ernst & Young LLP (public accounting firm) (Retired). Other Directorships Held: Director, Chair of the Audit Committee, Equifax, Inc.; Lead Director, Member of the Audit and Nominating and Corporate Governance Committees, Haverty Furniture Companies, Inc.; formerly, Director, Member of Governance and Compensation Committees, Publix Super Markets, Inc. Qualifications: Mr. Hough has served in accounting, business management and directorship positions throughout his career. Mr. Hough most recently held the position of Americas Vice Chair of Assurance with Ernst & Young LLP (public accounting firm). Mr. Hough serves on the President’s Cabinet and Business School Board of Visitors for the University of Alabama. Mr. Hough previously served on the Business School Board of Visitors for Wake Forest University, and he previously served as an Executive Committee member of the United States Golf Association. |
Maureen Lally-Green Birth Date: July 5, 1949 Trustee Indefinite Term Began serving: August 2009 | Principal Occupations: Director or Trustee of the Federated Hermes Fund Family; Adjunct Professor Emerita of Law, Duquesne University School of Law; formerly, Dean of the Duquesne University School of Law and Professor of Law and Interim Dean of the Duquesne University School of Law; formerly, Associate General Secretary and Director, Office of Church Relations, Diocese of Pittsburgh. Other Directorships Held: Director, CNX Resources Corporation (natural gas). Qualifications: Judge Lally-Green has served in various legal and business roles and directorship positions throughout her career. Judge Lally-Green previously held the position of Dean of the School of Law of Duquesne University (as well as Interim Dean). Judge Lally-Green previously served as Associate General Secretary of the Diocese of Pittsburgh, a member of the Superior Court of Pennsylvania and as a Professor of Law, Duquesne University School of Law. Judge Lally- Green was appointed by the Supreme Court of Pennsylvania to serve on the Supreme Court’s Board of Continuing Judicial Education and the Supreme Court’s Appellate Court Procedural Rules Committee. Judge Lally-Green also currently holds the positions on not for profit or for profit boards of directors as follows: Director and Chair, UPMC Mercy Hospital; Regent, Saint Vincent Seminary; Member, Pennsylvania State Board of Education (public); Director, Catholic Charities, Pittsburgh; and Director CNX Resources Corporation (natural gas). Judge Lally-Green has held the positions of: Director, Auberle; Director, Epilepsy Foundation of Western and Central Pennsylvania; Director, Ireland Institute of Pittsburgh; Director, Saint Thomas More Society; Director and Chair, Catholic High Schools of the Diocese of Pittsburgh, Inc.; Director, Pennsylvania Bar Institute; Director, St. Vincent College; Director and Chair, North Catholic High School, Inc.; Director and Vice Chair, Our Campaign for the Church Alive!, Inc.; and Director and Vice Chair, Saint Francis University. |
Name Birth Date Positions Held with Trust Date Service Began | Principal Occupation(s) for Past Five Years, Other Directorships Held, Previous Position(s) and Qualifications |
Thomas M. O’Neill Birth Date: June 14, 1951 Trustee Indefinite Term Began serving: October 2013 | Principal Occupations: Director or Trustee of the Federated Hermes Fund Family; Sole Proprietor, Navigator Management Company (investment and strategic consulting). Other Directorships Held: None. Qualifications: Mr. O’Neill has served in several business, mutual fund and financial management roles and directorship positions throughout his career. Mr. O’Neill serves as Director, Medicines for Humanity. Mr. O’Neill previously served as Chief Executive Officer and President, Managing Director and Chief Investment Officer, Fleet Investment Advisors; President and Chief Executive Officer, Aeltus Investment Management, Inc.; General Partner, Hellman, Jordan Management Co., Boston, MA; Chief Investment Officer, The Putnam Companies, Boston, MA; Credit Analyst and Lending Officer, Fleet Bank; Director and Consultant, EZE Castle Software (investment order management software); Director, Midway Pacific (lumber); and Director, The Golisano Children’s Museum of Naples, Florida. |
Madelyn A. Reilly Birth Date: February 2, 1956 Trustee Indefinite Term Began serving: November 2020 | Principal Occupations: Director or Trustee of the Federated Hermes Fund Family; formerly, Senior Vice President for Legal Affairs, General Counsel and Secretary of Board of Directors, Duquesne University (Retired). Other Directorships Held: None. Qualifications: Ms. Reilly has served in various business and legal management roles throughout her career. Ms. Reilly previously served as Senior Vice President for Legal Affairs, General Counsel and Secretary of Board of Directors and Director of Risk Management and Associate General Counsel, Duquesne University. Prior to her work at Duquesne University, Ms. Reilly served as Assistant General Counsel of Compliance and Enterprise Risk as well as Senior Counsel of Environment, Health and Safety, PPG Industries. Ms. Reilly currently serves as a member of the Board of Directors of UPMC Mercy Hospital. |
Name Birth Date Positions Held with Trust Date Service Began | Principal Occupation(s) for Past Five Years, Other Directorships Held, Previous Position(s) and Qualifications |
P. Jerome Richey Birth Date: February 23, 1949 Trustee Indefinite Term Began serving: October 2013 | Principal Occupations: Director or Trustee of the Federated Hermes Fund Family; Retired; formerly, Senior Vice Chancellor and Chief Legal Officer, University of Pittsburgh and Executive Vice President and Chief Legal Officer, CONSOL Energy Inc. (now split into two separate publicly traded companies known as CONSOL Energy Inc. and CNX Resources Corp.). Other Directorships Held: None. Qualifications: Mr. Richey has served in several business and legal management roles and directorship positions throughout his career. Mr. Richey most recently held the positions of Senior Vice Chancellor and Chief Legal Officer, University of Pittsburgh. Mr. Richey previously served as Chairman of the Board, Epilepsy Foundation of Western Pennsylvania and Chairman of the Board, World Affairs Council of Pittsburgh. Mr. Richey previously served as Chief Legal Officer and Executive Vice President, CONSOL Energy Inc. and CNX Gas Company; and Board Member, Ethics Counsel and Shareholder, Buchanan Ingersoll & Rooney PC (a law firm). |
John S. Walsh Birth Date: November 28, 1957 Trustee Indefinite Term Began serving: November 1998 | Principal Occupations: Director or Trustee of the Federated Hermes Fund Family; President and Director, Heat Wagon, Inc. (manufacturer of construction temporary heaters); President and Director, Manufacturers Products, Inc. (distributor of portable construction heaters); President, Portable Heater Parts, a division of Manufacturers Products, Inc. Other Directorships Held: None. Qualifications: Mr. Walsh has served in several business management roles and directorship positions throughout his career. Mr. Walsh previously served as Vice President, Walsh & Kelly, Inc. (paving contractors). |
Name Birth Date Address Positions Held with Trust Date Service Began | Principal Occupation(s) for Past Five Years and Previous Position(s) |
Lori A. Hensler Birth Date: January 6, 1967 TREASURER Officer since: April 2013 | Principal Occupations: Principal Financial Officer and Treasurer of the Federated Hermes Fund Family; Senior Vice President, Federated Administrative Services; Financial and Operations Principal for Federated Securities Corp.; and Assistant Treasurer, Federated Investors Trust Company. Ms. Hensler has received the Certified Public Accountant designation. Previous Positions: Controller of Federated Hermes, Inc.; Senior Vice President and Assistant Treasurer, Federated Investors Management Company; Treasurer, Federated Investors Trust Company; Assistant Treasurer, Federated Administrative Services, Federated Administrative Services, Inc., Federated Securities Corp., Edgewood Services, Inc., Federated Advisory Services Company, Federated Equity Management Company of Pennsylvania, Federated Global Investment Management Corp., Federated Investment Counseling, Federated Investment Management Company, Passport Research, Ltd., and Federated MDTA, LLC; Financial and Operations Principal for Federated Securities Corp., Edgewood Services, Inc. and Southpointe Distribution Services, Inc. |
Peter J. Germain Birth Date: September 3, 1959 CHIEF LEGAL OFFICER, SECRETARY and EXECUTIVE VICE PRESIDENT Officer since: January 2005 | Principal Occupations: Mr. Germain is Chief Legal Officer, Secretary and Executive Vice President of the Federated Hermes Fund Family. He is General Counsel, Chief Legal Officer, Secretary and Executive Vice President, Federated Hermes, Inc.; Trustee and Senior Vice President, Federated Investors Management Company; Trustee and President, Federated Administrative Services; Director and President, Federated Administrative Services, Inc.; Director and Vice President, Federated Securities Corp.; Director and Secretary, Federated Private Asset Management, Inc.; Secretary, Federated Shareholder Services Company; and Secretary, Retirement Plan Service Company of America. Mr. Germain joined Federated Hermes, Inc. in 1984 and is a member of the Pennsylvania Bar Association. Previous Positions: Deputy General Counsel, Special Counsel, Managing Director of Mutual Fund Services, Federated Hermes, Inc.; Senior Vice President, Federated Services Company; and Senior Corporate Counsel, Federated Hermes, Inc. |
Stephen Van Meter Birth Date: June 5, 1975 CHIEF COMPLIANCE OFFICER AND SENIOR VICE PRESIDENT Officer since: July 2015 | Principal Occupations: Senior Vice President and Chief Compliance Officer of the Federated Hermes Fund Family; Vice President and Chief Compliance Officer of Federated Hermes, Inc. and Chief Compliance Officer of certain of its subsidiaries. Mr. Van Meter joined Federated Hermes, Inc. in October 2011. He holds FINRA licenses under Series 3, 7, 24 and 66. Previous Positions: Mr. Van Meter previously held the position of Compliance Operating Officer, Federated Hermes, Inc. Prior to joining Federated Hermes, Inc., Mr. Van Meter served at the United States Securities and Exchange Commission in the positions of Senior Counsel, Office of Chief Counsel, Division of Investment Management and Senior Counsel, Division of Enforcement. |
Name Birth Date Address Positions Held with Trust Date Service Began | Principal Occupation(s) for Past Five Years and Previous Position(s) |
Stephen F. Auth Birth Date: September 13, 1956 101 Park Avenue 41st Floor New York, NY 10178 CHIEF INVESTMENT OFFICER Officer since: November 2002 | Principal Occupations: Stephen F. Auth is Chief Investment Officer of various Funds in the Federated Hermes Fund Family; Executive Vice President, Federated Investment Counseling, Federated Global Investment Management Corp. and Federated Equity Management Company of Pennsylvania. Previous Positions: Executive Vice President, Federated Investment Management Company and Passport Research, Ltd. (investment advisory subsidiary of Federated); Senior Vice President, Global Portfolio Management Services Division; Senior Vice President, Federated Investment Management Company and Passport Research, Ltd.; Senior Managing Director and Portfolio Manager, Prudential Investments. |
Annual Evaluation of Adequacy and Effectiveness


Federated Hermes Funds
4000 Ericsson Drive
Warrendale, PA 15086-7561
or call 1-800-341-7400.
CUSIP 314183203
CUSIP 314183302
CUSIP 314183401
CUSIP 314183500
CUSIP 314183609

| Item 2. | Code of Ethics |
(a) As of the end of the period covered by this report, the registrant has adopted a code of ethics (the "Section 406 Standards for Investment Companies - Ethical Standards for Principal Executive and Financial Officers") that applies to the registrant's Principal Executive Officer and Principal Financial Officer; the registrant's Principal Financial Officer also serves as the Principal Accounting Officer.
(c) There was no amendment to the registrant’s code of ethics described in Item 2(a) above during the period covered by the report.
(d) There was no waiver granted, either actual or implicit, from a provision to the registrant’s code of ethics described in Item 2(a) above during the period covered by the report.
(e) Not Applicable
(f)(3) The registrant hereby undertakes to provide any person, without charge, upon request, a copy of the code of ethics. To request a copy of the code of ethics, contact the registrant at 1-800-341-7400, and ask for a copy of the Section 406 Standards for Investment Companies - Ethical Standards for Principal Executive and Financial Officers.
Item 3. Audit Committee Financial Expert
The registrant's Board has determined that each of the following members of the Board's Audit Committee is an “audit committee financial expert,” and is "independent," for purposes of this Item: G. Thomas Hough and Thomas M. O'Neill.
| Item 4. | Principal Accountant Fees and Services |
(a) Audit Fees billed to the registrant for the two most recent fiscal years:
Fiscal year ended 2022 – $36,299
Fiscal year ended 2021 - $34,570
(b) Audit-Related Fees billed to the registrant for the two most recent fiscal years:
Fiscal year ended 2022 - $0
Fiscal year ended 2021 - $0
Amount requiring approval of the registrant’s Audit Committee pursuant to paragraph (c)(7)(ii) of Rule 2-01 of Regulation S-X, $0 and $3,303 respectively. Fiscal year ended 2021- Audit consent fee for N-14 filing.
(c) Tax Fees billed to the registrant for the two most recent fiscal years:
Fiscal year ended 2022 - $0
Fiscal year ended 2021 - $3,813
Fiscal year ended 2021- International tax advice with respect to exchange of American Depositary Receipts.
Amount requiring approval of the registrant’s Audit Committee pursuant to paragraph (c)(7)(ii) of Rule 2-01 of Regulation S-X, $0 and $0 respectively.
(d) All Other Fees billed to the registrant for the two most recent fiscal years:
Fiscal year ended 2022 - $0
Fiscal year ended 2021 - $0
Amount requiring approval of the registrant’s Audit Committee pursuant to paragraph (c)(7)(ii) of Rule 2-01 of Regulation S-X, $0 and $0 respectively.
(e)(1) Audit Committee Policies regarding Pre-approval of Services.
The Audit Committee is required to pre-approve audit and non-audit services performed by the independent auditor in order to assure that the provision of such services do not impair the auditor’s independence. Unless a type of service to be provided by the independent auditor has received general pre-approval, it will require specific pre-approval by the Audit Committee. Any proposed services exceeding pre-approved cost levels will require specific pre-approval by the Audit Committee.
Certain services have the general pre-approval of the Audit Committee. The term of the general pre-approval is 12 months from the date of pre-approval, unless the Audit Committee specifically provides for a different period. The Audit Committee will annually review the services that may be provided by the independent auditor without obtaining specific pre-approval from the Audit Committee and may grant general pre-approval for such services. The Audit Committee will revise the list of general pre-approved services from time to time, based on subsequent determinations. The Audit Committee will not delegate to management its responsibilities to pre-approve services performed by the independent auditor.
The Audit Committee has delegated pre-approval authority to its chairman (the “Chairman”) for services that do not exceed a specified dollar threshold. The Chairman or Chief Audit Executive will report any such pre-approval decisions to the Audit Committee at its next scheduled meeting. The Committee will designate another member with such pre-approval authority when the Chairman is unavailable.
AUDIT SERVICES
The annual audit services engagement terms and fees will be subject to the specific pre-approval of the Audit Committee. The Audit Committee will approve, if necessary, any changes in terms, conditions and fees resulting from changes in audit scope, registered investment company (RIC) structure or other matters.
In addition to the annual audit services engagement specifically approved by the Audit Committee, the Audit Committee may grant general pre-approval for other audit services, which are those services that only the independent auditor reasonably can provide. The Audit Committee has pre-approved certain audit services; with limited exception, all other audit services must be specifically pre-approved by the Audit Committee.
AUDIT-RELATED SERVICES
Audit-related services are assurance and related services that are reasonably related to the performance of the audit or review of the RIC’s financial statements or that are traditionally performed by the independent auditor. The Audit Committee believes that the provision of audit-related services does not impair the independence of the auditor, and has pre-approved certain audit-related services; all other audit-related services must be specifically pre-approved by the Audit Committee.
TAX SERVICES
The Audit Committee believes that the independent auditor can provide tax services to the RIC such as tax compliance, tax planning and tax advice without impairing the auditor’s independence. However, the Audit Committee will not permit the retention of the independent auditor in connection with a transaction initially recommended by the independent auditor, the purpose of which may be tax avoidance and the tax treatment of which may not be supported in the Internal Revenue Code and related regulations. The Audit Committee has pre-approved certain tax services; with limited exception, all tax services involving large and complex transactions must be specifically pre-approved by the Audit Committee.
ALL OTHER SERVICES
With respect to the provision of permissible services other than audit, review or attest services the pre-approval requirement is waived if:
| (1) | With respect to such services rendered to the Funds, the aggregate amount of all such services provided constitutes no more than five percent of the total amount of revenues paid by the audit client to its accountant during the fiscal year in which the services are provided; and, |
| (2) | With respect to such services rendered to the Fund’s investment adviser ( the “Adviser”)and any entity controlling, controlled by to under common control with the Adviser such as affiliated non-U.S. and U.S. funds not under the Audit Committee’s purview and which do not fall within a category of service which has been determined by the Audit Committee not to have a direct impact on the operations or financial reporting of the RIC, the aggregate amount of all services provided constitutes no more than five percent of the total amount of revenues paid to the RIC’s auditor by the RIC, its Adviser and any entity controlling, controlled by, or under common control with the Adviser during the fiscal year in which the services are provided; and |
| (3) | Such services were not recognized by the issuer or RIC at the time of the engagement to be non-audit services; and |
| (4) | Such services are promptly brought to the attention of the Audit Committee and approved prior to the completion of the audit by the Audit Committee or by one or more members of the Audit Committee who are members of the Board of Directors to whom authority to grant such approvals has been delegated by the Audit Committee. |
The Audit Committee may grant general pre-approval to those permissible non-audit services which qualify for pre-approval and which it believes are routine and recurring services, and would not impair the independence of the auditor.
The Securities and Exchange Commission’s (the “SEC”) rules and relevant guidance should be consulted to determine the precise definitions of these services and applicability of exceptions to certain of the prohibitions.
PRE-APPROVAL FEE LEVELS
Pre-approval fee levels for all services to be provided by the independent auditor will be established annually by the Audit Committee. Any proposed services exceeding these levels will require specific pre-approval by the Audit Committee.
PROCEDURES
Requests or applications to provide services that require specific approval by the Audit Committee will be submitted to the Audit Committee by the Fund’s Principal Accounting Officer and/or the Chief Audit Executive of Federated Hermes, Inc., only after those individuals have determined that the request or application is consistent with the SEC’s rules on auditor independence.
(e)(2) Percentage of services identified in items 4(b) through 4(d) that were approved by the registrant’s Audit Committee pursuant to paragraph (c)(7)(i)(C) of Rule 2-01 of Regulation S-X:
4(b)
Fiscal year ended 2022 – 0%
Fiscal year ended 2021 - 0%
Percentage of services provided to the registrant’s Adviser and any entity controlling, controlled by, or under common control with the Adviser that provides ongoing services to the registrant that were approved by the registrant’s Audit Committee pursuant to paragraph (c)(7)(i)(C) of Rule 2-01 of Regulation S-X, 0% and 0% respectively.
4(c)
Fiscal year ended 2022 – 0%
Fiscal year ended 2021 – 0%
Percentage of services provided to the registrant’s Adviser and any entity controlling, controlled by, or under common control with the Adviser that provides ongoing services to the registrant that were approved by the registrant’s Audit Committee pursuant to paragraph (c)(7)(i)(C) of Rule 2-01 of Regulation S-X, 0% and 0% respectively.
4(d)
Fiscal year ended 2022 – 0%
Fiscal year ended 2021 – 0%
Percentage of services provided to the registrant’s Adviser and any entity controlling, controlled by, or under common control with the Adviser that provides ongoing services to the registrant that were approved by the registrant’s Audit Committee pursuant to paragraph (c)(7)(i)(C) of Rule 2-01 of Regulation S-X, 0% and 0% respectively.
| (f) | NA |
| (g) | Non-Audit Fees billed to the registrant, the registrant’s Adviser, and certain entities controlling, controlled by or under common control with the Adviser: |
Fiscal year ended 2022 - $25,435
Fiscal year ended 2021 - $20,255
| (h) | The registrant’s Audit Committee has considered that the provision of non-audit services that were rendered to the registrant’s Adviser (not including any sub-adviser whose role is primarily portfolio management and is subcontracted with or overseen by another investment adviser), and any entity controlling, controlled by, or under common control with the Adviser that provides ongoing services to the registrant that were not pre-approved pursuant to paragraph (c)(7)(ii) of Rule 2-01 of Regulation S-X is compatible with maintaining the principal accountant’s independence. |
| Item 5. | Audit Committee of Listed Registrants |
Not Applicable
| Item 6. | Schedule of Investments |
(a) The registrant’s Schedule of Investments is included as part of the Report to Stockholders filed under Item 1 of this form.
(b) Not Applicable; Fund had no divestments during the reporting period covered since the previous Form N-CSR filing.
| Item 7. | Disclosure of Proxy Voting Policies and Procedures for Closed-End Management Investment Companies |
Not Applicable
| Item 8. | Portfolio Managers of Closed-End Management Investment Companies |
Not Applicable
| Item 9. | Purchases of Equity Securities by Closed-End Management Investment Company and Affiliated Purchasers |
Not Applicable
| Item 10. | Submission of Matters to a Vote of Security Holders |
No Changes to Report
| Item 11. | Controls and Procedures |
(a) The registrant’s President and Treasurer have concluded that the
registrant’s disclosure controls and procedures (as defined in rule 30a-3(c) under the Act) are effective in design and operation and are sufficient to form the basis of the certifications required by Rule 30a-(2) under the Act, based on their evaluation of these disclosure controls and procedures within 90 days of the filing date of this report on Form N-CSR.
(b) There were no changes in the registrant’s internal control over financial reporting (as defined in rule 30a-3(d) under the Act) during the period covered by this report that have materially affected, or are reasonably likely to materially affect, the registrant’s internal control over financial reporting.
| Item 12. | Disclosure of Securities Lending Activities for Closed-End Management Investment Companies |
Not Applicable
| Item 13. | Exhibits |
(a)(1) Code of Ethics- Not Applicable to this Report.
(a)(2) Certifications of Principal Executive Officer and Principal Financial Officer.
(a)(3) Not Applicable.
(b) Certifications pursuant to 18 U.S.C. Section 1350.
SIGNATURES
Pursuant to the requirements of the Securities Exchange Act of 1934 and the Investment Company Act of 1940, the registrant has duly caused this report to be signed on its behalf by the undersigned, thereunto duly authorized.
Registrant Federated Hermes Global Allocation Fund
By /S/ Lori A. Hensler
Lori A. Hensler, Principal Financial Officer
Date January 23, 2023
Pursuant to the requirements of the Securities Exchange Act of 1934 and the Investment Company Act of 1940, this report has been signed below by the following persons on behalf of the registrant and in the capacities and on the dates indicated.
By /S/ J. Christopher Donahue
J. Christopher Donahue, Principal Executive Officer
Date January 23, 2023
By /S/ Lori A. Hensler
Lori A. Hensler, Principal Financial Officer
Date January 23, 2023