 Oppenheimer 3 rd Annual Industrials Conference October 2, 2008 Exhibit 99.1 |
 2 Safe Harbor Statement Except for historical information contained herein, the statements in this presentation are forward-looking and made pursuant to the safe harbor provisions of the Private Securities Litigation Reform Act of 1995. Forward-looking statements involve known and unknown risks and uncertainties that may cause the actual results of Mueller Water Products, Inc. in future periods to differ materially from forecasted results. Those risks include, among others, changes in customer orders and demand for our products; changes in raw material prices, labor, equipment and transportation costs; pricing actions by the Company and its competitors; changes in law; the ability to attract and retain management and employees; the inability to successfully execute management strategies with respect to cost containment, production increases or decreases, inventory control, the integration of acquired businesses, and the commencement of operations at our new manufacturing plant; and general changes in economic and financial conditions, residential construction or municipal spending. Risks associated with forward-looking statements are more fully described in our filings with the Securities and Exchange Commission. Mueller Water Products assumes no duty to update its forward-looking statements as of any future date. Non-GAAP Financial Measures Within this presentation, the Company makes reference to certain non-GAAP financial measures, which are derived from GAAP financial measures. These non-GAAP measures are provided because they are used as a standard metric by the financial community. We believe these measures will assist the financial community in assessing the Company’s underlying performance for the periods being reported. There are limitations to these non-GAAP measures, and reconciliations between GAAP and non-GAAP financial measures are included in the supplemental information at the end of this presentation. SAFE HARBOR STATEMENT |
 3 Key Attributes of Mueller Water Products • Leading water infrastructure products provider • Strong brands highly recognized for quality • Low-cost manufacturing operations • Attractive and growing water infrastructure industry |
 4 Current Economic Climate • Credit availability - Refinanced May 2007 - $260 million untapped revolver - Comfortably within our debt covenants • Banking relationships • Cash investments – $142 million at end of Q3 – Invested to preserve principal – Invested cash has increased in Q4 • Cost savings – Track record in implementing cost savings – Lean Six Sigma and lean manufacturing • Capital expenditures – Capital expenditures needs projected to decrease in coming years • End market drivers |
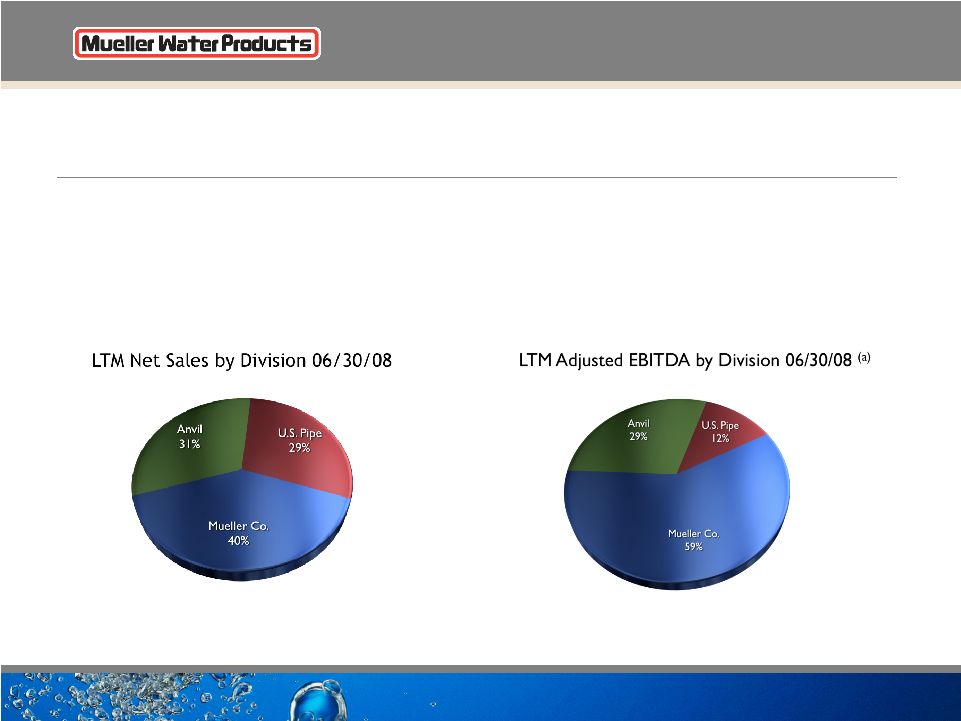 5 Leading Water Infrastructure Products Provider • Large installed base of products in U.S. • Leading specifications position, including top 50 U.S. markets (a) Before corporate expenses LTM Net Sales: $1,837 MM LTM Adjusted EBITDA: $262 MM LTM Adjusted EBITDA Margin: 14.3% |
 6 Restrained Joint Pipe Ductile Iron Pipe Joint Restraint Joint Fitting Broad and Profitable Product Portfolio $728MM $127MM $50MM $177MM SEGMENT NET SALES PRODUCT PORTFOLIO ADJUSTED OPERATING INCOME (a) $530MM $13MM $23MM $36MM $579MM $64MM $21MM $86MM Iron Gate Valves Butterfly, Ball and Plug Valves Fittings & Couplings Cast Iron Fittings Hangers & Supports Gas Products / Tapping Machines Pipe Nipples Hydrants DEPRECIATION AND AMORTIZATION (b) Est. 1857 Est. 1899 Est. 1999 (1850) HISTORICAL ROOTS Note: All statistics are actuals for LTM, ended June 30, 2008 (a) Segment operating income excludes corporate expenses of $37 million. U.S. Pipe operating income excludes $17.9 million of closure costs related to the Burlington facility. (b) Segment depreciation and amortization excludes corporate depreciation of $1 million. EBITDA (a) (b) |
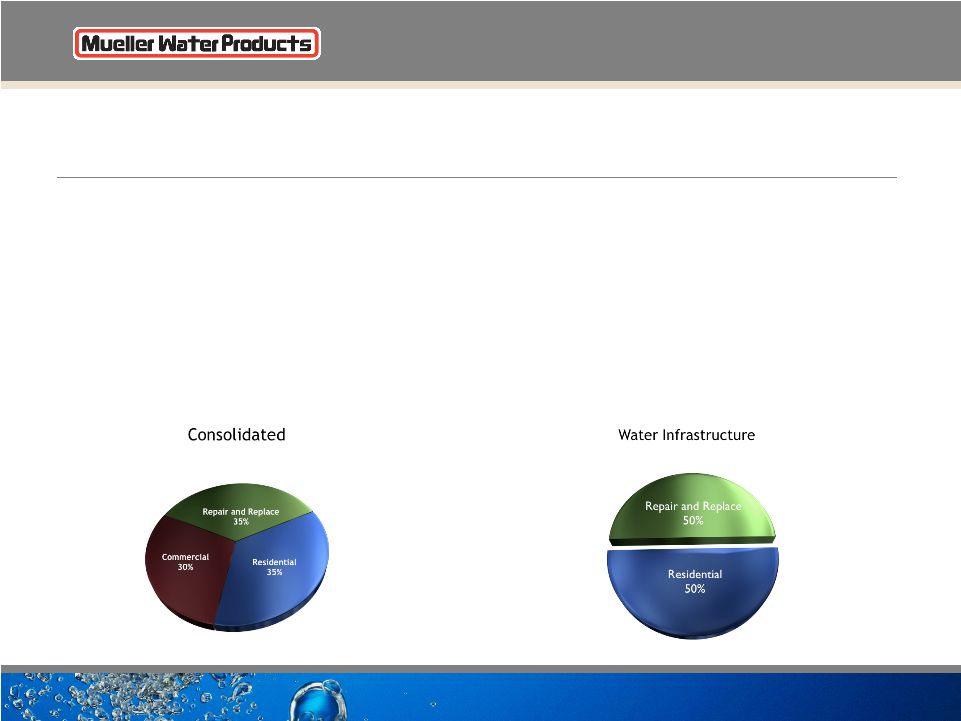 7 Primary End Markets • 70% of FY2007 net sales was water infrastructure related • 50% was repair and replacement (public sector) • 50% was residential construction • 30% of FY2007 net sales was commercial construction related Source: Management Estimates 2007 Net Sales |
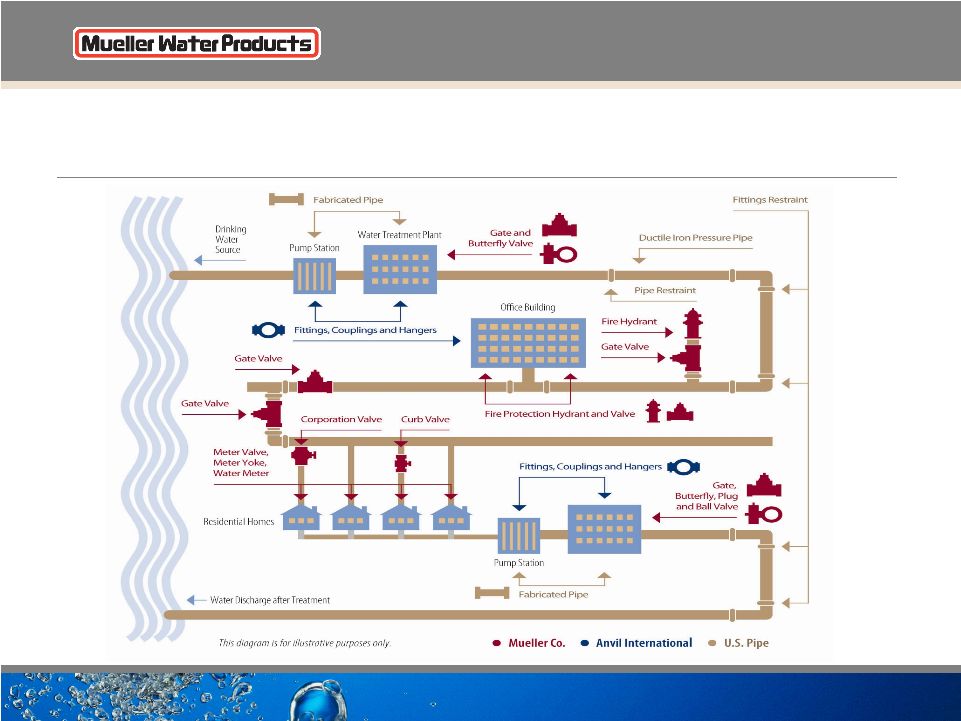 8 Complete Water Transmission Solutions |
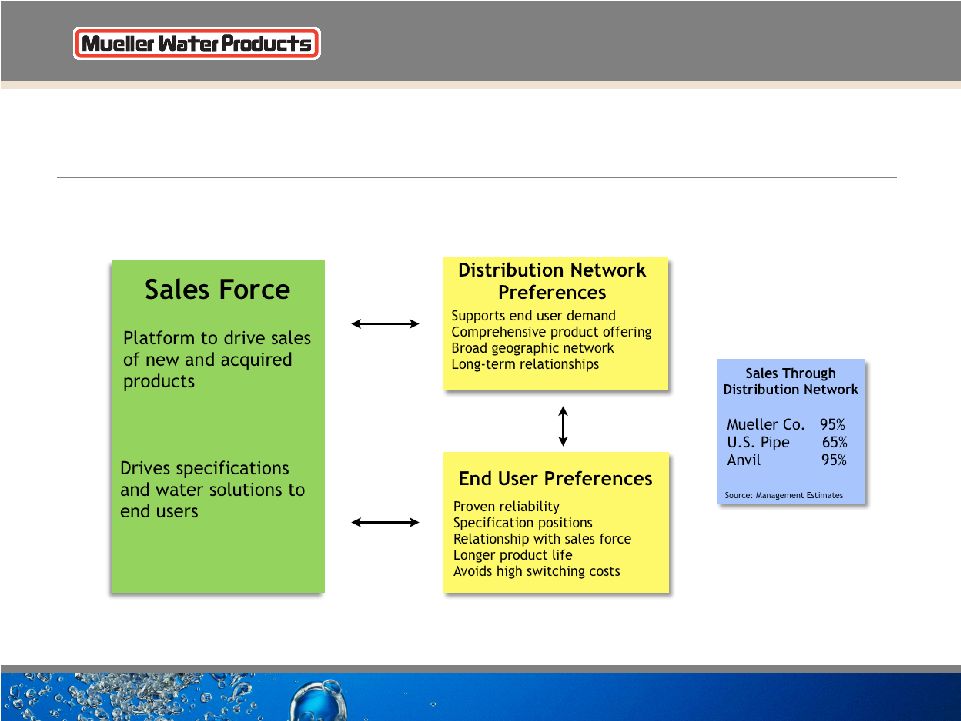 9 Comprehensive Distribution Network Installed base and specified products drive demand |
 10 Technical and Product Innovation • Manufacturing excellence - Commitment to being low-cost producer • Lost foam manufacturing process - Only manufacturer utilizing process for valves and hydrants - Reduced production costs by 15% • Automating ductile iron pipe manufacturing - Cuts labor costs in half - Leverages existing melting capacity - First production Q4 FY2008 Lost foam casting Ductile iron pipe Source: Management Estimates |
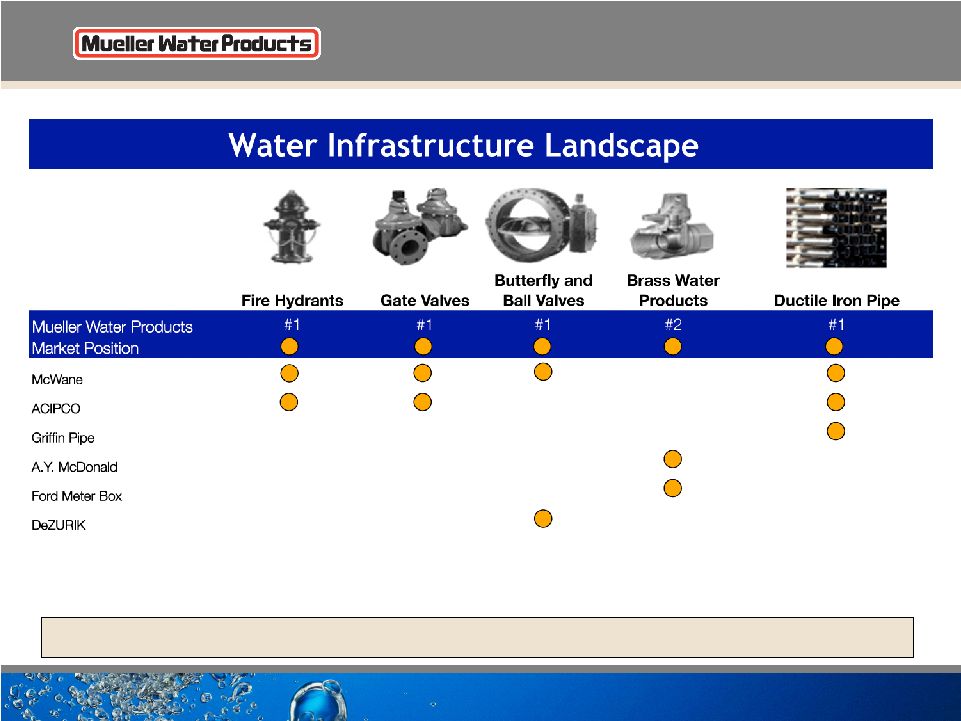 11 75% of revenue comes from products that are #1 or #2 |
 The Water Infrastructure Industry |
 13 An Aging Water Infrastructure Industry • Water leakage rates as high as 20% • Water systems serving 2 to 3 times more people than originally intended (1) • Water infrastructure graded a “D-” by American Society of Civil Engineers • Existing and future legislation could lead to increased infrastructure investment A National Issue with Local Ownership Source: (1) American Water Works Association |
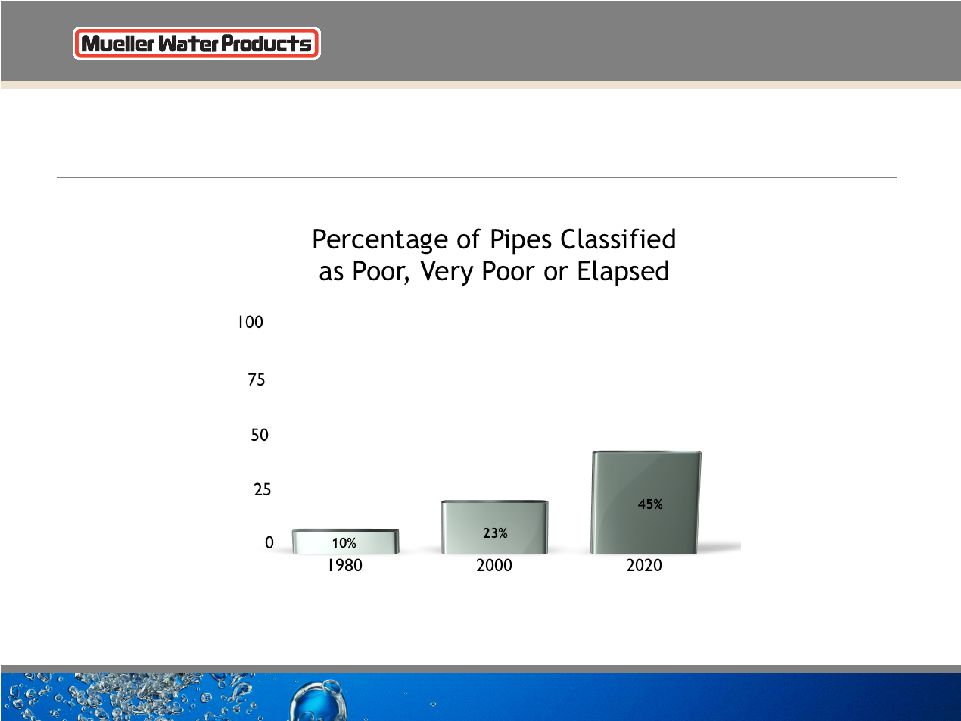 14 An Aging Water Infrastructure Source: The EPA Clean Water and Drinking Water Infrastructure Gap Analysis 2002 % |
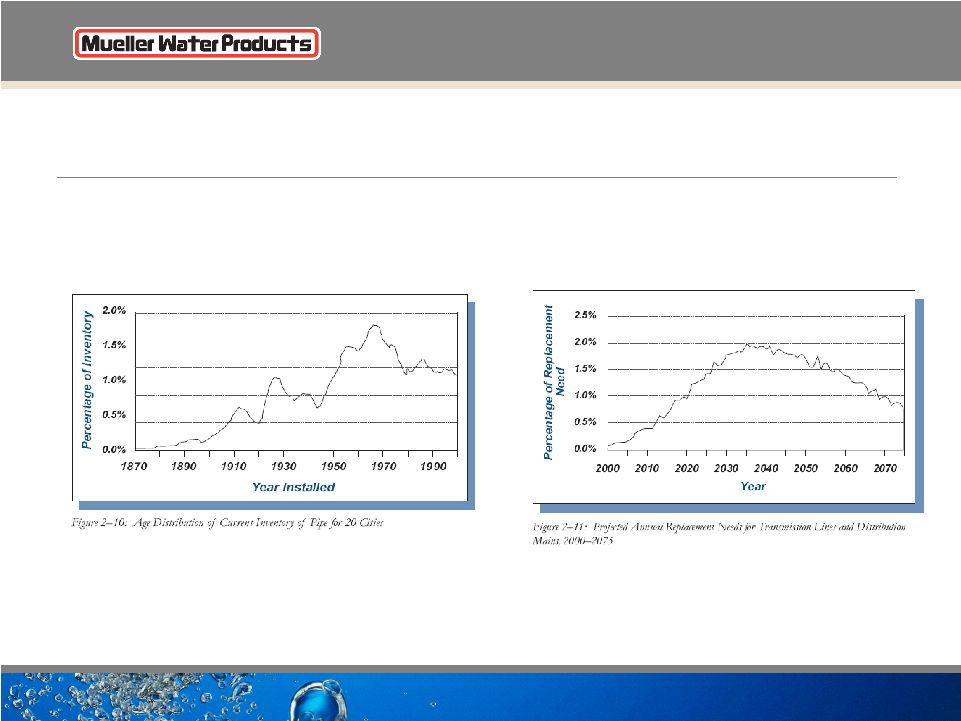 15 An Aging Water Infrastructure Source: The EPA Clean Water and Drinking Water Infrastructure Gap Analysis 2002 |
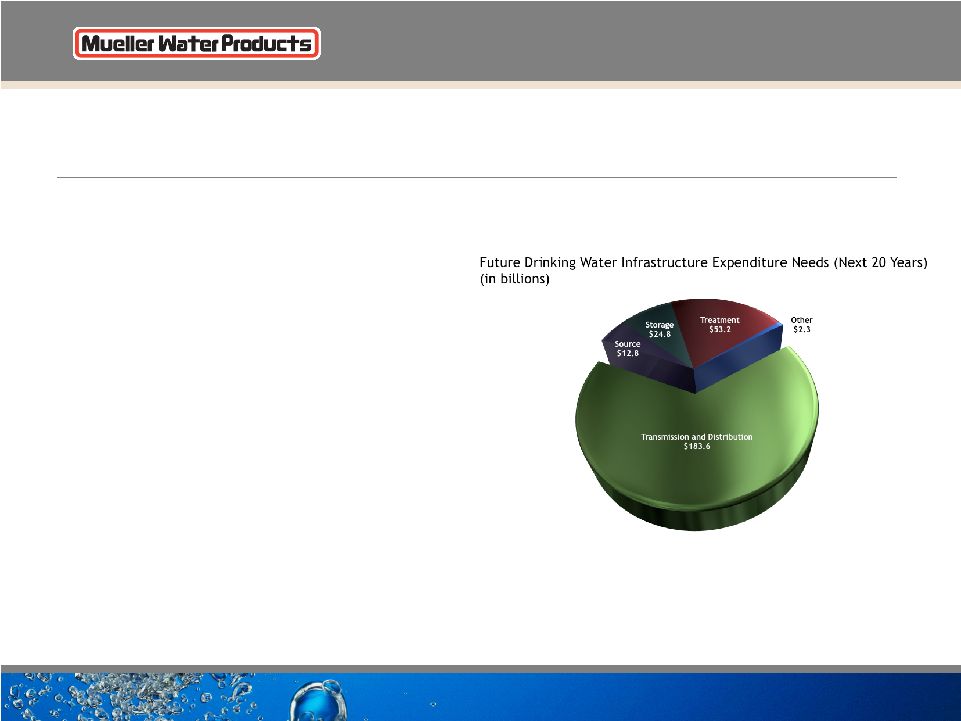 16 An Aging Water Infrastructure • Aging water pipes need to be rehabilitated or replaced • Valves and hydrants typically replaced at same time as pipes Source: EPA 2003 Drinking Water Needs Survey and Assessment |
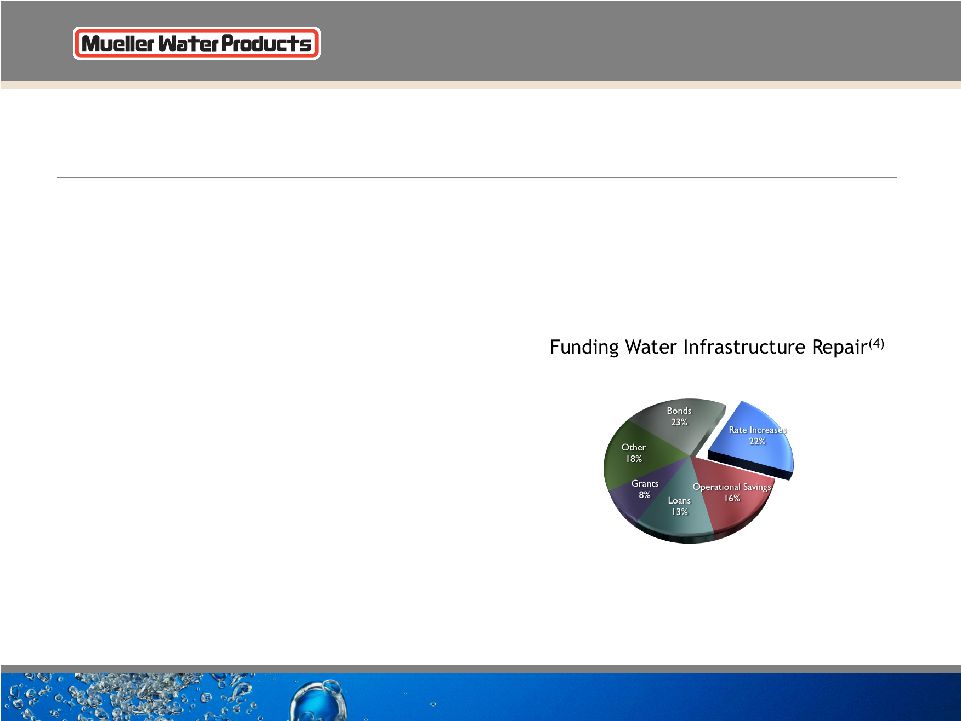 17 Water Infrastructure Market Opportunity • Growing repair and replace market • Public spending on water infrastructure expected to increase 17% in 2008 (Oct. 2007 AWWA survey) • 55% of Mueller Co.’s net sales in 2007 • 45% of U.S. Pipe’s net sales in 2007 • Rate increases • Average annual rate increase between 1996 and 2006: 4.1% (1) • 29% of water systems charge less than cost (2) • Spending • 90% funded at local level (3) Source: (1) American Water Works Association 2006 Water and Wastewater Rate Survey (2) Government Accountability Office 2004 report on water infrastructure (3) EPA Clean Water and Drinking Water Infrastructure Gap Analysis 2002 (4) AWWA State of the Industry Report October 2007 |
 Business Update |
 19 Management Actions • Completed synergy plan - At high end of range of $40 - $50 million • Continue to reduce fixed and variable costs - Closed Burlington facility - Expected to generate $15 - $17 million in annualized savings - Reduced headcount at Mueller Co. and U.S. Pipe by approx. 150 positions • Refinanced debt - Net debt decreased 12% over last 12 months - Debt well within maintenance debt covenants • Implemented inventory reduction plan - Generated free cash flow • Implemented price increases - With key product lines in a tough market • Constructing automated ductile iron pipe manufacturing (Bessemer, AL) - Cuts labor costs in half and leverages existing melting capacity - Accelerated start up – first production Q4 2008 |
 20 1 First Nine Months Fiscal 2008 adjusted to exclude $17.9 million, $10.9 million net of tax ($0.10 per share), of restructuring charges related to the closure of Burlington manufacturing operations. FY 3Q07 and 9-month Earnings per share adjusted for $36.4 million loss on early extinguishment of debt ($21.0 million or $0.18 per share, net of tax). See slide 28 for reconciliation of GAAP to non-GAAP performance measures Consolidated Results Q3 Net Sales Increased • $17.6 million higher pricing across all business segments, volume increases at U.S. Pipe and Anvil and $5.7 million favorable Canadian currency exchange rates Q3 Operating Income • Sales price increases of $17.6 million only offset higher costs of raw materials and purchased components of $17.6 million resulting in lower margins • $11.5 million cost reductions were more than offset by $9.5 million negative impact of reduced production and higher SG&A $ in millions (except EPS) 2008 2007 2008 2007 Net sales $528.5 $502.5 $1,362.4 $1,374.1 Income from operations 1 $53.6 $57.4 $115.9 $159.3 Operating income margin 1 10.1% 11.4% 8.5% 11.6% EPS 1 $0.18 $0.17 $0.31 $0.47 EBITDA 1 $76.6 $83.2 $185.2 $234.6 EBITDA margin 1 14.5% 16.6% 13.6% 17.1% First Nine Months Fiscal Third Quarter Fiscal |
 21 $45.1 $44.9 1 ($66.1) ($60.8 ) $0.0 $20.0 $40.0 $60.0 $80.0 $100.0 $120.0 2008 2007 Free Cash Flow (YTD through June 30) $105.9 $111.0 Free Cash Flow Capital Expenditures Cash flow from Operations 1) 2007 excludes $48.1 million of cash costs related to debt refinancing activities during FY 3Q07 2) YTD 2008 Adj. Net Income excludes $10.9 million, net of tax, costs related to the closure of Burlington facility 3) YTD 2007 Adj. Net Income excludes $21.0 million, net of tax, loss on early extinguishment of debt Free Cash Flow as % of Adj. Net Income YTD 2008 128% 2 YTD 2007 82% 3 1 |
 22 3.5X 3.7X 0.0 1.0 2.0 3.0 4.0 5.0 6.0 Leverage Ratio Interest Coverage 5.25X Maintenance Debt Covenants 2.5X Covenant restriction Maximum Minimum LTM as of June 30, 2008 |
 23 Near-Term Key Drivers Residential Construction Repair and Replace Commercial Construction Water Infrastructure Distributors Raw Materials Pricing Housing starts down 30.6% Q3 2008 vs. Q3 2007 Public spending on water infrastructure expected to continue to increase long term, although there is some uncertainty in the near term Commercial construction currently remaining stable through FY 2008 but is expected to soften Distributors ordered in advance of price increases. Expected to impact Q4 volumes Ongoing impact of unprecedented increases in the cost of raw materials (scrap iron, brass ingot, etc.) Realizing benefits of some price increases, but they may not cover higher raw material costs across all business units in Q4. August ductile iron pipe price increase wasn’t realized. |
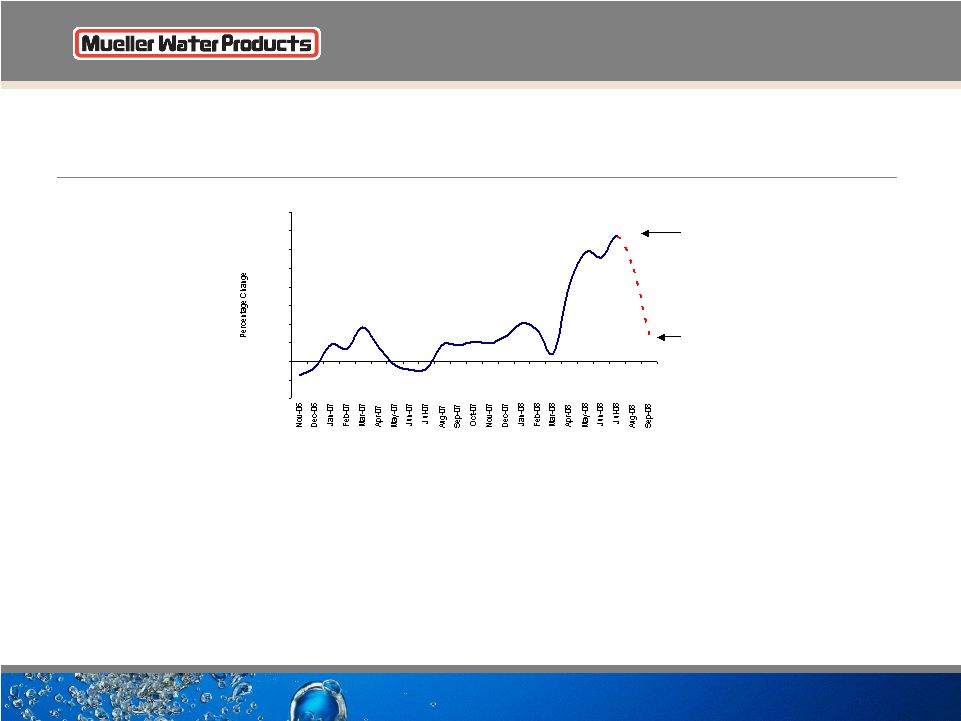 24 Raw Material Purchase Price Volatility U.S. Pipe • July 2008 - $533 per ton up 8% from April. Up 134% from July 2007 Mueller Co. • July 2008 - $699 per ton up 24% from April. Up 59% from July 2007 • Brass ingot increased from $2.64 per pound in January 2008 to $3.10 per pound in July 2008, essentially flat from April Scrap Iron Price Trends (U.S. Pipe) (Price percentage change over prior year) -40.0% -20.0% 0.0% 20.0% 40.0% 60.0% 80.0% 100.0% 120.0% 140.0% 160.0% July September |
 25 Potential Uses of Cash • Reinvesting in the business • Paying dividends • Repaying debt • Repurchasing stock • Making strategic acquisitions |
 26 Strategy and Objectives • Maintain market leadership positions • Expand internationally • Continue to enhance operational excellence • Broaden breadth and depth of products and services Capitalize on the large, attractive and growing water infrastructure markets worldwide |
 27 Investment Highlights • Attractive long-term water industry dynamics - Driven by new and upgraded infrastructure - Limited number of suppliers to end markets • Strong competitive position - Leading brand positions with large installed base - Leading municipal specification positions - Comprehensive distribution network - Low-cost manufacturing operations • Growth opportunities - Organic growth - Strategic acquisitions (including international expansion) • Successful synergy implementation plan |
 Supplemental Data |
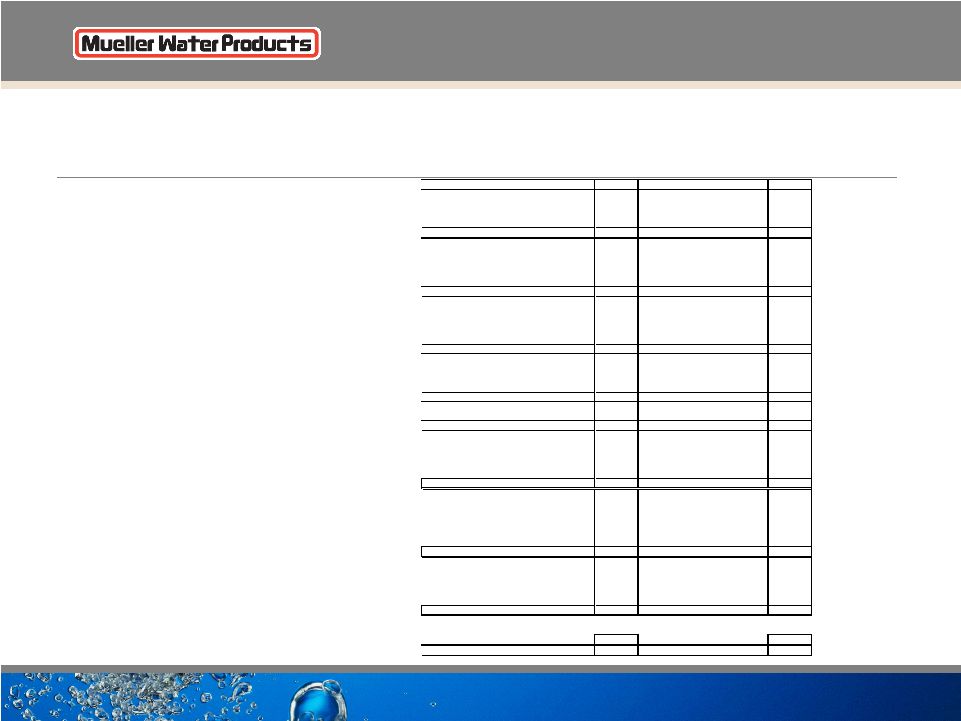 29 Segment Results & Reconciliation of GAAP to Non- GAAP Performance Measures $ in Millions (except EPS) Q1 '07 Q2 '07 Q3 '07 Q4 '07 FY 07 Q1 '08 Q2 '08 Q3 '08 LTM Net sales: Mueller Co. 162.1 195.9 203.1 195.0 756.1 161.6 168.9 203.0 728.5 U.S. Pipe 116.4 129.7 153.3 137.7 537.1 110.7 114.2 167.7 530.3 Anvil 133.4 134.1 146.1 142.2 555.8 140.0 138.5 157.8 578.5 411.9 459.7 502.5 474.9 1,849.0 412.3 421.6 528.5 1,837.3 Reported income (loss) from operations: Mueller Co. 35.7 42.8 41.5 34.7 154.7 24.8 27.4 40.4 127.3 U.S. Pipe 7.2 6.8 8.9 10.4 33.3 (15.3) (2.8) 2.9 (4.8) Anvil 13.0 13.6 17.4 13.4 57.4 15.9 12.9 21.9 64.1 Corporate (6.9) (10.3) (10.4) (7.8) (35.4) (9.0) (9.5) (11.6) (37.9) 49.0 52.9 57.4 50.7 210.0 16.4 28.0 53.6 148.7 Depreciation: Mueller Co. 6.5 6.7 6.9 6.7 26.8 6.3 6.1 6.0 25.1 U.S. Pipe 5.5 5.9 6.1 5.8 23.3 5.7 5.1 5.2 21.8 Anvil 5.0 4.9 4.9 5.6 20.4 4.1 4.2 4.1 18.0 Corporate 0.3 0.2 0.5 0.8 1.8 0.1 0.2 0.1 1.2 17.3 17.7 18.4 18.9 72.3 16.2 15.6 15.4 66.1 Amortization of intangible assets: Mueller Co. 6.2 6.3 6.3 6.2 25.0 6.3 6.2 6.3 25.0 U.S. Pipe - 0.3 0.2 0.2 0.7 0.2 0.3 0.2 0.9 Anvil 0.9 0.8 0.9 0.8 3.4 0.9 0.8 0.9 3.4 7.1 7.4 7.4 7.2 29.1 7.4 7.3 7.4 29.3 Unusual adjustments: Burlington Plant Closure Costs - - - - - 16.2 1.5 0.2 17.9 - - - - - 16.2 1.5 0.2 17.9 Adjusted EBITDA: Mueller Co. 48.4 55.8 54.7 47.6 206.5 37.4 39.7 52.7 177.4 U.S. Pipe 12.7 13.0 15.2 16.4 57.3 6.8 4.1 8.3 35.6 Anvil 18.9 19.3 23.2 19.8 81.2 20.9 17.9 26.9 85.5 Corporate (6.6) (10.1) (9.9) (7.0) (33.6) (8.9) (9.3) (11.5) (36.7) 73.4 78.0 83.2 76.8 �� 311.4 56.2 52.4 76.4 261.8 Capital expenditures: Mueller Co. 6.7 5.7 4.3 5.0 21.7 4.4 4.4 5.0 18.8 U.S. Pipe 7.8 12.1 14.3 13.3 47.5 9.1 13.9 15.3 51.6 Anvil 5.1 3.7 3.4 2.8 15.0 3.3 2.2 3.0 11.3 Corporate 0.4 1.0 1.6 1.1 4.1 - - 0.2 1.3 20.0 22.5 23.6 22.2 88.3 16.8 20.5 23.5 83.0 Reported income (loss) from operations: 49.0 52.9 57.4 50.7 210.0 16.4 28.0 53.6 148.7 Interest expense, net 20.4 21.1 23.3 22.0 86.8 19.2 18.1 17.5 76.8 Loss on early extinguishment of debt - - 36.4 0.1 36.5 - - - 0.1 Income tax expense (benefit) 11.6 13.9 (1.0) 14.0 38.5 (1.2) 4.2 15.8 32.8 Net income (loss) 17.0 17.9 (1.3) 14.6 48.2 (1.6) 5.7 20.3 39.0 Diluted earnings per share: Net income (loss) 0.15 0.16 (0.01) 0.13 0.42 (0.01) 0.05 0.18 0.35 Net income (loss), adjusted for unusual items 0.15 0.16 0.17 0.13 0.60 0.07 0.06 0.18 0.44 |
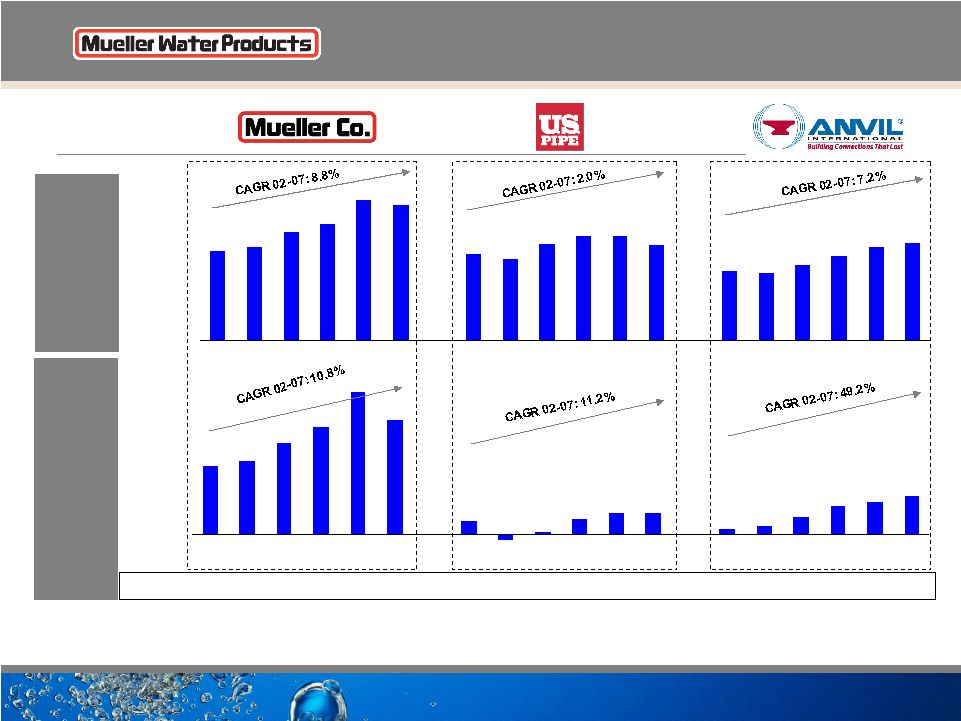 30 $509 $618 $664 $804 $775 $492 $465 $551 $598 $595 $543 $393 $387 $431 $485 $535 $557 $0 $200 $400 $600 $800 $1,000 2002 2003 2004 2005 2006 2007 2002 2003 2004 2005 2006 2007 2002 2003 2004 2005 2006 2007 $107 $114 $142 $168 $179 $20 ($9) $4 $24 $33 $34 $8 $14 $27 $45 $51 $59 $222 ($50) $0 $50 $100 $150 $200 2002 2003 2004 2005 2006 2007 2002 2003 2004 2005 2006 2007 2002 2003 2004 2005 2006 2007 21.0% 21.2% 23.0% 25.3% 27.6% 23.0% 2.0% 3.5% 6.2% 9.3% 9.5% 10.6% (a) Fiscal year end as of September 30. (b) Financials for 2002 and 2003 are calendar year while 2004 – 2007 a fiscal year ending September 30. (c) Excludes $6.5 million of litigation settlement expenses in 2003. (d) Excludes environmental-related insurance settlement benefits of $1.9 million and $5.1 million in 2004 and 2005, respectively. (e) Excludes U.S. Pipe Chattanooga Closing Costs of $49.9 million; Mueller Co. Inventory Step-Up costs of $53.5 million and Anvil Inventory Step-up costs of $17.3 million; Incremental amortization expense of $23.6 million for Mueller Co. and $1.8 million for Anvil in FY 2006 and $24.0 million for Mueller Co., $1.7 million for Anvil, and $0.7 million for U.S. Pipe in FY 2007 NET SALES OPERATING INCOME (e) (b) (a) (a) (d) (d) ($ in millions) (e) (e) (e) (e) (e) Operating Margin (c) 4.1% NM 0.7% 4.0% 5.5% 6.2% $536 th |
 Questions |