united states
securities and exchange commission
washington, d.c. 20549
form n-csr
certified shareholder report of registered management
investment companies
Investment Company Act file number 811-21872
Mutual Fund Series Trust
(Exact name of registrant as specified in charter)
4221 North 203rd Street, Suite 100 Elkhorn, Nebraska 68022-3474
(Address of principal executive offices) (Zip code)
Ultimus Fund Solutions ___
80 Arkay Drive, Suite 110, Hauppauge, NY 11788
(Name and address of agent for service)
Registrant's telephone number, including area code: 866-447-4228
Date of fiscal year end: 3/31
Date of reporting period: 3/31/23
ITEM 1. REPORTS TO SHAREHOLDERS.

Annual Report
AlphaCentric Income Opportunities Fund
Class A: IOFAX Class C: IOFCX Class I: IOFIX
AlphaCentric Premium Opportunity Fund
Class A: HMXAX Class C: HMXCX Class I: HMXIX
AlphaCentric Robotics and Automation Fund
Class A: GNXAX Class C: GNXCX Class I: GNXIX
AlphaCentric Symmetry Strategy Fund
Class A: SYMAX Class C: SYMCX Class I: SYMIX
AlphaCentric LifeSci Healthcare Fund
Class A: LYFAX Class C: LYFCX Class I: LYFIX
AlphaCentric SWBC Municipal Opportunities Fund
Class A: MUNAX Class C: MUNCX Class I: MUNIX
AlphaCentric Strategic Income Fund
Class A: SIIAX Class C: SIICX Class I: SIIIX
March 31, 2023
AlphaCentric Advisors LLC
53 Palmeras Street, Suite 601
San Juan, PR 00901
1-844-223-8637

March 31, 2023
Dear AlphaCentric Income Opportunities Fund (“the Fund”) Investor:
To say that the last year has been eventful is an understatement, and to that end we hope you have been able to weather the volatility in the markets as well as the world in general!
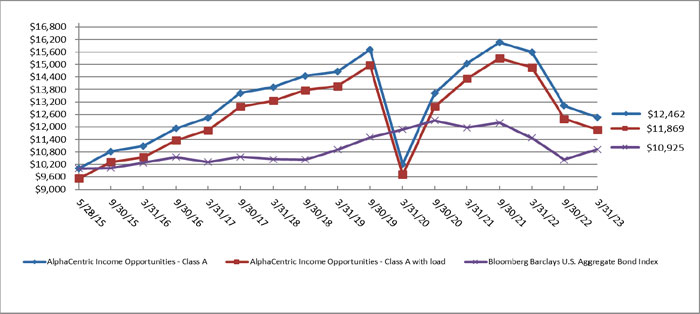
Few asset classes were spared over the last year, with the Fund’s holdings being no exception: returns were -19.90% (Class I shares), versus -4.78% for the Bloomberg US Aggregate Bond Index.
The Federal Reserve (“Fed”) continued its vigilant battle against inflation all last year and into 2023, raising rates every meeting at a pace not seen prior. The war in Ukraine persisted and dragged, requiring more and more US financial and military support and contributing to a deep risk-off mentality, with investors effectively remaining on the sidelines all year. Even the turn of the calendar year, which allowed participants to “start with a clean slate” and begin January 2023 with higher yields and bounce-back prospects aplenty, was met with a very strong jobs number and persistent inflation indicators. This quickly led to additional Fed hike fears and thus reluctance to deploy capital.
However, spillover effects from the rapid rise in rates plus apparent missteps in Fed monitoring led to turmoil at Silicon Valley Bank (SVB) in early March. As other regional banks were swept up into the resultant deposit run, an effective “lid” on further Fed hike action was priced into the market; incremental calm and stability in bonds resulted; and broad fixed income performance has improved.
Our sector presently remains relatively cheap, but activity has been increasing and we feel that the Fund is poised to potentially rally in response. Interestingly, collateral and fundamentals have not been an issue at all and have steadily improved. We believe that the clearing-up of poor bond technicals should produce much better conditions.
Further, the Fund’s dividend was increased in November to reflect higher interest generated from the floating-rate holdings of the Fund.
We thank you for your support of the Fund during this difficult period, and hope for more favorable market conditions this year!
Sincerely,
Garrison Point Fund Management Team
This report is intended for the Fund’s shareholders. It may not be distributed to prospective investors unless it is preceded or accompanied by the current Fund prospectus. To obtain a prospectus or other information about the Fund, please visit www.AlphaCentricFunds.com or call 844-ACFUNDS (844-223-8637). Please read the prospectus carefully before investing.
1
The Fund’s returns for the fiscal year ended 3/31/23 and for the period since inception through 3/31/23, as compared to the Benchmark Index, were as follows:
| Since Inception | ||
| Fiscal Year Ended 3/31/2023 | 5/28/2015 | |
| Class I | -19.90 | 3.11 |
| Class A | -20.13 | 2.85 |
| Class A w/ Sales Charge | -23.91 | 2.21 |
| Class C | -20.74 | 2.08 |
| Bloomberg US Agg Bond Index (1) | -4.78 | 1.13 |
| (1) | Bloomberg US Aggregate Bond Index: A market capitalization-weighted index that is designed to measure the performance of the U.S. investment grade bond market with maturities of more than one year. Investors cannot invest directly in an index. |
The Fund’s maximum sales charge for Class “A” shares is 4.75%. Performance is historic and does not guarantee future results. Investment return and principal value will fluctuate with changing market conditions so that when redeemed, shares may be worth more or less than their original cost. Current performance may be lower or higher than the performance data quoted. To obtain the most recent month end performance information or the Fund’s prospectus please call the Fund, toll free at 1-844-ACFUNDS (844-223-8637). You can also obtain a prospectus at www.AlphaCentricFunds.com. 5436-NLD-05052023
2
AlphaCentric Income Opportunities Fund
PORTFOLIO REVIEW (Unaudited)
March 31, 2023
The Fund’s performance figures* for the periods ended March 31, 2023, compared to its benchmark:
| Annualized | ||||
| Annualized | Annualized | Since Inception + - | ||
| One Year | Three Years | Five Years | March 31, 2023 | |
| Class A (IOFAX) | (20.13)% | 6.88% | (2.18)% | 2.85% |
| Class A (IOFAX) with 4.75% load | (23.91)% | 5.15% | (3.13)% | 2.21% |
| Class C (IOFCX) | (20.74)% | 6.07% | (2.92)% | 2.08% |
| Class I (IOFIX) | (19.90)% | 7.15% | (1.93)% | 3.11% |
| Bloomberg U.S. Aggregate Bond Index ** | (4.78)% | (2.77)% | 0.91% | 1.13% |
| * | The performance data quoted here represents past performance. Current performance may be lower or higher than the performance data quoted above. Investment return and principal value will fluctuate, so that shares, when redeemed, may be worth more or less than their original cost. Class A is subject to a maximum applicable sales charge of 4.75% and a maximum deferred sales charge of 1.00% on investments at or above the $1 million breakpoint (where you do not pay a sales charge) on shares redeemed within 18 months of purchase. Total returns are calculated using the net asset value (“NAV”) on March 31, 2023. The returns shown do not reflect the deduction of taxes that a shareholder would pay on Fund distributions or on the redemptions of Fund shares. Past performance is no guarantee of future results. Performance figures for periods greater than 1 year are annualized. The Fund’s manager has contractually agreed to reduce its fees and/or absorb expenses of the Fund, at least until July 31, 2023, to ensure that the net annual fund operating expenses (excluding brokerage costs; borrowing costs, such as (a) interest and (b) dividends on securities sold short; taxes; costs of investing in underlying funds and extraordinary expenses) will not exceed 1.74%, 2.49% and 1.49% for the Fund’s Class A, Class C, and Class I shares, respectively, subject to possible recoupment from the Fund in future years. Fee waivers and expense reimbursements are subject to possible recoupment by the manager from the Fund in future years on a rolling three-year basis (within three years after the fees have been waived or reimbursed) if such recoupment can be achieved within the foregoing expense limits and any expense limits in place at the time of recoupment. Without these waivers, the Fund’s total annual operating expenses as shown in the August 1, 2022 prospectus were 1.94%, 2.70% and 1.69% for the Fund’s Class A, Class C, and Class I shares, respectively. After fee waivers, the Fund’s total annual operating expenses as shown in the August 1, 2022 prospectus were 1.75%, 2.50% and 1.50% for the Fund’s Class A, Class C, and Class I shares, respectively. Please review the Fund’s most recent prospectus for more detail on the expense waiver. For more current information on the Fund’s expense ratio, please see the Financial Highlights. For performance information current to the most recent month-end, please call toll-free 1-844-223-8637. |
| ** | The Bloomberg U.S. Aggregate Bond Index is commonly used as a benchmark by both passive and active investors to measure portfolio performance relative to the U.S. dollar-denominated investment grade fixed-rate taxable bond market. It is also an informational measure of broad market returns commonly applied to fixed income instruments. Investors cannot invest directly in an index. |
| + | The AlphaCentric Income Opportunities Fund commenced operations on May 28, 2015. |
Comparison of the Change in value of a $10,000 investment
| Holdings by Security Type | % of Net Assets | |||
| Non-Agency Residential Mortgage Backed Securities | 106.4 | % | ||
| Liabilities In Excess Of Other Assets | (6.4 | )% | ||
| 100.0 | % | |||
Please refer to the Schedule of Investments in this Annual Report for a detailed listing of the Fund’s holdings.
3
March 31, 2023
Dear AlphaCentric Premium Opportunity Fund (“the Fund”) Investor:
We are pleased to provide our Annual Letter to Shareholders. Thank you for your support and for being an investor in the Fund.
Investment Strategy
The portfolio strategy utilized by the Fund seeks to achieve capital appreciation with lower overall volatility than the equity market. The strategy attempts to achieve its objective by investing in a systematically managed portfolio of long and short call and put options and futures on the Standard & Poor’s 500 Index (the “Index”) and/or other securities that represent the return of the Index (such as exchange traded funds), as well as investments tied to measures of market volatility such as volatility exchange traded funds and futures on the VIX Index, which reflect the market’s expected fluctuation (volatility).
In terms of positioning, the strategy generally aims to earn 40% to 60% of the stock market upside over a full market cycle but also employs options selling and other strategies to help reduce risk and mitigate the downside risk, aiming for 50% to 100% coverage during periods of severe market declines like March 2020.
In addition to option strategies such as call ratios, strangles and straddles, the strategy uses futures, options on futures, and a variety of derivative instruments in an attempt to achieve capital efficiency. Relying on the embedded leverage of these markets, the Fund aims to hold between 70% and 85% of assets in U.S. Treasury bills or similar investments.
Treasury bills act as a source of both safety and potential upside, aligning with the overall dual mandate of balancing offense and defense. The income they generate, especially in a higher rate environment, helps enhance risk-adjusted returns for investors.
Fund Performance
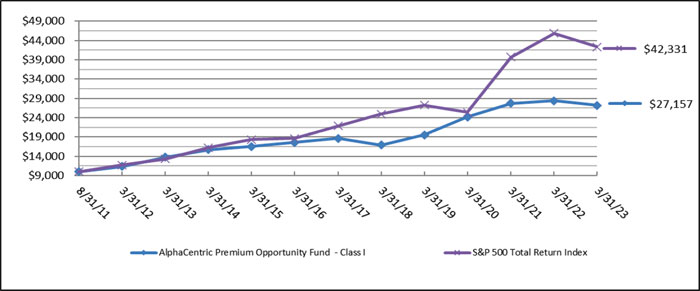
For the fiscal year ended March 31, 2023, the Fund returned -4.32% (Class I shares). This compares to a -7.73% return for the S&P 500 Index.
While the Fund’s strategy can and will be able to post positive returns in certain down-market environments thanks to its long VIX components, the 2022 market selloff occurred with the decline of the VIX, starting around 20, then averaging just 23 for the period before finishing below where it started, falling to 18.70. In comparison, March 2020 saw the VIX move from around 15 up to 75.
Additionally, volatility seemed to have a stubborn floor throughout the period, averaging 23 instead of falling back into the teens as was the pattern for much of the 2010 to 2020 period. This ceiling/floor phenomenon essentially put a cap on the opportunity available to the type of option trades the Fund employs. This kept the model alternating between its falling market/falling volatility quadrant and falling
4
market/rising volatility quadrant, which created a bit of drag as positions were adjusted and pivoted to the new quadrant, then back to the previous quadrant, then back to the other, and so on.
That sort of movement is not unexpected, but it is rarer to see than the typical pattern of markets finishing a falling market/rising volatility regime with a rising market/falling volatility regime. This was finally seen in January of 2023 and the Fund was quick to pivot and participate in the upside as it came into Q1 of 2023.
Market Outlook
Looking ahead, the market appears at an important turning point with many uncertainties remaining around risks such as recession, interest rates, inflation, and geopolitical issues.
Will the economy enter a downturn, or will growth continue at a steady pace? The Federal Reserve may have raised rates for the last time this cycle. But how long will they stay there, and how will that impact risk assets, valuations, and economic growth? For the first time since the COVID-19 pandemic first hit, it really feels like there are reasonable arguments on both the bull and bear sides. The future could unfold as a tale of either steady growth and healthy markets or deceleration, tightening monetary policy, and falling asset prices. Staying positioned to benefit no matter how events actually play out is the approach we’ll follow. The Fund aims to do just that through a strategy designed to earn solid returns through participation in up markets while also defending capital when volatility rises. With decades of experience, a time-tested process, and close monitoring of risks, the goal is making the most of opportunities to generate attractive risk-adjusted performance no matter the environment.
Sincerely,
Russell Kellites
Portfolio Manager
This report is intended for the Fund’s shareholders. It may not be distributed to prospective investors unless it is preceded or accompanied by the current Fund prospectus. To obtain a prospectus or other information about the Fund, please visit www.AlphaCentricFunds.com or call 844-ACFUNDS (844-223-8637). Please read the prospectus carefully before investing.
The Fund’s returns for the fiscal year ended 3/31/23 and for the period since inception through 3/31/23, as compared to the Benchmark Index, were as follows:
| Fiscal Year Ended 3/31/2023 | Since Inception* | |
| Class A | -4.53 | 6.12 |
| Class A with Sales Charge | -10.01 | 5.16 |
| Class C | -5.24 | 5.44 |
| S&P 500 TR Index (1) | -7.73 | 12.37 |
| Class I | -4.32 | 9.01 |
| S&P 500 TR Index (1) | -7.73 | 13.27 |
5
| * | Fund Inception: 9/1/2011 (Class I) & 9/30/2016 (Class A & C). The Performance shown before September 30, 2016, is for the Fund’s Predecessor Fund (Theta Funds, L.P.) The Fund’s management practices, investment goals, policies, objectives, guidelines and restrictions are, in all material respects, equivalent to the predecessor limited partnership. From its inception date, the predecessor limited partnership was not subject to certain investment restrictions, diversification requirements and other restrictions of the Investment Company Act of 1940, as amended, if they had been applicable, it might have adversely affected its performance. In addition, the predecessor limited partnership was not subject to sales loads that would have adversely affected performance. Performance of the predecessor fund is not an indicator of future results. |
| (1) | The S&P 500 Total Return Index by Standard & Poor’s Corp. is a capitalization-weighted index comprising 500 widely held common stocks listed on various exchanges, representing the performance of the stock market generally. Please note that indices do not take into account any fees and expenses of investing in the individual securities that they track, and individuals cannot invest directly in any index, although individuals may invest in exchange traded funds or other investment vehicles that attempt to track the performance of an index. The Fund may or may not purchase the types of securities represented by the S&P 500 Total Return Index. Investors cannot invest directly in an index. |
The Fund’s maximum sales charge for Class “A” shares is 5.75%. Dividends are not assured. Investments in mutual funds involve risks. Performance is historic and does not guarantee future results. Investment return and principal value will fluctuate with changing market conditions so that when redeemed, shares may be worth more or less than their original cost. Current performance may be lower or higher than the performance data quoted. To obtain the most recent month end performance information or the Fund’s prospectus please call the Fund, toll free at 844-ACFUNDS (844-223-8637). You can also obtain a prospectus at www.AlphaCentricFunds.com. 5447-NLD-05102023
6
AlphaCentric Premium Opportunity Fund
PORTFOLIO REVIEW (Unaudited)
March 31, 2023
The Fund’s performance figures* for the periods ended March 31, 2023, compared to its benchmark:
| Annualized | Annualized | |||||
| Annualized | Annualized | Annualized | Since Inception + - | Since Inception ++ - | ||
| One Year | Three Years | Five Years | Ten Years | March 31, 2023 | March 31, 2023 | |
| Class A (HMXAX) without load | (4.53)% | 3.67% | 9.66% | — | 6.12% | — |
| Class A (HMXAX) with 5.75% load | (10.01)% | 1.65% | 8.37% | — | 5.16% | — |
| Class C (HMXCX) | (5.24)% | 2.89% | 8.95% | — | 5.44% | — |
| Class I (HMXIX) +++ | (4.32)% | 3.92% | 9.92% | 7.06% | — | 9.01% |
| S&P 500 Total Return Index ** | (7.73)% | 18.60% | 11.19% | 12.24% | 12.37% | 13.27% |
| * | The performance data quoted here represents past performance. Current performance may be lower or higher than the performance data quoted above. Investment return and principal value will fluctuate, so that shares, when redeemed, may be worth more or less than their original cost. Class A is subject to a maximum applicable sales charge of 5.75% and a maximum deferred sales charge of 1.00% on investments at or above the $1 million breakpoint (where you do not pay a sales charge) on shares redeemed within 18 months of purchase. Total returns are calculated using the net asset value (“NAV”) on March 31, 2023. The returns shown do not reflect the deduction of taxes that a shareholder would pay on Fund distributions or on the redemptions of Fund shares. Past performance is no guarantee of future results. Performance figures for periods greater than 1 year are annualized. The Fund’s manager has contractually agreed to reduce its fees and/or absorb expenses of the Fund, at least until July 31, 2023, to ensure that the net annual fund operating expenses (excluding brokerage costs; borrowing costs, such as (a) interest and (b) dividends on securities sold short; taxes; costs of investing in underlying funds and extraordinary expenses) will not exceed 2.24%, 2.99% and 1.99% for the Fund’s Class A, Class C and Class I shares, respectively, subject to possible recoupment from the Fund in future years. Fee waivers and expense reimbursements are subject to possible recoupment by the manager from the Fund in future years on a rolling three-year basis (within three years after the fees have been waived or reimbursed) if such recoupment can be achieved within the foregoing expense limits and any expense limits in place at the time of recoupment. Without these waivers, the Fund’s total annual operating expenses as shown in the August 1, 2022 prospectus were 2.44%, 3.19% and 2.20% for the Fund’s Class A, Class C and Class I shares, respectively. After fee waivers, the Fund’s total annual operating expenses as shown in the August 1, 2022 prospectus were 2.43%, 3.18%, and 2.18% for the Fund’s Class A, Class C and Class I shares, respectively. Please review the Fund’s most recent prospectus for more detail on the expense waiver. For more current information on the Fund’s expense ratio, please see the Financial Highlights. For performance information current to the most recent month-end, please call toll-free 1-844-223-8637. |
| ** | The S&P 500 Total Return Index, a registered trademark of McGraw-Hill Co., Inc., is a market capitalization-weighted index of 500 widely held common stocks. Investors cannot invest directly in an index. |
| + | The AlphaCentric Premium Opportunity Fund Class A and Class C commenced operations on September 30, 2016. |
| ++ | The AlphaCentric Premium Opportunity Fund Class I, formerly a private fund, commenced operations on August 31, 2011. |
| +++ | The Fund acquired all of the assets and liabilities of Theta Funds, L.P. (the “Predecessor Fund”) in a tax-free reorganization on September 30, 2016. In connection with this acquisition, shares of the Predecessor Fund were exchanged for Class I shares of the Fund, so the Predecessor Fund became the Class I shares of the Fund. The Fund’s investment objective, policies and guidelines are, in all material respects, equivalent to the Predecessor Fund’s investment objectives, policies and guidelines. The Predecessor Fund commenced operations on August 31, 2011. Updated performance information will be available at no cost by calling 1-844-ACFUNDS (844-223-8637) or visiting the Fund’s website at www.AlphaCentricFunds.com. |
Comparison of the Change in value of a $10,000 investment
| Holdings by Security Type ** | % of Net Assets | |||
| U.S. Government & Agencies | 44.0 | % | ||
| Short-Term Investments | 27.6 | % | ||
| Future Options Purchased | 1.1 | % | ||
| Index Options Purchased | 0.0 | %* | ||
| Written Future Options | (1.0 | )% | ||
| Other Assets in Excess of Liabilities | 28.3 | % | ||
| 100.0 | % | |||
* - Less than 0.05%
** - Does not include derivative investments.
Please refer to the Schedule of Investments in this Annual Report for a detailed listing of the Fund’s holdings.
7
March 31, 2023
Dear AlphaCentric Robotics and Automation Fund (the “Fund”) Investor:
The highest inflation rates in four decades led to the fastest monetary policy tightening cycle in U.S. history. That in turn drove a 27% peak-to-trough decline in the S&P 500 during 2022. The major averages posted interim lows in mid-October and have since recovered approximately 50% of the aforementioned drop. Headline inflation data has receded sharply from the peak levels recorded last summer, but core inflation remains sticky, with the latest core Personal Consumption Expenditures report holding at 4.6% for the month ended February 2023. This remains well above the Federal Reserve’s 2.0% target rate, suggesting that the central bank may be inclined to raise rates further and potentially hold them there for a prolonged period. Complicating the situation is the fact that the held-to-maturity assets on many bank balance sheets have been substantially impaired by the rise in interest rates. This condition has already resulted in the failure of three regional banks in the U.S. – most notably Silicon Valley Bank. An impending credit crunch is expected as lending standards tighten in response to less liquid conditions, thus raising the odds of a recession later this year.
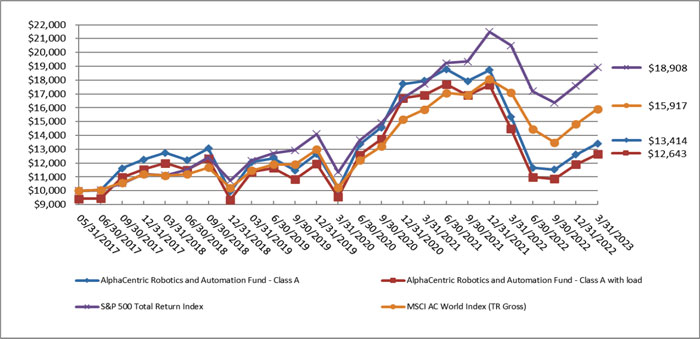
March 31, 2023 marked the end of the fiscal year of the Fund. Since the end of the last fiscal year, the Fund posted a -12.46% (Class I shares) decline. The S&P 500 TR Index during the same period reported a loss of -7.73%. The macro environment described above has put excessive pressure on the valuations of emerging growth and disruptive technology companies despite sound underlying fundamentals and robust execution. Due to this fact, the Fund experienced a relative performance deficit over the year ended March 31, 2023 versus the benchmark index.
Notably, despite the continuing conflict in Ukraine, energy prices and supply chains have normalized. As such, capex spending priorities have resumed their focus on robotics and automation solutions. It is our view that the mandate to improve operational efficiencies will remain front and center as companies large and small adapt to the new realities of a post-COVID world. Indeed, the Fund’s strategy of focusing on leading edge technologies and the core end-market beneficiaries of the automation theme has already begun to recover in the form of M&A. Two of the Fund’s former core portfolio holdings were acquired in 2022 – Kuka AG and Cyberoptics Corp – at substantial premiums to our cost basis. Both buyers were industrial manufacturers who saw significant value in the underlying businesses of these two technology innovators.
The Fund’s top performing position during the fiscal year was another German company by the name of Krones AG. The company posted a 43.1% gain for the year ended March 31, 2023. Krones is a packaging and bottling machine manufacturer. They are perhaps best known for their cutting-edge packing and filling process technologies used in the beer, soft drink, and spirits industries. But they have also become dominant in the juice, water, milk, and plant-based drinks arenas as well. Their solutions extend to include blow molding, filling and capping, tempering, labelling, palletizing, inspecting, cleaning, and conveying.
Allied Motion Technologies was the second largest contributor to the Fund’s results last year. The stock gained 29.9% during the period. The company is a leader in precision and specialty motion control
8
components and systems used in robotics and automation applications for a variety of end markets including industrial, medical, aerospace and defense, and autonomous vehicle technologies.
And lest we forget, the 20% gain from one of the Fund’s largest holdings – Infineon Technologies AG, was the Fund’s third largest driver of performance. The company, a spinoff from Siemens AG in 1999, has since become the largest semiconductor manufacturer in Germany. Their products make robotics possible. They are the world leader in high reliability motor control integrated circuits across all subcategories, microcontrollers, and ASICs serving the automotive, consumer, and industrial machinery end markets.
While these are just a few positions that were important to the Fund’s fiscal year results, they are representative of the broad array of companies and technologies that populate our portfolio. From smart warehouses, automated manufacturing, and robotic process automation to tele-medicine and surgical robotics, to autonomous vehicles, artificial intelligence and machine learning technologies, the Fund remains laser-focused on identifying and capitalizing upon advances and innovative technologies that are changing the world by investing in the companies that are driving this change.
Thank you for your support and participation in the Fund.
Sincerely,
Brian Gahsman, Portfolio Manager
This report is intended for the Fund’s shareholders. It may not be distributed to prospective investors unless it is preceded or accompanied by the current Fund prospectus. To obtain a prospectus or other information about the Fund, please visit www.AlphaCentricFunds.com or call 844-ACFUNDS (844-223-8637). Please read the prospectus carefully before investing.
The Fund’s returns for the fiscal year ended 3/31/23 and for the period since inception through 3/31/23, as compared to the Benchmark Index, were as follows:
| Fiscal Year Ended | ||
| 3/31/2023 | Since Inception 5/31/17 | |
| Class I | -12.46 | 5.43 |
| Class A | -12.64 | 5.16 |
| Class A w/Sales Charge | -17.64 | 4.10 |
| Class C | -13.28 | 4.39 |
| S&P 500 Total Return Index(1) | -7.73 | 11.54 |
| MSCI AC World Index TR Gross(2) | -6.96 | 8.29 |
| (1) | The S&P 500 Total Return Index, a registered trademark of McGraw-Hill Co., Inc., is a market capitalization-weighted index of 500 widely held common stocks. Investors cannot invest directly in an index. |
9
| (2) | The MSCI AC World Index TR Gross represents the Modern Index Strategy and captures all sources of equity returns in 23 developed and 24 emerging markets. Investors cannot invest directly in an index. |
The Fund’s maximum sales charge for Class “A” shares is 5.75%. Performance is historic and does not guarantee future results. Investment return and principal value will fluctuate with changing market conditions so that when redeemed, shares may be worth more or less than their original cost. Current performance may be lower or higher than the performance data quoted. To obtain the most recent month end performance information or the Fund’s prospectus please call the Fund, toll free at 844-ACFUNDS (844-223-8637). You can also obtain a prospectus at www.AlphaCentricFunds.com. 6220-NLD-05052023
10
AlphaCentric Robotics and Automation Fund
PORTFOLIO REVIEW (Unaudited)
March 31, 2023
The Fund’s performance figures* for the periods ended March 31, 2023, compared to its benchmarks:
| Annualized | ||||
| Annualized | Annualized | Since Inception + - | ||
| One Year | Three Years | Five Years | March 31, 2023 | |
| Class A (GNXAX) without load | (12.64)% | 9.80% | 1.05% | 5.16% |
| Class A (GNXAX) with 5.75% load | (17.64)% | 7.64% | (0.14)% | 4.10% |
| Class C (GNXCX) | (13.28)% | 8.97% | 0.29% | 4.39% |
| Class I (GNXIX) | (12.46)% | 10.04% | 1.28% | 5.43% |
| S&P 500 Total Return Index ** | (7.73)% | 18.60% | 11.19% | 11.54% |
| MSCI AC World Index (TR Gross) *** | (6.96)% | 15.90% | 7.46% | 8.29% |
| * | The performance data quoted here represents past performance. Current performance may be lower or higher than the performance data quoted above. Investment return and principal value will fluctuate, so that shares, when redeemed, may be worth more or less than their original cost. Class A is subject to a maximum applicable sales charge of 5.75% and a maximum deferred sales charge of 1.00% on investments at or above the $1 million breakpoint (where you do not pay a sales charge) on shares redeemed within 18 months of purchase. Total returns are calculated using the net asset value (“NAV”) on March 31, 2023. The returns shown do not reflect the deduction of taxes that a shareholder would pay on Fund distributions or on the redemptions of Fund shares. Past performance is no guarantee of future results. Performance figures for periods greater than 1 year are annualized. The Fund’s manager has contractually agreed to reduce its fees and/or absorb expenses of the Fund, at least until July 31, 2023, to ensure that the net annual fund operating expenses (excluding brokerage costs; borrowing costs, such as (a) interest and (b) dividends on securities sold short; taxes; costs of investing in underlying funds and extraordinary expenses) will not exceed 1.65%, 2.40% and 1.40% for the Fund’s Class A, Class C, and Class I shares, respectively, subject to possible recoupment from the Fund in future years. Fee waivers and expense reimbursements are subject to possible recoupment by the manager from the Fund in future years on a rolling three-year basis (within three years after the fees have been waived or reimbursed) if such recoupment can be achieved within the foregoing expense limits and any expense limits in place at the time of recoupment. Without these waivers, the Fund’s total annual operating expenses as shown in the August 1, 2022 prospectus for the Fund’s period of operation are 2.03%, 2.79% and 1.79% for the Fund’s Class A, Class C and Class I shares, respectively. After fee waivers, the Fund’s total annual operating expenses shown in the August 1, 2022 prospectus for the Fund’s period of operation are 1.66%, 2.41% and 1.41% for the Fund’s Class A, Class C and Class I shares, respectively. Please review the Fund’s most recent prospectus for more detail on the expense waiver. For more current information on the Fund’s expense ratio, please see the Financial Highlights. For performance information current to the most recent month-end, please call toll-free 1-844-223-8637. |
| ** | The S&P 500 Total Return Index, a registered trademark of McGraw-Hill Co., Inc., is a market capitalization-weighted index of 500 widely held common stocks. Investors cannot invest directly in an index. |
| *** | The MSCI AC World Index (TR Gross) represents the Modern Index Strategy and captures all sources of equity returns in 23 developed and 24 emerging markets. Investors cannot invest directly in an index. |
| + | The AlphaCentric Robotics and Automation Fund Class A, Class C and Class I commenced operations on May 31, 2017. |
Comparison of the Change in value of a $10,000 investment
| Holdings by Security Type | % of Net Assets | |||
| Common Stocks | 97.4 | % | ||
| Investment Purchased as Securities Lending Collateral | 28.0 | % | ||
| Money Market Fund | 2.4 | % | ||
| Liabilities In Excess Of Other Assets | (27.8 | )% | ||
| 100.0 | % | |||
Please refer to the Schedule of Investments in this Annual Report for a detailed listing of the Fund’s holdings.
11
March 31, 2023
Dear AlphaCentric Symmetry Strategy Fund (“the Fund”) Investor:
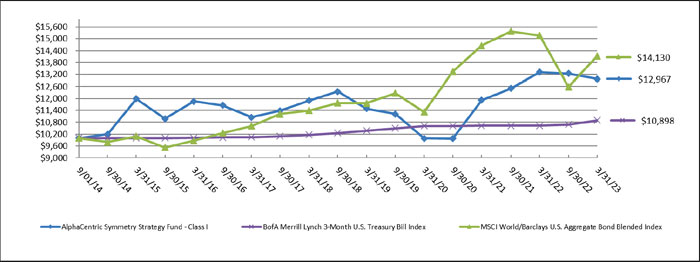
The Fund was down -2.65% (Class I shares) for fiscal year 2023, outperforming the blended MSCI World/U.S. Aggregate Bond Blended Index which returned -6.80%. The traditional portfolio, that invests in stocks and credit detracted from performance as both equity and bond markets fell over the period, with the S&P 500 falling -7.75% over the period and the Bloomberg Aggregate falling -4.78%. The alternative portfolio which invests in commodities, fixed income and currencies, added to performance over the period, with short positions in fixed income futures and long positions in the USD helping to offset equity losses as the Fund’s trend following strategies captured the move to higher global yields. Adaptability is important.
Those hoping for a quiet start to the new year after the rollercoaster that was 2022 were disappointed in the first quarter of 2023. Our favorite of the once-in-a-black-swan statistics: in the past 25 years the US 2-Year yield had moved 25bps or more 17 times; in March 2023 it happened 6 times in a row. Strong US inflation and payroll data for January caused US yields to rapidly move to the highest levels in 15 years, increasing the 2-Year yield almost 100bps from 4.20% at the end of February to 5.07% in early March. After a bank failure over a weekend, it reversed 110bps lower in just 3 sessions.
The Federal Reserve has found itself in a difficult position. Inflation has been stubbornly high as it is officially reported while the channel through which they expect tighter policy to work – the labor market – remains strong. At the same time, the most interest rate sensitive sectors of the economy have slowed, in some places meaningfully so. Housing prices and rents are clearly dropping. This is not in the official CPI data yet but will show up in due course, easing the inflation trajectory. Commercial real estate is showing signs of stress as well, partly due to post-pandemic working habits and partly due to financing cost increases. Some additional areas of the banking system are also stressed, which have implications for credit standards, loan growth and loan availability in the coming quarters.
Moving on to less-volatile things than the 2-Year bond – commodity markets. Not quite, but it sure feels that way. Our alternative strategies fit so well with traditional equity exposures as they generally thrive on volatility in markets. Traditional markets abhor volatility. What drives volatility in commodity markets? Deficit markets moving to surplus and surplus markets moving to deficits. Balanced markets are no fun for anyone. We sometimes hear the refrain that futures markets are price predictions of where things will trade. This is not right; they are arbitrage-free prices. Commodity markets can move further and more quickly than stock and bond markets as they must live in the here and now, unable to do too much discounting of what may happen in the out years. Take copper for example, the current price may be stable as we aren’t currently in the thick of a supply demand crunch, but that crunch is certainly building. Green revolutions will need a lot of copper. There are many markets with the potential for large moves as growth recovers, leading to higher demand than available supply – grains and energy markets may also come to fit this bill. But, if the slowdown in the economy continues, the strategy will move into short positions in due course as commodity demand falls away. Again, adaptability is important.
12
The traditional side of the portfolio spent much of 2022 with reduced risk exposures, having reduced meaningfully in late 2021 and ending the fiscal year about 50% net long. The strategy spent the majority of the fiscal year ended 2023 short global bonds and long the USD, both of which helped as rising yields driven by improving economies and inflation fears pushed all yields higher. Commodity exposures were more mixed, as the immediate price spike environment caused by the Ukraine war at the start of the Fund’s fiscal year subsided as the world evolved to manage as best it could through the supply disruptions. By way of example, energy markets stabilized in part due to releases from the Strategi Petroleum Reserve, and natural gas markets calmed as Europe in particular was fortunate to experience a fairly mild winter season.
Should equity and credit markets continue to stabilize and rebound after the battering of 2022, we believe the Fund is positioned to benefit. The Fund’s equity positions are cheap to a variety of fundamentals we analyze and look to have long runways ahead. During the first quarter of 2023, we saw some deal flow in a few names the Fund holds as other strategic buyers see the same thing, particularly in the energy space. We look for that to continue.
Thank you for your support, and we hope that you stay healthy and safe in 2023.
Sincerely,
Mount Lucas Management LP Team
This report is intended for the Fund’s shareholders. It may not be distributed to prospective investors unless it is preceded or accompanied by the current Fund prospectus. To obtain a prospectus or other information about the Fund, please visit www.AlphaCentricFunds.com or call 844-ACFUNDS (844-223-8637). Please read the prospectus carefully before investing.
The Fund’s returns for the fiscal year ended 3/31/23 and for the period since inception through 3/31/23, as compared to the Benchmark Index, were as follows:
| Fiscal Year | ||
| Ended | ||
| 3/31/2023 | Since Inception* | |
| Class A | -2.86 | 3.67 |
| Class A w/ Sales Charge | -8.46 | 2.00 |
| Class C | -3.53 | 2.88 |
| BofA Merrill Lynch 3-Month U.S. Treasury Bill Index (1) | 2.53 | 1.11 |
| MSCI World/Bloomberg U.S. Aggregate Bond Blended Index (2) | -6.80 | 4.26 |
| Class I | -2.65 | 3.08 |
| BofA Merrill Lynch 3-Month U.S. Treasury Bill Index (1) | 2.53 | 1.01 |
| MSCI World/Bloomberg U.S. Aggregate Bond Blended Index (2) | -6.80 | 4.11 |
| * | Inception (annualized): 9/1/14 (I Share) | 8/9/19 (A & C Shares) |
13
The Fund acquired all of the assets and liabilities of MLM Symmetry Fund, LP (the “Predecessor Fund”) in a tax-free reorganization on August 9, 2019. In connection with this acquisition, shares of the Predecessor Fund were exchanged for Class I shares of the Fund. The Fund’s investment objectives, policies, restrictions, and guidelines are, in all material respects, equivalent to the Predecessor Fund’s investment objectives, policies, restrictions, and guidelines. The Fund’s sub-advisor was the adviser to the Predecessor Fund.
| (1) | BofA Merrill Lynch 3-Month U.S. Treasury Bill Index is an unmanaged market index of U.S. Treasury securities maturing in 90 days that assumes reinvestment of all income. Investors cannot invest directly in an index. |
| (2) | MSCI World Index is a broad global equity index that represents large and mid-cap equity performance across all 23 developed markets countries. It covers approximately 85% of the free float-adjusted market capitalization in each country. The Bloomberg U.S. Aggregate Bond index is a broad-based benchmark that measures the investment grade, U.S. dollar-denominated, fixed-rate taxable bond market, including Treasuries, government-related and corporate securities, MBS (agency fixed-rate and hybrid ARM pass-throughs), ABS, and CMBS. Investors cannot invest directly in an index. |
The Fund’s maximum sales charge for Class “A” shares is 5.75%. Dividends are not assured. Investments in mutual funds involve risks. Performance is historic and does not guarantee future results. Investment return and principal value will fluctuate with changing market conditions so that when redeemed, shares may be worth more or less than their original cost. Current performance may be lower or higher than the performance data quoted. To obtain the most recent month end performance information or the Fund’s prospectus please call the Fund, toll free at 844-ACFUNDS (844-223-8637). You can also obtain a prospectus at www.AlphaCentricFunds.com. 5446-NLD-05102023
14
AlphaCentric Symmetry Strategy Fund
PORTFOLIO REVIEW (Unaudited)
March 31, 2023
The Fund’s performance figures* for the periods ended March 31, 2023, compared to its benchmarks:
| Annualized | Annualized | ||||
| Annualized | Annualized | Since Inception + - | Since Inception ++ - | ||
| One Year | Three Years | Five Years | March 31, 2023 | March 31, 2023 | |
| Class A (SYMAX) without load | (2.86)% | 8.88% | — | 3.67% | — |
| Class A (SYMAX) with 5.75% load | (8.46)% | 6.77% | — | 2.00% | — |
| Class C (SYMCX) | (3.53)% | 8.01% | — | 2.88% | — |
| Class I (SYMIX) +++ | (2.65)% | 9.10% | 1.73% | — | 3.08% |
| BofA Merrill Lynch 3-Month U.S. Treasury Bill Index ** | 2.53% | 0.90% | 1.41% | 1.11% | 1.01% |
| MSCI World/Bloomberg U.S. Aggregate Bond Blended Index *** | (6.80)% | 7.64% | 4.40% | 4.26% | 4.11% |
| * | The performance data quoted here represents past performance. Current performance may be lower or higher than the performance data quoted above. Investment return and principal value will fluctuate, so that shares, when redeemed, may be worth more or less than their original cost. Class A is subject to a maximum applicable sales charge of 5.75% and a maximum deferred sales charge of 1.00% on investments at or above the $1 million breakpoint (where you do not pay a sales charge) on shares redeemed within 18 months of purchase. Total returns are calculated using the net asset value (“NAV”) on March 31, 2023. The returns shown do not reflect the deduction of taxes that a shareholder would pay on Fund distributions or on the redemptions of Fund shares. Past performance is no guarantee of future results. Performance figures for periods greater than 1 year are annualized. The Fund’s manager has contractually agreed to reduce its fees and/or absorb expenses of the Fund, at least until July 31, 2023, to ensure that the net annual fund operating expenses (excluding brokerage costs; borrowing costs, such as (a) interest and (b) dividends on securities sold short; taxes; costs of investing in underlying funds and extraordinary expenses) will not exceed 1.85%, 2.60% and 1.60% for the Fund’s Class A, Class C, and Class I shares, respectively, subject to possible recoupment from the Fund in future years. Fee waivers and expense reimbursements are subject to possible recoupment by the manager from the Fund in future years on a rolling three-year basis (within three years after the fees have been waived or reimbursed) if such recoupment can be achieved within the foregoing expense limits and any expense limits in place at the time of recoupment. Without these waivers, the Fund’s total annual operating expenses as shown in the August 1, 2022 prospectus are 2.49%, 3.23% and 2.23% for the Fund’s Class A, Class C and Class I shares, respectively. After fee waivers, the Fund’s total annual operating expenses shown in the August 1, 2022 prospectus are 1.98%, 2.73% and 1.73% for the Fund’s Class A, Class C and Class I shares, respectively. Please review the Fund’s most recent prospectus for more detail on the expense waiver. For more current information on the Fund’s expense ratio, please see the Financial Highlights. For performance information current to the most recent month-end, please call toll-free 1-844-223-8637. |
| ** | BofA Merrill Lynch 3-Month U.S. Treasury Bill Index tracks the performance of the U.S. dollar denominated U.S. Treasury Bills publicly issued in the U.S. domestic market with a remaining term to final maturity of less than 3 months. Investors cannot invest directly in an index. |
| *** | MSCI World/Bloomberg U.S. Aggregate Bond Blended Index reflects an unmanaged portfolio of 60% of the MSCI World Index and 40% of the Bloomberg U.S. Aggregate Bond Index. Investors cannot invest directly in an index. |
| + | The AlphaCentric Symmetry Strategy Fund Class A, Class C commenced operations on August 8, 2019. |
| ++ | The AlphaCentric Symmetry Strategy Fund Class I, formerly a private fund, commenced operations on September 1, 2014. |
| +++ | The Fund acquired all of the assets and liabilities of MLM Symmetry Fund, LP (the “Predecessor Fund”) in a tax-free reorganization on August 9, 2019. In connection with this acquisition, shares of the Predecessor Fund were exchanged for Class I shares of the Fund. The Fund’s investment objectives, policies, restrictions, and guidelines are, in all material respects, equivalent to the Predecessor Fund’s investment objectives, policies, restrictions, and guidelines. The Fund’s sub-advisor was the adviser to the Predecessor Fund. The financial statements for the Predecessor Fund can be found in the Fund’s SAI. The performance information set forth below reflects the historical performance of the Predecessor Fund shares. Updated performance information will be available at no cost by calling 1-844-ACFUNDS (844-223-8637) or visiting the Fund’s website at www.AlphaCentricFunds.com |
Comparison of the Change in value of a $10,000 investment
| Holdings by Security Type * | % of Net Assets | |||
| Exchange-Traded Funds | 35.5 | % | ||
| Common Stocks | 29.6 | % | ||
| U.S. Government & Agencies | 16.6 | % | ||
| Short-term Investment | 11.1 | % | ||
| Other Assets in Excess of Liabilities | 7.2 | % | ||
| 100.0 | % | |||
* Does not include derivative investments.
Please refer to the Schedule of Investments in this Annual Report for a detailed listing of the Fund’s holdings.
15
March 31, 2023
Dear AlphaCentric LifeSci Healthcare Fund (“the Fund”) Investor:
PERFORMANCE
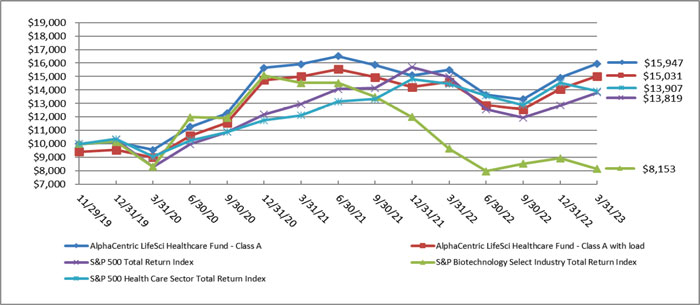
The Fund offered significant outperformance through the fiscal year ended March 31, 2023 with a return of +3.22% (Class I shares) that was driven by fundamental, thesis-driven stock picking. The S&P Biotechnology Select Index (“Index”) one-year return for the period ended March 31, 2023 was -15.60%. The Fund created alpha from holdings benefiting from M&A transactions, favorable earnings announcements, positive fundamental company-specific news and avoidance of negative clinical or regulatory developments. The Fund remains nimble and continues to seek asymmetric risk/reward opportunities for the portfolio that are poised to create value regardless of the trajectory of the broader economic environment.
MARKET OVERVIEW
The Index remains in the midst of the longest and deepest bear market in its history. The divergence from the S&P 500 seemingly widened in response to turmoil in the banking system following the collapse of Silicon Valley Bank (“SVB”) and negative headlines on coming price controls from the so-called Inflation Reduction Act. The US drug pricing outlook seems to compare favorably to the rest of the world though, as China reduced average prices for drugs by 56% during the most recent centralized procurement process. The Index entered 2023 following its two worst years on record and more than 50% off highs set in early 2021. Reset valuations set the stage for asymmetric upside in a subset of companies with differentiated profiles, while a growing number of companies are falling by the wayside as capital becomes scarce for marginal assets. Clearly, this environment strongly favors fundamental, thesis-driven stock selection.
The quarter ended March 31, 2023 got off on the right foot with announcement at the JP Morgan Healthcare conference of three >$1 billion bolt-on M&A transactions, seemingly indicating deal count will be trending higher in 2023. Shock and awe M&A followed later in the quarter with a pair of eyebrow-raising valuations. Pfizer (PFE) announced the acquisition of Seagen (SGEN) for ~$43 billion or $229 per share, a ~33% premium to the prior day’s closing price. The deal values SGEN at ~20x current revenue of ~$2.2 billion, but PFE projects the 2030 revenue contribution from SGEN’s assets will be >$10 billion. Notably, PFE’s projections are well ahead of 2030 Wall Street numbers of ~$8 billion and are perhaps the only way they could justify the lofty valuation of the deal. PFE does not expect the deal to be accretive until 2028, and some analysts project the deal may never be accretive. PFE’s willingness to pay a very high price for unprofitable SGEN signals the desperate need for large players to augment revenues and should benefit the valuations of other stand-alone commercial biotechs.
Loss of exclusivity (patent expiration) is a growing theme as Jefferies projects there will be $170 billion of branded product revenue lost by 2028, prompting urgency for M&A. To be sure, Merck (MRK), Bristol Myers (BMY) and Abbvie (ABBV) will all be losing their patent protection on top selling drug(s) Keytruda, Revlimid and Humira, respectively. Pending price controls from the Inflation Reduction Act will only
16
exacerbate the situation and further encourage M&A. Getting a drug over the goal line can be difficult, let alone proving differentiation from an often-crowded competitive landscape, potentially leading to significant premiums for the most differentiated assets.
Regulatory sentiment was also bolstered with several new watershed drug approvals. Bluebird bio’s (BLUE) Zynteglo made history as the first gene therapy approved for patients with beta-thalassemia. BLUE plans to launch the drug with a $2.8 million price tag, making it the most expensive therapy in the US. Regulators further surprised investors to the upside by approving Bristol Myers Squibb’s (BMY) oral TYK2 inhibitor deucravacitinib (Sotyktu) in psoriasis without an expected ‘black box’ warning. Amylyx Pharmaceuticals’ (AMLX) secured FDA approval for their controversial Amyotrophic Lateral Sclerosis (ALS) therapy following a favorable Advisory Committee meeting vote. FDA continues to show flexibility to allow new treatment options to come to market that serve small populations of patients with severe conditions and no other alternatives.
Culling of the biotech herd continued as Neoleukin Therapeutics (NLTX) announced the CEO was stepping down and a 70% reduction in force (RIF), a.k.a. layoffs. Likewise, RIF announcements were also made by Century Therapeutics (IPSC, 25% RIF), Editas Medicine (EDIT, 20% RIF), Elevation Oncology (ELEV, 30% RIF), TCR2 Therapeutics (TCRR, 40% RIF), Applied Molecular Transport (AMTI, 57% RIF), Cyteir Therapeutics (CYT, 70% RIF) and Y-Mabs Therapeutics (YMAB, 35% RIF). More extreme measures were taken at Calithera Biosciences (CALA) as the board approved the complete liquidation and dissolution of the company after concluding they were “unable to complete a transaction that would allow us to continue the development of our clinical programs and enhance shareholder value.” CALA has an accumulated deficit of ~$500 million, reminding investors of the downside risks inherent in drug discovery and development. Rubius Therapeutics (RUBY) was another former highflyer to announce a dissolution plan after unsuccessful attempts on alternatives. RUBY had been valued at >$2 billion during the sector’s peak in 1Q 2021. Mei Pharma (MEIP) and Infinity Pharmaceuticals (INFI) announced a merger to combine resources and extend the operating runway for the combined company. Codiak Biosciences (CDAK) also filed for Chapter 11 bankruptcy.
FUND OVERVIEW
The Fund materially benefited from biotech M&A in the quarter with exposure to two of the three deals announced at the JP Morgan Healthcare conference. Specifically, Chiesi Farmaceutici S.p.A. (certified B Corp) agreed to acquire portfolio holding Amryt Pharma Plc (AMYT) for $14.50 upfront cash or $1.25 billion representing a ~107% premium to the prior close, plus a $2.50 contingent value right (CVR) for up to an additional ~$225 million in payments based on pipeline progress. AstraZeneca PLC (AZN) agreed to buy portfolio holding CinCor Pharma (CINC) for $1.3 billion upfront or $26 per share representing a >100% premium to the prior close. The deal also included a $10 per share CVR for an additional $500 million, based on a regulatory submission for the lead asset, baxdrostat. CINC had been trading at a negative enterprise value (EV = market capitalization net of cash and debt) following mixed results in a mid-stage clinical trial last November. The Fund entered the position due to the asymmetric risk/reward potential. The upfront deal price was essentially the same value that CINC was trading at before the mixed data release, and well below the 2022 high of ~$43 per share.
The Fund also materially benefited from Amgen’s (AMGN) announcement it was purchasing Horizon Therapeutics (HZNP) for $116.50 per share or ~$28 billion. The acquisition represented a 48% premium to HZNP’s closing price before the announcement of a possible deal under Irish takeover law. Analysts
17
expect the deal to be accretive near term and bolster AMGN against loss of exclusivity risk in 2026 through the end of the decade. HZNP was one of the top holdings of the Fund going into the deal announcement. In addition, the Fund holding Sierra Oncology (SRRA) was acquired by Glaxosmithkline PLC (GSK) for $1.9 billion, a 39% premium to prior close and 63% to VWAP over 30 days. The transaction was focused on SRRA’s myelofibrosis drug momelotinib, which had positive pivotal data from the phase 3 MOMENTUM trial reported earlier in the year. SRRA raised $135 million immediately following the data announcement in January at $27, making the takeout price of $55 a 104% premium for the investors who participated in the offering. Analysts viewed the deal as a win/win as investors get to cash out at an estimated peak sales multiple of ~3x prior to approval/launch while GSK gets strategic synergy and potential accretion in 2024-2025. The Fund also filed in the past on holding Turning Point Therapeutics (TPTX) that was acquired by Bristol Myers Squibb (BMY) for $4 billion. The deal was a 122% premium to the prior close and showed the continued interest of big pharma for differentiated targeted oncology assets. TPTX was recently granted a breakthrough therapy designation by the FDA for lead drug candidate repotrectinib, a small molecule kinase inhibitor targeting the ROS1 and TRK oncogenic drivers of non-small cell lung cancer and advanced solid tumors.
The Fund continued to benefit from an overweight exposure to companies with robust revenue and cash flow growth profiles expected to be resilient in an economic downturn. Aurinia Pharmaceuticals (AUPH) reminded investors alpha is often found at the intersection of oversold conditions and good news. Shares rallied nearly 40% on news they entered into a settlement agreement with a patent challenger in January. AUPH stock was punished in 2022, falling >80% to near cash value as the patent overhang shook out weak hands and emboldened shorts. Shares ended the quarter up ~100%. Exelixis (EXEL) flexed its cash flow strength to announce a $550 million share repurchase program that will retire ~10% of outstanding shares in 2023. EXEL’s small molecule kinase inhibitor Cabometyx is expected to generate >$1.5 billion in revenue this year, providing the company the ability to return capital to shareholders as well as advance pipeline development programs. Activist investors are engaged with the company in an attempt to further enhance capital return to shareholders. A number of other commercial stage portfolio companies provided numbers ahead of consensus, including Lantheus Holdings (LNTH), Collegium Pharmaceuticals (COLL), Revance Therapeutics (RVNC), 2seventy bio (TSVT), and Embecta Corp (EMBC). Strong fundamentals will be critical to enable companies to successfully navigate through this period of increasing cost of capital and broad economic uncertainty.
Positive developments extended to big pharmas as well with GSK PLC (GSK) and Sanofi (SNY) posting strong numbers, with the latter benefiting from a ~10% currency tailwind. Further, GSK and SNY added an additional >$15 billion in combined market capitalization when the US District Court Judge in the Southern District of Florida for the multidistrict litigation (MDL) granted summary judgment for the pharma defendants, striking all plaintiffs’ evidence Zantac causes cancer. Analysts viewed this outcome as a best-case scenario since the MDL ruling is expected to clear a majority of the liability from the class action Zantac litigation. The Fund opportunistically increased exposure to both GSK and SNY during the prior quarter when they were being indiscriminately sold off due to fear of significant liability from the pending litigation.
Positive clinical and regulatory updates from Fund holdings also provided alpha generation. Specifically, the Fund benefited from the following positive program updates.
18
Acadia Pharmaceuticals (ACAD) announced the approval of the first drug for Rett Syndrome, DAYBUE (trofinetide). Rett is a rare genetic disease that severely impairs brain development and may be lethal, providing a basis for ACAD’s ~$400k estimated annual cost of therapy.
Viridian Therapeutics (VRDN) reached an all-time high on additional favorable updated data from their thyroid eye disease (TED) program.
Intra-cellular Therapies (ITCI) rallied on positive topline results from Study 403 evaluating lumateperone as monotherapy in the treatment of major depressive episodes in patients with mixed features. Peak revenue estimates for ITCI’s lead drug now exceed $2.5 billion.
Avoidance of negative clinical and regulatory events was also an important contributor to allowing the Fund to generate a positive return while the primary benchmark lost ground.
OUTLOOK
The Index continues to consolidate above the 2022 lows as green shoots push through the scorched earth. Full protection of SVB’s uninsured depositors enabled life sciences investors to focus on fundamental clinical/regulatory developments instead of potential capital impairment/recovery. Favorable regulatory developments continue to furnish a pathway to market for innovative therapies, even those with a measure of controversary. The therapeutics business model continues to perform independent of broader economic headwinds with a growing number of products beating financial projections. Reset valuations, cash flush pharma balance sheets and the strategic imperative for growth heighten expectations for M&A. For the rest of the sector, capital efficiency and a high bar for program advancement are coming back into vogue as the era of infinite money printing has come to an end. Creative destruction will continue to cull the herd of aspiring development stage SMID innovators, but the resulting group continues to offer an improving risk/reward profile. Although it’s not yet apparent at the Index level, good news is starting to pile up for a growing number of individual components. We continue to believe the setup for a fundamental, thesis-driven life sciences portfolio is as attractive as ever.
Sincerely,
Mark Charest, Ph.D.
Founding Partner and Portfolio Manager
LifeSci Fund Management
This report is intended for the Fund’s shareholders. It may not be distributed to prospective investors unless it is preceded or accompanied by the current Fund prospectus. To obtain a prospectus or other information about the Fund, please visit www.AlphaCentricFunds.com or call 844-ACFUNDS (844-223-8637). Please read the prospectus carefully before investing.
19
The Fund’s returns for the fiscal year ended 3/31/23 and for the period since inception through 3/31/23, as compared to the Benchmark Index, were as follows:
| Fiscal Year Ended | Since Inception | |
| 3/31/2023 | 11/29/2019 | |
| Class I | 3.22 | 15.25 |
| Class A | 3.00 | 15.01 |
| Class A w/ Sales Charge | -2.95 | 12.99 |
| Class C | 2.26 | 14.41 |
| S&P Biotechnology Select Industry Index (1) | -15.60 | -5.94 |
| (1) | The S&P Biotechnology Select Industry Index represents the biotechnology sub-industry portion of the S&P Total Markets Index (S&P TMI). The S&P TMI tracks all the U.S. common stocks listed on the NYSE, NYSE American, NASDAQ National Market and NASDAQ Small Cap exchanges. The S&P Biotechnology Select Industry Index is a modified equal weight index and typically consists of approximately 70 companies. Investors cannot invest directly in an index. |
The Fund’s maximum sales charge for Class “A” shares is 5.75%. Performance is historic and does not guarantee future results. Investment return and principal value will fluctuate with changing market conditions so that when redeemed, shares may be worth more or less than their original cost. Current performance may be lower or higher than the performance data quoted. To obtain the most recent month end performance information or the Fund’s prospectus please call the Fund, toll free at 1-844-ACFUNDS (844-223-8637). You can also obtain a prospectus at www.AlphaCentricFunds.com. 1553-NLD-04-28-2023
20
AlphaCentric LifeSci Healthcare Fund
PORTFOLIO REVIEW (Unaudited)
March 31, 2023
The Fund’s performance figures* for the periods ended March 31, 2023, compared to its benchmarks:
| Annualized | |||
| Annualized | Since Inception + - | ||
| One Year | Three Years | March 31, 2023 | |
| Class A (LYFAX) without load | 3.00% | 18.64% | 15.01% |
| Class A (LYFAX) with 5.75% load | (2.95)% | 16.33% | 12.99% |
| Class C (LYFCX) | 2.26% | 17.95% | 14.41% |
| Class I (LYFIX) | 3.22% | 18.91% | 15.25% |
| S&P 500 Total Return Index ** | (7.73)% | 18.60% | 10.18% |
| S&P Biotechnology Select Industry Total Return Index *** | (15.60)% | (0.58)% | (5.94)% |
| S&P 500 Health Care Sector Total Return Index **** | (3.70)% | 15.41% | 10.39% |
| * | The performance data quoted here represents past performance. Current performance may be lower or higher than the performance data quoted above. Investment return and principal value will fluctuate, so that shares, when redeemed, may be worth more or less than their original cost. Class A is subject to a maximum applicable sales charge of 5.75% and a maximum deferred sales charge of 1.00% on investments at or above the $1 million breakpoint (where you do not pay a sales charge) on shares redeemed within 18 months of purchase. Total returns are calculated using the net asset value (“NAV”) on March 31, 2023. The returns shown do not reflect the deduction of taxes that a shareholder would pay on Fund distributions or on the redemptions of Fund shares. Past performance is no guarantee of future results. Performance figures for periods greater than 1 year are annualized. The Fund’s manager has contractually agreed to reduce its fees and/or absorb expenses of the Fund, at least until July 31, 2023, to ensure that the net annual fund operating expenses (excluding brokerage costs; borrowing costs, such as (a) interest and (b) dividends on securities sold short; taxes; costs of investing in underlying funds and extraordinary expenses) will not exceed 1.65%, 2.40% and 1.40% for the Fund’s Class A, Class C, and Class I shares, respectively, subject to possible recoupment from the Fund in future years. Fee waivers and expense reimbursements are subject to possible recoupment by the manager from the Fund in future years on a rolling three-year basis (within three years after the fees have been waived or reimbursed) if such recoupment can be achieved within the foregoing expense limits and any expense limits in place at the time of recoupment. Without these waivers, the Fund’s total annual operating expenses as shown in the August 1, 2022 prospectus are 2.11%, 2.86% and 1.86% for the Fund’s Class A, Class C and Class I shares, respectively. After fee waivers, the Fund’s total annual operating expenses as shown in the August 1, 2022 prospectus are 1.66%, 2.41% and 1.41% for the Fund’s Class A, Class C and Class I shares, respectively. Please review the Fund’s most recent prospectus for more detail on the expense waiver. For more current information on the Fund’s expense ratio, please see the Financial Highlights. For performance information current to the most recent month-end, please call toll-free 1-844-223-8637. |
| ** | The S&P 500 Total Return Index, a registered trademark of McGraw-Hill Co., Inc., is a market capitalization-weighted index of 500 widely held common stocks. Investors cannot invest directly in an index. |
| *** | S&P Biotechnology Select Industry Total Return Index is designed to measure the performance of narrow GICS® sub-industries. The Index comprises stocks in the S&P Total Market Index that are classified in the GICS biotechnology sub-industry. Investors cannot invest directly in an index. |
| **** | S&P 500 Health Care Sector Total Return Index is designed to measure the performance of narrow GICS® health care sub-industries. The Index comprises stocks in the S&P Total Market Index that are classified in the GICS health care sub-industry. Investors cannot invest directly in an index. |
| + | The AlphaCentric LifeSci Healthcare Fund Class A, Class C and Class I commenced operations on November 29, 2019. |
Comparison of the Change in value of a $10,000 investment
| Holdings by Security Type | % of Net Assets | |||
| Common Stocks | 93.7 | % | ||
| Short-term Investments | 7.3 | % | ||
| Liabilities In Excess Of Other Assets | (1.0 | )% | ||
| 100.0 | % | |||
Please refer to the Schedule of Investments in this Annual Report for a detailed listing of the Fund’s holdings.
21
March 31, 2023
Dear AlphaCentric SWBC Municipal Opportunities Fund (the “Fund”) Investor:
The fiscal year ended 03/31/2023 was an extremely volatile 12-month period. The municipal market endured an extreme rise in interest rates and a historic outflow of investor cash. The first two quarters of the fiscal year proved to be an extremely difficult environment for fixed income securities as inflation increased more than almost anyone predicted, and the Federal Reserve continued its aggressive tightening campaign. The third quarter of the fiscal year saw a peak in long-term interest rates and the beginning of the downtrend in inflation indicators. The value in fixed income, which was created by the devastating prior two quarters, offered an entrance point for investors, and the market rallied significantly going into the fourth quarter of the fiscal year.
From March 31, 2022, to the lows on October 27, 2022, the various municipal indices were showing historically negative returns for the market. The Bloomberg Municipal Aggregate Index was -7.17%. The Bloomberg Long Term Municipal Index was -14.34% and the First Trust Municipal Closed End Fund Index was -18.69%. The Fund at this point was -14.83% (Class I shares). As sentiment began to change from October 27, 2022, to January 31, 2023, the Bloomberg Municipal Aggregate had an 8.11% return. The Bloomberg Long Term Municipal Index had a 12.97% return and the First Trust Municipal Closed End Fund Index returned 14.69%. The Fund had a 12.47% (Class I shares) return during this period.
The fourth quarter of the fiscal year started out with a bang as January showed the best first month municipal performance dating back to 1993. Due to sentiment change on how much more aggressive the Federal Reserve was going to be, February was decidedly negative with the worst performing February dating back to 2008. To top off the extreme volatility, the market suffered through a bank crisis in March, which caused a flight to safety trade, in which Treasury securities outperformed all other fixed income securities.
The fiscal year ended with the Bloomberg Municipal Aggregate Index at 0.26%; the Bloomberg Long Term Municipal Index at -3.64%; and the First Trust Municipal Closed End Fund Index at -9.60%. The Fund finished the fiscal year at -6.63% (Class I shares), with the overlay contributing approximately 2.80%. Since this is an income-oriented fund, the Fund paid an average annual dividend of approximately 3.90% which is a tax equivalent of 6.45%. This payout was in the top three of an internal peer group consisting of 39 of the largest and most well-known municipal bond funds.
Looking forward, management is optimistic for the overall fixed income market and specifically for the municipal bond market.
While the Federal Reserve may not be done hiking short-term interest rates yet, we believe they are close. The previous hikes in interest rates are starting to trickle into the economy and should speed up the process of moderating both inflation and employment going into the latter part of the year. We believe the combination of the Federal Reserve pausing its aggressive tightening and a moderating economy should cause interest rates to fall.
22
Municipal bonds should outperform their taxable counterparts as interest rates decline as some tax-free yields on the long end of the curve are higher than taxable interest rates. The municipal market should also benefit from strong fundamentals as the overall credit environment remains strong.
Additionally, new issuance is on track to come in much lower than projected with only $350 billion anticipated for 2023, while maturing bonds, bonds being called, and dividends are projected to equal approximately $525 billion for the year.
Thank you for your support.
Sincerely,
The SWBC Management Team
This report is intended for the Fund’s shareholders. It may not be distributed to prospective investors unless it is preceded or accompanied by the current Fund prospectus. To obtain a prospectus or other information about the Fund, please visit www.AlphaCentricFunds.com or call 844-ACFUNDS (844-223-8637). Please read the prospectus carefully before investing.
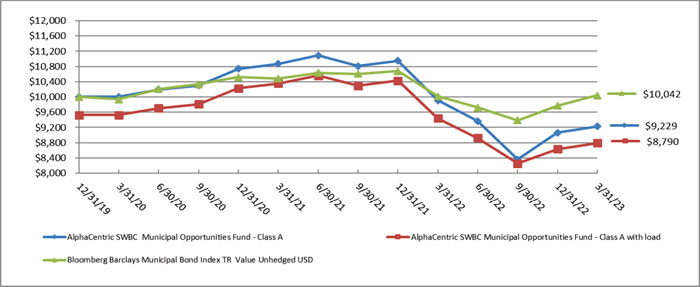
The Fund’s returns for the fiscal year ended 3/31/23 and for the period since inception through 3/31/23, as compared to the Benchmark Index, were as follows:
| Fiscal Year Ended 3/31/2023 | Since Inception* | |
| Class A | -6.86 | -2.44 |
| Class A w/ Sales Charge | -11.31 | -3.89 |
| Class C | -7.51 | -2.87 |
| Class I | -6.63 | -2.21 |
| Bloomberg Municipal Bond Index Value Unhedged USD (1) | 0.26 | 0.13 |
| (1) | Bloomberg Municipal Bond Index TR Value Unhedged covers the USD-denominated long-term tax-exempt bond market. The index has four main sectors: state and local general obligation bonds, revenue bonds, insured bonds and prerefunded bonds. Investors cannot invest directly in an index. |
The Fund’s maximum sales charge for Class “A” shares is 4.75%. Performance is historic and does not guarantee future results. Investment return and principal value will fluctuate with changing market conditions so that when redeemed, shares may be worth more or less than their original cost. Current performance may be lower or higher than the performance data quoted. To obtain the most recent month end performance information please call the Fund, toll free at 1-844-ACFUNDS (844-223-8637). You can also obtain a prospectus at www.AlphaCentricFunds.com.
The First Trust Municipal Closed End Fund Index is a capitalization weighted index designed to provide a broad representation of the U.S. municipal closed-end fund universe. 6222-NLD-05082023
23
AlphaCentric SWBC Municipal Opportunities Fund
PORTFOLIO REVIEW (Unaudited)
March 31, 2023
The Fund’s performance figures* for the periods ended March 31, 2023, compared to its benchmark:
| Annualized | |||
| Annualized | Since Inception + - | ||
| One Year | Three Years | March 31, 2023 | |
| Class A (MUNAX) without load | (6.86)% | (2.64)% | (2.44)% |
| Class A (MUNAX) with 4.75% load | (11.31)% | (4.21)% | (3.89)% |
| Class C (MUNCX) | (7.51)% | (3.20)% | (2.87)% |
| Class I (MUNIX) | (6.63)% | (2.49)% | (2.21)% |
| Bloomberg Municipal Bond Index Total Return Value Unhedged USD** | 0.26% | 0.35% | 0.13% |
| * | The performance data quoted here represents past performance. Current performance may be lower or higher than the performance data quoted above. Investment return and principal value will fluctuate, so that shares, when redeemed, may be worth more or less than their original cost. Class A is subject to a maximum applicable sales charge of 4.75% and a maximum deferred sales charge of 1.00% on investments at or above the $1 million breakpoint (where you do not pay a sales charge) on shares redeemed within 18 months of purchase. Total returns are calculated using the net asset value (“NAV”) on March 31, 2023. The returns shown do not reflect the deduction of taxes that a shareholder would pay on Fund distributions or on the redemptions of Fund shares. Past performance is no guarantee of future results. Performance figures for periods greater than 1 year are annualized. The Fund’s manager has contractually agreed to reduce its fees and/or absorb expenses of the Fund, at least until July 31, 2023, to ensure that the net annual fund operating expenses (excluding brokerage costs; borrowing costs, such as (a) interest and (b) dividends on securities sold short; taxes; costs of investing in underlying funds and extraordinary expenses) will not exceed 1.50%, 2.25% and 1.25% for the Fund’s Class A, Class C, and Class I shares, respectively, subject to possible recoupment from the Fund in future years. Fee waivers and expense reimbursements are subject to possible recoupment by the manager from the Fund in future years on a rolling three-year basis (within three years after the fees have been waived or reimbursed) if such recoupment can be achieved within the foregoing expense limits and any expense limits in place at the time of recoupment. Without these waivers, the Fund’s total annual operating expenses as shown in the August 1, 2022 prospectus are 3.68%, 4.43% and 3.43% for the Fund’s Class A, Class C and Class I shares, respectively. After fee waivers, the Fund’s total annual operating expenses shown in the August 1, 2022 prospectus are 1.98%, 2.73% and 1.73% for the Fund’s Class A, Class C and Class I shares, respectively. Please review the Fund’s most recent prospectus for more detail on the expense waiver. For more current information on the Fund’s expense ratio, please see the Financial Highlights. For performance information current to the most recent month-end, please call toll-free 1-844-223-8637. |
| ** | The Bloomberg Municipal Bond Index Total Return Value Unhedged USD covers the USD-denominated long-term tax exempt bond market. The index has four main sectors: state and local general obligation bonds, revenue bonds, insured bonds and prerefunded bonds. Investors cannot invest directly in an index. |
| + | The AlphaCentric SWBC Municipal Opportunities Fund Class A, Class C and Class I commenced operations on December 31, 2019. |
Comparison of the Change in value of a $10,000 investment
| Holdings by Security Type * | % of Net Assets | |||
| Municipal Bonds | 84.4 | % | ||
| Closed End Funds | 6.7 | % | ||
| Exchange-Traded Funds | 5.2 | % | ||
| Short-term Investment | 0.3 | % | ||
| Other Assets in Excess of Liabilities | 3.4 | % | ||
| 100.0 | % | |||
* Does not include derivative investments.
Please refer to the Schedule of Investments in this Annual Report for a detailed listing of the Fund’s holdings.
24
March 31, 2023
Dear AlphaCentric Strategic Income Fund (“the Fund”) Investor:
The Fund’s performance for the year ended March 31, 2023 was -10.29% (for the Class I Shares) versus -19.08% for the S&P US REIT Index. The Fund also outperformed most other funds in Morningstar’s Real Estate Fund category for the same period. In addition to achieving attractive total returns, our goal is to protect client capital in volatile periods. We believe the Fund’s flexibility shift between residential and commercial real estate exposure as well as the Fund’s ability to invest across the capital structure, in bonds and equities of publicly traded real estate securities, helped to limit the drawdown of the Fund in the context of broad financial asset price declines. We believe the Fund’s outperformance versus the S&P US REIT Index is attributable to the Fund’s differentiated approach and ability to take advantage of evolving dislocations in the market for real estate related securities.
As 2022 progressed, it became obvious that inflation was deeply imbedded in goods and services and the word “transitory” may need to be suspended from the English lexicon. Russia’s tragic and unexpected invasion of Ukraine early in the year certainly exacerbated upward price pressures although many commodity prices ended 2022 around pre-invasion levels. As the Federal Reserve (Fed) changed its tune on inflation, it hiked the Fed Funds rate over 400 basis points (bps) by year-end and ceased purchasing Agency MBS. Hawkish actions by several central banks sent global markets into a tailspin, losing more than $30 trillion in value. A rapidly strengthening dollar created pressure on other currencies with the UK bond market requiring a temporary government bailout. Growth stocks and speculative areas of the market like cryptocurrency got clobbered and even relatively short duration bonds proved an ill-conceived hiding spot.
The main theme in the portfolio continued to play off the strength in the U.S. housing market. We believe when there is discernable fundamental strength in one part of the market, investors are apt to invest lower down in the capital structure to find the best risk/reward. Despite a historic rise in interest rates, as we anticipated, housing data remained relatively resilient throughout 2022. Low housing supply and ample mortgage borrower equity continued to be the drivers of strength in the housing market and correspondingly low residential mortgage defaults.
In early 2023, it became evident that restrictive monetary policy was finally beginning to cool inflation. After a brief rally in risk assets in January, volatility rose again as turmoil struck the banking market. While the Fund does not own any bank stocks, most financial-related stocks sold off in tandem. Ironically, residential mortgage REITs and servicers (where the Fund is overweight) mark their portfolios to market every quarter and are not deposit-taking institutions. On the equity side of the portfolio, we have been extremely focused on investing in REITs/companies that do not overly depend on short-term funding and can perform well in a volatile interest rate environment.
25
Yields across the Fund’s target markets remain elevated and support the Fund’s managed monthly distribution, which increased to nine cents per share in December 2022. This is the equivalent of an annualized distribution yield of 7.25% of the March 31, 2023 NAV.
The volatility that gripped the market in 2022 and early 2023 has presented several investment opportunities in both bonds and equities. Looking ahead to the remainder of 2023, we believe many mortgage-related equities which are trading at unusually large discounts to book value are poised to generate attractive total returns. We also see deep value opportunities in certain parts of the structured credit and corporate credit markets.
In our view, most real estate mutual funds are taking predominantly commercial real estate risk by virtue of their extensive holdings of common shares in equity REITs. We believe the Fund’s differentiated flexibility to avoid this part of the market, as well as to opportunistically invest in bonds, puts the Fund in a good position in an environment where banks (a major funding source for commercial real estate) could likely restrict lending and put further pressure on commercial real estate. We believe the Fund is well positioned for 2023 as the Fund is focused on deep value opportunities in fundamentally sound parts of the real estate market – namely residential mortgage related investments.
We thank you for your investment and remind you that we are also investors in the Fund. Have a happy and healthy 2023!
Sincerely,
David Gregory
Portfolio Manager
This report is intended for the Fund’s shareholders. It may not be distributed to prospective investors unless it is preceded or accompanied by the current Fund prospectus. To obtain a prospectus or other information about the Fund, please visit www.AlphaCentricFunds.com or call 844-ACFUNDS (844-223-8637). Please read the prospectus carefully before investing.
The Fund’s returns for the fiscal year ended 3/31/23 and for the period since inception through 3/31/23, as compared to the Benchmark Index, were as follows:
| Fiscal Year Ended 3/31/2023 | Since Inception* | |
| Class I | -10.29 | 10.84 |
| S&P US REIT Index(1) | -19.08 | 7.03 |
| Bloomberg U.S. Mortgage Backed Securities Index USD(2) | -4.85 | 1.26 |
| Class A | -10.58 | -5.88 |
| Class A w/ Sales Charge | -14.82 | -8.33 |
| Class C | -11.24 | -6.58 |
| S&P US REIT Index(1) | -19.08 | -3.44 |
| Bloomberg U.S. Mortgage Backed Securities Index USD(2) | -4.85 | -5.49 |
| Class I 30-Day SEC Yield – Subsidized | 7.36% | |
| Class I 30-Day SEC Yield – Un-Subsidized | 6.50% |
| * | Inception (annualized): 8/1/2011 (I Share) | 5/28/2021 (A & C Shares) |
26
Performance before May 28, 2021 is for the Fund’s Predecessor Fund (Strategos Deep Value Fund LP). The prior performance is net of management fees and other expenses including the effect of the performance fee. The Predecessor Fund had an investment objective and strategies that were, in all material respects, the same as those of the Fund, and was managed in a manner that, in all material respects, complied with the investment guidelines and restrictions of the Fund. From its inception to May 28, 2021, the Predecessor Fund was not subject to certain investment restrictions, diversification requirements and other restrictions of the Investment Company Act of 1940 or the Internal Revenue Code, which if they had been applicable, might have adversely affected its performance. In addition, the Predecessor Fund was not subject to sales loads that would have adversely affected performance. Performance of the Predecessor Fund is not an indicator of future results.
| (1) | The Bloomberg U.S. Mortgage Backed Securities Index tracks fixed-rate agency mortgage backed pass-through securities guaranteed by Ginnie Mae, Fannie Mae, and Freddie Mac. Investors cannot invest directly in an index. |
| (2) | The S&P United States REIT Index defines and measures the investable universe of publicly traded real estate investment trusts domiciled in the United States. Investors cannot invest directly in an index. |
The 30-Day SEC Yield represents net investment income earned by the Fund over the 30-day period ending 12/31/2022, expressed as an annual percentage rate based on the Fund’s share price at the end of the 30-day period. Subsidized SEC 30-Day Yield reflects fee waivers and/or expense reimbursements during the period.
The Fund’s maximum sales charge for Class “A” shares is 4.75%. Performance is historic and does not guarantee future results. Investment return and principal value will fluctuate with changing market conditions so that when redeemed, shares may be worth more or less than their original cost. Current performance may be lower or higher than the performance data quoted. To obtain the most recent month end performance information or the Fund’s prospectus please call the Fund, toll free at 1-844-ACFUNDS (844-223-8637). You can also obtain a prospectus at www.AlphaCentricFunds.com. 5435-NLD-05052023
27
AlphaCentric Strategic Income Fund
PORTFOLIO REVIEW (Unaudited)
March 31, 2023
The Fund’s performance figures* for the periods ended March 31, 2023, compared to its benchmarks:
| Annualized | Annualized | |||||
| Annualized | Annualized | Annualized | Since Inception + - | Since Inception ++ - | ||
| One Year | Three Years | Five Years | Ten Years | March 31, 2023 | March 31, 2023 | |
| Class A (SIIAX) | (10.58)% | — | — | — | (5.88)% | — |
| Class A (SIIAX) with 4.75% load | (14.82)% | — | — | — | (8.33)% | — |
| Class C (SIICX) | (11.24)% | — | — | — | (6.58)% | — |
| Class I (SIIIX) +++ | (10.29)% | 18.72% | 10.25% | 9.82% | — | 10.84% |
| Bloomberg U.S. MBS Total Return Index ** | (4.85)% | (3.31)% | 0.20% | 1.00% | (5.49)% | 1.26% |
| S&P U.S. REIT Index Total Return *** | (19.08)% | 12.03% | 6.03% | 5.83% | (3.44)% | 7.03% |
| * | The performance data quoted here represents past performance. Current performance may be lower or higher than the performance data quoted above. Investment return and principal value will fluctuate, so that shares, when redeemed, may be worth more or less than their original cost. Class A is subject to a maximum applicable sales charge of 4.75% and a maximum deferred sales charge of 1.00% on investments at or above the $1 million breakpoint (where you do not pay a sales charge) on shares redeemed within 18 months of purchase. Total returns are calculated using the net asset value (“NAV”) on March 31, 2023. The returns shown do not reflect the deduction of taxes that a shareholder would pay on Fund distributions or on the redemptions of Fund shares. Past performance is no guarantee of future results. Performance figures for periods greater than 1 year are annualized. The Fund’s manager has contractually agreed to reduce its fees and/or absorb expenses of the Fund, at least until July 31, 2023, to ensure that the net annual fund operating expenses (excluding brokerage costs; borrowing costs, such as (a) interest and (b) dividends on securities sold short; taxes; costs of investing in underlying funds and extraordinary expenses) will not exceed 1.74%, 2.49% and 1.49% for the Fund’s Class A, Class C, and Class I shares, respectively, subject to possible recoupment from the Fund in future years. Fee waivers and expense reimbursements are subject to possible recoupment by the manager from the Fund in future years on a rolling three-year basis (within three years after the fees have been waived or reimbursed) if such recoupment can be achieved within the foregoing expense limits and any expense limits in place at the time of recoupment. Without these waivers, the Fund’s estimated total annual operating expenses as shown in the August 1, 2022 prospectus for the Fund’s inital fiscal period are 2.39%, 3.14% and 2.14% for the Fund’s Class A, Class C and Class I shares, respectively. After fee waivers, the Fund’s total annual operating expenses shown in the August 1, 2022 prospectus for the Fund’s inital fiscal period are 1.77%, 2.52% and 1.52% for the Fund’s Class A, Class C and Class I shares, respectively. Please review the Fund’s most recent prospectus for more detail on the expense waiver. For more current information on the Fund’s expense ratio, please see the Financial Highlights. For performance information current to the most recent month-end, please call toll-free 1-844-223-8637. |
| ** | The Bloomberg U.S. MBS Total Return Index tracks fixed-rate agency mortgage backed pass-through securities guaranteed by Ginnie Mae (GNMA), Fannie Mae (FNMA), and Freddie Mac (FHLMC). Investors cannot invest directly in an index. |
| *** | The S&P U.S. REIT Index Total Return defines and measures the investable universe of publicly traded real estate investment trusts domiciled in the United States.. Investors cannot invest directly in an index or benchmark. |
| + | The AlphaCentric Strategic Income Fund Class A and Class C commenced operations on May 28, 2021. |
| ++ | The AlphaCentric Strategic Income Fund Class I commenced operations on April 1, 2011. |
| +++ | The Fund acquired all of the assets and liabilities of Strategos Deep Value Fund LP (the “Predecessor Fund”) in a tax-free reorganization on May 28, 2021. In connection with this acquisition, shares of the Predecessor Fund were exchanged for Class I shares of the Fund. The Fund’s investment objectives, policies, restrictions, and guidelines are, in all material respects, equivalent to the Predecessor Fund’s investment objectives, policies, restrictions, and guidelines. The Fund’s sub-advisor is Goshen Rock Capital, LLC (“GRC”). GRC is an SEC registered investment advisor founded in 2021. The financial statements for the Predecessor Fund can be found in the Fund’s SAI. The performance information set forth below reflects the historical performance of the Predecessor Fund shares. Updated performance information will be available at no cost by calling 1-844-ACFUNDS (844-223-8637) or visiting the Fund’s website at www.AlphaCentricFunds.com |
Comparison of the Change in value of a $10,000 investment
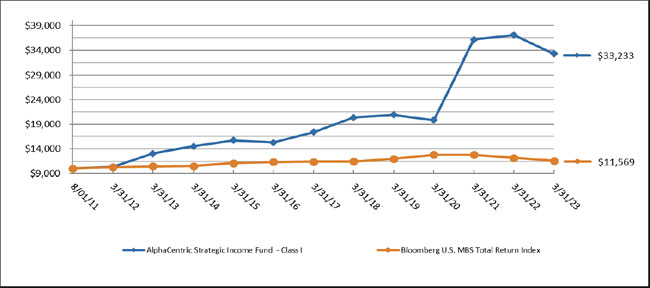
| Holdings by Security Type | % of Net Assets | |||
| Common Stocks | 42.8 | % | ||
| Preferred Stocks | 14.0 | % | ||
| Short-Term Investment | 15.6 | % | ||
| Convertible Bonds | 9.0 | % | ||
| Corporate Bonds | 8.5 | % | ||
| Asset Backed Securities | 7.2 | % | ||
| Collateralized Mortgage Obligations | 1.9 | % | ||
| Other Assets in Excess of Liabilities | 1.0 | % | ||
| 100.0 | % | |||
Please refer to the Schedule of Investments in this Annual Report for a detailed listing of the Fund’s holdings.
28
| ALPHACENTRIC INCOME OPPORTUNITIES FUND (IOFAX, IOFCX, IOFIX) |
| SCHEDULE OF INVESTMENTS |
| March 31, 2023 |
| Principal Amount ($) | Spread | Coupon Rate (%) | Maturity | Fair Value | ||||||||||
| NON-AGENCY RESIDENTIAL MORTGAGE BACKED SECURITIES — 106.4% | ||||||||||||||
| 1,095,031 | ABFC 2004-OPT4 Trust Series 2004-OPT4 M4(a) | US0001M + 2.700% | 7.5450 | 07/25/33 | $ | 1,013,664 | ||||||||
| 5,124,282 | ABFC 2007-NC1 Trust Series 2007-NC1 M1(a),(b) | US0001M + 1.000% | 5.8450 | 05/25/37 | 3,724,566 | |||||||||
| 1,500,465 | ABFS Mortgage Loan Trust 2003-2 Series 2003-2 B(b),(c) | 8.0000 | 04/25/34 | 556,923 | ||||||||||
| 678,000 | ACE Securities Corp Home Equity Loan Trust Series 2004-SD1 M4(a) | US0001M + 4.125% | 8.9700 | 11/25/33 | 618,243 | |||||||||
| 100,931 | ACE Securities Corp Home Equity Loan Trust Series 2004-FM2 M3(a) | US0001M + 2.025% | 6.8700 | 06/25/34 | 96,382 | |||||||||
| 1,679,073 | ACE Securities Corp Home Equity Loan Trust Series 2004-HE3 M7(a) | US0001M + 2.775% | 7.6200 | 11/25/34 | 1,716,802 | |||||||||
| 5,162,920 | ACE Securities Corp Home Equity Loan Trust Series 2004-HE4 M6(a) | US0001M + 1.950% | 6.7950 | 12/25/34 | 3,763,369 | |||||||||
| 481,054 | ACE Securities Corp Home Equity Loan Trust Series 2004-RM2 M4(a) | US0001M + 1.320% | 6.1650 | 01/25/35 | 387,172 | |||||||||
| 4,375,406 | ACE Securities Corp Home Equity Loan Trust Series 2005-HE2 M7(a) | US0001M + 1.845% | 6.6900 | 04/25/35 | 2,718,973 | |||||||||
| 2,924,469 | ACE Securities Corp Home Equity Loan Trust Series 2006-ASP3 M1(a) | US0001M + 0.420% | 5.2650 | 06/25/36 | 2,265,274 | |||||||||
| 4,764,061 | ACE Securities Corp Home Equity Loan Trust Series 2006-ASP4 M1(a) | US0001M + 0.435% | 5.2800 | 08/25/36 | 4,049,506 | |||||||||
| 2,417,000 | ACE Securities Corp Home Equity Loan Trust Series 2005-SD2 M5(a) | US0001M + 4.500% | 9.3450 | 08/25/40 | 1,581,094 | |||||||||
| 2,022,296 | Adjustable Rate Mortgage Trust 2005-1 Series 2005-1 5M2(a) | US0001M + 1.500% | 6.3450 | 05/25/35 | 1,857,775 | |||||||||
| 5,831,577 | Adjustable Rate Mortgage Trust 2005-2 Series 2005-2 6M3(a) | US0001M + 1.350% | 6.1950 | 06/25/35 | 3,975,743 | |||||||||
| 92,272 | Adjustable Rate Mortgage Trust 2005-3 Series 2005-3 1A2(c) | 3.7860 | 07/25/35 | 86,659 | ||||||||||
| 833,937 | Aegis Asset Backed Securities Trust Mortgage Series 2004-4 B3(a) | US0001M + 5.250% | 10.0950 | 10/25/34 | 860,636 | |||||||||
| 1,104,127 | Alternative Loan Trust 2006-OA22 Series 2006-OA22 A3(a) | US0001M + 0.240% | 5.3250 | 02/25/47 | 935,385 | |||||||||
| 7,214,648 | American Home Mortgage Investment Trust 2006-1 Series 2006-1 1A2(a) | US0001M + 0.380% | 5.2250 | 03/25/46 | 5,258,851 | |||||||||
| 1,044,914 | Ameriquest Mort Sec Inc Asset Backed Pass Through Certs Series 2002-2 M4(a) | US0001M + 3.300% | 5.2510 | 08/25/32 | 861,473 | |||||||||
| 2,722,790 | Ameriquest Mortgage Securities Asset-Backed Series 2004-R8 M5(a) | US0001M + 1.920% | 6.7650 | 09/25/34 | 2,024,608 | |||||||||
| 2,351,672 | Ameriquest Mortgage Securities Asset-Backed Series 2004-R11 M6(a) | US0001M + 2.100% | 3.7300 | 11/25/34 | 1,947,398 | |||||||||
| 8,575,471 | Ameriquest Mortgage Securities Asset-Backed Series 2005-R1 M6(a) | US0001M + 1.500% | 6.3450 | 03/25/35 | 8,389,959 | |||||||||
| 3,407,819 | Ameriquest Mortgage Securities Asset-Backed Series 2005-R5 M7(a) | US0001M + 1.830% | 6.6750 | 07/25/35 | 3,278,775 | |||||||||
| 1,187,319 | Ameriquest Mortgage Securities Asset-Backed Series 2005-R10 M7(a) | US0001M + 2.175% | 7.0200 | 01/25/36 | 1,234,944 | |||||||||
| 2,788 | Amresco Residential Securities Corp Mort Loan Series 1999-1 M2(a) | US0001M + 1.350% | 6.6950 | 11/25/29 | 2,447 | |||||||||
| 5,417,814 | Argent Securities Inc Asset-Backed Pass-Through Series 2006-W1 M1(a) | US0001M + 0.615% | 5.4600 | 03/25/36 | 4,290,155 | |||||||||
| 1,110,538 | Banc of America Funding 2004-B Trust Series 2004-B 3A2(c) | 3.4290 | 12/20/34 | 830,891 | ||||||||||
| 7,454,916 | Banc of America Funding 2006-G Trust Series 2006-G M2(a) | US0001M + 0.480% | 5.2410 | 07/20/36 | 6,241,349 | |||||||||
| 2,571,013 | Banc of America Mortgage 2004-K Trust Series 2004-K B1(c) | 3.9600 | 12/25/34 | 1,894,414 | ||||||||||
See accompanying notes to consolidated financial statements.
29
| ALPHACENTRIC INCOME OPPORTUNITIES FUND (IOFAX, IOFCX, IOFIX) |
| SCHEDULE OF INVESTMENTS (Continued) |
| March 31, 2023 |
| Principal Amount ($) | Spread | Coupon Rate (%) | Maturity | Fair Value | ||||||||||
| NON-AGENCY RESIDENTIAL MORTGAGE BACKED SECURITIES — 106.4% (Continued) | ||||||||||||||
| 1,287,243 | Bear Stearns ALT-A Trust 2004-11 Series 2004-11 1M2(a) | US0001M + 1.575% | 6.4200 | 11/25/34 | $ | 1,147,805 | ||||||||
| 24,788 | Bear Stearns ARM Trust 2003-8 Series 2003-8 1A2(c) | 4.3200 | 01/25/34 | 22,002 | ||||||||||
| 396,543 | Bear Stearns ARM Trust 2004-7 Series 2004-7 1A1(c) | 2.6250 | 10/25/34 | 268,781 | ||||||||||
| 2,986,904 | Bear Stearns Asset Backed Securities I Trust Series 2004-HE11 M4(a) | US0001M + 2.550% | 5.9770 | 12/25/34 | 2,512,320 | |||||||||
| 1,292,006 | Bear Stearns Asset Backed Securities I Trust Series 2005-HE1 M5(a) | US0001M + 2.325% | 5.7990 | 01/25/35 | 1,184,738 | |||||||||
| 9,950,194 | Bear Stearns Asset Backed Securities I Trust Series 2005-HE9 M4(a) | US0001M + 1.800% | 6.6450 | 10/25/35 | 8,905,936 | |||||||||
| 1,708,345 | Bear Stearns Asset Backed Securities I Trust Series 2007-HE2 1A4(a) | US0001M + 0.320% | 5.1650 | 03/25/37 | 1,514,207 | |||||||||
| 1,750,241 | Bear Stearns Asset Backed Securities I Trust Series 2007-HE7 M2(a) | US0001M + 1.750% | 6.5950 | 10/25/37 | 1,575,031 | |||||||||
| 45,368,500 | Carrington Mortgage Loan Trust Series 2006-FRE1 Series 2006-FRE1 M1(a) | US0001M + 0.300% | 5.1450 | 07/25/36 | 31,580,136 | |||||||||
| 2,609,451 | Carrington Mortgage Loan Trust Series 2006-FRE2 Series 2006-FRE2 A4(a) | US0001M + 0.250% | 5.0950 | 10/25/36 | 2,018,160 | |||||||||
| 5,924,000 | Carrington Mortgage Loan Trust Series 2006-NC2 Series 2006-NC2 M1(a) | US0001M + 0.405% | 5.2500 | 06/25/36 | 4,099,425 | |||||||||
| 8,588,813 | Carrington Mortgage Loan Trust Series 2006-NC4 Series 2006-NC4 M1(a) | US0001M + 0.300% | 5.1450 | 10/25/36 | 6,859,963 | |||||||||
| 8,772,362 | Carrington Mortgage Loan Trust Series 2006-RFC1 Series 2006-RFC1 M2(a) | US0001M + 0.435% | 5.2800 | 05/25/36 | 7,566,989 | |||||||||
| 13,733,907 | Carrington Mortgage Loan Trust Series 2007-RFC1 Series 2007-RFC1 M1(a) | US0001M + 0.260% | 5.1050 | 12/25/36 | 10,793,066 | |||||||||
| 3,774,725 | Centex Home Equity Loan Trust 2002-C Series 2002-C M2(a) | US0001M + 1.150% | 5.9950 | 09/25/32 | 3,555,867 | |||||||||
| 58,269 | Centex Home Equity Loan Trust 2004-B Series 2004-B M7(a) | US0001M + 2.325% | 7.1700 | 03/25/34 | 1,361 | |||||||||
| 2,658,007 | Centex Home Equity Loan Trust 2004-C Series 2004-C M5(a) | US0001M + 1.725% | 4.7350 | 06/25/34 | 2,356,659 | |||||||||
| 1,660,637 | Centex Home Equity Loan Trust 2004-C Series 2004-C M6(a) | US0001M + 2.100% | 4.7350 | 06/25/34 | 598,690 | |||||||||
| 184,371 | CHL Mortgage Pass-Through Trust 2004-6 Series 2004-6 M(c) | 6.7770 | 05/25/34 | 182,584 | ||||||||||
| 81,751,747 | CIT Mortgage Loan Trust 2007-1 Series 2007-1 1M3(a),(b) | US0001M + 1.750% | 6.5950 | 10/25/37 | 52,608,221 | |||||||||
| 14,454,834 | CIT Mortgage Loan Trust 2007-1 Series 2007-1 2M3(a),(b) | US0001M + 1.750% | 6.5950 | 10/25/37 | 8,897,524 | |||||||||
| 1,622,515 | Citigroup Mortgage Loan Trust 2004-OPT1 Series 2004-OPT1 M8(a) | US0001M + 2.625% | 7.4700 | 10/25/34 | 1,163,071 | |||||||||
| 555,740 | Citigroup Mortgage Loan Trust 2005-3 Series 2005-3 2A3(c) | 3.9130 | 08/25/35 | 436,148 | ||||||||||
| 4,880,726 | Citigroup Mortgage Loan Trust 2006-WMC1 Series 2006-WMC1 M2(a) | US0001M + 0.615% | 5.4600 | 12/25/35 | 3,579,120 | |||||||||
| 10,709,232 | Citigroup Mortgage Loan Trust 2007-AHL1 Series 2007-AHL1 M2(a) | US0001M + 0.270% | 5.2500 | 12/25/36 | 10,736,632 | |||||||||
| 651,733 | Citigroup Mortgage Loan Trust, Inc. Series 2005-OPT1 M8(a) | US0001M + 1.935% | 6.7800 | 02/25/35 | 529,840 | |||||||||
| 2,520,067 | Citigroup Mortgage Loan Trust, Inc. Series 2005-HE1 M5(a) | US0001M + 1.875% | 6.7200 | 05/25/35 | 2,356,154 | |||||||||
| 148,255 | Countrywide Asset-Backed Certificates Series 2003-SD2 B1(a),(b) | US0001M + 5.625% | 10.4700 | 10/25/32 | 165,829 | |||||||||
| 63,232 | Countrywide Asset-Backed Certificates Series 2004-SD3 M3(a),(b) | US0001M + 4.500% | 9.3450 | 11/25/33 | 63,252 | |||||||||
| 1,813,521 | Countrywide Asset-Backed Certificates Series 2004-BC5 M8(a) | US0001M + 2.625% | 7.4700 | 10/25/34 | 1,674,676 | |||||||||
| 2,444,298 | Countrywide Asset-Backed Certificates Series 2004-11 M6(a) | US0001M + 2.625% | 7.4700 | 11/25/34 | 2,052,909 | |||||||||
See accompanying notes to consolidated financial statements.
30
| ALPHACENTRIC INCOME OPPORTUNITIES FUND (IOFAX, IOFCX, IOFIX) |
| SCHEDULE OF INVESTMENTS (Continued) |
| March 31, 2023 |
| Principal Amount ($) | Spread | Coupon Rate (%) | Maturity | Fair Value | ||||||||||
| NON-AGENCY RESIDENTIAL MORTGAGE BACKED SECURITIES — 106.4% (Continued) | ||||||||||||||
| 5,714,317 | Countrywide Asset-Backed Certificates Series 2005-9 M4(a) | US0001M + 1.500% | 6.3450 | 01/25/36 | $ | 4,871,494 | ||||||||
| 4,000,469 | Countrywide Asset-Backed Certificates Series 2006-SD1 M2(a),(b) | US0001M + 1.095% | 5.9400 | 02/25/36 | 3,291,758 | |||||||||
| 2,552,670 | Countrywide Asset-Backed Certificates Series 2006-2 M3(a) | US0001M + 0.660% | 5.5050 | 06/25/36 | 2,491,680 | |||||||||
| 3,653,797 | Countrywide Asset-Backed Certificates Series 2007-BC2 M1(a) | US0001M + 0.340% | 5.1850 | 06/25/37 | 2,638,086 | |||||||||
| 4,062,952 | Countrywide Asset-Backed Certificates Series 2007-2 M1(a) | US0001M + 0.220% | 5.0650 | 08/25/37 | 3,069,637 | |||||||||
| 12,603,364 | Countrywide Asset-Backed Certificates Series 2006-22 M1(a) | US0001M + 0.230% | 5.0750 | 05/25/47 | 10,472,483 | |||||||||
| 9,953,861 | Countrywide Asset-Backed Certificates Series 2007-9 M1(a) | US0001M + 0.260% | 5.1050 | 06/25/47 | 10,474,187 | |||||||||
| 1,402,353 | Credit Suisse First Boston Mortgage Securities Series 2001-HE22 M1(a) | US0001M + 1.500% | 6.3450 | 02/25/32 | 2,029,742 | |||||||||
| 1,238,572 | Credit Suisse First Boston Mortgage Securities Series 2004-FRE1 B4(a) | US0001M + 3.850% | 8.6950 | 04/25/34 | 654,357 | |||||||||
| 1,672,937 | Credit-Based Asset Servicing and Securitization, Series 2003-RP1 M2(a),(b) | US0001M + 4.500% | 9.3450 | 03/25/33 | 1,143,788 | |||||||||
| 50,737 | Credit-Based Asset Servicing and Securitization, Series 2004-CB7 B2(a),(b) | US0001M + 2.850% | 3.7930 | 10/25/34 | 39,080 | |||||||||
| 1,997,993 | Credit-Based Asset Servicing and Securitization, Series 2004-CB8 B2(a) | US0001M + 2.625% | 3.8870 | 12/25/35 | 1,470,136 | |||||||||
| 3,618,082 | Credit-Based Asset Servicing and Securitization, Series 2007-SP2 M7(b),(d) | 7.2500 | 03/25/46 | 797,811 | ||||||||||
| 1,270,633 | CWABS Asset-Backed Certificates Trust 2004-9 Series 2004-9 MV5(a) | US0001M + 1.650% | 6.4950 | 11/25/34 | 1,100,149 | |||||||||
| 1,430,985 | Delta Funding Home Equity Loan Trust 1997-3 Series 1997-3 B1F | 7.6500 | 10/25/28 | 1,305,106 | ||||||||||
| 1,355,353 | Delta Funding Home Equity Loan Trust 1998-1 Series 1998-1 M1F(a) | US0001M + 0.825% | 5.6700 | 05/25/30 | 1,135,651 | |||||||||
| 1,108,432 | Delta Funding Home Equity Loan Trust 1999-1 Series 1999-1 B(c) | 6.8000 | 03/15/28 | 911,862 | ||||||||||
| 1,716,814 | Delta Funding Home Equity Loan Trust 1999-2 Series 1999-2 M1 | 7.3700 | 08/15/30 | 1,311,407 | ||||||||||
| 765,888 | Delta Funding Home Equity Loan Trust 2000-3 Series 2000-3 M2(d) | 8.3900 | 11/15/30 | 651,951 | ||||||||||
| 2,690,057 | Ellington Loan Acquisition Trust 2007-2 Series 2007-2 M2B(a),(b) | US0001M + 1.700% | 6.5450 | 05/25/37 | 1,488,622 | |||||||||
| 5,664,465 | EMC Mortgage Loan Trust 2005-B Series 2005-B M2(a),(b) | US0001M + 2.250% | 7.0950 | 04/25/42 | 5,281,675 | |||||||||
| 1,724,282 | Finance America Mortgage Loan Trust 2004-3 Series 2004-3 M5(a) | US0001M + 1.650% | 6.4950 | 11/25/34 | 1,313,422 | |||||||||
| 2,017,551 | First Franklin Mortgage Loan Trust 2003-FF4 Series 2003-FF4 M2(a) | US0001M + 2.475% | 7.3200 | 10/25/33 | 1,692,905 | |||||||||
| 3,782,990 | First Franklin Mortgage Loan Trust 2005-FF5 Series 2005-FF5 M5(a) | US0001M + 1.200% | 6.0450 | 05/25/35 | 2,916,429 | |||||||||
| 3,052,252 | First Franklin Mortgage Loan Trust 2006-FF7 Series 2006-FF7 M1(a) | US0001M + 0.375% | 5.2200 | 05/25/36 | 2,822,376 | |||||||||
| 7,077,917 | First Franklin Mortgage Loan Trust 2006-FF9 Series 2006-FF9 M1(a) | US0001M + 0.375% | 5.2200 | 06/25/36 | 9,149,947 | |||||||||
| 1,421,114 | First Franklin Mortgage Loan Trust2006-FF3 Series 2006-FF3 M2(a) | US0001M + 0.585% | 5.4300 | 02/25/36 | 1,136,322 | |||||||||
| 1,975,222 | Fremont Home Loan Trust 2004-3 Series 2004-3 M5(a) | US0001M + 1.875% | 6.7200 | 11/25/34 | 1,511,840 | |||||||||
| 375,966 | Fremont Home Loan Trust 2004-4 Series 2004-4 M3(a) | US0001M + 0.915% | 5.7600 | 03/25/35 | 277,184 | |||||||||
| 5,979,717 | Fremont Home Loan Trust 2005-1 Series 2005-1 M7(a),(b) | US0001M + 1.800% | 6.6450 | 06/25/35 | 2,741,827 | |||||||||
| 6,843,963 | Fremont Home Loan Trust 2005-A Series 2005-A M5(a) | US0001M + 1.050% | 5.8950 | 01/25/35 | 5,220,417 | |||||||||
| 5,048,045 | GreenPoint Mortgage Funding Trust 2005-HY1 Series 2005-HY1 M2(a) | US0001M + 0.885% | 5.7300 | 07/25/35 | 4,578,994 | |||||||||
| 4,032,647 | GSAA Home Equity Trust 2004-11 Series 2004-11 M2(a) | US0001M + 1.425% | 6.2700 | 12/25/34 | 3,342,837 | |||||||||
See accompanying notes to consolidated financial statements.
31
| ALPHACENTRIC INCOME OPPORTUNITIES FUND (IOFAX, IOFCX, IOFIX) |
| SCHEDULE OF INVESTMENTS (Continued) |
| March 31, 2023 |
| Principal Amount ($) | Spread | Coupon Rate (%) | Maturity | Fair Value | ||||||||||
| NON-AGENCY RESIDENTIAL MORTGAGE BACKED SECURITIES — 106.4% (Continued) | ||||||||||||||
| 2,146,082 | GSAA Home Equity Trust 2005-4 Series 2005-4 B1(a) | US0001M + 1.725% | 6.5700 | 03/25/35 | $ | 1,526,443 | ||||||||
| 4,556,200 | GSAMP Trust 2005-AHL2 Series 2005-AHL2 M1(a) | US0001M + 0.660% | 5.5050 | 12/25/35 | 3,183,792 | |||||||||
| 6,308,246 | GSAMP Trust 2006-HE8 Series 2006-HE8 M1(a) | US0001M + 0.250% | 5.0950 | 01/25/37 | 4,990,653 | |||||||||
| 8,384 | GSR Mortgage Loan Trust 2005-7F Series 2005-7F 3A1(a) | US0001M + 0.500% | 5.3450 | 09/25/35 | 8,153 | |||||||||
| 1,010,124 | GSRPM Mortgage Loan Trust Series 2004-1 Series 2004-1 B2(a),(b) | US0001M + 5.250% | 10.0950 | 09/25/42 | 910,694 | |||||||||
| 1,166,121 | HarborView Mortgage Loan Trust 2006-12 Series 2006-12 2A2B(a) | US0001M + 0.250% | 5.2610 | 01/19/38 | 1,867,982 | |||||||||
| 3,840,398 | Home Equity Asset Trust 2005-3 Series 2005-3 M6(a) | US0001M + 1.065% | 5.9100 | 08/25/35 | 3,727,020 | |||||||||
| 2,276,012 | Home Equity Asset Trust 2005-6 Series 2005-6 M6(a) | US0001M + 1.065% | 5.9100 | 12/25/35 | 3,545,657 | |||||||||
| 11,779,850 | Home Equity Asset Trust 2005-7 Series 2005-7 M3(a) | US0001M + 0.750% | 5.5950 | 01/25/36 | 10,809,297 | |||||||||
| 16,711,572 | Home Equity Mortgage Loan Asset-Backed Trust Series 2006-B M1(a) | US0001M + 0.540% | 5.3850 | 06/25/36 | 12,626,729 | |||||||||
| 231,500 | Impac CMB Trust Series 2004-10 Series 2004-10 3M1(a) | US0001M + 0.855% | 5.7000 | 03/25/35 | 208,788 | |||||||||
| 20,044 | IndyMac INDX Mortgage Loan Trust 2004-AR6 Series 2004-AR6 6A2(c) | 4.0920 | 10/25/34 | 17,697 | ||||||||||
| 1,005,422 | IXIS Real Estate Capital Trust 2005-HE2 Series 2005-HE2 M6(a) | US0001M + 1.035% | 5.8800 | 09/25/35 | 1,064,228 | |||||||||
| 5,719,611 | JP Morgan Mortgage Acquisition Trust 2006-CH1 Series 2006-CH1 M9(a) | US0001M + 1.800% | 6.6450 | 07/25/36 | 4,787,667 | |||||||||
| 3,777,631 | JP Morgan Mortgage Acquisition Trust 2007-HE1 Series 2007-HE1 MV1(a) | US0001M + 0.260% | 5.1050 | 03/25/47 | 3,763,421 | |||||||||
| 1,902,704 | Long Beach Mortgage Loan Trust 2003-1 Series 2003-1 M3(a) | US0001M + 6.000% | 10.8450 | 03/25/33 | 2,190,348 | |||||||||
| 11,155,603 | Long Beach Mortgage Loan Trust 2005-3 Series 2005-3 M1(a) | US0001M + 0.705% | 5.5500 | 08/25/45 | 9,637,868 | |||||||||
| 489,457 | MAFI II Remic Trust 1998-A Series 1998-AX B2 | 6.0000 | 02/20/27 | 428,845 | ||||||||||
| 420,949 | MASTR Adjustable Rate Mortgages Trust 2004-5 Series 2004-5 B2(c) | 3.5610 | 07/25/34 | 330,565 | ||||||||||
| 406,194 | MASTR Alternative Loan Trust 2002-2 Series 2002-2 B3(c) | 7.1340 | 10/25/32 | 21,800 | ||||||||||
| 1,497,751 | Mastr Asset Backed Securities Trust 2004-HE1 Series 2004-HE1 M10(a) | US0001M + 5.250% | 10.0950 | 09/25/34 | 1,175,718 | |||||||||
| 50,292 | Mastr Asset Backed Securities Trust 2005-NC1 Series 2005-NC1 M8(a) | US0001M + 2.295% | 7.1400 | 12/25/34 | 244,246 | |||||||||
| 4,490,002 | Mastr Asset Backed Securities Trust 2007-HE1 Series 2007-HE1 M1(a) | US0001M + 0.300% | 5.1450 | 05/25/37 | 4,304,573 | |||||||||
| 901,537 | Mastr Specialized Loan Trust Series 2005-2 M4(a),(b) | US0001M + 2.265% | 7.1670 | 07/25/35 | 873,948 | |||||||||
| 1,462,000 | Mastr Specialized Loan Trust Series 2005-3 M2(a),(b) | US0001M + 1.250% | 6.7200 | 11/25/35 | 885,923 | |||||||||
| 6,480,556 | Mastr Specialized Loan Trust Series 2006-1 M2(a),(b) | US0001M + 2.400% | 7.2450 | 01/25/36 | 4,549,107 | |||||||||
| 1,259,839 | Meritage Mortgage Loan Trust 2004-2 Series 2004-2 M4(a) | US0001M + 1.725% | 6.5700 | 01/25/35 | 1,070,001 | |||||||||
| 19,222 | Merrill Lynch Mortgage Investors Trust MLMI Series 2003-A1 2A(a) | US0012M + 1.625% | 7.3160 | 12/25/32 | 17,917 | |||||||||
| 73,729 | Merrill Lynch Mortgage Investors Trust MLMI Series 2003-A2 2A2(a) | US0006M + 1.500% | 6.7710 | 02/25/33 | 67,822 | |||||||||
| 440,649 | Merrill Lynch Mortgage Investors Trust Series 2003-OPT1 M2(a) | US0001M + 2.175% | 7.0200 | 07/25/34 | 360,011 | |||||||||
| 1,504,514 | Merrill Lynch Mortgage Investors Trust Series 2004-WMC1 B1(a) | US0001M + 2.400% | 7.2450 | 10/25/34 | 1,190,158 | |||||||||
| 239,200 | Merrill Lynch Mortgage Investors Trust Series MLCC Series 2005-A B2(a) | US0001M + 1.005% | 5.8500 | 03/25/30 | 164,083 | |||||||||
See accompanying notes to consolidated financial statements.
32
| ALPHACENTRIC INCOME OPPORTUNITIES FUND (IOFAX, IOFCX, IOFIX) |
| SCHEDULE OF INVESTMENTS (Continued) |
| March 31, 2023 |
| Principal Amount ($) | Spread | Coupon Rate (%) | Maturity | Fair Value | ||||||||||
| NON-AGENCY RESIDENTIAL MORTGAGE BACKED SECURITIES — 106.4% (Continued) | ||||||||||||||
| 3,250,497 | Merrill Lynch Mortgage Investors Trust Series MLCC Series 2006-1 M1(c) | 3.6500 | 02/25/36 | $ | 2,235,564 | |||||||||
| 1,468,750 | Morgan Stanley A.B.S Capital I Inc Trust 2004-WMC2 Series 2004-WMC2 B3(a) | US0001M + 5.250% | 10.0950 | 07/25/34 | 1,241,340 | |||||||||
| 298,253 | Morgan Stanley A.B.S Capital I Inc Trust 2004-WMC3 Series 2004-WMC3 M4(a) | US0001M + 1.350% | 4.0680 | 01/25/35 | 235,432 | |||||||||
| 298,085 | Morgan Stanley A.B.S Capital I Inc Trust 2004-WMC3 Series 2004-WMC3 M6(a) | US0001M + 1.650% | 4.0680 | 01/25/35 | 303,196 | |||||||||
| 2,378,505 | Morgan Stanley A.B.S Capital I Inc Trust 2005-WMC2 Series 2005-WMC2 M5(a) | US0001M + 0.975% | 5.8200 | 02/25/35 | 1,810,651 | |||||||||
| 5,918,680 | Morgan Stanley A.B.S Capital I Inc Trust 2005-WMC5 Series 2005-WMC5 B1(a) | US0001M + 1.800% | 6.6450 | 06/25/35 | 4,815,863 | |||||||||
| 10,596,493 | Morgan Stanley A.B.S Capital I Inc Trust 2006-NC1 Series 2006-NC1 M3(a) | US0001M + 0.630% | 5.4750 | 12/25/35 | 10,246,245 | |||||||||
| 3,546,076 | Morgan Stanley A.B.S Capital I Inc Trust 2007-HE6 Series 2007-HE6 M1(a) | US0001M + 0.260% | 5.1050 | 05/25/37 | 6,871,702 | |||||||||
| 59,244 | Morgan Stanley Mortgage Loan Trust 2004-7AR Series 2004-7AR 2A7(c) | 4.5350 | 09/25/34 | 57,218 | ||||||||||
| 6,487,710 | Nationstar Home Equity Loan Trust 2007-B Series 2007-B M2(a) | US0001M + 0.470% | 5.3150 | 04/25/37 | 7,520,654 | |||||||||
| 657,803 | New Century Home Equity Loan Trust Series 2004-A M2(c) | 5.6500 | 08/25/34 | 640,380 | ||||||||||
| 2,019,256 | New Century Home Equity Loan Trust 2005-1 Series 2005-1 M6(a) | US0001M + 1.200% | 6.0450 | 03/25/35 | 1,709,621 | |||||||||
| 3,706,648 | New Century Home Equity Loan Trust 2006-2 Series 2006-2 M1(a) | US0001M + 0.310% | 5.1550 | 08/25/36 | 3,164,448 | |||||||||
| 195,009 | New Century Home Equity Loan Trust Series 2003-5 Series 2003-5 AII(a) | US0001M + 0.800% | 4.4120 | 11/25/33 | 173,090 | |||||||||
| 16,565 | Nomura Asset Acceptance Corp Alternative Loan Series 2003-A1 A5 | 7.0000 | 04/25/33 | 16,463 | ||||||||||
| 6,022 | Nomura Asset Acceptance Corp Alternative Loan Series 2003-A1 A2 | 6.0000 | 05/25/33 | 5,850 | ||||||||||
| 1,335,012 | Nomura Home Equity Loan Inc Home Equity Loan Trust Series 2006-WF1 M4(a) | US0001M + 0.555% | 5.4000 | 03/25/36 | 1,161,849 | |||||||||
| 3,126,335 | NovaStar Mortgage Funding Trust Series 2003-1 Series 2003-1 M2(a) | US0001M + 3.000% | 7.8450 | 05/25/33 | 2,787,289 | |||||||||
| 5,952,157 | Opteum Mortgage Acceptance Corp Asset Backed Series 2005-5 M1(a) | US0001M + 0.645% | 5.4900 | 12/25/35 | 5,931,777 | |||||||||
| 2,882,613 | Option One Mortgage Loan Trust 2005-5 Series 2005-5 M4(a) | US0001M + 0.870% | 5.7150 | 12/25/35 | 2,190,308 | |||||||||
| 13,635,654 | Option One Mortgage Loan Trust 2007-CP1 Series 2007-CP1 M1(a) | US0001M + 0.300% | 5.1450 | 03/25/37 | 11,407,780 | |||||||||
| 2,294,830 | Ownit Mortgage Loan Trust Series 2006-3 Series 2006-3 M1(a) | US0001M + 0.495% | 5.3400 | 03/25/37 | 2,144,037 | |||||||||
| 3,390,521 | Park Place Securities Inc Asset-Backed Series 2004-WHQ2 M7(a) | US0001M + 2.625% | 7.4700 | 02/25/35 | 2,131,104 | |||||||||
| 3,660,629 | Park Place Securities Inc Asset-Backed Series 2005-WHQ3 M7(a) | US0001M + 1.800% | 6.6450 | 06/25/35 | 3,897,351 | |||||||||
| 17,903,426 | Park Place Securities Inc Asset-Backed Series 2005-WHQ4 M4(a) | US0001M + 0.915% | 5.7600 | 09/25/35 | 13,554,366 | |||||||||
| 3,822,139 | Park Place Securities Inc Asset-Backed Series 2005-WCW1 M5(a) | US0001M + 0.990% | 5.8350 | 09/25/35 | 3,286,762 | |||||||||
| 8,503,714 | Popular A.B.S Mortgage Pass-Through Trust 2007-A Series 2007-A M1(a) | US0001M + 0.310% | 5.1550 | 06/25/47 | 7,156,086 | |||||||||
| 5,984,900 | Quest Trust Series 2005-X1 M5(a),(b) | US0001M + 3.375% | 8.2200 | 03/25/35 | 5,235,194 | |||||||||
| 4,565,336 | RAAC Series 2006-RP2 Trust Series 2006-RP2 M2(a),(b) | US0001M + 1.250% | 6.0950 | 02/25/37 | 3,624,893 | |||||||||
See accompanying notes to consolidated financial statements.
33
| ALPHACENTRIC INCOME OPPORTUNITIES FUND (IOFAX, IOFCX, IOFIX) |
| SCHEDULE OF INVESTMENTS (Continued) |
| March 31, 2023 |
| Principal Amount ($) | Spread | Coupon Rate (%) | Maturity | Fair Value | ||||||||||
| NON-AGENCY RESIDENTIAL MORTGAGE BACKED SECURITIES — 106.4% (Continued) | ||||||||||||||
| 14,328,547 | RAAC Series 2007-SP3 Trust Series 2007-SP3 M1(a) | US0001M + 2.250% | 7.0950 | 09/25/47 | $ | 11,298,463 | ||||||||
| 1,414,661 | RAMP Series 2004-RS7 Trust Series 2004-RS7 A3(c) | 4.3070 | 07/25/34 | 1,287,409 | ||||||||||
| 3,356,660 | RAMP Series 2005-RS8 Trust Series 2005-RS8 M4(a) | US0001M + 0.600% | 5.7450 | 09/25/35 | 2,631,877 | |||||||||
| 2,490,795 | RAMP Series 2006-RS1 Trust Series 2006-RS1 M1(a) | US0001M + 0.410% | 5.4600 | 01/25/36 | 2,126,007 | |||||||||
| 3,720,282 | RAMP Series 2006-RS4 Trust Series 2006-RS4 M2(a) | US0001M + 0.380% | 5.4150 | 07/25/36 | 3,352,485 | |||||||||
| 1,791,969 | RASC Series 2005-EMX1 Trust Series 2005-EMX1 B(a),(b) | US0001M + 4.500% | 9.3450 | 03/25/35 | 1,505,550 | |||||||||
| 2,772,672 | RASC Series 2005-KS1 Trust Series 2005-KS1 M4(a) | US0001M + 1.250% | 6.7200 | 02/25/35 | 2,281,036 | |||||||||
| 6,487,956 | RASC Series 2005-KS12 Trust Series 2005-KS12 M5(a) | US0001M + 0.670% | 5.8500 | 01/25/36 | 5,417,149 | |||||||||
| 1,407,828 | RASC Series 2005-KS2 Trust Series 2005-KS2 M3(a) | US0001M + 0.770% | 6.0000 | 03/25/35 | 1,381,756 | |||||||||
| 2,976,356 | RASC Series 2006-EMX1 Trust Series 2006-EMX1 M3(a) | US0001M + 0.470% | 5.5500 | 01/25/36 | 2,396,552 | |||||||||
| 1,930,393 | Renaissance Home Equity Loan Trust 2002-1 Series 2002-1 M2(a) | US0001M + 2.925% | 7.7700 | 06/25/32 | 1,575,500 | |||||||||
| 1,229,306 | Renaissance Home Equity Loan Trust 2002-2 Series 2002-2 M2(a) | US0001M + 2.250% | 7.0950 | 08/25/32 | 1,006,818 | |||||||||
| 398,481 | Renaissance Home Equity Loan Trust 2003-2 Series 2003-2 M2F(d) | 4.1500 | 08/25/33 | 333,749 | ||||||||||
| 9,805,997 | Renaissance Home Equity Loan Trust 2005-1 Series 2005-1 M2(d) | 5.4050 | 05/25/35 | 1,561,172 | ||||||||||
| 7,042,012 | Renaissance Home Equity Loan Trust 2005-2 Series 2005-2 M2(d) | 5.1010 | 08/25/35 | 1,722,952 | ||||||||||
| 165,487 | SASCO Mortgage Loan Trust 2003-GEL1 Series 2003-GEL1 M3(a) | US0001M + 4.500% | 9.3450 | 10/25/33 | 145,463 | |||||||||
| 2,309,753 | Saxon Asset Securities Trust 2004-2 Series 2004-2 MF5(d) | 6.0000 | 08/25/35 | 1,593,105 | ||||||||||
| 2,149,653 | Saxon Asset Securities Trust 2005-2 Series 2005-2 M3(a) | US0001M + 0.705% | 5.5500 | 10/25/35 | 1,727,264 | |||||||||
| 5,326,282 | Saxon Asset Securities Trust 2005-4 Series 2005-4 M4(a) | US0001M + 0.930% | 5.7750 | 11/25/37 | 3,951,959 | |||||||||
| 11,163,608 | Saxon Asset Securities Trust 2006-2 Series 2006-2 M3(a) | US0001M + 0.320% | 5.3250 | 09/25/36 | 8,535,250 | |||||||||
| 4,744,354 | Saxon Asset Securities Trust 2007-3 Series 2007-3 1M2(a) | US0001M + 0.900% | 5.7450 | 09/25/47 | 4,446,232 | |||||||||
| 10,935,000 | Saxon Asset Securities Trust 2007-4 Series 2007-4 M1(a),(b) | US0001M + 3.000% | 7.8450 | 12/25/37 | 7,216,447 | |||||||||
| 1,111,432 | Securitized Asset Backed Receivables, LLC Trust Series 2005-FR1 M2(a) | US0001M + 0.975% | 5.8200 | 12/25/34 | 957,297 | |||||||||
| 8,967,469 | Sequoia Mortgage Trust 2004-10 Series 2004-10 XA(c) (e) | 0.0001 | 11/20/34 | 127 | ||||||||||
| 979,698 | Sequoia Mortgage Trust 2004-10 Series 2004-10 B1(a) | US0001M + 0.750% | 5.5110 | 11/20/34 | 673,346 | |||||||||
| 3,544,572 | Soundview Home Loan Trust 2005-1 Series 2005-1 M6(a) | US0001M + 1.950% | 4.4490 | 04/25/35 | 3,380,950 | |||||||||
| 2,025,964 | Soundview Home Loan Trust 2005-3 Series 2005-3 M4(a) | US0001M + 0.990% | 5.8350 | 06/25/35 | 1,895,794 | |||||||||
| 820,530 | Soundview Home Loan Trust 2005-A Series 2005-A M6(a) | US0001M + 1.350% | 6.1950 | 04/25/35 | 820,413 | |||||||||
| 4,542,879 | Soundview Home Loan Trust 2005-OPT1 Series 2005-OPT1 M4(a) | US0001M + 0.825% | 5.6700 | 06/25/35 | 3,240,676 | |||||||||
| 5,321,456 | Soundview Home Loan Trust 2005-OPT1 Series 2005-OPT1 M5(a) | US0001M + 1.050% | 5.8950 | 06/25/35 | 3,406,329 | |||||||||
| 11,128,874 | Soundview Home Loan Trust 2006-1 Series 2006-1 M1(a) | US0001M + 0.615% | 5.4600 | 02/25/36 | 8,642,234 | |||||||||
| 4,210,678 | Specialty Underwriting & Residential Finance Trust Series 2005-BC3 M4(a) | US0001M + 0.975% | 5.8200 | 06/25/36 | 3,291,529 | |||||||||
| 5,326,927 | Specialty Underwriting & Residential Finance Trust Series 2006-AB1 M1(a) | US0001M + 0.585% | 5.0210 | 12/25/36 | 5,458,381 | |||||||||
See accompanying notes to consolidated financial statements.
34
| ALPHACENTRIC INCOME OPPORTUNITIES FUND (IOFAX, IOFCX, IOFIX) |
| SCHEDULE OF INVESTMENTS (Continued) |
| March 31, 2023 |
| Principal Amount ($) | Spread | Coupon Rate (%) | Maturity | Fair Value | ||||||||||
| NON-AGENCY RESIDENTIAL MORTGAGE BACKED SECURITIES — 106.4% (Continued) | ||||||||||||||
| 2,585,266 | Structured Asset Investment Loan Trust 2004-10 Series 2004-10 M7(a) | US0001M + 3.750% | 8.5950 | 11/25/34 | $ | 2,987,004 | ||||||||
| 3,049,179 | Structured Asset Investment Loan Trust 2005-HE2 Series 2005-HE2 M3(a) | US0001M + 0.780% | 5.6250 | 07/25/35 | 2,627,120 | |||||||||
| 2,113,702 | Structured Asset Investment Loan Trust 2005-HE3 Series 2005-HE3 M3(a) | US0001M + 0.795% | 5.6400 | 09/25/35 | 1,672,392 | |||||||||
| 100,040 | Structured Asset Mortgage Investments II Trust Series 2004-AR5 1A2(c) | 3.0390 | 10/19/34 | 83,123 | ||||||||||
| 1,687,735 | Structured Asset Mortgage Investments II Trust Series 2005-AR5 B1(a) | US0001M + 0.750% | 5.5110 | 07/19/35 | 1,442,344 | |||||||||
| 998,996 | Structured Asset Mortgage Investments Trust Series 2002-AR4 A2(a) | US0001M + 0.825% | 5.5860 | 02/19/33 | 787,072 | |||||||||
| 2,480,290 | Structured Asset Securities Corp 2005-NC1 Series 2005-NC1 M6(a) | US0001M + 1.950% | 4.8120 | 02/25/35 | 2,425,814 | |||||||||
| 478,047 | Structured Asset Securities Corp 2005-WF1 Series 2005-WF1 M7(a) | US0001M + 1.905% | 6.7500 | 02/25/35 | 458,998 | |||||||||
| 5,245,780 | Structured Asset Securities Corp Mortgage Loan Series 2006-GEL4 M2(a),(b) | US0001M + 0.645% | 5.4900 | 10/25/36 | 5,244,945 | |||||||||
| 9,415,856 | Structured Asset Securities Corp Mortgage Loan Series 2006-W1A M1(a),(b) | US0001M + 0.300% | 5.1450 | 08/25/46 | 9,224,257 | |||||||||
| 240,275 | Thornburg Mortgage Securities Trust 2004-2 Series 2004-2 B2(a) | US0001M + 1.000% | 5.8450 | 06/25/44 | 178,147 | |||||||||
| 757,000 | Truman Capital Mortgage Loan Trust Series 2005-1 M3(a),(b) | US0001M + 5.250% | 10.0950 | 03/25/37 | 666,712 | |||||||||
| 626,595 | WaMu Mortgage Pass-Through Certificates Series 2003-AR10 B2(c) | 4.2330 | 10/25/33 | 451,849 | ||||||||||
| 104,292 | WaMu Mortgage Pass-Through Certificates Series 2002-AR17 2B1(a) | COF 11 + 1.250% | 3.9360 | 11/25/42 | 95,490 | |||||||||
| 2,331,185 | Washington Mutural Asset-Backed Certificates WMABS Series 2006-HE1 M2(a) | US0001M + 0.540% | 5.3850 | 04/25/36 | 2,117,285 | |||||||||
| 12,646,822 | Wells Fargo Home Equity Asset-Backed Securities Series 2006-3 M2(a) | US0001M + 0.405% | 5.2500 | 01/25/37 | 12,670,321 | |||||||||
| TOTAL NON-AGENCY RESIDENTIAL MORTGAGE BACKED SECURITIES (Cost $528,285,202) | 659,307,499 | |||||||||||||
| TOTAL INVESTMENTS - 106.4% (Cost $528,285,202) | $ | 659,307,499 | ||||||||||||
| LIABILITIES IN EXCESS OF OTHER ASSETS - (6.4)% | (39,885,718 | ) | ||||||||||||
| NET ASSETS - 100.0% | $ | 619,421,781 | ||||||||||||
| LLC | - Limited Liability Company |
| REMIC | - Real Estate Mortgage Investment Conduit |
| COF 11 | Cost of Funds for the 11th District of San Francisco |
| US0001M | ICE LIBOR USD 1 Month |
| US0006M | ICE LIBOR USD 6 Month |
| US0012M | ICE LIBOR USD 12 Month |
| (a) | Floating rate security, the interest rate of which adjusts periodically based on changes in current interest rates and prepayments on the underlying pool of assets. |
| (b) | Security exempt from registration under Rule 144A or Section 4(2) of the Securities Act of 1933. The security may be resold in transactions exempt from registration, normally to qualified institutional buyers. As of March 31, 2023, the total market value of 144A securities is 120,738,546 or 19.5% of net assets. |
| (c) | Variable rate security: the rate shown represents the rate on March 31, 2023. |
| (d) | Step bond. Coupon rate is fixed rate that changes on a specified date. The rate shown is the current rate at March 31, 2023. |
| (e) | Illiquid security. Total illiquid securities represents 0.0% of net assets as of March 31, 2023. |
See accompanying notes to consolidated financial statements.
35
| ALPHACENTRIC PREMIUM OPPORTUNITY FUND (HMXAX, HMXCX, HMXIX) |
| SCHEDULE OF INVESTMENTS |
| March 31, 2023 |
| Principal Amount ($) | Coupon Rate (%) | Maturity | Fair Value | |||||||||
| U.S. GOVERNMENT & AGENCIES — 44.0% | ||||||||||||
| U.S. TREASURY BILLS — 44.0% | ||||||||||||
| 20,611,000 | United States Treasury Note | 0.3750 | 10/31/23 | $ | 20,098,704 | |||||||
| 20,000,000 | United States Treasury Note | 0.2500 | 03/15/24 | 19,186,826 | ||||||||
| TOTAL U.S. GOVERNMENT & AGENCIES (Cost $39,158,297) | 39,285,530 | |||||||||||
| Shares | Fair Value | |||||||||||
| SHORT-TERM INVESTMENTS — 27.6% | ||||||||||||
| MONEY MARKET FUNDS – 27.6% | ||||||||||||
| 3,969,832 | Fidelity Government Portfolio, Class I, 4.71%(a) (h) | 3,969,832 | ||||||||||
| 20,651,506 | First American Government Obligations Fund, Class U, 4.66%(a) | 20,651,506 | ||||||||||
| TOTAL MONEY MARKET FUNDS (Cost $24,621,338) | 24,621,338 | |||||||||||
| TOTAL SHORT-TERM INVESTMENTS (Cost $24,621,338) | 24,621,338 | |||||||||||
| Contracts(c) | Broker/Counterparty | Expiration Date | Exercise Price | Notional Value | Fair Value | |||||||||||||||
| INDEX OPTIONS PURCHASED - 0.0% (d) | ||||||||||||||||||||
| CALL OPTIONS PURCHASED - 0.0%(d) | ||||||||||||||||||||
| 94 | Chicago Board Options Exchange VIX (g) | IB | 05/17/2023 | $ | 45 | $ | 423,000 | $ | 3,619 | |||||||||||
| 600 | Chicago Board Options Exchange VIX (g) | IB | 06/21/2023 | 50 | 3,000,000 | 29,700 | ||||||||||||||
| TOTAL CALL OPTIONS PURCHASED (Cost - $34,487) | 33,319 | |||||||||||||||||||
| TOTAL INDEX OPTIONS PURCHASED (Cost - $34,487) | 33,319 | |||||||||||||||||||
| Contracts(b) | Broker/Counterparty | Expiration Date | Exercise Price | Notional Value | Fair Value | |||||||||||||||
| FUTURE OPTIONS PURCHASED - 1.1% | ||||||||||||||||||||
| CALL OPTIONS PURCHASED - 1.1% | ||||||||||||||||||||
| 55 | S&P Emini 3rd Week | SXM | 04/21/2023 | $ | 4,230 | $ | 11,632,500 | $ | 65,312 | |||||||||||
| 75 | S&P Emini 3rd Week | SXM | 05/19/2023 | 4,240 | 15,900,000 | 197,812 | ||||||||||||||
| 150 | S&P500 Emini Option | SXM | 04/28/2023 | 4,300 | 32,250,000 | 101,250 | ||||||||||||||
See accompanying notes to consolidated financial statements.
36
| ALPHACENTRIC PREMIUM OPPORTUNITY FUND (HMXAX, HMXCX, HMXIX) |
| SCHEDULE OF INVESTMENTS (Continued) |
| March 31, 2023 |
| Contracts(b) | Broker/Counterparty | Expiration Date | Exercise Price | Notional Value | Fair Value | |||||||||||||||
| FUTURE OPTIONS PURCHASED - 1.1% (Continued) | ||||||||||||||||||||
| CALL OPTIONS PURCHASED - 1.1% (Continued) | ||||||||||||||||||||
| 150 | S&P500 Emini Option | SXM | 05/31/2023 | $ | 4,200 | $ | 31,500,000 | $ | 594,376 | |||||||||||
| TOTAL CALL OPTIONS PURCHASED (Cost - $813,683) | 958,750 | |||||||||||||||||||
| TOTAL FUTURE OPTIONS PURCHASED (Cost - $813,683) | 958,750 | |||||||||||||||||||
| TOTAL INVESTMENTS – 72.7% (Cost $64,627,805) | $ | 64,898,937 | ||||||||||||||||||
| CALL OPTIONS WRITTEN - (1.0)% (Proceeds - $860,008) | (853,788 | ) | ||||||||||||||||||
| PUT OPTIONS WRITTEN – (0.0)% (e) (Proceeds - $10,875) | (2,250 | ) | ||||||||||||||||||
| OTHER ASSETS IN EXCESS OF LIABILITIES – 28.3% | 25,170,134 | |||||||||||||||||||
| NET ASSETS - 100.0% | $ | 89,213,033 | ||||||||||||||||||
| Contracts(b) | Counterparty | Expiration Date | Exercise Price | Notional Value | Fair Value | |||||||||||||||
| WRITTEN FUTURE OPTIONS - (1.0)% | ||||||||||||||||||||
| CALL OPTIONS WRITTEN- (1.0)% | ||||||||||||||||||||
| 75 | Emini SP M Week Option | SXM | 04/03/2023 | $ | 4,165 | $ | 15,618,750 | $ | 19,687 | |||||||||||
| 75 | Emini SP W Week Option | SXM | 04/05/2023 | 4,210 | 15,787,500 | 12,188 | ||||||||||||||
| 25 | S&P Emini 3rd Week | SXM | 04/21/2023 | 4,350 | 5,437,500 | 4,938 | ||||||||||||||
| 170 | S&P Emini 3rd Week | SXM | 04/21/2023 | 4,450 | 37,825,000 | 7,225 | ||||||||||||||
| 75 | S&P Emini 3rd Week | SXM | 05/19/2023 | 4,325 | 16,218,750 | 95,625 | ||||||||||||||
| 150 | S&P Emini 3rd Week | SXM | 05/19/2023 | 4,425 | 33,187,500 | 69,375 | ||||||||||||||
| 100 | S&P EMINI Thurs Week | SXM | 04/06/2023 | 4,260 | 21,300,000 | 5,000 | ||||||||||||||
| 300 | S&P500 Emini Option | SXM | 04/28/2023 | 4,400 | 66,000,000 | 51,000 | ||||||||||||||
| 300 | S&P500 Emini Option | SXM | 05/31/2023 | 4,300 | 64,500,000 | 588,750 | ||||||||||||||
| TOTAL CALL OPTIONS WRITTEN (Proceeds - $860,008) | 853,788 | |||||||||||||||||||
| PUT OPTIONS WRITTEN – (0.0)%(e) | ||||||||||||||||||||
| 150 | Emini SP M Week Option | SXM | 04/03/2023 | $ | 3,730 | $ | 27,975,000 | $ | 750 | |||||||||||
| 150 | Emini SP W Week Option | SXM | 04/05/2023 | 3,765 | 28,237,500 | 1,500 | ||||||||||||||
| TOTAL PUT OPTIONS WRITTEN (Proceeds - $10,875) | 2,250 | |||||||||||||||||||
| TOTAL FUTURE OPTIONS WRITTEN (Proceeds - $870,883) | $ | 856,038 | ||||||||||||||||||
| OPEN FUTURES CONTRACTS | ||||||||||||||
| Number of | Value and Unrealized | |||||||||||||
| Contracts | Open Long Futures Contracts | Expiration | Notional Amount(f) | Appreciation | ||||||||||
| 7 | CME E-Mini NASDAQ 100 Index Future | 06/16/2023 | $ | 1,862,252 | $ | 128,688 | ||||||||
| 28 | CME E-mini Russell 2000 Index Futures | 06/16/2023 | 2,538,900 | 36,110 | ||||||||||
| 165 | CME E-Mini Standard & Poor’s 500 Index Future | 06/16/2023 | 34,136,438 | 1,634,560 | ||||||||||
| TOTAL OPEN LONG FUTURES CONTRACTS | $ | 1,799,358 | ||||||||||||
See accompanying notes to consolidated financial statements.
37
| ALPHACENTRIC PREMIUM OPPORTUNITY FUND (HMXAX, HMXCX, HMXIX) |
| SCHEDULE OF INVESTMENTS (Continued) |
| March 31, 2023 |
| OPEN FUTURES CONTRACTS | ||||||||||||||
| Number of | Value and Unrealized | |||||||||||||
| Contracts | Open Short Futures Contracts | Expiration | Notional Amount(f) | Appreciation (Depreciation) | ||||||||||
| 100 | CBOE Volatility Index Future | 04/19/2023 | $ | 2,076,420 | $ | 235,330 | ||||||||
| 20 | CBOE Volatility Index Future | 05/17/2023 | 442,570 | (570 | ) | |||||||||
| TOTAL OPEN SHORT FUTURES CONTRACTS | $ | 234,760 | ||||||||||||
| TOTAL FUTURES CONTRACTS | $ | 2,034,118 | ||||||||||||
| IB | Interactive Brokers |
| SXM | StoneX Financial Inc. |
| (a) | Rate disclosed is the seven day effective yield as of March 31, 2023. |
| (b) | Each contract is equivalent to one futures contract. |
| (c) | Each option contract allows the holder of the option to purchase or sell 100 shares of the underlying security. |
| (d) | Percentage rounds to less than 0.1%. |
| (e) | Percentage rounds to greater than (0.1)%. |
| (f) | The amounts shown are the underlying reference notional amounts to stock exchange indices and equities upon which the fair value of the futures contracts held by the Fund are based. Notional values do not represent the current fair value of, and are not necessarily indicative of the future cash flows of the Fund’s futures contracts. Further, the underlying price changes in relation to the variables specified by the notional values affects the fair value of these derivative financial instruments. The notional values as set forth within this schedule do not purport to represent economic value at risk to the Fund. |
| (g) | Illiquid security. Total illiquid securities represents (0.0)% of net assets as of March 31, 2023. |
| (h) | All or a portion of this investment is segregated as collateral for option contracts and future contracts. |
See accompanying notes to consolidated financial statements.
38
| ALPHACENTRIC ROBOTICS AND AUTOMATION FUND (GNXAX, GNXCX, GNXIX) |
| SCHEDULE OF INVESTMENTS |
| March 31, 2023 |
| Shares | Fair Value | |||||||
| COMMON STOCKS — 97.4% | ||||||||
| AEROSPACE & DEFENSE - 4.3% | ||||||||
| 15,000 | AeroVironment, Inc.(a),(b) | $ | 1,374,900 | |||||
| BIOTECH & PHARMA - 2.4% | ||||||||
| 40,000 | Bioxcel Therapeutics, Inc.(a),(b) | 746,400 | ||||||
| ELECTRICAL EQUIPMENT - 5.9% | ||||||||
| 35,000 | Allied Motion Technologies, Inc. | 1,352,750 | ||||||
| 10,000 | Renishaw plc | 505,064 | ||||||
| 1,857,814 | ||||||||
| HEALTH CARE FACILITIES & SERVICES - 0.6% | ||||||||
| 35,000 | Nano-X Imaging Ltd.(a),(b) | 201,950 | ||||||
| MACHINERY - 39.8% | ||||||||
| 35,000 | ATS Corporation(a) | 1,465,498 | ||||||
| 60,000 | Daifuku Company Ltd. | 1,104,039 | ||||||
| 50,000 | FANUC Corporation | 1,792,614 | ||||||
| 22,500,000 | FBR Ltd.(a) | 511,432 | ||||||
| 30,000 | GEA Group A.G. | 1,365,116 | ||||||
| 5,000 | Kardex Holding A.G. | 1,082,227 | ||||||
| 2,500 | Keyence Corporation | 1,213,592 | ||||||
| 25,000 | KION Group A.G. | 965,669 | ||||||
| 500,000 | Knightscope, Inc.(a),(b) | 445,450 | ||||||
| 500,000 | Kraken Robotics, Inc. (a),(b) | 192,376 | ||||||
| 10,000 | Krones A.G. | 1,179,087 | ||||||
| 125,000 | Scott Technology Ltd. | 217,351 | ||||||
| 25,000 | Yaskawa Electric Corporation | 1,086,490 | ||||||
| 12,620,941 | ||||||||
| MEDICAL EQUIPMENT & DEVICES - 25.7% | ||||||||
| 350,000 | Accuray, Inc.(a),(b) | 1,039,500 | ||||||
| 500,000 | Asensus Surgical, Inc.(a),(b) | 329,000 | ||||||
| 5,000 | Intuitive Surgical, Inc.(a) | 1,277,350 | ||||||
| 100,000 | Microbot Medical, Inc.(a) | 208,000 | ||||||
| 50,000 | PROCEPT BioRobotics Corporation(a),(b) | 1,420,000 | ||||||
| 25,000 | Siemens Healthineers A.G. | 1,437,792 | ||||||
See accompanying notes to consolidated financial statements.
39
| ALPHACENTRIC ROBOTICS AND AUTOMATION FUND (GNXAX, GNXCX, GNXIX) |
| SCHEDULE OF INVESTMENTS (Continued) |
| March 31, 2023 |
| Shares | Fair Value | |||||||
| COMMON STOCKS — 97.4% (Continued) | ||||||||
| MEDICAL EQUIPMENT & DEVICES - 25.7% (Continued) | ||||||||
| 50,000 | Smith & Nephew plc | $ | 692,088 | |||||
| 550,000 | Stereotaxis, Inc.(a),(b) | 1,122,000 | ||||||
| 175,000 | Vicarious Surgical, Inc.(a),(b) | 397,250 | ||||||
| 65,000 | ViewRay, Inc.(a),(b) | 224,900 | ||||||
| 8,147,880 | ||||||||
| SEMICONDUCTORS - 5.2% | ||||||||
| 40,000 | Infineon Technologies A.G. | 1,634,884 | ||||||
| SOFTWARE - 9.2% | ||||||||
| 25,000 | Mobileye Global, Inc., Class A(a),(b) | 1,081,750 | ||||||
| 15,000 | Omnicell, Inc.(a) | 880,050 | ||||||
| 2,500 | Synopsys, Inc.(a) | 965,625 | ||||||
| 2,927,425 | ||||||||
| TECHNOLOGY HARDWARE - 4.3% | ||||||||
| 500,000 | Draganfly, Inc.(a),(b) | 640,000 | ||||||
| 250,000 | Nano Dimension Ltd. - ADR(a),(b) | 722,500 | ||||||
| 1,362,500 | ||||||||
| TOTAL COMMON STOCKS (Cost $30,571,670) | 30,874,694 | |||||||
See accompanying notes to consolidated financial statements.
40
| ALPHACENTRIC ROBOTICS AND AUTOMATION FUND (GNXAX, GNXCX, GNXIX) |
| SCHEDULE OF INVESTMENTS (Continued) |
| March 31, 2023 |
| Shares | Fair Value | |||||||
| SHORT-TERM INVESTMENTS — 30.4% | ||||||||
| INVESTMENT PURCHASED AS SECURITIES LENDING COLLATERAL – 28.0% | ||||||||
| 8,876,379 | Mount Vernon Liquid Assets Portfolio, 4.93% (c) (d) | $ | 8,876,379 | |||||
| MONEY MARKET FUND - 2.4% | ||||||||
| 771,378 | First American Government Obligations Fund, Class U, 4.66% (d) | 771,378 | ||||||
| TOTAL SHORT-TERM INVESTMENTS (Cost $9,647,757) | 9,647,757 | |||||||
| TOTAL INVESTMENTS - 127.8% (Cost $40,219,427) | $ | 40,522,451 | ||||||
| LIABILITIES IN EXCESS OF OTHER ASSETS - (27.8)% | (8,809,457 | ) | ||||||
| NET ASSETS - 100.0% | $ | 31,712,994 | ||||||
| ADR | - American Depositary Receipt |
| LTD | - Limited Company |
| PLC | - Public Limited Company |
| (a) | - Non-income producing security. |
| (b) | - All or a portion of the security is on loan. The total value of the securities on loan as of March 31, 2023 was $8,502,383. |
| (c) | - Security was purchased with cash received as collateral for securities on loan at March 31, 2023. Total collateral had a value of $8,876,379 at March 31, 2023. |
| (d) | - Rate disclosed is the seven day effective yield as of March 31, 2023. |
See accompanying notes to consolidated financial statements.
41
| ALPHACENTRIC SYMMETRY STRATEGY FUND (SYMAX, SYMCX, SYMIX) |
| CONSOLIDATED SCHEDULE OF INVESTMENTS |
| March 31, 2023 |
| Shares | Fair Value | |||||||
| COMMON STOCKS — 29.6% | ||||||||
| BEVERAGES - 1.0% | ||||||||
| 3,892 | Coca-Cola Company (The) | $ | 241,421 | |||||
| 1,469 | PepsiCo, Inc. | 267,798 | ||||||
| 509,219 | ||||||||
| BIOTECH & PHARMA – 1.9% | ||||||||
| 1,679 | AbbVie, Inc. | 267,582 | ||||||
| 982 | Amgen, Inc. | 237,399 | ||||||
| 3,479 | Bristol-Myers Squibb Company | 241,129 | ||||||
| 1,577 | Johnson & Johnson | 244,435 | ||||||
| 990,545 | ||||||||
| CHEMICALS - 1.7% | ||||||||
| 200 | Albemarle Corporation | 44,208 | ||||||
| 2,355 | CF Industries Holdings, Inc. | 170,714 | ||||||
| 1,930 | Dow, Inc. | 105,803 | ||||||
| 1,247 | LyondellBasell Industries N.V., Class A | 117,081 | ||||||
| 7,026 | Mosaic Company (The) | 322,352 | ||||||
| 801 | Westlake Corporation | 92,900 | ||||||
| 853,058 | ||||||||
| COMMERCIAL SUPPORT SERVICES - 0.5% | ||||||||
| 1,933 | Republic Services, Inc. | 261,380 | ||||||
| FOOD - 1.8% | ||||||||
| 3,495 | General Mills, Inc. | 298,683 | ||||||
| 1,128 | Hershey Company (The) | 286,974 | ||||||
| 3,546 | Kellogg Company | 237,440 | ||||||
| 1,399 | Tyson Foods, Inc., Class A | 82,989 | ||||||
| 906,086 | ||||||||
| HEALTH CARE FACILITIES & SERVICES - 2.3% | ||||||||
| 1,652 | AmerisourceBergen Corporation | 264,502 | ||||||
| 1,251 | Cigna Group (The) | 319,667 | ||||||
| 1,281 | CVS Health Corporation | 95,191 | ||||||
| 731 | McKesson Corporation | 260,273 | ||||||
| 520 | UnitedHealth Group, Inc. | 245,747 | ||||||
| 1,185,380 | ||||||||
See accompanying notes to consolidated financial statements.
42
| ALPHACENTRIC SYMMETRY STRATEGY FUND (SYMAX, SYMCX, SYMIX) |
| CONSOLIDATED SCHEDULE OF INVESTMENTS (Continued) |
| March 31, 2023 |
| Shares | Fair Value | |||||||
| COMMON STOCKS — 29.6% (Continued) | ||||||||
| INSURANCE - 3.4% | ||||||||
| 3,905 | Aflac, Inc. | $ | 251,951 | |||||
| 4,351 | American International Group, Inc. | 219,116 | ||||||
| 2,319 | Globe Life, Inc. | 255,137 | ||||||
| 1,793 | Hartford Financial Services Group, Inc. (The) | 124,954 | ||||||
| 1,977 | MetLife, Inc. | 114,547 | ||||||
| 1,518 | Principal Financial Group, Inc. | 112,818 | ||||||
| 2,108 | Progressive Corporation (The) | 301,571 | ||||||
| 720 | Travelers Companies, Inc. (The) | 123,415 | ||||||
| 3,790 | W R Berkley Corporation | 235,965 | ||||||
| 1,739,474 | ||||||||
| METALS & MINING - 0.5% | ||||||||
| 4,758 | Cleveland-Cliffs, Inc.(a) | 87,214 | ||||||
| 4,208 | Teck Resources Ltd., Class B | 153,592 | ||||||
| 240,806 | ||||||||
| OIL & GAS PRODUCERS - 12.2% | ||||||||
| 3,324 | Antero Resources Corporation(a) | 76,751 | ||||||
| 11,062 | APA Corporation | 398,896 | ||||||
| 1,879 | Canadian Natural Resources Ltd. | 104,003 | ||||||
| 16,258 | Cenovus Energy, Inc. | 283,865 | ||||||
| 1,404 | Chevron Corporation | 229,077 | ||||||
| 4,111 | ConocoPhillips | 407,852 | ||||||
| 16,728 | Coterra Energy, Inc. | 410,505 | ||||||
| 820 | Devon Energy Corporation | 41,500 | ||||||
| 2,744 | Diamondback Energy, Inc. | 370,906 | ||||||
| 1,231 | EOG Resources, Inc. | 141,110 | ||||||
| 6,513 | EQT Corporation | 207,830 | ||||||
| 4,235 | Exxon Mobil Corporation | 464,410 | ||||||
| 381 | Hess Corporation | 50,422 | ||||||
| 4,265 | HF Sinclair Corporation | 206,341 | ||||||
| 5,154 | Imperial Oil Ltd. | 261,875 | ||||||
| 10,631 | Marathon Oil Corporation | 254,719 | ||||||
| 4,609 | Marathon Petroleum Corporation | 621,430 | ||||||
| 5,663 | Occidental Petroleum Corporation | 353,541 | ||||||
| 2,045 | Ovintiv, Inc. | 73,784 | ||||||
See accompanying notes to consolidated financial statements.
43
| ALPHACENTRIC SYMMETRY STRATEGY FUND (SYMAX, SYMCX, SYMIX) |
| CONSOLIDATED SCHEDULE OF INVESTMENTS (Continued) |
| March 31, 2023 |
| Shares | Fair Value | |||||||
| COMMON STOCKS — 29.6% (Continued) | ||||||||
| OIL & GAS PRODUCERS - 12.2% (Continued) | ||||||||
| 3,693 | Phillips 66 | $ | 374,396 | |||||
| 1,247 | Pioneer Natural Resources Company | 254,687 | ||||||
| 15,712 | Southwestern Energy Company(a) | 78,560 | ||||||
| 3,883 | Valero Energy Corporation | 542,067 | ||||||
| 6,208,527 | ||||||||
| RENEWABLE ENERGY - 0.1% | ||||||||
| 166 | Enphase Energy, Inc.(a) | 34,906 | ||||||
| RETAIL - DISCRETIONARY - 1.2% | ||||||||
| 835 | AutoNation, Inc.(a) | 112,191 | ||||||
| 504 | Avis Budget Group, Inc.(a) | 98,179 | ||||||
| 1,545 | Builders FirstSource, Inc.(a) | 137,165 | ||||||
| 1,510 | Genuine Parts Company | 252,638 | ||||||
| 600,173 | ||||||||
| SEMICONDUCTORS - 0.2% | ||||||||
| 901 | Marvell Technology, Inc. | 39,013 | ||||||
| 120 | Monolithic Power Systems, Inc. | 60,065 | ||||||
| 99,078 | ||||||||
| SOFTWARE - 0.1% | ||||||||
| 474 | Datadog, Inc., Class A(a) | 34,441 | ||||||
| STEEL - 0.9% | ||||||||
| 1,851 | Nucor Corporation | 285,924 | ||||||
| 1,413 | Steel Dynamics, Inc. | 159,754 | ||||||
| 445,678 | ||||||||
| TECHNOLOGY HARDWARE - 0.7% | ||||||||
| 16,318 | Hewlett Packard Enterprise Company | 259,946 | ||||||
| 3,417 | HP, Inc. | 100,289 | ||||||
| 360,235 | ||||||||
| TECHNOLOGY SERVICES - 0.4% | ||||||||
| 1,504 | Jack Henry & Associates, Inc. | 226,683 | ||||||
See accompanying notes to consolidated financial statements.
44
| ALPHACENTRIC SYMMETRY STRATEGY FUND (SYMAX, SYMCX, SYMIX) |
| CONSOLIDATED SCHEDULE OF INVESTMENTS (Continued) |
| March 31, 2023 |
| Shares | Fair Value | |||||||
| COMMON STOCKS — 29.6% (Continued) | ||||||||
| TRANSPORTATION & LOGISTICS - 0.2% | ||||||||
| 2,243 | United Airlines Holdings, Inc.(a) | $ | 99,253 | |||||
| WHOLESALE - CONSUMER STAPLES - 0.5% | ||||||||
| 2,971 | Archer-Daniels-Midland Company | 236,670 | ||||||
| TOTAL COMMON STOCKS (Cost $15,262,319) | 15,031,592 | |||||||
| EXCHANGE-TRADED FUNDS — 35.5% | ||||||||
| EQUITY - 18.2% | ||||||||
| 4,930 | Global X MSCI Greece ETF | 149,675 | ||||||
| 21,262 | Invesco Nasdaq 100 ETF | 2,806,797 | ||||||
| 8,749 | Invesco QQQ Trust Series 1 | 2,807,817 | ||||||
| 13,653 | Invesco S&P 500 BuyWrite ETF | 289,444 | ||||||
| 6,655 | iShares MSCI Austria ETF | 134,735 | ||||||
| 5,710 | iShares MSCI Chile ETF | 164,334 | ||||||
| 3,907 | iShares MSCI France ETF | 147,685 | ||||||
| 5,228 | iShares MSCI Germany ETF | 148,789 | ||||||
| 4,754 | iShares MSCI Italy ETF | 144,664 | ||||||
| 2,785 | iShares MSCI Mexico ETF | 165,791 | ||||||
| 3,497 | iShares MSCI Netherlands ETF | 147,573 | ||||||
| 5,527 | iShares MSCI Peru ETF | 168,463 | ||||||
| 289 | iShares MSCI Philippines ETF | 7,791 | ||||||
| 8,240 | iShares MSCI Poland ETF | 127,555 | ||||||
| 5,205 | iShares MSCI Spain ETF | 145,063 | ||||||
| 3,655 | iShares MSCI Sweden ETF | 129,899 | ||||||
| 2,663 | iShares MSCI Switzerland ETF | 120,687 | ||||||
| 2,974 | iShares MSCI Taiwan ETF | 134,811 | ||||||
| 323 | iShares MSCI Thailand ETF | 23,692 | ||||||
| 4,524 | iShares MSCI Turkey ETF | 147,573 | ||||||
| 4,420 | iShares MSCI United Kingdom ETF | 142,589 | ||||||
| 13,912 | JPMorgan BetaBuilders Japan ETF | 673,341 | ||||||
See accompanying notes to consolidated financial statements.
45
| ALPHACENTRIC SYMMETRY STRATEGY FUND (SYMAX, SYMCX, SYMIX) |
| CONSOLIDATED SCHEDULE OF INVESTMENTS (Continued) |
| March 31, 2023 |
| Shares | Fair Value | |||||||||||
| EXCHANGE-TRADED FUNDS — 35.5% (Continued) | ||||||||||||
| EQUITY - 18.2% (Continued) | ||||||||||||
| 8,497 | SPDR S&P International Dividend ETF | $ | 291,277 | |||||||||
| 9,220,045 | ||||||||||||
| FIXED INCOME - 17.3% | ||||||||||||
| 22,066 | Invesco Senior Loan ETF | 458,973 | ||||||||||
| 5,356 | iShares 0-5 Year High Yield Corporate Bond ETF | 223,238 | ||||||||||
| 76,992 | iShares 1-3 Year Treasury Bond ETF | 6,325,663 | ||||||||||
| 4,695 | iShares 3-7 Year Treasury Bond ETF | 552,367 | ||||||||||
| 6,329 | iShares Fallen Angels USD Bond ETF | 159,934 | ||||||||||
| 13,178 | iShares J.P. Morgan EM High Yield Bond ETF | 464,393 | ||||||||||
| 1,291 | iShares JP Morgan USD Emerging Markets Bond ETF | 111,387 | ||||||||||
| 914 | iShares National Muni Bond ETF | 98,474 | ||||||||||
| 1,198 | iShares Trust iShares 1-5 Year Investment Grade | 60,547 | ||||||||||
| 5,278 | iShares US & International High Yield Corp Bond | 226,004 | ||||||||||
| 3,152 | SPDR Blbg Investment Grade Floating Rate ETF | 95,915 | ||||||||||
| 8,776,895 | ||||||||||||
| TOTAL EXCHANGE-TRADED FUNDS (Cost $17,383,635) | 17,996,940 | |||||||||||
| Principal | Coupon Rate | |||||||||||
| Amount ($) | (%) | Maturity | Fair Value | |||||||||
| U.S. GOVERNMENT & AGENCIES — 16.6% | ||||||||||||
| U.S. TREASURY BILLS — 16.6% | ||||||||||||
| 2,000,000 | United States Treasury Bill(b) | 0.000 | 04/13/23 | 1,997,510 | ||||||||
| 1,000,000 | United States Treasury Bill(b) | 0.000 | 04/27/23 | 996,950 | ||||||||
| 3,000,000 | United States Treasury Bill(b) | 0.000 | 06/06/23 | 2,975,818 | ||||||||
| 2,500,000 | United States Treasury Bill(b) | 0.000 | 07/13/23 | 2,467,182 | ||||||||
| TOTAL U.S. GOVERNMENT & AGENCIES (Cost $8,441,486) | 8,437,460 | |||||||||||
See accompanying notes to consolidated financial statements.
46
| ALPHACENTRIC SYMMETRY STRATEGY FUND (SYMAX, SYMCX, SYMIX) |
| CONSOLIDATED SCHEDULE OF INVESTMENTS (Continued) |
| March 31, 2023 |
| Shares | Fair Value | |||||||
| SHORT-TERM INVESTMENT - 11.1% (Continued) | ||||||||
| MONEY MARKET FUND - 11.1% (Continued) | ||||||||
| 5,650,135 | First American Government Obligations Fund, Class U, 4.66%(c) (e) (Cost $5,650,135) | $ | 5,650,135 | |||||
| TOTAL INVESTMENTS - 92.8% (Cost $46,737,575) | $ | 47,116,127 | ||||||
| OTHER ASSETS IN EXCESS OF LIABILITIES - 7.2% | 3,657,098 | |||||||
| NET ASSETS - 100.0% | $ | 50,773,225 | ||||||
OPEN FUTURES CONTRACTS
| Number of | Value and Unrealized | |||||||||||||
| Contracts | Open Long Futures Contracts | Expiration | Notional Amount(d) | Appreciation (Depreciation) | ||||||||||
| 31 | 3 Month Euro Euribor Future | 03/17/2025 | $ | 8,161,080 | $ | 3,327 | ||||||||
| 22 | CBOT Corn Future(e) | 07/14/2023 | 699,600 | 11,275 | ||||||||||
| 15 | CBOT Soybean Future(e) | 05/12/2023 | 1,128,862 | (16,150 | ) | |||||||||
| 10 | CBOT Soybean Future(e) | 07/14/2023 | 737,750 | 12,375 | ||||||||||
| 33 | CME 3 Month Eurodollar Future | 03/17/2025 | 7,978,163 | 26,438 | ||||||||||
| 8 | CME British Pound Currency Future | 06/16/2023 | 617,750 | (1,113 | ) | |||||||||
| 2 | CME E Mini Industrial Select Sector Futures | 06/16/2023 | 205,600 | 5,820 | ||||||||||
| 1 | CME E Mini Technology Select Sector Futures | 06/16/2023 | 153,580 | 14,690 | ||||||||||
| 25 | CME Euro Foreign Exchange Currency Future | 06/16/2023 | 3,407,375 | 80,044 | ||||||||||
| 27 | CME Live Cattle Future(e) | 06/30/2023 | 1,750,870 | 37,460 | ||||||||||
| 22 | CME Swiss Franc Currency Future | 06/16/2023 | 3,033,375 | 48,537 | ||||||||||
| 12 | COMEX Copper Future(e) | 07/27/2023 | 1,230,438 | 14,063 | ||||||||||
| 6 | COMEX Gold 100 Troy Ounces Future(e) | 06/28/2023 | 1,191,720 | (2,670 | ) | |||||||||
| 25 | Montreal Exchange 10 Year Canadian Bond Future | 06/21/2023 | 2,333,669 | 5,742 | ||||||||||
| 44 | Montreal Exchange 3 Month Canadian Bank Acceptance | 09/16/2024 | 7,850,050 | (21,218 | ) | |||||||||
| 45 | Montreal Exchange 3 Month Canadian Bank Acceptance | 03/19/2025 | 8,059,259 | 527 | ||||||||||
| 78 | NYBOT CSC Number 11 World Sugar Future(e) | 05/28/2023 | 1,943,536 | 166,958 | ||||||||||
| 30 | NYBOT CSC Number 11 World Sugar Future(e) | 07/30/2023 | 733,488 | 60,816 | ||||||||||
| 7 | NYMEX Reformulated Gasoline Blendstock for Oxygen(e) | 09/30/2023 | 723,710 | (11,374 | ) | |||||||||
| 28 | Three Month SONIA Index Futures | 12/31/2024 | 8,305,803 | (17,641 | ) | |||||||||
| 2 | TSE Japanese 10 Year Bond Futures | 06/13/2023 | 2,231,277 | (3,243 | ) | |||||||||
| TOTAL OPEN LONG FUTURES CONTRACTS | $ | 414,663 | ||||||||||||
OPEN FUTURES CONTRACTS
| Number of | Value and Unrealized | |||||||||||||
| Contracts | Open Short Futures Contracts | Expiration | Notional Amount(d) | Appreciation (Depreciation) | ||||||||||
| 59 | CBOT 10 Year US Treasury Note | 06/21/2023 | $ | 6,780,359 | $ | (175,914 | ) | |||||||
| 56 | CBOT Corn Future(e) | 05/12/2023 | 1,849,400 | (87,088 | ) | |||||||||
| 50 | CBOT Wheat Future(e) | 05/12/2023 | 1,730,625 | 138,300 | ||||||||||
See accompanying notes to consolidated financial statements.
47
| ALPHACENTRIC SYMMETRY STRATEGY FUND (SYMAX, SYMCX, SYMIX) |
| CONSOLIDATED SCHEDULE OF INVESTMENTS (Continued) |
| March 31, 2023 |
OPEN FUTURES CONTRACTS (Continued)
| Number of | Value and Unrealized | |||||||||||||
| Contracts | Open Short Futures Contracts | Expiration | Notional Amount(d) | Appreciation (Depreciation) | ||||||||||
| 20 | CBOT Wheat Future(e) | 07/14/2023 | $ | 704,500 | $ | 13,500 | ||||||||
| 62 | CME Australian Dollar Currency Future | 06/16/2023 | 4,154,620 | (42,777 | ) | |||||||||
| 57 | CME Canadian Dollar Currency Future | 06/20/2023 | 4,217,430 | (86,868 | ) | |||||||||
| 15 | CME Japanese Yen Currency Future | 06/16/2023 | 1,429,144 | (41,791 | ) | |||||||||
| 7 | COMEX Copper Future(e) | 09/27/2023 | 718,638 | 8,988 | ||||||||||
| 3 | COMEX Gold 100 Troy Ounces Future(e) | 08/29/2023 | 601,230 | (8,160 | ) | |||||||||
| 47 | Eurex 10 Year Euro BUND Future | 06/08/2023 | 6,925,349 | (248,805 | ) | |||||||||
| 54 | Long Gilt Future | 06/28/2023 | 6,884,985 | (184,314 | ) | |||||||||
| 58 | NYMEX Henry Hub Natural Gas Futures(e) | 06/26/2023 | 1,429,600 | 129,940 | ||||||||||
| 26 | NYMEX Henry Hub Natural Gas Futures(e) | 09/29/2023 | 715,000 | 121,260 | ||||||||||
| 23 | NYMEX Light Sweet Crude Oil Future(e) | 06/28/2023 | 1,743,360 | 70,290 | ||||||||||
| 15 | NYMEX NY Harbor ULSD Futures(e) | 06/28/2023 | 1,617,156 | 86,092 | ||||||||||
| 15 | NYMEX Reformulated Gasoline Blendstock for Oxygen(e) | 06/28/2023 | 1,655,560 | (30,677 | ) | |||||||||
| TOTAL OPEN SHORT FUTURES CONTRACTS | $ | (338,024 | ) | |||||||||||
| TOTAL FUTURES CONTRACTS | $ | 76,639 | ||||||||||||
CREDIT DEFAULT SWAPS
| Upfront | ||||||||||||||||||||||||||||
| Fixed | Implied | Frequency | Premiums | Unrealized | ||||||||||||||||||||||||
| Buy/Sell | Rate | Credit | of | Expiration | Notional | Paid/ | Appreciation/ | |||||||||||||||||||||
| Counterparty | Index | Protection | Received | Spread | Payments | Date | Amount | Value | (Received) | (Depreciation) | ||||||||||||||||||
| SOC | Markit CDX North America High Yield Index | Sell | 5.00% | 463.39% | Quarterly | 12/20/2027 | $ | 230,500 | $ | 2,922 | $ | 3,252 | $ | (330 | ) | |||||||||||||
| SOC | Markit CDX North America Investment Grade Index | Sell | 1.00% | 76.17% | Quarterly | 6/20/2028 | 96,500 | 1,121 | 767 | 354 | ||||||||||||||||||
| SOC | Markit iTraxx Europe Index | Sell | 1.00% | 85.22% | Quarterly | 6/20/2028 | 91,000 | 729 | 422 | 307 | ||||||||||||||||||
| SOC | Markit iTraxx Europe Crossover Index | Sell | 5.00% | 440.27% | Quarterly | 6/20/2028 | 208,500 | 5,888 | 2,633 | 3,255 | ||||||||||||||||||
| Net Unrealized Appreciation on Swap Contracts | $ | 7,074 | $ | 3,586 | ||||||||||||||||||||||||
| ETF | - Exchange-Traded Fund |
| LTD | - Limited Company |
| MSCI | - Morgan Stanley Capital International |
| NV | - Naamioze Vennootschap |
| SPDR | - Standard & Poor’s Depositary Receipt |
| SOC | - Societe Generale |
| (a) | Non-income producing security. |
| (b) | Zero coupon bond. |
| (c) | Rate disclosed is the seven day effective yield as of March 31, 2023. |
| (d) | The amounts shown are the underlying reference notional amounts to stock exchange indices and equities upon which the fair value of the futures contracts held by the Fund are based. Notional values do not represent the current fair value of, and are not necessarily indicative of the future cash flows of the Fund’s futures contracts. Further, the underlying price changes in relation to the variables specified by the notional values affects the fair value of these derivative financial instruments. The notional values as set forth within this schedule do not purport to represent economic value at risk to the Fund. |
| (e) | All or a portion of this investment is a holding of the ACSSF Fund Limited. |
See accompanying notes to consolidated financial statements.
48
| ALPHACENTRIC LIFESCI HEALTHCARE FUND (LYFAX, LYFCX, LYFIX) |
| SCHEDULE OF INVESTMENTS |
| March 31, 2023 |
| Shares | Fair Value | |||||||
| COMMON STOCKS — 93.7% | ||||||||
| BIOTECH & PHARMA - 75.7% | ||||||||
| 302,500 | 2seventy bio, Inc.(a) | $ | 3,085,500 | |||||
| 50,000 | ACADIA Pharmaceuticals, Inc.(a) | 941,000 | ||||||
| 760,000 | ADC Therapeutics S.A.(a) | 1,482,000 | ||||||
| 45,000 | Alkermes plc(a) | 1,268,550 | ||||||
| 500,000 | Amarin Corp plc - ADR(a) | 750,000 | ||||||
| 81,000 | Amryt Pharma plc - ADR(a) | 1,180,980 | ||||||
| 7,500 | Amylyx Pharmaceuticals, Inc.(a) | 220,050 | ||||||
| 190,000 | Arcutis Biotherapeutics, Inc.(a) | 2,090,000 | ||||||
| 77,500 | Aurinia Pharmaceuticals, Inc.(a) | 849,400 | ||||||
| 419,500 | BioCryst Pharmaceuticals, Inc.(a) | 3,498,629 | ||||||
| 5,500 | BioMarin Pharmaceutical, Inc.(a) | 534,820 | ||||||
| 15,000 | Celldex Therapeutics, Inc.(a) | 539,700 | ||||||
| 354,500 | Coherus Biosciences, Inc.(a) | 2,424,780 | ||||||
| 49,500 | Collegium Pharmaceutical, Inc.(a) | 1,187,505 | ||||||
| 72,500 | Deciphera Pharmaceuticals, Inc.(a) | 1,120,125 | ||||||
| 107,500 | Dynavax Technologies Corporation(a) | 1,054,575 | ||||||
| 215,000 | Elanco Animal Health, Inc.(a) | 2,021,000 | ||||||
| 33,000 | Exelixis, Inc.(a) | 640,530 | ||||||
| 92,000 | Galapagos N.V. - ADR(a) | 3,554,880 | ||||||
| 8,500 | Gilead Sciences, Inc. | 705,245 | ||||||
| 80,000 | GSK plc - ADR | 2,846,400 | ||||||
| 67,500 | Harmony Biosciences Holdings, Inc.(a) | 2,203,875 | ||||||
| 25,500 | Horizon Therapeutics plc(a) | 2,783,070 | ||||||
| 184,000 | Innoviva, Inc.(a) | 2,070,000 | ||||||
| 84,500 | Insmed, Inc.(a) | 1,440,725 | ||||||
| 25,500 | Intra-Cellular Therapies, Inc.(a) | 1,380,825 | ||||||
| 63,000 | iTeos Therapeutics, Inc.(a) | 857,430 | ||||||
| 7,000 | Jazz Pharmaceuticals plc(a) | 1,024,310 | ||||||
| 240,000 | Karyopharm Therapeutics, Inc.(a) | 933,600 | ||||||
| 82,500 | Kiniksa Pharmaceuticals Ltd.(a) | 887,700 | ||||||
| 185,000 | MorphoSys A.G. - ADR(a) | 730,750 | ||||||
| 15,500 | Neurocrine Biosciences, Inc.(a) | 1,568,910 | ||||||
| 150,000 | Novavax, Inc., Class A(a) | 1,039,500 | ||||||
| 17,897 | Nuvalent, Inc.(a) | 466,933 | ||||||
See accompanying notes to consolidated financial statements.
49
| ALPHACENTRIC LIFESCI HEALTHCARE FUND (LYFAX, LYFCX, LYFIX) |
| SCHEDULE OF INVESTMENTS (Continued) |
| March 31, 2023 |
| Shares | Fair Value | |||||||
| COMMON STOCKS — 93.7% (Continued) | ||||||||
| BIOTECH & PHARMA - 75.7% (Continued) | ||||||||
| 345,000 | Nuvation Bio, Inc.(a) | $ | 572,700 | |||||
| 36,000 | Pacira BioSciences, Inc.(a) | 1,469,160 | ||||||
| 55,000 | Roche Holding A.G. - ADR | 1,972,300 | ||||||
| 10,000 | Sanofi - ADR | 544,200 | ||||||
| 65,000 | Takeda Pharmaceutical Company Ltd. - ADR | 1,071,200 | ||||||
| 32,500 | Taro Pharmaceutical Industries Ltd.(a) | 790,400 | ||||||
| 19,640 | Travere Therapeutics, Inc.(a) | 441,704 | ||||||
| 28,500 | Ultragenyx Pharmaceutical, Inc.(a) | 1,142,850 | ||||||
| 3,500 | United Therapeutics Corporation(a) | 783,860 | ||||||
| 55,000 | Verona Pharma plc - ADR(a) | 1,104,400 | ||||||
| 35,500 | Viridian Therapeutics, Inc.(a) | 903,120 | ||||||
| 60,179,191 | ||||||||
| HEALTH CARE FACILITIES & SERVICES - 8.7% | ||||||||
| 116,500 | AdaptHealth Corporation(a) | 1,448,095 | ||||||
| 50,000 | Centene Corporation(a) | 3,160,500 | ||||||
| 120,000 | DocGo, Inc.(a) | 1,038,000 | ||||||
| 39,500 | Fulgent Genetics, Inc.(a) | 1,233,190 | ||||||
| 6,879,785 | ||||||||
| MEDICAL EQUIPMENT & DEVICES - 6.7% | ||||||||
| 3,400 | Bio-Rad Laboratories, Inc., Class A(a) | 1,628,668 | ||||||
| 27,000 | Inmode Ltd.(a) | 862,920 | ||||||
| 23,000 | Lantheus Holdings, Inc.(a) | 1,898,880 | ||||||
| 4,000 | Medtronic plc | 322,480 | ||||||
| 239,500 | SomaLogic, Inc.(a) | 610,725 | ||||||
| 5,323,673 | ||||||||
| RETAIL - CONSUMER STAPLES - 2.6% | ||||||||
| 95,000 | PetIQ, Inc.(a) | 1,086,800 | ||||||
| 28,000 | Walgreens Boots Alliance, Inc. | 968,240 | ||||||
| 2,055,040 | ||||||||
| TOTAL COMMON STOCKS (Cost $77,052,389) | 74,437,689 | |||||||
See accompanying notes to consolidated financial statements.
50
| ALPHACENTRIC LIFESCI HEALTHCARE FUND (LYFAX, LYFCX, LYFIX) |
| SCHEDULE OF INVESTMENTS (Continued) |
| March 31, 2023 |
| Shares | Fair Value | |||||||
| SHORT-TERM INVESTMENTS — 7.3% | ||||||||
| MONEY MARKET FUNDS - 7.3% | ||||||||
| 1 | Fidelity Government Portfolio, Class I, 4.71%(b) | $ | 1 | |||||
| 5,838,323 | First American Government Obligations Fund, Class U, 4.66%(b) | 5,838,323 | ||||||
| TOTAL SHORT-TERM INVESTMENTS (Cost $5,838,324) | 5,838,324 | |||||||
| TOTAL INVESTMENTS - 101.0% (Cost $82,890,713) | $ | 80,276,013 | ||||||
| LIABILITIES IN EXCESS OF OTHER ASSETS - (1.0)% | (760,164 | ) | ||||||
| NET ASSETS - 100.0% | $ | 79,515,849 | ||||||
| ADR | - American Depositary Receipt |
| LTD | - Limited Company |
| NV | - Naamioze Vennootschap |
| PLC | - Public Limited Company |
| S/A | - Société Anonyme |
| (a) | - Non-income producing security. |
| (b) | - Rate disclosed is the seven day effective yield as of March 31, 2023. |
See accompanying notes to consolidated financial statements.
51
| ALPHACENTRIC SWBC MUNICIPAL OPPORTUNITIES FUND (MUNAX, MUNCX, MUNIX) |
| SCHEDULE OF INVESTMENTS |
| March 31, 2023 |
| Shares | Fair Value | |||||||||||
| CLOSED END FUNDS — 6.7% | ||||||||||||
| FIXED INCOME - 6.7% | ||||||||||||
| 11,242 | MainStay MacKay DefinedTerm Municipal | $ | 195,386 | |||||||||
| 6,550 | Nuveen Municipal Credit Opportunities Fund | 74,736 | ||||||||||
| 8,100 | Nuveen Municipal High Income Opportunity Fund | 87,480 | ||||||||||
| 10,000 | PIMCO Municipal Income Fund | 99,500 | ||||||||||
| 5,000 | PIMCO Municipal Income Fund III | 41,550 | ||||||||||
| 16,500 | Putnam Managed Municipal Income Trust | 101,145 | ||||||||||
| 4,820 | Putnam Municipal Opportunities Trust | 49,935 | ||||||||||
| 649,732 | ||||||||||||
| TOTAL CLOSED END FUNDS (Cost $659,591) | 649,732 | |||||||||||
| EXCHANGE-TRADED FUNDS — 5.2% | ||||||||||||
| FIXED INCOME - 5.2% | ||||||||||||
| 10,000 | SPDR Nuveen Bloomberg High Yield Municipal Bond | 250,400 | ||||||||||
| 4,840 | VanEck High Yield Muni ETF | 250,422 | ||||||||||
| 500,822 | ||||||||||||
| TOTAL EXCHANGE-TRADED FUNDS (Cost $500,186) | 500,822 | |||||||||||
| Principal | Coupon Rate | |||||||||||
| Amount ($) | (%) | Maturity | Fair Value | |||||||||
| MUNICIPAL BONDS — 84.4% | ||||||||||||
| APPROPRIATION — 4.0% | ||||||||||||
| 250,000 | Pataskala Public Library | 5.2500 | 12/01/52 | 271,317 | ||||||||
| 110,000 | Pennsylvania Economic Development Financing | 5.2500 | 06/30/53 | 111,666 | ||||||||
| 382,983 | ||||||||||||
| CHARTER SCHOOLS — 5.0% | ||||||||||||
| 250,000 | Colorado Educational & Cultural Facilities | 5.2500 | 12/01/52 | 263,784 | ||||||||
| 125,000 | District of Columbia | 5.0000 | 07/01/52 | 125,931 | ||||||||
| 100,000 | Utah Charter School Finance Authority | 4.5000 | 10/15/52 | 97,952 | ||||||||
| 487,667 | ||||||||||||
| CITY — 2.9% | ||||||||||||
| 125,000 | City of Chicago IL | 5.5000 | 01/01/43 | 131,818 | ||||||||
| 100,000 | City of Oil City PA | 4.0000 | 12/01/42 | 100,412 | ||||||||
See accompanying notes to consolidated financial statements.
52
| ALPHACENTRIC SWBC MUNICIPAL OPPORTUNITIES FUND (MUNAX, MUNCX, MUNIX) |
| SCHEDULE OF INVESTMENTS (Continued) |
| March 31, 2023 |
| Principal | Coupon Rate | |||||||||||
| Amount ($) | (%) | Maturity | Fair Value | |||||||||
| MUNICIPAL BONDS — 84.4% (Continued) | ||||||||||||
| CITY — 2.9% (Continued) | ||||||||||||
| 50,000 | City of Waukegan IL | 4.0000 | 12/30/37 | $ | 51,141 | |||||||
| 283,371 | ||||||||||||
| COMBINED UTILITIES — 1.7% | ||||||||||||
| 150,000 | South Carolina Public Service Authority | 5.7500 | 12/01/52 | 167,816 | ||||||||
| CONTINUING CARE RETIREMENT CENTER — 9.5% | ||||||||||||
| 200,000 | Florida Development Finance Corporation | 4.0000 | 06/01/55 | 133,092 | ||||||||
| 10,000 | Illinois Finance Authority | 4.0000 | 05/15/35 | 7,925 | ||||||||
| 50,000 | Illinois Finance Authority | 5.0000 | 05/15/56 | 39,012 | ||||||||
| 200,000 | Iowa Finance Authority | 4.0000 | 05/15/53 | 123,688 | ||||||||
| 100,000 | Massachusetts Development Finance Agency | 5.0000 | 07/01/56 | 78,217 | ||||||||
| 100,000 | New Hampshire Business Finance Authority | 5.0000 | 07/01/56 | 76,810 | ||||||||
| 250,000 | New Hope Cultural Education Facilities Finance | 6.8750 | 10/01/57 | 228,815 | ||||||||
| 25,000 | Palm Beach County Health Facilities Authority | 5.0000 | 05/15/47 | 19,025 | ||||||||
| 25,000 | South Carolina Jobs-Economic Development Authority | 5.0000 | 11/15/54 | 21,953 | ||||||||
| 100,000 | Tarrant County Cultural Education Facilities | 5.0000 | 11/15/37 | 101,233 | ||||||||
| 50,000 | Tempe Industrial Development Authority | 6.1250 | 10/01/47 | 31,709 | ||||||||
| 80,000 | Wisconsin Health & Educational Facilities | 4.0000 | 07/01/48 | 62,088 | ||||||||
| 923,567 | ||||||||||||
| ECONOMY & INDUSTRY DEVELOPMENT — 2.3% | ||||||||||||
| 300,000 | New York Liberty Development Corporation | 2.8750 | 11/15/46 | 220,161 | ||||||||
| ELECTRICITY AND PUBLIC POWER — 1.3% | ||||||||||||
| 25,000 | Puerto Rico Electric Power Authority | 5.2500 | 07/01/30 | 25,089 | ||||||||
| 100,000 | Puerto Rico Electric Power Authority | 5.2500 | 07/01/32 | 100,257 | ||||||||
| 125,346 | ||||||||||||
| HIGHER EDUCATION — 9.8% | ||||||||||||
| 200,000 | Collier County Educational Facilities Authority | 5.0000 | 06/01/43 | 192,653 | ||||||||
| 200,000 | Colorado Mountain College | 4.0000 | 12/01/51 | 192,519 | ||||||||
| 200,000 | Michigan Finance Authority | 4.0000 | 02/01/42 | 166,127 | ||||||||
| 100,000 | Michigan Finance Authority | 5.0000 | 05/01/46 | 84,292 | ||||||||
| 300,000 | Ohio Higher Educational Facility Commission | 6.0000 | 09/01/52 | 311,080 | ||||||||
| 946,671 | ||||||||||||
See accompanying notes to consolidated financial statements.
53
| ALPHACENTRIC SWBC MUNICIPAL OPPORTUNITIES FUND (MUNAX, MUNCX, MUNIX) |
| SCHEDULE OF INVESTMENTS (Continued) |
| March 31, 2023 |
| Principal | Coupon Rate | |||||||||||
| Amount ($) | (%) | Maturity | Fair Value | |||||||||
| MUNICIPAL BONDS — 84.4% (Continued) | ||||||||||||
| HOSPITALS — 16.0% | ||||||||||||
| 200,000 | Colorado Health Facilities Authority | 4.0000 | 05/15/52 | $ | 192,080 | |||||||
| 485,000 | Connecticut State Health & Educational Facilities | 3.0000 | 07/01/39 | 393,924 | ||||||||
| 250,000 | Illinois Finance Authority | 5.0000 | 08/15/52 | 266,181 | ||||||||
| 200,000 | Illinois Finance Authority | 6.7500 | 05/15/58 | 204,662 | ||||||||
| 100,000 | Maine Health & Higher Educational Facilities | 5.1250 | 07/01/52 | 105,467 | ||||||||
| 125,000 | Michigan Finance Authority | 4.0000 | 12/01/47 | 119,215 | ||||||||
| 100,000 | Palm Beach County Health Facilities Authority | 5.0000 | 11/01/52 | 98,963 | ||||||||
| 250,000 | South Broward Hospital District | 2.3750 | 05/01/45 | 174,458 | ||||||||
| 1,554,950 | ||||||||||||
| MELLO ROOS — 2.6% | ||||||||||||
| 250,000 | River Islands Public Financing Authority | 4.2500 | 09/01/47 | 253,908 | ||||||||
| MISCELLANEOUS TAX — 1.3% | ||||||||||||
| 25,000 | County of Pasco FL | 5.0000 | 09/01/48 | 26,478 | ||||||||
| 100,000 | Lancaster County Convention Center Authority | 4.7500 | 05/01/57 | 101,976 | ||||||||
| 128,454 | ||||||||||||
| PRIMARY AND SECONDARY EDUCATION — 4.1% | ||||||||||||
| 100,000 | Chicago Board of Education Dedicated Capital | 5.7500 | 04/01/48 | 109,044 | ||||||||
| 295,000 | Lafayette Parish School Board | 4.0000 | 04/01/53 | 288,831 | ||||||||
| 397,875 | ||||||||||||
| SALES TAX — 3.2% | ||||||||||||
| 313,000 | Sales Tax Securitization Corporation | 4.0000 | 01/01/42 | 306,146 | ||||||||
| SCHOOL DISTRICT — 6.9% | ||||||||||||
| 185,000 | Belton Independent School District | 4.0000 | 02/15/52 | 184,849 | ||||||||
| 250,000 | Sands Consolidated Independent School District | 4.0000 | 02/15/53 | 241,361 | ||||||||
| 250,000 | Spring Independent School District | 4.0000 | 08/15/52 | 244,849 | ||||||||
| 671,059 | ||||||||||||
| SINGLE-FAMILY HOUSING — 3.3% | ||||||||||||
| 300,000 | Texas Department of Housing & Community Affairs | 5.1250 | 01/01/48 | 314,679 | ||||||||
| STATE — 0.0%(a) | ||||||||||||
| 1,077 | Commonwealth of Puerto Rico | 5.6250 | 07/01/27 | 1,114 | ||||||||
| 1,059 | Commonwealth of Puerto Rico | 5.6250 | 07/01/29 | 1,107 | ||||||||
See accompanying notes to consolidated financial statements.
54
| ALPHACENTRIC SWBC MUNICIPAL OPPORTUNITIES FUND (MUNAX, MUNCX, MUNIX) |
| SCHEDULE OF INVESTMENTS (Continued) |
| March 31, 2023 |
| Principal | Coupon Rate | |||||||||||
| Amount ($) | (%) | Maturity | Fair Value | |||||||||
| MUNICIPAL BONDS — 84.4% (Continued) | ||||||||||||
| STATE — 0.0%(a) (Continued) | ||||||||||||
| 1,029 | Commonwealth of Puerto Rico | 5.7500 | 07/01/31 | $ | 1,093 | |||||||
| 1,064 | Commonwealth of Puerto Rico | 4.0000 | 07/01/46 | 833 | ||||||||
| 4,147 | ||||||||||||
| STUDENT HOUSING — 0.9% | ||||||||||||
| 100,000 | Hastings Campus Housing Finance Authority | 5.0000 | 07/01/45 | 86,261 | ||||||||
| TAX BACKED DISTRICT — 6.6% | ||||||||||||
| 250,000 | Tarrant County Hospital District | 5.2500 | 08/15/48 | 280,802 | ||||||||
| 100,000 | Tarrant County Hospital District | 4.2500 | 08/15/53 | 99,203 | ||||||||
| 250,000 | Whispering Pines Metropolitan District No 1 | 5.0000 | 12/01/52 | 259,733 | ||||||||
| 639,738 | ||||||||||||
| TAX INCREMENT FINANCING — 2.5% | ||||||||||||
| 250,000 | City of McKinney TX | 4.1250 | 08/15/52 | 243,082 | ||||||||
| TOBACCO — 0.5% | ||||||||||||
| 55,000 | New York Counties Tobacco Trust VI | 3.7500 | 06/01/45 | 43,837 | ||||||||
| TOTAL MUNICIPAL BONDS (Cost $8,621,397) | 8,181,718 | |||||||||||
| Shares | Fair Value | |||||||||||
| SHORT-TERM INVESTMENT — 0.3% | ||||||||||||
| MONEY MARKET FUND - 0.3% | ||||||||||||
| 26,980 | First American Treasury Obligations Fund, Class X, 4.72% (Cost $26,980)(b) | 26,980 | ||||||||||
| TOTAL INVESTMENTS - 96.6% (Cost $9,808,154) | $ | 9,359,252 | ||||||||||
| OTHER ASSETS IN EXCESS OF LIABILITIES - 3.4% | 334,090 | |||||||||||
| NET ASSETS - 100.0% | $ | 9,693,342 | ||||||||||
See accompanying notes to consolidated financial statements.
55
| ALPHACENTRIC SWBC MUNICIPAL OPPORTUNITIES FUND (MUNAX, MUNCX, MUNIX) |
| SCHEDULE OF INVESTMENTS (Continued) |
| March 31, 2023 |
OPEN FUTURES CONTRACTS
| Number of | Value and Unrealized | |||||||||||||
| Contracts | Open Short Futures Contracts | Expiration | Notional Amount(c) | Depreciation | ||||||||||
| 25 | CBOT 10 Year US Treasury Note | 06/21/2023 | $ | 2,873,047 | $ | (74,534 | ) | |||||||
| TOTAL FUTURES CONTRACTS | $ | (74,534 | ) | |||||||||||
CREDIT DEFAULT SWAPS
| Fixed | Implied | Frequency | Premiums | |||||||||||||||||||||||||
| Buy/Sell | Rate | Credit | of | Expiration | Notional | Paid/ | Unrealized | |||||||||||||||||||||
| Counterparty | Index | Protection | Received | Spread | Payments | Date | Amount | Value | (Received) | Appreciation | ||||||||||||||||||
| SOC | Markit CDX North America Investment Grade Index | Sell | 1.00% | 76.17% | Quarterly | 6/20/2028 | $ | 1,422,500 | $ | 16,521 | $ | 11,301 | $ | 5,220 | ||||||||||||||
| SOC | Markit CDX North America High Yield Index | Sell | 5.00% | 463.39% | Quarterly | 12/20/2027 | 1,420,500 | 18,007 | 13,593 | 4,414 | ||||||||||||||||||
| Net Unrealized Appreciation on Swap Contracts | $ | 24,894 | $ | 9,634 | ||||||||||||||||||||||||
| ETF | - Exchange-Traded Fund |
| PLC | - Public Limited Company |
| SPDR | - Standard & Poor’s Depositary Receipt |
| SOC | - Societe Generale |
| (a) | Percentage rounds to less than 0.1%. |
| (b) | Rate disclosed is the seven day effective yield as of March 31, 2023. |
| (c) | The amounts shown are the underlying reference notional amounts to stock exchange indices and equities upon which the fair value of the futures contracts held by the Fund are based. Notional values do not represent the current fair value of, and are not necessarily indicative of the future cash flows of the Fund’s futures contracts. Further, the underlying price changes in relation to the variables specified by the notional values affects the fair value of these derivative financial instruments. The notional values as set forth within this schedule do not purport to represent economic value at risk to the Fund. |
See accompanying notes to consolidated financial statements.
56
| ALPHACENTRIC STRATEGIC INCOME FUND |
| SCHEDULE OF INVESTMENTS |
| March 31, 2023 |
| Shares | Fair Value | |||||||
| COMMON STOCKS — 42.8% | ||||||||
| ASSET MANAGEMENT - 0.3% | ||||||||
| 7,744 | Star Holdings(a) | $ | 134,675 | |||||
| HEALTH CARE REIT - 1.7% | ||||||||
| 11,059 | Welltower, Inc. (h) | 792,820 | ||||||
| HOME CONSTRUCTION - 1.7% | ||||||||
| 3,000 | DR Horton, Inc. | 293,070 | ||||||
| 4,867 | Lennar Corporation, Class A | 511,570 | ||||||
| 804,640 | ||||||||
| MORTGAGE FINANCE - 4.5% | ||||||||
| 37,500 | Annaly Capital Management, Inc. (h) | 716,625 | ||||||
| 118,590 | Dynex Capital, Inc. (h) | 1,437,311 | ||||||
| 2,153,936 | ||||||||
| MORTGAGE REITS - 24.4% | ||||||||
| 92,746 | AGNC Investment Corporation (h) | 934,880 | ||||||
| 200,171 | Ellington Financial, Inc. (h) | 2,444,087 | ||||||
| 173,425 | MFA Financial, Inc. (h) | 1,720,376 | ||||||
| 172,079 | New York Mortgage Trust, Inc. (h) | 1,713,907 | ||||||
| 146,593 | Redwood Trust, Inc. (h) | 988,037 | ||||||
| 491,699 | Rithm Capital Corporation (h) | 3,933,591 | ||||||
| 11,734,878 | ||||||||
| MULTI ASSET CLASS REIT - 0.7% | ||||||||
| 11,973 | Safehold, Inc. (h) (j) | 351,639 | ||||||
| SPECIALTY FINANCE - 9.5% | ||||||||
| 25,367 | Enact Holdings, Inc. | 579,890 | ||||||
| 53,900 | MGIC Investment Corporation | 723,338 | ||||||
| 56,790 | Mr Cooper Group, Inc.(a) | 2,326,687 | ||||||
| 35,618 | Ocwen Financial Corporation(a) | 965,960 | ||||||
| 4,595,875 | ||||||||
| TOTAL COMMON STOCKS (Cost $23,421,398) | 20,568,463 | |||||||
See accompanying notes to consolidated financial statements.
57
| ALPHACENTRIC STRATEGIC INCOME FUND |
| SCHEDULE OF INVESTMENTS (Continued) |
| March 31, 2023 |
| Shares | Fair Value | |||||||
| PREFERRED STOCKS — 14.0% | ||||||||
| MORTGAGE REITS — 14.0% | ||||||||
| 59,964 | AGNC Investment Corporation - Series F (d) (h) | $ | 1,169,897 | |||||
| 10,000 | Arbor Realty Trust, Inc. - Series E (h) | 170,000 | ||||||
| 20,000 | Arbor Realty Trust, Inc. - Series D (h) | 349,000 | ||||||
| 63,126 | Arbor Realty Trust, Inc. - Series F (d) (h) | 1,073,142 | ||||||
| 28,308 | Chimera Investment Corporation - Series B (d) (h) | 542,381 | ||||||
| 7,881 | Chimera Investment Corporation - Series C (d) (h) | 151,552 | ||||||
| 2,252 | Chimera Investment Corporation - Series D (d) (h) | 42,563 | ||||||
| 36,754 | Granite Point Mortgage Trust, Inc. - Series A (d) (h) | 606,441 | ||||||
| 40,000 | KKR Real Estate Finance Trust, Inc. - Series A (h) | 638,800 | ||||||
| 11,272 | MFA Financial, Inc. - Series C (d) (h) | 192,075 | ||||||
| 22,500 | New York Mortgage Trust, Inc. - Series F (d) (h) | 391,725 | ||||||
| 37,930 | Rithm Capital Corporation - Series D (d) (h) | 747,221 | ||||||
| 9,000 | Two Harbors Investment Corporation - Series A (d) (h) | 194,850 | ||||||
| 20,472 | Two Harbors Investment Corporation - Series C (d) (h) | 424,794 | ||||||
| TOTAL PREFERRED STOCKS (Cost $8,916,351) | 6,694,441 | |||||||
| Principal | Coupon Rate | |||||||||||||
| Amount ($) | Spread | (%) | Maturity | Fair Value | ||||||||||
| ASSET BACKED SECURITIES — 7.2% | ||||||||||||||
| CLO — 0.2% | ||||||||||||||
| 100,000 | TRTX 2019-FL3 Issuer Ltd. Series FL3 B(b),(c) | TSFR1M + 1.864% | 6.6080 | 10/15/34 | 98,094 | |||||||||
| COLLATERALIZED MORTGAGE OBLIGATIONS — 2.7% | ||||||||||||||
| 55,962 | Adjustable Rate Mortgage Trust 2007-1 Series 2007-1 1A1(d) | 4.2710 | 03/25/37 | 48,318 | ||||||||||
| 18,961 | Alternative Loan Trust 2003-J2 Series 2003-J2 B2 | 6.0000 | 10/25/33 | — | (i) | |||||||||
| 558,747 | Alternative Loan Trust 2005-11CB Series 2005-11CB 3A2(c) | US0001M + 0.500% | 5.3450 | 06/25/35 | 415,834 | |||||||||
| 240,629 | Alternative Loan Trust 2005-J6 Series 2005-J6 1A5(c) | US0001M + 0.500% | 5.3450 | 07/25/35 | 192,941 | |||||||||
| 504,268 | Impac CMB Trust Series 2005-2 Series 2005-2 1M2(c) | US0001M + 0.735% | 5.5800 | 04/25/35 | 450,931 | |||||||||
| 233,293 | Washington Mutual Mortgage Pass-Through Series 2007-HY1 A2A(c) | US0001M + 0.160% | 5.1650 | 02/25/37 | 188,062 | |||||||||
| 1,296,086 | ||||||||||||||
| HOME EQUITY — 0.4% | ||||||||||||||
| 231,666 | Terwin Mortgage Trust 2004-7HE Series 7HE A3(b),(c) | US0001M + 1.400% | 6.2450 | 07/25/34 | 202,094 | |||||||||
See accompanying notes to consolidated financial statements.
58
| ALPHACENTRIC STRATEGIC INCOME FUND |
| SCHEDULE OF INVESTMENTS (Continued) |
| March 31, 2023 |
| Principal | Coupon Rate | |||||||||||||
| Amount ($) | Spread | (%) | Maturity | Fair Value | ||||||||||
| ASSET BACKED SECURITIES — 7.2% (Continued) | ||||||||||||||
| NON AGENCY CMBS — 3.0% | ||||||||||||||
| 7,101 | CD 2017-CD4 Mortgage Trust Series 2017-CD4 Class X-A(d),(e) | 1.2260 | 05/10/50 | $ | 272 | |||||||||
| 100,000 | COMM 2013-CCRE6 Mortgage Trust Series 2013-CR6 F(b),(d) | 4.1690 | 03/10/46 | 65,165 | ||||||||||
| 10,000 | COMM 2015-DC1 Mortgage Trust Series 2015-DC1 C(d) | 4.2990 | 02/10/48 | 8,420 | ||||||||||
| 81,000 | COMM 2015-LC19 Mortgage Trust Series 2015-LC19 D(b) | 2.8670 | 02/10/48 | 66,389 | ||||||||||
| 33,371 | CSAIL 2016-C5 Commercial Mortgage Trust Series 2016-C5 C(d) | 4.6450 | 11/15/48 | 30,415 | ||||||||||
| 100,000 | CSAIL 2016-C6 Commercial Mortgage Trust Series C6 B(d) | 3.9240 | 01/15/49 | 91,684 | ||||||||||
| 3,062,413 | GS Mortgage Securities Trust 2014-GC26 Series GC26 XA(d),(e) | 0.9270 | 11/10/47 | 34,942 | ||||||||||
| 45,000 | JPMBB Commercial Mortgage Securities Trust Series 2015-C30 B(d) | 4.2300 | 07/15/48 | 42,193 | ||||||||||
| 10,000 | JPMBB Commercial Mortgage Securities Trust Series 2015-C28 C(d) | 4.1450 | 10/15/48 | 9,185 | ||||||||||
| 15,000 | Morgan Stanley Bank of America Merrill Lynch Trust Series 2013-C12 C(d) | 4.9380 | 10/15/46 | 14,267 | ||||||||||
| 17,233 | Morgan Stanley Bank of America Merrill Lynch Trust Series 2015-C24 C(d) | 4.3280 | 05/15/48 | 15,728 | ||||||||||
| 1,956,454 | SG Commercial Mortgage Securities Trust 2016-C5 Series C5 XA(d),(e) | 1.8770 | 10/10/48 | 81,644 | ||||||||||
| 11,232,397 | UBS Commercial Mortgage Trust 2017-C7 Series C7 XA(d),(e) | 1.0040 | 12/15/50 | 397,191 | ||||||||||
| 25,000 | Wells Fargo Commercial Mortgage Trust 2015-C27 Series 2015-C27 B(d) | 4.1390 | 02/15/48 | 22,859 | ||||||||||
| 75,000 | Wells Fargo Commercial Mortgage Trust 2015-NXS1 Series 2015-NXS1 D(d) | 4.1490 | 05/15/48 | 62,316 | ||||||||||
| 100,000 | Wells Fargo Commercial Mortgage Trust 2016-NXS6 Series 2016-NXS6 B | 3.8110 | 11/15/49 | 89,247 | ||||||||||
| 270,000 | WFRBS Commercial Mortgage Trust 2013-C15 Series 2013-C15 B(d) | 4.5110 | 08/15/46 | 239,321 | ||||||||||
| 160,000 | WFRBS Commercial Mortgage Trust 2013-C15 Series 2013-C15 C(d) | 4.5110 | 08/15/46 | 135,799 | ||||||||||
| 15,000 | WFRBS Commercial Mortgage Trust 2014-C24 Series 2014-C24 B(d) | 4.2040 | 11/15/47 | 13,828 | ||||||||||
| 1,420,865 | ||||||||||||||
| RESIDENTIAL MORTGAGE — 0.9% | ||||||||||||||
| 146,779 | Credit-Based Asset Servicing and Securitization, Series 2003-CB2 M2(f) | 6.0450 | 08/25/32 | 65,668 | ||||||||||
| 484,210 | Ellington Loan Acquisition Trust 2007-2 Series 2007-2 M2B(b),(c) | US0001M + 1.700% | 6.5450 | 05/25/37 | 267,952 | |||||||||
| 86,278 | Park Place Securities Inc Asset-Backed Series 2004-WWF1 M4(c) | US0001M + 1.650% | 6.4950 | 12/25/34 | 87,709 | |||||||||
| 421,329 | ||||||||||||||
| TOTAL ASSET BACKED SECURITIES (Cost $3,770,518) | 3,438,468 | |||||||||||||
See accompanying notes to consolidated financial statements.
59
| ALPHACENTRIC STRATEGIC INCOME FUND |
| SCHEDULE OF INVESTMENTS (Continued) |
| March 31, 2023 |
| Principal | Coupon Rate | |||||||||||
| Amount ($) | (%) | Maturity | Fair Value | |||||||||
| COLLATERALIZED MORTGAGE OBLIGATIONS — 1.9% | ||||||||||||
| CMBS — 1.9% | ||||||||||||
| 1,237,846 | Fannie Mae-Aces Series 2014-M8 X2(d),(e) | 0.2930 | 06/25/24 | $ | 3,966 | |||||||
| 1,000,000 | Freddie Mac Multifamily Structured Pass Through Series K126 X3(d),(e) | 2.6290 | 01/25/49 | 153,139 | ||||||||
| 317,775 | Government National Mortgage Association Series 2015-108 IO(d),(e) | 0.3360 | 10/16/56 | 7,697 | ||||||||
| 163,934 | Government National Mortgage Association Series 2017-106 IO(d),(e) | 0.6910 | 12/16/56 | 5,745 | ||||||||
| 917,413 | Government National Mortgage Association Series 2018-17 MI(d),(e) | 0.4310 | 11/01/57 | 28,852 | ||||||||
| 1,963,139 | Government National Mortgage Association(d),(e) | 0.7280 | 03/16/58 | 65,932 | ||||||||
| 4,786,507 | Government National Mortgage Association Series 2017-171 IO(d),(e) | 0.6540 | 09/16/59 | 187,033 | ||||||||
| 2,950,496 | Government National Mortgage Association Series 161 IB(d),(e) | 0.5230 | 08/16/60 | 124,884 | ||||||||
| 1,744,339 | Government National Mortgage Association Series 2019-81 IO(d),(e) | 0.9450 | 02/16/61 | 102,896 | ||||||||
| 3,754,965 | Government National Mortgage Association Series 34 IO(d),(e) | 0.7270 | 03/16/61 | 194,161 | ||||||||
| 288,145 | Government National Mortgage Association Series 2019-105 IO(d),(e) | 0.7000 | 08/16/61 | 17,841 | ||||||||
| TOTAL COLLATERALIZED MORTGAGE OBLIGATIONS (Cost $1,225,488) | 892,146 | |||||||||||
| CONVERTIBLE BONDS — 9.0% | ||||||||||||
| ASSET MANAGEMENT — 2.1% | ||||||||||||
| 1,124,000 | RWT Holdings, Inc. | 5.7500 | 10/01/25 | 1,020,006 | ||||||||
| MORTGAGE REITS — 1.6% | ||||||||||||
| 315,000 | MFA Financial, Inc. (h) | 6.2500 | 06/15/24 | 302,471 | ||||||||
| 490,000 | Redwood Trust, Inc. (h) | 5.6250 | 07/15/24 | 465,881 | ||||||||
| 768,352 | ||||||||||||
| SPECIALTY FINANCE — 5.3% | ||||||||||||
| 30,000 | KKR Real Estate Finance Trust, Inc. | 6.1250 | 05/15/23 | 29,850 | ||||||||
| 1,465,000 | PennyMac Corporation | 5.5000 | 11/01/24 | 1,375,268 | ||||||||
| 1,315,000 | Two Harbors Investment Corporation | 6.2500 | 01/15/26 | 1,142,817 | ||||||||
| 2,547,935 | ||||||||||||
| TOTAL CONVERTIBLE BONDS (Cost $4,504,788) | 4,336,293 | |||||||||||
See accompanying notes to consolidated financial statements.
60
| ALPHACENTRIC STRATEGIC INCOME FUND |
| SCHEDULE OF INVESTMENTS (Continued) |
| March 31, 2023 |
| Principal | Coupon Rate | |||||||||||
| Amount ($) | (%) | Maturity | Fair Value | |||||||||
| CORPORATE BONDS — 8.5% | ||||||||||||
| SPECIALTY FINANCE — 8.5% | ||||||||||||
| 250,000 | Nationstar Mortgage Holdings, Inc.(b) | 5.5000 | 08/15/28 | $ | 214,630 | |||||||
| 1,989,000 | New Residential Investment Corporation(b) | 6.2500 | 10/15/25 | 1,776,993 | ||||||||
| 390,000 | PennyMac Financial Services, Inc.(b) | 5.3750 | 10/15/25 | 364,670 | ||||||||
| 1,664,000 | PHH Mortgage Corporation(b) | 7.8750 | 03/15/26 | 1,448,987 | ||||||||
| 280,000 | United Wholesale Mortgage, LLC(b) | 5.5000 | 11/15/25 | 265,322 | ||||||||
| TOTAL CORPORATE BONDS (Cost $4,446,720) | 4,070,602 | |||||||||||
| Shares | Fair Value | |||||||||||
| SHORT-TERM INVESTMENT — 15.6% | ||||||||||||
| MONEY MARKET FUND - 15.6% | ||||||||||||
| 7,481,848 | First American Government Obligations Fund, Class U, 4.66% (Cost $7,481,848)(g) | 7,481,848 | ||||||||||
| TOTAL INVESTMENTS - 99.0% (Cost $53,767,111) | $ | 47,482,261 | ||||||||||
| OTHER ASSETS IN EXCESS OF LIABILITIES - 1.0% | 478,172 | |||||||||||
| NET ASSETS - 100.0% | $ | 47,960,433 | ||||||||||
| LLC | - Limited Liability Company |
| LTD | - Limited Company |
| REIT | - Real Estate Investment Trust |
| H15T5Y | - US Treasury Yield Curve Rate T Note Constant Maturity 5 Year |
| SOFRRATE | - United States SOFR Secured Overnight Financing Rate |
| TSFR1M | -TSFR1M |
| US0001M | - ICE LIBOR USD 1 Month |
| US0003M | - ICE LIBOR USD 3 Month |
| (a) | Non-income producing security. |
| (b) | Security exempt from registration under Rule 144A or Section 4(2) of the Securities Act of 1933. The security may be resold in transactions exempt from registration, normally to qualified institutional buyers. As of March 31, 2023 the total market value of 144A securities is $4,770,296 or 9.9% of net assets. |
| (c) | Floating rate security, the interest rate of which adjusts periodically based on changes in current interest rates and prepayments on the underlying pool of assets. |
| (d) | Variable rate security; the rate shown represents the rate on March 31, 2023. |
| (e) | Interest only securities. |
| (f) | Step bond. Coupon rate is fixed rate that changes on a specified date. The rate shown is the current rate at March 31, 2023. |
| (g) | Rate disclosed is the seven day effective yield as of March 31, 2023. |
| (h) | REIT – Real Estate Investment Trust. |
| (i) | Less than $1. |
| (j) | Illiquid security. Total illiquid securities represents 0.7% of net assets as of March 31, 2023. |
See accompanying notes to consolidated financial statements.
61
| AlphaCentric Funds |
| STATEMENTS OF ASSETS AND LIABILITIES |
| March 31, 2023 |
| AlphaCentric | ||||||||||||||||
| AlphaCentric Income | AlphaCentric Premium | AlphaCentric Robotics | Symmetry Strategy | |||||||||||||
| Opportunities Fund | Opportunity Fund | and Automation Fund | Fund (Consolidated) | |||||||||||||
| ASSETS | ||||||||||||||||
| Investment securities: | ||||||||||||||||
| Investments, at cost | $ | 528,285,202 | $ | 64,627,805 | $ | 40,219,427 | $ | 46,737,575 | ||||||||
| Investments, at value (including collateral for loaned securities $0, $0, $8,876,379, $0) | $ | 659,307,499 | $ | 64,898,937 | $ | 40,522,451 | $ | 47,116,127 | ||||||||
| Cash & Cash Equivalents | 34 | — | — | — | ||||||||||||
| Deposit with brokers for futures and swaps | — | 23,121,109 | — | 3,585,536 | ||||||||||||
| Foreign currency (Cost $0, $0, $0, $4,326) | — | — | — | 4,327 | ||||||||||||
| Receivable for securities sold | 10,668,696 | — | — | 579,583 | ||||||||||||
| Receivable for Fund shares sold | 82,319 | 25,314 | 273 | — | ||||||||||||
| Dividends and interest receivable | 877,205 | 174,725 | 108,068 | 44,704 | ||||||||||||
| Upfront payment on swap | — | — | — | 7,074 | ||||||||||||
| Unrealized appreciation on open futures contracts | — | 2,034,688 | — | 1,056,441 | ||||||||||||
| Unrealized appreciation on swap contracts | — | — | — | 3,916 | ||||||||||||
| Prepaid expenses and other assets | 14,680 | 39,574 | 13,711 | 33,877 | ||||||||||||
| TOTAL ASSETS | 670,950,433 | 90,294,347 | 40,644,503 | 52,431,585 | ||||||||||||
| LIABILITIES | ||||||||||||||||
| Options Written (Proceeds $870,883) | — | 856,038 | — | — | ||||||||||||
| Payable upon return of line of credit | 47,617,000 | — | — | — | ||||||||||||
| Payable for investments purchased | — | 34,283 | — | 584,294 | ||||||||||||
| Unrealized depreciation on swap contracts | — | — | — | 330 | ||||||||||||
| Payable upon return of securities loaned | — | — | 8,876,379 | — | ||||||||||||
| Unrealized depreciation on open futures contracts | — | 570 | — | 979,802 | ||||||||||||
| Payable for Fund shares repurchased | 2,655,625 | 18,240 | 10,218 | — | ||||||||||||
| Management fees payable | 715,746 | 114,297 | 17,867 | 58,787 | ||||||||||||
| Distribution (12b-1) fees payable | 34,532 | — | — | 928 | ||||||||||||
| Payable to related parties | 24,993 | 12,153 | 1,161 | 1,373 | ||||||||||||
| Administration fees payable | 85,996 | 11,692 | 6,648 | 10,286 | ||||||||||||
| Compliance officer fees payable | 3,235 | 68 | — | — | ||||||||||||
| Accrued expenses and other liabilities | 391,525 | 33,973 | 19,236 | 22,560 | ||||||||||||
| TOTAL LIABILITIES | 51,528,652 | 1,081,314 | 8,931,509 | 1,658,360 | ||||||||||||
| NET ASSETS | $ | 619,421,781 | $ | 89,213,033 | $ | 31,712,994 | $ | 50,773,225 | ||||||||
| Composition of Net Assets: | ||||||||||||||||
| Paid in capital | $ | 872,638,915 | $ | 101,346,836 | $ | 34,058,288 | $ | 54,277,879 | ||||||||
| Accumulated loss | (253,217,134 | ) | (12,133,803 | ) | (2,345,294 | ) | (3,504,654 | ) | ||||||||
| NET ASSETS | $ | 619,421,781 | $ | 89,213,033 | $ | 31,712,994 | $ | 50,773,225 | ||||||||
| Net Asset Value Per Share: | �� | |||||||||||||||
| Class A Shares (IOFAX, HMXAX, GNXAX, SYMAX): | ||||||||||||||||
| Net Assets | $ | 44,560,666 | $ | 7,451,601 | $ | 3,728,531 | $ | 858,109 | ||||||||
| Shares of beneficial interest outstanding (a) | 5,132,196 | 310,543 | 321,074 | 75,926 | ||||||||||||
| Net asset value (Net Assets ÷ Shares Outstanding) and redemption price per share | $ | 8.68 | (d) | $ | 24.00 | $ | 11.61 | $ | 11.30 | |||||||
| Maximum offering price per share | $ | 9.11 | (c)(d) | $ | 25.46 | (b) | $ | 12.32 | (b) | $ | 11.99 | (b) | ||||
| Class C Shares (IOFCX, HMXCX, GNXCX, SYMCX): | ||||||||||||||||
| Net Assets | $ | 46,083,597 | $ | 1,782,709 | $ | 675,529 | $ | 953,924 | ||||||||
| Shares of beneficial interest outstanding (a) | 5,329,920 | 77,655 | 61,024 | 85,844 | ||||||||||||
| Net asset value (Net Assets ÷ Shares Outstanding) offering price and redemption price per share | $ | 8.65 | $ | 22.96 | $ | 11.07 | $ | 11.11 | ||||||||
| Class I Shares (IOFIX, HMXIX, GNXIX, SYMIX): | ||||||||||||||||
| Net Assets | $ | 528,777,518 | $ | 79,978,723 | $ | 27,308,934 | $ | 48,961,192 | ||||||||
| Shares of beneficial interest outstanding (a) | 60,834,875 | 3,256,236 | 2,312,889 | 4,331,128 | ||||||||||||
| Net asset value (Net Assets ÷ Shares Outstanding) offering price and redemption price per share | $ | 8.69 | (d) | $ | 24.56 | $ | 11.81 | (d) | $ | 11.30 | ||||||
| (a) | Unlimited number of shares of beneficial interest authorized, no par value. |
| (b) | Net asset value plus maximum sales charge of 5.75% |
| (c) | Net asset value plus maximum sales charge of 4.75% |
| (d) | The Net Asset Value (“NAV”) and offering price shown above differs from the traded NAV on March 31, 2023 due to financial statement rounding and/or financial statement adjustments. |
See accompanying notes to consolidated financial statements.
62
| AlphaCentric Funds |
| STATEMENTS OF ASSETS AND LIABILITIES (Continued) |
| March 31, 2023 |
| AlphaCentric SWBC | ||||||||||||
| AlphaCentric LifeSci | Municipal Opportunities | AlphaCentric Strategic | ||||||||||
| Healthcare Fund | Fund | Income Fund | ||||||||||
| ASSETS | ||||||||||||
| Investment securities: | ||||||||||||
| Investments, at cost | $ | 82,890,713 | $ | 9,808,154 | $ | 53,767,111 | ||||||
| Investments, at value | $ | 80,276,013 | $ | 9,359,252 | $ | 47,482,261 | ||||||
| Foreign currency (Cost $35,207, $0, $0) | 34,769 | — | — | |||||||||
| Deposit with brokers for futures and swaps | — | 492,756 | — | |||||||||
| Upfront payment on swap | — | 24,894 | — | |||||||||
| Receivable for securities sold | 78,093 | 484,591 | — | |||||||||
| Receivable for Fund shares sold | 89,919 | — | 14,144 | |||||||||
| Dividends and interest receivable | 88,827 | 104,164 | 609,287 | |||||||||
| Amount due from Manager | — | 7,138 | — | |||||||||
| Prepaid expenses and other assets | 25,845 | 11,526 | 24,821 | |||||||||
| Unrealized appreciation on swap contracts | — | 9,634 | — | |||||||||
| TOTAL ASSETS | 80,593,466 | 10,493,955 | 48,130,513 | |||||||||
| LIABILITIES | ||||||||||||
| Payable for investments purchased | 988,321 | 692,084 | 116,481 | |||||||||
| Unrealized depreciation on open futures contracts | — | 74,534 | — | |||||||||
| Payable for Fund shares repurchased | 5,000 | — | — | |||||||||
| Management fees payable | 54,905 | — | 26,797 | |||||||||
| Distribution (12b-1) fees payable | — | 280 | — | |||||||||
| Payable to related parties | 1,740 | 584 | 2,793 | |||||||||
| Administration fees payable | 10,382 | 5,126 | 3,805 | |||||||||
| Compliance officer fees payable | — | — | 2,037 | |||||||||
| Accrued expenses and other liabilities | 17,269 | 28,005 | 18,167 | |||||||||
| TOTAL LIABILITIES | 1,077,617 | 800,613 | 170,080 | |||||||||
| NET ASSETS | $ | 79,515,849 | $ | 9,693,342 | $ | 47,960,433 | ||||||
| Composition of Net Assets: | ||||||||||||
| Paid in capital | $ | 84,229,045 | $ | 11,964,794 | $ | 54,245,287 | ||||||
| Accumulated loss | (4,713,196 | ) | (2,271,452 | ) | (6,284,854 | ) | ||||||
| NET ASSETS | $ | 79,515,849 | $ | 9,693,342 | $ | 47,960,433 | ||||||
| Net Asset Value Per Share: | ||||||||||||
| Class A Shares (LYFAX,MUNAX,SIIAX): | ||||||||||||
| Net Assets | $ | 3,785,712 | $ | 2,099,291 | $ | 466,701 | ||||||
| Shares of beneficial interest outstanding (a) | 287,265 | 248,899 | 31,413 | |||||||||
| Net asset value (Net Assets ÷ Shares Outstanding) and redemption price per share | $ | 13.18 | $ | 8.43 | $ | 14.86 | ||||||
| Maximum offering price per share | $ | 13.98 | (b) | $ | 8.85 | (c) | $ | 15.60 | (c) | |||
| Class C Shares (LYFCX,MUNCX,SIICX): | ||||||||||||
| Net Assets | $ | 709,474 | $ | 433,881 | $ | 982,523 | ||||||
| Shares of beneficial interest outstanding (a) | 54,545 | 51,407 | 66,261 | |||||||||
| Net asset value (Net Assets ÷ Shares Outstanding) offering price and redemption price per share | $ | 13.01 | $ | 8.44 | $ | 14.83 | ||||||
| Class I Shares (LYFIX,MUNIX, SIIIX): | ||||||||||||
| Net Assets | $ | 75,020,663 | $ | 7,160,170 | $ | 46,511,209 | ||||||
| Shares of beneficial interest outstanding (a) | 5,662,969 | 848,934 | 3,124,696 | |||||||||
| Net asset value (Net Assets ÷ Shares Outstanding) offering price and redemption price per share | $ | 13.25 | $ | 8.43 | $ | 14.89 | ||||||
| (a) | Unlimited number of shares of beneficial interest authorized, no par value. |
| (b) | Net asset value plus maximum sales charge of 5.75% |
| (c) | Net asset value plus maximum sales charge of 4.75% |
See accompanying notes to consolidated financial statements.
63
| AlphaCentric Funds |
| STATEMENTS OF OPERATIONS |
| For the Year Ended March 31, 2023 |
| AlphaCentric | AlphaCentric | |||||||||||||||
| Premium | AlphaCentric | Symmetry Strategy | ||||||||||||||
| AlphaCentric Income | Opportunity | Robotics and | Fund | |||||||||||||
| Opportunities Fund | Fund | Automation Fund | (Consolidated) | |||||||||||||
| INVESTMENT INCOME | ||||||||||||||||
| Dividends (ARAF and ASSF: Net of tax witholding of $29,992 and $3,288, respectively) | $ | — | $ | — | $ | 235,454 | $ | 720,973 | ||||||||
| Interest | 47,199,195 | 2,168,409 | 26,915 | 370,514 | ||||||||||||
| Securities lending income | — | — | 200,007 | — | ||||||||||||
| TOTAL INVESTMENT INCOME | 47,199,195 | 2,168,409 | 462,376 | 1,091,487 | ||||||||||||
| EXPENSES | ||||||||||||||||
| Management fees | 16,857,672 | 2,234,028 | 402,988 | 640,133 | ||||||||||||
| Distribution (12b-1) fees: | ||||||||||||||||
| Class A | 178,110 | 17,041 | 10,546 | 1,152 | ||||||||||||
| Class C | 649,850 | 24,553 | 8,571 | 4,758 | ||||||||||||
| Line of credit fees | 1,752,550 | — | — | — | ||||||||||||
| Shareholder servicing fees | 1,031,640 | 163,196 | 29,500 | 13,740 | ||||||||||||
| Administrative fees | 762,358 | 101,296 | 44,954 | 52,465 | ||||||||||||
| Management service fees | 409,935 | 42,552 | 8,004 | 17,061 | ||||||||||||
| Printing and postage expenses | 283,797 | 19,998 | 22,286 | 3,000 | ||||||||||||
| Registration fees | 146,533 | 64,999 | 54,998 | 5,001 | ||||||||||||
| Insurance expense | 113,522 | 5,701 | 1,219 | 902 | ||||||||||||
| Audit fees | 79,216 | 14,100 | 16,600 | 16,002 | ||||||||||||
| Custodian fees | 52,168 | 7,818 | 10,384 | 13,546 | ||||||||||||
| Compliance officer fees | 44,033 | 10,319 | 13,218 | 10,557 | ||||||||||||
| Legal fees | 59,161 | 16,231 | 41,546 | 18,966 | ||||||||||||
| Trustees fees and expenses | 14,874 | 14,042 | 13,732 | 14,780 | ||||||||||||
| Interest expense | — | 568 | — | — | ||||||||||||
| Other expenses | 3,425 | 5,699 | 3,149 | 1,450 | ||||||||||||
| TOTAL EXPENSES | 22,438,844 | 2,742,141 | 681,695 | 813,513 | ||||||||||||
| Less: Fees waived by the Manager | (3,130,818 | ) | (164,482 | ) | (211,574 | ) | (48,215 | ) | ||||||||
| NET EXPENSES | 19,308,026 | 2,577,659 | 470,121 | 765,298 | ||||||||||||
| NET INVESTMENT INCOME (LOSS) | 27,891,169 | (409,250 | ) | (7,745 | ) | 326,189 | ||||||||||
| REALIZED AND UNREALIZED GAIN (LOSS) FROM INVESTMENTS | ||||||||||||||||
| Net realized gain (loss) from: | ||||||||||||||||
| Investments | 157,063,493 | (2,386,815 | ) | (2,521,474 | ) | (1,943,174 | ) | |||||||||
| Foreign Currencies Translation | — | — | (21,012 | ) | 30,862 | |||||||||||
| Futures Contracts | — | (8,467,301 | ) | — | 1,351,369 | |||||||||||
| Options Written | — | 2,454,997 | — | — | ||||||||||||
| Swap Contracts | — | — | — | 13,188 | ||||||||||||
| 157,063,493 | (8,399,119 | ) | (2,542,486 | ) | (547,755 | ) | ||||||||||
| Net change in unrealized appreciation (depreciation) on: | ||||||||||||||||
| Investments | (530,834,259 | ) | 206,099 | (2,469,768 | ) | (2,317 | ) | |||||||||
| Foreign Currencies Translation | — | — | 663 | (30,351 | ) | |||||||||||
| Futures Contracts | — | (741,939 | ) | — | (1,658,696 | ) | ||||||||||
| Options Written | — | (83,905 | ) | — | — | |||||||||||
| Swap Contracts | — | — | — | 3,586 | ||||||||||||
| (530,834,259 | ) | (619,745 | ) | (2,469,105 | ) | (1,687,778 | ) | |||||||||
| NET REALIZED AND UNREALIZED LOSS FROM INVESTMENTS | (373,770,766 | ) | (9,018,864 | ) | (5,011,591 | ) | (2,235,533 | ) | ||||||||
| NET DECREASE IN NET ASSETS RESULTING FROM OPERATIONS | $ | (345,879,597 | ) | $ | (9,428,114 | ) | $ | (5,019,336 | ) | $ | (1,909,344 | ) | ||||
See accompanying notes to consolidated financial statements.
64
| AlphaCentric Funds |
| STATEMENTS OF OPERATIONS (Continued) |
| For the Year Ended March 31, 2023 |
| AlphaCentric | ||||||||||||
| AlphaCentric | SWBC Municipal | AlphaCentric | ||||||||||
| LifeSci Healthcare | Opportunities | Strategic Income | ||||||||||
| Fund | Fund | Fund | ||||||||||
| INVESTMENT INCOME | ||||||||||||
| Dividends (ALHF : Net of tax witholding of $20,140) | $ | 294,851 | $ | 199,448 | $ | 1,556,684 | ||||||
| Interest | 143,541 | 255,020 | 892,320 | |||||||||
| TOTAL INVESTMENT INCOME | 438,392 | 454,468 | 2,449,004 | |||||||||
| EXPENSES | ||||||||||||
| Management fees | 587,635 | 92,828 | 678,827 | |||||||||
| Distribution (12b-1) fees: | ||||||||||||
| Class A | 5,413 | 5,232 | 606 | |||||||||
| Class C | 3,816 | 4,387 | 8,099 | |||||||||
| Registration fees | 54,998 | 19,999 | 64,999 | |||||||||
| Administrative fees | 52,123 | 38,879 | 53,519 | |||||||||
| Shareholder servicing fees | 36,010 | 13,296 | 28,051 | |||||||||
| Legal fees | 17,900 | 20,972 | 23,714 | |||||||||
| Management service fees | 14,567 | 3,280 | 16,011 | |||||||||
| Trustees fees and expenses | 14,298 | 14,426 | 16,091 | |||||||||
| Audit fees | 13,501 | 25,933 | 42,777 | |||||||||
| Compliance officer fees | 13,066 | 15,571 | 14,286 | |||||||||
| Printing and postage expenses | 9,339 | 3,000 | 16,440 | |||||||||
| Custodian fees | 7,487 | 5,260 | 3,153 | |||||||||
| Insurance expense | 1,000 | 321 | 748 | |||||||||
| Line of Credit fees | 121 | 94 | — | |||||||||
| Other expenses | 3,546 | 3,149 | 3,149 | |||||||||
| TOTAL EXPENSES | 834,820 | 266,627 | 970,470 | |||||||||
| Less: Fees waived/reimbursed by the Manager | (165,498 | ) | (140,854 | ) | (287,380 | ) | ||||||
| NET EXPENSES | 669,322 | 125,773 | 683,090 | |||||||||
| NET INVESTMENT INCOME (LOSS) | (230,930 | ) | 328,695 | 1,765,914 | ||||||||
| REALIZED AND UNREALIZED GAIN (LOSS) FROM INVESTMENTS | ||||||||||||
| Net realized gain (loss) from: | ||||||||||||
| Investments | 596,506 | (1,300,025 | ) | 409,394 | ||||||||
| Futures Contracts | — | 347,850 | — | |||||||||
| Swap Contracts | — | 14,883 | — | |||||||||
| 596,506 | (937,292 | ) | 409,394 | |||||||||
| Net change in unrealized appreciation (depreciation) on: | ||||||||||||
| Investments | 857,104 | 72,391 | (7,127,240 | ) | ||||||||
| Foreign Currency Translation | (74 | ) | — | — | ||||||||
| Futures Contracts | — | (148,222 | ) | — | ||||||||
| Swap Contracts | — | 30,120 | — | |||||||||
| 857,030 | (45,711 | ) | (7,127,240 | ) | ||||||||
| NET REALIZED AND UNREALIZED GAIN (LOSS) FROM INVESTMENTS | 1,453,536 | (983,003 | ) | (6,717,846 | ) | |||||||
| NET INCREASE (DECREASE) IN NET ASSETS RESULTING FROM OPERATIONS | $ | 1,222,606 | $ | (654,308 | ) | $ | (4,951,932 | ) | ||||
See accompanying notes to consolidated financial statements.
65
| AlphaCentric Income Opportunities Fund |
| STATEMENTS OF CHANGES IN NET ASSETS |
| Year Ended | Year Ended | |||||||
| March 31, 2023 | March 31, 2022 | |||||||
| FROM OPERATIONS | ||||||||
| Net investment income | $ | 27,891,169 | $ | 50,712,684 | ||||
| Net realized gain from investments | 157,063,493 | 160,502,870 | ||||||
| Net change in unrealized depreciation on investments | (530,834,259 | ) | (15,874,100 | ) | ||||
| Net increase (decrease) in net assets resulting from operations | (345,879,597 | ) | 195,341,454 | |||||
| DISTRIBUTIONS TO SHAREHOLDERS | ||||||||
| From return of capital: | ||||||||
| Class A (IOFAX) | (2,390,279 | ) | (3,782,235 | ) | ||||
| Class C (IOFCX) | (1,841,953 | ) | (1,474,662 | ) | ||||
| Class I (IOFIX) | (34,902,633 | ) | (63,332,083 | ) | ||||
| Total distributions paid: | ||||||||
| Class A (IOFAX) | (1,022,781 | ) | (4,804,498 | ) | ||||
| Class C (IOFCX) | (936,282 | ) | (2,033,592 | ) | ||||
| Class I (IOFIX) | (13,874,753 | ) | (79,840,006 | ) | ||||
| Total distributions to shareholders | (54,968,681 | ) | (155,267,076 | ) | ||||
| FROM SHARES OF BENEFICIAL INTEREST | ||||||||
| Proceeds from shares sold: | ||||||||
| Class A (IOFAX) | 12,270,446 | 64,473,656 | ||||||
| Class C (IOFCX) | 1,725,448 | 12,236,618 | ||||||
| Class I (IOFIX) | 239,909,400 | 1,376,077,978 | ||||||
| Net asset value of shares issued in reinvestment of distributions: | ||||||||
| Class A (IOFAX) | 3,104,924 | 7,379,266 | ||||||
| Class C (IOFCX) | 2,612,328 | 3,177,323 | ||||||
| Class I (IOFIX) | 39,393,370 | 109,862,661 | ||||||
| Payments for shares repurchased: | ||||||||
| Class A (IOFAX) | (91,588,892 | ) | (149,913,206 | ) | ||||
| Class C (IOFCX) | (38,281,062 | ) | (33,584,028 | ) | ||||
| Class I (IOFIX) | (1,585,150,298 | ) | (2,649,315,832 | ) | ||||
| Net decrease in net assets from shares of beneficial interest | (1,416,004,336 | ) | (1,259,605,564 | ) | ||||
| TOTAL DECREASE IN NET ASSETS | (1,816,852,614 | ) | (1,219,531,186 | ) | ||||
| NET ASSETS | ||||||||
| Beginning of Year | 2,436,274,395 | 3,655,805,581 | ||||||
| End of Year | $ | 619,421,781 | $ | 2,436,274,395 | ||||
| SHARE ACTIVITY | ||||||||
| Class A (IOFAX): | ||||||||
| Shares Sold | 1,280,165 | 5,423,079 | ||||||
| Shares Reinvested | 325,343 | 621,141 | ||||||
| Shares Repurchased | (9,208,368 | ) | (12,610,894 | ) | ||||
| Net decrease in shares of beneficial interest outstanding | (7,602,860 | ) | (6,566,674 | ) | ||||
| Class C (IOFCX): | ||||||||
| Shares Sold | 179,313 | 1,029,781 | ||||||
| Shares Reinvested | 277,465 | 268,738 | ||||||
| Shares Repurchased | (3,944,135 | ) | (2,835,895 | ) | ||||
| Net decrease in shares of beneficial interest outstanding | (3,487,357 | ) | (1,537,376 | ) | ||||
| Class I (IOFIX): | ||||||||
| Shares Sold | 24,341,874 | 115,474,277 | ||||||
| Shares Reinvested | 4,115,225 | 9,231,089 | ||||||
| Shares Repurchased | (158,104,387 | ) | (222,183,374 | ) | ||||
| Net decrease in shares of beneficial interest outstanding | (129,647,288 | ) | (97,478,008 | ) | ||||
See accompanying notes to consolidated financial statements.
66
| AlphaCentric Premium Opportunity Fund |
| STATEMENTS OF CHANGES IN NET ASSETS |
| Year Ended | Year Ended | |||||||
| March 31, 2023 | March 31, 2022 | |||||||
| FROM OPERATIONS | ||||||||
| Net investment loss | $ | (409,250 | ) | $ | (3,379,768 | ) | ||
| Net realized gain (loss) from investments, future contracts and options written | (8,399,119 | ) | 2,363,871 | |||||
| Net change in unrealized appreciation (depreciation) on investments, future contracts and options written | (619,745 | ) | 2,253,242 | |||||
| Net increase (decrease) in net assets resulting from operations | (9,428,114 | ) | 1,237,345 | |||||
| DISTRIBUTIONS TO SHAREHOLDERS | ||||||||
| Total distributions paid: | ||||||||
| Class A (HMXAX) | — | (420,303 | ) | |||||
| Class C (HMXCX) | — | (219,715 | ) | |||||
| Class I (HMXIX) | — | (9,230,648 | ) | |||||
| Total distributions to shareholders | — | (9,870,666 | ) | |||||
| FROM SHARES OF BENEFICIAL INTEREST | ||||||||
| Proceeds from shares sold: | ||||||||
| Class A (HMXAX) | 3,030,670 | 7,524,097 | ||||||
| Class C (HMXCX) | 325,945 | 2,727,243 | ||||||
| Class I (HMXIX) | 33,030,617 | 167,873,434 | ||||||
| Net asset value of shares issued in reinvestment of distributions: | ||||||||
| Class A (HMXAX) | — | 376,537 | ||||||
| Class C (HMXCX) | — | 188,104 | ||||||
| Class I (HMXIX) | — | 7,988,900 | ||||||
| Payments for shares repurchased: | ||||||||
| Class A (HMXAX) | (1,490,953 | ) | (7,801,947 | ) | ||||
| Class C (HMXCX) | (1,979,796 | ) | (1,153,336 | ) | ||||
| Class I (HMXIX) | (111,799,837 | ) | (93,589,369 | ) | ||||
| Net increase (decrease) in net assets from shares of beneficial interest | (78,883,354 | ) | 84,133,663 | |||||
| TOTAL INCREASE (DECREASE) IN NET ASSETS | (88,311,468 | ) | 75,500,342 | |||||
| NET ASSETS | ||||||||
| Beginning of Year | 177,524,501 | 102,024,159 | ||||||
| End of Year | $ | 89,213,033 | $ | 177,524,501 | ||||
| SHARE ACTIVITY | ||||||||
| Class A (HMXAX): | ||||||||
| Shares Sold | 128,113 | 287,417 | ||||||
| Shares Reinvested | — | 14,640 | ||||||
| Shares Repurchased | (63,622 | ) | (306,216 | ) | ||||
| Net increase (decrease) in shares of beneficial interest outstanding | 64,491 | (4,159 | ) | |||||
| Class C (HMXCX): | ||||||||
| Shares Sold | 14,329 | 107,345 | ||||||
| Shares Reinvested | — | 7,573 | ||||||
| Shares Repurchased | (87,342 | ) | (47,085 | ) | ||||
| Net increase (decrease) in shares of beneficial interest outstanding | (73,013 | ) | 67,833 | |||||
| Class I (HMXIX): | ||||||||
| Shares Sold | 1,356,731 | 6,270,536 | ||||||
| Shares Reinvested | — | 304,455 | ||||||
| Shares Repurchased | (4,632,238 | ) | (3,604,643 | ) | ||||
| Net increase (decrease) in shares of beneficial interest outstanding | (3,275,507 | ) | 2,970,348 | |||||
See accompanying notes to consolidated financial statements.
67
| AlphaCentric Robotics and Automation Fund |
| STATEMENTS OF CHANGES IN NET ASSETS |
| Year Ended | Year Ended | |||||||
| March 31, 2023 | March 31, 2022 | |||||||
| FROM OPERATIONS | ||||||||
| Net investment loss | $ | (7,745 | ) | $ | (306,923 | ) | ||
| Net realized gain (loss) from investments and foreign currencies translation | (2,542,486 | ) | 4,690,409 | |||||
| Net change in unrealized depreciation on investments and foreign currencies translation | (2,469,105 | ) | (11,179,156 | ) | ||||
| Net decrease in net assets resulting from operations | (5,019,336 | ) | (6,795,670 | ) | ||||
| DISTRIBUTIONS TO SHAREHOLDERS | ||||||||
| Total distributions paid: | ||||||||
| Class A (GNXAX) | (190,967 | ) | (309,155 | ) | ||||
| Class C (GNXCX) | (39,354 | ) | (65,619 | ) | ||||
| Class I (GNXIX) | (1,308,689 | ) | (1,624,050 | ) | ||||
| Total distributions to shareholders | (1,539,010 | ) | (1,998,824 | ) | ||||
| FROM SHARES OF BENEFICIAL INTEREST | ||||||||
| Proceeds from shares sold: | ||||||||
| Class A (GNXAX) | 228,324 | 1,312,845 | ||||||
| Class C (GNXCX) | 590,745 | 330,877 | ||||||
| Class I (GNXIX) | 9,730,408 | 11,826,632 | ||||||
| Net asset value of shares issued in reinvestment of distributions: | ||||||||
| Class A (GNXAX) | 175,548 | 284,881 | ||||||
| Class C (GNXCX) | 37,983 | 63,879 | ||||||
| Class I (GNXIX) | 1,021,076 | 1,381,459 | ||||||
| Payments for shares repurchased: | ||||||||
| Class A (GNXAX) | (1,535,007 | ) | (2,202,005 | ) | ||||
| Class C (GNXCX) | (986,251 | ) | (103,439 | ) | ||||
| Class I (GNXIX) | (10,391,213 | ) | (8,508,309 | ) | ||||
| Net increase (decrease) in net assets from shares of beneficial interest | (1,128,387 | ) | 4,386,820 | |||||
| TOTAL DECREASE IN NET ASSETS | (7,686,733 | ) | (4,407,674 | ) | ||||
| NET ASSETS | ||||||||
| Beginning of Year | 39,399,727 | 43,807,401 | ||||||
| End of Year | $ | 31,712,994 | $ | 39,399,727 | ||||
| SHARE ACTIVITY | ||||||||
| Class A (GNXAX): | ||||||||
| Shares Sold | 19,516 | 77,762 | ||||||
| Shares Reinvested | 15,858 | 17,049 | ||||||
| Shares Repurchased | (132,789 | ) | (133,382 | ) | ||||
| Net decrease in shares of beneficial interest outstanding | (97,415 | ) | (38,571 | ) | ||||
| Class C (GNXCX): | ||||||||
| Shares Sold | 58,395 | 19,948 | ||||||
| Shares Reinvested | 3,593 | 3,960 | ||||||
| Shares Repurchased | (94,397 | ) | (6,410 | ) | ||||
| Net increase (decrease) in shares of beneficial interest outstanding | (32,409 | ) | 17,498 | |||||
| Class I (GNXIX): | ||||||||
| Shares Sold | 818,422 | 684,024 | ||||||
| Shares Reinvested | 90,843 | 81,598 | ||||||
| Shares Repurchased | (874,531 | ) | (504,240 | ) | ||||
| Net increase in shares of beneficial interest outstanding | 34,734 | 261,382 | ||||||
See accompanying notes to consolidated financial statements.
68
| AlphaCentric Symmetry Strategy Fund |
| CONSOLIDATED STATEMENTS OF CHANGES IN NET ASSETS |
| Year Ended | Year Ended | |||||||
| March 31, 2023 | March 31, 2022 | |||||||
| FROM OPERATIONS | ||||||||
| Net investment income (loss) | $ | 326,189 | $ | (128,025 | ) | |||
| Net realized gain (loss) from investments, foreign currencies translation, futures contracts and swap contracts | (547,755 | ) | 7,515,869 | |||||
| Net change in unrealized depreciation on investments, foreign currencies translation, futures contracts and swap contracts | (1,687,778 | ) | (3,209,213 | ) | ||||
| Net increase (decrease) in net assets resulting from operations | (1,909,344 | ) | 4,178,631 | |||||
| DISTRIBUTIONS TO SHAREHOLDERS | ||||||||
| Total distributions paid: | ||||||||
| Class A (SYMAX) | (50,614 | ) | (360 | ) | ||||
| Class C (SYMCX) | (71,984 | ) | — | |||||
| Class I (SYMIX) | (4,629,201 | ) | (82,940 | ) | ||||
| Total distributions to shareholders | (4,751,799 | ) | (83,300 | ) | ||||
| FROM SHARES OF BENEFICIAL INTEREST | ||||||||
| Proceeds from shares sold: | ||||||||
| Class A (SYMAX) | 872,238 | 199,062 | ||||||
| Class C (SYMCX) | 1,117,443 | 8,000 | ||||||
| Class I (SYMIX) | 25,514,484 | 1,991,981 | ||||||
| Net asset value of shares issued in reinvestment of distributions: | ||||||||
| Class A (SYMAX) | 35,927 | 358 | ||||||
| Class C (SYMCX) | 71,886 | — | ||||||
| Class I (SYMIX) | 4,172,379 | 78,431 | ||||||
| Payments for shares repurchased: | ||||||||
| Class A (SYMAX) | (191,747 | ) | — | |||||
| Class C (SYMCX) | (137,756 | ) | — | |||||
| Class I (SYMIX) | (9,138,073 | ) | (7,876,787 | ) | ||||
| Net increase (decrease) in net assets from shares of beneficial interest | 22,316,781 | (5,598,955 | ) | |||||
| TOTAL INCREASE (DECREASE) IN NET ASSETS | 15,655,638 | (1,503,624 | ) | |||||
| NET ASSETS | ||||||||
| Beginning of Year | 35,117,587 | 36,621,211 | ||||||
| End of Year | $ | 50,773,225 | $ | 35,117,587 | ||||
| SHARE ACTIVITY | ||||||||
| Class A (SYMAX): | ||||||||
| Shares Sold | 71,906 | 16,417 | ||||||
| Shares Reinvested | 3,116 | 30 | ||||||
| Shares Repurchased | (15,632 | ) | — | |||||
| Net increase in shares of beneficial interest outstanding | 59,390 | 16,447 | ||||||
| Class C (SYMCX): | ||||||||
| Shares Sold | 90,532 | 633 | ||||||
| Shares Reinvested | 6,328 | — | ||||||
| Shares Repurchased | (11,738 | ) | — | |||||
| Net increase in shares of beneficial interest outstanding | 85,122 | 633 | ||||||
| Class I (SYMIX): | ||||||||
| Shares Sold | 2,018,139 | 167,122 | ||||||
| Shares Reinvested | 361,872 | 6,608 | ||||||
| Shares Repurchased | (785,934 | ) | (638,514 | ) | ||||
| Net increase (decrease) in shares of beneficial interest outstanding | 1,594,077 | (464,784 | ) | |||||
See accompanying notes to consolidated financial statements.
69
| AlphaCentric LifeSci Healthcare Fund |
| STATEMENTS OF CHANGES IN NET ASSETS |
| Year Ended | Year Ended | |||||||
| March 31, 2023 | March 31, 2022 | |||||||
| FROM OPERATIONS | ||||||||
| Net investment loss | $ | (230,930 | ) | $ | (404,269 | ) | ||
| Net realized gain from investments | 596,506 | 2,448,141 | ||||||
| Net change in unrealized appreciation (depreciation) on investments and foreign currency translation | 857,030 | (3,581,565 | ) | |||||
| Net increase (decrease) in net assets resulting from operations | 1,222,606 | (1,537,693 | ) | |||||
| DISTRIBUTIONS TO SHAREHOLDERS | ||||||||
| Total distributions paid: | ||||||||
| Class A (LYFAX) | (84,977 | ) | (196,257 | ) | ||||
| Class C (LYFCX) | (15,109 | ) | (28,628 | ) | ||||
| Class I (LYFIX) | (2,098,747 | ) | (3,806,307 | ) | ||||
| Total distributions to shareholders | (2,198,833 | ) | (4,031,192 | ) | ||||
| FROM SHARES OF BENEFICIAL INTEREST | ||||||||
| Proceeds from shares sold: | ||||||||
| Class A (LYFAX) | 3,088,160 | 1,192,922 | ||||||
| Class C (LYFCX) | 496,202 | 239,841 | ||||||
| Class I (LYFIX) | 57,979,380 | 23,341,758 | ||||||
| Net asset value of shares issued in reinvestment of distributions: | ||||||||
| Class A (LYFAX) | 69,852 | 148,921 | ||||||
| Class C (LYFCX) | 14,303 | 28,628 | ||||||
| Class I (LYFIX) | 1,722,708 | 3,316,270 | ||||||
| Payments for shares repurchased: | ||||||||
| Class A (LYFAX) | (1,071,666 | ) | (604,108 | ) | ||||
| Class C (LYFCX) | (89,040 | ) | (140,652 | ) | ||||
| Class I (LYFIX) | (13,317,881 | ) | (18,274,074 | ) | ||||
| Net increase in net assets from shares of beneficial interest | 48,892,018 | 9,249,506 | ||||||
| TOTAL INCREASE IN NET ASSETS | 47,915,791 | 3,680,621 | ||||||
| NET ASSETS | ||||||||
| Beginning of Year | 31,600,058 | 27,919,437 | ||||||
| End of Year | $ | 79,515,849 | $ | 31,600,058 | ||||
| SHARE ACTIVITY | ||||||||
| Class A (LYFAX): | ||||||||
| Shares Sold | 232,845 | 82,652 | ||||||
| Shares Reinvested | 5,802 | 11,810 | ||||||
| Shares Repurchased | (87,030 | ) | (42,348 | ) | ||||
| Net increase in shares of beneficial interest outstanding | 151,617 | 52,114 | ||||||
| Class C (LYFCX): | ||||||||
| Shares Sold | 37,659 | 16,524 | ||||||
| Shares Reinvested | 1,201 | 2,276 | ||||||
| Shares Repurchased | (6,962 | ) | (10,031 | ) | ||||
| Net increase in shares of beneficial interest outstanding | 31,898 | 8,769 | ||||||
| Class I (LYFIX): | ||||||||
| Shares Sold | 4,414,786 | 1,567,650 | ||||||
| Shares Reinvested | 142,373 | 262,363 | ||||||
| Shares Repurchased | (1,091,546 | ) | (1,325,795 | ) | ||||
| Net increase in shares of beneficial interest outstanding | 3,465,613 | 504,218 | ||||||
See accompanying notes to consolidated financial statements.
70
| AlphaCentric SWBC Municipal Opportunities Fund |
| STATEMENTS OF CHANGES IN NET ASSETS |
| Year Ended | Year Ended | |||||||
| March 31, 2023 | March 31, 2022 | |||||||
| FROM OPERATIONS | ||||||||
| Net investment income | $ | 328,695 | $ | 178,939 | ||||
| Net realized loss from investments, futures contracts and swaps contracts | (937,292 | ) | (726,866 | ) | ||||
| Net change in unrealized depreciation on investments, futures contracts and swap contracts | (45,711 | ) | (480,046 | ) | ||||
| Net decrease in net assets resulting from operations | (654,308 | ) | (1,027,973 | ) | ||||
| DISTRIBUTIONS TO SHAREHOLDERS | ||||||||
| Total distributions paid: | ||||||||
| Class A (MUNAX) | (69,968 | ) | (45,088 | ) | ||||
| Class C (MUNCX) | (11,051 | ) | (10,080 | ) | ||||
| Class I (MUNIX) | (243,659 | ) | (165,815 | ) | ||||
| Total distributions to shareholders | (324,678 | ) | (220,983 | ) | ||||
| FROM SHARES OF BENEFICIAL INTEREST | ||||||||
| Proceeds from shares sold: | ||||||||
| Class A (MUNAX) | 86,527 | 2,147,116 | ||||||
| Class C (MUNCX) | — | 306,350 | ||||||
| Class I (MUNIX) | 3,121,128 | 9,631,830 | ||||||
| Net asset value of shares issued in reinvestment of distributions: | ||||||||
| Class A (MUNAX) | 64,095 | 42,041 | ||||||
| Class C (MUNCX) | 7,430 | 8,359 | ||||||
| Class I (MUNIX) | 172,181 | 118,184 | ||||||
| Payments for shares repurchased: | ||||||||
| Class A (MUNAX) | (60 | ) | (51,061 | ) | ||||
| Class I (MUNIX) | (1,673,641 | ) | (3,677,873 | ) | ||||
| Net increase in net assets from shares of beneficial interest | 1,777,660 | 8,524,946 | ||||||
| TOTAL INCREASE IN NET ASSETS | 798,674 | 7,275,990 | ||||||
| NET ASSETS | ||||||||
| Beginning of Year | 8,894,668 | 1,618,678 | ||||||
| End of Year | $ | 9,693,342 | $ | 8,894,668 | ||||
| SHARE ACTIVITY | ||||||||
| Class A (MUNAX): | ||||||||
| Shares Sold | 9,331 | 204,648 | ||||||
| Shares Reinvested | 7,502 | 4,093 | ||||||
| Shares Repurchased | (7 | ) | (4,808 | ) | ||||
| Net increase in shares of beneficial interest outstanding | 16,826 | 203,933 | ||||||
| Class C (MUNCX): | ||||||||
| Shares Sold | — | 28,966 | ||||||
| Shares Reinvested | 869 | 803 | ||||||
| Net increase in shares of beneficial interest outstanding | 869 | 29,769 | ||||||
| Class I (MUNIX): | ||||||||
| Shares Sold | 358,688 | 920,927 | ||||||
| Shares Reinvested | 20,157 | 11,488 | ||||||
| Shares Repurchased | (198,175 | ) | (367,285 | ) | ||||
| Net increase in shares of beneficial interest outstanding | 180,670 | 565,130 | ||||||
See accompanying notes to consolidated financial statements.
71
| AlphaCentric Strategic Income Fund |
| STATEMENTS OF CHANGES IN NET ASSETS |
| Year Ended | Period Ended | |||||||
| March 31, 2023 | March 31, 2022 * | |||||||
| FROM OPERATIONS | ||||||||
| Net investment income | $ | 1,765,914 | $ | 475,968 | ||||
| Net realized gain from investments | 409,394 | 649,744 | ||||||
| Net change in unrealized depreciation on investments | (7,127,240 | ) | (1,527,950 | ) | ||||
| Net decrease in net assets resulting from operations | (4,951,932 | ) | (402,238 | ) | ||||
| DISTRIBUTIONS TO SHAREHOLDERS | ||||||||
| From return of capital: | ||||||||
| Class A (SIIAX) | (4,931 | ) | (867 | ) | ||||
| Class C (SIICX) | (11,890 | ) | (1,510 | ) | ||||
| Class I (SIIIX) | (693,518 | ) | (164,401 | ) | ||||
| Total distributions paid: | ||||||||
| Class A (SIIAX) | (11,026 | ) | (2,139 | ) | ||||
| Class C (SIICX) | (33,781 | ) | (7,083 | ) | ||||
| Class I (SIIIX) | (2,130,505 | ) | (1,149,038 | ) | ||||
| Total distributions to shareholders | (2,885,651 | ) | (1,325,038 | ) | ||||
| FROM SHARES OF BENEFICIAL INTEREST | ||||||||
| Proceeds from shares sold: | ||||||||
| Class A (SIIAX) | 253,527 | 299,840 | ||||||
| Class C (SIICX) | 652,544 | 572,300 | ||||||
| Class I (SIIIX) | 17,696,460 | 50,299,941 | ||||||
| Net asset value of shares issued in reinvestment of distributions: | ||||||||
| Class A (SIIAX) | 15,957 | 3,006 | ||||||
| Class C (SIICX) | 43,414 | 7,997 | ||||||
| Class I (SIIIX) | 1,861,561 | 1,067,474 | ||||||
| Payments for shares repurchased: | ||||||||
| Class A (SIIAX) | (12,039 | ) | (49,111 | ) | ||||
| Class C (SIICX) | (164,451 | ) | (176 | ) | ||||
| Class I (SIIIX) | (10,896,446 | ) | (4,126,506 | ) | ||||
| Net increase in net assets from shares of beneficial interest | 9,450,527 | 48,074,765 | ||||||
| TOTAL INCREASE IN NET ASSETS | 1,612,944 | 46,347,489 | ||||||
| NET ASSETS | ||||||||
| Beginning of Period | 46,347,489 | — | ||||||
| End of Period | $ | 47,960,433 | $ | 46,347,489 | ||||
| SHARE ACTIVITY | ||||||||
| Class A (SIIAX): | ||||||||
| Shares Sold | 17,251 | 16,470 | ||||||
| Shares Reinvested | 1,027 | 167 | ||||||
| Shares Repurchased | (794 | ) | (2,708 | ) | ||||
| Net increase in shares of beneficial interest outstanding | 17,484 | 13,929 | ||||||
| Class C (SIICX): | ||||||||
| Shares Sold | 42,263 | 31,471 | ||||||
| Shares Reinvested | 2,800 | 441 | ||||||
| Shares Repurchased | (10,704 | ) | (10 | ) | ||||
| Net increase in shares of beneficial interest outstanding | 34,359 | 31,902 | ||||||
| Class I (SIIIX): | ||||||||
| Shares Sold | 1,114,416 | 2,741,560 | ||||||
| Shares Reinvested | 119,010 | 58,365 | ||||||
| Shares Repurchased | (683,237 | ) | (225,418 | ) | ||||
| Net increase in shares of beneficial interest outstanding | 550,189 | 2,574,507 | ||||||
| * | AlphaCentric Strategic Income Fund Class A, Class C and Class I commenced operations on May 28, 2021. |
See accompanying notes to consolidated financial statements.
72
| AlphaCentric Income Opportunities Fund |
| FINANCIAL HIGHLIGHTS |
| Per Share Data and Ratios for a Share of Beneficial Interest Outstanding Throughout Each Year Presented |
| Year Ended | Year Ended | Year Ended | Year Ended | Year Ended | ||||||||||||||||
| March 31, | March 31, | March 31, | March 31, | March 31, | ||||||||||||||||
| Class A (IOFAX) | 2023 | 2022 | 2021 | 2020 | 2019 | |||||||||||||||
| Net asset value, beginning of year | $ | 11.48 | $ | 11.50 | $ | 8.15 | $ | 12.28 | $ | 12.23 | ||||||||||
| Activity from investment operations: | ||||||||||||||||||||
| Net investment income (1) | 0.22 | 0.13 | 0.19 | 0.46 | 0.56 | |||||||||||||||
| Net realized and unrealized gain (loss) on investments | (2.52 | ) | 0.30 | 3.62 | (4.02 | ) | 0.08 | |||||||||||||
| Total from investment operations | (2.30 | ) | 0.43 | 3.81 | (3.56 | ) | 0.64 | |||||||||||||
| Less distributions from: | ||||||||||||||||||||
| Net investment income | (0.19 | ) | (0.26 | ) | (0.21 | ) | (0.48 | ) | (0.57 | ) | ||||||||||
| Return of capital | (0.31 | ) | (0.19 | ) | (0.25 | ) | (0.09 | ) | (0.02 | ) | ||||||||||
| Total distributions | (0.50 | ) | (0.45 | ) | (0.46 | ) | (0.57 | ) | (0.59 | ) | ||||||||||
| Net asset value, end of year | $ | 8.68 | $ | 11.48 | $ | 11.50 | $ | 8.15 | $ | 12.28 | ||||||||||
| Total return (2)(5) | (20.20 | )% | 3.68 | % | 47.64 | % | (30.45 | )% | 5.31 | % | ||||||||||
| Net assets, at end of year (000s) | $ | 44,561 | $ | 146,192 | $ | 221,961 | $ | 152,646 | $ | 334,481 | ||||||||||
| Ratio of gross expenses to average net assets before expense reimbursement or recapture (3)(4) | 2.18 | % (11) | 1.95 | % (10) | 1.97 | % (9) | 1.93 | % (8) | 1.92 | % (7) | ||||||||||
| Ratio of net expenses to average net assets after expense reimbursement or recapture (4) | 1.90 | % (11) | 1.76 | % (10) | 1.75 | % (9) | 1.75 | % (8) | 1.75 | % (7) | ||||||||||
| Ratio of net investment income to average net assets (4)(6) | 2.32 | % (11) | 1.09 | % (10) | 1.83 | % (9) | 3.67 | % (8) | 4.56 | % (7) | ||||||||||
| Portfolio Turnover Rate (5) | 0 | % | 14 | % | 3 | % | 54 | % | 33 | % | ||||||||||
| (1) | Per share amounts calculated using the average shares method. |
| (2) | Total return in the above table is historical in nature and represents the rate that the investor would have earned or lost on an investment in the Fund assuming reinvestment of dividends and capital gain distributions, if any, and does not reflect the impact of sales charges. Had the manager not waived a portion of the Fund’s expenses, total returns would have been lower. |
| (3) | Represents the ratio of expenses to average net assets absent fee waivers and/or expense reimbursements by the manager. |
| (4) | Annualized for periods less than one year. |
| (5) | Not annualized for periods less than one year. |
| (6) | Recognition of net investment income (loss) is affected by the timing and declaration of dividends by the underlying investment companies in which the Fund invests. |
| (7) | Includes 0.01% for the year ended March 31, 2019 attributed to line of credit fees which are not subject to waiver by the manager. |
| (8) | Includes 0.01% for the year ended March 31, 2020 attributed to line of credit fees which are not subject to waiver by the manager. |
| (9) | Includes 0.01% for the year ended March 31, 2021 attributed to line of credit fees and deemed extraordinary expenses which are not subject to waiver by the manager. |
| (10) | Includes 0.02% for the year ended March 31, 2022 attributed to line of credit fees and deemed extraordinary expenses which are not subject to waiver by the manager. |
| (11) | Includes 0.16% for the year ended March 31, 2023 attributed to line of credit fees and deemed extraordinary expenses which are not subject to waiver by the manager. |
See accompanying notes to consolidated financial statements.
73
| AlphaCentric Income Opportunities Fund |
| FINANCIAL HIGHLIGHTS |
| Per Share Data and Ratios for a Share of Beneficial Interest Outstanding Throughout Each Year Presented |
| Year Ended | Year Ended | Year Ended | Year Ended | Year Ended | ||||||||||||||||
| March 31, | March 31, | March 31, | March 31, | March 31, | ||||||||||||||||
| Class C (IOFCX) | 2023 | 2022 | 2021 | 2020 | 2019 | |||||||||||||||
| Net asset value, beginning of year | $ | 11.43 | $ | 11.45 | $ | 8.12 | $ | 12.24 | $ | 12.20 | ||||||||||
| Activity from investment operations: | ||||||||||||||||||||
| Net investment income (1) | 0.16 | 0.04 | 0.11 | 0.37 | 0.47 | |||||||||||||||
| Net realized and unrealized gain (loss) on investments | (2.51 | ) | 0.30 | 3.61 | (4.01 | ) | 0.07 | |||||||||||||
| Total from investment operations | (2.35 | ) | 0.34 | 3.72 | (3.64 | ) | 0.54 | |||||||||||||
| Less distributions from: | ||||||||||||||||||||
| Net investment income | (0.17 | ) | (0.21 | ) | (0.14 | ) | (0.41 | ) | (0.48 | ) | ||||||||||
| Return of capital | (0.26 | ) | (0.15 | ) | (0.25 | ) | (0.07 | ) | (0.02 | ) | ||||||||||
| Total distributions | (0.43 | ) | (0.36 | ) | (0.39 | ) | (0.48 | ) | (0.50 | ) | ||||||||||
| Net asset value, end of year | $ | 8.65 | $ | 11.43 | $ | 11.45 | $ | 8.12 | $ | 12.24 | ||||||||||
| Total return (2)(5) | (20.74 | )% | 2.92 | % | 46.47 | % | (30.98 | )% | 4.50 | % | ||||||||||
| Net assets, at end of year (000s) | $ | 46,084 | $ | 100,794 | $ | 118,599 | $ | 87,724 | $ | 98,682 | ||||||||||
| Ratio of gross expenses to average net assets before expense reimbursement or recapture (3)(4) | 2.93 | % (11) | 2.71 | % (10) | 2.72 | % (9) | 2.68 | % (8) | 2.68 | % (7) | ||||||||||
| Ratio of net expenses to average net assets after expense reimbursement or recapture (4) | 2.65 | % (11) | 2.51 | % (10) | 2.50 | % (9) | 2.50 | % (8) | 2.50 | % (7) | ||||||||||
| Ratio of net investment income to average net assets (4)(6) | 1.66 | % (11) | 0.34 | % (10) | 1.08 | % (9) | 2.95 | % (8) | 3.80 | % (7) | ||||||||||
| Portfolio Turnover Rate (5) | 0 | % | 14 | % | 3 | % | 54 | % | 33 | % | ||||||||||
| (1) | Per share amounts calculated using the average shares method. |
| (2) | Total return in the above table is historical in nature and represents the rate that the investor would have earned or lost on an investment in the Fund assuming reinvestment of dividends and capital gain distributions, if any, and does not reflect the impact of sales charges. Had the manager not waived a portion of the Fund’s expenses, total returns would have been lower. |
| (3) | Represents the ratio of expenses to average net assets absent fee waivers and/or expense reimbursements by the manager. |
| (4) | Annualized for periods less than one year. |
| (5) | Not annualized for periods less than one year. |
| (6) | Recognition of net investment income (loss) is affected by the timing and declaration of dividends by the underlying investment companies in which the Fund invests. |
| (7) | Includes 0.01% for the year ended March 31, 2019 attributed to line of credit fees which are not subject to waiver by the manager. |
| (8) | Includes 0.01% for the year ended March 31, 2020 attributed to line of credit fees which are not subject to waiver by the manager. |
| (9) | Includes 0.01% for the year ended March 31, 2021 attributed to line of credit fees and deemed extraordinary expenses which are not subject to waiver by the manager. |
| (10) | Includes 0.02% for the year ended March 31, 2022 attributed to line of credit fees and deemed extraordinary expenses which are not subject to waiver by the manager. |
| (11) | Includes 0.16% for the year ended March 31, 2023 attributed to line of credit fees and deemed extraordinary expenses which are not subject to waiver by the manager. |
See accompanying notes to consolidated financial statements.
74
| AlphaCentric Income Opportunities Fund |
| FINANCIAL HIGHLIGHTS |
| Per Share Data and Ratios for a Share of Beneficial Interest Outstanding Throughout Each Year Presented |
| Year Ended | Year Ended | Year Ended | Year Ended | Year Ended | ||||||||||||||||
| March 31, | March 31, | March 31, | March 31, | March 31, | ||||||||||||||||
| Class I (IOFIX) | 2023 | 2022 | 2021 | 2020 | 2019 | |||||||||||||||
| Net asset value, beginning of year | $ | 11.49 | $ | 11.51 | $ | 8.16 | $ | 12.30 | $ | 12.25 | ||||||||||
| Activity from investment operations: | ||||||||||||||||||||
| Net investment income (1) | 0.25 | 0.16 | 0.22 | 0.50 | 0.59 | |||||||||||||||
| Net realized and unrealized gain (loss) on investments | (2.52 | ) | 0.30 | 3.63 | (4.03 | ) | 0.08 | |||||||||||||
| Total from investment operations | (2.27 | ) | 0.46 | 3.85 | (3.53 | ) | 0.67 | |||||||||||||
| Less distributions from: | ||||||||||||||||||||
| Net investment income | (0.20 | ) | (0.28 | ) | (0.23 | ) | (0.52 | ) | (0.60 | ) | ||||||||||
| Return of capital | (0.33 | ) | (0.20 | ) | (0.27 | ) | (0.09 | ) | (0.02 | ) | ||||||||||
| Total distributions | (0.53 | ) | (0.48 | ) | (0.50 | ) | (0.61 | ) | (0.62 | ) | ||||||||||
| Net asset value, end of year | $ | 8.69 | $ | 11.49 | $ | 11.51 | $ | 8.16 | $ | 12.30 | ||||||||||
| Total return (2)(5) | (19.99 | )% | 3.93 | % | 47.94 | % | (30.29 | )% | 5.56 | % | ||||||||||
| Net assets, at end of year (000s) | $ | 528,778 | $ | 2,189,289 | $ | 3,315,245 | $ | 1,515,562 | $ | 2,169,166 | ||||||||||
| Ratio of gross expenses to average net assets before expense reimbursement or recapture (3)(4) | 1.93 | % (11) | 1.70 | % (10) | 1.72 | % (9) | 1.68 | % (8) | 1.68 | % (7) | ||||||||||
| Ratio of net expenses to average net assets after expense reimbursement or recapture (4) | 1.65 | % (11) | 1.51 | % (10) | 1.50 | % (9) | 1.50 | % (8) | 1.50 | % (7) | ||||||||||
| Ratio of net investment income to average net assets (4)(6) | 2.56 | % (11) | 1.34 | % (10) | 2.07 | % (9) | 3.91 | % (8) | 4.80 | % (7) | ||||||||||
| Portfolio Turnover Rate (5) | 0 | % | 14 | % | 3 | % | 54 | % | 33 | % | ||||||||||
| (1) | Per share amounts calculated using the average shares method. |
| (2) | Total return in the above table is historical in nature and represents the rate that the investor would have earned or lost on an investment in the Fund assuming reinvestment of dividends and capital gain distributions, if any, and does not reflect the impact of sales charges. Had the manager not waived a portion of the Fund’s expenses, total returns would have been lower. |
| (3) | Represents the ratio of expenses to average net assets absent fee waivers and/or expense reimbursements by the manager. |
| (4) | Annualized for periods less than one year. |
| (5) | Not annualized for periods less than one year. |
| (6) | Recognition of net investment income (loss) is affected by the timing and declaration of dividends by the underlying investment companies in which the Fund invests. |
| (7) | Includes 0.01% for the year ended March 31, 2019 attributed to line of credit fees which are not subject to waiver by the manager. |
| (8) | Includes 0.01% for the year ended March 31, 2020 attributed to line of credit fees which are not subject to waiver by the manager. |
| (9) | Includes 0.01% for the year ended March 31, 2021 attributed to line of credit fees and deemed extraordinary expenses which are not subject to waiver by the manager. |
| (10) | Includes 0.02% for the year ended March 31, 2022 attributed to line of credit fees and deemed extraordinary expenses which are not subject to waiver by the manager. |
| (11) | Includes 0.16% for the year ended March 31, 2023 attributed to line of credit fees and deemed extraordinary expenses which are not subject to waiver by the manager. |
See accompanying notes to consolidated financial statements.
75
| AlphaCentric Premium Opportunity Fund |
| FINANCIAL HIGHLIGHTS |
| Per Share Data and Ratios for a Share of Beneficial Interest Outstanding Throughout Each Year Presented |
| Year Ended | Year Ended | Year Ended | Year Ended | Year Ended | ||||||||||||||||
| March 31, | March 31, | March 31, | March 31, | March 31, | ||||||||||||||||
| Class A (HMXAX) | 2023 | 2022 | 2021 | 2020 | 2019 | |||||||||||||||
| Net asset value, beginning of year | $ | 25.14 | $ | 25.80 | $ | 23.12 | $ | 18.70 | $ | 16.26 | ||||||||||
| Activity from investment operations: | ||||||||||||||||||||
| Net investment loss (1) | (0.07 | ) | (0.58 | ) | (0.53 | ) | (0.06 | ) | (0.10 | ) | ||||||||||
| Net realized and unrealized gain (loss) on investments | (1.07 | ) | 1.19 | 3.79 | 4.48 | 2.54 | ||||||||||||||
| Total from investment operations | (1.14 | ) | 0.61 | 3.26 | 4.42 | 2.44 | ||||||||||||||
| Less distributions from: | ||||||||||||||||||||
| Net realized gains | — | (1.27 | ) | (0.58 | ) | — | — | |||||||||||||
| Total distributions | — | (1.27 | ) | (0.58 | ) | — | — | |||||||||||||
| Net asset value, end of year | $ | 24.00 | $ | 25.14 | $ | 25.80 | $ | 23.12 | $ | 18.70 | ||||||||||
| Total return (2)(5) | (4.53 | )% | 2.24 | % | 14.17 | % | 23.64 | % | 15.01 | % | ||||||||||
| Net assets, at end of year (000s) | $ | 7,452 | $ | 6,187 | $ | 6,455 | $ | 1,722 | $ | 1,604 | ||||||||||
| Ratio of gross expenses to average net assets before expense reimbursement or recapture (3)(4) | 2.37 | % | 2.25 | % | 2.31 | % (9) | 3.19 | % (8) | 3.47 | % (7) | ||||||||||
| Ratio of net expenses to average net assets after expense reimbursement or recapture (4) | 2.24 | % | 2.24 | % | 2.25 | % (9) | 2.33 | % (8) | 2.32 | % (7) | ||||||||||
| Ratio of net investment loss to average net assets (4) | (0.31 | )% | (2.22 | )% | (2.11 | )% (9) | (0.31 | )% (8) | (0.61 | )% (7) | ||||||||||
| Portfolio Turnover Rate (5)(6) | 0 | % | 0 | % | 9 | % | 0 | % | 54 | % | ||||||||||
| (1) | Per share amounts calculated using the average shares method. |
| (2) | Total return in the above table is historical in nature and represents the rate that the investor would have earned or lost on an investment in the Fund assuming reinvestment of dividends and capital gain distributions, if any, and does not reflect the impact of sales charges. Had the manager not waived a portion of the Fund’s expenses, total returns would have been lower. |
| (3) | Represents the ratio of expenses to average net assets absent fee waivers and/or expense reimbursements by the manager. |
| (4) | Annualized for periods less than one year. |
| (5) | Not annualized for periods less than one year. |
| (6) | All securities whose maturity or expiration date at the time of acquisition were one year or less are excluded from the portfolio turnover calculation. |
| (7) | Includes 0.08% for the year ended March 31, 2019 attributable to margin expense on short sales, which is not subject to waiver by the manager. |
| (8) | Includes 0.09% for the year ended March 31, 2020 attributable to margin expense on short sales, which is not subject to waiver by the manager. |
| (9) | Includes 0.01% for the year ended March 31, 2021 attributable to margin expense on short sales, which is not subject to waiver by the manager. |
See accompanying notes to consolidated financial statements.
76
| AlphaCentric Premium Opportunity Fund |
| FINANCIAL HIGHLIGHTS |
| Per Share Data and Ratios for a Share of Beneficial Interest Outstanding Throughout Each Year Presented |
| Year Ended | Year Ended | Year Ended | Year Ended | Year Ended | ||||||||||||||||
| March 31, | March 31, | March 31, | March 31, | March 31, | ||||||||||||||||
| Class C (HMXCX) | 2023 | 2022 | 2021 | 2020 | 2019 | |||||||||||||||
| Net asset value, beginning of year | $ | 24.24 | $ | 25.10 | $ | 22.68 | $ | 18.38 | $ | 16.10 | ||||||||||
| Activity from investment operations: | ||||||||||||||||||||
| Net investment loss (1) | (0.29 | ) | (0.75 | ) | (0.71 | ) | (0.25 | ) | (0.23 | ) | ||||||||||
| Net realized and unrealized gain (loss) on investments | (0.99 | ) | 1.16 | 3.71 | 4.55 | 2.51 | ||||||||||||||
| Total from investment operations | (1.28 | ) | 0.41 | 3.00 | 4.30 | 2.28 | ||||||||||||||
| Less distributions from: | ||||||||||||||||||||
| Net realized gains | — | (1.27 | ) | (0.58 | ) | — | — | |||||||||||||
| Total distributions | — | (1.27 | ) | (0.58 | ) | — | — | |||||||||||||
| Net asset value, end of year | $ | 22.96 | $ | 24.24 | $ | 25.10 | $ | 22.68 | $ | 18.38 | ||||||||||
| Total return (2)(5) | (5.28 | )% | 1.50 | % | 13.29 | % | 23.40 | % | 14.16 | % | ||||||||||
| Net assets, at end of year (000s) | $ | 1,783 | $ | 3,652 | $ | 2,079 | $ | 164 | $ | 62 | ||||||||||
| Ratio of gross expenses to average net assets before expense reimbursement or recapture (3)(4) | 3.12 | % | 3.00 | % | 3.06 | % (9) | 3.94 | % (8) | 4.23 | % (7) | ||||||||||
| Ratio of net expenses to average net assets after expense reimbursement or recapture (4) | 2.99 | % | 2.99 | % | 3.00 | % (9) | 3.04 | % (8) | 3.06 | % (7) | ||||||||||
| Ratio of net investment loss to average net assets (4) | (1.30 | )% | (2.97 | )% | (2.88 | )% (9) | (1.23 | )% (8) | (1.37 | )% (7) | ||||||||||
| Portfolio Turnover Rate (5)(6) | 0 | % | 0 | % | 9 | % | 0 | % | 54 | % | ||||||||||
| (1) | Per share amounts calculated using the average shares method. |
| (2) | Total return in the above table is historical in nature and represents the rate that the investor would have earned or lost on an investment in the Fund assuming reinvestment of dividends and capital gain distributions, if any, and does not reflect the impact of sales charges. Had the manager not waived a portion of the Fund’s expenses, total returns would have been lower. |
| (3) | Represents the ratio of expenses to average net assets absent fee waivers and/or expense reimbursements by the manager. |
| (4) | Annualized for periods less than one year. |
| (5) | Not annualized for periods less than one year. |
| (6) | All securities whose maturity or expiration date at the time of acquisition were one year or less are excluded from the portfolio turnover calculation. |
| (7) | Includes 0.07% for the year ended March 31, 2019 attributable to margin expense on short sales, which is not subject to waiver by the manager. |
| (8) | Includes 0.05% for the year ended March 31, 2020 attributable to margin expense on short sales, which is not subject to waiver by the manager. |
| (9) | Includes 0.01% for the year ended March 31, 2021 attributable to margin expense on short sales, which is not subject to waiver by the manager. |
See accompanying notes to consolidated financial statements.
77
| AlphaCentric Premium Opportunity Fund |
| FINANCIAL HIGHLIGHTS |
| Per Share Data and Ratios for a Share of Beneficial Interest Outstanding Throughout Each Year Presented |
| Year Ended | Year Ended | Year Ended | Year Ended | Year Ended | ||||||||||||||||
| March 31, | March 31, | March 31, | March 31, | March 31, | ||||||||||||||||
| Class I (HMXIX) | 2023 | 2022 | 2021 | 2020 | 2019 | |||||||||||||||
| Net asset value, beginning of year | $ | 25.67 | $ | 26.25 | $ | 23.46 | $ | 18.93 | $ | 16.42 | ||||||||||
| Activity from investment operations: | ||||||||||||||||||||
| Net investment loss (1) | (0.07 | ) | (0.52 | ) | (0.48 | ) | (0.03 | ) | (0.05 | ) | ||||||||||
| Net realized and unrealized gain (loss) on investments | (1.04 | ) | 1.21 | 3.85 | 4.56 | 2.56 | ||||||||||||||
| Total from investment operations | (1.11 | ) | 0.69 | 3.37 | 4.53 | 2.51 | ||||||||||||||
| Less distributions from: | ||||||||||||||||||||
| Net realized gains | — | (1.27 | ) | (0.58 | ) | — | — | |||||||||||||
| Total distributions | — | (1.27 | ) | (0.58 | ) | — | — | |||||||||||||
| Net asset value, end of year | $ | 24.56 | $ | 25.67 | $ | 26.25 | $ | 23.46 | $ | 18.93 | ||||||||||
| Total return (2)(5) | (4.32 | )% | 2.51 | % | 14.43 | % | 23.93 | % | 15.29 | % | ||||||||||
| Net assets, at end of year (000s) | $ | 79,979 | $ | 167,686 | $ | 93,490 | $ | 26,792 | $ | 6,867 | ||||||||||
| Ratio of gross expenses to average net assets before expense reimbursement or recapture (3)(4) | 2.12 | % | 2.01 | % | 2.06 | % (9) | 2.94 | % (8) | 3.20 | % (7) | ||||||||||
| Ratio of net expenses to average net assets after expense reimbursement or recapture (4) | 1.99 | % | 1.99 | % | 2.00 | % (9) | 2.05 | % (8) | 2.09 | % (7) | ||||||||||
| Ratio of net investment loss to average net assets (4) | (0.30 | )% | (1.97 | )% | (1.87 | )% (9) | (0.13 | )% (8) | (0.32 | )% (7) | ||||||||||
| Portfolio Turnover Rate (5)(6) | 0 | % | 0 | % | 9 | % | 0 | % | 54 | % | ||||||||||
| (1) | Per share amounts calculated using the average shares method. |
| (2) | Total return in the above table is historical in nature and represents the rate that the investor would have earned or lost on an investment in the Fund assuming reinvestment of dividends and capital gain distributions, if any, and does not reflect the impact of sales charges. Had the manager not waived a portion of the Fund’s expenses, total returns would have been lower. |
| (3) | Represents the ratio of expenses to average net assets absent fee waivers and/or expense reimbursements by the manager. |
| (4) | Annualized for periods less than one year. |
| (5) | Not annualized for periods less than one year. |
| (6) | All securities whose maturity or expiration date at the time of acquisition were one year or less are excluded from the portfolio turnover calculation. |
| (7) | Includes 0.10% for the year ended March 31, 2019 attributable to margin expense on short sales, which is not subject to waiver by the manager. |
| (8) | Includes 0.06% for the year ended March 31, 2020 attributable to margin expense on short sales, which is not subject to waiver by the manager. |
| (9) | Includes 0.01% for the year ended March 31, 2021 attributable to margin expense on short sales, which is not subject to waiver by the manager. |
See accompanying notes to consolidated financial statements.
78
| AlphaCentric Robotics and Automation Fund |
| FINANCIAL HIGHLIGHTS |
| Per Share Data and Ratios for a Share of Beneficial Interest Outstanding Throughout Each Year Presented |
| Year Ended | Year Ended | Year Ended | Year Ended | Year Ended | ||||||||||||||||
| March 31, | March 31, | March 31, | March 31, | March 31, | ||||||||||||||||
| Class A (GNXAX) | 2023 | 2022 | 2021 | 2020 | 2019 | |||||||||||||||
| Net asset value, beginning of year | $ | 13.99 | $ | 17.06 | $ | 9.63 | $ | 11.46 | $ | 12.50 | ||||||||||
| Activity from investment operations: | ||||||||||||||||||||
| Net investment loss (1) | (0.02 | ) | (0.14 | ) | (0.14 | ) | (0.08 | ) | (0.10 | ) | ||||||||||
| Net realized and unrealized gain (loss) on investments | (1.78 | ) | (2.20 | ) | 7.57 | (1.75 | ) | (0.62 | ) | |||||||||||
| Total from investment operations | (1.80 | ) | (2.34 | ) | 7.43 | (1.83 | ) | (0.72 | ) | |||||||||||
| Less distributions from: | ||||||||||||||||||||
| Net realized gains | (0.58 | ) | (0.73 | ) | — | — | (0.32 | ) | ||||||||||||
| Total distributions | (0.58 | ) | (0.73 | ) | — | — | (0.32 | ) | ||||||||||||
| Net asset value, end of year | $ | 11.61 | $ | 13.99 | $ | 17.06 | $ | 9.63 | $ | 11.46 | ||||||||||
| Total return (2)(5) | (12.70 | )% | (14.41 | )% | 77.15 | % | (15.97 | )% | (5.29 | )% | ||||||||||
| Net assets, at end of year (000s) | $ | 3,729 | $ | 5,853 | $ | 7,796 | $ | 4,711 | $ | 4,450 | ||||||||||
| Ratio of gross expenses to average net assets before expense reimbursement or recapture (3)(4) | 2.31 | % | 2.02 | % | 2.10 | % | 2.18 | % | 2.41 | % (6) | ||||||||||
| Ratio of net expenses to average net assets after expense reimbursement or recapture (4) | 1.65 | % | 1.65 | % | 1.65 | % | 1.65 | % | 1.67 | % (6) | ||||||||||
| Ratio of net investment loss to average net assets (4) | (0.20 | )% | (0.85 | )% | (0.96 | )% | (0.69 | )% | (0.84 | )% (6) | ||||||||||
| Portfolio Turnover Rate (5) | 38 | % | 73 | % | 125 | % | 315 | % | 297 | % | ||||||||||
| (1) | Per share amounts calculated using the average shares method. |
| (2) | Total return in the above table is historical in nature and represents the rate that the investor would have earned or lost on an investment in the Fund assuming reinvestment of dividends and capital gain distributions, if any, and does not reflect the impact of sales charges. Had the manager not waived a portion of the Fund’s expenses, total returns would have been lower. |
| (3) | Represents the ratio of expenses to average net assets absent fee waivers and/or expense reimbursements by the manager. |
| (4) | Annualized for periods less than one year. |
| (5) | Not annualized for periods less than one year. |
| (6) | Includes 0.02% for the year ended March 31, 2019 attributable to interest expense, which is not subject to waiver by the manager. |
See accompanying notes to consolidated financial statements.
79
| AlphaCentric Robotics and Automation Fund |
| FINANCIAL HIGHLIGHTS |
| Per Share Data and Ratios for a Share of Beneficial Interest Outstanding Throughout Each Year Presented |
| Year Ended | Year Ended | Year Ended | Year Ended | Year Ended | ||||||||||||||||
| March 31, | March 31, | March 31, | March 31, | March 31, | ||||||||||||||||
| Class C (GNXCX) | 2023 | 2022 | 2021 | 2020 | 2019 | |||||||||||||||
| Net asset value, beginning of year | $ | 13.47 | $ | 16.57 | $ | 9.43 | $ | 11.30 | $ | 12.43 | ||||||||||
| Activity from investment operations: | ||||||||||||||||||||
| Net investment loss (1) | (0.10 | ) | (0.26 | ) | (0.24 | ) | (0.16 | ) | (0.17 | ) | ||||||||||
| Net realized and unrealized gain (loss) on investments | (1.72 | ) | (2.11 | ) | 7.38 | (1.71 | ) | (0.64 | ) | |||||||||||
| Total from investment operations | (1.82 | ) | (2.37 | ) | 7.14 | (1.87 | ) | (0.81 | ) | |||||||||||
| Less distributions from: | ||||||||||||||||||||
| Net realized gains | (0.58 | ) | (0.73 | ) | — | — | (0.32 | ) | ||||||||||||
| Total distributions | (0.58 | ) | (0.73 | ) | — | — | (0.32 | ) | ||||||||||||
| Net asset value, end of year | $ | 11.07 | $ | 13.47 | $ | 16.57 | $ | 9.43 | $ | 11.30 | ||||||||||
| Total return (2)(5) | (13.34 | )% | (15.03 | )% | 75.72 | % | (16.55 | )% | (6.05 | )% | ||||||||||
| Net assets, at end of year (000s) | $ | 676 | $ | 1,258 | $ | 1,258 | $ | 828 | $ | 767 | ||||||||||
| Ratio of gross expenses to average net assets before expense reimbursement or recapture (3)(4) | 3.06 | % | 2.78 | % | 2.85 | % | 2.93 | % | 3.17 | % (6) | ||||||||||
| Ratio of net expenses to average net assets after expense reimbursement or recapture (4) | 2.40 | % | 2.40 | % | 2.40 | % | 2.40 | % | 2.41 | % (6) | ||||||||||
| Ratio of net investment loss to average net assets (4) | (0.96 | )% | (1.61 | )% | (1.71 | )% | (1.47 | )% | (1.50 | )% (6) | ||||||||||
| Portfolio Turnover Rate (5) | 38 | % | 73 | % | 125 | % | 315 | % | 297 | % | ||||||||||
| (1) | Per share amounts calculated using the average shares method. |
| (2) | Total return in the above table is historical in nature and represents the rate that the investor would have earned or lost on an investment in the Fund assuming reinvestment of dividends and capital gain distributions, if any, and does not reflect the impact of sales charges. Had the manager not waived a portion of the Fund’s expenses, total returns would have been lower. |
| (3) | Represents the ratio of expenses to average net assets absent fee waivers and/or expense reimbursements by the manager. |
| (4) | Annualized for periods less than one year. |
| (5) | Not annualized for periods less than one year. |
| (6) | Includes 0.01% for the year ended March 31, 2019 attributable to interest expense, which is not subject to waiver by the manager. |
See accompanying notes to consolidated financial statements.
80
| AlphaCentric Robotics and Automation Fund |
| FINANCIAL HIGHLIGHTS |
| Per Share Data and Ratios for a Share of Beneficial Interest Outstanding Throughout Each Year Presented |
| Year Ended | Year Ended | Year Ended | Year Ended | Year Ended | ||||||||||||||||
| March 31, | March 31, | March 31, | March 31, | March 31, | ||||||||||||||||
| Class I (GNXIX) | 2023 | 2022 | 2021 | 2020 | 2019 | |||||||||||||||
| Net asset value, beginning of year | $ | 14.17 | $ | 17.23 | $ | 9.71 | $ | 11.52 | $ | 12.54 | ||||||||||
| Activity from investment operations: | ||||||||||||||||||||
| Net investment income (loss) (1) | 0.01 | (7) | (0.10 | ) | (0.10 | ) | (0.05 | ) | (0.06 | ) | ||||||||||
| Net realized and unrealized gain (loss) on investments | (1.79 | ) | (2.23 | ) | 7.62 | (1.76 | ) | (0.64 | ) | |||||||||||
| Total from investment operations | (1.78 | ) | (2.33 | ) | 7.52 | (1.81 | ) | (0.70 | ) | |||||||||||
| Less distributions from: | ||||||||||||||||||||
| Net realized gains | (0.58 | ) | (0.73 | ) | — | — | (0.32 | ) | ||||||||||||
| Total distributions | (0.58 | ) | (0.73 | ) | — | — | (0.32 | ) | ||||||||||||
| Net asset value, end of year | $ | 11.81 | $ | 14.17 | $ | 17.23 | $ | 9.71 | $ | 11.52 | ||||||||||
| Total return (2)(5) | (12.39 | )% | (14.21 | )% | 77.45 | % | (15.71 | )% | (5.11 | )% | ||||||||||
| Net assets, at end of year (000s) | $ | 27,309 | $ | 32,289 | $ | 34,754 | $ | 20,392 | $ | 17,968 | ||||||||||
| Ratio of gross expenses to average net assets before expense reimbursement or recapture (3)(4) | 2.06 | % | 1.78 | % | 1.85 | % | 1.93 | % | 2.16 | % (6) | ||||||||||
| Ratio of net expenses to average net assets after expense reimbursement or recapture (4) | 1.40 | % | 1.40 | % | 1.40 | % | 1.40 | % | 1.42 | % (6) | ||||||||||
| Ratio of net investment income (loss) to average net assets (4) | 0.03 | % | (0.60 | )% | (0.70 | )% | (0.46 | )% | (0.53 | )% (6) | ||||||||||
| Portfolio Turnover Rate (5) | 38 | % | 73 | % | 125 | % | 315 | % | 297 | % | ||||||||||
| (1) | Per share amounts calculated using the average shares method. |
| (2) | Total return in the above table is historical in nature and represents the rate that the investor would have earned or lost on an investment in the Fund assuming reinvestment of dividends and capital gain distributions, if any, and does not reflect the impact of sales charges. Had the manager not waived a portion of the Fund’s expenses, total returns would have been lower. |
| (3) | Represents the ratio of expenses to average net assets absent fee waivers and/or expense reimbursements by the manager. |
| (4) | Annualized for periods less than one year. |
| (5) | Not annualized for periods less than one year. |
| (6) | Includes 0.02% for the year ended March 31, 2019 attributable to interest expense, which is not subject to waiver by the manager. |
| (7) | Net investment income (loss) per share are balancing amounts necessary to reconcile the change in net asset value per share for the period, and may not accord with the aggregate gains and losses in the Statement of Operations due to share transactions for the period. |
See accompanying notes to consolidated financial statements.
81
| AlphaCentric Symmetry Strategy Fund |
| CONSOLIDATED FINANCIAL HIGHLIGHTS |
| Per Share Data and Ratios for a Share of Beneficial Interest Outstanding Throughout Each Period Presented |
| Year Ended | Year Ended | Year Ended | Period Ended | |||||||||||||
| March 31, | March 31, | March 31, | March 31, | |||||||||||||
| Class A (SYMAX) | 2023 | 2022 | 2021 | 2020 (1) | ||||||||||||
| Net asset value, beginning of period | $ | 12.76 | $ | 11.46 | $ | 9.75 | $ | 11.28 | ||||||||
| Activity from investment operations: | ||||||||||||||||
| Net investment income (loss) (2) | 0.08 | (0.08 | ) | (0.04 | ) | 0.05 | ||||||||||
| Net realized and unrealized gain (loss) on investments | (0.43 | ) | 1.40 | 1.89 | (1.33 | ) (8) | ||||||||||
| Total from investment operations | (0.35 | ) | 1.32 | 1.85 | (1.28 | ) | ||||||||||
| Less distributions from: | ||||||||||||||||
| Net investment income | (0.98 | ) | (0.02 | ) | (0.14 | ) | (0.25 | ) | ||||||||
| Net realized gains | (0.13 | ) | — | — | — | |||||||||||
| Total distributions | (1.11 | ) | (0.02 | ) | (0.14 | ) | (0.25 | ) | ||||||||
| Net asset value, end of period | $ | 11.30 | $ | 12.76 | $ | 11.46 | $ | 9.75 | ||||||||
| Total return (3)(6) | (2.86 | )% | 11.57 | % | 19.11 | % | (11.64 | )% | ||||||||
| Net assets, at end of period (000s) | $ | 858 | $ | 211 | $ | 1,016 | (7) | $ | 865 | (7) | ||||||
| Ratio of gross expenses to average net assets before expense reimbursement or recapture (4)(5) | 1.95 | % | 2.38 | % (11) | 2.63 | % (10) | 2.51 | % (9) | ||||||||
| Ratio of net expenses to average net assets after expense reimbursement or recapture (5) | 1.85 | % | 2.01 | % (11) | 2.26 | % (10) | 2.25 | % (9) | ||||||||
| Ratio of net investment income (loss) to average net assets (5) | 0.65 | % | (0.54 | )% (11) | (0.45 | )% (10) | 0.38 | % (9) | ||||||||
| Portfolio Turnover Rate (6) | 362 | % | 189 | % | 121 | % | 133 | % | ||||||||
| (1) | AlphaCentric Symmetry Strategy Fund Class A commenced operations on August 8, 2019. |
| (2) | Per share amounts calculated using the average shares method. |
| (3) | Total return in the above table is historical in nature and represents the rate that the investor would have earned or lost on an investment in the Fund assuming reinvestment of dividends and capital gain distributions, if any, and does not reflect the impact of sales charges. Had the manager not waived a portion of the Fund’s expenses, total returns would have been lower. |
| (4) | Represents the ratio of expenses to average net assets absent fee waivers and/or expense reimbursements by the manager. |
| (5) | Annualized for periods less than one year. |
| (6) | Not annualized for periods less than one year. |
| (7) | Actual net assets, not truncated. |
| (8) | As required by SEC standard per share calculation methodology, this represents a rebalancing figure derived from other amounts in the financial highlights tables that captures all other changes affecting net asset value per share. This per share gain amount does not correlate to the aggregrate of the net realized and unrealized loss in the Statement of Operations for the period ended March 31, 2020, primarily due to the timing of sales and repurchases of the Fund’s shares in relation to fluctuating market values of the Fund’s portfolio. |
| (9) | Includes 0.01% for the period ended March 31, 2020 attributable to margin expense on futures, which is not subject to waiver by the manager. |
| (10) | Includes 0.02% for the year ended March 31, 2021 attributable to margin expense on futures, which is not subject to waiver by the manager. |
| (11) | Includes 0.02% for the year ended March 31, 2022 attributable to margin expense on futures, which is not subject to waiver by the manager. |
See accompanying notes to consolidated financial statements.
82
| AlphaCentric Symmetry Strategy Fund |
| CONSOLIDATED FINANCIAL HIGHLIGHTS |
| Per Share Data and Ratios for a Share of Beneficial Interest Outstanding Throughout Each Period Presented |
| Year Ended | Year Ended | Year Ended | Period Ended | |||||||||||||
| March 31, | March 31, | March 31, | March 31, | |||||||||||||
| Class C (SYMCX) | 2023 | 2022 | 2021 | 2020 (1) | ||||||||||||
| Net asset value, beginning of period | $ | 12.63 | $ | 11.42 | $ | 9.75 | $ | 11.28 | ||||||||
| Activity from investment operations: | ||||||||||||||||
| Net investment income (loss) (2) | 0.01 | (0.15 | ) | (0.12 | ) | (0.00 | ) (7) | |||||||||
| Net realized and unrealized gain (loss) on investments | (0.44 | ) | 1.36 | 1.88 | (1.33 | ) (9) | ||||||||||
| Total from investment operations | (0.43 | ) | 1.21 | 1.76 | (1.33 | ) | ||||||||||
| Less distributions from: | ||||||||||||||||
| Net investment income | (0.96 | ) | — | (0.09 | ) | (0.20 | ) | |||||||||
| Net realized gains | (0.13 | ) | — | — | �� | |||||||||||
| Total distributions | (1.09 | ) | — | (0.09 | ) | (0.20 | ) | |||||||||
| Net asset value, end of period | $ | 11.11 | $ | 12.63 | $ | 11.42 | $ | 9.75 | ||||||||
| Total return (3)(6) | (3.53 | )% | 10.60 | % | 18.10 | % | (11.97 | )% | ||||||||
| Net assets, at end of period (000s) | $ | 954 | $ | 9 | $ | 1,013 | (8) | $ | 864 | (8) | ||||||
| Ratio of gross expenses to average net assets before expense reimbursement or recapture (4)(5) | 2.70 | % | 3.12 | % (12) | 3.37 | % (11) | 3.26 | % (10) | ||||||||
| Ratio of net expenses to average net assets after expense reimbursement or recapture (5) | 2.60 | % | 2.76 | % (12) | 3.01 | % (11) | 3.00 | % (10) | ||||||||
| Ratio of net investment income (loss) to average net assets (5) | 0.06 | % | (1.29 | )% (12) | (1.20 | )% (11) | (0.16 | )% (10) | ||||||||
| Portfolio Turnover Rate (6) | 362 | % | 189 | % | 121 | % | 133 | % | ||||||||
| (1) | AlphaCentric Symmetry Strategy Fund Class C commenced operations on August 8, 2019. |
| (2) | Per share amounts calculated using the average shares method. |
| (3) | Total return in the above table is historical in nature and represents the rate that the investor would have earned or lost on an investment in the Fund assuming reinvestment of dividends and capital gain distributions, if any, and does not reflect the impact of sales charges. Had the manager not waived a portion of the Fund’s expenses, total returns would have been lower. |
| (4) | Represents the ratio of expenses to average net assets absent fee waivers and/or expense reimbursements by the manager. |
| (5) | Annualized for periods less than one year. |
| (6) | Not annualized for periods less than one year. |
| (7) | Less than $0.01 |
| (8) | Actual net assets, not truncated. |
| (9) | As required by SEC standard per share calculation methodology, this represents a rebalancing figure derived from other amounts in the financial highlights tables that captures all other changes affecting net asset value per share. This per share gain amount does not correlate to the aggregrate of the net realized and unrealized loss in the Statement of Operations for the period ended March 31, 2020, primarily due to the timing of sales and repurchases of the Fund’s shares in relation to fluctuating market values of the Fund’s portfolio. |
| (10) | Includes 0.01% for the period ended March 31, 2020 attributable to margin expense on futures, which is not subject to waiver by the manager. |
| (11) | Includes 0.02% for the year ended March 31, 2021 attributable to margin expense on futures, which is not subject to waiver by the manager. |
| (12) | Includes 0.02% for the year ended March 31, 2022 attributable to margin expense on futures, which is not subject to waiver by the manager. |
See accompanying notes to consolidated financial statements.
83
| AlphaCentric Symmetry Strategy Fund |
| CONSOLIDATED FINANCIAL HIGHLIGHTS |
| Per Share Data and Ratios for a Share of Beneficial Interest Outstanding Throughout Each Period Presented |
| Year Ended | Year Ended | Year Ended | Period Ended | |||||||||||||
| March 31, | March 31, | March 31, | March 31, | |||||||||||||
| Class I (SYMIX) | 2023 | 2022 | 2021 | 2020 (1) | ||||||||||||
| Net asset value, beginning of period | $ | 12.75 | $ | 11.44 | $ | 9.75 | $ | 11.28 | ||||||||
| Activity from investment operations: | ||||||||||||||||
| Net investment income (loss) (2) | 0.08 | (0.04 | ) | (0.02 | ) | 0.07 | ||||||||||
| Net realized and unrealized gain (loss) on investments | (0.40 | ) | 1.38 | 1.89 | (1.33 | ) (7) | ||||||||||
| Total from investment operations | (0.32 | ) | 1.34 | 1.87 | (1.26 | ) | ||||||||||
| Less distributions from: | ||||||||||||||||
| Net investment income | (1.00 | ) | (0.03 | ) | (0.18 | ) | (0.27 | ) | ||||||||
| Net realized gains | (0.13 | ) | — | — | — | |||||||||||
| Total distributions | (1.14 | ) | (0.03 | ) | (0.18 | ) | (0.27 | ) | ||||||||
| Net asset value, end of period | $ | 11.30 | $ | 12.75 | $ | 11.44 | $ | 9.75 | ||||||||
| Total return (3)(6) | (2.65 | )% | 11.74 | % | 19.37 | % | (11.47 | )% | ||||||||
| Net assets, at end of period (000s) | $ | 48,961 | $ | 34,898 | $ | 36,619 | $ | 30,845 | ||||||||
| Ratio of gross expenses to average net assets before expense reimbursement or recapture (4)(5) | 1.70 | % | 2.12 | % (10) | 2.38 | % (9) | 2.26 | % (8) | ||||||||
| Ratio of net expenses to average net assets after expense reimbursement or recapture (5) | 1.60 | % | 1.76 | % (10) | 2.01 | % (9) | 2.00 | % (8) | ||||||||
| Ratio of net investment income (loss) to average net assets (5) | 0.71 | % | (0.29 | )% (10) | (0.21 | )% (9) | 0.96 | % (8) | ||||||||
| Portfolio Turnover Rate (6) | 362 | % | 189 | % | 121 | % | 133 | % | ||||||||
| (1) | AlphaCentric Symmetry Strategy Fund Class I commenced operations on September 1, 2014 and does not include performance prior to August 8, 2019 when Class I shares were previously shares of a private fund. |
| (2) | Per share amounts calculated using the average shares method. |
| (3) | Total return in the above table is historical in nature and represents the rate that the investor would have earned or lost on an investment in the Fund assuming reinvestment of dividends and capital gain distributions, if any, and does not reflect the impact of sales charges. Had the manager not waived a portion of the Fund’s expenses, total returns would have been lower. |
| (4) | Represents the ratio of expenses to average net assets absent fee waivers and/or expense reimbursements by the manager. |
| (5) | Annualized for periods less than one year. |
| (6) | Not annualized for periods less than one year. |
| (7) | As required by SEC standard per share calculation methodology, this represents a rebalancing figure derived from other amounts in the financial highlights tables that captures all other changes affecting net asset value per share. This per share gain amount does not correlate to the aggregrate of the net realized and unrealized loss in the Statement of Operations for the period ended March 31, 2020, primarily due to the timing of sales and repurchases of the Fund’s shares in relation to fluctuating market values of the Fund’s portfolio. |
| (8) | Includes 0.01% for the period ended March 31, 2020 attributable to margin expense on futures, which is not subject to waiver by the manager. |
| (9) | Includes 0.02% for the year ended March 31, 2021 attributable to margin expense on futures, which is not subject to waiver by the manager. |
| (10) | Includes 0.02% for the year ended March 31, 2022 attributable to margin expense on futures, which is not subject to waiver by the manager. |
See accompanying notes to consolidated financial statements.
84
| AlphaCentric LifeSci Healthcare Fund |
| FINANCIAL HIGHLIGHTS |
| Per Share Data and Ratios for a Share of Beneficial Interest Outstanding Throughout Each Period Presented |
| Year Ended | Year Ended | Year Ended | Period Ended | |||||||||||||
| March 31, | March 31, | March 31, | March 31, | |||||||||||||
| Class A (LYFAX) | 2023 | 2022 | 2021 | 2020 (1) | ||||||||||||
| Net asset value, beginning of period | $ | 13.38 | $ | 15.56 | $ | 9.55 | $ | 10.00 | ||||||||
| Activity from investment operations: | ||||||||||||||||
| Net investment loss (2) | (0.09 | ) | (0.21 | ) | (0.19 | ) | (0.04 | ) | ||||||||
| Net realized and unrealized gain (loss) on investments | 0.44 | (0.32 | ) | 6.55 | (0.41 | ) | ||||||||||
| Total from investment operations | 0.35 | (0.53 | ) | 6.36 | (0.45 | ) | ||||||||||
| Less distributions from: | ||||||||||||||||
| Net investment income | — | (0.07 | ) | — | — | |||||||||||
| Net realized gains | (0.55 | ) | (1.58 | ) | (0.35 | ) | — | |||||||||
| Total distributions | (0.55 | ) | (1.65 | ) | (0.35 | ) | — | |||||||||
| Net asset value, end of period | $ | 13.18 | $ | 13.38 | $ | 15.56 | $ | 9.55 | ||||||||
| Total return (3)(6) | 3.00 | % | (2.74 | )% | 66.70 | % | (4.50 | )% | ||||||||
| Net assets, at end of period (000s) | $ | 3,786 | $ | 1,815 | $ | 1,300 | $ | 10 | (7) | |||||||
| Ratio of gross expenses to average net assets before expense reimbursement or recapture (4)(5) | 2.00 | % (10) | 2.11 | % (9) | 2.78 | % (8) | 24.39 | % | ||||||||
| Ratio of net expenses to average net assets after expense reimbursement or recapture (5) | 1.65 | % (10) | 1.66 | % (9) | 1.66 | % (8) | 1.65 | % | ||||||||
| Ratio of net investment loss to average net assets (5) | (0.71 | )% (10) | (1.46 | )% (9) | (1.21 | )% (8) | (0.48 | )% | ||||||||
| Portfolio Turnover Rate (6) | 142 | % | 167 | % | 141 | % | 215 | % | ||||||||
| (1) | The AlphaCentric LifeSci Healthcare Fund Class A commenced operations on November 29, 2019. |
| (2) | Per share amounts calculated using the average shares method. |
| (3) | Total return in the above table is historical in nature and represents the rate that the investor would have earned or lost on an investment in the Fund assuming reinvestment of dividends and capital gain distributions, if any, and does not reflect the impact of sales charges. Had the manager not waived and reimbursed a portion of the Fund’s expenses, total returns would have been lower. |
| (4) | Represents the ratio of expenses to average net assets absent fee waivers and/or expense reimbursements by the manager. |
| (5) | Annualized for periods less than one year. |
| (6) | Not annualized for periods less than one year. |
| (7) | Actual net assets, not truncated. |
| (8) | Includes 0.01% for the year ended March 31, 2021 attributable to extraordinary expenses which are not subject to waiver by the manager. |
| (9) | Includes 0.01% for the year ended March 31, 2022 attributed to line of credit fees which are not subject to waiver by the manager. |
| (10) | Includes 0.00% for the year ended March 31, 2023 attributed to line of credit fees which are not subject to waiver by the manager. |
See accompanying notes to consolidated financial statements.
85
| AlphaCentric LifeSci Healthcare Fund |
| FINANCIAL HIGHLIGHTS |
| Per Share Data and Ratios for a Share of Beneficial Interest Outstanding Throughout Each Period Presented |
| Year Ended | Year Ended | Year Ended | Period Ended | |||||||||||||
| March 31, | March 31, | March 31, | March 31, | |||||||||||||
| Class C (LYFCX) | 2023 | 2022 | 2021 | 2020 (1) | ||||||||||||
| Net asset value, beginning of period | $ | 13.31 | $ | 15.53 | $ | 9.55 | $ | 10.00 | ||||||||
| Activity from investment operations: | ||||||||||||||||
| Net investment loss (2) | (0.18 | ) | (0.32 | ) | (0.32 | ) | (0.06 | ) | ||||||||
| Net realized and unrealized gain (loss) on investments | 0.43 | (0.32 | ) | 6.65 | (0.39 | ) | ||||||||||
| Total from investment operations | 0.25 | (0.64 | ) | 6.33 | (0.45 | ) | ||||||||||
| Less distributions from: | ||||||||||||||||
| Net realized gains | (0.55 | ) | (1.58 | ) | (0.35 | ) | — | |||||||||
| Total distributions | (0.55 | ) | (1.58 | ) | (0.35 | ) | — | |||||||||
| Net asset value, end of period | $ | 13.01 | $ | 13.31 | $ | 15.53 | $ | 9.55 | ||||||||
| Total return (3)(6) | 2.26 | % | (3.54 | )% | 66.38 | % | (4.50 | )% | ||||||||
| Net assets, at end of period (000s) | $ | 709 | $ | 302 | $ | 215 | $ | 10 | (7) | |||||||
| Ratio of gross expenses to average net assets before expense reimbursement or recapture (4)(5) | 2.75 | % (10) | 2.86 | % (9) | 3.53 | % (8) | 25.14 | % | ||||||||
| Ratio of net expenses to average net assets after expense reimbursement or recapture (5) | 2.40 | % (10) | 2.41 | % (9) | 2.41 | % (8) | 2.40 | % | ||||||||
| Ratio of net investment loss to average net assets (5) | (1.49 | )% (10) | (2.21 | )% (9) | (1.96 | )% (8) | (1.23 | )% | ||||||||
| Portfolio Turnover Rate (6) | 142 | % | 167 | % | 141 | % | 215 | % | ||||||||
| (1) | The AlphaCentric LifeSci Healthcare Fund Class C commenced operations on November 29, 2019. |
| (2) | Per share amounts calculated using the average shares method. |
| (3) | Total return in the above table is historical in nature and represents the rate that the investor would have earned or lost on an investment in the Fund assuming reinvestment of dividends and capital gain distributions, if any, and does not reflect the impact of sales charges. Had the manager not waived and reimbursed a portion of the Fund’s expenses, total returns would have been lower. |
| (4) | Represents the ratio of expenses to average net assets absent fee waivers and/or expense reimbursements by the manager. |
| (5) | Annualized for periods less than one year. |
| (6) | Not annualized for periods less than one year. |
| (7) | Actual net assets, not truncated. |
| (8) | Includes 0.01% for the year ended March 31, 2021 attributable to extraordinary expenses which are not subject to waiver by the manager. |
| (9) | Includes 0.01% for the year ended March 31, 2022 attributed to line of credit fees which are not subject to waiver by the manager. |
| (10) | Includes 0.00% for the year ended March 31, 2023 attributed to line of credit fees which are not subject to waiver by the manager. |
See accompanying notes to consolidated financial statements.
86
| AlphaCentric LifeSci Healthcare Fund |
| FINANCIAL HIGHLIGHTS |
| Per Share Data and Ratios for a Share of Beneficial Interest Outstanding Throughout Each Period Presented |
| Year Ended | Year Ended | Year Ended | Period Ended | |||||||||||||
| March 31, | March 31, | March 31, | March 31, | |||||||||||||
| Class I (LYFIX) | 2023 | 2022 | 2021 | 2020 (1) | ||||||||||||
| Net asset value, beginning of period | $ | 13.42 | $ | 15.59 | $ | 9.55 | $ | 10.00 | ||||||||
| Activity from investment operations: | ||||||||||||||||
| Net investment loss (2) | (0.06 | ) | (0.18 | ) | (0.14 | ) | (0.01 | ) | ||||||||
| Net realized and unrealized gain (loss) on investments | 0.44 | (0.31 | ) | 6.53 | (0.44 | ) | ||||||||||
| Total from investment operations | 0.38 | (0.49 | ) | 6.39 | (0.45 | ) | ||||||||||
| Less distributions from: | ||||||||||||||||
| Net investment income | — | (0.10 | ) | (0.00 | ) (7) | — | ||||||||||
| Net realized gains | (0.55 | ) | (1.58 | ) | (0.35 | ) | — | |||||||||
| Total distributions | (0.55 | ) | (1.68 | ) | (0.35 | ) | — | |||||||||
| Net asset value, end of period | $ | 13.25 | $ | 13.42 | $ | 15.59 | $ | 9.55 | ||||||||
| Total return (3)(6) | 3.22 | % | (2.47 | )% | 67.02 | % | (4.50 | )% | ||||||||
| Net assets, at end of period (000s) | $ | 75,021 | $ | 29,483 | $ | 26,404 | $ | 1,601 | ||||||||
| Ratio of gross expenses to average net assets before expense reimbursement or recapture (4)(5) | 1.75 | % (10) | 1.86 | % (9) | 2.53 | % (8) | 24.14 | % | ||||||||
| Ratio of net expenses to average net assets after expense reimbursement or recapture (5) | 1.40 | % (10) | 1.41 | % (9) | 1.41 | % (8) | 1.40 | % | ||||||||
| Ratio of net investment loss to average net assets (5) | (0.47 | )% (10) | (1.21 | )% (9) | (0.96 | )% (8) | (0.23 | )% | ||||||||
| Portfolio Turnover Rate (6) | 142 | % | 167 | % | 141 | % | 215 | % | ||||||||
| (1) | The AlphaCentric LifeSci Healthcare Fund Class I commenced operations on November 29, 2019. |
| (2) | Per share amounts calculated using the average shares method. |
| (3) | Total return in the above table is historical in nature and represents the rate that the investor would have earned or lost on an investment in the Fund assuming reinvestment of dividends and capital gain distributions, if any, and does not reflect the impact of sales charges. Had the manager not waived and reimbursed a portion of the Fund’s expenses, total returns would have been lower. |
| (4) | Represents the ratio of expenses to average net assets absent fee waivers and/or expense reimbursements by the manager. |
| (5) | Annualized for periods less than one year. |
| (6) | Not annualized for periods less than one year. |
| (7) | Less than $0.01 |
| (8) | Includes 0.01% for the year ended March 31, 2021 attributable to extraordinary expenses which are not subject to waiver by the manager. |
| (9) | Includes 0.01% for the year ended March 31, 2022 attributed to line of credit fees which are not subject to waiver by the manager. |
| (10) | Includes 0.00% for the year ended March 31, 2023 attributed to line of credit fees which are not subject to waiver by the manager. |
See accompanying notes to consolidated financial statements.
87
| AlphaCentric SWBC Municipal Opportunities Fund |
| FINANCIAL HIGHLIGHTS |
| Per Share Data and Ratios for a Share of Beneficial Interest Outstanding Throughout Each Period Presented |
| Year Ended | Year Ended | Year Ended | Period Ended | |||||||||||||
| March 31, | March 31, | March 31, | March 31, | |||||||||||||
| Class A (MUNAX) | 2023 | 2022 | 2021 | 2020 (1) | ||||||||||||
| Net asset value, beginning of period | $ | 9.35 | $ | 10.64 | $ | 10.00 | $ | 10.00 | ||||||||
| Activity from investment operations: | ||||||||||||||||
| Net investment income (loss) (2) | 0.29 | 0.29 | 0.21 | (0.02 | ) | |||||||||||
| Net realized and unrealized gain (loss) on investments | (0.92 | ) | (1.21 | ) | 0.65 | 0.02 | (8) | |||||||||
| Total from investment operations | (0.63 | ) | (0.92 | ) | 0.86 | (0.00 | ) | |||||||||
| Less distributions from: | ||||||||||||||||
| Net investment income | (0.29 | ) | (0.37 | ) | (0.22 | ) | — | |||||||||
| Total distributions | (0.29 | ) | (0.37 | ) | (0.22 | ) | — | |||||||||
| Net asset value, end of period | $ | 8.43 | $ | 9.35 | $ | 10.64 | $ | 10.00 | ||||||||
| Total return (3)(7) | (6.76 | )% | (8.94 | )% | 8.70 | % | 0.00 | % | ||||||||
| Net assets, at end of period (000s) | $ | 2,099 | $ | 2,170 | $ | 300 | $ | 12 | ||||||||
| Ratio of gross expenses to average net assets before expense reimbursement or recapture (4)(5)(6) | 3.02 | % (10) | 3.23 | % (9) | 18.50 | % | 6.29 | % | ||||||||
| Ratio of net expenses to average net assets after expense reimbursement or recapture (5)(6) | 1.50 | % (10) | 1.53 | % (9) | 1.50 | % | 1.50 | % | ||||||||
| Ratio of net investment income (loss) to average net assets (5)(6) | 3.40 | % (10) | 2.70 | % (9) | 2.30 | % | (0.98 | )% | ||||||||
| Portfolio Turnover Rate (7) | 404 | % | 639 | % | 143 | % | 314 | % | ||||||||
| (1) | The AlphaCentric SWBC Municipal Opportunities Fund Class A commenced operations on December 31, 2019. |
| (2) | Per share amounts calculated using the average shares method. |
| (3) | Total return in the above table is historical in nature and represents the rate that the investor would have earned or lost on an investment in the Fund assuming reinvestment of dividends and capital gain distributions, if any, and does not reflect the impact of sales charges. Had the manager not waived and reimbursed a portion of the Fund’s expenses, total returns would have been lower. |
| (4) | Represents the ratio of expenses to average net assets absent fee waivers and/or expense reimbursements by the manager. |
| (5) | Does not include the expenses of other investment companies in which the Fund invests. |
| (6) | Annualized for periods less than one year. |
| (7) | Not annualized for periods less than one year. |
| (8) | As required by SEC standard per share calculation methodology, this represents a rebalancing figure derived from other amounts in the financial highlights tables that captures all other changes affecting net asset value per share. This per share gain amount does not correlate to the aggregrate of the net realized and unrealized loss in the Statement of Operations for the period ended March 31, 2020, primarily due to the timing of sales and repurchases of the Fund’s shares in relation to fluctuating market values of the Fund’s portfolio. |
| (9) | Includes 0.03% for the year ended March 31, 2022 attributed to line of credit fees and deemed extraordinary expenses which are not subject to waiver by the manager. |
| (10) | Includes 0.00% for the year ended March 31, 2023 attributed to line of credit fees and deemed extraordinary expenses which are not subject to waiver by the manager. |
See accompanying notes to consolidated financial statements.
88
| AlphaCentric SWBC Municipal Opportunities Fund |
| FINANCIAL HIGHLIGHTS |
| Per Share Data and Ratios for a Share of Beneficial Interest Outstanding Throughout Each Period Presented |
| Year Ended | Year Ended | Year Ended | Period Ended | |||||||||||||
| March 31, | March 31, | March 31, | March 31, | |||||||||||||
| Class C (MUNCX) | 2023 | 2022 | 2021 | 2020 (1) | ||||||||||||
| Net asset value, beginning of period | $ | 9.35 | $ | 10.65 | $ | 10.03 | $ | 10.00 | ||||||||
| Activity from investment operations: | ||||||||||||||||
| Net investment income (loss) (2) | 0.23 | 0.23 | 0.22 | (0.02 | ) | |||||||||||
| Net realized and unrealized gain (loss) on investments | (0.92 | ) | (1.23 | ) | 0.62 | 0.05 | (9) | |||||||||
| Total from investment operations | (0.69 | ) | (1.00 | ) | 0.84 | 0.03 | ||||||||||
| Less distributions from: | ||||||||||||||||
| Net investment income | (0.22 | ) | (0.30 | ) | (0.22 | ) | — | |||||||||
| Total distributions | (0.22 | ) | (0.30 | ) | (0.22 | ) | — | |||||||||
| Net asset value, end of period | $ | 8.44 | $ | 9.35 | $ | 10.65 | $ | 10.03 | ||||||||
| Total return (3)(7) | (7.42 | )% | (9.69 | )% | 8.47 | % | 0.30 | % | ||||||||
| Net assets, at end of period (000s) | $ | 434 | $ | 473 | $ | 221 | $ | 10 | (8) | |||||||
| Ratio of gross expenses to average net assets before expense reimbursement or recapture (4)(5)(6) | 3.77 | % (11) | 3.98 | % (10) | 19.25 | % | 7.04 | % | ||||||||
| Ratio of net expenses to average net assets after expense reimbursement or recapture (5)(6) | 2.25 | % (11) | 2.28 | % (10) | 2.25 | % | 2.25 | % | ||||||||
| Ratio of net investment income (loss) to average net assets (5)(6) | 2.65 | % (11) | 1.99 | % (10) | 1.55 | % | (0.81 | )% | ||||||||
| Portfolio Turnover Rate (7) | 404 | % | 639 | % | 143 | % | 314 | % | ||||||||
| (1) | The AlphaCentric SWBC Municipal Opportunities Fund Class C commenced operations on December 31, 2019. |
| (2) | Per share amounts calculated using the average shares method. |
| (3) | Total return in the above table is historical in nature and represents the rate that the investor would have earned or lost on an investment in the Fund assuming reinvestment of dividends and capital gain distributions, if any, and does not reflect the impact of sales charges. Had the manager not waived and reimbursed a portion of the Fund’s expenses, total returns would have been lower. |
| (4) | Represents the ratio of expenses to average net assets absent fee waivers and/or expense reimbursements by the manager. |
| (5) | Does not include the expenses of other investment companies in which the Fund invests. |
| (6) | Annualized for periods less than one year. |
| (7) | Not annualized for periods less than one year. |
| (8) | Actual net assets, not truncated. |
| (9) | As required by SEC standard per share calculation methodology, this represents a rebalancing figure derived from other amounts in the financial highlights tables that captures all other changes affecting net asset value per share. This per share gain amount does not correlate to the aggregrate of the net realized and unrealized loss in the Statement of Operations for the period ended March 31, 2020, primarily due to the timing of sales and repurchases of the Fund’s shares in relation to fluctuating market values of the Fund’s portfolio. |
| (10) | Includes 0.03% for the year ended March 31, 2022 attributed to line of credit fees and deemed extraordinary expenses which are not subject to waiver by the manager. |
| (11) | Includes 0.00% for the year ended March 31, 2023 attributed to line of credit fees and deemed extraordinary expenses which are not subject to waiver by the manager. |
See accompanying notes to consolidated financial statements.
89
| AlphaCentric SWBC Municipal Opportunities Fund |
| FINANCIAL HIGHLIGHTS |
| Per Share Data and Ratios for a Share of Beneficial Interest Outstanding Throughout Each Period Presented |
| Year Ended | Year Ended | Year Ended | Period Ended | |||||||||||||
| March 31, | March 31, | March 31, | March 31, | |||||||||||||
| Class I (MUNIX) | 2023 | 2022 | 2021 | 2020 (1) | ||||||||||||
| Net asset value, beginning of period | $ | 9.36 | $ | 10.65 | $ | 10.03 | $ | 10.00 | ||||||||
| Activity from investment operations: | ||||||||||||||||
| Net investment income (2) | 0.32 | 0.31 | 0.27 | 0.04 | ||||||||||||
| Net realized and unrealized gain (loss) on investments | (0.94 | ) | (1.20 | ) | 0.60 | (0.01 | ) (8) | |||||||||
| Total from investment operations | (0.62 | ) | (0.89 | ) | 0.87 | 0.03 | ||||||||||
| Less distributions from: | ||||||||||||||||
| Net investment income | (0.31 | ) | (0.40 | ) | (0.25 | ) | — | |||||||||
| Total distributions | (0.31 | ) | (0.40 | ) | (0.25 | ) | — | |||||||||
| Net asset value, end of period | $ | 8.43 | $ | 9.36 | $ | 10.65 | $ | 10.03 | ||||||||
| Total return (3)(7) | (6.63 | )% | (8.71 | )% | 8.77 | % | 0.30 | % | ||||||||
| Net assets, at end of period (000s) | $ | 7,160 | $ | 6,252 | $ | 1,098 | $ | 383 | ||||||||
| Ratio of gross expenses to average net assets before expense reimbursement or recapture (4)(5)(6) | 2.77 | % (10) | 2.98 | % (9) | 18.25 | % | 6.04 | % | ||||||||
| Ratio of net expenses to average net assets after expense reimbursement or recapture (5)(6) | 1.25 | % (10) | 1.28 | % (9) | 1.25 | % | 1.25 | % | ||||||||
| Ratio of net investment income to average net assets (5)(6) | 3.64 | % (10) | 2.93 | % (9) | 2.55 | % | 1.64 | % | ||||||||
| Portfolio Turnover Rate (7) | 404 | % | 639 | % | 143 | % | 314 | % | ||||||||
| (1) | The AlphaCentric SWBC Municipal Opportunities Fund Class I commenced operations on December 31, 2019. |
| (2) | Per share amounts calculated using the average shares method. |
| (3) | Total return in the above table is historical in nature and represents the rate that the investor would have earned or lost on an investment in the Fund assuming reinvestment of dividends and capital gain distributions, if any, and does not reflect the impact of sales charges. Had the manager not waived and reimbursed a portion of the Fund’s expenses, total returns would have been lower. |
| (4) | Represents the ratio of expenses to average net assets absent fee waivers and/or expense reimbursements by the manager. |
| (5) | Does not include the expenses of other investment companies in which the Fund invests. |
| (6) | Annualized for periods less than one year. |
| (7) | Not annualized for periods less than one year. |
| (8) | As required by SEC standard per share calculation methodology, this represents a rebalancing figure derived from other amounts in the financial highlights tables that captures all other changes affecting net asset value per share. This per share gain amount does not correlate to the aggregrate of the net realized and unrealized loss in the Statement of Operations for the period ended March 31, 2020, primarily due to the timing of sales and repurchases of the Fund’s shares in relation to fluctuating market values of the Fund’s portfolio. |
| (9) | Includes 0.03% for the year ended March 31, 2022 attributed to line of credit fees and deemed extraordinary expenses which are not subject to waiver by the manager. |
| (10) | Includes 0.00% for the year ended March 31, 2023 attributed to line of credit fees and deemed extraordinary expenses which are not subject to waiver by the manager. |
See accompanying notes to consolidated financial statements.
90
| AlphaCentric Strategic Income Fund |
| FINANCIAL HIGHLIGHTS |
| Per Share Data and Ratios for a Share of Beneficial Interest Outstanding Throughout Each Period Presented |
| Year Ended | Period Ended | |||||||
| March 31, | March 31, | |||||||
| Class A (SIIAX) | 2023 | 2022 (1) | ||||||
| Net asset value, beginning of period | $ | 17.67 | $ | 18.48 | ||||
| Activity from investment operations: | ||||||||
| Net investment income (2) | 0.70 | 0.40 | ||||||
| Net realized and unrealized loss on investments | (2.54 | ) | (0.38 | ) (9) | ||||
| Total from investment operations | (1.84 | ) | 0.02 | |||||
| Less distributions from: | ||||||||
| Net investment income | (0.75 | ) | (0.55 | ) | ||||
| Net realized gains | — | (0.18 | ) | |||||
| Return of capital | (0.22 | ) | (0.10 | ) | ||||
| Total distributions | (0.97 | ) | (0.83 | ) | ||||
| Net asset value, end of period | $ | 14.86 | $ | 17.67 | ||||
| Total return (3)(7) | (10.58 | )% | 0.02 | % | ||||
| Net assets, at end of period (000s) | $ | 467 | $ | 246 | ||||
| Ratio of gross expenses to average net assets before expense reimbursement or recapture (4)(5)(6) | 2.37 | % | 2.37 | % (8) | ||||
| Ratio of net expenses to average net assets after expense reimbursement or recapture (5)(6) | 1.74 | % | 1.75 | % (8) | ||||
| Ratio of net investment income to average net assets (5)(6) | 4.42 | % | 2.64 | % (8) | ||||
| Portfolio Turnover Rate (7) | 22 | % | 20 | % | ||||
| (1) | The AlphaCentric Strategic Income Fund Class A commenced operations on May 28, 2021. |
| (2) | Per share amounts calculated using the average shares method. |
| (3) | Total return in the above table is historical in nature and represents the rate that the investor would have earned or lost on an investment in the Fund assuming reinvestment of dividends and capital gain distributions, if any, and does not reflect the impact of sales charges. Had the manager not waived and reimbursed a portion of the Fund’s expenses, total returns would have been lower. |
| (4) | Represents the ratio of expenses to average net assets absent fee waivers and/or expense reimbursements by the manager. |
| (5) | Does not include the expenses of other investment companies in which the Fund invests. |
| (6) | Annualized for periods less than one year. |
| (7) | Not annualized for periods less than one year. |
| (8) | Includes 0.01% for the period ended March 31, 2022 attributed to line of credit fees which are not subject to waiver by the manager. |
| (9) | The amount of net realized and unrealized gain on investments per share does not accord with the amounts in the Statements of Operations due to the timing of shareholder subscriptions and redemptions relative to fluctuating net asset values during the year. |
See accompanying notes to consolidated financial statements.
91
| AlphaCentric Strategic Income Fund |
| FINANCIAL HIGHLIGHTS |
| Per Share Data and Ratios for a Share of Beneficial Interest Outstanding Throughout Each Period Presented |
| Year Ended | Period Ended | |||||||
| March 31, | March 31, | |||||||
| Class C (SIICX) | 2023 | 2022 (1) | ||||||
| Net asset value, beginning of period | $ | 17.64 | $ | 18.48 | ||||
| Activity from investment operations: | ||||||||
| Net investment income (2) | 0.51 | 0.21 | ||||||
| Net realized and unrealized loss on investments | (2.47 | ) | (0.31 | ) (9) | ||||
| Total from investment operations | (1.96 | ) | (0.10 | ) | ||||
| Less distributions from: | ||||||||
| Net investment income | (0.65 | ) | (0.47 | ) | ||||
| Net realized gains | — | (0.18 | ) | |||||
| Return of capital | (0.20 | ) | (0.09 | ) | ||||
| Total distributions | (0.85 | ) | (0.74 | ) | ||||
| Net asset value, end of period | $ | 14.83 | $ | 17.64 | ||||
| Total return (3)(7) | (11.24 | )% | (0.61 | )% | ||||
| Net assets, at end of period (000s) | $ | 983 | $ | 563 | ||||
| Ratio of gross expenses to average net assets before expense reimbursement or recapture (4)(5)(6) | 3.12 | % | 3.12 | % (8) | ||||
| Ratio of net expenses to average net assets after expense reimbursement or recapture (5)(6) | 2.49 | % | 2.50 | % (8) | ||||
| Ratio of net investment income to average net assets (5)(6) | 3.26 | % | 1.41 | % (8) | ||||
| Portfolio Turnover Rate (7) | 22 | % | 20 | % | ||||
| (1) | The AlphaCentric Strategic Income Fund Class C commenced operations on May 28, 2021. |
| (2) | Per share amounts calculated using the average shares method. |
| (3) | Total return in the above table is historical in nature and represents the rate that the investor would have earned or lost on an investment in the Fund assuming reinvestment of dividends and capital gain distributions, if any, and does not reflect the impact of sales charges. Had the manager not waived and reimbursed a portion of the Fund’s expenses, total returns would have been lower. |
| (4) | Represents the ratio of expenses to average net assets absent fee waivers and/or expense reimbursements by the manager. |
| (5) | Does not include the expenses of other investment companies in which the Fund invests. |
| (6) | Annualized for periods less than one year. |
| (7) | Not annualized for periods less than one year. |
| (8) | Includes 0.01% for the period ended March 31, 2022 attributed to line of credit fees which are not subject to waiver by the manager. |
| (9) | The amount of net realized and unrealized gain on investments per share does not accord with the amounts in the Statements of Operations due to the timing of shareholder subscriptions and redemptions relative to fluctuating net asset values during the year. |
See accompanying notes to consolidated financial statements.
92
| AlphaCentric Strategic Income Fund |
| FINANCIAL HIGHLIGHTS |
| Per Share Data and Ratios for a Share of Beneficial Interest Outstanding Throughout Each Period Presented |
| Year Ended | Period Ended | |||||||
| March 31, | March 31, | |||||||
| Class I (SIIIX) | 2023 | 2022 (1) | ||||||
| Net asset value, beginning of period | $ | 17.69 | $ | 18.48 | ||||
| Activity from investment operations: | ||||||||
| Net investment income (2) | 0.62 | 0.35 | ||||||
| Net realized and unrealized loss on investments | (2.42 | ) | (0.29 | ) (9) | ||||
| Total from investment operations | (1.80 | ) | 0.06 | |||||
| Less distributions from: | ||||||||
| Net investment income | (0.77 | ) | (0.56 | ) | ||||
| Net realized gains | — | (0.18 | ) | |||||
| Return of capital | (0.23 | ) | (0.11 | ) | ||||
| Total distributions | (1.00 | ) | (0.85 | ) | ||||
| Net asset value, end of period | $ | 14.89 | $ | 17.69 | ||||
| Total return (3)(7) | (10.29 | )% | 0.23 | % | ||||
| Net assets, at end of period (000s) | $ | 46,511 | $ | 45,539 | ||||
| Ratio of gross expenses to average net assets before expense reimbursement or recapture (4)(5)(6) | 2.12 | % | 2.12 | % (8) | ||||
| Ratio of net expenses to average net assets after expense reimbursement or recapture (5)(6) | 1.49 | % | 1.50 | % (8) | ||||
| Ratio of net investment income to average net assets (5)(6) | 3.91 | % | 2.25 | % (8) | ||||
| Portfolio Turnover Rate (7) | 22 | % | 20 | % | ||||
| (1) | The AlphaCentric Strategic Income Fund Class I commenced operations on August 1, 2011 and does not include performance prior to May 28, 2021 when Class I shares were previously shares of a private fund. |
| (2) | Per share amounts calculated using the average shares method. |
| (3) | Total return in the above table is historical in nature and represents the rate that the investor would have earned or lost on an investment in the Fund assuming reinvestment of dividends and capital gain distributions, if any, and does not reflect the impact of sales charges. Had the manager not waived and reimbursed a portion of the Fund’s expenses, total returns would have been lower. |
| (4) | Represents the ratio of expenses to average net assets absent fee waivers and/or expense reimbursements by the manager. |
| (5) | Does not include the expenses of other investment companies in which the Fund invests. |
| (6) | Annualized for periods less than one year. |
| (7) | Not annualized for periods less than one year. |
| (8) | Includes 0.01% for the period ended March 31, 2022 attributed to line of credit fees which are not subject to waiver by the manager. |
| (9) | The amount of net realized and unrealized gain on investments per share does not accord with the amounts in the Statements of Operations due to the timing of shareholder subscriptions and redemptions relative to fluctuating net asset values during the year. |
See accompanying notes to consolidated financial statements.
93
| AlphaCentric Funds |
| CONSOLIDATED NOTES TO FINANCIAL STATEMENTS |
| March 31, 2023 |
| (1) | ORGANIZATION AND SIGNIFICANT ACCOUNTING POLICIES |
Mutual Fund Series Trust (the “Trust”), was organized as an Ohio business trust on February 27, 2006. The Trust is registered as an open-end investment management company under the Investment Company Act of 1940, as amended (“1940 Act”). The Trust currently consists of thirty-six series. These financial statements include the following series: AlphaCentric Income Opportunities Fund, AlphaCentric Premium Opportunity Fund, AlphaCentric Robotics and Automation Fund, AlphaCentric Symmetry Strategy Fund, AlphaCentric LifeSci Healthcare Fund, AlphaCentric SWBC Municipal Opportunities Fund and AlphaCentric Strategic Income Fund. Each series is individually referred to as a “Fund” or collectively as the “Funds” throughout these financial statements. The AlphaCentric Robotics and Automation Fund, AlphaCentric Symmetry Strategy Fund, AlphaCentric LifeSci Healthcare Fund, AlphaCentric SWBC Municipal Opportunities Fund and AlphaCentric Strategic Income Fund are registered as non-diversified series of the Trust. The AlphaCentric Income Opportunities Fund and AlphaCentric Premium Opportunity Fund are diversified series of the Trust. The Funds’ investment manager is AlphaCentric Advisors, LLC (the “Manager” or “AlphaCentric”).
AlphaCentric Income Opportunities Fund (“AIOF”), commenced operations on May 28, 2015. AIOF’s investment objective is current income. The Fund’s sub-advisor is Garrison Point Capital, LLC.
AlphaCentric Premium Opportunity Fund (“APOF”) , commenced operations as a series of the Trust on September 30, 2016. The predecessor fund of APOF Class I commenced operations on August 31, 2011, as a private investment fund. APOF’s investment objective is long-term capital appreciation.
AlphaCentric Robotics and Automation Fund (“ARAF”), commenced operations on May 31, 2017. ARAF’s investment objective is long-term capital appreciation. Effective December 1, 2018, the Fund’s sub-advisor is Contego Capital Group, Inc.
AlphaCentric Symmetry Strategy Fund (“ASSF”), class A and C commenced operations on August 8, 2019, and Class I commenced operations on September 1, 2014. ASSF’s investment objective is capital appreciation. The Fund’s sub-advisor is Mount Lucas Management LP.
AlphaCentric LifeSci Healthcare Fund (“ALHF”), commenced operations on November 29, 2019. ALHF’s investment objective is long-term capital appreciation. The Fund’s sub-advisor is LifeSci Fund Management LLC.
AlphaCentric SWBC Municipal Opportunities Fund (“AMOF”), commenced operations on December 31, 2019. AMOF’s investment objective is to provide income exempt from federal income tax with capital appreciation as a secondary objective. The Fund’s sub-advisors are SWBC Investment Company LLC and Mount Lucas Management LP. Effective December 1, 2021, the Fund’s name changed from AlphaCentric Municipal Opportunities Fund to “AlphaCentric SWBC Municipal Opportunities Fund”.
AlphaCentric Strategic Income Fund (“ASIF”), commenced operations on May 28, 2021. ASIF’s investment objective is total return through current income and capital appreciation. The Fund’s sub-advisor is Goshen Rock Capital, LLC (“GRC”). GRC is an SEC registered investment advisor founded in 2021.
ASIF acquired all of the assets and liabilities of Strategos Deep Value Fund LP (the “Predecessor Fund”) in a tax-free reorganization on May 28, 2021. In connection with this acquisition, net assets of the Predecessor Fund were exchange for Class I shares of ASIF, so the Predecessor Fund became the Class I shares of ASIF. The net asset value of ASIF’s shares resulting from these tax-free transactions at the close of business on May 28, 2021, after the reorganization, was $18.48 for Class I shares and ASIF received in-kind capital contributions of securities valued at $9,944,195, cash valued at $2,160,007 and other net assets/liabilities valued at $17,036 in exchange for 655,911 Class I shares. Class A and Class C shares commenced operations on May 28, 2021. The Fund’s investment objective, policies, restrictions and guidelines are, in all material respects, equivalent to the Predecessor Fund’s investment objectives, policies, restrictions, and guidelines. For financial reporting purposes, assets received and shares issued were recorded at fair value; however, the cost basis of the investment received was carried forward to align ongoing reporting of ASIF’s realized and unrealized gains and losses with amounts distributable to shareholders for tax purposes.
Each Fund offers three classes of shares, Class A, Class C and Class I. Each share class represents an interest in the same assets of the respective Fund, has the same rights and is identical in all material respects except that (i) each class of shares may bear different distribution fees; (ii) each class of shares may be subject to different (or no) sales charges; (iii) certain other class specific expenses borne solely by the class to which such expenses are attributable; and (iv) each class has exclusive voting rights with respect to matters relating to its own distribution arrangements.
The following is a summary of significant accounting policies consistently followed by the Funds and are in accordance with accounting principles generally accepted in the United States of America (“GAAP”). Each Fund is an investment company and accordingly follows the investment company accounting and reporting guidance of the Financial Accounting Standards Board (“FASB”) Accounting Standards Codification Topic 946 - Financial Services – Investment Companies including FASB Accounting Standards Update (“ASU”) 2013-08.
94
| AlphaCentric Funds |
| CONSOLIDATED NOTES TO FINANCIAL STATEMENTS (Continued) |
| March 31, 2023 |
a) Securities Valuation – Securities listed on an exchange are valued at the last reported sale price at the close of the regular trading session of the exchange on the business day the value is being determined, or in the case of securities listed on NASDAQ, at the NASDAQ Official Closing Price (“NOCP”). In the absence of a sale, such securities shall be valued at the last bid price on the day of valuation. Debt securities (other than short-term obligations) are valued each day by an independent pricing service approved by the Board of Trustees (the “Board”) using methods which include current market quotations from a major market maker in the securities and based on methods which include the consideration of yields or prices of securities of comparable quality, coupon, maturity and type. The Funds may invest in portfolios of open-end or closed-end investment companies (the “underlying funds”). Open-end funds are valued at their respective net asset values as reported by such investment companies. The underlying funds value securities in their portfolios for which market quotations are readily available at their market values (generally the last reported sale price) and all other securities and assets at their fair value by the methods established by the boards of the underlying funds. The shares of many closed-end investment companies, after their initial public offering, frequently trade at a price per share, which is different than the net asset value per share. The difference represents a market premium or market discount of such shares. There can be no assurances that the market discount or market premium on shares of any closed-end investment company purchased by the Funds will not change. The independent pricing service does not distinguish between smaller-sized bond positions known as “odd lots” and larger institutional-sized bond positions known as “round lots”. A Fund may fair value a particular bond if the Manager does not believe that the round lot value provided by the independent pricing service reflects fair value of the Fund’s holding. Short-term debt obligations having 60 days or less remaining until maturity, at time of purchase, may be valued at amortized cost, provided each such valuation represent fair value. Investments in total return swap contracts are priced daily based on the underlying equity securities held in the swap. Futures and future options are valued at the final settled price or, in the absence of a settled price, at the last sale price on the day of valuation. Options are valued at their closing price on the exchange they are traded on. When no closing price is available, options are valued at their mean price. Swap transactions are valued through an independent pricing service or at fair value based on daily price reporting from the swap counterparty issuing the swap.
Securities traded on a foreign exchange which has not closed by the valuation time or for which the official closing prices are not available at the time the net asset value (‘NAV’) is determined will be valued using alternative market prices provided by a pricing service.
In certain circumstances, instead of valuing securities in the usual manner, the Funds may value securities at “fair value” as determined in good faith by the Board, pursuant to the procedures (the “Procedures”) approved by the Board. The Procedures consider, among others, the following factors to determine a security’s fair value: the nature and pricing history (if any) of the security; whether any dealer quotations for the security are available; and possible valuation methodologies that could be used to determine the fair value of the security. Fair value may also be used by the Board if extraordinary events occur after the close of the relevant world market but prior to the New York Stock Exchange close.
Exchange Traded Funds – The Funds may invest in exchange traded funds (“ETFs”). ETFs are a type of fund bought and sold on a securities exchange. An ETF trades like common stock and represents a fixed portfolio of securities. The risks of owning an ETF generally reflect the risks of owning the underlying securities they are designed to track, although the potential lack of liquidity on an ETF could result in it being more volatile. Additionally, ETFs have fees and expenses that reduce their value.
The Funds utilize various methods to measure the fair value of most of their investments on a recurring basis. GAAP establishes a hierarchy that prioritizes inputs to valuation methods. The three levels of input are:
Level 1 – Unadjusted quoted prices in active markets for identical assets and liabilities that the Funds have the ability to access.
Level 2 – Observable inputs other than quoted prices included in Level 1 that are observable for the asset or liability, either directly or indirectly. These inputs may include quoted prices for the identical instrument in an inactive market, prices for similar instruments, interest rates, prepayment speeds, credit risk, yield curves, default rates and similar data.
Level 3 – Unobservable inputs for the asset or liability, to the extent relevant observable inputs are not available, representing the Funds’ own assumptions about the assumptions a market participant would use in valuing the asset or liability, and would be based on the best information available.
The availability of observable inputs can vary from security to security and is affected by a wide variety of factors, including, for example, the type of security, whether the security is new and not yet established in the marketplace, the liquidity of markets, and other characteristics particular to the security. To the extent that valuation is based on models or inputs that are less observable or unobservable in the market, the determination of fair value requires more judgment. Accordingly, the degree of judgment exercised in determining fair value is greatest for instruments categorized in Level 3.
The inputs used to measure fair value may fall into different levels of the fair value hierarchy. In such cases, for disclosure purposes, the level in the fair value hierarchy within which the fair value measurement falls in its entirety, is determined based on the lowest level input that is significant to the fair value measurement in its entirety.
95
| AlphaCentric Funds |
| CONSOLIDATED NOTES TO FINANCIAL STATEMENTS (Continued) |
| March 31, 2023 |
The inputs or methodology used for valuing securities are not necessarily an indication of the risk associated with investing in those securities. The following tables summarize the inputs used as of March 31, 2023 for the Funds’ assets and liabilities measured at fair value:
| AIOF | ||||||||||||||||
| Assets | ||||||||||||||||
| Level 2 | Level 3 | |||||||||||||||
| Level 1 | (Other Significant | (Unobservable | ||||||||||||||
| Security Classifications + | (Quoted Prices) | Observable Inputs) | Inputs) | Totals | ||||||||||||
| Non-Agency Residential Mortgage Backed Securities | $ | — | $ | 659,307,499 | $ | — | $ | 659,307,499 | ||||||||
| Total | $ | — | $ | 659,307,499 | $ | — | $ | 659,307,499 | ||||||||
| APOF | ||||||||||||||||
| Assets | ||||||||||||||||
| Level 2 | Level 3 | |||||||||||||||
| Level 1 | (Other Significant | (Unobservable | ||||||||||||||
| Security Classifications + * | (Quoted Prices) | Observable Inputs) | Inputs) | Totals | ||||||||||||
| Short-Term Investments | $ | 24,621,338 | $ | — | $ | — | $ | 24,621,338 | ||||||||
| Call Options Purchased | 992,069 | — | — | 992,069 | ||||||||||||
| U.S. Government & Agencies | — | 39,285,530 | — | 39,285,530 | ||||||||||||
| Unrealized Appreciation on Open Futures Contracts | 2,034,688 | — | — | 2,034,688 | ||||||||||||
| Total | $ | 27,648,095 | $ | 39,285,530 | $ | — | $ | 66,933,625 | ||||||||
| Liabilities | ||||||||||||||||
| Level 2 | Level 3 | |||||||||||||||
| Level 1 | (Other Significant | (Unobservable | ||||||||||||||
| Security Classifications + * | (Quoted Prices) | Observable Inputs) | Inputs) | Totals | ||||||||||||
| Unrealized Depreciation on Open Futures Contracts | $ | 570 | $ | — | $ | — | $ | 570 | ||||||||
| Call Options Written | 853,788 | — | — | 853,788 | ||||||||||||
| Put Options Written | 2,250 | — | — | 2,250 | ||||||||||||
| Total | $ | 856,608 | $ | — | $ | — | $ | 856,608 | ||||||||
| ARAF | ||||||||||||||||
| Assets | ||||||||||||||||
| Level 2 | Level 3 | |||||||||||||||
| Level 1 | (Other Significant | (Unobservable | ||||||||||||||
| Security Classifications + | (Quoted Prices) | Observable Inputs) | Inputs) | Totals | ||||||||||||
| Common Stocks | $ | 30,874,694 | $ | — | $ | — | $ | 30,874,694 | ||||||||
| Investment Purchased as Securities Lending Collateral (b) | — | — | — | 8,876,379 | ||||||||||||
| Money Market Fund | 771,378 | — | — | 771,378 | ||||||||||||
| Total | $ | 31,646,072 | $ | — | $ | — | $ | 40,522,451 | ||||||||
96
| AlphaCentric Funds |
| CONSOLIDATED NOTES TO FINANCIAL STATEMENTS (Continued) |
| March 31, 2023 |
| ASSF | ||||||||||||||||
| Assets | ||||||||||||||||
| Level 2 | Level 3 | |||||||||||||||
| Level 1 | (Other Significant | (Unobservable | ||||||||||||||
| Security Classifications (a) + * | (Quoted Prices) | Observable Inputs) | Inputs) | Totals | ||||||||||||
| Common Stocks | $ | 15,031,592 | $ | — | $ | — | $ | 15,031,592 | ||||||||
| Exchange-Traded Funds | 17,996,940 | — | — | 17,996,940 | ||||||||||||
| Unrealized Appreciation on Open Futures Contracts | 1,056,441 | — | — | 1,056,441 | ||||||||||||
| Unrealized Appreciation on Swap Contracts | — | 3,916 | — | 3,916 | ||||||||||||
| U.S. Government & Agencies | — | 8,437,460 | — | 8,437,460 | ||||||||||||
| Short-Term Investment | 5,650,135 | — | — | 5,650,135 | ||||||||||||
| Total | $ | 39,735,108 | $ | 8,441,376 | $ | — | $ | 48,176,484 | ||||||||
| Liabilities | ||||||||||||||||
| Level 2 | Level 3 | |||||||||||||||
| Level 1 | (Other Significant | (Unobservable | ||||||||||||||
| Security Classifications + * | (Quoted Prices) | Observable Inputs) | Inputs) | Totals | ||||||||||||
| Unrealized Depreciation on Open Futures Contracts | $ | 979,802 | $ | — | $ | — | $ | 979,802 | ||||||||
| Unrealized Depreciation on Swap Contracts | — | 330 | — | 330 | ||||||||||||
| Total | $ | 979,802 | $ | 330 | $ | — | $ | 980,132 | ||||||||
| ALHF | ||||||||||||||||
| Assets | ||||||||||||||||
| Level 2 | Level 3 | |||||||||||||||
| Level 1 | (Other Significant | (Unobservable | ||||||||||||||
| Security Classifications + | (Quoted Prices) | Observable Inputs) | Inputs) | Totals | ||||||||||||
| Common Stocks | $ | 74,437,689 | $ | — | $ | — | $ | 74,437,689 | ||||||||
| Short-Term Investments | 5,838,324 | — | — | 5,838,324 | ||||||||||||
| Total | $ | 80,276,013 | $ | — | $ | — | $ | 80,276,013 | ||||||||
| AMOF | ||||||||||||||||
| Assets | ||||||||||||||||
| Level 2 | Level 3 | |||||||||||||||
| Level 1 | (Other Significant | (Unobservable | ||||||||||||||
| Security Classifications (a) + * | (Quoted Prices) | Observable Inputs) | Inputs) | Totals | ||||||||||||
| Closed End Funds | $ | 649,732 | $ | — | $ | — | $ | 649,732 | ||||||||
| Exchange-Traded Funds | 500,822 | — | — | 500,822 | ||||||||||||
| Municipal Bonds | — | 8,181,718 | — | 8,181,718 | ||||||||||||
| Unrealized Appreciation on Swap Contracts | — | 9,634 | — | 9,634 | ||||||||||||
| Short-Term Investment | 26,980 | — | — | 26,980 | ||||||||||||
| Total | $ | 1,177,534 | $ | 8,191,352 | $ | — | $ | 9,368,886 | ||||||||
| Liabilities | ||||||||||||||||
| Level 2 | Level 3 | |||||||||||||||
| Level 1 | (Other Significant | (Unobservable | ||||||||||||||
| Security Classifications + * | (Quoted Prices) | Observable Inputs) | Inputs) | Totals | ||||||||||||
| Unrealized Depreciation on Open Futures Contracts | $ | 74,534 | $ | — | $ | — | $ | 74,534 | ||||||||
| Total | $ | 74,534 | $ | — | $ | — | $ | 74,534 | ||||||||
97
| AlphaCentric Funds |
| CONSOLIDATED NOTES TO FINANCIAL STATEMENTS (Continued) |
| March 31, 2023 |
| ASIF | ||||||||||||||||
| Assets | ||||||||||||||||
| Level 2 | Level 3 | |||||||||||||||
| Level 1 | (Other Significant | (Unobservable | ||||||||||||||
| Security Classifications + | (Quoted Prices) | Observable Inputs) | Inputs) | Totals | ||||||||||||
| Common Stocks | $ | 20,568,463 | $ | — | $ | — | $ | 20,568,463 | ||||||||
| Preferred Stocks | 6,694,441 | — | — | 6,694,441 | ||||||||||||
| Asset Backed Securities | — | 3,438,468 | — | 3,438,468 | ||||||||||||
| Collateralized Mortgage Obligations | — | 892,146 | — | 892,146 | ||||||||||||
| Convertible Bonds | — | 4,336,293 | — | 4,336,293 | ||||||||||||
| Corporate Bonds | — | 4,070,602 | — | 4,070,602 | ||||||||||||
| Short-Term Investment | 7,481,848 | — | — | 7,481,848 | ||||||||||||
| Total | $ | 34,744,752 | $ | 12,737,509 | $ | — | $ | 47,482,261 | ||||||||
| (a) | All ETFs held in the Fund are Level 1 securities. For a detailed break-out of ETFs by major index classification, please refer to the Schedules of Investments. |
| (b) | In accordance with Subtopic 820-10, certain investments that are measured at fair value using the net asset value per share (or its equivalent) have not been classified in the fair value hierarchy. The fair value amount presented in this table is intended to permit reconciliation of the fair value hierarchy to the amounts presented in the Statements of Assets and Liabilities. |
| + | See Schedules of Investments for industry classification. |
| * | Derivative instruments include cumulative net unrealized appreciation (depreciation) on futures contracts open as of March 31, 2023. |
Forward Foreign Currency Contracts – As foreign securities are purchased, a Fund generally enters into forward foreign currency exchange contracts in order to hedge against foreign currency exchange rate risks. The market value of the contract fluctuates with changes in currency exchange rates. The contract is marked-to-market daily and the change in market value is recorded by the Fund as an unrealized gain or loss. As foreign currency contracts are sold, a portion of the contract is generally closed and the Fund records a realized gain or loss equal to the difference between the value of the contract at the time it was opened and the value at the time it was closed. Realized gains and losses from contract transactions are included as a component of net realized gains (losses) from foreign currency contracts in the Statements of Operations.
Foreign Currency – Investment securities and other assets and liabilities denominated in foreign currencies are translated into U.S. dollar amounts at the date of valuation. Purchases and sales of investment securities and income and expense items denominated in foreign currencies are translated into U.S. dollar amounts on the respective dates of such transactions. Each Fund does not isolate that portion of the results of operations resulting from changes in foreign exchange rates on investments from the fluctuations arising from changes in market prices of securities held. Such fluctuations are included with the net realized and unrealized gain or loss from investments. Reported net realized foreign exchange gains or losses arise from sales of foreign currencies, currency gains or losses realized between the trade and settlement dates on securities transactions, and the difference between the amounts of dividends, interest, and foreign withholding taxes recorded on the Funds’ books and the U.S. dollar equivalent of the amounts actually received or paid. Net unrealized foreign exchange gains and losses arise from changes in the fair values of assets and liabilities, other than investments in securities at fiscal period-end, resulting from changes in exchange rates.
Futures Contracts – Each Fund may purchase and sell futures contracts. A Fund may use futures contracts to gain exposure to, or hedge against changes in the value of equities, interest rates or foreign currencies. Upon entering into a contract, a Fund deposits and maintains as collateral such initial margin as required by the exchange on which the transaction is affected. Pursuant to the contract, the Fund agrees to receive from or pay to the broker an amount of cash equal to the daily fluctuation in value of the contract. Such receipts or payments are known as “variation margin” and are recorded by the Fund as unrealized gains and losses. When the contract is closed, the Fund records a realized gain or loss equal to the difference between the value of the contract at the time it was opened and the value at the time it was closed. For the year ended March 31, 2023, APOF, ASSF and AMOF invested in futures contracts.
Swap Agreements – The Funds that invest in swaps are subject to equity price risk, interest rate risk, credit risk, currency risk, counterparty risk and/or commodity risk in the normal course of pursuing its investment objective. The Funds may enter into various swap transactions for investment purposes or to manage interest rate, equity, foreign exchange (currency), or credit risk. These would be two-party contracts entered into primarily to exchange the returns (or differentials in rates of returns) earned or realized on particular pre-determined investments or instruments.
The gross returns to be exchanged or “swapped” between parties are calculated with respect to a notional amount, i.e., the return on or increase in value of a particular dollar amount invested at a particular interest rate, in a particular foreign currency, or in a “basket” of securities representing a particular index or market segment. Changes in the value of swap agreements are recognized as unrealized gains or losses in the
98
| AlphaCentric Funds |
| CONSOLIDATED NOTES TO FINANCIAL STATEMENTS (Continued) |
| March 31, 2023 |
Statements of Operations by “marking to market” on a daily basis to reflect the value of the swap agreement at the end of each trading day. Payments received or paid at the beginning of the agreement are reflected as such on the Statements of Assets and Liabilities and may be referred to as upfront payments. The Funds amortize upfront payments and/or accrue for the fixed payment stream on swap agreements on a daily basis with the net amount recorded as a component of unrealized gain or loss on the Statements of Operations. Periodic payments and receipts and liquidation payments received or made at the termination of the swap agreement are recorded as realized gains or losses on the Statements of Operations. Entering into these agreements involves, to varying degrees, lack of liquidity and elements of credit, market, and counterparty risk in excess of amounts recognized on the Statements of Assets and Liabilities. A Fund’s maximum risk of loss from counterparty credit risk is the discounted net value of the cash flows to be received from the counterparty over the contract’s remaining life, to the extent that that amount is positive. For the year ended March 31, 2023 only ASSF and AMOF invested in swap contracts.
Accounting for Options – The Funds are subject to equity price risks in the normal course of pursuing their investment objective and may purchase or sell options to help hedge against risk. When the Funds write a call or put option, an amount equal to the premium received is included in the Statements of Assets and Liabilities as a liability. The amount of the liability is subsequently marked- to-market to reflect the current market value of the option. If an option expires on its stipulated expiration date or if the Funds enter into a closing purchase transaction, a gain or loss is realized. If a written put option is exercised, the purchase cost of the underlying security is reduced by the premium originally received. If a written call option is exercised, a gain or loss is realized for the sale of the underlying security and the proceeds from the sale are increased by the premium originally received. As writer of an option, the Funds have no control over whether the option will be exercised and, as a result, retain the market risk of an unfavorable change in the price of the security underlying the written option.
Certain Funds may purchase put and call options. Put options are purchased to hedge against a decline in the value of securities held in a Fund’s portfolio. If such a decline occurs, the put options will permit the Funds to sell the securities underlying such options at the exercise price, or to close out the options at a profit. The premium paid for a put or call option plus any transaction costs will reduce the benefit, if any, realized by the Funds upon exercise of the option, and, unless the price of the underlying security rises or declines sufficiently, the option may expire worthless to the Funds. In addition, in the event that the price of the security in connection with which an option was purchased moves in a direction favorable to the Funds, the benefits realized by the Funds as a result of such favorable movement will be reduced by the amount of the premium paid for the option and related transaction costs. Written and purchased options are non-income producing securities. With purchased options, there is minimal counterparty risk to the Funds since these options are exchange traded and the exchange’s clearinghouse, as counterparty to all exchange traded options, guarantees against a possible default. Initial margin deposits required upon entering into options contracts are satisfied by the deposits of cash as collateral for the account of the broker (the Funds’ agent in acquiring the options). For the year ended March 31, 2023, APOF invested in options.
The derivatives are not accounted for as hedging instruments under GAAP. The effect of derivative instruments on the Statements of Assets and Liabilities at March 31, 2023 was as follows:
| Location of derivatives on | Fair value of asset/liability | |||||||||
| Fund | Derivative | Risk Type | Statement of Assets and Liabilities | derivatives | ||||||
| APOF | ||||||||||
| Future Contracts | Equity | Unrealized appreciation on open futures contracts | $ | 2,034,688 | ||||||
| Future Contracts | Equity | Unrealized depreciation on open futures contracts | (570 | ) | ||||||
| Total | $ | 2,034,118 | ||||||||
| Options Purchased | Equity | Investments, At Value | 992,069 | |||||||
| Total | $ | 992,069 | ||||||||
| Options Written | Equity | Options Written | 856,038 | |||||||
| Total | $ | 856,038 | ||||||||
99
| AlphaCentric Funds |
| CONSOLIDATED NOTES TO FINANCIAL STATEMENTS (Continued) |
| March 31, 2023 |
| Location of derivatives on | ||||||||||
| Statement of Assets and Liabilities | Fair value of asset/liability | |||||||||
| Fund | Derivative | Risk Type | (Consolidated) | derivatives | ||||||
| ASSF | ||||||||||
| Credit Default Swap Contracts | Equity | Unrealized appreciation on swap contracts | $ | 3,916 | ||||||
| Credit Default Swap Contracts | Equity | Unrealized depreciation on swap contracts | (330 | ) | ||||||
| Total | $ | 3,586 | ||||||||
| Future Contracts | Commodity | Unrealized appreciation on open futures contracts | $ | 871,316 | ||||||
| Currency | Unrealized appreciation on open futures contracts | 128,582 | ||||||||
| Equity | Unrealized appreciation on open futures contracts | 20,510 | ||||||||
| Interest | Unrealized appreciation on open futures contracts | 36,033 | ||||||||
| Future Contracts | Commodity | Unrealized depreciation on open futures contracts | (156,118 | ) | ||||||
| Currency | Unrealized depreciation on open futures contracts | (172,549 | ) | |||||||
| Interest | Unrealized depreciation on open futures contracts | (651,135 | ) | |||||||
| Total | $ | 76,639 | ||||||||
| Location of derivatives on | Fair value of asset/liability | |||||||||
| Fund | Derivative | Risk Type | Statement of Assets and Liabilities | derivatives | ||||||
| AMOF | ||||||||||
| Credit Default Swap Contracts | Equity | Unrealized appreciation on swap contracts | $ | 9,634 | ||||||
| $ | 9,634 | |||||||||
| Future Contracts | Interest | Unrealized depreciation on open futures contracts | (74,534 | ) | ||||||
| Total | $ | (74,534 | ) | |||||||
The effect of derivative instruments on the Statements of Operations for the year ended March 31, 2023 were as follows:
| Realized and unrealized | ||||||||||
| Fund | Derivative | Risk Type | Location of gain (loss) on derivatives | gain (loss) on derivatives | ||||||
| APOF | ||||||||||
| Future Contracts | Equity | Net realized gain (loss) from Futures Contracts | $ | (8,467,301 | ) | |||||
| Future Contracts | Equity | Net change in unrealized appreciation (depreciation) on Futures Contracts | (741,939 | ) | ||||||
| Total | $ | (9,209,240 | ) | |||||||
| Options Purchased | Equity | Net realized gain (loss) from Investments | $ | (2,376,114 | ) | |||||
| Options Purchased | Equity | Net change in unrealized appreciation (depreciation) on Investments | 78,866 | |||||||
| Total | $ | (2,297,248 | ) | |||||||
| Options Written | Equity | Net realized gain (loss) from Options Written | $ | 2,454,997 | ||||||
| Options Written | Equity | Net change in unrealized appreciation (depreciation) on Options Written | (83,905 | ) | ||||||
| Total | $ | 2,371,092 | ||||||||
100
| AlphaCentric Funds |
| CONSOLIDATED NOTES TO FINANCIAL STATEMENTS (Continued) |
| March 31, 2023 |
| Location of gain (loss) on | Realized and unrealized | |||||||||
| Fund | Derivative | Risk Type | derivatives (Consolidated) | gain (loss) on derivatives | ||||||
| ASSF | ||||||||||
| Credit Default Swap Contracts | Equity | Net realized gain (loss) from Swap Contracts | $ | 13,188 | ||||||
| Credit Default Swap Contracts | Equity | Net change in unrealized appreciation (depreciation) on Swap Contracts | 3,586 | |||||||
| Total | $ | 16,774 | ||||||||
| Future Contracts | Commodity | Net realized gain (loss) from Futures Contracts | $ | (270,800 | ) | |||||
| Currency | Net realized gain (loss) from Futures Contracts | 140,746 | ||||||||
| Equity | Net realized gain (loss) from Futures Contracts | (103,377 | ) | |||||||
| Interest | Net realized gain (loss) from Futures Contracts | 1,584,800 | ||||||||
| Future Contracts | Commodity | Net change in unrealized appreciation (depreciation) on Futures Contracts | (358,062 | ) | ||||||
| Currency | Net change in unrealized appreciation (depreciation) on Futures Contracts | (125,936 | ) | |||||||
| Equity | Net change in unrealized appreciation (depreciation) on Futures Contracts | 20,510 | ||||||||
| Interest | Net change in unrealized appreciation (depreciation) on Futures Contracts | (1,195,208 | ) | |||||||
| Total | $ | (307,327 | ) | |||||||
| Realized and unrealized | ||||||||||
| Fund | Derivative | Risk Type | Location of gain (loss) on derivatives | gain (loss) on derivatives | ||||||
| AMOF | ||||||||||
| Credit Default Swap Contracts | Equity | Net realized gain (loss) from Swap Contracts | $ | 14,883 | ||||||
| Credit Default Swap Contracts | Equity | Net change in unrealized appreciation (depreciation) on Swap Contracts | 30,120 | |||||||
| Total | $ | 45,003 | ||||||||
| Future Contracts | Interest | Net realized gain (loss) from Futures Contracts | $ | 347,850 | ||||||
| Future Contracts | Interest | Net change in unrealized appreciation (depreciation) on Futures Contracts | (148,222 | ) | ||||||
| Total | $ | 199,628 | ||||||||
During the year ended March 31, 2023, APOF was subject to a master netting arrangement for the futures. The following table shows additional information regarding the offsetting of assets and liabilities at March 31, 2023.
| Gross Amounts of Assets and liabilities Presented in | ||||||||||||||||||||||||||
| the Statement of Assets and Liabilities | ||||||||||||||||||||||||||
| Gross | ||||||||||||||||||||||||||
| Amounts | Gross Amounts | |||||||||||||||||||||||||
| Recognized in | Offset in the | Net Amounts | ||||||||||||||||||||||||
| the Statements | Statements of | Presented in the | ||||||||||||||||||||||||
| of Assets and | Assets and | Statements of Assets | Financial | Cash Collateral | ||||||||||||||||||||||
| Assets: | Counterparty | Liabilities | Liabilities | and Liabilities | Instruments | Pledged/Received(1) | Net Amount | |||||||||||||||||||
| Futures Contracts | StoneX Financial Inc. | $ | 2,034,688 | $ | — | $ | 2,034,688 | $ | (570 | ) | $ | — | $ | 2,034,118 | ||||||||||||
| Total | $ | 2,034,688 | $ | — | $ | 2,034,688 | $ | (570 | ) | $ | — | $ | 2,034,118 | |||||||||||||
| Liabilities: | ||||||||||||||||||||||||||
| Futures Contracts | StoneX Financial Inc. | $ | 570 | $ | — | $ | 570 | $ | (570 | ) | $ | — | $ | — | ||||||||||||
| Total | $ | 570 | $ | — | $ | 570 | $ | (570 | ) | $ | — | $ | — | |||||||||||||
| (1) | Collateral pledged is limited to the net outstanding amount due to/from one individual counterparty. The actual collateral amounts pledged may exceed these amounts and fluctuate in value. |
101
| AlphaCentric Funds |
| CONSOLIDATED NOTES TO FINANCIAL STATEMENTS (Continued) |
| March 31, 2023 |
During the year ended March 31, 2023, ASSF was subject to a master netting arrangement for the futures. The following table shows additional information regarding the offsetting of assets and liabilities at March 31, 2023.
| Gross Amounts of Assets and liabilities in the | ||||||||||||||||||||||||||
| Consolidated Statement of Assets and Liabilities | ||||||||||||||||||||||||||
| Amounts | ||||||||||||||||||||||||||
| Recognized in | Gross Amounts | |||||||||||||||||||||||||
| the | Offset in the | Net Amounts | ||||||||||||||||||||||||
| Consolidated | Consolidated | Presented in the | ||||||||||||||||||||||||
| Statements of | Statements of | Consolidated | ||||||||||||||||||||||||
| Assets and | Assets and | Statements of Assets | Financial | Cash Collateral | ||||||||||||||||||||||
| Assets: | Counterparty | Liabilities | Liabilities | and Liabilities | Instruments | Pledged/Received(1) | Net Amount | |||||||||||||||||||
| Futures Contracts | Societe General | $ | 1,056,441 | $ | — | $ | 1,056,441 | $ | (979,802 | ) | $ | — | $ | 76,639 | ||||||||||||
| Swap Contracts | Societe General | 3,916 | — | 3,916 | (330 | ) | — | 3,586 | ||||||||||||||||||
| Total | $ | 1,060,357 | $ | — | $ | 1,060,357 | $ | (980,132 | ) | $ | — | $ | 80,225 | (2) | ||||||||||||
| Liabilities: | ||||||||||||||||||||||||||
| Futures Contracts | Societe General | $ | 979,802 | $ | — | $ | 979,802 | $ | (979,802 | ) | $ | — | $ | — | ||||||||||||
| Swap Contracts | Societe General | 330 | — | 330 | (330 | ) | — | — | ||||||||||||||||||
| Total | $ | 980,132 | $ | — | $ | 980,132 | $ | (980,132 | ) | $ | — | $ | — | (2) | ||||||||||||
| (1) | Collateral pledged is limited to the net outstanding amount due to/from one individual counterparty. The actual collateral amounts pledged may exceed these amounts and fluctuate in value. |
| (2) | Total reflects net amount offset with Societe Generale. |
During the year ended March 31, 2023, AMOF was subject to a master netting arrangement for the futures and swaps. The following table shows additional information regarding the offsetting of assets and liabilities at March 31, 2023.
| Gross Amounts of Assets and liabilities Presented in | ||||||||||||||||||||||||||
| the Statement of Assets and Liabilities | ||||||||||||||||||||||||||
| Amounts | Gross Amounts | |||||||||||||||||||||||||
| Recognized in | Offset in the | Net Amounts | ||||||||||||||||||||||||
| the Statements | Statements of | Presented in the | ||||||||||||||||||||||||
| of Assets and | Assets and | Statements of Assets | Financial | Cash Collateral | ||||||||||||||||||||||
| Assets: | Counterparty | Liabilities | Liabilities | and Liabilities | Instruments | Pledged/Received(1) | Net Amount | |||||||||||||||||||
| Swap Contracts | Societe Generale | $ | 9,634 | $ | — | $ | 9,634 | $ | — | $ | — | $ | 9,634 | |||||||||||||
| Total | $ | 9,634 | $ | — | $ | 9,634 | $ | — | $ | — | $ | 9,634 | ||||||||||||||
| Liabilities: | ||||||||||||||||||||||||||
| Futures Contracts | Societe Generale | $ | 74,534 | $ | — | $ | 74,534 | $ | — | $ | — | $ | 74,534 | |||||||||||||
| Total | $ | 74,534 | $ | — | $ | 74,534 | $ | — | $ | — | $ | 74,534 | ||||||||||||||
| (1) | Collateral pledged is limited to the net outstanding amount due to/from one individual counterparty. The actual collateral amounts pledged may exceed these amounts and fluctuate in value. |
The value of derivative instruments outstanding as of March 31, 2023 as disclosed in the Schedules of Investments and the amounts realized and changes in unrealized gains and losses on derivative instruments during the year ended March 31, 2023, as disclosed above and within the Statements of Operations serve as indicators of the volume of derivative activity for the APOF, ASSF and AMOF.
b) Federal Income Tax – The Funds qualify as regulated investment companies and to comply with the applicable provisions of the Internal Revenue Code of 1986, as amended, and to distribute substantially all of their taxable income to their shareholders. Therefore, no federal income or excise tax provisions are required.
During the year ended March 31, 2023, the Funds did not have a liability for any unrecognized tax expense. The Funds recognize interest and penalties, if any, related to unrecognized tax expense as income tax expense in the Statements of Operations as incurred. As of March 31, 2023, the Funds did not incur any interest or penalties. Management has analyzed the Fund’s tax positions and has concluded that no liability for unrecognized tax benefits should be recorded related to uncertain tax positions taken on returns filed for open tax years ended March 31, 2020 to March 31, 2022, or expected to be taken in the Funds’ March 31, 2023 year-end tax returns.
102
| AlphaCentric Funds |
| CONSOLIDATED NOTES TO FINANCIAL STATEMENTS (Continued) |
| March 31, 2023 |
c) Distribution to Shareholders – Distributions to shareholders, which are determined in accordance with income tax regulations and may differ from GAAP, are recorded on the ex-dividend date. Dividends from net investment income, if any, are declared and paid at least annually for APOF, ARAF, ASSF and ALHF. AIOF, AMOF and ASIF make monthly dividend distributions from net investment income. Distributable net realized gains, if any, are declared and distributed annually.
d) Multiple Class Allocations – Income, non-class specific expenses and realized/unrealized gains or losses are allocated to each class based on relative net assets. Expenses of the Trust that are directly identifiable to a specific Fund are charged to that Fund. Expenses, which are not readily identifiable to a specific Fund, are allocated in such a manner as deemed equitable, taking into consideration the nature and type of expense and the relative sizes of the Funds in the Trust. Distribution fees are charged to each respective share class in accordance with the distribution plan.
e) Other – Investment and shareholder transactions are recorded on the trade date. Interest income is recognized on an accrual basis. Discounts are accreted and premiums are amortized on securities purchased over the lives of the respective securities utilizing the effective interest method. Dividend income is recorded on the ex-dividend date. Realized gains or losses from sales of securities are determined by comparing the identified cost of the security lot sold with the net sales proceeds. Withholding taxes and capital gains on foreign dividends have been provided for in accordance with the Funds’ understanding of the applicable country’s tax rules and rates.
f) Use of Estimates – The preparation of financial statements in conformity with GAAP requires management to make estimates and assumptions that affect the reported amounts of assets and liabilities and disclosure of contingent assets and liabilities at the date of the financial statements and the reported amounts of increases and decreases in net assets resulting from operations during the reporting period. Actual results could differ from those estimates.
g) Commitments and Contingencies - In the normal course of business, the Trust may enter into contracts that contain a variety of representations and warranties and provide general indemnifications. The Funds’ maximum exposure under these arrangements is dependent on future claims that may be made against the Funds and, therefore, cannot be estimated; however, management considers the risk of loss from such claims to be remote.
h) Sales charges (loads) – A maximum sales charge of 5.75% is imposed on Class A shares of the APOF, ARAF, ASSF, and ALHF. A maximum sales charge of 4.75% is imposed on Class A shares of AIOF, AMOF ASIF. Investments in Class A shares in all Funds made at or above $1 million breakpoint are not subject to an initial sales charge and may be subject to a 1.00% contingent deferred sales charge ("CDSC") on shares redeemed within 18 months of purchase (excluding shares purchased with reinvested dividends and/or distributions). The respective shareholders pay such CDSC charges, which are not an expense of the Fund. For year ended March 31, 2023, there were $0 CDSC fees paid.
i) Short Sales – The Funds may sell securities short. A short sale is a transaction in which the Funds sell securities they do not own in anticipation of a decline in the market price of the securities. To deliver the securities to the buyer, the Funds must arrange through a broker to borrow the securities and, in so doing, the Funds become obligated to replace the securities borrowed at their market price at the time of replacement, whatever that price may be. The Funds will make a profit or incur a loss as a result of a short sale depending on whether the price of the securities decrease or increase between the date of the short sale and the date on which the Funds purchased the securities to replace the borrowed securities that have been sold.
j) Cash and Cash Equivalents – The Funds consider their investment in a Federal Deposit Insurance Corporation (“FDIC”) insured interest bearing savings account to be cash. The Funds maintain cash balances, which, at times, may exceed federally insured limits. The Funds maintain these balances with a high quality financial institution.
Consolidation of Subsidiaries – ACSSF Fund Limited (“ASSF-CFC”) - The Consolidated Financial Statements of ASSF include the accounts of ASSF-CFC, which is a wholly-owned and controlled foreign subsidiary. ASSF consolidates the results of subsidiaries in which ASSF holds a controlling economic interest. Controlling economic interest is generally deemed to exist with investment interests comprising greater than 50% of the net asset value of the subsidiary. However, ASSF may also consider qualitative aspects of control in determining if a controlling economic interest exists. These qualitative control considerations include the nature and organizational structure of the investment, as well as ASSF’s ability to control the circumstances leading to majority ownership. All inter-company accounts and transactions have been eliminated in consolidation.
ASSF may invest up to 25% of its total assets in a controlled foreign corporation (“CFC”), which acts as an investment vehicle in order to effect certain investments consistent with ASSF’s investment objectives and policies.
103
| AlphaCentric Funds |
| CONSOLIDATED NOTES TO FINANCIAL STATEMENTS (Continued) |
| March 31, 2023 |
A summary of ASSF’s investments in ASSF-CFC is as follows:
| Inception | ASSF-CFC's | |||||||||||
| Date of | Net Assets at | % of Net Assets at | ||||||||||
| ASSF-CFC | March 31, 2023 | March 31, 2023 | ||||||||||
| ASSF-CFC | 8/8/2019 | $ | 4,523,916 | 8.91% | ||||||||
The CFC utilizes commodity-based derivative products to facilitate ASSF’s pursuit of its investment objectives. In accordance with its investment objectives and through their exposure to the aforementioned commodity-based derivative products, ASSF may have increased or decreased exposure to one or more of the following risk factors defined below:
Taxation Risk - By investing in commodities indirectly through a CFC, ASSF obtains exposure to the commodities markets within the federal tax requirements that apply to ASSF.
For tax purposes, the CFC is an exempted Cayman investment company. The CFC has received an undertaking from the Government of the Cayman Islands exempting it from all local income, profits and capital gains taxes. No such taxes are levied in the Cayman Islands at the present time. For U.S. income tax purposes, the CFC is a Controlled Foreign Corporation which generates and is allocated no income which is considered effectively connected with U.S. trade or business and as such is not subject to U.S. income tax. However, as a wholly-owned Controlled Foreign Corporation, ASSF-CFC’s net income and capital gain, to the extent of its earnings and profits, will be included each year in the ASSF’s investment company taxable income.
| (2) | INVESTMENT TRANSACTIONS |
For the year ended March 31, 2023, aggregate cost of purchases and proceeds from sales of investment securities (excluding short-term investments) for the Funds were as follows:
| Fund | Purchases | Sales | ||||||
| AIOF | $ | 18 | $ | 1,445,025,761 | ||||
| APOF | $ | — | $ | — | ||||
| ARAF | $ | 12,004,988 | $ | 14,514,993 | ||||
| ASSF | $ | 127,805,173 | $ | 116,542,653 | ||||
| ALHF | $ | 103,741,874 | $ | 61,122,406 | ||||
| AMOF | $ | 38,556,701 | $ | 36,096,328 | ||||
| ASIF | $ | 16,023,784 | $ | 8,789,774 | ||||
| (3) | MANAGEMENT AGREEMENT AND OTHER RELATED PARTY TRANSACTIONS |
AlphaCentric acts as investment manager to the Funds pursuant to the terms of the Management Agreement with the Trust. Under the terms of the Management Agreement, the Manager manages the investment operations of the Funds in accordance with the Funds’ investment policies and restrictions. The investment sub- advisers are responsible for the day-to-day management of their Fund's portfolios. The Manager provides the Funds with investment advice and supervision and furnishes an investment program for the Funds. For its investment management services, the Funds pay to the Manager, as of the last day of each month, an annualized fee detailed in the table below. Such fees are computed daily based upon daily average net assets of the respective Fund. The Manager pays expenses incurred by it in connection with acting as investment manager to the Funds other than costs (including taxes and brokerage commissions, borrowing costs, costs of investing in underlying funds and extraordinary expenses, if any) of securities purchased for the Funds and certain other expenses paid by the Funds (as detailed in the Management Agreement).
The Manager and the Trust, with respect to the Funds, have entered into Expense Limitation Agreements (the “Limitation”), approved annually, under which the Manager has contractually agreed to waive fees and/or reimburse expenses to the extent necessary to maintain total annual operating expenses (excluding brokerage costs; borrowing costs, such as (a) interest and (b) dividends on securities sold short; taxes; costs of investing in underlying funds; and extraordinary expenses) do not exceed the expense limitation shown in the table below, and is based on each Fund’s average daily net assets.
104
| AlphaCentric Funds |
| CONSOLIDATED NOTES TO FINANCIAL STATEMENTS (Continued) |
| March 31, 2023 |
| Expense Limitation | ||||||||||||||||||||||||
| Management Fees | ||||||||||||||||||||||||
| Management | Waived/ Expenses | |||||||||||||||||||||||
| Fund | Agreement | Class A | Class C | Class I | Expires | Total Advisory fee | Reimbursed | |||||||||||||||||
| AIOF | 1.50% | 1.74% | 2.49% | 1.49% | July 31, 2023 | $ | 16,857,672 | $ | 3,130,818 | |||||||||||||||
| APOF | 1.75% | 2.24% | 2.99% | 1.99% | July 31, 2023 | 2,234,028 | 164,482 | |||||||||||||||||
| ARAF | 1.25% | 1.65% | 2.40% | 1.40% | July 31, 2023 | 402,988 | 211,574 | |||||||||||||||||
| ASSF | 1.35% | 1.85% | 2.60% | 1.60% | July 31, 2023 | 640,133 | 48,215 | |||||||||||||||||
| ALHF | 1.25% | 1.65% | 2.40% | 1.40% | July 31, 2023 | 587,635 | 165,498 | |||||||||||||||||
| AMOF | 1.00% | 1.50% | 2.25% | 1.25% | July 31, 2023 | 92,828 | 140,854 | |||||||||||||||||
| ASIF | 1.50% | 1.74% | 2.49% | 1.49% | July 31, 2023 | 678,827 | 287,380 | |||||||||||||||||
For the year ended March 31, 2023, the Manager waived management fees and reimbursed expenses. The Manager may recapture a portion of the waived and/or reimbursed amounts. The Manager may seek reimbursement only for fees waived or expenses reimbursed by a Fund within the three years following the date the waiver and/or reimbursement was incurred if the Fund is able to make the repayment without exceeding the limitation in effect at that time of the waiver and the Limitation in effect at the time of recoupment, no later than the dates as stated below:
| Fund | 2024 | 2025 | 2026 | ||||||||||
| AIOF | $ | 6,772,123 | $ | 7,341,886 | $ | 3,130,818 | |||||||
| APOF | $ | 40,402 | $ | 30,209 | $ | 164,482 | |||||||
| ARAF | $ | 165,273 | $ | 170,674 | $ | 211,574 | |||||||
| ASSF | $ | 119,849 | $ | 132,579 | $ | 48,215 | |||||||
| ALHF | $ | 97,907 | $ | 148,768 | $ | 165,498 | |||||||
| AMOF | $ | 105,262 | $ | 106,430 | $ | 140,854 | |||||||
| ASIF | $ | — | $ | 132,356 | $ | 287,380 | |||||||
Pursuant to the Management Services Agreement between the Trust and MFund, an affiliate of the Manager, MFund provides the Funds with various management and legal administrative services (the “Management Services Agreement”) . For these services, the Funds pay MFund as of the last day of each month an annualized asset-based fee based upon net assets. In addition, the Funds reimburse MFund for any reasonable out-of- pocket expenses incurred in the performance of its duties under the Management Services Agreement. The amounts due to MFund for the Management Services Agreement are listed in the Statements of Assets and Liabilities under “Payable to related parties” and the amounts accrued for the year are shown in the Statements of Operations under “Management service fees.”
Pursuant to the Compliance Services Agreement, MFund an affiliate of the Manager, provides chief compliance officer services to the Funds. For these services, the Funds pay MFund as of the last day of each month an annualized base fee plus an annualized asset-based fee based upon net assets. In addition, the Funds reimburse MFund for any reasonable out-of-pocket expenses incurred in the performance of its duties under the Compliance Services Agreement. The amounts due to MFund for chief compliance officer services are listed in the Statements of Assets and Liabilities under “Compliance officer fees payable” and the amounts accrued for the year are shown in the Statements of Operations under “Compliance officer fees.”
A trustee of the Trust is also the controlling member of MFund, the Manager and Catalyst Capital Advisors, LLC (an investment manager to other series of the Trust) and is not paid any fees directly by the Trust for serving in such capacities.
Trustees who are not “interested persons” as that term is defined in the 1940 Act (the “Independent Trustees”), are paid a quarterly retainer and receive compensation for each special in-person meeting attended. The fees paid to the Independent Trustees for their attendance at a meeting will be shared equally by the funds of the Trust in which the meeting relates. The Lead Independent Trustee of the Trust and the Chairmen of the Trust’s Audit Committee and Risk and Compliance Committee receive an additional quarterly retainer. The “interested persons” of the Trust receive no compensation from the Funds. The Trust reimburses each trustee and officer for his or her travel and other expenses related to attendance at such meetings.
Ultimus Fund Solutions, LLC (“UFS”) provides administrative, fund accounting, and transfer agency services to the Funds pursuant to agreements with the Trust, for which it receives from each Fund: (i) basis points in decreasing amounts as assets reach certain breakpoints; and (ii) any related out-of-pocket expenses.
105
| AlphaCentric Funds |
| CONSOLIDATED NOTES TO FINANCIAL STATEMENTS (Continued) |
| March 31, 2023 |
Certain officers of the Trust are also employees of UFS and MFund, and are not paid any fees directly by the Trust for serving in such capacity.
The Trust has adopted a Master Distribution Plan pursuant to rule 12b-1 under the 1940 Act for each class of shares, that allows the Funds to pay distribution and shareholder servicing expenses of up to 0.50% per annum for the Class A shares and up to 1.00% for the Class C shares based on average daily net assets of each class. Class A shares are currently paying 0.25% per annum of 12b-1 fees and Class C shares are currently paying 1.00% per annum of 12b-1 fees. The fee may be used for a variety of purposes, including compensating dealers and other financial service organizations for eligible services provided by those parties to the Funds and their shareholders and to reimburse Northern Lights Distributors, LLC (“NLD”) and Manager for distribution related expenses. Brokers may receive a 1.00% commission from NLD for the sale of Class C shares.
For the year ended March 31, 2023, the Distributor received the following in underwriter commissions from the sale of Class A shares of the Funds:
| Underwriter | ||||
| Fund | Commissions | |||
| AIOF | $ | 14,869 | ||
| APOF | $ | 8,468 | ||
| ARAF | $ | 6,710 | ||
| ASSF | $ | 22,495 | ||
| ALHF | $ | 90,063 | ||
| AMOF | $ | 2,233 | ||
| ASIF | $ | 7,456 | ||
| (4) | CREDIT FACILITY |
Effective January 26, 2022, the trust amended the Revolving Credit Agreement and entered into a new revolving, uncommitted $300,000,000 line of credit with U.S. Bank National Association (the “2022 Revolving Credit Agreement”) that applies to all of the Funds, that expired on January 25, 2023. Borrowings under the 2022 Revolving Credit Agreement bear an interest at Prime Rate minus 1% per month. There are no fees charged on the unused portion of the line of credit. For the period January 26, 2022 through January 25, 2023, amounts outstanding to Funds under the credit facility at no time were permitted to exceed in the aggregate the lessor of (a) $300,000,000; (b) 10% of the gross market value of AMOF and or 15% gross market value of AIOF, APOF, ARAF, ASSF, ALHF and ASIF; or (c) 33.33% of a Fund’s daily market value.
Effective January 25, 2023, the trust amended the Revolving Credit Agreement and entered into a new revolving, uncommitted $125,000,000 line of credit with U.S. Bank National Association (the “2023 Revolving Credit Agreement”) that applies to all of the Funds, that is set to expire on January 24, 2024. Borrowings under the 2023 Revolving Credit Agreement bear an interest at Prime Rate minus 1% per month. There are no fees charged on the unused portion of the line of credit. For the period January 25, 2023 through March 31, 2023, amounts outstanding to Funds under the credit facility at no time were permitted to exceed in the aggregate the lessor of (a) $125,000,000; (b) 10% of the gross market value of AMOF and or 15% gross market value of AIOF, APOF, ARAF, ASSF, ALHF and ASIF; or (c) 33.33% of a Fund’s daily market value. APOF, ARAF, ASSF, and ASIF did not borrow during the year ended March 31, 2023. For the year ended March 31, 2023, amounts outstanding to AIOF, ALHF and AMOF were as follows:
| Periods the line of credit | Interest | Outstanding | Average | Average | Maximum | Maximum | ||||||||||||||||
| Fund | was drawn on: | Expense | Borrowings | Borrowings | Borrowings Rate | Borrowings | Borrowings Rate | |||||||||||||||
| AIOF | 3/31/22-3/31/23 | $ | 1,752,550 | $ | 47,617,000 | $ | 42,732,849 | 4.96% | $ | 159,709,000 | 7.00% | |||||||||||
| ALHF | 4/29/22-5/3/22 | 121 | — | 435,000 | 2.50% | 468,000 | 2.50% | |||||||||||||||
| AMOF | 7/28/22-11/30/22 | 94 | — | 41,882 | 4.81% | 72,000 | 6.00% | |||||||||||||||
| (5) | CONTROL OWNERSHIP |
The beneficial ownership, either directly or indirectly, of more than 25% of the voting securities of a Fund creates presumption of the control of the Fund, under section 2(a)(9) of the 1940 Act. As of March 31, 2023, Charles Schwab owned 28.3% of AIOF. National Financial Services LLC owned 33.7% of APOF. Charles Schwab and National Financial Services LLC owned 33.7% and 33.0%, respectfully of ARAF. Hartz Capital Investments LLC owned 50.4% of ASSF. Charles Schwab owned 25.2% of ALHF. National Financial Services LLC and TD Ameritrade Inc.
106
AlphaCentric Funds
CONSOLIDATED NOTES TO FINANCIAL STATEMENTS (Continued)
March 31, 2023
owned 64.0% and 26.7%, respectfully, of AMOF. Wells Fargo owned 28.1% of ASIF. The Trust has no knowledge as to whether all or any portion of the shares owned of record by Hartz Capital Investments LLC, Charles Schwab & Co. Inc., National Financial Services LLC, TD Ameritrade Inc. and Wells Fargo are also owned beneficially.
| (6) | DISTRIBUTIONS TO SHAREHOLDERS AND TAX COMPONENTS TO CAPITAL |
The tax character of fund distributions paid for the period ended March 31, 2023 (for the tax period-ended November 30, 2022 for AIOF and for the tax period-ended April 30, 2022 for AMOF) and March 31, 2022 was as follows:
For the period ended March 31, 2023:
| Ordinary | Long-Term | Return | Tax-Exempt | |||||||||||||||||
| Portfolio | Income | Capital Gains | of Capital | Income | Total | |||||||||||||||
| AlphaCentric Income Opportunities Fund | $ | 47,153,857 | $ | — | $ | 40,594,714 | $ | — | $ | 87,748,571 | ||||||||||
| AlphaCentric Premium Opportunity Fund | — | — | — | — | — | |||||||||||||||
| AlphaCentric Robotics and Automation Fund | — | 1,539,010 | — | — | 1,539,010 | |||||||||||||||
| AlphaCentric Symmetry Strategy Fund | 4,190,411 | 561,388 | — | — | 4,751,799 | |||||||||||||||
| AlphaCentric LifeSci Healthcare Fund | 2,198,833 | — | — | — | 2,198,833 | |||||||||||||||
| AlphaCentric SWBC Municipal Opportunities Fund | 20,517 | — | — | 214,438 | 234,955 | |||||||||||||||
| AlphaCentric Strategic Income Fund | 1,811,372 | 363,940 | 710,339 | — | 2,885,651 | |||||||||||||||
For the period ended March 31, 2022:
| Ordinary | Long-Term | Return | Tax-Exempt | |||||||||||||||||
| Portfolio | Income | Capital Gains | of Capital | Income | Total | |||||||||||||||
| AlphaCentric Income Opportunities Fund | $ | 38,064,419 | $ | — | $ | 68,588,979 | $ | — | $ | 106,653,398 | ||||||||||
| AlphaCentric Premium Opportunity Fund | 2,469,198 | 7,401,468 | — | — | 9,870,666 | |||||||||||||||
| AlphaCentric Robotics and Automation Fund | — | 1,998,824 | — | — | 1,998,824 | |||||||||||||||
| AlphaCentric Symmetry Strategy Fund | 83,300 | — | — | — | 83,300 | |||||||||||||||
| AlphaCentric LifeSci Healthcare Fund | 3,884,543 | 146,649 | — | — | 4,031,192 | |||||||||||||||
| AlphaCentric SWBC Municipal Opportunities Fund | 9,630 | — | — | — | 9,630 | |||||||||||||||
| AlphaCentric Strategic Income Fund | 848,671 | 309,589 | 166,778 | — | 1,325,038 | |||||||||||||||
As of each Fund’s tax year-ended of March 31, 2023 (for the tax period-ended November 30, 2022 for AlOF and for the tax period-ended April 30, 2022 for AMOF), the components of accumulated earnings/(deficit) on a tax basis were as follows:
| Undistributed | Undistributed | Undistributed | Post October Loss | Capital Loss | Other | Unrealized | Total | |||||||||||||||||||||||||
| Ordinary | Ordinary | Long-Term | and | Carry | Book/Tax | Appreciation/ | Accumulated | |||||||||||||||||||||||||
| Portfolio | Tax-Exempt Income | Income | Capital Gains | Late Year Loss | Forwards | Differences | (Depreciation) | Earnings/(Deficits) | ||||||||||||||||||||||||
| AlphaCentric Income Opportunities Fund | $ | — | $ | — | $ | — | $ | — | $ | (369,089,389 | ) | $ | — | $ | 138,814,581 | $ | (230,274,808 | ) | ||||||||||||||
| AlphaCentric Premium Opportunity Fund | — | — | — | — | (12,261,036 | ) | — | 127,233 | (12,133,803 | ) | ||||||||||||||||||||||
| AlphaCentric Robotics and Automation Fund | — | — | — | (286,603 | ) | (2,185,464 | ) | — | 126,773 | (2,345,294 | ) | |||||||||||||||||||||
| AlphaCentric Symmetry Strategy Fund | — | 95,392 | — | (3,749,771 | ) | — | 715,198 | (565,473 | ) | (3,504,654 | ) | |||||||||||||||||||||
| AlphaCentric LifeSci Healthcare Fund | — | — | — | (1,663,063 | ) | — | — | (3,050,133 | ) | (4,713,196 | ) | |||||||||||||||||||||
| AlphaCentric SWBC Municipal Opportunities Fund | — | 8,093 | — | — | (759,814 | ) | — | (920,892 | ) | (1,672,613 | ) | |||||||||||||||||||||
| AlphaCentric Strategic Income Fund | — | — | — | — | — | — | (6,284,854 | ) | (6,284,854 | ) | ||||||||||||||||||||||
The difference between book basis and tax basis undistributed net investment income, accumulated net realized gains, and unrealized appreciation(depreciation) from investments is primarily attributable to the tax deferral of losses on wash sales, mark-to-market on open 1256 futures and options, swaps, and passive foreign investment companies, and adjustments for the ASSF Fund’s wholly owned subsidiary.
The unrealized appreciation in the table above includes unrealized foreign currency gains (losses) of $519, $(3,581) and $(438) for ARAF, ASSF and ALHF, respectively.
107
AlphaCentric Funds
CONSOLIDATED NOTES TO FINANCIAL STATEMENTS (Continued)
March 31, 2023
Late year losses incurred after December 31 within the fiscal year are deemed to arise on the first business day of the following fiscal year for tax purposes. The Funds incurred and elected to defer such late year losses as follows:
| Late Year | ||||
| Portfolio | Losses | |||
| AlphaCentric Income Opportunities Fund | $ | — | ||
| AlphaCentric Premium Opportunity Fund | — | |||
| AlphaCentric Robotics and Automation Fund | 4,353 | |||
| AlphaCentric Symmetry Strategy Fund | — | |||
| AlphaCentric LifeSci Healthcare Fund | 402 | |||
| AlphaCentric SWBC Municipal Opportunities Fund | — | |||
| AlphaCentric Strategic Income Fund | — | |||
Capital losses incurred after October 31 within the fiscal year are deemed to arise on the first business day of the following fiscal year for tax purposes. The Funds incurred and elected to defer such capital losses as follows:
| Post October | ||||
| Portfolio | Losses | |||
| AlphaCentric Income Opportunities Fund | $ | — | ||
| AlphaCentric Premium Opportunity Fund | — | |||
| AlphaCentric Robotics and Automation Fund | 282,250 | |||
| AlphaCentric Symmetry Strategy Fund | 3,749,771 | |||
| AlphaCentric LifeSci Healthcare Fund | 1,662,661 | |||
| AlphaCentric SWBC Municipal Opportunities Fund | — | |||
| AlphaCentric Strategic Income Fund | — | |||
At March 31, 2023, the Funds (for the tax period-ended November 30, 2022 and April 30, 2022, for AlOF and AMOF, respectively) had capital loss carry forwards for federal income tax purposes available to offset future capital gains and capital loss carry forwards utilized as follows:
| Non - Expiring | Non - Expiring | |||||||||||||||
| Portfolio | Short-Term | Long-Term | Total | CLCF Utilized | ||||||||||||
| AlphaCentric Income Opportunities Fund | $ | 369,089,389 | $ | — | $ | 369,089,389 | $ | — | ||||||||
| AlphaCentric Premium Opportunity Fund | 4,983,434 | 7,277,602 | 12,261,036 | — | ||||||||||||
| AlphaCentric Robotics and Automation Fund | 2,185,464 | — | 2,185,464 | — | ||||||||||||
| AlphaCentric Symmetry Strategy Fund | — | — | — | 1,668,560 | ||||||||||||
| AlphaCentric LifeSci Healthcare Fund | — | — | — | — | ||||||||||||
| AlphaCentric SWBC Municipal Opportunities Fund | 759,814 | — | 759,814 | — | ||||||||||||
| AlphaCentric Strategic Income Fund | — | — | — | — | ||||||||||||
Permanent book and tax differences, primarily attributable to the book/tax basis treatment of net operating losses, distributions in excess, and ASSF’s wholly owned subsidiary, resulted in reclassifications for the Funds for the year ended March 31, 2023 (except for AlOF in which its tax period-ended November 30, 2022 has been adjusted for March 31, 2023 activity, and for AMOF in which its tax period-ended April 30, 2022 has been adjusted for March 31, 2023 activity) as follows:
| Paid | ||||||||
| In | Accumulated | |||||||
| Portfolio | Capital | Earnings (Losses) | ||||||
| AlphaCentric Income Opportunities Fund | $ | (1,459,849 | ) | $ | 1,459,849 | |||
| AlphaCentric Premium Opportunity Fund | (1,406,442 | ) | 1,406,442 | |||||
| AlphaCentric Robotics and Automation Fund | (43,101 | ) | 43,101 | |||||
| AlphaCentric Symmetry Strategy Fund | (160,804 | ) | 160,804 | |||||
| AlphaCentric LifeSci Healthcare Fund | (37,970 | ) | 37,970 | |||||
| AlphaCentric SWBC Municipal Opportunities Fund | — | — | ||||||
| AlphaCentric Strategic Income Fund | — | — | ||||||
108
AlphaCentric Funds
CONSOLIDATED NOTES TO FINANCIAL STATEMENTS (Continued)
March 31, 2023
| (7) | AGGREGATE UNREALIZED APPRECIATION AND DEPRECIATION – TAX BASIS |
The Funds for the year ended March 31, 2023 (except for AlOF in which its tax period -ended November 30, 2022 cost has been adjusted for March 31, 2023 activity, and for AMOF in which its tax period-ended April 30, 2022 cost has been adjusted for March 31, 2023 activity).
| Cost for | Tax Net | |||||||||||||||
| Federal Tax | Unrealized | Unrealized | Unrealized | |||||||||||||
| Portfolio | purposes | Appreciation | Depreciation | App/Dep | ||||||||||||
| AlphaCentric Income Opportunities Fund | $ | 528,285,202 | $ | 179,376,711 | $ | (48,354,414 | ) | $ | 131,022,297 | |||||||
| AlphaCentric Premium Opportunity Fund | 65,949,784 | 127,233 | — | 127,233 | ||||||||||||
| AlphaCentric Robotics and Automation Fund | 40,396,197 | 5,402,658 | (5,276,404 | ) | 126,254 | |||||||||||
| AlphaCentric Symmetry Strategy Fund | 47,249,491 | 1,461,650 | (2,023,542 | ) | (561,892 | ) | ||||||||||
| AlphaCentric LifeSci Healthcare Fund | 83,325,708 | 7,014,772 | (10,064,467 | ) | (3,049,695 | ) | ||||||||||
| AlphaCentric SWBC Municipal Opportunities Fund | 9,979,879 | 150,971 | (836,498 | ) | (685,527 | ) | ||||||||||
| AlphaCentric Strategic Income Fund | 53,767,115 | 1,916,375 | (8,201,229 | ) | (6,284,854 | ) | ||||||||||
| (8) | UNDERLYING FUND RISK |
The Funds in the normal course of business make investments in financial instruments and derivatives where the risk of potential loss exists due to changes in the market or failure or inability of the counterparty to a transaction to perform. See below for a detailed description of select principal risks.
Each underlying fund, including each ETF, is subject to specific risks, depending on the nature of the underlying fund. These risks could include liquidity risk, sector risk, foreign and related currency risk, as well as risks associated with real estate investments and commodities. Investors in the Funds will indirectly bear fees and expenses charged by the underlying investment companies in which the Funds invest in addition to the Funds’ direct fees and expenses.
Wholly-Owned Subsidiary Risk: ASSF-CFC is not registered under the 1940 Act and is not be subject to all of the investor protections of the 1940 Act. Changes in the laws of the United States and/or the Cayman Islands, under which ASSF and ASSF-CFC, respectively, are organized, could result in the inability of ASSF and/or ASSF-CFC to operate as described in the Prospectus and could negatively affect ASSF and their shareholders. Your cost of investing in ASSF will be higher because you indirectly bear the expenses of ASSF-CFC.
Credit Risk: There is a risk that issuers and counterparties will not make payments on securities and other investments held by a Fund, resulting in losses to the Fund. In addition, the credit quality of securities held by a Fund may be lowered if an issuer’s financial condition changes. Lower credit quality may lead to greater volatility in the price of a security and in shares of the Fund. Lower credit quality also may affect liquidity and make it difficult for a Fund to sell the security. The Funds may invest, directly or indirectly, in high yield fixed-income securities (also known as “junk bonds”), which are considered speculative with respect to the issuer’s capacity to pay interest and repay principal in accordance with the terms of the obligations. This means that, compared to issuers of higher rated securities, issuers of medium and lower rated securities are less likely to have the capacity to pay interest and repay principal when due in the event of adverse business, financial or economic conditions and/or may be in default or not current in the payment of interest or principal. The market values of medium- and lower-rated securities tend to be more sensitive to company-specific developments and changes in economic conditions than higher-rated securities. The companies that issue these securities often are highly leveraged, and their ability to service their debt obligations during an economic downturn or periods of rising interest rates may be impaired. In addition, these companies may not have access to more traditional methods of financing, and may be unable to repay debt at maturity by refinancing. The risk of loss due to default in payment of interest or principal by these issuers is significantly greater than with higher-rated securities because medium- and lower-rated securities generally are unsecured and subordinated to senior debt. Default, or the market’s perception that an issuer is likely to default, could reduce the value and liquidity of securities held by a Fund. In addition, default may cause a Fund to incur expenses in seeking recovery of principal or interest on its portfolio holdings.
Swap Counterparty Credit Risk: The Funds are subject to credit risk on the amount the Funds expect to receive from swap agreement counterparties. With certain exchange traded credit default swaps, there is minimal counterparty risk to a Fund in that the exchanges, clearinghouse, as counter party, guarantees against default.
Commodity Risk: Investing in the commodities markets may subject the Funds to greater volatility than investments in traditional securities. Commodity prices may be influenced by unfavorable weather, animal and plant disease, geologic and environmental factors as well as changes in government regulation such as tariffs, embargoes or burdensome production rules and restrictions.
Foreign Currency Risk: Currency trading risks include market risk, credit risk and country risk. Market risk results from adverse changes in exchange rates in the currencies the Fund is long or short. Credit risk results because a currency-trade counterparty may default. Country risk arises because a government may interfere with transactions in its currency.
109
AlphaCentric Funds
CONSOLIDATED NOTES TO FINANCIAL STATEMENTS (Continued)
March 31, 2023
Foreign Exchanges Risk: A portion of the derivatives trades made by the Funds may take place on foreign markets. Neither existing CFTC regulations nor regulations of any other U.S. governmental agency apply to transactions on foreign markets. Some of these foreign markets, in contrast to U.S. exchanges, are so -called principals’ markets in which performance is the responsibility only of the individual counterparty with whom the trader has entered into a commodity interest transaction and not of the exchange or clearing corporation. In these kinds of markets, there is risk of bankruptcy or other failure or refusal to perform by the counterparty.
Fixed Income Risk: When the Funds invest in fixed income securities, the value of your investment in each will fluctuate with changes in interest rates. Typically, a rise in interest rates causes a decline in the value of fixed income securities owned by the Funds. In general, the market price of fixed income securities with longer maturities will increase or decrease more in response to changes in interest rates than shorter-term securities. Other risk factors include credit risk (the debtor may default) and prepayment risk (the debtor may pay its obligation early, reducing the amount of interest payments). If the U.S. Federal Reserve’s Federal Open Market Committee (“FOMC”) raises the federal funds interest rate target, interest rates across the U.S. financial system may rise. However, the magnitude of rate changes across maturities and borrower sectors is uncertain. Rising rates may decrease liquidity and increase volatility, which may make portfolio management more difficult and costly to each Fund and its shareholders. Additionally, default risk increases if issuers must borrow at higher rates. These risks could affect the value of a particular investment by each Fund, possibly causing the Fund’s share price and total return to be reduced and fluctuate more than other types of investments.
Futures and Forwards Contract Risk: For APOF, ASSF and AMOF the successful use of futures contracts draws upon the Manager’s skill and experience with respect to such instruments and are subject to special risk considerations. The primary risks associated with the use of futures contracts are (a) the imperfect correlation between the change in market value of the instruments held by the Fund and the price of the forward or futures contract; (b) possible lack of a liquid secondary market for a forward or futures contract and the resulting inability to close a forward or futures contract when desired; (c) losses caused by unanticipated market movements, which are potentially unlimited; (d) the Manager’s inability to predict correctly the direction of securities prices, interest rates, currency exchange rates and other economic factors; (e) the possibility that the counterparty will default in the performance of its obligations; and (f) if the Fund has insufficient cash, it may have to sell securities from its portfolio to meet daily variation margin requirements, and the Fund may have to sell securities at a time when it may be disadvantageous to do so.
Derivatives Risk: APOF, ASSF and AMOF may use derivatives (including options, futures, forwards, swaps and options on futures) to enhance returns or hedge against market declines. Each Fund’s use of derivative instruments involves risks different from, or possibly greater than, the risks associated with investing directly in securities and other traditional investments. These risks include (i) the risk that the counterparty to a derivative transaction may not fulfill its contractual obligations; (ii) risk of mispricing or improper valuation; and (iii) the risk that changes in the value of the derivative may not correlate perfectly with the underlying asset, rate or index. Derivative prices are highly volatile and may fluctuate substantially during a short period of time. Such prices are influenced by numerous factors that affect the markets, including, but not limited to: changing supply and demand relationships; government programs and policies; national and international political and economic events, changes in interest rates, inflation and deflation and changes in supply and demand relationships.
Options Risk: There are risks associated with the sale and purchase of call and put options. As the seller (writer) of a covered call option, APOF assumes the risk of a decline in the market price of the underlying security below the purchase price of the underlying security less the premium received, and gives up the opportunity for gain on the underlying security above the exercise option price. As the buyer of a put or call option, the Fund risks losing the entire premium invested in the option if the Fund does not exercise the option. As a seller (writer) of a put option, the Fund will lose money if the value of the security falls below the strike price. If unhedged, the Fund’s written calls exposes it to potentially unlimited losses.
Market Risk: Overall market risks may also affect the value of the Funds. The market values of securities or other investments owned by the Funds will go up or down, sometimes rapidly or unpredictably. Factors such as economic growth and market conditions, interest rate levels, exchange rates and political events affect the securities markets. Changes in market conditions and interest rates generally do not have the same impact on all types of securities and instruments. Unexpected local, regional or global events and their aftermath, such as war; acts of terrorism; financial, political or social disruptions; natural, environmental or man-made disasters; climate- change or climate -related events; the spread of infectious illnesses or other public health issues; recessions and depressions; or other tragedies, catastrophes and events could have a significant impact on the Funds and their investments and could result in increased premiums or discounts to a Fund’s net asset value, and may impair market liquidity, thereby increasing liquidity risk. Such events can cause investor fear and panic, which can adversely affect the economies of many companies, sectors, nations, regions and the market in general, in ways that cannot necessarily be foreseen. The Funds could lose money over short periods due to short-term market movements and over longer periods during more prolonged market downturns. During a general market downturn, multiple asset classes may be negatively affected. In times of severe market disruptions, you could lose your entire investment.
LIBOR Risk: The Funds’ investment, payment obligations and financing terms may be based on floating rates such as the London Interbank Offered Rate, or “LIBOR” which is the offered rate of short -term Eurodollar deposits between major international banks. The use of LIBOR is being phased out. There remains uncertainty regarding the nature of any replacement rate and the impact of the transition from LIBOR on the
110
AlphaCentric Funds
CONSOLIDATED NOTES TO FINANCIAL STATEMENTS (Continued)
March 31, 2023
Funds’ transactions and financial markets generally. As such, the potential effect of the transition away from LIBOR on the Funds’ investments cannot yet be determined.
Please refer to each Fund’s prospectus for a full listing of risks associated with the investments.
| (9) | SECURITIES LENDING |
ARAF has entered into a Securities Lending Agreement with the US Bank NA (“US Bank”). ARAF can lend its securities to brokers, dealers and other financial institutions approved by the Board to earn additional income. The cash collateral is invested in short-term investments as noted in the ARAF’s Schedule of Investments. ARAF also continues to receive interest or dividends on the securities loaned. Loans are collateralized at a value at least equal to 105% of the then current market value of any loaned security that are foreign, or 102% of the then current market value of any other loaned security. All interest and dividend payments received on securities which are held on loan, provided that there is no material default, will be paid to ARAF. A portion of the income generated by the investment in ARAF’s collateral, net of any rebates paid by US Bank to the borrowers is remitted to US Bank as lending agent and the remainder is paid to ARAF.
Although risk is mitigated by the collateral, the ARAF could experience a delay in recovering their securities and possible loss of income or value if the borrower fails to return them. Should the borrower of the securities fail financially, ARAF has the right to repurchase the securities using the collateral in the open market.
ARAF receives cash as collateral in return for securities lent as part of the securities lending program. The collateral is invested in the Mount Vernon Liquid Assets Portfolio, LLC of which the investment objective is to seek to maximize current income to the extent with the preservation of capital and liquidity and maintain a stable NAV of $1.00 per unit. ARAF held $8,876,379 as of March 31, 2023. The remaining contractual maturity of all securities lending transactions is overnight and continuous. ARAF is not subject to a master netting agreement with respect to securities lending; therefore no additional disclosures are required. The income earned by ARAF on investments of cash collateral received from borrowers for the securities loaned to them are reflected in the ARAF’s Statement of Operations.
The following table is a summary of the Funds’ securities loaned and related collateral which are subject to a netting agreement as of March 31, 2023:
| Gross Amounts Not Offset in the | ||||||||||||||||||||||||
| Statement of Assets & Liabilities | ||||||||||||||||||||||||
| Net Amounts of | ||||||||||||||||||||||||
| Gross Amounts | Assets | |||||||||||||||||||||||
| Offset in the | Presented in the | |||||||||||||||||||||||
| Gross Amounts | Statement of | Statement of | Financial | Non-Cash | ||||||||||||||||||||
| of Recognized | Assets & | Assets & | Instruments | Collateral | Net Amount of | |||||||||||||||||||
| Assets: | Assets | Liabilities | Liabilities | Pledged | Received * | Assets | ||||||||||||||||||
| ARAF | ||||||||||||||||||||||||
| Description: | ||||||||||||||||||||||||
| Securities Loaned | $ | 8,502,383 | $ | — | $ | 8,502,383 | $ | — | $ | 8,502,383 | * | $ | — | |||||||||||
| Total | $ | 8,502,383 | $ | — | $ | 8,502,383 | $ | — | $ | 8,502,383 | $ | — | ||||||||||||
| * | The amount is limited to the asset balance and accordingly does not include excess collateral pledged. |
The fair value of the securities loaned for ARAF totaled $8,502,383 at March 31, 2023. The securities loaned are noted in the Schedule of Investments. The fair value of the “Collateral for Securities Loaned” on the Schedule of Investments includes cash collateral received and reinvested that totaled $8,876,379 for ARAF at March 31, 2023. This amount is offset by a liability recorded as “Collateral on securities loaned.” The contractual maturity of securities lending transactions is on an overnight and continuous basis. The Funds cannot pledge or resell the collateral.
| (10) | LEGAL PROCEEDINGS |
On July 30, 2020, an investor in the AlphaCentric Income Opportunities Fund (the “Fund”) filed a putative class action in Florida state court, naming AlphaCentric Advisors LLC, Mutual Fund Series Trust, and others as defendants. Plaintiff alleges that the Fund misrepresented that it held no more than 15% of its assets in illiquid securities, among other things, and asserts violations of Sections 11, 12(a)(2) and 15 of the Securities Act of 1933. The Florida action was dismissed with prejudice on September 22, 2021.
On October 14, 2020, the same Plaintiff filed a nearly identical putative class action in New York State Court against the same defendants. That complaint was amended on February 26, 2021, which added two additional defendants, including sub-advisor Garrison Point LLC. On February 16, 2023, the New York court dismissed all but one claim for failure to state a claim. The defendants believe the remaining claim is meritless and intend to contest it vigorously.
| (11) | SUBSEQUENT EVENTS |
Subsequent events after the date of the Statements of Assets and Liabilities have been evaluated through the date the financial statements were issued. Management has determined that no events or transactions occurred requiring adjustment or disclosure in the financial statements, other than the following:
Effective April 1, 2023, the management fee payable by AIOF Manager reduced from 1.50% to 1.30% of the average daily net assets of the Fund.
111

REPORT OF INDEPENDENT REGISTERED PUBLIC ACCOUNTING FIRM
To the Shareholders of AlphaCentric Income Opportunities Fund, AlphaCentric Premium Opportunity Fund, AlphaCentric Robotics and Automation Fund, AlphaCentric Symmetry Strategy Fund, AlphaCentric LifeSci Healthcare Fund, AlphaCentric SWBC Municipal Opportunities Fund, and AlphaCentric Strategic Income Fund and Board of Trustees of Mutual Fund Series Trust
Opinion on the Financial Statements
We have audited the accompanying statements of assets and liabilities, including the schedules of investments, of the funds listed below (the “Funds”), each a series of Mutual Fund Series Trust, as of March 31, 2023, the related statements of operations, the statements of changes in net assets, the related notes, and the financial highlights for each of the periods indicated below (collectively referred to as the “financial statements”). In our opinion, the financial statements present fairly, in all material respects, the financial position of each of the Funds as of March 31, 2023, the results of their operations, the changes in net assets, and the financial highlights for each of the periods indicated below in conformity with accounting principles generally accepted in the United States of America.
| Statement(s) of | ||||||
| Statements of | Changes in Net | |||||
| Fund Name | Operations | Assets | Financial Highlights | |||
| AlphaCentric Income Opportunities Fund, AlphaCentric Premium Opportunity Fund, and AlphaCentric Robotics and Automation Fund | For the year ended March 31, 2023 | For the years ended March 31, 2023 and 2022 | For the years ended March 31, 2023, 2022, 2021, 2020, and 2019 | |||
| AlphaCentric Symmetry Strategy Fund* | For the year ended March 31, 2023 | For the years ended March 31, 2023 and 2022 | For the years ended March 31, 2023, 2022, 2021, and for the period from August 8, 2019 (commencement of operations) through March 31, 2020 | |||
| AlphaCentric LifeSci Healthcare Fund | For the year ended March 31, 2023 | For the years ended March 31, 2023 and 2022 | For the years ended March 31, 2023, 2022, 2021, and for the period from November 29, 2019 (commencement of operations) through March 31, 2020 | |||
AlphaCentric SWBC Municipal Opportunities Fund
| For the year ended March 31, 2023
| For the years ended March 31, 2023 and 2022 | For the years ended March 31, 2023, 2022, 2021, and for the period from December 31, 2019 (commencement of operations) through March 31, 2020 | |||
AlphaCentric Strategic Income Fund
| For the year ended March 31, 2023 | For the year ended March 31, 2023 and for the period from May 28, 2021 (commencement of operations) through March 31, 2022 | ||||
| * | The financial statements referred to above are Consolidated Financial Statements. |
C O H E N & C O M P A N Y , L T D .
800.229.1099 | 866.818.4538 fax | cohencpa.com
Registered with the Public Company Accounting Oversight Board
112
Basis for Opinion
These financial statements are the responsibility of the Funds’ management. Our responsibility is to express an opinion on the Funds’ financial statements based on our audits. We are a public accounting firm registered with the Public Company Accounting Oversight Board (United States) (“PCAOB”) and are required to be independent with respect to the Funds in accordance with the U.S. federal securities laws and the applicable rules and regulations of the Securities and Exchange Commission and the PCAOB.
We conducted our audits in accordance with the standards of the PCAOB. Those standards require that we plan and perform the audit to obtain reasonable assurance about whether the financial statements are free of material misstatement whether due to error or fraud.
Our audits included performing procedures to assess the risks of material misstatement of the financial statements, whether due to error or fraud, and performing procedures that respond to those risks. Such procedures included examining, on a test basis, evidence regarding the amounts and disclosures in the financial statements. Our procedures included confirmation of securities owned as of March 31, 2023, by correspondence with the custodians and brokers; when replies were not received from brokers, we performed other auditing procedures. Our audits also included evaluating the accounting principles used and significant estimates made by management, as well as evaluating the overall presentation of the financial statements. We believe that our audits provide a reasonable basis for our opinion.
We have served as the Funds’ auditor since 2015.

COHEN & COMPANY, LTD.
Cleveland, Ohio
May 30, 2023
113
AlphaCentric Funds
EXPENSE EXAMPLES (Unaudited)
March 31, 2023
As a shareholder of one or more of the AlphaCentric Funds, you incur two types of costs: (1) transaction costs, including sales charges (loads) on purchases of Class A shares; (2) ongoing costs, including management fees; distribution and/or service (12b-1) fees; and other Fund expenses. This example is intended to help you understand your ongoing costs (in dollars) of investing in a Fund and to compare these costs with the ongoing costs of investing in other mutual funds.
The example is based on an investment of $1,000 invested at the beginning of the period and held for the entire period from October 1, 2022 through March 31, 2023.
Actual Expenses
The “Actual” columns in the table below provide information about actual account values and actual expenses. You may use the information below, together with the amount you invested, to estimate the expenses that you paid over the period. Simply divide your account value by $1,000 (for example, an $8,600 account value divided by $1,000 = 8.6), then multiply the result by the number in the table under the heading entitled “Expenses Paid During Period” to estimate the expenses you paid on your account during this period.
Hypothetical Example for Comparison Purposes
The “Hypothetical” columns in the table below provide information about hypothetical account values and hypothetical expenses based on the AlphaCentric Funds’ actual expense ratio and an assumed rate of return of 5% per year before expenses, which is not either Fund’s actual return. The hypothetical account values and expenses may not be used to estimate the actual ending account balances or expenses you paid for the period. You may use this information to compare this 5% hypothetical example with the 5% hypothetical examples that appear in the shareholder reports of other funds.
Please note that the expenses shown in the table are meant to highlight your ongoing costs only and do not reflect any transactional costs, such as sales charges (loads), or redemption fees. Therefore, the table is useful in comparing ongoing costs only, and will not help you determine the relative total costs of owning different funds. In addition, if these transactional costs were included, your costs would have been higher.
| Hypothetical | ||||||||||||
| Actual | (5% return before expenses) | |||||||||||
| Fund’s | Beginning | Ending | Expenses | Ending | Expenses | |||||||
| Annualized | Account Value | Account Value | Paid During | Account Value | Paid During | |||||||
| Expense Ratio | 10/1/2022 | 3/31/2023 | Period * | 3/31/2023 | Period ** | |||||||
| AlphaCentric Income Opportunities Fund – Class A | 1.90% | $1,000.00 | $957.50 | $9.27 | $1,015.46 | $9.55 | ||||||
| AlphaCentric Income Opportunities Fund – Class C | 2.65% | $1,000.00 | $953.60 | $12.90 | $1,011.72 | $13.28 | ||||||
| AlphaCentric Income Opportunities Fund – Class I | 1.65% | $1,000.00 | $958.80 | $8.05 | $1,016.71 | $8.29 | ||||||
| AlphaCentric Premium Opportunity Fund – Class A | 2.24% | $1,000.00 | $1,064.30 | $11.53 | $1,013.76 | $11.25 | ||||||
| AlphaCentric Premium Opportunity Fund – Class C | 2.99% | $1,000.00 | $1,060.50 | $15.36 | $1,010.02 | $14.99 | ||||||
| AlphaCentric Premium Opportunity Fund – Class I | 1.99% | $1,000.00 | $1,065.50 | $10.25 | $1,015.01 | $10.00 | ||||||
| AlphaCentric Robotics and Automation Fund – Class A | 1.65% | $1,000.00 | $1,164.30 | $8.90 | $1,016.70 | $8.30 | ||||||
| AlphaCentric Robotics and Automation Fund – Class C | 2.40% | $1,000.00 | $1,160.30 | $12.93 | $1,012.96 | $12.04 | ||||||
| AlphaCentric Robotics and Automation Fund – Class I | 1.40% | $1,000.00 | $1,164.70 | $7.56 | $1,017.95 | $7.04 | ||||||
| AlphaCentric Symmetry Strategy Fund – Class A | 1.85% | $1,000.00 | $977.50 | $9.12 | $1,015.71 | $9.30 | ||||||
| AlphaCentric Symmetry Strategy Fund – Class C | 2.60% | $1,000.00 | $973.90 | $12.80 | $1,011.97 | $13.04 | ||||||
| AlphaCentric Symmetry Strategy Fund – Class I | 1.60% | $1,000.00 | $978.90 | $7.89 | $1,016.95 | $8.05 | ||||||
114
AlphaCentric Funds
EXPENSE EXAMPLES (Unaudited)(Continued)
March 31, 2023
| Hypothetical | ||||||||||||
| Actual | (5% return before expenses) | |||||||||||
| Fund’s | Beginning | Ending | Expenses | Ending | Expenses | |||||||
| Annualized | Account Value | Account Value | Paid During | Account Value | Paid During | |||||||
| Expense Ratio | 10/1/2022 | 3/31/2023 | Period * | 3/31/2023 | Period ** | |||||||
| AlphaCentric LifeSci Healthcare Fund – Class A | 1.65% | $1,000.00 | $1,197.30 | $9.04 | $1,016.70 | $8.30 | ||||||
| AlphaCentric LifeSci Healthcare Fund – Class C | 2.40% | $1,000.00 | $1,192.80 | $13.12 | $1,012.96 | $12.05 | ||||||
| AlphaCentric LifeSci Healthcare Fund – Class I | 1.40% | $1,000.00 | $1,199.30 | $7.68 | $1,017.95 | $7.04 | ||||||
| AlphaCentric SWBC Municipal Opportunities Fund – Class A | 1.50% | $1,000.00 | $1,065.20 | $7.73 | $1,017.45 | $7.55 | ||||||
| AlphaCentric SWBC Municipal Opportunities Fund – Class C | 2.25% | $1,000.00 | $1,061.70 | $11.57 | $1,013.71 | $11.30 | ||||||
| AlphaCentric SWBC Municipal Opportunities Fund – Class I | 1.25% | $1,000.00 | $1,066.50 | $6.45 | $1,018.69 | $6.30 | ||||||
| AlphaCentric Strategic Income Fund – Class A | 1.74% | $1,000.00 | $1,086.70 | $9.05 | $1,016.26 | $8.75 | ||||||
| AlphaCentric Strategic Income Fund – Class C | 2.49% | $1,000.00 | $1,082.00 | $12.92 | $1,012.52 | $12.49 | ||||||
| AlphaCentric Strategic Income Fund – Class I | 1.49% | $1,000.00 | $1,087.70 | $7.76 | $1,017.50 | $7.49 | ||||||
| * | Expenses are equal to the average account value over the period, multiplied by the Funds’ annualized expense ratio, multiplied by the number of days in the period (182) divided by the number of days in the fiscal year (365). |
| ** | Hypothetical expense information is presented on the basis of the full one-half year period to enable comparison to other funds. It is based on assuming the same net expense ratio and average account value over the period, but is multiplied by 182/365 (to reflect the full half-year period). |
115
| AlphaCentric Funds |
| Additional Information (Unaudited) |
| March 31, 2023 |
Approval of the Renewal of the Management Agreement between the Mutual Fund Series Trust and AlphaCentric Advisors, LLC with respect to the AlphaCentric Income Opportunities Fund, AlphaCentric LifeSci Healthcare Fund, AlphaCentric SWBC Municipal Opportunities Fund, AlphaCentric Premium Opportunity Fund, AlphaCentric Robotics and Automation Fund, AlphaCentric Symmetry Strategy Fund and AlphaCentric Strategic Income Fund
At a meeting held on November 10 and 21, 2022, the Board of Trustees (the “Board”) of Mutual Fund Series Trust (the “Trust”), including a majority of the Trustees who are not “interested persons” as that term is defined in the Investment Company Act of 1940, as amended, (each an “Independent Trustee,” and collectively the “Independent Trustees”) discussed the renewal of the management agreement (the “Management Agreement”) between the Trust and AlphaCentric Advisors LLC (“AlphaCentric”) with respect to the AlphaCentric Income Opportunities Fund (“AlphaCentric IO”), AlphaCentric LifeSci Healthcare Fund, (“AlphaCentric LH”), AlphaCentric SWBC Municipal Opportunities Fund (“AlphaCentric MO”), AlphaCentric Premium Opportunity Fund,(“AlphaCentric PO”), AlphaCentric Robotics and Automation Fund, (“AlphaCentric RA”), AlphaCentric Symmetry Strategy Fund (“AlphaCentric SS”) and AlphaCentric Strategic Income Fund (“AlphaCentric SI”) (collectively, the “AlphaCentric Funds”)
The Board examined AlphaCentric’s responses to a series of questions regarding, among other things, its management services provided to the AlphaCentric Funds, comparative fee and expense information, and AlphaCentric’s profitability from managing the AlphaCentric Funds. The Board was assisted by legal counsel throughout the review process and relied upon the advice of legal counsel and its own business judgment in determining the material factors to be considered in evaluating the Management Agreement and the weight to be given to each factor considered. The conclusions reached by the Board were based on a comprehensive evaluation of all of the information provided and were not the result of any one factor. Moreover, each Trustee may have afforded different weight to the various factors in reaching his conclusions with respect to renewal of the Management Agreement.
Nature, Extent and Quality of Services. The Board considered that AlphaCentric provided a continuous investment program to each AlphaCentric Fund consistent with the respective Fund’s investment objectives and policies. The Board further considered that AlphaCentric provided oversight of the sub-advisors for AlphaCentric IO, AlphaCentric LH, AlphaCentric MO, AlphaCentric RA, AlphaCentric SS, and AlphaCentric SI. The Board noted that with respect to AlphaCentric PO, AlphaCentric was responsible for managing the Fund on a day-to-day basis, including selection of securities. The Board discussed the fundamental and technical analysis performed by AlphaCentric and discussed its ongoing research and quantitative modeling to monitor and possible enhance the strategies. The Board considered the backgrounds of AlphaCentric’s investment personnel managing and supervising the AlphaCentric Funds, noting their tenure and financial industry experience. The Board reviewed the key risks associated with the AlphaCentric Funds and discussed AlphaCentric’s policies to monitor such risks, including period post-trade reviews. The Board noted that AlphaCentric had a risk management function and employed a Chief Risk Officer in addition to a Chief Compliance Officer. The Board reviewed AlphaCentric’s best execution policies, noting that for sub-advised funds, broker selection was delegated to the respective sub-advisor. After further discussion, the Board concluded that AlphaCentric had sufficient quality and depth of personnel, resources, investment methods and compliance policies and procedures necessary to perform its duties under the management agreement, and that the nature, overall quality and extent of the advisory services provided by AlphaCentric to each AlphaCentric Fund were satisfactory. The Board determined that AlphaCentric had the resources to continue providing high quality services to each AlphaCentric Fund and its shareholders.
Performance. The Board reviewed the performance of each AlphaCentric Fund relative to its peer group, Morningstar category and benchmark index.
AlphaCentric IO The Board observed that for the 1-year, 3-year, and 5-year periods, AlphaCentric IO underperformed its peer group, Morningstar categories and benchmark index. The Board noted that AlphaCentric IO outperformed its peer group, Morningstar categories and benchmark index over the since inception period. The Board acknowledged that AlphaCentric attributed underperformance to redemptions and a sell-off in the mezzanine and junior non-agency mortgage-backed securities class. The Board considered AlphaCentric’s representation that AlphaCentric IO’s performance had stabilized year to date.
AlphaCentric LH The Board commented that AlphaCentric LH had outperformed its peer group, Morningstar category the S&P 500 Total Return Index and the S&P 500 Biotechnology Total Return Index over the 1-year period. The Board observed that AlphaCentric LH had significantly outperformed its peer group and Morningstar category over the since inception period. The Board acknowledged that AlphaCentric attributed outperformance to stock selection and active management.
AlphaCentric MO The Board observed that AlphaCentric MO underperformed its peer group, Morningstar Category and benchmark over the 1-year and since inception periods. The Board discussed AlphaCentric’s explanation that AlphaCentric MO underperformed due to its exposure to closed-end funds that performed poorly during the year, and that AlphaCentric MO
116
| AlphaCentric Funds |
| Additional Information (Unaudited)(Continued) |
| March 31, 2023 |
was launched in a zero-interest rate environment in contrast to most of its peer funds that were invested when rates were higher which acted as a cushion in the rising interest rate environment.
AlphaCentric PO The Board noted that AlphaCentric PO outperformed its peer group and Morningstar category for the 3-year, 5-year, and 10-year periods, and the S&P 500 Index for the 1-year period. The Board observed that AlphaCentric PO underperformed its peer group and Morningstar category for the 1-year period and the S&P 500 Index for the 3-year, 5-year, and 10-year periods. The Board acknowledged AlphaCentric’s belief that comparing AlphaCentric PO to some of the funds in its peer group and Morningstar category was not an apples-to-apples comparison due to the wide range of options-based strategies of those funds. The Board recalled that AlphaCentric PO was not designed to track the S&P 500 in an extreme bull market.
AlphaCentric RA The Board observed that AlphaCentric RA underperformed its peer group, the S&P 500 Index, and the MSCI ACWI Gross Index across all periods. The Board noted that AlphaCentric RA outperformed its Morningstar category over the since inception period but underperformed the category across the 1-year, 3- year, and 5-year periods. The Board acknowledged that AlphaCentric attributed underperformance to the significant selloff of innovative growth companies due to concerns over inflation, particularly those focused on robotics and automation. The Board considered AlphaCentric’s assertion that although AlphaCentric RA’s performance relative to broad indices was unfavorable, the performance as compared to other robotics strategies was favorable for the year-to-date and 12-month periods.
AlphaCentric SS The Board noted that AlphaCentric SS outperformed its peer group, Morningstar category, and the BofA Merrill Lynch 3-Month U.S. Treasury Bill Index across all periods. The Board observed that AlphaCentric SS outperformed the MSCI World/Bloomberg U.S. Aggregate Bond Blended Index over the 1-year and 3-year periods but underperformed the same index over the 5-year period while generating equal returns over the since inception period. The Board acknowledged AlphaCentric SS’s significant outperformance relative to all benchmarks over the 1-year period.
AlphaCentric SI The Board noted that AlphaCentric SI outperformed its peer group, Real Estate category, and the Bloomberg U.S. MBS Index across all periods. The Board observed that AlphaCentric SI significantly outperformed the Nontraditional Bond category over 3-year, 5-year, and 10-year periods but underperformed the Nontraditional Bond category over the 1-year period. The Board observed AlphaCentric SS’s significant outperformance relative to all benchmarks over most periods and acknowledged AlphaCentric’s explanation that AlphaCentric SI underperformed the Nontraditional Bond category over the 1-year period due to AlphaCentric SI’s allocation to mortgage REITs which generally underperformed mortgage-backed securities over the period.
After discussion, the Board concluded that the performance of each AlphaCentric Fund was acceptable.
Fees and Expenses. The Board reviewed the management fee paid for each AlphaCentric Fund, and the average fees charged by each AlphaCentric Fund’s peer group and Morningstar category. The Board discussed the allocation by AlphaCentric of its management fees and the sub-advisory fees paid by AlphaCentric to each sub-advisor compared to the allocation of duties between AlphaCentric and each sub-advisor of the AlphaCentric Funds, and also considered the impact of Fund expense limitations on net advisory and sub-advisory fees. The Board acknowledged that the allocation between AlphaCentric and each sub-advisor was the result of arm’s length negotiations and determined that the allocations were appropriate. The Board considered the impact of the expense caps on total net expenses. After further discussion, the Board concluded that the management fee for each AlphaCentric Fund was not unreasonable.
AlphaCentric IO The Board noted that AlphaCentric IO’s management fee was higher than the high of its peer group and the Multisector Bond category, but lower than the high of the Nontraditional Bond Morningstar category. The Board discussed that AlphaCentric IO’s expense ratio was higher than the averages of the peer group and Morningstar categories but below the highs of each. The Board considered AlphaCentric’s remarks that its fees and expenses were attributable to the resources involved in managing the complex AlphaCentric IO strategy, including oversight of the sub-advisor. The Board noted that although the management fee was on the higher end of the Nontraditional Bond Morningstar category and highest of the Multisector Bond Morningstar Category, it was not unreasonable and would continue to be monitored.
AlphaCentric LH The Board recognized that AlphaCentric LH’s management fee was tied with the high of its peer group and Morningstar category, but that its net expense ratio was well below the highs of each. The Board discussed AlphaCentric’s explanation that the particular expertise and resources required to effectively executive AlphaCentric LH’s highly specialized strategy justified the higher fees. The Board recalled AlphaCentric’s representations that the actual net management fee after
117
| AlphaCentric Funds |
| Additional Information (Unaudited)(Continued) |
| March 31, 2023 |
waivers was below 1.00%. The Board also considered that shareholders benefited from the expense limitation agreement in place that limits total operating expenses to 1.40%.
AlphaCentric MO The Board observed that the management fee and net expense ratio of AlphaCentric MO were above the peer group and Morningstar category averages and medians, but below the highs of each. The Board noted AlphaCentric’s position that it was difficult to find an apt comparison for AlphaCentric MO because of its dual-investment strategy. The Board also considered that shareholders benefited from the expense limitation agreement in place that limits total operating expenses to 1.25%.
AlphaCentric PO The Board discussed that AlphaCentric PO’s management fee was tied with the high of its peer group and Morningstar category. The Board noted that AlphaCentric PO’s net expense ratio was higher than its peer group and Morningstar category averages, but below the highs of each. The Board considered AlphaCentric’s explanation that its peer group and Morningstar category contained funds with a diverse range of strategies and that AlphaCentric PO’s management fee and expense ratio aligned with the funds with similar investment strategies. The Board also considered that shareholders benefited from the expense limitation agreement in place that limits total operating expenses to 1.99%.
AlphaCentric RA The Board noted that the management fee for AlphaCentric RA was equal to the high of its peer group and Morningstar category. The Board observed that AlphaCentric RA’s net expense ratio was higher than the average net expense ratio of the peer group and Morningstar category but below the high of each. The Board considered the complexity of the investment strategy and expertise required to actively manage AlphaCentric RA, including oversight of the sub- advisor. The Board recounted AlphaCentric’s explanation that its peer group and Morningstar category encompassed funds that invested in a wide range of sectors whereas AlphaCentric RA invested strictly in robotics and automation. The Board also considered that shareholders benefited from the expense limitation agreement in place that limits total operating expenses to 1.40%.
AlphaCentric SS The Board acknowledged that the management fee for AlphaCentric SS was higher than the averages of its peer group and Morningstar category, but well below the high of each. The Board noted that AlphaCentric SS’s net expense ratio was lower than the average expense ratio of its peer group and higher than the average of its Morningstar category, but well below the high of each. The Board also considered that shareholders benefited from the expense limitation agreement in place that limits total operating expenses to 1.60%.
AlphaCentric SI The Board discussed that the management fee for AlphaCentric SI was higher than the averages of its peer group, Nontraditional Bond category, and Real Estate category, but below the high of its peer group and Nontraditional Bond category. The Board noted that AlphaCentric SI’s net expense ratio was higher than the average expense ratio of its peer group, Nontraditional Bond category, and Real Estate category, but well below the high of each. The Board also considered that shareholders benefited from the expense limitation agreement in place that limits total operating expenses to 1.49%.
Profitability. The Board discussed AlphaCentric’s profitability from its relationship with each AlphaCentric Fund based on the information provided by AlphaCentric related to its revenue and expenses. The Board also considered the benefits that AlphaCentric could derive from its soft dollar arrangements. The Board noted that AlphaCentric was managing AlphaCentric MO at a loss and managing AlphaCentric SS at the slimmest of margins. The Board therefore concluded that excessive profitability was not an issue at this time with respect to either AlphaCentric MO or AlphaCentric SS. The Board discussed that AlphaCentric was earning a profit from its relationship with AlphaCentric IO, AlphaCentric PO, AlphaCentric RA, AlphaCentric LH, and AlphaCentric SI. The Board considered AlphaCentric’s explanation that profitability in the Meeting Materials was for the period ended June 30, 2022, and that the assets of some AlphaCentric Fund’s had experienced a significant decline since that time. The Board determined AlphaCentric’s profitability for each AlphaCentric Fund was not excessive.
Economies of Scale. The Board noted that the management agreement did not provide breakpoints reducing the fee rate on assets above specified levels, but that shareholders of the AlphaCentric Funds had benefitted from the respective Fund’s expense limitation. The Board acknowledged AlphaCentric’s statement regarding the increasing costs of managing a registered fund. The Board recognized that the declining assets of some AlphaCentric Funds meant that the asset levels at which economies of scale would be achieved were unlikely to be realized in the near term. The Board agreed to monitor the assets of the AlphaCentric Funds and revisit the issue of breakpoints the next time the management agreement was considered for approval.
Conclusion. Having requested and received such information from AlphaCentric as the Board believed to be reasonably necessary to evaluate the terms of the Management Agreement, and as assisted by the advice of counsel, the Board concluded that renewal of the Management Agreement was in the best interests of each AlphaCentric Fund and its respective shareholders.
118
| AlphaCentric Funds |
| Additional Information (Unaudited)(Continued) |
| March 31, 2023 |
Approval of a Sub-Advisory Agreement between AlphaCentric Advisors, LLC and Garrison Point Capital Management, LLC with respect to AlphaCentric Income Opportunities Fund
At a meeting held on November 10 and 21, 2022, the Board of Trustees (the “Board”) of Mutual Fund Series Trust (the “Trust”), including a majority of the Trustees who are not “interested persons” as that term is defined in the Investment Company Act of 1940, as amended, (each an “Independent Trustee,” and collectively the “Independent Trustees”) discussed the approval of a sub-advisory agreement (the “New Sub-Advisory Agreement”) between AlphaCentric Advisors, LLC (“AlphaCentric”) and Garrison Point Capital Management, LLC (“Garrison Point”) with respect to the AlphaCentric Income Opportunities Fund (“AlphaCentric IO”) in light of a change in control of Garrison Point.
The Board examined Garrison Point’s responses to a series of questions regarding, among other things, its sub-advisory services provided to AlphaCentric IO, comparative fee and expense information, and Garrison Point’s profitability from sub- advising AlphaCentric IO. The Board was assisted by legal counsel throughout the review process and relied upon the advice of legal counsel and its own business judgment in determining the material factors to be considered in evaluating the New Sub-Advisory Agreement and the weight to be given to each factor considered. The conclusions reached by the Board were based on a comprehensive evaluation of all of the information provided and were not the result of any one factor. Moreover, each Trustee may have afforded different weight to the various factors in reaching his conclusions with respect to approval of the New Sub-Advisory Agreement.
Nature, Extent and Quality of Services. The Board considered that Garrison Point performed portfolio monitoring, research, in-dept analysis and trade execution on behalf of AlphaCentric IO and supported the AlphaCentric IO’s operations in all areas including compliance, valuation, and research. The Board commented on the depth of Garrison Point’s network to identify trading opportunities, and the longevity of its trading relationships. The Board reviewed the background information of Garrison Point’s key investment personnel, noting their satisfaction with the senior personnel dedicated to servicing AlphaCentric IO, the individuals’ educations and wide range of experience with alternative investments. The Board noted that Garrison Point routinely stress tested AlphaCentric IO’s portfolio in order to monitor and assess performance and risk. The Board commented on Garrison Point’s compliance program, which included documentation and review of daily portfolio transactions and monitoring of investment limitations. They considered the recent settlement with the SEC related to Garrison Point’s valuation disclosures and policies, and ongoing litigation. The Board expressed satisfaction with Garrison Point’s transparency regarding its plans to pursue non-routine investments. The Board reviewed Garrison Point’s best execution practices and noted that it evaluated its broker-dealers annually to ensure best execution. After further discussion, the Board concluded that Garrison Point had the resources to continue providing high quality service to AlphaCentric IO and its shareholders.
Performance. The Board observed that AlphaCentric IO underperformed the Bloomberg US Aggregate Bond Index for the 1-year, 3-year, and 5-year periods but outperformed the benchmark index over the since inception period. The Board acknowledged that Garrison Point attributed recent underperformance to AlphaCentric IO’s relatively high credit spread associated with housing related credit, which generally caused AlphaCentric IO to underperform in bear markets and outperform in bullish markets. The Board considered the negative impact of the recent performance on the longer-term metrics. Based on all the information presented, including the Fund’s investment strategy, the Board concluded the performance was acceptable.
Fees and Expenses. The Board observed that AlphaCentric charged a management fee of 1.50% for AlphaCentric IO and that 50% of the net management fee, after certain expenses, was paid to Garrison Point by AlphaCentric. The Board acknowledged that Garrison Point’s maximum sub-advisory fee for AlphaCentric IO of 0.75% was lower than the fees Garrison Point charged its other accounts. The Board discussed the allocation of fees between AlphaCentric and Garrison Point relative to their respective duties and other factors and agreed the allocation for AlphaCentric IO was appropriate. The Board concluded that the sub-advisor fee received by Garrison Point for AlphaCentric IO was not unreasonable.
Profitability. The Board considered the benefits that Garrison Point derived from nominal research services from various brokers. The Board considered that Garrison Point earned a profit from sub-advising AlphaCentric IO and attributed its estimated profitability in part to the efficiency of its operations. The Board recalled that the fee charged by Garrison Point was lower than those it charged to its other accounts. The Board acknowledged the complexity of AlphaCentric IO’s strategy and the expertise required to effectively execute the strategy. Further, the Board noted that while Garrison Point’s profit analysis reflected the annual base salary and benefits paid to its portfolio managers and managing director, it did not reflect the amounts paid to them from these profits as equity owners in the company. The Board concluded that Garrison Point’s profits were not excessive.
Economies of Scale. The Board considered whether Garrison Point had realized economies of scale with respect to the New Sub-Advisory services provided to AlphaCentric IO. The Board agreed that this was primarily an advisor-level issue and should be considered with respect to the overall management agreement taking into consideration the impact of the sub-advisory
119
| AlphaCentric Funds |
| Additional Information (Unaudited)(Continued) |
| March 31, 2023 |
expense. The Board concluded that it would continue to monitor the size of AlphaCentric IO and whether breakpoints were appropriate.
Conclusion. Having requested and received such information from Garrison Point as the Board believed to be reasonably necessary to evaluate the terms of the New Sub-Advisory Agreement, and as assisted by the advice and guidance of counsel, the Board concluded that approval of the New Sub-Advisory Agreement was in the best interests of AlphaCentric IO and its shareholders.
120
| AlphaCentric Funds |
| Additional Information (Unaudited)(Continued) |
| March 31, 2023 |
Approval of the Renewal of the Sub-Advisory Agreement between AlphaCentric Advisors LLC and Contego Capital Group, Inc. with respect to AlphaCentric Robotics & Automation Fund
At a meeting held on November 10 and 21, 2022, the Board of Trustees (the “Board”) of Mutual Fund Series Trust (the “Trust”), including a majority of the Trustees who are not “interested persons” as that term is defined in the Investment Company Act of 1940, as amended, (each an “Independent Trustee”, and collectively the “Independent Trustees”) discussed the renewal of the sub-advisory agreement (the “Sub-Advisory Agreement”) between AlphaCentric Advisors LLC (“AlphaCentric”) and Contego Capital Group, Inc. (“Contego”) with respect to the AlphaCentric Robotics & Automation Fund (“AlphaCentric RA”).
The Board examined Contego’s responses to a series of questions regarding, among other things, its sub-advisory services provided to AlphaCentric RA, comparative fee and expense information, and Contego’s profitability from sub- advising AlphaCentric RA. The Board was assisted by legal counsel throughout the review process and relied upon the advice of legal counsel and its own business judgment in determining the material factors to be considered in evaluating the Sub-Advisory Agreement and the weight to be given to each factor considered. The conclusions reached by the Board were based on a comprehensive evaluation of all of the information provided and were not the result of any one factor. Moreover, each Trustee may have afforded different weight to the various factors in reaching his conclusions with respect to renewal of the Sub-Advisory Agreement.
Nature, Extent and Quality of Services. The Board reviewed the business experience and academic credentials of the key personnel at Contego. The Board noted that Contego engaged a third-party for administrative and compliance services. The Board remarked that Contego furnished advice and recommendations with respect to the investment of AlphaCentric RA’s assets and purchase and sale of portfolio securities. The Board observed that Contego managed AlphaCentric RA’s investments to ensure compliance with investment restrictions and limitations and maintained records and furnished reports about AlphaCentric RA’s assets as required. The Board discussed that Contego provided fundamental and quantitative equity research, account reconciliations, recordkeeping, compliance, and trading services for AlphaCentric RA. The Board acknowledged that Contego selected broker dealers on the basis of best execution that could maximize Fund profits through a combination of cost control and efficient use of resources. The Board recognized that Contego had reported no material litigation or compliance issues since the last renewal of the Sub-Advisory Agreement. The Board concluded that the services provided by Contego were in line with its expectations and could be expected to continue providing quality service to AlphaCentric RA and its shareholders.
Performance. The Board observed that AlphaCentric RA underperformed its peer group, the S&P 500 Index, and the MSCI ACWI Gross Index across all periods. The Board noted that AlphaCentric RA outperformed its Morningstar category over the since inception period but underperformed the category across the 1-year, 3-year, and 5-year periods. The Board acknowledged that Contego attributed underperformance to the significant selloff of growth stocks, particularly those of small and mid-cap companies, in response to the Federal Reserve’s monetary policy and concerns over inflation. The Board concluded that the performance of AlphaCentric RA was acceptable.
Fees and Expenses . The Board acknowledged that Contego’s maximum annual sub-advisory fee of 0.625% of AlphaCentric RA’s average daily net assets was lower than the fee Contego charged to other accounts it managed. After further discussion, the Board concluded that the Contego’s sub-advisory fee was not unreasonable.
Profitability. The Board considered the benefits that Contego could derive from its soft dollar arrangements. The Board reviewed the profitability analysis provided by Contego, noting that Contego was sub-advising AlphaCentric RA at a reasonable profit. The Board concluded, therefore, that excessive profitability was not an issue for Contego at this time.
Economies of Scale. The Board considered whether Contego had realized economies of scale with respect to the sub-advisory services provided to AlphaCentric RA. The Board agreed that this was primarily an advisor level issue and should be considered with respect to the overall management agreement, taking into consideration the impact of the sub-advisory expense. The Board agreed that Contego did not appear to have benefited from material economies of scale.
Conclusion. Having requested and received such information from Contego as the Board believed to be reasonably necessary to evaluate the terms of the Sub-Advisory Agreement between AlphaCentric and Contego, and as assisted by the advice and guidance of counsel, the Board concluded that renewal of the Sub-Advisory Agreement was in the best interests of AlphaCentric RA and its shareholders.
121
| AlphaCentric Funds |
| Additional Information (Unaudited)(Continued) |
| March 31, 2023 |
Approval of the Renewal of the Sub-Advisory Agreement between AlphaCentric Advisors, LLC and LifeSci Fund Management, LLC with respect to AlphaCentric LifeSci Healthcare Fund.
At a meeting held on November 10 and 21, 2022, the Board of Trustees (the “Board”) of Mutual Fund Series Trust (the “Trust”), including a majority of the Trustees who are not “interested persons” as that term is defined in the Investment Company Act of 1940, as amended, (each an “Independent Trustee,” and collectively the “Independent Trustees”) discussed the renewal of the sub-advisory agreement (the “Sub-Advisory Agreement”) between AlphaCentric Advisors, LLC (“AlphaCentric”) and LifeSci Fund Management, LLC (“LifeSci”) with respect to the AlphaCentric LifeSci Healthcare Fund (“AlphaCentric LH”).
The Board examined LifeSci’s responses to a series of questions regarding, among other things, its sub-advisory services provided to AlphaCentric LH, comparative fee and expense information, and LifeSci’s profitability from sub-advising AlphaCentric LH. The Board was assisted by legal counsel throughout the review process and relied upon the advice of legal counsel and its own business judgment in determining the material factors to be considered in evaluating the Sub-Advisory Agreement and the weight to be given to each factor considered. The conclusions reached by the Board were based on a comprehensive evaluation of all of the information provided and were not the result of any one factor. Moreover, each Trustee may have afforded different weight to the various factors in reaching his conclusions with respect to renewal of the Sub-Advisory Agreement.
Nature, Extent and Quality of Services. The Board observed that the key personnel from LifeSci serving AlphaCentric LH had impressive academic credentials and extensive industry experience. The Board discussed that LifeSci was responsible for implementing AlphaCentric LH’s investment strategy, including making investment decisions and executing transactions for AlphaCentric LH. The Board noted that LifeSci conducted fundamental research to identify life sciences and healthcare technology companies with attractive growth potential. The Board discussed that LifeSci met with senior management teams of target companies to understand their strategic goals and limitations. It noted that LifeSci conducted scientific and technical diligence from company literature and publications and performed financial diligence by reviewing company filings and financial statements. The Board considered that LifeSci cross- referenced each new investment decision with a list of current investment restrictions prior to trade execution and reviewed the portfolio on a periodic basis post-trade to ensure compliance with investment restrictions. The Board further considered that LifeSci chose broker-dealers on the basis of best execution. The Board acknowledged that LifeSci reported no material litigation or compliance issues since the last approval of the sub-advisory agreement. The Board agreed that LifeSci could be expected to continue providing quality service to AlphaCentric LH and its shareholders.
Performance. The Board noted that AlphaCentric LH had outperformed its peer group, Morningstar category, the S&P 500 TR Index, and the S&P 500 Biotechnology TR Index over the 1-year and since inception periods. The Board observed that AlphaCentric LH had also outperformed these benchmarks year to date. The Board acknowledged that AlphaCentric attributed outperformance to diligent stock selection and active management style of AlphaCentric LH.
Fees and Expenses. The Board noted that AlphaCentric charged a management fee of 1.25% for AlphaCentric LH and that 50% of the net management fee was paid to LifeSci by AlphaCentric. The Board discussed the allocation of fees between AlphaCentric and LifeSci relative to their respective duties and other factors and agreed the allocation for AlphaCentric LH was appropriate. The Board concluded that the sub-advisory fee received by LifeSci for AlphaCentric LH was not unreasonable.
Profitability. The Board reviewed the profitability analysis provided by LifeSci, noting that LifeSci was sub-advising AlphaCentric LH at a loss. The Board concluded, therefore, that excessive profitability was not an issue for LifeSci at this time.
Economies of Scale. The Board considered whether LifeSci had realized economies of scale with respect to the sub-advisory services provided to AlphaCentric LH. The Board agreed that this was primarily an advisor-level issue and should be considered with respect to the overall management agreement taking into consideration the impact of the sub-advisory expense. The Board concluded that it would continue to monitor the size of AlphaCentric LH and whether breakpoints were appropriate. The Board agreed that LifeSci did not appear to have benefited from material economies of scale.
Conclusion. Having requested and received such information from LifeSci as the Board believed to be reasonably necessary to evaluate the terms of the Sub-Advisory Agreement between AlphaCentric and LifeSci, and as assisted by the advice and guidance of counsel, the Board concluded that renewal of the Sub-Advisory Agreement was in the best interests of AlphaCentric LH and its shareholders.
122
| AlphaCentric Funds |
| Additional Information (Unaudited)(Continued) |
| March 31, 2023 |
Approval of the Renewal of the Sub-Advisory Agreement between AlphaCentric Advisors, LLC and SWBC Investment Company with respect to AlphaCentric SWBC Municipal Opportunities Fund
At a meeting held on November 10 and 21, 2022, the Board of Trustees (the “Board”) of Mutual Fund Series Trust (the “Trust”), including a majority of the Trustees who are not “interested persons” as that term is defined in the Investment Company Act of 1940, as amended, (each an “Independent Trustee,” and collectively the “Independent Trustees”) discussed the renewal of the sub-advisory agreement (the “Sub-Advisory Agreement”) between AlphaCentric Advisors, LLC (“AlphaCentric”) and SWBC Investment Company (“SWBC”) with respect to the AlphaCentric SWBC Municipal Opportunities Fund (“AlphaCentric MO”).
The Board examined SWBC’s responses to a series of questions regarding, among other things, its sub-advisory services provided to AlphaCentric MO, comparative fee and expense information, and SWBC’s profitability from sub-advising AlphaCentric MO. The Board was assisted by legal counsel throughout the review process and relied upon the advice of legal counsel and its own business judgment in determining the material factors to be considered in evaluating the Sub-Advisory Agreement and the weight to be given to each factor considered. The conclusions reached by the Board were based on a comprehensive evaluation of all of the information provided and were not the result of any one factor. Moreover, each Trustee may have afforded different weight to the various factors in reaching his conclusions with respect to renewal of the Sub-Advisory Agreement.
Nature, Extent and Quality of Services. The Board reviewed the background information of the key investment personnel who were responsible for providing sub-advisory services to AlphaCentric MO, taking into consideration their education and experience. The Board observed that SWBC provided research, asset management and portfolio construction for AlphaCentric MO and that all investment decisions were overseen and executed by the sub-advisory team and authorized personnel. The Board noted that SWBC conducted a thorough analysis of credit fundamentals and value prior to purchasing a bond. The Board acknowledged that SWBC used a centralized platform with a dedicated team to manage all investment instructions and utilized pre-arranged clearing firms offering best execution to support trading activity. The Board noted that SWBC reported no material compliance, litigation or regulatory issues since the last approval of the Sub -Advisory Agreement. Based on the information provided, including AlphaCentric’s satisfaction with the services of SWBC, the Board concluded that the nature, extent and quality of the service provided were acceptable.
Performance. The Board considered AlphaCentric MO’s performance, commenting that it underperformed the Bloomberg Long Bond Index over the 1-year and since inception periods. The Board acknowledged SWBC’ s position that the Bloomberg Long Bond Index was not the best comparison. The Board reviewed performance compared to a blended 50% Bloomberg Long Bond Index/50% First Trust Closed End Fund Index, observing that AlphaCentric MO outperformed the blended index over the 1-year period. The Board concluded that based on all of the information provided, performance was acceptable.
Fees and Expenses. The Board noted that SWBC received a sub-advisory fee, which was paid by AlphaCentric, of 40% of AlphaCentric’s net advisory fee. After further discussion, the Board concluded that the sub-advisory fee charged with respect to AlphaCentric MO, the sub-advisory fee in relation to the total advisory fee, and the allocation of fees between AlphaCentric and SWBC were not unreasonable.
Profitability. The Board reviewed the profitability analysis provided by SWBC, noting that SWBC was sub-advising AlphaCentric MO at a loss. The Board concluded, therefore, that excessive profitability was not an issue for SWBC at this time.
Economies of Scale. The Board considered whether SWBC had realized economies of scale with respect to the sub-advisory services provided to AlphaCentric MO. The Board agreed that this was primarily an advisor level issue and had been considered with respect to the overall management agreement, taking into consideration the impact of the sub-advisory expense and the breakpoints in the sub-advisory fee. The Board concluded that it would continue to monitor the size of AlphaCentric MO and whether breakpoints were appropriate. The Board agreed that SWBC did not appear to have benefited from material economies of scale.
Conclusion. Having requested and received such information from SWBC as the Board believed to be reasonably necessary to evaluate the terms of the Sub-Advisory Agreement between AlphaCentric and SWBC, and as assisted by the advice and guidance of counsel, the Board concluded that renewal of the Sub-Advisory Agreement was in the best interests of AlphaCentric MO and its shareholders.
123
| AlphaCentric Funds |
| Additional Information (Unaudited)(Continued) |
| March 31, 2023 |
Approval of the Renewal of the Sub-Advisory Agreement between AlphaCentric Advisors LLC and Mount Lucas Management LP with respect to AlphaCentric SWBC Municipal Opportunities Fund and AlphaCentric Symmetry Strategy Fund.
At a meeting held on November 10 and 21, 2022, the Board of Trustees (the “Board”) of Mutual Fund Series Trust (the “Trust”), including a majority of the Trustees who are not “interested persons” as that term is defined in the Investment Company Act of 1940, as amended, (each an “Independent Trustee,” and collectively the “Independent Trustees”) discussed the renewal of the sub-advisory agreements (the “Sub-Advisory Agreements”) between AlphaCentric Advisors, LLC (“AlphaCentric”) and Mount Lucas Management LP (“Mount Lucas”) with respect to each of AlphaCentric Municipal Opportunities Fund (“AlphaCentric MO”) and AlphaCentric Symmetry Strategy Fund (“AlphaCentric SS”).
The Board examined Mount Lucas’s responses to a series of questions regarding, among other things, its sub-advisory services provided to AlphaCentric MO and AlphaCentric SS, comparative fee and expense information, and Mount Lucas’s profitability from sub- advising AlphaCentric MO and AlphaCentric SS. The Board was assisted by legal counsel throughout the review process and relied upon the advice of legal counsel and its own business judgment in determining the material factors to be considered in evaluating the Sub-Advisory Agreements and the weight to be given to each factor considered. The conclusions reached by the Board were based on a comprehensive evaluation of all of the information provided and were not the result of any one factor. Moreover, each Trustee may have afforded different weight to the various factors in reaching his conclusions with respect to the renewal of the Sub-Advisory Agreements.
Nature, Extent and Quality of Services. The Board noted that Mount Lucas utilized various quantitative investment models which it had developed and continuously refined over 30 years. The Board commented on Mount Lucas’s technical expertise, including designing and building proprietary software systems to aid in trading and compliance monitoring. The Board reviewed the experience and credentials of Mount Lucas’s investment personnel, taking into consideration each individual’s education, financial industry experience, and tenure with the company. The Board observed that Mount Lucas selected broker-dealers on the basis of best execution, taking into account the full range of a broker’s services, commission rates, financial responsibility and responsiveness. The Board reviewed Mount Lucas’s compliance monitoring practices, noting that Mount Lucas reported no material compliance issues. The Board agreed that Mount Lucas had the experience and resources necessary to continue providing quality services to AlphaCentric MO and AlphaCentric SS.
Performance. The Board reviewed the performance of AlphaCentric MO and AlphaCentric SS relative to each’s peer group, Morningstar category and benchmark index.
AlphaCentric MO The Board observed AlphaCentric MO underperformed its benchmark index over the 1-year and since inception periods. The Board observed that the sleeve of AlphaCentric MO sub-advised by Mount Lucas positively contributed to the performance of AlphaCentric MO over the 1-year period.
AlphaCentric SS The Board noted that AlphaCentric SS outperformed the MSCI World/Bloomberg U.S. Aggregate Bond Blended Index over the 1-year and 3-year periods but underperformed its benchmark over the 5-year and since inception periods. The Board discussed that AlphaCentric SS had outperformed its peer group, Morningstar category, and the BofA Merrill Lynch 3-Month U.S. Treasury Bill Index across all periods.
After discussion, the Board concluded that the performance of AlphaCentric MO and AlphaCentric SS were acceptable.
Fees and Expenses. The Board discussed the allocation of fees between AlphaCentric and Mount Lucas relative to their respective duties and other factors and agreed the allocations for each of AlphaCentric MO and AlphaCentric SS were appropriate. The Board noted that the allocation of fees between the advisor and Mount Lucas was the product of an arm’s length negotiation. The Board concluded that the sub-advisory fees received by Mount Lucas from AlphaCentric for each of AlphaCentric MO and AlphaCentric SS were not unreasonable.
AlphaCentric MO The Board observed that Mount Lucas received 10% of the net advisory fee, which was equal to or lower than the advisory fee charged to the other accounts it managed.
AlphaCentric SS The Board noted that Mount Lucas received 100% of the net management fee earned by the adviser on assets merged from the predecessor fund, and 50% of the net management fee earned by the adviser on all other assets of AlphaCentric SS, the net being the management fee after paying certain fund related expenses. The Board noted that although the differing fee structures made a direct comparison difficult, the fees charged by Mount Lucas to its other accounts appeared in line with the fees charged to AlphaCentric SS.
124
| AlphaCentric Funds |
| Additional Information (Unaudited)(Continued) |
| March 31, 2023 |
Profitability. The Board reviewed the profitability analyses provided by Mount Lucas and concluded that excessive profitability was not an issue for Mount Lucas with respect to either AlphaCentric MO or AlphaCentric SS.
AlphaCentric MO The Board remarked that AlphaCentric waived its sub-advisory fee and was sub-advising AlphaCentric MO at a loss.
AlphaCentric SS The Board reviewed that Mount Lucas earned a profit from the Sub-Advisory Agreement. The Board discussed that the profit in terms of actual dollars paid was a modest profit as a percentage of revenue and was not excessive. The Board considered the fee arrangement between AlphaCentric and Mount Lucas, noting that Mount Lucas received 100% of the management fee from managing the predecessor fund’s assets.
Economies of Scale. The Board considered whether Mount Lucas had realized economies of scale with respect to the sub-advisory services provided to AlphaCentric MO and AlphaCentric SS. The Board agreed that this was primarily an advisor-level issue and should be considered with respect to the overall management agreement taking into consideration the impact of the sub-advisory expense. The Board concluded that it would continue to monitor the size of each of AlphaCentric MO and AlphaCentric SS and whether breakpoints were appropriate.
Conclusion. Having requested and received such information from Mount Lucas as the Board believed to be reasonably necessary to evaluate the terms of the Sub-Advisory Agreements between AlphaCentric and Mount Lucas, and as assisted by the advice and guidance of counsel, the Board concluded that the renewal of the Sub-Advisory Agreements were in the best interests of AlphaCentric MO and AlphaCentric SS and their shareholders.
125
| AlphaCentric Funds |
| Additional Information (Unaudited)(Continued) |
| March 31, 2023 |
Approval of the Renewal of the Sub-Advisory Agreement between AlphaCentric Advisors, LLC and Goshen Rock Capital, LLC . with respect to AlphaCentric Strategic Income Fund
At a meeting held on November 10 and 21, 2022, the Board of Trustees (the “Board”) of Mutual Fund Series Trust (the “Trust”), including a majority of the Trustees who are not “interested persons” as that term is defined in the Investment Company Act of 1940, as amended, (each an “Independent Trustee,” and collectively the “Independent Trustees”) discussed the renewal of the sub-advisory agreement (the “Sub-Advisory Agreement”) between AlphaCentric Advisors, LLC (“AlphaCentric”) and Goshen Rock Capital, LLC (“GRC”) with respect to the AlphaCentric Strategic Income Fund (“AlphaCentric SI”).
The Board examined GRC’s responses to a series of questions regarding, among other things, its sub-advisory services provided to AlphaCentric SI, comparative fee and expense information, and GRC’s profitability from sub-advising AlphaCentric SI. The Board was assisted by legal counsel throughout the review process and relied upon the advice of legal counsel and its own business judgment in determining the material factors to be considered in evaluating the Sub-Advisory Agreement and the weight to be given to each factor considered. The conclusions reached by the Board were based on a comprehensive evaluation of all of the information provided and were not the result of any one factor. Moreover, each Trustee may have afforded different weight to the various factors in reaching his conclusions with respect to the renewal of the Sub-Advisory Agreement.
Nature, Extent and Quality of Services. The Board observed that the key personnel from GRC had extensive investment industry experience. The Board discussed that GRC was responsible for the implementation of AlphaCentric SI’s investment strategy including the determination of investment decisions and execution of transactions for AlphaCentric SI. The Board noted that GRC utilized written portfolio guidelines and internal models to ensure compliance with the AlphaCentric SI’s investment limitations. The Board remarked that GRC’s investment team conducted portfolio surveillance and security level stress testing on an ongoing basis, and that its risk committee monitored a wide range of known and potential investment risks. The Board considered that GRC selected broker-dealers upon approval of its chief compliance officer who reviewed them for best execution after taking into account their facilities, reliability and financial responsibility among other things. The Board agreed that GRC could be expected to continue providing quality service to AlphaCentric SI and its shareholders.
Performance. The Board observed that while the AlphaCentric SI’s performance was negative for the one-year period, it outperformed the Bloomberg U.S. Mortgage-Backed Securities Index and S&P U.S. REIT NTR Index over the 1-year, 3-year, 5-year, and since inception periods.
Fees and Expenses. The Board noted that GRC receives 50% of the net asset management fee that AlphaCentric received for managing AlphaCentric SI. The Board noted that GRC compared its sub-advisory fee to the fees paid to an affiliate of GRC for managing a private fund, which was 1.50% plus a 20% incentive fee. The Board discussed the allocation of fees between AlphaCentric and GRC relative to their respective duties and agreed that the allocation was appropriate. After further discussion, the Board concluded that the sub- advisory fee charged with respect to AlphaCentric SI was not unreasonable and the sub-advisory fee, in relation to the total advisory fee, was not unreasonable.
Profitability. The Board reviewed the profitability analysis provided by GRC, noting that GRC was sub-advising AlphaCentric SI at a loss. The Board concluded, therefore, that excessive profitability was not an issue for GRC at this time.
Economies of Scale. The Board considered whether GRC had realized economies of scale with respect to the sub-advisory services provided to AlphaCentric SI. The Board agreed that this was primarily an advisor level issue and had been considered with respect to the overall advisory agreement, taking into consideration the impact of the sub-advisory expense and whether breakpoints were appropriate.
Conclusion. Having requested and received such information from GRC as the Board believed to be reasonably necessary to evaluate the terms of the Sub-Advisory Agreement between AlphaCentric and GRC, and as assisted by the advice and guidance of counsel, the Board concluded that renewal of the Sub-Advisory Agreement was in the best interests of AlphaCentric SI and its shareholders.
126
| AlphaCentric Funds |
| ADDITIONAL INFORMATION (Unaudited)(Continued) |
| March 31, 2023 |
Independent Trustees
| Name, Address Year of Birth | Position(s) Held with Registrant | Term and Length Served* | Principal Occupation(s) During Past 5 Years | Number of Portfolios Overseen in the Fund Complex** | Other Directorships Held During Past 5 Years |
| Tobias Caldwell c/o Mutual Fund Series Trust 36 N. New York Avenue, Huntington, NY 11743 Year of Birth: 1967 | Lead Trustee, Chairman of the Audit Committee and Nominating Committee | Since 6/2006 | Manager of Genovese Family Enterprises LLC & affiliates, the Genovese family office, since 1999; Managing Member of Bear Properties, LLC, a real estate management firm, since 2006; Managing Member of PTL Real Estate LLC, from 2000 until 2019. | 54 | Trustee of Variable Insurance Trust since 2010; Chairman of the Board of Mutual Fund and Variable Insurance Trust since 2016; Chairman of the Board of Strategy Shares since 2016; Trustee of IDX Funds Trust since 2016; Chairman of the Board of AlphaCentric Prime Meridian Income Fund since 2018 |
| Tiberiu Weisz c/o Mutual Fund Series Trust 36 N. New York Avenue, Huntington, NY 11743 Year of Birth: 1949 | Trustee, Chairman of the Risk and Compliance Committee | Since 6/2006 | Attorney since 1982. | 38 | Trustee of Variable Insurance Trust since 2010 |
| Stephen P. Lachenauer c/o Mutual Fund Series Trust 36 N. New York Avenue, Huntington, NY 11743 Year of Birth: 1967 | Trustee | Since 4/2022 | Attorney, private practice | 54 | Trustee and Chair of the Audit and Risk and Compliance Committees since 2016, and Chair of the Investment Committee since November 2020, Mutual Fund and Variable Insurance Trust; Trustee and Chair of the Audit and Risk and Compliance Committees since 2016, and Chair of the Investment Committee since November 2020, Strategy Shares; Chairman of the Board, TCG Financial Series Trusts I-X since 2015; Trustee and Chair of the Audit and Risk and Compliance Committees since 2018, and Chair of the Investment Committee since November 2020, AlphaCentric Prime Meridian Income Fund. |
127
| AlphaCentric Funds |
| ADDITIONAL INFORMATION (Unaudited)(Continued) |
| March 31, 2023 |
Interested Trustee*** and Officers
| Name, Address, Year of Birth | Position(s) Held with Registrant | Term and Length Served* | Principal Occupation(s) During Past 5 Years | Number of Portfolios Overseen In The Fund Complex** | Other Directorships Held During Past 5 Years |
| Jerry Szilagyi 53 Palmeras St. Suite 601 San Juan, PR 00901 Year of Birth: 1962 | Chairman of the Board | Trustee since 7/2006; President 2/2012- 3/2022 | President of the Trust, 2/2012—4/2022; President, Rational Advisors, Inc., 1/2016 - present; Chief Executive Officer, Catalyst Capital Advisors LLC, 1/2006- present; Member, AlphaCentric Advisors LLC, 2/2014 to Present; Managing Member, MFund Distributors LLC, 10/2012-present; Managing Member, MFund Services LLC, 1/2012 – Present; CEO, Catalyst International Advisors LLC, 11/2019 to present; CEO, Insights Media LLC, 11/2019 to present; CEO, MFund Management LLC, 11/2019 to present. | 38 | Variable Insurance Trust since 2010 |
| Michael Schoonover 53 Palmeras St. Suite 601 San Juan, PR 00901 Year of Birth: 1983 | President | Since 3/2022 | Vice President of the Trust, 2018--2022; Chief Operating Officer, Catalyst Capital Advisors LLC and Rational Advisors, Inc., June 2017 to present; Portfolio Manager, Catalyst Capital Advisors LLC 12/2013 to 5/2021; Portfolio Manager, Rational Advisors, Inc. 1/2016 to 5/2018; President, MFund Distributors LLC, 1/2020 to present; COO, Catalyst International Advisors LLC, 11/2019 to present; COO, Insights Media LLC, 11/2019 to present; COO, MFund Management LLC, 11/2019 to present; COO, AlphaCentric Advisors LLC, since 1/2021. | N/A | N/A |
| Alex Merino 53 Palmeras St. Suite 601 San Juan, PR 00901 Year of Birth: 1985 | Vice President | Since 3/2022 | Investment Operations Manager, MFund Management LLC, 1/2022 to present; Investment Operations Analyst, MFund Management LLC, 9/2020 to 12/2021; Tax Senior Associate, PwC Asset & Wealth Management NY Metro, 7/2016-6/2019. | N/A | N/A |
| Erik Naviloff 4221 North 203rd Street, Suite 100, Elkhorn, Nebraska, 68022 Year of Birth: 1968 | Treasurer | Since 4/2012 | Vice President – Fund Administration, Ultimus Fund Solutions, LLC, since 2011. | N/A | N/A |
| Brian Curley 4221 North 203rd Street, Suite 100, Elkhorn, Nebraska, 68022 Year of Birth: 1970 | Assistant Treasurer | Since 11/2013 | Vice President – Fund Administration, Ultimus Fund Solutions, LLC since 1/2015. | N/A | N/A |
| Sam Singh 4221 North 203rd Street, Suite 100, Elkhorn, Nebraska, 68022 Year of Birth: 1976 | Assistant Treasurer | Since 2/2015 | Vice President – Fund Administration, Ultimus Fund Solutions, LLC since 1/2015. | N/A | N/A |
| Frederick J. Schmidt 36 N. New York Avenue Huntington, NY 11743 Year of Birth: 1959 | Chief Compliance Officer | Since 5/2015 | Director of Compliance Services, MFund Services LLC since 5/2015. | N/A | N/A |
| Jennifer A. Bailey 36 N. New York Avenue Huntington, NY 11743 Year of Birth: 1968 | Secretary | Since 4/2014 | Director of Legal Services, MFund Services LLC, since 2012. | N/A | N/A |
| * | The term of office of each Trustee is indefinite. |
| ** | The ‘Fund Complex’ includes the Trust, Variable Insurance Trust, Mutual Fund and Variable Insurance Trust, Strategy Shares, and AlphaCentric Prime Meridian Income Fund, each a registered investment company. |
| *** | The Trustee who is an “interested person” of the Trust as defined in the 1940 Act is an interested person by virtue of being an officer of the advisor to certain series of the Trust. |
The Funds’ Statement of Additional Information includes additional information about the Trustees.
128
| AlphaCentric Funds |
| Additional Information (Unaudited) |
| March 31, 2023 |
Reference is made to the Prospectus and the Statement of Additional Information for more detailed descriptions of the Management Agreement, Services Agreement and Distribution and/or Service (12b-1) Plan, tax aspects of the Funds and the calculation of the net asset value of shares of the Funds.
The Funds file their complete schedules of portfolio holdings with the Securities and Exchange Commission (the “Commission”) for the first and third quarters of each fiscal year as an exhibit to its reports on Form N-PORT. The Funds’ Forms N-PORT are available on the Commission’s website at http://www.sec.gov. The Funds’ Forms N-PORT may be obtained by calling 1-800-SEC-0330.
A description of the policies and procedures that the Funds use to determine how to vote proxies relating to portfolio securities is available without charge, upon request, by calling 1-844-223-8637; and on the Commission’s website at http://www.sec.gov.
Information regarding how the Funds voted proxies relating to portfolio securities during the most recent 12-month period ended June 30 is available without charge, upon request, by calling 1-844-223-8637; and on the Commission’s website at http://www.sec.gov.
129
PRIVACY NOTICE
Mutual Fund Series Trust
Rev. August 2021
| FACTS | WHAT DOES MUTUAL FUND SERIES TRUST DO WITH YOUR PERSONAL INFORMATION? |
| Why? | Financial companies choose how they share your personal information. Federal law gives consumers the right to limit some, but not all sharing. Federal law also requires us to tell you how we collect, share, and protect your personal information. Please read this notice carefully to understand what we do. |
| What? | The types of personal information we collect and share depends on the product or service that you have with us. This information can include:
● Social Security number and wire transfer instructions
● account transactions and transaction history
● investment experience and purchase history
When you are no longer our customer, we continue to share your information as described in this notice. |
| How? | All financial companies need to share customers’ personal information to run their everyday business. In the section below, we list the reasons financial companies can share their customers’ personal information; the reasons Mutual Fund Series Trust chooses to share; and whether you can limit this sharing. |
| Reasons we can share your personal information: | Does Mutual Fund Series Trust share information? | Can you limit this sharing? |
For our everyday business purposes - such as to process your transactions, maintain your account(s), respond to court orders and legal investigations, or report to credit bureaus. | YES | NO |
For our marketing purposes - to offer our products and services to you. | NO | We don’t share |
| For joint marketing with other financial companies. | NO | We don’t share |
For our affiliates’ everyday business purposes - information about your transactions and records. | NO | We don’t share |
For our affiliates’ everyday business purposes - information about your credit worthiness. | NO | We don’t share |
| For our affiliates to market to you | NO | We don’t share |
| For non-affiliates to market to you | NO | We don’t share |
130
PRIVACY NOTICE
Mutual Fund Series Trust
| What we do: | |
| How does Mutual Fund Series Trust protect my personal information? | To protect your personal information from unauthorized access and use, we use security measures that comply with federal law. These measures include computer safeguards and secured files and buildings.
Our service providers are held accountable for adhering to strict policies and procedures to prevent any misuse of your nonpublic personal information. |
| How does Mutual Fund Series Trust collect my personal information? | We collect your personal information, for example, when you:
● open an account or deposit money
● direct us to buy securities or direct us to sell your securities
● seek advice about your investments
We also collect your personal information from others, such as credit bureaus, affiliates, or other companies. |
| Why can’t I limit all sharing? | Federal law gives you the right to limit only:
● sharing for affiliates’ everyday business purposes – information about your creditworthiness.
● affiliates from using your information to market to you.
● sharing for non-affiliates to market to you.
State laws and individual companies may give you additional rights to limit sharing. |
| Definitions | |
| Affiliates | Companies related by common ownership or control. They can be financial and non-financial companies.
● Mutual Fund Series Trust does not share with affiliates. |
| Non-affiliates | Companies not related by common ownership or control. They can be financial and non-financial companies.
● Mutual Fund Series Trust doesn’t share with non-affiliates so they can market to you. |
| Joint marketing | A formal agreement between nonaffiliated financial companies that together market financial products or services to you.
● Mutual Fund Series Trust doesn’t jointly market. |
| Alpha Centric | 844-223-8637 | |
| Catalyst | 866-447-4228 | |
| QUESTIONS? | Day Hagan | 877-329-4246 |
| CALL | Empiric | 888-839-7424 |
| Eventide | 877-771-3836 | |
| JAG | 855-552-4596 |
131
Mutual Fund Series Trust
4221 North 203rd Street, Suite 100
Elkhorn, NE 68022
MANAGER
AlphaCentric Advisors, LLC
53 Palmeras Street, Suite 601
San Juan, PR 00901
ADMINISTRATOR
Ultimus Fund Solutions, LLC
225 Pictoria Drive, Suite 450
Cincinnati, OH 45246
TRANSFER AGENT
Ultimus Fund Solutions, LLC
225 Pictoria Drive, Suite 450
Cincinnati, OH 45246
INDEPENDENT REGISTERED PUBLIC ACCOUNTING FIRM
Cohen & Company, Ltd.
1350 Euclid Avenue
Suite 800
Cleveland, OH 44115
LEGAL COUNSEL
Thompson Hine LLP
41 South High Street Suite 1700
Columbus, OH 43215
CUSTODIAN BANK
U.S. Bank
1555 N. Rivercenter Drive. Suite 302
Milwaukee, WI 53212
ALPHA-A23
ITEM 2. CODE OF ETHICS.
| (a) | The registrant has, as of the end of the period covered by this report, adopted a code of ethics that applies to the registrant's principal executive officer, principal financial officer, and principal accounting officer or controller, or persons performing similar functions, regardless of whether these individuals are employed by the registrant or a third party. |
| (b) | During the period covered by this report, there were no amendments to any provision of the code of ethics. |
| (c) | During the period covered by this report, there were no waivers or implicit waivers of a provision of the code of ethics. |
ITEM 3. AUDIT COMMITTEE FINANCIAL EXPERT.
| The registrant’s Board of Trustees has determined that it does not have an audit committee financial expert serving on its audit committee. At this time, the registrant believes that the experience provided by each member of the audit committee together offer the registrant adequate oversight for the registrant’s level of financial complexity. |
ITEM 4. PRINCIPAL ACCOUNTANT FEES AND SERVICES.
| (a) | Audit Fees. The aggregate fees billed for each of the last two fiscal years for professional services rendered by the registrant's principal accountant for the audit of the registrant's annual financial statements or services that are normally provided by the accountant in connection with statutory and regulatory filings or engagements for the fiscal year is as follows: |
| Trust Series | 2023 | 2022 |
| AlphaCentric Income Opportunities Fund | $49,000 | $49,000 |
| AlphaCentric Premium Opportunity Fund | $11,500 | $11,500 |
| AlphaCentric Robotics and Automation Fund | $13,500 | $13,500 |
| AlphaCentric Symmetry Strategy Fund | $14,000 | $13,000 |
| AlphaCentric LifeSci Healthcare Fund | $12,000 | $11,000 |
| AlphaCentric SWBC Municipal Opportunities Fund | $14,000 | $14,000 |
| AlphaCentric Strategic Income Fund | $12,000 | $15,500 |
| (b) | Audit-Related Fees. There were no fees billed in each of the last two fiscal years for assurances and related services by the principal accountant that are reasonably related to the performance of the audit of the registrant’s financial statements and are not reported under paragraph (a) of this item. |
| (c) | Tax Fees. The aggregate fees billed in each of the last two fiscal years for professional services rendered by the principal accountant for tax compliance are as follows: |
| Trust Series | 2023 | 2022 |
| AlphaCentric Income Opportunities Fund | $4,100 | $7,600 |
| AlphaCentric Premium Opportunity Fund | $2,600 | $2,600 |
| AlphaCentric Robotics and Automation Fund | $3,100 | $3,100 |
| AlphaCentric Symmetry Strategy Fund | $3,500 | $3,000 |
| AlphaCentric LifeSci Healthcare Fund | $2,600 | $2,500 |
| Alpha SWBC Municipal Opportunities Fund | $4,000 | $6,000 |
| AlphaCentric Strategic Income Fund | $2,600 | $2,600 |
| (d) | All Other Fees. The aggregate fees billed in each of the last two fiscal years for products and services provided by the registrant’s principal accountant, other than the services reported in paragraphs (a) through (c) of this item were $0 for the fiscal year ended March 31, 2020. |
| (e)(1) | The audit committee does not have pre-approval policies and procedures. Instead, the audit committee or audit committee chairman approves on a case-by-case basis each audit or non-audit service before the principal accountant is engaged by the registrant. |
| (e)(2) | There were no services described in each of paragraphs (b) through (d) of this Item that were approved by the audit committee pursuant to paragraph (c)(7)(i)(C) of Rule 2-01 of Regulation S-X. |
| f) | Not applicable. The percentage of hours expended on the principal accountant's engagement to audit the registrant's financial statements for the most recent fiscal year that were attributed to work performed by persons other than the principal accountant's full-time, permanent employees was zero percent (0%). |
| (g) | All non-audit fees billed by the registrant's principal accountant for services rendered to the registrant for the fiscal year ended March 31, 2023, and are disclosed in (b)-(d) above. There were no audit or non-audit services performed by the registrant's principal accountant for the registrant's adviser. |
| (h) | The registrant's audit committee has considered whether the provision of non-audit services to the registrant's investment adviser (not including any sub-adviser whose role is primarily portfolio management and is subcontracted with or overseen by another investment adviser), and any entity controlling, controlled by, or under common control with the investment adviser that provides ongoing services to the registrant, that were not pre-approved pursuant to paragraph (c)(7)(ii) of Rule 2-01 of Regulation S-X, is compatible with maintaining the principal accountant's independence. |
(i) Not applicable.
(j) Not applicable.
ITEM 5. AUDIT COMMITTEE OF LISTED REGISTRANTS.
Not applicable
ITEM 6. SCHEDULE OF INVESTMENT
Included in annual report to shareholders filed under item 1 of this form.
ITEM 7. DISCLOSURE OF PROXY VOTING POLICIES AND PROCEDURES FOR CLOSED-END MANAGEMENT INVESTMENT COMPANIES.
Not applicable Fund is an open-end management investment company
ITEM 8. PORTFOLIO MANAGERS OF CLOSED-END MANAGEMENT INVESTMENT COMPANIES
Not applicable Fund is an open-end management investment company
ITEM 9. PURCHASES OF EQUITY SECURITIES BY CLOSED-END MANAGEMENT INVESTMENT COMPANY AND AFFILIATED PURCHASERS.
Not applicable Fund is an open-end management investment company
ITEM 10. SUBMISSION OF MATTERS TO A VOTE OF SECURITY HOLDERS.
Not applicable at this time.
ITEM 11. CONTROLS AND PROCEDURES.
| (a) | The registrant's principal executive and principal financial officers, or persons performing similar functions, have concluded that the registrant's disclosure controls and procedures (as defined in Rule 30a-3(c) under the 1940 Act, are effective, as of a date within 90 days of the filing date of |
this report, based on the evaluation of these controls and procedures required by Rule 30a-3(b) under the 1940 Act and Rule 15d-15(b) under the Securities Exchange Act of 1934, as amended.
| (b) | There were no changes in the registrant's internal control over financial reporting (as defined in Rule 30a-3(d) under the 1940 Act) that occurred during the period covered by this report that have materially affected, or are reasonably likely to materially affect, the registrant's internal control over financial reporting. |
ITEM 12. Disclosure of Securities Lending Activities for Closed-End Management Investment Companies. Not applicable to open-end investment companies.
ITEM 13. EXHIBITS
| (1) | Code of Ethics for Principal Executive and Senior Financial Officers is attached hereto. |
| (2) | Certifications pursuant to Section 302 of the Sarbanes-Oxley Act of 2002 are filed herewith. |
| (3) | Certifications pursuant to Section 906 of the Sarbanes-Oxley Act of 2002 are filed herewith. |
SIGNATURES
Pursuant to the requirements of the Securities Exchange Act of 1934 and the Investment Company Act of 1940, the registrant has duly caused this report to be signed on its behalf by the undersigned, thereunto duly authorized.
Mutual Fund Series Trust
| By Jerry Szilagyi | /s/ Jerry Szilagyi |
| President | |
| Date: June 8, 2023 | |
Pursuant to the requirements of the Securities Exchange Act of 1934 and the Investment Company Act of 1940, this report has been signed below by the following person on behalf of the registrant and in the capacities and on the date indicated.
| By Jerry Szilagyi | /s/ Jerry Szilagyi ___________ |
| President | |
| Date: June 8, 2023 | |
Pursuant to the requirements of the Securities Exchange Act of 1934 and the Investment Company Act of 1940, this report has been signed below by the following person on behalf of the registrant and in the capacities and on the date indicated.
| By Erik Naviloff | /s/ Erik Naviloff_____________ |
| Treasurer | |
| Date: June 8, 2023 | |