UNITED STATES SECURITIES AND EXCHANGE COMMISSION
Washington, D.C. 20549
FORM 10-K/A
Amendment No. 1
| x | Annual Report Pursuant to Section 13 or 15(d) of the Securities Exchange Act of 1934 |
For the fiscal year ended December 31, 2012
or
| o | Transition Report Pursuant to Section 13 or 15(d) of the Securities Exchange Act of 1934 |
For the transition period from ___ to ___
Commission file number 001-33055
BreitBurn Energy Partners L.P.
(Exact Name of Registrant as Specified in Its Charter)
| Delaware | 74-3169953 |
| (State or Other Jurisdiction of | (I.R.S. Employer |
| Incorporation or Organization) | Identification No.) |
| 515 South Flower Street, Suite 4800 | |
| Los Angeles, California | 90071 |
| (Address of Principal Executive Offices) | (Zip Code) |
Registrant’s telephone number, including area code: (213) 225-5900
Securities registered pursuant to Section 12(b) of the Act:
| Title of each class | Name of each exchange on which registered | |
| Common Units Representing Limited Partner Interests | The NASDAQ Stock Market LLC | |
Securities registered pursuant to section 12(g) of the Act: None
Indicate by check mark if the registrant is a well-known seasoned issuer, as defined in Rule 405 of the Securities Act. Yes x No o
Indicate by check mark if the registrant is not required to file reports pursuant to Section 13 or Section 15(d) of the Act. Yes o No x
Indicate by check mark whether registrant (1) has filed all reports required to be filed by Section 13 or 15(d) of the Securities Exchange Act of 1934 during the preceding 12 months (or for such shorter period that the registrant was required to file such reports), and (2) has been subject to such filing requirements for the past 90 days. Yes x No o
Indicate by check mark whether the registrant has submitted electronically and posted on its corporate Web site, if any, every Interactive Data File required to be submitted and posted pursuant to Rule 405 of Regulation S-T (§232.405 of this chapter) during the preceding 12 months (or for such shorter period that the registrant was required to submit and post such files). Yes x No o
Indicate by check mark if disclosure of delinquent filers pursuant to Item 405 of Regulation S-K (§229.405 of this chapter) is not contained herein, and will not be contained, to the best of registrant’s knowledge, in definitive proxy or information statements incorporated by reference in Part III of this Form 10-K or any amendment to this Form 10-K. o
Indicate by check mark whether the registrant is a large accelerated filer, an accelerated filer, a non-accelerated filer, or a smaller reporting company. See the definitions of “large accelerated filer,” “accelerated filer” and “smaller reporting company” in Rule 12b-2 of the Exchange Act. Large accelerated filer x Accelerated filer o Non-accelerated filer o (Do not check if a smaller reporting company) Smaller reporting company o
Indicate by check-mark whether the registrant is a shell company (as defined in Rule 12b-2 of the Act). Yes o No x
The aggregate market value of the Common Units held by non-affiliates was approximately $1.1 billion on June 30, 2012, the last business day of the registrant’s most recently completed second fiscal quarter, based on $16.58 per unit, the last reported sales price on The NASDAQ Global Select Market on such date.
As of February 27, 2013, there were 99,679,796 Common Units outstanding.
Documents Incorporated By Reference: Certain information called for in Items 10, 11, 12, 13 and 14 of Part III are incorporated by reference from the registrant’s definitive proxy statement for the 2013 annual meeting of unitholders to be held on June 19, 2013.
EXPLANATORY NOTE
BreitBurn Energy Partners L.P. (the “Partnership,” “we,” “us” or “our”) is filing this Amendment No. 1 on Form 10-K/A (this “Amendment”) to amend its Annual Report on Form 10-K for the year ended December 31, 2012, filed with the Securities and Exchange Commission (the “SEC”) on February 28, 2013 (the “Original 10-K”).
This Amendment is being filed to amend the Original 10-K as follows:
(a) Revised the reconciliation of Adjusted EBITDA to net income (loss) attributable to the partnership table in Part II-Item 6 “Selected Financial Data” to remove the amount shown as “Net operating cash flow from acquisitions, effective date through closing date,” and to replace the unrealized derivative gain or loss row with a row for the add back of derivative gain or loss and a row for derivative contract settlement amounts. In footnotes, disclosed (i) the amount of deferred premiums settled during the periods presented; (ii) the amount of premiums for derivative contracts paid in earlier periods that apply to contracts settled during the periods presented; and (iii) the amount of crude oil, natural gas and interest rate settlements received or paid during the periods presented.
(b) Part II-Item 7 - “Executive Overview” - amended the section under “Operational Focus” related to realized sales prices to delete the discussion of realized prices including the effect of commodity derivative instruments.
(c) Part II-Item 7 - “Results of Operations” - (i) amended the results of operations table to combine “Realized gain (loss) on commodity derivatives” and “Unrealized gain (loss) on commodity derivatives” into a new row titled “Gain on commodity derivatives” and to exclude the effect of commodity derivative instruments from the average realized sales prices; (ii) replaced the section titled “Revenues” with separate sections titled “Oil, natural gas and NGL sales” and “Gain on commodity derivatives” to discuss sales revenues separately from gain (loss) on commodity derivatives including a discussion of settlements received or paid during the periods presented; and (iii) amended the section titled “Interest expense, net of amounts capitalized” and added “Loss on interest rate swaps” to discuss interest expense separately from loss on interest rate swaps.
(d) Part II-Item 7 - “Liquidity and Capital Resources” - revised the discussion in the first paragraph of the section titled “Cash Flows” “Operating activities” to replace the words “realized gains” with “settlements received” during the period.
(e) Revised the Consolidated Statements of Cash Flows in Part IV-Item 15 to remove the row titled “Unrealized (gain) loss on derivative instruments” under the header “Adjustments to reconcile to cash flow from operating activities” and replace it by a row titled “Gain on derivative instruments” that combines settled and mark-to-market gains on derivative instruments. Added a new row titled “Derivative instrument settlements” under the same header that includes cash attributable to commodity derivative instruments that settled during the periods. Added new rows titled “Prepaid premiums on derivative instruments” and “Settlement payments on terminated derivative instruments” under this same header to reflect actual payments made or received relating to these items during the periods.
(f) Part IV-Item 15 - Note 4 “Acquisitions” - revised the pro forma revenue and net income (loss) table for material acquisitions - (i) revised the years ended December 31, 2011 and 2012 were to include aggregated pro forma information for our 2012 insignificant subsidiary acquisitions; and (ii) corrected the year ended December 31, 2010, which was incorrectly reported in the Original 10-K.
(g) Part IV-Item 15 - Note 5 “Financial Instruments and Fair Value Measurements” - revised the tables presenting gain and loss on derivative instruments not designated as hedging instruments to remove the “Realized gain (loss)” and “Unrealized gain (loss)” rows and combine these amounts in a new row titled “Net gain (loss).” Revised the tables setting forth a reconciliation of changes in fair value of our derivative instruments classified as Level 3 to remove the “Realized gain” and “Unrealized loss” rows and combine these amounts in a new row titled “Gain (loss).”
This Amendment includes new certifications by our Principal Executive Officer and Principal Financial Officer pursuant to Section 302 of the Sarbanes-Oxley Act of 2002, filed as Exhibits 31.1, 31.2, 32.1 and 32.2, hereto. Each certification was true and correct as of the date of the filing of the Original 10-K.
Pursuant to interpretation 246.14 in the Regulation S-K section of the SEC’s “Compliance & Disclosure Interpretations,” we are filing Parts II and IV of the Original 10-K in their entirety as part of this Amendment. The information included in the Original 10-K was complete and correct as of the date of the filing of the Original 10-K.
Except as described above, we have not modified or updated other disclosures contained in the Original 10-K. Accordingly, this Amendment, with the exception of the foregoing, does not reflect events occurring after the date of filing of the Original 10-K, or modify or update those disclosures affected by subsequent events. Consequently, all other information not affected by the corrections described above is unchanged and reflects the disclosures and other information made at the date of the filing of the Original 10-K and should be read in conjunction with our filings with the SEC subsequent to the filing of the Original 10-K, including amendments to those filings, if any.
BREITBURN ENERGY PARTNERS L.P. AND SUBSIDIARIES
TABLE OF CONTENTS
| Page | ||
| No. | ||
| PART II | ||
| PART IV | ||
GLOSSARY OF OIL AND GAS TERMS, DESCRIPTION OF REFERENCES
The following is a description of the meanings of some of the oil and gas industry terms that may be used in this report. The definitions of proved developed reserves, proved reserves and proved undeveloped reserves have been abbreviated from the applicable definitions contained in Rule 4-10(a)(6), (22) and (31) of Regulation S-X.
API: The specific gravity or density of oil expressed in terms of a scale devised by the American Petroleum Institute.
Bbl: One stock tank barrel, or 42 U.S. gallons of liquid volume, of crude oil or other liquid hydrocarbons.
Bbl/d: Bbl per day.
Bcf: One billion cubic feet of natural gas.
Bcfe: One billion cubic feet equivalent, determined using the ratio of one Bbl of crude oil to six Mcf of natural gas.
Boe: One barrel of oil equivalent. Natural gas is converted on the basis of six Mcf of gas per one barrel of oil equivalent. This ratio reflects an energy content equivalency and not a price or revenue equivalency. Given commodity price disparities, the price for a barrel of oil equivalent for natural gas is significantly less than the price for a barrel of oil.
Boe/d: Boe per day.
Btu: British thermal unit, which is the quantity of heat required to raise the temperature of a one-pound mass of water by one degree Fahrenheit.
completion: The installation of permanent equipment for the production of oil or natural gas, or in the case of a dry hole, the reporting of abandonment to the appropriate agency.
development well: A well drilled within the proved area of a natural gas or oil reservoir to the depth of a stratigraphic horizon known to be productive.
differential: The difference between a benchmark price of oil and natural gas, such as the NYMEX crude oil price, and the wellhead price received.
dry hole or well: A well found to be incapable of producing either oil or gas in sufficient quantities to justify completion as an oil or gas well.
economically producible: A resource which generates revenue that exceeds, or is reasonably expected to exceed, the costs of the operation.
exploitation: A drilling or other project which may target proven or unproven reserves (such as probable or possible reserves), but which generally has a lower risk than that associated with exploration projects.
exploratory well: A well drilled to find a new field or to find a new reservoir in a field previously found to be productive of oil or gas in another reservoir. Generally, an exploratory well is not a development well.
field: An area consisting of a single reservoir or multiple reservoirs all grouped on or related to the same individual geological structural feature and/or stratigraphic condition.
gross acres or gross wells: The total acres or wells, as the case may be, in which a working interest is owned.
ICE: Intercontinental Exchange.
LIBOR: London Interbank Offered Rate.
MBbls: One thousand barrels of crude oil or other liquid hydrocarbons.
1
MBoe: One thousand barrels of oil equivalent.
MBoe/d: One thousand barrels of oil equivalent per day.
Mcf: One thousand cubic feet of natural gas.
Mcf/d: One thousand cubic feet of natural gas per day.
Mcfe: One thousand cubic feet of natural gas equivalent, determined using the ratio of one Bbl of crude oil to six Mcf of natural gas.
MichCon: Michigan Consolidated Gas Company.
MMBbls: One million barrels of crude oil or other liquid hydrocarbons.
MMBoe: One million barrels of oil equivalent.
MMBtu: One million British thermal units.
MMBtu/d: One million British thermal units per day.
MMcf: One million cubic feet of natural gas.
MMcfe: One million cubic feet of natural gas equivalent, determined using the ratio of one Bbl of crude oil to six Mcf of natural gas.
MMcfe/d: One million cubic feet of natural gas equivalent per day, determined using the ratio of one Bbl of crude oil to six Mcf of natural gas.
net acres or net wells: The sum of the fractional working interests owned in gross acres or gross wells, as the case may be.
NGLs: The combination of ethane, propane, butane and natural gasolines that when removed from natural gas become liquid under various levels of higher pressure and lower temperature.
NYMEX: New York Mercantile Exchange.
oil: Crude oil, condensate and natural gas liquids.
productive well: A well that is producing or that is mechanically capable of production.
proved developed reserves: Proved reserves that can be expected to be recovered (i) through existing wells with existing equipment and operating methods or in which the cost of the required equipment is relatively minor compared to the cost of a new well, and (ii) through installed extraction equipment and infrastructure operational at the time of the reserves estimate if the extraction is by means not involving a well. This definition of proved developed reserves has been abbreviated from the applicable definition contained in Rule 4-10(a)(6) of Regulation S-X.
proved reserves: The estimated quantities of crude oil, natural gas and natural gas liquids that geological and engineering data demonstrate with reasonable certainty to be economically producible in future years from known reservoirs under existing economic and operating conditions and government regulations. The project to extract the hydrocarbons must have commenced or the operator must be reasonably certain that it will commence the project within a reasonable time. This definition of proved reserves has been abbreviated from the applicable definition contained in Rule 4-10(a)(22) of Regulation S-X.
2
proved undeveloped reserves or PUDs: Proved reserves that are expected to be recovered from new wells on undrilled acreage or from existing wells where a relatively major expenditure is required for recompletion. This definition of proved undeveloped reserves has been abbreviated from the applicable definitions contained in Rule 4-10(a)(31) of Regulation
S-X.
recompletion: The completion for production of an existing wellbore in another formation from that which the well has been previously completed.
reserve: Estimated remaining quantities of mineral deposits anticipated to be economically producible, as of a given date, by application of development projects to known accumulations.
reservoir: A porous and permeable underground formation containing a natural accumulation of producible oil and/or natural gas that is confined by impermeable rock or water barriers and is individual and separate from other reservoirs.
standardized measure: The present value of estimated future net revenue to be generated from the production of proved reserves, determined in accordance with the rules and regulations of the SEC (using prices and costs in effect as of the date of estimation), less future development, production and income tax expenses, and discounted at 10% per annum to reflect the timing of future net revenue. Standardized measure does not give effect to derivative transactions.
undeveloped acreage: Lease acreage on which wells have not been drilled or completed to a point that would permit the production of economic quantities of natural gas and oil regardless of whether such acreage contains proved reserves.
West Texas Intermediate (“WTI”): Light, sweet crude oil with high API gravity and low sulfur content used as the benchmark for U.S. crude oil refining and trading. WTI is deliverable at Cushing, Oklahoma to fill NYMEX futures contracts for light, sweet crude oil.
working interest: The operating interest that gives the owner the right to drill, produce and conduct operating activities on the property and to receive a share of production.
workover: Operations on a producing well to restore or increase production.
_____________________________________
References in this report to “the Partnership,” “we,” “our,” “us” or like terms refer to BreitBurn Energy Partners L.P. and its subsidiaries. References in this filing to “PCEC” or the “Predecessor” refer to Pacific Coast Energy Company LP, formerly named BreitBurn Energy Company L.P., our predecessor, and its predecessors and subsidiaries. References in this filing to “BreitBurn GP” or the “General Partner” refer to BreitBurn GP, LLC, our general partner and our wholly owned subsidiary. References in this filing to “BreitBurn Corporation” refer to BreitBurn Energy Corporation, a corporation owned by Randall Breitenbach and Halbert Washburn, the President (until December 31, 2012) and Chief Executive Officer, respectively, of our general partner. References in this filing to “BreitBurn Management” refer to BreitBurn Management Company, LLC, our administrative manager and wholly owned subsidiary. References in this filing to “BOLP” or “BreitBurn Operating” refer to BreitBurn Operating L.P., our wholly owned operating subsidiary. References in this filing to “BOGP” refer to BreitBurn Operating GP, LLC, the general partner of BOLP. References in this filing to “Quicksilver” refer to Quicksilver Resources Inc. from whom we acquired oil and gas properties and facilities in Michigan, Indiana and Kentucky on November 1, 2007. References in this filing to “BEPI” refer to BreitBurn Energy Partners I, L.P. References in this filing to “Utica” refer to BreitBurn Collingwood Utica LLC, our wholly owned subsidiary formed September 17, 2010. References in this filing to “Cabot” refer to Cabot Oil & Gas Corporation, from whom we acquired oil and natural gas properties primarily located in Wyoming on October 6, 2011. References in this filing to “NiMin” refer to NiMin Energy Corp., from whom we acquired oil properties located in Wyoming on June 28, 2012. References in this filing to “Element” refer to Element Petroleum, LP, from whom we acquired oil and natural gas properties located in Texas on July 2, 2012. References in this filing to “CrownRock” refer to CrownRock, L.P., from whom we acquired oil and natural gas properties located in Texas on July 2, 2012 and December 28, 2012. References in this filing to “AEO” refer to American Energy Operations, Inc., from whom we acquired principally oil gas properties located in California on November 30, 2012. References in this filing to “Lynden” refer to Lynden USA Inc., from whom we acquired oil and natural gas properties located in Texas on December 28, 2012. References in this filing to “Piedra” refer to Piedra Energy I, LLC, from whom we acquired oil and natural gas properties located in Texas on December 28, 2012.
3
PART II
Item 5. Market for Registrant’s Common Equity, Related Unitholder Matters and Issuer Purchases of Equity Securities.
Our Common Units trade on the NASDAQ Global Select Market under the symbol “BBEP.” As of December 31, 2012, based upon information received from our transfer agent and brokers and nominees, we had approximately 61,000 common unitholders of record.
The following table sets forth high and low sales prices per Common Unit and cash distributions to common unitholders for the periods indicated. The last reported sales price for our Common Units on February 27, 2013 was $19.60 per unit.
| Price Range | Cash Distribution | Date | ||||||||||||
| Period | High | Low | Per Common Unit | Paid | ||||||||||
| First Quarter 2011 | $ | 23.14 | $ | 19.50 | $ | 0.4175 | 5/13/2011 | |||||||
| Second Quarter 2011 | 22.69 | 19.01 | 0.4225 | 8/12/2011 | ||||||||||
| Third Quarter 2011 | 20.00 | 15.00 | 0.4350 | 11/14/2011 | ||||||||||
| Fourth Quarter 2011 | 19.17 | 15.75 | 0.4500 | 2/14/2012 | ||||||||||
| First Quarter 2012 | 20.19 | 18.65 | 0.4550 | 5/14/2012 | ||||||||||
| Second Quarter 2012 | 19.20 | 16.06 | 0.4600 | 8/14/2012 | ||||||||||
| Third Quarter 2012 | 19.85 | 16.51 | 0.4650 | 11/14/2012 | ||||||||||
| Fourth Quarter 2012 | 20.47 | 16.90 | 0.4700 | 2/14/2013 | ||||||||||
We intend to make cash distributions to unitholders on a quarterly basis, although there is no assurance as to future cash distributions since they are dependent upon future earnings, cash flows, capital requirements, financial condition and other factors. Our credit agreement restricts us from making cash distributions unless, after giving effect to such distribution, we remain in compliance with all terms and conditions of our credit facility. See Item 7 “—Management’s Discussion and Analysis of Financial Condition and Results of Operations—Liquidity and Capital Resources—Credit Facility” and Note 10 to the consolidated financial statements in this report.
For the quarters for which we declare a distribution, distributions of available cash are made within 45 days after the end of the quarter to unitholders of record on the applicable record date. Available cash, as defined in our partnership agreement, generally is all cash on hand, including cash from borrowings, at the end of the quarter after the payment of our expenses and the establishment of reserves for future capital expenditures and operational needs.
Equity Compensation Plan Information
See Part III—Item 12 “—Security Ownership of Certain Beneficial Owners and Management and Related Unitholder Matters” for information regarding securities authorized for issuance under equity compensation plans.
Unregistered Sales of Equity Securities and Use of Proceeds
The information required by this item is included in our Current Report on Form 8-K filed on November 27, 2012. See also Note 15 of the consolidated financial statements included in this report.
Purchases of Equity Securities by the Issuer and Affiliated Purchasers
There were no purchases of our Common Units by us or any affiliated purchasers during the fourth quarter of 2012.
4
Common Unit Performance Graph
The graph below compares our cumulative total unitholder return on our Common Units over the past five years, with the cumulative total returns over the same period of the Russell 2000 index and the Alerian MLP index. The graph assumes that the value of the investment in our Common Units, in the Russell 2000 index and in the Alerian MLP index was $100 on December 31, 2007. Cumulative return is computed assuming reinvestment of dividends.
Comparison of Cumulative Total Return among the Partnership, the Russell 2000 Index and the Alerian MLP Index
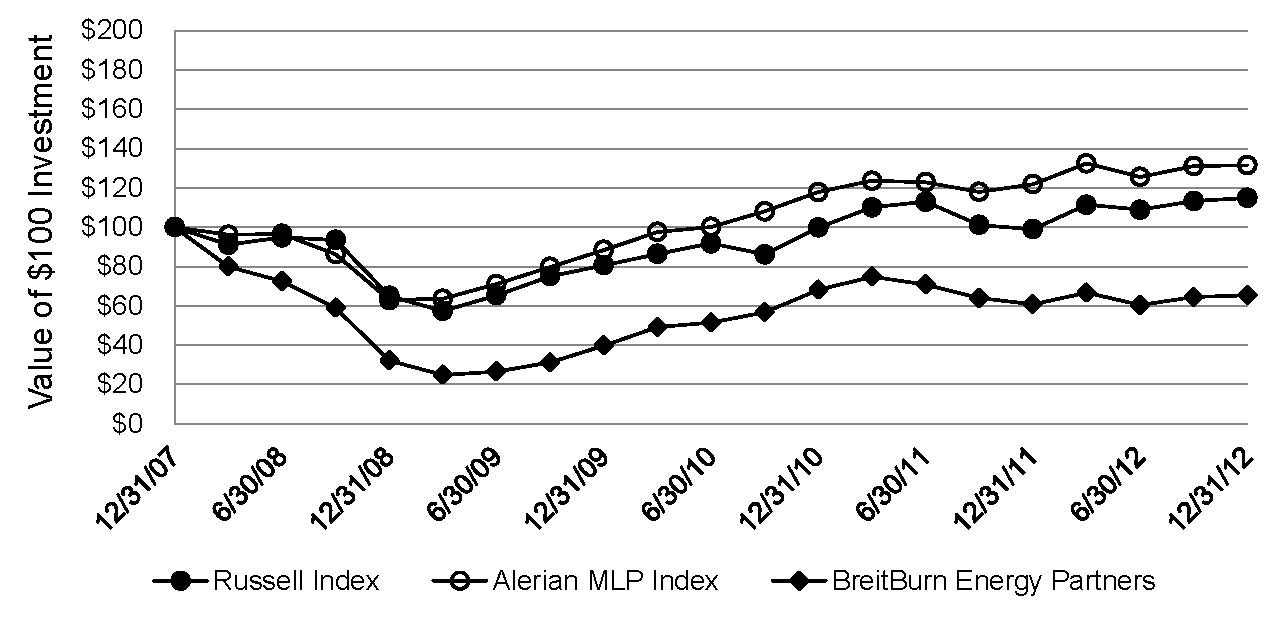
The information in this report appearing under the heading “Common Unit Performance Graph” is being furnished pursuant to Item 2.01(e) of Regulation S-K and shall not be deemed to be “soliciting material” or to be “filed” with the SEC or subject to Regulation 14A or 14C, other than as provided in Item 2.01(e) of Regulation S-K, or to the liabilities of Section 18 of the Securities Exchange Act of 1934, as amended.
5
Item 6. Selected Financial Data.
Set forth below is selected historical consolidated financial data for the past five years.
The selected consolidated financial data presented is derived from our audited financial statements. In 2008, we acquired Provident’s interest in BreitBurn Management, BreitBurn Corporation contributed its interest in BreitBurn Management to us, and BreitBurn Management contributed its interest in the General Partner to us, resulting in BreitBurn Management and the General Partner becoming our wholly owned subsidiaries. In 2009, we completed the sale of the Lazy JL field for $23 million in cash. In 2011, we completed the Greasewood Acquisition on July 28, 2011 for approximately $57 million and the Cabot Acquisition on October 6, 2011 for approximately $281 million. In 2012, we completed the NiMin Acquisition on June 28, 2012 for approximately $95 million, the Element and CrownRock acquisitions on July 2, 2012 for approximately $148 million and $70 million, respectively, the AEO Acquisition on November 30, 2012 for approximately $38 million in cash and approximately 3 million Common Units, and the CrownRock II and Lynden acquisitions on December 28, 2012 for approximately $167 million and approximately $25 million, respectively. See Note 4 to the consolidated financial statements in this report for further details about our 2011 and 2012 acquisitions. Effective April 1, 2012, our ownership interest in properties at two California fields decreased from approximately 95% to approximately 62%. See Note 16 to the consolidated financial statements in this report.
You should read the following selected financial data in conjunction with Part II—Item 7 “—Management’s Discussion and Analysis of Financial Condition and Results of Operations” and our consolidated financial statements and related notes in this report.
The selected financial data table presents a non-GAAP financial measure, “Adjusted EBITDA,” which we use in our business. This measure is not calculated or presented in accordance with generally accepted accounting principles (“GAAP”). We reconcile this measure to the most directly comparable financial measure calculated and presented in accordance with GAAP.
We believe the presentation of Adjusted EBITDA provides useful information to investors to evaluate the operations of our business excluding certain items and for the reasons set forth below. Adjusted EBITDA should not be considered an alternative to net income, operating income, cash flow from operating activities or any other measure of financial performance presented in accordance with GAAP. Our Adjusted EBITDA may not be comparable to similarly titled measures of another company because all companies may not calculate Adjusted EBITDA in the same manner.
We use Adjusted EBITDA to assess:
| • | the financial performance of our assets, without regard to financing methods, capital structure or historical cost basis; |
| • | our operating performance and return on capital as compared to those of other companies in our industry, without regard to financing or capital structure; |
| • | the viability of acquisitions and capital expenditure projects and the overall rates of return on alternative investment opportunities; and |
| • | the ability of our assets to generate cash sufficient to pay interest costs and support our indebtedness. |
6
Selected Financial Data
| Year Ended December 31, | ||||||||||||||||||||
| Thousands of dollars, except per unit amounts | 2012 | 2011 | 2010 | 2009 | 2008 | |||||||||||||||
| Statement of Operations Data: | ||||||||||||||||||||
| Oil, natural gas and natural gas liquid sales | $ | 413,867 | $ | 394,393 | $ | 317,738 | $ | 254,917 | $ | 467,381 | ||||||||||
| Gain (loss) on commodity derivative instruments, net | 5,580 | 81,667 | 35,112 | (51,437 | ) | 332,102 | ||||||||||||||
| Other revenue, net | 3,548 | 4,310 | 2,498 | 1,382 | 2,920 | |||||||||||||||
| Total revenue | 422,995 | 480,370 | 355,348 | 204,862 | 802,403 | |||||||||||||||
| Operating income (loss) | 21,700 | 153,809 | 63,743 | (82,811 | ) | 429,354 | ||||||||||||||
| Net income (loss) | (40,739 | ) | 110,698 | 34,913 | (107,257 | ) | 378,424 | |||||||||||||
| Less: Net income attributable to noncontrolling interest | (62 | ) | (201 | ) | (162 | ) | (33 | ) | (188 | ) | ||||||||||
| Net income (loss) attributable to the partnership | $ | (40,801 | ) | $ | 110,497 | $ | 34,751 | $ | (107,290 | ) | $ | 378,236 | ||||||||
| Basic net income (loss) per unit | $ | (0.56 | ) | $ | 1.80 | $ | 0.61 | $ | (2.03 | ) | $ | 6.29 | ||||||||
| Diluted net income (loss) per unit | $ | (0.56 | ) | $ | 1.79 | $ | 0.61 | $ | (2.03 | ) | $ | 6.28 | ||||||||
| Cash Flow Data: | ||||||||||||||||||||
| Net cash provided by operating activities | $ | 191,782 | $ | 128,543 | $ | 182,022 | $ | 224,358 | $ | 226,696 | ||||||||||
| Net cash used in investing activities | (697,159 | ) | (414,573 | ) | (68,286 | ) | (6,229 | ) | (141,039 | ) | ||||||||||
| Net cash provided by (used in) financing activities | 504,556 | 287,728 | (115,872 | ) | (214,909 | ) | (89,040 | ) | ||||||||||||
| Balance Sheet Data (at period end): | ||||||||||||||||||||
| Cash | $ | 4,507 | $ | 5,328 | $ | 3,630 | $ | 5,766 | $ | 2,546 | ||||||||||
| Other current assets | 109,158 | 167,492 | 121,674 | 136,675 | 138,020 | |||||||||||||||
| Net property, plant and equipment | 2,711,893 | 2,072,759 | 1,722,295 | 1,741,089 | 1,840,341 | |||||||||||||||
| Other assets | 89,936 | 85,270 | 82,568 | 87,499 | 235,927 | |||||||||||||||
| Total assets | $ | 2,915,494 | $ | 2,330,849 | $ | 1,930,167 | $ | 1,971,029 | $ | 2,216,834 | ||||||||||
| Current liabilities | 115,240 | 89,889 | 101,317 | 91,890 | 79,990 | |||||||||||||||
| Long-term debt | 1,100,696 | 820,613 | 528,116 | 559,000 | 736,000 | |||||||||||||||
| Other long-term liabilities | 110,022 | 93,133 | 91,477 | 91,338 | 47,413 | |||||||||||||||
| Partners' equity | 1,589,536 | 1,326,764 | 1,208,803 | 1,228,373 | 1,352,892 | |||||||||||||||
| Noncontrolling interest | — | 450 | 454 | 428 | 539 | |||||||||||||||
| Total liabilities and partners' equity | $ | 2,915,494 | $ | 2,330,849 | $ | 1,930,167 | $ | 1,971,029 | $ | 2,216,834 | ||||||||||
| Cash dividends declared per unit outstanding: | $ | 1.8300 | $ | 1.6875 | $ | 1.1475 | $ | 0.5200 | $ | 1.9925 | ||||||||||
7
The following table presents a reconciliation of Adjusted EBITDA to net income (loss) attributable to the partnership, our most directly comparable GAAP financial performance measure, for each of the periods indicated.
| Year Ended December 31, | ||||||||||||||||||||
| Thousands of dollars | 2012 | 2011 | 2010 | 2009 | 2008 | |||||||||||||||
| Reconciliation of consolidated net income (loss) to Adjusted EBITDA: | ||||||||||||||||||||
| Net income (loss) attributable to the partnership | $ | (40,801 | ) | $ | 110,497 | $ | 34,751 | $ | (107,290 | ) | $ | 378,236 | ||||||||
| Gain (loss) on commodity derivative instruments (a) | (5,580 | ) | (81,667 | ) | (35,112 | ) | 51,437 | (332,102 | ) | |||||||||||
| Commodity derivative instrument settlements (b)(c)(d) | 87,605 | (16,067 | ) | 74,825 | 167,683 | (55,946 | ) | |||||||||||||
| Depletion, depreciation and amortization (e) | 149,565 | 107,503 | 102,758 | 106,843 | 179,933 | |||||||||||||||
| Write-down of crude oil inventory | — | — | — | — | 1,172 | |||||||||||||||
| Interest expense and other financing costs | 61,206 | 39,165 | 24,552 | 18,827 | 29,147 | |||||||||||||||
| Loss on interest rate swaps (f) | 1,101 | 2,777 | 4,490 | 7,246 | 20,035 | |||||||||||||||
| Settlement payments (receipts) on terminated derivatives | — | 36,779 | — | (70,587 | ) | — | ||||||||||||||
| (Gain) loss on sale of assets | 486 | (111 | ) | 14 | 5,965 | — | ||||||||||||||
| Income tax expense (benefit) | 84 | 1,188 | (204 | ) | (1,528 | ) | 1,939 | |||||||||||||
| Amortization of intangibles | — | — | 495 | 2,771 | 3,131 | |||||||||||||||
| Non-cash unit based compensation | 22,184 | 22,002 | 20,331 | 13,619 | 7,481 | |||||||||||||||
| Adjusted EBITDA | $ | 275,850 | $ | 222,066 | $ | 226,900 | $ | 194,986 | $ | 233,026 | ||||||||||
| (a) The Partnership enters into certain derivative instrument contracts such as put options that require the payment of premiums at contract inception. Gain (loss) on commodity derivative instruments includes the reduction of premium value for derivative instruments over time. The Partnership’s calculation of adjusted EBITDA does not include premiums paid for derivative instruments at contract inception as these payments pertain to future contract settlement periods. | ||||||||||||||||||||
| (b) Includes net cash settlements on derivative instruments: | ||||||||||||||||||||
| - Crude oil settlements received (paid) of: | $ | 3,855 | $ | (70,398 | ) | $ | 11,252 | $ | 66,176 | $ | (35,146 | ) | ||||||||
| - Natural gas settlements received (paid) of: | $ | 83,750 | $ | 54,331 | $ | 63,573 | $ | 101,507 | $ | (20,800 | ) | |||||||||
| (c) Includes premiums deferred and paid at the time of derivative contract settlements each period of: | $ | — | $ | — | $ | 1,820 | $ | 1,116 | $ | 154 | ||||||||||
| (d) Excludes premiums paid at contract inception related to those derivative contracts that settled during the periods of: | $ | 859 | $ | — | $ | — | $ | — | $ | — | ||||||||||
| (e) Includes impairments and price-related depletion, depreciation and amortization expense adjustments of: | $ | 12,313 | $ | 648 | $ | 6,286 | $ | — | $ | 86,385 | ||||||||||
| (f) Includes settlements paid on interest rate derivatives of: | $ | 5,469 | $ | 3,257 | $ | 11,087 | $ | 13,115 | $ | 2,721 | ||||||||||
8
Item 7. Management’s Discussion and Analysis of Financial Condition and Results of Operations.
The following discussion and analysis should be read in conjunction with the “Selected Financial Data” and the financial statements and related notes included elsewhere in this report. The following discussion contains forward-looking statements that reflect our future plans, estimates, beliefs and expected performance. The forward-looking statements are dependent upon events, risks and uncertainties that may be outside our control. Our actual results could differ materially from those discussed in these forward-looking statements. Factors that could cause or contribute to such differences are discussed in “Risk Factors” contained in Part I—Item 1A of this report. In light of these risks, uncertainties and assumptions, the forward-looking events discussed may not occur. See “Cautionary Statement Regarding Forward-Looking Information” in the front of this report.
Executive Overview
We are an independent oil and gas partnership focused on the acquisition, exploitation and development of oil and gas properties in the United States. Our objective is to manage our oil and gas producing properties for the purpose of generating cash flow and making distributions to our unitholders. Our assets consist primarily of producing and non-producing crude oil and natural gas reserves located primarily in the Antrim Shale and other non-Antrim formations in Michigan, the Evanston Green River, Wind River, Big Horn and Powder River Basins in Wyoming, the Los Angeles and San Joaquin Basins in California, the Permian Basin in Texas, the Sunniland Trend in Florida and the New Albany Shale in Indiana and Kentucky.
Our core investment strategy includes the following principles:
| • | acquire long-lived assets with low-risk exploitation and development opportunities; |
| • | use our technical expertise and state-of-the-art technologies to identify and implement successful exploitation techniques to optimize reserve recovery; |
| • | reduce cash flow volatility through commodity price and interest rate derivatives; and |
| • | maximize asset value and cash flow stability through operating and technical expertise. |
2012 Acquisitions
In June 2012, we completed the NiMin Acquisition, to acquire oil properties located in Park County in the Big Horn Basin of Wyoming for approximately $95 million in cash. The properties are 100% oil.
In July 2012, we completed the acquisitions of oil and natural gas properties in the Permian Basin in Texas from Element and CrownRock for approximately $148 million and $70 million in cash, respectively. In December 2012, we completed the acquisitions of additional oil and natural gas properties in the Permian Basin in Texas from CrownRock, Lynden and Piedra for approximately $167 million, $25 million and $10 million, respectively. The Permian Basin properties were approximately 79% oil as of December 31, 2012.
In November 2012, we completed the AEO Acquisition to acquire principally oil properties located in the Belridge Field in Kern County, California for approximately $38 million in cash and approximately 3 million Common Units valued at $56 million. The properties were approximately 85% oil as of December 31, 2012
During 2012, we completed other smaller acquisitions of oil and natural gas properties located in California and Michigan. In the aggregate, we paid approximately $9.6 million in total consideration for these properties.
We used borrowings under our credit facility to fund the cash portion of our 2012 acquisitions.
9
2012 Highlights
In 2012, we paid cash distributions to unitholders totaling $127.7 million. On February 14, 2013, we paid a cash distribution to unitholders of $39.8 million for the fourth quarter of 2012. We increased our quarterly cash distributions from $0.4500 per Common Unit for the fourth quarter of 2011 to $0.4700 per Common Unit for the fourth quarter of 2012.
In 2012, our oil and natural gas capital expenditures, including capitalized engineering costs and excluding acquisitions, totaled approximately $153 million, compared with approximately $75 million in 2011. We spent approximately $47 million in California, $46 million in Florida, $32 million in Wyoming, $16 million in Texas and $12 million in Michigan, Indiana and Kentucky. We drilled and completed 11 new wells, 27 recompletions and six workovers in Michigan and Indiana. We drilled and completed 20 new wells, 20 workovers and six recompletions in Wyoming. We drilled and completed 20 new wells, 14 workovers and one recompletion in California, 18 new wells in Texas and four new wells in Florida. Primarily as a result of our 2012 acquisitions and our capital spending, our 2012 production was 8,318 MMBoe, which was 18% higher than our 2011 production.
In January 2012, we and BreitBurn Finance Corporation, and certain of our subsidiaries as guarantors, issued $250 million in aggregate principal amount of 7.875% Senior Notes due 2022 (the “Initial Notes”) at a price of 99.154%. We received net proceeds of approximately $242.3 million and used the proceeds to reduce borrowings under our credit facility.
In February 2012, we sold 9.2 million Common Units at a price to the public of $18.80, resulting in proceeds net of underwriting discounts and estimated offering expenses of $166.0 million, which we used to reduce borrowings under our credit facility.
In May 2012, we entered into the Fifth Amendment to our $1.5 billion bank credit facility (the “Second Amended and Restated Credit Agreement”), which increased the permitted amount of senior unsecured notes we may issue from $700 million to $1 billion.
In September 2012, we sold 11.5 million of our Common Units at a price to the public of $18.51 per Common Unit, resulting in proceeds net of underwriting discount and offering expenses of $204.1 million, which we used to reduce borrowings under our credit facility.
In September 2012, we issued an additional $200 million aggregate principal amount of our 7.875% Senior Notes due 2022 (the “Additional Notes”) (the Additional Notes and the Initial Notes collectively referred to as the “2022 Senior Notes”). The Additional Notes were issued at a premium of 103.500%, or $207.0 million. We used the net proceeds from the Additional Notes offering of approximately $202.8 million, after financing fees and expenses, to reduce borrowings under our credit facility.
In October 2012, we entered into the Sixth Amendment to the Second Amended and Restated Credit Agreement (the “Sixth Amendment”), which increased our borrowing base to $1 billion and increased our total commitments from existing lenders to $900 million. The Sixth Amendment also provided us with the ability to increase our total commitments up to the $1 billion borrowing base upon lender approval.
In December 2012, we filed a registration statement for the offer to exchange the 2022 Senior Notes for substantially identical notes that are registered under the Securities Act of 1933, as amended. On December 27, 2012, the exchange registration statement became effective, and we commenced the exchange offer, which was completed on February 7, 2013.
Outlook
In 2013, our crude oil and natural gas capital spending program, including capitalized engineering costs and excluding acquisitions, is expected to be approximately $261 million, compared with approximately $153 million in 2012. In 2013, we anticipate spending approximately 84% principally on oil projects in California, Florida and Texas and approximately 16% principally on oil projects in Michigan, Wyoming, Indiana and Kentucky. We anticipate 89% of
10
our total capital spending will be focused on drilling and rate-generating projects that are designed to increase or add to production or reserves. Without considering potential acquisitions, we expect our 2013 production to be approximately 9.8 MMBoe.
Commodity hedging remains an important part of our strategy to reduce cash flow volatility. We use swaps, collars and options for managing risk relating to commodity prices. As of February 27, 2013, we had hedged approximately 77% of our expected 2013 production. For 2013, we had 11,038 Bbl/d of oil and 58,100 MMBtu/d of natural gas hedged at average prices of approximately $92.93 and $5.87, respectively. For 2014, we had 11,114 Bbl/d of oil and 52,100 MMBtu/d of natural gas hedged at average prices of approximately $95.17 and $4.99, respectively. For 2015, we had 9,489 Bbl/d of oil and 52,200 MMBtu/d of natural gas hedged at average prices of approximately $95.61 and $5.00, respectively. For 2016, we had 5,911 Bbl/d of oil and 25,200 MMBtu/d of natural gas hedged at average prices of approximately $93.15 and $4.30, respectively. For 2017, we had 1,769 Bbl/d of oil and 5,571 MMBtu/d hedged at average prices of approximately $88.20 and $4.51, respectively.
Consistent with our long-term business strategy, we intend to continue to actively pursue oil and natural gas acquisition opportunities in 2013.
Operational Focus
We use a variety of financial and operational measures to assess our performance. Among these measures are the following: volumes of oil and natural gas produced, reserve replacement, realized prices, operating expenses and general and administrative expenses (”G&A”).
As of December 31, 2012, our total estimated proved reserves were 149.4 MMBoe, of which approximately 53% was crude oil and 47% was natural gas. As of December 31, 2011, our total estimated proved reserves were 151.1 MMBoe, of which approximately 35% was crude oil and 65% was natural gas.
Our total estimated reserve additions in 2012 from acquisitions of 33.7 MMBoe were offset by reserve revisions of 27.1 MMBoe and 8.3 MMBoe of production, resulting in a net decrease of 1.7 MMBoe from 2011. The decrease in 2012 was primarily the result of a 30.9MMBoe (185.6 Bcf) decrease in natural gas reserves driven primarily by a decrease in natural gas prices. Price-related reserve revisions were partially offset by drilling, recompletions, workovers, addition of new drilling locations and revised estimates of existing reserves. The unweighted average first-day-of-the-month crude oil and natural gas prices used to determine our total estimated proved reserves as of December 31, 2012 were $94.71 per Bbl of oil and $2.76 per MMBtu of natural gas, compared to $95.97 per Bbl of oil and $4.12 per MMBtu of gas in 2011. The unweighted average first-day-of-the-month crude oil and natural gas prices used to determine our total estimated proved reserves as of December 31, 2010 were $79.40 per Bbl of oil $4.38 per MMBtu of gas.
Of our total estimated proved reserves as of December 31, 2012, 35% were located in Michigan, 26% in Wyoming, 17% in California, 15% in Texas and 7% in Florida, with less than 1% in Indiana and Kentucky. On a net production basis, we operated approximately 84% of our production in 2012.
Our revenues and net income are sensitive to oil and natural gas prices. Our operating expenses are highly correlated to oil prices, and as oil prices rise and fall, our operating expenses will directionally rise and fall. Significant factors that will impact near-term commodity prices include global demand for oil and natural gas, political developments in oil producing countries, including, without limitation, the extent to which members of the OPEC and other oil exporting nations are able to manage oil supply through export quotas and variations in key North American natural gas and refined products supply and demand indicators.
In 2012, the NYMEX WTI spot price averaged approximately $94 per Bbl, compared with approximately $95 per Bbl a year earlier. In 2012, crude oil prices ranged from a monthly average low of $82 per Bbl in June to a monthly average high of $106 per Bbl in March. In 2011, prices ranged from a monthly average low of $86 per Bbl in September to a monthly average high of $110 per Bbl in April. In 2013 to date, the NYMEX WTI spot price averaged $95 per Bbl.
Prices for natural gas have historically fluctuated widely and in many markets are aligned both with supply and demand conditions in their respective regional markets and with the overall U.S. market. Natural gas prices are also
11
typically higher during the winter period when demand for heating is greatest in the U.S. Since January 2010, monthly average natural gas spot prices at Henry Hub ranged from a low of $1.95 per MMBtu in April 2012 to a high of $5.83 per MMBtu in January 2010. During 2012, the natural gas spot price at Henry Hub ranged from a low of $1.82 per MMBtu to a high of $3.77 per MMBtu, with the monthly average ranging from a low of $1.95 per MMBtu in April to a high of $3.54 per MMBtu in November, and averaged approximately $2.75 per MMBtu for the year. During 2011, the natural gas spot price at Henry Hub ranged from a low of $2.84 per MMBtu to a high of $4.92 per MMBtu, and averaged approximately $4.00 per MMBtu. In 2013 to date, the natural gas spot price at Henry Hub averaged approximately $3.32 per MMBtu.
Excluding the effect of derivatives, our average realized oil and NGL price for 2012 decreased $0.15 per Boe to $89.77 per Boe as compared to $89.92 per Boe in 2011. Excluding the effect of derivatives, our realized natural gas price for 2012 decreased $1.18 per Mcf to $3.00 per Mcf as compared to $4.18 per Mcf in 2011.
While our commodity price risk management program is intended to reduce our exposure to commodity prices and assist with stabilizing cash flow and distributions, to the extent we have hedged a significant portion of our expected production and the cost for goods and services increases, our margins would be adversely affected.
In evaluating our production operations, we frequently monitor and assess our operating and general and administrative expenses per Boe produced. These measures allow us to better evaluate our operating efficiency and are used in reviewing the economic feasibility of a potential acquisition or development project.
Operating expenses are the costs incurred in the operation of producing properties. Expenses for utilities, direct labor, water injection and disposal, production taxes and materials and supplies comprise the most significant portion of our operating expenses. A majority of our operating cost components are variable and increase or decrease along with our levels of production. For example, we incur power costs in connection with various production related activities such as pumping to recover oil and gas, separation and treatment of water produced in connection with our oil and gas production, and re-injection of water produced into the oil producing formation to maintain reservoir pressure. Although these costs typically vary with production volumes, they are driven not only by volumes of oil and gas produced but also volumes of water produced. Consequently, fields that have a high percentage of water production relative to oil and gas production, also known as a high water cut, will experience higher levels of power costs for each Boe produced. Certain items, however, such as direct labor and materials and supplies, generally remain relatively fixed across broad production volume ranges but can fluctuate depending on activities performed during a specific period. For instance, repairs to our pumping equipment or surface facilities result in increased expenses in periods during which they are performed. Our operating expenses are highly correlated to oil prices, and we experience upward or downward pressure on material and service costs depending on how oil prices change. These costs include specific expenditures such as lease fuel, electricity, drilling services and severance and property taxes. Lease operating expenses, including processing fees, were $19.15 per Boe in 2012 and $19.39 per Boe in 2011. The decrease in per Boe lease operating expenses was primarily due to lower operating costs from our acquisitions in Wyoming and Texas.
Production taxes vary by state. All states in which we operate impose ad valorem taxes on our oil and gas properties. Various states regulate the drilling for, and the production, gathering and sale of, oil and natural gas, including imposing severance taxes and requirements for obtaining drilling permits. Currently, Wyoming, Michigan, Indiana, Kentucky and Florida impose severance taxes on oil and gas producers at rates ranging from 1% to 9% of the value of the gross product extracted. Wyoming wells that reside on Indian or federal land are subject to an additional tax of 8.5%. California does not currently impose a severance tax; rather it imposes an ad valorem tax based in large part on the value of the mineral interests in place. See Part I—Item 1A “—Risk Factors” — “Risks Related to Our Business — We are subject to complex federal, state, local and other laws and regulations that could adversely affect the cost, manner or feasibility of conducting our operations” in this report.
G&A, excluding unit based compensation, was $4.00 per Boe in 2012 and $4.45 per Boe in 2011. The decrease in per Boe G&A, excluding unit based compensation, was primarily due to additional production from our 2012 acquisitions.
12
BreitBurn Management
BreitBurn Management operates our assets and performs other administrative services for us such as accounting, corporate development, finance, land administration, legal and engineering. All of our employees, including our executives, are employees of BreitBurn Management. BreitBurn Management also operates the assets of PCEC, our Predecessor. In addition to a monthly fee for indirect expenses, BreitBurn Management charges PCEC for all direct expenses including incentive plan costs and direct payroll and administrative costs related to PCEC’s properties and operations.
On January 6, 2012, Pacific Coast Oil Trust (the “Trust”), which was formed by PCEC, filed a registration statement on Form S-1 with the SEC in connection with an initial public offering by the Trust. On May 8, 2012, the Trust completed its initial public offering (the “Trust IPO”). We have no direct or indirect ownership interest in PCEC or the Trust. As part of the Trust IPO, PCEC conveyed net profits interests in its oil and natural gas production from certain of its properties to the Trust in exchange for Trust units. PCEC’s assets consist primarily of producing and non-producing crude oil reserves located in Santa Barbara, Los Angeles and Orange Counties in California, including certain interests in the East Coyote and Sawtelle Fields. Prior to the Trust IPO, PCEC operated the East Coyote and Sawtelle Fields for the benefit of itself and us, who owned the non-operated interests in the East Coyote and Sawtelle Fields. PCEC owned an average working interest of approximately 5% in the two fields and held a reversionary interest in both fields.
Effective April 1, 2012 and pursuant to an agreement with us, PCEC’s ownership interest in these properties was increased. As a result of that agreement, our average working interest in the properties decreased from approximately 95% to approximately 62%.
On May 8, 2012, BreitBurn Management entered into the Third Amended and Restated Administrative Services Agreement with PCEC, pursuant to which the parties agreed to increase the monthly fee charged by BreitBurn Management to PCEC for indirect costs.
Prior to the Trust IPO, the 2012 monthly fee charged by BreitBurn Management to PCEC for indirect costs was set at $571,000, and the two parties agreed to increase that monthly fee to $700,000. The new monthly fee will be in effect from April 1, 2012 through August 31, 2014 and will be redetermined biannually thereafter. In connection with the Trust IPO, we also amended the Omnibus Agreement with PCEC to remove our right of first offer with respect to the sale of assets by PCEC.
For information on potential conflicts between us and PCEC, see Part I—Item 1A “—Risk Factors”— “Risks Related to Our Structure — Certain of the directors and officers of our General Partner, including our Chief Executive Officer, our President and other members of our senior management, own interests in PCEC, which is managed by our subsidiary, BreitBurn Management. Conflicts of interest may arise between PCEC, on the one hand, and us and our unitholders, on the other hand. Our partnership agreement limits the remedies available to you in the event you have a claim relating to conflicts of interest.”
See Note 6 to the consolidated financial statements in this report for more information regarding our relationship with BreitBurn Management and PCEC.
13
Results of Operations
The table below summarizes certain of the results of operations and period-to-period comparisons attributable to our operations for the periods indicated. These results are presented for illustrative purposes only and are not indicative of our future results. The data reflect our results as they are presented in our consolidated financial statements.
| Year Ended December 31, | Increase / decrease % | |||||||||||||||||
| Thousands of dollars, except as indicated | 2012 | 2011 | 2010 | 2012-2011 | 2011-2010 | |||||||||||||
| Total production (MBoe) (a) | 8,318 | 7,037 | 6,699 | 18 | % | 5 | % | |||||||||||
| Oil and NGL (MBoe) | 3,652 | 3,255 | 3,157 | 12 | % | 3 | % | |||||||||||
| Natural gas (MMcf) | 27,997 | 22,697 | 21,251 | 23 | % | 7 | % | |||||||||||
| Average daily production (Boe/d) | 22,726 | 19,281 | 18,354 | 18 | % | 5 | % | |||||||||||
| Sales volumes (MBoe) | 8,334 | 7,106 | 6,663 | 17 | % | 7 | % | |||||||||||
| Average realized sales price (per Boe) (b) (c) | $ | 49.57 | $ | 55.41 | $ | 47.71 | (11 | )% | 16 | % | ||||||||
| Oil and NGL (per Boe) (c) | 89.77 | 89.92 | 70.71 | — | 27 | % | ||||||||||||
| Natural gas (per Mcf) | 3.00 | 4.18 | 4.57 | (28 | )% | (9 | )% | |||||||||||
| Oil, natural gas and NGL sales (d) | $ | 413,867 | $ | 394,393 | $ | 317,738 | 5 | % | 24 | % | ||||||||
| Gain on commodity derivative instruments (e) | 5,580 | 81,667 | 35,112 | (93 | )% | 133 | % | |||||||||||
| Other revenues, net | 3,548 | 4,310 | 2,498 | (18 | )% | 73 | % | |||||||||||
| Total revenues | 422,995 | 480,370 | 355,348 | (12 | )% | 35 | % | |||||||||||
| Lease operating expenses including processing fees | 159,289 | 136,441 | 122,512 | 17 | % | 11 | % | |||||||||||
| Production and property taxes (f) | 33,634 | 26,599 | 20,510 | 26 | % | 30 | % | |||||||||||
| Total lease operating expenses | 192,923 | 157,787 | 138,964 | 22 | % | 14 | % | |||||||||||
| Purchases and other operating costs | 1,577 | 961 | 328 | 64 | % | 193 | % | |||||||||||
| Change in inventory | 1,279 | 1,968 | (825 | ) | (35 | )% | n/a | |||||||||||
| Total operating costs | $ | 195,779 | $ | 165,969 | $ | 142,525 | 18 | % | 16 | % | ||||||||
| Lease operating expenses pre-taxes per Boe (g) | 19.15 | 19.39 | 18.29 | (1 | )% | 6 | % | |||||||||||
| Production and property taxes per Boe | 4.04 | 3.78 | 3.06 | 7 | % | 23 | % | |||||||||||
| Total lease operating expenses per Boe | 23.19 | 23.17 | 21.35 | — | % | 9 | % | |||||||||||
| Depletion, depreciation and amortization | $ | 149,565 | $ | 107,503 | $ | 102,758 | 39 | % | 5 | % | ||||||||
| (a) Natural gas is converted on the basis of six Mcf of gas per one Bbl of oil equivalent. This ratio reflects an energy content equivalency and not a price or revenue equivalency. Given commodity price disparities, the price for a Bbl of oil equivalent for natural gas is significantly less than the price for a Bbl of oil. | ||||||||||||||||||
| (b) Excludes the effect of commodity derivative settlements. | ||||||||||||||||||
| (c) Includes the per Boe price effect of crude oil purchases. For 2010, amount excludes the per Boe price effect of amortization of an intangible asset related to crude oil sales contracts. | ||||||||||||||||||
| (d) 2010 amount includes $495 of amortization of an intangible asset related to crude oil sales contracts. | ||||||||||||||||||
| (e) Includes the effects of the early termination of commodity derivative contracts terminated in 2011 for a cost of $36,779. | ||||||||||||||||||
| (f) Includes ad valorem and severance taxes. | ||||||||||||||||||
| (g) Includes lease operating expenses, district expenses, transportation expenses and processing fees. | ||||||||||||||||||
14
Comparison of Results of Operations for the Years Ended December 31, 2012, 2011 and 2010
The variances in our results of operations were due to the following components:
Production
For the year ended December 31, 2012 compared to the year ended December 31, 2011, production volumes increased by 1,281 MBoe, or 18%, primarily due to a 1,112 MBoe increase from a full year of production from our southwest Wyoming properties acquired in October 2011, a 155 MBoe increase from a full year of production from our eastern Wyoming properties acquired in July 2011, 315 MBoe from our Permian Basin properties acquired in July and December 2012, 92 MBbl of oil from our central Wyoming properties acquired in June 2012, 28 MBoe from our properties in the San Joaquin Basin in California acquired in November 2012 and 42 MBbl higher Florida production from new wells partially offset by 411 MBoe lower Michigan production due to lower natural gas prices and natural field declines. The remaining decrease was primarily due to natural field declines at our legacy Wyoming properties, and a reduction in our ownership interest in two California fields, partially offset by higher production from a field in California due to additional drilling. In 2012, natural gas, crude oil and natural gas liquids accounted for 56%, 42% and 2% of our production, respectively.
For the year ended December 31, 2011 compared to the year ended December 31, 2010, production volumes increased by 338 MBoe, or 5%, primarily due to 368 MBoe from our southwestern Wyoming properties acquired in October 2011, 88 MBoe from our eastern Wyoming properties acquired in July 2011 and 41 MBoe higher Florida production from new wells partially offset by 129 MBoe lower Michigan natural gas production due to natural field declines. In 2011, natural gas, crude oil and natural gas liquids accounted for 54%, 44% and 2% of our production, respectively.
Oil, natural gas and NGL sales
Total oil, natural gas liquids (“NGL”) and natural gas sales revenues increased $19.5 million for the year ended December 31, 2012 compared to the year ended December 31, 2011. Crude oil and NGL revenues increased $30.6 million due to higher sales volumes, primarily due to oil production from our 2012 acquisitions in Texas, California and Wyoming. Natural gas revenues decreased $11.1 million primarily due to lower natural gas prices partially offset by higher natural gas production primarily from our 2012 acquisitions in Texas. Realized prices for crude oil and NGLs, excluding the effect of derivative instruments, decreased $0.15 per Boe, or less than 1%, for the year ended December 31, 2012 compared to the year ended December 31, 2011. Realized prices for natural gas, excluding the effect of derivative instruments, decreased $1.18 per Mcf, or approximately 28%, for the year ended December 31, 2012 compared to the year ended December 31, 2011.
Total oil, NGLs and natural gas sales revenues increased $76.7 million for the year ended December 31, 2011 compared to the year ended December 31, 2010. Crude oil and NGL revenues increased $78.9 million due to higher crude oil prices and sales volumes, primarily due to oil production from our 2011 acquisitions in Wyoming. Natural gas revenues decreased $2.2 million primarily due to lower natural gas prices partially offset by higher natural gas production. Realized prices for crude oil and NGLs, excluding the effect of derivative instruments, increased $19.21 per Boe, or 27%, for the year ended December 31, 2011 compared to the year ended December 31, 2010. Realized prices for natural gas, excluding the effect of derivative instruments, decreased $0.39 per Mcf, or 9%, for the year ended December 31, 2011 compared to the year ended December 31, 2010.
Gain on commodity derivative instruments
Gain on commodity derivative instruments for the year ended December 31, 2012 was $5.6 million compared to a gain of $81.7 million for the year ended December 31, 2011. Commodity derivative instrument settlements received for the year ended December 31, 2012 were $87.6 million compared to derivative settlements paid of $16.1 million for the year ended December 31, 2011, which included $36.8 million paid to terminate commodity hedge contracts in the fourth quarter of 2011.
15
Gain on commodity derivatives instruments for the year ended December 31, 2011 was $81.7 million compared to a gain of $35.1 million the year ended December 31, 2010. Commodity derivative instrument settlements paid for the year ended December 31, 2011 were $16.1 million, which included $36.8 million paid to terminate hedge contracts in the fourth quarter of 2011. Commodity derivative instrument settlements received for the year ended December 31, 2010 were $74.8 million.
Lease operating expenses
Pre-tax lease operating expenses, including processing fees, for the year ended December 31, 2012 totaled $159.3 million, $22.8 million higher than 2011. The increase in pre-tax lease operating expenses reflects our newly acquired Wyoming and Texas properties, higher California well service costs, higher Florida fuel and utilities costs and higher transportation expenses. The increase in California well services was partially offset by lower lease operating expenses at the East Coyote and Sawtelle fields as a result of the reduction in our working interests from 95% to 62% attributable to a payout reversion that was effective April 1, 2012. On a per Boe basis, lease operating expenses were 1% lower than 2011.
Production and property taxes for the year ended December 31, 2012 totaled $33.6 million, or $4.04 per Boe, which was 7% higher per Boe than the year ended December 31, 2011. The per Boe increase in production and property taxes compared to 2011 was primarily due to higher per Boe production and property taxes on our newly acquired Permian Basin assets and an increase in per Boe Florida taxes.
Pre-tax lease operating expenses, including processing fees, for the year ended December 31, 2011 totaled $136.4 million or $19.39 per Boe, which was 6% higher per Boe than 2010. The increase was primarily attributable to an increase in crude oil prices, higher Florida production costs related to new wells and higher transportation expenses, well services, compression repairs and maintenance.
Production and property taxes for the year ended December 31, 2011 totaled $26.6 million, or $3.78 per Boe, which was 23% higher per Boe than the year ended December 31, 2010. The per Boe increase in production and property taxes compared to 2010 was primarily due to higher commodity prices in 2011.
Change in inventory
In Florida, our crude oil sales are a function of the number and size of crude oil shipments in each year and thus crude oil sales do not always coincide with volumes produced in a given year. Sales occur on average every six to eight weeks. We match production expenses with crude oil sales. Production expenses associated with unsold crude oil inventory are credited to operating costs through the change in inventory account. Production expenses are charged to operating costs through the change in inventory account when they are sold. In 2012 and 2011, the change in inventory account amounted to a charge of $1.3 million and $2.0 million, respectively, reflecting the higher amount of barrels sold than produced during the periods, compared to a credit of $0.8 million in 2010, reflecting the higher amount of barrels produced than sold during the period.
Depletion, depreciation and amortization
Depletion, depreciation and amortization (“DD&A”) expense totaled $149.6 million, or $17.98 per Boe, for the year ended December 31, 2012, compared to DD&A of $15.28 per Boe for the year ended December 31, 2011. Included in DD&A for the year ended December 31, 2012 are $12.3 million in impairments primarily related to uneconomic proved properties in Michigan, Indiana and Kentucky due to a decrease in expected future natural gas prices. Included in DD&A for the year ended December 31, 2011 are $0.6 million in impairments related to uneconomic proved properties in Michigan. Excluding the impact of impairments, DD&A per Boe for 2012 and 2011 was $16.50 and $15.18, respectively. The increase in DD&A excluding impairments was primarily due to higher DD&A rates on our newly acquired properties.
DD&A expense totaled $107.5 million, or $15.28 per Boe, for the year ended December 31, 2011, which was in line with DD&A of $15.34 per Boe for the year ended December 31, 2010. Included in DD&A for the year ended December 31, 2011 are $0.6 million in impairments related to uneconomic proved properties in Michigan. Included in DD&A for
16
the year ended December 31, 2010 are $6.3 million in impairments related to our Eastern region properties, including a $4.2 million write-down of uneconomic proved properties and a $2.1 million write-down of expired unproved lease properties. Excluding the impact of impairments, DD&A per Boe for 2011 and 2010 was $15.18 and $14.40, respectively. The increase in DD&A per Boe excluding impairments was primarily due to higher DD&A rates reflecting lower natural gas reserves as a result of a decrease in natural gas prices, and investment additions related to new wells in Florida.
General and administrative expenses
Our G&A expenses totaled $55.5 million and $53.3 million in 2012 and 2011, respectively. This included $22.2 million and $22.0 million, respectively, in unit-based compensation expense related to employee incentive plans. For 2012, G&A expenses, excluding unit-based compensation, were $33.3 million, which was $2.0 million higher than 2011. The increase was primarily due to additional activity related to our 2012 acquisitions. On a per Boe basis, G&A expenses, excluding unit-based compensation, were $4.00, a 10% decrease from the prior year.
Our G&A expenses totaled $53.3 million and $44.9 million in 2011 and 2010, respectively, including $22.0 million and $20.4 million, respectively, in unit-based compensation expense related to employee incentive plans. The increase in non-cash unit-based compensation expense was primarily due to new equity awards granted in the first quarter of 2011. For 2011, G&A expenses, excluding unit-based compensation, were $31.3 million, which was $6.8 million higher than 2010. The increase was primarily due to acquisition and integration costs related to our 2011 acquisitions, higher employee related costs and higher short-term incentive compensation expense.
Interest expense, net of amounts capitalized
Our interest expense totaled $61.2 million for the year ended December 31, 2012, net of less than $0.1 million of capitalized interest, an increase of $22.0 million from 2011. This increase in interest expense was primarily attributable to an additional $23.0 million associated with our 2022 Senior Notes and slightly higher amortization of debt issuance costs, partially offset by $1.2 million lower interest expense on our credit facility due to a lower credit facility debt balance.
Our interest expense totaled $39.2 million for the year ended December 31, 2011 net of $0.1 million of capitalized interest, an increase of $14.6 million from 2010. This increase in interest expense was primarily attributable to an additional $19.9 million in interest expense associated with our 2020 Senior Notes, partially offset by $4.8 million lower interest expense on our credit facility due to a lower credit facility debt balance and $0.7 million lower amortization of debt issuance costs.
Loss on interest rate swaps
We are subject to interest rate risk associated with loans under our credit facility that bear interest based on floating rates. See Part II-Item 7A “-Quantitative and Qualitative Disclosures About Market Risk” in this report for a discussion of our interest rate risk. Loss on interest swaps for the year ended December 31, 2012 was $1.1 million compared to a loss of $2.8 million for the year ended December 31, 2011. The higher loss in 2011 compared to 2012 reflects higher average interest rates on our swap contracts in 2011 compared to 2012.
Loss on interest swaps for the year ended December 31, 2011 was $2.8 million compared to a loss of $4.5 million for the year ended December 31, 2010. The higher loss in 2010 primarily reflects higher average interest rates on our swap contracts in 2010 compared to 2011.
Liquidity and Capital Resources
Our primary sources of liquidity are cash generated from operations, amounts available under our credit facility and cash from the issuance of unsecured long-term debt and partnership units. Historically, our primary uses of cash have been for our operating expenses, capital expenditures, cash distributions to unitholders and unit repurchase transactions. To fund certain acquisition transactions, we have also sourced the private placement markets and have issued equity as
17
partial consideration for the acquisition of oil and natural gas properties. As market conditions have permitted, we have also engaged in asset sale transactions.
Natural gas prices have fluctuated substantially in the last two years from a high monthly average Henry Hub price of $4.54 per MMBtu in June 2011 to a low of $1.95 per MMBtu in April 2012, with an average of $3.32 in 2013 to date. Henry Hub prices averaged $4.00 and $2.75 in 2011 and 2012, respectively. We have hedged more than 68% of our expected natural gas production in 2013 and 2014 at average prices of $5.87 and $4.99, respectively. As of February 27, 2013, we had approximately $77.0 million in borrowings outstanding under our credit facility and total lender commitments of $900 million. However, sustained low prices for natural gas may reduce the amounts we would otherwise have available to pay expenses, make distributions to our unitholders and service our indebtedness.
In 2013, our crude oil and natural gas capital spending program, including capitalized engineering and excluding acquisitions, is expected to be approximately $261 million.
In 2012, we spent $562.4 million on acquisitions in Texas, Wyoming and California and issued approximately 3 million Common Units.
Equity Offerings
In February 2011, we sold approximately 4.9 million Common Units at a price to the public of $21.25, resulting in proceeds net of underwriting discounts and expenses of $100 million. In February 2012, we sold 9.2 million Common Units at a price to the public of $18.80, resulting in proceeds net of underwriting discounts and estimated offering expenses of $166.0 million. In September 2012, we sold 11.5 million of our Common Units at a price to the public of $18.51 per Common Unit, resulting in proceeds, net of underwriting discount and offering expenses, of $204.1 million. In February 2013, we sold 14.95 million Common Units at a price to the public of $19.86, resulting in proceeds net of underwriting discounts and expenses of $285.0 million. We used the proceeds from these offerings to reduce borrowings under our credit facility.
Senior Notes
On October 6, 2010, we and BreitBurn Finance Corporation, and certain of our subsidiaries as guarantors, issued $305 million in aggregate principal amount of 8.625% senior notes due 2020 at a price of 98.358%. We received net proceeds of approximately $291.2 million, after deducting estimated fees and offering expenses, and used $290 million of the net proceeds to repay amounts outstanding under our credit facility.
On January 13, 2012, we and BreitBurn Finance Corporation, and certain of our subsidiaries, as guarantors, issued $250 million in aggregate principal amount of 7.875% senior notes due 2022 at a price of 99.154%. We received net proceeds of approximately $242.3 million, after deducting estimated fees and offering expenses, and used the proceeds to reduce borrowings under our credit facility.
In September 2012, we issued an additional $200 million aggregate principal amount of our 7.875% Senior Notes due 2022. These notes were offered as an addition to our existing 7.875% Senior Notes due 2022 at a premium of 103.500%. We received net proceeds of approximately $202.8 million, after deducting estimated fees and offering expenses, and used the proceeds to reduce borrowings under our credit facility.
The use of proceeds from the issuance of these senior notes to repay amounts outstanding under our credit facility increased the borrowing availability under our credit facility, which gives us additional flexibility to finance future acquisitions.
Credit Facility
As of December 31, 2011, our Second Amended and Restated Credit Agreement had a maturity date of May 9, 2016 and a borrowing base of $850 million.
18
In May 2012, we entered into the Fifth Amendment to the Second Amended and Restated Credit Agreement, which increased the permitted amount of senior unsecured notes we may issue from $700 million to $1 billion.
In October 2012, we entered into the Sixth Amendment to the Second Amended and Restated Credit Agreement, which increased our borrowing base to $1.0 billion and increased our total commitments from existing lenders to $900 million. The Sixth Amendment also provided us with the ability to increase our total commitments up to the $1 billion borrowing base upon lender approval.
We had outstanding borrowings under our credit facility of $345.0 million as of December 31, 2012 and $77.0 million as of February 27, 2013.
As of December 31, 2012, the lending group under the Second Amended and Restated Credit Agreement included 14 banks. Of the $900 million in total commitments under the credit facility, Wells Fargo Bank National Association held approximately 18.8% of the commitments. Ten banks held between 5% and 8% of the commitments, including Union Bank, N.A., Bank of Montreal, The Bank of Nova Scotia, Houston Branch, Citibank, N.A., Royal Bank of Canada, U.S. Bank National Association, Bank of Scotland plc, Barclays Bank PLC, The Royal Bank of Scotland plc and Credit Suisse AG, Cayman Islands Branch, with each of the remaining lenders holding less than 5% of the commitments. In addition to our relationships with these institutions under the credit facility, from time to time we engage in other transactions with a number of these institutions. Such institutions or their affiliates may serve as underwriter or initial purchaser of our debt and equity securities and/or serve as counterparties to our commodity and interest rate derivative agreements.
The Second Amended and Restated Credit Agreement contains customary covenants, including restrictions on our ability to: incur additional indebtedness, make certain investments, loans or advances, make distributions to our unitholders or repurchase units, make dispositions or enter into sales and leasebacks, or enter into a merger or sale of our property or assets, including the sale or transfer of interests in our subsidiaries.
The Second Amended and Restated Credit Agreement includes the restriction on our ability to make distributions unless after giving effect to such distribution, we remain in compliance with all terms and conditions of our credit facility. In addition, the Second Amended and Restated Credit Agreement requires us to maintain a leverage ratio (defined as the ratio of total debt to EBITDAX) as of the last day of each quarter, on a last twelve month basis of no more than 4.00 to 1.00 and a current ratio as of the last day of each quarter, of not less than 1.00 to 1.00. As of December 31, 2012, we were in compliance with these covenants.
EBITDAX is not a defined GAAP measure. The Second Amended and Restated Credit Agreement defines EBITDAX as consolidated net income plus exploration expense, interest expense, income tax provision, DD&A, unrealized loss or gain on derivative instruments, non-cash charges, including non-cash unit-based compensation expense, loss or gain on sale of assets (excluding gain or loss on monetization of derivative instruments for the following twelve months), pro forma impact of acquisitions and disposition, cumulative effect of changes in accounting principles, cash distributions received from our unrestricted entities (as defined in the Second Amended and Restated Credit Agreement) and excluding income from our unrestricted entities.
The events that constitute an Event of Default (as defined in the Second Amended and Restated Credit Agreement) include: payment defaults, misrepresentations, breaches of covenants, cross-default and cross-acceleration to certain other indebtedness, adverse judgments against us in excess of a specified amount, changes in management or control, loss of permits, certain insolvency events and assertion of certain environmental claims.
Please see Part I—Item 1A “—Risk Factors”— “Risks Related to Our Business — Our credit facility has substantial restrictions and financial covenants that may restrict our business and financing activities and our ability to pay distributions” in this report for more information on the effect of an event of default under the Second Amended and Restated Credit Facility.
19
Distributions
We intend to make cash distributions to unitholders on a quarterly basis, although there is no assurance as to future cash distributions since they are dependent upon future earnings, cash flows, capital requirements, financial condition and other factors. Our credit agreement restricts us from making cash distributions unless, after giving effect to such distribution, we remain in compliance with all terms and conditions of our credit facility. The following table provides a summary of distributions paid during the years ended December 31, 2012, 2011 and 2010:
| Total | Cash Distribution | Date | ||||||||
| Thousands of dollars, except per unit amounts | Distribution | Per Common Unit | Paid | |||||||
| Fourth Quarter 2012 | $ | 39,823 | $ | 0.4700 | 2/14/2013 | |||||
| Third Quarter 2012 | 37,499 | 0.4650 | 11/14/2012 | |||||||
| Second Quarter 2012 | 31,806 | 0.4600 | 8/14/2012 | |||||||
| First Quarter 2012 | 31,461 | 0.4550 | 5/14/2012 | |||||||
| Fourth Quarter 2011 | 26,988 | 0.4500 | 2/14/2012 | |||||||
| Third Quarter 2011 | 25,682 | 0.4350 | 11/14/2011 | |||||||
| Second Quarter 2011 | 24,944 | 0.4225 | 8/12/2011 | |||||||
| First Quarter 2011 | 24,649 | 0.4175 | 5/13/2011 | |||||||
| Fourth Quarter 2010 | 22,314 | 0.4125 | 2/11/2011 | |||||||
| Third Quarter 2010 | 20,790 | 0.3900 | 11/12/2010 | |||||||
| Second Quarter 2010 | 20,385 | 0.3825 | 8/13/2010 | |||||||
| First Quarter 2010 | 19,985 | 0.3750 | 5/14/2010 | |||||||
Cash Flows
Operating activities. Our cash flow from operating activities in 2012 was $191.8 million compared to $128.5 million in 2011. The increase in cash flow from operating activities was primarily due to higher crude oil sales revenue and higher settlements received on commodity derivatives, partially offset by higher operating costs and higher interest expense. We paid $30.0 million in premiums on commodity derivative contracts in 2012 and paid $2.5 million to terminate an interest rate contract. See Note 5 to the consolidated financial statements in this report for more information regarding our derivatives.
Our cash flow from operating activities in 2011 was $128.5 million compared to $182.0 million in 2010. The decrease in cash flow from operating activities was primarily due to higher operating costs, higher overall cash interest expense and $36.8 million in net payments during 2011 related to the termination of commodity derivative contracts.
Investing activities. Net cash used in investing activities for the year ended December 31, 2012 was $697.2 million, which was predominantly spent on property acquisitions. Property acquisitions of $562.4 million in 2012 included $420 million for the Permian Basin Acquisitions, $95 million for the NiMin Acquisition and $38 million for the AEO Acquisition. We also spent $135.9 million for capital expenditures, primarily for drilling and completions. Net cash used in investing activities for the year ended December 31, 2011 was $414.6 million, including $280.6 million for the Cabot Acquisition, $57.4 million for the Greasewood Acquisition and $78.1 million for capital expenditures, primarily for drilling and completions.
Net cash used in investing activities for the year ended December 31, 2010 was $68.3 million, which was predominantly spent on drilling and completions, including drilling of the Raccoon Point wells in Florida.
Financing activities. Net cash provided by financing activities for the year ended December 31, 2012 was $504.6 million compared to $287.7 million for the year ended December 31, 2011. Our long-term debt increased by approximately $275 million in 2012 compared to $292 million in 2011. The increase in our debt in 2012 and 2011 was primarily due to borrowings for property acquisitions. In addition, for the year ended December 31, 2012, we received net cash proceeds from the issuance of Common Units of $370.2 million, made cash distributions of $132.4 million and
20
paid $10.0 million in debt issuance costs. For the year ended December 31, 2011, we received net cash proceeds from the issuance of Common Units of $99.4 million, made cash distributions of $102.7 million and paid $3.7 million in debt issuance costs.
Net cash used in financing activities for the year ended December 31, 2010 was $115.9 million. We reduced our long-term debt by approximately $26.0 million, made cash distributions of $65.2 million and paid $20.7 million in debt issuance costs.
Off-Balance Sheet Arrangements
We did not have any off-balance sheet arrangements as of December 31, 2012.
Contractual Obligations and Commitments
The following table summarizes our financial contractual obligations as of December 31, 2012. Some of these contractual obligations are reflected in the balance sheet, while others are disclosed as future obligations under GAAP.
| Payments Due by Year | ||||||||||||||||||||||||||||
| Thousands of dollars | 2013 | 2014 | 2015 | 2016 | 2017 | after 2017 | Total | |||||||||||||||||||||
| Credit facility (a) | $ | — | $ | — | $ | — | $ | 345,000 | $ | — | $ | — | $ | 345,000 | ||||||||||||||
| Credit facility commitment fees | 2,109 | 2,109 | 2,109 | 746 | — | — | 7,073 | |||||||||||||||||||||
| Senior Notes (b) | — | — | — | — | — | 755,000 | 755,000 | |||||||||||||||||||||
| Estimated interest payments (c) | 69,488 | 69,488 | 69,488 | 64,481 | 61,744 | 225,524 | 560,213 | |||||||||||||||||||||
| Operating lease obligations | 4,713 | 4,323 | 3,902 | 2,843 | 2,441 | 396 | 18,618 | |||||||||||||||||||||
| Asset retirement obligations | 709 | 5 | — | 57 | 422 | 97,287 | 98,480 | |||||||||||||||||||||
| Deferred premiums | 898 | 657 | — | — | — | — | 1,555 | |||||||||||||||||||||
| Purchase obligations | 183 | — | — | — | — | — | 183 | |||||||||||||||||||||
| Total | $ | 78,100 | $ | 76,582 | $ | 75,499 | $ | 413,127 | $ | 64,607 | $ | 1,078,207 | $ | 1,786,122 | ||||||||||||||
| (a) Credit facility matures on May 9, 2016. | ||||||||||||||||||||||||||||
| (b) Represents 8.625% senior notes due 2020 with a face value of $305,000 and 7.875% Senior Notes due 2022 with a face value of $450,000. | ||||||||||||||||||||||||||||
| (c) Based on debt balance and interest rates in effect at December 31, 2012. | ||||||||||||||||||||||||||||
Surety Bonds and Letters of Credit
In the normal course of business, we have performance obligations that are secured, in whole or in part, by surety bonds or letters of credit. These obligations primarily cover self-insurance and other programs where governmental organizations require such support. These surety bonds and letters of credit are issued by financial institutions and are required to be reimbursed by us if drawn upon. At December 31, 2012, we had obtained various surety bonds for $16.2 million and $0.3 million in letters of credit outstanding. At December 31, 2011, we had $22.1 million in surety bonds and $0.3 million in letters of credit outstanding.
Credit and Counterparty Risk
Financial instruments that potentially subject us to concentrations of credit risk consist principally of derivatives and accounts receivable. Our derivatives are exposed to credit risk from counterparties. As of December 31, 2012 and February 27, 2013, our derivative counterparties were Barclays Bank PLC, Bank of Montreal, Citibank, N.A, Credit Suisse Energy LLC, Union Bank N.A, Wells Fargo Bank National Association, JP Morgan Chase Bank N.A., The Royal Bank of Scotland plc, The Bank of Nova Scotia, BNP Paribas, Toronto-Dominion Bank and the Royal Bank of Canada. Our counterparties are all lenders who participate in our Second Amended and Restated Credit Agreement. During 2008 and 2009, there was extreme volatility and disruption in the capital and credit markets. While the market has become more stable, future volatility could adversely affect the financial condition of our derivative counterparties. On all transactions where we are exposed to counterparty risk, we analyze the counterparty’s financial condition prior to
21
entering into an agreement, establish limits, and monitor the appropriateness of these limits on an ongoing basis. We periodically obtain credit default swap information on our counterparties. As of December 31, 2012 and February 27, 2013, each of these financial institutions had an investment grade credit rating. Although we currently do not believe we have a specific counterparty risk with any party, our loss could be substantial if any of these parties were to default. As of December 31, 2012, our largest derivative asset balances were with Credit Suisse Energy LLC, Wells Fargo Bank National Association and The Royal Bank of Scotland plc which accounted for approximately 21%, 20% and 12% of our derivative asset balances, respectively. See Note 5 to the consolidated financial statements in this report for more information regarding our derivatives.
Accounts receivable are primarily from purchasers of oil and natural gas products. We have a portfolio of crude oil and natural gas sales contracts with large, established refiners and utilities. Because our products are commodity products sold primarily on the basis of price and availability, we are not dependent upon one purchaser or a small group of purchasers. During the year ended December 31, 2012, our largest purchasers were ConocoPhillips, Plains Marketing & Transportation LLC and Marathon Oil Company which accounted for approximately 31%, 17% and 14% of net sales revenues, respectively.
ConocoPhillips, Plains Marketing & Transportation LLC and Marathon Oil Company comprised 10% or more of our outstanding trade receivables, and together comprised approximately 45% of our outstanding trade receivables as of December 31, 2012.
Critical Accounting Policies and Estimates
The discussion and analysis of our financial condition and results of operations is based upon our consolidated financial statements, which have been prepared in accordance with GAAP. The preparation of these financial statements requires us to make estimates and assumptions that affect the reported amounts of assets, liabilities, revenue and expenses and related disclosure of contingent assets and liabilities. Certain accounting policies involve judgments and uncertainties to such an extent that there is reasonable likelihood that materially different amounts could have been reported under different conditions or if different assumptions had been used. We evaluate our estimates and assumptions on a regular basis. We base our estimates on historical experience and various other assumptions that are believed to be reasonable under the circumstances, the results of which form the basis for making judgments about the carrying values of assets and liabilities that are not readily apparent from other sources. Actual results may differ from these estimates and assumptions used in preparation of our financial statements. Below, we have provided expanded discussion of our more significant accounting policies, estimates and judgments. The development, selection and disclosure of each of these policies is reviewed by our audit committee. We believe these accounting policies reflect the more significant estimates and assumptions used in preparation of our financial statements. See Note 2 to the consolidated financial statements in this report for a discussion of additional accounting policies and estimates made by management.
Successful Efforts Method of Accounting
We account for oil and gas properties using the successful efforts method. Under this method of accounting, leasehold acquisition costs are capitalized. Subsequently, if proved reserves are found on unproved property, the leasehold costs are transferred to proved properties. Under this method of accounting, costs relating to the development of proved areas are capitalized when incurred.
DD&A of producing oil and gas properties is recorded based on units of production. Unit rates are computed for unamortized drilling and development costs using proved developed reserves and for unamortized leasehold costs using all proved reserves. Acquisition costs of proved properties are amortized on the basis of all proved reserves, developed and undeveloped, and capitalized development costs (wells and related equipment and facilities) are amortized on the basis of proved developed reserves.
Geological, geophysical and dry hole costs on oil and gas properties relating to unsuccessful exploratory wells are charged to expense as incurred.
Oil and gas properties are reviewed for impairment periodically and when facts and circumstances indicate that their carrying value may not be recoverable. We assess impairment of capitalized costs of proved oil and gas properties by
22
comparing net capitalized costs to estimated undiscounted future net cash flows using expected prices. If net capitalized costs exceed estimated undiscounted future net cash flows, the measurement of impairment is based on estimated fair value, which would consider estimated future discounted cash flows. For purposes of performing an impairment test, the undiscounted cash flows are forecast using five-year NYMEX forward strip prices at the end of the period and escalated thereafter at 2.5%. For impairment charges, the associated proved properties’ expected future net cash flows are discounted using a weighted average cost of capital which approximated 10% at December 31, 2012. Unproved properties are assessed for impairment along with proved properties and if considered impaired are charged to expense when such impairment is deemed to have occurred.
During the year ended December 31, 2012, we recorded impairments of approximately $12.3 million primarily related to uneconomic proved natural gas properties in Michigan. During the year ended December 31, 2011, we recorded impairments of approximately $0.6 million related to uneconomic proved natural gas properties in Michigan. During the year ended December 31, 2010, we recorded impairments of approximately $6.3 million related to our Michigan, Indiana and Kentucky properties, including a $4.2 million write-down of uneconomic proved properties and a $2.1 million write-down of expired unproved lease properties. Price declines may in the future result in additional impairment charges, which could have a material adverse effect on our results of operations in the period incurred.
We capitalize interest costs to oil and gas properties on expenditures made in connection with certain projects such as drilling and completion of new oil and natural gas wells and major facility installations. Interest is capitalized only for the period that such activities are in progress. Interest is capitalized using a weighted average interest rate based on our outstanding borrowings. These capitalized costs are included with intangible drilling costs and amortized using the units of production method. During 2012 and 2011 and 2010, interest of less than $0.1 million, $0.1 million and $0.3 million, respectively, was capitalized and included in our capital expenditures.
Business combinations
We account for all business combinations using the acquisition method. Under the acquisition method of accounting, a business combination is accounted for at a purchase price based upon the fair value of the consideration given, whether in the form of cash, assets, equity or the assumption of liabilities. The assets and liabilities acquired are measured at their fair values, and the purchase price is allocated to the assets and liabilities based upon these fair values. The excess of the fair value of assets acquired and liabilities assumed over the cost of an acquired entity, if material, is recognized as a gain at the time of acquisition. All purchase price allocations are finalized within one year from the acquisition date. We have not recognized any goodwill from any business combinations.
Oil and Gas Reserve Quantities
The estimates of our proved reserves are based on the quantities of oil and gas that engineering and geological analyses demonstrate, with reasonable certainty, to be recoverable from established reservoirs in the future under current operating and economic parameters. Annually, Netherland, Sewell & Associates, Inc. and Schlumberger PetroTechnical Services prepare reserve and economic evaluations of all our properties on a well-by-well basis.
Estimated proved reserves and their relation to estimated future net cash flows impact our depletion and impairment calculations. As a result, adjustments to depletion and impairment are made concurrently with changes to reserve estimates. We prepare our disclosures for reserve estimates, and the projected cash flows derived from these reserve estimates, in accordance with SEC guidelines. The independent engineering firms described above adhere to the same guidelines when preparing their reserve reports. The accuracy of the reserve estimates is a function of many factors including the following: the quality and quantity of available data, the interpretation of that data, the accuracy of various mandated economic assumptions and the judgments of the individuals preparing the estimates.
Because these estimates depend on many assumptions, all of which may substantially differ from future actual results, reserve estimates will be different from the quantities of oil and natural gas that are ultimately recovered. In addition, results of drilling, testing and production after the date of an estimate may justify, positively or negatively, material revisions to the estimate of proved reserves.
23
Our estimates of proved reserves materially impact depletion expense. If the estimates of proved reserves decline, the rate at which we record depletion expense will increase, reducing future net income. Such a decline may result from lower market prices, which may make it uneconomical to drill for and produce higher cost fields. In addition, a decline in proved reserve estimates may impact the outcome of our assessment of oil and gas producing properties for impairment. For example, if the SEC prices used for our December 31, 2012 reserve report had been $10.00 less per Bbl and $1.00 less per MMBtu, respectively, then the standardized measure of our estimated proved reserves as of December 31, 2012 would have decreased by approximately $501.7 million, from $1,989.9 million to $1,488.2 million.
Please see Part I—Item 1A —“Risk Factors” — “Risks Related to Our Business — Our estimated proved reserves are based on many assumptions that may prove to be inaccurate. Any material inaccuracies in these reserve estimates or underlying assumptions could materially affect the quantities and present value of our reserves.”
Asset Retirement Obligations
Estimated asset retirement obligation (“ARO”) costs are recognized when the asset is placed in service and are amortized over proved reserves using the units of production method. The engineers of BreitBurn Management estimate asset retirement costs using existing regulatory requirements and anticipated future inflation rates. Projecting future ARO cost estimates is difficult as it involves the estimation of many variables such as economic recoveries of future oil and gas reserves, future labor and equipment rates, future inflation rates, and our credit adjusted risk free interest rate. Because of the intrinsic uncertainties present when estimating asset retirement costs as well as asset retirement settlement dates, our ARO estimates are subject to ongoing volatility.
Derivative Instruments
We use derivative financial instruments to achieve more predictable cash flow from our oil and natural gas production by reducing their exposure to price fluctuations. Currently, these instruments include swaps, collars and options. Additionally, we may use derivative financial instruments in the form of interest rate swaps to mitigate interest rate exposure. Derivative instruments (including certain derivative instruments embedded in other contracts) are recorded at fair market value and are included in the balance sheet as assets or liabilities. The accounting for changes in the fair market value of a derivative instrument depends on the intended use of the derivative instrument and the resulting designation, which is established at the inception of a derivative instrument. We do not account for our derivative instruments as cash flow hedges for financial accounting purposes and are recognizing changes in the fair value of our derivative instruments immediately in net income. See Part II—Item 7A “—Quantitative and Qualitative Disclosures About Market Risk” and Note 5 to the consolidated financial statements in this report for additional information related to our financial instruments.
New Accounting Standards
See Note 3 to the consolidated financial statements in this report for a discussion of new accounting standards.
24
Item 7A. Quantitative and Qualitative Disclosures About Market Risk.
The primary objective of the following information is to provide forward-looking quantitative and qualitative information about our potential exposure to market risks. The term “market risk” refers to the risk of loss arising from adverse changes in oil and natural gas prices and interest rates. The disclosures are not meant to be precise indicators of expected future losses, but rather indicators of reasonably possible losses. This forward-looking information provides indicators of how we view and manage our ongoing market risk exposures. All of our market risk sensitive instruments were entered into for purposes other than speculative trading. See “Cautionary Statement Regarding Forward-Looking Information” in Part I—Item 1 “—Business” in this report.
See Note 5 to the consolidated financial statements in this report for additional information related to our financial instruments, including summaries of our commodity and interest rate derivative contracts at December 31, 2012 and a discussion of credit and counterparty risk.
Commodity Price Risk
Due to the historical volatility of crude oil and natural gas prices, we have entered into various derivative instruments to manage exposure to volatility in the market price of crude oil and natural gas to achieve more predictable cash flows. We use swaps, collars and options for managing risk relating to commodity prices. All contracts are settled with cash and do not require the delivery of physical volumes to satisfy settlement. While this strategy may result in us having lower revenues than we would otherwise have if we had not utilized these instruments in times of higher oil and natural gas prices, management believes that the resulting reduced volatility of prices and cash flow is beneficial. While our commodity price risk management program is intended to reduce our exposure to commodity prices and assist with stabilizing cash flow and distributions, to the extent we have hedged a significant portion of our expected production and the cost for goods and services increases, our margins would be adversely affected. Please see Part I—Item 1A — “Risk Factors” — “Risks Related to Our Business — Our derivative activities could result in financial losses or could reduce our income, which may adversely affect our ability to pay distributions to our unitholders. To the extent we have hedged a significant portion of our expected production and actual production is lower than expected or the costs of goods and services increase, our profitability would be adversely affected.” The use of derivatives also involves the risk that the counterparties to such instruments will be unable to meet the financial terms of such contracts.
Our commodity derivative instruments provide for monthly settlement based on the differential between the agreement price and the actual ICE Brent crude oil price, NYMEX WTI crude oil price, NYMEX Henry Hub natural gas price or MichCon City-Gate natural gas price.
We do not currently designate any of our derivative instruments as hedges for financial accounting purposes. In order to qualify for hedge accounting, the relationship between the hedging instrument and the hedged item must be highly effective in achieving the offset of changes in cash flows attributable to the hedged risk both at the inception of the contract and on an ongoing basis. Hedge effectiveness must be measured, at minimum, on a quarterly basis. Hedge accounting must be discontinued prospectively when a hedge instrument is no longer considered to be highly effective. Many of our commodity derivative instruments would not qualify for hedge accounting due to the ineffectiveness created by variability in our price discounts or differentials.
Our Los Angeles Basin crude oil is generally medium gravity crude. Because of its proximity to the extensive Los Angeles refinery market, it trades at a premium to NYMEX WTI. Historically, WTI oil prices and ICE Brent oil prices have fluctuated together, but recently WTI and ICE Brent oil prices have diverged. Management believes that ICE Brent pricing will better correlate with local California prices we receive in the future. In 2012, ICE Brent prices were higher than WTI, and our California production traded at a premium to WTI. Our Wyoming crude oil, while generally of similar quality to our Los Angeles Basin crude oil, trades at a significant discount to NYMEX WTI because of its distance from a major refining market and the fact that our central Wyoming production is priced relative to the Bow River benchmark for Canadian heavy sour crude oil and our eastern Wyoming production is priced relative to Flint Hills Resources Wyoming Sweet posting, both of which have historically traded at a significant discount to NYMEX WTI. In 2012, our Florida crude oil traded at a premium to NYMEX WTI. Our Texas crude oil traded at a discount to NYMEX due to the deduction of transportation costs and benchmarking to WTI posted prices.
25
Our Michigan properties have favorable natural gas supply/demand characteristics as the state has been importing an increasing percentage of its natural gas. To the extent our production is not hedged, the supply/demand situation has allowed us to sell our natural gas production with little or no discount to industry MichCon City-Gate prices. Our Wyoming natural gas trades at a discount to Henry Hub due to its relative location and the regional supply/demand market balances. Our Texas natural gas traded at a premium to Henry Hub primarily due to its high BTU content.
During 2012, the average differentials per barrel to NYMEX WTI benchmark prices were a $13.30 premium for our California-based oil production, a $17.55 discount for our Wyoming-based oil production, a $4.91 discount for our Texas-based oil production and a $2.91 premium for our Florida-based oil production, excluding transportation costs. During 2012, the average differentials per Mcf to Henry Hub benchmark prices were a $0.21 premium for our Michigan-based natural gas production, an $0.18 premium for our Wyoming-based natural gas production and a $1.78 premium for out Texas-based natural gas production.
During 2011, the average differentials per barrel to NYMEX WTI benchmark prices were a $13.88 premium for our California-based oil production, a $15.42 discount for our Wyoming-based oil production and a $14.46 discount for our Florida-based oil production, including approximately $7.50 in transportation costs. During 2011, the average differentials per Mcf to Henry Hub benchmark prices were a $0.27 premium for our Michigan-based natural gas production and a $0.01 discount for our Wyoming-based natural gas production.
During 2010, the average discounts we received for our crude oil production relative to NYMEX WTI benchmark prices per barrel were $0.25 for California-based production, $13.24 for Wyoming-based production, and $16.15 for Florida-based production, including approximately $7.50 in transportation costs. During 2010, the average premium we received for our natural gas production relative to Henry Hub benchmark prices per Mcf was $0.17 for our Michigan-based production.
All of our derivative instruments are recorded on the balance sheet at fair value. Fair value is generally determined based on the difference between the fixed contract price and the underlying market price at the determination date, and/or confirmed by the counterparty. Changes in the fair value of our commodity derivatives were recorded in gain (loss) on commodity derivative instruments, net on the consolidated statements of operations, as a loss of $82.0 million for 2012 and a gain of $97.7 million for 2011.
Interest Rate Risk
We are subject to interest rate risk associated with loans under our credit facility that bear interest based on floating rates. At December 31, 2012, LIBOR based long-term debt outstanding under our credit facility was $345.0 million. For the year ended December 31, 2012, our weighted average credit facility debt balance was $217 million and, excluding the impact of interest rate swaps, if interest rates on our LIBOR based debt increased or decreased by 1%, our annual interest cost would have increased or decreased by approximately $2.2 million.
Changes in Fair Value
The fair value of our outstanding oil and gas commodity derivative instruments at December 31, 2012 was a net asset of approximately $79.2 million. The fair value of our outstanding oil and gas commodity derivative instruments at December 31, 2011 was a net asset of approximately $131.2 million.
As of December 31, 2012, assuming a $10 per barrel increase in the price of oil and a corresponding $1 per Mcf increase in natural gas, our net commodity derivative instrument asset at December 31, 2012 would have decreased by approximately $176 million. Assuming a $10 per barrel decrease in the price of oil and a corresponding $1 per Mcf decrease in natural gas, our net commodity derivative instrument asset at December 31, 2012 would have increased by approximately $180 million.
Price risk sensitivities were calculated by assuming across-the-board increases in price of $10 per barrel for oil and $1 per Mcf for natural gas regardless of term or historical relationships between the contractual price of the instruments and the underlying commodity price. In the event of actual changes in prompt month prices equal to the assumptions, the
26
fair value of our derivative portfolio would typically change by less than the amounts given due to lower volatility in out-month prices.
Changes in derivative instruments since December 31, 2012
In February 2013, we entered into NYMEX WTI and ICE Brent fixed price crude oil swaps covering a total of approximately 2.2 million barrels of future production in 2013 through 2017 at a weighted average hedge price of $96.02 per Bbl. Also in February 2013, we entered into Henry Hub fixed price natural gas swaps covering a total of approximately 2,375 BBtu of future production in 2016 and 2017 at a weighted average hedge price of $4.47 per MMBtu.
Item 8. Financial Statements and Supplementary Data.
The information required by this Item 8 is incorporated herein by reference from the consolidated financial statements beginning on page F-1.
Item 9. Changes In and Disagreements with Accountants on Accounting and Financial Disclosure.
None.
Item 9A. Controls and Procedures.
Evaluation of Disclosure Controls and Procedures
As required by Rule 13a-15(b) of the Exchange Act, we have evaluated, under the supervision and with the participation of our management, including our General Partner's principal executive officer and principal financial officer, the effectiveness of the design and operation of our disclosure controls and procedures (as defined in Rules 13a-15(e) and 15d-15(e) under the Exchange Act) as of the end of the period covered by this report. Our disclosure controls and procedures are designed to provide reasonable assurance that the information required to be disclosed by us in reports that we file under the Exchange Act is accumulated and communicated to our management, including our General Partner's principal executive officer and principal financial officer, as appropriate, to allow timely decisions regarding required disclosure and is recorded, processed, summarized and reported within the time periods specified in the rules and forms of the Commission. Based upon the evaluation, our General Partner's principal executive officer and principal financial officer have concluded that our disclosure controls and procedures were effective as of December 31, 2012 at the reasonable assurance level.
Management’s Report on Internal Control Over Financial Reporting
The information required by this Item is incorporated by reference from “Management’s Report on Internal Control Over Financial Reporting” located on page F-2.
Changes in Internal Control Over Financial Reporting
There were no changes in our internal control over financial reporting that occurred during the quarter ended December 31, 2012 that materially affected, or are reasonably likely to materially affect, our internal control over financial reporting.
Item 9B. Other Information.
There was no information required to be disclosed in a report on Form 8-K during the fourth quarter of 2012 that has not previously been reported.
27
PART IV
Item 15. Exhibits and Financial Statement Schedules.
(a) (1) Financial Statements
See “Index to the Consolidated Financial Statements” set forth on Page F-1.
(2) Financial Statement Schedules
All schedules are omitted because they are not applicable or the required information is presented in the consolidated financial statements or notes thereto.
(3) Exhibits
| NUMBER | DOCUMENT | |
| 3.1 | Certificate of Limited Partnership of BreitBurn Energy Partners L.P. (incorporated herein by reference to Exhibit 3.1 to Amendment No. 1 to Form S-1 (File No. 333-134049) filed on July 13, 2006). | |
| 3.2 | First Amended and Restated Agreement of Limited Partnership of BreitBurn Energy Partners L.P. (incorporated herein by reference to Exhibit 3.1 to the Current Report on Form 8-K (File No. 001-33055) filed on October 16, 2006). | |
| 3.3 | Amendment No. 1 to the First Amended and Restated Agreement of Limited Partnership of BreitBurn Energy Partners L.P. (incorporated herein by reference to Exhibit 3.1 to the Current Report on Form 8-K (File No. 001-33055) filed on June 23, 2008). | |
| 3.4 | Amendment No. 2 to the First Amended and Restated Agreement of Limited Partnership of BreitBurn Energy Partners L.P. (incorporated herein by reference to Exhibit 3.1 to the Current Report on Form 8-K (File No. 001-33055) filed April 9, 2009). | |
| 3.5 | Amendment No. 3 to the First Amended and Restated Agreement of Limited Partnership of BreitBurn Energy Partners L.P. (incorporated herein by reference to Exhibit 3.1 to the Current Report on Form 8-K (File No. 001-33055) filed September 1, 2009). | |
| 3.6 | Amendment No.4 to the First Amended and Restated Agreement of Limited Partnership of BreitBurn Energy Partners L.P. (incorporated herein by reference to Exhibit 3.1 to the Current Report on Form 8-K (File No. 001-33055) filed on April 9, 2010). | |
| 3.7 | Fourth Amended and Restated Limited Liability Company Agreement of BreitBurn GP, LLC dated as of April 5, 2010 (incorporated herein by reference to Exhibit 3.2 to the Current Report on Form 8-K (File No. 001-33055) filed on April 9, 2011). | |
| 3.8 | Amendment No. 1 to the Fourth Amended and Restated Limited Liability Company Agreement of BreitBurn GP, LLC dated as of December 30, 2010 (incorporated herein by reference to Exhibit 3.1 to the Current Report on Form 8-K (File No. 001-33055) filed on January 6, 2011). | |
| 4.1 | Registration Rights Agreement, dated as of November 1, 2007, by and among BreitBurn Energy Partners L.P. and Quicksilver Resources Inc. (incorporated herein by reference to Exhibit 4.2 to the Current Report on Form 8-K (File No. 001-33055) filed on November 6, 2007). | |
| 4.2 | First Amendment to the Registration Rights Agreement, dated as of April 5, 2010, by and among BreitBurn Energy Partners L.P. and Quicksilver Resources Inc. (incorporated herein by reference to Exhibit 4.1 to the Current Report on Form 8-K (File No. 001-33055) filed on April 9, 2010). | |
| 4.3 | Indenture, dated as of October 6, 2010, by and among BreitBurn Energy Partners L.P., BreitBurn Finance Corporation, the Guarantors named therein and U.S. Bank National Association (incorporated herein by reference to Exhibit 4.1 to the Current Report on Form 8-K (File No. 001-33055) filed on October 7, 2010). | |
| 4.4 | Registration Rights Agreement, dated as of October 6, 2010, by and among BreitBurn Energy Partners L.P., BreitBurn Finance Corporation, the Guarantors named therein and the Initial Purchasers named therein (incorporated herein by reference to Exhibit 4.2 to the Current Report on Form 8-K (File No. 001-33055) filed on October 7, 2010). | |
| 4.5 | Indenture, dated as of January 13, 2012, by and among BreitBurn Energy Partners L.P., BreitBurn Finance Corporation, the Guarantors named therein and U.S. Bank National Association (incorporated herein by reference to Exhibit 4.1 to the Current Report on Form 8-K (File No. 001-33055) filed on January 13, 2012). | |
28
| NUMBER | DOCUMENT | |
| 4.6 | Registration Rights Agreement, dated as of January 13, 2012, by and among BreitBurn Energy Partners L.P., BreitBurn Finance Corporation, the Guarantors named therein and Wells Fargo Securities, LLC as representative of the Initial Purchasers named therein (incorporated herein by reference to Exhibit 4.2 to the Current Report on Form 8-K (File No. 001-33055) filed on January 13, 2012). | |
| 4.7 | Registration Rights Agreement, dated as of September 27, 2012, by and among BreitBurn Energy Partners L.P., BreitBurn Finance Corporation, the Guarantors named therein and Wells Fargo Securities, LLC, as representative of the Initial Purchasers named therein (incorporated herein by reference to Exhibit 4.2 to the Current Report on Form 8-K (File No. 001-33055) filed on September 28, 2012). | |
| 10.1 | Seventh Amendment to the Second Amended and Restated Credit Agreement of BreitBurn Energy Partners L.P. dated February 26, 2013. | |
| 10.2 | Amended and Restated Agreement of Limited Partnership of BreitBurn Energy Partners I, L.P. dated May 5, 2003 (incorporated herein by reference to Exhibit 10.2 to the Current Report on Form 8-K (File No. 001-33055) filed on May 29, 2007). | |
| 10.3† | Form of BreitBurn Energy Partners L.P. 2006 Long-Term Incentive Plan Restricted Phantom Unit Agreement (Executive Form) (incorporated herein by reference to Exhibit 10.1 to the Current Report on Form 8-K (File No. 001-33055) filed on March 11, 2008). | |
| 10.4† | Form of BreitBurn Energy Partners L.P. 2006 Long-Term Incentive Plan Restricted Phantom Unit Agreement (Non-Executive Form) (incorporated herein by reference to Exhibit 10.2 to the Current Report on Form 8-K (File No. 001-33055) filed on March 11, 2008). | |
| 10.5† | Form of BreitBurn Energy Partners L.P. 2006 Long-Term Incentive Plan Restricted Phantom Units Directors’ Award Agreement (incorporated herein by reference to Exhibit 10.35 to the Annual Report on Form 10-K for the year ended December 31, 2007 (File No. 001-33055) and filed on March 17, 2008). | |
| 10.6 | Amendment No. 1 to the Operations and Proceeds Agreement, relating to the Dominguez Field and dated October 10, 2006 entered into on June 17, 2008 by and between BreitBurn Energy Company L.P. and BreitBurn Operating L.P. (incorporated herein by reference to Exhibit 10.6 to the Current Report on Form 8-K (File No. 001-33055) filed on June 23, 2008). | |
| 10.7 | Amendment No. 1 to the Surface Operating Agreement dated October 10, 2006 entered into on June 17, 2008 by and between BreitBurn Energy Company L.P. and its predecessor BreitBurn Energy Corporation and BreitBurn Operating L.P. (incorporated herein by reference to Exhibit 10.7 to the Current Report on Form 8-K (File No. 001-33055) filed on June 23, 2008). | |
| 10.8† | Form of BreitBurn Energy Partners L.P. 2006 Long-Term Incentive Plan Convertible Phantom Unit Agreement (Employment Agreement Form) (incorporated herein by reference to Exhibit 10.9 to the Quarterly Report on Form 10-Q for the period ended June 30, 2008 (File No. 001-33055) and filed on August 11, 2008). | |
| 10.9† | Form of BreitBurn Energy Partners L.P. 2006 Long-Term Incentive Plan Convertible Phantom Unit Agreement (Non-Employment Agreement Form) (incorporated herein by reference to Exhibit 10.10 to the Quarterly Report on Form 10-Q for the period ended June 30, 2008 and (File No. 001-33055) filed on August 11, 2008). | |
| 10.10 | Second Amended and Restated Administrative Services Agreement dated August 26, 2008 by and between BreitBurn Energy Company L.P. and BreitBurn Management Company, LLC (incorporated herein by reference to Exhibit 10.1 to the Current Report on Form 8-K (File No. 001-33055) filed on September 02, 2008). | |
| 10.11 | Omnibus Agreement, dated August 26, 2008, by and among BreitBurn Energy Holdings LLC, BEC (GP) LLC, BreitBurn Energy Company L.P, BreitBurn GP, LLC, BreitBurn Management Company, LLC and BreitBurn Energy Partners L.P. (incorporated herein by reference to Exhibit 10.2 to the Current Report on Form 8-K (File No. 001-33055) filed on September 02, 2008). | |
| 10.12 | Indemnity Agreement between BreitBurn Energy Partners L.P., BreitBurn GP, LLC and Halbert S. Washburn, together with a schedule identifying other substantially identical agreements between BreitBurn Energy Partners L.P., BreitBurn GP, LLC and each of its executive officers and non-employee directors identified on the schedule (incorporated herein by reference to Exhibit 10.1 to the Current Report on form 8-K (File No. 001-33055) filed on November 4, 2009). | |
| 10.13† | First Amendment to the BreitBurn Energy Partners L.P. 2006 Long-Term Incentive Plan Convertible Phantom Unit Agreements (incorporated herein by reference to Exhibit 10.2 to the Current Report on form 8-K (File No. 001-33055) filed on November 4, 2009). | |
| 10.14† | First Amended and Restated BreitBurn Energy Partners L.P. 2006 Long-Term Incentive Plan effective as of October 29, 2009 (incorporated herein by reference to Exhibit 10.3 to the Quarterly Report on Form 10-Q for the period ended September 30, 2009 (File No. 001-33055) filed on November 6, 2009). | |
29
| NUMBER | DOCUMENT | |
| 10.15 | Settlement Agreement as of April 5, 2010 by and among Quicksilver Resources Inc., BreitBurn Energy Partners L.P., BreitBurn GP LLC, Provident Energy Trust, Randall H. Breitenbach and Halbert S. Washburn (incorporated herein by reference to Exhibit 10.1 to the Current Report on Form 8-K filed on April 9, 2010). | |
| 10.16† | Form of BreitBurn Energy Partners L.P. 2006 Long-Term Incentive Plan Restricted Phantom Unit Agreement (Executive Form) (incorporated herein by reference to Exhibit 10.21 to the Annual Report on Form 10-K for the year ended December 31, 2010 (File No. 0001-33055) filed on March 9, 2011). | |
| 10.17† | Form of BreitBurn Energy Partners L.P. 2006 Long-Term Incentive Plan Restricted Phantom Unit Agreement (Non-Executive Form) (incorporated herein by reference to Exhibit 10.22 to the Annual Report on Form 10-K for the year ended December 31, 2010 (File No. 0001-33055) filed on March 9, 2011). | |
| 10.18† | Form of BreitBurn Energy Partners L.P. 2006 Long-Term Incentive Plan Restricted Phantom Unit Agreement (Director Form) (incorporated herein by reference to Exhibit 10.23 to the Annual Report on Form 10-K for the year ended December 31, 2010 (File No. 0001-33055) filed on March 9, 2011). | |
| 10.19† | Form of Second Amendment to the BreitBurn Energy Partners L.P. 2006 Long-Term Incentive Plan Convertible Phantom Unit Agreements (incorporated herein by reference to Exhibit 10.24 to the Annual Report on Form 10-K for the year ended December 31, 2010 (File No. 0001-33055) filed on March 9, 2011). | |
| 10.20† | Form of Third Amendment to the BreitBurn Energy Partners L.P. 2006 Long-Term Incentive Plan Convertible Phantom Unit Agreements (incorporated herein by reference to Exhibit 10.25 to the Annual Report on Form 10-K for the year ended December 31, 2010 (File No. 0001-33055) filed on March 9, 2011). | |
| 10.21 | Third Amended and Restated Employment Agreement dated December 30, 2010 among BreitBurn Management Company, LLC, BreitBurn GP, LLC, BreitBurn Energy Partners L.P. and Halbert S. Washburn (incorporated herein by reference to Exhibit 10.1 to the Current Report on Form 8-K (File No. 001-33055) filed on January 6, 2011). | |
| 10.22 | Third Amended and Restated Employment Agreement dated December 30, 2010 among BreitBurn Management Company, LLC, BreitBurn GP, LLC, BreitBurn Energy Partners L.P. and Randall H. Breitenbach (incorporated herein by reference to Exhibit 10.2 to the Current Report on Form 8-K (File No. 001-33055) filed on January 6, 2011). | |
| 10.23 | Amended and Restated Employment Agreement dated December 30, 2010 among BreitBurn Management Company, LLC, BreitBurn GP, LLC, BreitBurn Energy Partners L.P. and Mark L. Pease (incorporated herein by reference to Exhibit 10.3 to the Current Report on Form 8-K (File No. 001-33055) filed on January 6, 2011). | |
| 10.24 | Second Amended and Restated Employment Agreement dated December 30, 2010 among BreitBurn Management Company, LLC, BreitBurn GP, LLC, BreitBurn Energy Partners L.P. and James G. Jackson (incorporated herein by reference to Exhibit 10.4 to the Current Report on Form 8-K (File No. 001-33055) filed on January 6, 2011). | |
| 10.25 | Amended and Restated Employment Agreement dated December 30, 2010 among BreitBurn Management Company, LLC, BreitBurn GP, LLC, BreitBurn Energy Partners L.P. and Gregory C. Brown (incorporated herein by reference to Exhibit 10.5 to the Current Report on Form 8-K (File No. 001-33055) filed on January 6, 2011). | |
| 10.26 | Second Amended and Restated Credit Agreement, dated May 7, 2010, by and among BreitBurn Operating L.P, as borrower, BreitBurn Energy Partners L.P., as parent guarantor, and Wells Fargo Bank, N.A., as administrative agent (incorporated herein by reference to Exhibit 10.1 to the Quarterly Report on Form 10-Q for the period ended March 31, 2010 (File No. 001-33055) filed on May 10, 2010). | |
| 10.27 | First Amendment dated September 17, 2010 to the Second Amended and Restated Credit Agreement dated May 7, 2010, by and among BreitBurn Operating L.P, as borrower, BreitBurn Energy Partners L.P., as parent guarantor, and Wells Fargo Bank, N.A., as administrative agent (incorporated herein by reference to Exhibit 10.1 to the Current Report on Form 8-K (File No. 001-33055) filed on September 23, 2010). | |
| 10.28 | Second Amendment to the Second Amended and Restated Credit Agreement dated May 9, 2011 (incorporated herein by reference to Exhibit 10.1 to the Quarterly Report on Form 10-Q for the quarter ended March 31, 2011 (File No. 001-33055) filed on May 10, 2011). | |
30
| NUMBER | DOCUMENT | |
| 10.29 | Asset Purchase Agreement, dated as of July 26, 2011, between Cabot Oil & Gas Corporation and BreitBurn Operating L.P. (incorporated herein by reference to Exhibit 10.1 to the Current Report on Form 8-K (File No. 001-33055) filed on July 29, 2011). | |
| 10.30 | Third Amendment to the Second Amended and Restated Credit Agreement dated August 3, 2011 (incorporated herein by reference to Exhibit 10.3 to the Quarterly Report on Form 10-Q for the quarter ended June 30, 2011 (File No. 001-33055) filed on August 8, 2011). | |
| 10.31 | Fourth Amendment to the Second Amended and Restated Credit Agreement dated October 5, 2011 (incorporated herein by reference to Exhibit 10.1 to the Current Report on Form 8-K (File No. 001-33055) filed on October 7, 2011). | |
| 10.32 | Dissolution Agreement, dated May 8, 2012, by and among BreitBurn Energy Partners L.P., Pacific Coast Energy Company LP, BEP (GP) I, LLC and BreitBurn Energy Partners I, L.P. (incorporated herein by reference to Exhibit 10.1 to the Quarterly Report on Form 10-Q for the quarter ended June 30, 2012 (File No. 001-33055) filed on August 8, 2012). | |
| 10.33 | Amendment No. 1 to BEPI Partnership Agreement, dated May 8, 2012, by and between BEP (GP) I, LLC and BreitBurn Energy Partners L.P. (incorporated herein by reference to Exhibit 10.2 to the Quarterly Report on Form 10-Q for the quarter ended June 30, 2012 (File No. 001-33055) filed on August 8, 2012). | |
| 10.34 | Third Amended and Restated Administrative Services Agreement, dated May 8, 2012, by and between Pacific Coast Energy Company L.P. and BreitBurn Management Company, LLC (incorporated herein by reference to Exhibit 10.3 to the Quarterly Report on Form 10-Q for the quarter ended June 30, 2012 (File No. 001-33055) filed on August 8, 2012). | |
| 10.35 | First Amendment to Omnibus Agreement, dated May 8, 2012, by and among BreitBurn Energy Partners L.P., BreitBurn GP, LLC, BreitBurn Management Company, LLC, Pacific Coast Energy Company L.P., Pacific Coast Energy Holdings LLC and PCEC (GP) LLC (incorporated herein by reference to Exhibit 10.4 to the Quarterly Report on Form 10-Q for the quarter ended June 30, 2012 (File No. 001-33055) filed on August 8, 2012). | |
| 10.36 | Purchase and Sale Agreement, dated April 24, 2012, among Legacy Energy, Inc., NiMin Energy Corp. and BreitBurn Operating L.P. (incorporated herein by reference to Exhibit 10.1 to the Current Report on Form 8-K (File No. 001-33055) filed on April 27, 2012). | |
| 10.37 | Purchase and Sale Agreement, dated May 9, 2012, between Element Petroleum, L.P. and BreitBurn Operating L.P. (incorporated herein by reference to Exhibit 10.1 to the Current Report on Form 8-K (File No. 001-33055) filed on May 11, 2012). | |
| 10.38 | Purchase and Sale Agreement, dated May 9, 2012, between CrownRock, L.P. and BreitBurn Operating L.P. (incorporated herein by reference to Exhibit 10.2 to the Current Report on Form 8-K (File No. 001-33055) filed on May 11, 2012). | |
| 10.39 | First Amendment to Purchase and Sale Agreement, dated as of June 28, 2012, among Legacy Energy, Inc., NiMin Energy Corp. and BreitBurn Operating L.P. (incorporated herein by reference to Exhibit 10.1 to the Current Report on Form 8-K (File No. 001-33055) filed on June 29, 2012). | |
| 10.40 | Fifth Amendment to the Second Amended and Restated Credit Agreement, dated as of May 25, 2012 (incorporated herein by reference to Exhibit 10.2 to the Current Report on Form 8-K (File No. 001-33055) filed on June 29, 2012). | |
| 10.41 | Sixth Amendment to the Second Amended and Restated Credit Agreement, dated as of October 11, 2012 (incorporated herein by reference to Exhibit 10.1 to the Current Report on Form 8-K (File No. 001-33055) filed on October 16, 2012). | |
| 10.42 | Contribution Agreement, dated November 21, 2012, among American Energy Operations, Inc., BreitBurn Energy Partners L.P. and BreitBurn Operating L.P. (incorporated herein by reference to Exhibit 10.1 to the Current Report on Form 8-K (File No. 001-33055) filed on November 27, 2012). | |
| 10.43† | Retirement Agreement, dated as of November 30, 2012, among BreitBurn Energy Partners L.P., BreitBurn GP, LLC and Randall H. Breitenbach (incorporated herein by reference to Exhibit 10.1 to the Current Report on Form 8-K (File No. 001-33055) filed on December 6, 2012). | |
| 10.44† | Omnibus First Amendment to the BreitBurn Energy Partners L.P. 2006 Long-Term Incentive Plan Restricted Phantom Unit Agreements, dated as of November 30, 2012, among BreitBurn Energy Partners L.P., BreitBurn GP, LLC and Randall H. Breitenbach (incorporated herein by reference to Exhibit 10.2 to the Current Report on form 8-K (File No. 001-33055) filed on December 6, 2012). | |
31
| NUMBER | DOCUMENT | |
| 10.45† | Fourth Amendment to the BreitBurn Energy Partners L.P. 2006 Long-Term Incentive Plan Convertible Phantom Unit Agreement, dated as of November 30, 2012, among BreitBurn Energy Partners L.P., BreitBurn GP, LLC and Randall H. Breitenbach (incorporated herein by reference to Exhibit 10.3 to the Current Report on form 8-K (File No. 001-33055) filed on December 6, 2012). | |
| 10.46 | Purchase and Sale Agreement, dated December 11, 2012, between CrownRock, L.P. and BreitBurn Operating L.P. (incorporated herein by reference to Exhibit 10.1 to the Current Report on Form 8-K (File No. 001-33055) filed on December 12, 2012). | |
| 10.47 | Purchase and Sale Agreement, dated December 11, 2012, between Lynden USA Inc. and BreitBurn Operating L.P. (incorporated herein by reference to Exhibit 10.2 to the Current Report on Form 8-K (File No. 001-33055) filed on December 12, 2012). | |
| 10.48† | Form of First Amendment to BreitBurn Energy Partners L.P. 2006 Long-Term Incentive Plan Restricted Phantom Unit Agreement (Director Form) (incorporated herein by reference to Exhibit 10.1 to the Current Report on Form 8-K (File No. 001-33055) filed on December 14, 2012). | |
| 10.49† | Form of Fourth Amendment to BreitBurn Energy Partners L.P. 2006 Long-Term Incentive Plan Restricted Convertible Phantom Unit Agreement (incorporated herein by reference to Exhibit 10.2 to the Current Report on Form 8-K (File No. 001-33055) filed on December 14, 2012). | |
| 14.1 | BreitBurn Energy Partners L.P. and BreitBurn GP, LLC Code of Ethics for Chief Executive Officers and Senior Officers (as amended and restated on February 28, 2007) (incorporated herein by reference to Exhibit 14.1 to the Current Report on Form 8-K filed on March 5, 2007). | |
| 21.1 | List of subsidiaries of BreitBurn Energy Partners L.P. | |
| 23.1* | Consent of PricewaterhouseCoopers LLP. | |
| 23.2* | Consent of Netherland, Sewell & Associates, Inc. | |
| 23.3* | Consent of Schlumberger PetroTechnical Services. | |
| 31.1* | Certification of Registrant’s Chief Executive Officer pursuant to Rule 13a-14(a) of the Securities Exchange Act of 1934 and Section 302 of the Sarbanes-Oxley Act of 2002. | |
| 31.2* | Certification of Registrant’s Chief Financial Officer pursuant to Rule 13a-14(a) of the Securities Exchange Act of 1934 and Section 302 of the Sarbanes-Oxley Act of 2002. | |
| 32.1** | Certification of Registrant’s Chief Executive Officer pursuant to Rule 13a-14(b) of the Securities Exchange Act of 1934 and 18 U.S.C. Section 1350, as created by Section 906 of the Sarbanes-Oxley Act of 2002. | |
| 32.2** | Certification of Registrant’s Chief Financial Officer pursuant to Rule 13a-14(b) of the Securities Exchange Act of 1934 and 18 U.S.C. Section 1350, as created by Section 906 of the Sarbanes-Oxley Act of 2002. | |
| 99.1 | Netherland, Sewell & Associates, Inc. reserve report for certain properties located in Wyoming. | |
| 99.2 | Netherland, Sewell & Associates, Inc. reserve report for certain properties located in California, Florida, and Texas. | |
| 99.3 | Schlumberger PetroTechnical Services reserve report. | |
| 101†† | Interactive Data Files | |
| * | Filed herewith. | |
| ** | Furnished herewith. | |
| † | Management contract or compensatory plan or arrangement. | |
| †† | The documents formatted in XBRL (Extensible Business Reporting Language) and attached as Exhibit 101 to this report are deemed not filed as part of a registration statement or prospectus for purposes of sections 11 or 12 of the Securities Act, are deemed not filed for purposes of section 18 of the Exchange Act, and otherwise are not subject to liability under these sections. | |
32
SIGNATURES
Pursuant to the requirements of Section 13 or 15(d) of the Securities Exchange Act of 1934, the registrant has duly caused this report to be signed on its behalf by the undersigned, thereunto duly authorized.
| BREITBURN ENERGY PARTNERS L.P. | ||
| By: | BREITBURN GP, LLC, | |
| its General Partner | ||
| Dated: August 23, 2013 | By: | /s/ Halbert S. Washburn |
| Halbert S. Washburn | ||
| Chief Executive Officer | ||
Pursuant to the requirements of the Securities Exchange Act of 1934, this report has been signed below by the following persons on behalf of the registrant and in the capacities and on the dates indicated.
| Name | Title | Date | ||
| /s/ Halbert S. Washburn | Chief Executive Officer and Director of | August 23, 2013 | ||
| Halbert S. Washburn | BreitBurn GP, LLC | |||
| (Principal Executive Officer) | ||||
33
BREITBURN ENERGY PARTNERS L.P. AND SUBSIDIARIES
INDEX TO THE CONSOLIDATED FINANCIAL STATEMENTS
F-1
Management’s Report on Internal Control Over Financial Reporting
The management of BreitBurn Energy Partners, L.P. (the “Partnership”) is responsible for establishing and maintaining adequate internal control over financial reporting, as defined in Rules 13a-15(f) and 15d-15(f) of the Securities Exchange Act of 1934, as amended. The term “internal control over financial reporting” is defined as a process designed by, or under the supervision of, the Partnership’s principal executive and principal financial officers, or persons performing similar functions, and effected by the Partnership’s board of directors, management and other personnel, to provide reasonable assurance regarding the reliability of financial reporting and the preparation of financial statements for external purposes in accordance with generally accepted accounting principles and includes those policies and procedures that: (i) pertain to the maintenance of records that in reasonable detail accurately and fairly reflect the transactions and dispositions of the assets of the Partnership; (ii) provide reasonable assurance that transactions are recorded as necessary to permit preparation of financial statements in accordance with generally accepted accounting principles, and that receipts and expenditures of the Partnership are being made only in accordance with authorizations of management and directors of the Partnership; and (iii) provide reasonable assurance regarding prevention or timely detection of unauthorized acquisition, use or disposition of the Partnership’s assets that could have a material effect on the financial statements.
Internal control over financial reporting, no matter how well designed, has inherent limitations. Because of its inherent limitations, internal control over financial reporting may not prevent or detect misstatements.
As required by Rule 13a-15(c) under the Exchange Act, the Partnership’s management, with the participation of the General Partner’s principal executive officers and principal financial officer, assessed the effectiveness of the Partnership’s internal control over financial reporting as of December 31, 2012. In making this assessment, the Partnership’s management used the criteria set forth by the Committee of Sponsoring Organizations of the Treadway Commission (COSO) in Internal Control Integrated Framework. Based on this assessment, the Partnership’s management, including the general partner’s principal executive officers and principal financial officer, concluded that, as of December 31, 2012, the Partnership’s internal control over financial reporting was effective based on those criteria.
Management excluded from its assessment of the effectiveness of the Partnership's internal control over financial reporting the properties acquired in the AEO, CrownRock II, Lynden and Piedra acquisitions (as further described in Note 4 to the consolidated financial statements) because they were acquired in the fourth quarter of 2012. The assets acquired from AEO, CrownRock II, Lynden and Piedra in total represented approximately 10% of the Partnership's total assets as of December 31, 2012 and revenue from these assets represented less than 1% of the Partnership's total revenue for the year ended December 31, 2012.
PricewaterhouseCoopers LLP, the independent registered public accounting firm who audited the consolidated financial statements included in this Annual Report on Form 10-K, has issued a report on the Partnership’s internal control over financial reporting as of December 31, 2012, which appears on page F-3.
| /s/ Halbert S. Washburn | /s/ James G. Jackson | |
| Halbert S. Washburn | James G. Jackson | |
| Chief Executive Officer of BreitBurn GP, LLC | Chief Financial Officer of BreitBurn GP, LLC | |
F-2
Report of Independent Registered Public Accounting Firm
To the Board of Directors of BreitBurn GP, LLC and
Unitholders of BreitBurn Energy Partners L.P.
In our opinion, the accompanying consolidated balance sheets and the related consolidated statements of operations, partners' equity and cash flows present fairly, in all material respects, the financial position of BreitBurn Energy Partners L.P. and its subsidiaries (the Partnership) at December 31, 2012 and 2011, and the results of their operations and their cash flows for each of the three years in the period ended December 31, 2012 in conformity with accounting principles generally accepted in the United States of America. Also in our opinion, the Partnership maintained, in all material respects, effective internal control over financial reporting as of December 31, 2012, based on criteria established in Internal Control - Integrated Framework issued by the Committee of Sponsoring Organizations of the Treadway Commission (COSO). The Partnership's management is responsible for these financial statements, for maintaining effective internal control over financial reporting and for its assessment of the effectiveness of internal control over financial reporting, included in the accompanying Management's Report on Internal Control Over Financial Reporting. Our responsibility is to express opinions on these financial statements and on the Partnership's internal control over financial reporting based on our integrated audits. We conducted our audits in accordance with the standards of the Public Company Accounting Oversight Board (United States). Those standards require that we plan and perform the audits to obtain reasonable assurance about whether the financial statements are free of material misstatement and whether effective internal control over financial reporting was maintained in all material respects. Our audits of the financial statements included examining, on a test basis, evidence supporting the amounts and disclosures in the financial statements, assessing the accounting principles used and significant estimates made by management, and evaluating the overall financial statement presentation. Our audit of internal control over financial reporting included obtaining an understanding of internal control over financial reporting, assessing the risk that a material weakness exists, and testing and evaluating the design and operating effectiveness of internal control based on the assessed risk. Our audits also included performing such other procedures as we considered necessary in the circumstances. We believe that our audits provide a reasonable basis for our opinions.
A company's internal control over financial reporting is a process designed to provide reasonable assurance regarding the reliability of financial reporting and the preparation of financial statements for external purposes in accordance with generally accepted accounting principles. A company's internal control over financial reporting includes those policies and procedures that (i) pertain to the maintenance of records that, in reasonable detail, accurately and fairly reflect the transactions and dispositions of the assets of the company; (ii) provide reasonable assurance that transactions are recorded as necessary to permit preparation of financial statements in accordance with generally accepted accounting principles, and that receipts and expenditures of the company are being made only in accordance with authorizations of management and directors of the company; and (iii) provide reasonable assurance regarding prevention or timely detection of unauthorized acquisition, use, or disposition of the company's assets that could have a material effect on the financial statements.
Because of its inherent limitations, internal control over financial reporting may not prevent or detect misstatements. Also, projections of any evaluation of effectiveness to future periods are subject to the risk that controls may become inadequate because of changes in conditions, or that the degree of compliance with the policies or procedures may deteriorate.
As described in Management's Report on Internal Control Over Financial Reporting, management has excluded the oil and natural gas properties acquired from American Energy Operations, Inc., CrownRock, L.P., Lynden USA Inc., and Piedra Energy I, LLC (together, the Acquired Properties) from its assessment of internal control over financial reporting as of December 31, 2012 because the assets were acquired by the Partnership in November and December 2012. We have also excluded the Acquired Properties from our audit of internal control over financial reporting. Combined total assets and total revenues of the Acquired Properties represent 10% and less than 1%, respectively, of the related consolidated financial statement amounts as of and for the year ended December 31, 2012.
| /s/ PricewaterhouseCoopers LLP |
| February 28, 2013 |
F-3
BreitBurn Energy Partners L.P. and Subsidiaries
Consolidated Balance Sheets
| December 31, | ||||||||
| Thousands | 2012 | 2011 | ||||||
| ASSETS | ||||||||
| Current assets | ||||||||
| Cash | $ | 4,507 | $ | 5,328 | ||||
| Accounts and other receivables, net (note 2) | 67,862 | 73,018 | ||||||
| Derivative instruments (note 5) | 34,018 | 83,452 | ||||||
| Related party receivables (note 6) | 1,413 | 4,245 | ||||||
| Inventory (note 7) | 3,086 | 4,724 | ||||||
| Prepaid expenses | 2,779 | 2,053 | ||||||
| Total current assets | 113,665 | 172,820 | ||||||
| Equity investments (note 8) | 7,004 | 7,491 | ||||||
| Property, plant and equipment | ||||||||
| Oil and gas properties | 3,363,946 | 2,583,993 | ||||||
| Other assets | 14,367 | 13,431 | ||||||
| 3,378,313 | 2,597,424 | |||||||
| Accumulated depletion and depreciation (note 9) | (666,420 | ) | (524,665 | ) | ||||
| Net property, plant and equipment | 2,711,893 | 2,072,759 | ||||||
| Other long-term assets | ||||||||
| Derivative instruments (note 5) | 55,210 | 55,337 | ||||||
| Other long-term assets | 27,722 | 22,442 | ||||||
| Total assets | $ | 2,915,494 | $ | 2,330,849 | ||||
| LIABILITIES AND EQUITY | ||||||||
| Current liabilities: | ||||||||
| Accounts payable | $ | 42,497 | $ | 27,203 | ||||
| Derivative instruments (note 5) | 5,625 | 8,881 | ||||||
| Revenue and royalties payable | 22,262 | 19,641 | ||||||
| Salaries and wages payable | 10,857 | 13,655 | ||||||
| Accrued interest payable | 13,002 | 6,291 | ||||||
| Accrued liabilities | 20,997 | 14,218 | ||||||
| Total current liabilities | 115,240 | 89,889 | ||||||
| Credit facility (note 10) | 345,000 | 520,000 | ||||||
| Senior notes, net (note 10) | 755,696 | 300,613 | ||||||
| Deferred income taxes (note 12) | 2,487 | 2,803 | ||||||
| Asset retirement obligation (note 13) | 98,480 | 82,397 | ||||||
| Derivative instruments (note 5) | 4,393 | 3,084 | ||||||
| Other long-term liabilities | 4,662 | 4,849 | ||||||
| Total liabilities | 1,325,958 | 1,003,635 | ||||||
| Commitments and contingencies (note 14) | ||||||||
| Equity: | ||||||||
| Partners' equity (note 15) | 1,589,536 | 1,326,764 | ||||||
| Noncontrolling interest (note 16) | — | 450 | ||||||
| Total equity | 1,589,536 | 1,327,214 | ||||||
| Total liabilities and equity | $ | 2,915,494 | $ | 2,330,849 | ||||
| Common units issued and outstanding | 84,668 | 59,864 | ||||||
The accompanying notes are an integral part of these consolidated financial statements.
F-4
BreitBurn Energy Partners L.P. and Subsidiaries
Consolidated Statements of Operations
| Year Ended December 31, | ||||||||||||
| Thousands of dollars, except per unit amounts | 2012 | 2011 | 2010 | |||||||||
| Revenues and other income items: | ||||||||||||
| Oil, natural gas and natural gas liquid sales | $ | 413,867 | $ | 394,393 | $ | 317,738 | ||||||
| Gain on commodity derivative instruments, net (note 5) | 5,580 | 81,667 | 35,112 | |||||||||
| Other revenue, net (note 8) | 3,548 | 4,310 | 2,498 | |||||||||
| Total revenues and other income items | 422,995 | 480,370 | 355,348 | |||||||||
| Operating costs and expenses: | ||||||||||||
| Operating costs | 195,779 | 165,969 | 142,525 | |||||||||
| Depletion, depreciation and amortization (note 9) | 149,565 | 107,503 | 102,758 | |||||||||
| General and administrative expenses | 55,465 | 53,313 | 44,907 | |||||||||
| (Gain) loss on sale of assets | 486 | (111 | ) | 14 | ||||||||
| Unreimbursed litigation costs | — | (113 | ) | 1,401 | ||||||||
| Total operating costs and expenses | 401,295 | 326,561 | 291,605 | |||||||||
| Operating income | 21,700 | 153,809 | 63,743 | |||||||||
| Interest expense, net of capitalized interest (note 10) | 61,206 | 39,165 | 24,552 | |||||||||
| Loss on interest rate swaps (note 5) | 1,101 | 2,777 | 4,490 | |||||||||
| Other expense (income), net | 48 | (19 | ) | (8 | ) | |||||||
| Income (loss) before taxes | (40,655 | ) | 111,886 | 34,709 | ||||||||
| Income tax expense (benefit) (note 12) | 84 | 1,188 | (204 | ) | ||||||||
| Net income (loss) | (40,739 | ) | 110,698 | 34,913 | ||||||||
| Less: Net income attributable to noncontrolling interest (note 16) | (62 | ) | (201 | ) | (162 | ) | ||||||
| Net income (loss) attributable to the partnership | $ | (40,801 | ) | $ | 110,497 | $ | 34,751 | |||||
| Basic net income (loss) per unit (note 15) | $ | (0.56 | ) | $ | 1.80 | $ | 0.61 | |||||
| Diluted net income (loss) per unit (note 15) | $ | (0.56 | ) | $ | 1.79 | $ | 0.61 | |||||
The accompanying notes are an integral part of these consolidated financial statements.
F-5
BreitBurn Energy Partners L.P. and Subsidiaries
Consolidated Statements of Cash Flows
| Year Ended December 31, | ||||||||||||
| Thousands of dollars | 2012 | 2011 | 2010 | |||||||||
| Cash flows from operating activities | ||||||||||||
| Net income (loss) | $ | (40,739 | ) | $ | 110,698 | $ | 34,913 | |||||
| Adjustments to reconcile to cash flow from operating activities: | ||||||||||||
| Depletion, depreciation and amortization | 149,565 | 107,503 | 102,758 | |||||||||
| Unit based compensation expense | 22,266 | 22,043 | 20,422 | |||||||||
| Gain on derivative instruments | (4,479 | ) | (78,890 | ) | (30,622 | ) | ||||||
| Derivative instrument settlements | 84,615 | 17,455 | 63,738 | |||||||||
| Prepaid premiums on derivative instruments | (30,043 | ) | — | — | ||||||||
| Settlement payments on terminated derivative instruments | (2,479 | ) | (36,779 | ) | — | |||||||
| Income from equity affiliates, net | 487 | 210 | 450 | |||||||||
| Deferred income taxes | (316 | ) | 714 | (403 | ) | |||||||
| Amortization of intangibles | — | — | 495 | |||||||||
| (Gain) loss on sale of assets | 486 | (111 | ) | 14 | ||||||||
| Other | 4,472 | (312 | ) | 3,528 | ||||||||
| Changes in net assets and liabilities | ||||||||||||
| Accounts receivable and other assets | 6,759 | (17,833 | ) | 11,552 | ||||||||
| Inventory | 1,638 | 2,597 | (1,498 | ) | ||||||||
| Net change in related party receivables and payables | 2,832 | 100 | (15,218 | ) | ||||||||
| Accounts payable and other liabilities | (3,282 | ) | 1,148 | (8,107 | ) | |||||||
| Net cash provided by operating activities | 191,782 | 128,543 | 182,022 | |||||||||
| Cash flows from investing activities (a) | ||||||||||||
| Capital expenditures | (135,932 | ) | (78,107 | ) | (66,947 | ) | ||||||
| Proceeds from sale of assets | 1,129 | 2,339 | 337 | |||||||||
| Property acquisitions | (562,356 | ) | (338,805 | ) | (1,676 | ) | ||||||
| Net cash used in investing activities | (697,159 | ) | (414,573 | ) | (68,286 | ) | ||||||
| Cash flows from financing activities | ||||||||||||
| Issuance of common units, net | 370,234 | 99,443 | — | |||||||||
| Distributions | (132,420 | ) | (102,686 | ) | (65,197 | ) | ||||||
| Proceeds from issuance of long-term debt, net | 1,502,885 | 661,500 | 1,047,992 | |||||||||
| Repayments of long-term debt | (1,223,000 | ) | (369,500 | ) | (1,079,000 | ) | ||||||
| Change in bank overdraft | (3,176 | ) | 2,636 | 1,025 | ||||||||
| Debt issuance costs | (9,967 | ) | (3,665 | ) | (20,692 | ) | ||||||
| Net cash provided by (used in) financing activities | 504,556 | 287,728 | (115,872 | ) | ||||||||
| Increase (decrease) in cash | (821 | ) | 1,698 | (2,136 | ) | |||||||
| Cash beginning of period | 5,328 | 3,630 | 5,766 | |||||||||
| Cash end of period | $ | 4,507 | $ | 5,328 | $ | 3,630 | ||||||
(a) Non-cash investing activities in 2012 were $56 million, reflecting the issuance of approximately 3 million Common Units for the AEO Acquisition.
The accompanying notes are an integral part of these consolidated financial statements.
F-6
BreitBurn Energy Partners L.P. and Subsidiaries
Consolidated Statements of Partners’ Equity
| Thousands | Common Units | Partners' Equity | |||||
| Balance, December 31, 2009 | 52,784 | $ | 1,228,373 | ||||
| Distributions | — | (61,161 | ) | ||||
| Distributions paid on unissued units under incentive plans | — | (4,020 | ) | ||||
| Units issued under incentive plans | 1,173 | 7,677 | |||||
| Unit-based compensation | — | 3,183 | |||||
| Net income attributable to the partnership | — | 34,751 | |||||
| Balance, December 31, 2010 | 53,957 | $ | 1,208,803 | ||||
| Distributions | — | (97,590 | ) | ||||
| Distributions paid on unissued units under incentive plans | — | (5,096 | ) | ||||
| Issuance of common units | 4,945 | 99,443 | |||||
| Units issued under incentive plans | 962 | 11,840 | |||||
| Unit-based compensation | — | (1,133 | ) | ||||
| Net income attributable to the partnership | — | 110,497 | |||||
| Balance, December 31, 2011 | 59,864 | $ | 1,326,764 | ||||
| Distributions | — | (127,748 | ) | ||||
| Distributions paid on unissued units under incentive plans | — | (4,672 | ) | ||||
| Sale of common units | 20,699 | 370,177 | |||||
| Common units issued in acquisition | 3,014 | 55,691 | |||||
| Units issued under incentive plans | 1,091 | 24,381 | |||||
| Unit-based compensation | — | (14,314 | ) | ||||
| Net loss attributable to the partnership | — | (40,801 | ) | ||||
| Other | — | 58 | |||||
| Balance, December 31, 2012 | 84,668 | $ | 1,589,536 | ||||
The accompanying notes are an integral part of these consolidated financial statements.
F-7
Notes to Consolidated Financial Statements
Note 1. Organization
We are a Delaware limited partnership formed on March 23, 2006. Our initial public offering was in October 2006. Pacific Coast Energy Company LP (“PCEC”), formerly BreitBurn Energy Company L.P., was our Predecessor.
Our general partner is BreitBurn GP, LLC, a Delaware limited liability company (the “General Partner”), also formed on March 23, 2006. The board of directors of our General Partner has sole responsibility for conducting our business and managing our operations. We conduct our operations through a wholly owned subsidiary, BreitBurn Operating L.P, (“BOLP”) and BOLP’s general partner BreitBurn Operating GP, LLC (“BOGP”). We own all of the ownership interests in BOLP and BOGP.
Our wholly owned subsidiary, BreitBurn Management, manages our assets and performs other administrative services for us such as accounting, corporate development, finance, land administration, legal and engineering. See Note 6 for information regarding our relationship with BreitBurn Management. Our wholly owned subsidiary, BreitBurn Finance Corporation, was incorporated on June 1, 2009 under the laws of the State of Delaware. BreitBurn Finance Corporation has no assets or liabilities. Its activities are limited to co-issuing debt securities and engaging in other activities incidental thereto. Our wholly owned subsidiary, BreitBurn Collingwood Utica LLC (“Utica”) holds certain non-producing oil and gas zones in the Collingwood-Utica shale play in Michigan and is classified as an unrestricted subsidiary under our credit facility.
During 2011, Quicksilver Resources Inc. (“Quicksilver”), a holder of 15.7 million of our limited partnership units (“Common Units”) sold 100% of its interest in the Partnership. Also in 2011, The Baupost Group, L.L.C. sold 4.4 million of our Common Units, disposing of 100% of its interest in the Partnership.
As of December 31, 2012, public unitholders owned 99.18% of our Common Units and BreitBurn Energy Corporation owned 0.7 million Common Units, representing a 0.82% limited partner interest. We own 100% of the General Partner, BreitBurn Management, BOLP, BreitBurn Finance Corporation and Utica.
Amendment Explanatory Note
We have revised our financial statements to amend the presentation of the items described below. The revisions, which we determined are not material, had no impact on the financial statements or footnotes except as described below:
(a) Revised the Consolidated Statements of Cash Flows to remove the row titled “Unrealized (gain) loss on commodity derivative instruments” under the header “Adjustments to reconcile to cash flow from operating activities” and replace it by a row titled “Gain on derivative instruments” that combines settled and mark-to-market gains on derivative instruments. Added a new row titled “Derivative instrument settlements” under the same header that includes cash attributable to commodity derivative instruments that settled during the periods. Added new rows titled “Prepaid premiums on derivative instruments” and “Settlement payments on terminated derivative instruments” under this same header to reflect actual payments made or received relating to these items during the periods. We also revised the accounts receivable and other assets amount for the year ended December 31, 2012 from $(23.3) million to $6.8 million to remove the prepaid premiums from the balance. The revisions to the cash flow presentation had no impact on “Net cash provided by operating activities,” “Net cash used in investing activities” or “Net cash provided by (used in) financing activities.”
(b) Note 4 “Acquisitions” - revised the pro forma revenue and net income (loss) table - (i) revised the years ended December 31, 2011 and 2012 to include aggregated pro forma information for our 2012 insignificant subsidiary acquisitions; and (ii) corrected the year ended December 31, 2010 pro forma information. The impact of the revision on pro forma revenue and net income was $63.9 million and $25.3 million for the year ended December 31, 2012, respectively, $63.5 million and $10.9 million for the year ended December 31, 2011, respectively, and $(110.2) million and $(75.7) million for the year ended December 31, 2010, respectively.
F-8
(c) Note 5 “Financial Instruments and Fair Value Measurements” - revised the tables presenting gain and loss on derivative instruments not designated as hedging instruments to remove the “Realized gain (loss)” and “Unrealized gain (loss)” rows and combine these amounts in a new row titled “Net gain (loss).” Revised the tables setting forth a reconciliation of changes in fair value of our derivative instruments classified as Level 3 to remove the “Realized gain” and “Unrealized loss” rows and combine these amounts in a new row titled “Gain (loss).”
Except as described above, we have not modified the presentation of the financial statements or updated any other part of the notes thereto.
2. Summary of Significant Accounting Policies
Principles of consolidation
The consolidated financial statements include our accounts and the accounts of our wholly owned subsidiaries. Investments in affiliated companies with a 20% or greater ownership interest, and in which we do not have control, are accounted for on the equity basis. Investments in affiliated companies with less than a 20% ownership interest, and in which we do not have control, are accounted for on the cost basis. Investments in which we own greater than 50% interest and in which we have control are consolidated. Investments in which we own less than a 50% interest but are deemed to have control, or where we have a variable interest in an entity in which we will absorb a majority of the entity’s expected losses or receive a majority of the entity’s expected residual returns or both, however, are consolidated. The effects of all intercompany transactions have been eliminated.
Basis of presentation
Our financial statements are prepared in conformity with U.S. generally accepted accounting principles. Certain items included in the prior year financial statements were reclassified to conform to the 2012 presentation.
We recorded out-of-period adjustments in the fourth quarter and during 2012 that resulted in net reductions of net income of $2.1 million and $1.0 million, respectively. The adjustments primarily related to a correction of property tax expense and depreciation, depletion and amortization (“DD&A”). We concluded that the impact of these corrections was not material to the current year or any prior period.
Use of estimates
The preparation of financial statements in conformity with accounting principles generally accepted in the United States of America requires management to make estimates and assumptions that affect the reported amounts of assets and liabilities and disclosure of contingent assets and liabilities at the date of the financial statements and the reported amounts of revenues and expenses during the reporting period. Actual results could differ from those estimates. The financial statements are based on a number of significant estimates including fair value of derivative instruments, unit based compensation and oil and gas reserve quantities, which are the basis for the calculation of DD&A, asset retirement obligations and impairment of oil and gas properties.
Business segment information
We report in one segment because our oil and gas operating areas have similar economic characteristics. We acquire, exploit, develop and produce oil and natural gas in the United States. Corporate management administers all properties as a whole rather than as discrete operating segments. Operational data is tracked by area; however, financial performance is measured as a single enterprise and not on an area-by-area basis. Allocation of capital resources is employed on a project-by-project basis across our entire asset base to maximize profitability without regard to individual areas.
Revenue recognition
Revenues associated with sales of our crude oil and natural gas are recognized when title passes from us to our customer. Revenues from properties in which we have an interest with other partners are recognized on the basis of our working interest (“entitlement” method of accounting). We generally market most of our natural gas production from our operated properties and pay our partners for their working interest shares of natural gas production sold. As a result, we have no material natural gas producer imbalance positions.
Accounts receivable
Our accounts receivable are primarily from purchasers of crude oil and natural gas and counterparties to our financial instruments. Crude oil receivables are generally collected within 30 days after the end of the month. Natural gas receivables are generally collected within 60 days after the end of the month. We review all outstanding accounts receivable balances and record a reserve for amounts that we expect will not be fully recovered. Actual balances are not applied against the reserve until substantially all collection efforts have been exhausted. At December 31, 2012 and 2011, we had an allowance for doubtful accounts receivable of $0.6 million and $0.2 million, respectively.
The settlement costs related to the Quicksilver lawsuit and the associated legal expenses were $13.0 million and approximately $8.7 million, respectively, of which we collected approximately $10.0 million from our insurance companies during the year ended December 31, 2010. Of the costs incurred in connection with the lawsuit, $1.4 million was estimated to be not recoverable from the insurance companies and is reflected as an expense in unreimbursed litigation costs on the consolidated statements of operations for the year ended December 31, 2010. The receivable at December 31, 2010 was $10.3 million. In 2011, we reduced the previously recorded $1.4 million provision by $0.1 million in anticipation of the final insurance recovery payment of $10.4 million, which we received in January 2012. At December 31, 2011, accounts receivable included $10.4 million due from our insurance companies related to the lawsuit.
Inventory
Oil inventories are carried at the lower of cost to produce or market price. We match production expenses with crude oil sales. Production expenses associated with unsold crude oil inventory are recorded as inventory.
Investments in equity affiliates
Income from equity affiliates is included as a component of operating income, as the operations of these affiliates are associated with the processing and transportation of our natural gas production.
Property, plant and equipment
Oil and gas properties
We follow the successful efforts method of accounting. Lease acquisition and development costs (tangible and intangible) incurred relating to proved oil and gas properties are capitalized. Delay and surface rentals are charged to expense as incurred. Dry hole costs incurred on exploratory wells are expensed. Dry hole costs associated with developing proved fields are capitalized. Geological and geophysical costs related to exploratory operations are expensed as incurred.
Upon sale or retirement of proved properties, the cost thereof and the accumulated depletion, depreciation and amortization are removed from the accounts and any gain or loss is recognized in the statement of operations. Maintenance and repairs are charged to operating expenses. DD&A of proved oil and gas properties, including the estimated cost of future abandonment and restoration of well sites and associated facilities, are generally computed on a field-by-field basis where applicable and recognized using the units of production method net of any anticipated proceeds from equipment salvage and sale of surface rights. Other gathering and processing facilities are recorded at cost and are depreciated using straight line, generally over 20 years.
F-10
We capitalize interest costs to oil and gas properties on expenditures made in connection with drilling and completion of new oil and natural gas wells. Interest is capitalized only for the period that such activities are in progress. Interest is capitalized using a weighted average interest rate based on our outstanding borrowings. These capitalized costs are included with intangible drilling costs and amortized using the units of production method. During 2012, 2011 and 2010, interest of $0.1 million, $0.1 million and $0.3 million, respectively, was capitalized and included in our capital expenditures.
Non-oil and gas assets
Buildings and non-oil and gas assets are recorded at cost and depreciated using the straight-line method over their estimated useful lives, which range from three to 10 years.
Oil and natural gas reserve quantities
Reserves and their relation to estimated future net cash flows impact our depletion and impairment calculations. As a result, adjustments to depletion are made concurrently with changes to reserve estimates. We disclose reserve estimates, and the projected cash flows derived from these reserve estimates, in accordance with the Securities and Exchange Commission (the “SEC”) guidelines. The independent engineering firms adhere to the SEC definitions when preparing their reserve reports.
Asset retirement obligations
We have significant obligations to plug and abandon oil and natural gas wells and related equipment at the end of oil and natural gas production operations. The fair value of a liability for an asset retirement obligation (“ARO”) is recorded when there is a legal obligation associated with the retirement of a tangible long-lived asset and the liability can be reasonably estimated. Over time, changes in the present value of the liability are accreted and recorded on the depletion, depreciation and amortization on the consolidated statements of operations. The capitalized asset costs are depreciated over the useful lives of the corresponding asset. Recognized liability amounts are based upon future retirement cost estimates and incorporate many assumptions such as: (1) expected economic recoveries of crude oil and natural gas, (2) time to abandonment, (3) future inflation rates and (4) the risk free rate of interest adjusted for our credit costs. Future revisions to ARO estimates will impact the present value of existing ARO liabilities and corresponding adjustments will be made to the capitalized asset retirement costs balance.
Impairment of assets
Long-lived assets with recorded values that are not expected to be recovered through future cash flows are written down to estimated fair value. A long-lived asset is tested for impairment periodically and when events or circumstances indicate that its carrying value may not be recoverable. The carrying value of a long-lived asset is not recoverable if it exceeds the sum of the undiscounted cash flows expected to result from the use and eventual disposition of the asset. If the carrying value exceeds the sum of the undiscounted cash flows, an impairment loss equal to the amount by which the carrying value exceeds the fair value of the asset is recognized. Fair value is generally determined from estimated discounted future net cash flows. For purposes of performing an impairment test, the undiscounted future cash flows are based on total proved and risk-adjusted probable and possible reserves, and are forecast using five-year NYMEX forward strip prices at the end of the period and escalated along with expenses and capital starting year six and thereafter at 2.5% per year. For impairment charges, the associated property’s expected future net cash flows are discounted using a weighted average cost of capital which approximated 10% at December 31, 2012. Reserves are calculated based upon reports from third party engineers adjusted for acquisitions or other changes occurring during the year as determined to be appropriate in the good faith judgment of management. Unproved properties are assessed for impairment and if considered impaired are charged to expense when such impairment is deemed to have occurred.
We assess our long-lived assets for impairment generally on a field-by-field basis where applicable. See Note 9 for a discussion of our impairments and price related depletion and depreciation adjustments.
F-11
Debt issuance costs
The costs incurred to obtain financing have been capitalized. Debt issuance costs are amortized using the straight-line method over the term of the related debt. Use of the straight-line method does not differ materially from the “effective interest” method of amortization. Amortization of debt issuance costs for the year ended December 31, 2010 included a $1.5 million write-off of debt issuance costs as a result of the reduced borrowing base under our credit facility.
Equity-based compensation
BreitBurn Management has various forms of equity-based compensation outstanding under employee compensation plans that are described more fully in Note 17. Awards classified as equity are valued on the grant date and are recognized as compensation expense over the vesting period. We recognize equity-based compensation costs on a straight line basis over the annual vesting periods. Awards classified as liabilities are revalued at each reporting period and changes in the fair value of the options are recognized as compensation expense over the vesting schedules of the awards.
Fair market value of financial instruments
The carrying amount of our cash, accounts receivable, accounts payable, related party receivables and payables, and accrued expenses approximate their respective fair value due to the relatively short term of the related instruments. The carrying amount of long-term debt under our credit facility approximates fair value; however, changes in the credit markets may impact our ability to enter into future credit facilities at similar terms. See Note 10 for the fair value of our Senior Notes.
Accounting for business combinations
We account for all business combinations using the acquisition method. Under the acquisition method of accounting, a business combination is accounted for at a purchase price based upon the fair value of the consideration given, whether in the form of cash, assets, equity or the assumption of liabilities. The assets and liabilities acquired are measured at their fair values, and the purchase price is allocated to the assets and liabilities based upon these fair values. The excess of the fair value of assets acquired and liabilities assumed over the cost of an acquired entity, if material, is recognized as a gain at the time of acquisition. All purchase price allocations are finalized within one year from the acquisition date. We have not recognized any goodwill from any business combinations.
Concentration of credit risk
We maintain our cash accounts primarily with a single bank and invest cash in money market accounts, which we believe to have minimal risk. At times, such balances may be in excess of the Federal Insurance Corporation insurance limit. As operator of jointly owned oil and gas properties, we sell oil and gas production to U.S. oil and gas purchasers and pay vendors on behalf of joint owners for oil and gas services. We periodically monitor our major purchasers’ credit ratings. We enter into commodity and interest rate derivative instruments. Our derivative counterparties are all lenders under our credit facility and we periodically monitor their credit ratings.
Derivatives
Financial Accounting Standards Board (“FASB”) Accounting Standards establish accounting and reporting requirements for derivative instruments, including certain derivative instruments embedded in other contracts, and hedging activities. These standards require recognition of all derivative instruments as assets or liabilities on our balance sheet and measurement of those instruments at fair value. The accounting treatment of changes in fair value is dependent upon whether or not a derivative instrument is designated as a hedge and if so, the type of hedge. We currently do not designate any of our derivatives as hedges for financial accounting purposes. Gains and losses on derivative instruments not designated as hedges are currently included in earnings. The resulting cash flows are reported as cash from operating activities.
F-12
Fair value measurement is based upon a hypothetical transaction to sell an asset or transfer a liability at the measurement date. The objective of fair value measurement is to determine the price that would be received in selling the asset or transferring the liability in an orderly transaction between market participants at the measurement date. If there is an active market for the asset or liability, the fair value measurement shall represent the price in that market whether the price is directly observable or otherwise obtained using a valuation technique.
Income taxes
Our subsidiaries are mostly partnerships or limited liability companies treated as partnerships for federal tax purposes with essentially all taxable income or loss being passed through to the members. As such, no federal income tax for these entities has been provided.
We have three wholly owned subsidiaries which are subject to corporate income taxes. Deferred income taxes are recorded under the asset and liability method. Where material, deferred income tax assets and liabilities are computed for differences between the financial statement and income tax bases of assets and liabilities that will result in taxable or deductible amounts in the future. Such deferred income tax asset and liability computations are based on enacted tax laws and rates applicable to periods in which the differences are expected to affect taxable income. Income tax expense is the tax payable or refundable for the period plus or minus the change during the period in deferred income tax assets and liabilities.
FASB Accounting Standards clarify the accounting for uncertainty in income taxes recognized in a company’s financial statements. A company can only recognize the tax position in the financial statements if the position is more-likely-than-not to be upheld on audit based only on the technical merits of the tax position. This accounting standard also provides guidance on thresholds, measurement, derecognition, classification, interest and penalties, accounting in interim periods, disclosure, and transition that is intended to provide better financial-statement comparability among different companies.
We performed evaluations as of December 31, 2012, 2011 and 2010 and concluded that there were no uncertain tax positions requiring recognition in our financial statements.
Net Income or loss per unit
FASB Accounting Standards require use of the “two-class” method of computing earnings per unit for all periods presented. The “two-class” method is an earnings allocation formula that determines earnings per unit for each class of Common Unit and participating security as if all earnings for the period had been distributed. Unvested restricted unit awards that earn non-forfeitable dividend rights qualify as participating securities and, accordingly, are included in the basic computation. Our unvested restricted phantom units (“RPUs”) and convertible phantom units (“CPUs”) participate in dividends on an equal basis with Common Units; therefore, there is no difference in undistributed earnings allocated to each participating security. Accordingly, our calculation is prepared on a combined basis and is presented as net income (loss) per Common Unit. See Note 15 for our earnings per Common Unit calculation.
Environmental expenditures
We review, on an annual basis, our estimates of the cleanup costs of various sites. When it is probable that obligations have been incurred and where a reasonable estimate of the cost of compliance or remediation can be determined, the applicable amount is accrued. For other potential liabilities, the timing of accruals coincides with the related ongoing site assessments. We do not discount these liabilities. At December 31, 2012, we had a $1.9 million environmental liability accrued that included cost estimates related to the maintenance of ground water monitoring wells associated with certain former well sites in Michigan that are no longer producing. At December 31, 2011, we had a $1.9 million environmental liability accrued.
F-13
3. Accounting Standards
In May 2011, the FASB issued an ASU to improve comparability between U.S. GAAP and International Financial Reporting Standards (“IFRS”) fair value measurement and disclosure requirements. This amendment changes the wording used to describe many of the requirements in U.S. GAAP for measuring fair value and for disclosing information about fair value measurements, particularly for Level 3 fair value measurements. For many of the requirements, the FASB does not intend for the amendments to result in a change in the application of the fair value measurement and disclosure requirements. Some of the amendments clarify the FASB's intent about the application of existing fair value measurement requirements. Other amendments change a particular principle or requirement for measuring fair value or for disclosing information about fair value measurements. This ASU is effective for interim and annual periods beginning after December 15, 2011. This ASU requires prospective application. We adopted this ASU on January 1, 2012. The adoption of this ASU, which expanded our fair value disclosures, did not have a material impact on our financial position, results of operations or cash flows.
In December 2011, the FASB issued an ASU which requires companies to disclose information about financial instruments that have been offset and related arrangements to enable users of its financial statements to understand the effect of those arrangements on its financial position. Companies will be required to provide both net (offset amounts) and gross information in the notes to the financial statements for relevant assets and liabilities that are offset. This update is effective for interim and annual periods beginning on or after January 1, 2013 and requires retrospective application. We do not expect the adoption of this ASU to have a material impact on our financial position, results of operations or cash flows.
4. Acquisitions
Our purchase price allocations are based on discounted cash flows, quoted market prices and estimates made by management, the most significant assumptions related to the estimated fair values assigned to oil and gas properties with proved reserves. To estimate the fair values the properties, estimates of oil and gas reserves were prepared by management in consultation with independent engineers. We apply estimated future prices to the estimated reserve quantities acquired, and estimate future operating and development costs to arrive at estimates of future net revenues. For estimated proved reserves, the future net revenues are discounted using a weighted average cost of capital which approximated 10% at December 31, 2012.
We conducted assessments of net assets acquired and recognized amounts for identifiable assets acquired and liabilities assumed at their estimated acquisition date fair values, while transaction and integration costs associated with the acquisitions were expensed as incurred.
The fair value measurements of assets acquired and liabilities assumed are based on inputs that are not observable in the market and therefore represent Level 3 inputs. The fair values of oil and natural gas properties and asset retirement
obligations were measured using valuation techniques that convert future cash flows to a single discounted amount.
Significant inputs to the valuation of oil and natural gas properties include estimates of reserves, future operating and
development costs, future commodity prices, estimated future cash flow and a market-based weighted average cost of capital rate. These inputs require significant judgments and estimates by management at the time of the valuation and are subject to change.
Our acquisitions were accounted for using the acquisition method of accounting.
F-14
AEO Acquisition
On November 30, 2012, we completed the acquisition of principally oil properties from American Energy Operations, Inc. (“AEO”) located in the Belridge Field in Kern County, California (the “AEO Acquisition”), with an effective date of November 1, 2012, for approximately $38 million in cash and 3 million Common Units. We used borrowings under our credit facility to fund the cash portion of the AEO Acquisition. The preliminary purchase price of $38 million in cash and $56 million in Common Units was allocated to the assets acquired and liabilities assumed as follows:
| Thousands of dollars | AEO | |||
| Oil and gas properties | $ | 97,814 | ||
| Asset retirement obligation | (4,014 | ) | ||
| Net assets acquired | $ | 93,800 | ||
We will finalize the purchase price allocation within one year of the acquisition date. Acquisition-related costs for the AEO Acquisition were $0.4 million and were recorded in general and administrative expenses on the consolidated statements of operations. In 2012, we recorded $2.6 million in sales revenue and $0.6 million in lease operating expenses, including production and property taxes, from the properties acquired in the AEO Acquisition.
Permian Basin Acquisitions
On July 2, 2012, we completed acquisitions of oil and natural gas properties located in the Permian Basin in Texas from Element Petroleum, LP (“Element”) for approximately $148 million and from CrownRock, L.P. (“CrownRock”) for approximately $70 million. On December 28, 2012, we completed the acquisition of additional oil and natural gas properties in the Permian Basin in Texas from CrownRock for approximately $167 million (the “CrownRock II Acquisition”) and from Lynden USA Inc. (“Lynden”) for approximately $25 million (the “Lynden Acquisition”). On December 28, 2012, we also completed the acquisition from Piedra Energy I, LLC of additional net working interests in six producing properties (acquired from Element and CrownRock in July 2012) and interests in 180 proved undeveloped drilling locations for approximately $10 million (the “Piedra Acquisition”). These purchase prices are subject to customary post-closing adjustments. We used borrowings under our credit facility to fund these acquisitions. The preliminary purchase prices for the 2012 Permian Basin acquisitions (the “Permian Basin Acquisitions”) were primarily allocated to oil and gas properties, and included $52.5 million of unproved oil and gas properties.
We will finalize the purchase price allocations within one year of the acquisition dates. Acquisition-related costs for the Permian Basin Acquisitions were $1.2 million and were recorded in general and administrative expenses on the consolidated statements of operations. Revenues and expenses from the Permian Basin Acquisitions are reflected in our consolidated statements of operations beginning on the completion dates of the respective acquisitions. In 2012, we recorded $19.1 million in sales revenue and $3.6 million in lease operating expenses, including production and property taxes, from the Permian Basin Acquisitions.
NiMin Acquisition
On June 28, 2012, we completed the acquisition of oil properties located in Park County in the Big Horn Basin of
Wyoming from Legacy Energy, Inc., a wholly-owned subsidiary of NiMin, with an effective date of April 1, 2012 (the
“NiMin Acquisition”). We used borrowings under our credit facility to fund the acquisition. The final purchase price for this acquisition was approximately $95 million in cash, which was primarily allocated to oil and gas properties (including $36.2 million in unproved properties) and included $1.7 million of ARO. Acquisition-related costs for the NiMin Acquisition were $0.5 million and were reflected in general and administrative expenses on the consolidated statements of operations. Revenues and expenses from the NiMin properties are reflected in our consolidated statements of operations beginning June 28, 2012. In 2012, we recorded $6.6 million in sales revenue and $3.2 million in lease operating expenses, including production and property taxes, from the properties acquired in the NiMin acquisition.
F-15
2011 Acquisitions
On July 28, 2011, we completed the acquisition of crude oil properties in the Powder River Basin in eastern Wyoming with an effective date of July 1, 2011 (the “Greasewood Acquisition”). We used borrowings under our credit facility to fund the Greasewood Acquisition. The purchase price for the acquisition was approximately $57 million in cash, which was primarily allocated to oil properties. Acquisition-related costs for the Greasewood Acquisition were $0.1 million and were reflected in general and administrative expenses on the consolidated statements of operations. In 2011, we recorded $7.4 million in sales revenue and $1.9 million in lease operating expenses, including production and property taxes, from the properties acquired in the Greasewood Acquisition.
On October 6, 2011, we completed the acquisition of oil and gas properties from Cabot Oil & Gas Corporation located primarily in the Evanston and Green River Basins in southwestern Wyoming (the “Cabot Acquisition”), with an effective date of September 1, 2011. We used borrowings under our credit facility to fund the Cabot Acquisition. The assets acquired also include limited acreage and non-operated oil and gas interests in Colorado and Utah.
The final purchase price of $281 million was allocated to the assets acquired and liabilities assumed as follows:
| Thousands of dollars | Cabot | |||
| Accounts receivable | $ | 767 | ||
| Oil and gas properties | 294,500 | |||
| Accounts payable | (197 | ) | ||
| Revenue and royalties payable | (798 | ) | ||
| Asset retirement obligation | (10,845 | ) | ||
| Other long-term liabilities | (2,820 | ) | ||
| $ | 280,607 | |||
Acquisition-related costs for the Cabot Acquisition were $0.6 million and were recorded in general and administrative expenses on the consolidated statements of operations. In 2011, we recorded $9.1 million in sales revenue and $3.9 million in lease operating expenses, including production and property taxes, from the properties acquired in the Cabot Acquisition.
F-16
2012 and 2011 Acquisitions Pro Forma
The following unaudited pro forma financial information presents a summary of our combined statements of operations for the years ended December 31, 2012, 2011 and 2010, assuming the AEO Acquisition, the Nimin Acquisition and the 2012 acquisitions from Element Petroleum, LP, CrownRock, L.P., Piedra Energy I, LLC and Lynden USA Inc. had been completed on January 1, 2011 and the Cabot Acquisition had been completed on January 1, 2010. The pro forma results for the 2012 acquisitions are reflected in the years ended December 31, 2012 and 2011. The pro forma results for the 2011 Cabot Acquisition are reflected in the years ended December 31, 2011 and 2010. The pro forma results reflect the results of combining our statement of operations with the results of operations from all of our 2012 acquisitions and the 2011 Cabot acquisition, adjusted for (1) the assumption of ARO and accretion expense for the properties acquired, (2) depletion and depreciation expense applied to the adjusted purchase price of the properties acquired, and (3) interest expense on additional borrowings necessary to finance the acquisitions, including the amortization of debt issuance costs. The pro forma financial information is not necessarily indicative of the results of operations if the 2012 acquisitions had been effective January 1, 2011 and the 2011 Cabot acquisition has been effective January 1 2010.
| Pro Forma Year Ended December 31, | ||||||||||||
| Thousands of dollars, except per unit amounts | 2012 | 2011 | 2010 | |||||||||
| Revenues | $ | 515,885 | $ | 615,310 | $ | 409,897 | ||||||
| Net income (loss) attributable to partnership | (202 | ) | 146,992 | 44,498 | ||||||||
| Net income (loss) per unit: | ||||||||||||
| Basic | $ | — | $ | 1.71 | $ | 0.78 | ||||||
| Diluted | $ | — | $ | 1.71 | $ | 0.78 | ||||||
5. Financial Instruments and Fair Value Measurements
Our risk management programs are intended to reduce our exposure to commodity prices and interest rates and to assist with stabilizing cash flows.
Commodity Activities
Due to the historical volatility of crude oil and natural gas prices, we have entered into various derivative instruments to manage exposure to volatility in the market price of crude oil and natural gas to achieve more predictable cash flows. We use swaps, collars and options for managing risk relating to commodity prices. All contracts are settled with cash and do not require the delivery of physical volumes to satisfy settlement. While this strategy may result in us having lower revenues than we would otherwise have if we had not utilized these instruments in times of higher oil and natural gas prices, management believes that the resulting reduced volatility of prices and cash flow is beneficial. While our commodity price risk management program is intended to reduce our exposure to commodity prices and assist with stabilizing cash flow and distributions, to the extent we have hedged a significant portion of our expected production and the cost for goods and services increases, our margins would be adversely affected.
The derivative instruments we utilize are based on index prices that may and often do differ from the actual crude oil and natural gas prices realized in our operations. These variations often result in a lack of adequate correlation to enable these derivative instruments to qualify for cash flow hedges under FASB Accounting Standards. Accordingly, we do not attempt to account for our derivative instruments as cash flow hedges for financial accounting purposes and instead recognize changes in the fair value immediately in earnings.
F-17
We had the following oil contracts in place at December 31, 2012:
| Year | ||||||||||||||||||||
| 2013 | 2014 | 2015 | 2016 | 2017 | ||||||||||||||||
| Oil Positions: | ||||||||||||||||||||
| Fixed Price Swaps - NYMEX WTI | ||||||||||||||||||||
| Hedged Volume (Bbl/d) | 4,677 | 3,814 | 4,189 | 1,611 | 222 | |||||||||||||||
| Average Price ($/Bbl) | $ | 90.34 | $ | 92.79 | $ | 96.61 | $ | 91.50 | $ | 88.12 | ||||||||||
| Fixed Price Swaps - ICE Brent | ||||||||||||||||||||
| Hedged Volume (Bbl/d) | 4,200 | 3,800 | 2,300 | 1,800 | 297 | |||||||||||||||
| Average Price ($/Bbl) | $ | 97.57 | $ | 97.26 | $ | 97.18 | $ | 95.13 | $ | 97.53 | ||||||||||
| Collars - NYMEX WTI | ||||||||||||||||||||
| Hedged Volume (Bbl/d) | 500 | 1,000 | 1,000 | — | — | |||||||||||||||
| Average Floor Price ($/Bbl) | $ | 77.00 | $ | 90.00 | $ | 90.00 | $ | — | $ | — | ||||||||||
| Average Ceiling Price ($/Bbl) | $ | 103.10 | $ | 112.00 | $ | 113.50 | $ | — | $ | — | ||||||||||
| Collars - ICE Brent | ||||||||||||||||||||
| Hedged Volume (Bbl/d) | — | — | 500 | 500 | — | |||||||||||||||
| Average Floor Price ($/Bbl) | $ | — | $ | — | $ | 90.00 | $ | 90.00 | $ | — | ||||||||||
| Average Ceiling Price ($/Bbl) | $ | — | $ | — | $ | 109.50 | $ | 101.25 | $ | — | ||||||||||
| Puts - NYMEX WTI | ||||||||||||||||||||
| Hedged Volume (Bbl/d) | 1,000 | 500 | 500 | 1,000 | — | |||||||||||||||
| Average Price ($/Bbl) | $ | 90.00 | $ | 90.00 | $ | 90.00 | $ | 90.00 | $ | — | ||||||||||
| Total: | ||||||||||||||||||||
| Hedged Volume (Bbl/d) | 10,377 | 9,114 | 8,489 | 4,911 | 519 | |||||||||||||||
| Average Price ($/Bbl) | $ | 92.59 | $ | 94.20 | $ | 95.21 | $ | 92.37 | $ | 93.50 | ||||||||||
The following derivative transactions are included in the table above. In July 2012, we paid premiums of $2.5 million for crude oil swap contracts to hedge a total of 0.5 million barrels associated with the NiMin Acquisition at NYMEX WTI prices, ranging from $104.80 per Bbl in 2012 to $88.45 per Bbl in 2017. In July 2012, we also paid premiums of $2.6 million for crude oil swap contracts to hedge a total of 0.6 million barrels associated with the Element and CrownRock acquisitions at NYMEX WTI prices, ranging from $98.35 per Bbl in 2012 to $87.80 per Bbl in 2017. In August 2012, we entered into a crude oil put contract, hedging a total of 0.2 million barrels from January 1, 2013 to December 31, 2013, at a NYMEX WTI price of $90.00 per Bbl, for which we paid premiums of approximately $1.3 million. In October 2012, we entered into crude oil swap contracts hedging a total of 0.5 million barrels from January 1, 2013 to June 30, 2017, at an ICE Brent price of $102.00 per Bbl, for which we paid a premium of approximately $3.7 million. In December 2012, we entered into crude oil swap and put contracts hedging a total of 1.3 million barrels from January 1, 2013 through December 31, 2016, at a weighted average NYMEX WTI prices of $90.00 per Bbl, for which we paid premiums of approximately $13.0 million.
F-18
We had the following natural gas contracts in place at December 31, 2012:
| Year | ||||||||||||||||||||
| 2013 | 2014 | 2015 | 2016 | 2017 | ||||||||||||||||
| Gas Positions: | ||||||||||||||||||||
| Fixed Price Swaps - MichCon City-Gate | ||||||||||||||||||||
| Hedged Volume (MMBtu/d) | 37,000 | 7,500 | 7,500 | 7,000 | — | |||||||||||||||
| Average Price ($/MMBtu) | $ | 6.50 | $ | 6.00 | $ | 6.00 | $ | 4.51 | $ | — | ||||||||||
| Fixed Price Swaps - Henry Hub | ||||||||||||||||||||
| Hedged Volume (MMBtu/d) | 21,100 | 38,600 | 43,200 | 15,700 | 1,571 | |||||||||||||||
| Average Price ($/MMBtu) | $ | 4.76 | $ | 4.80 | $ | 4.83 | $ | 4.20 | $ | 4.45 | ||||||||||
| Puts - Henry Hub | ||||||||||||||||||||
| Hedged Volume (MMBtu/d) | — | 6,000 | 1,500 | — | — | |||||||||||||||
| Average Price ($/MMBtu) | $ | — | $ | 5.00 | $ | 5.00 | $ | — | $ | — | ||||||||||
| Total: | ||||||||||||||||||||
| Hedged Volume (MMBtu/d) | 58,100 | 52,100 | 52,200 | 22,700 | 1,571 | |||||||||||||||
| Average Price ($/MMBtu) | $ | 5.87 | $ | 4.99 | $ | 5.00 | $ | 4.30 | $ | 4.45 | ||||||||||
| Calls - Henry Hub | ||||||||||||||||||||
| Hedged Volume (MMBtu/d) | — | 30,000 | 15,000 | — | — | — | ||||||||||||||
| Average Price ($/MMBtu) | — | $ | 8.00 | $ | 9.00 | $ | — | $ | — | $ | — | |||||||||
| Deferred Premium ($/MMBtu) | $ | 0.08 | $ | 0.12 | $ | — | $ | — | $ | — | ||||||||||
Included in the above table are natural gas swap and put contracts we entered into in June 2012, hedging a total of 18,628 BBtu from January 1, 2014 to December 31, 2016 at a weighted average Henry Hub price of $4.30 per MMBtu, for which we paid premiums of approximately $7.0 million.
Interest Rate Activities
We are subject to interest rate risk associated with loans under our credit facility that bear interest based on floating rates. In order to mitigate our interest rate exposure, we had the following interest rate swaps, indexed to 1-month LIBOR, in place at December 31, 2011, to fix a portion of floating LIBOR-base debt under our credit facility. As of December 31, 2011, we had an interest rate swap covering January 1, 2012 to December 20, 2012 for $100 million at a fixed rate of 1.1550% and an interest rate swap covering January 20, 2012 to January 20, 2014 for $100 million at 2.4800%. The first contract expired in December 2012. In the fourth quarter of 2012, we terminated the second contract and realized a loss of $2.5 million. As of December 31, 2012, we had no interest rate swaps in place. We did not designate these interest rate derivatives as hedges for financial accounting purposes.
Fair Value of Financial Instruments
FASB Accounting Standards require disclosures about how and why an entity uses derivative instruments, how derivative instruments and related hedge items are accounted for, and how derivative instruments and related hedged items affect an entity’s financial position, financial performance, and cash flows. The required disclosures are detailed below.
F-19
Fair value of derivative instruments not designated as hedging instruments:
| Balance sheet location, thousands of dollars | Oil Commodity Derivatives | Natural Gas Commodity Derivatives | Interest Rate Derivatives | Commodity Derivatives Netting (a) | Total Financial Instruments | |||||||||||||||
| As of December 31, 2012 | ||||||||||||||||||||
| Assets | ||||||||||||||||||||
| Current assets - derivative instruments | $ | 4,270 | $ | 46,724 | $ | — | $ | (16,976 | ) | $ | 34,018 | |||||||||
| Other long-term assets - derivative instruments | 38,919 | 33,443 | — | (17,152 | ) | 55,210 | ||||||||||||||
| Total assets | 43,189 | 80,167 | — | (34,128 | ) | 89,228 | ||||||||||||||
| Liabilities | ||||||||||||||||||||
| Current liabilities - derivative instruments | (21,665 | ) | (936 | ) | 16,976 | (5,625 | ) | |||||||||||||
| Long-term liabilities - derivative instruments | (18,769 | ) | (2,776 | ) | 17,152 | (4,393 | ) | |||||||||||||
| Total liabilities | (40,434 | ) | (3,712 | ) | — | 34,128 | (10,018 | ) | ||||||||||||
| Net assets | $ | 2,755 | $ | 76,455 | $ | — | $ | — | $ | 79,210 | ||||||||||
| As of December 31, 2011 | ||||||||||||||||||||
| Assets | ||||||||||||||||||||
| Current assets - derivative instruments | $ | 11,795 | $ | 73,312 | $ | — | $ | (1,655 | ) | $ | 83,452 | |||||||||
| Other long-term assets - derivative instruments | 6,032 | 58,605 | — | (9,300 | ) | 55,337 | ||||||||||||||
| Total assets | 17,827 | 131,917 | — | (10,955 | ) | 138,789 | ||||||||||||||
| Liabilities | ||||||||||||||||||||
| Current liabilities - derivative instruments | (8,032 | ) | — | (2,504 | ) | 1,655 | (8,881 | ) | ||||||||||||
| Long-term liabilities - derivative instruments | (10,520 | ) | — | (1,864 | ) | 9,300 | (3,084 | ) | ||||||||||||
| Total liabilities | (18,552 | ) | — | (4,368 | ) | 10,955 | (11,965 | ) | ||||||||||||
| Net assets (liabilities) | $ | (725 | ) | $ | 131,917 | $ | (4,368 | ) | $ | — | $ | 126,824 | ||||||||
(a) Represents counterparty netting under derivative netting agreements - these contracts are reflected net on the balance sheet.
Gains and losses on derivative instruments not designated as hedging instruments:
| Location of gain/loss, thousands of dollars | Oil Commodity Derivatives (a) | Natural Gas Commodity Derivatives (a) | Interest Rate Derivatives (b) | Total Financial Instruments | ||||||||||||
| Year Ended December 31, 2012 | ||||||||||||||||
| Net gain (loss) | $ | (15,752 | ) | $ | 21,332 | $ | (1,101 | ) | $ | 4,479 | ||||||
| Year Ended December 31, 2011 | ||||||||||||||||
| Net gain (loss) | $ | 32 | $ | 81,635 | $ | (2,777 | ) | $ | 78,890 | |||||||
| Year Ended December 31, 2010 | ||||||||||||||||
| Net gain (loss) | $ | (50,987 | ) | $ | 86,099 | $ | (4,490 | ) | $ | 30,622 | ||||||
(a) Included in gain on commodity derivative instruments, net on the consolidated statements of operations.
(b) Included in loss on interest rate swaps on the consolidated statements of operations.
F-20
In the fourth quarter of 2011, in order to improve the effectiveness of our hedge portfolio, we terminated certain crude oil fixed price swaps at NYMEX WTI prices for a total termination cost of $36.8 million, included in 2011 realized losses, and entered into new crude oil fixed price swaps for the same volumes and periods at ICE Brent prices.
FASB Accounting Standards define fair value, establish a framework for measuring fair value and establish required disclosures about fair value measurements. They also establish a fair value hierarchy that prioritizes the inputs to valuation techniques into three broad levels based upon how observable those inputs are. We use valuation techniques that maximize the use of observable inputs and obtain the majority of our inputs from published objective sources or third party market participants. We incorporate the impact of nonperformance risk, including credit risk, into our fair value measurements. The fair value hierarchy gives the highest priority of Level 1 to unadjusted quoted prices in active markets for identical assets or liabilities and the lowest priority of Level 3 to unobservable inputs. We categorize our fair value financial instruments based upon the objectivity of the inputs and how observable those inputs are. The three levels of inputs are described further as follows:
Level 1 – Unadjusted quoted prices in active markets for identical assets or liabilities as of the reporting date. Level 2 – Inputs other than quoted prices that are included in Level 1. Level 2 includes financial instruments that are actively traded but are valued using models or other valuation methodologies. We consider the over the counter (“OTC”) commodity and interest rate swaps in our portfolio to be Level 2. Level 3 – Inputs that are not directly observable for the asset or liability and are significant to the fair value of the asset or liability. Level 3 includes financial instruments that are not actively traded and have little or no observable data for input into industry standard models. Certain OTC derivatives that trade in less liquid markets or contain limited observable model inputs are currently included in Level 3. As of December 31, 2012 and 2011, our Level 3 derivative assets and liabilities consisted entirely of OTC commodity put and call options.
Financial assets and liabilities that are categorized in Level 3 may later be reclassified to the Level 2 category at the point we are able to obtain sufficient binding market data. We had no transfers in or out of Levels 1, 2 or 3 during the years ended December 31, 2012, 2011 and 2010. Our policy is to recognize transfers between levels as of the end of the period.
Our Treasury/Risk Management group calculates the fair value of our commodity and interest rate swaps and options. We compare these fair value amounts to the fair value amounts that we receive from the counterparties on a monthly basis. Any differences are resolved and any required changes are recorded prior to the issuance of our financial statements.
The model we utilize to calculate the fair value of our Level 2 and Level 3 commodity derivative instruments is a standard option pricing model. Level 2 inputs to the option pricing models include fixed monthly commodity strike prices and volumes from each specific contract, commodity prices from commodity forward price curves, volatility and interest rate factors and time to expiry. Model inputs are obtained from our counterparties and third party data providers and are verified to published data where available (e.g., NYMEX). Additional inputs to our Level 3 derivatives include option volatility, forward commodity prices and risk-free interest rates for present value discounting. We use the standard swap contract valuation method to value our interest rate derivatives, and inputs include LIBOR forward interest rates, one-month LIBOR rates and risk-free interest rates for present value discounting.
Assumed credit risk adjustments, based on published credit ratings and credit default swap rates, are applied to our derivative instruments.
F-21
Our assessment of the significance of an input to its fair value measurement requires judgment and can affect the valuation of the assets and liabilities as well as the category within which they are classified. Financial assets and liabilities carried at fair value on a recurring basis are presented in the following tables:
| Thousands of dollars | Level 1 | Level 2 | Level 3 | Total | ||||||||||||
| As of December 31, 2012 | ||||||||||||||||
| Assets (liabilities) | ||||||||||||||||
| Oil | ||||||||||||||||
| Oil swaps | $ | — | $ | (12,413 | ) | $ | — | $ | (12,413 | ) | ||||||
| Oil collars | — | — | 4,024 | 4,024 | ||||||||||||
| Oil puts | — | — | 11,144 | 11,144 | ||||||||||||
| Natural gas | ||||||||||||||||
| Natural gas swaps | — | 74,782 | — | 74,782 | ||||||||||||
| Natural gas calls | — | — | (1,489 | ) | (1,489 | ) | ||||||||||
| Natural gas puts | — | — | 3,162 | 3,162 | ||||||||||||
| Net assets | $ | — | $ | 62,369 | $ | 16,841 | $ | 79,210 | ||||||||
| As of December 31, 2011 | ||||||||||||||||
| Assets (liabilities) | ||||||||||||||||
| Oil | ||||||||||||||||
| Oil swaps | $ | — | $ | (9,234 | ) | $ | — | $ | (9,234 | ) | ||||||
| Oil collars | — | — | 8,509 | 8,509 | ||||||||||||
| Natural gas | ||||||||||||||||
| Natural gas swaps | — | 94,868 | — | 94,868 | ||||||||||||
| Natural gas collars | — | — | 38,366 | 38,366 | ||||||||||||
| Natural gas calls | — | — | (1,317 | ) | (1,317 | ) | ||||||||||
| Interest rate | ||||||||||||||||
| Interest rate swaps | — | (4,368 | ) | — | (4,368 | ) | ||||||||||
| Net assets | $ | — | $ | 72,530 | $ | 45,558 | $ | 118,088 | ||||||||
The following table sets forth a reconciliation of changes in fair value of our derivative instruments classified as Level 3:
| Year End December 31, | ||||||||||||||||||||||||
| 2012 | 2011 | 2010 | ||||||||||||||||||||||
| Thousands of dollars | Oil | Natural Gas | Oil | Natural Gas | Oil | Natural Gas | ||||||||||||||||||
| Assets (a): | ||||||||||||||||||||||||
| Beginning balance | $ | 8,509 | $ | 37,049 | $ | 35,443 | $ | 50,810 | $ | 67,025 | $ | 35,450 | ||||||||||||
| Gain (loss) (b)(c) | (6,629 | ) | (39,155 | ) | (26,935 | ) | (13,761 | ) | (31,581 | ) | 15,360 | |||||||||||||
| Purchases (c)(d) | 13,288 | 3,778 | — | — | — | — | ||||||||||||||||||
| Ending balance | $ | 15,169 | $ | 1,672 | $ | 8,509 | $ | 37,049 | $ | 35,443 | $ | 50,810 | ||||||||||||
(a) We had no changes in fair value of our derivative instruments classified as Level 3 related to sales or issuances.
(b) For the years ended December 31, 2012, 2011, and 2010, includes cash settlements received on crude oil derivatives instruments of $14.1 million, $16.6 million and $21.2 million, respectively, and cash settlements received on natural gas derivative instruments of $42.4 million, $27.6 million and $5.6 million, respectively.
(c) Included in gain on commodity derivative instruments, net on consolidated statement of operations.
(d) Relates to natural gas put options entered into in June 2012.
F-22
For Level 3 derivatives measured at fair value on a recurring basis as of December 31, 2012, the significant unobservable inputs used in the fair value measurements were as follows:
| Fair Value at | Valuation | |||||||||
| Thousands of dollars | December 31, 2012 | Technique | Unobservable Input | Range | ||||||
| Oil options | $ | 15,169 | Option pricing model | Oil forward commodity prices | $86.78/Bbl - $110.46/Bbl | |||||
| Oil volatility | 20.56% - 27.53% | |||||||||
| Own credit risk | 5% | |||||||||
| Natural gas options | 1,672 | Option pricing model | Gas forward commodity prices | $3.35/MMBtu - $4.87/MMBtu | ||||||
| Gas volatility | 20.55% - 35.88% | |||||||||
| Own credit risk | 5% | |||||||||
| Total | $ | 16,841 | ||||||||
Credit and Counterparty Risk
Financial instruments which potentially subject us to concentrations of credit risk consist principally of derivatives and accounts receivable. Our derivatives expose us to credit risk from counterparties. As of December 31, 2012, our derivative counterparties were Barclays Bank PLC, Bank of Montreal, Citibank, N.A, Credit Suisse Energy LLC, Union Bank N.A, Wells Fargo Bank National Association, JP Morgan Chase Bank N.A., The Royal Bank of Scotland plc, The Bank of Nova Scotia, BNP Paribas, U.S Bank National Association, Toronto-Dominion Bank and Royal Bank of Canada. Our counterparties are all lenders under our Amended and Restated Credit Agreement. Our credit agreement is secured by our crude oil, natural gas and NGL reserves, so we are not required to post any collateral, and we conversely do not receive collateral from our counterparties. On all transactions where we are exposed to counterparty risk, we analyze the counterparty’s financial condition prior to entering into an agreement, establish limits, and monitor the appropriateness of these limits on an ongoing basis. We periodically obtain credit default swap information on our counterparties. Although we currently do not believe we have a specific counterparty risk with any party, our loss could be substantial if any of these parties were to fail to perform in accordance with the terms of the contract. This risk is managed by diversifying our derivatives portfolio. As of December 31, 2012, each of these financial institutions had an investment grade credit rating. As of December 31, 2012, our largest derivative asset balances were with Credit Suisse Energy LLC, Wells Fargo Bank National Association and The Royal Bank of Scotland plc which accounted for approximately 21%, 20% and 12% of our derivative asset balances, respectively.
6. Related Party Transactions
BreitBurn Management operates our assets and performs other administrative services for us such as accounting, corporate development, finance, land administration, legal and engineering. All of our employees, including our executives, are employees of BreitBurn Management. BreitBurn Management also operates the assets of PCEC, our Predecessor. In addition to a monthly fee for indirect expenses, BreitBurn Management charges PCEC for all direct expenses including incentive plan costs and direct payroll and administrative costs related to PCEC properties and operations. The monthly fees for 2011 and 2010 were set at $481,000 and $456,000, respectively.
On January 6, 2012, Pacific Coast Oil Trust (the “Trust”), which was formed by PCEC, filed a registration statement on Form S-1 with the SEC in connection with an initial public offering by the Trust. On May 8, 2012, the Trust completed its initial public offering (the “Trust IPO”). We have no direct or indirect ownership interest in PCEC or the Trust. As part of the Trust IPO, PCEC conveyed net profits interests in its oil and natural gas production from certain of its properties to the Trust in exchange for Trust units. PCEC’s assets consist primarily of producing and non-producing crude oil reserves located in Santa Barbara, Los Angeles and Orange Counties in California, including certain interests in the East Coyote and Sawtelle Fields. Prior to the Trust IPO, PCEC operated the East Coyote and Sawtelle Fields for the benefit of itself and us, who owned the non-operated interests in the East Coyote and Sawtelle Fields. PCEC owned an average working interest of approximately 5% in the two fields and held a reversionary interest in both fields.
F-23
On May 8, 2012, BreitBurn Management entered into the Third Amended and Restated Administrative Services Agreement (the “Third Amended and Restated Administrative Services Agreement”) with PCEC, pursuant to which the parties agreed to increase the monthly fee charged by BreitBurn Management to PCEC for indirect costs. For the first three months of 2012, the monthly fee charged by BreitBurn Management to PCEC for indirect costs was set at $571,000, and the two parties agreed to increase that monthly fee to $700,000, effective April 1, 2012. In connection with the PCEC transactions and the Third Amended and Restated Administrative Services Agreement, PCEC also paid us a $250,000 fee.
In connection with the Trust IPO, we, BreitBurn GP, LLC and BreitBurn Management entered into the First Amendment to Omnibus Agreement, dated as of May 8, 2012, with PCEC, Pacific Coast Energy Holdings LLC, formerly known as BreitBurn Energy Holdings, LLC, and PCEC (GP) LLC, formerly known as BEC (GP) LLC (the “First Amendment to Omnibus Agreement”). Pursuant to the First Amendment to Omnibus Agreement, the parties agreed to amend the Omnibus Agreement among the parties, dated as of August 26, 2008 (the “Omnibus Agreement”), to remove Article III of the Omnibus Agreement, which contained our right of first offer with respect to the sale of assets by PCEC and its affiliates.
At December 31, 2012 and December 31, 2011, we had net current receivables of $1.2 million and $2.8 million, respectively, due from PCEC related to the applicable administrative services agreement, employee related costs and oil and gas sales made by PCEC on our behalf from certain properties. During 2012, the monthly charges to PCEC for indirect expenses totaled $8.0 million and charges for direct expenses including direct payroll and administrative costs totaled $8.6 million. During 2011, the monthly charges to PCEC for indirect expenses totaled $5.8 million and charges for direct expenses including direct payroll and administrative costs totaled $9.0 million. During 2010, the monthly charges to BEC for indirect expenses totaled $5.4 million and charges for direct expenses including direct payroll and administrative costs totaled $6.2 million.
At December 31, 2012 and December 31, 2011, we had receivables of $0.2 million and $1.4 million due from certain of our other affiliates, primarily representing investments in natural gas processing facilities, for management fees due from them and operational expenses incurred on their behalf.
7. Inventory
In Florida, crude oil inventory was $3.1 million and $4.7 million at December 31, 2012 and 2011, respectively. For the year ended December 31, 2012, we sold 849 MBbls of crude oil and produced 830 MBbls from our Florida operations. For the year ended December 31, 2011, we sold 862 MBbls of crude oil and produced 782 MBbls from our Florida operations. Crude oil sales are a function of the number and size of crude oil shipments in each quarter and thus crude oil sales do not always coincide with volumes produced in a given quarter. Crude oil inventory additions are at cost and represent our production costs. We match production expenses with crude oil sales. Production expenses associated with unsold crude oil inventory are recorded to inventory.
We carry inventory at the lower of cost or market. When using lower of cost or market to value inventory, market should not exceed the net realizable value or the estimated selling price less costs of completion and disposal. We assessed our crude oil inventory at December 31, 2012 and December 31, 2011 and determined that the carrying value of our inventory was below market value and, therefore, no write-down was necessary.
For our properties in Florida, there are a limited number of alternative methods of transportation for our production. Substantially all of our oil production is transported by pipelines, trucks and barges owned by third parties. The inability or unwillingness of these parties to provide transportation services for a reasonable fee could result in our having to find transportation alternatives, increased transportation costs, or involuntary curtailment of our oil production, which could have a negative impact on our future consolidated financial position, results of operations and cash flows.
F-24
8. Equity Investments
We had equity investments at December 31, 2012 and December 31, 2011 totaling $7.0 million and $7.5 million, respectively, which primarily represent investments in natural gas processing facilities. For the years ended December 31, 2012 and 2011, we recorded $0.7 million and $0.7 million, respectively in earnings from equity investments and $1.2 million and $0.9 million, respectively, in dividends. For the year ended December 31, 2010, we recorded $0.7 million in earnings from equity investments and $1.2 million in dividends. Earnings from equity investments are reported in other revenue, net on the consolidated statements of operations.
At December 31, 2012, our equity investments consisted primarily of a 24.5% limited partner interest and a 25.5% general partner interest in Wilderness Energy Services LP, with a combined carrying value of $5.9 million. The remaining $1.1 million consists of smaller interests in several other investments where we have significant influence.
9. Impairments and Price Related Depletion and Depreciation Adjustments
We assess our developed and undeveloped oil and gas properties and other long-lived assets for possible impairment periodically and whenever events or changes in circumstances indicate that the carrying value of the assets may not be recoverable. Such indicators include changes in business plans, changes in commodity prices and, for crude oil and natural gas properties, significant downward revisions of estimated proved reserve quantities. If the carrying value of an asset exceeds the future undiscounted cash flows expected from the asset, an impairment charge is recorded for the excess of carrying value of the asset over its estimated fair value.
Determination as to whether and how much an asset is impaired involves management estimates on highly uncertain matters such as future commodity prices, the effects of inflation and technology improvements on operating expenses, production profiles and the outlook for market supply and demand conditions for crude oil and natural gas. For purposes of performing an impairment test, the undiscounted future cash flows are based on total proved and risk-adjusted probable and possible reserves and are forecast using five-year NYMEX forward strip prices at the end of the period and escalated along with expenses and capital starting year six and thereafter at 2.5% per year. For impairment charges, the associated property’s expected future net cash flows are discounted using a market-based weighted average cost of capital rate that currently approximates 10%. Additional inputs include crude oil and natural gas reserves, future operating and development costs and future commodity prices. We consider the inputs for our impairment calculations to be Level 3 inputs. The impairment reviews and calculations are based on assumptions that are consistent with our business plans.
During the year ended December 31, 2012, we recorded non-cash impairment charges of approximately $12.3 million primarily related to uneconomic proved properties in Michigan, Indiana and Kentucky due to a decrease in expected future natural gas prices. During the year ended December 31, 2011, we recorded impairments of approximately $0.6 million related to uneconomic proved properties in Michigan primarily due to a decrease in natural gas prices. During the year ended December 31, 2010, we recorded impairments of approximately $6.3 million related to our Eastern region properties, including a $4.2 million write-down of uneconomic proved properties and a $2.1 million write-down of expired unproved lease properties.
An estimate as to the sensitivity to earnings for these periods if other assumptions had been used in impairment reviews and calculations is not practicable, given the number of assumptions involved in the estimates; favorable changes to some assumptions might have avoided the need to impair any assets in these periods, whereas unfavorable changes might have caused an additional unknown number of other assets to become impaired.
10. Long-Term Debt
Credit Facility
BOLP, as borrower, and we and our wholly-owned subsidiaries, as guarantors, have a $1.5 billion revolving credit facility with Wells Fargo Bank National Association, as Administrative Agent, Swing Line Lender and Issuing Lender, and a syndicate of banks (the “Second Amended and Restated Credit Agreement”) with a maturity date of May 9, 2016.
As of December 31, 2011, our borrowing base was $850 million. On May 25, 2012, we entered into the Fifth Amendment to the Second Amended and Restated Credit Agreement, which increased the permitted amount of senior unsecured notes we may issue from $700 million to $1 billion. On October 11, 2012, we entered into the Sixth Amendment (the “Sixth Amendment”) to the Second Amended and Restated Credit Agreement, which increased our borrowing base to $1 billion and increased our total commitments from existing lenders to $900 million. The Sixth Amendment also provides us with the ability to increase our total commitments up to the $1 billion borrowing base upon lender approval.
Our next semi-annual borrowing base redetermination is scheduled for April 2013.
As of December 31, 2012 and December 31, 2011, we had $345.0 million and $520.0 million, respectively, in indebtedness outstanding under the credit facility. At December 31, 2012, the 1-month LIBOR interest rate plus an applicable spread was 2.214% on the 1-month LIBOR portion of $345.0 million. The amounts reported on our consolidated balance sheets for long-term debt approximate fair value due to the variable nature of our interest rates.
Borrowings under the Second Amended and Restated Credit Agreement are secured by first-priority liens on and security interests in substantially all of our and certain of our subsidiaries’ assets, representing not less than 80% of the total value of our oil and gas properties.
The Second Amended and Restated Credit Agreement contains customary covenants, including restrictions on our ability to: incur additional indebtedness; make certain investments, loans or advances; make distributions to our unitholders or repurchase units (including the restriction on our ability to make distributions unless, after giving effect to such distribution, we remain in compliance with all terms and conditions of our credit facility); make dispositions or enter into sales and leasebacks; or enter into a merger or sale of our property or assets, including the sale or transfer of interests in our subsidiaries.
The Second Amended and Restated Credit Agreement also permits us to terminate derivative contracts without obtaining the consent of the lenders in the facility, provided that the net effect of such termination plus the aggregate value of all dispositions of oil and gas properties made during such period, together, does not exceed 5% of the borrowing base, and the borrowing base will be automatically reduced by an amount equal to the net effect of the termination.
The events that constitute an Event of Default (as defined in the Second Amended and Restated Credit Agreement) include: payment defaults; misrepresentations; breaches of covenants; cross-default and cross-acceleration to certain other indebtedness; adverse judgments against us in excess of a specified amount; changes in management or control; loss of permits; certain insolvency events; and assertion of certain environmental claims.
Senior Notes Due 2020
On October 6, 2010, we and BreitBurn Finance Corporation (the “Issuers”), and certain of our subsidiaries as guarantors (the “Guarantors”), issued $305 million in aggregate principal amount of 8.625% Senior Notes due 2020 (the “2020 Senior Notes”). The 2020 Senior Notes were offered at a discount price of 98.358%, or $300 million. The $5 million discount is being amortized over the life of the 2020 Senior Notes. As of December 31, 2012 and 2011, the 2020 Senior Notes had a carrying value of $301.1 million and $300.6 million, respectively, net of unamortized discount of $3.9 million and $4.4 million, respectively. In connection with the 2020 Senior Notes, we incurred financing fees and expenses of approximately $8.8 million, which will be amortized over the life of the 2020 Senior Notes. Interest on the 2020 Senior Notes is payable twice a year in April and October.
As of December 31, 2012 and 2011, the fair value of the 2020 Senior Notes was estimated to be $330 million and $320 million. We consider the inputs to the valuation of our 2020 Senior Notes to be Level 2, as fair value was estimated based on prices quoted from third party financial institutions.
F-26
Senior Notes Due 2022
On January 10, 2012, the Issuers, and certain of our subsidiaries as Guarantors, issued $250 million in aggregate principal amount of 7.875% Senior Notes due 2022 (the “Initial Notes”), which were purchased by the initial purchasers as defined in the purchase agreement (the “Initial Purchasers”) and then resold to qualified institutional buyers pursuant to Rule 144A under the Securities Act of 1933, as amended (the “Securities Act”). The Initial Notes were issued at a discount of 99.154%, or $247.9 million. The $2.1 million discount will be amortized over the life of the Initial Notes. In connection with the Initial Notes, our financing fees and expenses were approximately $5.6 million, which will be amortized over the life of the Initial Notes.
On September 27, 2012 we issued an additional $200 million aggregate principal amount of our 7.875% Senior Notes due 2022 (the “Additional Notes”), which were purchased by the Initial Purchasers and then resold to qualified institutional buyers pursuant to Rule 144A under the Securities Act (the Additional Notes and the Initial Notes are collectively referred to as the “2022 Senior Notes”). The Additional Notes have identical terms, other than the issue date and initial interest payment date, and constitute part of the same series as and are fungible with the Initial Notes. The Additional Notes were issued at a premium of 103.500%, or $207.0 million. The $7.0 million premium will be amortized over the life of the Additional Notes. In connection with the Additional Notes, our financing fees and expenses were approximately $4.2 million, which will be amortized over the life of the Additional Notes.
In connection with the issuance of the 2022 Senior Notes, we entered into Registration Rights Agreements (the “Registration Rights Agreements”) with the Guarantors and Initial Purchasers. Under the Registration Rights Agreements, the Issuers and the Guarantors agreed to cause to be filed with the SEC a registration statement with respect to an offer to exchange the 2022 Senior Notes for substantially identical notes that are registered under the Securities Act. The Issuers and the Guarantors agreed to use their commercially reasonable efforts to cause such exchange offer registration statement to become effective under the Securities Act. In addition, the Issuers and the Guarantors agreed to use their commercially reasonable efforts to cause the exchange offer to be consummated not later than 400 days after January 13, 2012. In December 2012, we filed a registration statement for the exchange offer for the 2022 Senior Notes. On December 27, 2012, the exchange registration statement became effective and we commenced the exchange offer, which was completed on February 7, 2013.
As of December 31, 2012, the 2022 Senior Notes had a carrying value of $454.6 million, net of unamortized premium of $4.6 million. Interest on the 2022 Senior Notes is payable twice a year in April and October. As of December 31, 2012, the fair value of the 2022 Senior Notes was estimated to be $468 million. We consider the inputs to the valuation of our 2022 Senior Notes to be Level 2, as fair value was estimated based on prices quoted from third party financial institutions.
As of December 31, 2012 and December 31, 2011, we were in compliance with the covenants on our Senior Notes.
Interest Expense
Our interest expense is detailed in the following table:
| Year Ended December 31, | ||||||||||||
| Thousands of dollars | 2012 | 2011 | 2010 | |||||||||
| Credit facility (including commitment fees) | $ | 7,114 | $ | 8,266 | $ | 13,060 | ||||||
| Senior notes | 49,279 | 26,233 | 6,284 | |||||||||
| Amortization of discount and deferred issuance costs | 4,867 | 4,743 | 5,478 | |||||||||
| Capitalized interest | (54 | ) | (77 | ) | (270 | ) | ||||||
| Total | $ | 61,206 | $ | 39,165 | $ | 24,552 | ||||||
| Cash paid for interest | $ | 55,151 | $ | 37,756 | $ | 23,755 | ||||||
F-27
11. Condensed Consolidating Financial Statements
We and BreitBurn Finance Corporation as co-issuers, and certain of our subsidiaries as guarantors, issued the 2020 Senior Notes and the 2022 Senior Notes. Effective April 1, 2012, we and PCEC agreed to dissolve BEPI. With the dissolution of BEPI, all but one of our subsidiaries have guaranteed our senior notes and our only remaining non-guarantor subsidiary, BreitBurn Collingwood Utica LLC, is a minor subsidiary.
In accordance with Rule 3-10 of Regulation S-X, we are not presenting condensed consolidating financial statements as we have no independent assets or operations; BreitBurn Finance Corporation, the subsidiary co-issuer which does not guarantee our senior notes, is a 100% owned finance subsidiary; all of our material subsidiaries are 100% owned, have guaranteed our senior notes, and all of the guarantees are full, unconditional, joint and several.
Each guarantee of each of the 2020 Senior Notes and the 2022 Senior Notes is subject to release in the following customary circumstances:
| (1) | a disposition of all or substantially all the assets of the guarantor subsidiary (including by way or merger or consolidation), to a third person, provided the disposition complies with the applicable indenture, |
| (2) | a disposition of the capital stock of the guarantor subsidiary to a third person, if the disposition complies with the applicable indenture and as a result the guarantor subsidiary ceases to be our subsidiary, |
| (3) | the designation by us of the guarantor subsidiary as an Unrestricted Subsidiary in accordance with the applicable indenture, |
| (4) | legal or covenant defeasance of such series of Senior Notes or satisfaction and discharge of the related indenture, |
| (5) | the liquidation or dissolution of the guarantor subsidiary, provided no default under the applicable indenture exists, or |
| (6) | the guarantor subsidiary ceases both (a) to guarantee any other indebtedness of ours or any other guarantor subsidiary and (b) to be an obligor under any bank credit facility. |
12. Income Taxes
We, and all of our subsidiaries, with the exception of Phoenix Production Company (“Phoenix”), Alamitos Company, BreitBurn Management and BreitBurn Finance Corporation, are partnerships or limited liability companies treated as partnerships for federal and state income tax purposes. Essentially all of our taxable income or loss, which may differ considerably from the net income or loss reported for financial reporting purposes, is passed through to the federal income tax returns of our partners. As such, we have not recorded any federal income tax expense for those pass-through entities.
The consolidated income tax expense (benefit) attributable to our tax-paying entities consisted of the following:
| Year Ended December 31, | ||||||||||||
| Thousands of dollars | 2012 | 2011 | 2010 | |||||||||
| Federal income tax expense (benefit) | ||||||||||||
| Current | $ | 223 | $ | 378 | $ | 347 | ||||||
| Deferred (a) | (316 | ) | 714 | (403 | ) | |||||||
| State income tax expense (benefit) (b) | 177 | 96 | (148 | ) | ||||||||
| Total | $ | 84 | $ | 1,188 | $ | (204 | ) | |||||
(a) Related to Phoenix, our wholly owned subsidiary.
(b) Primarily in California, Texas and Michigan.
F-28
The following is a reconciliation of federal income taxes at the statutory rates to federal income tax expense (benefit) for Phoenix:
| Year Ended December 31, | ||||||||||||
| Thousands of dollars | 2012 | 2011 | 2010 | |||||||||
| Income (loss) subject to federal income tax | $ | (705 | ) | $ | 3,329 | $ | (565 | ) | ||||
| Federal income tax rate | 34 | % | 34 | % | 34 | % | ||||||
| Income tax at statutory rate | (240 | ) | 1,132 | (192 | ) | |||||||
| Statutory depletion from prior year | (248 | ) | — | — | ||||||||
| Other | — | — | (13 | ) | ||||||||
| Income tax expense (benefit) | $ | (488 | ) | $ | 1,132 | $ | (205 | ) | ||||
At December 31, 2012 and 2011, net deferred federal income tax liabilities of $2.5 million and $2.8 million, respectively, were reported in our consolidated balance sheet for Phoenix. Deferred income taxes reflect the net tax effect of temporary differences between the carrying amounts of assets and liabilities for financial reporting and the amount used for income tax purposes. Significant components of our net deferred tax liabilities are presented in the following table:
| December 31, | ||||||||
| Thousands of dollars | 2012 | 2011 | ||||||
| Deferred tax assets: | ||||||||
| Asset retirement obligation | $ | 470 | $ | 431 | ||||
| Unrealized hedge loss | 82 | — | ||||||
| Deferred realized hedge loss | 149 | — | ||||||
| Other | 571 | 368 | ||||||
| Deferred tax liabilities: | ||||||||
| Depreciation, depletion and intangible drilling costs | (3,759 | ) | (3,199 | ) | ||||
| Unrealized hedge gain | — | (326 | ) | |||||
| Deferred realized hedge gain | — | (77 | ) | |||||
| Net deferred tax liability | $ | (2,487 | ) | $ | (2,803 | ) | ||
At December 31, 2012, we had an insignificant amount of estimated unused operating loss carryforwards. As of December 31, 2012 and 2011, we had $0.5 million and $0.4 million, respectively, of estimated unused minimum tax credit carryforward. We did not provide a valuation allowance against this deferred tax asset as we expect to use the minimum tax credit carryforward in the future.
On a consolidated basis, cash paid for federal and state income taxes totaled $0.8 million, $0.3 million and $0.2 million in 2012, 2011 and 2010, respectively.
FASB Accounting Standards clarify the accounting for uncertainty in income taxes recognized in a company’s financial statements. A company can only recognize the tax position in the financial statements if the position is more-likely-than-not to be upheld on audit based only on the technical merits of the tax position. FASB Accounting Standards also provide guidance on thresholds, measurement, derecognition, classification, interest and penalties, accounting in interim periods, disclosure, and transition that is intended to provide better financial statement comparability among different companies.
We performed evaluations as of December 31, 2012, 2011 and 2010 and concluded that there were no uncertain tax positions requiring recognition in our financial statements.
F-29
13. Asset Retirement Obligation
Our asset retirement obligation is based on our net ownership in wells and facilities and our estimate of the costs to abandon and remediate those wells and facilities as well as our estimate of the future timing of the costs to be incurred. Payments to settle asset retirement obligations occur over the operating lives of the assets, estimated to be from less than one year to 50 years. We expect our cash settlements to be approximately $0.7 million, $0.1 million and $0.4 million for the years 2013, 2016 and 2017, respectively. Cash settlements for the years after 2017 are expected to be $97.3 million. Our estimated asset retirement obligation has been discounted at our credit adjusted risk free rate of 7% and adjusted for inflation using a rate of 2%. Our credit adjusted risk free rate is calculated based on our cost of borrowing adjusted for the effect of our credit standing and specific industry and business risk. Each year we review and, to the extent necessary, revise our asset retirement obligation estimates. During 2012 and 2011, we obtained new estimates to evaluate the cost of abandoning our properties. As a result, we increased our ARO estimate by $20.0 million in 2011 to reflect recent increases in the costs incurred for plugging and abandonment activities primarily in California. 2012 revisions of $1.6 million reflect increases in estimated costs for plugging and abandonment, primarily in Wyoming and Florida, partially offset by a decrease in ARO related to the change in working interest ownership in two California fields.
We consider the inputs to our asset retirement obligation valuation to be Level 3 as fair value is determined using discounted cash flow methodologies based on standardized inputs that are not readily observable in public markets.
Changes in the asset retirement obligation are presented in the following table:
| Year Ended December 31, | ||||||||
| Thousands of dollars | 2012 | 2011 | ||||||
| Carrying amount, beginning of period | $ | 82,397 | $ | 47,429 | ||||
| Acquisitions | 6,279 | 10,980 | ||||||
| Liabilities incurred | 2,468 | 5,701 | ||||||
| Liabilities settled | (86 | ) | (5,301 | ) | ||||
| Revisions | 1,553 | 20,005 | ||||||
| Accretion expense | 5,869 | 3,583 | ||||||
| Carrying amount, end of period | $ | 98,480 | $ | 82,397 | ||||
14. Commitments and Contingencies
Lease Rental and Purchase Obligations
We have operating leases for office space and other property and equipment having initial or remaining non-cancelable lease terms in excess of one year. Our future minimum rental payments for operating leases at December 31, 2012 are presented below:
| Payments Due by Year | ||||||||||||||||||||||||||||
| Thousands of dollars | 2013 | 2014 | 2015 | 2016 | 2017 | after 2017 | Total | |||||||||||||||||||||
| Operating leases | $ | 4,713 | $ | 4,323 | $ | 3,902 | $ | 2,843 | $ | 2,441 | $ | 396 | $ | 18,618 | ||||||||||||||
Net rental expense under non-cancelable operating leases was $3.7 million, $3.4 million and $3.0 million in 2012, 2011 and 2010, respectively.
At December 31, 2012, we had purchase obligations of $0.2 million in 2013.
Surety Bonds and Letters of Credit
In the normal course of business, we have performance obligations that are secured, in whole or in part, by surety bonds or letters of credit. These obligations primarily cover self-insurance and other programs where governmental organizations require such support. These surety bonds and letters of credit are issued by financial institutions and are
F-30
required to be reimbursed by us if drawn upon. At December 31, 2012, we had $16.2 million in surety bonds and $0.3 million in letters of credit outstanding. At December 31, 2011, we had $22.1 million in surety bonds and $0.3 million in letters of credit outstanding.
Legal Proceedings
Although we may, from time to time, be involved in litigation and claims arising out of our operations in the normal course of business, we are not currently a party to any material legal proceedings. In addition, we are not aware of any material legal or governmental proceedings against us, or contemplated to be brought against us, under the various environmental protection statues to which we are subject.
15. Partners’ Equity
At December 31, 2012 and 2011, we had 84.7 million and 59.9 million Common Units outstanding, respectively.
At December 31, 2012 and December 31, 2011, we had 9.7 million and 9.7 million, respectively, of units authorized for issuance under our long-term incentive compensation plans and there were 0.9 million and 1.7 million, respectively, of units outstanding under grants that are eligible to be paid in Common Units upon vesting.
During the years ended December 31, 2012, 2011 and 2010, approximately 1.0 million, 1.0 million and 1.2 million Common Units, respectively, were issued to employees and outside directors pursuant to vested grants under our First Amended and Restated 2006 Long Term Incentive Plan (“LTIP”).
In February 2012, we sold 9.2 million of our limited partnership units at a price to the public of $18.80 per Common Unit, resulting in proceeds net of underwriting discount and offering expenses of $166.0 million. In September 2012, we sold 11.5 million of our Common Units at a price to the public of $18.51 per Common Unit, resulting in proceeds net of underwriting discount and offering expenses of $204.1 million. In November 2012, we issued 3 million Common Units to AEO as partial consideration for the AEO Acquisition. The fair value of the units on the date of the acquisitions was $18.48 per unit, or $56 million.
Earnings per common unit
FASB Accounting Standards require use of the “two-class” method of computing earnings per unit for all periods presented. The “two-class” method is an earnings allocation formula that determines earnings per unit for each class of common unit and participating security as if all earnings for the period had been distributed. Unvested restricted unit awards that earn non-forfeitable distribution rights qualify as participating securities and, accordingly, are included in the basic computation. Our unvested RPUs and CPUs participate in distributions on an equal basis with Common Units. Accordingly, the presentation below is prepared on a combined basis and is presented as net income (loss) per common unit.
F-31
The following is a reconciliation of net income (loss) and weighted average units for calculating basic net income (loss) per common unit and diluted net income (loss) per common unit.
| Year Ended December 31, | ||||||||||||
| Thousands, except per unit amounts | 2012 | 2011 | 2010 | |||||||||
| Net income (loss) attributable to limited partners | $ | (40,801 | ) | $ | 110,497 | $ | 34,751 | |||||
| Distributions on participating units not expected to vest | 82 | 29 | 15 | |||||||||
| Net income (loss) attributable to common unitholders and participating securities | $ | (40,719 | ) | $ | 110,526 | $ | 34,766 | |||||
| Weighted average number of units used to calculate basic and diluted net income (loss) per unit: | ||||||||||||
| Common Units | 72,745 | 58,522 | 53,302 | |||||||||
| Participating securities (a) | — | 2,948 | 3,454 | |||||||||
| Denominator for basic earnings per common unit | 72,745 | 61,470 | 56,756 | |||||||||
| Dilutive units (b) | — | 134 | 137 | |||||||||
| Denominator for diluted earnings per common unit | 72,745 | 61,604 | 56,893 | |||||||||
| Net income (loss) per common unit | ||||||||||||
| Basic | $ | (0.56 | ) | $ | 1.80 | $ | 0.61 | |||||
| Diluted | $ | (0.56 | ) | $ | 1.79 | $ | 0.61 | |||||
(a) The year ended December 31, 2012 excludes 2,452 of potentially issuable weighted average RPUs and CPUs from participating securities, as we were in a loss position.
(b) The year ended December 31, 2012 excludes 55 weighted average anti-dilutive units from the calculation of the denominator for diluted earnings per common unit, as we were in a loss position.
Cash Distributions
The partnership agreement requires us to distribute all of our available cash quarterly. Available cash is cash on hand, including cash from borrowings, at the end of a quarter after the payment of expenses and the establishment of reserves for future capital expenditures and operational needs. We may fund a portion of capital expenditures with additional borrowings or issuances of additional units. We may also borrow to make distributions to unitholders, for example, in circumstances where we believe that the distribution level is sustainable over the long term, but short-term factors have caused available cash from operations to be insufficient to pay the distribution at the current level. The partnership agreement does not restrict our ability to borrow to pay distributions. The cash distribution policy reflects a basic judgment that unitholders will be better served by us distributing our available cash, after expenses and reserves, rather than retaining it.
Distributions are not cumulative. Consequently, if distributions on Common Units are not paid with respect to any fiscal quarter at the initial distribution rate, our unitholders will not be entitled to receive such payments in the future. Distributions are paid within 45 days of the end of each fiscal quarter to holders of record on or about the first or second week of each such month. If the distribution date does not fall on a business day, the distribution will be made on the business day immediately preceding the indicated distribution date.
We do not have a legal obligation to pay distributions at any rate except as provided in the partnership agreement. Our distribution policy is consistent with the terms of our partnership agreement, which requires that we distribute all of our available cash quarterly. Under the partnership agreement, available cash is defined to generally mean, for each fiscal quarter, cash generated from our business in excess of the amount of reserves the General Partner determines is necessary or appropriate to provide for the conduct of the business, to comply with applicable law, any of its debt instruments or other agreements or to provide for future distributions to its unitholders for any one or more of the upcoming four quarters. The partnership agreement provides that any determination made by the General Partner in its capacity as general partner must be made in good faith and that any such determination will not be subject to any other
F-32
standard imposed by the partnership agreement, the Delaware limited partnership statute or any other law, rule or regulation or at equity.
During the years ended December 31, 2012, 2011 and 2010, we paid cash distributions of approximately $127.7 million, $97.6 million and $61.2 million. respectively, to our common unitholders. The distributions that were paid to unitholders totaled $1.83, $1.69 and $1.15 per Common Unit, respectively. We also paid cash equivalent to the distribution paid to our unitholders of $4.7 million, $5.1 million and $4.0 million, respectively, to holders of outstanding RPUs and CPUs issued under our LTIP.
16. Noncontrolling interest
FASB Accounting Standards require that noncontrolling interests be classified as a component of equity and establish reporting requirements that provide sufficient disclosures that clearly identify and distinguish between the interests of the parent and the interests of the noncontrolling owners.
In 2007, we acquired the limited partner interest (99%) of BEPI. As such, we were fully consolidating the results of BEPI and were recognizing a noncontrolling interest representing the book value of BEPI’s general partner’s interests.
Prior to April 1, 2012, BEPI’s general partner interest was held by PCEC, and PCEC held a 35% reversionary interest under the limited partnership agreement applicable to the East Coyote and Sawtelle Fields, which was expected to result in an increase in PCEC’s ownership and a corresponding decrease in our ownership in the properties during the second quarter of 2012. We and PCEC agreed to dissolve BEPI and liquidate the properties and assets of BEPI as of April 1, 2012. As a result of such agreement, PCEC’s ownership interest in both of these properties increased, and our ownership in the properties has decreased from approximately 95% to approximately 62%. As of December 31, 2012, the amount of the noncontrolling interest was zero. At December 31, 2011, the amount of the noncontrolling interest was $0.5 million.
17. Unit and Other Valuation-Based Compensation Plans
Effective on the initial public offering date of October 10, 2006, BreitBurn Management adopted the existing Long-Term Incentive Plan (“BreitBurn Management LTIP”) and the Unit Appreciation Rights Plan (“UAR plan”) of the predecessor as previously amended. The predecessor’s Executive Phantom Option Plan, Unit Appreciation Plan for Officers and Key Individuals (“Founders Plan”), and the Performance Trust Units awarded to the Chief Financial Officer during 2006 under the BreitBurn Management LTIP, were adopted by BreitBurn Management with amendments at the initial public offering date as described in the subject plan discussions below.
In 2007, we entered into the First Amended and Restated 2006 Long-Term Incentive Plan (“LTIP”).
We may terminate or amend the long-term incentive plan at any time with respect to any units for which a grant has not yet been made. We also have the right to alter or amend the long-term incentive plan or any part of the plan from time to time, including increasing the number of units that may be granted subject to the requirements of the exchange upon which the Common Units are listed at that time. However, no change in any outstanding grant may be made that would materially reduce the rights or benefits of the participant without the consent of the participant. The plan will expire when units are no longer available under the plan for grants or, if earlier, it is terminated by us.
Unit Based Compensation
FASB Accounting Standards establish requirements for charging compensation expenses based on fair value provisions. At December 31, 2012, the Restricted Phantom Units (“RPUs”) and the Convertible Phantom Units (“CPUs”) granted under our LTIP as well as the outstanding Directors RPUs discussed below were all classified as equity awards. These awards are being recognized as compensation expense on a straight line basis over the annual vesting periods as prescribed in the award agreements.
All the outstanding Founders Plan awards as presented in the table below were classified as liabilities. The awards were revalued at each reporting period using the Black-Scholes option pricing model and changes in the fair value of the
F-33
options were recognized as compensation expense over the vesting schedules of the awards. These awards were settled in cash or had the option of being settled in cash or units at the choice of the holder, and were indexed to our Common Units. The liability-classified option awards were distribution-protected awards because the holders received cumulative distribution amounts upon vesting equal to the actual distribution amounts per Common Unit of the underlying notional Units.
We recognized $22.2 million, $22.0 million and $20.4 million of compensation expense related to our various plans for the years ended December 31, 2012, 2011 and 2010, respectively.
Restricted Phantom Units
RPUs are phantom equity awards that, to the extent vested, represent the right to receive actual partnership units upon specified payment events. Certain of our employees including our executives are eligible to receive RPU awards. We believe that RPUs properly incentivize holders of these awards to grow stable distributions for our common unitholders. RPUs generally vest in three equal annual installments on each anniversary of the vesting commencement date of the award. In addition, each RPU is granted in tandem with a distribution equivalent right that will remain outstanding from the grant of the RPU until the earlier to occur of its forfeiture or the payment of the underlying unit, and which entitles the grantee to receive payment of amounts equal to distributions paid to each holder of an actual partnership unit during such period. RPUs that do not vest for any reason are forfeited upon a grantee’s termination of employment.
The fair value of the RPUs is determined based on the fair market value of our units on the date of grant. RPU awards were granted to BreitBurn Management employees during the years ended December 31, 2012, 2011 and 2010 as shown in the table below. We recorded compensation expense of $17.4 million, $16.9 million and $15.6 million in 2012, 2011 and 2010, respectively, related to the amortization of outstanding RPUs over their related vesting periods. As of December 31, 2012, there was $16.5 million of total unrecognized compensation cost remaining for the unvested RPUs. This amount is expected to be recognized over the next 2 years. The total fair value of units that vested during the years ended December 31, 2012, 2011 and 2010 was $17.4 million, $21.5 million, and $16.9 million, respectively.
The following table summarizes information about RPUs:
| Year Ended December 31, | |||||||||||||||||||||
| 2012 | 2011 | 2010 | |||||||||||||||||||
| Number | Weighted | Number | Weighted | Number | Weighted | ||||||||||||||||
| of | Average | of | Average | of | Average | ||||||||||||||||
| Thousands, except per unit amounts | RPUs | Fair Value | RPUs | Fair Value | RPUs | Fair Value | |||||||||||||||
| Outstanding, beginning of period | 983 | $ | 18.35 | 1,747 | $ | 13.40 | 1,575 | $ | 12.82 | ||||||||||||
| Granted | 887 | 19.61 | 758 | 21.60 | 1,482 | 13.77 | |||||||||||||||
| Exercised | (1,005 | ) | 17.33 | (1,505 | ) | 14.26 | (1,289 | ) | 13.13 | ||||||||||||
| Canceled | (48 | ) | 19.06 | (17 | ) | 16.68 | (21 | ) | 12.80 | ||||||||||||
| Outstanding, end of period | 817 | $ | 20.92 | 983 | $ | 18.35 | 1,747 | $ | 13.40 | ||||||||||||
| Exercisable, end of period | — | $ | — | — | $ | — | — | $ | — | ||||||||||||
In December 2007, seven executives, Halbert Washburn, Randall Breitenbach, Mark Pease, James Jackson, Gregory Brown, Thurmon Andress and Jackson Washburn, received 0.7 million units of CPUs at a grant price of $30.29 per Common Unit. Each of the awards has the vesting commencement date of January 1, 2008. CPUs are significantly tied to the amount of distributions we make to holders of our Common Units. As discussed further below, the number of CPUs ultimately awarded to each of these senior executives will be based upon the level of distributions to common unitholders achieved during the term of the CPUs. The CPU grants vest over a longer-term period of up to five years. Therefore, these grants will not be made on an annual basis. New grants could be made at the Board’s discretion at a future date after the present CPU grants have vested.
F-34
CPUs vest on the earliest to occur of (i) January 1, 2013, (ii) the date on which the aggregate amount of distributions paid to common unitholders for any four consecutive quarters during the term of the award is greater than or equal to $3.10 per Common Unit and (iii) upon the occurrence of the death or “disability” of the grantee or his or her termination without “cause” or for “good reason” (as defined in the holder’s employment agreement, if applicable). Unvested CPUs are forfeited in the event that the grantee ceases to remain in the service of BreitBurn Management. Prior to vesting, a holder of a CPU is entitled to receive payments equal to the amount of distributions made by us with respect to each of the Common Units multiplied by the number of Common Unit equivalents underlying the CPUs at the time of the distribution.
Under the original CPU Agreements, one Common Unit Equivalent (CUE) underlies each CPU at the time it was awarded to the grantee. However, the number of CUEs underlying the CPUs would increase at a compounded rate of 25% upon the achievement of each 5% compounded increase in the distributions paid by us to our common unitholders. Conversely, the number of CUEs underlying the CPUs would decrease at a compounded rate of 25% if the distributions paid by us to our common unitholders decreases at a compounded rate of 5%.
On October 29, 2009, the Compensation and Governance Committee approved an amendment to each of the existing CPU Agreements entered into with each named executive. Originally under the CPU Agreements, the number of CUEs per CPU could be reduced over the five year life of the agreement to a minimum of zero, or be multiplied by a maximum of 4.77 times, based on our distribution levels. We suspended the payment of distributions in April 2009; therefore, holders of CPUs did not receive any distributions under the CPU Agreements as long as distributions were suspended. Under the original chart, if the CPUs were to vest currently – for instance in the case of the death or disability of a holder – zero units would have vested to that holder. The Committee determined that the elimination of multipliers between zero and one best represented the original incentive and retention purpose of the CPU Agreements. With this modification to the CPU Agreements, the number of CUEs per CPU can no longer be less than one, regardless of Common Unit distribution levels.
On January 29, 2010, the Committee approved an amendment to each of the existing CPU Agreements entered into with each named executive. Under these agreements, each CPU entitles its holder to receive (i) a number of our Common Units at the time of vesting equal to the number of “common unit equivalents” (“CUEs”) underlying the CPU at vesting, and (ii) current distributions on Common Units during the vesting period based on the number of CUEs underlying the CPU at the time of such distribution. The number of CUEs underlying each CPU is determined by reference to Common Unit distribution levels during the applicable vesting period, generally calculated based upon the aggregate amount of distributions made per Common Unit for the four quarters preceding vesting. The amendment to the CPU agreements limited the multiplier for 20% of the total number of CPUs and related CUEs granted in each award to one.”
On January 28, 2011, the Committee approved an amendment to each of the existing CPU Agreements entered into with each of named executives. This amendment to the CPU agreements now limits the multiplier for 40% of the total number of CPUs and related CUEs granted in each award to one instead of 20% in the prior amendment approved on January 29, 2010. As a result at vesting, CPUs for 40% of each award will convert to Common Units on a one to one basis, and with respect to that portion of the award, holders will lose the ability to earn additional Common Units based on increased distributions on Common Units. No other modification was made to the CPU Agreements under this amendment. The Committee determined that this cap on 40% of the CPUs was appropriate in light of the overall long-term incentive grants made to BreitBurn’s executive officers in 2011. Because we were accruing compensation expense assuming a CUE multiplier of one, all of these amendments had no impact on compensation expense recorded. Compensation expense will be adjusted upon such time it deems probable that the CUE would increase due to increased distributions.
On December 13, 2012, certain of our executive officers entered into an amendment to their grants of CPUs, that provided that such grants could vest on December 28, 2012 instead of January 1, 2013.
In the event that the CPUs vested on December 28, 2012 or January 1, 2013 or if the aggregate amount of distributions paid to common unitholders for any four consecutive quarters during the term of the award was greater than $3.10 per Common Unit, the CPUs would have converted into a number of Common Units equal to the number of Common Unit equivalents underlying the CPUs at such time (calculated based upon the aggregate amount of
F-35
distributions made per Common Unit for the preceding four quarters subject to the 60% limitation put in place on January 28, 2011 as noted above). After January 1, 2011, under the terms of the CPU Agreements, all unvested CPUs would fully vest in the event of a termination without cause or good reason and upon death or disability.
We recorded compensation expense for CPUs of $4.1 million in 2012, $4.1 million in 2011 and $4.1 million in 2010. Approximately 0.6 million units vested on December 28, 2012 at a fair market value as of the grant date of $18.3 million. They were converted to Common Units on a one to one basis. The remaining 0.1 million units vested on January 1, 2013 at a fair market value as of the grant date of $2.3 million and were converted to Common Units on a one to one basis.
Founders Plan Awards
Under the Founders Plan, participants received unit appreciation rights which provide cash compensation in relation to the appreciation in the value of a specified number of underlying notional phantom units. The value of the unit appreciation rights was determined on the basis of a valuation of the predecessor at the end of the fiscal period plus distributions during the period less the value of the predecessor at the beginning of the period. The base price and vesting terms were determined by BreitBurn Management at the time of the grant. Outstanding unit appreciation rights vest in the following manner: one-third vest three years after the grant date, one-third vest four years after the grant date and one-third vest five years after the grant date and are subject to specified service requirements. The award is liability-classified and is being charged to us as compensation expense over the remaining vesting schedule.
The founders plan ceased to exist at the end of 2011. We recorded less than $0.1 million for compensation expense under the plan for each of the years ended December 31, 2011 and December 31, 2010. At December 31, 2010, we had less than 10,000 unit appreciation rights outstanding, at a weighted average exercise price of $18.50 per unit, all of which were exercised during 2011.
Director Restricted Phantom Units
Effective with the initial public offering until 2011, we also made grants of Restricted Phantom Units in the Partnership to the non-employee directors of our General Partner. Each phantom unit was accompanied by a distribution equivalent unit right entitling the holder to an additional number of phantom units with a value equal to the amount of distributions paid on each of our Common Units until settlement. Since 2010, the phantom units were paid in Common Units upon vesting, and the unit-settled awards are classified as equity. The estimated fair value associated with these phantom units is expensed in the statement of income over the vesting period. Since 2011, we have made grants of RPUs to the non-employee directors of our General Partner that are substantially similar to the ones granted to employees.
We recorded compensation expense for the director’s phantom units of approximately $0.6 million, $1.0 million and, $0.6 million in 2012, 2011 and 2010, respectively. As of December 31, 2012, there was $0.6 million of total unrecognized compensation cost for the unvested Director Performance Units and such cost is expected to be recognized over the next two years.
F-36
The following table summarizes information about the Director Restricted Phantom Units:
| Year Ended December 31, | |||||||||||||||||||||
| 2012 | 2011 | 2010 | |||||||||||||||||||
| Number | Weighted | Number | Weighted | Number | Weighted | ||||||||||||||||
| of | Average | of | Average | of | Average | ||||||||||||||||
| Thousands, except per unit amounts | Units | Fair Value | Units | Fair Value | Units | Fair Value | |||||||||||||||
| Outstanding, beginning of period | 132 | $ | 13.45 | 131 | $ | 13.05 | 81 | $ | 13.80 | ||||||||||||
| Granted | 29 | 19.63 | 41 | 21.68 | 60 | 13.94 | |||||||||||||||
| Exercised | (113 | ) | 12.11 | (40 | ) | 20.55 | (10 | ) | 24.10 | ||||||||||||
| Outstanding, end of period | 48 | $ | 20.43 | 132 | $ | 13.45 | 131 | $ | 13.05 | ||||||||||||
| Exercisable, end of period | — | $ | — | — | $ | — | — | $ | — | ||||||||||||
18. Retirement Plan
BreitBurn Management operates our assets and performs other administrative services for us such as accounting, corporate development, finance, land administration, legal and engineering. All of our employees, including our executives, are employees of BreitBurn Management. BreitBurn Management has a defined contribution retirement plan, which covers substantially all of its employees on the first day of the month following the month of hire. The plan provides for BreitBurn Management to make regular contributions based on employee contributions as provided for in the plan agreement. Employees fully vest in BreitBurn Management’s contributions after five years of service. PCEC is charged for a portion of the matching contributions made by BreitBurn Management. For the years ended December 31, 2012, 2011 and 2010, we recognized expense related to matching contributions of $1.3 million, $1.1 million and $1.0 million, respectively.
19. Significant Customers
We sell oil, natural gas and natural gas liquids primarily to large domestic refiners. For the year ended December 31, 2012, purchasers that accounted for 10% or more of our net sales were ConocoPhillips, Plains Marketing & Transportation LLC, and Marathon Oil Company, which accounted for approximately 31%, 17%, and 14% of net sales, respectively.
For the year ended December 31, 2011, purchasers that accounted for 10% or more of our net sales were ConocoPhillips, Plains Marketing & Transportation LLC, and Marathon Oil Company, which accounted for 30%, 16%, and 15% of net sales, respectively.
For the year ended December 31, 2010, purchasers that accounted for 10% or more of our net sales were ConocoPhillips, Marathon Oil Company, Plains Marketing & Transportation LLC and Sunoco Partners Marketing and Terminals L.P., which accounted for 30%, 16%, 12% and 10% of net sales, respectively.
20. Subsequent Events
On January 29, 2013, we announced a cash distribution to unitholders for the fourth quarter of 2012 at the rate of $0.4700 per Common Unit, which was paid on February 14, 2013 to the record holders of common units at the close of business on February 11, 2013.
In February 2013, we sold 14.95 million Common Units at a price to the public of $19.86, resulting in proceeds net of underwriting discounts and estimated offering expenses of $285.0 million, which we used to repay outstanding debt under our credit facility.
In February 2013, we entered into NYMEX WTI and ICE Brent fixed price crude oil swaps covering a total of approximately 2.2 million barrels of future production in 2013 through 2017 at a weighted average hedge price of $96.02
F-37
per Bbl. Also in February 2013, we entered into Henry Hub fixed price natural gas swaps covering a total of approximately 2,375 BBtu of future production in 2016 and 2017 at a weighted average hedge price of $4.47 per MMBtu.
In February 2013, we entered into the Seventh Amendment to the Second Amended and Restated Credit Agreement, which increased the percentage of expected oil and gas production volume that we are permitted to hedge under the terms of the credit facility.
Supplemental Information
A. Oil and Natural Gas Activities (Unaudited)
We calculate total estimated proved reserves and disclose our oil and natural gas activities in accordance with SEC guidelines. The definition of proved reserves incorporates a definition of “reasonable certainty” using the PRMS (Petroleum Resource Management System) standard of “high degree of confidence” for deterministic method estimates, or a 90% recovery probability for probabilistic methods used in estimating proved reserves. While SEC guidelines permit a company to establish undeveloped reserves as proved with appropriate degrees of reasonable certainty established absent actual production tests and without artificially limiting such reserves to spacing units adjacent to a producing well, we have elected not to add such undeveloped reserves as proved. For reserve reporting purposes we use unweighted average first-day-of-the-month pricing for the 12 calendar months. Costs associated with reserves are measured on the last day of the fiscal year.
Costs incurred
Our oil and natural gas activities are conducted in the United States. The following table summarizes our costs incurred for the past three years:
| Year Ended December 31, | ||||||||||||
| Thousands of dollars | 2012 | 2011 | 2010 | |||||||||
| Property acquisition costs | ||||||||||||
| Proved | $ | 530,532 | $ | 341,602 | $ | 1,676 | ||||||
| Unproved | 89,725 | 1,073 | 2,877 | |||||||||
| Asset retirement costs | 6,279 | 10,980 | — | |||||||||
| Development costs | 152,820 | 75,635 | 64,951 | |||||||||
| Asset retirement costs - development | 4,021 | 25,706 | 10,120 | |||||||||
| Total costs incurred | $ | 783,377 | $ | 454,996 | $ | 79,624 | ||||||
Capitalized costs
The following table presents the aggregate capitalized costs subject to DD&A relating to oil and gas activities, and the aggregate related accumulated allowance:
| December 31, | ||||||||
| Thousands of dollars | 2012 | 2011 | ||||||
| Proved properties and related producing assets | $ | 3,001,018 | $ | 2,319,857 | ||||
| Pipelines and processing facilities | 165,320 | 152,551 | ||||||
| Unproved properties | 197,608 | 111,585 | ||||||
| Accumulated depreciation, depletion and amortization | (655,607 | ) | (516,214 | ) | ||||
| Net capitalized costs | $ | 2,708,339 | $ | 2,067,779 | ||||
F-38
The average DD&A rate per equivalent unit of production for the year ended December 31, 2012, excluding non-oil and gas related DD&A, was $17.68 per Boe. The average DD&A rate per equivalent unit of production for the year ended December 31, 2011, excluding non-oil and gas related DD&A, was $14.90 per Boe.
Results of operations for oil and gas producing activities
The results of operations from oil and gas producing activities below exclude general and administrative expenses, interest expenses and interest income:
| Year Ended December 31, | ||||||||||||
| Thousands of dollars | 2012 | 2011 | 2010 | |||||||||
| Oil, natural gas and NGL sales | $ | 413,867 | $ | 394,393 | $ | 317,738 | ||||||
| Gain (loss) on commodity derivative instruments, net | 5,580 | 81,667 | 35,112 | |||||||||
| Operating costs | (195,779 | ) | (165,969 | ) | (142,525 | ) | ||||||
| Depreciation, depletion, and amortization | (147,059 | ) | (105,066 | ) | (100,183 | ) | ||||||
| Income tax (expense) benefit | (84 | ) | (1,188 | ) | 204 | |||||||
| Results of operations from producing activities (a) | $ | 76,525 | $ | 203,837 | $ | 110,346 | ||||||
(a) Excludes (gain) loss on sale of assets of $486, $(111) and $14 for the years ended December 31, 2012, 2011, and 2010, respectively.
Supplemental reserve information
The following information summarizes our estimated proved reserves of oil (including condensate and natural gas liquids) and natural gas and the present values thereof for the years ended December 31, 2012, 2011 and 2010. The following reserve information is based upon reports by Netherland, Sewell & Associates, Inc. (“NSAI”) and Schlumberger PetroTechnical Services (“SLB”), independent petroleum engineering firms. NSAI provides reserve data for our California, Wyoming and Florida properties, and SLB provides reserve data for our Michigan, Kentucky and Indiana properties. The estimates are prepared in accordance with SEC regulations. We only utilize large, widely known, highly regarded, and reputable engineering consulting firms. Not only the firms, but the technical persons that sign and seal the reports are licensed and certify that they meet all professional requirements. Licensing requirements formally require mandatory continuing education and professional qualifications. They are independent petroleum engineers, geologists, geophysicists and petrophysicists.
Our reserve estimation process involves petroleum engineers and geoscientists. As part of this process, all reserves volumes are estimated using a forecast of production rates, current operating costs and projected capital expenditures. Reserves are based upon the unweighted average first-day-of-the-month prices for each year. Price differentials are then applied to adjust these prices to the expected realized field price. Specifics of each operating agreement are then used to estimate the net reserves. Production rate forecasts are derived by a number of methods, including decline curve analyses, volumetrics, material balance or computer simulation of the reservoir performance. Operating costs and capital costs are forecast using current costs combined with expectations of future costs for specific reservoirs. In many cases, activity-based cost models for a reservoir are utilized to project operating costs as production rates and the number of wells for production and injection vary.
The technical person primarily responsible for overseeing preparation of the reserves estimates and the third party reserve reports is Mark L. Pease, the President and Chief Operating Officer of our General Partner. Mr. Pease received a Bachelor of Science in Petroleum Engineering from the Colorado School of Mines in 1979. Prior to joining our General Partner, Mr. Pease was Senior Vice President, E&P Technology & Services for Anadarko Petroleum Corporation. Mr. Pease has over 30 years of experience working in various capacities in the energy industry, including acquisition analysis, reserve estimation, reservoir engineering and operations engineering. Mr. Pease consults with NSAI and SLB during the reserve estimation process to review properties, assumptions and relevant data.
F-39
Within NSAI, the technical persons primarily responsible for preparing the estimates set forth in the NSAI reserves report included in this report as exhibits 99.1 and 99.2 are Mr. J. Carter Henson, Jr. and Mr. Mike K. Norton. J. Carter Henson, Jr. has been practicing consulting petroleum engineering at NSAI since 1989. Carter is a Licensed Professional Engineer in the State of Texas (License No. 73964) and has over 30 years of practical experience in petroleum engineering, with over 22 years experience in the estimation and evaluation of reserves. He graduated from Rice University in 1981 with a Bachelor of Science Degree in Mechanical Engineering. Mike Norton has been practicing consulting petroleum geology at NSAI since 1989. Mike is a Licensed Petroleum Geologist in the State of Texas (License No. 441) and has over 34 years of practical experience in petroleum geosciences, with over 29 years experience in the estimation and evaluation of reserves. He graduated from Texas A&M University in 1978 with a Bachelor of Science Degree in Geology. Both technical principals meet or exceed the education, training, and experience requirements set forth in the Standards Pertaining to the Estimating and Auditing of Oil and Gas Reserves Information promulgated by the Society of Petroleum Engineers; both are proficient in judiciously applying industry standard practices to engineering and geoscience evaluations as well as applying SEC and other industry reserves definitions and guidelines.
Within SLB, the technical person primarily responsible for preparing the reserves estimates set forth in the SLB reserves report including in this report as exhibit 99.3 is Mr. Charles M. Boyer II, who has been with PetroTechnical Services (PTS) Division of SLB since 1998. He attended The Pennsylvania State University and graduated with a Bachelor of Science Degree in Geological Sciences in 1976; he is a Certified Petroleum Geologist of the American Association of Petroleum Geologists (Reg. No. 5733); he is a Registered Professional Geologist in the Commonwealth of Pennsylvania (Reg. No. PG004509) and has in excess of 20 years’ experience in the conduct of evaluation and engineering studies relating to oil and gas interests.
Management believes the reserve estimates presented herein, in accordance with generally accepted engineering and evaluation methods and procedures consistently applied, are reasonable. However, there are numerous uncertainties inherent in estimating quantities and values of the estimated proved reserves and in projecting future rates of production and timing of development expenditures, including many factors beyond our control. Reserve engineering is a subjective process of estimating the recovery from underground accumulations of oil and gas that cannot be measured in an exact manner and the accuracy of any reserve estimate is a function of the quality of available data and of engineering and geological interpretation and judgment. Because all reserve estimates are to some degree speculative, the quantities of oil and gas that are ultimately recovered, production and operating costs, the amount and timing of future development expenditures and future oil and gas sales prices may all differ from those assumed in these estimates. In addition, different reserve engineers may make different estimates of reserve quantities and cash flows based upon the same available data. Therefore, the standardized measure of discounted net future cash flows shown below represents estimates only and should not be construed as the current market value of the estimated oil and gas reserves attributable to our properties. In this regard, the information set forth in the following tables includes revisions of reserve estimates attributable to proved properties included in the preceding year’s estimates. Such revisions reflect additional information from subsequent exploitation and development activities, production history of the properties involved and any adjustments in the projected economic life of such properties resulting from changes in product prices. Decreases in the prices of oil and natural gas and increases in operating expenses have had, and could have in the future, an adverse effect on the carrying value of our proved reserves and revenues, profitability and cash flow.
F-40
The following table sets forth certain data pertaining to our estimated proved and proved developed reserves for the years ended December 31, 2012, 2011 and 2010.
| Year Ended December 31, | |||||||||||||||||||||||||||
| 2012 | 2011 | 2010 | |||||||||||||||||||||||||
Total (MBoe) | Oil (MBbl) | Gas (MMcf) | Total (MBoe) | Oil (MBbl) | Gas (MMcf) | Total (MBoe) | Oil (MBbl) | Gas (MMcf) | |||||||||||||||||||
| Proved Reserves | |||||||||||||||||||||||||||
| Beginning balance | 151,106 | 52,682 | 590,543 | 118,908 | 41,659 | 463,491 | 111,301 | 38,846 | 434,730 | ||||||||||||||||||
| Revision of previous estimates | (27,086 | ) | 3,852 | (185,627 | ) | 7,037 | 10,074 | (18,222 | ) | 12,819 | 5,900 | 41,510 | |||||||||||||||
| Purchase of reserves in-place | 33,696 | 26,092 | 45,625 | 32,198 | 4,204 | 167,971 | 1,487 | 70 | 8,502 | ||||||||||||||||||
| Production | (8,318 | ) | (3,652 | ) | (27,997 | ) | (7,037 | ) | (3,255 | ) | (22,697 | ) | (6,699 | ) | (3,157 | ) | (21,251 | ) | |||||||||
| Ending balance | 149,398 | 78,974 | 422,545 | 151,106 | 52,682 | 590,543 | 118,908 | 41,659 | 463,491 | ||||||||||||||||||
| Proved Developed Reserves | |||||||||||||||||||||||||||
| Beginning balance | 131,462 | 47,813 | 501,891 | 108,283 | 38,719 | 417,381 | 100,968 | 34,436 | 399,190 | ||||||||||||||||||
| Ending balance | 119,721 | 59,158 | 363,378 | 131,462 | 47,813 | 501,891 | 108,283 | 38,719 | 417,381 | ||||||||||||||||||
| Proved Undeveloped Reserves | |||||||||||||||||||||||||||
| Beginning balance | 19,644 | 4,869 | 88,652 | 10,625 | 2,940 | 46,110 | 10,333 | 4,410 | 35,540 | ||||||||||||||||||
| Ending balance | 29,677 | 19,816 | 59,167 | 19,644 | 4,869 | 88,652 | 10,625 | 2,940 | 46,110 | ||||||||||||||||||
Revisions of Previous Estimates
In 2012, we had negative revisions of 27.1 MMBoe, primarily related to a decrease in natural gas prices. Unweighted average first-day-of-the-month crude oil and natural gas prices used to determine our total estimated proved reserves as of December 31, 2012 were $94.71 per Bbl of oil and $2.76 per MMBtu of gas, compared to $95.97 per Bbl of oil and $4.12 per MMBtu of gas in 2011. In 2011, we had positive revisions of 7.0 MMBoe, primarily related to an increase in oil prices partially offset by a decrease in natural gas prices.
Unweighted average first-day-of-the-month market prices for the reserve reports for the year ended December 31, 2010 were $79.40 per Bbl of oil and $4.38 per MMBtu of gas. In 2010, we had positive revisions of 12.8 MMBoe, primarily related to an increase in oil and natural gas prices.
Conversion of Proved Undeveloped Reserves
During the years ended December 31, 2012, 2011 and 2010 , we incurred $21.6 million, $15.4 million and $32.6 million in capital expenditures, respectively, and drilled 20 wells, 28 wells and 16 wells, respectively, related to the conversion of proved undeveloped to proved developed reserves. During the years ended December 31, 2012, 2011 and 2010, we converted 2.3 MMBoe, 1.0 MMBoe and 3.2 MMBoe, respectively, from proved undeveloped to proved developed reserves. As of December 31, 2012, 2011 and 2010, we had no proved undeveloped reserves that have remained undeveloped for more than five years. The increase in proved undeveloped reserves during the year ended December 31, 2012 was primarily due to the Permian Basin Acquisitions, the NiMin Acquisition and the AEO Acquisition, which added 12.9 MMBoe, 2.4 MMBoe and 1.4 MMBoe of proved undeveloped reserves, respectively, partially offset by economic revisions and the conversion of proved undeveloped to proved developed reserves. The increase in proved undeveloped reserves during the year ended December 31, 2011 was primarily due to the acquisition of 10.3 MMBoe and 1.9 MMBoe of proved undeveloped reserves in the Cabot Acquisition and the Greasewood Acquisition, respectively. The increase in proved undeveloped reserves during the year ended December 31, 2010 was not material.
F-41
Standardized measure of discounted future net cash flows
The standardized measure of discounted future net cash flows relating to our estimated proved crude oil and natural gas reserves as of December 31, 2012, 2011 and 2010 is presented below:
| December 31, | ||||||||||||
| Thousands of dollars | 2012 | 2011 | 2010 | |||||||||
| Future cash inflows | $ | 8,512,019 | $ | 7,338,443 | $ | 5,097,644 | ||||||
| Future development costs | (728,577 | ) | (338,273 | ) | (251,181 | ) | ||||||
| Future production expense | (3,950,308 | ) | (3,531,192 | ) | (2,618,470 | ) | ||||||
| Future net cash flows | 3,833,134 | 3,468,978 | 2,227,993 | |||||||||
| Discounted at 10% per year | (1,843,238 | ) | (1,809,677 | ) | (1,163,069 | ) | ||||||
| Standardized measure of discounted future net cash flows | $ | 1,989,895 | $ | 1,659,301 | $ | 1,064,924 | ||||||
The standardized measure of discounted future net cash flows discounted at 10% from production of proved reserves was developed as follows:
| 1. | An estimate was made of the quantity of proved reserves and the future periods in which they are expected to be produced based on year-end economic conditions. |
| 2. | In accordance with SEC guidelines, the reserve engineers’ estimates of future net revenues from our estimated proved properties and the present value thereof are made using unweighted average first-day-of-the-month oil and gas sales prices and are held constant throughout the life of the properties, except where such guidelines permit alternate treatment, including the use of fixed and determinable contractual price escalations. We have entered into various derivative instruments to fix or limit the prices relating to a portion of our oil and gas production. Derivative instruments in effect at December 31, 2012 and 2011 are discussed in Note 5. Such derivative instruments are not reflected in the reserve reports. Representative unweighted average first-day-of-the-month market prices for the reserve reports for the year ended December 31, 2012 were $94.71 per Bbl of oil and $2.76 per MMBtu of gas, compared to $95.97 per Bbl of oil and $4.12 per MMBtu of gas in 2011. Unweighted average first-day-of-the-month market prices for the reserve reports for the year ended December 31, 2010 were $79.40 per Bbl of oil and $4.38 per MMBtu of gas. |
| 3. | The future gross revenue streams were reduced by estimated future operating costs (including production and ad valorem taxes) and future development and abandonment costs, all of which were based on current costs. Future net cash flows assume no future income tax expense as we are essentially a non-taxable entity except for four tax-paying corporations whose future income tax liabilities on a discounted basis are insignificant. |
The principal sources of changes in the standardized measure of the future net cash flows for the years ended December 31, 2012, 2011 and 2010 are presented below:
| Year Ended December 31, | ||||||||||||
| Thousands of dollars | 2012 | 2011 | 2010 | |||||||||
| Beginning balance | $ | 1,659,301 | $ | 1,064,924 | $ | 759,622 | ||||||
| Sales, net of production expense | (218,088 | ) | (228,424 | ) | (175,213 | ) | ||||||
| Net change in sales and transfer prices, net of production expense | (320,533 | ) | 393,183 | 306,311 | ||||||||
| Previously estimated development costs incurred during year | 61,767 | 39,665 | 47,732 | |||||||||
| Changes in estimated future development costs | (41,372 | ) | (35,886 | ) | (105,207 | ) | ||||||
| Purchase of reserves in place | 530,532 | 342,675 | 1,676 | |||||||||
| Revision of quantity estimates and timing of estimated production | 152,358 | (23,328 | ) | 154,041 | ||||||||
| Accretion of discount | 165,930 | 106,492 | 75,962 | |||||||||
| Ending balance | $ | 1,989,895 | $ | 1,659,301 | $ | 1,064,924 | ||||||
F-42
B. Quarterly Financial Data (Unaudited)
| Year ended December 31, 2012 | ||||||||||||||||
| First | Second | Third | Fourth | |||||||||||||
| Thousands of dollars except per unit amounts | Quarter | Quarter | Quarter | Quarter | ||||||||||||
| Oil, natural gas and natural gas liquid sales | $ | 94,007 | $ | 94,981 | $ | 111,700 | $ | 113,179 | ||||||||
| Gain (loss) on derivative instruments, net | (36,005 | ) | 107,288 | (69,418 | ) | 3,715 | ||||||||||
| Other revenue, net | 1,145 | 907 | 796 | 700 | ||||||||||||
| Total revenue | 59,147 | 203,176 | 43,078 | 117,594 | ||||||||||||
| Operating income (loss) | (36,194 | ) | 107,810 | (58,029 | ) | 8,113 | ||||||||||
| Net income (loss) | $ | (49,925 | ) | $ | 92,523 | $ | (73,003 | ) | $ | (10,334 | ) | |||||
| Basic net income (loss) per limited partner unit (a) | $ | (0.76 | ) | $ | 1.29 | $ | (1.00 | ) | $ | (0.13 | ) | |||||
| Diluted net income (loss) per limited partner unit (a) | $ | (0.76 | ) | $ | 1.29 | $ | (1.00 | ) | $ | (0.13 | ) | |||||
| Year ended December 31, 2011 | ||||||||||||||||
| First | Second | Third | Fourth | |||||||||||||
| Thousands of dollars except per unit amounts | Quarter | Quarter | Quarter | Quarter | ||||||||||||
| Oil, natural gas and natural gas liquid sales | $ | 92,575 | $ | 94,742 | $ | 97,356 | $ | 109,720 | ||||||||
| Gain (loss) on derivative instruments, net | (106,177 | ) | 46,483 | 178,826 | (37,465 | ) | ||||||||||
| Other revenue, net | 898 | 1,143 | 1,375 | 894 | ||||||||||||
| Total revenue | (12,704 | ) | 142,368 | 277,557 | 73,149 | |||||||||||
| Operating income (loss) | (86,641 | ) | 69,439 | 190,518 | (19,507 | ) | ||||||||||
| Net income (loss) | $ | (94,713 | ) | $ | 57,523 | $ | 178,227 | $ | (30,339 | ) | ||||||
| Basic net income (loss) per limited partner unit (a) | $ | (1.67 | ) | $ | 0.93 | $ | 2.87 | $ | (0.51 | ) | ||||||
| Diluted net income (loss) per limited partner unit (a) | $ | (1.67 | ) | $ | 0.92 | $ | 2.87 | $ | (0.51 | ) | ||||||
(a) Due to changes in the number of weighted average common units outstanding that may occur each quarter, the earnings per unit amounts for certain quarters may not be additive.
F-43
EXHIBIT INDEX
| NUMBER | DOCUMENT | |
| 3.1 | Certificate of Limited Partnership of BreitBurn Energy Partners L.P. (incorporated herein by reference to Exhibit 3.1 to Amendment No. 1 to Form S-1 (File No. 333-134049) filed on July 13, 2006). | |
| 3.2 | First Amended and Restated Agreement of Limited Partnership of BreitBurn Energy Partners L.P. (incorporated herein by reference to Exhibit 3.1 to the Current Report on Form 8-K (File No. 001-33055) filed on October 16, 2006). | |
| 3.3 | Amendment No. 1 to the First Amended and Restated Agreement of Limited Partnership of BreitBurn Energy Partners L.P. (incorporated herein by reference to Exhibit 3.1 to the Current Report on Form 8-K (File No. 001-33055) filed on June 23, 2008). | |
| 3.4 | Amendment No. 2 to the First Amended and Restated Agreement of Limited Partnership of BreitBurn Energy Partners L.P. (incorporated herein by reference to Exhibit 3.1 to the Current Report on Form 8-K (File No. 001-33055) filed April 9, 2009). | |
| 3.5 | Amendment No. 3 to the First Amended and Restated Agreement of Limited Partnership of BreitBurn Energy Partners L.P. (incorporated herein by reference to Exhibit 3.1 to the Current Report on Form 8-K (File No. 001-33055) filed September 1, 2009). | |
| 3.6 | Amendment No.4 to the First Amended and Restated Agreement of Limited Partnership of BreitBurn Energy Partners L.P. (incorporated herein by reference to Exhibit 3.1 to the Current Report on Form 8-K (File No. 001-33055) filed on April 9, 2010). | |
| 3.7 | Fourth Amended and Restated Limited Liability Company Agreement of BreitBurn GP, LLC dated as of April 5, 2010 (incorporated herein by reference to Exhibit 3.2 to the Current Report on Form 8-K (File No. 001-33055) filed on April 9, 2011). | |
| 3.8 | Amendment No. 1 to the Fourth Amended and Restated Limited Liability Company Agreement of BreitBurn GP, LLC dated as of December 30, 2010 (incorporated herein by reference to Exhibit 3.1 to the Current Report on Form 8-K (File No. 001-33055) filed on January 6, 2011). | |
| 4.1 | Registration Rights Agreement, dated as of November 1, 2007, by and among BreitBurn Energy Partners L.P. and Quicksilver Resources Inc. (incorporated herein by reference to Exhibit 4.2 to the Current Report on Form 8-K (File No. 001-33055) filed on November 6, 2007). | |
| 4.2 | First Amendment to the Registration Rights Agreement, dated as of April 5, 2010, by and among BreitBurn Energy Partners L.P. and Quicksilver Resources Inc. (incorporated herein by reference to Exhibit 4.1 to the Current Report on Form 8-K (File No. 001-33055) filed on April 9, 2010). | |
| 4.3 | Indenture, dated as of October 6, 2010, by and among BreitBurn Energy Partners L.P., BreitBurn Finance Corporation, the Guarantors named therein and U.S. Bank National Association (incorporated herein by reference to Exhibit 4.1 to the Current Report on Form 8-K (File No. 001-33055) filed on October 7, 2010). | |
| 4.4 | Registration Rights Agreement, dated as of October 6, 2010, by and among BreitBurn Energy Partners L.P., BreitBurn Finance Corporation, the Guarantors named therein and the Initial Purchasers named therein (incorporated herein by reference to Exhibit 4.2 to the Current Report on Form 8-K (File No. 001-33055) filed on October 7, 2010). | |
| 4.5 | Indenture, dated as of January 13, 2012, by and among BreitBurn Energy Partners L.P., BreitBurn Finance Corporation, the Guarantors named therein and U.S. Bank National Association (incorporated herein by reference to Exhibit 4.1 to the Current Report on Form 8-K (File No. 001-33055) filed on January 13, 2012). | |
| 4.6 | Registration Rights Agreement, dated as of January 13, 2012, by and among BreitBurn Energy Partners L.P., BreitBurn Finance Corporation, the Guarantors named therein and Wells Fargo Securities, LLC as representative of the Initial Purchasers named therein (incorporated herein by reference to Exhibit 4.2 to the Current Report on Form 8-K (File No. 001-33055) filed on January 13, 2012). | |
| 4.7 | Registration Rights Agreement, dated as of September 27, 2012, by and among BreitBurn Energy Partners L.P., BreitBurn Finance Corporation, the Guarantors named therein and Wells Fargo Securities, LLC, as representative of the Initial Purchasers named therein (incorporated herein by reference to Exhibit 4.2 to the Current Report on Form 8-K (File No. 001-33055) filed on September 28, 2012). | |
| 10.1 | Seventh Amendment to the Second Amended and Restated Credit Agreement of BreitBurn Energy Partners L.P. dated February 26, 2013. | |
| 10.2 | Amended and Restated Agreement of Limited Partnership of BreitBurn Energy Partners I, L.P. dated May 5, 2003 (incorporated herein by reference to Exhibit 10.2 to the Current Report on Form 8-K (File No. 001-33055) filed on May 29, 2007). | |
F-44
| NUMBER | DOCUMENT | |
| 10.3† | Form of BreitBurn Energy Partners L.P. 2006 Long-Term Incentive Plan Restricted Phantom Unit Agreement (Executive Form) (incorporated herein by reference to Exhibit 10.1 to the Current Report on Form 8-K (File No. 001-33055) filed on March 11, 2008). | |
| 10.4† | Form of BreitBurn Energy Partners L.P. 2006 Long-Term Incentive Plan Restricted Phantom Unit Agreement (Non-Executive Form) (incorporated herein by reference to Exhibit 10.2 to the Current Report on Form 8-K (File No. 001-33055) filed on March 11, 2008). | |
| 10.5† | Form of BreitBurn Energy Partners L.P. 2006 Long-Term Incentive Plan Restricted Phantom Units Directors’ Award Agreement (incorporated herein by reference to Exhibit 10.35 to the Annual Report on Form 10-K for the year ended December 31, 2007 (File No. 001-33055) and filed on March 17, 2008). | |
| 10.6 | Amendment No. 1 to the Operations and Proceeds Agreement, relating to the Dominguez Field and dated October 10, 2006 entered into on June 17, 2008 by and between BreitBurn Energy Company L.P. and BreitBurn Operating L.P. (incorporated herein by reference to Exhibit 10.6 to the Current Report on Form 8-K (File No. 001-33055) filed on June 23, 2008). | |
| 10.7 | Amendment No. 1 to the Surface Operating Agreement dated October 10, 2006 entered into on June 17, 2008 by and between BreitBurn Energy Company L.P. and its predecessor BreitBurn Energy Corporation and BreitBurn Operating L.P. (incorporated herein by reference to Exhibit 10.7 to the Current Report on Form 8-K (File No. 001-33055) filed on June 23, 2008). | |
| 10.8† | Form of BreitBurn Energy Partners L.P. 2006 Long-Term Incentive Plan Convertible Phantom Unit Agreement (Employment Agreement Form) (incorporated herein by reference to Exhibit 10.9 to the Quarterly Report on Form 10-Q for the period ended June 30, 2008 (File No. 001-33055) and filed on August 11, 2008). | |
| 10.9† | Form of BreitBurn Energy Partners L.P. 2006 Long-Term Incentive Plan Convertible Phantom Unit Agreement (Non-Employment Agreement Form) (incorporated herein by reference to Exhibit 10.10 to the Quarterly Report on Form 10-Q for the period ended June 30, 2008 and (File No. 001-33055) filed on August 11, 2008). | |
| 10.10 | Second Amended and Restated Administrative Services Agreement dated August 26, 2008 by and between BreitBurn Energy Company L.P. and BreitBurn Management Company, LLC (incorporated herein by reference to Exhibit 10.1 to the Current Report on Form 8-K (File No. 001-33055) filed on September 02, 2008). | |
| 10.11 | Omnibus Agreement, dated August 26, 2008, by and among BreitBurn Energy Holdings LLC, BEC (GP) LLC, BreitBurn Energy Company L.P, BreitBurn GP, LLC, BreitBurn Management Company, LLC and BreitBurn Energy Partners L.P. (incorporated herein by reference to Exhibit 10.2 to the Current Report on Form 8-K (File No. 001-33055) filed on September 02, 2008). | |
| 10.12 | Indemnity Agreement between BreitBurn Energy Partners L.P., BreitBurn GP, LLC and Halbert S. Washburn, together with a schedule identifying other substantially identical agreements between BreitBurn Energy Partners L.P., BreitBurn GP, LLC and each of its executive officers and non-employee directors identified on the schedule (incorporated herein by reference to Exhibit 10.1 to the Current Report on form 8-K (File No. 001-33055) filed on November 4, 2009). | |
| 10.13† | First Amendment to the BreitBurn Energy Partners L.P. 2006 Long-Term Incentive Plan Convertible Phantom Unit Agreements (incorporated herein by reference to Exhibit 10.2 to the Current Report on form 8-K (File No. 001-33055) filed on November 4, 2009). | |
| 10.14† | First Amended and Restated BreitBurn Energy Partners L.P. 2006 Long-Term Incentive Plan effective as of October 29, 2009 (incorporated herein by reference to Exhibit 10.3 to the Quarterly Report on Form 10-Q for the period ended September 30, 2009 (File No. 001-33055) filed on November 6, 2009). | |
| 10.15 | Settlement Agreement as of April 5, 2010 by and among Quicksilver Resources Inc., BreitBurn Energy Partners L.P., BreitBurn GP LLC, Provident Energy Trust, Randall H. Breitenbach and Halbert S. Washburn (incorporated herein by reference to Exhibit 10.1 to the Current Report on Form 8-K filed on April 9, 2010). | |
| 10.16† | Form of BreitBurn Energy Partners L.P. 2006 Long-Term Incentive Plan Restricted Phantom Unit Agreement (Executive Form) (incorporated herein by reference to Exhibit 10.21 to the Annual Report on Form 10-K for the year ended December 31, 2010 (File No. 0001-33055) filed on March 9, 2011). | |
| 10.17† | Form of BreitBurn Energy Partners L.P. 2006 Long-Term Incentive Plan Restricted Phantom Unit Agreement (Non-Executive Form) (incorporated herein by reference to Exhibit 10.22 to the Annual Report on Form 10-K for the year ended December 31, 2010 (File No. 0001-33055) filed on March 9, 2011). | |
F-45
| NUMBER | DOCUMENT | |
| 10.18† | Form of BreitBurn Energy Partners L.P. 2006 Long-Term Incentive Plan Restricted Phantom Unit Agreement (Director Form) (incorporated herein by reference to Exhibit 10.23 to the Annual Report on Form 10-K for the year ended December 31, 2010 (File No. 0001-33055) filed on March 9, 2011). | |
| 10.19† | Form of Second Amendment to the BreitBurn Energy Partners L.P. 2006 Long-Term Incentive Plan Convertible Phantom Unit Agreements (incorporated herein by reference to Exhibit 10.24 to the Annual Report on Form 10-K for the year ended December 31, 2010 (File No. 0001-33055) filed on March 9, 2011). | |
| 10.20† | Form of Third Amendment to the BreitBurn Energy Partners L.P. 2006 Long-Term Incentive Plan Convertible Phantom Unit Agreements (incorporated herein by reference to Exhibit 10.25 to the Annual Report on Form 10-K for the year ended December 31, 2010 (File No. 0001-33055) filed on March 9, 2011). | |
| 10.21 | Third Amended and Restated Employment Agreement dated December 30, 2010 among BreitBurn Management Company, LLC, BreitBurn GP, LLC, BreitBurn Energy Partners L.P. and Halbert S. Washburn (incorporated herein by reference to Exhibit 10.1 to the Current Report on Form 8-K (File No. 001-33055) filed on January 6, 2011). | |
| 10.22 | Third Amended and Restated Employment Agreement dated December 30, 2010 among BreitBurn Management Company, LLC, BreitBurn GP, LLC, BreitBurn Energy Partners L.P. and Randall H. Breitenbach (incorporated herein by reference to Exhibit 10.2 to the Current Report on Form 8-K (File No. 001-33055) filed on January 6, 2011). | |
| 10.23 | Amended and Restated Employment Agreement dated December 30, 2010 among BreitBurn Management Company, LLC, BreitBurn GP, LLC, BreitBurn Energy Partners L.P. and Mark L. Pease (incorporated herein by reference to Exhibit 10.3 to the Current Report on Form 8-K (File No. 001-33055) filed on January 6, 2011). | |
| 10.24 | Second Amended and Restated Employment Agreement dated December 30, 2010 among BreitBurn Management Company, LLC, BreitBurn GP, LLC, BreitBurn Energy Partners L.P. and James G. Jackson (incorporated herein by reference to Exhibit 10.4 to the Current Report on Form 8-K (File No. 001-33055) filed on January 6, 2011). | |
| 10.25 | Amended and Restated Employment Agreement dated December 30, 2010 among BreitBurn Management Company, LLC, BreitBurn GP, LLC, BreitBurn Energy Partners L.P. and Gregory C. Brown (incorporated herein by reference to Exhibit 10.5 to the Current Report on Form 8-K (File No. 001-33055) filed on January 6, 2011). | |
| 10.26 | Second Amended and Restated Credit Agreement, dated May 7, 2010, by and among BreitBurn Operating L.P, as borrower, BreitBurn Energy Partners L.P., as parent guarantor, and Wells Fargo Bank, N.A., as administrative agent (incorporated herein by reference to Exhibit 10.1 to the Quarterly Report on Form 10-Q for the period ended March 31, 2010 (File No. 001-33055) filed on May 10, 2010). | |
| 10.27 | First Amendment dated September 17, 2010 to the Second Amended and Restated Credit Agreement dated May 7, 2010, by and among BreitBurn Operating L.P, as borrower, BreitBurn Energy Partners L.P., as parent guarantor, and Wells Fargo Bank, N.A., as administrative agent (incorporated herein by reference to Exhibit 10.1 to the Current Report on Form 8-K (File No. 001-33055) filed on September 23, 2010). | |
| 10.28 | Second Amendment to the Second Amended and Restated Credit Agreement dated May 9, 2011 (incorporated herein by reference to Exhibit 10.1 to the Quarterly Report on Form 10-Q for the quarter ended March 31, 2011 (File No. 001-33055) filed on May 10, 2011). | |
| 10.29 | Asset Purchase Agreement, dated as of July 26, 2011, between Cabot Oil & Gas Corporation and BreitBurn Operating L.P. (incorporated herein by reference to Exhibit 10.1 to the Current Report on Form 8-K (File No. 001-33055) filed on July 29, 2011). | |
| 10.3 | Third Amendment to the Second Amended and Restated Credit Agreement dated August 3, 2011 (incorporated herein by reference to Exhibit 10.3 to the Quarterly Report on Form 10-Q for the quarter ended June 30, 2011 (File No. 001-33055) filed on August 8, 2011). | |
| 10.31 | Fourth Amendment to the Second Amended and Restated Credit Agreement dated October 5, 2011 (incorporated herein by reference to Exhibit 10.1 to the Current Report on Form 8-K (File No. 001-33055) filed on October 7, 2011). | |
| 10.32 | Dissolution Agreement, dated May 8, 2012, by and among BreitBurn Energy Partners L.P., Pacific Coast Energy Company LP, BEP (GP) I, LLC and BreitBurn Energy Partners I, L.P. (incorporated herein by reference to Exhibit 10.1 to the Quarterly Report on Form 10-Q for the quarter ended June 30, 2012 (File No. 001-33055) filed on August 8, 2012). | |
F-46
| NUMBER | DOCUMENT | |
| 10.33 | Amendment No. 1 to BEPI Partnership Agreement, dated May 8, 2012, by and between BEP (GP) I, LLC and BreitBurn Energy Partners L.P. (incorporated herein by reference to Exhibit 10.2 to the Quarterly Report on Form 10-Q for the quarter ended June 30, 2012 (File No. 001-33055) filed on August 8, 2012). | |
| 10.34 | Third Amended and Restated Administrative Services Agreement, dated May 8, 2012, by and between Pacific Coast Energy Company L.P. and BreitBurn Management Company, LLC (incorporated herein by reference to Exhibit 10.3 to the Quarterly Report on Form 10-Q for the quarter ended June 30, 2012 (File No. 001-33055) filed on August 8, 2012). | |
| 10.35 | First Amendment to Omnibus Agreement, dated May 8, 2012, by and among BreitBurn Energy Partners L.P., BreitBurn GP, LLC, BreitBurn Management Company, LLC, Pacific Coast Energy Company L.P., Pacific Coast Energy Holdings LLC and PCEC (GP) LLC (incorporated herein by reference to Exhibit 10.4 to the Quarterly Report on Form 10-Q for the quarter ended June 30, 2012 (File No. 001-33055) filed on August 8, 2012). | |
| 10.36 | Purchase and Sale Agreement, dated April 24, 2012, among Legacy Energy, Inc., NiMin Energy Corp. and BreitBurn Operating L.P. (incorporated herein by reference to Exhibit 10.1 to the Current Report on Form 8-K (File No. 001-33055) filed on April 27, 2012). | |
| 10.37 | Purchase and Sale Agreement, dated May 9, 2012, between Element Petroleum, L.P. and BreitBurn Operating L.P. (incorporated herein by reference to Exhibit 10.1 to the Current Report on Form 8-K (File No. 001-33055) filed on May 11, 2012). | |
| 10.38 | Purchase and Sale Agreement, dated May 9, 2012, between CrownRock, L.P. and BreitBurn Operating L.P. (incorporated herein by reference to Exhibit 10.2 to the Current Report on Form 8-K (File No. 001-33055) filed on May 11, 2012). | |
| 10.39 | First Amendment to Purchase and Sale Agreement, dated as of June 28, 2012, among Legacy Energy, Inc., NiMin Energy Corp. and BreitBurn Operating L.P. (incorporated herein by reference to Exhibit 10.1 to the Current Report on Form 8-K (File No. 001-33055) filed on June 29, 2012). | |
| 10.40 | Fifth Amendment to the Second Amended and Restated Credit Agreement, dated as of May 25, 2012 (incorporated herein by reference to Exhibit 10.2 to the Current Report on Form 8-K (File No. 001-33055) filed on June 29, 2012). | |
| 10.41 | Sixth Amendment to the Second Amended and Restated Credit Agreement, dated as of October 11, 2012 (incorporated herein by reference to Exhibit 10.1 to the Current Report on Form 8-K (File No. 001-33055) filed on October 16, 2012). | |
| 10.42 | Contribution Agreement, dated November 21, 2012, among American Energy Operations, Inc., BreitBurn Energy Partners L.P. and BreitBurn Operating L.P. (incorporated herein by reference to Exhibit 10.1 to the Current Report on Form 8-K (File No. 001-33055) filed on November 27, 2012). | |
| 10.43† | Retirement Agreement, dated as of November 30, 2012, among BreitBurn Energy Partners L.P., BreitBurn GP, LLC and Randall H. Breitenbach (incorporated herein by reference to Exhibit 10.1 to the Current Report on Form 8-K (File No. 001-33055) filed on December 6, 2012). | |
| 10.44† | Omnibus First Amendment to the BreitBurn Energy Partners L.P. 2006 Long-Term Incentive Plan Restricted Phantom Unit Agreements, dated as of November 30, 2012, among BreitBurn Energy Partners L.P., BreitBurn GP, LLC and Randall H. Breitenbach (incorporated herein by reference to Exhibit 10.2 to the Current Report on form 8-K (File No. 001-33055) filed on December 6, 2012). | |
| 10.45† | Fourth Amendment to the BreitBurn Energy Partners L.P. 2006 Long-Term Incentive Plan Convertible Phantom Unit Agreement, dated as of November 30, 2012, among BreitBurn Energy Partners L.P., BreitBurn GP, LLC and Randall H. Breitenbach (incorporated herein by reference to Exhibit 10.3 to the Current Report on form 8-K (File No. 001-33055) filed on December 6, 2012). | |
| 10.46 | Purchase and Sale Agreement, dated December 11, 2012, between CrownRock, L.P. and BreitBurn Operating L.P. (incorporated herein by reference to Exhibit 10.1 to the Current Report on Form 8-K (File No. 001-33055) filed on December 12, 2012). | |
| 10.47 | Purchase and Sale Agreement, dated December 11, 2012, between Lynden USA Inc. and BreitBurn Operating L.P. (incorporated herein by reference to Exhibit 10.2 to the Current Report on Form 8-K (File No. 001-33055) filed on December 12, 2012). | |
| 10.48† | Form of First Amendment to BreitBurn Energy Partners L.P. 2006 Long-Term Incentive Plan Restricted Phantom Unit Agreement (Director Form) (incorporated herein by reference to Exhibit 10.1 to the Current Report on Form 8-K (File No. 001-33055) filed on December 14, 2012). | |
| 10.49† | Form of Fourth Amendment to BreitBurn Energy Partners L.P. 2006 Long-Term Incentive Plan Restricted Convertible Phantom Unit Agreement (incorporated herein by reference to Exhibit 10.2 to the Current Report on Form 8-K (File No. 001-33055) filed on December 14, 2012). | |
F-47
| NUMBER | DOCUMENT | |
| 14.1 | BreitBurn Energy Partners L.P. and BreitBurn GP, LLC Code of Ethics for Chief Executive Officers and Senior Officers (as amended and restated on February 28, 2007) (incorporated herein by reference to Exhibit 14.1 to the Current Report on Form 8-K filed on March 5, 2007). | |
| 21.1 | List of subsidiaries of BreitBurn Energy Partners L.P. | |
| 23.1* | Consent of PricewaterhouseCoopers LLP. | |
| 23.2* | Consent of Netherland, Sewell & Associates, Inc. | |
| 23.3* | Consent of Schlumberger PetroTechnical Services. | |
| 31.1* | Certification of Registrant’s Chief Executive Officer pursuant to Rule 13a-14(a) of the Securities Exchange Act of 1934 and Section 302 of the Sarbanes-Oxley Act of 2002. | |
| 31.2* | Certification of Registrant’s Chief Financial Officer pursuant to Rule 13a-14(a) of the Securities Exchange Act of 1934 and Section 302 of the Sarbanes-Oxley Act of 2002. | |
| 32.1** | Certification of Registrant’s Chief Executive Officer pursuant to Rule 13a-14(b) of the Securities Exchange Act of 1934 and 18 U.S.C. Section 1350, as created by Section 906 of the Sarbanes-Oxley Act of 2002. | |
| 32.2** | Certification of Registrant’s Chief Financial Officer pursuant to Rule 13a-14(b) of the Securities Exchange Act of 1934 and 18 U.S.C. Section 1350, as created by Section 906 of the Sarbanes-Oxley Act of 2002. | |
| 99.1 | Netherland, Sewell & Associates, Inc. reserve report for certain properties located in Wyoming. | |
| 99.2 | Netherland, Sewell & Associates, Inc. reserve report for certain properties located in California, Florida, and Texas. | |
| 99.3 | Schlumberger PetroTechnical Services reserve report. | |
| 101†† | Interactive Data Files | |
| * | Filed herewith. | |
| ** | Furnished herewith. | |
| † | Management contract or compensatory plan or arrangement. | |
| †† | The documents formatted in XBRL (Extensible Business Reporting Language) and attached as Exhibit 101 to this report are deemed not filed as part of a registration statement or prospectus for purposes of sections 11 or 12 of the Securities Act, are deemed not filed for purposes of section 18 of the Exchange Act, and otherwise are not subject to liability under these sections. | |
F-48