
Hood River Funds
Core Financial Statements
Annual Report June 30, 2024
UNITED STATES
SECURITIES AND EXCHANGE COMMISSION
Washington, D.C. 20549
FORM N-CSR
CERTIFIED SHAREHOLDER REPORT OF REGISTERED
MANAGEMENT INVESTMENT COMPANIES
Investment Company Act file number 811-21897
Manager Directed Portfolios
(Exact name of registrant as specified in charter)
615 East Michigan Street
Milwaukee, WI 53202
(Address of principal executive offices) (Zip code)
Scott M. Ostrowski, President
Manager Directed Portfolios
c/o U.S. Bank Global Fund Services
777 East Wisconsin Avenue, 6th Floor
Milwaukee, WI 53202
(Name and address of agent for service)
(414) 516-3087
Registrant’s telephone number, including area code
Date of fiscal year end: June 30, 2024
Date of reporting period: June 30, 2024
Item 1. Reports to Stockholders.
| (a) |
 | Hood River Small-Cap Growth Fund | |
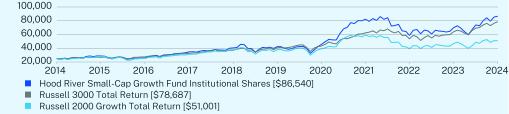
| Institutional Shares | HRSMX | ||
| Annual Shareholder Report | June 30, 2024 |
Class Name | Costs of a $10,000 investment | Costs paid as a percentage of a $10,000 investment |
| Institutional Shares | $120 | 1.07% |
Top Contributors | |
| ↑ | FTAI Aviation Ltd. |
| ↑ | Vertiv Holdings Co. |
| ↑ | Comfort Systems USA, Inc. |
| ↑ | Onto Innovcation, Inc. |
| ↑ | FormFactor, Inc. |
Top Detractors | |
| ↓ | DocGo, Inc. |
| ↓ | MasTec, Inc. |
| ↓ | Applied Digital Corporation |
| ↓ | Five9, Inc. |
| ↓ | Harmonic, Inc. |
| Hood River Small-Cap Growth Fund | PAGE 1 | TSR_AR_56170L208 |
1 Year | 5 Year | 10 Year | |
Institutional Shares | 23.87 | 15.40 | 13.22 |
Russell 3000 Total Return Index | 23.13 | 14.14 | 12.15 |
Russell 2000 Growth Total Return Index | 9.14 | 6.17 | 7.39 |
| * | The Fund’s past performance is not a good predictor of the Fund’s future performance. The returns do not reflect the deduction of taxes that a shareholder would pay on Fund distributions or redemption of Fund shares. |
Net Assets | $2,637,663,827 |
Number of Holdings | 104 |
Net Advisory Fee | $17,166,582 |
Portfolio Turnover Rate | 98% |

Top 10 Holdings | (% of Net Assets) |
Mount Vernon Liquid Assets Portfolio, LLC | 13.9% |
FTAI Aviation Ltd. | 6.5% |
First American Treasury Obligations Fund | 3.7% |
MasTec, Inc. | 2.6% |
Rambus, Inc. | 2.5% |
Clean Harbors, Inc. | 2.2% |
Comfort Systems USA, Inc. | 2.2% |
FormFactor, Inc. | 2.2% |
Coherent Corp. | 2.1% |
Kirby Corp. | 2.0% |
| * | The Global Industry Classification Standard (“GICS®”) was developed by and/or is the exclusive property of MSCI, Inc. (“MSCI”) and Standard & Poor’s Financial Services LLC (“S&P”). GICS® is a service mark of MSCI and S&P and has been licensed for use by U.S. Bank Global Fund Services. |
| Hood River Small-Cap Growth Fund | PAGE 2 | TSR_AR_56170L208 |
| Hood River Small-Cap Growth Fund | PAGE 3 | TSR_AR_56170L208 |
 | Hood River Small-Cap Growth Fund | |
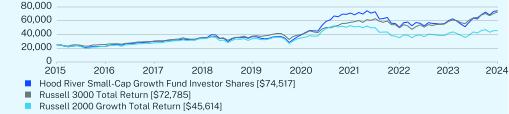
| Investor Shares | HRSRX | ||
| Annual Shareholder Report | June 30, 2024 |
Class Name | Costs of a $10,000 investment | Costs paid as a percentage of a $10,000 investment |
| Investor Shares | $146 | 1.31% |
Top Contributors | |
| ↑ | FTAI Aviation Ltd. |
| ↑ | Vertiv Holdings Co. |
| ↑ | Comfort Systems USA, Inc. |
| ↑ | Onto Innovcation, Inc. |
| ↑ | FormFactor, Inc. |
Top Detractors | |
| ↓ | DocGo, Inc. |
| ↓ | MasTec, Inc. |
| ↓ | Applied Digital Corporation |
| ↓ | Five9, Inc. |
| ↓ | Harmonic, Inc. |
| Hood River Small-Cap Growth Fund | PAGE 1 | TSR_AR_56170L109 |
1 Year | 5 Year | Since Inception (07/07/2015) | |
Investor Shares | 23.57 | 15.16 | 12.93 |
Russell 3000 Total Return Index | 23.13 | 14.14 | 12.63 |
Russell 2000 Growth Total Return Index | 9.14 | 6.17 | 6.92 |
| * | The Fund’s past performance is not a good predictor of the Fund’s future performance. The returns do not reflect the deduction of taxes that a shareholder would pay on Fund distributions or redemption of Fund shares. |
Net Assets | $2,637,663,827 |
Number of Holdings | 104 |
Net Advisory Fee | $17,166,582 |
Portfolio Turnover Rate | 98% |

Top 10 Holdings | (% of Net Assets) |
Mount Vernon Liquid Assets Portfolio, LLC | 13.9% |
FTAI Aviation Ltd. | 6.5% |
First American Treasury Obligations Fund | 3.7% |
MasTec, Inc. | 2.6% |
Rambus, Inc. | 2.5% |
Clean Harbors, Inc. | 2.2% |
Comfort Systems USA, Inc. | 2.2% |
FormFactor, Inc. | 2.2% |
Coherent Corp. | 2.1% |
Kirby Corp. | 2.0% |
| * | The Global Industry Classification Standard (“GICS®”) was developed by and/or is the exclusive property of MSCI, Inc. (“MSCI”) and Standard & Poor’s Financial Services LLC (“S&P”). GICS® is a service mark of MSCI and S&P and has been licensed for use by U.S. Bank Global Fund Services. |
| Hood River Small-Cap Growth Fund | PAGE 2 | TSR_AR_56170L109 |
| Hood River Small-Cap Growth Fund | PAGE 3 | TSR_AR_56170L109 |
 | Hood River Small-Cap Growth Fund | |
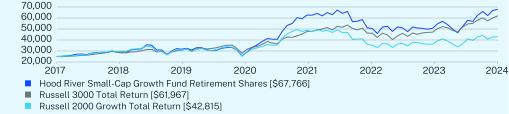
| Retirement Shares | HRSIX | ||
| Annual Shareholder Report | June 30, 2024 |
Class Name | Costs of a $10,000 investment | Costs paid as a percentage of a $10,000 investment |
| Retirement Shares | $111 | 0.99% |
Top Contributors | |
| ↑ | FTAI Aviation Ltd. |
| ↑ | Vertiv Holdings Co. |
| ↑ | Comfort Systems USA, Inc. |
| ↑ | Onto Innovcation, Inc. |
| ↑ | FormFactor, Inc. |
Top Detractors | |
| ↓ | DocGo, Inc. |
| ↓ | MasTec, Inc. |
| ↓ | Applied Digital Corporation |
| ↓ | Five9, Inc. |
| ↓ | Harmonic, Inc. |
| Hood River Small-Cap Growth Fund | PAGE 1 | TSR_AR_56170L505 |
1 Year | 5 Year | Since Inception (03/03/2017) | |
Retirement Shares | 23.94 | 15.48 | 14.58 |
Russell 3000 Total Return Index | 23.13 | 14.14 | 13.19 |
Russell 2000 Growth Total Return Index | 9.14 | 6.17 | 7.62 |
| * | The Fund’s past performance is not a good predictor of the Fund’s future performance. The returns do not reflect the deduction of taxes that a shareholder would pay on Fund distributions or redemption of Fund shares. |
Net Assets | $2,637,663,827 |
Number of Holdings | 104 |
Net Advisory Fee | $17,166,582 |
Portfolio Turnover Rate | 98% |
Top 10 Holdings | (% of Net Assets) |
Mount Vernon Liquid Assets Portfolio, LLC | 13.9% |
FTAI Aviation Ltd. | 6.5% |
First American Treasury Obligations Fund | 3.7% |
MasTec, Inc. | 2.6% |
Rambus, Inc. | 2.5% |
Clean Harbors, Inc. | 2.2% |
Comfort Systems USA, Inc. | 2.2% |
FormFactor, Inc. | 2.2% |
Coherent Corp. | 2.1% |
Kirby Corp. | 2.0% |
| * | The Global Industry Classification Standard (“GICS®”) was developed by and/or is the exclusive property of MSCI, Inc. (“MSCI”) and Standard & Poor’s Financial Services LLC (“S&P”). GICS® is a service mark of MSCI and S&P and has been licensed for use by U.S. Bank Global Fund Services. |
| Hood River Small-Cap Growth Fund | PAGE 2 | TSR_AR_56170L505 |
| Hood River Small-Cap Growth Fund | PAGE 3 | TSR_AR_56170L505 |
 | Hood River International Opportunity Fund | |
| Institutional Shares | HRIOX | ||
| Annual Shareholder Report | June 30, 2024 |
Class Name | Costs of a $10,000 investment | Costs paid as a percentage of a $10,000 investment |
| Institutional Shares | $144 | 1.27% |
Top Contributors | |
| ↑ | FTAI Aviation Ltd. |
| ↑ | Micronics Japan Co., Ltd. |
| ↑ | Camtek Ltd |
| ↑ | Applied Digital Corporation |
| ↑ | Voltamp Transformers Limited |
Top Detractors | |
| ↓ | Establishment Labs Holdings, Inc. |
| ↓ | Inspired Entertainment, Inc. |
| ↓ | ODDITY Tech Ltd. |
| ↓ | Lilium N.V. |
| ↓ | Toyo Gosei Co., Ltd. |
| Hood River International Opportunity Fund | PAGE 1 | TSR_AR_56170L778 |
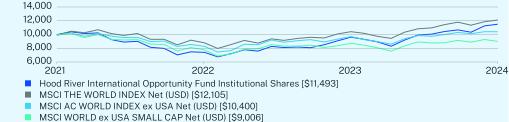
1 Year | Since Inception (09/28/2021) | |
Institutional Shares | 26.73 | 5.18 |
MSCI THE WORLD INDEX Net (USD) | 20.19 | 7.18 |
MSCI AC WORLD INDEX ex USA Net (USD) | 11.62 | 1.43 |
MSCI WORLD INDEX ex USA SMALL CAP Net (USD) | 7.80 | -3.73 |
| * | The Fund’s past performance is not a good predictor of the Fund’s future performance. The returns do not reflect the deduction of taxes that a shareholder would pay on Fund distributions or redemption of Fund shares. |
Net Assets | $14,341,428 |
Number of Holdings | 97 |
Net Advisory Fee | $0 |
Portfolio Turnover Rate | 119% |

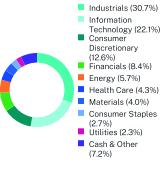
Top 10 Holdings | (% of Net Assets) |
Applied Digital Corp. | 6.2% |
Marubeni Corp. | 4.0% |
GFL Environmental, Inc. | 2.9% |
First American Treasury Obligations Fund | 2.3% |
Voltamp Transformers Ltd. | 2.1% |
Camtek Ltd./Israel | 2.0% |
Denison Mines Corp. | 1.9% |
Alphawave IP Group PLC | 1.8% |
VIKING HOLDINGS Ltd. ORD SHS | 1.7% |
Munters Group AB | 1.7% |

| * | The Global Industry Classification Standard (“GICS®”) was developed by and/or is the exclusive property of MSCI, Inc. (“MSCI”) and Standard & Poor’s Financial Services LLC (“S&P”). GICS® is a service mark of MSCI and S&P and has been licensed for use by U.S. Bank Global Fund Services. |
| Hood River International Opportunity Fund | PAGE 2 | TSR_AR_56170L778 |
| Hood River International Opportunity Fund | PAGE 3 | TSR_AR_56170L778 |
 | Hood River International Opportunity Fund | |
| Investor Shares | HRIIX | ||
| Annual Shareholder Report | June 30, 2024 |
Class Name | Costs of a $10,000 investment | Costs paid as a percentage of a $10,000 investment |
| Investor Shares | $147 | 1.47% |
Top Contributors | |
| ↑ | FTAI Aviation Ltd. |
| ↑ | Micronics Japan Co., Ltd. |
| ↑ | Camtek Ltd |
| ↑ | Applied Digital Corporation |
| ↑ | Voltamp Transformers Limited |
Top Detractors | |
| ↓ | Establishment Labs Holdings, Inc. |
| ↓ | Inspired Entertainment, Inc. |
| ↓ | ODDITY Tech Ltd. |
| ↓ | Lilium N.V. |
| ↓ | Toyo Gosei Co., Ltd. |
| Hood River International Opportunity Fund | PAGE 1 | TSR_AR_56170L760 |
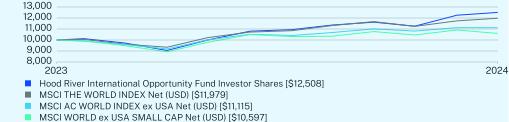
Since Inception (08/11/2023) | |
Investor Shares | 25.08 |
MSCI THE WORLD INDEX Net (USD) | 19.79 |
MSCI AC WORLD INDEX ex USA Net (USD) | 11.15 |
MSCI WORLD INDEX ex USA SMALL CAP Net (USD) | 5.97 |
| * | The Fund’s past performance is not a good predictor of the Fund’s future performance. The returns do not reflect the deduction of taxes that a shareholder would pay on Fund distributions or redemption of Fund shares. |
Net Assets | $14,341,428 |
Number of Holdings | 97 |
Net Advisory Fee | $0 |
Portfolio Turnover Rate | 119% |
Top 10 Holdings | (% of Net Assets) |
Applied Digital Corp. | 6.2% |
Marubeni Corp. | 4.0% |
GFL Environmental, Inc. | 2.9% |
First American Treasury Obligations Fund | 2.3% |
Voltamp Transformers Ltd. | 2.1% |
Camtek Ltd./Israel | 2.0% |
Denison Mines Corp. | 1.9% |
Alphawave IP Group PLC | 1.8% |
VIKING HOLDINGS Ltd. ORD SHS | 1.7% |
Munters Group AB | 1.7% |

| * | The Global Industry Classification Standard (“GICS®”) was developed by and/or is the exclusive property of MSCI, Inc. (“MSCI”) and Standard & Poor’s Financial Services LLC (“S&P”). GICS® is a service mark of MSCI and S&P and has been licensed for use by U.S. Bank Global Fund Services. |
| Hood River International Opportunity Fund | PAGE 2 | TSR_AR_56170L760 |
| Hood River International Opportunity Fund | PAGE 3 | TSR_AR_56170L760 |
 | Hood River International Opportunity Fund | |
| Retirement Shares | HRITX | ||
| Annual Shareholder Report | June 30, 2024 |
Class Name | Costs of a $10,000 investment | Costs paid as a percentage of a $10,000 investment |
| Retirement Shares | $137 | 1.21% |
Top Contributors | |
| ↑ | FTAI Aviation Ltd. |
| ↑ | Micronics Japan Co., Ltd. |
| ↑ | Camtek Ltd |
| ↑ | Applied Digital Corporation |
| ↑ | Voltamp Transformers Limited |
Top Detractors | |
| ↓ | Establishment Labs Holdings, Inc. |
| ↓ | Inspired Entertainment, Inc. |
| ↓ | ODDITY Tech Ltd. |
| ↓ | Lilium N.V. |
| ↓ | Toyo Gosei Co., Ltd. |
| Hood River International Opportunity Fund | PAGE 1 | TSR_AR_56170L752 |
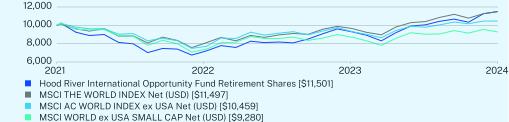
1 Year | Since Inception (12/22/2021) | |
Retirement Shares | 26.81 | 5.70 |
MSCI THE WORLD INDEX Net (USD) | 20.19 | 5.69 |
MSCI AC WORLD INDEX ex USA Net (USD) | 11.62 | 1.80 |
MSCI WORLD INDEX ex USA SMALL CAP Net (USD) | 7.80 | -2.92 |
| * | The Fund’s past performance is not a good predictor of the Fund’s future performance. The returns do not reflect the deduction of taxes that a shareholder would pay on Fund distributions or redemption of Fund shares. |
Net Assets | $14,341,428 |
Number of Holdings | 97 |
Net Advisory Fee | $0 |
Portfolio Turnover Rate | 119% |

Top 10 Holdings | (% of Net Assets) |
Applied Digital Corp. | 6.2% |
Marubeni Corp. | 4.0% |
GFL Environmental, Inc. | 2.9% |
First American Treasury Obligations Fund | 2.3% |
Voltamp Transformers Ltd. | 2.1% |
Camtek Ltd./Israel | 2.0% |
Denison Mines Corp. | 1.9% |
Alphawave IP Group PLC | 1.8% |
VIKING HOLDINGS Ltd. ORD SHS | 1.7% |
Munters Group AB | 1.7% |
| * | The Global Industry Classification Standard (“GICS®”) was developed by and/or is the exclusive property of MSCI, Inc. (“MSCI”) and Standard & Poor’s Financial Services LLC (“S&P”). GICS® is a service mark of MSCI and S&P and has been licensed for use by U.S. Bank Global Fund Services. |
| Hood River International Opportunity Fund | PAGE 2 | TSR_AR_56170L752 |
| Hood River International Opportunity Fund | PAGE 3 | TSR_AR_56170L752 |
| (b) | Not applicable. |
Item 2. Code of Ethics.
The registrant has adopted a code of ethics that applies to the registrant’s principal executive officer and principal financial officer. The registrant has not made any substantive amendments to its code of ethics during the period covered by this report. The registrant has not granted any waivers from any provisions of the code of ethics during the period covered by this report.
A copy of the registrant’s Code of Ethics is filed herewith.
Item 3. Audit Committee Financial Expert.
The registrant’s Board of Trustees has determined that there are at least two audit committee financial experts serving on its audit committee. Messrs. Gaylord B. Lyman and Scott C. Jones are the “audit committee financial experts” and are considered to be “independent” as each term is defined in Item 3 of Form N-CSR.
Item 4. Principal Accountant Fees and Services.
The registrant has engaged its principal accountant to perform audit services and tax services during the past two fiscal years. “Audit services” refer to performing an audit of the registrant’s annual financial statements or services that are normally provided by the accountant in connection with statutory and regulatory filings or engagements for those fiscal years. “Audit-related services” refer to the assurance and related services by the principal accountant that are reasonably related to the performance of the audit. “Tax services” refer to professional services rendered by the principal accountant for tax compliance, tax advice, and tax planning. There were no “other services” provided by the principal accountant. The following table details the aggregate fees billed or expected to be billed for each of the last two fiscal years for audit fees, audit-related fees, tax fees and other fees by the principal accountant.
| FYE 6/30/2024 | FYE 6/30/2023 | |
| Audit Fees | $28,150 | $26,000 |
| Audit-Related Fees | N/A | N/A |
| Tax Fees | $7,000 | $6,500 |
| All Other Fees | N/A | N/A |
The audit committee has adopted pre-approval policies and procedures that require the audit committee to pre-approve all audit and non-audit services of the registrant, as well as non-audit services provided to the registrant’s investment adviser and any entity controlling, controlled by or under common control with the investment adviser that provides ongoing services to the registrant relating to the operations and financial reporting of the registrant.
The percentage of fees billed by Cohen & Company Ltd. applicable to non-audit services pursuant to waiver of the pre-approval requirement were as follows for each of the Hood River Small-Cap Growth Fund and the Hood River International Opportunity Fund:
| FYE 6/30/2024 | FYE 6/30/2023 | |
| Audit-Related Fees | 0% | 0% |
| Tax Fees | 0% | 0% |
| All Other Fees | 0% | 0% |
The following table indicates the non-audit fees billed or expected to be billed by the registrant’s accountant for services to the registrant and to the registrant’s investment adviser (and any other controlling entity, etc.—not sub-adviser) for the last two years.
| Non-Audit Related Fees | FYE 6/30/2024 | FYE 6/30/2023 |
| Registrant | N/A | N/A |
| Registrant’s Investment Adviser | N/A | N/A |
Item 5. Audit Committee of Listed Registrants.
Not applicable.
Item 6. Investments.
| (a) | Schedule of Investments is included as part of the financial statements filed under Item 7 of this Form. |
| (b) | Not applicable. |
Item 7. Financial Statements and Financial Highlights for Open-End Investment Companies.
| (a) |
Page | |||
Schedule of Investments | |||
Financial Highlights | |||
Shares | Value | |||||
COMMON STOCKS - 95.4% | ||||||
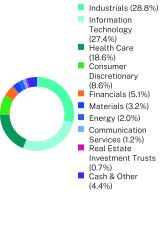
COMMUNICATION SERVICES - 1.2% | ||||||
Diversified Telecommunication Services - 1.0% | ||||||
Cogent Communications Holdings, Inc.(a) | 467,731 | $ 26,398,738 | ||||
Media & Entertainment – 0.2% | ||||||
Webtoon Entertainment, Inc.(b) | 268,357 | 6,126,590 | ||||
TOTAL COMMUNICATION SERVICES | 32,525,328 | |||||
CONSUMER DISCRETIONARY - 8.6% | ||||||
Broadline Retail - 1.1% | ||||||
Global-e Online Ltd.(a)(b) | 478,491 | 17,354,868 | ||||
Ollie’s Bargain Outlet Holdings, Inc.(a)(b) | 124,204 | 12,193,107 | ||||
29,547,975 | ||||||
Diversified Consumer Services - 0.5% | ||||||
Duolingo, Inc.(a)(b) | 67,490 | 14,083,138 | ||||
Hotels, Restaurants & Leisure - 4.1% | ||||||
Caesars Entertainment, Inc.(b) | 549,198 | 21,825,128 | ||||
Cava Group, Inc.(a)(b) | 346,437 | 32,132,032 | ||||
Genius Sports Ltd.(b) | 960,031 | 5,232,169 | ||||
Life Time Group Holdings, Inc.(a)(b) | 1,009,323 | 19,005,552 | ||||
Sweetgreen, Inc. - Class A(a)(b) | 971,235 | 29,273,023 | ||||
107,467,904 | ||||||
Household Durables - 1.5% | ||||||
Lovesac Co.(a)(b) | 454,265 | 10,257,304 | ||||
SharkNinja, Inc. | 379,769 | 28,539,640 | ||||
38,796,944 | ||||||
Specialty Retail - 0.4% | ||||||
Arhaus, Inc.(a) | 606,673 | 10,277,041 | ||||
Textiles, Apparel & Luxury Goods - 1.0% | ||||||
Amer Sports, Inc.(a)(b) | 2,027,384 | 25,484,217 | ||||
TOTAL CONSUMER DISCRETIONARY | 225,657,219 | |||||
CONSUMER STAPLES - 0.5% | ||||||
Personal Care Products - 0.5% | ||||||
Oddity Tech Ltd. - Class A(a)(b) | 349,749 | 13,731,146 | ||||
TOTAL CONSUMER STAPLES | 13,731,146 | |||||
ENERGY - 2.0% | ||||||
Oil, Gas & Consumable Fuels - 2.0% | ||||||
Denison Mines Corp.(b) | 14,843,478 | 29,538,521 | ||||
Northern Oil & Gas, Inc.(a) | 504,994 | 18,770,627 | ||||
1 |
Shares | Value | |||||
COMMON STOCKS - (Continued) | ||||||
ENERGY - (Continued) | ||||||
Oil, Gas & Consumable Fuels - (Continued) | ||||||
Scorpio Tankers, Inc. | 64,399 | $ 5,234,995 | ||||
53,544,143 | ||||||
TOTAL ENERGY | 53,544,143 | |||||
FINANCIALS - 5.1% | ||||||
Banks - 1.4% | ||||||
Customers Bancorp, Inc.(b) | 329,557 | 15,812,145 | ||||
Western Alliance Bancorp | 334,191 | 20,993,879 | ||||
36,806,024 | ||||||
Consumer Finance - 1.3% | ||||||
FirstCash Holdings, Inc. | 326,942 | 34,289,677 | ||||
Financial Services - 0.6% | ||||||
I3 Verticals, Inc. - Class A(a)(b) | 695,931 | 15,366,156 | ||||
Insurance - 1.8% | ||||||
HCI Group, Inc.(a) | 453,999 | 41,845,088 | ||||
Root, Inc.(a)(b) | 112,463 | 5,804,215 | ||||
47,649,303 | ||||||
TOTAL FINANCIALS | 134,111,160 | |||||
HEALTH CARE - 18.6% | ||||||
Biotechnology - 9.4% | ||||||
Biohaven Ltd.(a)(b) | 193,464 | 6,715,135 | ||||
Blueprint Medicines Corp.(a)(b) | 263,633 | 28,414,365 | ||||
Crinetics Pharmaceuticals, Inc.(b) | 212,313 | 9,509,499 | ||||
Cytokinetics, Inc.(a)(b) | 390,280 | 21,145,370 | ||||
Insmed, Inc.(a)(b) | 693,112 | 46,438,504 | ||||
Iovance Biotherapeutics, Inc.(a)(b) | 1,408,584 | 11,296,844 | ||||
Krystal Biotech, Inc.(a)(b) | 275,426 | 50,579,231 | ||||
Neurocrine Biosciences, Inc.(b) | 126,422 | 17,404,517 | ||||
REVOLUTION Medicines, Inc.(b) | 476,913 | 18,508,993 | ||||
Scholar Rock Holding Corp.(a)(b) | 420,114 | 3,499,549 | ||||
TG Therapeutics, Inc.(a)(b) | 815,949 | 14,515,733 | ||||
Viking Therapeutics, Inc.(a)(b) | 373,563 | 19,802,575 | ||||
247,830,315 | ||||||
Health Care Equipment & Supplies - 3.6% | ||||||
AtriCure, Inc.(a)(b) | 935,154 | 21,293,456 | ||||
Haemonetics Corp.(a)(b) | 144,030 | 11,915,602 | ||||
Inspire Medical Systems, Inc.(a)(b) | 48,982 | 6,555,261 | ||||
Lantheus Holdings, Inc.(b) | 571,727 | 45,903,961 | ||||
TransMedics Group, Inc.(b) | 66,293 | 9,985,052 | ||||
95,653,332 | ||||||
2 |
Shares | Value | |||||
COMMON STOCKS - (Continued) | ||||||
HEALTH CARE - (Continued) | ||||||
Health Care Providers & Services - 3.1% | ||||||
Alignment Healthcare, Inc.(a)(b) | 1,821,926 | $ 14,247,461 | ||||
Option Care Health, Inc.(b) | 920,147 | 25,488,072 | ||||
RadNet, Inc.(a)(b) | 589,519 | 34,734,460 | ||||
Select Medical Holdings Corp. | 223,501 | 7,835,945 | ||||
82,305,938 | ||||||
Health Care Technology - 0.6% | ||||||
Evolent Health, Inc. - Class A(a)(b) | 849,221 | 16,237,106 | ||||
Pharmaceuticals - 1.9% | ||||||
Axsome Therapeutics, Inc.(a)(b) | 286,036 | 23,025,898 | ||||
Intra-Cellular Therapies, Inc.(b) | 252,695 | 17,307,081 | ||||
Verona Pharma PLC - ADR(a)(b) | 550,651 | 7,962,413 | ||||
48,295,392 | ||||||
TOTAL HEALTH CARE | 490,322,083 | |||||
INDUSTRIALS - 28.8%(c) | ||||||
Aerospace & Defense - 2.4% | ||||||
Axon Enterprise, Inc.(b) | 117,944 | 34,703,843 | ||||
Kratos Defense & Security Solutions, Inc.(a)(b) | 1,406,028 | 28,134,620 | ||||
62,838,463 | ||||||
Commercial Services & Supplies - 2.5% | ||||||
CECO Environmental Corp.(b) | 320,223 | 9,238,433 | ||||
Clean Harbors, Inc.(b) | 256,867 | 58,090,472 | ||||
67,328,905 | ||||||
Construction & Engineering - 8.2% | ||||||
API Group Corp.(b) | 598,893 | 22,536,344 | ||||
Comfort Systems USA, Inc. | 190,275 | 57,866,433 | ||||
Construction Partners, Inc. - Class A(b) | 280,199 | 15,469,787 | ||||
Fluor Corp.(b) | 576,262 | 25,096,210 | ||||
Granite Construction, Inc.(a) | 248,648 | 15,408,716 | ||||
MasTec, Inc.(a)(b) | 631,407 | 67,554,235 | ||||
MDU Resources Group, Inc. | 513,139 | 12,879,789 | ||||
216,811,514 | ||||||
Electrical Equipment - 2.2% | ||||||
American Superconductor Corp.(a)(b) | 1,016,506 | 23,776,075 | ||||
Vertiv Holdings Co. - Class A | 407,919 | 35,313,548 | ||||
59,089,623 | ||||||
Ground Transportation - 3.5% | ||||||
FTAI Infrastructure, Inc. | 1,756,852 | 15,161,632 | ||||
RXO, Inc.(b) | 966,459 | 25,272,903 | ||||
TFI International, Inc.(a) | 127,005 | 18,436,046 | ||||
3 |
Shares | Value | |||||
COMMON STOCKS - (Continued) | ||||||
INDUSTRIALS - (Continued) | ||||||
Ground Transportation - (Continued) | ||||||
XPO, Inc.(a)(b) | 308,046 | $ 32,699,083 | ||||
91,569,664 | ||||||
Machinery - 1.0% | ||||||
Flowserve Corp.(a) | 259,370 | 12,475,697 | ||||
SPX Technologies, Inc.(b) | 97,713 | 13,888,926 | ||||
26,364,623 | ||||||
Marine Transportation - 2.0% | ||||||
Kirby Corp.(b) | 431,660 | 51,682,652 | ||||
Trading Companies & Distributors - 7.0% | ||||||
FTAI Aviation Ltd.(a) | 1,648,164 | 170,139,970 | ||||
Transcat, Inc.(a)(b) | 116,312 | 13,920,220 | ||||
184,060,190 | ||||||
TOTAL INDUSTRIALS | 759,745,634 | |||||
INFORMATION TECHNOLOGY - 27.4%(c) | ||||||
Communications Equipment - 0.9% | ||||||
Applied Optoelectronics, Inc.(a)(b) | 811,963 | 6,731,173 | ||||
Infinera Corp.(a)(b) | 2,798,887 | 17,045,222 | ||||
23,776,395 | ||||||
Electronic Equipment, Instruments & Components - 3.7% | ||||||
Coherent Corp.(b) | 756,786 | 54,836,714 | ||||
Itron, Inc.(b) | 119,991 | 11,874,309 | ||||
OSI Systems, Inc.(b) | 187,582 | 25,796,277 | ||||
TTM Technologies, Inc.(b) | 268,649 | 5,219,850 | ||||
97,727,150 | ||||||
IT Services - 2.3% | ||||||
Applied Digital Corp.(b) | 4,848,159 | 28,846,546 | ||||
Couchbase, Inc.(b) | 963,776 | 17,598,550 | ||||
DigitalOcean Holdings, Inc.(a)(b) | 427,147 | 14,843,358 | ||||
61,288,454 | ||||||
Semiconductors & Semiconductor Equipment - 12.5% | ||||||
Camtek Ltd./Israel(a) | 347,803 | 43,558,848 | ||||
FormFactor, Inc.(a)(b) | 943,770 | 57,126,398 | ||||
Ichor Holdings Ltd.(b) | 655,264 | 25,260,427 | ||||
indie Semiconductor, Inc. - Class A(a)(b) | 2,041,279 | 12,594,691 | ||||
MACOM Technology Solutions Holdings, Inc.(a)(b) | 370,728 | 41,325,050 | ||||
MaxLinear, Inc.(b) | 714,558 | 14,391,198 | ||||
Onto Innovation, Inc.(b) | 210,042 | 46,116,822 | ||||
Rambus, Inc.(b) | 1,136,944 | 66,806,830 | ||||
Silicon Motion Technology Corp. - ADR | 155,834 | 12,620,996 | ||||
4 |
Shares | Value | |||||
COMMON STOCKS - (Continued) | ||||||
INFORMATION TECHNOLOGY - (Continued) | ||||||
Semiconductors & Semiconductor Equipment - (Continued) | ||||||
Ultra Clean Holdings, Inc.(b) | 215,697 | $ 10,569,153 | ||||
330,370,413 | ||||||
Software - 8.0% | ||||||
ACI Worldwide, Inc.(b) | 1,276,840 | 50,550,096 | ||||
Clearwater Analytics Holdings, Inc. - Class A(b) | 1,252,653 | 23,199,134 | ||||
CyberArk Software Ltd.(b) | 122,083 | 33,379,934 | ||||
Intapp, Inc.(a)(b) | 126,384 | 4,634,501 | ||||
Iris Energy Ltd.(a)(b) | 712,174 | 8,040,444 | ||||
Q2 Holdings, Inc.(a)(b) | 659,825 | 39,807,242 | ||||
Terawulf, Inc.(a)(b) | 2,753,463 | 12,252,910 | ||||
Varonis Systems, Inc.(b) | 799,431 | 38,348,705 | ||||
210,212,966 | ||||||
TOTAL INFORMATION TECHNOLOGY | 723,375,378 | |||||
MATERIALS - 3.2% | ||||||
Chemicals - 0.9% | ||||||
Aspen Aerogels, Inc.(b) | 1,048,847 | 25,015,001 | ||||
Construction Materials - 2.3% | ||||||
Eagle Materials, Inc. | 146,797 | 31,922,475 | ||||
Knife River Corp.(b) | 395,184 | 27,718,206 | ||||
59,640,681 | ||||||
TOTAL MATERIALS | 84,655,682 | |||||
TOTAL COMMON STOCKS (Cost $1,832,065,402) | 2,517,667,773 | |||||
REAL ESTATE INVESTMENT TRUSTS - 0.7% | ||||||
Financial Services - 0.7% | ||||||
Hannon Armstrong Sustainable Infrastructure Capital, Inc.(a) | 588,628 | 17,423,389 | ||||
TOTAL REAL ESTATE INVESTMENT TRUSTS (Cost $13,885,411) | 17,423,389 | |||||
Units | ||||||
SHORT-TERM INVESTMENTS - 17.6% | ||||||
Investments Purchased with Proceeds from Securities Lending - 13.9% | ||||||
Mount Vernon Liquid Assets Portfolio, LLC | 367,137,073 | 367,137,073 | ||||
5 |
Shares | Value | |||||
SHORT-TERM INVESTMENTS - (Continued) | ||||||
Money Market Funds - 3.7% | ||||||
First American Treasury Obligations Fund - Class Z, 5.17%(d) | 97,498,087 | $97,498,087 | ||||
TOTAL SHORT-TERM INVESTMENTS (Cost $464,635,160) | 464,635,160 | |||||
TOTAL INVESTMENTS - 113.7% (Cost $2,310,585,973) | $2,999,726,322 | |||||
Liabilities in Excess of Other Assets - (13.7)% | (362,062,495) | |||||
TOTAL NET ASSETS - 100.0% | $2,637,663,827 | |||||
(a) | All or a portion of this security is on loan as of June 30, 2024. The total market value of these securities was $359,741,377 which represented 13.6% of net assets. |
(b) | Non-income producing security. |
(c) | To the extent that the Fund invests more heavily in a particular industry or sector of the economy, its performance will be especially sensitive to developments that significantly affect those industries or sectors. |
(d) | The rate shown represents the 7-day effective yield as of June 30, 2024. |
6 |
Shares | Value | |||||
COMMON STOCKS - 95.2% | ||||||
COMMUNICATION SERVICES - 0.8% | ||||||
Media & Entertainment - 0.8% | ||||||
Webtoon Entertainment, Inc. | 5,300 | $ 120,999 | ||||
TOTAL COMMUNICATION SERVICES | 120,999 | |||||
CONSUMER DISCRETIONARY - 12.6% | ||||||
Automobile Components - 3.8% | ||||||
Aisan Industry Co. Ltd. | 4,486 | 39,246 | ||||
MRF Ltd. | 106 | 164,459 | ||||
Nifco, Inc. | 2,838 | 68,041 | ||||
Niterra Co. Ltd. | 4,800 | 139,971 | ||||
Sumitomo Rubber Industries Ltd. | 8,800 | 88,290 | ||||
Toyoda Gosei Co. Ltd. | 2,293 | 40,521 | ||||
540,528 | ||||||
Broadline Retail - 0.6% | ||||||
Jumia Technologies AG - ADR(a) | 13,225 | 92,840 | ||||
Hotels, Restaurants & Leisure - 4.1% | ||||||
Basic-Fit NV(a)(b) | 2,263 | 48,760 | ||||
Despegar.com Corp.(a) | 14,461 | 191,319 | ||||
eDreams ODIGEO SA(a) | 22,046 | 153,466 | ||||
Genius Sports Ltd.(a) | 27,015 | 147,232 | ||||
HomeToGo SE(a) | 28,129 | 55,279 | ||||
596,056 | ||||||
Household Durables - 1.0% | ||||||
Nikon Corp. | 13,700 | 139,032 | ||||
Management of Companies and Enterprises - 1.7% | ||||||
Viking Holdings Ltd. ORD SHS(a) | 7,234 | 245,522 | ||||
Textiles, Apparel & Luxury Goods - 1.4% | ||||||
Amer Sports, Inc.(a) | 10,227 | 128,553 | ||||
Asics Corp. | 4,400 | 67,840 | ||||
196,393 | ||||||
TOTAL CONSUMER DISCRETIONARY | 1,810,371 | |||||
CONSUMER STAPLES - 2.7% | ||||||
Consumer Staples Distribution & Retail - 1.1% | ||||||
BBB Foods, Inc. - Class A(a) | 4,958 | 118,298 | ||||
Redcare Pharmacy NV(a)(b) | 322 | 39,279 | ||||
157,577 | ||||||
Personal Care Products - 1.6% | ||||||
Oddity Tech Ltd. - Class A(a) | 4,020 | 157,825 | ||||
Warpaint London PLC | 9,025 | 70,504 | ||||
228,329 | ||||||
TOTAL CONSUMER STAPLES | 385,906 | |||||
7 |
Shares | Value | |||||
COMMON STOCKS - (Continued) | ||||||
ENERGY - 5.7% | ||||||
Energy Equipment & Services - 0.7% | ||||||
Secure Energy Services, Inc. | 10,554 | $ 93,424 | ||||
Oil, Gas & Consumable Fuels - 5.0% | ||||||
Denison Mines Corp.(a) | 139,465 | 277,536 | ||||
Great Eastern Shipping Co. Ltd. | 14,079 | 206,451 | ||||
NexGen Energy Ltd.(a) | 33,396 | 233,104 | ||||
717,091 | ||||||
TOTAL ENERGY | 810,515 | |||||
FINANCIALS - 8.4% | ||||||
Banks - 1.0% | ||||||
Sumitomo Mitsui Trust Holdings, Inc. | 6,431 | 147,792 | ||||
Capital Markets - 1.0% | ||||||
Plus500 Ltd. | 5,135 | 147,626 | ||||
Consumer Finance - 2.8% | ||||||
Kaspi.KZ JSC - ADR | 1,310 | 169,003 | ||||
Sundaram Finance Ltd. | 3,996 | 224,583 | ||||
393,586 | ||||||
Financial Services - 1.2% | ||||||
Payfare, Inc.(a) | 39,137 | 177,655 | ||||
Insurance - 2.4% | ||||||
Just Group PLC | 136,748 | 181,515 | ||||
Revo Insurance SpA | 16,717 | 162,560 | ||||
344,075 | ||||||
TOTAL FINANCIALS | 1,210,734 | |||||
HEALTH CARE - 4.3% | ||||||
Biotechnology - 0.1% | ||||||
Exscientia PLC - ADR(a) | 2,680 | 13,668 | ||||
Electronic Equipment, Instruments & Components - 1.1% | ||||||
Jeol Ltd. | 3,500 | 158,944 | ||||
Health Care Equipment & Supplies - 1.9% | ||||||
Establishment Labs Holdings, Inc.(a) | 950 | 43,168 | ||||
Implantica AG(a) | 72,597 | 226,031 | ||||
269,199 | ||||||
Health Care Technology - 0.4% | ||||||
Craneware PLC | 1,743 | 50,896 | ||||
8 |
Shares | Value | |||||
COMMON STOCKS - (Continued) | ||||||
HEALTH CARE - (Continued) | ||||||
Pharmaceuticals - 0.8% | ||||||
Dr Reddy’s Laboratories Ltd. | 1,160 | $ 88,977 | ||||
Verona Pharma PLC - ADR(a) | 1,898 | 27,445 | ||||
116,422 | ||||||
TOTAL HEALTH CARE | 609,129 | |||||
INDUSTRIALS - 30.7%(d) | ||||||
Aerospace & Defense - 3.7% | ||||||
Bharat Electronics Ltd. | 43,516 | 159,253 | ||||
Bombardier, Inc. - Class B(a) | 2,897 | 185,778 | ||||
Hindustan Aeronautics Ltd. | 2,881 | 181,709 | ||||
526,740 | ||||||
Building Products - 3.5% | ||||||
Grupo Rotoplas SAB de CV | 42,595 | 63,677 | ||||
Munters Group AB(b) | 12,664 | 238,511 | ||||
Nitto Boseki Co. Ltd. | 4,800 | 195,505 | ||||
497,693 | ||||||
Commercial Services & Supplies - 4.0% | ||||||
DO & CO AG | 402 | 71,562 | ||||
GFL Environmental, Inc. | 10,696 | 416,395 | ||||
ION Exchange India Ltd. | 13,700 | 94,219 | ||||
582,176 | ||||||
Construction & Engineering - 1.8% | ||||||
Ahluwalia Contracts India Ltd. | 5,762 | 85,957 | ||||
Larsen & Toubro Ltd. | 3,992 | 169,571 | ||||
255,528 | ||||||
Electrical Equipment - 4.3% | ||||||
CG Power & Industrial Solutions Ltd. | 11,800 | 99,599 | ||||
Triveni Turbine Ltd. | 28,733 | 213,599 | ||||
Voltamp Transformers Ltd. | 2,325 | 306,334 | ||||
619,532 | ||||||
Ground Transportation - 1.5% | ||||||
Grupo Traxion SAB de CV(a)(b) | 31,567 | 46,932 | ||||
TFI International, Inc. | 1,207 | 175,208 | ||||
222,140 | ||||||
Machinery - 6.3% | ||||||
AIA Engineering Ltd. | 1,113 | 55,671 | ||||
Alfa Laval AB | 2,287 | 100,151 | ||||
Cummins India Ltd. | 2,900 | 137,705 | ||||
Elgi Equipments Ltd. | 7,904 | 67,969 | ||||
Kurita Water Industries Ltd. | 2,000 | 84,984 | ||||
Mitsubishi Heavy Industries Ltd. | 10,707 | 115,262 | ||||
Nomura Micro Science Co. Ltd. | 1,600 | 43,187 | ||||
9 |
Shares | Value | |||||
COMMON STOCKS - (Continued) | ||||||
INDUSTRIALS - (Continued) | ||||||
Machinery - (Continued) | ||||||
Pentair PLC | 1,271 | $ 97,448 | ||||
Silex Systems Ltd.(a) | 5,360 | 18,915 | ||||
Thermax Ltd. | 1,475 | 94,615 | ||||
VAT Group AG(b) | 147 | 83,004 | ||||
898,911 | ||||||
Trading Companies & Distributors - 5.6% | ||||||
FTAI Aviation Ltd. | 2,228 | 229,996 | ||||
Marubeni Corp. | 30,773 | 570,611 | ||||
800,607 | ||||||
TOTAL INDUSTRIALS | 4,403,327 | |||||
INFORMATION TECHNOLOGY - 22.1% | ||||||
Electronic Equipment, Instruments & Components - 1.6% | ||||||
Kaynes Technology India Ltd.(a) | 2,412 | 111,362 | ||||
Nayax Ltd.(a) | 5,313 | 113,698 | ||||
225,060 | ||||||
IT Services - 6.9% | ||||||
Applied Digital Corp.(a) | 150,637 | 896,290 | ||||
Globant SA(a) | 570 | 101,608 | ||||
997,898 | ||||||
Semiconductors & Semiconductor Equipment - 10.0% | ||||||
Alphawave IP Group PLC(a) | 143,503 | 260,538 | ||||
ASMPT Ltd. | 5,800 | 80,321 | ||||
BE Semiconductor Industries NV | 477 | 79,683 | ||||
Camtek Ltd./Israel | 2,243 | 280,913 | ||||
Kokusai Electric Corp. | 2,293 | 67,422 | ||||
Powertech Technology, Inc. | 39,000 | 225,507 | ||||
Renesas Electronics Corp. | 5,542 | 105,102 | ||||
Shibaura Mechatronics Corp. | 3,004 | 158,858 | ||||
SPEL Semiconductor Ltd.(a) | 42,795 | 110,211 | ||||
WONIK IPS Co. Ltd.(a) | 2,428 | 60,887 | ||||
1,429,442 | ||||||
Software - 2.6% | ||||||
Iris Energy Ltd.(a) | 11,138 | 125,748 | ||||
Sylogist Ltd. | 9,377 | 69,366 | ||||
Zoo Digital Group PLC(a) | 219,891 | 179,286 | ||||
374,400 | ||||||
Technology Hardware, Storage & Peripherals - 1.0% | ||||||
Asia Vital Components Co. Ltd. | 6,231 | 145,906 | ||||
TOTAL INFORMATION TECHNOLOGY | 3,172,706 | |||||
10 |
Shares | Value | |||||
COMMON STOCKS - (Continued) | ||||||
MATERIALS - 4.0% | ||||||
Chemicals - 1.6% | ||||||
Kemira Oyj | 9,252 | $ 225,289 | ||||
Metals & Mining - 2.4% | ||||||
Ferroglobe PLC | 20,816 | 111,574 | ||||
Jindal Saw Ltd. | 19,999 | 129,974 | ||||
Vedanta Ltd. | 18,600 | 101,177 | ||||
342,725 | ||||||
TOTAL MATERIALS | 568,014 | |||||
REAL ESTATE - 1.6% | ||||||
Real Estate Management & Development - 1.6% | ||||||
Lavvi Empreendimentos Imobiliarios SA | 47,649 | 73,219 | ||||
Tosei Corp. | 10,725 | 162,727 | ||||
235,946 | ||||||
TOTAL REAL ESTATE | 235,946 | |||||
UTILITIES - 2.3% | ||||||
Multi-Utilities - 1.3% | ||||||
Veolia Environnement SA | 5,917 | 177,231 | ||||
Water Utilities - 1.0% | ||||||
VA Tech Wabag Ltd.(a) | 9,600 | 146,928 | ||||
TOTAL UTILITIES | 324,159 | |||||
TOTAL COMMON STOCKS | ||||||
(Cost $11,892,125) | 13,651,806 | |||||
CLOSED END INVESTMENT TRUSTS - 1.4% | ||||||
Sprott Physical Uranium Trust(a) | 11,127 | 206,517 | ||||
TOTAL CLOSED END INVESTMENT TRUSTS (Cost $196,369) | 206,517 | |||||
REAL ESTATE INVESTMENT TRUSTS - 0.5% | ||||||
Industrial REITs - 0.5% | ||||||
FIBRA Macquarie Mexico(b) | 45,171 | 76,688 | ||||
TOTAL REAL ESTATE INVESTMENT TRUSTS (Cost $73,225) | 76,688 | |||||
11 |
Shares | Value | |||||
SHORT-TERM INVESTMENTS - 2.3% | ||||||
Money Market Funds - 2.3% | ||||||
First American Treasury Obligations Fund - Class X, 5.21%(c) | 326,838 | $326,838 | ||||
TOTAL SHORT-TERM INVESTMENTS (Cost $326,838) | 326,838 | |||||
TOTAL INVESTMENTS - 99.4% (Cost $12,488,557) | $14,261,849 | |||||
Other Assets in Excess of Liabilities - 0.6% | 79,579 | |||||
TOTAL NET ASSETS - 100.0% | $14,341,428 | |||||
(a) | Non-income producing security. |
(b) | Security is exempt from registration pursuant to Rule 144A under the Securities Act of 1933, as amended. These securities may only be resold in transactions exempt from registration to qualified institutional investors. As of June 30, 2024, the value of these securities total $533,174 or 3.7% of the Fund’s net assets. |
(c) | The rate shown represents the 7-day effective yield as of June 30, 2024. |
(d) | To the extent that the Fund invests more heavily in a particular industry or sector of the economy, its performance will be especially sensitive to developments that significantly affect those industries or sectors. |
12 |
Hood River Small-Cap Growth Fund | Hood River International Opportunity Fund | |||||
Assets: | ||||||
Investments at value* (Including securities on loan valued at $359,741,377 and $0, respectively) | $2,999,726,322 | $14,261,849 | ||||
Foreign Currency at value ** | — | 391 | ||||
Cash | 25,760 | — | ||||
Receivables: | ||||||
Securities sold | 45,636,701 | 196,874 | ||||
Fund shares sold | 3,355,596 | 70,000 | ||||
Dividends and interest | 730,657 | 8,039 | ||||
Securities lending income | 42,046 | — | ||||
Due From Advisor | — | 15,075 | ||||
Prepaid expenses | 187,130 | 39,236 | ||||
Total assets | 3,049,704,212 | 14,591,464 | ||||
Liabilities: | ||||||
Payables: | ||||||
Payable upon return of collateral for securities loaned | 367,137,073 | — | ||||
Securities purchased | 41,142,086 | 200,319 | ||||
Advisory fee | 1,857,463 | — | ||||
Fund shares redeemed | 1,028,596 | — | ||||
Service fees | 308,943 | 1,817 | ||||
Distribution fees | 195,433 | 331 | ||||
Administration and fund accounting fees | 164,963 | 4,237 | ||||
Transfer agent fees and expenses | 40,616 | 9,599 | ||||
Printing and Mailing Fees | 30,521 | 5,219 | ||||
Custody fees | 23,757 | 4,414 | ||||
Audit Fees | 16,739 | 18,096 | ||||
Compliance fees | 2,092 | 2,032 | ||||
Other accrued expenses | 92,103 | 3,972 | ||||
Total liabilities | 412,040,385 | 250,036 | ||||
Net assets | $2,637,663,827 | $14,341,428 | ||||
Net Assets Consist of: | ||||||
Capital stock | $1,971,542,106 | $13,053,405 | ||||
Total distributable earnings | 666,121,721 | 1,288,023 | ||||
Net Assets | $2,637,663,827 | $14,341,428 | ||||
* Investments at cost | $2,310,585,973 | $12,488,557 | ||||
** Foreign currency at cost | $— | $391 | ||||
Investor Shares: | ||||||
Net assets applicable to outstanding Investor Shares | $185,678,997 | $411,609 | ||||
Shares issued (Unlimited number of beneficial interest authorized, $0.01 par value) | 2,853,801 | $36,513 | ||||
Net asset value, offering price and redemption price per share | $65.06 | $11.27 | ||||
13 |
Hood River Small-Cap Growth Fund | Hood River International Opportunity Fund | |||||
Institutional Shares: | ||||||
Net assets applicable to outstanding Institutional Shares | $1,392,826,265 | $11,446,079 | ||||
Shares issued (Unlimited number of beneficial interest authorized, $0.01 par value) | 20,936,932 | 1,013,362 | ||||
Net asset value, offering price and redemption price per share | $66.52 | $11.30 | ||||
Retirement Shares: | ||||||
Net assets applicable to outstanding Retirement Shares | $1,059,158,565 | $2,483,740 | ||||
Shares issued (Unlimited number of beneficial interest authorized, $0.01 par value) | 15,822,529 | 219,439 | ||||
Net asset value, offering price and redemption price per share | $66.94 | $11.32 | ||||
14 |
Hood River Small-Cap Growth Fund | Hood River International Opportunity Fund | |||||
Investment income: | ||||||
Dividends (net of foreign taxes withheld of $131,504 and $9,422, respectively) | $7,827,994 | $60,780 | ||||
Interest | 2,557,892 | 21,583 | ||||
Securities lending income | 856,197 | — | ||||
Total investment income | 11,242,083 | 82,363 | ||||
Expenses: | ||||||
Investment advisory fees (Note 4) | 17,110,292 | 69,715 | ||||
Administration and fund accounting fees (Note 4) | 830,554 | 24,099 | ||||
Service fees (Note 6) | ||||||
Service fees - Investor Shares | 126,453 | 97 | ||||
Service fees - Institutional Shares | 768,529 | 2,774 | ||||
Distribution fees (Note 5) | ||||||
Distribution fees - Investor Shares | 312,341 | 331 | ||||
Transfer agent fees and expenses | 244,536 | 75,078 | ||||
Federal and state registration fees | 219,572 | 40,556 | ||||
Reports to shareholders | 126,540 | 4,178 | ||||
Custody fees | 114,034 | 17,564 | ||||
Trustees’ fees and expenses | 30,000 | 29,908 | ||||
Legal fees | 27,238 | 34,362 | ||||
Audit fees | 16,746 | 22,398 | ||||
Compliance expense | 12,352 | 12,354 | ||||
Other | 37,401 | 15,334 | ||||
Total expenses before reimbursement from advisor | 19,976,588 | 348,748 | ||||
Expense recoupment to (reimbursement from) Advisor (Note 4) | 56,290 | (269,486) | ||||
Net expenses | 20,032,878 | 79,262 | ||||
Net investment income (loss) | $(8,790,795) | $3,101 | ||||
Realized and unrealized gain (loss) on investments: | ||||||
Net realized gain (loss) on transactions from: | ||||||
Investments | $114,205,889 | $209,418 | ||||
Foreign currency related transactions | — | (13,875) | ||||
Net change in unrealized appreciation on: | ||||||
Investments | 355,795,924 | 1,452,007 | ||||
Foreign currency related translations | — | 11,253 | ||||
Net realized and unrealized gain on investments | 470,001,813 | 1,658,803 | ||||
Net increase in net assets resulting from operations | $461,211,018 | $1,661,904 | ||||
15 |
Hood River Small-Cap Growth Fund | ||||||
Year Ended June 30, | ||||||
2024 | 2023 | |||||
Operations: | ||||||
Net investment loss | $(8,790,795) | $(6,294,777) | ||||
Net realized gain (loss) on investments | 114,205,889 | (107,293,666) | ||||
Net change in unrealized appreciation on investments | 355,795,924 | 330,954,691 | ||||
Net increase in net assets resulting from operations | 461,211,018 | 217,366,248 | ||||
Capital Share Transactions: | ||||||
Proceeds from shares sold | ||||||
Investor shares | 113,611,267 | 51,175,497 | ||||
Institutional shares | 651,973,250 | 354,068,959 | ||||
Retirement shares | 251,377,698 | 177,286,523 | ||||
Cost of shares redeemed | ||||||
Investor shares | (48,617,075) | (15,412,272) | ||||
Institutional shares | (214,509,296) | (165,348,295) | ||||
Retirement shares | (131,526,849) | (92,821,897) | ||||
Net increase in net assets from capital share transactions | 622,308,995 | 308,948,515 | ||||
Total Increase in Net Assets | 1,083,520,013 | 526,314,763 | ||||
Net Assets: | ||||||
Beginning of year | 1,554,143,814 | 1,027,829,051 | ||||
End of year | $2,637,663,827 | $1,554,143,814 | ||||
Changes in Shares Outstanding: | ||||||
Shares sold | ||||||
Investor shares | 2,102,866 | 1,027,397 | ||||
Institutional shares | 11,162,697 | 7,094,441 | ||||
Retirement shares | 4,338,610 | 3,525,994 | ||||
Shares redeemed | ||||||
Investor shares | (858,937) | (318,337) | ||||
Institutional shares | (3,728,665) | (3,330,574) | ||||
Retirement shares | (2,297,504) | (1,871,673) | ||||
Net increase in shares outstanding | 10,719,067 | 6,127,248 | ||||
16 |
Hood River International Opportunity Fund | ||||||
Year Ended June 30, | ||||||
2024 | 2023 | |||||
Operations: | ||||||
Net investment income | $3,101 | $12,606 | ||||
Net realized gain (loss) on investments | 195,543 | (305,922) | ||||
Net change in unrealized appreciation on investments | 1,463,260 | 797,701 | ||||
Net increase in net assets resulting from operations | 1,661,904 | 504,385 | ||||
Distributions: | ||||||
Investor Shares | (1,367) | — | ||||
Institutional Shares | (59,139) | — | ||||
Retirement Shares | (20,029) | — | ||||
Total distributions | (80,535) | — | ||||
Capital Share Transactions: | ||||||
Proceeds from shares sold | ||||||
Investor Shares | 375,632 | — | ||||
Institutional Shares | 9,329,858 | 101,200 | ||||
Retirement Shares | 1,417,676 | 261,932 | ||||
Proceeds from shares issued to holders in reinvestment of dividends | ||||||
Investor Shares | 1,367 | — | ||||
Institutional Shares | 56,155 | — | ||||
Retirement Shares | 20,029 | — | ||||
Cost of shares redeemed | ||||||
Investor Shares | (11,585) | — | ||||
Institutional Shares | (732,597) | (400,015) | ||||
Retirement Shares | (220,999) | (28,888) | ||||
Net increase (decrease) in net assets from capital share transactions | 10,235,536 | (65,771) | ||||
Total increase in net assets | 11,816,905 | 438,614 | ||||
Net Assets: | ||||||
Beginning of year | 2,524,523 | 2,085,909 | ||||
End of year | $14,341,428 | $2,524,523 | ||||
Changes in Shares Outstanding: | ||||||
Shares sold | ||||||
Investor Shares | 37,558 | — | ||||
Institutional Shares | 901,225 | 11,256 | ||||
Retirement Shares | 137,866 | 33,400 | ||||
Proceeds from shares issued to holders in reinvestment of dividends | ||||||
Investor Shares | 146 | — | ||||
Institutional shares | 5,980 | — | ||||
Retirement shares | 2,131 | — | ||||
Shares redeemed | ||||||
Investor shares | (1,191) | — | ||||
Institutional shares | (72,713) | (58,999) | ||||
Retirement shares | (20,636) | (3,881) | ||||
Net increase (decrease) in shares outstanding | 990,366 | (18,224) | ||||
17 |
Year Ended June 30, | |||||||||||||||
2024 | 2023 | 2022 | 2021 | 2020 | |||||||||||
Net Asset Value - Beginning of Year | $52.65 | $44.26 | $75.04 | $44.40 | $41.36 | ||||||||||
Income from Investment Operations: | |||||||||||||||
Net investment loss1 | (0.41) | (0.34) | (0.41) | (0.42) | (0.34) | ||||||||||
Net realized and unrealized gain (loss) on investments | 12.82 | 8.73 | (17.41) | 35.02 | 3.38 | ||||||||||
Total from investment operations | 12.41 | 8.39 | (17.82) | 34.60 | 3.04 | ||||||||||
Less Distributions: | |||||||||||||||
Distributions from net realized gains | — | — | (12.96) | (3.96) | — | ||||||||||
Total distributions | — | — | (12.96) | (3.96) | — | ||||||||||
Net Asset Value - End of Year | $65.06 | $52.65 | $44.26 | $75.04 | $44.40 | ||||||||||
Total Return | 23.57% | 18.96% | (28.85)% | 80.27% | 7.35% | ||||||||||
Ratios and Supplemental Data: | |||||||||||||||
Net assets, end of year (thousands) | $ 185,679 | $ 84,753 | $ 39,866 | $ 18,428 | $ 9,274 | ||||||||||
Ratio of operating expenses to average net assets: | |||||||||||||||
Before recoupments/reimbursements | 1.31% | 1.24% | 1.25% | 1.26% | 1.27% | ||||||||||
After recoupments/reimbursements | 1.31% | 1.24% | 1.25% | 1.25% | 1.25% | ||||||||||
Ratio of net investment loss to average net assets: | |||||||||||||||
Before recoupments/reimbursements | (0.73)% | (0.71)% | (0.71)% | (0.69)% | (0.90)% | ||||||||||
After recoupments/reimbursements | (0.73)% | (0.71)% | (0.71)% | (0.68)% | (0.88)% | ||||||||||
Portfolio turnover rate | 98% | 95% | 77% | 119% | 157% | ||||||||||
1 | The net investment loss per share was calculated using the average shares outstanding method. |
18 |
Year Ended June 30, | |||||||||||||||
2024 | 2023 | 2022 | 2021 | 2020 | |||||||||||
Net Asset Value - Beginning of Year | $53.70 | $45.07 | $76.04 | $44.87 | $41.71 | ||||||||||
Income from Investment Operations: | |||||||||||||||
Net investment loss1 | (0.28) | (0.26) | (0.32) | (0.30) | (0.27) | ||||||||||
Net realized and unrealized gain (loss) on investments | 13.10 | 8.89 | (17.69) | 35.43 | 3.43 | ||||||||||
Total from investment operations | 12.82 | 8.63 | (18.01) | 35.13 | 3.16 | ||||||||||
Less Distributions: | |||||||||||||||
Distributions from net realized gains | — | — | (12.96) | (3.96) | — | ||||||||||
Total distributions | — | — | (12.96) | (3.96) | — | ||||||||||
Net Asset Value - End of Year | $66.52 | $53.70 | $45.07 | $76.04 | $44.87 | ||||||||||
Total Return | 23.89% | 19.15% | (28.71)% | 80.66% | 7.55% | ||||||||||
Ratios and Supplemental Data: | |||||||||||||||
Net assets, end of year (thousands) | $1,392,826 | $725,117 | $438,898 | $433,921 | $257,909 | ||||||||||
Ratio of operating expenses to average net assets: | |||||||||||||||
Before recoupments/reimbursements | 1.07% | 1.07% | 1.06% | 1.06% | 1.07% | ||||||||||
After recoupments/reimbursements | 1.07% | 1.07% | 1.06% | 1.05% | 1.05% | ||||||||||
Ratio of net investment loss to average net assets: | |||||||||||||||
Before recoupments/reimbursements | (0.48)% | (0.53)% | (0.52)% | (0.49)% | (0.69)% | ||||||||||
After recoupments/reimbursements | (0.48)% | (0.53)% | (0.52)% | (0.48)% | (0.67)% | ||||||||||
Portfolio turnover rate | 98% | 95% | 77% | 119% | 157% | ||||||||||
1 | The net investment loss per share was calculated using the average shares outstanding method. |
19 |
Year Ended June 30, | |||||||||||||||
2024 | 2023 | 2022 | 2021 | 2020 | |||||||||||
Net Asset Value - Beginning of Year | $54.01 | $45.28 | $76.29 | $44.98 | $41.78 | ||||||||||
Income from Investment Operations: | |||||||||||||||
Net investment loss1 | (0.23) | (0.22) | (0.29) | (0.26) | (0.25) | ||||||||||
Net realized and unrealized gain (loss) on investments | 13.16 | 8.95 | (17.76) | 35.53 | 3.45 | ||||||||||
Total from investment operations | 12.93 | 8.73 | (18.05) | 35.27 | 3.20 | ||||||||||
Less Distributions: | |||||||||||||||
Distributions from net realized gains | — | — | (12.96) | (3.96) | — | ||||||||||
Total distributions | — | — | (12.96) | (3.96) | — | ||||||||||
Net Asset Value - End of Year | $66.94 | $54.01 | $45.28 | $76.29 | $44.98 | ||||||||||
Total Return | 23.94% | 19.28% | (28.66)% | 80.76% | 7.61% | ||||||||||
Ratios and Supplemental Data: | |||||||||||||||
Net assets, end of year (thousands) | $1,059,159 | $744,273 | $549,066 | $710,935 | $335,863 | ||||||||||
Ratio of operating expenses to average net assets: | |||||||||||||||
Before recoupments/reimbursements | 0.99% | 0.99% | 0.99% | 1.00% | 1.01% | ||||||||||
After recoupments/reimbursements | 0.99% | 0.99% | 0.99% | 0.99% | 0.99% | ||||||||||
Ratio of net investment loss to average net assets: | |||||||||||||||
Before recoupments/reimbursements | (0.40)% | (0.43)% | (0.45)% | (0.41)% | (0.64)% | ||||||||||
After recoupments/reimbursements | (0.40)% | (0.43)% | (0.45)% | (0.40)% | (0.62)% | ||||||||||
Portfolio turnover rate | 98% | 95% | 77% | 119% | 157% | ||||||||||
1 | The net investment loss per share was calculated using the average shares outstanding method. |
20 |
Period from August 11, 2023 through June 30, 2024* | |||
Net Asset Value - Beginning of Period | $9.15 | ||
Income from Investment Operations: | |||
Net investment loss1 | (0.02) | ||
Net realized gain on investments | 2.28 | ||
Total from investment operations | 2.26 | ||
Less Distributions: | |||
Distributions from net investment income | (0.14) | ||
Total distributions | (0.14) | ||
Net Asset Value - End of Period | $11.27 | ||
Total Return | 25.08%^ | ||
Ratios and Supplemental Data: | |||
Net assets, end of period (thousands) | $412 | ||
Ratio of operating expenses to average net assets: | |||
Before reimbursements | 5.15%+ | ||
After reimbursements | 1.47%+ | ||
Ratio of net investment loss to average net assets: | |||
Before reimbursements | (3.87)%+ | ||
After reimbursements | (0.19)%+ | ||
Portfolio turnover rate | 119%^ | ||
* | The Investor Shares class commenced operations on August 11, 2023. |
+ | Annualized |
^ | Not Annualized |
| 1 | The net investment loss per share was calculated using the average shares outstanding method. |
21 |
Year Ended June 30, | September 28, 2021* through June 30, 2022 | ||||||||
2024 | 2023 | ||||||||
Net Asset Value - Beginning of Year (Period) | $9.04 | $7.02 | $10.00 | ||||||
Income from Investment Operations: | |||||||||
Net investment income(loss)1 | 0.01 | 0.04 | (0.03) | ||||||
Net realized and unrealized gain (loss) on investments | 2.39 | 1.98 | (2.93) | ||||||
Total from investment operations | 2.40 | 2.02 | (2.96) | ||||||
Less Distributions: | |||||||||
Distributions from net investment income | (0.14) | — | — | ||||||
Distributions from net realized gains | — | — | (0.02) | ||||||
Total distributions | (0.14) | — | (0.02) | ||||||
Net Asset Value - End of Year (Period) | $11.30 | $9.04 | $7.02 | ||||||
Total Return | 26.73% | 28.77% | (29.65)%^ | ||||||
Ratios and Supplemental Data: | |||||||||
Net assets, end of year (period) (thousands) | $11,446 | $1,618 | $1,590 | ||||||
Ratio of operating expenses to average net assets: | |||||||||
Before reimbursements | 5.53% | 15.95% | 12.57%+ | ||||||
After reimbursements | 1.27% | 1.50% | 1.50%+ | ||||||
Ratio of net investment income (loss) to average net assets: | |||||||||
Before reimbursements | (4.21)% | (13.87)% | (11.57)%+ | ||||||
After reimbursements | 0.05% | 0.58% | (0.50)%+ | ||||||
Portfolio turnover rate | 119% | 172% | 98%^ | ||||||
| * | The Institutional Shares class commenced operations on September 28, 2021. |
+ | Annualized |
^ | Not Annualized |
1 | The net investment income/(loss) per share was calculated using the average shares outstanding method. |
22 |
Year Ended June 30, | December 22, 2021* through June 30, 2022 | ||||||||
2024 | 2023 | ||||||||
Net Asset Value - Beginning of Year (Period) | $9.06 | $7.02 | $10.06 | ||||||
Income from Investment Operations: | |||||||||
Net investment income1 | 0.002 | 0.05 | 0.02 | ||||||
Net realized and unrealized gain (loss) on investments | 2.40 | 1.99 | (3.06) | ||||||
Total from investment operations | 2.40 | 2.04 | (3.04) | ||||||
Less Distributions: | |||||||||
Distributions from net investment income | (0.14) | — | — | ||||||
Total distributions | (0.14) | — | — | ||||||
Net Asset Value - End of Year (Period) | $11.32 | $9.06 | $7.02 | ||||||
Total Return | 26.81% | 29.06% | (30.22)%^ | ||||||
Ratios and Supplemental Data: | |||||||||
Net assets, end of year (period) (thousands) | $ 2,484 | $907 | $496 | ||||||
Ratio of operating expenses to average net assets: | |||||||||
Before reimbursements | 5.61% | 16.29% | 11.80%+ | ||||||
After reimbursements | 1.21% | 1.40% | 1.40%+ | ||||||
Ratio of net investment income (loss) to average net assets: | |||||||||
Before reimbursements | (4.32)% | (14.22)% | (9.95)%+ | ||||||
After reimbursements | 0.08% | 0.67% | 0.45%+ | ||||||
Portfolio turnover rate | 119% | 172% | 98%^ | ||||||
| * | The Retirement Shares class commenced operations on December 22, 2021. |
+ | Annualized |
^ | Not Annualized |
1 | The net investment income per share was calculated using the average shares outstanding method. |
2 | The value is less than 0.005. |
23 |
| A. | Security Valuation: All investments in securities are recorded at their estimated fair value, as described in Note 3. |
| B. | Federal Income Taxes: It is each Fund’s policy to continue to comply with the requirements of Subchapter M of the Internal Revenue Code applicable to regulated investment companies and to distribute substantially all of its taxable income to its shareholders. Therefore, no federal income or excise tax provisions are required. |
| C. | Securities Transactions, Income, Expenses and Distributions: Securities transactions are accounted for on the trade date. Realized gains and losses on securities sold are determined on the basis of identified cost. Interest income is recorded on an accrual basis. Dividend income and distributions to shareholders are recorded on the ex-dividend date. Withholding taxes on foreign dividends have been provided for in accordance with the Funds’ understanding of the applicable country’s tax rules and rates. |
24 |
| D. | Use of Estimates: The preparation of financial statements in conformity with GAAP requires management to make estimates and assumptions that affect the reported amounts of assets and liabilities and disclosure of contingent assets and liabilities at the date of the financial statements and the reported amounts of increases and decreases in net assets during the reporting period. Actual results could differ from those estimates. |
| E. | Reclassification of Capital Accounts: GAAP requires that certain components of net assets relating to permanent differences be reclassified between financial and tax reporting. These reclassifications have no effect on net assets or net asset value per share. |
| F. | Foreign Currency: Values of investments denominated in foreign currencies are converted into U.S. dollars using the spot market rate of exchange at the time of valuation. Purchases and sales of investments and income are translated into U.S. dollars using the spot market rate of exchange prevailing on the respective dates of such transactions. The Funds do not isolate the portion of the results of operations resulting from fluctuations in foreign exchange rates on investments from fluctuations resulting from changes in the market prices of securities held. Such fluctuations are included with the net realized and unrealized gain/loss on investments. Foreign investments present additional risks due to currency fluctuations, economic and political factors, lower liquidity, government regulations, differences in accounting standards, and other factors. |
| G. | Events Subsequent to the Fiscal Period End: In preparing the financial statements as of June 30, 2024, and through the date the financial statements were available to be issued, management considered the impact of subsequent events for potential recognition or disclosure in the financial statements and had concluded that no additional recognition or disclosures are necessary. |
25 |
26 |
Level 1 | Level 2 | Level 3 | Total | |||||||||
Common Stocks | $ 2,517,667,773 | $ — | $ — | $2,517,667,773 | ||||||||
REITs | 17,423,389 | — | — | 17,423,389 | ||||||||
Investments Purchased with Cash Proceeds from Securities Lending* | — | — | — | 367,137,073 | ||||||||
Money Market Funds | 97,498,087 | — | — | 97,498,087 | ||||||||
Total Investments in Securities | $2,632,589,249 | $— | $— | $2,999,726,322 | ||||||||
| * | Investments valued using the NAV per share practical expedient in accordance with Topic 820, the investment is excluded from the fair value hierarchy. The investment is included in the total column for the purpose of reconciling the table to the schedule of investments. |
Level 1 | Level 2 | Level 3 | Total | |||||||||
Common Stocks | $ 6,056,021 | $7,595,785 | $ — | $ 13,651,806 | ||||||||
Closed End Investment Trusts | 206,517 | — | — | 206,517 | ||||||||
REITs | 76,688 | — | — | 76,688 | ||||||||
Short-Term Investments | 326,838 | — | — | 326,838 | ||||||||
Total Investments in Securities | $6,666,064 | $7,595,785 | $— | $14,261,849 | ||||||||
Investor Shares | 0.99% | ||
Institutional Shares | 0.99% | ||
Retirement Shares | 0.99% | ||
27 |
Investor Shares | 1.15% | ||
Institutional Shares | 1.15% | ||
Retirement Shares | 1.15% | ||
Amount | Expiration | ||
Small-Cap Growth Fund | |||
$16,942 | 6/30/2027 | ||
International Opportunity Fund | |||
$191,498 | 6/30/2025 | ||
$300,864 | 6/30/2026 | ||
$269,486 | 6/30/2027 | ||
Small-Cap Growth Fund | International Opportunity Fund | |||||
Administration & fund accounting | $830,554 | $24,099 | ||||
Custody | $114,034 | $17,564 | ||||
Transfer agency | $244,536 | $75,078 | ||||
Compliance | $ 12,352 | $12,354 | ||||
28 |
Small-Cap Growth Fund | International Opportunity Fund | |||||
Administration & fund accounting | $164,963 | $4,237 | ||||
Custody | $ 23,757 | $4,414 | ||||
Transfer agency | $ 40,616 | $9,599 | ||||
Compliance | $ 2,092 | $2,032 | ||||
Small-Cap Growth Fund | International Opportunity Fund | |||||
Investor Shares | $126,453 | $97 | ||||
Institutional Shares | $768,529 | $2,774 | ||||
29 |
Purchases | Sales | |||||
Small-Cap Growth Fund | $2,403,653,820 | $1,836,138,896 | ||||
International Opportunity Fund | $ 17,376,705 | $7,337,655 | ||||
Small-Cap Growth Fund | International Opportunity Fund | |||||
Cost of investments(a) | $2,324,513,767 | $12,577,487 | ||||
Gross unrealized appreciation | 770,037,308 | 2,156,629 | ||||
Gross unrealized depreciation | (94,824,753) | (472,267) | ||||
Net unrealized appreciation | 675,212,555 | 1,684,362 | ||||
Undistributed ordinary income | — | 47,055 | ||||
Undistributed long-term capital gain | — | — | ||||
Total distributable earnings | — | 47,055 | ||||
Other accumulated gains/(losses) | (9,090,834) | (443,394) | ||||
Total accumulated earnings/(losses) | $ 666,121,721 | $ 1,288,023 | ||||
(a) | The difference between the book basis and tax basis net unrealized appreciation and cost is attributable primarily to wash sales and partnership adjustments. |
Capital | Ordinary Late Year Loss Deferral | |||||
Small-Cap Growth Fund | $ — | $5,807,816 | ||||
International Opportunity Fund | — | — | ||||
Total accumulated earnings/(loss) | Capital stock | |||||
Small-Cap Growth Fund | $4,995,211 | $(4,995,211) | ||||
International Opportunity Fund | 10 | (10) | ||||
30 |
Year Ended June 30, 2024 | Year Ended June 30, 2023 | |||||
International Opportunity Fund | ||||||
Ordinary income | $80,535 | $ — | ||||
Overnight and Continuous | Market Value of Securities on Loan | Investment Asset Class of Securities Purchased | Collateral Proceeds from Securities Lending | Pledged Counterparty^ | Net Exposure | ||||||||||
Hood River Small – Cap Growth Fund | $359,741,377 | Non-registered money market fund | $367,137,073 | $367,137,073 | $ — | ||||||||||
| ^ | As of the end of the reporting period, the value of the collateral pledged from the counterparty exceeded the value of the securities out on loan. Refer to the Fund’s Schedule of Investments for details on the securities out on loan. |
31 |
32 |

33 |
Hood River Small-Cap Growth Fund | 0.00% | ||
Hood River International Opportunity Fund | 61.00% | ||
Hood River Small-Cap Growth Fund | 0.00% | ||
Hood River International Opportunity Fund | 0.14% | ||
34 |
| (b) | Financial Highlights are included within the financial statements filed under Item 7 of this Form. |
Item 8. Changes in and Disagreements with Accountants for Open-End Investment Companies.
There were no changes in or disagreements with accountants during the period covered by this report.
Item 9. Proxy Disclosures for Open-End Investment Companies.
There were no matters submitted to a vote of shareholders during the period covered by this report.
Item 10. Remuneration Paid to Directors, Officers, and Others of Open-End Investment Companies.
See Statement of Operations within Item 7(a).
Item 11. Statement Regarding Basis for Approval of Investment Advisory Contract.
Not applicable.
Item 12. Disclosure of Proxy Voting Policies and Procedures for Closed-End Management Investment Companies.
Not applicable to open-end investment companies.
Item 13. Portfolio Managers of Closed-End Management Investment Companies.
Not applicable to open-end investment companies.
Item 14. Purchases of Equity Securities by Closed-End Management Investment Company and Affiliated Purchasers.
Not applicable to open-end investment companies.
Item 15. Submission of Matters to a Vote of Security Holders.
There have been no material changes to the procedures by which shareholders may recommend nominees to the Registrant’s Board of Trustees.
Item 16. Controls and Procedures.
| (a) | The Registrant’s President/Principal Executive Officer and Treasurer/Principal Financial Officer have reviewed the Registrant’s disclosure controls and procedures (as defined in Rule 30a-3(c) under the Investment Company Act of 1940 (the “Act”)) as of a date within 90 days of the filing of this report, as required by Rule 30a-3(b) under the Act and Rules 13a-15(b) or 15d 15(b) under the Securities Exchange Act of 1934. Based on their review, such officers have concluded that the disclosure controls and procedures are effective in ensuring that information required to be disclosed in this report is appropriately recorded, processed, summarized and reported and made known to them by others within the Registrant and by the Registrant’s service providers. |
| (b) | There were no changes in the Registrant’s internal control over financial reporting (as defined in Rule 30a-3(d) under the Act) that occurred during the period covered by this report that have materially affected, or are reasonably likely to materially affect, the Registrant’s internal control over financial reporting. |
Item 17. Disclosure of Securities Lending Activities for Closed-End Management Investment Companies
Not applicable to open-end investment companies.
Item 18. Recovery of Erroneously Awarded Compensation.
Not applicable.
Item 19. Exhibits.
(2) Any policy required by the listing standards adopted pursuant to Rule 10D-1 under the Exchange Act (17 CFR 240.10D-1) by the registered national securities exchange or registered national securities association upon which the registrant’s securities are listed. Not applicable.
(4) Any written solicitation to purchase securities under Rule 23c-1 under the Act sent or given during the period covered by the report by or on behalf of the registrant to 10 or more persons. Not applicable.
| (5) | Change in the registrant’s independent public accountant. Not applicable. |
| (b) | Certifications pursuant to Section 906 of the Sarbanes-Oxley Act of 2002. Furnished herewith. |
SIGNATURES
Pursuant to the requirements of the Securities Exchange Act of 1934 and the Investment Company Act of 1940, the registrant has duly caused this report to be signed on its behalf by the undersigned, thereunto duly authorized.
| (Registrant) | Manager Directed Portfolios |
| By (Signature and Title)* | /s/ Scott M. Ostrowski | ||
| Scott M. Ostrowski, President/ Principal Executive Officer |
| Date | September 3, 2024 |
Pursuant to the requirements of the Securities Exchange Act of 1934 and the Investment Company Act of 1940, this report has been signed below by the following persons on behalf of the registrant and in the capacities and on the dates indicated.
| By (Signature and Title)* | /s/ Scott M. Ostrowski | ||
| Scott M. Ostrowski, President/ Principal Executive Officer |
| Date | September 3, 2024 |
| By (Signature and Title)* | /s/ Ryan Frank | ||
| Ryan Frank, Treasurer/ Principal Financial Officer |
| Date | September 3, 2024 |
* Print the name and title of each signing officer under his or her signature.