UNITED STATES
SECURITIES AND EXCHANGE COMMISSION
Washington, D.C. 20549
FORM N-CSR
CERTIFIED SHAREHOLDER REPORT OF REGISTERED
MANAGEMENT INVESTMENT COMPANIES
Investment Company Act file number 811-21991
Fidelity Rutland Square Trust II
(Exact name of registrant as specified in charter)
245 Summer St., Boston, MA 02210
(Address of principal executive offices) (Zip code)
Christina H. Lee, Secretary
245 Summer St.
Boston, Massachusetts 02210
(Name and address of agent for service)
Registrant's telephone number, including area code:
617-563-7000
Date of fiscal year end: | February 28 |
Date of reporting period: | August 31, 2022 |
Item 1.
Reports to Stockholders


Contents
Board Approval of Investment Advisory Contracts and Management Fees |
Top Holdings (% of Fund's net assets) | ||
| (excluding cash equivalents) | ||
| Fidelity Advisor Small Cap Growth Fund Class Z | 5.3 | |
| T. Rowe Price Institutional Small-Cap Stock Fund | 4.1 | |
| Fidelity SAI Small-Mid Cap 500 Index Fund | 2.9 | |
| Fidelity SAI Real Estate Index Fund | 1.1 | |
| LKQ Corp. | 0.8 | |
| Fidelity Small Cap Index Fund | 0.7 | |
| Fidelity Small Cap Discovery Fund | 0.7 | |
| Berry Global Group, Inc. | 0.6 | |
| Ziff Davis, Inc. | 0.5 | |
| Alight, Inc. Class A | 0.5 | |
| 17.2 | ||
| Market Sectors (% of Fund's net assets) | ||
| (Stocks Only) | ||
| Industrials | 17.0 | |
| Information Technology | 13.6 | |
| Consumer Discretionary | 11.7 | |
| Financials | 11.6 | |
| Health Care | 11.0 | |
| Materials | 4.6 | |
| Consumer Staples | 3.6 | |
| Energy | 3.5 | |
| Real Estate | 2.8 | |
| Communication Services | 1.8 | |
| Utilities | 1.2 | |
Asset Allocation (% of Fund's net assets) |
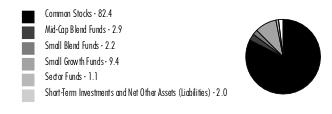 |
| Common Stocks - 82.4% | |||
| Shares | Value ($) | ||
| COMMUNICATION SERVICES - 1.8% | |||
| Diversified Telecommunication Services - 0.1% | |||
| Bandwidth, Inc. (a) | 89,512 | 1,387,436 | |
| EchoStar Holding Corp. Class A (a)(b) | 28,277 | 520,580 | |
| Liberty Latin America Ltd.: | |||
| Class A (a) | 249,772 | 1,748,404 | |
| Class C (a) | 114,804 | 800,184 | |
| Lumen Technologies, Inc. (b) | 429,200 | 4,274,832 | |
| 8,731,436 | |||
| Entertainment - 0.2% | |||
| Electronic Arts, Inc. | 8,532 | 1,082,455 | |
| IMAX Corp. (a) | 122,100 | 1,914,528 | |
| Sciplay Corp. (A Shares) (a) | 18,507 | 225,600 | |
| Take-Two Interactive Software, Inc. (a) | 27,108 | 3,322,356 | |
| World Wrestling Entertainment, Inc. Class A (b) | 95,919 | 6,523,451 | |
| 13,068,390 | |||
| Interactive Media & Services - 0.9% | |||
| Alphabet, Inc. Class C (a) | 9,547 | 1,042,055 | |
| CarGurus, Inc. Class A (a) | 202,310 | 3,783,197 | |
| Meta Platforms, Inc. Class A (a) | 18,981 | 3,092,574 | |
| QuinStreet, Inc. (a) | 123,472 | 1,482,899 | |
| Shutterstock, Inc. (b) | 35,028 | 1,940,901 | |
| TripAdvisor, Inc. (a) | 160,810 | 3,827,278 | |
| Yelp, Inc. (a) | 184,221 | 6,294,832 | |
| Ziff Davis, Inc. (a) | 530,088 | 40,965,201 | |
| ZipRecruiter, Inc. (a) | 672,083 | 11,210,344 | |
| 73,639,281 | |||
| Media - 0.6% | |||
| AMC Networks, Inc. Class A (a) | 69,600 | 1,864,584 | |
| Audacy, Inc. Class A (a)(b) | 862,300 | 475,645 | |
| Criteo SA sponsored ADR (a) | 287,582 | 7,770,466 | |
| Gray Television, Inc. (b) | 184,588 | 3,525,631 | |
| iHeartMedia, Inc. (a) | 115,810 | 1,024,919 | |
| Liberty Media Corp. Liberty Formula One Group Series C (a) | 40,600 | 2,585,408 | |
| Loyalty Ventures, Inc. (a) | 14,424 | 30,435 | |
| Nexstar Broadcasting Group, Inc. Class A (b) | 91,966 | 17,594,935 | |
| Omnicom Group, Inc. | 43,399 | 2,903,393 | |
| Paramount Global Class B (b) | 79,100 | 1,850,149 | |
| Sirius XM Holdings, Inc. (b) | 154,982 | 943,840 | |
| TechTarget, Inc. (a)(b) | 33,789 | 2,192,906 | |
| TEGNA, Inc. | 240,436 | 5,145,330 | |
| The New York Times Co. Class A | 47,800 | 1,457,422 | |
| Thryv Holdings, Inc. (a) | 12,807 | 327,603 | |
| 49,692,666 | |||
TOTAL COMMUNICATION SERVICES | 145,131,773 | ||
| CONSUMER DISCRETIONARY - 11.7% | |||
| Auto Components - 0.8% | |||
| Adient PLC (a) | 92,266 | 3,063,231 | |
| Autoliv, Inc. | 54,160 | 4,213,106 | |
| BorgWarner, Inc. | 133,700 | 5,040,490 | |
| Dana, Inc. (b) | 530,849 | 8,212,234 | |
| Fox Factory Holding Corp. (a) | 33,465 | 3,119,273 | |
| Gentex Corp. | 178,561 | 4,872,930 | |
| Gentherm, Inc. (a) | 24,167 | 1,447,603 | |
| Holley, Inc. (a)(b) | 193,835 | 1,099,044 | |
| LCI Industries (b) | 61,268 | 7,099,123 | |
| Lear Corp. | 77,459 | 10,738,916 | |
| Standard Motor Products, Inc. | 29,888 | 1,096,890 | |
| The Goodyear Tire & Rubber Co. (a) | 935,419 | 13,123,929 | |
| 63,126,769 | |||
| Automobiles - 0.3% | |||
| Harley-Davidson, Inc. (b) | 318,357 | 12,279,029 | |
| Thor Industries, Inc. (b) | 118,324 | 9,585,427 | |
| 21,864,456 | |||
| Distributors - 1.1% | |||
| Funko, Inc. (a) | 18,877 | 420,391 | |
| LKQ Corp. | 1,140,315 | 60,687,564 | |
| Pool Corp. | 82,459 | 27,969,268 | |
| 89,077,223 | |||
| Diversified Consumer Services - 1.4% | |||
| 2U, Inc. (a)(b) | 698,638 | 4,974,303 | |
| ADT, Inc. (b) | 905,150 | 6,598,544 | |
| Bright Horizons Family Solutions, Inc. (a)(b) | 161,795 | 11,034,419 | |
| Carriage Services, Inc. | 11,003 | 389,616 | |
| Frontdoor, Inc. (a)(b) | 1,451,980 | 34,092,490 | |
| Grand Canyon Education, Inc. (a) | 155,787 | 12,677,946 | |
| H&R Block, Inc. | 34,984 | 1,574,280 | |
| Mister Car Wash, Inc. (a)(b) | 213,587 | 2,116,647 | |
| Perdoceo Education Corp. (a)(b) | 50,906 | 589,491 | |
| Service Corp. International | 124,501 | 7,682,957 | |
| Stride, Inc. (a)(b) | 651,535 | 24,849,545 | |
| Terminix Global Holdings, Inc. (a) | 88,071 | 3,756,228 | |
| WW International, Inc. (a) | 38,641 | 201,706 | |
| 110,538,172 | |||
| Hotels, Restaurants & Leisure - 1.8% | |||
| ARAMARK Holdings Corp. | 102,400 | 3,656,704 | |
| Bowlero Corp. Class A (a)(b) | 675,111 | 7,979,812 | |
| Brinker International, Inc. (a)(b) | 38,200 | 936,282 | |
| Choice Hotels International, Inc. | 24,782 | 2,842,743 | |
| Churchill Downs, Inc. | 64,541 | 12,720,386 | |
| Dine Brands Global, Inc. (b) | 107,210 | 7,140,186 | |
| Domino's Pizza, Inc. | 9,000 | 3,346,740 | |
| Expedia, Inc. (a) | 24,455 | 2,510,306 | |
| Full House Resorts, Inc. (a) | 273,679 | 1,844,596 | |
| Hilton Grand Vacations, Inc. (a) | 160,960 | 6,563,949 | |
| International Game Technology PLC (b) | 157,332 | 2,822,536 | |
| Krispy Kreme, Inc. (b) | 140,636 | 1,652,473 | |
| Kura Sushi U.S.A., Inc. Class A (a) | 103,352 | 7,726,596 | |
| Light & Wonder, Inc. Class A (a) | 98,550 | 4,851,617 | |
| Papa John's International, Inc. (b) | 90,677 | 7,329,422 | |
| Penn Entertainment, Inc. (a) | 50,700 | 1,583,361 | |
| Planet Fitness, Inc. (a) | 266,374 | 18,046,839 | |
| Six Flags Entertainment Corp. (a)(b) | 65,837 | 1,458,290 | |
| Sportradar Holding AG (b) | 380,471 | 4,185,181 | |
| Texas Roadhouse, Inc. Class A | 41,748 | 3,705,552 | |
| Travel+Leisure Co. | 133,567 | 5,663,241 | |
| Vail Resorts, Inc. | 101,941 | 22,904,104 | |
| Wendy's Co. | 515,070 | 9,879,043 | |
| Wingstop, Inc. (b) | 22,518 | 2,563,899 | |
| Wyndham Hotels & Resorts, Inc. | 47,900 | 3,129,786 | |
| 147,043,644 | |||
| Household Durables - 1.2% | |||
| Cavco Industries, Inc. (a) | 6,206 | 1,452,266 | |
| Ethan Allen Interiors, Inc. | 15,968 | 379,559 | |
| Helen of Troy Ltd. (a) | 17,539 | 2,168,347 | |
| KB Home | 208,619 | 5,976,934 | |
| La-Z-Boy, Inc. (b) | 123,103 | 3,248,688 | |
| M.D.C. Holdings, Inc. (b) | 64,000 | 1,989,120 | |
| Meritage Homes Corp. (a) | 23,067 | 1,807,299 | |
| Mohawk Industries, Inc. (a) | 64,479 | 7,115,902 | |
| NVR, Inc. (a) | 893 | 3,697,074 | |
| PulteGroup, Inc. | 620,215 | 25,217,942 | |
| Skyline Champion Corp. (a) | 72,859 | 4,128,920 | |
| Sony Group Corp. sponsored ADR | 48,173 | 3,822,528 | |
| Taylor Morrison Home Corp. (a) | 214,969 | 5,397,872 | |
| Tempur Sealy International, Inc. | 338,589 | 8,468,111 | |
| Toll Brothers, Inc. | 83,170 | 3,642,014 | |
| TopBuild Corp. (a) | 47,116 | 8,658,036 | |
| Whirlpool Corp. (b) | 48,344 | 7,570,670 | |
| 94,741,282 | |||
| Internet & Direct Marketing Retail - 0.3% | |||
| CarParts.com, Inc. (a) | 813,969 | 5,274,519 | |
| Etsy, Inc. (a)(b) | 41,596 | 4,392,954 | |
| Farfetch Ltd. Class A (a)(b) | 507,718 | 5,092,412 | |
| Liquidity Services, Inc. (a) | 133,737 | 2,339,060 | |
| Lyft, Inc. (a) | 254,620 | 3,750,553 | |
| Overstock.com, Inc. (a)(b) | 36,890 | 962,829 | |
| PetMed Express, Inc. (b) | 15,220 | 313,075 | |
| Porch Group, Inc. Class A (a)(b) | 861,938 | 1,853,167 | |
| Qurate Retail, Inc. Series A | 261,800 | 811,580 | |
| Revolve Group, Inc. (a)(b) | 117,255 | 2,754,320 | |
| 27,544,469 | |||
| Leisure Products - 0.6% | |||
| Brunswick Corp. | 200,900 | 15,009,239 | |
| Callaway Golf Co. (a)(b) | 550,711 | 12,187,234 | |
| Hasbro, Inc. | 42,888 | 3,380,432 | |
| JAKKS Pacific, Inc. (a) | 63,750 | 1,428,000 | |
| Latham Group, Inc. (a)(b) | 431,874 | 2,466,001 | |
| Malibu Boats, Inc. Class A (a) | 57,963 | 3,479,519 | |
| Polaris, Inc. (b) | 87,741 | 9,938,423 | |
| Sturm, Ruger & Co., Inc. (b) | 13,271 | 693,410 | |
| YETI Holdings, Inc. (a) | 63,710 | 2,350,262 | |
| 50,932,520 | |||
| Multiline Retail - 0.1% | |||
| Dillard's, Inc. Class A (b) | 3,029 | 897,311 | |
| Kohl's Corp. | 94,900 | 2,697,058 | |
| Macy's, Inc. | 125,000 | 2,165,000 | |
| Nordstrom, Inc. (b) | 52,003 | 889,771 | |
| Ollie's Bargain Outlet Holdings, Inc. (a) | 73,342 | 4,056,546 | |
| 10,705,686 | |||
| Specialty Retail - 2.7% | |||
| Academy Sports & Outdoors, Inc. | 64,046 | 2,759,102 | |
| Advance Auto Parts, Inc. | 111,681 | 18,833,884 | |
| American Eagle Outfitters, Inc. | 86,585 | 974,947 | |
| Asbury Automotive Group, Inc. (a)(b) | 33,882 | 5,911,731 | |
| AutoNation, Inc. (a) | 29,061 | 3,621,001 | |
| Boot Barn Holdings, Inc. (a) | 92,706 | 6,176,074 | |
| Burlington Stores, Inc. (a) | 90,691 | 12,713,971 | |
| Destination XL Group, Inc. (a) | 230,736 | 1,271,355 | |
| Five Below, Inc. (a) | 72,530 | 9,275,136 | |
| Floor & Decor Holdings, Inc. Class A (a) | 94,395 | 7,679,977 | |
| Foot Locker, Inc. | 245,490 | 9,043,852 | |
| Genesco, Inc. (a) | 28,381 | 1,605,797 | |
| Group 1 Automotive, Inc. (b) | 46,187 | 8,248,536 | |
| Haverty Furniture Companies, Inc. (b) | 115,103 | 3,087,062 | |
| Leslie's, Inc. (a)(b) | 147,822 | 2,096,116 | |
| Lithia Motors, Inc. Class A (sub. vtg.) | 45,363 | 12,041,155 | |
| MarineMax, Inc. (a) | 34,655 | 1,259,363 | |
| Murphy U.S.A., Inc. (b) | 44,158 | 12,813,327 | |
| National Vision Holdings, Inc. (a)(b) | 111,686 | 3,711,326 | |
| Penske Automotive Group, Inc. (b) | 64,197 | 7,569,468 | |
| Petco Health & Wellness Co., Inc. (a)(b) | 157,108 | 2,344,051 | |
| Sally Beauty Holdings, Inc. (a)(b) | 2,278,456 | 33,903,425 | |
| Signet Jewelers Ltd. (b) | 38,569 | 2,521,256 | |
| Sleep Number Corp. (a)(b) | 77,454 | 3,208,919 | |
| Sonic Automotive, Inc. Class A (sub. vtg.) (b) | 136,460 | 7,258,307 | |
| The Aaron's Co., Inc. | 128,600 | 1,530,340 | |
| The Buckle, Inc. | 22,152 | 715,067 | |
| The ODP Corp. (a) | 99,500 | 3,557,125 | |
| TravelCenters of America LLC (a) | 251,551 | 13,603,878 | |
| Victoria's Secret & Co. (a) | 84,950 | 2,840,728 | |
| Williams-Sonoma, Inc. (b) | 112,410 | 16,720,988 | |
| 218,897,264 | |||
| Textiles, Apparel & Luxury Goods - 1.4% | |||
| Canada Goose Holdings, Inc. (a)(b) | 212,606 | 3,829,034 | |
| Capri Holdings Ltd. (a) | 128,592 | 6,066,971 | |
| Carter's, Inc. (b) | 247,767 | 18,297,593 | |
| Crocs, Inc. (a) | 178,268 | 13,138,352 | |
| Deckers Outdoor Corp. (a) | 13,027 | 4,189,092 | |
| Hanesbrands, Inc. (b) | 756,076 | 6,585,422 | |
| PVH Corp. | 69,200 | 3,892,500 | |
| Ralph Lauren Corp. | 92,901 | 8,484,648 | |
| Skechers U.S.A., Inc. Class A (sub. vtg.) (a) | 763,848 | 28,873,454 | |
| Steven Madden Ltd. | 166,828 | 4,856,363 | |
| Tapestry, Inc. | 310,350 | 10,778,456 | |
| Under Armour, Inc. Class C (non-vtg.) (a)(b) | 611,911 | 4,644,404 | |
| 113,636,289 | |||
TOTAL CONSUMER DISCRETIONARY | 948,107,774 | ||
| CONSUMER STAPLES - 3.6% | |||
| Beverages - 0.2% | |||
| MGP Ingredients, Inc. (b) | 27,322 | 2,990,666 | |
| Molson Coors Beverage Co. Class B | 253,850 | 13,116,430 | |
| National Beverage Corp. (b) | 17,596 | 975,874 | |
| 17,082,970 | |||
| Food & Staples Retailing - 1.1% | |||
| Andersons, Inc. | 117,160 | 4,338,435 | |
| BJ's Wholesale Club Holdings, Inc. (a) | 358,808 | 26,727,608 | |
| Casey's General Stores, Inc. | 46,197 | 9,875,533 | |
| Grocery Outlet Holding Corp. (a) | 143,350 | 5,751,202 | |
| Ingles Markets, Inc. Class A (b) | 102,148 | 8,941,014 | |
| Kroger Co. | 117,641 | 5,639,710 | |
| Performance Food Group Co. (a) | 342,940 | 17,140,141 | |
| PriceSmart, Inc. | 37,815 | 2,392,555 | |
| SpartanNash Co. | 71,900 | 2,187,917 | |
| Sprouts Farmers Market LLC (a) | 124,700 | 3,603,830 | |
| U.S. Foods Holding Corp. (a) | 93,027 | 2,848,487 | |
| Weis Markets, Inc. (b) | 44,614 | 3,466,954 | |
| 92,913,386 | |||
| Food Products - 1.3% | |||
| Archer Daniels Midland Co. | 23,954 | 2,105,317 | |
| Bunge Ltd. | 22,200 | 2,201,574 | |
| Darling Ingredients, Inc. (a) | 24,399 | 1,855,788 | |
| Flowers Foods, Inc. | 144,457 | 3,943,676 | |
| Fresh Del Monte Produce, Inc. | 91,894 | 2,512,382 | |
| Freshpet, Inc. (a)(b) | 94,498 | 4,113,498 | |
| Hostess Brands, Inc. Class A (a) | 171,918 | 3,985,059 | |
| Ingredion, Inc. | 145,526 | 12,670,949 | |
| J&J Snack Foods Corp. (b) | 10,815 | 1,611,759 | |
| John B. Sanfilippo & Son, Inc. | 6,442 | 520,063 | |
| Lamb Weston Holdings, Inc. | 129,456 | 10,295,636 | |
| Lancaster Colony Corp. (b) | 14,410 | 2,428,806 | |
| Nomad Foods Ltd. (a) | 1,926,795 | 34,085,004 | |
| SunOpta, Inc. (a)(b) | 1,040,366 | 10,330,834 | |
| The Hain Celestial Group, Inc. (a) | 333,678 | 6,760,316 | |
| The J.M. Smucker Co. | 20,900 | 2,925,791 | |
| Tootsie Roll Industries, Inc. (b) | 12,944 | 463,784 | |
| 102,810,236 | |||
| Household Products - 0.5% | |||
| Energizer Holdings, Inc. (b) | 162,369 | 4,562,569 | |
| Reynolds Consumer Products, Inc. (b) | 309,660 | 8,648,804 | |
| Spectrum Brands Holdings, Inc. | 347,840 | 21,910,442 | |
| WD-40 Co. (b) | 10,336 | 1,955,158 | |
| 37,076,973 | |||
| Personal Products - 0.3% | |||
| elf Beauty, Inc. (a) | 354,372 | 13,512,204 | |
| Herbalife Nutrition Ltd. (a) | 71,741 | 1,871,723 | |
| MediFast, Inc. | 35,780 | 4,489,674 | |
| Nu Skin Enterprises, Inc. Class A | 36,234 | 1,483,420 | |
| The Honest Co., Inc. (a)(b) | 255,305 | 921,651 | |
| USANA Health Sciences, Inc. (a) | 8,807 | 568,228 | |
| 22,846,900 | |||
| Tobacco - 0.2% | |||
| Turning Point Brands, Inc. | 459,839 | 10,723,445 | |
| Universal Corp. (b) | 47,546 | 2,426,748 | |
| Vector Group Ltd. | 98,696 | 967,221 | |
| 14,117,414 | |||
TOTAL CONSUMER STAPLES | 286,847,879 | ||
| ENERGY - 3.5% | |||
| Energy Equipment & Services - 0.4% | |||
| Cactus, Inc. | 93,520 | 3,736,124 | |
| Championx Corp. | 217,535 | 4,744,438 | |
| Diamond Offshore Drilling, Inc. (a)(b) | 105,325 | 748,861 | |
| Helmerich & Payne, Inc. | 169,470 | 7,244,843 | |
| Nextier Oilfield Solutions, Inc. (a) | 336,836 | 3,156,153 | |
| Noble Corp. (a) | 45,551 | 1,382,473 | |
| Pason Systems, Inc. | 426,455 | 4,513,439 | |
| Patterson-UTI Energy, Inc. | 330,330 | 4,921,917 | |
| ProPetro Holding Corp. (a) | 231,214 | 2,117,920 | |
| 32,566,168 | |||
| Oil, Gas & Consumable Fuels - 3.1% | |||
| Antero Resources Corp. (a) | 206,426 | 8,273,554 | |
| APA Corp. | 196,177 | 7,672,482 | |
| Archaea Energy, Inc. (a) | 112,157 | 2,216,222 | |
| Baytex Energy Corp. (a) | 196,715 | 1,020,951 | |
| Cameco Corp. | 280,420 | 8,174,243 | |
| Cardinal Energy Ltd. | 137,702 | 877,162 | |
| Centennial Resource Development, Inc. Class A (a) | 688,554 | 5,666,799 | |
| Chesapeake Energy Corp. (b) | 26,832 | 2,696,348 | |
| Chord Energy Corp. | 38,368 | 5,430,990 | |
| CNX Resources Corp. (a) | 59,200 | 1,046,064 | |
| Coterra Energy, Inc. | 54,676 | 1,690,035 | |
| Delek U.S. Holdings, Inc. | 203,189 | 5,740,089 | |
| Devon Energy Corp. | 127,600 | 9,011,112 | |
| DHT Holdings, Inc. | 211,774 | 1,653,955 | |
| Diamondback Energy, Inc. | 103,022 | 13,730,772 | |
| Enerplus Corp. (b) | 360,231 | 5,551,160 | |
| Enviva, Inc. (b) | 132,881 | 9,237,887 | |
| Green Plains, Inc. (a) | 73,559 | 2,694,466 | |
| HF Sinclair Corp. | 416,884 | 21,940,605 | |
| Kistos PLC (a) | 567,431 | 3,691,434 | |
| Kosmos Energy Ltd. (a) | 1,249,072 | 8,830,939 | |
| Laredo Petroleum, Inc. (a) | 130,288 | 10,111,652 | |
| Magnolia Oil & Gas Corp. Class A | 445,070 | 10,623,821 | |
| Matador Resources Co. (b) | 192,543 | 11,475,563 | |
| National Energy Services Reunited Corp. (a) | 239,952 | 1,684,463 | |
| Navigator Holdings Ltd. (a) | 163,026 | 1,970,984 | |
| Northern Oil & Gas, Inc. | 257,735 | 8,154,735 | |
| Ovintiv, Inc. | 200,911 | 10,676,411 | |
| Par Pacific Holdings, Inc. (a) | 167,851 | 3,155,599 | |
| PBF Energy, Inc. Class A (a) | 185,337 | 6,331,112 | |
| PDC Energy, Inc. | 166,384 | 11,299,137 | |
| Range Resources Corp. | 121,118 | 3,979,937 | |
| Serica Energy PLC | 438,292 | 1,901,727 | |
| SFL Corp. Ltd. | 280,009 | 2,996,096 | |
| Sitio Royalties Corp. (b) | 7,461 | 189,808 | |
| SM Energy Co. | 181,726 | 8,008,665 | |
| Targa Resources Corp. | 10,800 | 736,884 | |
| Vermilion Energy, Inc. (b) | 108,473 | 2,897,314 | |
| Viper Energy Partners LP | 493,731 | 15,068,670 | |
| World Fuel Services Corp. (b) | 363,624 | 9,381,499 | |
| 247,491,346 | |||
TOTAL ENERGY | 280,057,514 | ||
| FINANCIALS - 11.6% | |||
| Banks - 4.1% | |||
| Ameris Bancorp | 40,935 | 1,910,846 | |
| Associated Banc-Corp. | 223,000 | 4,468,920 | |
| Bancorp, Inc., Delaware (a) | 121,100 | 2,872,492 | |
| Bank OZK | 103,254 | 4,184,885 | |
| BankUnited, Inc. | 418,548 | 15,507,203 | |
| Cathay General Bancorp (b) | 102,900 | 4,315,626 | |
| Citizens Financial Group, Inc. | 122,500 | 4,493,300 | |
| Columbia Banking Systems, Inc. (b) | 65,153 | 1,951,332 | |
| Comerica, Inc. | 144,585 | 11,610,176 | |
| Commerce Bancshares, Inc. | 106,260 | 7,307,500 | |
| Cullen/Frost Bankers, Inc. (b) | 63,475 | 8,249,211 | |
| Customers Bancorp, Inc. (a) | 98,405 | 3,413,669 | |
| East West Bancorp, Inc. | 103,590 | 7,476,090 | |
| Fifth Third Bancorp | 67,000 | 2,288,050 | |
| First Bancorp, Puerto Rico | 694,320 | 9,928,776 | |
| First Citizens Bancshares, Inc. | 20,318 | 16,497,403 | |
| First Hawaiian, Inc. | 506,276 | 13,016,356 | |
| First Horizon National Corp. | 262,044 | 5,927,435 | |
| First Merchants Corp. | 83,962 | 3,343,367 | |
| Fulton Financial Corp. | 239,600 | 3,888,708 | |
| Hancock Whitney Corp. | 82,900 | 3,998,267 | |
| Hanmi Financial Corp. | 108,800 | 2,689,536 | |
| HomeStreet, Inc. | 66,800 | 2,325,308 | |
| Hope Bancorp, Inc. | 340,100 | 4,921,247 | |
| Huntington Bancshares, Inc. | 291,003 | 3,899,440 | |
| KeyCorp | 396,900 | 7,021,161 | |
| Midland States Bancorp, Inc. | 84,421 | 2,118,123 | |
| OFG Bancorp | 100,700 | 2,739,040 | |
| PacWest Bancorp | 448,346 | 11,804,950 | |
| Pathward Financial, Inc. | 22,512 | 741,996 | |
| Peoples Bancorp, Inc. | 40,051 | 1,197,124 | |
| Pinnacle Financial Partners, Inc. | 85,208 | 6,877,138 | |
| Preferred Bank, Los Angeles | 34,143 | 2,316,261 | |
| Regions Financial Corp. | 294,000 | 6,370,980 | |
| ServisFirst Bancshares, Inc. | 97,618 | 8,235,054 | |
| Signature Bank | 78,102 | 13,617,865 | |
| Silvergate Capital Corp. (a) | 16,454 | 1,499,288 | |
| Southstate Corp. | 29,490 | 2,301,400 | |
| SVB Financial Group (a) | 30,704 | 12,481,790 | |
| Synovus Financial Corp. | 330,501 | 13,272,920 | |
| Texas Capital Bancshares, Inc. (a) | 151,529 | 8,944,757 | |
| Umpqua Holdings Corp. | 304,665 | 5,404,757 | |
| Valley National Bancorp | 288,936 | 3,357,436 | |
| Webster Financial Corp. | 237,151 | 11,157,955 | |
| WesBanco, Inc. | 25,853 | 884,431 | |
| Western Alliance Bancorp. | 246,392 | 18,903,194 | |
| Wintrust Financial Corp. | 278,201 | 23,463,472 | |
| Zions Bancorp NA | 347,545 | 19,125,401 | |
| 334,321,636 | |||
| Capital Markets - 3.0% | |||
| Affiliated Managers Group, Inc. | 24,100 | 3,069,376 | |
| Ares Management Corp. | 71,180 | 5,277,285 | |
| Artisan Partners Asset Management, Inc. (b) | 109,662 | 3,702,189 | |
| Blucora, Inc. (a) | 65,159 | 1,308,393 | |
| Bridge Investment Group Holdings, Inc. | 17,714 | 288,915 | |
| Carlyle Group LP | 101,069 | 3,287,775 | |
| Cboe Global Markets, Inc. | 80,131 | 9,453,054 | |
| Cohen & Steers, Inc. (b) | 18,957 | 1,353,151 | |
| Coinbase Global, Inc. (a)(b) | 21,449 | 1,432,793 | |
| Diamond Hill Investment Group, Inc. (b) | 2,392 | 409,152 | |
| Donnelley Financial Solutions, Inc. (a) | 97,848 | 4,153,648 | |
| Evercore, Inc. Class A | 161,669 | 15,146,769 | |
| FactSet Research Systems, Inc. | 28,407 | 12,309,889 | |
| Federated Hermes, Inc. (b) | 70,397 | 2,397,722 | |
| Focus Financial Partners, Inc. Class A (a) | 260,835 | 10,211,690 | |
| GQG Partners, Inc. unit | 489,936 | 535,508 | |
| Hamilton Lane, Inc. Class A | 26,401 | 1,836,982 | |
| Houlihan Lokey | 63,778 | 5,006,573 | |
| Jefferies Financial Group, Inc. | 154,224 | 4,949,048 | |
| Lazard Ltd. Class A | 141,391 | 5,139,563 | |
| LPL Financial | 173,318 | 38,360,473 | |
| MarketAxess Holdings, Inc. | 9,653 | 2,399,639 | |
| Moelis & Co. Class A (b) | 440,391 | 18,346,689 | |
| Morningstar, Inc. | 46,624 | 10,629,806 | |
| Open Lending Corp. (a) | 48,042 | 466,488 | |
| P10, Inc. (b) | 842,908 | 10,519,492 | |
| PJT Partners, Inc. | 74,537 | 5,159,451 | |
| SEI Investments Co. | 79,436 | 4,345,149 | |
| Sprott, Inc. (b) | 382,239 | 14,418,055 | |
| StepStone Group, Inc. Class A | 420,403 | 11,472,798 | |
| Stifel Financial Corp. | 160,870 | 9,541,200 | |
| Victory Capital Holdings, Inc. | 655,218 | 17,546,738 | |
| WisdomTree Investments, Inc. (b) | 1,466,205 | 7,345,687 | |
| 241,821,140 | |||
| Consumer Finance - 0.6% | |||
| Ally Financial, Inc. | 167,300 | 5,554,360 | |
| Atlanticus Holdings Corp. (a)(b) | 4,104 | 116,841 | |
| Credit Acceptance Corp. (a)(b) | 6,074 | 3,231,854 | |
| Encore Capital Group, Inc. (a)(b) | 24,765 | 1,354,150 | |
| Enova International, Inc. (a) | 84,031 | 2,936,043 | |
| FirstCash Holdings, Inc. | 18,300 | 1,426,668 | |
| Navient Corp. | 474,167 | 7,297,430 | |
| OneMain Holdings, Inc. | 102,500 | 3,580,325 | |
| PRA Group, Inc. (a)(b) | 88,915 | 3,284,520 | |
| Regional Management Corp. | 71,100 | 2,395,359 | |
| SLM Corp. | 1,021,667 | 15,611,072 | |
| 46,788,622 | |||
| Diversified Financial Services - 0.3% | |||
| A-Mark Precious Metals, Inc. | 12,573 | 388,631 | |
| Acacia Research Corp. (a)(b) | 1,821,153 | 8,176,977 | |
| Banco Latinoamericano de Comercio Exterior SA Series E (b) | 75,700 | 1,105,220 | |
| Cannae Holdings, Inc. (a) | 675,815 | 14,604,362 | |
| Voya Financial, Inc. (b) | 70,000 | 4,307,100 | |
| 28,582,290 | |||
| Insurance - 2.8% | |||
| Alleghany Corp. (a) | 4,275 | 3,596,045 | |
| American Equity Investment Life Holding Co. | 248,891 | 9,457,858 | |
| American Financial Group, Inc. | 126,946 | 16,208,465 | |
| Amerisafe, Inc. | 14,061 | 672,397 | |
| Assurant, Inc. | 47,615 | 7,546,501 | |
| Assured Guaranty Ltd. | 79,515 | 4,060,831 | |
| Axis Capital Holdings Ltd. | 252,055 | 13,396,723 | |
| BRP Group, Inc. (a) | 75,800 | 2,380,120 | |
| CNA Financial Corp. (b) | 209,882 | 8,072,062 | |
| CNO Financial Group, Inc. (b) | 339,200 | 6,244,672 | |
| Crawford & Co. Class B | 124,426 | 734,113 | |
| Employers Holdings, Inc. | 57,327 | 2,244,925 | |
| Erie Indemnity Co. Class A | 18,130 | 3,896,681 | |
| Everest Re Group Ltd. | 25,571 | 6,879,878 | |
| Fidelity National Financial, Inc. | 82,046 | 3,207,999 | |
| First American Financial Corp. | 181,295 | 9,699,283 | |
| Genworth Financial, Inc. Class A (a) | 1,903,678 | 8,033,521 | |
| Globe Life, Inc. | 30,109 | 2,926,294 | |
| Hanover Insurance Group, Inc. | 77,092 | 9,974,934 | |
| Heritage Insurance Holdings, Inc. | 127,900 | 337,656 | |
| Kemper Corp. | 136,470 | 6,277,620 | |
| Kinsale Capital Group, Inc. | 83,708 | 21,226,675 | |
| Lincoln National Corp. | 119,600 | 5,508,776 | |
| Old Republic International Corp. | 467,142 | 10,202,381 | |
| Primerica, Inc. | 19,700 | 2,496,975 | |
| ProAssurance Corp. (b) | 169,841 | 3,632,899 | |
| Reinsurance Group of America, Inc. | 35,500 | 4,450,280 | |
| RenaissanceRe Holdings Ltd. | 29,640 | 4,009,106 | |
| RLI Corp. (b) | 126,598 | 13,895,396 | |
| Selective Insurance Group, Inc. | 84,588 | 6,717,979 | |
| Trupanion, Inc. (a)(b) | 65,400 | 4,615,932 | |
| Universal Insurance Holdings, Inc. | 101,536 | 1,212,340 | |
| Unum Group | 121,200 | 4,587,420 | |
| White Mountains Insurance Group Ltd. | 14,597 | 19,997,890 | |
| 228,402,627 | |||
| Mortgage Real Estate Investment Trusts - 0.3% | |||
| AGNC Investment Corp. | 189,194 | 2,260,868 | |
| Annaly Capital Management, Inc. | 414,200 | 2,671,590 | |
| Ares Commercial Real Estate Corp. | 95,429 | 1,258,709 | |
| Blackstone Mortgage Trust, Inc. | 74,621 | 2,162,517 | |
| MFA Financial, Inc. | 104,800 | 1,145,464 | |
| Redwood Trust, Inc. | 266,700 | 2,066,925 | |
| Rithm Capital Corp. | 635,100 | 5,988,993 | |
| Starwood Property Trust, Inc. | 175,396 | 4,021,830 | |
| 21,576,896 | |||
| Thrifts & Mortgage Finance - 0.5% | |||
| Axos Financial, Inc. (a) | 75,724 | 3,163,749 | |
| Essent Group Ltd. | 169,022 | 6,759,190 | |
| Federal Agricultural Mortgage Corp. Class C (non-vtg.) | 58,078 | 6,344,441 | |
| Merchants Bancorp | 18,185 | 490,449 | |
| MGIC Investment Corp. | 261,047 | 3,730,362 | |
| Mr. Cooper Group, Inc. (a) | 44,994 | 1,903,246 | |
| NMI Holdings, Inc. (a) | 73,530 | 1,509,571 | |
| Ocwen Financial Corp. (a)(b) | 47,818 | 1,251,875 | |
| PennyMac Financial Services, Inc. (b) | 46,133 | 2,450,585 | |
| Radian Group, Inc. | 196,700 | 4,152,337 | |
| Walker & Dunlop, Inc. | 57,409 | 5,767,308 | |
| 37,523,113 | |||
TOTAL FINANCIALS | 939,016,324 | ||
| HEALTH CARE - 11.0% | |||
| Biotechnology - 1.9% | |||
| ACADIA Pharmaceuticals, Inc. (a) | 73,343 | 1,205,025 | |
| ADC Therapeutics SA (a)(b) | 90,699 | 618,567 | |
| Agios Pharmaceuticals, Inc. (a)(b) | 169,823 | 4,330,487 | |
| Albireo Pharma, Inc. (a)(b) | 126,216 | 2,208,780 | |
| Amicus Therapeutics, Inc. (a) | 42,849 | 481,194 | |
| Anika Therapeutics, Inc. (a) | 116,488 | 2,632,629 | |
| Applied Genetic Technologies Corp. (a)(b) | 1,216,061 | 488,613 | |
| Arcus Biosciences, Inc. (a) | 64,300 | 1,548,344 | |
| Arrowhead Pharmaceuticals, Inc. (a) | 58,050 | 2,305,166 | |
| Ascendis Pharma A/S sponsored ADR (a) | 41,474 | 3,714,826 | |
| Avid Bioservices, Inc. (a) | 100,132 | 1,724,273 | |
| Biohaven Pharmaceutical Holding Co. Ltd. (a) | 34,532 | 5,157,354 | |
| BioMarin Pharmaceutical, Inc. (a) | 26,244 | 2,340,965 | |
| Blueprint Medicines Corp. (a) | 106,572 | 7,803,202 | |
| C4 Therapeutics, Inc. (a)(b) | 477,107 | 4,809,239 | |
| CareDx, Inc. (a) | 392,547 | 7,689,996 | |
| Catalyst Pharmaceutical Partners, Inc. (a) | 182,900 | 2,476,466 | |
| Celldex Therapeutics, Inc. (a) | 14,100 | 428,640 | |
| Coherus BioSciences, Inc. (a) | 176,350 | 1,971,593 | |
| Day One Biopharmaceuticals, Inc. (a)(b) | 68,900 | 1,618,461 | |
| Erasca, Inc. (a)(b) | 116,790 | 1,053,446 | |
| Exelixis, Inc. (a) | 152,600 | 2,707,124 | |
| Fate Therapeutics, Inc. (a)(b) | 30,649 | 801,165 | |
| Halozyme Therapeutics, Inc. (a) | 66,508 | 2,708,871 | |
| Heron Therapeutics, Inc. (a)(b) | 567,024 | 2,319,128 | |
| Horizon Therapeutics PLC (a) | 28,330 | 1,677,419 | |
| Insmed, Inc. (a)(b) | 35,585 | 876,103 | |
| Intellia Therapeutics, Inc. (a) | 35,320 | 2,121,319 | |
| Iovance Biotherapeutics, Inc. (a) | 179,489 | 1,924,122 | |
| Ironwood Pharmaceuticals, Inc. Class A (a)(b) | 588,100 | 6,327,956 | |
| Karuna Therapeutics, Inc. (a) | 12,528 | 3,195,392 | |
| Karyopharm Therapeutics, Inc. (a) | 86,703 | 438,717 | |
| Legend Biotech Corp. ADR (a) | 128,031 | 5,952,161 | |
| Ligand Pharmaceuticals, Inc. Class B (a) | 28,533 | 2,636,164 | |
| Mirati Therapeutics, Inc. (a) | 17,581 | 1,424,588 | |
| Natera, Inc. (a) | 82,693 | 4,073,457 | |
| Neurocrine Biosciences, Inc. (a) | 61,790 | 6,465,088 | |
| Oyster Point Pharma, Inc. (a)(b) | 115,496 | 721,850 | |
| Puma Biotechnology, Inc. (a) | 24,520 | 65,714 | |
| PureTech Health PLC (a) | 704,642 | 2,034,178 | |
| RAPT Therapeutics, Inc. (a) | 132,650 | 3,543,082 | |
| Relay Therapeutics, Inc. (a)(b) | 219,888 | 5,050,827 | |
| Repligen Corp. (a) | 38,425 | 8,429,292 | |
| Springworks Therapeutics, Inc. (a)(b) | 259,118 | 7,195,707 | |
| Ultragenyx Pharmaceutical, Inc. (a) | 43,748 | 2,086,342 | |
| United Therapeutics Corp. (a) | 73,448 | 16,644,786 | |
| Veracyte, Inc. (a)(b) | 290,174 | 5,919,550 | |
| Vir Biotechnology, Inc. (a) | 66,586 | 1,581,418 | |
| 155,528,786 | |||
| Health Care Equipment & Supplies - 2.9% | |||
| Abiomed, Inc. (a) | 2,263 | 586,751 | |
| Atricure, Inc. (a) | 124,610 | 5,684,708 | |
| Atrion Corp. (b) | 1,046 | 631,732 | |
| AxoGen, Inc. (a) | 1,128,510 | 10,574,139 | |
| Axonics Modulation Technologies, Inc. (a) | 71,200 | 5,144,200 | |
| Bausch + Lomb Corp. (a)(b) | 135,531 | 2,016,701 | |
| CryoPort, Inc. (a)(b) | 45,669 | 1,491,550 | |
| Cutera, Inc. (a)(b) | 62,300 | 2,974,825 | |
| Enovis Corp. (a) | 27,346 | 1,385,075 | |
| Envista Holdings Corp. (a) | 569,268 | 21,114,150 | |
| Globus Medical, Inc. (a) | 112,676 | 6,669,292 | |
| Haemonetics Corp. (a) | 37,547 | 2,817,151 | |
| Hologic, Inc. (a) | 150,536 | 10,170,212 | |
| ICU Medical, Inc. (a) | 69,024 | 10,974,816 | |
| Inari Medical, Inc. (a)(b) | 69,203 | 4,799,228 | |
| Insulet Corp. (a) | 10,635 | 2,716,923 | |
| Integra LifeSciences Holdings Corp. (a) | 204,104 | 9,737,802 | |
| iRhythm Technologies, Inc. (a) | 42,910 | 6,327,080 | |
| Lantheus Holdings, Inc. (a) | 71,930 | 5,668,084 | |
| LeMaitre Vascular, Inc. (b) | 13,954 | 689,049 | |
| Meridian Bioscience, Inc. (a) | 32,838 | 1,070,190 | |
| Merit Medical Systems, Inc. (a) | 220,379 | 13,053,048 | |
| Neogen Corp. (a)(b) | 78,169 | 1,633,732 | |
| Nevro Corp. (a) | 114,236 | 5,177,176 | |
| Omnicell, Inc. (a) | 62,042 | 6,346,276 | |
| QuidelOrtho Corp. (a) | 389,135 | 30,842,840 | |
| Silk Road Medical, Inc. (a)(b) | 103,523 | 4,123,321 | |
| Staar Surgical Co. (a) | 38,922 | 3,681,632 | |
| STERIS PLC | 163,952 | 33,016,654 | |
| Tandem Diabetes Care, Inc. (a) | 49,700 | 2,273,278 | |
| Teleflex, Inc. | 62,886 | 14,228,586 | |
| The Cooper Companies, Inc. | 20,630 | 5,929,887 | |
| Utah Medical Products, Inc. | 2,562 | 235,448 | |
| 233,785,536 | |||
| Health Care Providers & Services - 3.3% | |||
| Acadia Healthcare Co., Inc. (a) | 185,837 | 15,225,625 | |
| agilon health, Inc. (a)(b) | 144,328 | 2,999,136 | |
| Amedisys, Inc. (a) | 61,115 | 7,239,072 | |
| AMN Healthcare Services, Inc. (a) | 57,603 | 5,912,372 | |
| Apollo Medical Holdings, Inc. (a)(b) | 9,932 | 428,367 | |
| Castle Biosciences, Inc. (a)(b) | 112,758 | 3,269,982 | |
| Chemed Corp. | 46,664 | 22,220,930 | |
| Corvel Corp. (a) | 7,099 | 1,103,043 | |
| DaVita HealthCare Partners, Inc. (a) | 59,000 | 5,032,110 | |
| dentalcorp Holdings Ltd. (a)(b) | 890,152 | 7,008,164 | |
| Encompass Health Corp. | 230,678 | 11,204,030 | |
| Guardant Health, Inc. (a) | 105,039 | 5,258,252 | |
| HealthEquity, Inc. (a) | 395,258 | 26,118,649 | |
| Henry Schein, Inc. (a) | 435,363 | 31,959,998 | |
| Molina Healthcare, Inc. (a) | 56,543 | 19,075,912 | |
| National Research Corp. Class A | 10,332 | 352,425 | |
| Owens & Minor, Inc. | 133,951 | 3,952,894 | |
| Patterson Companies, Inc. | 141,249 | 3,939,435 | |
| Pediatrix Medical Group, Inc. (a) | 950,084 | 16,930,497 | |
| PetIQ, Inc. Class A (a)(b) | 192,047 | 1,793,719 | |
| Premier, Inc. | 679,902 | 23,959,746 | |
| Privia Health Group, Inc. (a) | 142,143 | 5,655,870 | |
| Quest Diagnostics, Inc. | 33,900 | 4,248,009 | |
| R1 Rcm, Inc. (a) | 810,341 | 17,705,951 | |
| Select Medical Holdings Corp. (b) | 153,600 | 3,938,304 | |
| Tenet Healthcare Corp. (a) | 63,900 | 3,610,350 | |
| U.S. Physical Therapy, Inc. (b) | 9,376 | 774,551 | |
| Universal Health Services, Inc. Class B (b) | 128,167 | 12,539,859 | |
| 263,457,252 | |||
| Health Care Technology - 0.6% | |||
| Certara, Inc. (a) | 763,892 | 11,970,188 | |
| Change Healthcare, Inc. (a) | 981,951 | 24,126,536 | |
| Definitive Healthcare Corp. (b) | 301,432 | 6,052,755 | |
| Doximity, Inc. (a)(b) | 32,851 | 1,090,325 | |
| Health Catalyst, Inc. (a) | 187,494 | 2,249,928 | |
| iCAD, Inc. (a) | 228,344 | 687,315 | |
| Simulations Plus, Inc. (b) | 11,411 | 685,231 | |
| 46,862,278 | |||
| Life Sciences Tools & Services - 1.6% | |||
| Avantor, Inc. (a) | 272,329 | 6,783,715 | |
| Azenta, Inc. | 45,472 | 2,396,829 | |
| Bio-Rad Laboratories, Inc. Class A (a) | 23,216 | 11,260,689 | |
| Bruker Corp. | 132,956 | 7,445,536 | |
| Harvard Bioscience, Inc. (a) | 945,270 | 3,119,391 | |
| ICON PLC (a)(b) | 72,109 | 15,130,631 | |
| Maravai LifeSciences Holdings, Inc. (a) | 55,317 | 1,154,466 | |
| Medpace Holdings, Inc. (a)(b) | 61,783 | 9,119,789 | |
| Quanterix Corp. (a) | 241,145 | 2,254,706 | |
| Sotera Health Co. (a)(b) | 879,704 | 14,875,795 | |
| Stevanato Group SpA | 233,932 | 3,883,271 | |
| Syneos Health, Inc. (a) | 582,344 | 35,004,698 | |
| Thermo Fisher Scientific, Inc. | 6,863 | 3,742,531 | |
| West Pharmaceutical Services, Inc. | 44,037 | 13,065,338 | |
| 129,237,385 | |||
| Pharmaceuticals - 0.7% | |||
| Aerie Pharmaceuticals, Inc. (a) | 106,709 | 1,611,306 | |
| Amphastar Pharmaceuticals, Inc. (a) | 169,779 | 5,025,458 | |
| Arvinas Holding Co. LLC (a) | 155,755 | 6,594,667 | |
| Bayer AG sponsored ADR | 352,203 | 4,649,080 | |
| Catalent, Inc. (a) | 187,383 | 16,489,704 | |
| Innoviva, Inc. (a) | 206,000 | 2,710,960 | |
| Intra-Cellular Therapies, Inc. (a) | 95,083 | 4,778,872 | |
| Jazz Pharmaceuticals PLC (a) | 35,400 | 5,494,788 | |
| Lannett Co., Inc. (a)(b) | 177,600 | 89,493 | |
| Pacira Biosciences, Inc. (a) | 56,046 | 2,941,294 | |
| Perrigo Co. PLC | 45,302 | 1,695,201 | |
| Phathom Pharmaceuticals, Inc. (a)(b) | 130,181 | 1,111,746 | |
| Prestige Brands Holdings, Inc. (a) | 41,979 | 2,123,298 | |
| Revance Therapeutics, Inc. (a) | 82,802 | 1,647,760 | |
| Supernus Pharmaceuticals, Inc. (a) | 68,882 | 2,357,831 | |
| 59,321,458 | |||
TOTAL HEALTH CARE | 888,192,695 | ||
| INDUSTRIALS - 17.0% | |||
| Aerospace & Defense - 1.0% | |||
| Axon Enterprise, Inc. (a) | 58,938 | 6,876,886 | |
| BWX Technologies, Inc. | 75,478 | 3,934,668 | |
| Curtiss-Wright Corp. | 94,177 | 13,861,913 | |
| HEICO Corp. Class A | 33,800 | 4,143,204 | |
| Hexcel Corp. | 34,530 | 2,025,875 | |
| Howmet Aerospace, Inc. | 156,820 | 5,556,133 | |
| Huntington Ingalls Industries, Inc. | 28,819 | 6,635,863 | |
| L3Harris Technologies, Inc. | 19,742 | 4,504,927 | |
| Moog, Inc. Class A | 48,900 | 3,666,522 | |
| Rocket Lab U.S.A., Inc. Class A (a)(b) | 745,488 | 4,100,184 | |
| Spirit AeroSystems Holdings, Inc. Class A | 260,360 | 7,836,836 | |
| Textron, Inc. | 37,803 | 2,358,151 | |
| Woodward, Inc. | 173,536 | 16,150,996 | |
| 81,652,158 | |||
| Air Freight & Logistics - 0.6% | |||
| Air Transport Services Group, Inc. (a) | 723,106 | 21,787,184 | |
| Atlas Air Worldwide Holdings, Inc. (a) | 26,230 | 2,620,902 | |
| C.H. Robinson Worldwide, Inc. (b) | 93,082 | 10,625,310 | |
| Forward Air Corp. | 121,797 | 11,819,181 | |
| GXO Logistics, Inc. (a) | 21,179 | 939,924 | |
| Hub Group, Inc. Class A (a) | 33,154 | 2,646,021 | |
| 50,438,522 | |||
| Airlines - 0.2% | |||
| Alaska Air Group, Inc. (a) | 283,729 | 12,359,235 | |
| JetBlue Airways Corp. (a) | 100,600 | 783,674 | |
| SkyWest, Inc. (a) | 179,100 | 3,813,039 | |
| 16,955,948 | |||
| Building Products - 1.7% | |||
| A.O. Smith Corp. | 99,210 | 5,600,405 | |
| Allegion PLC | 67,713 | 6,439,506 | |
| Apogee Enterprises, Inc. | 70,192 | 2,866,641 | |
| Armstrong World Industries, Inc. | 205,793 | 17,284,554 | |
| Builders FirstSource, Inc. (a) | 31,100 | 1,822,771 | |
| Carlisle Companies, Inc. | 47,550 | 14,058,633 | |
| Fortune Brands Home & Security, Inc. | 240,595 | 14,779,751 | |
| Gibraltar Industries, Inc. (a) | 12,287 | 514,211 | |
| Hayward Holdings, Inc. (a)(b) | 629,600 | 6,617,096 | |
| Lennox International, Inc. | 40,349 | 9,688,602 | |
| Masonite International Corp. (a) | 168,372 | 13,776,197 | |
| Owens Corning | 83,500 | 6,824,455 | |
| Resideo Technologies, Inc. (a) | 243,873 | 5,077,436 | |
| Simpson Manufacturing Co. Ltd. (b) | 119,731 | 11,091,880 | |
| Tecnoglass, Inc. (b) | 466,208 | 10,154,010 | |
| Trex Co., Inc. (a) | 111,189 | 5,202,533 | |
| 131,798,681 | |||
| Commercial Services & Supplies - 2.5% | |||
| ABM Industries, Inc. | 155,402 | 7,210,653 | |
| ACCO Brands Corp. | 398,357 | 2,362,257 | |
| ACV Auctions, Inc. Class A (a) | 1,939,938 | 16,508,872 | |
| Charah Solutions, Inc. (a) | 1,272,225 | 3,256,896 | |
| Cimpress PLC (a) | 138,737 | 4,658,788 | |
| Clean Harbors, Inc. (a) | 42,022 | 4,934,223 | |
| CoreCivic, Inc. (a) | 943,933 | 8,995,681 | |
| Deluxe Corp. (b) | 56,100 | 1,079,364 | |
| Driven Brands Holdings, Inc. (a) | 387,087 | 12,166,144 | |
| Ennis, Inc. | 19,627 | 416,681 | |
| IAA, Inc. (a) | 329,264 | 12,268,377 | |
| Marlowe PLC (a) | 1,699,706 | 12,716,092 | |
| Millerknoll, Inc. (b) | 209,630 | 5,802,558 | |
| MSA Safety, Inc. | 99,243 | 11,796,023 | |
| Ritchie Bros. Auctioneers, Inc. | 507,979 | 35,223,264 | |
| Rollins, Inc. | 170,876 | 5,768,774 | |
| Steelcase, Inc. Class A (b) | 190,595 | 2,130,852 | |
| Stericycle, Inc. (a) | 192,389 | 9,636,765 | |
| Tetra Tech, Inc. | 82,403 | 11,191,151 | |
| The Brink's Co. | 83,193 | 4,598,909 | |
| UniFirst Corp. | 77,683 | 14,003,138 | |
| Viad Corp. (a) | 95,850 | 3,659,553 | |
| Waste Connections, Inc. (United States) | 98,284 | 13,679,167 | |
| 204,064,182 | |||
| Construction & Engineering - 1.1% | |||
| AECOM | 152,633 | 11,165,104 | |
| Arcosa, Inc. | 167,480 | 9,789,206 | |
| Argan, Inc. | 155,924 | 5,393,411 | |
| Comfort Systems U.S.A., Inc. | 103,820 | 10,417,299 | |
| Dycom Industries, Inc. (a) | 77,199 | 8,655,552 | |
| EMCOR Group, Inc. | 80,710 | 9,598,033 | |
| MDU Resources Group, Inc. | 235,754 | 7,107,983 | |
| MYR Group, Inc. (a) | 12,275 | 1,140,839 | |
| Willscot Mobile Mini Holdings (a) | 692,903 | 27,813,126 | |
| 91,080,553 | |||
| Electrical Equipment - 1.6% | |||
| Acuity Brands, Inc. | 42,737 | 7,005,876 | |
| AMETEK, Inc. | 39,972 | 4,803,036 | |
| Array Technologies, Inc. (a) | 133,578 | 2,791,780 | |
| Atkore, Inc. (a) | 233,517 | 19,711,170 | |
| Babcock & Wilcox Enterprises, Inc. (a) | 419,445 | 3,347,171 | |
| EnerSys | 65,839 | 4,106,378 | |
| Generac Holdings, Inc. (a) | 120,770 | 26,618,916 | |
| Hubbell, Inc. Class B | 5,907 | 1,218,614 | |
| nVent Electric PLC | 122,287 | 4,030,580 | |
| Regal Rexnord Corp. | 86,208 | 11,861,359 | |
| Sensata Technologies, Inc. PLC | 768,188 | 30,942,613 | |
| Vertiv Holdings Co. | 942,140 | 10,862,874 | |
| 127,300,367 | |||
| Machinery - 3.5% | |||
| AGCO Corp. | 137,626 | 14,961,322 | |
| Allison Transmission Holdings, Inc. | 352,234 | 12,772,005 | |
| Altra Industrial Motion Corp. | 80,680 | 3,061,806 | |
| Barnes Group, Inc. | 33,821 | 1,050,142 | |
| Chart Industries, Inc. (a)(b) | 10,900 | 2,113,074 | |
| Crane Holdings Co. | 73,532 | 6,938,480 | |
| Donaldson Co., Inc. | 93,257 | 4,788,747 | |
| Douglas Dynamics, Inc. | 146,902 | 4,274,848 | |
| ESAB Corp. | 99,237 | 4,077,648 | |
| Flowserve Corp. | 105,800 | 3,223,726 | |
| Gorman-Rupp Co. | 17,143 | 452,747 | |
| Graco, Inc. | 162,253 | 10,358,232 | |
| Hillenbrand, Inc. | 61,760 | 2,573,539 | |
| Hillman Solutions Corp. Class A (a)(b) | 917,135 | 7,694,763 | |
| IDEX Corp. | 104,619 | 21,050,389 | |
| Ingersoll Rand, Inc. | 169,259 | 8,017,799 | |
| ITT, Inc. | 117,830 | 8,546,210 | |
| John Bean Technologies Corp. | 50,845 | 5,250,255 | |
| Lincoln Electric Holdings, Inc. | 150,699 | 20,599,046 | |
| Middleby Corp. (a) | 120,152 | 17,280,261 | |
| Mueller Industries, Inc. | 101,310 | 6,399,753 | |
| Nordson Corp. | 87,007 | 19,765,380 | |
| Omega Flex, Inc. (b) | 2,284 | 230,730 | |
| Oshkosh Corp. | 77,561 | 6,186,265 | |
| RBC Bearings, Inc. (a)(b) | 72,096 | 17,352,065 | |
| Snap-On, Inc. | 98,804 | 21,525,439 | |
| Tennant Co. (b) | 157,004 | 9,475,191 | |
| Terex Corp. | 47,703 | 1,584,694 | |
| Timken Co. (b) | 158,000 | 9,952,420 | |
| Toro Co. | 329,952 | 27,362,919 | |
| Wabash National Corp. | 147,576 | 2,427,625 | |
| Watts Water Technologies, Inc. Class A | 20,031 | 2,774,694 | |
| 284,122,214 | |||
| Marine - 0.5% | |||
| Genco Shipping & Trading Ltd. | 31,600 | 433,236 | |
| Kirby Corp. (a)(b) | 281,088 | 18,849,761 | |
| Matson, Inc. | 169,499 | 12,485,296 | |
| Star Bulk Carriers Corp. (b) | 326,000 | 6,373,300 | |
| 38,141,593 | |||
| Professional Services - 2.2% | |||
| Alight, Inc. Class A (a) | 5,074,816 | 39,989,550 | |
| ASGN, Inc. (a) | 76,132 | 7,361,964 | |
| Barrett Business Services, Inc. | 5,661 | 456,503 | |
| Booz Allen Hamilton Holding Corp. Class A | 23,365 | 2,236,031 | |
| CACI International, Inc. Class A (a) | 53,131 | 14,922,904 | |
| CBIZ, Inc. (a) | 365,132 | 15,941,663 | |
| Dun & Bradstreet Holdings, Inc. (b) | 554,360 | 7,899,630 | |
| Exponent, Inc. | 39,343 | 3,692,734 | |
| First Advantage Corp. (a) | 374,882 | 5,188,367 | |
| FTI Consulting, Inc. (a)(b) | 19,205 | 3,084,323 | |
| Heidrick & Struggles International, Inc. | 68,324 | 1,944,501 | |
| Insperity, Inc. | 26,028 | 2,837,573 | |
| Kforce, Inc. | 15,188 | 831,087 | |
| Korn Ferry | 75,900 | 4,623,828 | |
| Leidos Holdings, Inc. | 41,185 | 3,914,634 | |
| Manpower, Inc. | 56,200 | 4,120,584 | |
| Robert Half International, Inc. | 152,568 | 11,743,159 | |
| Science Applications International Corp. | 153,201 | 13,952,015 | |
| Sterling Check Corp. (b) | 244,565 | 5,204,343 | |
| TransUnion Holding Co., Inc. | 184,837 | 13,653,909 | |
| TriNet Group, Inc. (a) | 175,241 | 14,439,858 | |
| 178,039,160 | |||
| Road & Rail - 1.0% | |||
| ArcBest Corp. | 63,794 | 5,137,331 | |
| Daseke, Inc. (a) | 808,957 | 4,902,279 | |
| Heartland Express, Inc. | 213,499 | 3,234,510 | |
| Knight-Swift Transportation Holdings, Inc. Class A | 419,184 | 21,172,984 | |
| Landstar System, Inc. | 133,435 | 19,565,574 | |
| Ryder System, Inc. | 42,000 | 3,210,480 | |
| TFI International, Inc. | 52,030 | 5,192,074 | |
| Werner Enterprises, Inc. | 45,293 | 1,802,208 | |
| XPO Logistics, Inc. (a) | 305,881 | 16,034,282 | |
| 80,251,722 | |||
| Trading Companies & Distributors - 1.1% | |||
| Air Lease Corp. Class A | 63,100 | 2,294,316 | |
| Alta Equipment Group, Inc. | 599,865 | 7,060,411 | |
| BlueLinx Corp. (a) | 102,343 | 7,174,244 | |
| Boise Cascade Co. (b) | 29,698 | 1,851,076 | |
| Custom Truck One Source, Inc. Class A (a)(b) | 977,162 | 6,429,726 | |
| EVI Industries, Inc. (a)(b) | 316,770 | 3,959,625 | |
| H&E Equipment Services, Inc. | 47,089 | 1,490,838 | |
| Hardwoods Distribution, Inc. | 64,078 | 1,455,211 | |
| Herc Holdings, Inc. | 74,710 | 8,407,116 | |
| MSC Industrial Direct Co., Inc. Class A | 70,360 | 5,573,216 | |
| SiteOne Landscape Supply, Inc. (a)(b) | 73,378 | 9,183,990 | |
| Titan Machinery, Inc. (a) | 40,854 | 1,257,486 | |
| Triton International Ltd. (b) | 101,300 | 6,036,467 | |
| Univar Solutions, Inc. (a) | 232,304 | 5,858,707 | |
| Watsco, Inc. (b) | 24,006 | 6,530,352 | |
| WESCO International, Inc. (a) | 117,526 | 15,475,824 | |
| 90,038,605 | |||
TOTAL INDUSTRIALS | 1,373,883,705 | ||
| INFORMATION TECHNOLOGY - 13.6% | |||
| Communications Equipment - 0.6% | |||
| CalAmp Corp. (a) | 185,641 | 1,147,261 | |
| Cambium Networks Corp. (a)(b) | 22,394 | 435,787 | |
| Ciena Corp. (a) | 75,940 | 3,853,196 | |
| CommScope Holding Co., Inc. (a) | 400,461 | 4,525,209 | |
| Digi International, Inc. (a) | 49,773 | 1,647,984 | |
| DZS, Inc. (a) | 45,322 | 603,236 | |
| Extreme Networks, Inc. (a) | 251,892 | 3,609,612 | |
| F5, Inc. (a) | 18,403 | 2,890,375 | |
| Juniper Networks, Inc. | 245,504 | 6,977,224 | |
| Lantronix, Inc. (a)(b) | 1,108,375 | 6,716,753 | |
| Lumentum Holdings, Inc. (a) | 111,910 | 9,350,081 | |
| NetScout Systems, Inc. (a) | 53,720 | 1,705,073 | |
| Radware Ltd. (a) | 69,374 | 1,488,766 | |
| 44,950,557 | |||
| Electronic Equipment & Components - 2.6% | |||
| Arlo Technologies, Inc. (a) | 156,531 | 953,274 | |
| Arrow Electronics, Inc. (a) | 93,444 | 9,793,866 | |
| Avnet, Inc. | 339,033 | 14,880,158 | |
| Badger Meter, Inc. (b) | 22,085 | 2,091,229 | |
| Bel Fuse, Inc. Class B (non-vtg.) | 125,469 | 3,565,829 | |
| Belden, Inc. | 219,950 | 14,402,326 | |
| Cognex Corp. | 486,463 | 20,484,957 | |
| CTS Corp. (b) | 23,400 | 990,288 | |
| ePlus, Inc. (a) | 159,530 | 7,517,054 | |
| Fabrinet (a) | 26,909 | 2,767,322 | |
| Flex Ltd. (a) | 237,293 | 4,226,188 | |
| Identiv, Inc. (a)(b) | 1,047,014 | 15,621,449 | |
| Insight Enterprises, Inc. (a) | 70,335 | 6,408,925 | |
| IPG Photonics Corp. (a) | 25,962 | 2,351,898 | |
| Jabil, Inc. | 130,900 | 7,893,270 | |
| Littelfuse, Inc. | 17,723 | 4,204,250 | |
| Methode Electronics, Inc. Class A (b) | 47,000 | 1,901,620 | |
| Napco Security Technologies, Inc. (b) | 21,885 | 649,109 | |
| National Instruments Corp. | 95,864 | 3,811,553 | |
| Novanta, Inc. (a) | 42,726 | 5,712,039 | |
| Par Technology Corp. (a)(b) | 182,519 | 6,424,669 | |
| Powerfleet, Inc. (a) | 1,306,697 | 4,168,363 | |
| Richardson Electronics Ltd. | 340,941 | 5,533,472 | |
| Rogers Corp. (a) | 13,615 | 3,410,830 | |
| Sanmina Corp. (a) | 137,398 | 6,666,551 | |
| ScanSource, Inc. (a) | 71,700 | 2,077,149 | |
| TD SYNNEX Corp. | 210,249 | 20,242,774 | |
| Trimble, Inc. (a) | 269,996 | 17,077,247 | |
| TTM Technologies, Inc. (a) | 142,900 | 2,247,817 | |
| Vishay Intertechnology, Inc. | 145,800 | 2,867,886 | |
| Vontier Corp. | 281,641 | 6,173,571 | |
| Zebra Technologies Corp. Class A (a) | 9,838 | 2,967,534 | |
| 210,084,467 | |||
| IT Services - 3.0% | |||
| Amdocs Ltd. | 116,685 | 9,973,067 | |
| Broadridge Financial Solutions, Inc. | 58,189 | 9,960,211 | |
| Cass Information Systems, Inc. | 8,545 | 313,431 | |
| Computer Services, Inc. | 472,187 | 26,867,440 | |
| Concentrix Corp. | 87,400 | 10,993,172 | |
| CSG Systems International, Inc. | 23,749 | 1,373,880 | |
| Digitalocean Holdings, Inc. (a)(b) | 85,573 | 3,601,768 | |
| DXC Technology Co. (a) | 123,247 | 3,054,061 | |
| Euronet Worldwide, Inc. (a) | 200,298 | 17,758,421 | |
| EVERTEC, Inc. | 124,056 | 4,168,282 | |
| EVO Payments, Inc. Class A (a) | 34,437 | 1,147,441 | |
| ExlService Holdings, Inc. (a) | 24,208 | 4,059,924 | |
| Fidelity National Information Services, Inc. | 26,146 | 2,388,960 | |
| Flywire Corp. (a) | 172,310 | 4,283,627 | |
| Gartner, Inc. (a) | 24,102 | 6,876,783 | |
| Genpact Ltd. | 257,115 | 12,079,263 | |
| Globant SA (a) | 19,681 | 4,148,164 | |
| GoDaddy, Inc. (a) | 153,760 | 11,658,083 | |
| Hackett Group, Inc. | 20,226 | 415,240 | |
| i3 Verticals, Inc. Class A (a)(b) | 296,304 | 6,921,661 | |
| International Money Express, Inc. (a) | 318,493 | 7,134,243 | |
| Jack Henry & Associates, Inc. | 40,058 | 7,699,148 | |
| Maximus, Inc. | 45,974 | 2,785,565 | |
| MongoDB, Inc. Class A (a) | 20,700 | 6,683,202 | |
| Okta, Inc. (a) | 42,991 | 3,929,377 | |
| Perficient, Inc. (a) | 23,947 | 1,870,261 | |
| Rackspace Technology, Inc. (a)(b) | 282,507 | 1,259,981 | |
| Repay Holdings Corp. (a) | 71,725 | 666,325 | |
| Shift4 Payments, Inc. (a)(b) | 94,485 | 4,279,226 | |
| SolarWinds, Inc. (b) | 57,525 | 521,752 | |
| SS&C Technologies Holdings, Inc. | 241,228 | 13,450,873 | |
| The Western Union Co. | 298,526 | 4,424,155 | |
| Ttec Holdings, Inc. | 36,041 | 1,886,746 | |
| Twilio, Inc. Class A (a) | 25,300 | 1,760,374 | |
| Unisys Corp. (a) | 1,837,765 | 17,109,592 | |
| WEX, Inc. (a) | 127,080 | 19,602,090 | |
| Wix.com Ltd. (a) | 29,643 | 1,876,105 | |
| WNS Holdings Ltd. sponsored ADR (a) | 80,640 | 6,793,920 | |
| 245,775,814 | |||
| Semiconductors & Semiconductor Equipment - 2.0% | |||
| Allegro MicroSystems LLC (a) | 311,810 | 7,271,409 | |
| Amkor Technology, Inc. | 463,914 | 9,338,589 | |
| Cirrus Logic, Inc. (a) | 12,800 | 981,632 | |
| Diodes, Inc. (a) | 39,000 | 2,775,630 | |
| Entegris, Inc. | 133,815 | 12,696,367 | |
| GlobalFoundries, Inc. (b) | 282,000 | 16,869,240 | |
| Kulicke & Soffa Industries, Inc. | 132,683 | 5,577,993 | |
| Lattice Semiconductor Corp. (a) | 201,822 | 10,878,206 | |
| MACOM Technology Solutions Holdings, Inc. (a) | 128,690 | 7,097,254 | |
| Monolithic Power Systems, Inc. | 7,220 | 3,271,960 | |
| NVE Corp. (b) | 3,650 | 185,128 | |
| onsemi (a) | 528,164 | 36,321,838 | |
| Power Integrations, Inc. (b) | 219,164 | 15,676,801 | |
| Qorvo, Inc. (a) | 44,449 | 3,990,631 | |
| Semtech Corp. (a) | 144,927 | 6,694,178 | |
| Silicon Laboratories, Inc. (a) | 42,893 | 5,375,780 | |
| Skyworks Solutions, Inc. | 20,578 | 2,027,962 | |
| SMART Global Holdings, Inc. (a)(b) | 176,211 | 3,233,472 | |
| SolarEdge Technologies, Inc. (a) | 10,100 | 2,787,297 | |
| Synaptics, Inc. (a) | 22,515 | 2,602,959 | |
| Ultra Clean Holdings, Inc. (a) | 104,967 | 3,072,384 | |
| Universal Display Corp. | 31,514 | 3,521,059 | |
| 162,247,769 | |||
| Software - 5.0% | |||
| 8x8, Inc. (a)(b) | 1,019,827 | 5,313,299 | |
| A10 Networks, Inc. | 220,992 | 3,071,789 | |
| ACI Worldwide, Inc. (a) | 915,844 | 21,705,503 | |
| American Software, Inc. Class A | 23,896 | 404,559 | |
| Aspen Technology, Inc. (a)(b) | 32,841 | 6,916,315 | |
| Black Knight, Inc. (a) | 339,252 | 22,444,912 | |
| Blackbaud, Inc. (a) | 46,600 | 2,437,180 | |
| Box, Inc. Class A (a) | 87,894 | 2,263,271 | |
| Ceridian HCM Holding, Inc. (a) | 43,800 | 2,612,232 | |
| Check Point Software Technologies Ltd. (a) | 49,003 | 5,892,121 | |
| Clearwater Analytics Holdings, Inc. (b) | 427,047 | 6,576,524 | |
| CommVault Systems, Inc. (a) | 123,890 | 6,725,988 | |
| Consensus Cloud Solutions, Inc. (a) | 283,935 | 14,296,127 | |
| Couchbase, Inc. (a) | 141,030 | 2,339,688 | |
| Descartes Systems Group, Inc. (a)(b) | 37,105 | 2,612,192 | |
| Digital Turbine, Inc. (a) | 557,657 | 10,299,925 | |
| DocuSign, Inc. (a) | 71,260 | 4,148,757 | |
| Dolby Laboratories, Inc. Class A | 47,471 | 3,476,776 | |
| Domo, Inc. Class B (a) | 279,568 | 5,384,480 | |
| Dynatrace, Inc. (a) | 271,723 | 10,374,384 | |
| E2open Parent Holdings, Inc. (a)(b) | 348,734 | 2,395,803 | |
| Elastic NV (a) | 35,500 | 2,978,805 | |
| Fair Isaac Corp. (a) | 4,807 | 2,160,266 | |
| Five9, Inc. (a) | 75,010 | 7,359,231 | |
| Freshworks, Inc. (b) | 232,366 | 3,162,501 | |
| Guidewire Software, Inc. (a) | 97,528 | 6,993,733 | |
| HubSpot, Inc. (a) | 24,313 | 8,194,454 | |
| InterDigital, Inc. | 75,384 | 3,781,261 | |
| KnowBe4, Inc. (a) | 269,821 | 5,185,960 | |
| Mandiant, Inc. (a) | 221,433 | 5,061,958 | |
| Manhattan Associates, Inc. (a) | 203,105 | 28,690,612 | |
| Micro Focus International PLC | 2,216,026 | 13,342,312 | |
| Momentive Global, Inc. (a) | 1,247,386 | 8,843,967 | |
| Monday.com Ltd. (a)(b) | 69,984 | 7,957,181 | |
| N-able, Inc. (a) | 1,019,672 | 10,155,933 | |
| nCino, Inc. (a)(b) | 188,512 | 5,945,668 | |
| NCR Corp. (a) | 368,815 | 11,451,706 | |
| NortonLifeLock, Inc. | 576,960 | 13,033,526 | |
| Oracle Corp. | 109,316 | 8,105,781 | |
| Paycor HCM, Inc. (a)(b) | 119,525 | 3,541,526 | |
| Paylocity Holding Corp. (a) | 56,107 | 13,521,787 | |
| PTC, Inc. (a) | 95,327 | 10,952,119 | |
| Q2 Holdings, Inc. (a) | 162,631 | 6,459,703 | |
| Qualys, Inc. (a) | 55,222 | 8,388,222 | |
| Rapid7, Inc. (a) | 32,050 | 1,842,875 | |
| Samsara, Inc. (b) | 313,320 | 4,659,068 | |
| Smartsheet, Inc. (a) | 380,507 | 12,659,468 | |
| Sumo Logic, Inc. (a) | 419,879 | 3,686,538 | |
| Tenable Holdings, Inc. (a) | 158,742 | 6,287,771 | |
| The Trade Desk, Inc. (a) | 22,274 | 1,396,580 | |
| Tyler Technologies, Inc. (a) | 36,595 | 13,595,408 | |
| Varonis Systems, Inc. (a) | 77,910 | 2,130,839 | |
| WalkMe Ltd. (a) | 408,843 | 4,803,905 | |
| Workday, Inc. Class A (a) | 12,732 | 2,095,178 | |
| Workiva, Inc. (a) | 19,700 | 1,337,433 | |
| Zendesk, Inc. (a) | 207,867 | 15,957,950 | |
| 407,413,050 | |||
| Technology Hardware, Storage & Peripherals - 0.4% | |||
| 3D Systems Corp. (a) | 92,749 | 939,547 | |
| Avid Technology, Inc. (a) | 287,427 | 7,861,128 | |
| Immersion Corp. (a)(b) | 568,226 | 3,386,627 | |
| NetApp, Inc. | 41,325 | 2,980,772 | |
| Seagate Technology Holdings PLC | 73,500 | 4,921,560 | |
| Stratasys Ltd. (a) | 175,044 | 3,021,259 | |
| Western Digital Corp. (a) | 88,482 | 3,739,249 | |
| Xerox Holdings Corp. | 164,200 | 2,729,004 | |
| 29,579,146 | |||
TOTAL INFORMATION TECHNOLOGY | 1,100,050,803 | ||
| MATERIALS - 4.6% | |||
| Chemicals - 1.8% | |||
| Albemarle Corp. | 7,294 | 1,954,500 | |
| Ashland, Inc. | 28,716 | 2,922,140 | |
| Avient Corp. | 40,136 | 1,759,161 | |
| Axalta Coating Systems Ltd. (a) | 856,520 | 22,055,390 | |
| Balchem Corp. | 24,448 | 3,222,735 | |
| Cabot Corp. | 62,010 | 4,462,860 | |
| Celanese Corp. Class A | 31,100 | 3,447,746 | |
| CF Industries Holdings, Inc. | 75,339 | 7,794,573 | |
| Chase Corp. | 5,636 | 496,870 | |
| Eastman Chemical Co. | 31,600 | 2,875,600 | |
| Ecovyst, Inc. | 153,769 | 1,420,826 | |
| FMC Corp. | 80,292 | 8,677,959 | |
| Huntsman Corp. | 471,690 | 13,216,754 | |
| Ingevity Corp. (a) | 88,543 | 6,210,406 | |
| Innospec, Inc. | 55,830 | 5,217,872 | |
| Koppers Holdings, Inc. | 78,800 | 1,799,004 | |
| LSB Industries, Inc. | 184,153 | 2,905,934 | |
| Mativ, Inc. | 149,708 | 3,536,103 | |
| Minerals Technologies, Inc. | 48,756 | 2,840,525 | |
| Nutrien Ltd. | 15,761 | 1,446,387 | |
| Olin Corp. | 163,743 | 8,950,192 | |
| RPM International, Inc. | 29,262 | 2,726,048 | |
| Sensient Technologies Corp. | 30,551 | 2,433,998 | |
| Sociedad Quimica y Minera de Chile SA (PN-B) sponsored ADR | 45,000 | 4,485,600 | |
| The Chemours Co. LLC | 104,500 | 3,524,785 | |
| The Mosaic Co. | 92,600 | 4,988,362 | |
| Trinseo PLC | 37,300 | 989,569 | |
| Tronox Holdings PLC | 125,000 | 1,828,750 | |
| Valvoline, Inc. (b) | 496,283 | 14,426,947 | |
| 142,617,596 | |||
| Construction Materials - 0.1% | |||
| Eagle Materials, Inc. | 37,514 | 4,487,425 | |
| Summit Materials, Inc. (a) | 104,000 | 2,955,680 | |
| 7,443,105 | |||
| Containers & Packaging - 1.8% | |||
| Aptargroup, Inc. | 178,108 | 18,311,283 | |
| Berry Global Group, Inc. (a) | 844,013 | 45,855,226 | |
| CCL Industries, Inc. Class B (b) | 347,814 | 17,060,325 | |
| Crown Holdings, Inc. | 158,449 | 14,353,895 | |
| Graphic Packaging Holding Co. | 890,709 | 19,836,089 | |
| Greif, Inc. Class A (b) | 92,100 | 6,175,305 | |
| O-I Glass, Inc. (a) | 177,200 | 2,305,372 | |
| Ranpak Holdings Corp. (A Shares) (a) | 1,238,489 | 6,551,607 | |
| Silgan Holdings, Inc. | 111,000 | 5,056,050 | |
| TriMas Corp. | 87,199 | 2,399,716 | |
| WestRock Co. | 111,300 | 4,517,667 | |
| 142,422,535 | |||
| Metals & Mining - 0.7% | |||
| Alcoa Corp. | 45,000 | 2,226,600 | |
| ATI, Inc. (a) | 311,871 | 9,334,299 | |
| Carpenter Technology Corp. | 59,410 | 2,018,158 | |
| Commercial Metals Co. | 79,600 | 3,224,596 | |
| Ferroglobe Representation & Warranty Insurance (a)(c) | 495,885 | 5 | |
| Materion Corp. | 9,170 | 791,463 | |
| Reliance Steel & Aluminum Co. | 112,742 | 21,193,241 | |
| Royal Gold, Inc. | 47,710 | 4,384,549 | |
| Steel Dynamics, Inc. | 213,928 | 17,268,268 | |
| 60,441,179 | |||
| Paper & Forest Products - 0.2% | |||
| Canfor Corp. (a) | 227,245 | 4,465,364 | |
| Louisiana-Pacific Corp. | 30,700 | 1,664,861 | |
| Resolute Forest Products, Inc. (a) | 163,294 | 3,308,336 | |
| West Fraser Timber Co. Ltd. (b) | 72,138 | 6,470,779 | |
| 15,909,340 | |||
TOTAL MATERIALS | 368,833,755 | ||
| REAL ESTATE - 2.8% | |||
| Equity Real Estate Investment Trusts (REITs) - 2.5% | |||
| Alexanders, Inc. | 1,558 | 369,090 | |
| American Homes 4 Rent Class A | 84,300 | 2,997,708 | |
| Americold Realty Trust | 81,148 | 2,387,374 | |
| Apartment Income (REIT) Corp. | 97,300 | 3,974,705 | |
| Apple Hospitality (REIT), Inc. | 339,800 | 5,406,218 | |
| Brandywine Realty Trust (SBI) | 307,700 | 2,470,831 | |
| Brixmor Property Group, Inc. | 140,900 | 3,026,532 | |
| Broadstone Net Lease, Inc. | 331,290 | 6,340,891 | |
| Camden Property Trust (SBI) | 73,973 | 9,506,270 | |
| City Office REIT, Inc. | 261,000 | 3,014,550 | |
| CorEnergy Infrastructure Trust, Inc. | 84,100 | 196,794 | |
| Cousins Properties, Inc. | 349,007 | 9,370,838 | |
| CubeSmart | 422,601 | 19,460,776 | |
| EastGroup Properties, Inc. | 78,061 | 12,882,407 | |
| Equity Commonwealth | 378,830 | 9,967,017 | |
| Franklin Street Properties Corp. | 275,093 | 773,011 | |
| Gaming & Leisure Properties | 136,100 | 6,569,547 | |
| Global Net Lease, Inc. | 190,184 | 2,618,834 | |
| Hudson Pacific Properties, Inc. | 117,775 | 1,555,808 | |
| Industrial Logistics Properties Trust | 121,900 | 913,031 | |
| Iron Mountain, Inc. | 44,000 | 2,314,840 | |
| LXP Industrial Trust (REIT) | 363,500 | 3,656,810 | |
| Medical Properties Trust, Inc. | 345,100 | 5,041,911 | |
| Mid-America Apartment Communities, Inc. | 62,507 | 10,355,535 | |
| National Retail Properties, Inc. | 234,229 | 10,516,882 | |
| Office Properties Income Trust | 132,285 | 2,324,247 | |
| Omega Healthcare Investors, Inc. | 175,600 | 5,735,096 | |
| Outfront Media, Inc. | 504,046 | 8,921,614 | |
| Physicians Realty Trust | 627,934 | 10,461,380 | |
| Piedmont Office Realty Trust, Inc. Class A | 308,600 | 3,635,308 | |
| Plymouth Industrial REIT, Inc. | 135,800 | 2,752,666 | |
| Ryman Hospitality Properties, Inc. | 54,030 | 4,442,347 | |
| Sabra Health Care REIT, Inc. | 317,800 | 4,757,466 | |
| Safehold, Inc. (b) | 85,577 | 3,254,493 | |
| Service Properties Trust | 254,722 | 1,742,298 | |
| Spirit Realty Capital, Inc. | 51,093 | 2,087,149 | |
| Stag Industrial, Inc. | 162,935 | 5,018,398 | |
| Sun Communities, Inc. | 18,128 | 2,786,455 | |
| Tanger Factory Outlet Centers, Inc. | 158,900 | 2,450,238 | |
| Uniti Group, Inc. | 315,720 | 2,964,611 | |
| Universal Health Realty Income Trust (SBI) | 9,667 | 491,954 | |
| Urstadt Biddle Properties, Inc. Class A | 139,752 | 2,336,653 | |
| 201,850,583 | |||
| Real Estate Management & Development - 0.3% | |||
| Anywhere Real Estate, Inc. (a) | 165,575 | 1,617,668 | |
| Cushman & Wakefield PLC (a) | 630,415 | 9,431,008 | |
| Jones Lang LaSalle, Inc. (a) | 9,149 | 1,582,777 | |
| Kennedy-Wilson Holdings, Inc. | 115,984 | 2,036,679 | |
| Newmark Group, Inc. (b) | 766,653 | 7,858,193 | |
| 22,526,325 | |||
TOTAL REAL ESTATE | 224,376,908 | ||
| UTILITIES - 1.2% | |||
| Electric Utilities - 0.5% | |||
| Allete, Inc. | 16,244 | 961,320 | |
| IDACORP, Inc. (b) | 174,339 | 19,044,792 | |
| NRG Energy, Inc. | 220,200 | 9,089,856 | |
| OGE Energy Corp. | 128,240 | 5,198,850 | |
| Pinnacle West Capital Corp. | 46,231 | 3,483,506 | |
| 37,778,324 | |||
| Gas Utilities - 0.3% | |||
| Atmos Energy Corp. | 93,540 | 10,605,565 | |
| National Fuel Gas Co. (b) | 50,200 | 3,577,754 | |
| South Jersey Industries, Inc. | 24,600 | 832,710 | |
| Southwest Gas Corp. | 88,612 | 6,898,444 | |
| UGI Corp. | 78,300 | 3,092,850 | |
| 25,007,323 | |||
| Independent Power and Renewable Electricity Producers - 0.4% | |||
| Sunnova Energy International, Inc. (a)(b) | 74,100 | 1,868,802 | |
| The AES Corp. | 206,968 | 5,267,336 | |
| Vistra Corp. | 911,355 | 22,556,036 | |
| 29,692,174 | |||
| Multi-Utilities - 0.0% | |||
| CenterPoint Energy, Inc. | 100,418 | 3,166,180 | |
TOTAL UTILITIES | 95,644,001 | ||
| TOTAL COMMON STOCKS (Cost $5,788,020,142) | 6,650,143,131 | ||
| Equity Funds - 15.6% | |||
| Shares | Value ($) | ||
| Mid-Cap Blend Funds - 2.9% | |||
| Fidelity SAI Small-Mid Cap 500 Index Fund (d) | 24,493,390 | 233,666,937 | |
| Sector Funds - 1.1% | |||
| Fidelity SAI Real Estate Index Fund (d) | 7,635,939 | 85,980,679 | |
| Small Blend Funds - 2.2% | |||
| Fidelity Small Cap Discovery Fund (d) | 2,459,329 | 58,335,273 | |
| Fidelity Small Cap Index Fund (d) | 2,594,510 | 59,336,454 | |
| PIMCO StocksPLUS Small Fund Institutional Class | 2,541,605 | 21,578,227 | |
| Vulcan Value Partners Small Cap Fund | 3,239,823 | 39,979,415 | |
TOTAL SMALL BLEND FUNDS | 179,229,369 | ||
| Small Growth Funds - 9.4% | |||
| Fidelity Advisor Small Cap Growth Fund Class Z (d) | 17,441,899 | 432,559,099 | |
| T. Rowe Price Institutional Small-Cap Stock Fund | 12,623,548 | 331,368,140 | |
TOTAL SMALL GROWTH FUNDS | 763,927,239 | ||
| TOTAL EQUITY FUNDS (Cost $1,440,287,449) | 1,262,804,224 | ||
| Money Market Funds - 9.2% | |||
| Shares | Value ($) | ||
| Fidelity Cash Central Fund 2.33% (e) | 4,641,314 | 4,642,242 | |
| Fidelity Securities Lending Cash Central Fund 2.34% (e)(f) | 588,940,378 | 588,999,272 | |
| State Street Institutional U.S. Government Money Market Fund Premier Class 2.25% (g) | 150,332,092 | 150,332,092 | |
| TOTAL MONEY MARKET FUNDS (Cost $743,973,606) | 743,973,606 | ||
| TOTAL INVESTMENT IN SECURITIES - 107.2% (Cost $7,972,281,197) | 8,656,920,961 |
NET OTHER ASSETS (LIABILITIES) - (7.2)% | (582,783,269) |
| NET ASSETS - 100.0% | 8,074,137,692 |
| Futures Contracts | |||||
Number of contracts | Expiration Date | Notional Amount ($) | Value ($) | Unrealized Appreciation/ (Depreciation) ($) | |
| Purchased | |||||
| Equity Index Contracts | |||||
| CME E-mini Russell 2000 Index Contracts (United States) | 7 | Sep 2022 | 645,610 | (5,014) | (5,014) |
| CME E-mini S&P MidCap 400 Index Contracts (United States) | 4 | Sep 2022 | 972,120 | 69,499 | 69,499 |
| TOTAL FUTURES CONTRACTS | 64,485 | ||||
| The notional amount of futures purchased as a percentage of Net Assets is 0.0% | |||||
| (a) | Non-income producing |
| (b) | Security or a portion of the security is on loan at period end. |
| (c) | Level 3 security |
| (d) | Affiliated Fund |
| (e) | Affiliated fund that is generally available only to investment companies and other accounts managed by Fidelity Investments. The rate quoted is the annualized seven-day yield of the fund at period end. A complete unaudited listing of the fund's holdings as of its most recent quarter end is available upon request. In addition, each Fidelity Central Fund's financial statements are available on the SEC's website or upon request. |
| (f) | Investment made with cash collateral received from securities on loan. |
| (g) | The rate quoted is the annualized seven-day yield of the fund at period end. |
| Affiliate | Value, beginning of period ($) | Purchases ($) | Sales Proceeds ($) | Dividend Income ($) | Realized Gain (loss) ($) | Change in Unrealized appreciation (depreciation) ($) | Value, end of period ($) | %ownership, end of period |
| Fidelity Cash Central Fund 2.33% | 5,130,595 | 178,679,135 | 179,167,488 | 35,164 | - | - | 4,642,242 | 0.0% |
| Fidelity Securities Lending Cash Central Fund 2.34% | 765,963,874 | 1,558,802,819 | 1,735,767,421 | 1,680,424 | - | - | 588,999,272 | 1.7% |
| Total | 771,094,469 | 1,737,481,954 | 1,914,934,909 | 1,715,588 | - | - | 593,641,514 | |
| Affiliate | Value, beginning of period ($) | Purchases ($) | Sales Proceeds ($) | Dividend Income ($) | Realized Gain (loss) ($) | Change in Unrealized appreciation (depreciation) ($) | Value, end of period ($) |
| Fidelity Advisor Small Cap Growth Fund Class Z | 487,996,936 | - | 1,849,294 | - | (666,157) | (52,922,386) | 432,559,099 |
| Fidelity SAI Real Estate Index Fund | 93,540,259 | - | - | - | - | (7,559,580) | 85,980,679 |
| Fidelity SAI Small-Mid Cap 500 Index Fund | 272,603,118 | 326,833,783 | 333,365,583 | - | (25,168,007) | (7,236,374) | 233,666,937 |
| Fidelity Small Cap Discovery Fund | 66,095,114 | 4,353,992 | - | 4,353,993 | - | (12,113,833) | 58,335,273 |
| Fidelity Small Cap Index Fund | 371,280,266 | 309,999,999 | 591,325,608 | - | 50,169,751 | (80,787,954) | 59,336,454 |
| 1,291,515,693 | 641,187,774 | 926,540,485 | 4,353,993 | 24,335,587 | (160,620,127) | 869,878,442 |
| Valuation Inputs at Reporting Date: | ||||
| Description | Total ($) | Level 1 ($) | Level 2 ($) | Level 3 ($) |
Investments in Securities: | ||||
| Equities: | ||||
Communication Services | 145,131,773 | 145,131,773 | - | - |
Consumer Discretionary | 948,107,774 | 948,107,774 | - | - |
Consumer Staples | 286,847,879 | 286,847,879 | - | - |
Energy | 280,057,514 | 280,057,514 | - | - |
Financials | 939,016,324 | 938,480,816 | 535,508 | - |
Health Care | 888,192,695 | 888,192,695 | - | - |
Industrials | 1,373,883,705 | 1,373,883,705 | - | - |
Information Technology | 1,100,050,803 | 1,086,708,491 | 13,342,312 | - |
Materials | 368,833,755 | 368,833,750 | - | 5 |
Real Estate | 224,376,908 | 224,376,908 | - | - |
Utilities | 95,644,001 | 95,644,001 | - | - |
| Equity Funds | 1,262,804,224 | 1,262,804,224 | - | - |
| Money Market Funds | 743,973,606 | 743,973,606 | - | - |
| Total Investments in Securities: | 8,656,920,961 | 8,643,043,136 | 13,877,820 | 5 |
Derivative Instruments: | ||||
| Assets | ||||
Futures Contracts | 69,499 | 69,499 | - | - |
| Total Assets | 69,499 | 69,499 | - | - |
| Liabilities | ||||
Futures Contracts | (5,014) | (5,014) | - | - |
| Total Liabilities | (5,014) | (5,014) | - | - |
| Total Derivative Instruments: | 64,485 | 64,485 | - | - |
Primary Risk Exposure / Derivative Type | Value | |
| Asset ($) | Liability ($) | |
| Equity Risk | ||
Futures Contracts (a) | 69,499 | (5,014) |
| Total Equity Risk | 69,499 | (5,014) |
| Total Value of Derivatives | 69,499 | (5,014) |
| Statement of Assets and Liabilities | ||||
August 31, 2022 (Unaudited) | ||||
| Assets | ||||
| Investment in securities, at value (including securities loaned of $570,018,748) - See accompanying schedule: | $7,193,401,000 | |||
Unaffiliated issuers (cost $6,386,451,806) | ||||
Fidelity Central Funds (cost $593,641,514) | 593,641,514 | |||
Other affiliated issuers (cost $992,187,877) | 869,878,447 | |||
| Total Investment in Securities (cost $7,972,281,197) | $ | 8,656,920,961 | ||
| Segregated cash with brokers for derivative instruments | 68,000 | |||
| Foreign currency held at value (cost $176,003) | 173,009 | |||
| Receivable for investments sold | 21,171,776 | |||
| Receivable for fund shares sold | 3,631,792 | |||
| Dividends receivable | 6,573,819 | |||
| Interest receivable | 294,093 | |||
| Distributions receivable from Fidelity Central Funds | 216,294 | |||
| Prepaid expenses | 16,402 | |||
| Other receivables | 372,380 | |||
Total assets | 8,689,438,526 | |||
| Liabilities | ||||
| Payable to custodian bank | $91,204 | |||
| Payable for investments purchased | 19,372,880 | |||
| Payable for fund shares redeemed | 4,034,520 | |||
| Accrued management fee | 2,341,100 | |||
| Payable for daily variation margin on futures contracts | 8,810 | |||
| Other payables and accrued expenses | 460,481 | |||
| Collateral on securities loaned | 588,991,839 | |||
| Total Liabilities | 615,300,834 | |||
| Net Assets | $ | 8,074,137,692 | ||
| Net Assets consist of: | ||||
| Paid in capital | $ | 7,394,026,901 | ||
| Total accumulated earnings (loss) | 680,110,791 | |||
| Net Assets | $ | 8,074,137,692 | ||
Net Asset Value , offering price and redemption price per share ($8,074,137,692 ÷ 596,692,700 shares) | $ | 13.53 | ||
| Statement of Operations | ||||
Six months ended August 31, 2022 (Unaudited) | ||||
| Investment Income | ||||
| Dividends: | ||||
| Unaffiliated issuers | $ | 49,214,110 | ||
| Interest | 730,480 | |||
| Income from Fidelity Central Funds (including $1,680,424 from security lending) | 1,715,588 | |||
| Total Income | 51,660,178 | |||
| Expenses | ||||
| Management fee | $ | 25,032,730 | ||
| Custodian fees and expenses | 83,673 | |||
| Independent trustees' fees and expenses | 27,708 | |||
| Registration fees | 56,686 | |||
| Audit | 36,437 | |||
| Legal | 14,825 | |||
| Miscellaneous | 112,099 | |||
| Total expenses before reductions | 25,364,158 | |||
| Expense reductions | (10,852,279) | |||
| Total expenses after reductions | 14,511,879 | |||
| Net Investment income (loss) | 37,148,299 | |||
| Realized and Unrealized Gain (Loss) | ||||
| Net realized gain (loss) on: | ||||
| Investment Securities: | ||||
| Unaffiliated issuers | 23,611,460 | |||
| Other affiliated issuers | 24,335,587 | |||
| Foreign currency transactions | (10,108) | |||
| Futures contracts | (110,360) | |||
| Capital gain distributions from underlying funds: | ||||
| Affiliated issuers | 4,353,993 | |||
| Total net realized gain (loss) | 52,180,572 | |||
| Change in net unrealized appreciation (depreciation) on: | ||||
| Investment Securities: | ||||
| Unaffiliated issuers | (1,033,851,205) | |||
| Affiliated issuers | (160,620,127) | |||
| Assets and liabilities in foreign currencies | (3,121) | |||
| Futures contracts | 49,857 | |||
| Total change in net unrealized appreciation (depreciation) | (1,194,424,596) | |||
| Net gain (loss) | (1,142,244,024) | |||
| Net increase (decrease) in net assets resulting from operations | $ | (1,105,095,725) | ||
| Statement of Changes in Net Assets | ||||
Six months ended August 31, 2022 (Unaudited) | Year ended February 28, 2022 | |||
| Increase (Decrease) in Net Assets | ||||
| Operations | ||||
| Net investment income (loss) | $ | 37,148,299 | $ | 91,740,715 |
| Net realized gain (loss) | 52,180,572 | 1,231,502,341 | ||
| Change in net unrealized appreciation (depreciation) | (1,194,424,596) | (1,050,008,515) | ||
| Net increase (decrease) in net assets resulting from operations | (1,105,095,725) | 273,234,541 | ||
| Distributions to shareholders | (302,916,938) | (1,588,171,662) | ||
| Share transactions | ||||
| Proceeds from sales of shares | 821,921,553 | 2,795,392,205 | ||
| Reinvestment of distributions | 294,198,871 | 1,559,302,156 | ||
| Cost of shares redeemed | (1,405,359,262) | (2,294,618,359) | ||
Net increase (decrease) in net assets resulting from share transactions | (289,238,838) | 2,060,076,002 | ||
| Total increase (decrease) in net assets | (1,697,251,501) | 745,138,881 | ||
| Net Assets | ||||
| Beginning of period | 9,771,389,193 | 9,026,250,312 | ||
| End of period | $ | 8,074,137,692 | $ | 9,771,389,193 |
| Other Information | ||||
| Shares | ||||
| Sold | 57,876,259 | 156,832,175 | ||
| Issued in reinvestment of distributions | 19,758,151 | 89,520,194 | ||
| Redeemed | (97,874,608) | (128,714,090) | ||
| Net increase (decrease) | (20,240,198) | 117,638,279 | ||
| Strategic Advisers® Small-Mid Cap Fund |
Six months ended (Unaudited) August 31, 2022 | Years ended February 28, 2022 | 2021 | 2020 A | 2019 | 2018 | |||||||
Selected Per-Share Data | ||||||||||||
| Net asset value, beginning of period | $ | 15.84 | $ | 18.08 | $ | 12.87 | $ | 13.62 | $ | 14.86 | $ | 14.19 |
| Income from Investment Operations | ||||||||||||
Net investment income (loss) B,C | .06 | .17 | .14 | .13 | .11 | .08 | ||||||
| Net realized and unrealized gain (loss) | (1.87) | .61 | 5.63 | (.41) | .11 | 1.88 | ||||||
| Total from investment operations | (1.81) | .78 | 5.77 | (.28) | .22 | 1.96 | ||||||
| Distributions from net investment income | - | (.19) | (.16) | (.13) | (.11) | (.07) | ||||||
| Distributions from net realized gain | (.50) | (2.84) | (.40) | (.34) | (1.35) | (1.22) | ||||||
| Total distributions | (.50) | (3.02) D | (.56) | (.47) | (1.46) | (1.29) | ||||||
| Net asset value, end of period | $ | 13.53 | $ | 15.84 | $ | 18.08 | $ | 12.87 | $ | 13.62 | $ | 14.86 |
Total Return E,F | (11.72)% | 3.45% | 46.31% | (2.40)% | 2.64% | 14.04% | ||||||
Ratios to Average Net Assets C,G,H | ||||||||||||
| Expenses before reductions | .58% I | .60% | .62% | .65% | .73% | .85% | ||||||
| Expenses net of fee waivers, if any | .33% I | .35% | .37% | .40% | .48% | .60% | ||||||
| Expenses net of all reductions | .33% I | .35% | .37% | .40% | .48% | .60% | ||||||
| Net investment income (loss) | .85% I | .96% | 1.02% | .96% | .77% | .53% | ||||||
| Supplemental Data | ||||||||||||
| Net assets, end of period (000 omitted) | $ | 8,074,138 | $ | 9,771,389 | $ | 9,026,250 | $ | 6,975,346 | $ | 8,081,562 | $ | 7,503,132 |
Portfolio turnover rate J | 76% I | 61% | 104% | 67% | 82% | 75% |
| Strategic Advisers Small-Mid Cap Fund | $92,571 |
| Gross unrealized appreciation | $1,572,840,642 |
| Gross unrealized depreciation | (959,076,187) |
| Net unrealized appreciation (depreciation) | $ 613,764,455 |
| Tax cost | $8,043,220,991 |
| Equity Risk | Equity risk relates to the fluctuations in the value of financial instruments as a result of changes in market prices (other than those arising from interest rate risk or foreign exchange risk), whether caused by factors specific to an individual investment, its issuer, or all factors affecting all instruments traded in a market or market segment. |
| Purchases ($) | Sales ($) | |
| Strategic Advisers Small-Mid Cap Fund | 3,267,245,044 | 3,780,108,049 |
| Amount | |
| Strategic Advisers Small-Mid Cap Fund | $ 3,830 |
| Purchases ($) | Sales ($) | Realized Gain (Loss) ($) | |
| Strategic Advisers Small-Mid Cap Fund | 18,755,185 | 14,343,744 | (1,272,920) |
| Amount ($) | |
| Strategic Advisers Small-Mid Cap Fund | 18,118 |
| Fidelity Central Fund | Investment Manager | Investment Objective | Investment Practices | Expense Ratio A |
| Fidelity Money Market Central Funds | Fidelity Management & Research Company LLC (FMR) | Each fund seeks to obtain a high level of current income consistent with the preservation of capital and liquidity. | Short-term Investments | Less than .005% |
| Amount | |
| Strategic Advisers Small-Mid Cap Fund | $ 8,062 |
| Total Security Lending Fees Paid to NFS | Security Lending Income From Securities Loaned to NFS | Value of Securities Loaned to NFS at Period End | |
| Strategic Advisers Small-Mid Cap Fund | $ 175,741 | $ - | $- |
| Fund | Strategic Advisers Small-Mid Cap Fund |
| Fidelity SAI Real Estate Index Fund | 31% |
| Fidelity SAI Small-Mid Cap 500 Index Fund | 99% |
| The Example is based on an investment of $1,000 invested at the beginning of the period and held for the entire period (March 1, 2022 to August 31, 2022). |
Annualized Expense Ratio- A | Beginning Account Value March 1, 2022 | Ending Account Value August 31, 2022 | Expenses Paid During Period- C March 1, 2022 to August 31, 2022 | |||||||
| Strategic Advisers® Small-Mid Cap Fund | .33% | |||||||||
| Actual | $ 1,000 | $ 882.80 | $ 1.57 | |||||||
Hypothetical- B | $ 1,000 | $ 1,023.54 | $ 1.68 | |||||||
|


Contents
Top Holdings (% of Fund's net assets) | ||
| (excluding cash equivalents) | ||
| Fidelity SAI Japan Stock Index Fund | 5.4 | |
| Fidelity SAI International Value Index Fund | 5.1 | |
| Fidelity Advisor International Discovery Fund Class Z | 5.1 | |
| Artisan International Value Fund Investor Class | 4.7 | |
| Fidelity Overseas Fund | 3.5 | |
| Oakmark International Fund Investor Class | 3.5 | |
| Fidelity SAI International Low Volatility Index Fund | 3.2 | |
| Fidelity Diversified International Fund | 3.0 | |
| WCM Focused International Growth Fund Investor Class | 2.5 | |
| Pear Tree Polaris Foreign Value Fund Institutional Shares | 2.4 | |
| 38.4 | ||
| Market Sectors (% of Fund's net assets) | ||
| (Stocks Only) | ||
| Financials | 7.3 | |
| Industrials | 7.3 | |
| Information Technology | 6.0 | |
| Consumer Staples | 5.6 | |
| Health Care | 5.4 | |
| Communication Services | 4.1 | |
| Materials | 3.6 | |
| Consumer Discretionary | 3.5 | |
| Energy | 2.6 | |
| Utilities | 1.4 | |
| Real Estate | 0.5 | |
Asset Allocation (% of Fund's net assets) |
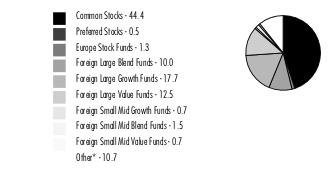 |
Geographic Diversification (% of Fund's net assets) |
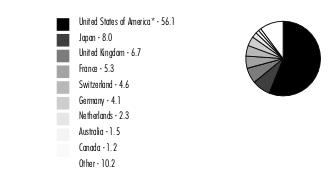 |
* Includes Short-Term investments and Net Other Assets (Liabilities). Percentages are based on country or territory of incorporation and are adjusted for the effect of futures contracts, if applicable. |
| Common Stocks - 44.4% | |||
| Shares | Value ($) | ||
| COMMUNICATION SERVICES - 1.7% | |||
| Diversified Telecommunication Services - 0.8% | |||
| Cellnex Telecom SA (a) | 170,846 | 6,653,210 | |
| Deutsche Telekom AG | 1,956,512 | 36,874,843 | |
| Hellenic Telecommunications Organization SA | 281,812 | 4,491,663 | |
| KT Corp. | 150,290 | 4,148,583 | |
| Liberty Global PLC Class C (b) | 432,300 | 9,212,313 | |
| Nippon Telegraph & Telephone Corp. | 998,000 | 27,050,082 | |
| Orange SA | 1,619,241 | 16,398,672 | |
| Proximus | 12,467 | 158,864 | |
| Telefonica SA | 1,400,994 | 5,781,927 | |
| Telenor ASA | 369,558 | 4,044,073 | |
| Telia Co. AB | 2,398,563 | 8,442,305 | |
| 123,256,535 | |||
| Entertainment - 0.2% | |||
| CTS Eventim AG (b) | 49,365 | 2,661,542 | |
| NetEase, Inc. ADR | 126,313 | 11,179,964 | |
| Nintendo Co. Ltd. | 31,800 | 13,017,232 | |
| Square Enix Holdings Co. Ltd. | 122,100 | 5,301,709 | |
| Ubisoft Entertainment SA (b) | 124,000 | 5,718,267 | |
| 37,878,714 | |||
| Interactive Media & Services - 0.2% | |||
| carsales.com Ltd. | 253,532 | 3,865,263 | |
| Hemnet Group AB | 72,931 | 969,449 | |
| Info Edge India Ltd. | 26,442 | 1,421,708 | |
| NAVER Corp. | 48,347 | 8,545,121 | |
| SEEK Ltd. | 178,116 | 2,512,982 | |
| Tencent Holdings Ltd. | 332,100 | 13,725,952 | |
| Z Holdings Corp. | 1,309,500 | 3,849,767 | |
| 34,890,242 | |||
| Media - 0.2% | |||
| CyberAgent, Inc. | 614,700 | 5,992,882 | |
| Informa PLC | 1,125,169 | 7,147,271 | |
| Publicis Groupe SA | 50,636 | 2,472,319 | |
| Stroeer SE & Co. KGaA | 60,783 | 2,587,513 | |
| WPP PLC | 874,713 | 7,533,944 | |
| 25,733,929 | |||
| Wireless Telecommunication Services - 0.3% | |||
| Advanced Info Service PCL (For. Reg.) | 977,100 | 5,125,523 | |
| KDDI Corp. | 333,700 | 10,211,598 | |
| SoftBank Group Corp. | 244,200 | 9,673,143 | |
| Tele2 AB (B Shares) | 126,106 | 1,343,869 | |
| Vodafone Group PLC sponsored ADR | 1,130,087 | 15,165,768 | |
| 41,519,901 | |||
TOTAL COMMUNICATION SERVICES | 263,279,321 | ||
| CONSUMER DISCRETIONARY - 3.4% | |||
| Auto Components - 0.4% | |||
| Autoliv, Inc. (depositary receipt) | 65,506 | 5,091,770 | |
| Bridgestone Corp. | 166,100 | 6,373,953 | |
| Compagnie Generale des Etablissements Michelin SCA Series B | 407,741 | 9,916,782 | |
| Continental AG | 8,647 | 497,845 | |
| DENSO Corp. | 96,600 | 5,272,499 | |
| Eagle Industry Co. Ltd. | 2,700 | 22,686 | |
| JTEKT Corp. | 72,300 | 508,954 | |
| Koito Manufacturing Co. Ltd. | 211,000 | 7,208,696 | |
| Magna International, Inc. Class A | 165,812 | 9,572,327 | |
| Stanley Electric Co. Ltd. | 179,100 | 3,306,039 | |
| Sumitomo Rubber Industries Ltd. | 195,400 | 1,676,742 | |
| TPR Co. Ltd. | 19,100 | 174,895 | |
| Valeo SA | 264,467 | 5,086,955 | |
| 54,710,143 | |||
| Automobiles - 0.4% | |||
| Bayerische Motoren Werke AG (BMW) | 30,035 | 2,212,938 | |
| Bayerische Motoren Werke AG (BMW) ADR | 61,881 | 1,517,941 | |
| Honda Motor Co. Ltd. | 483,600 | 12,874,527 | |
| Honda Motor Co. Ltd. sponsored ADR | 3,815 | 101,174 | |
| Mercedes-Benz Group AG (Germany) | 188,159 | 10,549,263 | |
| Nissan Motor Co. Ltd. | 300,800 | 1,183,405 | |
| Stellantis NV | 423,878 | 5,680,819 | |
| Stellantis NV (Italy) | 490,610 | 6,584,036 | |
| Suzuki Motor Corp. | 152,200 | 5,319,565 | |
| Toyota Motor Corp. | 1,179,200 | 17,646,809 | |
| 63,670,477 | |||
| Distributors - 0.0% | |||
| Inchcape PLC | 537,443 | 4,745,041 | |
| Hotels, Restaurants & Leisure - 0.6% | |||
| Aristocrat Leisure Ltd. | 363,234 | 8,767,174 | |
| Compass Group PLC | 2,170,054 | 46,680,160 | |
| Dominos Pizza Enterprises Ltd. | 29,027 | 1,251,125 | |
| Entain PLC | 298,700 | 4,394,663 | |
| Evolution AB (a) | 35,497 | 2,839,877 | |
| Flutter Entertainment PLC (b) | 33,695 | 4,213,796 | |
| Food & Life Companies Ltd. | 55,000 | 865,525 | |
| Greggs PLC | 68,032 | 1,458,155 | |
| Sands China Ltd. (b) | 8,306,000 | 18,573,024 | |
| Whitbread PLC | 141,302 | 4,095,408 | |
| Yum China Holdings, Inc. | 163,478 | 8,191,883 | |
| 101,330,790 | |||
| Household Durables - 0.3% | |||
| Barratt Developments PLC | 794,300 | 3,942,861 | |
| Crompton Greaves Consumer Electricals Ltd. | 321,226 | 1,633,727 | |
| Nikon Corp. | 115,300 | 1,316,175 | |
| Panasonic Holdings Corp. | 770,900 | 6,255,379 | |
| Persimmon PLC | 576,082 | 9,877,901 | |
| Sony Group Corp. | 386,300 | 30,712,127 | |
| 53,738,170 | |||
| Internet & Direct Marketing Retail - 0.2% | |||
| Alibaba Group Holding Ltd. sponsored ADR (b) | 16,660 | 1,589,531 | |
| ASOS PLC (b)(c) | 202,529 | 1,636,358 | |
| MercadoLibre, Inc. (b) | 3,762 | 3,217,864 | |
| Rakuten Group, Inc. | 1,535,200 | 7,450,729 | |
| THG PLC (b) | 225,974 | 144,383 | |
| Zalando SE (a)(b)(c) | 213,751 | 4,948,943 | |
| ZOZO, Inc. | 165,800 | 3,664,715 | |
| 22,652,523 | |||
| Leisure Products - 0.1% | |||
| Sega Sammy Holdings, Inc. | 312,400 | 4,637,520 | |
| Thule Group AB (a)(c) | 41,219 | 1,010,368 | |
| Yamaha Corp. | 126,000 | 4,915,121 | |
| 10,563,009 | |||
| Multiline Retail - 0.1% | |||
| Dollarama, Inc. | 94,873 | 5,777,548 | |
| Next PLC | 87,054 | 5,877,712 | |
| Wesfarmers Ltd. | 328,207 | 10,498,994 | |
| 22,154,254 | |||
| Specialty Retail - 0.3% | |||
| H&M Hennes & Mauritz AB (B Shares) | 120,326 | 1,249,625 | |
| Industria de Diseno Textil SA | 689,311 | 14,883,213 | |
| Kingfisher PLC | 6,045,028 | 16,238,571 | |
| WH Smith PLC (b) | 803,583 | 13,344,702 | |
| 45,716,111 | |||
| Textiles, Apparel & Luxury Goods - 1.0% | |||
| adidas AG | 92,833 | 13,765,568 | |
| Brunello Cucinelli SpA | 31,030 | 1,615,310 | |
| Burberry Group PLC | 300,619 | 6,104,525 | |
| Compagnie Financiere Richemont SA: | |||
| warrants 11/22/23 (b) | 562,417 | 362,478 | |
| Series A | 309,576 | 34,619,400 | |
| Dr. Martens Ltd. | 936,378 | 2,573,712 | |
| EssilorLuxottica SA | 123,708 | 18,554,813 | |
| Hermes International SCA | 3,386 | 4,364,041 | |
| Kering SA | 18,346 | 9,205,152 | |
| Li Ning Co. Ltd. | 812,000 | 7,395,950 | |
| lululemon athletica, Inc. (b) | 20,936 | 6,279,963 | |
| LVMH Moet Hennessy Louis Vuitton SE | 69,447 | 44,811,852 | |
| Moncler SpA | 173,084 | 7,764,716 | |
| Puma AG | 30,135 | 1,847,940 | |
| Samsonite International SA (a)(b) | 1,437,600 | 3,514,271 | |
| Swatch Group AG (Bearer) (Reg.) | 21,301 | 973,200 | |
| 163,752,891 | |||
TOTAL CONSUMER DISCRETIONARY | 543,033,409 | ||
| CONSUMER STAPLES - 5.4% | |||
| Beverages - 1.2% | |||
| Anheuser-Busch InBev SA NV | 486,021 | 23,472,149 | |
| Anheuser-Busch InBev SA NV ADR | 110,193 | 5,328,933 | |
| Asahi Group Holdings | 64,700 | 2,169,278 | |
| Davide Campari Milano NV | 235,573 | 2,321,937 | |
| Diageo PLC | 1,434,932 | 62,342,622 | |
| Diageo PLC sponsored ADR | 24,904 | 4,392,817 | |
| Heineken Holding NV | 179,349 | 12,760,764 | |
| ITO EN Ltd. | 210,300 | 9,229,473 | |
| Kirin Holdings Co. Ltd. | 1,521,200 | 25,041,659 | |
| Pernod Ricard SA | 240,223 | 44,311,192 | |
| Royal Unibrew A/S | 24,517 | 1,843,889 | |
| Suntory Beverage & Food Ltd. | 95,400 | 3,484,644 | |
| Treasury Wine Estates Ltd. | 1,312 | 11,769 | |
| 196,711,126 | |||
| Food & Staples Retailing - 0.6% | |||
| Alimentation Couche-Tard, Inc. Class A (multi-vtg.) | 239,031 | 10,272,136 | |
| Carrefour SA (c) | 658,479 | 10,990,334 | |
| Coles Group Ltd. | 545,127 | 6,524,723 | |
| Jeronimo Martins SGPS SA | 24,797 | 550,726 | |
| Ocado Group PLC (b) | 350,211 | 2,953,659 | |
| Qol Holdings Co. Ltd. | 56,400 | 511,520 | |
| Seven & i Holdings Co. Ltd. | 717,300 | 28,495,114 | |
| Sugi Holdings Co. Ltd. | 61,600 | 2,613,912 | |
| Tesco PLC | 4,476,152 | 12,928,334 | |
| Tsuruha Holdings, Inc. | 2,800 | 155,418 | |
| Wal-Mart de Mexico SA de CV Series V | 1,891,900 | 6,182,845 | |
| Welcia Holdings Co. Ltd. | 117,700 | 2,465,038 | |
| Woolworths Group Ltd. | 212,744 | 5,244,723 | |
| 89,888,482 | |||
| Food Products - 1.6% | |||
| Barry Callebaut AG | 2,695 | 5,525,095 | |
| Chacha Food Co. Ltd. (A Shares) | 174,500 | 1,196,034 | |
| Danone SA | 590,068 | 31,049,565 | |
| Ezaki Glico Co. Ltd. | 156,000 | 4,059,066 | |
| Foshan Haitian Flavouring & Food Co. Ltd. (A Shares) | 176,537 | 2,059,107 | |
| Itoham Yonekyu Holdings, Inc. | 110,400 | 533,895 | |
| Kerry Group PLC Class A | 71,533 | 7,393,587 | |
| Lindt & Spruengli AG (participation certificate) | 329 | 3,480,164 | |
| Mowi ASA | 381,200 | 7,836,621 | |
| Nestle SA (Reg. S) | 1,376,686 | 161,103,891 | |
| Nissin Food Holdings Co. Ltd. | 27,600 | 1,974,681 | |
| Orior AG | 2,732 | 214,088 | |
| Toyo Suisan Kaisha Ltd. | 335,000 | 13,741,500 | |
| WH Group Ltd. (a) | 649,500 | 442,520 | |
| Wilmar International Ltd. | 3,210,600 | 9,267,072 | |
| Yakult Honsha Co. Ltd. | 6,700 | 396,276 | |
| 250,273,162 | |||
| Household Products - 0.6% | |||
| Essity AB (B Shares) | 532,718 | 11,848,728 | |
| Henkel AG & Co. KGaA | 17,592 | 1,100,192 | |
| Lion Corp. | 313,300 | 3,657,999 | |
| Reckitt Benckiser Group PLC | 1,101,699 | 85,008,856 | |
| 101,615,775 | |||
| Personal Products - 1.1% | |||
| Beiersdorf AG | 65,440 | 6,605,515 | |
| Haleon PLC (b) | 559,352 | 1,682,005 | |
| Haleon PLC ADR (b) | 249,275 | 1,490,665 | |
| Kao Corp. | 492,300 | 21,316,742 | |
| Kobayashi Pharmaceutical Co. Ltd. | 139,400 | 7,900,001 | |
| Kose Corp. | 23,900 | 2,250,760 | |
| L'Oreal SA | 129,219 | 44,379,504 | |
| Pola Orbis Holdings, Inc. | 86,000 | 948,638 | |
| Proya Cosmetics Co. Ltd. (A Shares) | 92,660 | 2,148,350 | |
| Rohto Pharmaceutical Co. Ltd. | 387,100 | 11,651,963 | |
| Unilever PLC | 1,466,493 | 66,523,528 | |
| Unilever PLC sponsored ADR | 27,054 | 1,227,981 | |
| 168,125,652 | |||
| Tobacco - 0.3% | |||
| British American Tobacco PLC (United Kingdom) | 783,151 | 31,367,343 | |
| Imperial Brands PLC | 196,000 | 4,310,400 | |
| Japan Tobacco, Inc. | 93,200 | 1,579,128 | |
| Scandinavian Tobacco Group A/S (a) | 53,079 | 797,539 | |
| Swedish Match Co. AB | 579,421 | 5,816,888 | |
| 43,871,298 | |||
TOTAL CONSUMER STAPLES | 850,485,495 | ||
| ENERGY - 2.4% | |||
| Energy Equipment & Services - 0.1% | |||
| Tenaris SA | 333,011 | 4,555,419 | |
| WorleyParsons Ltd. | 793,935 | 7,776,363 | |
| 12,331,782 | |||
| Oil, Gas & Consumable Fuels - 2.3% | |||
| Aker BP ASA | 150,414 | 5,262,602 | |
| BP Castrol KK | 10,600 | 84,553 | |
| BP PLC | 6,640,237 | 33,931,106 | |
| BP PLC sponsored ADR | 800,451 | 24,685,909 | |
| ENEOS Holdings, Inc. | 1,032,500 | 3,901,742 | |
| Eni SpA | 3,210,232 | 37,922,225 | |
| Eni SpA sponsored ADR (c) | 10,369 | 244,916 | |
| Equinor ASA | 651,836 | 25,298,180 | |
| Equinor ASA sponsored ADR (c) | 44,438 | 1,723,750 | |
| Galp Energia SGPS SA Class B | 1,002,581 | 10,826,853 | |
| Gazprom OAO (d) | 3,670,010 | 585,795 | |
| Gazprom OAO sponsored ADR (Reg. S) (d) | 33,845 | 7,732 | |
| Idemitsu Kosan Co. Ltd. | 301,600 | 7,952,368 | |
| INPEX Corp. | 534,400 | 6,142,729 | |
| Japan Petroleum Exploration Co. Ltd. | 18,600 | 529,922 | |
| LUKOIL PJSC (d) | 35,755 | 16,881 | |
| Neste OYJ | 147,968 | 7,323,497 | |
| OMV AG | 123,777 | 5,010,417 | |
| Parkland Corp. | 79,879 | 1,960,863 | |
| Petroleo Brasileiro SA - Petrobras (ON) | 232,900 | 1,664,019 | |
| Petronet LNG Ltd. | 614,081 | 1,693,284 | |
| Reliance Industries Ltd. | 502,543 | 16,455,401 | |
| Repsol SA | 539,539 | 7,007,576 | |
| Rosneft Oil Co. OJSC (d) | 420,640 | 107,307 | |
| San-Ai Obbli Co. Ltd. | 55,400 | 438,368 | |
| Santos Ltd. | 2,814,400 | 15,024,065 | |
| Shell PLC: | |||
| ADR | 552,641 | 29,278,920 | |
| (Amsterdam) | 624,196 | 16,594,845 | |
| (London) | 219,796 | 5,817,568 | |
| rights (b)(e) | 219,796 | 52,367 | |
| rights (b)(e) | 428,814 | 104,429 | |
| TC Energy Corp. | 142,051 | 6,845,401 | |
| TotalEnergies SE | 1,225,464 | 62,044,884 | |
| TotalEnergies SE sponsored ADR | 180,265 | 9,105,185 | |
| Washington H. Soul Pattinson & Co. Ltd. | 34,001 | 592,574 | |
| Whitehaven Coal Ltd. | 95,502 | 508,702 | |
| Woodside Energy Group Ltd. | 55,722 | 1,288,819 | |
| Woodside Energy Group Ltd. | 940,988 | 21,857,755 | |
| Woodside Energy Group Ltd. ADR (c) | 19,765 | 450,840 | |
| 370,344,349 | |||
TOTAL ENERGY | 382,676,131 | ||
| FINANCIALS - 7.3% | |||
| Banks - 3.1% | |||
| ABN AMRO Bank NV: | |||
| GDR (a) | 129,541 | 1,246,365 | |
| rights (b)(e) | 129,541 | 41,658 | |
| Agricultural Bank of China Ltd. (H Shares) | 559,000 | 182,660 | |
| AIB Group PLC | 3,447,500 | 7,850,705 | |
| Australia & New Zealand Banking Group Ltd. | 372,347 | 5,755,946 | |
| Bank Leumi le-Israel BM | 71,660 | 760,633 | |
| Bank of China Ltd. (H Shares) | 9,628,000 | 3,359,868 | |
| Barclays PLC | 18,400,300 | 35,083,701 | |
| Barclays PLC sponsored ADR | 252,713 | 1,968,634 | |
| BNP Paribas SA | 922,403 | 42,864,240 | |
| CaixaBank SA | 1,744,825 | 5,268,504 | |
| Chiba Bank Ltd. | 535,300 | 2,891,603 | |
| China Construction Bank Corp. (H Shares) | 1,645,000 | 1,016,912 | |
| Close Brothers Group PLC | 140,527 | 1,666,785 | |
| DBS Group Holdings Ltd. | 1,205,800 | 28,075,251 | |
| DNB Bank ASA | 1,213,064 | 23,065,200 | |
| Erste Group Bank AG | 104,967 | 2,360,472 | |
| FinecoBank SpA | 202,868 | 2,204,878 | |
| First Abu Dhabi Bank PJSC | 451,932 | 2,350,032 | |
| First International Bank of Israel | 9,258 | 432,427 | |
| Haci Omer Sabanci Holding A/S | 239,579 | 335,299 | |
| HDFC Bank Ltd. | 960,869 | 17,606,047 | |
| Hokuhoku Financial Group, Inc. | 118,600 | 704,731 | |
| Industrial & Commercial Bank of China Ltd. (H Shares) | 6,707,000 | 3,407,446 | |
| ING Groep NV (Certificaten Van Aandelen) | 3,947,130 | 34,594,381 | |
| Intesa Sanpaolo SpA | 4,044,505 | 6,962,573 | |
| Jyske Bank A/S (Reg.) (b) | 66,661 | 3,354,330 | |
| KBC Group NV | 324,571 | 15,479,609 | |
| Kyushu Financial Group, Inc. | 227,200 | 620,549 | |
| Lloyds Banking Group PLC | 37,488,946 | 18,997,788 | |
| Mebuki Financial Group, Inc. | 884,200 | 1,694,631 | |
| Mitsubishi UFJ Financial Group, Inc. | 2,168,000 | 11,238,799 | |
| Mizrahi Tefahot Bank Ltd. | 46,487 | 1,897,827 | |
| National Bank of Canada | 187,092 | 12,377,831 | |
| NatWest Group PLC | 4,931,731 | 14,119,593 | |
| Nordea Bank ABP | 363,094 | 3,377,183 | |
| Nordea Bank ABP (Helsinki Stock Exchange) | 135,240 | 1,254,036 | |
| North Pacific Bank Ltd. | 787,000 | 1,302,671 | |
| PT Bank Central Asia Tbk | 24,204,100 | 13,366,063 | |
| Sberbank of Russia (b)(d) | 1,813,540 | 17,009 | |
| Shizuoka Bank Ltd. | 81,700 | 472,786 | |
| Skandinaviska Enskilda Banken AB (A Shares) | 14,079 | 140,856 | |
| Societe Generale Series A | 252,200 | 5,559,854 | |
| Standard Chartered PLC (United Kingdom) | 485,204 | 3,371,823 | |
| Sumitomo Mitsui Financial Group, Inc. | 1,243,500 | 37,508,018 | |
| Sumitomo Mitsui Trust Holdings, Inc. | 135,000 | 4,198,931 | |
| Svenska Handelsbanken AB (A Shares) | 1,498,067 | 12,269,430 | |
| Swedbank AB (A Shares) | 1,876,051 | 24,247,792 | |
| Sydbank A/S | 88,391 | 2,560,691 | |
| The Hachijuni Bank Ltd. | 525,200 | 1,801,039 | |
| The Toronto-Dominion Bank | 125,626 | 8,081,730 | |
| UniCredit SpA | 4,524,459 | 44,275,840 | |
| United Overseas Bank Ltd. | 497,300 | 9,697,079 | |
| 485,340,739 | |||
| Capital Markets - 1.5% | |||
| 3i Group PLC | 199,643 | 2,810,231 | |
| Amundi SA (a) | 125,757 | 6,407,441 | |
| B3 SA - Brasil Bolsa Balcao | 975,700 | 2,222,444 | |
| Bridgepoint Group Holdings Ltd. (a) | 898,070 | 2,612,393 | |
| Credit Suisse Group AG | 88,993 | 459,215 | |
| Daiwa Securities Group, Inc. | 220,700 | 963,406 | |
| Deutsche Borse AG | 166,823 | 28,205,517 | |
| EQT AB | 105,819 | 2,385,395 | |
| Euronext NV (a) | 310,211 | 23,006,895 | |
| Hong Kong Exchanges and Clearing Ltd. | 250,100 | 10,077,661 | |
| Intermediate Capital Group PLC | 154,489 | 2,453,353 | |
| Julius Baer Group Ltd. | 401,952 | 19,422,201 | |
| London Stock Exchange Group PLC | 285,391 | 26,770,111 | |
| Macquarie Group Ltd. | 250,050 | 29,919,307 | |
| Netwealth Group Ltd. | 124,675 | 1,106,722 | |
| Nomura Holdings, Inc. | 1,359,700 | 4,923,327 | |
| Partners Group Holding AG | 7,727 | 7,481,159 | |
| SBI Holdings, Inc. Japan | 484,900 | 9,528,359 | |
| UBS Group AG | 2,875,324 | 45,681,618 | |
| XP, Inc. Class A (b) | 159,531 | 3,069,376 | |
| �� | 229,506,131 | ||
| Diversified Financial Services - 0.4% | |||
| Challenger Ltd. | 648,003 | 2,793,667 | |
| Element Fleet Management Corp. | 840,545 | 10,585,613 | |
| EXOR NV | 55,800 | 3,379,152 | |
| Groupe Bruxelles Lambert SA | 86,700 | 6,578,252 | |
| Housing Development Finance Corp. Ltd. | 217,430 | 6,579,611 | |
| Investor AB (B Shares) | 569,998 | 9,020,512 | |
| Mitsubishi UFJ Lease & Finance Co. Ltd. | 660,400 | 3,200,475 | |
| ORIX Corp. | 1,651,400 | 27,144,703 | |
| 69,281,985 | |||
| Insurance - 2.3% | |||
| AIA Group Ltd. | 2,874,600 | 27,657,206 | |
| Allianz SE | 134,300 | 22,701,601 | |
| Aon PLC | 55,307 | 15,445,033 | |
| ASR Nederland NV | 108,398 | 4,430,369 | |
| Aviva PLC | 1,393,875 | 6,779,861 | |
| AXA SA | 1,767,075 | 41,617,472 | |
| Beazley PLC | 1,147,889 | 7,774,320 | |
| Dai-ichi Mutual Life Insurance Co. | 467,900 | 8,084,382 | |
| Definity Financial Corp. | 66,361 | 1,879,643 | |
| Direct Line Insurance Group PLC | 1,308,119 | 3,128,943 | |
| Gjensidige Forsikring ASA | 52,181 | 1,060,648 | |
| Hiscox Ltd. | 823,679 | 8,590,760 | |
| Intact Financial Corp. | 45,224 | 6,551,084 | |
| Japan Post Holdings Co. Ltd. | 1,062,900 | 7,332,719 | |
| Japan Post Insurance Co. Ltd. | 40,900 | 626,491 | |
| Manulife Financial Corp. | 370,069 | 6,401,925 | |
| MS&AD Insurance Group Holdings, Inc. | 151,300 | 4,514,177 | |
| MS&AD Insurance Group Holdings, Inc. ADR | 5,200 | 77,428 | |
| Muenchener Rueckversicherungs-Gesellschaft AG in Muenchen | 81,908 | 19,569,519 | |
| NN Group NV | 191,780 | 7,896,120 | |
| NN Group NV: | |||
| ADR | 12,694 | 259,465 | |
| rights (b)(c)(e) | 191,780 | 192,729 | |
| People's Insurance Co. of China Group Ltd. (A Shares) | 1,706,600 | 1,232,330 | |
| PICC Property & Casualty Co. Ltd. (H Shares) | 6,200,000 | 6,706,114 | |
| Ping An Insurance Group Co. of China Ltd. (H Shares) | 503,500 | 2,961,408 | |
| Prudential PLC | 2,996,708 | 31,450,940 | |
| Sampo Oyj (A Shares) | 266,911 | 12,075,142 | |
| Sompo Holdings, Inc. | 27,500 | 1,179,096 | |
| Storebrand ASA (A Shares) | 969,257 | 7,784,993 | |
| Sun Life Financial, Inc. | 275,965 | 12,157,715 | |
| Swiss Life Holding AG | 3,164 | 1,658,551 | |
| Swiss Re Ltd. | 47,351 | 3,681,810 | |
| Talanx AG | 105,700 | 3,749,680 | |
| Tokio Marine Holdings, Inc. | 474,000 | 26,268,788 | |
| Tokio Marine Holdings, Inc. ADR | 3,647 | 201,898 | |
| Willis Towers Watson PLC | 26,212 | 5,421,428 | |
| Zurich Insurance Group Ltd. | 109,510 | 48,611,455 | |
| 367,713,243 | |||
| Thrifts & Mortgage Finance - 0.0% | |||
| Paragon Banking Group PLC | 60,016 | 374,400 | |
TOTAL FINANCIALS | 1,152,216,498 | ||
| HEALTH CARE - 5.4% | |||
| Biotechnology - 0.1% | |||
| Genmab A/S (b) | 25,801 | 9,184,285 | |
| Vitrolife AB | 35,898 | 859,397 | |
| 10,043,682 | |||
| Health Care Equipment & Supplies - 0.7% | |||
| Alcon, Inc. (Switzerland) | 84,068 | 5,552,358 | |
| ASAHI INTECC Co. Ltd. | 106,700 | 1,897,936 | |
| Carl Zeiss Meditec AG | 17,222 | 2,149,560 | |
| Coloplast A/S Series B | 24,536 | 2,802,772 | |
| ConvaTec Group PLC (a) | 3,505,556 | 8,861,552 | |
| Elekta AB (B Shares) | 634,657 | 3,647,194 | |
| Hoya Corp. | 118,500 | 12,084,248 | |
| InMode Ltd. (b)(c) | 43,200 | 1,379,808 | |
| Koninklijke Philips Electronics NV | 1,750,613 | 29,074,177 | |
| Nihon Kohden Corp. | 112,200 | 2,562,384 | |
| Olympus Corp. | 766,500 | 16,324,332 | |
| Siemens Healthineers AG (a) | 190,070 | 9,287,986 | |
| Smith & Nephew PLC | 858,600 | 10,099,484 | |
| Straumann Holding AG | 40,993 | 4,492,126 | |
| Terumo Corp. | 254,800 | 8,179,504 | |
| 118,395,421 | |||
| Health Care Providers & Services - 0.1% | |||
| Amplifon SpA | 52,779 | 1,381,699 | |
| Apollo Hospitals Enterprise Ltd. | 26,023 | 1,397,500 | |
| CVS Group PLC | 61,138 | 1,294,058 | |
| Fresenius Medical Care AG & Co. KGaA sponsored ADR | 43,496 | 743,782 | |
| Fresenius SE & Co. KGaA | 447,488 | 11,070,083 | |
| Galenica AG (a) | 25,994 | 1,832,211 | |
| Suzuken Co. Ltd. | 1,800 | 43,138 | |
| 17,762,471 | |||
| Health Care Technology - 0.0% | |||
| M3, Inc. | 77,100 | 2,469,658 | |
| Pro Medicus Ltd. | 41,121 | 1,511,498 | |
| 3,981,156 | |||
| Life Sciences Tools & Services - 0.4% | |||
| Agilent Technologies, Inc. | 66,840 | 8,572,230 | |
| Bachem Holding AG (B Shares) | 11,981 | 832,848 | |
| Bruker Corp. | 106,553 | 5,966,968 | |
| Eurofins Scientific SA | 58,248 | 4,044,860 | |
| Evotec OAI AG (b) | 122,593 | 2,703,004 | |
| ICON PLC (b) | 51,069 | 10,715,808 | |
| Lonza Group AG | 18,932 | 10,096,815 | |
| QIAGEN NV (Germany) (b) | 284,863 | 12,953,857 | |
| Sartorius Stedim Biotech | 14,259 | 5,240,328 | |
| Siegfried Holding AG | 2,536 | 2,030,097 | |
| Tecan Group AG | 5,905 | 2,180,772 | |
| 65,337,587 | |||
| Pharmaceuticals - 4.1% | |||
| Astellas Pharma, Inc. | 2,121,200 | 30,073,924 | |
| AstraZeneca PLC: | |||
| (United Kingdom) | 299,891 | 37,094,219 | |
| sponsored ADR | 279,355 | 17,426,165 | |
| Bayer AG | 1,049,789 | 55,521,235 | |
| GSK PLC | 1,398,835 | 22,360,401 | |
| GSK PLC sponsored ADR | 744,242 | 24,172,980 | |
| Ipsen SA | 26,602 | 2,554,403 | |
| Kyowa Hakko Kirin Co., Ltd. | 536,600 | 12,027,742 | |
| Merck KGaA | 47,948 | 8,236,506 | |
| Novartis AG | 1,239,425 | 100,254,696 | |
| Novo Nordisk A/S Series B | 577,651 | 61,758,888 | |
| Ono Pharmaceutical Co. Ltd. | 10,500 | 250,637 | |
| Otsuka Holdings Co. Ltd. | 265,600 | 8,675,180 | |
| Roche Holding AG: | |||
| (participation certificate) | 489,092 | 157,605,812 | |
| sponsored ADR | 25,897 | 1,047,275 | |
| Sanofi SA | 828,897 | 67,762,197 | |
| Sanofi SA sponsored ADR | 77,040 | 3,160,951 | |
| Santen Pharmaceutical Co. Ltd. | 1,410,700 | 10,135,195 | |
| Sumitomo Dainippon Pharma Co., Ltd. | 15,700 | 116,949 | |
| Taisho Pharmaceutical Holdings Co. Ltd. | 7,300 | 271,431 | |
| Takeda Pharmaceutical Co. Ltd. | 963,600 | 26,633,956 | |
| 647,140,742 | |||
TOTAL HEALTH CARE | 862,661,059 | ||
| INDUSTRIALS - 7.3% | |||
| Aerospace & Defense - 0.6% | |||
| Airbus Group NV | 99,711 | 9,770,995 | |
| Dassault Aviation SA | 37,300 | 5,135,395 | |
| Leonardo SpA | 100,033 | 820,913 | |
| MTU Aero Engines AG | 104,007 | 18,390,617 | |
| Rolls-Royce Holdings PLC (b) | 42,327,406 | 37,722,984 | |
| Safran SA | 125,888 | 12,834,844 | |
| Thales SA | 52,590 | 6,349,966 | |
| 91,025,714 | |||
| Air Freight & Logistics - 0.2% | |||
| Deutsche Post AG | 526,005 | 19,198,723 | |
| Deutsche Post AG ADR | 2,200 | 80,520 | |
| DSV A/S | 54,585 | 8,087,350 | |
| Konoike Transport Co. Ltd. | 14,400 | 136,658 | |
| 27,503,251 | |||
| Airlines - 0.3% | |||
| InterGlobe Aviation Ltd. (a)(b) | 118,197 | 2,950,249 | |
| Ryanair Holdings PLC sponsored ADR (b) | 486,837 | 35,397,918 | |
| Turk Hava Yollari AO (b) | 1,911,123 | 7,679,475 | |
| 46,027,642 | |||
| Building Products - 0.3% | |||
| AGC, Inc. | 49,700 | 1,686,766 | |
| Belimo Holding AG (Reg.) | 3,910 | 1,488,000 | |
| Compagnie de St. Gobain | 119,900 | 4,829,302 | |
| Daikin Industries Ltd. | 125,100 | 21,838,350 | |
| Geberit AG (Reg.) | 16,080 | 7,450,263 | |
| Kingspan Group PLC (Ireland) | 74,352 | 4,232,143 | |
| Noritz Corp. | 13,600 | 150,822 | |
| Sekisui Jushi Corp. | 57,400 | 709,751 | |
| Takasago Thermal Engineering Co. Ltd. | 31,900 | 376,904 | |
| 42,762,301 | |||
| Commercial Services & Supplies - 0.2% | |||
| Brambles Ltd. | 93,862 | 789,964 | |
| Japan Elevator Service Holdings Co. Ltd. | 33,300 | 444,043 | |
| Nippon Kanzai Co. Ltd. | 15,900 | 303,228 | |
| Rentokil Initial PLC | 948,411 | 5,727,902 | |
| Ritchie Bros. Auctioneers, Inc. | 78,229 | 5,419,176 | |
| Secom Co. Ltd. | 217,500 | 13,856,762 | |
| Sohgo Security Services Co., Ltd. | 79,400 | 2,057,112 | |
| Toppan, Inc. | 198,900 | 3,123,654 | |
| 31,721,841 | |||
| Construction & Engineering - 0.2% | |||
| Balfour Beatty PLC | 931,481 | 3,410,784 | |
| Kajima Corp. | 275,700 | 2,901,065 | |
| Sanki Engineering Co. Ltd. | 18,000 | 212,615 | |
| Sweco AB (B Shares) (c) | 92,565 | 874,418 | |
| VINCI SA | 278,019 | 25,648,220 | |
| Voltas Ltd. | 132,929 | 1,654,382 | |
| 34,701,484 | |||
| Electrical Equipment - 1.0% | |||
| ABB Ltd.: | |||
| (Reg.) | 1,001,619 | 27,608,258 | |
| sponsored ADR (c) | 49,838 | 1,374,034 | |
| Contemporary Amperex Technology Co. Ltd. (b) | 33,500 | 2,327,795 | |
| Havells India Ltd. | 123,203 | 2,131,820 | |
| Legrand SA | 573,745 | 41,513,144 | |
| Mitsubishi Electric Corp. | 962,100 | 9,726,969 | |
| Prysmian SpA | 384,059 | 11,814,238 | |
| Schneider Electric SA | 498,498 | 59,250,171 | |
| Siemens Energy AG | 427,100 | 6,298,718 | |
| 162,045,147 | |||
| Industrial Conglomerates - 0.8% | |||
| CK Hutchison Holdings Ltd. | 2,437,400 | 15,739,895 | |
| DCC PLC (United Kingdom) | 269,947 | 15,563,840 | |
| Hitachi Ltd. | 672,580 | 33,603,496 | |
| Investment AB Latour (B Shares) | 70,417 | 1,393,807 | |
| Lifco AB | 121,307 | 1,894,142 | |
| Melrose Industries PLC | 7,914,627 | 12,550,386 | |
| Siemens AG | 342,360 | 34,679,046 | |
| Toshiba Corp. | 261,790 | 9,695,119 | |
| 125,119,731 | |||
| Machinery - 1.6% | |||
| Airtac International Group | 55,158 | 1,480,147 | |
| Alstom SA (c) | 1,014,546 | 20,791,341 | |
| Atlas Copco AB (A Shares) | 557,258 | 5,656,742 | |
| AutoStore Holdings Ltd. (a)(c) | 313,153 | 415,947 | |
| CNH Industrial NV | 760,300 | 9,306,293 | |
| Epiroc AB (A Shares) | 500,617 | 7,659,848 | |
| FANUC Corp. | 204,800 | 32,993,131 | |
| Furukawa Co. Ltd. | 5,200 | 47,144 | |
| GEA Group AG | 570,741 | 19,897,010 | |
| Harmonic Drive Systems, Inc. | 30,600 | 1,115,890 | |
| Husqvarna AB (B Shares) | 296,300 | 1,993,635 | |
| IMI PLC | 861,379 | 11,497,629 | |
| Indutrade AB | 105,709 | 1,965,434 | |
| KION Group AG | 122,642 | 4,900,389 | |
| Kitz Corp. | 61,200 | 356,840 | |
| Knorr-Bremse AG | 84,662 | 4,103,137 | |
| Kubota Corp. | 654,500 | 10,164,542 | |
| Max Co. Ltd. | 1,900 | 27,311 | |
| Misumi Group, Inc. | 78,500 | 1,926,872 | |
| Mitsuboshi Belting Ltd. | 13,400 | 308,048 | |
| Nachi-Fujikoshi Corp. | 1,300 | 35,272 | |
| NGK Insulators Ltd. | 113,800 | 1,624,777 | |
| Nitto Seiko Co. Ltd. | 4,000 | 15,538 | |
| Nordson Corp. | 30,115 | 6,841,225 | |
| NSK Ltd. | 28,800 | 156,121 | |
| OSG Corp. | 25,900 | 356,676 | |
| Rotork PLC | 876,444 | 2,512,831 | |
| Schindler Holding AG (participation certificate) | 101,949 | 17,803,268 | |
| Shenzhen Inovance Technology Co. Ltd. (A Shares) | 322,250 | 2,792,598 | |
| SMC Corp. | 63,800 | 30,268,614 | |
| Spirax-Sarco Engineering PLC | 130,296 | 15,946,288 | |
| Sumitomo Heavy Industries Ltd. | 8,200 | 172,126 | |
| Techtronic Industries Co. Ltd. | 824,000 | 9,718,457 | |
| The Weir Group PLC | 285,105 | 4,827,334 | |
| THK Co. Ltd. | 155,300 | 3,152,342 | |
| Toyota Industries Corp. | 401,400 | 22,435,390 | |
| VAT Group AG (a) | 4,978 | 1,194,720 | |
| Volvo AB (B Shares) | 395,278 | 6,261,320 | |
| 262,722,227 | |||
| Marine - 0.2% | |||
| A.P. Moller - Maersk A/S: | |||
| ADR (c) | 4,262 | 51,144 | |
| Series A | 3,326 | 7,801,825 | |
| Series B | 1,493 | 3,581,937 | |
| Mitsui OSK Lines Ltd. | 321,100 | 8,365,811 | |
| Nippon Yusen KK | 102,600 | 7,825,732 | |
| ZIM Integrated Shipping Services Ltd. (c) | 7,223 | 260,678 | |
| 27,887,127 | |||
| Professional Services - 0.8% | |||
| BayCurrent Consulting, Inc. | 4,700 | 1,381,189 | |
| Benefit One, Inc. | 72,400 | 1,071,794 | |
| Experian PLC | 708,381 | 21,496,146 | |
| Intertek Group PLC | 236,097 | 10,858,503 | |
| Nihon M&A Center Holdings, Inc. | 159,800 | 1,980,441 | |
| Persol Holdings Co. Ltd. | 211,400 | 4,243,688 | |
| Randstad NV | 32,176 | 1,503,267 | |
| Recruit Holdings Co. Ltd. | 264,100 | 8,395,899 | |
| RELX PLC: | |||
| rights 12/31/99 (b)(e) | 473,362 | 89,124 | |
| (Euronext N.V.) | 473,362 | 12,430,175 | |
| (London Stock Exchange) | 565,833 | 14,839,032 | |
| SGS SA (Reg.) | 7,148 | 15,741,210 | |
| SMS Co., Ltd. | 37,500 | 853,820 | |
| TechnoPro Holdings, Inc. | 378,000 | 8,502,666 | |
| Teleperformance | 43,140 | 12,325,412 | |
| Wolters Kluwer NV | 180,133 | 17,639,043 | |
| Wolters Kluwer NV: | |||
| ADR | 1,900 | 185,326 | |
| rights (b)(e) | 180,133 | 114,046 | |
| 133,650,781 | |||
| Road & Rail - 0.3% | |||
| Canadian National Railway Co. | 291,858 | 34,709,180 | |
| Canadian Pacific Railway Ltd. (c) | 121,899 | 9,125,359 | |
| Central Japan Railway Co. | 42,700 | 5,027,073 | |
| Sankyu, Inc. | 19,400 | 596,692 | |
| TFI International, Inc. (Canada) | 75,900 | 7,572,374 | |
| 57,030,678 | |||
| Trading Companies & Distributors - 0.6% | |||
| AerCap Holdings NV (b) | 255,197 | 11,241,428 | |
| Ashtead Group PLC | 476,010 | 23,501,685 | |
| Beijer Ref AB (B Shares) | 110,589 | 1,435,790 | |
| Bunzl PLC | 469,059 | 15,589,756 | |
| Diploma PLC | 53,586 | 1,563,742 | |
| Hanwa Co. Ltd. | 6,300 | 155,854 | |
| IMCD NV | 16,523 | 2,288,140 | |
| Kanamoto Co. Ltd. | 21,900 | 337,134 | |
| Marubeni Corp. | 124,900 | 1,301,743 | |
| Mitsubishi Corp. | 245,300 | 8,031,281 | |
| Mitsui & Co. Ltd. | 358,800 | 8,420,721 | |
| MonotaRO Co. Ltd. | 172,700 | 3,098,634 | |
| Ochi Holdings Co. Ltd. | 17,000 | 151,085 | |
| Rexel SA | 250,000 | 4,070,048 | |
| Sojitz Corp. | 90,300 | 1,519,382 | |
| Sumitomo Corp. | 467,100 | 6,570,041 | |
| Toromont Industries Ltd. | 30,625 | 2,370,531 | |
| Toyota Tsusho Corp. | 18,400 | 644,150 | |
| Wakita & Co. Ltd. | 14,100 | 113,405 | |
| Yamazen Co. Ltd. | 53,900 | 360,936 | |
| Yuasa Trading Co. Ltd. | 32,100 | 808,725 | |
| 93,574,211 | |||
| Transportation Infrastructure - 0.2% | |||
| Aena SME SA (a)(b) | 147,030 | 18,058,474 | |
| Beijing Capital International Airport Co. Ltd. (H Shares) (b) | 12,018,000 | 7,543,179 | |
| Grupo Aeroportuario del Sureste S.A.B. de CV Series B sponsored ADR | 13,062 | 2,762,221 | |
| 28,363,874 | |||
TOTAL INDUSTRIALS | 1,164,136,009 | ||
| INFORMATION TECHNOLOGY - 6.0% | |||
| Communications Equipment - 0.1% | |||
| Ericsson (B Shares) | 1,381,714 | 10,333,042 | |
| Nokia Corp. | 3,500,980 | 17,642,709 | |
| 27,975,751 | |||
| Electronic Equipment & Components - 0.9% | |||
| Enplas Corp. | 6,000 | 181,857 | |
| Halma PLC | 495,370 | 11,941,030 | |
| Hamamatsu Photonics K.K. | 126,000 | 5,342,230 | |
| Hexagon AB (B Shares) | 494,196 | 5,050,210 | |
| Hirose Electric Co. Ltd. | 130,290 | 18,461,770 | |
| Keyence Corp. | 40,200 | 15,094,057 | |
| Kyocera Corp. | 456,400 | 25,368,437 | |
| Largan Precision Co. Ltd. | 34,000 | 2,164,419 | |
| Macnica Fuji Electronics Holdings, Inc. | 4,200 | 90,117 | |
| Murata Manufacturing Co. Ltd. | 440,500 | 23,719,350 | |
| Oki Electric Industry Co. Ltd. | 21,400 | 115,481 | |
| OMRON Corp. | 197,700 | 10,404,214 | |
| Renishaw PLC | 22,897 | 983,115 | |
| Samsung SDI Co. Ltd. | 6,511 | 2,867,152 | |
| Sanshin Electronic Co. Ltd. | 14,500 | 179,006 | |
| Shimadzu Corp. | 612,800 | 17,897,475 | |
| Topcon Corp. | 62,300 | 840,381 | |
| Yokogawa Electric Corp. | 389,500 | 6,798,069 | |
| 147,498,370 | |||
| IT Services - 1.3% | |||
| Adyen BV (a)(b) | 6,227 | 9,609,164 | |
| Amadeus IT Holding SA Class A (b) | 1,207,922 | 63,765,431 | |
| Capgemini SA | 152,306 | 26,479,365 | |
| Computershare Ltd. | 73,786 | 1,230,581 | |
| Dlocal Ltd. (b) | 38,047 | 946,229 | |
| Fujitsu Ltd. | 202,240 | 23,798,248 | |
| Globant SA (b) | 11,702 | 2,466,431 | |
| GMO Payment Gateway, Inc. | 18,500 | 1,467,130 | |
| Infosys Ltd. | 464,506 | 8,557,226 | |
| Locaweb Servicos de Internet SA (a)(b) | 624,088 | 1,121,641 | |
| Mitsubishi Research Institute, Inc. | 13,300 | 398,158 | |
| Nomura Research Institute Ltd. | 808,700 | 21,765,198 | |
| NTT Data Corp. | 1,017,700 | 14,321,448 | |
| OBIC Co. Ltd. | 67,900 | 10,042,353 | |
| SCSK Corp. | 155,500 | 2,532,054 | |
| SHIFT, Inc. (b) | 12,300 | 1,762,498 | |
| Softcat PLC | 78,162 | 1,176,778 | |
| TIS, Inc. | 131,100 | 3,733,301 | |
| Visa, Inc. Class A | 51,191 | 10,172,164 | |
| 205,345,398 | |||
| Semiconductors & Semiconductor Equipment - 1.6% | |||
| ams-OSRAM AG (b) | 212,700 | 1,561,903 | |
| Analog Devices, Inc. | 134,439 | 20,371,542 | |
| ASML Holding NV | 5,135 | 2,515,842 | |
| ASML Holding NV (Netherlands) | 128,250 | 62,600,783 | |
| BE Semiconductor Industries NV | 18,820 | 896,295 | |
| Broadcom, Inc. | 29,314 | 14,630,911 | |
| Disco Corp. | 30,300 | 7,357,136 | |
| GlobalWafers Co. Ltd. | 59,000 | 934,153 | |
| Infineon Technologies AG | 622,970 | 15,243,365 | |
| MediaTek, Inc. | 310,000 | 6,712,571 | |
| NXP Semiconductors NV | 170,294 | 28,026,987 | |
| Renesas Electronics Corp. (b) | 384,700 | 3,642,551 | |
| Silergy Corp. | 52,000 | 892,151 | |
| SK Hynix, Inc. | 127,882 | 8,955,603 | |
| Taiwan Semiconductor Manufacturing Co. Ltd. | 1,531,000 | 25,081,523 | |
| Taiwan Semiconductor Manufacturing Co. Ltd. sponsored ADR | 494,198 | 41,191,403 | |
| Tokyo Electron Ltd. | 31,400 | 9,848,205 | |
| 250,462,924 | |||
| Software - 1.3% | |||
| ANSYS, Inc. (b) | 62,911 | 15,620,801 | |
| Atlassian Corp. PLC (b) | 24,211 | 5,996,096 | |
| Aveva Group PLC | 31,847 | 1,035,906 | |
| Cadence Design Systems, Inc. (b) | 286,432 | 49,773,289 | |
| Check Point Software Technologies Ltd. (b) | 91,900 | 11,050,056 | |
| Constellation Software, Inc. | 7,076 | 10,651,687 | |
| Dassault Systemes SA | 500,598 | 19,304,649 | |
| Kinaxis, Inc. (b) | 17,785 | 2,050,756 | |
| Nemetschek Se | 20,758 | 1,228,698 | |
| NICE Ltd. sponsored ADR (b) | 28,079 | 5,991,216 | |
| Rakus Co. Ltd. | 81,800 | 962,747 | |
| SAP SE | 800,555 | 68,182,782 | |
| SAP SE sponsored ADR (c) | 154,564 | 13,171,944 | |
| 205,020,627 | |||
| Technology Hardware, Storage & Peripherals - 0.8% | |||
| Brother Industries Ltd. | 170,700 | 3,266,773 | |
| Canon, Inc. | 191,700 | 4,591,083 | |
| Canon, Inc. sponsored ADR (c) | 83,747 | 1,999,878 | |
| FUJIFILM Holdings Corp. | 135,100 | 6,858,596 | |
| Ricoh Co. Ltd. | 286,500 | 2,251,732 | |
| Samsung Electronics Co. Ltd. | 2,286,211 | 100,880,803 | |
| Seiko Epson Corp. | 215,000 | 3,378,471 | |
| 123,227,336 | |||
TOTAL INFORMATION TECHNOLOGY | 959,530,406 | ||
| MATERIALS - 3.6% | |||
| Chemicals - 2.1% | |||
| Air Liquide SA | 235,444 | 29,504,153 | |
| Air Water, Inc. | 68,600 | 858,189 | |
| Akzo Nobel NV | 568,199 | 35,797,319 | |
| Asahi Kasei Corp. | 721,700 | 5,274,034 | |
| BASF AG | 397,780 | 16,825,631 | |
| Chr. Hansen Holding A/S | 32,061 | 1,872,346 | |
| Covestro AG (a) | 190,972 | 5,758,175 | |
| Croda International PLC | 265,249 | 20,725,480 | |
| Daicel Chemical Industries Ltd. | 221,000 | 1,387,928 | |
| Denka Co. Ltd. | 193,260 | 4,629,754 | |
| Evonik Industries AG | 167,969 | 3,138,844 | |
| Givaudan SA | 7,159 | 22,916,124 | |
| Icl Group Ltd. | 55,230 | 530,532 | |
| Johnson Matthey PLC | 255,416 | 5,978,843 | |
| Kansai Paint Co. Ltd. | 499,200 | 7,650,987 | |
| Kuraray Co. Ltd. | 89,500 | 679,827 | |
| Linde PLC | 79,990 | 22,625,971 | |
| Linde PLC | 95,370 | 26,931,625 | |
| Mitsubishi Chemical Holdings Corp. | 429,700 | 2,255,907 | |
| Mitsui Chemicals, Inc. | 16,100 | 361,695 | |
| Nippon Sanso Holdings Corp. | 229,900 | 4,181,223 | |
| Nitto Denko Corp. | 180,200 | 11,106,228 | |
| Novozymes A/S Series B | 328,010 | 18,863,096 | |
| PhosAgro PJSC (d) | 3,751 | 352 | |
| Pidilite Industries Ltd. | 59,830 | 2,041,344 | |
| Shin-Etsu Chemical Co. Ltd. | 64,100 | 7,444,115 | |
| Sika AG | 106,524 | 23,967,342 | |
| Sumitomo Chemical Co. Ltd. | 428,800 | 1,687,896 | |
| Symrise AG | 215,935 | 22,594,177 | |
| Teijin Ltd. | 128,400 | 1,357,507 | |
| Toray Industries, Inc. | 396,600 | 2,263,175 | |
| Tosoh Corp. | 147,900 | 1,912,324 | |
| Umicore SA | 125,536 | 3,990,293 | |
| UPL Ltd. | 172,066 | 1,647,263 | |
| Yara International ASA | 191,174 | 8,106,454 | |
| 326,866,153 | |||
| Construction Materials - 0.1% | |||
| CRH PLC | 147,907 | 5,461,853 | |
| HeidelbergCement AG | 228,700 | 10,327,515 | |
| Taiheiyo Cement Corp. | 24,400 | 365,303 | |
| 16,154,671 | |||
| Containers & Packaging - 0.1% | |||
| Amcor PLC unit | 385,213 | 4,663,173 | |
| CCL Industries, Inc. Class B | 37,073 | 1,818,436 | |
| Sig Group AG | 144,047 | 3,386,394 | |
| Smurfit Kappa Group PLC | 364,308 | 12,283,035 | |
| Toyo Seikan Group Holdings Ltd. | 56,800 | 672,165 | |
| 22,823,203 | |||
| Metals & Mining - 1.2% | |||
| Agnico Eagle Mines Ltd. (Canada) | 171,668 | 7,079,254 | |
| Anglo American PLC: | |||
| ADR | 15,297 | 246,435 | |
| (United Kingdom) | 298,109 | 9,579,577 | |
| Antofagasta PLC | 448,328 | 5,734,257 | |
| ArcelorMittal SA (Netherlands) | 381,200 | 9,100,230 | |
| BHP Group Ltd. | 878,971 | 23,978,344 | |
| BHP Group Ltd.: | |||
| (London) | 335,534 | 9,197,091 | |
| sponsored ADR | 94,000 | 5,159,660 | |
| Franco-Nevada Corp. | 233,795 | 28,108,448 | |
| Glencore Xstrata PLC | 4,223,573 | 23,092,635 | |
| IGO Ltd. | 1,821,084 | 16,297,398 | |
| Mitsubishi Materials Corp. | 26,400 | 394,021 | |
| Rio Tinto Ltd. | 145,701 | 9,253,963 | |
| Rio Tinto PLC | 369,098 | 20,378,002 | |
| Rio Tinto PLC sponsored ADR | 169,843 | 9,560,462 | |
| South32 Ltd. | 2,815,340 | 7,752,625 | |
| Wheaton Precious Metals Corp. | 184,284 | 5,625,268 | |
| 190,537,670 | |||
| Paper & Forest Products - 0.1% | |||
| Stora Enso Oyj (R Shares) | 468,672 | 7,006,005 | |
| Svenska Cellulosa AB SCA (B Shares) | 402,482 | 6,054,220 | |
| 13,060,225 | |||
TOTAL MATERIALS | 569,441,922 | ||
| REAL ESTATE - 0.5% | |||
| Equity Real Estate Investment Trusts (REITs) - 0.1% | |||
| Big Yellow Group PLC | 107,277 | 1,657,495 | |
| Great Portland Estates PLC | 714,746 | 4,134,996 | |
| Scentre Group unit | 2,809,781 | 5,583,865 | |
| Segro PLC | 327,601 | 3,588,814 | |
| Warehouses de Pauw | 43,155 | 1,317,539 | |
| 16,282,709 | |||
| Real Estate Management & Development - 0.4% | |||
| Airport City Ltd. (b) | 7,864 | 165,221 | |
| CK Asset Holdings Ltd. | 1,331,100 | 8,984,613 | |
| ESR Cayman Ltd. (a) | 2,005,800 | 5,616,447 | |
| Grand City Properties SA | 396,134 | 4,705,481 | |
| LEG Immobilien AG | 185,625 | 14,050,482 | |
| Lendlease Group unit | 809,400 | 5,640,317 | |
| Mitsui Fudosan Co. Ltd. | 514,000 | 10,403,678 | |
| TAG Immobilien AG (c) | 254,184 | 2,348,791 | |
| Vonovia SE | 260,506 | 7,052,298 | |
| 58,967,328 | |||
TOTAL REAL ESTATE | 75,250,037 | ||
| UTILITIES - 1.4% | |||
| Electric Utilities - 0.5% | |||
| Chubu Electric Power Co., Inc. | 52,900 | 537,930 | |
| CLP Holdings Ltd. | 646,000 | 5,566,128 | |
| EDF SA | 5,988 | 71,821 | |
| Enel SpA | 7,306,890 | 34,335,597 | |
| Iberdrola SA | 2,254,874 | 23,477,071 | |
| Iberdrola SA ADR | 5,500 | 228,360 | |
| Kansai Electric Power Co., Inc. | 497,100 | 4,817,719 | |
| Origin Energy Ltd. | 424,659 | 1,808,647 | |
| ORSTED A/S (a) | 76,272 | 7,444,340 | |
| The Okinawa Electric Power Co., Inc. | 49,600 | 404,437 | |
| Tokyo Electric Power Co., Inc. (b) | 279,100 | 1,090,016 | |
| 79,782,066 | |||
| Gas Utilities - 0.2% | |||
| APA Group unit | 814,655 | 6,143,173 | |
| Beijing Enterprises Holdings Ltd. | 754,500 | 2,244,204 | |
| China Resource Gas Group Ltd. | 1,090,400 | 4,245,373 | |
| Osaka Gas Co. Ltd. | 130,400 | 2,196,379 | |
| Tokyo Gas Co. Ltd. | 347,500 | 6,519,523 | |
| 21,348,652 | |||
| Independent Power and Renewable Electricity Producers - 0.2% | |||
| EDP Renovaveis SA | 149,480 | 3,630,816 | |
| Electric Power Development Co. Ltd. | 480,500 | 7,401,730 | |
| RWE AG | 632,040 | 24,187,220 | |
| RWE AG ADR | 20,428 | 780,554 | |
| Uniper SE (c) | 4,616 | 24,980 | |
| 36,025,300 | |||
| Multi-Utilities - 0.5% | |||
| E.ON AG | 1,062,855 | 9,065,718 | |
| Engie SA | 3,634,946 | 43,172,605 | |
| Engie SA ADR (c) | 98,719 | 1,178,705 | |
| National Grid PLC | 709,867 | 8,839,156 | |
| Veolia Environnement SA | 684,976 | 15,266,341 | |
| 77,522,525 | |||
TOTAL UTILITIES | 214,678,543 | ||
| TOTAL COMMON STOCKS (Cost $6,120,177,838) | 7,037,388,830 | ||
| Nonconvertible Preferred Stocks - 0.5% | |||
| Shares | Value ($) | ||
| CONSUMER DISCRETIONARY - 0.1% | |||
| Automobiles - 0.1% | |||
| Bayerische Motoren Werke AG (BMW) (non-vtg.) | 100,992 | 7,028,315 | |
| Porsche Automobil Holding SE (Germany) | 5,399 | 380,681 | |
| Volkswagen AG | 74,892 | 10,652,570 | |
| 18,061,566 | |||
| CONSUMER STAPLES - 0.2% | |||
| Household Products - 0.2% | |||
| Henkel AG & Co. KGaA | 483,762 | 31,218,909 | |
| ENERGY - 0.2% | |||
| Oil, Gas & Consumable Fuels - 0.2% | |||
| Petroleo Brasileiro SA - Petrobras: | |||
| (PN) (non-vtg.) | 1,855,000 | 11,848,695 | |
| (PN) sponsored ADR (non-vtg.) | 261,737 | 3,334,529 | |
| sponsored ADR | 659,745 | 9,427,756 | |
| 24,610,980 | |||
| FINANCIALS - 0.0% | |||
| Insurance - 0.0% | |||
| Samsung Fire & Marine Insurance Co. Ltd. | 34 | 4,028 | |
| INFORMATION TECHNOLOGY - 0.0% | |||
| Technology Hardware, Storage & Peripherals - 0.0% | |||
| Samsung Electronics Co. Ltd. | 51,864 | 2,089,723 | |
| TOTAL NONCONVERTIBLE PREFERRED STOCKS (Cost $76,828,500) | 75,985,206 | ||
| Equity Funds - 51.9% | |||
| Shares | Value ($) | ||
| Diversified Emerging Markets Funds - 0.0% | |||
| Matthews Pacific Tiger Fund Investor Class | 19,976 | 453,052 | |
| Europe Stock Funds - 1.3% | |||
| iShares MSCI United Kingdom ETF (c) | 6,827,728 | 197,389,616 | |
| WisdomTree Europe Hedged Equity ETF (c) | 209,614 | 13,872,255 | |
TOTAL EUROPE STOCK FUNDS | 211,261,871 | ||
| Foreign Large Blend Funds - 10.0% | |||
| Artisan International Value Fund Investor Class | 20,817,475 | 746,930,986 | |
| Fidelity SAI International Index Fund (f) | 2,459,707 | 27,843,883 | |
| Fidelity SAI International Low Volatility Index Fund (f) | 52,498,652 | 512,911,828 | |
| Harbor International Fund Institutional Class | 9,619 | 361,589 | |
| Morgan Stanley Institutional Fund, Inc. - International Equity Portfolio Class A | 25,023,608 | 303,286,129 | |
TOTAL FOREIGN LARGE BLEND FUNDS | 1,591,334,415 | ||
| Foreign Large Growth Funds - 17.7% | |||
| American Funds EuroPacific Growth Fund Class F2 | 148,814 | 7,168,363 | |
| Fidelity Advisor International Discovery Fund Class Z (f) | 21,005,227 | 813,742,504 | |
| Fidelity Diversified International Fund (f) | 13,370,292 | 472,506,106 | |
| Fidelity Overseas Fund (f) | 11,394,174 | 553,870,781 | |
| Fidelity SAI International Momentum Index Fund (f) | 15,255,576 | 162,776,991 | |
| Fidelity SAI International Quality Index Fund (f) | 229,961 | 2,368,595 | |
| Invesco Oppenheimer International Growth Fund Class R6 | 836,208 | 27,151,673 | |
| JOHCM International Select Fund Investor Shares | 18,984,018 | 375,124,197 | |
| WCM Focused International Growth Fund Investor Class | 20,690,913 | 397,058,617 | |
TOTAL FOREIGN LARGE GROWTH FUNDS | 2,811,767,827 | ||
| Foreign Large Value Funds - 12.5% | |||
| Fidelity SAI International Value Index Fund (f) | 103,027,366 | 817,007,013 | |
| iShares MSCI EAFE Value ETF (c) | 5,575,951 | 235,751,208 | |
| Oakmark International Fund Investor Class | 25,323,831 | 550,540,093 | |
| Pear Tree Polaris Foreign Value Fund Institutional Shares | 19,840,307 | 377,759,437 | |
TOTAL FOREIGN LARGE VALUE FUNDS | 1,981,057,751 | ||
| Foreign Small Mid Blend Funds - 1.5% | |||
| Fidelity Advisor International Small Cap Fund Class Z (f) | 1,565,342 | 40,589,312 | |
| Fidelity SAI International Small Cap Index Fund (f) | 15,283,075 | 114,775,891 | |
| Victory Trivalent International Small-Cap Fund Class I | 6,040,171 | 75,683,341 | |
TOTAL FOREIGN SMALL MID BLEND FUNDS | 231,048,544 | ||
| Foreign Small Mid Growth Funds - 0.7% | |||
| Fidelity Advisor International Small Cap Opportunities Fund - Class Z (f) | 2,588,253 | 47,106,203 | |
| Oberweis International Opportunities Institutional Fund | 1,819,480 | 15,210,853 | |
| T. Rowe Price International Discovery Fund | 693,406 | 40,092,752 | |
| Wasatch International Growth Fund Investor Class | 110 | 2,558 | |
TOTAL FOREIGN SMALL MID GROWTH FUNDS | 102,412,366 | ||
| Foreign Small Mid Value Funds - 0.7% | |||
| Brandes International Small Cap Equity Fund Class A | 2,423,064 | 25,708,711 | |
| Oakmark International Small Cap Fund Investor Class | 1,669,334 | 24,856,377 | |
| Transamerica International Small Cap Value Fund Class I | 5,682,172 | 66,822,347 | |
TOTAL FOREIGN SMALL MID VALUE FUNDS | 117,387,435 | ||
| Sector Funds - 0.0% | |||
| SPDR Dow Jones International Real Estate ETF (c) | 201,575 | 5,603,785 | |
| Other - 7.5% | |||
| Fidelity Advisor Japan Fund Class Z (f) | 3,900,816 | 55,586,629 | |
| Fidelity Japan Smaller Companies Fund (f) | 7,813,236 | 103,290,979 | |
| Fidelity SAI Japan Stock Index Fund (f) | 104,918,315 | 854,035,080 | |
| iShares MSCI Australia ETF (c) | 7,695,457 | 168,607,463 | |
| Matthews Japan Fund Investor Class | 222 | 3,520 | |
TOTAL OTHER | 1,181,523,671 | ||
| TOTAL EQUITY FUNDS (Cost $7,906,350,768) | 8,233,850,717 | ||
| U.S. Treasury Obligations - 0.1% | |||
Principal Amount (g) | Value ($) | ||
U.S. Treasury Bills, yield at date of purchase 1.11% to 2.5% 9/1/22 to 11/10/22 (h) (Cost $14,460,452) | 14,490,000 | 14,457,978 | |
| Money Market Funds - 3.5% | |||
| Shares | Value ($) | ||
| Fidelity Securities Lending Cash Central Fund 2.34% (i)(j) | 103,208,689 | 103,219,010 | |
| State Street Institutional U.S. Government Money Market Fund Premier Class 2.25% (k) | 463,333,426 | 463,333,426 | |
| TOTAL MONEY MARKET FUNDS (Cost $566,552,436) | 566,552,436 | ||
| TOTAL INVESTMENT IN SECURITIES - 100.4% (Cost $14,684,369,994) | 15,928,235,167 |
NET OTHER ASSETS (LIABILITIES) - (0.4)% | (68,521,636) |
| NET ASSETS - 100.0% | 15,859,713,531 |
| Futures Contracts | |||||
Number of contracts | Expiration Date | Notional Amount ($) | Value ($) | Unrealized Appreciation/ (Depreciation) ($) | |
| Purchased | |||||
| Equity Index Contracts | |||||
| CME Nikkei 225 Index Contracts (Japan) | 1,086 | Sep 2022 | 151,252,650 | 591,251 | 591,251 |
| ICE E-mini MSCI EAFE Index Contracts (United States) | 1,402 | Sep 2022 | 128,079,710 | (3,491,829) | (3,491,829) |
| TOTAL FUTURES CONTRACTS | (2,900,578) | ||||
| The notional amount of futures purchased as a percentage of Net Assets is 1.8% | |||||
| ETF | - | EXCHANGE-TRADED FUND |
| (a) | Security exempt from registration under Rule 144A of the Securities Act of 1933. These securities may be resold in transactions exempt from registration, normally to qualified institutional buyers. At the end of the period, the value of these securities amounted to $125,630,728 or 0.8% of net assets. |
| (b) | Non-income producing |
| (c) | Security or a portion of the security is on loan at period end. |
| (d) | Level 3 security |
| (e) | Security or a portion of the security purchased on a delayed delivery or when-issued basis. |
| (f) | Affiliated Fund |
| (g) | Amount is stated in United States dollars unless otherwise noted. |
| (h) | Security or a portion of the security was pledged to cover margin requirements for futures contracts. At period end, the value of securities pledged amounted to $13,397,978. |
| (i) | Affiliated fund that is generally available only to investment companies and other accounts managed by Fidelity Investments. The rate quoted is the annualized seven-day yield of the fund at period end. A complete unaudited listing of the fund's holdings as of its most recent quarter end is available upon request. In addition, each Fidelity Central Fund's financial statements are available on the SEC's website or upon request. |
| (j) | Investment made with cash collateral received from securities on loan. |
| (k) | The rate quoted is the annualized seven-day yield of the fund at period end. |
| Affiliate | Value, beginning of period ($) | Purchases ($) | Sales Proceeds ($) | Dividend Income ($) | Realized Gain (loss) ($) | Change in Unrealized appreciation (depreciation) ($) | Value, end of period ($) | %ownership, end of period |
| Fidelity Securities Lending Cash Central Fund 2.34% | 106,934,926 | 1,374,643,931 | 1,378,359,847 | 2,350,511 | - | - | 103,219,010 | 0.3% |
| Total | 106,934,926 | 1,374,643,931 | 1,378,359,847 | 2,350,511 | - | - | 103,219,010 | |
| Affiliate | Value, beginning of period ($) | Purchases ($) | Sales Proceeds ($) | Dividend Income ($) | Realized Gain (loss) ($) | Change in Unrealized appreciation (depreciation) ($) | Value, end of period ($) |
| Fidelity Advisor International Discovery Fund Class Z | 1,125,937,643 | - | 139,000,001 | - | (19,700,415) | (153,494,723) | 813,742,504 |
| Fidelity Advisor International Small Cap Fund Class Z | 75,483,967 | 277,357 | 25,450,222 | - | (4,392,504) | (5,329,286) | 40,589,312 |
| Fidelity Advisor International Small Cap Opportunities Fund - Class Z | 77,918,434 | - | 17,797,543 | - | (2,544,413) | (10,470,275) | 47,106,203 |
| Fidelity Advisor Japan Fund Class Z | 64,324,457 | - | - | - | - | (8,737,828) | 55,586,629 |
| Fidelity Diversified International Fund | 649,338,765 | - | 70,999,999 | - | (23,548,783) | (82,283,877) | 472,506,106 |
| Fidelity Japan Smaller Companies Fund | 115,870,288 | - | - | - | - | (12,579,309) | 103,290,979 |
| Fidelity Overseas Fund | 778,192,337 | - | 98,000,000 | - | (29,733,945) | (96,587,611) | 553,870,781 |
| Fidelity SAI International Index Fund | 320,771,471 | 433,500,000 | 717,500,000 | - | (35,559,162) | 26,631,574 | 27,843,883 |
| Fidelity SAI International Low Volatility Index Fund | 171,461,639 | 372,000,000 | - | - | - | (30,549,811) | 512,911,828 |
| Fidelity SAI International Momentum Index Fund | 451,078,800 | - | 222,000,001 | - | (72,187,933) | 5,886,125 | 162,776,991 |
| Fidelity SAI International Quality Index Fund | 2,773,326 | - | - | - | - | (404,731) | 2,368,595 |
| Fidelity SAI International Small Cap Index Fund | 148,232,792 | 8,445,173 | 18,810,314 | - | (4,474,300) | (18,617,460) | 114,775,891 |
| Fidelity SAI International Value Index Fund | 1,659,358,147 | - | 638,000,000 | - | (105,495,999) | (98,855,135) | 817,007,013 |
| Fidelity SAI Japan Stock Index Fund | 1,198,577,710 | - | 189,000,000 | - | (43,951,887) | (111,590,743) | 854,035,080 |
| 6,839,319,776 | 814,222,530 | 2,136,558,080 | - | (341,589,341) | (596,983,090) | 4,578,411,795 |
| Valuation Inputs at Reporting Date: | ||||
| Description | Total ($) | Level 1 ($) | Level 2 ($) | Level 3 ($) |
Investments in Securities: | ||||
| Equities: | ||||
Communication Services | 263,279,321 | 54,918,216 | 208,361,105 | - |
Consumer Discretionary | 561,094,975 | 156,132,138 | 404,962,837 | - |
Consumer Staples | 881,704,404 | 132,415,371 | 749,289,033 | - |
Energy | 407,287,111 | 136,050,963 | 270,518,433 | 717,715 |
Financials | 1,152,220,526 | 294,605,489 | 857,598,028 | 17,009 |
Health Care | 862,661,059 | 131,304,165 | 731,356,894 | - |
Industrials | 1,164,136,009 | 427,199,709 | 736,936,300 | - |
Information Technology | 961,620,129 | 283,051,963 | 678,568,166 | - |
Materials | 569,441,922 | 242,048,510 | 327,393,060 | 352 |
Real Estate | 75,250,037 | 31,968,819 | 43,281,218 | - |
Utilities | 214,678,543 | 30,102,456 | 184,576,087 | - |
| Equity Funds | 8,233,850,717 | 8,233,850,717 | - | - |
| Other Short-Term Investments | 14,457,978 | - | 14,457,978 | - |
| Money Market Funds | 566,552,436 | 566,552,436 | - | - |
| Total Investments in Securities: | 15,928,235,167 | 10,720,200,952 | 5,207,299,139 | 735,076 |
Derivative Instruments: | ||||
| Assets | ||||
Futures Contracts | 591,251 | 591,251 | - | - |
| Total Assets | 591,251 | 591,251 | - | - |
| Liabilities | ||||
Futures Contracts | (3,491,829) | (3,491,829) | - | - |
| Total Liabilities | (3,491,829) | (3,491,829) | - | - |
| Total Derivative Instruments: | (2,900,578) | (2,900,578) | - | - |
Primary Risk Exposure / Derivative Type | Value | |
| Asset ($) | Liability ($) | |
| Equity Risk | ||
Futures Contracts (a) | 591,251 | (3,491,829) |
| Total Equity Risk | 591,251 | (3,491,829) |
| Total Value of Derivatives | 591,251 | (3,491,829) |
| Statement of Assets and Liabilities | ||||
August 31, 2022 (Unaudited) | ||||
| Assets | ||||
| Investment in securities, at value (including securities loaned of $95,860,431) - See accompanying schedule: | $11,246,604,362 | |||
Unaffiliated issuers (cost $9,910,432,332) | ||||
Fidelity Central Funds (cost $103,219,010) | 103,219,010 | |||
Other affiliated issuers (cost $4,670,718,652) | 4,578,411,795 | |||
| Total Investment in Securities (cost $14,684,369,994) | $ | 15,928,235,167 | ||
| Foreign currency held at value (cost $5,012,893) | 5,028,749 | |||
| Receivable for investments sold | 5,428,099 | |||
| Receivable for fund shares sold | 7,142,455 | |||
| Dividends receivable | 16,583,443 | |||
| Reclaims receivable | 28,134,430 | |||
| Interest receivable | 879,343 | |||
| Distributions receivable from Fidelity Central Funds | 107,947 | |||
| Prepaid expenses | 38,532 | |||
| Other receivables | 256,924 | |||
Total assets | 15,991,835,089 | |||
| Liabilities | ||||
| Payable for investments purchased | ||||
Regular delivery | $16,051,400 | |||
Delayed delivery | 594,361 | |||
| Payable for fund shares redeemed | 7,340,867 | |||
| Accrued management fee | 2,184,140 | |||
| Payable for daily variation margin on futures contracts | 1,347,480 | |||
| Other payables and accrued expenses | 1,303,151 | |||
| Collateral on securities loaned | 103,300,159 | |||
| Total Liabilities | 132,121,558 | |||
| Net Assets | $ | 15,859,713,531 | ||
| Net Assets consist of: | ||||
| Paid in capital | $ | 14,944,057,617 | ||
| Total accumulated earnings (loss) | 915,655,914 | |||
| Net Assets | $ | 15,859,713,531 | ||
Net Asset Value , offering price and redemption price per share ($15,859,713,531 ÷ 1,651,157,397 shares) | $ | 9.61 | ||
| Statement of Operations | ||||
Six months ended August 31, 2022 (Unaudited) | ||||
| Investment Income | ||||
| Dividends: | ||||
| Unaffiliated issuers | $ | 221,280,664 | ||
| Non-Cash dividends | 12,643,244 | |||
| Interest | 2,354,197 | |||
| Income from Fidelity Central Funds (including $2,350,511 from security lending) | 2,350,511 | |||
| Income before foreign taxes withheld | 238,628,616 | |||
| Less foreign taxes withheld | (19,998,549) | |||
| Total Income | 218,630,067 | |||
| Expenses | ||||
| Management fee | $ | 38,384,510 | ||
| Custodian fees and expenses | 321,035 | |||
| Independent trustees' fees and expenses | 63,006 | |||
| Registration fees | 86,849 | |||
| Audit | 82,794 | |||
| Legal | 17,756 | |||
| Miscellaneous | 69,572 | |||
| Total expenses before reductions | 39,025,522 | |||
| Expense reductions | (23,920,842) | |||
| Total expenses after reductions | 15,104,680 | |||
| Net Investment income (loss) | 203,525,387 | |||
| Realized and Unrealized Gain (Loss) | ||||
| Net realized gain (loss) on: | ||||
| Investment Securities: | ||||
| Unaffiliated issuers(net of foreign taxes of $495,513) | (59,393,712) | |||
| Other affiliated issuers | (341,589,341) | |||
| Foreign currency transactions | (2,982,289) | |||
| Futures contracts | (43,563,672) | |||
| Capital gain distributions from underlying funds: | ||||
| Unaffiliated issuers | 39,619 | |||
| Total net realized gain (loss) | (447,489,395) | |||
| Change in net unrealized appreciation (depreciation) on: | ||||
| Investment Securities: | ||||
| Unaffiliated issuers (net of decrease in deferred foreign taxes of $414,150) | (2,383,808,935) | |||
| Affiliated issuers | (596,983,090) | |||
| Assets and liabilities in foreign currencies | (2,613,344) | |||
| Futures contracts | 14,774,814 | |||
| Total change in net unrealized appreciation (depreciation) | (2,968,630,555) | |||
| Net gain (loss) | (3,416,119,950) | |||
| Net increase (decrease) in net assets resulting from operations | $ | (3,212,594,563) | ||
| Statement of Changes in Net Assets | ||||
Six months ended August 31, 2022 (Unaudited) | Year ended February 28, 2022 | |||
| Increase (Decrease) in Net Assets | ||||
| Operations | ||||
| Net investment income (loss) | $ | 203,525,387 | $ | 420,263,151 |
| Net realized gain (loss) | (447,489,395) | 1,640,920,347 | ||
| Change in net unrealized appreciation (depreciation) | (2,968,630,555) | (2,142,116,264) | ||
| Net increase (decrease) in net assets resulting from operations | (3,212,594,563) | (80,932,766) | ||
| Distributions to shareholders | (430,058,700) | (1,971,210,060) | ||
| Share transactions | ||||
| Proceeds from sales of shares | 1,316,732,624 | 6,949,817,508 | ||
| Reinvestment of distributions | 393,404,598 | 1,846,735,934 | ||
| Cost of shares redeemed | (4,866,252,631) | (3,886,239,701) | ||
Net increase (decrease) in net assets resulting from share transactions | (3,156,115,409) | 4,910,313,741 | ||
| Total increase (decrease) in net assets | (6,798,768,672) | 2,858,170,915 | ||
| Net Assets | ||||
| Beginning of period | 22,658,482,203 | 19,800,311,288 | ||
| End of period | $ | 15,859,713,531 | $ | 22,658,482,203 |
| Other Information | ||||
| Shares | ||||
| Sold | 125,177,672 | 536,412,235 | ||
| Issued in reinvestment of distributions | 35,505,830 | 146,286,367 | ||
| Redeemed | (470,707,356) | (299,692,661) | ||
| Net increase (decrease) | (310,023,854) | 383,005,941 | ||
| Strategic Advisers® International Fund |
Six months ended (Unaudited) August 31, 2022 | Years ended February 28, 2022 | 2021 | 2020 A | 2019 | 2018 | |||||||
Selected Per-Share Data | ||||||||||||
| Net asset value, beginning of period | $ | 11.55 | $ | 12.55 | $ | 9.93 | $ | 10.03 | $ | 11.43 | $ | 9.78 |
| Income from Investment Operations | ||||||||||||
Net investment income (loss) B,C | .11 | .24 | .13 | .20 | .21 | .19 | ||||||
| Net realized and unrealized gain (loss) | (1.82) | (.12) | 2.71 | .06 | (.98) | 1.82 | ||||||
| Total from investment operations | (1.71) | .12 | 2.84 | .26 | (.77) | 2.01 | ||||||
| Distributions from net investment income | - D | (.26) | (.14) | (.22) | (.18) | (.18) | ||||||
| Distributions from net realized gain | (.22) | (.86) | (.08) | (.14) | (.44) | (.18) | ||||||
| Total distributions | (.23) E | (1.12) | (.22) | (.36) | (.63) E | (.36) | ||||||
| Net asset value, end of period | $ | 9.61 | $ | 11.55 | $ | 12.55 | $ | 9.93 | $ | 10.03 | $ | 11.43 |
Total Return F,G | (15.10)% | .30% | 28.99% | 2.35% | (6.57)% | 20.53% | ||||||
Ratios to Average Net Assets C,H,I | ||||||||||||
| Expenses before reductions | .41% J | .41% | .43% | .44% | .45% | .50% | ||||||
| Expenses net of fee waivers, if any | .16% J | .16% | .18% | .19% | .20% | .25% | ||||||
| Expenses net of all reductions | .16% J | .16% | .18% | .19% | .20% | .24% | ||||||
| Net investment income (loss) | 2.13% J | 1.83% | 1.25% | 1.91% | 1.95% | 1.68% | ||||||
| Supplemental Data | ||||||||||||
| Net assets, end of period (000 omitted) | $ | 15,859,714 | $ | 22,658,482 | $ | 19,800,311 | $ | 15,096,568 | $ | 15,904,961 | $ | 17,256,557 |
Portfolio turnover rate K | 29% J | 29% | 41% | 33% | 39% | 33% |
| Strategic Advisers International Fund | $256,910 |
| Gross unrealized appreciation | $2,596,201,813 |
| Gross unrealized depreciation | (1,450,652,710) |
| Net unrealized appreciation (depreciation) | $1,145,549,103 |
| Tax cost | $14,779,785,486 |
| Equity Risk | Equity risk relates to the fluctuations in the value of financial instruments as a result of changes in market prices (other than those arising from interest rate risk or foreign exchange risk), whether caused by factors specific to an individual investment, its issuer, or all factors affecting all instruments traded in a market or market segment. |
| Purchases ($) | Sales ($) | |
| Strategic Advisers International Fund | 2,698,530,731 | 5,763,394,678 |
| Amount | |
| Strategic Advisers International Fund | $ 3,185 |
| Fidelity Central Fund | Investment Manager | Investment Objective | Investment Practices | Expense Ratio A |
| Fidelity Money Market Central Funds | Fidelity Management & Research Company LLC (FMR) | Each fund seeks to obtain a high level of current income consistent with the preservation of capital and liquidity. | Short-term Investments | Less than .005% |
| Amount | |
| Strategic Advisers International Fund | $ 18,728 |
| Total Security Lending Fees Paid to NFS | Security Lending Income From Securities Loaned to NFS | Value of Securities Loaned to NFS at Period End | |
| Strategic Advisers International Fund | $ 253,429 | $ - | $- |
| Fund | Strategic Advisers International Fund |
| Fidelity International Discovery Fund | 10% |
| Fidelity Japan Smaller Companies Fund | 26% |
| Fidelity SAI International Momentum Index Fund | 24% |
| Fidelity SAI International Small Cap Index Fund | 16% |
| Fidelity SAI International Value Index Fund | 18% |
| Fidelity SAI Japan Stock Index Fund | 85% |
| The Example is based on an investment of $1,000 invested at the beginning of the period and held for the entire period (March 1, 2022 to August 31, 2022). |
Annualized Expense Ratio- A | Beginning Account Value March 1, 2022 | Ending Account Value August 31, 2022 | Expenses Paid During Period- C March 1, 2022 to August 31, 2022 | |||||||
| Strategic Advisers® International Fund | .16% | |||||||||
| Actual | $ 1,000 | $ 849.00 | $ .75 | |||||||
Hypothetical- B | $ 1,000 | $ 1,024.40 | $ .82 | |||||||
|


Contents
Top Holdings (% of Fund's net assets) | ||
| (excluding cash equivalents) | ||
| Fidelity SAI International Value Index Fund | 18.3 | |
| Fidelity Overseas Fund | 11.0 | |
| Fidelity Advisor International Discovery Fund Class Z | 10.5 | |
| Fidelity Diversified International Fund | 8.8 | |
| Fidelity International Capital Appreciation Fund | 7.8 | |
| Fidelity SAI International Low Volatility Index Fund | 6.0 | |
| Fidelity SAI International Small Cap Index Fund | 2.5 | |
| Fidelity Advisor Japan Fund Class Z | 1.9 | |
| Fidelity SAI International Index Fund | 1.4 | |
| Fidelity SAI International Momentum Index Fund | 1.3 | |
| 69.5 | ||
Asset Allocation (% of Fund's net assets) |
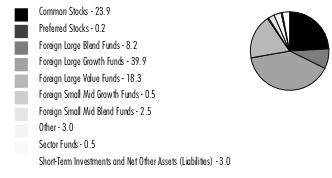 |
| Common Stocks - 23.9% | |||
| Shares | Value ($) | ||
| COMMUNICATION SERVICES - 0.9% | |||
| Diversified Telecommunication Services - 0.3% | |||
| Cellnex Telecom SA (a) | 466,432 | 18,164,136 | |
| Deutsche Telekom AG | 1,164,381 | 21,945,363 | |
| Elisa Corp. (A Shares) | 292,508 | 15,656,092 | |
| HKT Trust/HKT Ltd. unit | 6,792,000 | 9,112,013 | |
| 64,877,604 | |||
| Entertainment - 0.2% | |||
| Capcom Co. Ltd. | 490,800 | 13,396,255 | |
| Sea Ltd. ADR (b) | 86,050 | 5,335,100 | |
| Universal Music Group NV | 934,627 | 18,559,776 | |
| 37,291,131 | |||
| Interactive Media & Services - 0.0% | |||
| Z Holdings Corp. | 1,688,900 | 4,965,156 | |
| Media - 0.1% | |||
| Vivendi SA (c) | 1,073,900 | 9,734,321 | |
| Wireless Telecommunication Services - 0.3% | |||
| SoftBank Group Corp. | 891,000 | 35,293,901 | |
| Vodafone Group PLC | 12,256,158 | 16,409,182 | |
| 51,703,083 | |||
TOTAL COMMUNICATION SERVICES | 168,571,295 | ||
| CONSUMER DISCRETIONARY - 2.3% | |||
| Auto Components - 0.2% | |||
| DENSO Corp. | 623,300 | 34,020,174 | |
| Automobiles - 1.0% | |||
| Ferrari NV (Italy) | 54,541 | 10,589,481 | |
| Isuzu Motors Ltd. | 2,366,100 | 29,386,219 | |
| Mercedes-Benz Group AG (Germany) | 342,207 | 19,186,070 | |
| Suzuki Motor Corp. | 741,300 | 25,909,288 | |
| Toyota Motor Corp. | 7,131,100 | 106,717,400 | |
| 191,788,458 | |||
| Hotels, Restaurants & Leisure - 0.2% | |||
| Compass Group PLC | 650,461 | 13,992,105 | |
| Flight Centre Travel Group Ltd. (b)(c) | 1,284,411 | 15,495,331 | |
| Flutter Entertainment PLC (Ireland) (b) | 27,632 | 3,478,040 | |
| InterContinental Hotel Group PLC | 189,211 | 10,271,544 | |
| 43,237,020 | |||
| Household Durables - 0.1% | |||
| Sony Group Corp. | 339,000 | 26,951,621 | |
| Internet & Direct Marketing Retail - 0.1% | |||
| Delivery Hero AG (a)(b) | 101,892 | 4,228,643 | |
| Prosus NV | 227,202 | 14,043,238 | |
| ZOZO, Inc. | 212,200 | 4,690,305 | |
| 22,962,186 | |||
| Multiline Retail - 0.1% | |||
| B&M European Value Retail SA | 1,302,012 | 5,594,913 | |
| Pan Pacific International Holdings Ltd. | 336,100 | 6,034,877 | |
| 11,629,790 | |||
| Specialty Retail - 0.1% | |||
| Fast Retailing Co. Ltd. | 7,600 | 4,443,962 | |
| WH Smith PLC (b) | 245,978 | 4,084,834 | |
| 8,528,796 | |||
| Textiles, Apparel & Luxury Goods - 0.5% | |||
| Compagnie Financiere Richemont SA Series A | 174,290 | 19,490,578 | |
| EssilorLuxottica SA | 89,773 | 13,464,943 | |
| Hermes International SCA | 9,464 | 12,197,661 | |
| LVMH Moet Hennessy Louis Vuitton SE | 87,290 | 56,325,350 | |
| 101,478,532 | |||
TOTAL CONSUMER DISCRETIONARY | 440,596,577 | ||
| CONSUMER STAPLES - 1.8% | |||
| Beverages - 0.6% | |||
| Anheuser-Busch InBev SA NV | 244,188 | 11,792,942 | |
| Coca-Cola HBC AG | 456,365 | 10,444,137 | |
| Diageo PLC | 1,023,592 | 44,471,382 | |
| Heineken NV (Bearer) | 136,086 | 12,272,809 | |
| Pernod Ricard SA | 147,480 | 27,203,950 | |
| 106,185,220 | |||
| Food & Staples Retailing - 0.1% | |||
| Seven & i Holdings Co. Ltd. | 347,500 | 13,804,618 | |
| Food Products - 0.7% | |||
| Nestle SA (Reg. S) | 949,522 | 111,115,889 | |
| Tate & Lyle PLC | 2,065,085 | 18,333,229 | |
| 129,449,118 | |||
| Household Products - 0.2% | |||
| Reckitt Benckiser Group PLC | 555,836 | 42,889,194 | |
| Personal Products - 0.2% | |||
| Shiseido Co. Ltd. | 397,500 | 15,015,090 | |
| Unilever PLC | 525,509 | 23,838,308 | |
| 38,853,398 | |||
| Tobacco - 0.0% | |||
| Imperial Brands PLC | 426,372 | 9,376,704 | |
TOTAL CONSUMER STAPLES | 340,558,252 | ||
| ENERGY - 1.9% | |||
| Energy Equipment & Services - 0.2% | |||
| John Wood Group PLC (b) | 6,580,533 | 9,888,297 | |
| Tenaris SA | 1,808,203 | 24,735,286 | |
| 34,623,583 | |||
| Oil, Gas & Consumable Fuels - 1.7% | |||
| BP PLC | 5,570,344 | 28,464,034 | |
| Equinor ASA | 1,113,093 | 43,199,865 | |
| Idemitsu Kosan Co. Ltd. | 293,900 | 7,749,340 | |
| INPEX Corp. | 1,136,600 | 13,064,793 | |
| Reliance Industries Ltd. sponsored GDR (a)(b) | 193,300 | 12,738,470 | |
| Santos Ltd. | 2,368,923 | 12,645,982 | |
| Shell PLC: | |||
| ADR (c) | 1,017,800 | 53,923,044 | |
| (London) | 692,514 | 18,329,483 | |
| rights (b)(d) | 692,514 | 164,994 | |
| Thungela Resources Ltd. (c) | 84,400 | 1,619,744 | |
| TotalEnergies SE | 2,012,565 | 101,895,577 | |
| Woodside Energy Group Ltd. | 1,372,575 | 31,882,881 | |
| 325,678,207 | |||
TOTAL ENERGY | 360,301,790 | ||
| FINANCIALS - 5.4% | |||
| Banks - 2.6% | |||
| Banco Santander SA (Spain) | 11,884,247 | 28,768,157 | |
| Bank of Ireland Group PLC | 1,119,296 | 6,931,243 | |
| BNP Paribas SA | 1,060,040 | 49,260,258 | |
| CaixaBank SA | 6,092,172 | 18,395,331 | |
| Commonwealth Bank of Australia | 400,065 | 26,437,199 | |
| DBS Group Holdings Ltd. | 958,000 | 22,305,599 | |
| Erste Group Bank AG | 214,800 | 4,830,369 | |
| FinecoBank SpA | 1,109,685 | 12,060,649 | |
| HSBC Holdings PLC (United Kingdom) | 3,205,397 | 19,638,965 | |
| ING Groep NV (Certificaten Van Aandelen) | 1,291,787 | 11,321,789 | |
| KBC Group NV | 659,538 | 31,455,029 | |
| Lloyds Banking Group PLC | 65,700,388 | 33,294,136 | |
| Mediobanca SpA | 1,147,500 | 9,119,348 | |
| Mitsubishi UFJ Financial Group, Inc. | 9,507,700 | 49,287,421 | |
| National Australia Bank Ltd. | 824,301 | 17,092,813 | |
| NatWest Group PLC | 6,494,590 | 18,594,074 | |
| Nordea Bank ABP | 2,364,736 | 21,994,707 | |
| PT Bank Rakyat Indonesia (Persero) Tbk | 22,831,800 | 6,667,550 | |
| Societe Generale Series A | 193,777 | 4,271,895 | |
| Standard Chartered PLC (United Kingdom) | 4,274,473 | 29,704,550 | |
| Sumitomo Mitsui Financial Group, Inc. | 548,200 | 16,535,501 | |
| Unicaja Banco SA (a) | 2,989,700 | 2,693,533 | |
| United Overseas Bank Ltd. | 2,992,603 | 58,354,127 | |
| 499,014,243 | |||
| Capital Markets - 0.6% | |||
| Hong Kong Exchanges and Clearing Ltd. | 256,800 | 10,347,635 | |
| Macquarie Group Ltd. | 387,021 | 46,308,338 | |
| Nordnet AB | 567,165 | 6,823,538 | |
| UBS Group AG | 1,175,408 | 18,674,257 | |
| UBS Group AG (c) | 1,602,600 | 25,401,210 | |
| 107,554,978 | |||
| Diversified Financial Services - 0.3% | |||
| Investor AB (B Shares) | 1,747,956 | 27,662,306 | |
| ORIX Corp. | 2,162,900 | 35,552,427 | |
| 63,214,733 | |||
| Insurance - 1.9% | |||
| AIA Group Ltd. | 4,908,200 | 47,222,953 | |
| Aviva PLC | 3,077,266 | 14,967,938 | |
| AXA SA | 2,084,274 | 49,088,021 | |
| Beazley PLC | 1,052,000 | 7,124,892 | |
| Hannover Reuck SE | 102,200 | 15,087,495 | |
| Hiscox Ltd. | 791,564 | 8,255,809 | |
| Muenchener Rueckversicherungs-Gesellschaft AG in Muenchen | 91,243 | 21,799,844 | |
| NN Group NV | 587,122 | 24,173,458 | |
| NN Group NV rights (b)(c)(d) | 587,122 | 590,028 | |
| Prudential PLC | 728,322 | 7,643,858 | |
| Sampo Oyj (A Shares) | 395,700 | 17,901,599 | |
| Steadfast Group Ltd. | 6,047,451 | 20,697,577 | |
| Swiss Life Holding AG | 20,340 | 10,662,114 | |
| Talanx AG | 313,192 | 11,110,403 | |
| Tokio Marine Holdings, Inc. | 665,300 | 36,870,517 | |
| Zurich Insurance Group Ltd. | 134,012 | 59,487,885 | |
| 352,684,391 | |||
TOTAL FINANCIALS | 1,022,468,345 | ||
| HEALTH CARE - 2.8% | |||
| Biotechnology - 0.1% | |||
| Argenx SE (b) | 55,821 | 21,020,044 | |
| Health Care Equipment & Supplies - 0.5% | |||
| GN Store Nord A/S | 132,550 | 3,766,546 | |
| Hoya Corp. | 493,600 | 50,335,736 | |
| Olympus Corp. | 1,552,400 | 33,061,830 | |
| Siemens Healthineers AG (a) | 224,641 | 10,977,337 | |
| 98,141,449 | |||
| Life Sciences Tools & Services - 0.2% | |||
| Eurofins Scientific SA | 144,654 | 10,045,070 | |
| Lonza Group AG | 20,833 | 11,110,656 | |
| Sartorius Stedim Biotech | 37,349 | 13,726,139 | |
| 34,881,865 | |||
| Pharmaceuticals - 2.0% | |||
| AstraZeneca PLC (United Kingdom) | 864,635 | 106,948,725 | |
| Bayer AG | 306,900 | 16,231,326 | |
| Daiichi Sankyo Kabushiki Kaisha | 888,900 | 26,713,051 | |
| Euroapi SASU (b)(c) | 17,270 | 269,965 | |
| Merck KGaA | 122,717 | 21,080,322 | |
| Novartis AG | 163,270 | 13,206,595 | |
| Roche Holding AG (participation certificate) | 292,078 | 94,119,696 | |
| Sanofi SA | 1,015,271 | 82,998,242 | |
| UCB SA | 415,591 | 29,277,137 | |
| 390,845,059 | |||
TOTAL HEALTH CARE | 544,888,417 | ||
| INDUSTRIALS - 3.5% | |||
| Aerospace & Defense - 0.6% | |||
| Airbus Group NV | 295,729 | 28,979,416 | |
| BAE Systems PLC | 4,572,428 | 41,179,744 | |
| Dassault Aviation SA | 58,221 | 8,015,760 | |
| Rheinmetall AG | 144,720 | 23,037,120 | |
| Thales SA | 50,428 | 6,088,916 | |
| 107,300,956 | |||
| Air Freight & Logistics - 0.4% | |||
| Deutsche Post AG | 1,485,058 | 54,203,320 | |
| DSV A/S | 190,863 | 28,278,388 | |
| 82,481,708 | |||
| Airlines - 0.0% | |||
| Ryanair Holdings PLC sponsored ADR (b) | 151,100 | 10,986,481 | |
| Building Products - 0.2% | |||
| ASSA ABLOY AB (B Shares) | 828,417 | 16,778,736 | |
| Kingspan Group PLC (Ireland) | 153,194 | 8,719,859 | |
| Nibe Industrier AB (B Shares) | 613,937 | 5,773,657 | |
| 31,272,252 | |||
| Commercial Services & Supplies - 0.0% | |||
| Rentokil Initial PLC | 903,195 | 5,454,822 | |
| Construction & Engineering - 0.2% | |||
| Ferrovial SA | 383,446 | 9,625,895 | |
| VINCI SA | 300,738 | 27,744,127 | |
| 37,370,022 | |||
| Industrial Conglomerates - 0.7% | |||
| Hitachi Ltd. | 1,605,800 | 80,229,109 | |
| Siemens AG | 482,049 | 48,828,716 | |
| 129,057,825 | |||
| Machinery - 0.5% | |||
| Indutrade AB | 455,961 | 8,477,624 | |
| Kawasaki Heavy Industries Ltd. | 579,100 | 11,239,213 | |
| Minebea Mitsumi, Inc. | 1,457,900 | 25,057,056 | |
| Misumi Group, Inc. | 474,400 | 11,644,686 | |
| Sandvik AB | 943,309 | 14,706,659 | |
| SMC Corp. | 17,600 | 8,349,962 | |
| Techtronic Industries Co. Ltd. | 721,000 | 8,503,650 | |
| 87,978,850 | |||
| Professional Services - 0.4% | |||
| Experian PLC | 224,554 | 6,814,194 | |
| Persol Holdings Co. Ltd. | 657,900 | 13,206,823 | |
| Recruit Holdings Co. Ltd. | 540,200 | 17,173,285 | |
| RELX PLC (London Stock Exchange) | 495,421 | 12,992,470 | |
| Teleperformance | 54,271 | 15,505,620 | |
| Wolters Kluwer NV | 63,324 | 6,200,834 | |
| 71,893,226 | |||
| Trading Companies & Distributors - 0.5% | |||
| Brenntag SE | 185,073 | 12,134,773 | |
| Bunzl PLC | 587,960 | 19,541,578 | |
| Ferguson PLC | 50,500 | 5,858,372 | |
| IMCD NV | 84,866 | 11,752,423 | |
| Itochu Corp. | 1,258,700 | 34,640,331 | |
| RS GROUP PLC | 541,048 | 6,825,895 | |
| 90,753,372 | |||
| Transportation Infrastructure - 0.0% | |||
| Aena SME SA (a)(b) | 50,363 | 6,185,669 | |
TOTAL INDUSTRIALS | 660,735,183 | ||
| INFORMATION TECHNOLOGY - 1.7% | |||
| Communications Equipment - 0.0% | |||
| Ericsson (B Shares) | 762,050 | 5,698,933 | |
| Electronic Equipment & Components - 0.1% | |||
| Azbil Corp. | 93,300 | 2,658,434 | |
| Ibiden Co. Ltd. | 135,500 | 4,300,641 | |
| Keyence Corp. | 31,400 | 11,789,886 | |
| 18,748,961 | |||
| IT Services - 0.7% | |||
| Adyen BV (a)(b) | 13,060 | 20,153,475 | |
| ALTEN | 39,700 | 4,911,261 | |
| Amadeus IT Holding SA Class A (b) | 176,575 | 9,321,281 | |
| Capgemini SA | 130,088 | 22,616,625 | |
| Edenred SA | 132,933 | 6,746,346 | |
| Fujitsu Ltd. | 196,300 | 23,099,269 | |
| TIS, Inc. | 720,600 | 20,520,342 | |
| Wix.com Ltd. (b) | 166,950 | 10,566,266 | |
| Worldline SA (a)(b) | 189,008 | 8,097,613 | |
| 126,032,478 | |||
| Semiconductors & Semiconductor Equipment - 0.5% | |||
| ASML Holding NV (Netherlands) | 80,937 | 39,506,585 | |
| Infineon Technologies AG | 312,518 | 7,646,959 | |
| Renesas Electronics Corp. (b) | 3,687,900 | 34,919,063 | |
| Sumco Corp. | 1,348,500 | 18,303,034 | |
| 100,375,641 | |||
| Software - 0.1% | |||
| Money Forward, Inc. (b) | 179,100 | 4,412,184 | |
| NICE Ltd. (b) | 42,266 | 9,164,210 | |
| SAP SE | 118,323 | 10,077,498 | |
| 23,653,892 | |||
| Technology Hardware, Storage & Peripherals - 0.3% | |||
| Canon, Inc. | 207,800 | 4,976,666 | |
| FUJIFILM Holdings Corp. | 717,000 | 36,399,804 | |
| Samsung Electronics Co. Ltd. | 112,190 | 4,950,469 | |
| 46,326,939 | |||
TOTAL INFORMATION TECHNOLOGY | 320,836,844 | ||
| MATERIALS - 2.2% | |||
| Chemicals - 0.7% | |||
| Air Liquide SA | 231,026 | 28,950,521 | |
| HEXPOL AB (B Shares) | 770,207 | 6,863,946 | |
| Linde PLC | 62,400 | 17,621,195 | |
| Nutrien Ltd. | 125,900 | 11,558,049 | |
| Shin-Etsu Chemical Co. Ltd. | 434,000 | 50,401,653 | |
| Sika AG | 62,094 | 13,970,825 | |
| 129,366,189 | |||
| Construction Materials - 0.2% | |||
| CRH PLC | 1,080,098 | 39,885,448 | |
| Metals & Mining - 1.3% | |||
| Alleima AB (b) | 188,661 | 757,476 | |
| Anglo American PLC (United Kingdom) | 904,281 | 29,058,598 | |
| ArcelorMittal SA (Netherlands) | 863,339 | 20,610,136 | |
| BHP Group Ltd. | 1,822,896 | 49,728,633 | |
| Dowa Holdings Co. Ltd. | 100,800 | 3,799,561 | |
| Evolution Mining Ltd. | 1,107,815 | 1,780,318 | |
| Fortescue Metals Group Ltd. | 1,101,296 | 13,686,432 | |
| Glencore Xstrata PLC | 11,934,279 | 65,251,376 | |
| Iluka Resources Ltd. | 4,336,629 | 30,488,589 | |
| Lynas Rare Earths Ltd. (b) | 1,423,433 | 8,503,691 | |
| Newcrest Mining Ltd. | 675,456 | 8,120,107 | |
| South32 Ltd. | 3,780,796 | 10,411,208 | |
| 242,196,125 | |||
| Paper & Forest Products - 0.0% | |||
| UPM-Kymmene Corp. | 349,488 | 11,902,777 | |
TOTAL MATERIALS | 423,350,539 | ||
| REAL ESTATE - 0.7% | |||
| Equity Real Estate Investment Trusts (REITs) - 0.1% | |||
| National Storage REIT unit | 9,895,142 | 16,253,166 | |
| Real Estate Management & Development - 0.6% | |||
| City Developments Ltd. | 1,808,800 | 10,502,268 | |
| Grainger Trust PLC | 2,679,359 | 8,348,024 | |
| Kerry Properties Ltd. | 7,295,000 | 16,818,937 | |
| LEG Immobilien AG | 190,933 | 14,452,260 | |
| Mitsubishi Estate Co. Ltd. | 1,121,100 | 15,097,712 | |
| Mitsui Fudosan Co. Ltd. | 817,300 | 16,542,657 | |
| Vonovia SE | 1,266,241 | 34,279,092 | |
| 116,040,950 | |||
TOTAL REAL ESTATE | 132,294,116 | ||
| UTILITIES - 0.7% | |||
| Electric Utilities - 0.4% | |||
| Enel SpA | 2,294,900 | 10,783,899 | |
| Iberdrola SA | 2,137,189 | 22,251,770 | |
| Kansai Electric Power Co., Inc. | 1,482,700 | 14,369,810 | |
| ORSTED A/S (a) | 382,497 | 37,332,672 | |
| 84,738,151 | |||
| Independent Power and Renewable Electricity Producers - 0.2% | |||
| RWE AG | 953,998 | 36,508,069 | |
| Multi-Utilities - 0.1% | |||
| Veolia Environnement SA | 425,539 | 9,484,162 | |
TOTAL UTILITIES | 130,730,382 | ||
| TOTAL COMMON STOCKS (Cost $5,073,291,015) | 4,545,331,740 | ||
| Nonconvertible Preferred Stocks - 0.2% | |||
| Shares | Value ($) | ||
| CONSUMER DISCRETIONARY - 0.2% | |||
| Automobiles - 0.2% | |||
| Porsche Automobil Holding SE (Germany) | 319,254 | 22,510,445 | |
| Volkswagen AG | 77,876 | 11,077,012 | |
| TOTAL NONCONVERTIBLE PREFERRED STOCKS (Cost $43,553,036) | 33,587,457 | ||
| Equity Funds - 72.8% | |||
| Shares | Value ($) | ||
| Foreign Large Blend Funds - 8.2% | |||
| Fidelity Pacific Basin Fund (e) | 4,884,671 | 145,074,724 | |
| Fidelity SAI International Index Fund (e) | 23,223,364 | 262,888,486 | |
| Fidelity SAI International Low Volatility Index Fund (e) | 117,569,807 | 1,148,657,012 | |
TOTAL FOREIGN LARGE BLEND FUNDS | 1,556,620,222 | ||
| Foreign Large Growth Funds - 39.9% | |||
| Fidelity Advisor International Discovery Fund Class Z (e) | 51,701,774 | 2,002,926,740 | |
| Fidelity Diversified International Fund (e) | 47,368,223 | 1,673,993,015 | |
| Fidelity International Capital Appreciation Fund (e) | 71,990,601 | 1,481,566,574 | |
| Fidelity Overseas Fund (e) | 43,006,270 | 2,090,534,771 | |
| Fidelity SAI International Momentum Index Fund (e) | 23,931,380 | 255,347,820 | |
| Fidelity SAI International Quality Index Fund (e) | 9,142,532 | 94,168,079 | |
TOTAL FOREIGN LARGE GROWTH FUNDS | 7,598,536,999 | ||
| Foreign Large Value Funds - 18.3% | |||
| Fidelity SAI International Value Index Fund (e) | 438,889,355 | 3,480,392,576 | |
| Foreign Small Mid Blend Funds - 2.5% | |||
| Fidelity SAI International Small Cap Index Fund (e) | 63,801,004 | 479,145,542 | |
| Foreign Small Mid Growth Funds - 0.5% | |||
| Fidelity Advisor International Small Cap Opportunities Fund - Class Z (e) | 5,472,738 | 99,603,838 | |
| Sector Funds - 0.5% | |||
| Fidelity Advisor International Real Estate Fund Class Z (e) | 8,392,364 | 93,071,316 | |
| Other - 2.9% | |||
| Fidelity Advisor Japan Fund Class Z (e) | 25,843,030 | 368,263,182 | |
| Fidelity Japan Smaller Companies Fund (e) | 2,972,180 | 39,292,215 | |
| Fidelity SAI Japan Stock Index Fund (e) | 17,985,696 | 146,403,565 | |
TOTAL OTHER | 553,958,962 | ||
| TOTAL EQUITY FUNDS (Cost $15,223,843,773) | 13,861,329,455 | ||
| Other - 0.1% | |||
| Shares | Value ($) | ||
| Commodity Funds - Broad Basket - 0.1% | |||
Fidelity SAI Inflation-Focused Fund (e) (Cost $10,022,703) | 1,173,878 | 14,215,658 | |
| U.S. Treasury Obligations - 0.1% | |||
Principal Amount (f) | Value ($) | ||
U.S. Treasury Bills, yield at date of purchase 1.11% to 2.9% 9/1/22 to 12/1/22 (g) (Cost $21,672,810) | 21,710,000 | 21,670,053 | |
| Money Market Funds - 3.1% | |||
| Shares | Value ($) | ||
| Fidelity Cash Central Fund 2.33% (h) | 87,914,066 | 87,931,649 | |
| Fidelity Securities Lending Cash Central Fund 2.34% (h)(i) | 48,217,952 | 48,222,774 | |
| State Street Institutional U.S. Government Money Market Fund Premier Class 2.25% (j) | 459,995,217 | 459,995,217 | |
| TOTAL MONEY MARKET FUNDS (Cost $596,149,640) | 596,149,640 | ||
| TOTAL INVESTMENT IN SECURITIES - 100.2% (Cost $20,968,532,977) | 19,072,284,003 |
NET OTHER ASSETS (LIABILITIES) - (0.2)% | (41,007,450) |
| NET ASSETS - 100.0% | 19,031,276,553 |
| Futures Contracts | |||||
Number of contracts | Expiration Date | Notional Amount ($) | Value ($) | Unrealized Appreciation/ (Depreciation) ($) | |
| Purchased | |||||
| Equity Index Contracts | |||||
| CME Nikkei 225 Index Contracts (Japan) | 250 | Sep 2022 | 34,818,750 | 135,722 | 135,722 |
| ICE E-mini MSCI EAFE Index Contracts (United States) | 4,676 | Sep 2022 | 427,175,980 | (18,106,168) | (18,106,168) |
| TOTAL FUTURES CONTRACTS | (17,970,446) | ||||
| The notional amount of futures purchased as a percentage of Net Assets is 2.4% | |||||
| (a) | Security exempt from registration under Rule 144A of the Securities Act of 1933. These securities may be resold in transactions exempt from registration, normally to qualified institutional buyers. At the end of the period, the value of these securities amounted to $120,571,548 or 0.6% of net assets. |
| (b) | Non-income producing |
| (c) | Security or a portion of the security is on loan at period end. |
| (d) | Security or a portion of the security purchased on a delayed delivery or when-issued basis. |
| (e) | Affiliated Fund |
| (f) | Amount is stated in United States dollars unless otherwise noted. |
| (g) | Security or a portion of the security was pledged to cover margin requirements for futures contracts. At period end, the value of securities pledged amounted to $17,200,053. |
| (h) | Affiliated fund that is generally available only to investment companies and other accounts managed by Fidelity Investments. The rate quoted is the annualized seven-day yield of the fund at period end. A complete unaudited listing of the fund's holdings as of its most recent quarter end is available upon request. In addition, each Fidelity Central Fund's financial statements are available on the SEC's website or upon request. |
| (i) | Investment made with cash collateral received from securities on loan. |
| (j) | The rate quoted is the annualized seven-day yield of the fund at period end. |
| Affiliate | Value, beginning of period ($) | Purchases ($) | Sales Proceeds ($) | Dividend Income ($) | Realized Gain (loss) ($) | Change in Unrealized appreciation (depreciation) ($) | Value, end of period ($) | %ownership, end of period |
| Fidelity Cash Central Fund 2.33% | 69,827,988 | 365,955,200 | 347,851,539 | 485,064 | - | - | 87,931,649 | 0.2% |
| Fidelity Securities Lending Cash Central Fund 2.34% | 26,204,871 | 411,665,335 | 389,647,432 | 791,220 | - | - | 48,222,774 | 0.1% |
| Total | 96,032,859 | 777,620,535 | 737,498,971 | 1,276,284 | - | - | 136,154,423 | |
| Affiliate | Value, beginning of period ($) | Purchases ($) | Sales Proceeds ($) | Dividend Income ($) | Realized Gain (loss) ($) | Change in Unrealized appreciation (depreciation) ($) | Value, end of period ($) |
| Fidelity Advisor International Discovery Fund Class Z | 2,384,485,835 | - | - | - | - | (381,559,095) | 2,002,926,740 |
| Fidelity Advisor International Real Estate Fund Class Z | 109,352,502 | - | - | - | - | (16,281,186) | 93,071,316 |
| Fidelity Advisor International Small Cap Opportunities Fund - Class Z | 100,692,930 | 17,815,021 | - | - | - | (18,904,113) | 99,603,838 |
| Fidelity Advisor Japan Fund Class Z | 426,151,570 | - | - | - | - | (57,888,388) | 368,263,182 |
| Fidelity Diversified International Fund | 2,014,096,859 | - | - | - | - | (340,103,844) | 1,673,993,015 |
| Fidelity International Capital Appreciation Fund | 1,739,292,927 | - | - | - | - | (257,726,353) | 1,481,566,574 |
| Fidelity Japan Smaller Companies Fund | 44,077,424 | - | - | - | - | (4,785,209) | 39,292,215 |
| Fidelity Overseas Fund | 2,516,726,904 | - | - | - | - | (426,192,133) | 2,090,534,771 |
| Fidelity Pacific Basin Fund | 171,989,260 | - | - | - | - | (26,914,536) | 145,074,724 |
| Fidelity SAI Inflation-Focused Fund | 13,476,115 | - | - | - | - | 739,543 | 14,215,658 |
| Fidelity SAI International Index Fund | 1,344,983,583 | - | 930,815,027 | - | (180,636,148) | 29,356,078 | 262,888,486 |
| Fidelity SAI International Low Volatility Index Fund | 1,286,213,686 | - | - | - | - | (137,556,674) | 1,148,657,012 |
| Fidelity SAI International Momentum Index Fund | 304,885,776 | - | - | - | - | (49,537,956) | 255,347,820 |
| Fidelity SAI International Quality Index Fund | 110,258,936 | - | - | - | - | (16,090,857) | 94,168,079 |
| Fidelity SAI International Small Cap Index Fund | 572,933,019 | - | - | - | - | (93,787,477) | 479,145,542 |
| Fidelity SAI International Value Index Fund | 4,068,504,316 | - | - | - | - | (588,111,740) | 3,480,392,576 |
| Fidelity SAI Japan Stock Index Fund | 168,885,685 | - | - | - | - | (22,482,120) | 146,403,565 |
| 17,377,007,327 | 17,815,021 | 930,815,027 | - | (180,636,148) | (2,407,826,060) | 13,875,545,113 |
| Valuation Inputs at Reporting Date: | ||||
| Description | Total ($) | Level 1 ($) | Level 2 ($) | Level 3 ($) |
Investments in Securities: | ||||
| Equities: | ||||
Communication Services | 168,571,295 | 20,991,192 | 147,580,103 | - |
Consumer Discretionary | 474,184,034 | 49,409,872 | 424,774,162 | - |
Consumer Staples | 340,558,252 | 68,254,125 | 272,304,127 | - |
Energy | 360,301,790 | 78,169,555 | 282,132,235 | - |
Financials | 1,022,468,345 | 271,041,524 | 751,426,821 | - |
Health Care | 544,888,417 | 57,084,857 | 487,803,560 | - |
Industrials | 660,735,183 | 174,688,422 | 486,046,761 | - |
Information Technology | 320,836,844 | 54,004,708 | 266,832,136 | - |
Materials | 423,350,539 | 69,313,579 | 354,036,960 | - |
Real Estate | 132,294,116 | 22,800,284 | 109,493,832 | - |
Utilities | 130,730,382 | 36,508,069 | 94,222,313 | - |
| Equity Funds | 13,861,329,455 | 13,861,329,455 | - | - |
| Other | 14,215,658 | 14,215,658 | - | - |
| Other Short-Term Investments | 21,670,053 | - | 21,670,053 | - |
| Money Market Funds | 596,149,640 | 596,149,640 | - | - |
| Total Investments in Securities: | 19,072,284,003 | 15,373,960,940 | 3,698,323,063 | - |
Derivative Instruments: | ||||
| Assets | ||||
Futures Contracts | 135,722 | 135,722 | - | - |
| Total Assets | 135,722 | 135,722 | - | - |
| Liabilities | ||||
Futures Contracts | (18,106,168) | (18,106,168) | - | - |
| Total Liabilities | (18,106,168) | (18,106,168) | - | - |
| Total Derivative Instruments: | (17,970,446) | (17,970,446) | - | - |
Primary Risk Exposure / Derivative Type | Value | |
| Asset ($) | Liability ($) | |
| Equity Risk | ||
Futures Contracts (a) | 135,722 | (18,106,168) |
| Total Equity Risk | 135,722 | (18,106,168) |
| Total Value of Derivatives | 135,722 | (18,106,168) |
| Statement of Assets and Liabilities | ||||
August 31, 2022 (Unaudited) | ||||
| Assets | ||||
| Investment in securities, at value (including securities loaned of $45,342,701) - See accompanying schedule: | $5,060,584,467 | |||
Unaffiliated issuers (cost $5,598,512,078) | ||||
Fidelity Central Funds (cost $136,154,423) | 136,154,423 | |||
Other affiliated issuers (cost $15,233,866,476) | 13,875,545,113 | |||
| Total Investment in Securities (cost $20,968,532,977) | $ | 19,072,284,003 | ||
| Foreign currency held at value (cost $2,584,903) | 2,584,896 | |||
| Receivable for investments sold | 4,317,977 | |||
| Receivable for fund shares sold | 19,165,372 | |||
| Dividends receivable | 16,977,947 | |||
| Interest receivable | 687,430 | |||
| Distributions receivable from Fidelity Central Funds | 222,348 | |||
| Prepaid expenses | 41,294 | |||
| Other receivables | 109,186 | |||
Total assets | 19,116,390,453 | |||
| Liabilities | ||||
| Payable for investments purchased | ||||
Regular delivery | $21,233,194 | |||
Delayed delivery | 754,628 | |||
| Payable for fund shares redeemed | 10,409,186 | |||
| Accrued management fee | 1,098,747 | |||
| Payable for daily variation margin on futures contracts | 3,245,584 | |||
| Other payables and accrued expenses | 149,787 | |||
| Collateral on securities loaned | 48,222,774 | |||
| Total Liabilities | 85,113,900 | |||
| Net Assets | $ | 19,031,276,553 | ||
| Net Assets consist of: | ||||
| Paid in capital | $ | 21,510,596,654 | ||
| Total accumulated earnings (loss) | (2,479,320,101) | |||
| Net Assets | $ | 19,031,276,553 | ||
Net Asset Value , offering price and redemption price per share ($19,031,276,553 ÷ 1,961,110,265 shares) | $ | 9.70 | ||
| Statement of Operations | ||||
Six months ended August 31, 2022 (Unaudited) | ||||
| Investment Income | ||||
| Dividends: | ||||
| Unaffiliated issuers | $ | 119,876,981 | ||
| Non-Cash dividends | 8,147,957 | |||
| Interest | 2,894,069 | |||
| Income from Fidelity Central Funds (including $791,220 from security lending) | 1,276,284 | |||
| Income before foreign taxes withheld | 132,195,291 | |||
| Less foreign taxes withheld | (10,701,508) | |||
| Total Income | 121,493,783 | |||
| Expenses | ||||
| Management fee | $ | 33,958,466 | ||
| Custodian fees and expenses | 172,714 | |||
| Independent trustees' fees and expenses | 70,117 | |||
| Registration fees | 419,242 | |||
| Audit | 48,136 | |||
| Legal | 17,875 | |||
| Miscellaneous | 73,305 | |||
| Total expenses before reductions | 34,759,855 | |||
| Expense reductions | (27,139,631) | |||
| Total expenses after reductions | 7,620,224 | |||
| Net Investment income (loss) | 113,873,559 | |||
| Realized and Unrealized Gain (Loss) | ||||
| Net realized gain (loss) on: | ||||
| Investment Securities: | ||||
| Unaffiliated issuers | (222,256,829) | |||
| Other affiliated issuers | (180,636,148) | |||
| Foreign currency transactions | (1,502,403) | |||
| Futures contracts | (224,195,862) | |||
| Total net realized gain (loss) | (628,591,242) | |||
| Change in net unrealized appreciation (depreciation) on: | ||||
| Investment Securities: | ||||
| Unaffiliated issuers | (671,736,158) | |||
| Affiliated issuers | (2,407,826,060) | |||
| Assets and liabilities in foreign currencies | (553,143) | |||
| Futures contracts | 67,900,533 | |||
| Total change in net unrealized appreciation (depreciation) | (3,012,214,828) | |||
| Net gain (loss) | (3,640,806,070) | |||
| Net increase (decrease) in net assets resulting from operations | $ | (3,526,932,511) | ||
| Statement of Changes in Net Assets | ||||
Six months ended August 31, 2022 (Unaudited) | Year ended February 28, 2022 | |||
| Increase (Decrease) in Net Assets | ||||
| Operations | ||||
| Net investment income (loss) | $ | 113,873,559 | $ | 461,425,423 |
| Net realized gain (loss) | (628,591,242) | 1,113,337,301 | ||
| Change in net unrealized appreciation (depreciation) | (3,012,214,828) | (1,762,830,917) | ||
| Net increase (decrease) in net assets resulting from operations | (3,526,932,511) | (188,068,193) | ||
| Distributions to shareholders | (545,780,575) | (1,317,924,908) | ||
| Share transactions | ||||
| Proceeds from sales of shares | 3,470,853,452 | 12,229,755,768 | ||
| Reinvestment of distributions | 533,468,915 | 1,294,919,467 | ||
| Cost of shares redeemed | (5,486,960,544) | (3,882,294,279) | ||
Net increase (decrease) in net assets resulting from share transactions | (1,482,638,177) | 9,642,380,956 | ||
| Total increase (decrease) in net assets | (5,555,351,263) | 8,136,387,855 | ||
| Net Assets | ||||
| Beginning of period | 24,586,627,816 | 16,450,239,961 | ||
| End of period | $ | 19,031,276,553 | $ | 24,586,627,816 |
| Other Information | ||||
| Shares | ||||
| Sold | 327,183,153 | 956,141,916 | ||
| Issued in reinvestment of distributions | 47,377,346 | 102,217,040 | ||
| Redeemed | (522,151,222) | (302,048,311) | ||
| Net increase (decrease) | (147,590,723) | 756,310,645 | ||
| Strategic Advisers® Fidelity® International Fund |
Six months ended (Unaudited) August 31, 2022 | Years ended February 28, 2022 | 2021 | 2020 A | 2019 | 2018 | |||||||
Selected Per-Share Data | ||||||||||||
| Net asset value, beginning of period | $ | 11.66 | $ | 12.16 | $ | 9.84 | $ | 9.66 | $ | 10.69 | $ | 8.94 |
| Income from Investment Operations | ||||||||||||
Net investment income (loss) B,C | .06 | .27 | .10 | .20 | .16 | .12 | ||||||
| Net realized and unrealized gain (loss) | (1.76) | (.03) | 2.37 | .31 | (.85) | 1.85 | ||||||
| Total from investment operations | (1.70) | .24 | 2.47 | .51 | (.69) | 1.97 | ||||||
| Distributions from net investment income | - D | (.25) | (.08) | (.19) | (.15) | (.11) | ||||||
| Distributions from net realized gain | (.26) | (.49) | (.07) | (.14) | (.20) | (.11) | ||||||
| Total distributions | (.26) | (.74) | (.15) | (.33) | (.34) E | (.22) | ||||||
| Net asset value, end of period | $ | 9.70 | $ | 11.66 | $ | 12.16 | $ | 9.84 | $ | 9.66 | $ | 10.69 |
Total Return F,G | (14.86)% | 1.59% | 25.35% | 5.10% | (6.41)% | 22.01% | ||||||
Ratios to Average Net Assets C,H,I | ||||||||||||
| Expenses before reductions | .32% J | .30% | .28% | .29% | .35% | .38% | ||||||
| Expenses net of fee waivers, if any | .07% J | .05% | .03% | .04% | .10% | .13% | ||||||
| Expenses net of all reductions | .07% J | .05% | .03% | .04% | .09% | .13% | ||||||
| Net investment income (loss) | 1.05% J | 2.09% | .93% | 1.97% | 1.65% | 1.16% | ||||||
| Supplemental Data | ||||||||||||
| Net assets, end of period (000 omitted) | $ | 19,031,277 | $ | 24,586,628 | $ | 16,450,240 | $ | 8,776,005 | $ | 6,342,369 | $ | 4,740,524 |
Portfolio turnover rate K | 13% J | 17% | 6% | 6% | 9% | 13% |
| Strategic Advisers Fidelity International Fund | $40,087 |
| Gross unrealized appreciation | $ 638,541,632 |
| Gross unrealized depreciation | (2,592,710,555) |
| Net unrealized appreciation (depreciation) | $(1,954,168,923) |
| Tax cost | $21,008,482,480 |
| Equity Risk | Equity risk relates to the fluctuations in the value of financial instruments as a result of changes in market prices (other than those arising from interest rate risk or foreign exchange risk), whether caused by factors specific to an individual investment, its issuer, or all factors affecting all instruments traded in a market or market segment. |
| Purchases ($) | Sales ($) | |
| Strategic Advisers Fidelity International Fund | 1,350,434,115 | 2,157,820,165 |
| Amount | |
| Strategic Advisers Fidelity International Fund | $ 633 |
| Purchases ($) | Sales ($) | Realized Gain (Loss) ($) | |
| Strategic Advisers Fidelity International Fund | 30,966,883 | 17,685,716 | (2,533,709) |
| Fidelity Central Fund | Investment Manager | Investment Objective | Investment Practices | Expense Ratio A |
| Fidelity Money Market Central Funds | Fidelity Management & Research Company LLC (FMR) | Each fund seeks to obtain a high level of current income consistent with the preservation of capital and liquidity. | Short-term Investments | Less than .005% |
| Amount | |
| Strategic Advisers Fidelity International Fund | $ 20,497 |
| Total Security Lending Fees Paid to NFS | Security Lending Income From Securities Loaned to NFS | Value of Securities Loaned to NFS at Period End | |
| Strategic Advisers Fidelity International Fund | $ 85,318 | $ - | $- |
| Fund | Strategic Advisers Fidelity International Fund |
| Fidelity Diversified International Fund | 18% |
| Fidelity International Capital Appreciation Fund | 36% |
| Fidelity International Discovery Fund | 25% |
| Fidelity International Real Estate Fund | 12% |
| Fidelity Japan Fund | 60% |
| Fidelity Overseas Fund | 30% |
| Fidelity Pacific Basin Fund | 19% |
| Fidelity SAI International Low Volatility Index Fund | 20% |
| Fidelity SAI International Momentum Index Fund | 37% |
| Fidelity SAI International Quality Index Fund | 28% |
| Fidelity SAI International Small Cap Index Fund | 67% |
| Fidelity SAI International Value Index Fund | 75% |
| Fidelity SAI Japan Stock Index Fund | 15% |
| The Example is based on an investment of $1,000 invested at the beginning of the period and held for the entire period (March 1, 2022 to August 31, 2022). |
Annualized Expense Ratio- A | Beginning Account Value March 1, 2022 | Ending Account Value August 31, 2022 | Expenses Paid During Period- C March 1, 2022 to August 31, 2022 | |||||||
| Strategic Advisers® Fidelity® International Fund | .07% | |||||||||
| Actual | $ 1,000 | $ 851.40 | $ .33 | |||||||
Hypothetical- B | $ 1,000 | $ 1,024.85 | $ .36 | |||||||
|

Contents
Top Holdings (% of Fund's net assets) | ||
| (excluding cash equivalents) | ||
| Fidelity SAI Emerging Markets Value Index Fund | 10.4 | |
| Fidelity SAI Emerging Markets Low Volatility Index Fund | 7.7 | |
| Fidelity Advisor Emerging Markets Fund Class Z | 6.4 | |
| Taiwan Semiconductor Manufacturing Co. Ltd. | 4.2 | |
| Goldman Sachs Emerging Markets Equity Fund Institutional Shares | 3.2 | |
| Tencent Holdings Ltd. | 2.8 | |
| Fidelity SAI Emerging Markets Index Fund | 2.7 | |
| Samsung Electronics Co. Ltd. | 2.5 | |
| Invesco Developing Markets Fund Class R6 | 2.0 | |
| Aberdeen Emerging Markets Fund Institutional Service Class | 1.9 | |
| 43.8 | ||
| Market Sectors (% of Fund's net assets) | ||
| (Stocks Only) | ||
| Financials | 12.5 | |
| Information Technology | 11.3 | |
| Consumer Discretionary | 8.5 | |
| Communication Services | 4.9 | |
| Materials | 4.1 | |
| Consumer Staples | 3.9 | |
| Industrials | 3.2 | |
| Energy | 2.9 | |
| Health Care | 1.8 | |
| Utilities | 0.8 | |
| Real Estate | 0.7 | |
Asset Allocation (% of Fund's net assets) |
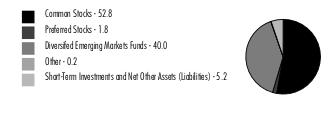 |
Geographic Diversification (% of Fund's net assets) |
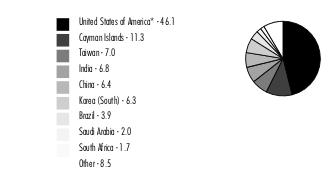 |
* Includes Short-Term investments and Net Other Assets (Liabilities). Percentages are based on country or territory of incorporation and are adjusted for the effect of futures contracts, if applicable. |
| Common Stocks - 52.8% | |||
| Shares | Value ($) | ||
| COMMUNICATION SERVICES - 4.9% | |||
| Diversified Telecommunication Services - 0.3% | |||
| Chunghwa Telecom Co. Ltd. | 936,000 | 3,717,002 | |
| Hellenic Telecommunications Organization SA | 149,427 | 2,381,643 | |
| KT Corp. | 196,383 | 5,420,927 | |
| LG Uplus Corp. | 729,612 | 6,223,703 | |
| Ooredoo QSC | 117,634 | 293,298 | |
| PT Telkom Indonesia Persero Tbk | 19,144,200 | 5,862,543 | |
| Saudi Telecom Co. | 148,477 | 1,651,061 | |
| Telefonica Brasil SA | 236,370 | 1,869,188 | |
| Telkom SA Ltd. (a) | 360,373 | 919,328 | |
| 28,338,693 | |||
| Entertainment - 0.6% | |||
| 37 Interactive Entertainment Network Technology Group Co. Ltd. (A Shares) | 1,160,747 | 3,408,659 | |
| Bilibili, Inc.: | |||
| ADR (a)(b) | 307,900 | 7,685,184 | |
| Class Z (a) | 59,900 | 1,489,806 | |
| FriendTimes, Inc. | 125,932 | 18,970 | |
| G-bits Network Technology Xiamen Co. Ltd. (A Shares) | 93,617 | 3,860,398 | |
| IGG, Inc. | 421,000 | 180,986 | |
| Kingnet Network Co. Ltd. (A Shares) (a) | 764,100 | 853,003 | |
| Kingsoft Corp. Ltd. | 81,400 | 247,398 | |
| MD Pictures Tbk PT | 1,996,779 | 333,974 | |
| Mgame Corp. (a) | 34,930 | 183,030 | |
| NetDragon WebSoft, Inc. | 152,000 | 330,717 | |
| NetEase, Inc. | 405,000 | 7,232,247 | |
| NetEase, Inc. ADR | 129,300 | 11,444,343 | |
| NHN Corp. | 5,686 | 106,363 | |
| Perfect World Co. Ltd. (A Shares) | 1,038,355 | 2,220,120 | |
| PVR Ltd. (a) | 271,900 | 6,173,883 | |
| Sea Ltd. ADR (a) | 110,308 | 6,839,096 | |
| UserJoy Technology Co. Ltd. | 19,000 | 44,366 | |
| 52,652,543 | |||
| Interactive Media & Services - 3.3% | |||
| Baidu, Inc.: | |||
| Class A (a) | 664,256 | 11,857,353 | |
| sponsored ADR (a) | 35,796 | 5,153,550 | |
| Info Edge India Ltd. | 18,486 | 993,937 | |
| NAVER Corp. | 81,990 | 14,491,374 | |
| Tencent Holdings Ltd. | 5,564,372 | 229,979,830 | |
| Yandex NV Series A (a)(c) | 974,417 | 3,342,094 | |
| 265,818,138 | |||
| Media - 0.1% | |||
| China South Publishing & Media Group Co. Ltd. (A Shares) | 245,565 | 353,902 | |
| Chinese Universe Publishing and Media Group Co. Ltd. (A Shares) | 1,812,741 | 2,449,571 | |
| Jagran Prakashan Ltd. | 30,888 | 24,293 | |
| Korea Business News Co. Ltd. | 8,585 | 39,327 | |
| Media Prima Bhd | 364,400 | 38,131 | |
| New Delhi Television Ltd. (a) | 17,147 | 100,615 | |
| Shandong Publishing & Media Co. Ltd. (A Shares) | 1,516,200 | 1,466,635 | |
| Woongjin Holdings Co. Ltd. | 19,424 | 37,088 | |
| 4,509,562 | |||
| Wireless Telecommunication Services - 0.6% | |||
| America Movil S.A.B. de CV Series L | 5,406,900 | 4,608,070 | |
| Bharti Airtel Ltd. | 2,134,433 | 19,325,326 | |
| Etihad Etisalat Co. | 370,558 | 3,607,987 | |
| Far EasTone Telecommunications Co. Ltd. | 466,000 | 1,143,775 | |
| Mobile Telecommunications Co. Saudi Arabia (a) | 45,970 | 141,615 | |
| MTN Group Ltd. | 1,261,366 | 9,129,827 | |
| SK Telecom Co. Ltd. | 92,764 | 3,584,689 | |
| TIM SA | 2,046,518 | 4,653,681 | |
| Vodafone Qatar QSC (a) | 93,166 | 42,084 | |
| 46,237,054 | |||
TOTAL COMMUNICATION SERVICES | 397,555,990 | ||
| CONSUMER DISCRETIONARY - 8.5% | |||
| Auto Components - 0.2% | |||
| Chaowei Power Holdings Ltd. | 68,000 | 15,711 | |
| FIEM Industries Ltd. | 6,009 | 111,663 | |
| Fuyao Glass Industries Group Co. Ltd. (A Shares) | 2,195,926 | 12,428,029 | |
| Hankook Tire Co. Ltd. | 29,749 | 835,366 | |
| Huayu Automotive Systems Co. Ltd. (A Shares) | 1,096,862 | 2,961,678 | |
| MAHLE Metal Leve SA | 35,265 | 164,720 | |
| Sejong Industrial Co. Ltd. | 8,552 | 38,833 | |
| Seoyon Co. Ltd. | 36,970 | 185,038 | |
| Somboon Advance Technology PCL unit | 71,100 | 37,857 | |
| Sri Trang Agro-Industry PCL (For. Reg.) | 1,022,100 | 630,760 | |
| Tianneng Power International Ltd. | 1,305,826 | 1,389,265 | |
| Yoosung Enterprise Co. Ltd. | 12,624 | 26,904 | |
| 18,825,824 | |||
| Automobiles - 1.3% | |||
| Bajaj Auto Ltd. | 170,504 | 8,680,240 | |
| BYD Co. Ltd. (H Shares) | 337,500 | 10,400,176 | |
| Dongfeng Motor Group Co. Ltd. (H Shares) | 1,722,000 | 1,091,831 | |
| Eicher Motors Ltd. | 124,183 | 5,180,310 | |
| Guangzhou Automobile Group Co. Ltd. (H Shares) | 20,228,000 | 17,392,239 | |
| Hero Motocorp Ltd. | 11,561 | 407,042 | |
| Hyundai Motor Co. | 80,152 | 11,598,666 | |
| Kia Corp. | 378,292 | 22,584,433 | |
| Li Auto, Inc. ADR (a) | 183,100 | 5,267,787 | |
| Mahindra & Mahindra Ltd. | 295,481 | 4,793,530 | |
| Maruti Suzuki India Ltd. | 67,110 | 7,566,186 | |
| PT Astra International Tbk | 2,197,700 | 1,031,203 | |
| UMW Holdings Bhd | 40,100 | 27,480 | |
| XPeng, Inc.: | |||
| ADR (a) | 401,458 | 7,435,002 | |
| Class A (a) | 91,900 | 851,460 | |
| 104,307,585 | |||
| Distributors - 0.0% | |||
| Xinhua Winshare Publishing and Media Co. Ltd. | 18,795 | 13,221 | |
| Diversified Consumer Services - 0.0% | |||
| Human Soft Holding Co. KSCC | 30,860 | 346,618 | |
| New Oriental Education & Technology Group, Inc. (a) | 129,100 | 372,647 | |
| Visang Education, Inc. | 8,025 | 38,644 | |
| YDUQS Participacoes SA | 455,731 | 1,078,358 | |
| 1,836,267 | |||
| Hotels, Restaurants & Leisure - 1.1% | |||
| H World Group Ltd. ADR | 195,879 | 7,370,927 | |
| MakeMyTrip Ltd. (a) | 50,469 | 1,683,141 | |
| Sands China Ltd. (a) | 3,403,922 | 7,611,501 | |
| Shangri-La Asia Ltd. (a) | 5,578,000 | 4,449,557 | |
| Songcheng Performance Development Co. Ltd. (A Shares) | 2,587,441 | 4,743,835 | |
| Tongcheng Travel Holdings Ltd. (a) | 2,082,000 | 4,264,270 | |
| Trip.com Group Ltd. ADR (a) | 614,556 | 15,806,380 | |
| Yum China Holdings, Inc. | 856,771 | 42,932,795 | |
| Yum China Holdings, Inc. (Hong Kong) | 38,550 | 1,891,081 | |
| 90,753,487 | |||
| Household Durables - 0.8% | |||
| Daewon Co. Ltd. | 1,576 | 9,859 | |
| Haier Smart Home Co. Ltd. | 1,467,400 | 4,793,998 | |
| Haier Smart Home Co. Ltd. (A Shares) | 3,831,141 | 14,312,004 | |
| Hisense Home Appliances Group Co. Ltd. (H Shares) | 27,000 | 29,090 | |
| Huisen Household International Group Ltd. (a) | 350,000 | 26,767 | |
| LG Electronics, Inc. | 93,037 | 6,934,460 | |
| Midea Group Co. Ltd. (A Shares) | 3,660,784 | 28,101,243 | |
| Skyworth Group Ltd. | 3,263,457 | 1,621,404 | |
| TCL Electronics Holdings Ltd. | 591,000 | 282,343 | |
| Viomi Technology Co. Ltd. ADR Class A (a) | 71,922 | 93,499 | |
| Zhejiang Supor Cookware Co. Ltd. | 963,207 | 6,391,761 | |
| 62,596,428 | |||
| Internet & Direct Marketing Retail - 4.1% | |||
| Alibaba Group Holding Ltd. (a) | 5,572,220 | 66,479,635 | |
| Alibaba Group Holding Ltd. sponsored ADR (a) | 572,442 | 54,616,691 | |
| Alibaba Health Information Technology Ltd. (a) | 404,000 | 231,518 | |
| Coupang, Inc. Class A (a)(b) | 96,430 | 1,629,667 | |
| Danawa Co. Ltd. (a) | 3,935 | 53,005 | |
| JD.com, Inc.: | |||
| Class A | 2,424,777 | 76,756,682 | |
| sponsored ADR | 385,153 | 24,453,364 | |
| Meituan Class B (a)(d) | 3,029,900 | 72,769,781 | |
| Naspers Ltd. Class N | 132,236 | 18,646,138 | |
| Ozon Holdings PLC ADR (a)(b)(c) | 53,343 | 112,054 | |
| Pinduoduo, Inc. ADR (a) | 275,656 | 19,654,273 | |
| Prosus NV | 30,171 | 1,864,854 | |
| Vipshop Holdings Ltd. ADR (a) | 37,036 | 429,988 | |
| YES24 Co. Ltd. | 13,106 | 62,083 | |
| Zomato Ltd. (a) | 861,131 | 615,262 | |
| 338,374,995 | |||
| Leisure Products - 0.0% | |||
| Goodbaby International Holdings Ltd. (a) | 214,000 | 21,755 | |
| Multiline Retail - 0.1% | |||
| AEON Co. (M) Bhd | 59,400 | 19,435 | |
| El Puerto de Liverpool S.A.B. Dcv Series C | 106,433 | 474,620 | |
| Falabella SA | 1,062,723 | 2,504,291 | |
| Pepco Group NV (a)(d) | 676,317 | 5,099,718 | |
| PT Matahari Department Store Tbk | 312,231 | 80,660 | |
| PT Mitra Adiperkasa Tbk (a) | 6,036,308 | 410,137 | |
| Savezon I&C Corp. | 11,337 | 23,406 | |
| 8,612,267 | |||
| Specialty Retail - 0.4% | |||
| Bermaz Auto Bhd | 80,700 | 32,753 | |
| Cashbuild Ltd. | 18 | 239 | |
| China Harmony Auto Holding Ltd. | 514,500 | 135,172 | |
| China Tourism Group Duty Free Corp. Ltd. (H Shares) (a)(d) | 170,900 | 3,943,109 | |
| Chow Tai Fook Jewellery Group Ltd. | 601,400 | 1,210,443 | |
| Dogus Otomotiv Servis ve Ticaret A/S | 224,488 | 1,232,776 | |
| Foschini Group Ltd./The | 231,252 | 1,706,462 | |
| Grand Baoxin Auto Group Ltd. (a) | 247,000 | 15,318 | |
| Index Living Mall PCL NVDR | 230,500 | 117,010 | |
| Lewis Group Ltd. | 11,913 | 33,231 | |
| Lojas Renner SA | 1,825,180 | 9,286,582 | |
| LOTTE Hi-Mart Co. Ltd. | 125 | 1,457 | |
| Motus Holdings Ltd. | 135,807 | 914,199 | |
| Pou Sheng International (Holdings) Ltd. | 265,273 | 26,667 | |
| Shan-Loong Transportation Co. Ltd. | 56,000 | 63,779 | |
| SSI Group, Inc. | 136,000 | 3,571 | |
| Trent Ltd. | 11,874 | 207,577 | |
| Zhongsheng Group Holdings Ltd. Class H | 2,345,000 | 11,088,028 | |
| 30,018,373 | |||
| Textiles, Apparel & Luxury Goods - 0.5% | |||
| Bosideng International Holdings Ltd. | 274,000 | 153,849 | |
| Cabbeen Fashion Ltd. | 84,000 | 14,516 | |
| CECEP COSTIN New Materials Group Ltd. (a)(c) | 741,000 | 28,323 | |
| Century Enka Ltd. | 14,178 | 81,478 | |
| ECLAT Textile Co. Ltd. | 260,000 | 3,768,604 | |
| Fila Holdings Corp. | 12,389 | 285,029 | |
| Filatex India Ltd. | 68,988 | 96,582 | |
| JNBY Design Ltd. | 293,220 | 319,080 | |
| Kddl Ltd. | 299 | 3,452 | |
| Kewal Kiran Clothing Ltd. | 12,217 | 63,876 | |
| Kitex Garments Ltd. | 21,853 | 62,298 | |
| LF Corp. | 7,144 | 89,644 | |
| Li Ning Co. Ltd. | 2,483,500 | 22,620,496 | |
| Mirza International Ltd. (a) | 155,448 | 616,565 | |
| Monte Carlo Fashions Ltd. | 10,276 | 105,946 | |
| Pou Chen Corp. | 787,000 | 746,095 | |
| Shenzhou International Group Holdings Ltd. | 886,100 | 9,260,902 | |
| Sutlej Textiles & Industries Ltd. | 12,472 | 11,540 | |
| Vardhman Textiles Ltd. | 915 | 3,776 | |
| Weiqiao Textile Co. Ltd. (H Shares) | 139,556 | 26,332 | |
| XTEP International Holdings Ltd. | 113,000 | 156,808 | |
| Youngone Corp. | 38,165 | 1,258,624 | |
| Zhejiang Semir Garment Co. Ltd. (A Shares) | 431,700 | 324,547 | |
| 40,098,362 | |||
TOTAL CONSUMER DISCRETIONARY | 695,458,564 | ||
| CONSUMER STAPLES - 3.8% | |||
| Beverages - 1.4% | |||
| Arca Continental S.A.B. de CV | 241,143 | 1,641,613 | |
| Beijing Yanjing Brewery Co. Ltd. (A Shares) | 1,308,670 | 1,732,064 | |
| Budweiser Brewing Co. APAC Ltd. (d) | 6,321,700 | 18,582,258 | |
| China Resources Beer Holdings Co. Ltd. | 2,452,000 | 17,092,948 | |
| Coca-Cola FEMSA S.A.B. de CV sponsored ADR (b) | 18,815 | 1,152,042 | |
| Fomento Economico Mexicano S.A.B. de CV sponsored ADR | 182,934 | 11,471,791 | |
| Heineken Malaysia Bhd | 6,000 | 31,543 | |
| Heineken NV (Bearer) | 150,597 | 13,581,472 | |
| Kweichow Moutai Co. Ltd. (A Shares) | 80,435 | 22,415,129 | |
| Thai Beverage PCL | 8,035,400 | 3,702,701 | |
| Tsingtao Brewery Co. Ltd. (H Shares) | 52,000 | 504,971 | |
| Varun Beverages Ltd. | 36,350 | 468,588 | |
| Wuliangye Yibin Co. Ltd. (A Shares) | 930,586 | 22,481,145 | |
| 114,858,265 | |||
| Food & Staples Retailing - 1.1% | |||
| Abdullah Al Othaim Markets Co. | 6,275 | 214,008 | |
| Bid Corp. Ltd. | 531,314 | 10,063,687 | |
| Bim Birlesik Magazalar A/S JSC | 289,341 | 1,740,014 | |
| Clicks Group Ltd. | 366,184 | 6,366,738 | |
| CP ALL PCL (For. Reg.) | 9,942,800 | 16,709,881 | |
| Dino Polska SA (a)(d) | 4,401 | 321,835 | |
| GPA | 201,200 | 838,849 | |
| Jeronimo Martins SGPS SA | 79,517 | 1,766,024 | |
| Laobaixing Pharmacy Chain JSC (A Shares) | 192,000 | 924,535 | |
| Magnit OJSC (c) | 45,493 | 1,426 | |
| Nahdi Medical Co. | 120,452 | 6,210,055 | |
| PT Sumber Alfaria Trijaya Tbk | 1,435,100 | 210,618 | |
| Raia Drogasil SA | 4,005,218 | 16,752,565 | |
| Shoprite Holdings Ltd. | 435,125 | 5,900,306 | |
| Wal-Mart de Mexico SA de CV Series V | 4,583,200 | 14,978,179 | |
| X5 Retail Group NV GDR (Reg. S) (c) | 166,798 | 34,826 | |
| Yifeng Pharmacy Chain Co. Ltd. | 520,778 | 4,021,686 | |
| 87,055,232 | |||
| Food Products - 1.0% | |||
| Adecoagro SA (b) | 27,088 | 249,751 | |
| AVI Ltd. | 402,650 | 1,719,754 | |
| Brasilagro Coia Brasileira de | 66,900 | 368,295 | |
| China Mengniu Dairy Co. Ltd. | 9,792,496 | 44,343,136 | |
| Dalmia Bharat Sugar & Industries Ltd. | 21,546 | 92,934 | |
| Dhampur Bio Organics Ltd. (a)(c) | 28,099 | 14,563 | |
| Dhampur Sugar Mills Ltd. | 28,099 | 81,108 | |
| Dwarikesh Sugar Industries Ltd. | 174,073 | 209,762 | |
| Jalles Machado SA | 43,800 | 63,312 | |
| JBS SA | 2,253,329 | 12,816,393 | |
| Kuala Lumpur Kepong Bhd | 198,900 | 1,027,707 | |
| LT Foods Ltd. | 77,911 | 92,295 | |
| Marfrig Global Foods SA | 1,052,986 | 2,661,611 | |
| Minerva SA | 439,500 | 1,305,220 | |
| Muyuan Foodstuff Co. Ltd. (A Shares) | 113,833 | 964,110 | |
| PT Indofood Sukses Makmur Tbk | 2,068,300 | 867,684 | |
| PT Perusahaan Perkebunan London Sumatra Indonesia Tbk | 2,157,000 | 171,408 | |
| PT Triputra Agro Persada | 990,800 | 50,134 | |
| Sarawak Oil Palms Bhd | 33,000 | 20,298 | |
| Saudi Dairy & Foodstuffs Co. | 3,683 | 194,977 | |
| Sime Darby Plantation Bhd | 182,200 | 181,107 | |
| SLC Agricola SA | 147,530 | 1,378,202 | |
| The Savola Group | 119,572 | 1,038,581 | |
| Three-A Resources Bhd | 138,600 | 27,580 | |
| Tingyi (Cayman Islands) Holding Corp. | 170,000 | 301,873 | |
| Uni-President China Holdings Ltd. | 105,000 | 90,400 | |
| Unified-President Enterprises Corp. | 1,638,000 | 3,542,555 | |
| Universal Robina Corp. | 1,097,250 | 2,379,005 | |
| Uttam Sugar Mills Ltd. | 39,683 | 132,142 | |
| Vietnam Dairy Products Corp. | 1,501,100 | 4,829,044 | |
| Want Want China Holdings Ltd. | 251,000 | 176,810 | |
| WH Group Ltd. (d) | 1,565,000 | 1,066,271 | |
| 82,458,022 | |||
| Personal Products - 0.2% | |||
| Emami Ltd. | 10,684 | 64,644 | |
| Hengan International Group Co. Ltd. | 53,500 | 256,025 | |
| Hindustan Unilever Ltd. | 293,850 | 9,723,502 | |
| LG Household & Health Care Ltd. | 4,546 | 2,397,785 | |
| Natura & Co. Holding SA (a) | 1,362,358 | 3,776,181 | |
| Proya Cosmetics Co. Ltd. (A Shares) | 53,980 | 1,251,542 | |
| 17,469,679 | |||
| Tobacco - 0.1% | |||
| ITC Ltd. | 2,319,743 | 9,265,873 | |
TOTAL CONSUMER STAPLES | 311,107,071 | ||
| ENERGY - 2.2% | |||
| Energy Equipment & Services - 0.0% | |||
| ADNOC Drilling Co. PJSC | 843,977 | 840,967 | |
| China Oilfield Services Ltd. (H Shares) | 150,000 | 155,795 | |
| Ezion Holdings Ltd. warrants 4/16/23 (a)(c) | 5,020,014 | 5,640 | |
| Yantai Jereh Oilfield Services (A Shares) | 325,096 | 1,788,744 | |
| 2,791,146 | |||
| Oil, Gas & Consumable Fuels - 2.2% | |||
| Bangchak Corp. PCL NVDR | 174,200 | 167,761 | |
| Banpu PCL NVDR | 3,381,100 | 1,338,375 | |
| China Coal Energy Co. Ltd. (H Shares) | 8,918,000 | 7,930,486 | |
| China Merchants Energy Shipping Co. Ltd. (A Shares) | 1,997,660 | 2,167,924 | |
| China Petroleum & Chemical Corp. (H Shares) | 5,424,000 | 2,550,610 | |
| China Shenhua Energy Co. Ltd. (H Shares) | 1,426,000 | 4,472,323 | |
| Coal India Ltd. | 1,210,678 | 3,535,880 | |
| Empresas COPEC SA | 779,531 | 6,724,189 | |
| Exxaro Resources Ltd. | 82,796 | 1,054,841 | |
| Gazprom OAO (c) | 1,235,592 | 197,221 | |
| Gazprom OAO sponsored ADR (Reg. S) (c) | 968,777 | 221,307 | |
| Indian Oil Corp. Ltd. | 694,548 | 619,452 | |
| Lanna Resources PCL unit | 81,200 | 53,051 | |
| LUKOIL PJSC (c) | 165,638 | 78,204 | |
| LUKOIL PJSC sponsored ADR (c) | 341,548 | 96,621 | |
| Mangalore Refinery & Petrochemicals Ltd. (a) | 104,083 | 94,459 | |
| MOL Hungarian Oil and Gas PLC Series A (For. Reg.) | 282,256 | 1,947,681 | |
| Novatek PJSC GDR (Reg. S) (c) | 82,920 | 21,184 | |
| Oil & Natural Gas Corp. Ltd. | 4,510,711 | 7,804,792 | |
| Oil India Ltd. | 112,562 | 270,906 | |
| OMV AG | 18,938 | 766,599 | |
| Petro Rio SA (a) | 1,063,254 | 5,581,552 | |
| PetroChina Co. Ltd. (H Shares) | 32,844,000 | 15,273,037 | |
| Polish Oil & Gas Co. SA | 299,787 | 356,555 | |
| Polski Koncern Naftowy Orlen SA | 13,751 | 178,412 | |
| PT Adaro Energy Tbk | 34,722,900 | 8,277,833 | |
| PT Bukit Asam Tbk | 3,621,650 | 1,036,262 | |
| PT Indo Tambangraya Megah Tbk | 548,200 | 1,452,061 | |
| PT United Tractors Tbk | 9,495,600 | 21,622,117 | |
| PTT Exploration and Production PCL (For. Reg.) | 695,100 | 3,205,409 | |
| PTT PCL (For. Reg.) | 503,400 | 515,684 | |
| Qatar Gas Transport Co. Ltd. (Nakilat) (a) | 5,748,065 | 6,313,520 | |
| Rabigh Refining & Petrochemical Co. (a) | 775,702 | 3,574,131 | |
| Reliance Industries Ltd. | 1,208,884 | 39,584,017 | |
| Rosneft Oil Co. OJSC (c) | 634,013 | 161,739 | |
| S-Oil Corp. | 16,634 | 1,256,704 | |
| Saudi Arabian Oil Co. (d) | 1,260,924 | 12,579,050 | |
| SK Innovation Co., Ltd. | 16,352 | 2,292,865 | |
| Star Petroleum Refining PCL NVDR | 1,318,100 | 464,358 | |
| Susco Public Co. Ltd. unit | 49,300 | 5,038 | |
| Tatneft PAO sponsored ADR (c) | 28,136 | 25,979 | |
| TotalEnergies SE | 68,681 | 3,477,299 | |
| Turkiye Petrol Rafinerileri A/S (a) | 308,000 | 6,083,219 | |
| Yankuang Energy Group Co. Ltd. (H Shares) | 128,000 | 506,676 | |
| 175,937,383 | |||
TOTAL ENERGY | 178,728,529 | ||
| FINANCIALS - 12.0% | |||
| Banks - 8.6% | |||
| Absa Group Ltd. (b) | 1,423,558 | 14,744,024 | |
| Abu Dhabi Commercial Bank PJSC | 1,810,820 | 4,471,465 | |
| Agricultural Bank of China Ltd. (H Shares) | 5,158,980 | 1,685,757 | |
| Al Rajhi Bank | 1,196,649 | 28,714,483 | |
| Alinma Bank | 1,870,086 | 18,904,833 | |
| Alior Bank SA (a) | 27,373 | 151,716 | |
| Alliance Bank Malaysia Bhd | 59,900 | 47,101 | |
| Alpha Bank SA (a) | 1,219,698 | 1,132,825 | |
| Arab National Bank | 125,228 | 999,425 | |
| Axis Bank Ltd. | 1,330,561 | 12,394,171 | |
| Banco de Chile | 20,342,743 | 1,929,979 | |
| Banco do Brasil SA | 1,061,359 | 8,505,316 | |
| Banco Santander Chile sponsored ADR | 215,142 | 3,450,878 | |
| Bancolombia SA sponsored ADR | 22,400 | 614,880 | |
| Bangkok Bank PCL (For. Reg.) | 490,500 | 1,833,562 | |
| Bank Handlowy w Warszawie SA | 5,075 | 64,139 | |
| Bank of Baroda | 1,623,802 | 2,626,985 | |
| Bank of China Ltd. (H Shares) | 29,997,000 | 10,468,004 | |
| Bank of Communications Co. Ltd. (H Shares) | 6,994,703 | 3,985,366 | |
| Bank Polska Kasa Opieki SA | 24,666 | 342,175 | |
| Banque Saudi Fransi | 16,088 | 212,923 | |
| BNK Financial Group, Inc. | 49,906 | 247,864 | |
| BOC Hong Kong (Holdings) Ltd. | 686,500 | 2,362,797 | |
| Capitec Bank Holdings Ltd. | 197,309 | 23,461,096 | |
| China CITIC Bank Corp. Ltd. (H Shares) | 3,359,000 | 1,440,038 | |
| China Construction Bank Corp. (H Shares) | 62,602,000 | 38,699,518 | |
| China Everbright Bank Co. Ltd. (H Shares) | 268,900 | 82,435 | |
| China Merchants Bank Co. Ltd. (H Shares) | 3,417,500 | 17,477,481 | |
| China Minsheng Banking Corp. Ltd. (H Shares) | 487,000 | 154,914 | |
| CIMB Group Holdings Bhd | 3,214,917 | 3,844,623 | |
| Commercial International Bank SAE sponsored GDR | 1,920,547 | 3,384,004 | |
| Credicorp Ltd. (United States) | 134,647 | 17,354,652 | |
| CTBC Financial Holding Co. Ltd. | 10,581,000 | 8,110,844 | |
| DGB Financial Group Co. Ltd. | 16,476 | 90,957 | |
| Dubai Islamic Bank Pakistan Ltd. (a) | 1,904,912 | 3,033,877 | |
| E.SUN Financial Holdings Co. Ltd. | 8,126,538 | 7,493,655 | |
| Emirates NBD Bank PJSC (a) | 934,931 | 3,398,037 | |
| Eurobank Ergasias Services and Holdings SA (a) | 2,477,285 | 2,298,443 | |
| First Abu Dhabi Bank PJSC | 2,114,778 | 10,996,777 | |
| Grupo Financiero Banorte S.A.B. de CV Series O | 5,905,628 | 34,877,106 | |
| Grupo Financiero Inbursa S.A.B. de CV Series O (a) | 240,864 | 379,472 | |
| Gulf Bank | 690,735 | 784,799 | |
| Hana Financial Group, Inc. | 481,995 | 13,993,050 | |
| HDFC Bank Ltd. | 2,945,923 | 53,978,282 | |
| HDFC Bank Ltd. sponsored ADR | 202,176 | 12,342,845 | |
| ICICI Bank Ltd. | 3,200,725 | 35,080,151 | |
| ICICI Bank Ltd. sponsored ADR | 1,622,479 | 35,434,941 | |
| Industrial & Commercial Bank of China Ltd. (H Shares) | 60,555,310 | 30,764,711 | |
| Industrial Bank Co. Ltd. (A Shares) | 475,191 | 1,175,070 | |
| Kasikornbank PCL: | |||
| NVDR | 3,197,900 | 13,392,968 | |
| (For. Reg.) | 1,899,600 | 7,955,621 | |
| KB Financial Group, Inc. | 484,937 | 17,731,212 | |
| Kiatnakin Bank PCL (For. Reg.) | 552,400 | 1,093,234 | |
| Komercni Banka A/S | 16,010 | 377,138 | |
| Kotak Mahindra Bank Ltd. | 510,470 | 12,104,637 | |
| Krung Thai Bank PCL: | |||
| (For. Reg.) | 2,895,800 | 1,335,000 | |
| NVDR | 679,400 | 313,212 | |
| National Bank of Greece SA (a) | 4,575,353 | 14,823,955 | |
| National Bank of Kuwait | 81,783 | 279,822 | |
| Nova Ljubljanska banka d.d. unit | 489,395 | 5,926,401 | |
| Nu Holdings Ltd. (b) | 169,801 | 832,025 | |
| OTP Bank PLC | 305,783 | 6,515,762 | |
| Postal Savings Bank of China Co. Ltd. | 1,803,200 | 1,176,515 | |
| Postal Savings Bank of China Co. Ltd. (H Shares) (d) | 737,000 | 439,968 | |
| Powszechna Kasa Oszczednosci Bank SA | 366,588 | 1,834,500 | |
| PT Bank Bukopin Tbk (a) | 11,635 | 143 | |
| PT Bank Central Asia Tbk | 47,485,000 | 26,222,314 | |
| PT Bank Mandiri (Persero) Tbk | 55,068,600 | 32,770,506 | |
| PT Bank Rakyat Indonesia (Persero) Tbk | 22,783,319 | 6,653,393 | |
| Pureun Mutual Savings Bank | 2,171 | 18,988 | |
| Qatar National Bank SAQ (a) | 2,146,555 | 12,165,826 | |
| Riyad Bank | 180,187 | 1,701,686 | |
| Santander Bank Polska SA | 713 | 32,495 | |
| Sberbank of Russia (a)(c) | 328,709 | 3,083 | |
| Sberbank of Russia (a)(c) | 2,908,251 | 27,276 | |
| Sberbank of Russia sponsored ADR (a)(c) | 1,288,149 | 22,929 | |
| SCB X PCL (For. Reg.) | 1,600,800 | 4,824,767 | |
| Shinhan Financial Group Co. Ltd. | 382,989 | 10,335,508 | |
| Standard Bank Group Ltd. | 355,107 | 3,168,826 | |
| State Bank of India | 329,782 | 2,170,228 | |
| TCS Group Holding PLC GDR (a)(c) | 89,300 | 112,031 | |
| The Karnataka Bank Ltd. | 396,111 | 368,672 | |
| The Karur Vysya Bank Ltd. | 386,151 | 327,907 | |
| The Saudi National Bank | 1,553,999 | 28,897,188 | |
| Woori Financial Group, Inc. | 615,172 | 5,542,817 | |
| Yapi ve Kredi Bankasi A/S | 1,358,450 | 525,705 | |
| 702,046,704 | |||
| Capital Markets - 0.4% | |||
| Alexander Forbes Group Holdings Ltd. | 888 | 244 | |
| Angel One Ltd. | 16,963 | 272,929 | |
| B3 SA - Brasil Bolsa Balcao | 4,314,000 | 9,826,407 | |
| Boursa Kuwait Securities Co. KPSC | 29,046 | 216,961 | |
| China Cinda Asset Management Co. Ltd. (H Shares) | 748,000 | 102,717 | |
| China Galaxy Securities Co. Ltd. (H Shares) | 2,457,500 | 1,343,553 | |
| Daishin Securities Co. Ltd. | 5,900 | 67,313 | |
| East Money Information Co. Ltd. (A Shares) | 480,319 | 1,536,612 | |
| HDFC Asset Management Co. Ltd. (d) | 89,655 | 2,311,897 | |
| Hong Kong Exchanges and Clearing Ltd. | 189,200 | 7,623,725 | |
| Korea Investment Holdings Co. Ltd. | 47,425 | 1,991,779 | |
| Mirae Asset Securities Co. Ltd. | 101,501 | 493,049 | |
| Motilal Oswal Financial Services Ltd. | 2,593 | 24,842 | |
| Nahar Capital & Finance Services Ltd. | 4,934 | 23,108 | |
| Noah Holdings Ltd. sponsored ADR (a) | 32,657 | 578,355 | |
| Samsung Securities Co. Ltd. | 16,117 | 404,145 | |
| Saudi Tadawul Group Holding Co. | 13,706 | 829,871 | |
| VLS Finance Ltd. | 24,557 | 44,753 | |
| XP, Inc. Class A (a) | 330,524 | 6,359,282 | |
| 34,051,542 | |||
| Consumer Finance - 0.2% | |||
| 360 DigiTech, Inc. ADR | 127,589 | 2,038,872 | |
| Bajaj Finance Ltd. | 41,883 | 3,778,172 | |
| Commercial Facilities Co. SAK | 103,124 | 67,622 | |
| FinVolution Group ADR (b) | 93,500 | 460,020 | |
| Kaspi.KZ JSC GDR (Reg. S) | 69,699 | 4,202,850 | |
| Kruk SA | 5,962 | 383,598 | |
| Samsung Card Co. Ltd. | 2,434 | 56,674 | |
| SBI Cards & Payment Services Ltd. | 36,042 | 413,068 | |
| Shriram Transport Finance Co. Ltd. | 98,091 | 1,645,596 | |
| Ujjivan Financial Services Ltd. (a) | 30,839 | 74,984 | |
| 13,121,456 | |||
| Diversified Financial Services - 0.8% | |||
| Chailease Holding Co. Ltd. | 2,185,731 | 14,044,789 | |
| FirstRand Ltd. | 3,542,836 | 13,232,882 | |
| Housing Development Finance Corp. Ltd. | 946,067 | 28,628,766 | |
| Power Finance Corp. Ltd. | 216,707 | 322,873 | |
| REC Ltd. | 1,361,768 | 1,848,135 | |
| Yuanta Financial Holding Co. Ltd. | 9,212,155 | 6,119,710 | |
| 64,197,155 | |||
| Insurance - 2.0% | |||
| AIA Group Ltd. | 6,782,984 | 65,260,693 | |
| Cathay Financial Holding Co. Ltd. | 872,000 | 1,269,589 | |
| China Life Insurance Co. Ltd. (H Shares) | 10,641,000 | 15,256,246 | |
| China Pacific Insurance (Group) Co. Ltd. (H Shares) | 5,468,600 | 11,584,233 | |
| China Taiping Insurance Group Ltd. | 1,756,234 | 1,793,072 | |
| Db Insurance Co. Ltd. | 127,714 | 5,665,119 | |
| Hanwha Life Insurance Co. Ltd. (a) | 130,319 | 222,687 | |
| HDFC Standard Life Insurance Co. Ltd. (d) | 997,703 | 7,146,302 | |
| Hyundai Fire & Marine Insurance Co. Ltd. | 161,716 | 3,778,542 | |
| ICICI Lombard General Insurance Co. Ltd. (d) | 48,502 | 778,737 | |
| Meritz Fire & Marine Insurance Co. Ltd. | 18,537 | 527,149 | |
| New China Life Insurance Co. Ltd. (H Shares) | 189,700 | 446,494 | |
| People's Insurance Co. of China Group Ltd. (H Shares) | 678,000 | 209,545 | |
| PICC Property & Casualty Co. Ltd. (H Shares) | 11,916,000 | 12,888,719 | |
| Ping An Insurance Group Co. of China Ltd. (H Shares) | 2,943,500 | 17,312,623 | |
| Powszechny Zaklad Ubezpieczen SA | 1,132,408 | 6,784,810 | |
| Prudential PLC | 508,188 | 5,333,516 | |
| Samsung Fire & Marine Insurance Co. Ltd. | 63,966 | 9,259,715 | |
| 165,517,791 | |||
| Thrifts & Mortgage Finance - 0.0% | |||
| LIC Housing Finance Ltd. | 323,236 | 1,641,616 | |
| Sangsangin Co. Ltd. | 4,273 | 27,078 | |
| 1,668,694 | |||
TOTAL FINANCIALS | 980,603,342 | ||
| HEALTH CARE - 1.8% | |||
| Biotechnology - 0.2% | |||
| InnoCare Pharma Ltd. (a)(d) | 407,000 | 561,353 | |
| Innovent Biologics, Inc. (a)(d) | 1,031,000 | 4,346,209 | |
| Zai Lab Ltd. (a) | 590,400 | 2,617,493 | |
| Zai Lab Ltd. ADR (a) | 118,800 | 5,489,748 | |
| 13,014,803 | |||
| Health Care Equipment & Supplies - 0.2% | |||
| Lutronic Corp. | 22,813 | 318,028 | |
| Peijia Medical Ltd. (a)(d) | 871,000 | 693,473 | |
| Rayence Co. Ltd. | 12,372 | 92,517 | |
| Shenzhen Mindray Bio-Medical Electronics Co. Ltd. (A Shares) | 395,738 | 17,075,112 | |
| 18,179,130 | |||
| Health Care Providers & Services - 0.3% | |||
| Apollo Hospitals Enterprise Ltd. | 108,525 | 5,828,064 | |
| Bangkok Chain Hospital PCL (For. Reg.) | 2,390,400 | 1,219,896 | |
| Bangkok Dusit Medical Services PCL (For. Reg.) | 2,201,000 | 1,758,809 | |
| Bumrungrad Hospital PCL (For. Reg.) | 40,400 | 238,516 | |
| Dr Sulaiman Al Habib Medical Services Group Co. | 20,789 | 1,106,092 | |
| Hapvida Participacoes e Investimentos SA (d) | 3,623,000 | 5,069,860 | |
| Mediclinic International PLC | 800,567 | 4,612,895 | |
| Rede D'Oregon Sao Luiz SA (d) | 207,783 | 1,331,195 | |
| Shanghai Pharmaceuticals Holding Co. Ltd. (H Shares) | 666,100 | 968,372 | |
| Sinopharm Group Co. Ltd. (H Shares) | 110,400 | 245,949 | |
| 22,379,648 | |||
| Health Care Technology - 0.0% | |||
| Medlive Technology Co. Ltd. (d) | 232,500 | 369,593 | |
| Life Sciences Tools & Services - 0.5% | |||
| Pharmaron Beijing Co. Ltd. (H Shares) (d) | 274,300 | 1,814,409 | |
| WuXi AppTec Co. Ltd. | 338,969 | 4,387,681 | |
| WuXi AppTec Co. Ltd. (H Shares) (d) | 309,956 | 3,499,095 | |
| Wuxi Biologics (Cayman), Inc. (a)(d) | 3,744,500 | 33,034,363 | |
| 42,735,548 | |||
| Pharmaceuticals - 0.6% | |||
| Aspen Pharmacare Holdings Ltd. | 331,074 | 2,841,211 | |
| China Medical System Holdings Ltd. | 80,616 | 119,310 | |
| China Resources Pharmaceutical Group Ltd. (d) | 1,497,500 | 1,026,014 | |
| China Traditional Chinese Medicine Holdings Co. Ltd. | 228,000 | 98,321 | |
| Cipla Ltd./India | 429,794 | 5,566,726 | |
| CSPC Pharmaceutical Group Ltd. | 440,000 | 446,347 | |
| Hansoh Pharmaceutical Group Co. Ltd. (d) | 742,000 | 1,480,392 | |
| Hypera SA | 895,200 | 7,411,246 | |
| Korea United Pharm, Inc. | 2,053 | 37,466 | |
| PT Kalbe Farma Tbk | 7,063,400 | 798,722 | |
| Richter Gedeon PLC | 1,085,072 | 21,904,153 | |
| Shanghai Fosun Pharmaceutical (Group) Co. Ltd. (H Shares) | 42,500 | 136,723 | |
| Sino Biopharmaceutical Ltd. | 756,000 | 397,063 | |
| Sun Pharmaceutical Industries Ltd. | 380,199 | 4,241,056 | |
| 46,504,750 | |||
TOTAL HEALTH CARE | 143,183,472 | ||
| INDUSTRIALS - 3.2% | |||
| Aerospace & Defense - 0.2% | |||
| Bharat Dynamics Ltd. | 24,654 | 250,750 | |
| Bharat Electronics Ltd. | 389,491 | 1,487,520 | |
| Hanwha Aerospace Co. Ltd. | 22,988 | 1,385,218 | |
| Hindustan Aeronautics Ltd. | 128,993 | 3,691,523 | |
| Korea Aerospace Industries Ltd. | 174,940 | 7,906,683 | |
| 14,721,694 | |||
| Air Freight & Logistics - 0.2% | |||
| Dimerco Express Corp. | 171,000 | 450,789 | |
| Hyundai Glovis Co. Ltd. | 13,692 | 1,786,936 | |
| SF Holding Co. Ltd. (A Shares) | 967,453 | 6,910,366 | |
| Sinotrans Ltd. (H Shares) | 256,000 | 73,150 | |
| Transport Corp. of India Ltd. | 11,277 | 100,270 | |
| ZTO Express, Inc. sponsored ADR | 172,888 | 4,503,732 | |
| 13,825,243 | |||
| Airlines - 0.0% | |||
| Air Arabia PJSC (a) | 427,264 | 258,236 | |
| Turk Hava Yollari AO (a) | 463,539 | 1,862,641 | |
| Wizz Air Holdings PLC (a)(d) | 77,911 | 1,935,087 | |
| 4,055,964 | |||
| Building Products - 0.1% | |||
| Bawan Co. | 12,953 | 134,389 | |
| China Liansu Group Holdings Ltd. | 107,000 | 127,180 | |
| Dare Power Dekor Home Co. Ltd. (A Shares) | 1,220,078 | 1,570,285 | |
| Everest Industries Ltd. | 8,635 | 75,785 | |
| KCC Glass Corp. | 4,052 | 151,188 | |
| LX Hausys Ltd. | 1,397 | 46,513 | |
| PT Mulia Industrindo Tbk (a) | 3,988,500 | 151,715 | |
| SCG Ceramics PCL NVDR | 467,000 | 25,767 | |
| Somany Ceramics Ltd. | 3,251 | 26,068 | |
| Zhejiang Weixing New Building Materials Co. Ltd. (A Shares) | 718,002 | 2,168,954 | |
| 4,477,844 | |||
| Commercial Services & Supplies - 0.0% | |||
| China Everbright International Ltd. | 3,442,000 | 1,701,253 | |
| EKI Energy Services Ltd. | 3,200 | 68,282 | |
| Saudi Airlines Catering Co. (a) | 18,685 | 376,782 | |
| 2,146,317 | |||
| Construction & Engineering - 0.6% | |||
| Budimex SA | 65 | 3,492 | |
| China CAMC Engineering Co. Ltd. (A Shares) | 52,958 | 61,405 | |
| China Conch Venture Holdings Ltd. | 138,000 | 281,629 | |
| China Railway Group Ltd. (H Shares) | 9,339,993 | 5,347,086 | |
| Combined Group Contracting Co. SAKC | 26,635 | 39,687 | |
| DL E&C Co. Ltd. | 30,916 | 934,662 | |
| Hindustan Construction Co. Ltd. (a) | 504,895 | 80,359 | |
| Hyundai Engineering & Construction Co. Ltd. | 39,557 | 1,408,886 | |
| Larsen & Toubro Ltd. | 952,766 | 22,728,940 | |
| Metallurgical Corp. China Ltd. (H Shares) | 4,555,882 | 862,869 | |
| Murray & Roberts Holdings Ltd. (a) | 72,316 | 37,618 | |
| Orascom Construction PLC | 1,460 | 4,774 | |
| Sinopec Engineering Group Co. Ltd. (H Shares) | 574,738 | 256,776 | |
| Suzhou Gold Mantis Consolidated Co. Ltd. (a) | 147,100 | 106,785 | |
| Voltas Ltd. | 1,169,132 | 14,550,557 | |
| 46,705,525 | |||
| Electrical Equipment - 0.2% | |||
| ABB Ltd. India | 11,633 | 473,251 | |
| Bharat Heavy Electricals Ltd. | 834,967 | 609,689 | |
| China High Speed Transmission Equipment Group Co. Ltd. (a) | 234,210 | 132,409 | |
| Contemporary Amperex Technology Co. Ltd. (a) | 85,582 | 5,946,787 | |
| DONGYANG E&P, Inc. | 21,665 | 236,347 | |
| Harbin Electric Machinery Co. Ltd.(H Shares) (a) | 565,906 | 153,796 | |
| Hongfa Technology Co. Ltd. (A Shares) | 729,841 | 3,974,399 | |
| LS Electric Co. Ltd. | 10,221 | 422,256 | |
| TD Power Systems Ltd. | 8,415 | 61,376 | |
| Titan Wind Energy Suzhou Co. Ltd. (A Shares) | 889,462 | 1,775,636 | |
| Triveni Turbine Ltd. | 43,830 | 111,561 | |
| Weg SA | 662,759 | 3,604,000 | |
| Xinjiang Goldwind Science & Technology Co. Ltd. (H Shares) | 65,529 | 97,649 | |
| 17,599,156 | |||
| Industrial Conglomerates - 0.3% | |||
| Aamal Co. (a) | 177,954 | 57,514 | |
| Alfa SA de CV Series A | 1,699,752 | 1,081,618 | |
| Astra Industrial Group | 30,578 | 420,559 | |
| CITIC Pacific Ltd. | 6,337,000 | 6,532,678 | |
| CJ Corp. | 16,874 | 977,893 | |
| Doosan Co. Ltd. | 5,221 | 318,252 | |
| Fosun International Ltd. | 217,000 | 160,175 | |
| GS Holdings Corp. | 12,179 | 416,478 | |
| Hanwha Corp. | 83,235 | 1,960,572 | |
| Industries Qatar QSC (a) | 708,433 | 3,530,736 | |
| Koc Holding A/S | 883,889 | 2,216,555 | |
| Kolon Corp. | 8,285 | 155,693 | |
| LG Corp. | 83,345 | 5,065,707 | |
| Mannai Corp. | 86,440 | 291,951 | |
| Nava Bharat Ventures Ltd. | 157,633 | 443,757 | |
| Shanghai Industrial Holdings Ltd. | 48,000 | 66,726 | |
| SM Investments Corp. | 276,310 | 4,074,244 | |
| Thoresen Thai Agencies PCL NVDR | 685,000 | 155,215 | |
| 27,926,323 | |||
| Machinery - 0.6% | |||
| Ador Welding Ltd. | 1,754 | 20,152 | |
| China International Marine Containers Group Co. Ltd. (H Shares) | 1,130,931 | 940,626 | |
| Elgi Equipments Ltd. | 74,285 | 458,315 | |
| Haitian International Holdings Ltd. | 352,000 | 862,384 | |
| HIWIN Technologies Corp. | 875,365 | 5,912,890 | |
| Hyundai Mipo Dockyard Co. Ltd. (a) | 74,620 | 5,900,368 | |
| Jingjin Environmental Protection Co. Ltd. | 50,200 | 211,657 | |
| Kepler Weber SA | 15,585 | 63,300 | |
| Kirloskar Brothers Ltd. | 3,519 | 14,615 | |
| NRB Bearings Ltd. | 71,935 | 145,456 | |
| Schaeffler India Ltd. | 7,615 | 288,067 | |
| Shenzhen Inovance Technology Co. Ltd. (A Shares) | 936,868 | 8,118,839 | |
| Sinotruk Hong Kong Ltd. | 1,201,072 | 1,197,510 | |
| SNT Energy Co. Ltd. | 3,136 | 53,717 | |
| Techtronic Industries Co. Ltd. | 580,000 | 6,840,662 | |
| Tian Di Science & Technology Co. Ltd. (A Shares) | 1,570,000 | 1,159,921 | |
| Weichai Power Co. Ltd.: | |||
| (A Shares) | 102 | 171 | |
| (H Shares) | 5,091,560 | 6,802,392 | |
| Wuxi Lead Intelligent Equipment Co. Ltd. (A Shares) | 253,236 | 2,015,057 | |
| Zhejiang Sanhua Intelligent Controls Co. Ltd. (A Shares) | 2,811,030 | 10,414,864 | |
| Zoomlion Heavy Industry Science and Technology Co. Ltd. (H Shares) | 122,200 | 55,087 | |
| 51,476,050 | |||
| Marine - 0.3% | |||
| COSCO SHIPPING Holdings Co. Ltd. (H Shares) | 5,454,750 | 8,143,185 | |
| Danaos Corp. | 16,274 | 1,126,975 | |
| Evergreen Marine Corp. (Taiwan) | 1,916,000 | 5,494,953 | |
| Orient Overseas International Ltd. | 59,542 | 1,659,732 | |
| PT Temas Tbk | 240,100 | 39,342 | |
| Qatar Navigation QPSC | 6,188 | 18,912 | |
| Safe Bulkers, Inc. | 25,016 | 79,801 | |
| Star Bulk Carriers Corp. (b) | 93,890 | 1,835,550 | |
| Wan Hai Lines Ltd. | 419,750 | 1,183,934 | |
| Wisdom Marine Lines Co. Ltd. | 167,000 | 314,947 | |
| Yang Ming Marine Transport Corp. | 1,094,000 | 2,804,745 | |
| 22,702,076 | |||
| Professional Services - 0.1% | |||
| Centre Testing International Group Co. Ltd. (A Shares) | 1,191,137 | 3,789,621 | |
| Grupa Pracuj SA | 134,225 | 1,399,367 | |
| Headhunter Group PLC ADR (c) | 18,283 | 49,762 | |
| Pony Testing International Group Co. Ltd. | 265,240 | 1,515,967 | |
| 6,754,717 | |||
| Road & Rail - 0.4% | |||
| Globaltrans Investment PLC GDR (Reg. S) (c) | 13,245 | 4,580 | |
| Grab Holdings Ltd. (a)(b) | 1,322,600 | 3,769,410 | |
| Localiza Rent A Car SA | 1,948,091 | 22,774,661 | |
| United International Transportation Co. | 360,008 | 4,419,891 | |
| VRL Logistics Ltd. | 44,040 | 339,977 | |
| 31,308,519 | |||
| Trading Companies & Distributors - 0.1% | |||
| Asia Green Energy PCL unit | 1,462,200 | 161,434 | |
| BOC Aviation Ltd. Class A (d) | 662,200 | 5,300,569 | |
| CITIC Resources Holdings Ltd. | 590,000 | 36,955 | |
| LX International Corp. | 58,523 | 1,877,236 | |
| PT Sumber Global Energy | 586,000 | 36,863 | |
| 7,413,057 | |||
| Transportation Infrastructure - 0.1% | |||
| Abu Dhabi Ports Co. PJSC | 590,709 | 813,751 | |
| Airports of Thailand PCL (For. Reg.) (a) | 491,500 | 976,559 | |
| CCR SA | 1,023,171 | 2,712,119 | |
| Cosco Shipping Ports Ltd. | 172,000 | 111,297 | |
| Grupo Aeroportuario del Pacifico S.A.B. de CV Series B | 70,100 | 998,063 | |
| Grupo Aeroportuario del Sureste S.A.B. de CV: | |||
| Series B | 127,720 | 2,705,155 | |
| Series B sponsored ADR | 5,931 | 1,254,229 | |
| Jiangsu Expressway Co. Ltd. (H Shares) | 102,000 | 87,364 | |
| Zhejiang Expressway Co. Ltd. (H Shares) | 1,342,000 | 1,021,423 | |
| 10,679,960 | |||
TOTAL INDUSTRIALS | 261,792,445 | ||
| INFORMATION TECHNOLOGY - 11.1% | |||
| Communications Equipment - 0.1% | |||
| Accton Technology Corp. | 825,000 | 7,602,971 | |
| BYD Electronic International Co. Ltd. | 57,000 | 150,601 | |
| SerComm Corp. | 256,000 | 811,706 | |
| ZTE Corp. (H Shares) | 62,800 | 132,590 | |
| 8,697,868 | |||
| Electronic Equipment & Components - 1.1% | |||
| AAC Technology Holdings, Inc. | 62,000 | 114,863 | |
| Alviva Holdings Ltd. | 11,198 | 15,596 | |
| FIH Mobile Ltd. (a) | 3,235,000 | 419,037 | |
| General Interface Solution Holding Ltd. | 90,000 | 236,746 | |
| GrandTech CG Systems, Inc. | 15,000 | 27,481 | |
| Hon Hai Precision Industry Co. Ltd. (Foxconn) | 12,182,626 | 43,413,177 | |
| Innolux Corp. | 1,204,000 | 474,613 | |
| Kingboard Chemical Holdings Ltd. | 55,500 | 175,252 | |
| Kingboard Laminates Holdings Ltd. | 79,000 | 75,359 | |
| LG Display Co. Ltd. | 22,050 | 253,825 | |
| LG Innotek Co. Ltd. | 8,084 | 2,049,717 | |
| Lotes Co. Ltd. | 52,000 | 1,233,774 | |
| Primax Electronics Ltd. | 519,000 | 1,136,392 | |
| Redington (India) Ltd. | 546,863 | 1,019,884 | |
| Samsung SDI Co. Ltd. | 20,611 | 9,076,159 | |
| Simplo Technology Co. Ltd. | 3,000 | 28,329 | |
| SINBON Electronics Co. Ltd. | 228,000 | 2,108,558 | |
| Sirtec International Co. Ltd. | 1,000 | 728 | |
| Sunny Optical Technology Group Co. Ltd. | 572,400 | 7,814,664 | |
| Unimicron Technology Corp. | 2,742,000 | 13,445,429 | |
| Wasion Holdings Ltd. | 54,000 | 18,168 | |
| Yageo Corp. | 371,600 | 3,977,413 | |
| 87,115,164 | |||
| IT Services - 1.0% | |||
| Arabian Internet and Communications Services Co. Ltd. | 12,762 | 943,824 | |
| ChinaSoft International Ltd. | 234,000 | 182,918 | |
| Comtec System Co. Ltd. (a) | 49,330 | 28,311 | |
| Digital China Holdings Ltd. (H Shares) | 386,000 | 172,185 | |
| Elm Co. | 5,583 | 510,921 | |
| Endava PLC ADR (a) | 13,009 | 1,313,909 | |
| Globant SA (a) | 16,943 | 3,571,076 | |
| HCL Technologies Ltd. | 621,785 | 7,229,017 | |
| Infosys Ltd. | 1,137,645 | 20,957,933 | |
| Infosys Ltd. sponsored ADR | 1,176,030 | 21,521,349 | |
| Mastek Ltd. | 5,248 | 122,915 | |
| Mphasis BFL Ltd. | 62,186 | 1,635,168 | |
| Network International Holdings PLC (a)(d) | 12,420 | 34,743 | |
| Tata Consultancy Services Ltd. | 380,154 | 15,153,835 | |
| TravelSky Technology Ltd. (H Shares) | 54,000 | 94,116 | |
| Wipro Ltd. | 384,214 | 1,966,297 | |
| WNS Holdings Ltd. sponsored ADR (a) | 27,674 | 2,331,535 | |
| 77,770,052 | |||
| Semiconductors & Semiconductor Equipment - 6.2% | |||
| Advanced Analog Technology, Inc. | 33,000 | 55,173 | |
| ALI Corp. (a) | 131,000 | 108,174 | |
| Amlogic Shanghai Co. Ltd. (A Shares) (a) | 41,889 | 522,062 | |
| ASE Technology Holding Co. Ltd. | 2,339,000 | 6,512,153 | |
| ASMedia Technology, Inc. | 25,000 | 755,185 | |
| ASML Holding NV (Netherlands) | 13,550 | 6,613,962 | |
| ASPEED Tech, Inc. | 200 | 13,173 | |
| ChipMOS TECHNOLOGIES, Inc. | 714,000 | 832,650 | |
| Contrel Technology Co. Ltd. | 122,000 | 63,137 | |
| Daqo New Energy Corp. ADR (a) | 91,742 | 6,116,439 | |
| DB HiTek Co. Ltd. | 40,337 | 1,379,086 | |
| eGalax_eMPIA Technology, Inc. | 309,826 | 641,441 | |
| eMemory Technology, Inc. | 189,000 | 8,459,422 | |
| Everlight Electronics Co. Ltd. | 73,000 | 93,861 | |
| Generalplus Technology, Inc. | 41,000 | 76,601 | |
| King Yuan Electronics Co. Ltd. | 227,000 | 276,731 | |
| LONGi Green Energy Technology Co. Ltd. | 2,507,691 | 18,497,402 | |
| Lx Semicon Co. Ltd. | 19,405 | 1,359,930 | |
| Macroblock, Inc. | 68,000 | 261,476 | |
| MediaTek, Inc. | 1,590,000 | 34,428,994 | |
| MLS Co. Ltd. (A Shares) | 733,268 | 1,078,033 | |
| Nanya Technology Corp. | 11,000 | 19,119 | |
| Novatek Microelectronics Corp. | 451,000 | 3,861,423 | |
| Parade Technologies Ltd. | 40,000 | 1,120,611 | |
| Phison Electronics Corp. | 40,000 | 406,930 | |
| Powertech Technology, Inc. | 140,000 | 390,962 | |
| Qingdao GaoCe Technology Co. Ltd. Class A | 17,317 | 222,983 | |
| Radiant Opto-Electronics Corp. | 437,000 | 1,437,145 | |
| Raydium Semiconductor Corp. | 64,572 | 581,443 | |
| Realtek Semiconductor Corp. | 443,000 | 4,981,705 | |
| Silergy Corp. | 918,000 | 15,749,895 | |
| Sino-American Silicon Products, Inc. | 229,000 | 1,249,431 | |
| Sitronix Technology Corp. | 154,000 | 952,894 | |
| SK Hynix, Inc. | 520,642 | 36,460,668 | |
| SNU Precision Co. Ltd. (a) | 8,382 | 17,122 | |
| Sonix Technology Co. Ltd. | 10,000 | 19,399 | |
| Taiwan Semiconductor Manufacturing Co. Ltd. | 19,205,900 | 314,639,596 | |
| Taiwan Semiconductor Manufacturing Co. Ltd. sponsored ADR | 372,299 | 31,031,122 | |
| United Microelectronics Corp. | 2,858,000 | 3,805,413 | |
| Vanguard International Semiconductor Corp. | 734,000 | 1,775,835 | |
| Will Semiconductor Ltd. | 37,273 | 504,199 | |
| Winbond Electronics Corp. | 2,697,000 | 1,944,702 | |
| 509,317,682 | |||
| Software - 0.2% | |||
| Asseco Poland SA | 16,805 | 256,366 | |
| Aurionpro Solutions Ltd. (a) | 5,213 | 21,787 | |
| Cyient Ltd. | 44,146 | 462,044 | |
| GemVaxLINK Co. Ltd. | 37,821 | 36,535 | |
| Genesis Technology, Inc. | 20,698 | 37,357 | |
| Glodon Co. Ltd. (A Shares) | 303,500 | 2,153,985 | |
| Hundsun Technologies, Inc. (A Shares) | 1,118,845 | 5,436,585 | |
| Intellect Design Arena Ltd. | 48,348 | 354,705 | |
| Kingdee International Software Group Co. Ltd. (a) | 2,343,000 | 4,547,536 | |
| KPIT Technologies Ltd. | 243,587 | 1,682,125 | |
| Newgen Software Technologies Ltd. | 13,425 | 65,467 | |
| Nucleus Software Exports Ltd. | 31,536 | 158,829 | |
| Oracle Financial Services Soft | 3,355 | 132,481 | |
| Sangfor Technologies, Inc. | 84,000 | 1,171,908 | |
| 16,517,710 | |||
| Technology Hardware, Storage & Peripherals - 2.5% | |||
| ASUSTeK Computer, Inc. | 378,000 | 3,147,783 | |
| Gigabyte Technology Co. Ltd. | 419,000 | 1,169,546 | |
| Lenovo Group Ltd. | 9,586,000 | 7,895,150 | |
| Lite-On Technology Corp. | 2,172,000 | 4,677,823 | |
| Samsung Electronics Co. Ltd. | 4,168,175 | 183,923,900 | |
| Wiwynn Corp. | 35,000 | 876,850 | |
| 201,691,052 | |||
TOTAL INFORMATION TECHNOLOGY | 901,109,528 | ||
| MATERIALS - 3.9% | |||
| Chemicals - 1.3% | |||
| Abou Kir Fertilizers & Chemical Industries | 68,315 | 89,784 | |
| Andhra Sugars Ltd. (a) | 60,735 | 110,268 | |
| Asian Paints Ltd. | 41,556 | 1,748,615 | |
| China BlueChemical Ltd. (H Shares) | 162,000 | 42,183 | |
| China Risun Group Ltd. Class H | 238,000 | 93,304 | |
| China Sanjiang Fine Chemicals Ltd. | 186,000 | 38,030 | |
| Dongyue Group Co. Ltd. | 123,000 | 138,048 | |
| Fertiglobe PLC | 1,107,112 | 1,693,929 | |
| Finolex Industries Ltd. | 24,457 | 46,184 | |
| Fufeng Group Ltd. | 437,000 | 245,555 | |
| GHCL Ltd. | 45,616 | 339,099 | |
| Gujarat Narmada Valley Fertilizers Co. | 54,694 | 508,744 | |
| Gujarat State Fertilizers & Chemicals Ltd. | 97,251 | 190,597 | |
| Hansol Chemical Co. Ltd. | 19,268 | 3,099,581 | |
| Icl Group Ltd. | 469,500 | 4,509,951 | |
| Indorama Ventures PCL: | |||
| (For. Reg.) | 899,700 | 1,062,392 | |
| NVDR | 659,900 | 779,229 | |
| KCC Corp. | 1,168 | 254,036 | |
| LG Chemical Ltd. | 87,756 | 40,916,005 | |
| Mangalore Chemicals & Fertilizers Ltd. | 14,526 | 22,618 | |
| NOROO Paint & Coatings Co. Ltd. | 11,018 | 74,483 | |
| North Huajin Chemical Industries Co. Ltd. (A Shares) | 314,200 | 323,839 | |
| Pcbl Ltd. /India | 394,494 | 673,935 | |
| PhosAgro PJSC: | |||
| GDR (c) | 359 | 7 | |
| GDR (Reg. S) (c) | 55,750 | 1,143 | |
| Polyplex Corp. Ltd. | 23,781 | 635,828 | |
| PT Avia Avian Tbk | 33,403,300 | 1,743,116 | |
| Sabic Agriculture-Nutrients Co. | 95,575 | 4,424,062 | |
| Sahara International Petrochemical Co. | 626,683 | 7,960,658 | |
| Sasol Ltd. | 211,988 | 4,077,094 | |
| Satellite Chemical Co. Ltd. (A Shares) | 1,482,172 | 4,701,197 | |
| Saudi Basic Industries Corp. | 363,003 | 9,676,217 | |
| Shandong Sinocera Functional Material Co. Ltd. (A Shares) | 436,483 | 2,000,034 | |
| Sharda Cropchem Ltd. | 25,945 | 167,435 | |
| Solar Industries India Ltd. | 182,100 | 7,569,978 | |
| Sree Rayalaseema Hi-Strength Hypo Ltd. | 6,825 | 68,686 | |
| Taekwang Industrial Co. Ltd. | 168 | 102,898 | |
| Tamilnadu Petroproducts Ltd. | 29,740 | 37,528 | |
| Tangshan Sanyou Chemical Industries Co. Ltd. (A Shares) | 289,900 | 279,807 | |
| Unipar Carbocloro SA | 6,160 | 108,911 | |
| UPL Ltd. | 269,965 | 2,584,493 | |
| 103,139,501 | |||
| Construction Materials - 0.2% | |||
| Anhui Conch Cement Co. Ltd. (H Shares) | 382,000 | 1,455,747 | |
| Asia Cement (China) Holdings Corp. | 259,584 | 129,798 | |
| Beijing Oriental Yuhong Waterproof Technology Co. Ltd. (A Shares) | 440,141 | 1,930,046 | |
| CEMEX S.A.B. de CV sponsored ADR (a) | 344,300 | 1,287,682 | |
| China National Building Materials Co. Ltd. (H Shares) | 2,154,442 | 2,034,376 | |
| JK Cement Ltd. | 189,200 | 6,383,968 | |
| NCL Industries Ltd. | 21,490 | 49,053 | |
| Qatar National Cement Co. QSC (a) | 18,192 | 24,752 | |
| Ultratech Cement Ltd. | 57,200 | 4,753,022 | |
| 18,048,444 | |||
| Containers & Packaging - 0.0% | |||
| AGI Greenpac Ltd. | 19,766 | 76,978 | |
| CPMC Holdings Ltd. | 104,000 | 44,493 | |
| 121,471 | |||
| Metals & Mining - 2.3% | |||
| African Rainbow Minerals Ltd. | 74,594 | 1,022,802 | |
| Aluminum Corp. of China Ltd. (H Shares) | 332,000 | 122,677 | |
| Angang Steel Co. Ltd. (H Shares) | 1,547,654 | 483,612 | |
| Anglo American Platinum Ltd. | 39,568 | 2,762,227 | |
| Anglo American PLC (South Africa) | 11,331 | 363,212 | |
| AngloGold Ashanti Ltd. | 22,441 | 299,692 | |
| Ann Joo Resources Bhd | 500 | 116 | |
| ArcelorMittal South Africa Ltd. (a) | 26,000 | 7,724 | |
| Baoshan Iron & Steel Co. Ltd. (A Shares) | 1,878,201 | 1,448,943 | |
| Barrick Gold Corp. | 835,400 | 12,405,690 | |
| China Hongqiao Group Ltd. | 1,286,500 | 1,247,471 | |
| China Oriental Group Co. Ltd. (H Shares) | 102,045 | 18,800 | |
| China Zhongwang Holdings Ltd. (a)(c) | 350,800 | 75,088 | |
| Cmoc Group Ltd. (H Shares) | 300,000 | 133,775 | |
| Companhia Brasileira de Aluminio | 1,426,935 | 3,524,549 | |
| Companhia Siderurgica Nacional SA (CSN) | 79,562 | 211,048 | |
| Fangda Special Steel Technology Co. Ltd. (A Shares) | 316,000 | 295,704 | |
| First Quantum Minerals Ltd. | 286,348 | 5,066,987 | |
| Freeport-McMoRan, Inc. | 136,100 | 4,028,560 | |
| Ganfeng Lithium Co. Ltd. (H Shares) (d) | 234,520 | 2,060,366 | |
| Godawari Power & Ispat Ltd. | 8,450 | 30,930 | |
| Gold Fields Ltd. | 579,237 | 4,678,124 | |
| Grupo Mexico SA de CV Series B | 2,974,830 | 11,263,497 | |
| Hindalco Industries Ltd. | 562,205 | 3,047,706 | |
| Hunan Valin Steel Co. Ltd. (A Shares) | 918,718 | 592,108 | |
| Impala Platinum Holdings Ltd. | 1,556,601 | 16,310,615 | |
| Jastrzebska Spolka Weglowa SA (a) | 133,379 | 1,349,682 | |
| Jiangxi Copper Co. Ltd. (H Shares) | 1,335,000 | 1,639,612 | |
| Jindal Saw Ltd. | 59,724 | 64,438 | |
| Korea Zinc Co. Ltd. | 40,156 | 20,007,760 | |
| Kumba Iron Ore Ltd. (b) | 77,499 | 1,715,774 | |
| Maharashtra Seamless Ltd. | 10,425 | 108,852 | |
| MMG Ltd. (a) | 256,000 | 70,032 | |
| Nanjing Iron & Steel Co. Ltd. | 2,888,200 | 1,233,648 | |
| National Aluminium Co. Ltd. | 39,774 | 39,588 | |
| Novolipetsk Steel OJSC (c) | 355,140 | 5,458 | |
| Novolipetsk Steel OJSC GDR (Reg. S) (c) | 56,576 | 7,029 | |
| Polyus PJSC (c) | 2,468 | 8,853 | |
| Polyus PJSC unit (c) | 8,823 | 13,520 | |
| POSCO | 141,827 | 26,722,742 | |
| POSCO sponsored ADR | 33,432 | 1,571,973 | |
| Press Metal Bhd | 1,341,300 | 1,421,640 | |
| PT Tambank Timah | 5,053,300 | 507,914 | |
| Sansteel Minguang Co. Ltd. (A Shares) | 723,700 | 545,031 | |
| Saudi Arabian Mining Co. | 11,837 | 234,599 | |
| SGIS Songshan Co. Ltd. (A Shares) | 1,595,800 | 759,294 | |
| Shanxi Taigang Stainless Steel Co. Ltd. (A Shares) | 797,304 | 566,086 | |
| Sibanye-Stillwater Ltd. | 831,480 | 1,857,545 | |
| Southern Copper Corp. (b) | 54,700 | 2,574,729 | |
| Steel Authority of India Ltd. | 2,931,836 | 2,951,699 | |
| Tata Steel Ltd. | 10,607,970 | 14,235,422 | |
| Ternium SA sponsored ADR | 120,737 | 3,719,907 | |
| Tinplate Co. of India Ltd. | 28,726 | 112,753 | |
| Vale SA | 568,500 | 7,048,333 | |
| Vale SA sponsored ADR (b) | 1,652,150 | 20,519,703 | |
| Vedanta Ltd. | 737,591 | 2,470,779 | |
| Welspun Gujarat Stahl Rohren Ltd. | 96,833 | 271,380 | |
| Xinyu Iron & Steel Co. Ltd. | 2,900,747 | 1,791,372 | |
| Zhaojin Mining Industry Co. Ltd. (H Shares) (a) | 97,000 | 82,133 | |
| Zijin Mining Group Co. Ltd. (H Shares) | 486,000 | 549,167 | |
| 188,280,470 | |||
| Paper & Forest Products - 0.1% | |||
| Dexco SA | 802,787 | 1,518,419 | |
| Evergreen Fibreboard Bhd | 293,700 | 33,514 | |
| Nine Dragons Paper (Holdings) Ltd. | 141,000 | 110,639 | |
| PT Indah Kiat Pulp & Paper Tbk | 568,000 | 318,165 | |
| Seshasayee Paper & Boards Ltd. | 7,875 | 28,255 | |
| Shanying International Holdings Co. Ltd. Class A | 594,300 | 226,298 | |
| Suzano Papel e Celulose SA | 568,200 | 4,834,025 | |
| West Coast Paper Mills Ltd. | 36,114 | 283,064 | |
| 7,352,379 | |||
TOTAL MATERIALS | 316,942,265 | ||
| REAL ESTATE - 0.7% | |||
| Equity Real Estate Investment Trusts (REITs) - 0.0% | |||
| Link (REIT) | 157,000 | 1,215,027 | |
| SA Corporate Real Estate Fund | 186,080 | 22,833 | |
| Torunlar Gayrimenkul Yatirim Ortakligi AS (a) | 159,310 | 74,875 | |
| 1,312,735 | |||
| Real Estate Management & Development - 0.7% | |||
| Agile Property Holdings Ltd. | 2,555,238 | 894,845 | |
| Aldar Properties PJSC | 842,464 | 1,105,518 | |
| AP Thailand PCL (For. Reg.) | 1,322,000 | 360,909 | |
| Ayala Land, Inc. | 7,949,800 | 4,031,268 | |
| China Jinmao Holdings Group Ltd. | 430,000 | 90,546 | |
| China Merchants Shekou Industrial Zone Holdings Co. Ltd. (A Shares) | 664,700 | 1,406,069 | |
| China Overseas Land and Investment Ltd. | 3,541,500 | 9,517,680 | |
| China Resources Land Ltd. | 1,914,000 | 7,836,392 | |
| China Resources Mixc Lifestyle Services Ltd. (d) | 854,200 | 3,873,600 | |
| China Vanke Co. Ltd. (H Shares) | 147,300 | 287,563 | |
| CIFI Ever Sunshine Services Group Ltd. | 74,000 | 45,480 | |
| CIFI Holdings Group Co. Ltd. | 350,000 | 88,583 | |
| Country Garden Services Holdings Co. Ltd. | 179,000 | 351,764 | |
| Dar Al Arkan Real Estate Development Co. (a) | 372,221 | 1,402,141 | |
| Emaar Development PJSC (a) | 2,439,377 | 3,194,414 | |
| Emaar Properties PJSC (a) | 5,272,255 | 8,985,412 | |
| Greentown China Holdings Ltd. | 75,500 | 142,452 | |
| Greentown Service Group Co. Ltd. | 126,000 | 91,029 | |
| Hang Lung Properties Ltd. | 2,122,000 | 3,528,908 | |
| K Wah International Holdings Ltd. | 14,880 | 5,612 | |
| KE Holdings, Inc. ADR (a) | 440,000 | 7,937,600 | |
| Longfor Properties Co. Ltd. (d) | 617,000 | 2,002,636 | |
| Powerlong Real Estate Holding Ltd. | 195,417 | 24,506 | |
| PT Ciputra Development Tbk | 1,816,000 | 116,168 | |
| Seazen Group Ltd. (a) | 178,000 | 59,086 | |
| SYN prop e tech SA | 47,300 | 41,459 | |
| Xinyuan Real Estate Co. Ltd. ADR (a) | 386 | 197 | |
| Yuexiu Property Co. Ltd. | 116,000 | 145,090 | |
| 57,566,927 | |||
TOTAL REAL ESTATE | 58,879,662 | ||
| UTILITIES - 0.7% | |||
| Electric Utilities - 0.2% | |||
| Centrais Eletricas Brasileiras SA (Electrobras) | 435,207 | 3,857,334 | |
| CESC Ltd. GDR | 126,180 | 128,013 | |
| CEZ A/S | 8,248 | 333,798 | |
| Energisa SA unit | 213,082 | 1,732,131 | |
| PGE Polska Grupa Energetyczna SA (a) | 526,044 | 802,721 | |
| Power Grid Corp. of India Ltd. | 386,105 | 1,104,913 | |
| Saudi Electricity Co. | 917,408 | 6,162,424 | |
| Tata Power Co. Ltd./The | 137,192 | 402,103 | |
| Tauron Polska Energia SA (a) | 516,875 | 253,819 | |
| 14,777,256 | |||
| Gas Utilities - 0.4% | |||
| Beijing Enterprises Holdings Ltd. | 42,500 | 126,413 | |
| ENN Energy Holdings Ltd. | 907,400 | 13,182,181 | |
| GAIL India Ltd. | 3,103,243 | 5,268,712 | |
| Indraprastha Gas Ltd. | 82,667 | 432,001 | |
| Korea Gas Corp. | 43,315 | 1,397,616 | |
| Kunlun Energy Co. Ltd. | 13,660,000 | 11,894,131 | |
| PT Perusahaan Gas Negara Tbk Series B | 1,580,700 | 195,559 | |
| 32,496,613 | |||
| Independent Power and Renewable Electricity Producers - 0.1% | |||
| Adani Power Ltd. (a) | 145,266 | 741,465 | |
| China Longyuan Power Grid Corp. Ltd. (H Shares) | 281,000 | 453,862 | |
| China Power International Development Ltd. | 457,000 | 255,122 | |
| China Resources Power Holdings Co. Ltd. | 162,000 | 322,111 | |
| Galata Wind Enerji A/S | 150,580 | 120,933 | |
| Jaiprakash Power Ventures Ltd. (a) | 3,520,118 | 329,046 | |
| JSW Energy Ltd. | 41,968 | 178,261 | |
| Nlc India Ltd. | 113,192 | 107,390 | |
| NTPC Ltd. | 3,268,764 | 6,697,273 | |
| Orient Green Power Co. Ltd. (a) | 1,404,214 | 159,134 | |
| 9,364,597 | |||
| Multi-Utilities - 0.0% | |||
| Dubai Electricity & Water Authority PJSC | 463,455 | 323,009 | |
| Water Utilities - 0.0% | |||
| Beijing Enterprises Water Group Ltd. | 348,208 | 89,448 | |
| Companhia de Saneamento Basico do Estado de Sao Paulo (SABESP) | 5,600 | 52,906 | |
| Taliworks Corp. Bhd | 154,900 | 31,992 | |
| VA Tech Wabag Ltd. (a) | 32,270 | 105,870 | |
| 280,216 | |||
TOTAL UTILITIES | 57,241,691 | ||
| TOTAL COMMON STOCKS (Cost $4,064,506,780) | 4,302,602,559 | ||
| Nonconvertible Preferred Stocks - 1.8% | |||
| Shares | Value ($) | ||
| CONSUMER STAPLES - 0.1% | |||
| Beverages - 0.1% | |||
| Ambev SA sponsored ADR | 1,827,400 | 5,299,460 | |
| ENERGY - 0.7% | |||
| Oil, Gas & Consumable Fuels - 0.7% | |||
| Petroleo Brasileiro SA - Petrobras: | |||
| (PN) (non-vtg.) | 2,806,952 | 17,929,228 | |
| (PN) sponsored ADR (non-vtg.) | 386,330 | 4,921,844 | |
| sponsored ADR | 2,664,939 | 38,081,978 | |
| 60,933,050 | |||
| FINANCIALS - 0.5% | |||
| Banks - 0.5% | |||
| Banco Bradesco SA (PN) | 1,724,555 | 6,285,092 | |
| Itau Unibanco Holding SA | 2,980,710 | 14,787,814 | |
| Itau Unibanco Holding SA sponsored ADR (b) | 2,420,687 | 11,958,194 | |
| Itausa-Investimentos Itau SA (PN) | 4,336,141 | 7,626,421 | |
| Sberbank of Russia (a)(c) | 145,250 | 1,372 | |
| Sberbank of Russia (Russia) (a)(c) | 128,031 | 1,210 | |
| 40,660,103 | |||
| INDUSTRIALS - 0.0% | |||
| Aerospace & Defense - 0.0% | |||
| Forjas Taurus SA | 184,800 | 617,374 | |
| INFORMATION TECHNOLOGY - 0.2% | |||
| Technology Hardware, Storage & Peripherals - 0.2% | |||
| Samsung Electronics Co. Ltd. | 450,803 | 18,163,916 | |
| MATERIALS - 0.2% | |||
| Chemicals - 0.1% | |||
| Braskem SA Class A | 545,626 | 3,193,586 | |
| Unipar Carbocloro SA | 34,540 | 680,522 | |
| 3,874,108 | |||
| Metals & Mining - 0.1% | |||
| Cia Ferro Ligas da Bahia - Ferbasa | 15,600 | 158,207 | |
| Gerdau SA | 1,660,200 | 7,441,924 | |
| Metalurgica Gerdau SA (PN) | 574,600 | 1,101,177 | |
| Usinas Siderurgicas de Minas Gerais SA - Usiminas (PN-A) (non-vtg.) | 131,900 | 203,337 | |
| 8,904,645 | |||
TOTAL MATERIALS | 12,778,753 | ||
| UTILITIES - 0.1% | |||
| Electric Utilities - 0.1% | |||
| Companhia Energetica de Minas Gerais (CEMIG) (PN) | 838,488 | 1,950,197 | |
| Companhia Paranaense de Energia-COPEL (PN-B) | 1,564,100 | 2,095,528 | |
| Transmissora Alianca de Energia Eletrica SA | 15,800 | 42,124 | |
| 4,087,849 | |||
| Water Utilities - 0.0% | |||
| Cia de Saneamento do Parana | 195,100 | 132,757 | |
TOTAL UTILITIES | 4,220,606 | ||
| TOTAL NONCONVERTIBLE PREFERRED STOCKS (Cost $122,734,880) | 142,673,262 | ||
| Equity Funds - 40.0% | |||
| Shares | Value ($) | ||
| Diversified Emerging Markets Funds - 40.0% | |||
| Aberdeen Emerging Markets Fund Institutional Service Class | 11,965,871 | 153,761,438 | |
| Artisan Developing World Fund Investor Shares | 7,321,364 | 101,327,676 | |
| Brandes Emerging Markets Value Fund Class A | 16,850,310 | 111,549,052 | |
| Calvert Emerging Markets Equity Fund Class A | 45 | 732 | |
| Fidelity Advisor Emerging Markets Fund Class Z (e) | 15,923,372 | 525,152,816 | |
| Fidelity SAI Emerging Markets Index Fund (e) | 17,368,649 | 223,013,449 | |
| Fidelity SAI Emerging Markets Low Volatility Index Fund (e) | 61,128,071 | 625,340,170 | |
| Fidelity SAI Emerging Markets Value Index Fund (e) | 74,045,838 | 847,824,830 | |
| GMO Emerging Markets Fund - Class III | 1,924,381 | 45,704,039 | |
| Goldman Sachs Emerging Markets Equity Fund Institutional Shares | 12,110,916 | 259,294,718 | |
| Invesco Developing Markets Fund Class R6 | 4,625,320 | 163,181,281 | |
| Invesco Emerging Markets Innovators Fund Class A | 173,274 | 1,301,286 | |
| iShares MSCI China ETF (b) | 2,226,845 | 110,651,928 | |
| iShares MSCI EM ESG Optimized ETF (b) | 209,609 | 6,579,627 | |
| iShares MSCI South Korea Index ETF (b) | 546,222 | 31,631,716 | |
| Lazard Emerging Markets Equity Portfolio Open Shares | 842,137 | 13,314,193 | |
| Matthews Korea Fund Investor Class | 4,457,127 | 18,987,361 | |
| Matthews Pacific Tiger Fund Investor Class | 164 | 3,720 | |
| Xtrackers Harvest CSI 300 China ETF Class A (b) | 674,830 | 20,150,424 | |
| TOTAL EQUITY FUNDS (Cost $3,423,874,945) | 3,258,770,456 | ||
| Other - 0.2% | |||
| Shares | Value ($) | ||
| Commodity Funds - Broad Basket - 0.2% | |||
Fidelity SAI Inflation-Focused Fund (e) (Cost $10,022,703) | 1,173,878 | 14,215,658 | |
| U.S. Treasury Obligations - 0.2% | |||
Principal Amount (f) | Value ($) | ||
U.S. Treasury Bills, yield at date of purchase 1.13% to 2.43% 9/1/22 to 10/27/22 (g) (Cost $16,312,578) | 16,350,000 | 16,309,826 | |
| Money Market Funds - 6.6% | |||
| Shares | Value ($) | ||
| Fidelity Cash Central Fund 2.33% (h) | 73,412,619 | 73,427,301 | |
| Fidelity Securities Lending Cash Central Fund 2.34% (h)(i) | 146,046,696 | 146,061,301 | |
| State Street Institutional U.S. Government Money Market Fund Premier Class 2.25% (j) | 318,412,367 | 318,412,367 | |
| TOTAL MONEY MARKET FUNDS (Cost $537,900,969) | 537,900,969 | ||
| TOTAL INVESTMENT IN SECURITIES - 101.6% (Cost $8,175,352,855) | 8,272,472,730 |
NET OTHER ASSETS (LIABILITIES) - (1.6)% | (129,570,608) |
| NET ASSETS - 100.0% | 8,142,902,122 |
| Futures Contracts | |||||
Number of contracts | Expiration Date | Notional Amount ($) | Value ($) | Unrealized Appreciation/ (Depreciation) ($) | |
| Purchased | |||||
| Equity Index Contracts | |||||
| ICE E-mini MSCI Emerging Markets Index Contracts (United States) | 5,680 | Sep 2022 | 278,859,600 | (1,987,915) | (1,987,915) |
| The notional amount of futures purchased as a percentage of Net Assets is 3.4% | |||||
| ETF | - | EXCHANGE-TRADED FUND |
| (a) | Non-income producing |
| (b) | Security or a portion of the security is on loan at period end. |
| (c) | Level 3 security |
| (d) | Security exempt from registration under Rule 144A of the Securities Act of 1933. These securities may be resold in transactions exempt from registration, normally to qualified institutional buyers. At the end of the period, the value of these securities amounted to $193,471,883 or 2.4% of net assets. |
| (e) | Affiliated Fund |
| (f) | Amount is stated in United States dollars unless otherwise noted. |
| (g) | Security or a portion of the security was pledged to cover margin requirements for futures contracts. At period end, the value of securities pledged amounted to $12,416,481. |
| (h) | Affiliated fund that is generally available only to investment companies and other accounts managed by Fidelity Investments. The rate quoted is the annualized seven-day yield of the fund at period end. A complete unaudited listing of the fund's holdings as of its most recent quarter end is available upon request. In addition, each Fidelity Central Fund's financial statements are available on the SEC's website or upon request. |
| (i) | Investment made with cash collateral received from securities on loan. |
| (j) | The rate quoted is the annualized seven-day yield of the fund at period end. |
| Affiliate | Value, beginning of period ($) | Purchases ($) | Sales Proceeds ($) | Dividend Income ($) | Realized Gain (loss) ($) | Change in Unrealized appreciation (depreciation) ($) | Value, end of period ($) | %ownership, end of period |
| Fidelity Cash Central Fund 2.33% | 46,788,821 | 238,185,366 | 211,546,886 | 387,527 | - | - | 73,427,301 | 0.1% |
| Fidelity Securities Lending Cash Central Fund 2.34% | 227,226,382 | 778,268,481 | 859,433,562 | 1,267,522 | - | - | 146,061,301 | 0.4% |
| Total | 274,015,203 | 1,016,453,847 | 1,070,980,448 | 1,655,049 | - | - | 219,488,602 | |
| Affiliate | Value, beginning of period ($) | Purchases ($) | Sales Proceeds ($) | Dividend Income ($) | Realized Gain (loss) ($) | Change in Unrealized appreciation (depreciation) ($) | Value, end of period ($) |
| Fidelity Advisor Emerging Markets Fund Class Z | 622,922,321 | - | - | - | - | (97,769,505) | 525,152,816 |
| Fidelity SAI Emerging Markets Index Fund | 344,501,663 | - | 75,000,000 | - | 9,595,986 | (56,084,200) | 223,013,449 |
| Fidelity SAI Emerging Markets Low Volatility Index Fund | 590,858,941 | 100,000,000 | - | - | - | (65,518,771) | 625,340,170 |
| Fidelity SAI Emerging Markets Value Index Fund | 885,908,737 | 100,000,000 | - | - | - | (138,083,907) | 847,824,830 |
| Fidelity SAI Inflation-Focused Fund | 13,476,115 | - | - | - | - | 739,543 | 14,215,658 |
| 2,457,667,777 | 200,000,000 | 75,000,000 | - | 9,595,986 | (356,716,840) | 2,235,546,923 |
| Valuation Inputs at Reporting Date: | ||||
| Description | Total ($) | Level 1 ($) | Level 2 ($) | Level 3 ($) |
Investments in Securities: | ||||
| Equities: | ||||
Communication Services | 397,555,990 | 50,370,800 | 343,843,096 | 3,342,094 |
Consumer Discretionary | 695,458,564 | 201,561,197 | 493,756,990 | 140,377 |
Consumer Staples | 316,406,531 | 99,820,430 | 216,535,286 | 50,815 |
Energy | 239,661,579 | 105,878,925 | 132,974,759 | 807,895 |
Financials | 1,021,263,445 | 337,800,219 | 683,295,325 | 167,901 |
Health Care | 143,183,472 | 42,312,294 | 100,871,178 | - |
Industrials | 262,409,819 | 64,910,311 | 197,445,166 | 54,342 |
Information Technology | 919,273,444 | 67,631,284 | 851,642,160 | - |
Materials | 329,721,018 | 122,426,400 | 207,183,520 | 111,098 |
Real Estate | 58,879,662 | 22,741,616 | 36,138,046 | - |
Utilities | 61,462,297 | 17,859,681 | 43,602,616 | - |
| Equity Funds | 3,258,770,456 | 3,258,770,456 | - | - |
| Other | 14,215,658 | 14,215,658 | - | - |
| Other Short-Term Investments | 16,309,826 | - | 16,309,826 | - |
| Money Market Funds | 537,900,969 | 537,900,969 | - | - |
| Total Investments in Securities: | 8,272,472,730 | 4,944,200,240 | 3,323,597,968 | 4,674,522 |
Derivative Instruments: | ||||
| Liabilities | ||||
Futures Contracts | (1,987,915) | (1,987,915) | - | - |
| Total Liabilities | (1,987,915) | (1,987,915) | - | - |
| Total Derivative Instruments: | (1,987,915) | (1,987,915) | - | - |
Primary Risk Exposure / Derivative Type | Value | |
| Asset ($) | Liability ($) | |
| Equity Risk | ||
Futures Contracts (a) | 0 | (1,987,915) |
| Total Equity Risk | 0 | (1,987,915) |
| Total Value of Derivatives | 0 | (1,987,915) |
| Statement of Assets and Liabilities | ||||
August 31, 2022 (Unaudited) | ||||
| Assets | ||||
| Investment in securities, at value (including securities loaned of $142,202,840) - See accompanying schedule: | $5,817,437,205 | |||
Unaffiliated issuers (cost $5,726,908,400) | ||||
Fidelity Central Funds (cost $219,488,602) | 219,488,602 | |||
Other affiliated issuers (cost $2,228,955,853) | 2,235,546,923 | |||
| Total Investment in Securities (cost $8,175,352,855) | $ | 8,272,472,730 | ||
| Cash | 246,134 | |||
| Foreign currency held at value (cost $10,230,354) | 10,207,847 | |||
| Receivable for investments sold | 12,333,805 | |||
| Receivable for fund shares sold | 3,242,844 | |||
| Dividends receivable | 15,184,820 | |||
| Interest receivable | 613,652 | |||
| Distributions receivable from Fidelity Central Funds | 226,387 | |||
| Receivable for daily variation margin on futures contracts | 798,335 | |||
| Prepaid expenses | 16,471 | |||
| Other receivables | 164,522 | |||
Total assets | 8,315,507,547 | |||
| Liabilities | ||||
| Payable for investments purchased | $11,641,317 | |||
| Payable for fund shares redeemed | 3,781,816 | |||
| Accrued management fee | 2,044,163 | |||
| Other payables and accrued expenses | 9,127,397 | |||
| Collateral on securities loaned | 146,010,732 | |||
| Total Liabilities | 172,605,425 | |||
| Net Assets | $ | 8,142,902,122 | ||
| Net Assets consist of: | ||||
| Paid in capital | $ | 8,258,911,047 | ||
| Total accumulated earnings (loss) | (116,008,925) | |||
| Net Assets | $ | 8,142,902,122 | ||
Net Asset Value , offering price and redemption price per share ($8,142,902,122 ÷ 814,844,675 shares) | $ | 9.99 | ||
| Statement of Operations | ||||
Six months ended August 31, 2022 (Unaudited) | ||||
| Investment Income | ||||
| Dividends: | ||||
| Unaffiliated issuers | $ | 118,345,113 | ||
| Interest | 1,594,185 | |||
| Income from Fidelity Central Funds (including $1,267,522 from security lending) | 1,655,049 | |||
| Income before foreign taxes withheld | 121,594,347 | |||
| Less foreign taxes withheld | (10,785,856) | |||
| Total Income | 110,808,491 | |||
| Expenses | ||||
| Management fee | $ | 23,376,552 | ||
| Custodian fees and expenses | 911,922 | |||
| Independent trustees' fees and expenses | 27,849 | |||
| Registration fees | 73,399 | |||
| Audit | 43,011 | |||
| Legal | 6,921 | |||
| Miscellaneous | 29,943 | |||
| Total expenses before reductions | 24,469,597 | |||
| Expense reductions | (10,845,379) | |||
| Total expenses after reductions | 13,624,218 | |||
| Net Investment income (loss) | 97,184,273 | |||
| Realized and Unrealized Gain (Loss) | ||||
| Net realized gain (loss) on: | ||||
| Investment Securities: | ||||
| Unaffiliated issuers(net of foreign taxes of $1,684,396) | (176,777,902) | |||
| Other affiliated issuers | 9,595,986 | |||
| Foreign currency transactions | (2,664,845) | |||
| Futures contracts | (66,757,208) | |||
| Total net realized gain (loss) | (236,603,969) | |||
| Change in net unrealized appreciation (depreciation) on: | ||||
| Investment Securities: | ||||
| Unaffiliated issuers (net of decrease in deferred foreign taxes of $2,049,884) | (1,006,020,173) | |||
| Affiliated issuers | (356,716,840) | |||
| Assets and liabilities in foreign currencies | (107,728) | |||
| Futures contracts | 12,429,350 | |||
| Total change in net unrealized appreciation (depreciation) | (1,350,415,391) | |||
| Net gain (loss) | (1,587,019,360) | |||
| Net increase (decrease) in net assets resulting from operations | $ | (1,489,835,087) | ||
| Statement of Changes in Net Assets | ||||
Six months ended August 31, 2022 (Unaudited) | Year ended February 28, 2022 | |||
| Increase (Decrease) in Net Assets | ||||
| Operations | ||||
| Net investment income (loss) | $ | 97,184,273 | $ | 174,467,478 |
| Net realized gain (loss) | (236,603,969) | 89,420,383 | ||
| Change in net unrealized appreciation (depreciation) | (1,350,415,391) | (1,539,804,432) | ||
| Net increase (decrease) in net assets resulting from operations | (1,489,835,087) | (1,275,916,571) | ||
| Distributions to shareholders | - | (294,736,059) | ||
| Share transactions | ||||
| Proceeds from sales of shares | 1,327,247,533 | 3,263,578,700 | ||
| Reinvestment of distributions | - | 266,713,282 | ||
| Cost of shares redeemed | (1,452,441,911) | (1,415,939,059) | ||
Net increase (decrease) in net assets resulting from share transactions | (125,194,378) | 2,114,352,923 | ||
| Total increase (decrease) in net assets | (1,615,029,465) | 543,700,293 | ||
| Net Assets | ||||
| Beginning of period | 9,757,931,587 | 9,214,231,294 | ||
| End of period | $ | 8,142,902,122 | $ | 9,757,931,587 |
| Other Information | ||||
| Shares | ||||
| Sold | 126,975,427 | 245,488,428 | ||
| Issued in reinvestment of distributions | - | 20,980,423 | ||
| Redeemed | (136,466,901) | (105,951,304) | ||
| Net increase (decrease) | (9,491,474) | 160,517,547 | ||
| Strategic Advisers® Emerging Markets Fund |
Six months ended (Unaudited) August 31, 2022 | Years ended February 28, 2022 | 2021 | 2020 A | 2019 | 2018 | |||||||
Selected Per-Share Data | ||||||||||||
| Net asset value, beginning of period | $ | 11.84 | $ | 13.88 | $ | 10.20 | $ | 10.23 | $ | 11.75 | $ | 9.14 |
| Income from Investment Operations | ||||||||||||
Net investment income (loss) B,C | .12 | .24 | .15 | .23 D | .17 | .14 | ||||||
| Net realized and unrealized gain (loss) | (1.97) | (1.90) | 3.66 | (.03) | (1.53) | 2.62 | ||||||
| Total from investment operations | (1.85) | (1.66) | 3.81 | .20 | (1.36) | 2.76 | ||||||
| Distributions from net investment income | - | (.25) | (.13) | (.23) | (.16) | (.15) | ||||||
| Distributions from net realized gain | - | (.13) | - | - | - | - E | ||||||
| Total distributions | - | (.38) | (.13) | (.23) | (.16) | (.15) | ||||||
| Net asset value, end of period | $ | 9.99 | $ | 11.84 | $ | 13.88 | $ | 10.20 | $ | 10.23 | $ | 11.75 |
Total Return F,G | (15.62)% | (12.12)% | 37.42% | 1.80% | (11.48)% | 30.23% | ||||||
Ratios to Average Net Assets C,H,I | ||||||||||||
| Expenses before reductions | .56% J | .58% | .59% | .64% | .66% | .70% | ||||||
| Expenses net of fee waivers, if any | .31% J | .33% | .34% | .39% | .41% | .45% | ||||||
| Expenses net of all reductions | .31% J | .33% | .34% | .39% | .40% | .45% | ||||||
| Net investment income (loss) | 2.24% J | 1.78% | 1.28% | 2.20% D | 1.60% | 1.36% | ||||||
| Supplemental Data | ||||||||||||
| Net assets, end of period (000 omitted) | $ | 8,142,902 | $ | 9,757,932 | $ | 9,214,231 | $ | 4,818,245 | $ | 4,660,765 | $ | 5,070,379 |
Portfolio turnover rate K | 32% J | 31% | 43% | 39% | 57% | 31% |
| Strategic Advisers Emerging Markets Fund | $53,514 |
| Gross unrealized appreciation | $ 1,087,433,228 |
| Gross unrealized depreciation | (1,055,398,985) |
| Net unrealized appreciation (depreciation) | $ 32,034,243 |
| Tax cost | $ 8,238,450,572 |
| Equity Risk | Equity risk relates to the fluctuations in the value of financial instruments as a result of changes in market prices (other than those arising from interest rate risk or foreign exchange risk), whether caused by factors specific to an individual investment, its issuer, or all factors affecting all instruments traded in a market or market segment. |
| Purchases ($) | Sales ($) | |
| Strategic Advisers Emerging Markets Fund | 1,581,972,107 | 1,307,178,101 |
| Amount | |
| Strategic Advisers Emerging Markets Fund | $ 940 |
| Purchases ($) | Sales ($) | Realized Gain (Loss) ($) | |
| Strategic Advisers Emerging Markets Fund | 2,177,133 | 8,872,665 | 1,305,693 |
| Fidelity Central Fund | Investment Manager | Investment Objective | Investment Practices | Expense Ratio A |
| Fidelity Money Market Central Funds | Fidelity Management & Research Company LLC (FMR) | Each fund seeks to obtain a high level of current income consistent with the preservation of capital and liquidity. | Short-term Investments | Less than .005% |
| Amount | |
| Strategic Advisers Emerging Markets Fund | $ 8,123 |
| Total Security Lending Fees Paid to NFS | Security Lending Income From Securities Loaned to NFS | Value of Securities Loaned to NFS at Period End | |
| Strategic Advisers Emerging Markets Fund | $ 135,532 | $ - | $- |
| Fund | Strategic Advisers Emerging Markets Fund |
| Fidelity SAI Emerging Markets Low Volatility Index Fund | 32% |
| Fidelity SAI Emerging Markets Value Index Fund | 32% |
| The Example is based on an investment of $1,000 invested at the beginning of the period and held for the entire period (March 1, 2022 to August 31, 2022). |
Annualized Expense Ratio- A | Beginning Account Value March 1, 2022 | Ending Account Value August 31, 2022 | Expenses Paid During Period- C March 1, 2022 to August 31, 2022 | |||||||
| Strategic Advisers® Emerging Markets Fund | .31% | |||||||||
| Actual | $ 1,000 | $ 843.80 | $ 1.44 | |||||||
Hypothetical- B | $ 1,000 | $ 1,023.64 | $ 1.58 | |||||||
|
Item 2.
Code of Ethics
Not applicable.
Item 3.
Audit Committee Financial Expert
Not applicable.
Item 4.
Principal Accountant Fees and Services
Not applicable.
Item 5.
Audit Committee of Listed Registrants
Not applicable.
Item 6.
Investments
(a)
Not applicable.
(b)
Not applicable
Item 7.
Disclosure of Proxy Voting Policies and Procedures for Closed-End Management Investment Companies
Not applicable.
Item 8.
Portfolio Managers of Closed-End Management Investment Companies
Not applicable.
Item 9.
Purchase of Equity Securities by Closed-End Management Investment Company and Affiliated Purchasers
Not applicable.
Item 10.
Submission of Matters to a Vote of Security Holders
There were no material changes to the procedures by which shareholders may recommend nominees to the Fidelity Rutland Square Trust II’s Board of Trustees.
Item 11.
Controls and Procedures
(a)(i) The President and Treasurer and the Chief Financial Officer have concluded that the Fidelity Rutland Square Trust II’s (the “Trust”) disclosure controls and procedures (as defined in Rule 30a-3(c) under the Investment Company Act) provide reasonable
assurances that material information relating to the Trust is made known to them by the appropriate persons, based on their evaluation of these controls and procedures as of a date within 90 days of the filing date of this report.
(a)(ii) There was no change in the Trust’s internal control over financial reporting (as defined in Rule 30a-3(d) under the Investment Company Act) that occurred during the period covered by this report that has materially affected, or is reasonably likely to materially affect, the Trust’s internal control over financial reporting.
Item 12.
Disclosure of Securities Lending Activities for Closed-End Management
Investment Companies
Not applicable.
Item 13.
Exhibits
(a) | (1) | Not applicable. |
(a) | (2) | |
(a) | (3) | Not applicable. |
(b) |
SIGNATURES
Pursuant to the requirements of the Securities Exchange Act of 1934 and the Investment Company Act of 1940, the registrant has duly caused this report to be signed on its behalf by the undersigned, thereunto duly authorized.
Fidelity Rutland Square Trust II
By: | /s/Stacie M. Smith |
Stacie M. Smith | |
President and Treasurer | |
Date: | October 20, 2022 |
Pursuant to the requirements of the Securities Exchange Act of 1934 and the Investment Company Act of 1940, this report has been signed below by the following persons on behalf of the registrant and in the capacities and on the dates indicated.
By: | /s/Stacie M. Smith |
Stacie M. Smith | |
President and Treasurer | |
Date: | October 20, 2022 |
By: | /s/John J. Burke III |
John J. Burke III | |
Chief Financial Officer | |
Date: | October 20, 2022 |