UNITED STATES SECURITIES AND EXCHANGE COMMISSION
Washington, D.C. 20549
_____________________________________________________________
Form 10-K | | | | | | | | |
| (Mark One) |
| ☑ | ANNUAL REPORT PURSUANT TO SECTION 13 OR 15(d) OF THE SECURITIES EXCHANGE ACT OF 1934 |
| | For the fiscal year ended | December 31, 2024 |
| OR |
| ☐ | TRANSITION REPORT PURSUANT TO SECTION 13 OR 15(d) OF THE SECURITIES EXCHANGE ACT OF 1934 |
| | For the transition period from to |
Commission file number: 001-33492
_____________________________________________________________
CVR Energy, Inc.
(Exact name of registrant as specified in its charter) | | | | | | | | |
| Delaware | | 61-1512186 |
(State or Other Jurisdiction of Incorporation or Organization) | (I.R.S. Employer Identification No.) |
2277 Plaza Drive, Suite 500, Sugar Land, Texas 77479
(Address of principal executive offices) (Zip Code)
281-207-3200
(Registrant’s Telephone Number, including Area Code)
____________________________________________________________
Securities registered pursuant to Section 12(b) of the Act: | | | | | | | | |
| Title of Each Class | Trading Symbol(s) | Name of Each Exchange on Which Registered |
| Common Stock, $0.01 par value per share | CVI | New York Stock Exchange |
Securities registered pursuant to Section 12(g) of the Act: None
Indicate by check mark if the registrant is a well-known seasoned issuer, as defined in Rule 405 of the Securities Act. Yes ☑ No ☐
Indicate by check mark if the registrant is not required to file reports pursuant to Section 13 or Section 15(d) of the Act. Yes ☐ No ☑
Indicate by check mark whether the registrant (1) has filed all reports required to be filed by Section 13 or 15(d) of the Securities Exchange Act of 1934 during the preceding 12 months (or for such shorter period that the registrant was required to file such reports), and (2) has been subject to such filing requirements for the past 90 days. Yes ☑ No ☐
Indicate by check mark whether the registrant has submitted electronically every Interactive Data File required to be submitted pursuant to Rule 405 of Regulation S-T (§232.405 of this chapter) during the preceding 12 months (or for such shorter period that the registrant was required to submit such files). Yes ☑ No ☐
Indicate by check mark whether the registrant is a large accelerated filer, an accelerated filer, a non-accelerated filer, a smaller reporting company, or an emerging growth company. See the definitions of “large accelerated filer,” “accelerated filer,” “smaller reporting company” and “emerging growth company” in Rule 12b-2 of the Exchange Act.
| | | | | | | | | | | | | | | | | |
| Large accelerated filer | ☑ | Accelerated filer | ☐ | Non-accelerated filer | ☐ |
| Smaller reporting company | ☐ | Emerging growth company | ☐ | | |
If an emerging growth company, indicate by check mark if the registrant has elected not to use the extended transition period for complying with any new or revised financial accounting standards provided pursuant to Section 13(a) of the Exchange Act. ☐
Indicate by check mark whether the registrant has filed a report on and attestation to its management’s assessment of the effectiveness of its internal control over financial reporting under Section 404(b) of the Sarbanes-Oxley Act (15 U.S.C. 7262(b)) by the registered public accounting firm prepared or issued its audit report. ☑
If securities are registered pursuant to Section 12(b) of the Act, indicate by check mark whether the financial statements of the registrant included in the filing reflect the correction of an error to previously issued financial statements. o
Indicate by check mark whether any of those error corrections are restatements that required a recovery analysis of incentive-based compensation received by any of the registrant’s executive officers during the relevant recovery period pursuant to § 240.10D-1(b). o
Indicate by check mark whether the registrant is a shell company (as defined in Rule 12b-2 of the Exchange Act). Yes ☐ No ☑
At June 30, 2024, the aggregate market value of the voting common stock held by non-affiliates of the registrant was approximately $906 million based upon the closing price of its common stock on the New York Stock Exchange Composite tape. As of February 14, 2025, there were 100,530,599 shares of the registrant’s common stock outstanding.
Documents Incorporated By Reference
Portions of the registrant’s Proxy Statement to be filed pursuant to Regulation 14A pertaining to the 2025 Annual Meeting of Stockholders are incorporated by reference into Part III hereof. The Company intends to file such Proxy Statement no later than 120 days after the end of the fiscal year covered by this Form 10-K.
TABLE OF CONTENTS
CVR Energy, Inc.
Annual Report on Form 10-K
| | | | | | | | | | | | | | | | | | | | |
| PART I | | | PART III | |
| | | | | | |
| | | | | | |
| | | | | | |
| | | | | | |
| | | | | | |
| | | | | | |
| | | | | | |
| | | | | | |
| PART II | | | PART IV | |
| | | | | | |
| | | | | | |
| | | | |
| | | |
| | | |
| | | |
| | | |
| | | |
| | | |
GLOSSARY OF SELECTED TERMS
The following are definitions of certain terms used in this Annual Report on Form 10-K for the year ended December 31, 2024 (this “Report”).
2-1-1 crack spread — The approximate gross margin resulting from processing two barrels of crude oil to produce one barrel of gasoline and one barrel of distillate. The 2-1-1 crack spread is expressed in dollars per barrel and is a proxy for the per barrel margin that a sweet crude oil refinery would earn assuming it produced and sold the benchmark production of gasoline and distillate.
Ammonia — Ammonia is a direct application fertilizer and is primarily used as a building block for other nitrogen products for industrial applications and finished fertilizer products.
Biodiesel — A renewable fuel that can be manufactured from Vegetable oils, animal fats, or recycled restaurant grease for use in diesel vehicles or any equipment that operates on diesel fuel and has physical properties similar to those of petroleum diesel.
Blendstocks — Various compounds that are combined with gasoline or diesel from the crude oil refining process to make finished gasoline and diesel fuel; these may include natural gas liquids, ethanol, or reformate, among others.
Bpd — Barrels per day.
Bulk sales — Volume sales through third-party pipelines, in contrast to tanker truck quantity rack sales.
Cap at the Rack (“CAR”) — The cost of complying associated with “cap and trade regulations” for greenhouse gas emissions from fuel combustion. This is a component of the wholesale price of gasoline and diesel.
Capacity — Capacity is defined as the throughput a process unit is capable of sustaining, either on a calendar or stream day basis. The throughput may be expressed in terms of maximum sustainable, nameplate or economic capacity. The maximum sustainable or nameplate capacities may not be the most economical. The economic capacity is the throughput that generally provides the greatest economic benefit based on considerations such as crude oil and other feedstock costs, product values, regulatory compliance costs and downstream unit constraints.
Carbon intensity (“CI”) — A measure of how much carbon dioxide is released to produce a unit of energy.
Catalyst — A substance that alters, accelerates, or instigates chemical changes, but is neither produced, consumed nor permanently altered in the process.
Condensate — A mixture of light liquid hydrocarbons, similar to a very light crude oil. It is typically separated out of a natural gas stream at the point of production when the temperature and pressure of the gas is dropped to atmospheric conditions.
Corn belt — The primary corn producing region of the United States, which Green Markets (a Bloomberg Company) defines as Illinois, Indiana, Iowa, Missouri, Nebraska, and Ohio.
Crack spread — A simplified calculation that measures the difference between the price for light products and crude oil.
Distillates — Primarily diesel fuel, kerosene and jet fuel.
Ethanol — A clear, colorless, flammable oxygenated hydrocarbon. Ethanol is typically produced chemically from ethylene, or biologically from fermentation of various sugars from carbohydrates found in agricultural crops and cellulosic residues from crops or wood. It is used in the United States as a gasoline octane enhancer and oxygenate.
Feedstocks — Petroleum products, such as crude oil or fluid catalytic cracking unit gasoline, that are processed and blended into refined products, such as gasoline, diesel fuel, and jet fuel during the refining process.
Group 3 — A geographic subset of the PADD II region comprising refineries in the midcontinent portion of the United States, specifically Oklahoma, Kansas, Missouri, Nebraska, Iowa, Minnesota, North Dakota, and South Dakota.
LCFS — The Low Carbon Fuel Standard (“LCFS”) is a regulatory framework designed to reduce greenhouse gas emissions from transportation fuels. It sets specific CI targets for fuels including renewable natural gas, electricity, and hydrogen.
Light crude oil — A relatively expensive crude oil characterized by low relative density and viscosity. Light crude oils require lower levels of processing to produce high value products such as gasoline and diesel fuel.
Liquid volume yield — A calculation of the total liquid volumes produced divided by total throughput.
MMBtu — One million British thermal units, or Btu: a measure of energy. One Btu of heat is required to raise the temperature of one pound of water one degree Fahrenheit.
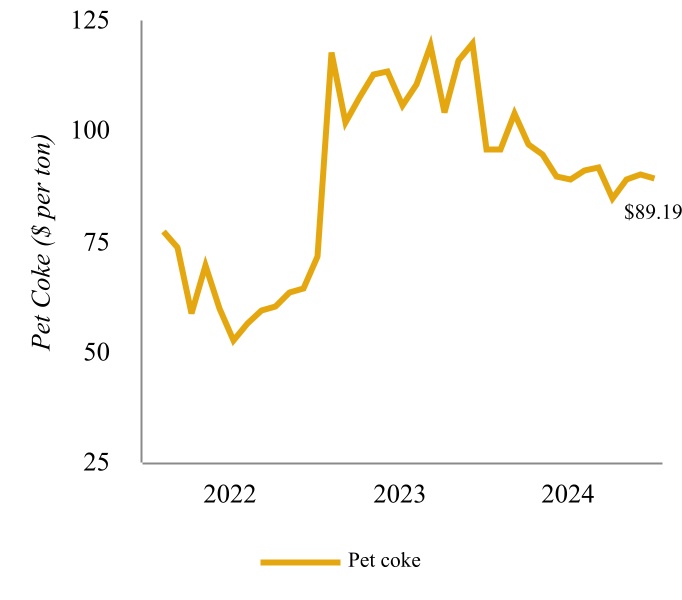
Petroleum coke (pet coke) — A coal-like substance that is produced during the refining process.
Product pricing at gate — Product pricing at gate represents net sales less freight revenue divided by product sales volume in tons. Product pricing at gate is also referred to as netback.
Rack sales — Sales which are made at terminals into third-party tanker trucks or railcars.
RIN — A 38-character number assigned to each physical gallon of renewable fuel produced or imported used for compliance with the Renewable Fuel Standard of the Clean Air Act.
RBOB — Reformulated blendstocks for oxygenate blending.
Renewable diesel — An advanced biofuel that is made from the same renewable resources as biodiesel but using a process that involves heat, pressure and hydrogen to create a cleaner fuel that’s chemically identical to petroleum diesel.
Refined products — Petroleum products, such as gasoline, diesel fuel, and jet fuel, that are produced by a refinery.
Sour crude oil — A crude oil that is relatively high in sulfur content, requiring additional processing to remove the sulfur. Sour crude oil is typically less expensive than sweet crude oil.
Southern Plains — The southern portion of the Great Plains, which Green Markets (a Bloomberg Company) defines as Colorado, Kansas, New Mexico, Oklahoma, and Texas.
Spot market — A market in which commodities are bought and sold for cash and delivered immediately.
Sweet crude oil — A crude oil that is relatively low in sulfur content, requiring less processing to remove the sulfur. Sweet crude oil is typically more expensive than sour crude oil.
Throughput — The quantity of crude oil and other feedstocks processed at a refinery measured in barrels per day.
Turnaround — A periodically performed standard procedure to inspect, refurbish, repair, and maintain the refinery or nitrogen fertilizer plant assets. This process involves the shutdown and inspection of major processing units and occurs every four to five years for the refineries and generally every three years for the nitrogen fertilizer facilities. A turnaround will typically extend the operating life of a facility and return performance to desired operating levels.
UAN — An aqueous solution of urea and ammonium nitrate used as a fertilizer.
ULSD — Ultra low sulfur diesel.
Utilization — Measurement of the annual production of UAN and ammonia expressed as a percentage of each facilities’ nameplate production capacity.
Vegetable oil — An oil extracted from plants, such as canola, corn, and soybean, that can be processed into renewable fuels, including diesel, jet, naphtha, and other fuels.
WCS —Western Canadian Select crude oil, a medium to heavy, sour crude oil, characterized by an American Petroleum Institute gravity (“API gravity”) of between 20 and 22 degrees and a sulfur content of approximately 3.3 weight percent.
WTI — West Texas Intermediate crude oil, a light, sweet crude oil, characterized by an API gravity between 39 and 41 degrees and a sulfur content of approximately 0.4 weight percent that is used as a benchmark for other crude oils.
Yield — The percentage of refined products that is produced from crude oil and other feedstocks.
Important Information Regarding Forward-Looking Statements
This Annual Report on Form 10-K contains forward-looking statements within the meaning of Section 27A of the Securities Act of 1933, as amended (the “Securities Act”), and Section 21E of the Securities Exchange Act of 1934, as amended (the “Exchange Act”), including, but not limited to, those under Part I, Item 1, “Business”, Part I, Item 1A, “Risk Factors”, and Part II, Item 7, “Management’s Discussion and Analysis of Financial Condition and Results of Operations” of this Report. These forward-looking statements are subject to a number of risks and uncertainties, many of which are beyond our control. All statements other than statements of historical fact, including without limitation, statements regarding future operations, financial position, estimated revenues and losses, growth, capital projects, stock or unit repurchases, impacts of legal proceedings, projected costs, prospects, plans and objectives of management are forward-looking statements. The words “could”, “believe”, “anticipate”, “intend”, “estimate”, “expect”, “may”, “continue”, “predict”, “potential”, “project”, and similar terms and phrases are intended to identify forward-looking statements.
Although we believe our assumptions concerning future events are reasonable, a number of risks, uncertainties, and other factors could cause actual results and trends to differ materially from those projected or forward-looking. Forward-looking statements, as well as certain risks, contingencies or uncertainties that may impact our forward-looking statements, include, but are not limited to, the following:
•volatile margins in the refining industry and exposure to the risks associated with volatile crude oil, refined product and feedstock prices;
•the availability of adequate cash and other sources of liquidity for the capital, operating and other needs of our businesses;
•the effects of the Russia-Ukraine war and the conflict in the Middle East and any spread or expansion thereof, including with respect to impacts to commodity prices and other markets;
•the effects of changes in market conditions; market volatility; crude oil and other commodity prices; demand for those commodities, storage and transportation capacities and costs, inflation, and the impact of such changes on our operating results and financial condition;
•the ability to forecast our future financial condition, results of operations, revenues and expenses accurately or at all;
•the effects of transactions involving derivative instruments;
•changes in laws, regulations, rules and policies with respect to crude oil, refined products, other hydrocarbons or renewable feedstocks or products including, without limitation, the export, production, sale or transportation thereof and the actions of the current administration or future administrations that impact oil and gas operations in the United States;
•political uncertainty and impacts to the oil and gas industry and the United States economy generally as a result of actions taken by the current administration, including the imposition of tariffs and changes in climate or other energy laws, rules, regulations, or policies;
•interruption in pipelines supplying feedstocks or distributing the petroleum business’ products;
•competition in the petroleum and nitrogen fertilizer businesses, including potential impacts of domestic and global supply and demand or domestic or international duties, tariffs, or similar costs;
•capital expenditures;
•changes in our or our segments’ credit profiles and impacts thereof on cash needs or otherwise;
•the cyclical and seasonal nature of the petroleum and nitrogen fertilizer businesses;
•the supply, availability and price levels of raw materials and feedstocks and the effects of inflation thereupon;
•our production levels, including the risk of a material decline in those levels;
•accidents or other unscheduled shutdowns or interruptions affecting our facilities, machinery, people, or equipment, or those of our suppliers or customers;
•existing and future laws, regulations, policies, or rulings, including the reinterpretation or amplification thereof by regulators, and including but not limited to those relating to the environment, climate change, alternative energy or fuel sources, electric vehicles, emissions, including tailpipe emission standards that could impact the future viability of internal combustion engines, renewables, safety, security or the transportation, storage, or production of hazardous chemicals, materials or substances, like ammonia, including potential liabilities or capital requirements arising from such laws, regulations, policies, or rulings and the impacts thereof on macroeconomic factors, consumer activity or otherwise;
•erosion of demand for our products due to, or other impacts of, climate change and Environmental, Social and Governance (“ESG”) initiatives or other factors, whether from regulators, rating agencies, lenders, investors, litigants, customers, vendors, the public or others;
•potential operating hazards, downtime, and damage to our or our counterparties’ facilities and other assets from accidents, fires, severe weather, tornadoes, floods, wildfires, or other natural disasters;
•the impact of weather on commodity supply or pricing and on the nitrogen fertilizer business including our ability to produce, market or sell fertilizer products profitability or at all;
•rulings, judgments or settlements in litigation, tax or other legal or regulatory matters;
•the dependence of the nitrogen fertilizer business on customers and distributors including to transport goods and equipment and providers of feedstocks;
•the reliance on, or the ability to procure economically or at all, petroleum coke (“pet coke”) that our nitrogen fertilizer business purchases from our subsidiaries and third-party suppliers or the natural gas, electricity, oxygen, nitrogen, sulfur processing and compressed dry air and other products purchased from third parties by the nitrogen fertilizer and petroleum businesses and the facility operating risks associated with these third parties;
•risks of terrorism, cybersecurity attacks, and the security of chemical manufacturing facilities and other matters beyond our control;
•our lack of diversification of assets or operating and supply areas;
•the petroleum business’ and nitrogen fertilizer business’ dependence on significant customers and the creditworthiness and performance by counterparties;
•the potential loss of the nitrogen fertilizer business’ transportation cost advantage over its competitors;
•the potential inability to successfully implement our business strategies at all or on time and within our anticipated budgets, including significant capital programs or projects, turnarounds or renewable or carbon reduction initiatives at our refineries and fertilizer facilities, including pretreater, carbon sequestration, segregation of our renewables business and other projects;
•our ability to continue to license the technology used for our operations;
•our petroleum business’ purchase of, or ability to purchase, renewable identification numbers (“RINs”) on a timely and cost effective basis or at all;
•the impact of refined product demand and declining inventories on refined product prices and crack spreads;
•Organization of Petroleum Exporting Countries’ and its allies’ (“OPEC+”) production levels and pricing;
•the impact of RINs pricing, our blending and purchasing activities and governmental actions, including by the U.S. Environmental Protection Agency (the “EPA”) on our RIN obligation, open RINs positions, small refinery exemptions, and our estimated consolidated cost to comply with our Renewable Fuel Standard (“RFS”) obligations;
•our accounting policies and treatment, including of our RFS obligations;
•operational upsets or changes in laws that could impact the amount and receipt of credits (if any) under Section 45Q of the Internal Revenue Code of 1986, as amended, or any similar law, rule, or regulation;
•our ability to meet certain carbon oxide capture and sequestration milestones;
•our businesses’ ability to obtain, retain or renew environmental and other governmental permits, licenses or authorizations necessary for the operation of its business;
•impact of potential runoff of water containing nitrogen based fertilizer into waterways and regulatory or legal actions in response thereto;
•our ability to issue securities, obtain financing or sell assets on terms favorable to us or at all;
•bank failures or other events affecting financial institutions;
•existing and future regulations related to the end-use of our products or the application of fertilizers;
•refinery and nitrogen fertilizer facilities’ operating hazards and interruptions, including unscheduled maintenance or downtime and the availability of adequate insurance coverage;
•risks related to services provided by or competition among our subsidiaries, including conflicts of interests and control of CVR Partners, LP’s general partner, and control of CVR Energy, Inc. by its controlling shareholder;
•risks related to potential strategic transactions involving CVR Energy, Inc. including, but not limited to, those in which its controlling shareholder or others may participate or direct (including by providing financing to CVR Energy, Inc. or otherwise) and potential strategic transactions involving CVR Partners, LP in which CVR Energy, Inc. or its controlling shareholder or others may participate, including in each case the process of exploring any such transaction and potentially completing any such transaction, including the costs thereof and the risk that any such transaction may not achieve any or all of any anticipated benefits or be completed at all;
•instability and volatility in the capital and credit markets;
•restrictions in our debt agreements;
•our ability to refinance our debt on acceptable terms or at all;
•asset impairments and impacts thereof;
•the outcome of any legal proceedings involving or investigations of our controlling shareholder or his affiliates;
•our controlling shareholder’s intentions regarding ownership of our common stock, including any acquisitions, dispositions or transactions relating to our common stock;
•the impact of any future pandemic or breakout of infectious disease, and of businesses’ and governments’ responses to such pandemic on our operations, personnel, commercial activity, and supply and demand across our and our customers’ and suppliers’ business;
•the variable nature of CVR Partners, LP’s distributions, including the ability of its general partner to modify or revoke its distribution policy, or to cease making cash distributions on its common units;
•changes in tax and other laws, regulations and policies, including, without limitation, actions of the past, current or future administrations that impact conventional fuel operations or favor renewable energy projects in the United States.;
•changes in CVR Partners, LP’s treatment as a partnership for U.S. federal income or state tax purposes;
•our ability to procure or recover under our insurance policies for damages or losses in full or at all;
•labor supply shortages, labor difficulties, labor disputes or strikes; and
•impacts of any decision to return a unit back to hydrocarbon processing following renewable conversion.
All forward-looking statements contained in this Report only speak as of the date of this Report. We undertake no obligation to publicly update or revise any forward-looking statements to reflect events or circumstances that occur after the date of this Report, or to reflect the occurrence of unanticipated events, except to the extent required by law.
Information About Us
Investors should note that we make available, free of charge on our website at www.CVREnergy.com, our annual reports on Form 10-K, quarterly reports on Form 10-Q, current reports on Form 8-K, and any amendments to those reports as soon as reasonably practicable after we electronically file such material with, or furnish it to, the Securities and Exchange Commission (the “SEC”). We also post announcements, updates, events, investor information and presentations on our website in addition to copies of all recent news releases. We may use the Investor Relations section of our website to communicate with investors. It is possible that the financial and other information posted there could be deemed to be material information. Documents and information on our website are not incorporated by reference herein.
The SEC maintains a website at www.sec.gov that contains reports, proxy and information statements, and other information regarding issuers, including us, that file electronically with the SEC.
Risk Factors Summary
This summary of risks below is intended to provide an overview of the risks we face and should not be considered a substitute for the more fulsome risk factors discussed in this Annual Report on Form 10-K.
Risks Related to Our Entire Business
•Our businesses are, and commodity prices are, cyclical and highly volatile, which could have a material adverse effect on our results of operations, financial condition and cash flows.
•Certain developments in the global oil markets have had, and may continue to have, material adverse impacts on the Company or its customers, suppliers, and other counterparties.
•Our businesses face intense competition.
•Our operations are geographically concentrated, creating exposure to regional economic downturns and seasonal variations for us or our customers, which may affect our production levels, transportation costs, and inventory and working capital levels.
•Our segments depend on significant customers, the loss of which may have a material adverse impact on our results of operations, financial condition and cash flows.
•Public health crises have had, and may continue to have, adverse impacts on our business, financial condition, liquidity or results of operations.
•If licensed technology were no longer available or able to be licensed economically or at all, our business may be adversely affected.
•Compliance with and changes in environmental laws, rules, and regulations, including those related to climate change and the ongoing “energy transition”, may adversely affect our business.
•Unplanned or emergency partial or total shutdowns of our facilities could cause property damage and a material decline in production that may not be fully insured, which may have a material adverse effect on our business.
•We could incur significant costs in cleaning up contamination at or associated with our facilities.
•Regulations concerning the transportation, storage, and handling of hazardous materials could result in higher operating costs.
•Acts of terror or sabotage, threats of war, armed conflict or war or trade wars may have an adverse impact on our business.
•Adverse weather conditions or other unforeseen developments may negatively affect our business.
•If our access to transportation on which we rely for the supply of our feedstocks and the distribution of our products is interrupted, our inventory and costs may increase and we may be unable to distribute our products efficiently or at all.
•Any interruption in the supply of, or failure of third parties to supply us with, feedstocks to operate our business.
•We may be unable to obtain or renew permits or approvals necessary for our operations.
•Failure to comply with laws and regulations regarding employee and process safety could adversely affect our business.
•Our business may suffer due to a skilled labor shortage or the departure of any of our key employees.
•A portion of our workforce is unionized, and we are subject to the risk of labor disputes, shutdowns or strikes.
•We are subject to cybersecurity risks and may experience cyber incidents resulting in disruption or harm to our businesses.
•Changes in privacy, cybersecurity and data protection laws could result in harm to our business.
•An increase in inflation could have adverse effects on our results of operations.
Risks Related to the Petroleum and Renewables Segments
•If our Petroleum Segment loses the benefit of a crude oil supply agreement or is unable to gather crude oil in the regions in which we operate, our exposure to the risks associated with volatile crude oil prices may increase, crude oil transportation costs could increase and our liquidity may be reduced.
•Compliance with the RFS could have a material adverse effect on our business.
•Changes in our credit profile could have a material adverse effect on our business.
•The Petroleum Segment’s commodity derivative strategy and contracts involve certain risks.
•If we are unable to complete capital projects at their expected costs, in a timely manner or at all, or if the market conditions assumed in project economics deteriorate, our business could be adversely affected.
•Investor and market sentiment related to ESG matters could adversely affect our business.
•Our Renewables Segment is highly dependent on government credits, resulting in uncertainty and volatility.
•Tariffs and bans on renewable feedstocks could result in supply restriction and feedstock pricing volatility.
•Our renewables customer base is dependent on some environmental credits only available in certain states, thereby limiting our customer pool.
•Potential Renewables Projects at the Refineries could impact the operations and/or profitability of our Renewables Segment.
Risks Related to the Nitrogen Fertilizer Segment
•Any decline in U.S. agricultural production or limitations on the use of nitrogen fertilizer for agricultural purposes could have a material adverse effect on sales, and on our results of operations, financial condition and cash flows.
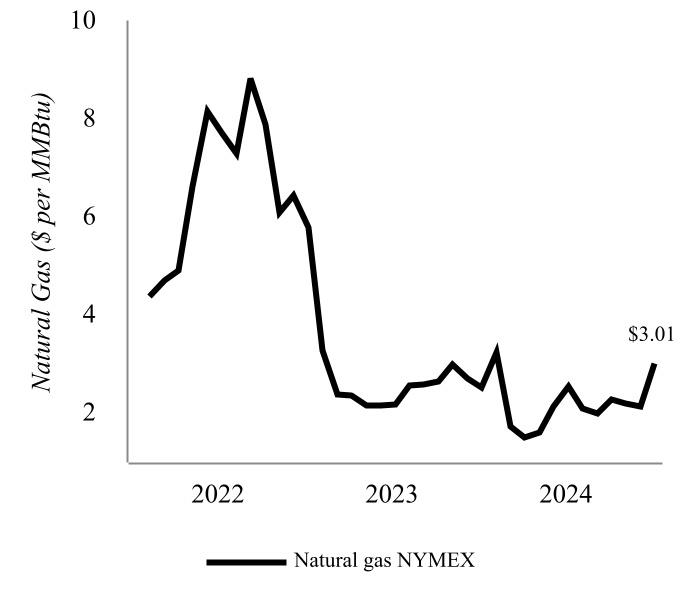
•The market for natural gas has been volatile, and fluctuations in natural gas prices could affect our competitive position.
•Our nitrogen fertilizer business depends in large part on third-party suppliers, which could have a material adverse effect on our business.
•Any liability for accidents involving ammonia or other products we produce or transport causing severe damage to property or injury to the environment and human health could have a material adverse effect on our business.
Risks Related to Our Capital Structure
•Instability and volatility in the capital, credit, and commodity markets could negatively impact our business.
•Our indebtedness may increase and have a material adverse effect on our business.
•Covenants in our debt agreements could limit our ability to run our business.
•We may not be able to generate sufficient cash to service existing indebtedness.
•We are authorized to issue up to a total of 350 million shares of our common stock and 50 million shares of preferred stock, potentially diluting equity ownership of current holders and the share price of our common stock.
•An increase in interest rates will cause our debt service obligations to increase.
Risks Related to Our Corporate Structure
•The Company’s reorganization of its entities and assets could trigger increased costs, complexity and risks.
•We are a holding company and depend upon our subsidiaries for our cash flow.
•Mr. Carl C. Icahn exerts significant influence over the Company, and his interests or those of Icahn Enterprises L.P. and its affiliates may conflict with the interests of the Company’s other stockholders.
•Our stock price may decline due to sales of shares by Mr. Carl C. Icahn.
•We are a “controlled company” within the meaning of the NYSE rules and, as a result, qualify for, and are relying on, exemptions from certain corporate governance requirements.
•We have various mechanisms in place to discourage takeover attempts, which may reduce or eliminate our stockholders’ ability to sell their shares for a premium in a change of control transaction.
•Compliance with and changes in the tax laws could adversely affect our performance.
Risks Related to Our Ownership in CVR Partners
•If CVR Partners were to be treated as a corporation for U.S. federal income tax purposes or if it becomes subject to entity-level taxation for state tax purposes, the value of the common units held by us could be substantially reduced.
•We may have liability to repay distributions that are wrongfully distributed to us.
•The general partner of CVR Partners owes a duty of good faith to public unitholders, which could cause them to manage their respective businesses differently than if there were no public unitholders.
•CVR Partners is managed by the executive officers of its general partner, who are employed by and also serve as part of the senior management team of the Company. Conflicts of interest could arise as a result of this arrangement.
General Risks Related to CVR Energy
•The acquisition, expansion and investment strategy of our businesses involves significant risks.
•We are subject to the risk of becoming an investment company.
•Internally generated cash flows and other sources of liquidity may not be adequate for the capital needs of our businesses.
•Our ability to pay dividends on our common stock is subject to market conditions and numerous other factors.
PART I
Part I should be read in conjunction with “Management’s Discussion and Analysis of Financial Condition and Results of Operations” in Part II, Item 7, and our consolidated financial statements and related notes thereto in Part II, Item 8 of this Report.
Item 1. Business
Overview
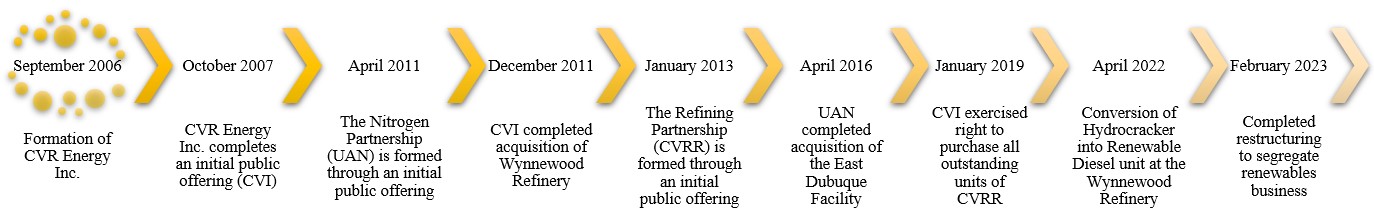
CVR Energy, Inc. is a diversified holding company, formed in September 2006, primarily engaged in the petroleum refining and marketing industry, the renewable fuels industry, and the nitrogen fertilizer manufacturing industry through its interest in CVR Partners, LP, a publicly traded limited partnership (“CVR Partners”). As used in this Annual Report on Form 10-K, the terms “CVR Energy”, the “Company”, “we”, “us”, or “our” generally include the Company’s subsidiaries, including CVR Partners and its subsidiaries, as consolidated subsidiaries of the Company, unless otherwise noted or implied.
Effective with this Report and due to the prominence of the renewables business relative to the Company’s overall 2024 performance, the Company has revised its reportable segments to reflect a new reportable segment – Renewables. The Renewables Segment includes the operations of the renewable diesel unit and renewable feedstock pretreater at the refinery located in Wynnewood, Oklahoma. Results of the Renewables Segment were not previously allocated or aggregated to our reportable segments, but were reflected in our consolidated results of operations.
As a result, as of December 31, 2024, we had three reportable segments as follows:
•Petroleum Segment includes the refining and marketing of high value transportation fuels which consist of gasoline, diesel, jet fuel, and distillates. The Petroleum Segment also includes activities related to crude gathering and logistics that support the refinery operations.
•Renewables Segment includes the refining of renewable feedstocks, such as soybean oil, corn oil, and other renewable feedstocks, into renewable diesel and marketing of renewables products.
•Nitrogen Fertilizer Segment includes the production and distribution of nitrogen fertilizer products, primarily in the form of ammonia and urea ammonium nitrate (“UAN”), for the farming industry.
Refer to “Petroleum”, “Renewables”, and “Nitrogen Fertilizer” below and Part II, Item 8, Note 15 (“Business Segments”) for further details on our reportable segments.
Our common stock is listed on the New York Stock Exchange (“NYSE”) under the symbol “CVI”, and CVR Partners’ common units are listed on the NYSE under the symbol “UAN”.
As of December 31, 2024, Icahn Enterprises L.P. and its affiliates, including Mr. Carl C. Icahn (collectively, “IEP”), owned approximately 66% of our outstanding common stock. As of December 31, 2024, CVR Energy owned the general partner and approximately 37% of the outstanding common units representing limited partner interests in CVR Partners; public common unitholders and IEP held the remaining approximately 61% and 2% of the outstanding common units of CVR Partners, respectively. On January 8, 2025, IEP acquired via cash tender offer a total of 878,212 additional shares at a price of $18.25 per share, increasing its ownership percentage of CVR Energy’s outstanding common stock to approximately 67%.
Our History
The following graphic depicts the Company’s history and key events that have occurred since the Company’s formation.
Petroleum
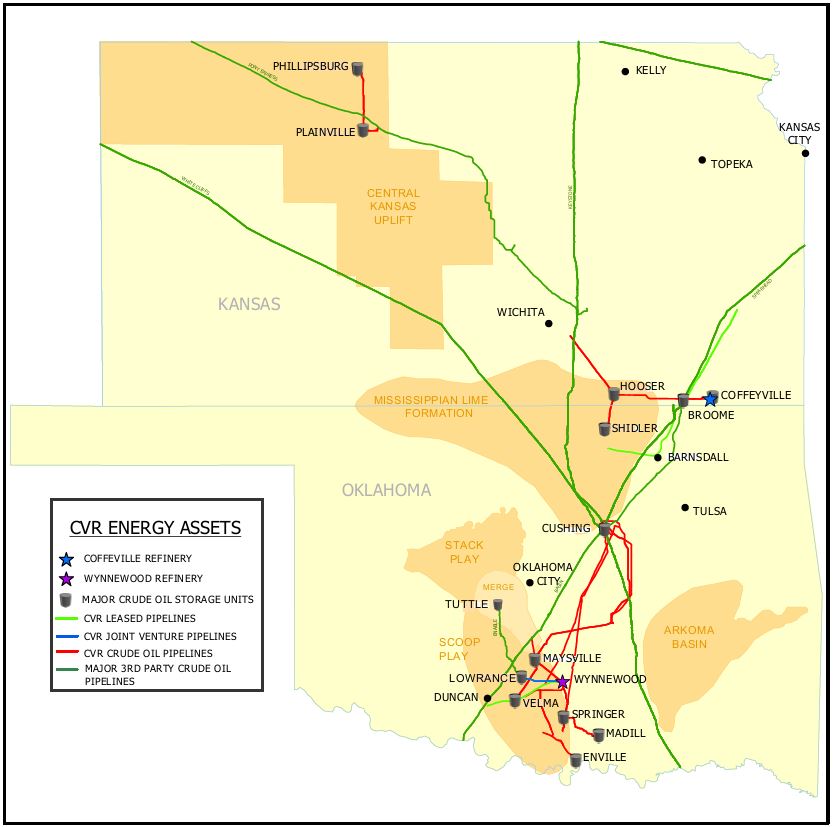
Our Petroleum Segment is composed of the assets and operations of two refineries located in Coffeyville, Kansas and Wynnewood, Oklahoma and supporting crude gathering and logistics assets in the region.
Facilities
Coffeyville Refinery - Various of our subsidiaries own or operate, as applicable, a complex full coking, medium-sour crude oil refinery in southeast Kansas, approximately 100 miles from Cushing, Oklahoma (“Cushing”) with a name plate crude oil capacity of 132,000 bpd (the “Coffeyville Refinery”). The major operations of the Coffeyville Refinery include fractionation, catalytic cracking, hydrotreating, reforming, coking, isomerization, alkylation, sulfur recovery, and propane and butane recovery operating units. The Coffeyville Refinery benefits from significant refining unit redundancies, which include two crude oil distillation units, two vacuum towers, two sulfur recovery units, and five hydrotreating units. These redundancies allow the Coffeyville Refinery to continue to receive and process crude oil even if one tower requires maintenance without having to shut down the entire refinery.
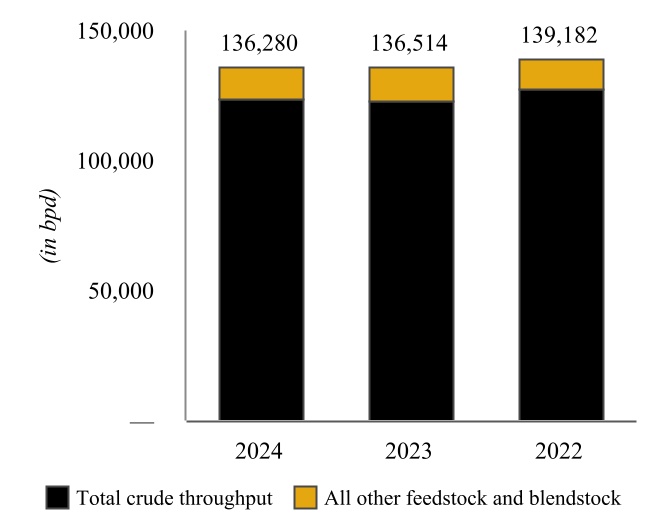
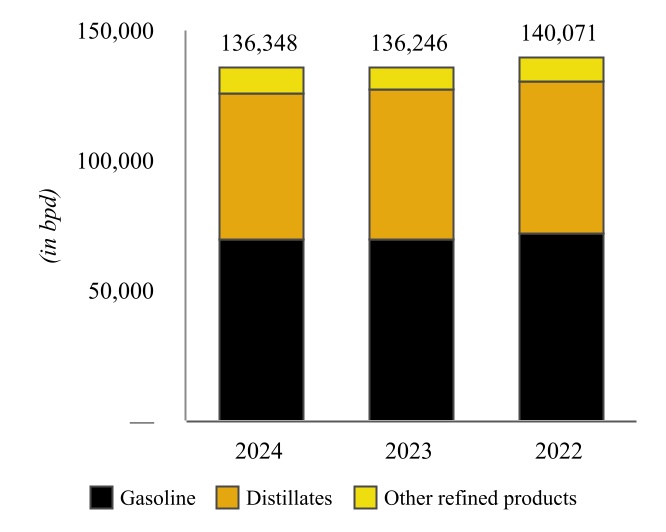
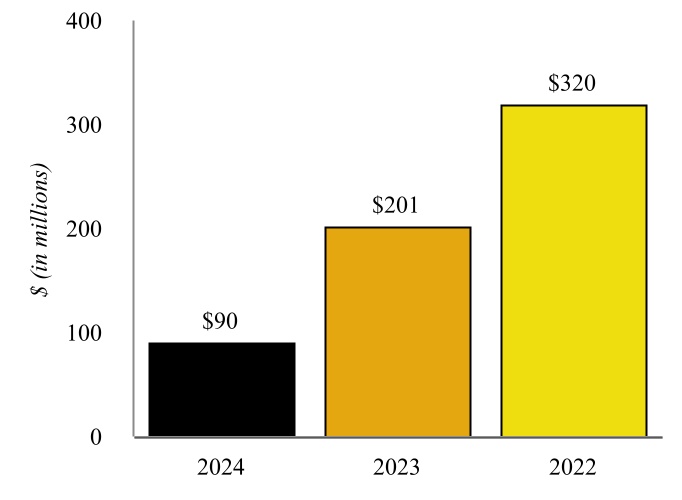
| | | | | | | | |
| Coffeyville Refinery Throughput | | Coffeyville Refinery Production |
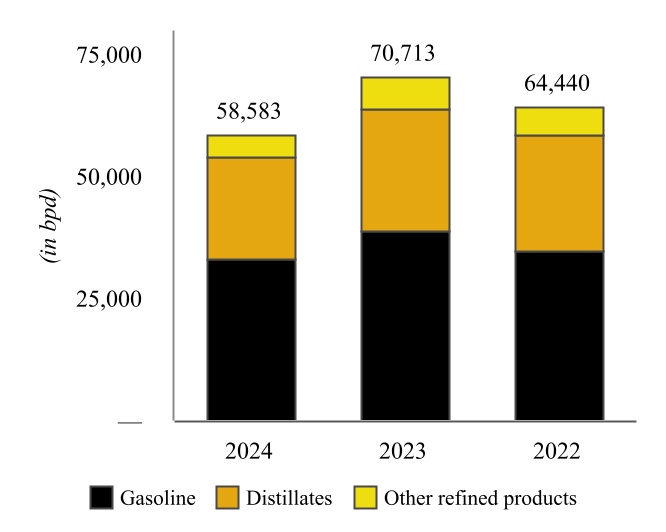
Wynnewood Refinery - Various of our subsidiaries own or operate, as applicable, a complex crude oil refinery in Wynnewood, Oklahoma, approximately 65 miles south of Oklahoma City, Oklahoma and approximately 130 miles from Cushing (the “Wynnewood Refinery” and together with the Coffeyville Refinery, the “Refineries”). The Wynnewood Refinery has a name plate crude oil capacity of 74,500 bpd with major operations including fractionation, fluid catalytic cracking, hydrotreating, reforming, alkylation, sulfur recovery, and propane and butane recovery. Similar to the Coffeyville Refinery, the Wynnewood
Refinery benefits from unit redundancies, including two crude oil distillation units and two vacuum towers as well as four hydrotreating units.
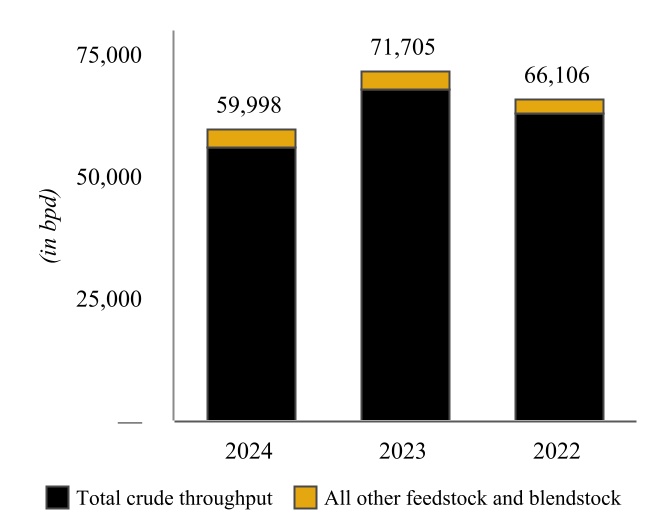
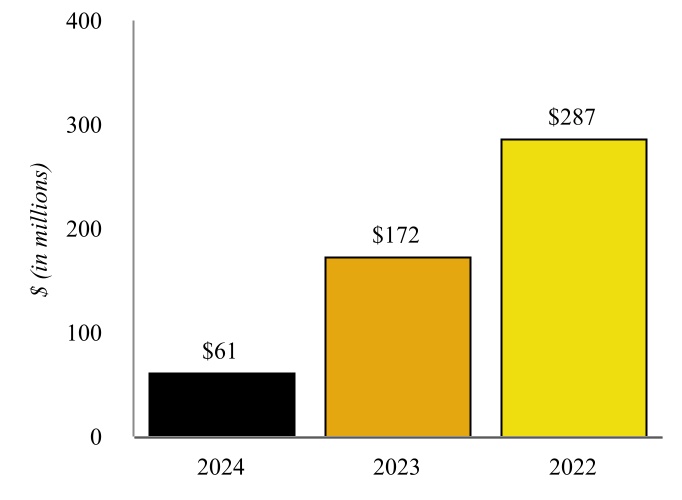
| | | | | | | | |
| Wynnewood Refinery Throughput | | Wynnewood Refinery Production |
Supply
The Coffeyville Refinery has the capability to process a variety of crude oils ranging from heavy sour to light sweet crude oil. Currently, the Coffeyville Refinery crude oil slate consists of a blend of mid-continent domestic grades and various Canadian medium and heavy sours and other similarly sourced crudes. Other blendstocks and intermediates include ethanol, biodiesel, normal butane, natural gasoline, alkylation feeds, naphtha, gas oil, and vacuum tower bottoms. The Wynnewood Refinery has the capability to process a variety of crude oils ranging from medium sour to light sweet crude oil. Isobutane, gasoline components, and normal butane blendstocks are also typically used.
In addition to the use of third-party pipelines, we have an extensive gathering system consisting of logistics assets that are owned, leased, or part of a joint venture operation. These assets include the following:
| | | | | | | | | | | | | | | | | |
| | | As of December 31, 2024 |
| Pipeline Segment | | Length (miles) | | Capacity (bpd) |
| Joint Ventures: | | | | |
| Enable South Central Pipeline (“Enable JV”) (1) | | 26 | | 80,000 |
| Owned Pipelines: | | | | |
| East Tank Farm to Refinery 16” (2) | | 2 | | 156,000 |
| Broome to East Tank Farm 16” (2) | | 19 | | 168,000 |
| Broome to East Tank Farm 12” (2) | | 19 | | 28,000 |
| Enable to Cushing 8” & 10” (Red River) | | 108 | | 41,000 |
| Maysville to Springer 8” (Red River) | | 45 | | 17,000 |
| Springer to Cushing 6” & 8” | | 125 | | 23,000 |
| Hooser to Broome 8” | | 43 | | 12,000 |
| Brothers to Hooser 8” | | 20 | | 7,000 |
| CapturePoint to Shidler 6” | | 3 | | 16,000 |
| Madill to Springer 6” | | 32 | | 18,000 |
| Maysville to Cushing 6” & 8” | | 124 | | 12,000 |
| Velma to Maysville 6” & 8” | | 29 | | 13,000 |
| Plainville to Natoma 6” | | 11 | | 7,000 |
| Shidler to Hooser 4” | | 23 | | 7,000 |
| Phillipsburg to Plainville 6” | | 36 | | 8,000 |
| Enville to Wynnewood 4” & 6” | | 74 | | 6,000 |
| | | | | |
| Leased Pipelines: | | | | |
| Cushing to Broome 16” (“Midway Pipeline”) (3) | | 99 | | 131,000 |
| Kelly to Caney Jct. 8” | | 66 | | 13,000 |
| Humboldt to Broome 8” | | 63 | | 6,000 |
| | | | | |
(1)Through our subsidiaries, we own a 40% interest in Enable JV. While we have the ability to exercise influence through our participation on the board of directors of Enable JV, we do not serve as the day-to-day operator. We have determined that this entity should not be consolidated and is accounted for under the equity method. Refer to Part II, Item 8, Note 5 (“Equity Method Investments”) of this Report for further discussion.
(2)In support of our Coffeyville Refinery, we operate a tank storage facility in close proximity to the Coffeyville Refinery (the “East Tank Farm”).
(3)On December 23, 2024, a subsidiary of the Company sold the 50% limited liability company interest (the “Membership Interests”) it owned in Midway Pipeline LLC (“Midway”) to Plains Pipeline, L.P. (“Plains”) pursuant to an Assignment and Assumption of Units in exchange for cash consideration of approximately $90 million. Midway operates a crude oil pipeline that connects the Broome Station facility to Cushing, Oklahoma (the “Midway Pipeline”). Refer to Part II, Item 8, Note 5 (“Equity Method Investments”) and Note 6 (“Leases”) for further details.
For the acquisition of crude oil within close proximity of the Refineries, we operate a fleet of 116 trucks as of December 31, 2024 and have contracts with third-party trucking fleets to acquire and deliver crude oil to our pipeline systems
or directly to the Refineries for consumption. For the year ended December 31, 2024, the gathering system, which includes the pipelines outlined above and our trucking operations, supplied approximately 71% and 98% of the Coffeyville and Wynnewood Refineries’ crude oil demand, respectively. Regionally sourced crude oils delivered to the Refineries usually have a transportation cost advantage compared to other domestic or international crudes given the Refineries’ proximity to the producing areas. However, sometimes slightly heavier and more sour crude oils may offer improved economics to the Refineries, notwithstanding the higher transportation costs. The regionally-sourced crude oils we purchase are light and sweet enough to allow the Refineries to blend higher percentages of lower cost crude oils, such as heavy Canadian sour, to optimize economics within operational constraints.
Crude oils sourced outside of our gathering system are delivered to Cushing by various third-party pipelines, including the Keystone and Spearhead pipelines, on which we can be subject to proration, and subsequently to the Broome Station facility via the Midway Pipeline. From the Broome Station facility, crude oil is delivered to the Coffeyville Refinery via the Petroleum Segment’s 170,000 bpd pipeline system. Crude oils are delivered to the Wynnewood Refinery through third-party and joint venture pipelines and received into storage tanks at terminals located within or near the refinery. We also lease tank storage totaling 2.2 million barrels, including 2.0 million barrels at Cushing.
The Coffeyville Refinery is connected to the mid-continent natural gas liquid commercial hub at Conway, Kansas by the inbound Enterprise Pipeline Blue Line, through which natural gas liquid blendstocks, such as butanes and natural gasoline, are sourced and delivered directly into the refinery. In addition, the Coffeyville Refinery’s proximity to Conway, Kansas provides access to natural gas liquid and liquid petroleum gas fractionation and storage capabilities.
Through the crude oil and other feedstock supply operations outlined above, and the associated markets available to us, we are able to source and refine crude oils from different locations and of different compositions when it is economically advantageous for us to do so.
Marketing and Distribution
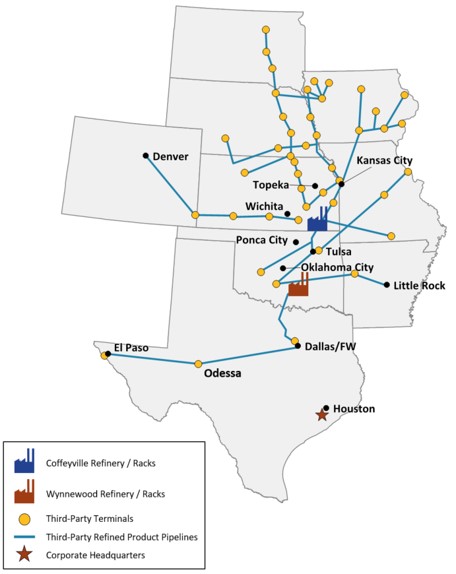
Products produced at our Coffeyville Refinery are generally sold in the central mid-continent area through rack marketing, which is the supply of product through tanker trucks and railcars directly to customers located in close geographic proximity to
the refinery and to customers at terminals on third-party refined products distribution systems; and bulk sales into the mid-continent markets and other destinations utilizing third-party product pipeline networks.
Products produced at our Wynnewood Refinery are generally shipped via pipeline, railcar, and truck, focusing its efforts in Oklahoma and parts of Arkansas, as well as eastern Missouri. The pipeline system connected to our Wynnewood Refinery is capable of multi-directional flow, providing access to Texas as well as adjoining states with pipeline connections. Jet fuel produced at the Wynnewood Refinery is sold to the U.S. Department of Defense via the segregated truck rack at the Wynnewood Refinery.
Customers
Customers for the petroleum products produced at the Refineries primarily include retailers, railroads, farm cooperatives, and other refiners/marketers in Group 3 of the PADD II region because of their relative proximity to the Refineries and pipeline access. We typically sell bulk products to long-standing customers at spot market prices based on a Group 3 basis differential to prices quoted on the New York Mercantile Exchange (“NYMEX”) subject to other terms or adjustments, which are reported by industry market-related indices such as Platts and Oil Price Information Service.
Rack sales occur at posted prices, which are impacted by the competitive dynamics in Group 3 of the PADD II region, among other factors. In addition, we sell hydrogen and by-products of our refining operations in Coffeyville, Kansas, such as pet coke, to an affiliate, Coffeyville Resources Nitrogen Fertilizer, LLC (“CRNF”), which is an indirect, wholly owned subsidiary of CVR Partners. The Petroleum Segment’s top customer represented 13% of its net sales for the year ended December 31, 2024, and its top two customers represented 27% and 25% of its net sales for the years ended December 31, 2023 and 2022, respectively.
Competition
Our Petroleum Segment competes primarily on the basis of price, reliability of supply, availability of multiple grades of products, and location. The principal competitive factors affecting its refining operations are cost of crude oil and other feedstocks, refinery complexity, refinery efficiency, refinery product mix, product distribution and transportation costs, and costs of compliance with government regulations, including the Renewable Fuel Standard (“RFS”). The locations of the Refineries generally provide us with a reliable supply of crude oil and a transportation cost advantage over our competitors. We primarily compete against CHS Inc.’s McPherson Refinery; HF Sinclair Corporation’s El Dorado and Tulsa Refineries; Phillips 66 Company’s Ponca Refinery; and Valero Energy Corporation’s Ardmore Refinery in the mid-continent region. In addition to these refineries, we compete against trading companies, as well as other refineries located outside the region that are linked to the mid-continent market through product pipeline systems, including those near the Gulf Coast, the Great Lakes, and the Texas panhandle regions.
Seasonality
Our Petroleum Segment experiences seasonal fluctuations as demand for gasoline products is generally higher during the summer months than during the winter months due to seasonal increases in highway traffic and road construction work. Demand for diesel fuel is higher during the planting and harvesting seasons. As a result, our results of operations for the Petroleum Segment for the first and fourth calendar quarters are generally lower compared to our results for the second and third calendar quarters. In addition, unseasonably cool weather in the summer months and/or unseasonably warm weather in the winter months in the markets in which we sell petroleum products can impact the demand for gasoline and diesel fuel.
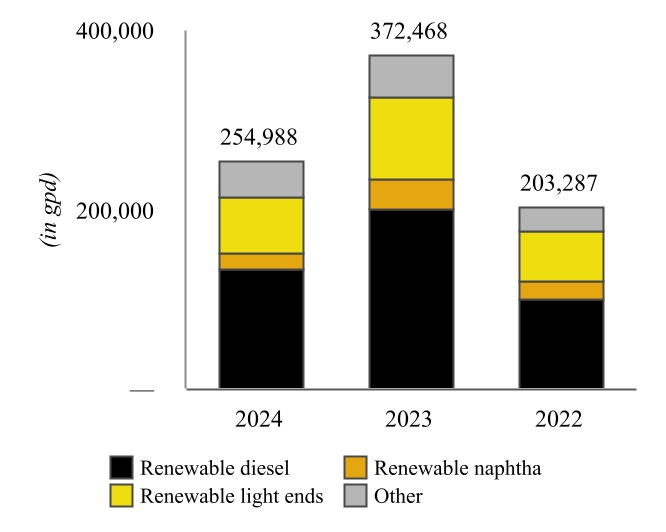
Renewables
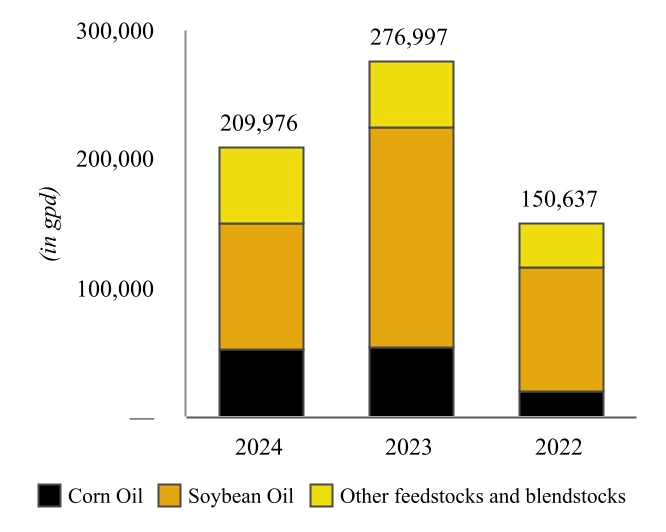
Our Renewables Segment is composed of the renewable diesel unit (“RDU”) and renewable feedstock pretreater (“PTU”) at the Wynnewood Refinery (collectively, the “Wynnewood Renewable Facility”).
Facilities
In April 2022, we completed a project at our Wynnewood Refinery that converted the refinery’s hydrocracker to a RDU capable of producing approximately 80 million gallons of renewable diesel per year, which we have revised down due to current catalyst limitations. The Wynnewood Renewable Facility has a name plate capacity of 252,000 gallons per day (“gpd”)
and is capable of being returned to hydrocarbon service primarily through a catalyst change. The produced renewable diesel currently generates federal renewable identification numbers (“RINs”), which are sold to our Petroleum Segment to help meet its RFS compliance obligations, as discussed in “Environmental Matters - Renewable Fuel Standard”. Further, as a low-carbon fuel, renewable diesel produced at the Wynnewood Renewable Facility generates LCFS credits for our customers who transport such product to states with low carbon fuel programs, primarily to California.
In the fourth quarter of 2023, the PTU project at the Wynnewood Refinery was mechanically complete and became operational during the first quarter of 2024. The PTU is intended to lower our feedstock costs by processing a wider variety of feedstocks. This flexibility results in more economic purchasing of feedstocks.
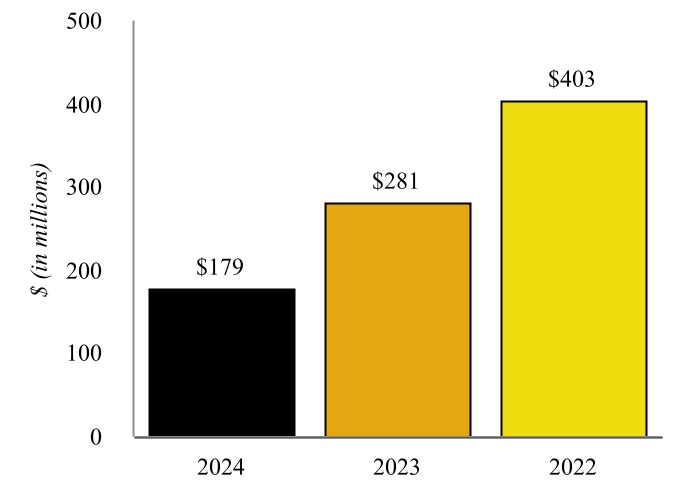
| | | | | | | | |
| Wynnewood Renewable Facility Throughput | | Wynnewood Renewable Facility Production |
Supply
All feedstock required for renewable diesel production is purchased in connection with a third-party supply agreement under which the third-party is responsible for the procurement and delivery of feedstock to the Wynnewood Renewable Facility. Its strategic and central position in an agriculturally rich region, coupled with an extensive network of transportation infrastructure, offers ease of access to a wide range of renewable feedstocks.
Marketing and Distribution
The products produced at the Wynnewood Renewable Facility are generally sold through two third-party offtake agreements. Under these agreements, the third parties have agreed to purchase substantially all of our renewable diesel produced, which is delivered primarily via railcar. The remaining products produced at the Wynnewood Renewable Facility are sold to and consumed by our Petroleum Segment.
Competition
We face competition from renewable fuel producers and others that have been offering or might offer products with lower emissions. In connection with the sourcing of our renewable feedstocks, we face not only competition from consumers in the energy sector, such as renewable fuel producers, but also from non-energy related consumers, such as food producers. This increased competition from non-traditional food producers creates a unique dynamic of competing priorities for food versus fuel.
Governmental Credits
Our Renewables Segment is also highly dependent upon government subsidies, such as tax and carbon credits. Prior to the expiration of the Biodiesel Blenders’ Tax Credit (“BTC”) on December 31, 2024, we received a $1-per-gallon tax incentive for renewable diesel mixture produced and sold. The Inflation Reduction Act of 2022 (the “Inflation Reduction Act”) created the
Clean Fuel Production Credit (“PTC”), which provides for a tax credit for domestic production and sale of clean transportation fuels, including renewable diesel beginning in 2025. While formal IRS rule making has not been issued, draft IRS guidance suggests that the value of the PTC for renewable diesel we produce and sell will be significantly lower than the value of the BTC. In January 2025, President Trump signed executive orders that, among other things, paused the disbursement of funds appropriated through the Inflation Reduction Act. Whether or how the Trump Administration or Congress will seek to continue or reverse course on governmental initiatives like these cannot be predicted at this time.
Nitrogen Fertilizer
Our Nitrogen Fertilizer Segment is composed of the assets and operations of CVR Partners, including two nitrogen fertilizer manufacturing facilities located in Coffeyville, Kansas and East Dubuque, Illinois.
Facilities
Coffeyville Fertilizer Facility - We own and operate a nitrogen fertilizer production facility in Coffeyville, Kansas that includes a gasifier complex having a capacity of 89 million standard cubic feet per day of hydrogen, a 1,300 ton per day capacity ammonia unit and a 3,100 ton per day capacity UAN unit (the “Coffeyville Fertilizer Facility”). The Coffeyville Fertilizer Facility is the only nitrogen fertilizer facility in North America that utilizes pet coke, which is purchased from our Coffeyville Refinery and third parties, in a gasification process to produce hydrogen for use in manufacturing nitrogen fertilizer.
East Dubuque Fertilizer Facility - We own and operate a nitrogen fertilizer production facility in East Dubuque, Illinois that includes a 1,075 ton per day capacity ammonia unit and a 950 ton per day capacity UAN unit (the “East Dubuque Fertilizer Facility”). The East Dubuque Fertilizer Facility has the flexibility to vary its product mix, thereby enabling it to upgrade a portion of its ammonia production into varying amounts of UAN and nitric acid, depending on market demand, pricing, and storage availability. The East Dubuque Fertilizer Facility utilizes natural gas, which is purchased from third parties, to produce hydrogen for use in manufacturing nitrogen fertilizer.
Agriculture, Commodities and Seasonality
Nutrients are depleted in soil over time and, therefore, must be replenished through fertilizer application. Nitrogen is the most quickly depleted nutrient and must be replenished every year, whereas phosphate and potassium can be retained in soil for up to three years. Plants require nitrogen in the largest amounts, and it accounts for approximately 58% of primary fertilizer consumption on a nutrient ton basis, per the International Fertilizer Association (“IFA”).
The three primary forms of nitrogen fertilizer used in the United States are ammonia, urea, and UAN. Unlike ammonia and urea, UAN can be applied throughout the growing season and can be applied in tandem with pesticides and herbicides, providing farmers with flexibility and cost savings. As a result of these factors, UAN typically commands a premium price to urea and ammonia, on a nitrogen equivalent basis.
The nitrogen fertilizer products we produce are globally traded commodities and are subject to price competition. The customers for CVR Partners’ products make their purchasing decisions principally on the basis of delivered price and, to a lesser extent, on customer service and product quality. The selling prices of its products fluctuate in response to global market conditions, feedstock costs, and changes in supply and demand.
Because the Nitrogen Fertilizer Segment primarily sells agricultural commodity products, its business is exposed to seasonal fluctuations in demand for nitrogen fertilizer products in the agricultural industry. In addition, the demand for fertilizers is affected by the aggregate crop planting decisions and fertilizer application rate decisions of individual farmers who make planting decisions based largely on the prospective profitability of a harvest. The specific varieties and amounts of fertilizer they apply depend on factors like crop prices, farmers’ current liquidity, soil conditions, weather patterns, and the types of crops planted. The Nitrogen Fertilizer Segment typically experiences higher net sales in the first half of the calendar year, which is referred to as the planting season, and its net sales tend to be lower during the second half of each calendar year, which is referred to as the fill season.
Demand
Global demand for fertilizers is driven primarily by grain demand and prices, which, in turn, are driven by population growth, farmland per capita, dietary changes in the developing world, and increased consumption of bio-fuels. Global fertilizer use, consisting of nitrogen, phosphate, and potash, is projected to increase by 1% through 2025 to meet global food demand according to a study funded by the Food and Agricultural Organization of the United Nations.
The United States is the world’s largest exporter of coarse grains, accounting for 30% of world exports and 26% of world production for the fiscal year ended December 31, 2024, according to the United States Department of Agriculture (“USDA”). A substantial amount of nitrogen is consumed in production of these crops to increase yield. Fertecon Limited, an agency which provides market information and analysis on fertilizers and fertilizer raw materials, estimates indicate that China, India, and the United States are the top consumers representing 27%, 17%, and 10% of total global nitrogen fertilizer consumption for 2024, respectively.
North American nitrogen fertilizer producers predominantly use natural gas as their primary feedstock. Over the last five years, U.S. oil and natural gas reserves have increased significantly due to, among other factors, advances in extracting shale oil and gas, as well as improvements in drilling efficiencies and reduced production costs. As a result, North America has been a low-cost region for nitrogen fertilizer production.
Raw Material Supply
A key ingredient used in the manufacturing process of our nitrogen fertilizer products is hydrogen, which is sourced from pet coke gasification or natural gas. CVR Partners benefits from logistical advantages for both feedstocks, ensuring a stable and secure supply chain. A substantial part of our pet coke requirements are supplied by our adjacent Coffeyville Refinery pursuant to the Coffeyville Master Services Agreement (the “Coffeyville MSA”). In 2024, 2023, and 2022, our supply of pet coke from the Coffeyville Refinery was approximately 46%, 43%, and 47%, respectively. Historically, the Coffeyville Fertilizer Facility has obtained the remainder of its pet coke requirements through third-party contracts with delivery provided by truck, railcar, or barge.
We are generally able to purchase natural gas at competitive prices due to the connection of our East Dubuque Fertilizer Facility to the Northern Natural Gas interstate pipeline system, which is within one mile of the facility, and a third-party owned and operated pipeline. The pipelines are connected to a third-party distribution system at the Chicago Citygate receipt point and at the Hampshire interconnect from which natural gas is transported to the East Dubuque Fertilizer Facility.
Marketing and Distribution
Our Nitrogen Fertilizer Segment primarily markets UAN products to agricultural customers and ammonia products to agricultural and industrial customers. UAN and ammonia, including freight, accounted for approximately 66% and 25%, respectively, of our Nitrogen Fertilizer Segment’s total net sales for the year ended December 31, 2024.
CVR Partners distributes its nitrogen fertilizer products via railcars, primarily using the Union Pacific or Burlington Northern Santa Fe railroads, trucks for direct shipment to customers, and barges, as it has direct access to a barge dock on the Mississippi River. If delivered by truck, products are most commonly sold on a shipping point basis, and freight is normally arranged by the customer. If delivered by railcar, products are most commonly sold on a destination point basis, and we typically arrange the freight. In addition, given the East Dubuque Fertilizer Facility’s advantaged location in the heart of the agriculture country, CVR Partners ships substantially all of its products within 200 miles of the facility.
Customers
Retailers and distributors are the main customers for UAN and, more broadly, the industrial and agricultural sectors are the primary recipients of our ammonia products. Given the nature of our nitrogen fertilizer business, and consistent with industry practice, we sell our products on a wholesale basis under a contract or by purchase order. Contracts with customers generally contain fixed pricing and have terms of less than one year. The Nitrogen Fertilizer Segment’s top customer represented 14% of its net sales for the year ended December 31, 2024, and its top two customers represented 25% and 30% of its net sales for the years ended December 31, 2023 and 2022, respectively.
Competition
Our Nitrogen Fertilizer Segment produces globally traded commodities and has competitors in every region of the world, with barge and rail distribution fostering healthy competition throughout the United States. The industry is dominated by price considerations, which are driven by raw material and transportation costs, currency fluctuations, trade barriers, and regulators. Our Nitrogen Fertilizer Segment has experienced, and expects to continue to experience, significant levels of competition from domestic and foreign nitrogen fertilizer producers, many of whom have significantly greater financial and other resources. Farming activities intensify in the United States during the spring and fall fertilizer application periods, and geographic proximity to these activities is also a significant competitive advantage for domestic producers. We seek to manage our manufacturing and distribution operations to best serve our customers during these critical periods.
Subject to location and other considerations, our major domestic competitors in the nitrogen fertilizer business generally includes CF Industries Holdings, Inc., which sells significantly more nitrogen fertilizers in the United States than other industry participants; Nutrien Ltd.; Koch Fertilizer Company, LLC; and LSB Industries, Inc. Domestic customers generally demonstrate sophisticated buying tendencies that include a focus on cost and service. We also encounter competition from producers of fertilizer products manufactured in foreign countries, including the threat of increased production capacity. In certain cases, foreign producers of fertilizer that export to the United States may be subsidized by their respective governments which could put us at a competitive disadvantage.
Environmental Matters
Our businesses are subject to extensive and frequently changing federal, state, and local environmental laws, rules, and regulations governing the emission and release of regulated substances into the environment, the transportation, storage, and disposal of waste, the treatment and discharge of wastewater and stormwater, and the storage, handling, use, and transportation of petroleum, renewable and nitrogen fertilizer products, and the characteristics and composition of gasoline, diesel and aviation fuels, renewable fuels, UAN, and ammonia. These laws and regulations and the enforcement thereof impact our segments and their operations by imposing:
•restrictions on operations or the need to install and operate enhanced or additional control and monitoring equipment;
•liability for the investigation and remediation of contaminated soil and groundwater at current and former facilities (if any) and for off-site waste disposal locations; and
•specifications for the products marketed by the Petroleum, Renewables, and Nitrogen Fertilizer Segments, primarily gasoline, diesel and aviation fuels, renewable diesel, UAN, and ammonia.
Our operations require numerous permits, licenses, and authorizations. Failure to comply with these permits, licenses, authorizations, or environmental laws, rules, and regulations could result in fines, penalties, or other sanctions or liabilities or a revocation of our permits, licenses, or authorizations. In addition, the laws, rules, and regulations to which we are subject are often evolving and many of them have or could become more stringent or have or could become subject to more stringent interpretation or enforcement by federal or state agencies or courts. These laws and regulations could result in increased capital, operating, and compliance costs.
Recent Greenhouse Gas Footprint Reduction Efforts
The Nitrogen Fertilizer Segment has generated carbon offset credits from voluntary nitrous oxide (“N2O”) abatement at its Coffeyville Fertilizer Facility since October 2020, with similar N2O abatement efforts at its East Dubuque Fertilizer Facility since June 2011. From 2020 to 2023, the N2O abatement systems at the East Dubuque Fertilizer Facility’s two nitric acid plants and the Coffeyville Fertilizer Facility’s nitric acid plant have abated, on average, the annual release of approximately 277,000 and 340,000 metric tons of carbon dioxide-equivalent (“CO2e”), respectively.
CVR Partners’ N2O abatement projects are registered with the Climate Action Reserve (the “Reserve”), a carbon offset registry for the North American market. The Reserve employs standards and an independent third-party verification process to issue its carbon credits, known as Climate Reserve Tonnes.
The Nitrogen Fertilizer Segment also sequesters carbon dioxide that is not utilized for urea production at its Coffeyville Fertilizer Facility by capturing and purifying the CO2 as part of its manufacturing process. Certain carbon oxide capture and
sequestration activities conducted at or in connection with the Coffeyville Fertilizer Facility qualify under the Internal Revenue Service (“IRS”) safe harbor described in Revenue Procedure 2020-12 for certain tax credits available to joint ventures under Section 45Q of the Internal Revenue Code of 1986, as amended (“Section 45Q Credits”). In January 2023, the Nitrogen Fertilizer Segment entered into a series of agreements with CapturePoint LLC, an unaffiliated third-party (“CapturePoint”), and certain unaffiliated third-party investors intended to qualify under the IRS safe harbor described in Revenue Procedure 2020-12 for certain joint ventures that are eligible to claim Section 45Q Credits and allow us to monetize Section 45Q Credits we expect to generate from January 6, 2023 until March 31, 2030.
By combining our nitrous oxide abatement and CO2 sequestration activities, we reduced our CO2e footprint by over 1.3 million metric tons in 2023. In addition, our Coffeyville Fertilizer Facility is uniquely qualified to produce hydrogen and ammonia that could be certified ‘blue’ to a market that is increasingly demanding reduced carbon footprints. These greenhouse gas footprint reduction efforts support our core Values of Environment and Continuous Improvement, and our goal of continuing to produce nitrogen fertilizers that produce crops that help to feed the world’s growing population in the most environmentally responsible way possible.
The Federal Clean Air Act (“CAA”)
The CAA and its implementing regulations, as well as state laws and regulations governing air emissions, affect our businesses. Direct impacts may occur through the CAA’s permitting requirements and/or emission control and monitoring requirements relating to specific air pollutants, as well as the requirement to maintain a risk management program to help prevent accidental releases of certain regulated substances. The CAA affects our businesses by extensively regulating the air emissions of sulfur dioxide (“SO2”), volatile organic compounds, nitrogen oxides, and other substances, including those emitted by mobile sources, which are direct or indirect users of our products. Some or all of the regulations promulgated pursuant to the CAA, or any future promulgations of regulations, may require the installation of controls or changes to the Refineries and/or the nitrogen fertilizer facilities (collectively referred to as the “Facilities”) to maintain compliance. If new controls or changes to operations are needed, the costs could be material.
The regulation of air emissions under the CAA requires that we obtain various construction and operating permits and incur capital expenditures for the installation of certain air pollution control devices at our operations. Various standards and programs specific to our operations have been implemented, such as the National Emission Standard for Hazardous Air Pollutants, the New Source Performance Standards, and the New Source Review.
The U.S. Environmental Protection Agency (“EPA”) regulates greenhouse gas (“GHG”) emissions under the CAA. In October 2009, the EPA finalized a rule requiring certain large emitters of GHGs to inventory and report their GHG emissions to the EPA. In accordance with the rule, our Facilities monitor and report our GHG emissions to the EPA. In May 2010, the EPA finalized the “Greenhouse Gas Tailoring Rule”, which established GHG emissions thresholds that determine when stationary sources, such as the Refineries and the Facilities, must obtain permits under the Prevention of Significant Deterioration (“PSD”) and Title V programs of the CAA. Under the rule, facilities already subject to the PSD and Title V programs that increase their emissions of GHGs by a significant amount are required to undergo PSD review and to evaluate and implement air pollution control technology, known as “best available control technology”, to reduce GHG emissions.
On January 20, 2025, under the new Trump Administration the White House issued Executive Order (“EO”) 14154 titled “Unleashing American Energy” that seeks to establish American energy dominance through, among other actions, purported revocation of certain Presidential and regulatory actions, abolishment of certain offices such as the American Climate Corps and the Interagency Working Group on the Social Cost of Greenhouse Gases and other actions including, for example, directives to revise permitting processes, promote domestic mining and energy production and eliminate the "electric vehicle mandate" by ensuring a level regulatory playing field for gasoline-powered automobiles and eliminating subsidies or other incentives for purchasing electric vehicles (“EVs”). Also on January 20, 2025, the White House issued EO 14162, “Putting America First in International Environmental Agreements”, directing the United States’ withdrawal from the Paris Agreement under the United Nations Framework Convention on Climate Change. While we cannot predict exactly how these EOs and their directives will impact our Facilities’ operations, it is possible that they could serve as a catalyst for potential agency action relevant to our business.
Renewable Fuel Standard
Pursuant to the Energy Policy Act of 2005 and Energy Independence and Security Act of 2007, which was intended “to move the United States toward greater energy independence…[and] increase the production of clean renewable fuels,” Congress established the RFS, which requires obligated parties, defined by the EPA as refiners and importers of transportation fuels, to either blend “renewable fuels”, such as ethanol and biofuels, into their transportation fuels or purchase renewable fuel credits, known as renewable identification numbers (“RINs”), in lieu of blending. The RFS established annually increasing volume targets, called Renewable Volume Obligations (“RVOs”), for biomass-based diesel through 2012 and for the remaining three categories of renewable fuel (cellulosic biofuel, advanced biofuel, and total renewable fuel) through 2022. For periods following 2022, the statute directs the EPA to use its “set” authority to determine the RVO based on certain criteria, including the impact of renewable fuels on the environment, energy security, and transportation fuel costs to consumers. On June 21, 2023, the EPA announced its final rule establishing applicable renewable volumes and percentage standards for 2023 through 2025. In the rule, the EPA set the implied conventional renewable volume requirement at 15 billion gallons, which is beyond the “blend wall,” or the point at which the percentage of ethanol required to be blended into the gasoline supply exceeds the level at which most engines can safely run on gasoline blended with ethanol. In addition, for the first time, the EPA established a cellulosic biofuel standard without utilizing the cellulosic waiver and issuing cellulosic waiver credits. The table below reflects, as of the date hereof, the annual RVO under the RFS for the compliance years 2021 through 2025:
| | | | | | | | | | | | | | | | | | | | | | | | | | | | | | | |
| 2021 to 2025 Renewable Volume Obligation % |
| 2021 | | 2022 | | 2023 | | 2024 | | 2025 | | |
| D6 - Ethanol | 7.89 | | | 8.43 | | | 8.57 | | | 8.71 | | | 8.82 | | | |
| D4 - Biodiesel | 2.30 | | | 2.33 | | | 2.58 | | | 2.82 | | | 3.15 | | | |
| D3 - Cellulosic | 0.32 | | | 0.35 | | | 0.48 | | | 0.63 | | | 0.81 | | | |
| D5 - Advanced | 0.31 | | | 0.48 | | | 0.33 | | | 0.34 | | | 0.35 | | | |
| Supplemental Standard | — | | | 0.14 | | | 0.14 | | | — | | | — | | | |
| Total RVO % | 10.82 | | | 11.73 | | | 12.10 | | | 12.50 | | | 13.13 | | | |
Coffeyville Resources Refining & Marketing, LLC (“CRRM”) and Wynnewood Refining Company, LLC (“WRC”, and together with CRRM, the “obligated-party subsidiaries”) have been deemed by EPA to be obligated parties under the RFS. The Wynnewood Refinery has qualified, and is currently expected in the future to qualify, as a “small refinery” defined under the RFS as a refinery with an aggregate daily crude oil throughput no greater than 75,000 barrels. WRC may petition for and receive small refinery exemptions (“SREs”) under the RFS should it be able to establish it suffered disproportionate economic hardship, which WRC believes it has already established for the compliance periods 2017 through 2024. Our obligated-party subsidiaries are not able to meet the majority of their annual RVOs through blending, so, unless their RVOs are waived or exempted, they have had to and currently expect to be required in the future to purchase RINs on the open market from third parties, including but not limited to its affiliates who generate RINs through the Wynnewood Renewable Facility. Our obligated-party subsidiaries have also purchased cellulosic waiver credits in years in which they are made available by the EPA.
The cost of purchasing RINs and cellulosic waiver credits fluctuates and can be significant. The price of RINs became extremely volatile, particularly when the EPA’s RVO mandates approach or exceed the blend wall. The blend wall is generally considered to be reached when more than 10 percent ethanol by volume (“E10”) is blended into gasoline. The price of RINs has also been impacted by the depletion of the carryover RIN bank, requiring carryover RINs from the RIN bank to be used to settle RVOs. The volatility of RIN prices also increased significantly in response to a number of factors, which we believe include, but are not limited to, the actions of RIN market participants including those not deemed by the EPA to be obligated parties, various government laws, rules, policies and initiatives relating to climate change, and the actions of the EPA in administrating the RFS, such as the EPA’s failure to include blenders in the definition of obligated parties, its failure to timely administer the RFS and its multiple blanket denials of SREs. Government actions and litigation by refiners including our obligated-party subsidiaries, biofuels groups and others, has also significantly impacted us and the price of RINs, including but not limited to the following:
•On January 20, 2021, President Trump issued EO 13990, in which he directed the EPA, in consultation with the Department of Energy, to consider issuing emergency fuel waivers to allow the year-round sale of E15 “to meet any projected temporary shortfalls in the supply of gasoline across the nation.” The EO cites the same CAA waiver provision used by the Biden Administration in 2022, 2023, and 2024. In April 2022, a group of Midwestern governors
petitioned EPA to allow summertime sales of E15 in their states, including Kansas, under the CAA. On July 21, 2022, the Governor of Kansas rescinded Kansas’ summertime E15 request. In February 2024, the EPA issued its final rule to allow summertime sales of E15 for the eight states that did not rescind their requests.
•In December 2021, the EPA proposed a new standard for evaluating SREs which it ultimately finalized and applied, in most cases retroactively, to deny approximately 130 SRE petitions filed by small refineries for compliance years 2016 through 2021, including (a) the petitions of WRC and 35 other small refineries for the 2018 compliance year denied in April 2022 and 69 petitions for other compliance years, including those of WRC for the 2017, 2019, 2020 and 2021 compliance years, denied in June 2022 (collectively, the “2022 Denials”), and (b) 26 petitions for other compliance years between 2016 and 2023, including WRC’s 2022 petition (the “2023 Denials”). WRC and others challenged these denials before the Fifth Circuit and DC Circuit. In November 2023 and July 2024, the Fifth Circuit and the DC Circuit, respectively, vacated EPA’s 2022 Denials and remanded the applicable SRE petitions back to EPA, holding the EPA’s denials were arbitrary and capricious and contrary to law. Other than seeking writ of certiorari from the Supreme Court of the United States (“SCOTUS”) relating to the Fifth Circuit’s ruling that venue for the case was proper in the Fifth Circuit, the EPA has yet to act on those remanded petitions.
•In December 2023, WRC and CRRM submitted a petition for rulemaking to the EPA demanding that it cures its violation of the RFS, which we believe required the EPA to establish a credit trading program under which only obligated parties who over-comply with their RFS obligations could sell RINS generated through such over-compliance to other obligated parties. The EPA has not yet responded to our petition, and our obligated-party subsidiaries expect to file suit against the EPA in the future should it fail to act.
•In January 2025, the EPA denied WRC’s SRE petition for the 2023 compliance year based on what WRC considers to be yet another new standard devised by the EPA, which denial WRC has challenged in the Fifth Circuit, also seeking a stay of enforcement of WRC’s RFS obligations for 2023. In its filing with the Fifth Circuit in February 2025, the EPA reported that it was reviewing its denial and did not oppose WRC’s stay.
As a result, our costs to comply with RFS (excluding the impacts of any exemptions or waivers to which the Petroleum Segment’s obligated-party subsidiaries may be entitled) increased significantly throughout 2021 and 2022, remained significant in 2023, and currently are expected to remain significant into 2024 and beyond, which volatility could have material impacts on the Company’s results of operations, financial condition, and cash flows.
The Federal Clean Water Act (“CWA”)
The CWA and its implementing regulations, as well as state laws and regulations that govern the discharge of pollutants into the water, affect our businesses. The CWA’s permitting requirements establish discharge limitations that may be based on technology standards, water quality standards, and restrictions on the total maximum daily load of pollutants allowed to enter a particular water body based on its use. In addition, water resources are becoming more scarce, and many refiners, including us, are subject to use restrictions in the event of low availability conditions. Our Refineries and the Coffeyville Fertilizer Facility have contracts in place to receive water during certain water shortage conditions, but these conditions and contracts could change over time depending on the scarcity of water.
In January 2021, the EPA announced it is undertaking a plan to review and update effluent standards for many industries. In that announcement, the EPA prioritized those sectors that are ranked high in point source categories for total nitrogen discharges, including fertilizer manufacturers. The EPA is continuing its review, which eventually could result in different regulations governing the Company.
Comprehensive Environmental Response, Compensation and Liability Act (“CERCLA”) and the Emergency Planning and Community Right-to-Know Act (“EPCRA”)
The release of hazardous substances or extremely hazardous substances into the environment is subject to release reporting requirements under federal and state environmental laws. Our Facilities also periodically experience releases of hazardous and extremely hazardous substances from their equipment and periodically have excess emission events. From time to time, the EPA has conducted inspections and issued information requests to us with respect to our compliance with reporting requirements under the CERCLA and the EPCRA. If we fail to timely or properly report a release, or if a release violates the law or our permits, we could become the subject of a governmental enforcement action or third-party claims. Government
enforcement or third-party claims relating to releases of hazardous or extremely hazardous substances could result in significant expenditures and liability.
Resource Conservation and Recovery Act (“RCRA”)
Our Refineries and Fertilizer Facilities are subject to the RCRA requirements for the generation, transportation, treatment, storage, and disposal of solid and hazardous wastes. When feasible, RCRA-regulated materials are recycled instead of being disposed of on-site or off-site. RCRA establishes standards for the management of solid and hazardous wastes. Besides governing current waste disposal practices, RCRA also addresses the environmental effects of certain past waste disposal practices, the recycling of wastes, and the regulation of underground storage tanks containing regulated substances.
Impacts of Past Manufacturing - In March 2004, two of our subsidiaries entered into a Consent Decree (“2004 Consent Decree”) with the EPA and the Kansas Department of Health and Environment (the “KDHE”) that required us to assume two RCRA corrective action orders issued to Farmland, the prior owner of the Coffeyville Refinery. Until January 21, 2021, we were subject to a 1994 EPA administrative order related to investigation of possible past releases of hazardous materials to the environment at the Coffeyville Refinery. In accordance with the order, we have conducted the required investigation and interim remediation projects and documented existing soil and groundwater conditions. In June 2017, the Coffeyville Refinery submitted an amended RCRA post-closure permit application to the KDHE to complete closure of former hazardous waste management units at the Coffeyville Refinery and to perform corrective action at the site. The KDHE approved the post-closure permit application in July 2019, and the RCRA permit was issued on December 16, 2020. The EPA terminated the 1994 administrative order on January 21, 2021. On January 13, 2021, the Coffeyville Fertilizer Facility entered into an agreement with the KDHE to address certain historical releases of UAN located on property held by CRNF that comingled with legacy groundwater contamination from the adjacent Coffeyville Refinery. The cleanup provisions of the agreement with the KDHE are held in abeyance so long as the Coffeyville Refinery conducts corrective action for these comingled historical releases in accordance with CRRM’s RCRA permit. The now-closed Phillipsburg terminal is subject to a 1996 EPA administrative order related to investigation of releases of hazardous materials to the environment at the Phillipsburg terminal, which operated as a refinery until 1991. The Phillipsburg terminal investigation is complete and corrective measures are in place implementing the EPA’s Statement of Basis and Final Remedy Decision issued in July 2018. The Phillipsburg Terminal has applied to KDHE for a RCRA Post-Closure Corrective Action Permit. When issued, we anticipate that the EPA will terminate the 1996 administrative order for Phillipsburg. The Wynnewood Refinery operates under a RCRA permit. A RCRA facility investigation has been completed in accordance with the terms of the permit. Based on the facility investigation and other available information, WRC entered into a consent order with the Oklahoma Department of Environmental Quality (the “ODEQ”) requiring further investigations of groundwater conditions and enhancements of existing remediation systems. We have completed the groundwater investigation at the Wynnewood Refinery and the ODEQ has approved our ongoing corrective actions. The consent order was terminated by the ODEQ in July 2019. The Wynnewood Refinery’s RCRA Permit was renewed on December 13, 2024, and included the incorporation of groundwater corrective action.
Financial Assurance - We are required under the 2004 Consent Decree, as modified by a 2010 agreement between CVR Energy subsidiaries, the EPA, and the KDHE, to establish financial assurance to secure the current projected clean-up cost for the now-closed Phillipsburg terminal. This financial assurance is currently provided by a bond in the amount of $2 million. The $2 million bond amount is reduced each year based on actual expenditures for corrective actions. Additional financial assurance of approximately $4 million and $3 million is required to meet our RCRA financial obligations for the Coffeyville Refinery and Phillipsburg terminal, respectively. Current RCRA financial assurance requirements for the Wynnewood Refinery include approximately $3 million for hazardous waste storage tank closure, the post-closure monitoring of a closed storm water retention pond, and the projected clean-up costs at the Wynnewood Refinery. These RCRA financial assurance obligations are currently being satisfied by a surety bond. The Company’s financial assurance mechanisms are re-evaluated and adjusted on an annual basis.
Waste Management - There are fourteen closed hazardous waste units at the Coffeyville Refinery. There is one closed hazardous waste unit and one active hazardous waste storage tank at the Wynnewood Refinery. In March 2021, 30 years of long-term post-closure care was completed at one closed, interim status, hazardous waste land treatment facility located at the now-closed Phillipsburg terminal and is no longer subject to monitoring.
Environmental Remediation
As is the case with all companies engaged in similar industries, we face potential exposure from claims and lawsuits involving environmental matters, including soil and water contamination and personal injury or property damage allegedly caused by crude oil or hazardous substances that we processed, handled, used, stored, transported, spilled, disposed of, or released. There is no assurance that we will not become involved in future proceedings related to the release of hazardous or extremely hazardous substances or crude oil for which we have potential liability or that, if we were held responsible for damages in any existing or future proceedings, such costs would be covered by insurance or would not be material.
Environmental Insurance
We are covered by site pollution legal liability insurance policies, which insure any location owned, leased, rented, or operated by the Company, including the Refineries and the Facilities. The policies insure certain pollution conditions at or migrating from a covered location, certain waste transportation and disposal activities, and business interruption.
In addition to the site pollution legal liability insurance policies, we maintain and are covered by certain general liability, umbrella and excess casualty insurance policies (collectively, the “Casualty Policies”) which generally include sudden and accidental pollution coverage. The Casualty Policies generally provide coverage due to named perils for claims involving pollutants where the discharge is sudden and accidental and first commences at a specific day and time during the policy period.
The site pollution legal liability policy and the Casualty Policies are subject to retentions and deductibles and contain discovery requirements, waiting periods, reporting requirements, exclusions, definitions, conditions, and limitations that could apply to a particular pollution claim, and there can be no assurance such claim will be adequately insured for all potential damages.
Health, Safety and Security Matters
We are subject to a number of federal and state laws and regulations related to safety, including the Occupational Safety and Health Act, which created the Occupational Safety and Health Administration (“OSHA”) and comparable state statutes, the purposes of which are to protect the health and safety of workers. We are also subject to OSHA Process Safety Management regulations, which are designed to prevent or minimize the consequences of catastrophic releases of toxic, reactive, flammable, or explosive chemicals. We are committed to safe, reliable operations of our Facilities to protect the health and safety of our employees, our contractors, and the communities in which we operate. Our health and safety management system provides a comprehensive approach to injury, illness and incident prevention, risk assessment and mitigation, and emergency management. Despite our efforts to achieve excellence in our health and safety performance, there can be no assurances that there will not be accidents resulting in losses, injuries, or fatalities that could materially adversely impact our business.
Our Facilities were subject to the Chemical Facility Anti-Terrorism Standards (“CFATS”), a regulatory program designed to ensure facilities have security measures in place to reduce the risk that certain hazardous chemicals are weaponized by terrorists. Despite the expiration of the CFATS in June 2023, our Facilities continue to adhere to its requirements. In addition, the East Dubuque Fertilizer Facility is regulated under the Maritime Transportation Security Act. We implement and maintain comprehensive security programs designed to comply with regulatory requirements and protect our assets and employees.
We periodically assess risk and conduct audits of our programs and seek to continually improve our health, safety, and security management systems.
Human Capital
Our employees are the most important part of our business and help us work to achieve our Mission to be a top-tier North American renewable fuels, petroleum refining and nitrogen-based fertilizer company as measured by safe and reliable operations, superior financial performance and profitable growth. CVR Energy’s culture is defined by our core Values: Safety, Environment, Integrity, Corporate Citizenship and Continuous Improvement. The efforts of our employees in support of this Mission are guided each and every day by these core Values as we strive to achieve excellence for all of our key stakeholders – employees, communities and stockholders. See “Management’s Discussion and Analysis of Financial Condition and Results of Operations” in Part II, Item 7 of this Report for further discussion on our Mission and core Values.
Workforce Profile
As of December 31, 2024, CVR Energy and its subsidiaries had 1,595 employees, all of which are located in the United States. Of these, 614 employees are covered by collective bargaining agreements.
Safety & Health
We are committed to providing a safe and healthy workplace and striving to protect our employees, contractors and communities. We accomplish this through compliance with applicable workplace safety and environmental laws and regulations, seeking employee input, learning from any events, and maintaining comprehensive audit and training programs and emergency response and disaster recovery plans. To assess our safety performance, we monitor workplace injuries, process safety incidents, and environmental events, and perform compliance audits and risk assessments. We believe these efforts reinforce our safety culture; promote a safe workplace, accountability, and stronger community relations; help safeguard against complacency; and ultimately, enhance our safety performance and help us manage risk and reduce impact to personal health and safety and the environment.
Compensation & Benefits
We believe that our future success largely depends upon our continued ability to attract and retain highly skilled employees. We are committed to providing wages and benefits that are competitive with a market-based, pay-for-performance compensation philosophy. Our performance bonus program is an important component of our compensation program, rewarding high-performing employees for our performance against pre-defined safety and health, operational reliability, and financial measures. Senior employees may also receive long-term incentive awards that currently vest ratably over a three-year period, subject to the terms and conditions of the applicable award agreement, aligning employee compensation with the interests of our shareholders and promoting employee retention. We provide paid time off and paid holidays, a 401(k) Company match program, life insurance, health savings and dependent care flexible spending accounts, and an employee assistance program. In furtherance of our core Value of Continuous Improvement, we also offer programs for tuition reimbursement and dependent scholarships. We offer a remote work policy to provide eligible employees with the flexibility that is key to a work-life balance. We encourage all employees to live our core Value of corporate citizenship by making a positive impact in our communities by taking advantage of our volunteerism policy pursuant to which eligible employees are provided paid time off from work to volunteer at 501(c)(3) non-profit entities.
Talent Management
We believe our competitive compensation and benefit plans allow us to attract and retain talented employees. Our recruiting strategy focuses on ensuring our hiring practices are free from bias for or against any individual or group of candidates. We continue to build upon our inclusive culture by expanding our recruitment efforts to include veteran recruitment and apprenticeship programs, recruiting interns at diverse colleges, and promoting diverse representation within our workforce. In support of the personal development of our employees and our goal of employing and retaining effective and dynamic leaders, we provide in-person supervisor training to managers at all levels led by our executives, which focuses on a combination of business and leadership strategies, including coaching and performance management, goal setting, critical thinking, effective communication and listening, development and succession planning, delegation techniques, and legal aspects of leadership, among other topics. We hold supervisor training program refresher sessions, at least quarterly, to reinforce topics covered in the in-person sessions, as well as to cover new topics including accountability, team building and other leadership skills and topics.
Diversity & Inclusion
We are an equal opportunity employer and strive to maintain a diverse and inclusive work environment free from harassment and discrimination regardless of race, religion, color, age, gender, disability, minority, sexual orientation, or any other protected class. Our recruiting efforts that include focus on veteran and diverse college populations, support our diverse and inclusive environment, as do the activities of our Diversity & Inclusion Committee. We provide diversity and inclusion training that covers, among other topics, unconscious bias and encouraging diversity of experience and opinion. Our Code of Ethics and Business Conduct and our anti-discrimination and harassment policies also help us maintain a work environment where individuals are treated with respect and dignity, and where diversity of thought and perspective is valued.
Available Information
Our website address is www.CVREnergy.com. Our annual reports on Form 10-K, quarterly reports on Form 10-Q, current reports on Form 8-K, and all amendments to those reports, filed or furnished pursuant to Section 13(a) or 15(d) of the Securities Exchange Act of 1934, as amended, are available free of charge through our website under “Investor Relations”, as soon as reasonably practicable after the electronic filing or furnishing of these reports is made with the Securities and Exchange Commission (the “SEC”) at www.sec.gov. In addition, our Corporate Governance Guidelines, Codes of Ethics and Business Conduct, and the charters of the Audit Committee, the Nominating and Corporate Governance Committee, the Compensation Committee, and the Environmental, Health and Safety Committee of the Company’s Board of Directors (the “Board”) are available on our website. These guidelines, policies, and charters are also available in print without charge to any stockholder requesting them. Information on our website is not a part of, and is not incorporated into, this Report or any other report we may file with or furnish to the SEC, whether before or after the date of this Report and irrespective of any general incorporation language therein.
Item 1A. Risk Factors
Risk Factors
The following risks should be considered together with the other information contained in this Report and all of the information set forth in our filings with the SEC. If any of the following risks or uncertainties develops into actual events, our petroleum and/or nitrogen fertilizer businesses, financial conditions, or results of operations could be materially adversely affected. References to “CVR Energy”, the “Company”, “we”, “us”, and “our” may refer to consolidated subsidiaries of CVR Energy, including CVR Partners, as the context may require.
Risks Related to Our Entire Business
Our businesses are, and commodity prices are, cyclical and highly volatile, which could have a material adverse effect on our results of operations, financial condition and cash flows.
Our Petroleum Segment’s financial results are primarily affected by margin between refined product prices and prices for crude oil and other feedstocks. Historically, refining margins have been volatile and vary by region, and we believe they will continue to be volatile in the future. We do not produce crude oil and must purchase all of the crude oil we refine long before we refine it and sell the refined products to our customers. Price level changes during the period between purchasing feedstocks and selling the refined products from these feedstocks could have a significant effect on our financial results. The Market prices for these and other commodities depend upon a wide range of factors beyond our control, including regional and global supply of and demand for crude oil, gasoline, diesel, and other feedstocks and refined products, which supply and demand is subject to volatility based on, among other things, the availability and quantity of imports, the capacity and production levels of U.S. and foreign refineries and suppliers, levels of refined petroleum product inventories and the availability of petroleum alternatives, productivity and growth (or the lack thereof) of U.S. and global economies, U.S. foreign trade policy and relationships with foreign governments, political affairs, and the extent of governmental regulation, including executive orders. A decline in market prices of these feedstocks and refined products may negatively impact the carrying value of our inventories. In addition, the profitability of our Petroleum Segment is also subject to our ability to purchase crude oil at a discount to benchmark crude oils, such as WTI. Crude oil differentials can fluctuate significantly based upon overall economic and crude oil market conditions. Adverse changes in crude oil differentials can adversely impact our refining margins, earnings and cash flows. Further, the Petroleum Segment’s purchases of crude oil, although based on WTI prices, have historically been at a discount to WTI because of the proximity of the Refineries to the sources, existing logistics infrastructure, and quality differences. Any changes to these factors could result in a reduction of the discount to WTI and may result in a reduction of the Petroleum Segment’s cost advantage.
For example, as described further below, volatile commodity pricing and higher industry utilization and oversupply have had an unfavorable impact on our petroleum business and have negatively impacted our cash from operating activities and liquidity. As a result, in October 2024, the Board elected to suspend payment of the cash dividend, defer new growth capital spending, and reduce certain expected capital expenditures. Refer to Part II, Item 7, “Management’s Discussion and Analysis of Financial Condition and Results of Operations—Liquidity and Capital Resources” of this Report for further discussion of our liquidity.
Additionally, our Renewables Segment is exposed to fluctuations in the prices of Vegetable oils and other feedstocks and renewable fuels, which are affected by numerous factors, such as Vegetable oil production capacity, system inventory, local and regional market conditions, inflation, and the operating levels of other facilities. Widespread expansion or upgrades of third-party facilities, price volatility, international political and economic developments, and other factors are likely to continue to play an important role in renewable fuel industry economics. These factors can impact, among other things, inventory levels in the market, resulting in renewable fuels price and product margin volatility.
Our Nitrogen Fertilizer Segment is exposed to fluctuations in nitrogen fertilizer demand in the agricultural industry. These fluctuations historically have had, and could in the future have, significant effects on prices across all nitrogen fertilizer products and, in turn, our results of operations, financial condition and cash flows. Nitrogen fertilizer products are commodities, the price of which can be highly volatile. A decrease in nitrogen fertilizer prices could have a material adverse effect on our business, cash flow, and ability to make distributions. The prices of nitrogen fertilizer products depend on a number of factors, including general economic conditions, cyclical trends in end-user markets, supply and demand imbalances, governmental policies, and weather conditions, which have a greater relevance because of the seasonal nature of fertilizer application. If seasonal demand exceeds the projections on which we base our production levels, customers may acquire nitrogen fertilizer products from competitors, and our profitability may be negatively impacted. If seasonal demand is less than expected, we may be left with excess inventory that will have to be stored or liquidated. Supply is affected by available capacity and operating rates, raw material costs, government policies and global trade.
In addition, the international market for nitrogen fertilizers is influenced by such factors as the relative value of the U.S. dollar and its impact upon the cost of importing nitrogen fertilizers, foreign agricultural policies, the existence of, or changes in, import or foreign currency exchange barriers in certain foreign markets, changes in the hard currency demands of certain countries, and other regulatory policies of foreign governments, as well as the laws and policies of the U.S. affecting foreign trade and investment.
We cannot predict future changes in U.S. policy with respect to foreign trade (including the imposition of trade barriers, tariffs on Canadian and other goods, or economic or trade sanctions, from the new administration or otherwise), including whether existing trade policies will be maintained or modified or whether the entry into new bilateral or multilateral trade agreements will occur, nor can we predict the effects that any such changes would have on our business. Changes in U.S. trade policy have resulted and could again result in reactions from U.S. trading partners, including adopting responsive trade policies which could make it more difficult or costly to obtain feedstocks or market our products. Such changes in U.S. trade policy or in laws and policies governing foreign trade, and any resulting negative sentiments towards the U.S. as a result of such changes, could materially and adversely affect our business, financial condition, results of operations and liquidity.
Certain developments in the global oil markets have had, and may continue to have, material adverse impacts on the operations, business, financial condition, liquidity, and results of operations of the Company or its customers, suppliers, and other counterparties.
Our business is impacted by events and developments that impact the global markets for oil and other energy products, including, among others, decisions by and disputes among the members of OPEC+ relating to setting and maintaining production levels and the impact of non-OPEC+ producers on global supply. Declines in the market prices of crude oil and certain other petroleum products below the carrying cost of such commodities in the Company’s inventory have required, and may continue to require, the Company to adjust the value of, and record a loss on, certain inventories, which has had, and may continue to have a negative impact on our operating income; adversely impact our ability to profitably operate our facilities, and our results of operations, such as revenues and cost of sales; could result in significant financial constraints on certain producers from which we acquire our crude oil; and could result in an increased risk that customers, lenders, and other counterparties may be unable to fulfill their obligations in a timely manner, or at all. Further, if general economic conditions continue to remain uncertain for an extended period of time, our liquidity and ability to repay our outstanding debt may be harmed and the trading price of our common stock, which has seen recent volatility, may decline.
Our businesses face intense competition.
The refining industry is highly competitive with respect to both crude oil and other feedstock supply and refined petroleum product markets. We compete with many companies for available supplies of crude oil and other feedstocks and for sites for our refined petroleum products. Our Petroleum Segment may be unable to compete effectively with competitors within and outside of the industry, which could result in reduced profitability. In contrast to many of our competitors, we do not have a retail
business and therefore are dependent upon others for outlets for our refined products, and we do not have arrangements exceeding a twelve-month period for much of our petroleum output and thus cannot offset losses from refining operations with profits from retail operations and may be less able to withstand periods of depressed refining margins or feedstock shortages. Some of our competitors also have materially greater financial and other resources than us and a greater ability to bear the economic risks inherent in our industry. In addition, our Petroleum Segment competes with other industries that provide alternative means to satisfy the energy and fuel requirements of its industrial, commercial, and individual customers. There are presently significant governmental incentives and consumer pressures to increase the use of alternative fuels in the United States. The more successful these alternatives become as a result of governmental incentives or regulations, technological advances, consumer demand, improved pricing, or otherwise, the greater the negative impact on pricing and demand for our products and profitability.
Our Renewables Segment faces competition from other renewable fuel producers. In recent years, there has been an increase in renewable fuel capacity and production as new renewables projects have come online, which impacts the prices at which we are able to sell renewable fuel. With an increase in renewable fuel projects in recent years, we also face competition for renewable feedstocks. The prices at which we sell renewable fuel and buy renewable feedstock are therefore volatile and beyond our control and could adversely affect our renewables margin and results.
Our Nitrogen Fertilizer Segment is subject to intense price competition from both U.S. and foreign sources. With little or no product differentiation, customers make their purchasing decisions principally on the basis of delivered price and availability of the product. Increased global supply or decreases in transportation costs for foreign sources of fertilizer may put downward pressure on fertilizer prices. We compete with a number of U.S. producers and producers in other countries, including state-owned and government-subsidized entities that may have greater total resources and are less dependent on earnings from fertilizer sales, which make them less vulnerable to industry downturns and better positioned to pursue new expansion and development opportunities. In addition, imports of fertilizer from other countries may be unfairly subsidized, as determined by the U.S. Department of Commerce on June 24, 2022 with respect to UAN imports from Russia and Trinidad and Tobago. On July 18, 2022, the U.S. International Trade Commission ultimately voted against imposing import tariffs on UAN from Russia and Trinidad and Tobago and, accordingly, the U.S. Department of Commerce will not issue countervailing duty orders and anti-dumping duty orders on UAN imports from the same countries. An inability to compete successfully could result in a loss of customers, which could adversely affect our sales, profitability, and cash flows, and therefore, have a material adverse effect on our results of operations and financial condition.
For example, as described further below, volatile commodity pricing and higher industry utilization and oversupply have had an unfavorable impact on our business and have negatively impacted our cash from operating activities and liquidity. As a result, in October 2024, the Board elected to suspend payment of the cash dividend, defer new growth capital spending, and reduce certain expected capital expenditures. Refer to Part II, Item 7, “Management’s Discussion and Analysis of Financial Condition and Results of Operations—Liquidity and Capital Resources” of this Report for further discussion of our liquidity.
Our businesses are geographically concentrated, creating exposure to regional economic downturns and seasonal variations for us or our customers, which may affect our production levels, transportation costs, and inventory and working capital levels.
Our Refineries are both located in the southern portion of Group 3 of the PADD II region, and we primarily market refined products in a relatively limited geographic area. As a result, our Petroleum Segment is more susceptible to regional economic conditions than the operations of more geographically diversified competitors, and any unforeseen circumstances that affect our operating area could also materially adversely affect our revenues and cash flows. These factors include, among other things, changes in the economy, weather conditions, demographics and population, increased supply of refined products from competitors, and reductions in the supply of crude oil. In addition, if we deliver refined products to customers outside of the region, we may incur considerably higher transportation costs, resulting in lower refining margins, if any.
Our Nitrogen Fertilizer Segment’s sales to agricultural customers are concentrated in the Great Plains and Midwest states, and nitrogen fertilizer demand is seasonal. Our quarterly results may vary significantly from one year to the next due to weather-related shifts in planting schedules and purchase patterns. Because we build inventory during low demand periods, the accumulation of inventory to be available for seasonal sales creates significant seasonal working capital and storage capacity requirements. The degree of seasonality can change significantly from year-to-year due to conditions in the agricultural industry and other factors. As a consequence of this seasonality, distributions by our Nitrogen Fertilizer Segment of available cash, if any, may be volatile and may vary quarterly and annually.
Public health crises have had, and may continue to have, adverse impacts on our business, financial condition, results of operations, and liquidity.
The economic effects from public health crises, such as a pandemic, on our business were and may again be significant. The extent to which the effects of a pandemic or other public health crisis may adversely impact our future business, financial, and operating results, and for what duration and magnitude, depends on factors that continuously evolve, are difficult to predict and, in many instances, are beyond our control. The ultimate outcome of these and other factors have in the past resulted and may again result in many adverse consequences including, but not limited to, disruption or delays to supply chains for critical equipment or feedstock, inflation, increased interest rates, and increased administrative, compliance, and operational costs. In addition, pandemics or other public health crises have also resulted and could result in significant economic disruption and other effects that adversely impact our business, financial condition, results of operations, and liquidity. The adverse impacts of a pandemic had, and the adverse impacts of a future pandemic or other public health crisis may have, the effect of precipitating or heightening many of the other risks described in this section.
Our segments each depend on significant customers, the loss of which may have a material adverse impact on our results of operations, financial condition and cash flows.
The Petroleum, Renewables, and Nitrogen Fertilizer Segments each have a significant concentration of customers. The largest customer for each of our Petroleum and Nitrogen Fertilizer Segments represented 13% and 14% of their respective net sales for the year ended December 31, 2024, while the Renewables Segment has two customers that each accounted for approximately 50% of its net sales for the same period. Given the nature of our businesses, and consistent with industry practice, we do not have long-term minimum purchase contracts with our customers. The loss of one or more of these significant customers, or a significant reduction in purchase volume by any of them, for any reason including, but not limited to, a desire to purchase competing products with lower emissions, could have a material adverse effect on our results of operations, financial condition and cash flows.
If licensed technology were no longer available or able to be licensed economically or at all, our business may be adversely affected.
We have licensed a combination of patent, trade secret, and other intellectual property rights of third parties for use in our plant operations. If our use of technology on which our operations rely were to be terminated or face infringement claims, licenses to alternative technology may not be available, may only be available on terms that are not commercially reasonable or acceptable, or in the case of infringement may result in substantial costs, all of which could have a material adverse effect on our results of operations, financial condition and cash flows.
In addition, we may identify in the future additional third-party intellectual property that we believe is necessary to our operations. The licensing or acquisition of third-party intellectual property rights is a competitive area, and several companies may pursue strategies to license or acquire third-party intellectual property rights that we may consider attractive or necessary, with the result that such intellectual property may not be available on economic terms or at all. In addition, companies that perceive us to be a competitor may be unwilling to assign or license rights to us. Even if such licenses are available, we may be required to pay the licensor substantial royalties based on sales of our products, and such licenses may be non-exclusive, which could give our competitors access to the same intellectual property licensed to us. Any of the foregoing could have a material adverse effect on our competitive position, results of operations, financial condition and cash flows.
Compliance with and changes in environmental laws, rules, and regulations, including those related to climate change and the ongoing “energy transition”, could result in increased operating costs and capital expenditures and changes in demand for the products we produce.
Our operations are subject to extensive federal, state, and local environmental laws, rules, and regulations relating to the protection of the environment, including those governing the emission or discharge of pollutants into the environment, climate change and the ongoing energy transition, product use and specifications, and the generation, treatment, storage, transportation, disposal, and remediation of solid and hazardous wastes. Violations of applicable environmental laws, rules, and regulations or of the conditions of permits issued thereunder can result in substantial penalties, injunctive orders compelling installation of additional controls or other injunctive relief, civil and criminal sanctions, operating restrictions, permit revocations, and/or facility shutdowns, which may have a material adverse effect on our ability to operate our facilities and accordingly our financial performance.
In addition, new environmental laws, rules, and regulations, including as a result of climate change and the ongoing energy transition efforts, new interpretations of existing laws, rules, and regulations, including as a result of the change in U.S. presidential administration, or increased governmental enforcement of laws, rules, and regulations, could require us to make additional unforeseen expenditures. More aggressive efforts by governments and non-governmental organizations to put in place laws requiring or otherwise driving reductions in GHG emissions appear likely and any such future laws and regulations could result in increased compliance costs or additional operating restrictions applicable to our customers and/or us, and any increase in the prices of refined products resulting from such increased costs, GHG cap-and-trade programs or taxes on GHGs, could results in reduced demand for our refined petroleum products. For example, in August 2022, President Biden signed into law the Inflation Reduction Act, which directs the EPA to impose a charge on methane emissions from certain petroleum system facilities and could have an indirect impact on demand for the goods and services of our Petroleum Segment. On January 26, 2024, the EPA issued a proposed rule to implement the methane emissions reduction program. Following a public comment period that ended March 11, 2024, the EPA announced the final rule on November 12, 2024, which took effect on January 17, 2025. Our business could also be impacted by governmental initiatives to incentivize the conservation of energy or the use of alternative energy sources. For example, there have been a number of U.S. federal and state rulemakings encouraging or mandating electric vehicles or alternative fuel vehicles. These initiatives to reduce energy consumption or incentivize a shift away from fossil fuels could reduce demand for hydrocarbons, thereby reducing demand for the products of our Petroleum Segment, and adversely impact our business, financial condition, results of operations and cash flows.
In 2024, there was an increased agency interest in polyfluoroalkyl substances or PFAS. Although not yet finalized, in February 2024, the EPA proposed changes to the RCRA regulations by adding nine PFAS compounds to its list of “hazardous constituents.” In April 2024, EPA finalized a rule to designate two PFAS compounds as “hazardous substances” under CERCLA. Industry and environmental groups have challenged the final CERCLA rule in the United States District Court for the District of Columbia, and while that case is still ongoing, in February 2025, the EPA requested that the court hold the case in abeyance for sixty days to allow agency leadership review and the court has not yet ruled on that motion. In addition, in April 2024, the EPA released a memorandum providing direction on the EPA’s enforcement discretion under CERCLA in matters involving PFAS. The EPA’s request to stay the April 2024 PFAS Rule, and the withdrawal of a June 2024 draft proposal (that would likely not apply to us) setting PFAS effluent limits for the chemical manufacturing sector, among other indicators, suggest that the January 2025 change in the presidential administration could impact the EPA’s level of interest in the regulation of PFAS and that PFAS regulation and enforcement will be less of a priority for the EPA in 2025. Nevertheless, to the extent these new PFAS compounds remain designated as hazardous substances, the EPA and states have the ability to order remediation of those compounds and cost recovery at clean-up sites. The EPA and states also have the authority to reopen closed sites which are shown to be impacted by these PFAS compounds. This could lead to increased monitoring obligations, costs and potential liability related thereto. If we are unable to maintain sales of our products at a price that reflects such increased costs, or those costs result in reduced demand for our fertilizer and hydrocarbon products, there could be a material adverse effect on our business, financial condition and results of operations.
Under the new Trump Administration the White House issued EO 14154 titled “Unleashing American Energy” that seeks to establish American energy dominance through, among other actions, purported revocation of certain executive and regulatory actions taken under the prior U.S. presidential administration, abolishment of certain offices such as the American Climate Corps and the Interagency Working Group on the Social Cost of Greenhouse Gases and other actions including, for example, directives to revise permitting processes, promote domestic mining and energy production and eliminate the “electric vehicle mandate” by ensuring a level regulatory playing field for gasoline-powered automobiles and eliminating subsidies or other incentives for purchasing electric vehicles (EVs). Also on January 20, 2025, the White House issued EO 14162, “Putting America First in International Environmental Agreements”, directing the United States’ withdrawal from the Paris Agreement under the United Nations Framework Convention on Climate Change. It is unclear the impact the Trump Administration and these EOs and others will have on the laws, rules, and regulations applicable to us or on our operations, and we cannot predict future developments related thereto.
Our facilities face significant risks due to physical damage hazards, environmental liability risk exposure, and unplanned or emergency partial or total plant shutdowns which could cause property damage and a material decline in production which may not be fully insured.
If any of our facilities, logistics assets, or key suppliers sustain a catastrophic loss and operations are shutdown or significantly impaired, it would have a material adverse impact on our operations, financial condition and cash flows. Examples of unforeseen events and circumstances, which may not be within our control, include: (i) major unplanned maintenance requirements; (ii) catastrophic events caused by mechanical breakdown, electrical injury, pressure vessel rupture, explosion,
contamination, fires, or natural disasters, including floods, windstorms, and other similar events; (iii) labor supply shortages or labor difficulties that result in a work stoppage or slowdown; (iv) cessation or suspension of a plant or specific operations dictated by environmental authorities; (v) acts of terrorism, cyberattacks or other deliberate malicious acts; and (vi) an event or incident involving a large clean-up, decontamination, or the imposition of laws and ordinances regulating the cost and schedule of demolition or reconstruction, which can cause significant delays in restoring property to its pre-loss condition. For example, on April 28, 2024, a fire commenced at the Wynnewood Refinery during severe weather and damaged pipe racks and pumps in the area of the naphtha processing units, which damage to the pipe rack impacted service to other units. Refer to “Adverse weather conditions or other unforeseen developments could damage our facilities or logistics assets and impair our ability to produce and deliver our products” below and Part II, Item 7, “Management’s Discussion and Analysis of Financial Condition and Results of Operations—Results of Operations—Petroleum Segment” of this Report for additional information on this incident. Any similar events in the future or claims related thereto could have a significant impact on the Company and its operations, may not be insured, and could be the subject of litigation or an enforcement action, which could result in significant expense to the Company, and which could have a material adverse effect on our results of operations, financial condition and cash flow.
We are insured under casualty, environmental, property, and business interruption insurance policies. The property and business interruption policies insure our real and personal property. These policies are subject to limits, sub-limits, retention (financial and time-based), and deductibles. The application of these and other policy conditions could materially impact insurance recoveries and potentially cause us to assume losses which could impair earnings. There is potential for a common occurrence to impact both our Coffeyville Refinery and Coffeyville Fertilizer Facility, in which case the insurance limits and applicable sub-limits would apply to all damages combined.
There is finite capacity in the commercial insurance industry engaged in underwriting energy industry risk, and factors impacting cost and availability include: (i) losses in our industries, (ii) natural disasters (which could be exacerbated by climate change), (iii) specific losses incurred by us, and (iv) inadequate investment returns earned by the insurance industry. In the future, certain insurance could become unavailable or available only for reduced amounts of coverage or at exorbitant costs. If the supply of commercial insurance is curtailed or if commercial insurance companies decline to underwrite companies in the energy industry, we may not be able to continue our present limits of insurance coverage or obtain sufficient insurance capacity to adequately insure our risks or we may determine that premium costs, in our judgement, do not justify such expenditures and instead increase our self-insurance.
We could incur significant costs in cleaning up contamination at or associated with our facilities.
Our businesses handle petroleum and hazardous substances, and as a result, spills, discharges, or other releases of petroleum or hazardous substances into the environment may occur. Past or future spills related to any of our current or former operations and solid or hazardous waste disposal may give rise to liability (including for personal injury and property damage, penalties, strict liability and potential cleanup responsibility) to governmental entities or private parties under federal, state, or local environmental laws, as well as under common law. For example, we could be held strictly liable under CERCLA and similar state statutes for past or future spills without regard to fault or whether our actions were in compliance with the law at the time of the spills, including in connection with contamination associated with our current and former facilities, and facilities to which we transported or arranged for the transportation of wastes or byproducts containing hazardous substances for treatment, storage, or disposal. Such liability could have a material adverse effect on our results of operations, financial condition and cash flows and may not be covered by insurance.
Remedial activities to address known environmental contamination are underway at three of our facilities, including the Coffeyville Refinery, the now-closed Phillipsburg terminal (which operated as a refinery until 1991), and the Wynnewood Refinery. We also have assumed the previous owner’s responsibilities under certain administrative orders under RCRA related to contamination at or that originated from the Coffeyville Refinery and the Phillipsburg terminal. We continue to work with the applicable governmental authorities to implement remediation of these three sites on a timely basis. As of December 31, 2024, we have established an accrual of approximately $3 million for probable and reasonably estimable obligations associated with environmental matters.
Regulations concerning the transportation, storage, and handling of hazardous chemicals and materials could result in higher operating costs.
Our crude oil gathering division that operates as a motor carrier is subject to regulation by federal and various state agencies and possible regulatory and legislative changes that may affect the economics of the industry. Some of these possible changes include increasingly stringent fuel-economy environmental regulations, limits on vehicle weight and size, and increases to federal, state or local taxes, including taxes on motor fuels, which may increase our costs or adversely impact the recruitment of drivers.
Acts of terror or sabotage, threats of war, armed conflict, or war or trade wars may have an adverse impact on our business, our future results of operations and our overall financial performance.
Acts of sabotage or terrorist attacks (including cyberattacks), threats of war, armed conflict, or war or trade wars, as well as events occurring in response to or in connection with such events may harm our business or have an adverse impact on our future results of operations and financial condition. For example, the ongoing Russia-Ukraine war poses significant geopolitical risks to global crude oil, fertilizer, and agriculture markets. In addition, despite recent de-escalation and the ongoing ceasefire, the conflict between Israel and Hamas, which began in October 2023, continues to pose similar risks to the global crude oil, fertilizer, and agriculture markets. The threat or imposition of trade restrictions or economic sanctions could lead to further volatility in the price and disruptions in the production and trade of fertilizer, grains, and feedstock. The ultimate outcome of these conflicts, or further escalation or expansion thereof, and any associated market disruptions are difficult to predict and may affect our business, operations, and cash flows in unforeseen ways.
Critical infrastructure such as petroleum refining and chemical manufacturing facilities may be at greater risk of terrorist attacks than other businesses in the United States. As a result, the petroleum and chemical industries are subject to security regulations relating to physical and cyber security, and the costs of compliance therewith may have a material adverse effect on our financial condition. Further, uncertainty surrounding new or continued global hostilities or other sustained military campaigns, sanctions brought by the U.S. and other countries, and the possibility that infrastructure facilities could be direct targets of, or indirect casualties of, an act of terror, armed conflict or war may affect our operations in unpredictable ways, including disruptions of crude oil supplies and markets for refined products. The long-term impacts of terrorist attacks and the threat of future terrorist attacks on the energy transportation industry in general, and on us in particular, are unknown. Increased security measures taken by us as a precaution against possible terrorist attacks or vandalism could result in increased costs to our business. In addition, disruption or significant increases in energy prices could result in government-imposed price controls.
Further, changes in the insurance markets attributable to terrorist attacks, acts of sabotage or cyberattacks could make certain types of insurance more difficult for us to obtain. Moreover, the insurance that may be available to us may be significantly more expensive than our existing insurance coverage. Instability in the financial markets as a result of war, terrorism, sabotage or cyberattack could also affect our ability to raise capital, including our ability to repay or refinance debt.
Adverse weather conditions or other unforeseen developments could damage our facilities or logistics assets and impair our ability to produce and deliver our products.
The regions in which our facilities are located and in which our customers operate are susceptible to severe storms, hurricanes, thunderstorms, tornadoes, floods, extended periods of rain, ice storms, snow, and wildfires, some of which we or our customers have experienced in recent years. Such inclement weather conditions or other unforeseen developments could damage our facilities or logistics assets. If such weather conditions or developments prevail near our facilities or logistics assets, they could interrupt or undermine our ability to produce and transport products or to manage our business. For example, on April 28, 2024, a fire commenced at the Wynnewood Refinery during severe weather. The fire was extinguished shortly after it started, no employees or contractors were injured. The damages were limited to pipe racks and pumps in the area of the naphtha processing units, which damage to the pipe rack impacted service to other units. During 2024, the Company also experienced weather-related external power outages at both refineries.
If events such as severe storms, hurricanes, thunderstorms, tornadoes, floods, extended periods of rain, ice storms, snow, and wildfires become more intense or more frequent, they could have an adverse effect on our continued operations, as well as the operations of our suppliers and customers. Regional occurrences, such as energy shortages or increases in commodity prices, geological hazards, and natural disasters, could also have a material adverse effect on our business, financial condition and results of operations. The physical effects of adverse weather conditions have the potential to directly affect our operations
and result in increased costs related to our operations. Since climate change may change weather patterns and the severity of weather events, any such changes could consequently materially adversely affect our revenues and cash flows and the demand for our products by our customers. However, because the nature and timing of changes in extreme weather events (such as increased frequency, duration, and severity) are uncertain, it is not possible for us to estimate reliably the future financial risk to our operations caused by these potential physical risks.
If our access to transportation on which we rely for the supply of our feedstocks and the distribution of our products is interrupted, our inventory and costs may increase and we may be unable to distribute our products efficiently or at all.
If one of the pipelines on which either of the Refineries relies for supply of crude oil or for distribution of fuel becomes inoperative, the Petroleum Segment would be required to use alternative pipelines or other transportation methods or increase inventory, which could increase its costs and result in lower production levels and profitability. Our Nitrogen Fertilizer business relies on railroad, trucking and barge companies to ship finished products to customers. Factors that could negatively impact transportation availability and have a material adverse effect on our results of operations, financial condition and ability to pay dividends include extreme weather conditions, work stoppages, delays, spills, and derailments, new regulations restricting movements or increasing costs. The limited number of companies available for ammonia transport may also impact the availability of transportation for our Nitrogen Fertilizer Segment’s products.
Any interruption in the supply of natural gas to our Facilities could have a material adverse effect on our results of operations and financial condition.
Operations at our Facilities depend on the availability of natural gas. We have two agreements for pipeline transportation of natural gas with expiration dates in April 2025. We typically purchase natural gas from third parties on a spot basis and, from time to time, we may enter into fixed-price forward purchase contracts. Upon expiration of the agreements, we may be unable to extend the service under the terms of the existing agreements or renew the agreements on satisfactory terms, or at all, necessitating construction of a new connection that could be costly and disruptive. Any disruption in the supply of natural gas to our East Dubuque Fertilizer Facility could restrict our ability to continue to make products at the facility and have a material adverse effect on our results of operations and financial condition.
We may be unable to obtain or renew permits or approvals necessary for our operations, which could inhibit our ability to do business.
Our businesses hold numerous environmental and other governmental permits and approvals authorizing operations at our facilities and future expansion of our operations is predicated upon the ability to secure necessary approvals therefore. A decision by a government agency to deny or delay issuing a new or renewed material permit or approval, or to revoke or substantially modify an existing permit or approval, could have a material adverse effect on our ability to continue operations and on our financial condition, results of operations and cash flows.
We are subject to strict laws and regulations regarding employee and process safety, and failure to comply with these laws and regulations could have a material adverse effect on our results of operations, financial condition and profitability.
We are subject to the requirements of OSHA and comparable state statutes that regulate the protection of the health and safety of workers, the proper design, operation, and maintenance of our equipment, and require us to provide information about hazardous materials used in our operations. Failure to comply with these requirements may result in significant fines or compliance costs, which could have a material adverse effect on our results of operations, financial condition and cash flows.
Our business may suffer due to the departure of any of our key senior executives or other key employees. Furthermore, a shortage of skilled labor may make it difficult for us to maintain labor productivity.
Our future performance depends to a significant degree upon our management team and key technical personnel. The loss or unavailability to us of any member of our management team or a key technical employee could significantly harm us. We face competition for these professionals from our competitors, our customers and other companies operating in our industry. To the extent that the services of members of our management team and key technical personnel would be unavailable to us for any reason, we may be required to hire other personnel to manage and operate our business. We may not be able to locate or employ such qualified personnel on acceptable terms, or at all.
Furthermore, our operations require skilled and experienced laborers with proficiency in multiple tasks. A shortage of trained workers due to retirements or otherwise could have an adverse impact on productivity and costs and our ability to expand production in the event here is an increase in the demand for our products and services, which could adversely affect our operations.
A portion of our workforce is unionized, and we are subject to the risk of labor disputes, slowdowns or strikes, which may disrupt our business and increase our costs.
As of December 31, 2024, approximately 41% and 27% of our Petroleum and Nitrogen Fertilizer Segment employees, respectively, were represented by labor unions under collective bargaining agreements. We may not be able to renegotiate our collective bargaining agreements when they expire on satisfactory terms or at all. A failure to do so may increase our costs. For example, a labor union representing approximately 90 employees at the East Dubuque Fertilizer Facility went on strike in October 2023, after its collective bargaining agreement expired. However, the East Dubuque Fertilizer Facility continued to operate during the strike, which ended in February 2024; and employees began returning to work in March 2024. In addition, our existing labor agreements may not prevent a strike or work stoppage at any of our facilities in the future, and any work stoppage could negatively affect our results of operations, financial condition and cash flows.
In addition, there continues to be a tight labor market. Increases in remote work opportunities have also amplified the competition for employees and contractors. An inability to recruit, train, and retain adequate personnel, or the loss or departure of personnel with key skills or deep institutional knowledge for whom we are unable to find adequate replacements, may negatively impact our business. Inflation has also caused and may in the future cause increases in employee-related costs, both due to higher wages and other compensation.
We are subject to cybersecurity risks and may experience cyber incidents resulting in disruption or harm to our businesses.
We depend on internal and third-party information technology systems to manage and support our operations, and we collect, process, and retain sensitive and confidential customer information in the normal course of business. To protect our facilities and systems against and mitigate cyber risk, we have implemented several programs including externally performed cyber risk monitoring, audits and penetration testing and an information security training program, and we completed the implementation of applicable Cybersecurity and Infrastructure Security Agency security standard guidelines in 2023. On an as needed basis, but no less than quarterly, we brief the Audit Committee of the Board on information security matters. Despite these measures (or those we may implement in the future), our facilities and these systems could be vulnerable to security breaches, computer viruses, lost or misplaced data, programming errors, human errors, acts of vandalism, or other events. Moreover, cyberattacks are expected to accelerate on a global basis in both frequency and magnitude as threat actors are becoming increasingly sophisticated in using techniques and tools (including artificial intelligence) that circumvent controls, evade detection and even remove forensic evidence of the infiltration. A breach could also originate from or compromise our customers’, vendors’, suppliers’, or other third-party networks outside of our control that could impact our business and operations, and there can be no assurance that the systems of third parties have been designed to prevent or limit the effects of cyber incidents or attacks, will be sufficient to prevent or detect material consequences arising from such incidents or attacks, or to avoid a material adverse impact. Although we implement controls on third-party connectivity to our systems, we have limited control in ensuring their systems consistently enforce strong cybersecurity controls. The advancement and use of artificial intelligence (“AI”) also presents both external and internal cybersecurity risks, such as more sophisticated phishing and breach attempts, and the potential for incorrect information generated by AI models to be used for business decisions. We mitigate these risks through comprehensive cybersecurity training, the deployment of cybersecurity monitoring tools, and regular reviews for external cyber threats, as well as by requiring authorization from the IT and Legal Departments for any AI use case. Despite our mitigation efforts, any disruption of these systems or security breach or event resulting in the misappropriation, loss or other unauthorized disclosure of confidential information, whether by us directly or our third-party service providers, could damage our reputation, expose us to the risks of litigation and liability, disrupt our business, or otherwise affect our results of operations.
Our business is subject to complex and evolving laws, regulations and security standards regarding privacy, cybersecurity and data protection (“data protection laws”). Many of these data protection laws are subject to change and uncertain interpretation, and could result in claims, increased costs of operations, or other harm to our business.
The constantly evolving regulatory and legislative environment surrounding data privacy and protection poses increasingly complex compliance challenges, and complying with such data protection laws could increase the costs and complexity of compliance. While we do not collect significant amounts of personal information from consumers, we do have personal information from our employees, job applicants and some third parties, such as contractors and distributors. Any failure, whether real or perceived, by us to comply with applicable data protection laws could result in proceedings or actions against us by governmental entities or others, subject us to significant fines, penalties, judgments, and negative publicity, require us to change our business practices, increase the costs and complexity of compliance, and adversely affect our business. Our compliance with emerging privacy/security laws, as well as any associated inquiries or investigations or any other government actions related to these laws, may increase our operating costs.
An increase in inflation could have adverse effects on our results of operations.
Inflation in the United States increased beginning in the second half of 2021 and continued into the beginning of 2023, due to a substantial increase in money supply, a stimulative fiscal policy, a significant rebound in consumer demand as COVID-19 restrictions were relaxed, the Russia-Ukraine war and worldwide supply chain disruptions resulting from the economic contraction caused by COVID-19 and lockdowns followed by a rapid recovery. According to the Consumer Price Index, annual inflation was at 2.9% and 3.4% as of December 2024 and 2023, respectively. An increase in inflation rates could negatively affect our profitability and cash flows, due to higher wages, higher operating costs, higher financing costs and/or higher supplier prices. We may be unable to pass along such higher costs to our customers. In addition, inflation may adversely affect our customers’ financing costs, cash flows and profitability, which could adversely impact their operations and our ability to offer credit and collect receivables.
Risks Related to the Petroleum and Renewables Segments
If our Petroleum Segment loses the benefit of a crude oil supply agreement or is unable to gather crude oil in the regions in which we operate, our exposure to the risks associated with volatile crude oil prices may increase, crude oil transportation costs could increase and our liquidity may be reduced.
Our Petroleum Segment obtains substantially all of its crude oil supply through crude oil gathering operations in Kansas and Oklahoma or through the crude oil intermediation agreement with Gunvor USA LLC. The agreement, which currently extends through January 31, 2026, minimizes the amount of in-transit inventory and mitigates crude oil pricing risk by ensuring pricing takes place close to the time the crude oil is refined and the yielded products are sold. If we were required to obtain our crude oil supply without the benefit of crude oil located near the Refineries or a supply intermediation agreement, our Petroleum Segment’s exposure to crude oil pricing risk may increase, despite any hedging activity in which we engage (such as futures and swaps), crude oil transportation costs could increase and our liquidity could be negatively impacted due to increased inventory, potential need to post letters of credit, and negative impacts of market volatility. There is no assurance that our crude oil gathering operations will remain at current levels or that we will be able to renew or extend the Gunvor agreement beyond January 31, 2026. Crude oil production disruptions could have a material impact on the Petroleum Segment because in such an event, we may be unable to obtain an adequate supply of crude oil, or we may only be able to obtain crude oil at unfavorable prices and we may experience a reduction in liquidity and our results of operations could be materially adversely affected.
Compliance with the RFS could have a material adverse effect on our business, financial condition and results of operations.
The EPA has promulgated and implemented the RFS pursuant to the Energy Policy Act of 2005 and the Energy Independence and Security Act. Under the RFS program, a RIN is assigned to each gallon of renewable fuel produced in or imported into the United States. The RFS program sets annual mandates for the volume of renewable fuels (such as ethanol and biodiesel) that must be blended into a refiner’s transportation fuels. If a refiner of petroleum-based transportation fuels is unable to meet its renewable fuel mandate through blending and is not otherwise exempt from compliance, it must purchase RINs in the open market to meet its obligations under the RFS program.
Our Petroleum Segment’s obligated-party subsidiaries are exposed to the volatility in the market price of RINs, which can be extreme. We cannot predict the future prices of RINs. RIN prices are dependent upon a variety of factors, including EPA regulations, the availability of RINs for purchase from third parties or our Renewables Segment, levels of transportation fuels produced, the mix of the petroleum business’ petroleum products, our purchasing as well as the fuel blending performed at the Refineries and downstream terminals, all of which can vary significantly from period to period. RIN prices may also be
impacted by the timing and content of the EPA’s actions or inactions relating to the RFS and communications relating thereto, as well as the actions of market participants, such as non-obligated parties. We may also be adversely impacted by the timing by which we purchase RINs, either ratably or at all. Also, we believe WRC, as a small refinery, should be entitled to exemptions from the RFS, and we may carry a RIN deficit while we pursue such exemptions in court. The accounting treatment of such deficit may change over time and in response to court rulings. If sufficient RINs are unavailable for purchase, if the Petroleum Segment has to pay a significantly higher price for RINs, if our legal actions relating to WRC’s small refinery exemptions are not decided in our favor, or if our obligated-party subsidiaries are otherwise unable to meet the EPA’s RFS mandates or is unable to participate in programs or receive exemptions relieving compliance with RFS obligations, our business, financial condition and results of operations could be materially adversely affected.
Changes in our credit profile may affect our relationship with our suppliers, which could have a material adverse effect on our liquidity and ability to operate the Refineries at full capacity.
Changes in our credit profile may affect the way crude oil suppliers view our ability to make payments and may induce them to shorten the payment terms for purchases or require us to post security. For example, our corporate credit ratings were downgraded in the second half of 2024 and further downgrades to our corporate credit ratings could be seen as a significant change to our credit profile by our crude oil suppliers. Given the large dollar amounts and volume of our crude oil and other feedstock purchases, a burdensome change in payment terms may have a material adverse effect on liquidity and our ability to make payments to suppliers. This, in turn, could cause us to be unable to operate the Refineries at full capacity. A failure to operate at full capacity could adversely affect our profitability and cash flows.
The Petroleum Segment’s commodity derivative strategy and contracts may limit potential gains, exacerbate potential losses, and involve other risks.
We may enter into both short- and long-term commodity derivatives contracts to mitigate crack spread risk with respect to a portion of expected refined products production. However, hedging arrangements, if we are able to procure them, may fail to fully achieve this objective for a variety of reasons, including its failure to have adequate hedging contracts, if any, in effect at any particular time and the failure of hedging arrangements to produce the anticipated results. Moreover, such transactions may limit our ability to benefit from favorable changes in margins. In addition, our hedging activities may expose us to the risk of financial loss in certain circumstances, including instances in which the volumes of our actual use of crude oil or production of the applicable refined products is less than the volumes subject to the hedging arrangement; accidents, interruptions in transportation, inclement weather, or other events cause unscheduled shutdowns or otherwise adversely affect a refinery, suppliers, or customers; the counterparties to our futures contracts fail to perform under the contracts; or a sudden, unexpected event materially impacts the commodity or crack spread subject to the hedging arrangement. As a result, our risk mitigation strategy and activities could have a material adverse impact on our financial results and cash flows.
If we are unable to complete capital projects at their expected costs, in a timely manner or at all, or if the market conditions assumed in project economics deteriorate, our financial condition, results of operations or cash flows could be adversely affected.
Equipment, even when properly maintained, may require significant capital expenditures and expenses to keep operating at optimum efficiency. Our facilities and equipment have been in operation for many years and may be subject to unscheduled downtime for unanticipated maintenance or repairs that are more frequent than our planned turnaround for facilities and equipment. In addition, our planned turnarounds for facilities and equipment reduce our revenues during the period of time that such assets are not operating and may take longer than anticipated to complete. Delays or cost increases beyond our control related to the engineering and construction of new facilities or improvements and repairs to existing facilities and equipment caused by delays in or denials of permits, disruptions to transportation, labor disagreements resulting in work stoppage, non-performance of vendors, or increases in financing costs, could have a significant impact on our petroleum business. If we are unable to make up for the delays or to recover the related costs, or if market conditions change, we could materially and adversely affect our financial condition, results of operations or cash flows.
One of the ways we may grow our business is through the conversion or expansion of our existing facilities, such as the conversion of the Wynnewood Refinery’s hydrocracker to an RDU, which was completed in 2022, and the conversion of a hydrotreater to renewable diesel service at the Coffeyville Refinery, which is currently being evaluated. If we are unable to complete capital projects at their expected costs or in a timely manner, our financial condition, results of operations, or cash flows could be materially and adversely affected. Delays in making required changes or upgrades to our facilities could subject
us to fines or penalties and also affect our ability to supply certain products we make. Moreover, we may construct facilities to capture anticipated future growth in demand for refined products or renewable diesel in a region in which such growth does not materialize, or we may return previously converted equipment to hydrocarbon service based on our expectations concerning market conditions, including but not limited to renewable diesel margins and contractual obligations, and our revenue may not increase immediately upon the expend of funds on a particular project. In addition, the long-term success of our Petroleum Segment depends on our ability to adapt to potentially changing government requirements, among other things. As a result, new capital investments may not achieve our expected investment return, which could materially and adversely affect our financial position, results of operations or cash flows.
Investor and market sentiment towards climate change, fossil fuels, GHG emissions, environmental justice, and other ESG matters could adversely affect our business, cost of capital, and the price of our common stock and debt securities.
There have been efforts in recent years aimed at the investment community, including investment advisors, sovereign wealth funds, public pension funds, universities, and other groups, to promote the divestment of securities of companies in the energy industry, as well as to pressure lenders and other financial services companies to limit or curtail activities with companies in the energy industry. As a result, some financial intermediaries, investors, and other capital markets participants have reduced or ceased lending to, or investing in, companies that operate in industries with higher perceived environmental exposure, such as the energy industry. Pension funds at both the United States state and municipal level, as well other countries and jurisdictions across the world, particularly in Europe, have announced plans to divest holdings in companies engaged in fossil fuels activities. If these or similar divestment efforts are continued, the price of our common stock or debt securities, and our ability to access capital markets or to otherwise obtain new investment or financing, may be negatively impacted.
Some members of the investment community are focused on ESG practices and disclosures, including those related to climate change, GHG emissions targets, business resilience under demand-constraint scenarios, and net-zero ambitions in the energy industry in particular, and diversity, equity, and inclusion initiatives, political activities, and governance standards among companies more generally. In addition to voluntary disclosures in response to investor and stakeholder requests, some governments have also proposed or adopted regulations that impose disclosure obligations with respect to various climate change and other ESG matters. As a result, we may face negative publicity, increasing pressure regarding our ESG practices and disclosures, and demands for ESG-focused engagement commenced by investors, stakeholders, and other interested parties. This could result in higher costs, disruption and diversion of management attention, an increased strain on company resources, and the implementation of certain ESG practices or disclosures that may present a heightened level of legal and regulatory risk, or that threaten our credibility with other investors and stakeholders. Investors, stakeholders, and other interested parties are also increasingly focusing on issues related to environmental justice. This may result in increased scrutiny, protests, and negative publicity with respect to our business and operations, and those of our counterparties, which could in turn result in the cancellation or delay of projects, the revocation of permits, termination of contracts, lawsuits, regulatory action, and policy change that may adversely affect our business strategy, increase our costs, and adversely affect our reputation and performance. For example, in recent years, private litigation has been increasingly initiated against energy companies by local and state agencies and private parties alleging climate change impacts arising from their operations and seeking damages and equitable relief. We cannot reasonably predict whether any such litigation will be initiated against us or, if initiated, what the outcome would be. While we would vehemently defend against any such litigation, we could incur significant costs in such defense and if we failed to prevail and were required to pay significant damages and/or materially alter our business, there could be a material adverse impact on our operations, financial condition or results of operations.
Additionally, the investment community may screen companies like ours for ESG performance and climate-related practices to limit GHG emissions before investing in our common stock, debt securities, or lending to us. Credit ratings agencies are also using ESG as a factor in assigning their ratings, which could impact our cost of capital or access to financing. There is also investor demand for ESG investing opportunities, and some institutional investors have committed to increasing the percentage of their portfolios allocated towards ESG-focused investments. As a result, some investment funds have been reallocated with an ESG focus. There continue to be third-party providers of company ESG ratings and ESG-focused voting policies among proxy advisory firms, portfolio managers, and institutional investors. Such climate-related activities could lead to decreased demand for fossil fuel-based products and increased demand for products that result in lower emissions than fossil fuel-based products, and our business could be adversely affected.
If we are unable to meet the ESG standards or investment, lending, ratings, or voting criteria and policies set by these parties, we may lose investors, investors may allocate a portion of their capital away from us, we may become a target for ESG-
focused activism, our cost of capital may increase, the price of our securities may be negatively impacted, and our reputation may also be negatively affected.
Our Renewables Segment is highly dependent on government credits, resulting in uncertainty and volatility.
Current market prices for renewable feedstocks are higher than the prices for renewable fuels. As a result, profitability in the Renewables Segment is highly dependent on the prices of government credits generated through the production of renewable fuels, particularly RINs prices, LCFS credit prices, and the BTC. RINs prices are mainly influenced by supply and demand dynamics, with the demand being heavily impacted by the annual Renewable Volume Obligation levels established by the EPA. The $1 per gallon BTC expired on December 31, 2024, and its intended replacement, the Clean Fuels Production Credit, has not yet been finalized. With the loss of the BTC there could be additional volatility in pricing for renewable fuels feedstocks, as well as in prices of other credits generated by renewable fuels production, particularly RINs prices and LCFS credit prices. Without sufficient government support to stabilize prices for credits generated by renewable fuels production, our Renewables Segment may not be able to generate profits.
Tariffs and bans on renewable feedstocks could result in supply restriction and feedstock pricing volatility.
Although the PTC guidelines have not yet been finalized, one of the proposed measures would exclude certain imported renewable feedstocks from being eligible to claim the credit. In addition, tariffs imposed by the new Presidential Administration could impact the pricing and availability of imported renewable feedstocks into the United States. Reduced supplies of imported feedstocks due to tariff restrictions or producers’ inability to claim credits could result in increased demand for domestic feedstocks. Increased demand for domestic feedstocks could reduce available supplies and increase feedstock pricing, which in turn could negatively impact the profitability of our Renewables Segment.
Our renewables customer base is dependent on some environmental credits only available in certain states, thereby limiting our customer pool.
One of the components of our Renewables Segment’s gross margin and profitability is LCFS credits generated by selling our product to customers who ship it to California. While several other states offer similar credit programs, such as Oregon and Washington, the California market is significantly larger due to the greater population and fuel demand in the state. As a result, most of the renewable diesel produced in the U.S. is shipped to California, which has significantly increased the amount of LCFS credits generated in the state and negatively impacted the pricing for those credits. Renewable diesel and biodiesel sales as a percentage of total diesel sales in California reached 70% in 2024. Without a wider adoption of LCFS programs in larger states, the customer pool will likely remain limited to states that currently offer LCFS programs.
Potential Renewables Projects at the Refineries could impact the operations and/or profitability of our Renewables Segment.
Two projects that we have evaluated for the Renewables Segment are the potential conversion of the Wynnewood RDU to produce sustainable aviation fuel (“SAF”), and the potential construction of a new renewable diesel or SAF project at our Coffeyville Refinery. If we were to proceed with these potential projects, there is no guarantee that operating performance or expected profitability, including that associated with SAF production, will meet expectations. Moreover, such potential projects could involve the formation of a joint venture, reliance on capital from joint venture partners to fund the project, or the contribution of some of our assets, such as the RDU, to any potential joint venture. Such actions could reduce the benefits that our Petroleum Segment receives from the RINs generated by the Wynnewood RDU, could fail to produce expected returns, and could otherwise negatively impact the operations and profitability of our Renewables Segment.
Risks Related to the Nitrogen Fertilizer Segment
Any decline in U.S. agricultural production or limitations on the use of nitrogen fertilizer for agricultural purposes could have a material adverse effect on the sales, and on our results of operations, financial condition and cash flows.
Conditions in the U.S. agricultural industry significantly impact our operating results. The U.S. agricultural industry can be affected by a number of factors, including weather patterns and field conditions, current and projected grain inventories and prices, domestic and international population changes, demand for U.S. agricultural products, U.S., state and foreign policies regarding trade in agricultural products, and changes in governmental regulations and incentives for ethanol production that
could affect future corn-based ethanol demand and production, including the RFS program. Developments in crop technology could also reduce the use of chemical fertilizers and adversely affect the demand for nitrogen fertilizer. All of the foregoing could have a material adverse effect on our results of operations, financial condition and cash flows.
Failure by our Coffeyville Refinery or other third parties to continue to supply our Coffeyville Fertilizer Facility with pet coke could negatively impact the Nitrogen Fertilizer Segment’s results of operations.
Unlike our competitors, whose primary costs are related to the purchase of natural gas and whose costs are therefore largely variable, our Coffeyville Fertilizer Facility uses a pet coke gasification process to produce nitrogen fertilizer. Our profitability is directly affected by the price and availability of pet coke obtained from our Coffeyville Refinery under the Coffeyville MSA. Our Coffeyville Fertilizer Facility obtained 46% of its pet coke from our Coffeyville Refinery in 2024. Should our Coffeyville Refinery fail to perform in accordance with the existing agreement or to the extent pet coke from the Coffeyville Refinery is insufficient, we would need to purchase pet coke from third parties on the open market, which could negatively impact our results of operations to the extent third-party pet coke is unavailable or available only at higher prices. Currently, we purchase 100% of the pet coke our Coffeyville Refinery produces. However, we are still required to procure additional pet coke at fixed prices from third parties to maintain our production rates. We have contracts for 280,000 tons of third-party supply of pet coke through December 2025.
The market for natural gas has been volatile, and fluctuations in natural gas prices could affect our competitive position.
Low natural gas prices benefit our competitors that rely on natural gas as their primary feedstock and disproportionately impact our operations at our Coffeyville Fertilizer Facility by making us less competitive with natural gas-based nitrogen fertilizer manufacturers. Low natural gas prices could result in nitrogen fertilizer pricing reductions and impair the ability of the Coffeyville Fertilizer Facility to compete with other nitrogen fertilizer producers who use natural gas as their primary feedstock, which, therefore, would have a material adverse impact on our results of operations, financial condition and ability to pay dividends.
The East Dubuque Fertilizer Facility uses natural gas as its primary feedstock, and as such, the profitability of operating the East Dubuque Fertilizer Facility is significantly dependent on the cost of natural gas. An increase in natural gas prices, without a corresponding increase to nitrogen fertilizer pricing, could make the East Dubuque Fertilizer Facility less competitive with producers who do not use natural gas as their primary feedstock. In addition, an increase in natural gas prices in the United States relative to prices of natural gas paid by foreign nitrogen fertilizer producers may negatively affect our competitive position in the corn belt, and such changes could have a material adverse effect on our results of operations, financial condition, and cash flows.
Our nitrogen fertilizer business depends in large part on third-party suppliers, which could have a material adverse effect on our results of operations, financial condition and cash flows.
Our nitrogen fertilizer business depends in large part on the performance of third-party suppliers, such as the adjacent third-party air separation plant and a third-party electric supplier. Our East Dubuque Fertilizer Facility operations also depend in large part on the performance of third-party suppliers, including for the purchase of electricity. Should these, or any of our other third-party suppliers fail to perform in accordance with existing contractual arrangements, or should we otherwise lose the service of any third-party suppliers, our operations (or a portion thereof) could be forced to halt. Alternative sources of supply could be difficult to obtain. Any shutdown of our operations (or a portion thereof), even for a limited period, could have a material adverse effect on our results of operations, financial condition and ability to pay dividends.
Any liability for accidents involving ammonia or other products we produce or transport that cause severe damage to property or injury to the environment and human health could have a material adverse effect on our results of operations, financial condition and ability to pay dividends.
Our business manufactures, processes, stores, handles, distributes and transports ammonia, which can be very volatile and extremely hazardous. Major accidents or releases involving ammonia could cause severe damage or injury to property, the environment, and human health, as well as a possible disruption of supplies and markets. Such an event could result in civil lawsuits, fines, penalties and regulatory enforcement proceedings, all of which could lead to significant liabilities. Any damage or injury to persons, equipment or property or other disruption of our ability to produce or distribute products could result in a
significant decrease in operating revenues and significant additional costs to replace or repair and insure our assets, which could have a material adverse effect on our results of operations, financial condition and ability to pay dividends.
In addition, we may incur significant losses or increased costs relating to the operation of railcars used for the purpose of carrying various products, including ammonia. Due to the dangerous and potentially hazardous nature of the cargo we carry, in particular ammonia, a railcar accident may result in fires, explosions, and releases of material which could lead to sudden, severe damage or injury to property, the environment, and human health. In the event of contamination, under environmental law, we may be held responsible even if we are not at fault, and we complied with the laws and regulations in effect at the time of the accident. Litigation arising from accidents involving ammonia and other products we produce or transport may result in us being named as a defendant in lawsuits asserting claims for substantial damages, which could have a material adverse effect on our results of operations, financial condition and ability to pay dividends.
Risks Related to Our Capital Structure
Instability and volatility in the capital, credit, and commodity markets in the global economy could negatively impact our business, financial condition, results of operations and cash flows.
Our business, financial condition and results of operations could be negatively impacted by difficult conditions and volatility in the capital, credit, and commodities markets and in the global economy. For example, there can be no assurance that funds under our credit facilities will be available or sufficient, and in such a case, we may not be able to successfully obtain additional financing on favorable terms, or at all; market volatility could exert downward pressure on the price of CVR Partners’ common units, which may make it more difficult for us to raise additional capital and thereby limit its ability to grow, which could in turn cause CVR Energy’s stock and/or CVR Partners’ unit price to drop; or customers experiencing financial difficulties may fail to meet their financial obligations when due because of bankruptcy, lack of liquidity, operational failure, or other reasons could result in decreased sales and earnings for us.
Our indebtedness may increase and affect our ability to operate our businesses, and have a material adverse effect on our financial flexibility, financial condition and results of operations.
Although existing credit facilities contain restrictions on the occurrence of additional indebtedness, these restrictions are subject to a number of qualifications and exceptions and, under certain circumstances, additional indebtedness incurred in compliance with these restrictions could be substantial and secured. The level of indebtedness could have important consequences, including the following: (i) limiting our ability to obtain additional financing to fund working capital needs, capital expenditures, debt service requirements, acquisitions, general corporate, or other purposes; (ii) requiring us to utilize a significant portion of cash flows to service indebtedness, thereby reducing our funds available for operations, future business opportunities, and distributions to us and public common unitholders of CVR Partners; (iii) limiting our ability to use operating cash flow in other areas of our business because we must dedicate a substantial portion of these funds to service debt; (iv) limiting our ability to compete with other companies who are not as highly leveraged, as we may be less capable of responding to adverse economic and industry conditions; (v) limiting our ability to make certain payments on debt that is subordinated or secured on a junior basis; (vi) restricting the way in which we conduct business because of financial and operating covenants, including regarding borrowing additional funds, disposing of assets, and in the case of certain indebtedness of subsidiaries, restricting the ability of subsidiaries to pay dividends or make distributions; (vii) limiting our ability to enter into certain transactions with our affiliates; (viii) limiting our ability to designate our subsidiaries as unrestricted subsidiaries; (ix) exposing us to potential events of default (if not cured or waived) under financial and operating covenants contained in their or their respective subsidiaries’ debt instruments; (x) increasing our vulnerability to general adverse economic and industry conditions or adverse pricing of products; (xi) increasing the likelihood for a reduction in the borrowing base under CVR Energy’s Amended and Restated ABL Credit Facility (the “CVR Energy ABL”), which certain subsidiaries of the Company are parties to, following a periodic redetermination could require us to repay a portion of our then-outstanding bank borrowings; and (xii) limiting our ability to react to changing market conditions in our industries and in respective customers’ industries.
Covenants in our debt agreements could limit our ability to incur additional indebtedness and engage in certain transactions, as well as limit operational flexibility, which could adversely affect our liquidity and ability to pursue our business strategies.
Our debt facilities and instruments contain, and any instruments governing future indebtedness would likely contain, a number of covenants that impose significant operating and financial restrictions on us and our subsidiaries and may limit our
ability to engage in acts that may be in our long-term best interest, including restrictions on the ability, among other things, to: incur, assume, or guarantee additional indebtedness or issue redeemable or preferred stock; pay dividends or distributions in respect of equity securities or make other restricted payments; prepay, redeem, or repurchase certain debt; enter into agreements that restrict distributions from restricted subsidiaries; make certain payments on debt that is subordinated or secured on a junior basis; make certain investments; sell or otherwise dispose of assets, including capital stock of subsidiaries; create liens on certain assets; consolidate, merge, sell, or otherwise dispose of all or substantially all assets; enter into certain transactions with affiliates; and designate subsidiaries as unrestricted subsidiaries.
Any of these restrictions could limit our ability to plan for or react to market conditions and could otherwise restrict operating activities. Any failure to comply with these covenants could result in a default under existing debt facilities and instruments. Upon a default, unless waived, the lenders under such debt facilities and instruments would have all remedies available to a secured lender and could elect to terminate their commitments, cease making further loans, institute foreclosure proceedings against assets, and force bankruptcy or liquidation, subject to any applicable intercreditor agreements. In addition, a default under existing debt facilities and instruments would trigger a cross default under other agreements and could trigger a cross default under the agreements governing future indebtedness. Our segments’ results may not be sufficient to service existing indebtedness or to fund other expenditures, and we may not be able to obtain financing to meet these requirements.
We may not be able to generate sufficient cash to service existing indebtedness and may be forced to take other actions to satisfy debt obligations that may not be successful.
Our ability to satisfy existing debt obligations will depend upon, among other things: future financial and operating performance, which will be affected by prevailing economic conditions and financial, business, regulatory, and other factors, many of which are beyond our control; future ability to borrow under the CVR Energy ABL and the CVR Partners’ ABL, the availability of which depends on, among other things, complying with the covenants in the applicable facility and with covenants in our new term loan facility in the amount of $325 million (the “Term Loan”); and future ability to obtain other financing.
During the second half of 2024, certain external factors such as volatile commodity pricing, higher industry utilization and oversupply had an unfavorable impact on our business, especially on our Petroleum Segment, and negatively impacted cash from operations, our primary source of liquidity. The fire incident at the Wynnewood Refinery in the second quarter of 2024 and weather-related external power outages at both refineries in the third quarter of 2024 also contributed to the negative impact on our cash from operations during the second half of 2024, as further discussed in Part II, Item 7, “Management’s Discussion and Analysis of Financial Condition and Results of Operations—Liquidity and Capital Resources” of this Report. We cannot offer any assurance that our businesses will generate sufficient cash flow from operations, or that we will be able to draw under our credit facilities or from other sources of financing, in an amount sufficient to fund respective liquidity needs. In addition, our Board may in the future elect to pursue other strategic options, including acquisitions of other businesses or asset purchases, which would reduce cash available to service our debt obligations.
If cash flows and capital resources are insufficient to service existing indebtedness, we may be forced to reduce or delay capital expenditures, sell assets, seek additional capital, restructure or refinance existing indebtedness, or seek bankruptcy protection. These alternative measures may not be successful and may not permit the meeting of scheduled debt service and other obligations. Our ability to restructure or refinance debt will depend on the condition of the capital markets and our financial condition, including that of our segments, at such time. Any refinancing of existing debt could be at higher interest rates and may require compliance with more onerous covenants, which could further restrict business operations.
The borrowings under our credit facilities bear interest at variable rates and other debt we or they incur could likewise be variable-rate debt. If market interest rates increase, variable-rate debt will create higher debt service requirements, which could adversely affect our cash flow and/or distributions to us. Although we may enter into agreements limiting exposure to higher interest rates, any such agreements may not offer complete protection from this risk.
We are authorized to issue up to a total of 350 million shares of our common stock and 50 million shares of preferred stock, potentially diluting equity ownership of current holders and the share price of our common stock.
Our Board may authorize us to issue the available authorized shares of common stock or preferred stock without notice to, or further action by, our stockholders, unless stockholder approval is required by law or the rules of the NYSE. The issuance of
additional shares of common stock or preferred stock may significantly dilute the equity ownership of the current holders of our common stock.
An increase in interest rates will cause our debt service obligations to increase.
While the Federal Reserve lowered its target range for the federal funds rate 100 basis points in the later half of 2024, it previously raised the rate by 525 basis points from March 2022 through July 2023. Any subsequent increase in the interest rates associated with our floating rate debt would increase our debt service costs and affect our results of operations and cash flow available for payments of our debt obligations. In addition, an increase in interest rates could adversely affect our future ability to obtain financing or materially increase the cost of any additional financing. We cannot predict future U.S. fiscal policy, including with respect to interest rates, and adverse changes with respect thereto have resulted and could again result in a material adverse effect on our results of operations, financial condition and cash flows.
Risks Related to Our Corporate Structure
The Company’s reorganization of its entities and assets could trigger increased costs, complexity and risks.
In February 2023, the Company completed the transformation of its business to segregate its renewables business, which included the transfer of assets into multiple newly formed entities and the execution of contractual arrangements among the Company’s subsidiaries. Such reorganization could subject the Company to increased costs and operational complexity and other risks. The reorganization may not be successful for many reasons, including but not limited to adverse legal and regulatory developments that may affect particular business lines. Failure to manage risks relating to the reorganization could have a material adverse effect on our results of operations, financial condition and cash flows.
We are a holding company and depend upon our subsidiaries for our cash flow.
We are a holding company, and our subsidiaries conduct substantially all of our operations and own substantially all of our assets. Consequently, our cash flow and our ability to meet our obligations or to pay dividends or make other distributions in the future will depend upon the cash flow of our subsidiaries and the payment of funds by our subsidiaries to us in the form of distributions.
Mr. Carl C. Icahn exerts significant influence over the Company, and his interests or those of IEP or their affiliates may conflict with the interests of the Company’s other stockholders.
As of December 31, 2024, Mr. Carl C. Icahn indirectly controlled approximately 66% of the voting power of our common stock and, by virtue of such stock ownership, is able to control or exert substantial influence over the Company, including the election and appointment of directors; business strategy and policies; mergers or other business combinations; acquisition or disposition of assets; future issuances of common stock, common units, or other securities; occurrence of debt or obtaining other sources of financing; and the payment of dividends on the Company’s common stock and distributions on the common units of CVR Partners. The existence of a controlling stockholder may have the effect of making it difficult for, or may discourage or delay, a third-party from seeking to acquire a majority of the Company’s outstanding common stock, which may adversely affect the market price of the Company’s common stock. On January 8, 2025, IEP acquired via cash tender offer a total of 878,212 additional shares at a price of $18.25 per share, increasing his indirect control of CVR Energy’s outstanding common stock to approximately 67%. In connection with the tender offer, the Company entered into a Tender Offer Agreement (the “Tender Offer Agreement”) among the Company, IEP, Icahn Enterprises Holdings L.P. (“Icahn Enterprises”) and Mr. Carl C. Icahn (together with IEP and Icahn Enterprises, the “Icahn Parties”), pursuant to which Icahn Enterprises agreed to commence a tender offer to purchase up to 17,753,322 of the outstanding shares of the Company’s common stock, par value $0.01 per share (collectively, the “TO Shares”), at a price of $18.25 per TO Share, subject to any required withholding of taxes, net to seller in cash, without interest (the “Offer”). Pursuant to the terms of the Tender Offer Agreement, the Company filed with the SEC a Solicitation/Recommendation Statement on Schedule 14D-9 disclosing that a special committee of the Board had determined to express no opinion and remain neutral with respect to the Offer. The foregoing description of the Tender Offer Agreement is qualified in its entirety by reference to the Tender Offer Agreement, which is incorporated by reference as Exhibit 10.45 to this Report and is incorporated herein by reference.
Mr. Icahn’s interests may not always be consistent with the Company’s interests or with the interests of the Company’s other stockholders. Mr. Icahn and entities controlled by him may also pursue acquisitions or business opportunities in industries
in which we compete, and there is no requirement that any additional business opportunities be presented to us. We also have and may in the future enter into transactions to purchase goods or services with affiliates of Mr. Icahn. To the extent that conflicts of interest may arise between the Company and Mr. Icahn and his affiliates, those conflicts may be resolved in a manner adverse to the Company or its other stockholders.
In addition, in the event of a sale or transfer of some or all of Mr. Icahn’s interests in us to an unrelated party or group, a change of control could be deemed to have occurred under the terms of the indenture governing CVR Energy’s 5.750% Senior Notes due 2028, under the indenture governing CVR Partners’ 6.125% Senior Secured Notes due 2028 and under the indenture governing CVR Energy’s 8.500% Senior Notes due 2029, which, in each case, could require the issuers to offer to repurchase all outstanding notes at 101% of their principal amount plus accrued interest to the date of repurchase, and an event of default could be deemed to have occurred under the CVR Energy ABL and the CVR Partners ABL, which, in each case, could allow lenders to accelerate indebtedness owed to them. If such an event were to occur, it is possible that we will not have sufficient funds at the time of the change of control to make the required repurchase of notes or repay amounts outstanding under the CVR Energy ABL or the CVR Partners ABL, if any.
Our stock price may decline due to sales of shares by Mr. Carl C. Icahn.
Sales of substantial amounts of the Company’s common stock, or the perception that these sales may occur, may adversely affect the price of the Company’s common stock and impede its ability to raise capital through the issuance of equity securities in the future. Mr. Icahn could elect in the future to request that the Company file a registration statement to sell shares of the Company’s common stock. If Mr. Icahn were to sell a large number of shares into the public markets, or if investors perceived that such a sale may occur, the price of the Company’s common stock could decline. We cannot predict future fluctuations in our stock price resulting from actions of Mr. Icahn, nor can we control perceptions in the market or investor sentiment with respect to actions Mr. Icahn may or may not take concerning his ownership of our common stock.
We are a “controlled company” within the meaning of the NYSE rules and, as a result, qualify for, and are relying on, exemptions from certain corporate governance requirements.
A company of which more than 50% of the voting power is held by an individual, a group, or another company is a “controlled company” within the meaning of the NYSE rules and may elect not to comply with certain corporate governance requirements of the NYSE, including the requirements that a majority of our Board consist of independent directors; we have a nominating/corporate governance committee that is composed entirely of independent directors; and we have a compensation committee that is composed entirely of independent directors. We are relying on all of these exemptions as a controlled company. Accordingly, our stockholders may not have the same protections afforded to stockholders of companies that are subject to all of the corporate governance requirements of the NYSE. In addition, CVR Partners is relying on exemptions from the same NYSE corporate governance requirements described above.
We have various mechanisms in place to discourage takeover attempts, which may reduce or eliminate our stockholders’ ability to sell their shares for a premium in a change of control transaction.
Various provisions of our amended certificate of incorporation and second amended and restated bylaws and of Delaware corporate law may discourage, delay, or prevent a change in control or takeover attempt of our Company by a third-party. Public stockholders who might desire to participate in such a transaction may not have the opportunity to do so. These anti-takeover provisions could substantially impede the ability of public stockholders to benefit from a change of control or change in our management and Board. These provisions include preferred stock that could be issued by our Board to make it more difficult for a third-party to acquire, or to discourage a third-party from acquiring, a majority of our outstanding voting stock; limitations on the ability of stockholders to call special meetings of stockholders; limitations on the ability of stockholders to act by written consent in lieu of a stockholders’ meeting; and advance notice requirements for nominations of candidates for election to our Board or for proposing matters that can be acted upon by our stockholders at stockholder meetings.
Compliance with and changes in the tax laws could adversely affect our performance.
We are subject to extensive tax liabilities, including U.S. federal and state income taxes and transactional taxes such as excise, sales/use, payroll, franchise, and withholding taxes. New tax laws and regulations are continuously being enacted or proposed that could result in increased expenditures for tax liabilities in the future. We cannot predict whether any future
changes to U.S. tax policy, including as a result of the new presidential administration, will occur, nor can we predict the impact to our business of any such changes.
In August 2022, President Biden signed into law the Inflation Reduction Act. This law imposes, among other things, a 15% corporate alternative minimum tax on adjusted financial statement income, and a 1% excise tax on certain corporate stock repurchases occurring after December 31, 2022. We do not expect any material impacts from these provisions.
Risks Related to Our Ownership in CVR Partners
If CVR Partners were to be treated as a corporation for U.S. federal income tax purposes or if it becomes subject to entity-level taxation for state tax purposes, its cash available for distribution to its common unitholders, including to us, would be substantially reduced, likely causing a substantial reduction in the value of its common units, including the common units held by us.
The anticipated after-tax economic benefit of an investment in common units of CVR Partners depends largely on it being treated as a partnership for U.S. federal income tax purposes. Despite the fact that CVR Partners is organized as a limited partnership under Delaware law, it would be treated as a corporation for U.S. federal income tax purposes unless it satisfies a “qualifying income” requirement. CVR Partners may not find it possible to meet this qualifying income requirement, may inadvertently fail to meet this qualifying income requirement, or a change in current law could cause CVR Partners to be treated as a corporation for U.S. federal income tax purposes or otherwise subject CVR Partners to entity-level taxation. If CVR Partners were to be treated as a corporation for U.S. federal income tax purposes, it would pay U.S. federal income tax on all of its taxable income at the corporate tax rate. Distributions to its common unitholders (including us) would generally be taxed again as corporate distributions, and no income, gains, losses, or deductions would flow through to such common unitholders. Because a tax would be imposed upon CVR Partners as a corporation, its cash available for distribution to its common unitholders would be substantially reduced. Therefore, treatment of CVR Partners as a corporation would result in a material reduction in the anticipated cash flow and after-tax return to its common unitholders (including us), likely causing a substantial reduction in the value of such common units.
We may have liability to repay distributions that are wrongfully distributed to us.
Under certain circumstances, we may, as a holder of common units in CVR Partners, have to repay amounts wrongfully returned or distributed to us. Under the Delaware Revised Uniform Limited Partnership Act, a partnership may not make distributions to its unitholders if the distribution would cause its liabilities to exceed the fair value of its assets. Delaware law provides that for a period of three years from the date of an impermissible distribution, limited partners who received the distribution and who knew at the time of the distribution that it violated Delaware law will be liable to the company for the distribution amount.
Public investors own approximately 61% of the Nitrogen Fertilizer Segment through CVR Partners. Although we own the general partner of CVR Partners, the general partner owes a duty of good faith to public unitholders, which could cause them to manage their respective businesses differently than if there were no public unitholders.
As of December 31, 2024, public investors own approximately 61% of CVR Partners’ outstanding common units. We are not entitled to receive all of the cash generated by CVR Partners or freely transfer money to finance operations at the Petroleum Segment. Furthermore, although we own the general partner of CVR Partners, the general partner is subject to certain fiduciary duties, which may require the general partner to manage its business in a way that may differ from our best interests.
CVR Partners is managed by the executive officers of its general partner, who are employed by and also serve as part of the senior management team of the Company. Conflicts of interest could arise as a result of this arrangement.
CVR Partners is managed by the executive officers of its general partner, who are employed by and also serve as part of the senior management team of the Company. Furthermore, although CVR Partners has entered into a service agreement with the Company under which it compensates the Company for the services of its management, our management is not required to devote any specific amount of time to the Nitrogen Fertilizer Segment and may devote a substantial majority of their time to other business of the Company. Moreover, the Company may terminate the services agreement with CVR Partners at any time, subject to a 90-day notice period. In addition, key executive officers of the Company, including its president and chief
executive officer, chief financial officer, and general counsel, will face conflicts of interest if decisions arise in which CVR Partners and the Company have conflicting points of view or interests.
General Risks Related to CVR Energy
The acquisition, expansion and investment strategy of our businesses involves significant risks.
From time to time, we may consider pursuing acquisitions of businesses or assets and expansion projects to continue to grow and increase profitability. We also may make investments in other entities. There can be no assurance that we will be able to consummate any acquisitions or expansions, successfully integrate acquired businesses or entities, or generate positive cash flow at any acquired company or expansion project. Challenges that may lead to failed consummation of an expansion/acquisition include intense competition for suitable acquisition targets, the potential unavailability of financial resources necessary, difficulties in securing sufficiently favorable terms, and the failure to obtain requisite regulatory or other governmental approvals or the approval of equity holders of the entities in which we have invested, and efforts concerning an expansion/acquisition will require significant time and attention from our management, which could distract them from the operation of our business. In addition, any future acquisitions, expansions or investments may entail significant transaction costs and risks associated with entry into new markets and lines of business, including but not limited to new regulatory obligations and risks, and integration challenges such as disruption of operations; failure to achieve financial or operating objectives contributing to the accretive nature of an acquisition; strain on controls, procedures and management; the need to modify systems or to add management resources; the diversion of management time from the operation of our business; customer and personnel retention; assumption of unknown material liabilities or regulatory non-compliance issues; amortization of acquired assets, which would reduce future reported earnings; and possible adverse short-term effects on our cash flows or operating results. Also, our investments may not be successful for many reasons, including, but not limited to, lack of control; worsening of general economic and market conditions; or adverse legal and regulatory developments that may affect particular businesses. Failure to manage these acquisition, expansion and investment risks could have a material adverse effect on our results of operations, financial condition and cash flows. Our joint ventures involve similar risks.
We are subject to the risk of becoming an investment company.
From time to time, we may own less than a 50% interest in other public companies, which exposes us to the risk of inadvertently becoming an investment company required to register under the Investment Company Act of 1940 (“ICA”). Events beyond our control, including significant appreciation or depreciation in the market value of certain of our publicly traded holdings or adverse developments, could result in our inadvertently becoming an investment company required to register under the ICA and subject to extensive, restrictive and potentially adverse regulations relating to, among other things, operating methods, management, capital structure, dividends and transactions with affiliates, and could also be subject to monetary penalties or injunctive relief for failure to register as such.
Internally generated cash flows and other sources of liquidity may not be adequate for the capital needs of our businesses.
Our businesses are capital intensive, and working capital needs may vary significantly over relatively short periods of time. For instance, crude oil price volatility can significantly impact working capital on a week-to-week and month-to-month basis. Operational issues at our facilities, including the fire incident at the Wynnewood Refinery in the second quarter of 2024 and weather-related external power outages at both refineries in the third quarter of 2024, negatively impacted our cash from operations during 2024. Moreover, the planned turnaround at the Coffeyville Refinery started in January 2025, with a total estimated cash outlay of $175 million to $200 million. As a result of these factors, the Board elected to suspend payment of the cash dividend in October 2024 and has implemented additional cost-saving factors that are discussed in Part II, Item 7, “Management’s Discussion and Analysis of Financial Condition and Results of Operations—Liquidity and Capital Resources” of this Report. If we cannot generate adequate cash flow or otherwise secure sufficient liquidity to meet our working capital needs or support our short-term and long-term capital requirements, we may be unable to meet our debt obligations, pursue our business strategies, or comply with certain environmental standards, which would have a material adverse effect on our business and results of operations.
Our ability to pay dividends on our common stock is subject to market conditions and numerous other factors.
Dividends are subject to change at the discretion of the Board and may change from quarter to quarter and may not be paid at historical rates or at all. Our ability to continue paying dividends is subject to our ability to continue to generate sufficient
cash flow from our segments, and the amount of dividends we are able to pay each year may vary, possibly substantially, based on market conditions, crack spreads, our capital expenditure and other business needs, covenants contained in any debt agreements we may enter into in the future, covenants contained in existing debt agreements, and the amount of distributions we receive from CVR Partners. If the amount of our dividends decreases, the trading price of our common stock could be materially adversely affected as a result. As described further below, volatile commodity pricing and higher industry utilization and oversupply have had an unfavorable impact on our business and have negatively impacted our cash from operating activities and liquidity. As a result, in October 2024, the Board elected to suspend payment of the cash dividend, defer new growth capital spending, and reduce certain expected capital expenditures, as further discussed in Part II, Item 7, “Management’s Discussion and Analysis of Financial Condition and Results of Operations—Liquidity and Capital Resources” of this Report.
Item 1B. Unresolved Staff Comments
None.
Item 1C. Cybersecurity
The Company has implemented processes to assess, identify and manage material risks resulting from cybersecurity incidents. Our Cybersecurity program and processes are based upon the International Standards Organization (“ISO”) guidance on information security. The Company’s processes used to identify, assess, and mitigate cybersecurity risks are integrated into the Company’s broader risk management system and processes, including through the risk management activities of the Board and its Audit Committee, our Enterprise Risk Management Committee (“ERM Committee”), and our internal audit and information technology functions. Refer to Part I, Item 1A, “Risk Factors—We are subject to cybersecurity risks and may experience cyber incidents resulting in disruption or harm to our businesses” of this Report for further discussion of our processes for managing cybersecurity risks.
Board Oversight of Cybersecurity Matters
The Board considers oversight of CVR Energy’s risks and risk management activities, including those related to cybersecurity risk, to be a responsibility of the entire Board. The Board also delegates certain risk oversight responsibilities to certain of its committees, and oversight of the Company’s cybersecurity risk is delegated by the Board to its Audit Committee. The Audit Committee receives regular reports, typically on a quarterly basis, from management regarding information technology, cybersecurity risk, AI use and governance, and efforts to prevent and mitigate such risks. The Chairperson of the Audit Committee subsequently reports on these activities to the full Board, which equips the Board and its committees to fulfill their risk oversight role.
The Board and Audit Committee are supported in their oversight capacity by the Company’s ERM Committee, and internal audit and information technology functions. On a quarterly basis, the ERM Committee evaluates past, existing, and future risks to the Company; the likelihood, severity, and velocity of such risks; and the controls and mitigation tools implemented to address such risk. Several members of the ERM Committee have functional responsibility for the Company’s information technology and cybersecurity risk monitoring activities and provide expertise to the ERM Committee in those areas.
Likewise, the Company’s internal audit function periodically performs audit engagements focused on information technology processes and cybersecurity risks. These audits have provided the Company with assessments of the effectiveness and efficiency of our information technology and cyber threat management processes with the goal of safeguarding Company assets and information.
Management of Cybersecurity Matters
At the management level, the Company’s cybersecurity risk management activities are led by our Chief Executive Officer and his executive team and is integrated into the day-to-day activities of the Company’s information technology function led by our Chief Information Officer, who operates under the supervision of our Chief Financial Officer, and reports regularly to the Audit Committee on cybersecurity risks, typically on a quarterly basis. The Company’s information technology function has a dedicated cybersecurity team comprised of employees with, on average, nearly 20 years of experience and expertise in cybersecurity, and includes individuals with degrees in Computer Studies and cybersecurity-related certifications including
Certified Information Systems Security Specialist (CISSP), Certified in Risk and Information Systems Controls (CRISC), and Certified Information Security Manager (CISM).
Management utilizes certain tools and controls to detect, monitor, prevent, mitigate, and remediate cybersecurity threats to our systems, networks, applications, and data. Management also conducts annual cybersecurity training and periodic phishing tests, which provide contemporaneous feedback and instruction to our employees and seek to strengthen the Company’s defenses against cyber threats. Management also monitors AI usage and has implemented a framework that tracks use and is governed by CVR Energy’s Artificial Intelligence Policy, which was most recently updated in 2024, and includes a review and approval process for adopting use of AI tools. Such governance activities are designed to mitigate the risks presented by AI. Management also monitors AI usage and has implemented a framework that tracks use and is governed by the Company’s Artificial Intelligence Policy, which was most recently updated in 2024, and includes a review and approval process for adopting use of AI tools. Such governance activities are designed to mitigate the risks presented by AI. Lastly, management maintains information security incident response processes to guide response and mitigate impact in the event of a cybersecurity incident. A third-party cybersecurity service provider is on retainer to assist the Company should a cybersecurity incident occur.
Engagement of Third Parties
The ERM Committee, internal audit function, information technology function and various other groups each occasionally engage third-party service providers to assist in their management of cybersecurity risk, including but not limited to cybersecurity vendors, assessors, consultants, auditors, and other third parties. The information technology function maintains processes to oversee and identify cyber risks associated with the Company’s use of third-party service providers who may have access to sensitive Company data and systems.
Material Impact on Company
During 2024, the Company did not experience any cybersecurity threats or incidents that have materially affected or are reasonably likely to materially affect the Company, including its business strategy, results of operations, or financial condition.
Item 2. Properties
Refer to Part I, Item 1, “Petroleum”, “Renewables”, and “Nitrogen Fertilizer” of this Report for more information on our core business properties. We also lease property for our executive and marketing offices in Sugar Land, Texas and Kansas City, Kansas, respectively.
Item 3. Legal Proceedings
In the ordinary course of business, we may become party to lawsuits, administrative proceedings, and governmental investigations, including environmental, regulatory, and other matters. Large, and sometimes unspecified, damages or penalties may be sought from us in some matters and certain matters may require years to resolve. Refer to Part II, Item 8, Note 14 (“Commitments and Contingencies”) of this Report for further discussion on current litigation matters.
Item 4. Mine Safety Disclosures
Not applicable.
PART II
Item 5. Market For Registrant’s Common Equity, Related Stockholder Matters and Issuer Purchases of Equity Securities
Performance Graph
The performance graph below compares the cumulative total return of our common stock to (a) the cumulative total return of the S&P 500 Composite Index and (b) a composite peer group (“Peer Group”) consisting of Delek US Holdings, Inc., HF Sinclair Corporation, Marathon Petroleum Corp., Par Pacific Holdings, Inc., PBF Energy Inc. and Valero Energy Corporation. The graph assumes that the value of the investment in common stock and each index was $100 on December 31, 2019 and that all dividends were reinvested. Investment is weighted on the basis of market capitalization.
The share price performance shown on the graph is not necessarily indicative of future price performance. Information used in the graph was obtained from Yahoo! Finance (finance.yahoo.com). The performance graph above is furnished and not filed for purposes of the Securities Act and the Exchange Act. The performance graph is not soliciting material subject to Regulation 14A.
Market Information
Our common stock is listed under the symbol “CVI” on the New York Stock Exchange (“NYSE”). The Company has 107 holders of record of the outstanding shares as of December 31, 2024.
Item 6. [Reserved]
Item 7. Management’s Discussion and Analysis of Financial Condition and Results of Operations
The following discussion and analysis of our financial condition, results of operations and cash flows should be read in conjunction with our consolidated financial statements and related notes and with the statistical information and financial data included elsewhere in this Report, as well as Part I, Item 1, “Business” and Part I, Item 1A, “Risk Factors” of this Report. References to “CVR Energy”, “CVR”, the “Company”, “we”, “us”, and “our” may refer to consolidated subsidiaries of CVR Energy, including CVR Partners, as the context may require.
With the exception of the Renewables Segment, as defined below, which discusses year-to-year comparisons between all periods presented, this discussion and analysis covers the years ended December 31, 2024 and 2023 and includes year-to-year
comparisons between such periods. The discussions of the year ended December 31, 2022 and year-to-year comparisons between the years ended December 31, 2023 and 2022 are not included in this Report but can be found in “Management’s Discussion and Analysis of Financial Condition and Results of Operations” in Part II, Item 7 of the Company’s Annual Report on Form 10-K for the fiscal year ended December 31, 2023 filed on February 21, 2024, and such discussions are incorporated by reference into this Report.
Reflected in this discussion and analysis is how management views the Company’s current financial condition and results of operations, along with key external variables and management’s actions that may impact the Company. This discussion may contain forward-looking statements that reflect our plans, estimates and beliefs. Our actual results could differ materially from those discussed in the forward-looking statements. Factors that could cause or contribute to such differences include, but are not limited to, those discussed below and elsewhere in this Report.
Company Overview
CVR Energy is a diversified holding company primarily engaged in the petroleum refining and marketing industry (the “Petroleum Segment”), the renewable fuels industry (the “Renewables Segment”), and the nitrogen fertilizer manufacturing industry through its interest in CVR Partners, LP, a publicly traded limited partnership (the “Nitrogen Fertilizer Segment” or “CVR Partners”). The Petroleum Segment is an “independent petroleum refiner”, in that it does not have crude oil exploration or production operations and is a marketer of high value transportation fuels primarily in the form of gasoline and diesel fuels. The Renewables Segment refines feedstocks, including soybean oil, corn oil, and other related renewable feedstocks, into renewable diesel. CVR Partners produces and markets nitrogen fertilizers primarily in the form of urea ammonium nitrate (“UAN”) and ammonia.
We operate under three reportable segments: petroleum, renewables, and nitrogen fertilizer, which are referred to in this document as our “Petroleum Segment”, our “Renewables Segment”, and our “Nitrogen Fertilizer Segment”, respectively.
Strategy and Goals
The Company has adopted Mission and Values, which articulate the Company’s expectations for how it and its employees do business each and every day.
Mission and Core Values
Our Mission is to be a top tier North American renewable fuels, petroleum refining, and nitrogen-based fertilizer company as measured by safe and reliable operations, superior performance and profitable growth. The foundation of how we operate is built on five core Values:
•Safety - We always put safety first. The protection of our employees, contractors and communities is paramount. We have an unwavering commitment to safety above all else. If it’s not safe, then we don’t do it.
•Environment - We care for our environment. Complying with all regulations and minimizing any environmental impact from our operations is essential. We understand our obligation to the environment and that it’s our duty to protect it.
•Integrity - We require high business ethics. We comply with the law and practice sound corporate governance. We only conduct business one way—the right way with integrity.
•Corporate Citizenship - We are proud members of the communities where we operate. We are good neighbors and know that it’s a privilege we can’t take for granted. We seek to make a positive economic and social impact through our financial donations and the contributions of time, knowledge and talent of our employees to the places where we live and work.
•Continuous Improvement - We believe in both individual and team success. We foster accountability under a performance-driven culture that supports creative thinking, teamwork, diversity and personal development so that employees can realize their maximum potential. We use defined work practices for consistency, efficiency and to create value across the organization.
Our core Values are driven by our people, inform the way we do business each and every day and enhance our ability to accomplish our mission and related strategic objectives.
Strategic Objectives
We have outlined the following strategic objectives to drive the accomplishment of our mission:
•Environmental, Health & Safety (“EH&S”) - We aim to achieve continuous improvement in all EH&S areas through ensuring our people’s commitment to environmental, health and safety comes first, the refinement of existing policies, continuous training, and enhanced monitoring procedures.
•Reliability - Our goal is to achieve industry-leading utilization rates at our facilities through safe and reliable operations. We are focusing on improvements in day-to-day plant operations, identifying alternative sources for plant inputs to reduce lost time due to third-party operational constraints, and optimizing our commercial and marketing functions to maintain plant operations at their highest level.
•Market Capture - We continuously evaluate opportunities to improve the facilities’ realized pricing at the gate and reduce variable costs incurred in production to maximize our capture of market opportunities.
•Financial Discipline - We strive to be as efficient as possible by maintaining low operating costs and disciplined deployment of capital.
Potential Strategic Transactions
As previously disclosed in a Schedule 13D amendment filed on March 18, 2024, Icahn Enterprises L.P. and its affiliates (“IEP”) and the Company are considering potential strategic transactions available to the Company and our subsidiaries, which may include the acquisition of additional entities, assets or businesses, including the acquisition of material amounts of refining assets through negotiated mergers or stock or asset purchase agreements by the Company or our subsidiaries. IEP may participate in such acquisitions, including by providing financing to us or our subsidiaries through the acquisition of additional equity of us or our subsidiaries, providing loans to us or our subsidiaries or otherwise. In addition, IEP and the Company are considering strategic options involving CVR Partners, which may include the acquisition by IEP, the Company, a combination of IEP and the Company or other affiliated entities of some or all of the outstanding common units of CVR Partners not already indirectly owned by the Company (the “public common units”), the sale of CVR Partners or the Company’s interest therein, or other transactions. Any such acquisition, sale or transaction could be effectuated through open market purchases, tender or exchange offers, exercise of the limited call right contained in CVR Partners’ limited partnership agreement, value enhancing partnerships, negotiated merger transactions, privately negotiated transactions, sale transactions or otherwise. At this time, there can be no assurance that IEP or the Company will pursue any such potential strategic transactions or that any transactions, if pursued, will be completed on attractive terms or at all.
Recent Events
As described further below, volatile commodity pricing and higher industry utilization and oversupply have had an unfavorable impact on our business and have negatively impacted our cash from operating activities and liquidity. As a result, the Board elected to suspend payment of the cash dividend, defer new growth capital spending, and reduce certain expected capital expenditures, as further discussed in Part II, Item 7, “Management’s Discussion and Analysis of Financial Condition and Results of Operations—Liquidity and Capital Resources” of this Report.
On December 19, 2024, certain of the Company’s subsidiaries entered into a senior secured term loan facility in the amount of $325 million (the “Term Loan”), which was borrowed in full on the closing date.
On December 23, 2024, a subsidiary of the Company sold the 50% limited liability company interest (the “Membership Interests”) it owned in Midway Pipeline LLC (“Midway”) to Plains Pipeline, L.P. pursuant to an Assignment and Assumption of Units in exchange for cash consideration of approximately $90 million. Midway operates a crude oil pipeline that connects the Broome Station facility to Cushing, Oklahoma. In connection with the sale of the Membership Interests, a subsidiary of the
Company entered into a pipeline transportation agreement with Midway that allows the Company to deliver a variety of crude oils from Cushing, Oklahoma to the Coffeyville Refinery over the long-term.
In January 2025, we published our 2023 Environmental, Social & Governance Report (“2023 ESG Report”), which continues to benchmark our Company’s performance against specific Sustainability Accounting Standards Board metrics and is available at CVR Energy’s website at www.CVREnergy.com. Our 2023 ESG Report does not constitute a part of, and is not incorporated by reference into, this Annual Report on Form 10-K or any other report we file with (or furnish to) the SEC, whether made before or after the date of this Annual Report on Form 10-K.
Industry Factors and Market Indicators
General Business Environment
Geopolitical Matters - The Middle East conflict, which began in October 2023 and impacted global oil, fertilizer, and agriculture markets, alongside other conflicts, like the ongoing Russia-Ukraine war, continue to present significant geopolitical risks to global markets as does the potential for future trade wars and the potential changes in U.S. economic trade policy. These concerns, including the enforcement of sanctions, could lead to further oil price volatility and disruptions in the production and trade of fertilizer, grains, and feedstock through various means, such as trade restrictions. The ultimate outcome of these conflicts and/or economic policy, or further escalation or expansion thereof, and any associated market disruptions are difficult to predict and may affect our business, operations, and cash flows in unforeseen ways.
Regulatory Environment - In addition to existing regulations like the Renewable Fuel Standard (“RFS”) of the Clean Air Act, which significantly impacts our business, there have been several proposed and enacted climate-related rules and compliance requirements at federal, state, and international levels. While the Biden Administration had advanced significant climate-related initiatives, including stricter EPA emissions standards and the SEC’s proposed climate risk disclosure rule, recent changes under the Trump Administration following the 2024 U.S. presidential election has begun to and may further shift regulatory priorities. Through executive orders and regulatory rollbacks, certain of these initiatives have been curtailed or reevaluated and incentives to increase fossil fuel production have been promoted, creating a more uncertain regulatory landscape which may materially impact our business, operations, feedstock and compliance costs, results and market stability.
Petroleum Segment
The earnings and cash flows of the Petroleum Segment are primarily affected by the relationship between refined product prices and the prices for crude oil and other feedstocks that are processed and blended into refined products together with the cost of refinery compliance, including the cost of compliance with RFS regulations. The cost to acquire crude oil and other feedstocks and the price for which refined products are ultimately sold depends on factors beyond the Petroleum Segment’s control, including the supply of and demand for crude oil, as well as gasoline, distillate, and other refined products which, in turn, depend on, among other factors, changes in domestic and foreign economies, driving habits, weather conditions, domestic and foreign political affairs, production levels, the availability or permissibly of imports and exports, the marketing of competitive fuels, and the extent of government regulations. Because the Petroleum Segment applies first-in, first-out (“FIFO”) accounting to value its inventory, crude oil and refined product price movements may impact margin as a result of changes in the value of its unhedged inventory. The effect of changes in crude oil prices on the Petroleum Segment’s results of operations is also influenced by the rate at which the processing of refined products adjusts to reflect these changes.
The prices of crude oil and other feedstocks and refined products are also affected by other factors, such as product pipeline capacity, system inventory, local and regional market conditions, inflation, and the operating levels of other refineries. Crude oil costs and the prices of refined products have historically been subject to wide fluctuations. Widespread expansion or upgrades of third-party facilities, shutdowns, price volatility, international political and economic developments, and other factors are likely to continue to play an important role in refining industry economics. These factors can impact, among other things, the level of inventories in the market, resulting in price volatility and a reduction in product margins. Moreover, the refining industry typically experiences seasonal fluctuations in demand for refined products, such as increases in the demand for gasoline during the summer driving season and for volatile seasonal exports of diesel from the United States Gulf Coast. Specific factors impacting the Company’s operations are outlined below:
Current Market Outlook
•We characterize current crack spreads as below mid-cycle levels. This is due to a combination of the refined products market being oversupplied, as refinery utilization has been above the 5-year history for most of 2024, improved fleet mileage, and reduced manufacturing activity which has lead to weak gas and diesel demand.
•Winter 2023/2024 weather was warmer than average in North America and Europe and, when combined with natural gas conservation measures, has caused demand and prices for natural gas to fall significantly, which contributed to the flattening of the global cost curve and has reduced the U.S. refiners’ advantage compared to refiners in Europe. If similar conditions are experienced during the 2024/2025 winter, these impacts could persist into 2025.
•Industrial production slowed in 2024, and truck, rail, and ship tonnage and freight volumes were reduced, which lowered distillate pricing into 2025. In addition, distillate crack spreads continue to be pressured by the low price levels of natural gas causing a lack of distillate demand to generate electricity around the world. Moreover, new liquid natural gas (“LNG”) projects coming online and expansion of export capacity in the United States has contributed to the increase of global supply of natural gas and thus downward pressure on prices, and may also support fleet shifting from diesel to LNG. Gasoline and distillate pricing has continued to decline into 2025.
•Shale oil production continues to increase in the shale oil basins, albeit at a slower pace than in prior years, including in the Anadarko Basin. Crude oil exports have sustained a 4 million bpd rate, and we believe the Petroleum Segment benefits from these exports through the Brent crude differential to WTI, as do all refineries in PADD II.
•Refining capacity has increased around the world over the past two years, with major projects being completed in the Middle East, Asia, Mexico, and Africa. Refining capacity in the United States has also increased approximately 500,000 bpd from post-pandemic levels, mainly due to the completion of expansion projects that were underway pre-pandemic, and capacity creep. While these ongoing projects may encounter various challenges and come to market slower than anticipated, they have begun to and should have a growing impact on global oil and refined product flows. At the same time, these capacity expansions could be offset by additional conversions to renewable fuels production and further refinery fleet rationalization through planned shutdowns, or currently unplanned shutdowns due to future economic constraints given refined product consumption is slowing in the United States and remains weak in Europe. Currently announced refinery closures in the U.S. and Europe account for nearly 800,000 bpd of capacity expected to be shut in by the end of 2025.
•While renewable identification number (“RIN”) prices increased slightly during the fourth quarter of 2024, they are still lower than the fourth quarter of 2023. Production of renewable fuels in the United States continues to increase as new plants start up, which may continue through 2025. We also expect biomass based diesel RIN (“D4”) production to exceed the renewable volume obligation (“RVO”) significantly going forward, creating a RIN surplus. In June 2023, the Environmental Protection Agency (“EPA”) set the D4 RVO for 2024 and 2025 at 3.04 and 3.35 billion gallons, respectively. The EPA released a unified agenda during spring 2024 delaying finalization of the 2026 RFS rule until December 2025.
•In the fourth quarter of 2024, new electric vehicle sales in the United States increased approximately 15.2% from the fourth quarter of 2023. In 2023, miles per gallon of the new auto fleet continued to increase, averaging 27.1 miles per gallon (“MPG”). The EPA expects the new fleet average to increase in 2024 by approximately 1 MPG. Vehicle miles traveled continues to increase but the effect of electric vehicle (“EV”) penetration in the fleet is clear and present. We expect this trend to continue. Based on 9.2 billion miles traveled per day, a 1 MPG change in fuel efficiency represents approximately 300,000 bpd of gasoline demand.
•Asian refiners appear to be benefiting from discounted crude oil offered by sanctioned countries like Russia and Iran, adding product to an oversupplied global market.
•While the Chinese government has taken several steps to spur economic activity, the Chinese economy is still weighed by a weak property sector and lower domestic demand for transportation fuels. China has seen a significant increase in EV sales as well as the conversion of heavy trucks to LNG. Any lasting effects of these factors remains to be seen.
Regulatory Environment
We continue to be impacted by significant volatility and costs associated with current and proposed laws, rules, regulations and policies, including the reinterpretation and amplification thereof, relating to climate change, the RFS, energy transition and related matters.
•Certain of the Petroleum Segment’s subsidiaries are subject to the RFS (collectively, the “obligated-party subsidiaries”), which, each year, absent exemptions or waivers, requires such obligated-party subsidiaries to blend renewable fuels with transportation fuels, purchase RINs in lieu of blending, or otherwise face liability. Our cost to comply with the RFS is dependent upon a variety of factors, which include but are not limited to the availability of
ethanol and biodiesel for blending at our refineries and downstream terminals or RINs for purchase, the actions of RIN market participants including non-obligated parties, the price at which RINs can be purchased, transportation fuel and renewable diesel production levels and pricing including potential discounts thereto related to the RFS, the mix of our products, our refining margins and other factors, all of which can vary significantly from period to period, as well as certain waivers or exemptions to which we may be entitled. Our costs to comply with the RFS further depend on the consistent, timely, and legal administration of the RFS program by the EPA, including the EPA’s unlawful failure to establish the RVOs by their statutory deadlines, its subsequent promulgation of RVOs exceeding the blendwall, its delay in issuing and refusal to issue decisions on pending small refinery exemption (“SRE”) petitions, its subsequent denial of those SRE petitions, most of which have been overturned by courts, and its enabling non-obligated parties to generate, hoard and sell RINs. Our costs to comply with the RFS are also impacted by, and dependent upon the outcome of, the numerous lawsuits filed by multiple refiners including our obligated-party subsidiaries, biofuels groups and others. Refer to Part II, Item 8, Note 14 (“Commitments and Contingencies”) in this Report. As a result, our costs to comply with RFS (excluding the impacts of any exemptions or waivers to which the Petroleum Segment’s obligated-party subsidiaries may be entitled) increased significantly throughout 2022, remained significant through 2024 and is expected to remain significant through 2025 and beyond.
•In March 2024, the EPA finalized new motor vehicle emissions standards for light-, medium-, and heavy-duty vehicles for model year 2027 and beyond. As a result of these new standards, the EPA is expected to propose new automobile limits requiring at least 50% of new vehicles sold to be EVs by 2030. In the United States in 2024, approximately 8.1% of new-vehicle sales were EVs.
•During 2024, multiple bills were introduced in Congress that would extend the Biodiesel Blenders’ Tax Credit (“BTC”). While extensions of this tax incentive have been passed by Congress and signed into law close to, and even after, expiration dates in the past, we believe provisions of the Inflation Reduction Act that created the Clean Fuel Production Credit (“PTC”) could signal the end of the BTC, and if not renewed, would likely affect RIN prices.
Company Initiatives
•During 2024, the Company installed a fuel by rail facility at its Coffeyville Refinery which allows the Company to load gasoline, jet, and additional diesel into rail cars. This system allows the Company to ship refined products to high priced markets in PADD IV.
•The Company has undertaken a project to replace the hydrofluoric acid catalyst alkylation unit at the refinery in Wynnewood, Oklahoma (the “Wynnewood Refinery”) with a fixed bed catalyst system, which should expand the alkylation unit by approximately 2,500 bpd, increase product capture by reducing propylene production/sales and increase production of premium gasoline, and eliminate hydrofluoric acid inventory onsite. The capital investment is estimated at $136 million, and the unit is expected to become operational by the second quarter of 2027.
•In April 2024, the Board approved a distillate yield improvement project at the Wynnewood Refinery to modify one of the vacuum towers, which may increase distillate production at the refinery by up to approximately 4,000 bpd. Final completion is currently expected in 2027 at a capital cost of less than $15 million. The Company is also studying a similar project at the Coffeyville Refinery which will be installed in phases. Modification to the crude tower will be made in early 2025 during the scheduled turnaround.
•In connection with our settlement with the EPA on certain environmental issues at the Coffeyville Refinery, the Company plans to install a flare gas recovery system at a cost of approximately $50 million, which is expected to be operational in late 2026.
As of December 31, 2024, we have an estimated liability of $323 million for the Petroleum Segment’s obligated-party subsidiaries’ compliance with the RFS for 2020 through 2024, which consists of approximately 487 million RINs, excluding open, fixed-price commitments to purchase a net 7 million RINs. The Company’s open RFS position, which does not consider open commitments expected to settle in future periods, is marked-to-market each period and thus significant market volatility, as experienced in late 2023 and 2024, could impact our RFS expense from period to period.
Market Indicators
NYMEX WTI crude oil is an industry wide benchmark that is utilized in the market pricing of a barrel of crude oil. The pricing differences between other crude oils and WTI, known as differentials, show how the market for other crude oils, such as WCS, White Cliffs (“Condensate”), Brent Crude (“Brent”), and Midland WTI (“Midland”), are trending. Due to geopolitical events, such as the Russia-Ukraine war and the conflict in the Middle East, and, in each case, actions taken by governments and
others in response thereto, refined product prices have experienced extreme volatility. As a result of the current environment, refining margins have been and will likely continue to be volatile.
We utilize NYMEX and Group 3 crack spreads as a performance benchmark and a comparison with other industry participants. These crack spreads are a measure of the difference between market prices for crude oil and refined products and are a commonly used proxy within the industry to estimate or identify trends in refining margins. Crack spreads can fluctuate significantly over time as a result of market conditions and supply and demand balances. The NYMEX 2-1-1 crack spread is calculated using two barrels of WTI producing one barrel of NYMEX RBOB Gasoline (“RBOB”) and one barrel of NYMEX NY Harbor ULSD (“HO”). The Group 3 2-1-1 crack spread is calculated using two barrels of WTI crude oil producing one barrel of Group 3 sub-octane gasoline and one barrel of Group 3 ultra-low sulfur diesel.
Both NYMEX 2-1-1 and Group 3 2-1-1 crack spreads decreased during 2024 compared to 2023. The NYMEX 2-1-1 crack spread averaged $23.79 per barrel in 2024 compared to $34.24 per barrel in 2023. The Group 3 2-1-1 crack spread averaged $18.05 per barrel in 2024 compared to $32.27 per barrel in 2023.
Average monthly prices for RINs decreased 46.7% during 2024 compared to 2023. On a blended barrel basis (calculated using applicable RVO percentages), RINs approximated $3.76 per barrel during 2024 compared to $7.05 per barrel during 2023.
The tables below are presented, on a per barrel basis, by month through December 31, 2024:
| | |
Crude Oil Differentials against WTI (1)(2) |
| | |
PADD II Group 3 Product Crack Spread and RIN Pricing (2)(3) ($/bbl) |
| | |
Group 3 Product Differential against NYMEX Products (1)(2) ($/bbl) |
(1)The change over time in NYMEX - WTI, as reflected in the charts above, is illustrated below. | | | | | | | | | | | | | | | | | | | | | | | | | | | | | | | | | | | |
| (in $/bbl) | Average 2022 | | Average December 2022 | | Average 2023 | | Average December 2023 | | Average 2024 | | Average December 2024 |
| WTI | $ | 94.41 | | | $ | 76.52 | | | $ | 77.57 | | | $ | 72.12 | | | $ | 75.77 | | | $ | 69.70 | |
(2)Information used within these charts was obtained from reputable market sources, including the New York Mercantile Exchange (“NYMEX”), Intercontinental Exchange, and Argus Media, among others.
(3)PADD II is the Midwest Petroleum Area for Defense District (“PADD”), which includes Illinois, Indiana, Iowa, Kansas, Kentucky, Michigan, Minnesota, Missouri, Nebraska, North Dakota, Ohio, Oklahoma, South Dakota, Tennessee, and Wisconsin.
Renewables Segment
The earnings and cash flows of the Renewables Segment are primarily affected by the relationship between renewable fuel prices, the prices for Vegetable oils and other feedstocks that are processed and blended into renewable fuels, as well as the prices of various credits generated by the production of renewable fuels together with the cost of operating the renewable diesel unit, including the pre-treatment unit. The cost to acquire Vegetable oils and other feedstocks and the price for which renewable fuels are ultimately sold depends on factors beyond the Renewables Segment’s control, including the supply of and demand for Vegetable oil and other feedstocks, as well as renewable diesel and other renewable fuels which, in turn, depend on, among other factors, changes in domestic and foreign economies, driving habits, weather conditions, domestic and foreign political affairs, production levels, the availability or permissibly of imports and exports, the marketing of competitive fuels, and the extent of government regulations. Similar to the Petroleum Segment, the Renewables Segment applies FIFO accounting to value its inventory, and product price movements may thus impact margin as a result of changes in the value of its unhedged inventory. The effect of changes in product prices on the Renewables Segment’s results of operations is partially influenced by the rate at which the processing of renewable fuels adjusts to reflect these changes.
The prices of Vegetable oils and other feedstocks and renewable fuels are also affected by other factors, such as Vegetable oil production capacity, system inventory, local and regional market conditions, inflation, and the operating levels of other facilities. Vegetable oil costs and the prices of renewable fuels have historically been subject to wide fluctuations. Widespread expansion or upgrades of third-party facilities, price volatility, international political and economic developments, and other factors are likely to continue to play an important role in renewable fuel industry economics. These factors can impact, among other things, the level of inventories in the market, resulting in price volatility and a reduction in product margins. Specific factors impacting the Company’s operations are outlined below:
Current Market Outlook
•The near-term outlook for the renewables market is likely to be heavily influenced by U.S. government policies, particularly as related to the recently expired BTC and PTC, which is awaiting formal IRS rule making, along with the RVO levels to be set for 2026 and the resulting potential impacts on RINs prices.
•The $1 per gallon BTC expired on December 31, 2024, and formal IRS rule making for he PTC has not been issued. With the loss of the BTC there could be additional volatility in pricing for renewables fuels feedstocks, as well as in prices of other credits generated by renewable fuels production, particularly RINs prices and Low Carbon Fuel Standard (“LCFS”) credit prices.
•After a substantial build-out of renewable diesel production capacity in the United States over the past four years, where capacity increased from less than 900 million gallons per year in January 2021 to over 4.5 billion gallons per year in October 2024, further renewable diesel production capacity expansion is expected to slow significantly due to the uncertainties around U.S. government policies and support of renewables businesses.
Regulatory Environment
We continue to be impacted by significant volatility and costs associated with current and proposed laws, rules, regulations and policies relating to climate change, the RFS, energy transition and related matters.
•Profitability in the Renewables Segment is highly dependent on the prices of government credits, particularly RINs prices, LCFS credit prices, and the BTC. RINs prices are mainly influenced by supply and demand dynamics, with the demand being heavily impacted by the annual RVO levels established by the EPA. Current market prices for renewable feedstocks are significantly higher than the prices for renewable fuels. Without sufficient government support to stabilize prices for credits generated by renewable fuels production, many renewable fuel producers may not be able to generate profits.
Company Initiatives
•The Company is evaluating a potential project to convert the Wynnewood Renewable Diesel Unit to produce sustainable aviation fuel (“SAF”), which approval would be subject to numerous conditions and requirements, such as approval of our Board, regulators, and potential other parties. This project, if approved and pursued, could reduce the risks associated with government credits through an off-take structure with potential counterparties, by potentially shifting the exposure of those credit prices to the fuel purchaser.
•The renewable diesel unit at the Wynnewood Refinery has the flexibility to be returned to hydrocarbon processing service primarily through a catalyst change, or to sustainable aviation fuel with additional capital outlays; depending on market conditions, such as renewable diesel margins, governmental regulations, contractual obligations and other factors, the Company could seek to return the unit to hydrocarbon processing service in the future.
•The Company is also evaluating a potential renewables project near its Coffeyville Refinery, which approval would be subject to numerous conditions and requirements, including but not limited to, approval of our Board, regulators, and potential other third parties. This project, if approved and pursued, could enable the capture of synergies with the Petroleum Segment, such as the use of excess hydrogen capacity of our Coffeyville Refinery and potential access to third-party carbon capture use and storage.
Market Indicators
Chicago Board of Trade (“CBOT”) soybean oil is an industry wide benchmark that is utilized in the pricing of renewable fuel feedstocks. The pricing differences between CBOT soybean oil and other renewable feedstocks such as distiller’s corn oil, used cooking oil and animal fats is typically driven by the carbon intensity (“CI”) score related to each feedstock along, with overall supply and demand in the market for various feedstocks. Feedstock CI scores play a significant role in the generation of Low Carbon Fuel Standard (“LCFS”) credits, where lower CI score feedstocks generate higher credit values than higher CI score feedstocks. The PTC that is intended to replace the BTC would also be calculated based on CI scores, with lower CI scores generating higher credit values.
Approximately 60% of combined biodiesel and renewable diesel production in 2023 was produced from Vegetable oils, with animal fats comprising the remaining 40%. Of the Vegetable oils consumed, soybean oil comprised over 60%, making it one of the primary feedstock pricing benchmarks in the renewables market. As a performance benchmark and a comparison with other industry participants, we utilize the HOBO spread and a Benchmark Renewable Diesel Margin that incorporates the HOBO spread along with RINs, LCFS credits, and BTCs generated by renewable diesel production.
The HOBO spread tightened during 2024 compared to 2023, primarily as a result of declining soybean oil pricing in 2024 more than offsetting a decline in ULSD prices. The HOBO spread averaged $(0.90) per gallon in 2024 compared to $(1.50) per gallon in 2023. Despite the improvement in the HOBO spread in 2024, the Benchmark Renewable Diesel Margin declined in 2024 compared to 2023, primarily due to declines in prices for RINs and LCFS credits. The Benchmark Renewable Diesel Margin averaged $1.82 per gallon in 2024, compared to $2.53 per gallon in 2023.
Average monthly prices for RINs decreased 56% during 2024 compared to 2023, while LCFS credit prices decreased 17% during 2024 compared to 2023.
The tables below are presented by month through December 31, 2024:
| | |
Benchmark Renewable Diesel Margins (1) (2) (3) |
| | | | | | | | |
LCFS Credit Price and D4 RIN Market Pricing (1) | | Soybean Oil and LA/SF CARB Market Pricing (1) |
(1)Information used within these charts was obtained from reputable market sources, including the New York Mercantile Exchange (“NYMEX”), CBOT, and Argus Media, among others.
(2)Renewable Diesel Indicator Margin calculated as follows:
(OPIS CARB ULSD + (D4 RIN * 1.7x) + BTC + LCFS Credit(65CI) + CAR + LCFS Fee) - (CBOT Soybean Oil * 7.6 lbs/gal).
(3)HOBO spread represents the Heating Oil – Bean Oil Spread and is calculated as CARB ULSD price per gallon less CBOT Soybean Oil price per gallon.
Nitrogen Fertilizer Segment
Within the Nitrogen Fertilizer Segment, earnings and cash flows from operations are primarily affected by the relationship between nitrogen fertilizer product prices, utilization, and operating costs and expenses, including pet coke and natural gas feedstock costs.
The price at which nitrogen fertilizer products are ultimately sold depends on numerous factors, including the global supply and demand for nitrogen fertilizer products, which, in turn, depends on world grain demand and production levels, changes in world population, the cost and availability of fertilizer transportation infrastructure, weather conditions, the availability of imports, the availability and price of feedstocks to produce nitrogen fertilizer, and the extent of government intervention in agriculture markets, among other factors. These factors can impact, among other things, the level of inventories in the markets, resulting in price and product margin volatility. Moreover, the industry typically experiences seasonal fluctuations in demand for nitrogen fertilizer products.
Certain governmental regulations and incentives associated with the automobile transportation and agricultural industries, including the ones related to corn-based ethanol and sustainable aviation fuel production or consumption can impact, and have directly impacted, our business. In June 2023, the EPA announced the renewable volume obligations for 2023, 2024, and 2025 which maintained the conventional biofuel blending level at 15 billion gallons. These actions lead us to believe that the demand on food, in particular corn, for fuel will remain strong for the foreseeable future and support farmer economics that incentivize the use of nitrogen-based fertilizers.
In contrast, in March 2024, the EPA finalized new motor vehicle emission standards for light-, medium-, and heavy-duty vehicles for model year 2027 and beyond, which could significantly reduce the use of internal combustion engine vehicles and the demand for liquid fuels, including ethanol. New heavy-truck requirements are also being proposed. In 2023, production of ethanol consumed approximately 37% of the annual United States corn crop used by the market.
Market Indicators
While there is risk of shorter-term volatility given the inherent nature of the commodity cycle and governmental and geopolitical risks, the Company believes the long-term fundamentals for the U.S. nitrogen fertilizer industry remain intact. The Nitrogen Fertilizer Segment views the anticipated combination of (i) increasing global population, (ii) decreasing arable land per capita, (iii) continued evolution to more protein-based diets in developing countries, (iv) sustained use of corn and soybeans as feedstock for the domestic production of ethanol and other renewable fuels, and (v) positioning at the lower end of the global cost curve should provide a solid foundation for nitrogen fertilizer producers in the United States over the longer term.
Corn and soybeans are two major crops planted by farmers in North America. Corn crops result in the depletion of the amount of nitrogen within the soil in which it is grown, which in turn, results in the need for this nutrient to be replenished after each growing cycle. Unlike corn, soybeans are able to obtain most of their own nitrogen through a process known as “N fixation”. As such, upon harvesting of soybeans, the soil retains a certain amount of nitrogen which results in lower demand for nitrogen fertilizer for the following corn planting cycle. Due to these factors, nitrogen fertilizer consumers generally operate a balanced corn-soybean rotational planting cycle as shown by the chart presented below.
The relationship between the total acres planted for both corn and soybeans has a direct impact on the overall demand for nitrogen products, as the market and demand for nitrogen increases with increased corn acres and decreases with increased soybean acres. Additionally, an estimated 14 billion pounds of soybean oil is expected to be used in producing cleaner renewable fuels in marketing year 2024/2025. Multiple refiners have announced renewable diesel expansion projects for 2025 and beyond, which should only increase the demand for soybeans and potentially for corn and canola.
The USDA data estimates that in spring 2024 farmers planted 90.7 million corn acres, representing a decrease of 4.1% as compared to 94.6 million corn acres in 2023. Planted soybean acres for spring 2024 are 87.1 million, representing an increase of 4.2% as compared to 83.6 million soybean acres in 2023. The combined corn and soybean planted acres of 177.8 million in 2024 is in line with the acreage planted in 2023. Due to lower input costs in 2024 for corn planting and the relative grain prices
of corn versus soybeans, economics favored planting corn compared to soybeans in 2024. Inventory levels of corn and soybeans are expected to be supportive of grain prices into the spring of 2025.
Ethanol is blended with gasoline to meet RFS requirements and for its octane value. Since 2010, ethanol production has historically consumed approximately 37% of the U.S. corn crop used by the market, so demand for corn generally rises and falls with ethanol demand, as shown by the charts below, through December 31, 2024.
| | | | | | | | |
U.S. Plant Production of Fuel Ethanol (1) | | Corn and Soybean Planted Acres (2) |
(1)Information used within this chart was obtained from the U.S. Energy Information Administration (“EIA”) through December 31, 2024.
(2)Information used within this chart was obtained from the USDA, National Agricultural Statistics Services, as of December 31, 2024.
Weather continues to be a critical variable for crop production. Even with high planted acres and above trendline yields per acre for corn in the United States, global inventory levels for corn and soybeans remain near historical 10-year averages and prices have remained elevated. Demand for nitrogen fertilizer, as well as other crop inputs, was strong for the spring 2024 planting season, primarily due to elevated grain prices and favorable weather conditions for planting.
Fertilizer input costs have been volatile since the fall of 2021. Natural gas prices were elevated in the fall of 2022 due to shortages in Europe and demand being driven by building natural gas storage for winter. Winter 2023/2024 weather was warmer than average in Europe and when combined with natural gas conservation measures caused demand and prices for natural gas in Europe to fall significantly in the first quarter of 2024 and remain below the 2021/2022 price levels throughout 2024. The decline in natural gas prices, and the resulting reversal of capacity curtailments, among other factors, has led to a significant reduction in the price for nitrogen fertilizer from peak prices. While we expect that natural gas prices might remain below the elevated levels experienced in 2022 in the near term, we believe that the structural shortage of natural gas in Europe will continue to be a source of volatility through at least 2026. Although pet coke prices had been elevated since 2021 due to higher natural gas prices compared to historical levels, as natural gas prices remained low in 2024, third-party pet coke prices declined into 2024 and fell further into 2025.
CVR Partners Initiatives
CVR Partners has been conducting engineering studies on the potential to utilize natural gas as an optional feedstock to pet coke at its facility in Coffeyville, Kansas (the “Coffeyville Fertilizer Facility”). Based on these studies, CVR Partners believes the Coffeyville Fertilizer Facility could utilize either natural gas or pet coke to produce nitrogen fertilizer by making certain modifications to the plant. If this project is approved by the board of directors of CVR Partners’ general partner (the “UAN GP Board”) and successfully implemented, it could allow CVR Partners to choose the optimal feedstock mix for production and would make the Coffeyville Fertilizer Facility the only nitrogen fertilizer plant in the United States with that feedstock flexibility.
As part of growth capital projects, CVR Partners has undertaken several initiatives to continually improve reliability of its Facilities. In December 2024, an additional piece of oxygen equipment was installed to provide better reliability of a third-party
air separation plant which supplies contract volumes of oxygen, nitrogen, and compressed dry air to the Coffeyville Fertilizer Facility gasifiers.
The charts below show relevant market indicators for the Nitrogen Fertilizer Segment by month through December 31, 2024:
| | |
Ammonia and UAN Market Pricing (1) |
| | | | | | | | |
Natural Gas Market Pricing (1) | | Pet Coke Market Pricing (1) |
(1)Information used within these charts was obtained from various third-party sources including Green Markets (a Bloomberg Company), Pace Petroleum Coke Quarterly, and the EIA, amongst others.
Results of Operations
Effective with this Annual Report on Form 10-K for the year ended December 31, 2024 and due to the prominence of the renewables business relative to the Company’s overall 2024 performance, we have revised our reportable segments to reflect a new reportable segment – Renewables. The Renewables Segment includes the operations of the renewable diesel unit and
renewable feedstock pretreater at the Wynnewood Refinery. Results of the Renewables Segment were not previously included within our reportable segments discussed below, rather included within “Other”. Prior period segment information has been retrospectively adjusted to reflect the current segment presentation, and year-to-year comparisons between all periods presented for the Renewables Segment are discussed herein.
Consolidated
The following sections should be read in conjunction with the information outlined within the previous sections of this Part II, Item 7 and the consolidated financial statements and related notes thereto in Part II, Item 8 of this Report. Our consolidated results of operations include certain unallocated corporate activities and the elimination of intercompany transactions and, therefore, do not equal the sum of the operating results of the Petroleum, Renewables, and Nitrogen Fertilizer Segments.
Consolidated Financial Highlights
| | | | | | | | |
| Operating Income | | Net Income Attributable to CVR Energy Stockholders |
| | | | | | | | |
| Earnings per Share | | EBITDA (1) |
(1)See “Non-GAAP Reconciliations” section below for reconciliations of the non-GAAP measure shown above.
Overview - For the year ended December 31, 2024, the Company’s operating income and net income were $58 million and $45 million, respectively, compared to operating income and net income of $1.1 billion and $878 million, respectively, for the year ended December 31, 2023. Refer to our discussion of each segment’s results of operations below for further information.
Other Income (Expense), Net - The Company’s Other income (expense), net, was $38 million for the year ended December 31, 2024 compared to $14 million for the year ended December 31, 2023. The change was primarily attributable to the gain on the Company’s sale of its Membership Interests in December 2024.
Income Tax (Benefit) Expense - Income tax benefit for the year ended December 31, 2024 was $26 million, or (137.2)% of income before income taxes, compared to income tax expense for the year ended December 31, 2023 of $207 million, or 19.1% of income before income taxes. The decrease in income tax expense was due primarily to a decrease in overall pretax earnings. In addition, the change in the effective tax rate was due primarily to changes in pretax earnings attributable to noncontrolling interests and the impact of federal and state tax credits and incentives generated in relation to overall pretax earnings for the year ended December 31, 2024 compared to the year ended December 31, 2023.
Petroleum Segment
The Petroleum Segment utilizes certain inputs within its refining operations. These inputs include crude oil, butanes, natural gasoline, ethanol, and bio-diesel (these are also known as “throughputs”).
Refining Throughput and Production Data by Refinery
| | | | | | | | | | | | | | | | | |
| Throughput Data | Year Ended December 31, |
| (in bpd) | 2024 | | 2023 | | 2022 |
| Coffeyville | | | | | |
| Gathered crude | 71,382 | | | 62,263 | | | 53,237 | |
| Other domestic | 39,360 | | | 49,930 | | | 55,383 | |
| Canadian | 7,304 | | | 3,265 | | | 6,847 | |
| Condensate | 3,177 | | | 7,566 | | | 12,159 | |
| Other crude oil | 2,546 | | | — | | | — | |
| Other feedstocks and blendstocks | 12,511 | | | 13,490 | | | 11,556 | |
| Wynnewood | | | | | |
| Gathered crude | 46,185 | | | 50,900 | | | 46,160 | |
| Other domestic | 980 | | | 2,112 | | | 3,538 | |
| | | | | |
| Condensate | 9,165 | | | 15,228 | | | 13,283 | |
| | | | | |
| Other feedstocks and blendstocks | 3,668 | | | 3,465 | | | 3,125 | |
| Total Throughput | 196,278 | | | 208,219 | | | 205,288 | |
| | | | | | | | | | | | | | | | | |
| Production Data | Year Ended December 31, |
| (in bpd) | 2024 | | 2023 | | 2022 |
| Coffeyville | | | | | |
| Gasoline | 69,771 | | | 69,847 | | | 72,478 | |
| Distillate | 56,690 | | | 57,888 | | | 58,104 | |
| Other liquid products | 5,125 | | | 4,388 | | | 4,789 | |
| Solids | 4,762 | | | 4,123 | | | 4,700 | |
| Wynnewood | | | | | |
| Gasoline | 33,106 | | | 38,843 | | | 35,027 | |
| Distillate | 20,917 | | | 24,978 | | | 23,690 | |
| Other liquid products | 4,551 | | | 6,882 | | | 5,712 | |
| Solids | 9 | | | 10 | | | 11 | |
| Total production | 194,931 | | | 206,959 | | | 204,511 | |
| | | | | | | | | | | | | | | | | |
Light product yield (as % of total crude throughput) (1) | 100.2 | % | | 100.2 | % | | 99.3 | % |
Liquid volume yield (as % of total throughput) (2) | 96.9 | % | | 97.4 | % | | 97.3 | % |
Distillate yield (as % of total crude throughput) (3) | 43.1 | % | | 43.3 | % | | 42.9 | % |
(1)Total Gasoline and Distillate divided by total Gathered crude, Other domestic, Canadian, and Condensate throughput (collectively, “Total Crude Throughput”).
(2)Total Gasoline, Distillate, and Other liquid products divided by total throughput.
(3)Total Distillate divided by Total Crude Throughput.
Petroleum Segment Financial Highlights
Overview - For the year ended December 31, 2024, the Petroleum Segment’s operating income and net income were $12 million and $70 million, respectively, compared to operating income and net income of $982 million and $1.1 billion, respectively, for the year ended December 31, 2023. The decline in both operating income and net income compared to the prior period was primarily due to decreases in gasoline and distillate crack spreads in 2024, decreased production and increased maintenance resulting from the fire at the Wynnewood Refinery during the second quarter of 2024 (the “Wynnewood Fire”) and unplanned downtime at the Coffeyville Refinery (together with the Wynnewood Fire, the “Petroleum Unplanned Outages”), and increased RFS-related expense in 2024.
| | | | | | | | |
| Net Sales | | Operating Income |
(1)See “Non-GAAP Reconciliations” section below for reconciliations of the non-GAAP measure shown above.
Net Sales - For the year ended December 31, 2024, net sales for the Petroleum Segment was $6.9 billion compared to $8.3 billion for the year ended December 31, 2023. The decrease in net sales was due to decreased refined product prices resulting from declining demand and increasing inventory levels for the year ended December 31, 2024 compared to the year ended December 31, 2023. Further, higher net sales in 2023 were due to increased prices resulting from tight inventory levels and uncertainty caused by the Russia-Ukraine war.
(1)See “Non-GAAP Reconciliations” section below for reconciliations of the non-GAAP measures shown above.
Refining Margin - For the year ended December 31, 2024, refining margin was $684 million, or $9.53 per throughput barrel, compared to $1.7 billion, or $21.82 per throughput barrel, for the year ended December 31, 2023. The primary factors contributing to the $974 million decrease in refining margin were:
•A decrease in the Group 3 2-1-1 crack spread of $14.22 per barrel, driven by a tightening of gasoline and distillate crack spreads primarily due to increased inventory levels and lower demand in the current year;
•Unfavorable sales volume impacts related to the Petroleum Unplanned Outages; and
•An increase in RFS-related expense, net of RINs sales, of $42 million, which includes unfavorable RINs revaluation adjustments of $195 million as a result of a smaller decrease in RINs prices in the current period compared to the previous period.
Factors partially offsetting the decrease in refining margin were:
•Unfavorable inventory valuation impacts of $6 million in 2024 compared to unfavorable inventory valuation impacts of $32 million in 2023, primarily due to a smaller decrease in crude oil prices for the current period as compared to the prior period.
| | |
Direct Operating Expenses (1) |
(1)Exclusive of depreciation and amortization expense.
Direct Operating Expenses (Exclusive of Depreciation and Amortization) - For the year ended December 31, 2024, direct operating expenses (exclusive of depreciation and amortization) were $421 million compared to $406 million for the year ended December 31, 2023. The increase in the current period was primarily due to increased repairs and maintenance costs and increased personnel costs as a result of the Petroleum Unplanned Outages, partially offset by lower costs for electricity and natural gas. On a total throughput barrel basis, direct operating expenses increased to $5.86 per barrel from $5.34 per barrel, as a function of the increased expense in 2024, combined with the decrease in total throughput in 2024 compared to 2023.
| | | | | | | | |
| Depreciation and Amortization Expense | | Selling, General, and
Administrative Expenses |
Depreciation and Amortization Expense - For the year ended December 31, 2024, depreciation and amortization expense was $174 million compared to $189 million for the year ended December 31, 2023. The decrease was primarily attributable to certain assets being retired or fully depreciated during the 2024 turnaround, partially offset by fixed asset additions during the 2024 turnaround.
Selling, General, and Administrative Expenses - For the year ended December 31, 2024, selling, general and administrative expenses was $77 million compared to $81 million for the year ended December 31, 2023. The decrease was primarily a result of lower personnel costs driven by decreased share-based compensation due to a decline in the market price of CVR Energy’s common stock.
Renewables Segment
The Renewables Segment utilizes certain inputs within its refining operations. These inputs include corn oil, soybean oil, and other vegetable oils (these are also known as “throughputs”).
Renewables Throughput and Production Data
| | | | | | | | | | | | | | | | | |
| Throughput Data | Year Ended December 31, |
| (in gallons per day) | 2024 | | 2023 | | 2022 |
| | | | | |
| Corn Oil | 52,807 | | | 53,661 | | | 20,501 | |
| Soybean Oil | 98,439 | | | 172,297 | | | 96,014 | |
| | | | | |
| Other feedstocks and blendstocks | 58,730 | | | 51,039 | | | 34,122 | |
| Total throughput | 209,976 | | | 276,997 | | | 150,637 | |
| | | | | | | | | | | | | | | | | |
| Production Data | Year Ended December 31, |
| (in gallons per day) | 2024 | | 2023 | | 2022 |
| Renewable diesel | 134,399 | | 200,015 | | 101,362 |
| Renewable naphtha | 17,101 | | 34,099 | | 20,160 |
| Renewable light ends | 62,424 | | 92,802 | | 54,804 |
| Other | 41,064 | | 45,552 | | 26,961 |
| Total production | 254,988 | | 372,468 | | 203,287 |
| | | | | |
| Renewable diesel yield (as % of corn and soybean oil throughput) | 89.2 | % | | 88.5 | % | | 87.0 | % |
Renewables Segment Financial Highlights
Overview - The Renewables Segment’s operating loss and net loss for the year ended December 31, 2024 were $22 million and $21 million, respectively, compared to operating loss and net loss of $37 million and $36 million, respectively, for the year ended December 31, 2023. The improvement in both operating loss and net loss compared to the prior period was primarily due to an overall feedstock price decrease. Operating loss and net loss for the year ended December 31, 2023 improved compared to operating loss and net loss of $47 million and $47 million, respectively, for the year ended December 31, 2022 primarily due to having a full year of operations in 2023 compared to operations beginning in April of 2022, as well as a better margin environment in 2023 compared to 2022.
(1)See “Non-GAAP Reconciliations” section below for reconciliations of the non-GAAP measure shown above.
Net Sales - For the year ended December 31, 2024, net sales for the Renewables Segment was $289 million compared to $559 million for the year ended December 31, 2023. The decrease in net sales was due to reduced production and sales volumes coupled with decreased biodiesel RIN prices resulting from increased renewable diesel supply in the market for the year ended December 31, 2024 compared to the year ended December 31, 2023. Net sales for the year ended December 31, 2023 increased compared to net sales of $338 million for the year ended December 31, 2022 primarily due to having a full year of operations in 2023 compared to operations beginning in April of 2022, partially offset by decreased biodiesel RINs prices resulting from increased renewable diesel supply in the market for the year ended December 31, 2023 compared to the year ended December 31, 2022.
(1)See “Non-GAAP Reconciliations” section below for reconciliations of the non-GAAP measures shown above.
Renewables Margin - For the year ended December 31, 2024, renewables margin was $44 million, or $0.80 per Vegetable oil throughput gallon, compared to $22 million, or $0.27 per Vegetable oil throughput gallon, for the year ended December 31, 2023. The primary factors contributing to the $22 million increase in renewables margin were:
•Favorable cost of sales of $284 million due to lower Vegetable oil feedstock prices;
•An increase in the HOBO spread of $0.59 per gallon, driven by a decrease in soybean oil prices of $0.14 per pound due to increased U.S. soybean oil inventories resulting from higher production levels; and
•An increase in renewable diesel yield due to improved catalyst performance in the current year.
For the year ended December 31, 2022, renewables margin was $(4) million, or $(0.10) per Vegetable oil throughput gallon. The primary factors contributing to the $26 million increase in renewables margin compared to the year ended December 31, 2023 were:
•A full year of operations in 2023 compared to beginning in April 2022; and
•An increase in the HOBO spread of $0.37 per gallon, driven by a decrease in soybean oil prices of $0.13 per pound due to increased global supply and decreased demand.
| | |
Direct Operating Expenses (1) |
(1)Exclusive of depreciation and amortization expense.
Direct Operating Expenses (Exclusive of Depreciation and Amortization) - For the year ended December 31, 2024, direct operating expenses (exclusive of depreciation and amortization) were $31 million compared to $28 million for the year ended December 31, 2023. The increase in the current period was primarily due to higher costs for insurance and chemicals used in the production process. On a Vegetable oil throughput gallon basis, direct operating expenses increased to $0.57 per gallon from $0.35 per gallon, as a function of the increased expense in 2024, partially offset by the decline in total Vegetable oil throughput in 2024 compared to 2023. Direct operating expenses (exclusive of depreciation and amortization) for the year ended December 31, 2023 increased compared to $24 million for the year ended December 31, 2022 due primarily to higher costs for catalysts and electricity. On a Vegetable oil throughput gallon basis, direct operating expenses decreased to $0.35 per gallon from $0.55 per gallon, primarily due to the increased throughput in 2023 as compared to 2022, partially offset by the increased expense in 2023.
Nitrogen Fertilizer Segment
Utilization and Production Volumes - The following tables summarize the ammonia utilization rates on a consolidated basis for the Nitrogen Fertilizer Segment’s facilities in Coffeyville, Kansas (the “Coffeyville Fertilizer Facility”, and together with the East Dubuque Fertilizer Facility, the “Facilities”) and the East Dubuque Fertilizer Facility. Utilization is an important measure used by management to assess operational output at each of the Facilities. Utilization is calculated as actual tons of ammonia produced divided by capacity.
Utilization is presented solely on ammonia production, rather than on each nitrogen product, as it provides a comparative baseline against industry peers and eliminates the disparity of facility configurations for upgrade of ammonia into other nitrogen products. With production primarily focused on ammonia upgrade capabilities, we believe this measure provides a meaningful view of how we operate.
Gross tons of ammonia represent the total ammonia produced, including ammonia produced that was upgraded into other fertilizer products. Net tons available for sale represents the ammonia available for sale that was not upgraded into other
fertilizer products. The table below presents all of these Nitrogen Fertilizer Segment metrics for the years ended December 31, 2024, 2023, and 2022:
| | | | | | | | | | | | | | | | | | | | | |
| | | Year Ended December 31, |
| | | | | 2024 | | 2023 | | 2022 |
| Ammonia utilization rate | | | | | 96 | % | | 100 | % | | 81 | % |
| | | | | | | | | |
Production Volumes (in thousands of tons) | | | | | | | | | |
| Ammonia (gross produced) | | | | | 836 | | | 864 | | 703 |
| Ammonia (net available for sale) | | | | | 270 | | | 270 | | 213 |
| UAN | | | | | 1,273 | | | 1,369 | | 1,140 |
On a consolidated basis, the Nitrogen Fertilizer Segment’s utilization decreased 4% to 96% for the year ended December 31, 2024 as compared to the year ended December 31, 2023, primarily due to the 14-day planned outage at the Coffeyville Fertilizer Facility during the first quarter of 2024 and other minor unplanned outages at the Facilities (the “2024 Outages”) in the current period.
Sales and Pricing per Ton - Two of the Nitrogen Fertilizer Segment’s key operating metrics are total sales volumes for ammonia and UAN, along with the product pricing per ton realized at the gate. Product pricing at the gate represents net sales less freight revenue divided by product sales volume in tons and is shown in order to provide a pricing measure comparable across the fertilizer industry.
| | | | | | | | | | | | | | | | | | | |
| Year Ended December 31, | | |
| 2024 | | 2023 | | 2022 | | |
| Consolidated sales volumes (thousand tons) | | | | | | | |
| Ammonia | 271 | | | 281 | | | 195 | | | |
| UAN | 1,260 | | | 1,395 | | | 1,144 | | | |
| | | | | | | |
| Consolidated product pricing at gate (dollars per ton) | | | | | | | |
| Ammonia | $ | 479 | | | $ | 573 | | | $ | 1,024 | | | |
| UAN | 248 | | | 309 | | | 486 | | | |
For the year ended December 31, 2024, total product sales volumes were unfavorable, compared to the year ended December 31, 2023 driven by reduced production volumes resulting from the 2024 Outages in the current period. For the year ended December 31, 2024, total product sales were unfavorable driven by sales price decreases of 16% for ammonia and 20% for UAN during the year. Ammonia and UAN sales prices were unfavorable primarily due to lower natural gas prices reducing input costs and lower planted acres of corn in the U.S.
Feedstock - Our Coffeyville Fertilizer Facility utilizes a pet coke gasification process to produce nitrogen fertilizer. Our East Dubuque Fertilizer Facility uses natural gas in its production of ammonia. The table below presents these feedstocks for the Facilities for the years ended December 31, 2024, 2023, and 2022:
| | | | | | | | | | | | | | | | | |
| Year Ended December 31, |
| 2024 | | 2023 | | 2022 |
Petroleum coke used in production (thousands of tons) | 517 | | | 518 | | | 425 | |
Petroleum coke used in production (dollars per ton) | $ | 59.69 | | | $ | 78.14 | | | $ | 52.88 | |
Natural gas used in production (thousands of MMBtus) (1) | 8,667 | | | 8,462 | | | 6,905 | |
Natural gas used in production (dollars per MMBtu) (1) | $ | 2.56 | | | $ | 3.42 | | | $ | 6.66 | |
Natural gas in cost of materials and other (thousands of MMBtus) (1) | 7,755 | | | 8,671 | | | 6,701 | |
Natural gas in cost of materials and other (dollars per MMBtu) (1) | $ | 2.50 | | | $ | 3.84 | | | $ | 6.37 | |
(1)The feedstock natural gas shown above does not include natural gas used for fuel. The cost of fuel natural gas is included in Direct operating expenses (exclusive of depreciation and amortization).
Nitrogen Fertilizer Segment Financial Highlights
Overview - For the year ended December 31, 2024, the Nitrogen Fertilizer Segment’s operating income and net income were $90 million and $61 million, respectively, compared to operating income and net income of $201 million and $172 million, respectively, for the year ended December 31, 2023. These decreases were driven primarily by lower product sales prices attributable to natural gas prices reducing input costs and driving an overall decrease in market prices and unfavorable product sales volume driven by reduced production volumes resulting from the 2024 Outages in the current period, partially offset by favorable utility costs due to lower natural gas and electricity prices.
| | | | | | | | |
| Net Sales | | Operating Income |
(1)See “Non-GAAP Reconciliations” section below for reconciliations of the non-GAAP measures shown above.
Net Sales - For the year ended December 31, 2024, net sales for the Nitrogen Fertilizer Segment was $525 million compared to $681 million for the year ended December 31, 2023. This decrease was primarily due to unfavorable UAN and ammonia pricing conditions and sales volume which lowered revenues by $104 million and $47 million, respectively. For the years ended December 31, 2024 and 2023, net sales included $36 million and $42 million in freight revenue and $16 million and $18 million in other revenue, respectively.
The following table demonstrates the impact of changes in sales volumes and pricing for the primary components of net sales, excluding urea products, freight, and other revenue, for the year ended December 31, 2024 compared to the year ended December 31, 2023:
| | | | | | | | | | | |
| (in millions) | Price Variance | | Volume Variance |
| UAN | $ | (78) | | | $ | (42) | |
| Ammonia | (26) | | | (5) | |
For the year ended December 31, 2024 compared to the year ended December 31, 2023, ammonia and UAN sales prices were unfavorable primarily due to lower natural gas prices reducing input costs and driving an overall decrease in market prices, paired with lower planted corn acres in the U.S. Total product sales volumes were unfavorable driven by reduced production volumes resulting from the 2024 Outages in the current period.
Cost of Materials and Other - For the year ended December 31, 2024, cost of materials and other was $104 million compared to $134 million for the year ended December 31, 2023. The decrease was driven primarily by lower pet coke and natural gas feedstock costs combined with favorable inventory impacts in the current period.
Direct Operating Expenses (exclusive of depreciation and amortization) - For the year ended December 31, 2024, direct operating expenses (exclusive of depreciation and amortization) were $214 million compared to $235 million for the year ended December 31, 2023. The decrease was primarily due to favorable utility costs due to lower natural gas and electricity prices combined with favorable inventory impacts in the current period.
Non-GAAP Measures
Our management uses certain non-GAAP performance measures, and reconciliations to those measures, to evaluate current and past performance and prospects for the future to supplement our financial information presented in accordance with accounting principles generally accepted in the United States (“GAAP”). These non-GAAP financial measures are important factors in assessing our operating results and profitability and include the performance and liquidity measures defined below.
The following are non-GAAP measures we present for the years ended December 31, 2024, 2023, and 2022:
EBITDA - Consolidated net income (loss) before (i) interest expense, net, (ii) income tax expense (benefit) and (iii) depreciation and amortization expense.
Petroleum EBITDA, Renewables EBITDA, and Nitrogen Fertilizer EBITDA - Segment net income (loss) before segment (i) interest expense, net, (ii) income tax expense (benefit), and (iii) depreciation and amortization.
Refining Margin - The difference between our Petroleum Segment net sales and cost of materials and other.
Refining Margin per Throughput Barrel - Refining Margin divided by the total throughput barrels during the period, which is calculated as total throughput barrels per day times the number of days in the period.
Direct Operating Expenses per Throughput Barrel - Direct operating expenses for our Petroleum Segment divided by total throughput barrels for the period, which is calculated as total throughput barrels per day times the number of days in the period.
Renewables Margin - The difference between our Renewables Segment net sales and cost of materials and other.
Renewables Margin per Vegetable Oil Throughput Gallon - Renewables Margin divided by the total Vegetable oil throughput gallons for the period, which is calculated as total Vegetable oil throughput gallons per day times the number of days in the period.
Direct Operating Expenses per Vegetable Oil Throughput Gallon - Direct operating expenses for our Renewables Segment divided by total Vegetable oil throughput gallons for the period, which is calculated as total Vegetable oil throughput gallons per day times the number of days in the period.
Adjusted EBITDA, Petroleum Adjusted EBITDA, Renewables Adjusted EBITDA, and Nitrogen Fertilizer Adjusted EBITDA - EBITDA, Petroleum EBITDA, Renewables EBITDA, and Nitrogen Fertilizer EBITDA adjusted for certain significant noncash items and items that management believes are not attributable to or indicative of our on-going operations or that may obscure our underlying results and trends.
We present these measures because we believe they may help investors, analysts, lenders and ratings agencies analyze our results of operations and liquidity in conjunction with our U.S. GAAP results, including but not limited to our operating performance as compared to other publicly-traded companies in the refining and fertilizer industries, without regard to historical cost basis or financing methods and our ability to incur and service debt and fund capital expenditures. Non-GAAP measures have important limitations as analytical tools because they exclude some, but not all, items that affect net earnings and operating income. These measures should not be considered substitutes for their most directly comparable U.S. GAAP financial measures. See “Non-GAAP Reconciliations” included herein for reconciliation of these amounts. Due to rounding, numbers presented within this section may not add or equal to numbers or totals presented elsewhere within this document.
Factors Affecting Comparability of Our Financial Results
Petroleum Segment
Major Scheduled Turnaround Activities - Our results of operations for the periods presented may not be comparable with prior periods or to our results of operations in the future due to capitalized expenditures as part of planned turnarounds. Total capitalized expenditures were $58 million, $60 million, and $81 million during the years ended December 31, 2024, 2023, and 2022, respectively. The next planned turnaround is currently scheduled to commence in the first quarter of 2025 at the Coffeyville Refinery.
Midway Disposition - On December 23, 2024, a subsidiary of the Company sold the 50% Membership Interests it owned in Midway to Plains Pipeline, L.P. in exchange for cash consideration of approximately $90 million. The sale resulted in a gain of $24 million within Other income (expense), net in the Company’s Consolidated Statements of Operations.
Nitrogen Fertilizer Segment
Major Scheduled Turnaround Activities - Our results of operations for the periods presented may not be comparable with prior periods or to our results of operations in the future due to expenses incurred as part of planned turnarounds. We incurred turnaround expenses of less than $1 million, $2 million, and $33 million during the years ended December 31, 2024, 2023, and 2022, respectively. The next planned turnarounds are currently scheduled to commence in the fourth quarter of 2025 at the Coffeyville Fertilizer Facility and in 2026 at the East Dubuque Fertilizer Facility.
Non-GAAP Reconciliations
Reconciliation of Net Income to EBITDA and Adjusted EBITDA
| | | | | | | | | | | | | | | | | | |
| Year Ended December 31, |
| (in millions) | 2024 | | 2023 | | 2022 |
| Net income | $ | 45 | | | $ | 878 | | | $ | 644 | | |
| Interest expense, net | 77 | | | 52 | | | 85 | | |
| Income tax (benefit) expense | (26) | | | 207 | | | 157 | | |
| Depreciation and amortization | 298 | | | 298 | | | 288 | | |
| EBITDA | 394 | | | 1,435 | | | 1,174 | | |
| Adjustments: | | | | | | |
| Revaluation of RFS liability, (favorable) unfavorable | (89) | | | (284) | | | 135 | | |
| | | | | | |
| Unrealized loss (gain) on derivatives, net | 22 | | | (32) | | | 5 | | |
| Inventory valuation impacts, unfavorable (favorable) | 14 | | | 45 | | | (24) | | |
| Gain on sale of equity method investment | (24) | | | — | | | — | | |
| Call Option Lawsuits settlement | — | | | — | | | 79 | | |
| Adjusted EBITDA | $ | 317 | | | $ | 1,164 | | | $ | 1,369 | | |
Reconciliation of Petroleum Segment Net Income to EBITDA and Adjusted EBITDA
| | | | | | | | | | | | | | | | | |
| Year Ended December 31, |
| (in millions) | 2024 | | 2023 | | 2022 |
| Petroleum net income | $ | 70 | | | $ | 1,071 | | | $ | 759 | |
| Interest income, net | (21) | | | (75) | | | (41) | |
| | | | | |
| Depreciation and amortization | 174 | | | 189 | | | 187 | |
| Petroleum EBITDA | 223 | | | 1,185 | | | 905 | |
| Adjustments: | | | | | |
| Revaluation of RFS liability, (favorable) unfavorable | (89) | | | (284) | | | 135 | |
| Unrealized loss (gain) on derivatives, net | 22 | | | (30) | | | 3 | |
Inventory valuation impacts, unfavorable (favorable) (1) | 6 | | | 32 | | | (22) | |
| Gain on sale of equity method investment | (24) | | | — | | | — | |
| Petroleum Adjusted EBITDA | $ | 138 | | | $ | 903 | | | $ | 1,021 | |
(1)The Petroleum Segment’s basis for determining inventory value under GAAP is FIFO. Changes in crude oil prices can cause fluctuations in the inventory valuation of crude oil, work in process and finished goods, thereby resulting in a favorable inventory valuation impact when crude oil prices increase and an unfavorable inventory valuation impact when crude oil prices decrease. The inventory valuation impact is calculated based upon inventory values at the beginning of the accounting period and at the end of the accounting period.
Reconciliation of Petroleum Segment Gross Profit to Refining Margin
| | | | | | | | | | | | | | | | | |
| Year Ended December 31, |
| (in millions, except throughput data) | 2024 | | 2023 | | 2022 |
| Net sales | $ | 6,920 | | | $ | 8,287 | | | $ | 9,919 | |
| Less: | | | | | |
| Cost of materials and other | (6,236) | | | (6,629) | | | (8,488) | |
| Direct operating expenses (exclusive of depreciation and amortization) | (421) | | | (406) | | | (426) | |
| Depreciation and amortization | (174) | | | (185) | | | (182) | |
| Gross profit | 89 | | | 1,067 | | | 823 | |
| Add: | | | | | |
| Direct operating expenses (exclusive of depreciation and amortization) | 421 | | | 406 | | | 426 | |
| Depreciation and amortization | 174 | | | 185 | | | 182 | |
| Refining margin | $ | 684 | | | $ | 1,658 | | | $ | 1,431 | |
| | | | | |
| Total throughput barrels per day | 196,278 | | | 208,219 | | | 205,288 | |
| Days in the period | 366 | | | 365 | | | 365 | |
| Total throughput barrels | 71,837,644 | | | 75,999,905 | | | 74,930,140 | |
| | | | | |
| | | | | |
| | | | | |
| Refining margin per total throughput barrel | $ | 9.53 | | | $ | 21.82 | | | $ | 19.09 | |
| | | | | |
| | | | | |
| Direct operating expenses per total throughput barrel | 5.86 | | | 5.34 | | | 5.68 | |
Reconciliation of Renewables Segment Net Loss to EBITDA and Adjusted EBITDA
| | | | | | | | | | | | | | | | | |
| Year Ended December 31, |
| (in millions) | 2024 | | 2023 | | 2022 |
| Renewables net loss | $ | (21) | | | $ | (36) | | | $ | (47) | |
| Interest expense, net | (1) | | | (1) | | | — | |
| | | | | |
| Depreciation and amortization | 25 | | | 20 | | | 16 | |
| Renewables EBITDA | 3 | | | (17) | | | (31) | |
| Adjustments: | | | | | |
| Unrealized (gain) loss on derivatives, net | — | | | (2) | | | 2 | |
Inventory valuation, (favorable) unfavorable (1) (2) | 7 | | | 14 | | | (2) | |
| Renewables Adjusted EBITDA | $ | 10 | | | $ | (5) | | | $ | (31) | |
(1)The Renewables Segment’s basis for determining inventory value under GAAP is FIFO. Changes in renewable diesel and renewable feedstock prices can cause fluctuations in the inventory valuation of renewable diesel, work in process and finished goods, thereby resulting in a favorable inventory valuation impact when renewable diesel prices increase and an unfavorable inventory valuation impact when renewable diesel prices decrease. The inventory valuation impact is calculated based upon inventory values at the beginning of the accounting period and at the end of the accounting period.
(2)Includes an inventory valuation charge of $5 million and $4 million recorded in the fourth quarters of 2024 and 2023, respectively, as inventories were reflected at the lower of cost or net realizable value. No adjustment was necessary for any other period in 2024, 2023, or 2022.
Reconciliation of Renewables Segment Gross Loss to Renewables Margin
| | | | | | | | | | | | | | | | | |
| Year Ended December 31, |
| (in millions, except throughput data) | 2024 | | 2023 | | 2022 |
| Net sales | $ | 289 | | | $ | 559 | | | $ | 338 | |
| Less: | | | | | |
| Cost of materials and other | (245) | | | (537) | | | (342) | |
| Direct operating expenses (exclusive of depreciation and amortization) | (31) | | | (28) | | | (24) | |
| Depreciation and amortization | (25) | | | (20) | | | (16) | |
| Gross loss | (12) | | | (26) | | | (44) | |
| Add: | | | | | |
| Direct operating expenses (exclusive of depreciation and amortization) | 31 | | | 28 | | | 24 | |
| Depreciation and amortization | 25 | | | 20 | | | 16 | |
| Renewables margin | $ | 44 | | | $ | 22 | | | $ | (4) | |
| | | | | |
| Total Vegetable oil throughput gallons per day | 151,278 | | | 225,957 | | | 116,515 | |
| Days in the period | 366 | | | 365 | | | 365 | |
| Total Vegetable oil throughput gallons | 55,367,620 | | | 82,474,473 | | | 42,527,847 | |
| | | | | |
| | | | | |
| | | | | |
| Renewables margin per Vegetable oil throughput gallon | $ | 0.80 | | | $ | 0.27 | | | $ | (0.10) | |
| | | | | |
| Direct operating expenses per Vegetable oil throughput gallon | 0.57 | | | 0.35 | | | 0.55 | |
Reconciliation of Nitrogen Fertilizer Segment Net Income to EBITDA and Adjusted EBITDA
| | | | | | | | | | | | | | | | | |
| Year Ended December 31, |
| (in millions) | 2024 | | 2023 | | 2022 |
| Nitrogen Fertilizer net income | $ | 61 | | | $ | 172 | | | $ | 287 | |
| Interest expense, net | 30 | | | 29 | | | 34 | |
| | | | | |
| Depreciation and amortization | 88 | | | 80 | | | 82 | |
| Nitrogen Fertilizer EBITDA and Adjusted EBITDA | $ | 179 | | | $ | 281 | | | $ | 403 | |
| | | | | |
Liquidity and Capital Resources
Our principal source of liquidity has historically been cash from operations. As further discussed below, our principal uses of cash are for working capital, capital expenditures, funding our debt service obligations, and paying dividends to our stockholders. We may also seek to secure additional liquidity to help mitigate the potential impact of adverse government actions such as the EPA denial of SREs.
Certain external factors, such as volatile commodity pricing, higher industry utilization, and oversupply have had an unfavorable impact on our business, especially on our Petroleum segment, and have negatively impacted cash from operations, our primary source of liquidity. Operational issues at our facilities, including the fire incident at the Wynnewood Refinery in the second quarter of 2024 and weather-related external power outages at both refineries in the third quarter of 2024, have also contributed to the negative impact on our cash from operations. In addition, uncertainty remains due to the potential for further demand destruction, increased supply of refined products from the startup of new refineries worldwide, the impacts of increasing electric vehicles and liquid natural gas and other improvements in fuel efficiencies, and potential implications of geopolitical matters and government regulatory actions. The planned turnaround at the Coffeyville Refinery that started in January 2025 and is currently expected to be completed in approximately 45 days from commencement is an event that is scheduled to occur once every five years and supports our continued focus on safe and reliable operations, with a total estimated cash outlay of $175 million to $200 million. As a result of these factors, the Board elected to suspend payment of the cash dividend in October 2024 and has implemented and are maintaining the following measures:
(1)The deferment of new growth capital spending; and
(2)A reduction in capital expenditures for the fourth quarter of 2024 and certain capital expenditures through 2025 to only include those projects critical to continuing safe and reliable operations, environmental compliance projects or are required to support future activities.
Concurrently, the Company took the following actions to further enhance the Company’s liquidity:
(1)Entered into the Term Loan in the amount of $325 million, which has scheduled quarterly principal amortization payments in an amount equal to 0.25% of the aggregate principal amount of the initial term loans and maturity on December 30, 2027. Refer to Part II, Item 8, Note 8 (“Long-Term Debt and Finance Lease Obligations”) of this Report for further discussion;
(2)Sold the 50% Membership Interests it owned in Midway for cash consideration of approximately $90 million;
(3)Entered into an Incremental Commitment Agreement for an amount of $70 million, which increased the total aggregate principal amount available under the CVR Energy ABL from $275 million to $345 million; and
(4)Explored additional efforts to control costs.
These decisions support the Company’s focus on financial discipline to maintain adequate capital for ongoing operations throughout this environment of uncertainty. The Board will continue to evaluate the economic environment, the Company’s cash needs, optimal uses of cash, payment of dividends (if any), and other applicable factors, and may elect to make additional changes to the Company’s capital allocation in future periods.
Depending on the needs of our business, contractual limitations, and market conditions, we may, from time to time, seek to issue equity securities, incur additional debt, issue debt securities, or redeem, repurchase, refinance, or retire our outstanding debt through privately negotiated transactions, open market repurchases, redemptions, exchanges, tender offers or otherwise. There can be no assurance that we will seek to do any of the foregoing or that we will be able to do any of the foregoing on terms acceptable to us or at all. We closely monitor the amounts and timing of our sources and uses of funds and the availability and borrowings, if any, under the CVR Energy ABL. Our ability to incur additional indebtedness could be restricted by the terms of our existing Senior Notes, the CVR Energy ABL, as defined below, or the Term Loan.
Considering the market conditions and actions outlined above, we believe that our cash from operations and existing cash and cash equivalents, along with borrowings, as necessary, will be sufficient to satisfy anticipated cash requirements associated with our existing operations for at least the next 12 months. Our future expenditures for turnaround, capital expenditures and other cash requirements could be higher than we currently expect as a result of various factors including, but not limited to, rising material and labor costs, the costs associated with complying with the RFS and the outcome of litigation and other factors. Additionally, our ability to generate adequate cash from our operating activities in the current commodity price environment, sell non-core assets, access capital markets, incur additional debt or take any other action to improve our liquidity is subject to the risks discussed above and elsewhere in our periodic reports and the other risks and uncertainties that exist in our industry, and depends on our future operational performance, which is subject to general economic, political, financial, competitive, and other factors, some of which may be beyond our control.
The Company and its subsidiaries were in compliance with applicable financial covenants under their respective debt instruments as of December 31, 2024 and through the date of filing of this Report, as applicable.
Cash Balances and Other Liquidity
As of December 31, 2024, we had total liquidity of approximately $1.3 billion. Total liquidity consists of $987 million of consolidated cash and cash equivalents, $238 million available under CVR Energy’s Amended and Restated ABL Credit Agreement (the “CVR Energy ABL”), and $39 million available under the CVR Partners ABL. As of December 31, 2023, we had total liquidity of approximately $869 million, not considering the $598 million of reserved funds that were utilized for the repayment of CVR Energy’s 5.25% Senior Notes, due 2025 (the “2025 Notes”). Total liquidity consisted of $581 million in cash and cash equivalents, $249 million available under the CVR Energy ABL, and $39 million available under the CVR Partners ABL.
Long-term debt consisted of the following:
| | | | | | | | | | | |
| December 31, |
| (in millions) | 2024 | | 2023 |
| CVR Energy: | | | |
| | | |
| 8.50% Senior Notes, due January 2029 | $ | 600 | | | $ | 600 | |
| 5.75% Senior Notes, due February 2028 | 400 | | | 400 | |
| Unamortized debt issuance costs | (4) | | | (5) | |
| Total CVR Energy debt | 996 | | | 995 | |
| Petroleum Segment: | | | |
| Term Loan | 322 | | | — | |
| | | |
| Unamortized debt discount and debt issuance costs | (8) | | | — | |
| Total Petroleum Segment debt | 314 | | | — | |
| Nitrogen Fertilizer Segment: | | | |
| 6.125% Senior Secured Notes, due June 2028 | 550 | | | 550 | |
| Unamortized debt issuance costs | (2) | | | (3) | |
| Total Nitrogen Fertilizer Segment debt | 548 | | | 547 | |
| Total long-term debt | 1,858 | | | 1,542 | |
Current portion of long-term debt (1) | 3 | | | 599 | |
| Total long-term debt, including current portion | $ | 1,861 | | | $ | 2,141 | |
(1)On February 15, 2024, CVR Energy’s 5.25% Senior Notes, due 2025 (the “2025 Notes”) were redeemed in full, at par, plus accrued and unpaid interest to the redemption date.
CVR Energy
As of December 31, 2024, CVR Energy has the 5.75% Senior Notes, due 2028 (the “2028 Notes”) and the 8.50% Senior Notes, due 2029 (the “2029 Notes”), the net proceeds of which may be used for general corporate purposes, which may include funding acquisitions, working capital and capital expenditures, share repurchases or distributions to our stockholders.
Petroleum Segment
As of December 31, 2024, the Petroleum Segment has the Term Loan and the CVR Energy ABL. The net proceeds from the Term Loan will be used to fund capital expenditures, including turnaround initiatives. The CVR Energy ABL supports working capital needs and liquidity for daily operations.
Nitrogen Fertilizer Segment
As of December 31, 2024, the Nitrogen Fertilizer Segment had outstanding its 6.125% Senior Secured Notes, due June 2028 (the “2028 UAN Notes”) and the CVR Partners ABL, the proceeds of which may be used to fund working capital and capital expenditures and for other general corporate purposes.
Refer to Part II, Item 8, Note 8 (“Long-Term Debt and Finance Lease Obligations”) of this Report for further discussions of these debt instruments.
Capital Spending
We divide capital spending needs into two categories: maintenance and growth. Maintenance capital spending includes non-discretionary maintenance projects and projects required to comply with environmental, health, and safety regulations. Growth capital projects generally involve an expansion of existing capacity, reliability improvements, and/or a reduction in direct operating expenses. We undertake growth capital spending based on the expected return on incremental capital employed, which is typically funded by reserves taken in prior years.
Our total capital expenditures for the year ended December 31, 2024, along with our estimated expenditures for 2025, by segment, are as follows:
| | | | | | | | | | | | | | | | | | | | | | | | | | | | | | | | |
| 2024 Actual | | 2025 Estimate |
| Maintenance | Growth | Total | | Maintenance | Growth | Total |
| (in millions) | | Low | High | Low | High | Low | High |
| Petroleum | $ | 90 | | $ | 38 | | $ | 128 | | | $ | 70 | | $ | 80 | | $ | 35 | | $ | 45 | | $ | 105 | | $ | 125 | |
| Renewables | 3 | | 8 | | 11 | | | 3 | | 5 | | 1 | | 2 | | 4 | | 7 | |
| Nitrogen Fertilizer | 30 | | 7 | | 37 | | | 35 | | 45 | | 20 | | 25 | | 55 | | 70 | |
| Other | 4 | | 1 | | 5 | | | — | | 2 | | 1 | | 1 | | 1 | | 3 | |
| Total | $ | 127 | | $ | 54 | | $ | 181 | | | $ | 108 | | $ | 132 | | $ | 57 | | $ | 73 | | $ | 165 | | $ | 205 | |
Our estimated capital expenditures are subject to further change due to changes in capital projects’ cost, scope, and completion time. For example, we may experience labor or equipment cost changes necessary to comply with government regulations or to complete projects that sustain the operations of the refineries or facilities. The UAN GP Board determines CVR Partners’ capital spending. We will continue to monitor market conditions and make adjustments, if needed, to our current capital spending or turnaround plans. We may also accelerate or defer some capital expenditures from time to time. For example, as described further above, volatile commodity pricing and higher industry utilization and oversupply have had an unfavorable impact on our business and have negatively impacted our cash from operating activities and liquidity. As a result, in October 2024, the Board elected to suspend payment of the cash dividend, defer new growth capital spending, and reduce certain expected capital expenditures, as further discussed under “Liquidity and Capital Resources” above.
The Petroleum Segment’s planned turnaround at the Wynnewood Refinery commenced in February 2024 and was completed in March 2024. The planned turnaround at the Coffeyville Refinery commenced in January 2025 and is expected to be completed 45 days from commencement. The Petroleum Segment’s total capitalized expenditures were $58 million, $60 million, and $81 million during the years ended December 31, 2024, 2023, and 2022, respectively.
The Nitrogen Fertilizer Segment incurred turnaround expenses of less than $1 million, $2 million, and $33 million during the years ended December 31, 2024, 2023, and 2022, respectively. The next planned turnarounds are currently scheduled to commence in the fourth quarter of 2025 at the Coffeyville Fertilizer Facility and in 2026 at the East Dubuque Fertilizer Facility.
Cash Requirements
The following table summarizes our known contractual obligations and other commercial commitments as of December 31, 2024 that are expected to be paid within the next year and thereafter:
| | | | | | | | | | | | | | | | | |
| Payments Due by Period | | |
| (in millions) | Short-Term | | Long-Term | | Total |
Debt obligations (1) | $ | 3 | | | $ | 1,872 | | | $ | 1,875 | |
Interest payments related to debt obligations (2) | 137 | | | 317 | | | 454 | |
Operating lease liabilities (3) | 21 | | | 67 | | | 88 | |
Finance lease obligations (3) | 14 | | | 75 | | | 89 | |
Other long-term liabilities (4) | 2 | | | 12 | | | 14 | |
Purchase commitments (5) | 45 | | | 90 | | | 135 | |
Transportation agreements (6) | 73 | | | 890 | | | 963 | |
| Total cash requirements | $ | 295 | | | $ | 3,323 | | | $ | 3,618 | |
(1)Debt obligations consist of the Term Loan, 2028 Notes, 2029 Notes, and 2028 UAN Notes as of December 31, 2024.
(2)Interest payments related to debt obligations consist of interest payments for our long-term debt outstanding as of December 31, 2024 and commitment fees on the unutilized commitments of the CVR Energy ABL and the CVR Partners ABL.
(3)Operating lease liabilities and finance lease obligations are described in Part II, Item 8, Note 6 (“Leases”) of this Report.
(4)Other long-term liabilities include obligations related to environmental liabilities. Environmental liabilities represents our estimated payments required by federal and/or state environmental agencies. See Part I, Item 1, “Environmental Matters”.
(5)Consists primarily of purchase obligations for pipeline storage and capacity, the supply of pet coke, oxygen, nitrogen, and other feedstocks, and water and utilities usage.
(6)Includes purchase obligations related to the transportation of feedstocks.
Dividends to CVR Energy Stockholders
Dividends, if any, including the payment, amount and timing thereof, are determined at the discretion of the Board. IEP, through its ownership of the Company’s common stock, is entitled to receive dividends that are declared and paid by the Company based on the number of shares held at each record date. The following table presents quarterly and special dividends paid to the Company’s stockholders, including IEP, during 2024, 2023, and 2022 (amounts presented in the table below may not add to totals presented due to rounding):
| | | | | | | | | | | | | | | | | | | | | | | | | | | | | | | | |
| | | | | | Quarterly Dividends Paid (in millions) |
| Related Period | | Date Paid | | Quarterly Dividends
Per Share | | Public Stockholders | | IEP | | Total |
| 2023 - 4th Quarter | | March 11, 2024 | | $ | 0.50 | | | $ | 17 | | | $ | 33 | | | $ | 50 | |
| 2024 - 1st Quarter | | May 20, 2024 | | 0.50 | | | 17 | | | 33 | | | 50 | |
| 2024 - 2nd Quarter | | August 19, 2024 | | 0.50 | | | 17 | | | 33 | | | 50 | |
| | | | | | | | | | |
| Total 2024 quarterly dividends | | $ | 1.50 | | | $ | 51 | | | $ | 100 | | | $ | 151 | |
| | | | | | | | | | |
| 2022 - 4th Quarter | | March 13, 2023 | | $ | 0.50 | | | $ | 15 | | | $ | 36 | | | $ | 50 | |
| 2023 - 1st Quarter | | May 22, 2023 | | 0.50 | | | 15 | | | 36 | | | 50 | |
| 2023 - 2nd Quarter | | August 21, 2023 | | 0.50 | | | 15 | | | 36 | | | 50 | |
| 2023 - 3rd Quarter | | November 20, 2023 | | 0.50 | | | 17 | | | 33 | | | 50 | |
| Total 2023 quarterly dividends | | $ | 2.00 | | | $ | 61 | | | $ | 140 | | | $ | 201 | |
| | | | | | | | | | |
| | | | | | | | | | |
| 2022 - 1st Quarter | | May 23, 2022 | | $ | 0.40 | | | $ | 12 | | | $ | 28 | | | $ | 40 | |
| 2022 - 2nd Quarter | | August 22, 2022 | | 0.40 | | | 12 | | | 28 | | | 40 | |
| 2022 - 3rd Quarter | | November 21, 2022 | | 0.40 | | | 12 | | | 28 | | | 40 | |
| Total 2022 quarterly dividends | | $ | 1.20 | | | $ | 36 | | | $ | 85 | | | $ | 121 | |
| | | | | | | | | | |
| | | | | | |
| | | | | | | | | | |
| | | | | | | | | | |
| | | | | | | | | | |
| | | | | | | | |
| | | | | | | | | | |
| | | | | | | | | | |
| | | | | | | | | | |
| | | | | | | | |
| | | | | | | | | | | | | | | | | | | | | | | | | | | | | | | | |
| | | | | | Special Dividends Paid (in millions) |
| Related Period | | Date Paid | | Special Dividends
Per Share | | Public Stockholders | | IEP | | Total |
| 2023 - 2nd Quarter | | August 21, 2023 | | $ | 1.00 | | | $ | 29 | | | $ | 71 | | | $ | 101 | |
| 2023 - 3rd Quarter | | November 20, 2023 | | 1.50 | | | 51 | | | 100 | | | 151 | |
| Total 2023 special dividends | | $ | 2.50 | | | $ | 80 | | | $ | 171 | | | $ | 251 | |
| | | | | | | | | | |
| 2022 - 2nd Quarter | | August 22, 2022 | | $ | 2.60 | | | $ | 76 | | | $ | 185 | | | $ | 261 | |
| 2022 - 3rd Quarter | | November 21, 2022 | | 1.00 | | | 29 | | | 71 | | | 101 | |
| Total 2022 special dividends | | $ | 3.60 | | | $ | 106 | | | $ | 256 | | | $ | 362 | |
There were no quarterly dividends declared or paid during the fourth quarter of 2024 related to the third quarter of 2024, and there were no quarterly dividends declared or paid during the first quarter of 2022 related to the fourth quarter of 2021. No dividends were declared for the fourth quarter of 2024.
Distributions to CVR Partners’ Unitholders
Distributions, if any, including the payment, amount and timing thereof, and UAN GP Board’s distribution policy, including the definition of available cash, are subject to change at the discretion of the UAN GP Board. The following tables
present quarterly distributions paid by CVR Partners to CVR Partners’ unitholders, including amounts received by the Company, during 2024, 2023, and 2022 (amounts presented in the table below may not add to totals presented due to rounding):
| | | | | | | | | | | | | | | | | | | | | | | | | | | | | | | | |
| | | | | | | | | | |
| | | | | | Quarterly Distributions Paid (in millions) |
| Related Period | | Date Paid | | Quarterly Distributions
Per Common Unit | | Public Unitholders | | CVR Energy | | Total |
| 2023 - 4th Quarter | | March 11, 2024 | | $ | 1.68 | | | $ | 11 | | | $ | 7 | | | $ | 18 | |
| 2024 - 1st Quarter | | May 20, 2024 | | 1.92 | | | 13 | | | 7 | | | 20 | |
| 2024 - 2nd Quarter | | August 19, 2024 | | 1.90 | | | 13 | | | 7 | | | 20 | |
| 2024 - 3rd Quarter | | November 18, 2024 | | 1.19 | | | 7 | | | 5 | | | 13 | |
| Total 2024 quarterly distributions | | $ | 6.69 | | | $ | 44 | | | $ | 26 | | | $ | 71 | |
| | | | | | | | | | |
| 2022 - 4th Quarter | | March 13, 2023 | | $ | 10.50 | | | $ | 70 | | | $ | 41 | | | $ | 111 | |
| 2023 - 1st Quarter | | May 22, 2023 | | 10.43 | | | 70 | | | 41 | | | 110 | |
| 2023 - 2nd Quarter | | August 21, 2023 | | 4.14 | | | 28 | | | 16 | | | 44 | |
| 2023 - 3rd Quarter | | November 20, 2023 | | 1.55 | | | 10 | | | 6 | | | 16 | |
| Total 2023 quarterly distributions | | $ | 26.62 | | | $ | 178 | | | $ | 104 | | | $ | 281 | |
| | | | | | | | | | |
| 2021 - 4th Quarter | | March 14, 2022 | | $ | 5.24 | | | $ | 36 | | | $ | 20 | | | $ | 56 | |
| 2022 - 1st Quarter | | May 23, 2022 | | 2.26 | | | 15 | | | 9 | | | 24 | |
| 2022 - 2nd Quarter | | August 22, 2022 | | 10.05 | | | 67 | | | 39 | | | 106 | |
| 2022 - 3rd Quarter | | November 21, 2022 | | 1.77 | | | 12 | | | 7 | | | 19 | |
| Total 2022 quarterly distributions | | $ | 19.32 | | | $ | 129 | | | $ | 75 | | | $ | 205 | |
For the fourth quarter of 2024, CVR Partners, upon approval by the UAN GP Board on February 18, 2025, declared a distribution of $1.75 per common unit, or $18 million, which is payable March 10, 2025 to unitholders of record as of March 3, 2025. Of this amount, CVR Energy and IEP will receive approximately $7 million and less than $1 million, with the remaining amount payable to public unitholders.
Capital Structure
On May 6, 2020, CVR Partners announced that the UAN GP Board, on behalf of CVR Partners, authorized a unit repurchase program, which was increased on February 22, 2021 (the “Unit Repurchase Program”). The Unit Repurchase Program authorized CVR Partners to repurchase up to $20 million of CVR Partners’ common units. On February 20, 2024, the UAN GP Board, on behalf of CVR Partners, terminated the nominal authority remaining under the Unit Repurchase Program. From authorization through March 2022, CVR Partners repurchased, on a split-adjusted basis, 759,250 common units on the open market in accordance with a repurchase agreement under Rules 10b5-1 and 10b-18 of the Securities Exchange Act of 1934, as amended, at a cost of $20 million, exclusive of transaction costs, or an average price of $26.33 per common unit. Prior to the termination of the Unit Repurchase Program in 2024 and for the year ended December 31, 2023, CVR Partners did not repurchase any common units.
Cash Flows
The following table sets forth our consolidated cash flows for the periods indicated below:
| | | | | | | | | | | | | | | | | |
| Year Ended December 31, |
| (in millions) | 2024 | | 2023 | | 2022 |
| Net cash provided by (used in): | | | | | |
| Operating activities | $ | 404 | | | $ | 948 | | | $ | 967 | |
| Investing activities | (121) | | | (239) | | | (271) | |
| Financing activities | (482) | | | (40) | | | (696) | |
| Net (decrease) increase in cash, cash equivalents, reserved funds and restricted cash | $ | (199) | | | $ | 669 | | | $ | — | |
Operating Activities
The change in net cash provided by operating activities for the year ended December 31, 2024 compared to the year ended December 31, 2023 was driven primarily by lower income from operations, offset by an increase in net changes from working capital items. The decrease of $833 million in net income was primarily due to decreases in gasoline and distillate crack spreads, as well as decreased production caused by the Petroleum Unplanned Outages in 2024. The lower activity in the current period was offset by favorable working capital changes of $403 million which were substantially attributable to the volatility in the RFS obligation in the prior period.
Investing Activities
The change in net cash used in investing activities for the year ended December 31, 2024 compared to the year ended December 31, 2023 was primarily due to proceeds received from the sale of the Membership Interests contributing approximately $90 million, a decrease in capital expenditures of $26 million, received insurance proceeds of $10 million related to the Wynnewood Fire in the second quarter of 2024, and a decrease in turnaround expenditures of $4 million in 2024 compared to 2023. This was partially offset by lower distributions from the CVR Partners’ equity method investment of $13 million associated with the 45Q Transaction during 2024.
Financing Activities
The change in net cash used in financing activities for the year ended December 31, 2024 compared to the net cash used in financing activities for the year ended December 31, 2023 was primarily due to the $600 million redemption of the 2025 Notes in 2024 and the decrease in proceeds of $275 million from issuance of the Term Loan in 2024 compared to the 2029 Notes in 2023. This was partially offset by a decrease in dividends paid to CVR Energy stockholders of $302 million and a decrease in distributions paid to CVR Partners’ noncontrolling interest holders of $134 million during 2024 compared to 2023.
Recent Accounting Pronouncements
Refer to Part II, Item 8, Note 2 (“Summary of Significant Accounting Policies”) of this Report for a discussion of recent accounting pronouncements applicable to the Company.
Critical Accounting Estimates
We prepare our consolidated financial statements in accordance with GAAP requiring management to make judgments, assumptions, and estimates based on the best available information at the time. Accounting estimates are considered to be critical if (1) the nature of the estimates and assumptions is material due to the levels of subjectivity and judgment necessary to account for highly uncertain matters or the susceptibility of such matters to change; and (2) the impact of the estimates and assumptions on financial condition or operating performance is material. Actual results could differ from the estimates and assumptions used.
Inventory Valuation
The cost of our products is determined under the FIFO method, and our FIFO inventories are carried at the lower of cost or net realizable value. We compare the estimated realizable value of inventories to their cost by product at each of our facilities. In our Petroleum and Renewables Segments, to determine the net realizable value of our inventories, we assume that crude oil and other feedstocks are converted into refined products, which requires us to make estimates regarding the refined products expected to be produced from those feedstocks and the costs required to convert those feedstocks into refined products. We also estimate the usual and customary transportation costs required to move the inventory from our facilities to the appropriate points of sale, if material. We then apply an estimated selling price to our inventories based primarily on actual prices observed subsequent to the end of the reporting period with any remaining volumes’ selling price estimated using indicative market pricing available as of the time the estimate is made. In our Nitrogen Fertilizer Segment, depending on inventory levels, the per-ton realizable value of our fertilizer products is estimated using pricing on in-transit orders, pricing for open, fixed-price orders that have not shipped, and, if volumes remain unaccounted for, current management pricing estimates for fertilizer products. Management’s estimate for current pricing reflects up-to-date pricing in each business’s market as of the end of each reporting period. Reductions to selling prices for unreimbursed freight costs are included to arrive at net realizable value, as applicable. If the net realizable value is less than cost, we recognize a loss for the difference in our statements of operations in the period in which it occurs. During the years ended December 31, 2024 and December 31, 2023, we recognized losses on inventory of $5 million and $4 million to reflect net realizable value associated with our Renewables Segment. No amounts were recognized in 2022. Due to the amount and variability in volume of inventories maintained, changes in production costs, and the volatility of market pricing for our products, losses recognized to reflect inventories at the lower of cost or net realizable value could have a material impact on the Company’s results of operations.
Impairment of Long-lived Assets
Long-lived assets used in operations are assessed for impairment whenever changes in facts and circumstances indicate a possible significant deterioration in future expected cash flows. If the sum of the undiscounted expected future cash flows of an asset group is less than the carrying value, including applicable liabilities, the carrying value may be written down to its estimated fair value. Individual assets are grouped for impairment purposes based on a judgmental assessment of the lowest level for which there are identifiable cash flows that are largely independent of the cash flows of other assets. In addition, when preparing the expected future cash flows or estimating the fair value of impaired assets, we make several estimates that include subjective assumptions related to future sales volumes, commodity prices, operating costs, discount rates, and capital expenditures, among others.
Item 7A. Quantitative and Qualitative Disclosures About Market Risk
Our market risk sensitive instruments and positions have inherent risks including potential loss from adverse changes in commodity prices, RINs prices, and interest rates.
Commodity Price Risk
The Company, as a manufacturer of refined petroleum and renewable products and of nitrogen fertilizer products, all of which are commodities, has exposure to market pricing for products sold in the future. In order to realize value from our processing capacity, a positive spread between the cost of raw materials and the value of finished products must be achieved (i.e., gross margin or crack spread). The physical commodities that comprise our raw materials and finished goods are typically bought and sold at a spot or index price that can be highly variable.
The Petroleum Segment utilizes a crude oil purchasing intermediary to purchase the majority of its non-gathered crude oil inventory for the refineries. This arrangement allows the Petroleum Segment to take title to and price its crude oil at locations in close proximity to the refineries, as opposed to the crude oil origination point, reducing its risk associated with volatile commodity prices by shortening the commodity conversion cycle time. The commodity conversion cycle time refers to the time elapsed between raw material acquisition and the sale of finished goods.
In addition, our refining business seeks to reduce the variability of commodity price exposure by engaging in hedging strategies and transactions that will serve to protect gross margin as forecasted in the annual operating plan. With regard to its hedging activities, our refining business may enter into, or has entered into, financial instruments which serve to (1) lock in or fix a percentage of the anticipated or planned gross margin in future periods when the derivative market offers commodity
spreads that generate positive cash flows, (2) hedge the value of inventories in excess of minimum required inventories, and (3) manage existing positions related to a change in anticipated operations and market conditions.
The Nitrogen Fertilizer Segment has commitments to purchase pet coke and natural gas for use in the fertilizer facilities through short-term, fixed price, and index price purchase contracts. In the normal course of business, nitrogen-based fertilizer products are produced throughout the year to supply the needs of our customers during the high-delivery-volume spring and fall seasons. The value of fertilizer product inventory is subject to market risk due to fluctuations in the relevant commodity prices, which can lead to volatile prices of nitrogen fertilizer products. We believe that market prices of nitrogen products are affected by changes in grain prices, demand, natural gas prices, and other factors. A $1.00 per MMBtu change in the price of natural gas would change the cost to produce a ton of ammonia and UAN by approximately $14.29 and $5.86, respectively. A $1.00 per ton change in the price of pet coke would change the cost to produce a ton of ammonia and UAN by approximately $0.66 and $0.27, respectively. In the opinion of our management, there are no financial instruments that correlate with our firm pet coke commitments and forecasted commodity sales transactions that could be used to effectively reduce commodity price risk.
RFS Compliance Price Risk
As a producer of transportation fuels from crude oil, the Petroleum Segment’s obligated-party subsidiaries are required to blend biofuels into the products it produces or purchase RINs in the open market in lieu of blending to meet the mandates established by the EPA, unless the obligations are waived, such as through a small refinery waiver. The Petroleum Segment’s obligated-party subsidiaries are exposed to market risk related to volatility in the price of RINs needed to comply with the RFS that are not otherwise generated through blending of renewable fuels in our refining and marketing operations. To mitigate the impact of this risk on the Petroleum Segment’s results of operations and cash flows, the Petroleum Segment’s obligated-party subsidiaries blend ethanol and biodiesel to the extent possible. Alleviating the Company’s exposure to the market risk of RINs price volatility, the Petroleum Segment’s obligated-party subsidiaries purchase internally generated RINs from our Renewables Segment to partially satisfy their RFS obligations. We continually monitor the impact of the RFS on our business and evaluate strategies to mitigate the impacts of the RFS program, the administration thereof, and the market volatility for RINs on our business. Refer to Part I, Item 1A, “Risk Factors”, Part II, Item 7, “Management’s Discussion and Analysis of Financial Condition and Results of Operations” and Part II, Item 8, Note 14 (“Commitments and Contingencies”) of this Report for further discussion about compliance with the RFS and the potential impacts on our business.
Interest Rate Risk
We may be exposed to risk based on changes in interest rates related to the CVR Energy ABL, CVR Partners ABL, and the Term Loan, which bear interest at the Secured Overnight Financing Rate (“SOFR”) plus a premium. As of and during the year ended December 31, 2024, there were $325 million of outstanding borrowings under the Term Loan that were subject to variable interest rates, and no variable rate borrowings under the CVR Energy ABL or CVR Partners ABL as of and during the years ended December 31, 2024 and 2023. Based on the outstanding Term Loan balance at December 31, 2024, a hypothetical 50-basis point fluctuation in interest rates would result in an annual change of $2 million recognized in Interest expense, net on the Consolidated Statements of Operations. Further, fixed-rate debt, such as the 2028 Notes, 2028 UAN Notes, and 2029 Notes (collectively, the “Notes”), exposes us to changes in the fair value of our debt due to changes in market interest rates, but not our earnings or cash flows. Based on the Notes, a hypothetical 50-basis point fluctuation in interest rates at December 31, 2024 would have resulted in a change of $23 million in fair value disclosure. Fixed-rate debt also exposes us to the risk that we may need to refinance maturing debt with new debt at higher rates, or that we may be obligated to pay rates higher than the current market.
Item 8. Financial Statements and Supplementary Data
CVR ENERGY, INC. AND SUBSIDIARIES
INDEX TO CONSOLIDATED FINANCIAL STATEMENTS
Report of Independent Registered Public Accounting Firm
The Board of Directors and Stockholders of CVR Energy, Inc.
Opinion on the financial statements
We have audited the accompanying consolidated balance sheets of CVR Energy, Inc. (a Delaware corporation) and subsidiaries (the “Company”) as of December 31, 2024 and 2023, the related consolidated statements of operations, changes in equity, and cash flows for each of the three years in the period ended December 31, 2024, and the related notes (collectively referred to as the “financial statements”). In our opinion, the financial statements present fairly, in all material respects, the financial position of the Company as of December 31, 2024 and 2023, and the results of its operations and its cash flows for each of the three years in the period ended December 31, 2024, in conformity with accounting principles generally accepted in the United States of America.
We also have audited, in accordance with the standards of the Public Company Accounting Oversight Board (United States) (“PCAOB”), the Company’s internal control over financial reporting as of December 31, 2024, based on criteria established in the 2013 Internal Control—Integrated Framework issued by the Committee of Sponsoring Organizations of the Treadway Commission (“COSO”), and our report dated February 19, 2025, expressed an unqualified opinion.
Basis for opinion
These financial statements are the responsibility of the Company’s management. Our responsibility is to express an opinion on the Company’s financial statements based on our audits. We are a public accounting firm registered with the PCAOB and are required to be independent with respect to the Company in accordance with the U.S. federal securities laws and the applicable rules and regulations of the Securities and Exchange Commission and the PCAOB.
We conducted our audits in accordance with the standards of the PCAOB. Those standards require that we plan and perform the audit to obtain reasonable assurance about whether the financial statements are free of material misstatement, whether due to error or fraud. Our audits included performing procedures to assess the risks of material misstatement of the financial statements, whether due to error or fraud, and performing procedures that respond to those risks. Such procedures included examining, on a test basis, evidence regarding the amounts and disclosures in the financial statements. Our audits also included evaluating the accounting principles used and significant estimates made by management, as well as evaluating the overall presentation of the financial statements. We believe that our audits provide a reasonable basis for our opinion.
Critical audit matters
Critical audit matters are matters arising from the current period audit of the financial statements that were communicated or required to be communicated to the audit committee and that: (1) relate to accounts or disclosures that are material to the financial statements and (2) involved our especially challenging, subjective, or complex judgments. We determined that there are no critical audit matters.
/s/ GRANT THORNTON LLP
We have served as the Company’s auditor since 2013.
Dallas, Texas
February 19, 2025
Report of Independent Registered Public Accounting Firm
The Board of Directors and Stockholders of CVR Energy, Inc.
Opinion on internal control over financial reporting
We have audited the internal control over financial reporting of CVR Energy, Inc. (a Delaware corporation) and subsidiaries (the “Company”) as of December 31, 2024, based on criteria established in the 2013 Internal Control—Integrated Framework issued by the Committee of Sponsoring Organizations of the Treadway Commission (“COSO”). In our opinion, the Company maintained, in all material respects, effective internal control over financial reporting as of December 31, 2024, based on criteria established in the 2013 Internal Control—Integrated Framework issued by COSO.
We also have audited, in accordance with the standards of the Public Company Accounting Oversight Board (United States) (“PCAOB”), the consolidated financial statements of the Company as of and for the year ended December 31, 2024, and our report dated February 19, 2025 expressed an unqualified opinion on those financial statements.
Basis for opinion
The Company’s management is responsible for maintaining effective internal control over financial reporting and for its assessment of the effectiveness of internal control over financial reporting, included in the accompanying Management’s Report on Internal Control Over Financial Reporting. Our responsibility is to express an opinion on the Company’s internal control over financial reporting based on our audit. We are a public accounting firm registered with the PCAOB and are required to be independent with respect to the Company in accordance with the U.S. federal securities laws and the applicable rules and regulations of the Securities and Exchange Commission and the PCAOB.
We conducted our audit in accordance with the standards of the PCAOB. Those standards require that we plan and perform the audit to obtain reasonable assurance about whether effective internal control over financial reporting was maintained in all material respects. Our audit included obtaining an understanding of internal control over financial reporting, assessing the risk that a material weakness exists, testing and evaluating the design and operating effectiveness of internal control based on the assessed risk, and performing such other procedures as we considered necessary in the circumstances. We believe that our audit provides a reasonable basis for our opinion.
Definition and limitations of internal control over financial reporting
A company’s internal control over financial reporting is a process designed to provide reasonable assurance regarding the reliability of financial reporting and the preparation of financial statements for external purposes in accordance with generally accepted accounting principles. A company’s internal control over financial reporting includes those policies and procedures that (1) pertain to the maintenance of records that, in reasonable detail, accurately and fairly reflect the transactions and dispositions of the assets of the company; (2) provide reasonable assurance that transactions are recorded as necessary to permit preparation of financial statements in accordance with generally accepted accounting principles, and that receipts and expenditures of the company are being made only in accordance with authorizations of management and directors of the company; and (3) provide reasonable assurance regarding prevention or timely detection of unauthorized acquisition, use, or disposition of the company’s assets that could have a material effect on the financial statements.
Because of its inherent limitations, internal control over financial reporting may not prevent or detect misstatements. Also, projections of any evaluation of effectiveness to future periods are subject to the risk that controls may become inadequate because of changes in conditions, or that the degree of compliance with the policies or procedures may deteriorate.
/s/ GRANT THORNTON LLP
Dallas, Texas
February 19, 2025
CVR ENERGY, INC. AND SUBSIDIARIES
CONSOLIDATED BALANCE SHEETS | | | | | | | | | | | |
| December 31, |
| (in millions) | 2024 | | 2023 |
| ASSETS |
| Current assets: | | | |
| Cash and cash equivalents (including $91 and $45, respectively, of consolidated variable interest entity (“VIE”)) | $ | 987 | | | $ | 581 | |
| Reserved funds for debt payment | — | | | 598 | |
| Accounts receivable, net (including $65 and $42, respectively, of VIE) | 295 | | | 286 | |
| Inventories (including $76 and $69, respectively, of VIE) | 502 | | | 604 | |
| Prepaid expenses (including $1 and $8, respectively, of VIE) | 16 | | | 59 | |
| Other current assets (including $1 and $1, respectively, of VIE) | 24 | | | 51 | |
| Total current assets | 1,824 | | | 2,179 | |
| Property, plant, and equipment, net (including $736 and $761, respectively, of VIE) | 2,176 | | | 2,221 | |
| Other long-term assets (including $50 and $48, respectively, of VIE) | 263 | | | 307 | |
| Total assets | $ | 4,263 | | | $ | 4,707 | |
| LIABILITIES AND EQUITY |
| Current liabilities: | | | |
| Current portion of long-term debt and finance lease obligations (including $1 and $0, respectively, of VIE) | $ | 12 | | | $ | 606 | |
| Accounts payable (including $37 and $39, respectively, of VIE) | 538 | | | 530 | |
| Other current liabilities (including $74 and $37, respectively, of VIE) | 548 | | | 546 | |
| Total current liabilities | 1,098 | | | 1,682 | |
| Long-term liabilities: | | | |
| Long-term debt and finance lease obligations, net of current portion (including $568 and $547, respectively, of VIE) | 1,907 | | | 1,579 | |
| Deferred income taxes | 277 | | | 327 | |
| Other long-term liabilities (including $46 and $50, respectively, of VIE) | 93 | | | 81 | |
| Total long-term liabilities | 2,277 | | | 1,987 | |
| Commitments and contingencies (See Note 14) | | | |
| | | |
| CVR Energy stockholders’ equity: | | | |
| Common stock, $0.01 par value per share; 350,000,000 shares authorized; 100,629,209 and 100,629,209 shares issued as of December 31, 2024 and 2023, respectively | 1 | | | 1 | |
| Additional paid-in-capital | 1,508 | | | 1,508 | |
| Accumulated deficit | (804) | | | (660) | |
| Treasury stock, 98,610 shares at cost | (2) | | | (2) | |
| | | |
| Total CVR stockholders’ equity | 703 | | | 847 | |
| Noncontrolling interest | 185 | | | 191 | |
| Total equity | 888 | | | 1,038 | |
| Total liabilities and equity | $ | 4,263 | | | $ | 4,707 | |
The accompanying notes are an integral part of these consolidated financial statements.
CVR ENERGY, INC. AND SUBSIDIARIES
CONSOLIDATED STATEMENTS OF OPERATIONS | | | | | | | | | | | | | | | | | |
| Year Ended December 31, |
| (in millions, except per share data) | 2024 | | 2023 | | 2022 |
| Net sales | $ | 7,610 | | | $ | 9,247 | | | $ | 10,896 | |
| Operating costs and expenses: | | | | | |
| Cost of materials and other | 6,448 | | | 7,013 | | | 8,766 | |
| Direct operating expenses (exclusive of depreciation and amortization) | 667 | | | 670 | | | 719 | |
| Depreciation and amortization | 290 | | | 291 | | | 281 | |
| Cost of sales | 7,405 | | | 7,974 | | | 9,766 | |
| | | | | |
| Selling, general and administrative expenses (exclusive of depreciation and amortization) | 139 | | | 141 | | | 149 | |
| Depreciation and amortization | 8 | | | 7 | | | 7 | |
| Loss on asset disposals | — | | | 2 | | | 11 | |
| | | | | |
| | | | | |
| Operating income | 58 | | | 1,123 | | | 963 | |
| Other (expense) income: | | | | | |
| Interest expense, net | (77) | | | (52) | | | (85) | |
| | | | | |
| | | | | |
| Other income (expense), net | 38 | | | 14 | | | (77) | |
| | | | | |
| Income before income tax expense | 19 | | | 1,085 | | | 801 | |
| Income tax (benefit) expense | (26) | | | 207 | | | 157 | |
| Net income | 45 | | | 878 | | | 644 | |
| Less: Net income attributable to noncontrolling interest | 38 | | | 109 | | | 181 | |
| Net income attributable to CVR Energy stockholders | $ | 7 | | | $ | 769 | | | $ | 463 | |
| | | | | |
| Basic and diluted earnings per share | $ | 0.06 | | | $ | 7.65 | | | $ | 4.60 | |
| | | | | |
| | | | | |
| | | | | |
| Weighted-average common shares outstanding: | | | | | |
| Basic and diluted | 100.5 | | | 100.5 | | | 100.5 | |
| | | | | |
The accompanying notes are an integral part of these consolidated financial statements.
CVR ENERGY, INC. AND SUBSIDIARIES
CONSOLIDATED STATEMENTS OF CHANGES IN EQUITY | | | | | | | | | | | | | | | | | | | | | | | | | | | | | | | | | | | | | | | | | | | | | | | | | |
| Common Stockholders | | | | |
| (in millions, except share data) | Shares Issued | | $0.01 Par Value Common Stock | | Additional Paid-In Capital | | Accumulated
Deficit | | Treasury Stock | | | | Total CVR Stockholders’ Equity | | Noncontrolling Interest | | Total Equity |
| Balance at December 31, 2021 | 100,629,209 | | | $ | 1 | | | $ | 1,510 | | | $ | (956) | | | $ | (2) | | | | | $ | 553 | | | $ | 217 | | | $ | 770 | |
| | | | | | | | | | | | | | | | | |
| Net income | — | | | — | | | — | | | 463 | | | — | | | | | 463 | | | 181 | | | 644 | |
| Dividends paid to CVR Energy stockholders | — | | | — | | | — | | | (483) | | | — | | | | | (483) | | | — | | | (483) | |
| Distributions from CVR Partners to public unitholders | — | | | — | | | — | | | — | | | — | | | | | — | | | (129) | | | (129) | |
| Changes in equity due to CVR Partners’ common unit repurchases | — | | | — | | | (2) | | | — | | | — | | | | | (2) | | | (9) | | | (11) | |
| | | | | | | | | | | | | | | | | |
| | | | | | | | | | | | | | | | | |
| | | | | | | | | | | | | | | | | |
| | | | | | | | | | | | | | | | | |
| Balance at December 31, 2022 | 100,629,209 | | | 1 | | | 1,508 | | | (976) | | | (2) | | | | | 531 | | | 260 | | | 791 | |
| | | | | | | | | | | | | | | | | |
| Net income | — | | | — | | | — | | | 769 | | | — | | | | | 769 | | | 109 | | | 878 | |
| Dividends paid to CVR Energy stockholders | — | | | — | | | — | | | (453) | | | — | | | | | (453) | | | — | | | (453) | |
| Distributions from CVR Partners to public unitholders | — | | | — | | | — | | | — | | | — | | | | | — | | | (178) | | | (178) | |
| | | | | | | | | | | | | | | | | |
| | | | | | | | | | | | | | | | | |
| | | | | | | | | | | | | | | | | |
| | | | | | | | | | | | | | | | | |
| | | | | | | | | | | | | | | | | |
| Balance at December 31, 2023 | 100,629,209 | | | 1 | | | 1,508 | | | (660) | | | (2) | | | | | 847 | | | 191 | | | 1,038 | |
| Net income | — | | | — | | | — | | | 7 | | | — | | | | | 7 | | | 38 | | | 45 | |
| Dividends paid to CVR Energy stockholders | — | | | — | | | — | | | (151) | | | — | | | | | (151) | | | — | | | (151) | |
| Distributions from CVR Partners to public unitholders | — | | | — | | | — | | | — | | | — | | | | | — | | | (44) | | | (44) | |
| | | | | | | | | | | | | | | | | |
| | | | | | | | | | | | | | | | | |
| | | | | | | | | | | | | | | | | |
| | | | | | | | | | | | | | | | | |
| | | | | | | | | | | | | | | | | |
| | | | | | | | | | | | | | | | | |
| Balance at December 31, 2024 | 100,629,209 | | | $ | 1 | | | $ | 1,508 | | | $ | (804) | | | $ | (2) | | | | | $ | 703 | | | $ | 185 | | | $ | 888 | |
The accompanying notes are an integral part of these consolidated financial statements.
CVR ENERGY, INC. AND SUBSIDIARIES
NOTES TO CONSOLIDATED FINANCIAL STATEMENTS
CVR ENERGY, INC. AND SUBSIDIARIES
CONSOLIDATED STATEMENTS OF CASH FLOWS | | | | | | | | | | | | | | | | | |
| Year Ended December 31, |
| (in millions) | 2024 | | 2023 | | 2022 |
| Cash flows from operating activities: | | | | | |
| Net income | $ | 45 | | | $ | 878 | | | $ | 644 | |
| Adjustments to reconcile net income to net cash provided by operating activities: | | | | | |
| Depreciation and amortization | 298 | | | 298 | | | 288 | |
| Loss on lower of cost or net realizable value adjustments | 5 | | | 4 | | | — | |
| | | | | |
| Deferred income taxes and unrecognized tax benefits | (50) | | | 67 | | | (17) | |
| | | | | |
| (Gain) loss on sale of investments and asset disposals | (24) | | | 2 | | | 11 | |
| | | | | |
| Unrealized loss (gain) on derivatives, net | 22 | | | (32) | | | 5 | |
| Share-based compensation | 15 | | | 34 | | | 71 | |
| Income from equity method investments | (13) | | | (12) | | | (10) | |
| Return from equity method investment earnings | 13 | | | 12 | | | 10 | |
| Other items | 7 | | | 2 | | | 2 | |
| Changes in assets and liabilities: | | | | | |
| Accounts receivable | (9) | | | 51 | | | (78) | |
| Inventories | 96 | | | 15 | | | (140) | |
| Prepaid expenses and other current assets | 33 | | | 19 | | | (29) | |
| | | | | |
| Accounts payable | 2 | | | 37 | | | 78 | |
| Deferred revenue | 29 | | | (24) | | | (20) | |
| Other current liabilities | (41) | | | (391) | | | 158 | |
| Other long-term assets and liabilities | (24) | | | (12) | | | (7) | |
| Net cash provided by operating activities | 404 | | | 948 | | | 967 | |
| Cash flows from investing activities: | | | | | |
| Capital expenditures | (179) | | | (205) | | | (191) | |
| Turnaround expenditures | (53) | | | (57) | | | (83) | |
| | | | | |
| Insurance proceeds related to asset damages | 10 | | | — | | | — | |
| Proceeds from sale of investments and assets | 92 | | | 1 | | | — | |
| Return of equity method investment | 9 | | | 22 | | | 3 | |
| | | | | |
| | | | | |
| | | | | |
| | | | | |
| Net cash used in investing activities | (121) | | | (239) | | | (271) | |
| Cash flows from financing activities: | | | | | |
| | | | | |
| | | | | |
| | | | | |
| | | | | |
| Proceeds from issuance of long-term debt | 325 | | | 600 | | | — | |
| Principal payments on senior secured notes | (600) | | | — | | | (65) | |
| | | | | |
| Repurchase of common units by CVR Partners | — | | | — | | | (12) | |
| | | | | |
| Dividends to CVR Energy’s stockholders | (151) | | | (453) | | | (483) | |
| | | | | |
| Distributions to CVR Partners’ noncontrolling interest holders | (44) | | | (178) | | | (129) | |
| Other financing activities | (12) | | | (9) | | | (7) | |
| Net cash used in financing activities | (482) | | | (40) | | | (696) | |
| Net (decrease) increase in cash, cash equivalents, reserved funds and restricted cash | (199) | | | 669 | | | — | |
| Cash, cash equivalents, reserved funds and restricted cash, beginning of period | 1,186 | | | 517 | | | 517 | |
| Cash, cash equivalents, reserved funds and restricted cash, end of period | $ | 987 | | | $ | 1,186 | | | $ | 517 | |
The accompanying notes are an integral part of these consolidated financial statements.
CVR ENERGY, INC. AND SUBSIDIARIES
NOTES TO CONSOLIDATED FINANCIAL STATEMENTS
(1) Organization and Nature of Business
Organization
CVR Energy, Inc. (“CVR Energy”, “CVR”, “we”, “us”, “our”, or the “Company”) is a diversified holding company primarily engaged in the petroleum refining and marketing industry (the “Petroleum Segment”), the renewable fuels industry (the “Renewables Segment”), and the nitrogen fertilizer manufacturing industry through its interest in CVR Partners, LP, a publicly traded limited partnership (the “Nitrogen Fertilizer Segment” or “CVR Partners”). The Petroleum Segment refines and markets high value transportation fuels which consist of gasoline, diesel, jet fuel, and distillates, as well as activities related to crude gathering and logistics that support the refinery operations. The Renewables Segment refines renewable feedstocks, such as soybean oil, corn oil, and other renewable feedstocks, into renewable diesel and markets renewables products. CVR Partners produces and markets nitrogen fertilizer products primarily in the form of ammonia and urea ammonium nitrate (“UAN”), for the farming industry. CVR’s common stock is listed on the New York Stock Exchange (“NYSE”) under the symbol “CVI”. As of December 31, 2024, Icahn Enterprises L.P. and its affiliates, including Mr. Carl C. Icahn (“IEP”), owned approximately 66% of the Company’s outstanding common stock. On January 8, 2025, IEP acquired an additional 1% ownership, or 878,212 additional shares of CVR Energy’s outstanding common stock at a price of $18.25 per share.
CVR Partners, LP
Interest Holders - As of December 31, 2024, public common unitholders held approximately 61% of CVR Partners’ outstanding common units; CVR Energy, through its subsidiaries, held approximately 37% of CVR Partners’ outstanding common units and held 100% of CVR Partners’ general partner interests, while IEP held the remaining approximately 2% of CVR Partners’ outstanding common units. The noncontrolling interest reflected on the Consolidated Balance Sheets of CVR is only impacted by the results of, distributions from, and unit repurchases by CVR Partners.
Unit Repurchase Program - On May 6, 2020, CVR Partners announced that the board of directors of CVR Partners’ general partner (the “UAN GP Board”), on behalf of CVR Partners, authorized a unit repurchase program, which was increased on February 22, 2021 (the “Unit Repurchase Program”). The Unit Repurchase Program authorized CVR Partners to repurchase up to $20 million of CVR Partners’ common units. On February 20, 2024, the UAN GP Board, on behalf of CVR Partners, terminated the nominal authority remaining under the Unit Repurchase Program. From authorization through March 2022, CVR Partners repurchased, on a split-adjusted basis, 759,250 common units on the open market in accordance with a repurchase agreement under Rules 10b5-1 and 10b-18 of the Securities Exchange Act of 1934, as amended, at a cost of $20 million exclusive of transaction costs, or an average price of $26.33 per common unit. Prior to the termination of the Unit Repurchase Program in 2024 and for the year ended December 31, 2023, CVR Partners did not repurchase any common units.
Subsequent Events
The Company evaluated subsequent events, if any, that would require an adjustment to the Company’s consolidated financial statements or require disclosure in the notes to the consolidated financial statements through the date of issuance of the consolidated financial statements. Where applicable, the notes to these consolidated financial statements have been updated to discuss all significant subsequent events which have occurred.
(2) Summary of Significant Accounting Policies
Principles of Consolidation
The accompanying consolidated financial statements, prepared in accordance with accounting principles generally accepted in the United States of America (“GAAP”) and in accordance with the rules and regulations of the Securities and Exchange Commission (“SEC”), include the accounts of the Company and its majority-owned direct and indirect subsidiaries. All intercompany accounts and transactions have been eliminated. The ownership interests of noncontrolling investors in CVR Partners are recorded as noncontrolling interests.
CVR Partners was determined to be a variable interest entity (“VIE”) and is consolidated by the Company. As the 100% owner of the general partner of CVR Partners, the Company has the sole ability to direct the activities that most significantly impact the economic performance of CVR Partners and is considered the primary beneficiary.
CVR ENERGY, INC. AND SUBSIDIARIES
NOTES TO CONSOLIDATED FINANCIAL STATEMENTS
Reclassifications
Effective with this Annual Report on Form 10-K for the year ended December 31, 2024 (this “Report”) and due to the prominence of the renewables business relative to the Company’s overall 2024 performance, the Company has revised its reportable segments to reflect a new reportable segment – Renewables. The Renewables Segment includes the operations of the renewable diesel unit and renewable feedstock pretreater at the refinery located in Wynnewood, Oklahoma (the “Wynnewood Refinery”). Results of the Renewables Segment were not previously included within our reportable segments, rather included within “Other”. Prior period segment information has been retrospectively adjusted to reflect the current segment presentation. Refer to Note 15 (“Business Segments”) for segment disclosures.
In addition, certain other immaterial reclassifications have been made within the consolidated financial statements for prior periods to conform with current presentation.
Use of Estimates
The consolidated financial statements are prepared in conformity with GAAP, which requires management to make certain estimates and assumptions that affect the reported amounts and disclosure of assets and liabilities at the date of the financial statements and the reported amounts of revenues and expenses during the reporting period. Estimates are reviewed on an ongoing basis, based on currently available information. Changes in facts and circumstances may result in revised estimates, and actual results could differ from those estimates.
Cash, Reserved Funds and Cash Equivalents
Cash, reserved funds and cash equivalents include cash on hand, demand deposits, and investments in highly liquid money market accounts with original maturities of three months or less. We maintain cash and cash equivalent balances with few financial institutions, which may at times be in excess of federally insured levels.
Restricted Cash
Restricted cash consists of cash and claims to cash that are legally restricted, have been set aside for a specific purpose, and restricted as to usage or withdrawal and, therefore, not available for immediate or general purpose use.
Accounts Receivable, net
Accounts receivable, net primarily consists of customer accounts receivable recorded at the invoiced amounts and generally do not bear interest. Allowances for doubtful accounts are based on historical loss experience, expected credit losses from current economic conditions, and management’s expectations of future economic conditions. The allowance is recorded when the receivable is deemed uncollectible and is booked to bad debt expense. The largest concentration of credit for any one customer was approximately 10% and 11% of the Accounts receivable, net balance at December 31, 2024 and 2023, respectively. The Company had no bad debt expense for the years ended December 31, 2024, 2023, and 2022.
Inventories
Inventories consist primarily of domestic and foreign crude oil, blending stock and components, work-in-progress, and refined fuels and by-products for the Petroleum Segment, soybean and corn oil, blending stock and components, work-in-progress, and renewable diesel for the Renewables Segment, and fertilizer products and raw materials (primarily pet coke) for the Nitrogen Fertilizer Segment. All of these components are valued at the lower of GAAP First-In, First-Out (“FIFO”) cost or net realizable value.
For each segment, we compare the estimated realizable value of inventories to their cost by product at each of our facilities. For our Petroleum and Renewables Segments, to determine the net realizable value of our inventories, we assume that crude oil and other feedstocks are converted into refined products, which requires us to make estimates regarding the refined products expected to be produced from those feedstocks and the costs required to convert those feedstocks into refined products. We also estimate the usual and customary transportation costs required to move the inventory from our facilities to the appropriate points of sale, if material. We then apply an estimated selling price to our inventories based primarily on actual prices observed
CVR ENERGY, INC. AND SUBSIDIARIES
NOTES TO CONSOLIDATED FINANCIAL STATEMENTS
subsequent to the end of the reporting period with any remaining volumes’ selling price estimated using indicative market pricing available as of the time the estimate is made. For our Nitrogen Fertilizer Segment, depending on inventory levels, the per-ton realizable value of our fertilizer products is estimated using pricing on in-transit orders, pricing for open, fixed-price orders that have not shipped, and, if volumes remain unaccounted for, current management pricing estimates for fertilizer products. Management’s estimate for current pricing reflects up-to-date pricing in the market as of the end of each reporting period. Reductions to selling prices for unreimbursed freight costs are included to arrive at net realizable value, as applicable.
Certain inventories in the Petroleum, Renewables and Nitrogen Fertilizer Segments, including other raw materials, spare parts, and supplies, are valued at the weighted moving-average cost, which approximates FIFO. The cost of inventories includes inbound freight costs.
Property, Plant and Equipment, net
Additions to property, plant and equipment, including capitalized interest and certain costs allocable to construction and property purchases, are recorded at cost. Expenditures for improvements that increase economic benefit or returns and/or extend useful life are capitalized, while expenditures for routine maintenance and repair costs are expensed when incurred and are reported in Direct operating expenses (exclusive of depreciation and amortization) in the Company’s Consolidated Statements of Operations. Depreciation is computed using the straight-line method over the estimated useful lives of the various classes of depreciable assets. The lives used in computing depreciation for significant asset classes are as follows:
| | | | | | | | |
| Asset | | Range of Useful Lives, in Years |
| Land improvements | | 10 to 30 |
| Buildings and improvements | | 1 to 30 |
| Machinery and equipment | | 1 to 30 |
| Furniture and fixtures | | 3 to 10 |
| Right-of-use (“ROU”) finance leases | | 2 to 18 |
| Other | | 5 to 30 |
Leasehold improvements and assets held under finance leases are depreciated or amortized utilizing the straight-line method over the shorter of the related contractual lease term or the estimated useful life of the asset.
Equity Method Investments
The Company accounts for investments in which it has a noncontrolling interest, yet has significant influence over the entity, using the equity method of accounting, whereby the Company records its pro-rata share of earnings, contributions to, and distributions from, as adjustments to the investment balance in Other long-term assets on our Consolidated Balance Sheets. The pro-rata share of earnings is also recorded in Other income (expense), net on our Consolidated Statements of Operations.
Leases
At inception, the Company determines whether an arrangement is a lease and, if so, the appropriate lease classification. Operating leases are included as operating lease ROU assets within Other long-term assets and lease liabilities within Other current liabilities and Other long-term liabilities on our Consolidated Balance Sheets. Finance leases are included as ROU finance leases within Property, plant, and equipment, net, and finance lease liabilities within Current portion of long-term debt and finance lease obligations and Long-term debt and finance lease obligations, net of current portion on our Consolidated Balance Sheets. Leases with an initial expected term of 12 months or less are considered short-term and are not recorded on our Consolidated Balance Sheets. The Company recognizes operating lease expense on a straight-line basis over the lease term within Direct operating expenses (exclusive of depreciation and amortization) and Cost of materials and other and finance lease expense on a straight-line basis over the lease term within Depreciation and amortization and Interest expense, net.
ROU assets and lease liabilities are recognized at the lease commencement date based on the present value of minimum lease payments over the lease term using an incremental borrowing rate with a maturity similar to the lease term. The lease term is modified to reflect options to extend or terminate the lease when it is reasonably certain we will exercise such option. The depreciable life of assets and leasehold improvements is limited by the expected lease term, unless there is a transfer of title or purchase option reasonably certain of exercise, in which case the depreciation policy in the “Property, Plant and Equipment,
CVR ENERGY, INC. AND SUBSIDIARIES
NOTES TO CONSOLIDATED FINANCIAL STATEMENTS
net” section above is applicable. The periodic lease payments are treated as payments of the lease obligation and interest is recorded as interest expense. A lease modification is assessed to conclude whether it is a separate new contract or a modified contract. If it is a modified contract, the Company reconsiders the lease classification and remeasures the lease.
Deferred Financing Costs
Lender and other third-party costs associated with debt issuances are deferred and amortized to interest expense and other financing costs using the effective-interest method over the term of the debt and, depending on maturity, are included within Current portion of long-term debt and finance lease obligations and Long-term debt and finance lease obligations, net of current portion. Deferred financing costs related to line-of-credit arrangements are amortized using the straight-line method through the maturity date of the facility and, depending on maturity, are included within Other current assets and Other long-term assets.
Impairment of Long-Lived Assets
Long-lived assets (excluding intangible assets with indefinite lives and deferred tax assets) are reviewed for impairment whenever events or changes in circumstances indicate that the carrying amount of an asset or asset group may not be recoverable. Recoverability of assets to be held and used is measured by a comparison of the carrying amount of an asset to the estimated undiscounted future net cash flows expected to be generated by the asset. If the carrying amount of an asset exceeds its estimated undiscounted future net cash flows, an impairment charge is recognized for the amount by which the carrying amount of the asset exceeds their fair value. Assets to be disposed of are reported at the lower of their carrying value or fair value less cost to sell.
Asset Retirement Obligations
The Company records an asset retirement obligation (“ARO”) at fair value for the estimated cost to retire a tangible long-lived asset at the time the liability is incurred, which is generally when the asset is purchased, constructed, or leased. The liability is recorded when there is a legal or contractual obligation to incur costs to retire the asset and only when a reasonable estimate of the fair value can be made.
Certain of the Company’s assets can be used for extended or indeterminate periods of time with proper maintenance and upgrades, which the Company intends, and has a historical practice of, to maintain and upgrade as technological advances are made available. As a result, the Company believes these assets have indeterminate lives for purposes of estimating AROs. A liability will be recognized at such time when sufficient information exists to estimate a date or range of potential settlement dates needed to employ a present value technique to estimate fair value.
Loss Contingencies
In the ordinary course of business, the Company may become party to lawsuits, administrative proceedings, and governmental investigations, including environmental, regulatory, and other matters. The outcome of these matters cannot always be predicted accurately, but the Company accrues liabilities for these matters if the Company has determined that it is probable a loss will be incurred, and the loss can be reasonably estimated. Accrued amounts are reflected in Other current liabilities or Other long-term liabilities depending on when the Company expects to expend such amounts and are adjusted as additional information becomes available or upon a change in circumstance, as applicable.
Environmental, Health & Safety (“EH&S”) Matters
CVR Energy is subject to various federal, state, and local environmental, health, and safety rules and regulations. Liabilities related to future remediation costs of past environmental contamination of properties are recognized when the related costs are considered probable and can be reasonably estimated. Estimates of these costs are based upon currently available facts, internal and third-party assessments of contamination, available remediation technology, site-specific costs, and currently enacted laws and regulations. In reporting environmental liabilities, no offset is made for potential recoveries. Loss contingency accruals, including those for environmental remediation, are subject to periodic management review and revision as further information develops or circumstances change, and such accruals can take into account the legal liability of other parties. Environmental expenditures for capital assets are capitalized at the time of the expenditure when such costs provide future economic benefits. Accrued amounts are reflected in Other current liabilities or Other long-term liabilities depending on when the Company expects to expend such amounts.
CVR ENERGY, INC. AND SUBSIDIARIES
NOTES TO CONSOLIDATED FINANCIAL STATEMENTS
Revenue Recognition
The Company’s revenue is generated from contracts with customers and is recognized at a point in time when performance obligations are satisfied by transferring control of the products or services to a customer. The transfer of control occurs upon shipment or delivery of the product, as the customer accepts the product, has title and significant risks and rewards of ownership of the product, physical possession of the product has been transferred, and we have the right to payment.
The transaction prices of the Company’s contracts are either fixed or based on market indices, and any uncertainty related to the variable consideration when determining the transaction price is resolved on the pricing date or the date when the product is delivered. The payment terms depend on the product and type of contract, but generally require customers to pay within 30 days or less, and do not contain significant financing components.
Any pass-through finished goods delivery costs reimbursed by customers are reported in Net sales, while an offsetting expense is included in Cost of materials and other. Non-monetary product exchanges and certain buy/sell transactions which are entered into in the normal course of business are included on a net cost basis in Cost of materials and other on our Consolidated Statements of Operations. Qualifying excise and other taxes collected from customers and remitted to governmental authorities are recorded as a reduction of the transaction price.
Certain sales contracts of the Nitrogen Fertilizer Segment require customer prepayment prior to product delivery to guarantee a price and supply of nitrogen fertilizer. Deferred revenue is recorded at the point in time in which a prepaid contract is legally enforceable and the associated right to consideration is unconditional prior to transferring product to the customer. An associated receivable is recorded for uncollected prepaid contract amounts.
Cost Classifications
Cost of materials and other consists primarily of costs for crude oil, feedstock blendstocks, purchased refined products, purchased ammonia, purchased hydrogen, pet coke, Renewable Identification Numbers (“RINs”), derivative gains or losses, and freight and distribution. Direct operating expenses (exclusive of depreciation and amortization) consist primarily of energy and other utility costs, direct costs of labor, including applicable share-based compensation expense, property taxes, plant-related maintenance services, including turnaround expenses for the Nitrogen Fertilizer Segment, and environmental and safety compliance costs, as well as catalyst and chemical costs. Selling, general and administrative expenses (exclusive of depreciation and amortization) consist primarily of labor and other direct expenses associated with the Company’s corporate activities, including accounting, finance, information technology, human resources, legal, and other related administrative functions. For the Company’s Nitrogen Fertilizer Segment, Cost of materials and other and Direct operating expenses (exclusive of depreciation and amortization) are also impacted by changes in inventory balances, as these financial statement line items include inventory production costs.
Derivatives
On a regular basis, the Company enters into commodity contracts with counterparties for the purchases or sale of crude oil, blendstocks, various finished products, RINs, and natural gas. These contracts usually meet the definition of a derivative and qualify for the normal purchase normal sale exception following the accrual method of accounting. All other derivative instruments are recorded in Prepaid expenses and other current assets, Other long-term assets, Other current liabilities, and Other long-term liabilities on our Consolidated Balance Sheets depending on the derivative position and when it will be settled, and are measured at fair value with changes to the fair value recognized in Cost of materials and other in the Consolidated Statements of Operations.
Fair Value of Financial Instruments
Financial instruments consist of cash and cash equivalents, reserved funds, restricted cash, accounts receivable, accounts payable, operating and finance lease obligations, and long-term debt are carried at cost and approximate their estimated fair value, except for the long-term debt. The Company’s derivative instruments and RFS obligations are recognized at fair value.
CVR ENERGY, INC. AND SUBSIDIARIES
NOTES TO CONSOLIDATED FINANCIAL STATEMENTS
Turnaround Expenses
Turnarounds represent major maintenance activities that require the shutdown of significant parts of a plant to perform necessary inspections, cleanings, repairs, and replacements of assets. Costs incurred for routine repairs and maintenance or unplanned outages at our facilities are expensed as incurred. Planned turnaround activities for the Petroleum Segment vary in frequency dependent on refinery units, but generally occur every four to five years, while the frequency of turnarounds in the Nitrogen Fertilizer Segment is generally every three years. Further details of each segment’s turnaround expensing method are discussed below.
Petroleum Segment - Consistent with others in the refining industry, the Petroleum Segment follows the deferral method of accounting for turnaround activities. Under the deferral method, the costs of turnarounds are deferred and amortized on a straight-line basis over a determined cycle, which represents the estimated time until the next turnaround occurs. Turnaround costs and related accumulated amortization are included in Other long-term assets on our Consolidated Balance Sheets. The amortization expense related to turnaround costs is included in Depreciation and amortization on our Consolidated Statements of Operations. During the years ended December 31, 2024, 2023, and 2022, the Petroleum Segment capitalized $58 million, $60 million, and $81 million, respectively. Capitalized turnaround costs are subject to impairment reviews, as discussed above.
Nitrogen Fertilizer Segment - The Nitrogen Fertilizer Segment follows the direct-expense method of accounting for turnaround activities. Costs associated with these turnaround activities are included in Direct operating expenses (exclusive of depreciation and amortization) on our Consolidated Statements of Operations. During the years ended December 31, 2024, 2023, and 2022, the Nitrogen Fertilizer Segment incurred turnaround expenses of less than $1 million, $2 million, and $33 million, respectively.
Share-Based Compensation
The Company accounts for share-based compensation in accordance with Financial Accounting Standards Board (“FASB”) Accounting Standards Codification (“ASC”) Topic 718, Compensation — Stock Compensation. Currently, all of the Company’s share-based compensation awards, including those issued by CVR Partners, are liability-classified and are measured at fair value at the end of each reporting period based on the applicable closing share or unit price. Compensation expense will fluctuate based on changes in the applicable share or unit prices and expense reversals resulting from employee terminations prior to award vesting. Additionally, the Company has issued certain performance unit awards whose fair value is recognized as compensation expense only if the attainment of the performance conditions is considered probable. Uncertainties involved in this estimate include continued employment requirements and whether or not the performance conditions will be attained. The performance objectives are set in accordance with approved levels of the business plan for the fiscal year during the performance cycle and, therefore, are considered reasonably possible of being achieved. If this assumption proves not to be true and the awards do not vest, compensation expense recognized during the performance cycle will be reversed. The Company recognizes forfeitures as they occur. Any previously recognized compensation expense is reversed in the period of forfeiture, and the corresponding liability is extinguished. There were no dilutive awards outstanding during the years ended December 31, 2024, 2023, and 2022.
Income Taxes
Income taxes are accounted for utilizing the asset and liability approach. Under this method, deferred tax assets and liabilities are recognized for the anticipated future tax consequences attributable to differences between the amounts recorded in the accounting books and their respective tax basis. Deferred amounts are measured using enacted tax rates expected to apply to taxable income in the year those temporary differences are expected to be recovered or settled. The effect on deferred tax assets and liabilities of a change in tax rates is recognized in income in the period that includes the enactment date. In assessing the realizability of the deferred income tax assets, including net operating loss and state tax credit carryforwards, management considers whether it is more likely than not that some portion or all of the deferred tax assets will not be realized. The ultimate realization of deferred income tax assets is dependent upon the generation of future taxable income during the periods in which those temporary differences become deductible. Management considers the scheduled reversal of deferred income tax liabilities, projected future taxable income, and tax planning strategies in making this assessment. Further, the Company recognizes interest expense (income) and penalties on uncertain tax positions and income tax deficiencies (refunds) in Income tax (benefit) expense.
CVR ENERGY, INC. AND SUBSIDIARIES
NOTES TO CONSOLIDATED FINANCIAL STATEMENTS
Recent Accounting Pronouncements - Adoption of Segment Reporting Standard
In November 2023, FASB issued Accounting Standard Update (“ASU”) 2023-07, Segment Reporting (Topic 280) - Improvements to Reportable Segment Disclosures, which includes requirements for more robust disclosures of significant segment expenses and information used in assessing segment performance on an annual and interim basis. The guidance also requires that a public entity that has a single reportable segment provide all the disclosures required by the guidance and all existing segment disclosures under the FASB Accounting Standards Codification (“ASC”) Topic 280, Segment Reporting. This standard is effective for the Company’s annual period beginning January 1, 2024 and interim periods beginning January 1, 2025 and should be applied retrospectively to all comparative periods. Effective with this Report, the Company adopted this ASU. Refer to Note 15 (“Business Segments”) for the required segment disclosures.
Recent Accounting Pronouncements - Accounting Standards Issued But Not Yet Implemented
In December 2023, FASB issued ASU 2023-09, Income Taxes (Topic 740) - Improvements to Income Tax Disclosures, which requires enhanced income tax disclosures that reflect how operations and related tax risks, as well as how tax planning and operational opportunities, affect the tax rate and prospects for future cash flows. This standard is effective for the Company’ annual reporting period beginning January 1, 2025 with early adoption permitted. While the Company does not expect adoption will have a material impact on its consolidated financial statements, it currently expects additional disclosures will be included for its annual reporting period beginning January 1, 2025 and interim reporting periods beginning January 1, 2026. The Company does not intend to early adopt this ASU.
In November 2024, FASB issued ASU 2024-03, Income Statement - Reporting Comprehensive Income - Expense Disaggregation Disclosures (Subtopic 220-40), which requires disclosure of specific information about costs and expenses within relevant expense captions on the face of the income statement, qualitative descriptions for expense captions not specifically disaggregated quantitatively, and the total amount and definition of selling expenses for interim and annual reporting periods. This standard is effective for the Company’s annual reporting period beginning January 1, 2027 and interim reporting periods beginning January 1, 2028 and should be applied retrospectively to all comparative periods. Early adoption is permitted. The Company is currently evaluating the effects of adopting this new accounting guidance.
(3) Inventory
Inventories consisted of the following:
| | | | | | | | | | | |
| December 31, |
| (in millions) | 2024 | | 2023 |
| Finished goods | $ | 221 | | | $ | 260 | |
| Raw materials | 146 | | | 226 | |
| In-process inventories | 28 | | | 21 | |
| Parts, supplies and other | 107 | | | 97 | |
| Total inventories | $ | 502 | | | $ | 604 | |
At December 31, 2024 and December 31, 2023, the Renewables Segment had inventories with carrying amounts exceeding their net realizable value, which is estimated using indicative market pricing available at the time the estimate was made. As a result, we recognized losses of $5 million and $4 million in Cost of materials and other in the Company’s Consolidated Statements of Operations for the years ended December 31, 2024 and 2023, respectively, to reflect the net realizable value of such inventories. No adjustment was necessary for the year ended December 31, 2022.
CVR ENERGY, INC. AND SUBSIDIARIES
NOTES TO CONSOLIDATED FINANCIAL STATEMENTS
(4) Property, Plant and Equipment
Property, plant, and equipment, net consisted of the following:
| | | | | | | | | | | |
| December 31, |
| (in millions) | 2024 | | 2023 |
| Machinery and equipment | $ | 4,403 | | | $ | 4,287 | |
| Buildings and improvements | 148 | | | 124 | |
| ROU finance leases | 106 | | | 81 | |
| Land and improvements | 74 | | | 74 | |
| Furniture and fixtures | 32 | | | 33 | |
| Construction in progress | 171 | | | 193 | |
| Other | 16 | | | 15 | |
| 4,950 | | | 4,807 | |
Less: Accumulated depreciation and amortization | (2,774) | | | (2,586) | |
| Total property, plant and equipment, net | $ | 2,176 | | | $ | 2,221 | |
For the years ended December 31, 2024, 2023, and 2022, depreciation and amortization expenses related to property, plant, and equipment were $238 million, $221 million, and $221 million, respectively, and capitalized interest was $7 million, $8 million, and $5 million, respectively.
During the years ended December 31, 2024, 2023, and 2022, the Company had not identified the existence of an impairment indicator for our long-lived asset groups as outlined under the FASB ASC Topic 360, Property, Plant, and Equipment.
(5) Equity Method Investments
We have variable interest in certain entities for which we have applied the VIE model under FASB ASC Topic 810, Consolidation and determined that these entities are variable interest entities. While we concluded we are not the primary beneficiary of these entities, we do have significant influence over their operating and financial policies and, therefore, applied the equity method of accounting for the respective investments. These investments are presented within Other long-term assets on our condensed consolidating financial statements:
•CVR-CapturePoint Parent LLC (“CVRP JV”) - As part of a series of agreements entered into by our subsidiaries with unaffiliated parties with the objective to monetize certain tax credits under Section 45Q of the Internal Revenue Code of 1986 (“45Q Transaction”), we received a 50% interest in CVRP JV in connection with a modification to a carbon oxide contract (“CO Contract”) with a customer. The Company has elected to record its share of the earnings or loss of CVRP JV one quarter in arrears.
•Enable South Central Pipeline, LLC (“Enable JV”) - Through our subsidiaries, we own a 40% interest in Enable JV, which operates a 12-inch 26-mile crude oil pipeline with a capacity of approximately 80,000 barrels per day that is connected to the Wynnewood Refinery. The remaining interest in Enable JV is owned by Energy Transfer LP. The Company has elected to record its share of the earnings or loss of Enable JV one month in arrears.
•Midway Pipeline, LLC (“Midway JV”) - On December 23, 2024, a subsidiary of the Company sold the 50% limited liability company interest in Midway JV (the “Membership Interests”) to Plains Pipeline, L.P. (“Plains”), pursuant to an Assignment and Assumption of Units, in exchange for cash consideration of approximately $90 million, resulting in a gain of $24 million included within Other income (expense), net. Midway Pipeline LLC operates a 16-inch 99-mile crude oil pipeline with a capacity of approximately 131,000 barrels per day, which connects the Coffeyville Refinery to the Cushing, Oklahoma oil hub (the “Midway Pipeline”). Prior to divesting its Membership Interests, the Company elected to record its share of the earnings or loss of Midway JV one month in arrears.
CVR ENERGY, INC. AND SUBSIDIARIES
NOTES TO CONSOLIDATED FINANCIAL STATEMENTS
| | | | | | | | | | | | | | | | | | | | | | | |
| (in millions) | CVRP JV | | Enable JV | | Midway JV | | Total |
| Balance at December 31, 2022 | $ | — | | | $ | 5 | | | $ | 71 | | | $ | 76 | |
| | | | | | | |
| CVRP JV inception | 46 | | | — | | | — | | | 46 | |
| Cash distributions | (21) | | | (4) | | | (9) | | | (34) | |
| Equity (loss) income | — | | | 4 | | | 8 | | | 12 | |
| Balance at December 31, 2023 | 25 | | | 5 | | | 70 | | | 100 | |
| | | | | | | |
Cash distributions (1) | (6) | | | (4) | | | (13) | | | (23) | |
| Equity income | — | | | 4 | | | 9 | | | 13 | |
| Midway JV disposition | — | | | — | | | (66) | | | (66) | |
| Balance at December 31, 2024 | $ | 19 | | | $ | 5 | | | $ | — | | | $ | 24 | |
(1)Includes a $2 million distribution to CVR Partners subsidiaries related to CVRP JV exceeding certain carbon oxide capture and sequestration milestones during 2023.
(6) Leases
Lease Overview
We lease certain pipelines, storage tanks, railcars, office space, land, and equipment across our refining, fertilizer, and corporate operations. Most of our leases include one or more renewal options to extend the lease term, which can be exercised at our sole discretion. Certain leases also include options to purchase the leased asset. Certain of our lease agreements include rental payments, which are adjusted periodically for factors such as inflation. Our lease agreements do not contain any material residual value guarantees or material restrictive covenants. Additionally, we do not have any material lessor or sub-leasing arrangements.
On December 23, 2024, in connection with the sale of our Membership Interests, a subsidiary of the Company entered into a pipeline transportation agreement, which we classify as an operating lease agreement, with Plains whereby the Company is required to transport all of the crude oil for the Coffeyville Refinery through the Midway Pipeline, except for certain gathered barrels. The consideration for this lease is 100% variable based on performance and there is no minimum volume commitment.
Balance Sheet Summary as of December 31, 2024 and 2023
The following tables summarize the right-of-use (“ROU”) asset and lease liability balances for the Company’s operating and finance leases at December 31, 2024 and 2023:
| | | | | | | | | | | | | | | | | | | | | | | |
| December 31, 2024 | | December 31, 2023 |
| (in millions) | Operating Leases | | Finance Leases | | Operating Leases | | Finance Leases |
| ROU assets, net | | | | | | | |
| Equipment, real estate and other | $ | 33 | | | $ | 36 | | | $ | 29 | | | $ | 14 | |
| Pipeline and storage | 25 | | | 14 | | | 12 | | | 17 | |
| Railcars | 17 | | | — | | | 12 | | | — | |
| Lease liability | | | | | | | |
| Equipment, real estate and other | $ | 30 | | | $ | 33 | | | $ | 25 | | | $ | 16 | |
| Pipelines and storage | 25 | | | 25 | | | 12 | | | 28 | |
| Railcars | 16 | | | — | | | 12 | | | — | |
CVR ENERGY, INC. AND SUBSIDIARIES
NOTES TO CONSOLIDATED FINANCIAL STATEMENTS
Lease Expense Summary for the Year Ended December 31, 2024, 2023 and 2022
For the years ended December 31, 2024, 2023, and 2022, we recognized lease expense comprised of the following components:
| | | | | | | | | | | | | | | | | |
| Year Ended December 31, |
| (in millions) | 2024 | | 2023 | | 2022 |
| Operating lease expense | $ | 19 | | | $ | 18 | | | $ | 16 | |
| Finance lease expense: | | | | | |
| Amortization of ROU asset | 5 | | | 6 | | | 6 | |
| Interest expense on lease liability | 4 | | | 4 | | | 5 | |
| Short-term lease expense | 12 | | | 11 | | | 11 | |
Lease Terms and Discount Rates
The following outlines the remaining lease terms and discount rates used in the measurement of the Company’s ROU assets and lease liabilities at December 31, 2024 and 2023:
| | | | | | | | | | | | | | | | | | | | | | | |
| December 31, 2024 | | December 31, 2023 |
| Operating Leases | | Finance Leases | | Operating Leases | | Finance Leases |
| Weighted-average remaining lease term | 5.4 years | | 8.3 years | | 5.4 years | | 5.3 years |
| Weighted-average discount rate | 7.9 | % | | 10.2 | % | | 6.7 | % | | 9.0 | % |
Maturities of Lease Liabilities
The following summarizes the remaining minimum lease payments through maturity of the Company’s lease liabilities at December 31, 2024:
| | | | | | | | | | | |
| (in millions) | Operating Leases | | Finance Leases |
| Year Ended December 31, | | | |
| 2025 | $ | 21 | | | $ | 14 | |
| 2026 | 19 | | | 14 | |
| 2027 | 15 | | | 13 | |
| 2028 | 10 | | | 11 | |
| 2029 | 8 | | | 8 | |
| Thereafter | 15 | | | 29 | |
| Total lease payments | 88 | | | 89 | |
| Less: imputed interest | (17) | | | (31) | |
| Total lease liability | $ | 71 | | | $ | 58 | |
CVR ENERGY, INC. AND SUBSIDIARIES
NOTES TO CONSOLIDATED FINANCIAL STATEMENTS
(7) Other Current Liabilities
Other current liabilities consisted of the following:
| | | | | | | | | | | |
| December 31, |
| (in millions) | 2024 | | 2023 |
| Accrued Renewable Fuel Standard (“RFS”) obligation | $ | 323 | | | $ | 329 | |
| Personnel accruals | 54 | | | 51 | |
| Deferred revenue | 51 | | | 16 | |
| Accrued taxes other than income taxes | 45 | | | 47 | |
| Accrued interest | 34 | | | 26 | |
| Operating lease liabilities | 16 | | | 14 | |
| Share-based compensation | 8 | | | 13 | |
| | | |
| | | |
| | | |
| Accrued income taxes | — | | | 25 | |
| Other accrued expenses and liabilities | 17 | | | 25 | |
| Total other current liabilities | $ | 548 | | | $ | 546 | |
(8) Long-Term Debt and Finance Lease Obligations
Long-term debt and finance lease obligations consisted of the following:
| | | | | | | | | | | |
| December 31, |
| (in millions) | 2024 | | 2023 |
| CVR Energy: | | | |
| | | |
| 8.50% Senior Notes, due January 2029 | $ | 600 | | | $ | 600 | |
| 5.75% Senior Notes, due February 2028 | 400 | | | 400 | |
| Unamortized debt issuance costs | (4) | | | (5) | |
| Total CVR Energy debt | 996 | | | 995 | |
| Petroleum Segment: | | | |
| Term Loan | 322 | | | — | |
| Finance lease obligations, net of current portion | 29 | | | 37 | |
| Unamortized debt discount and debt issuance costs | (8) | | | — | |
| Total Petroleum Segment debt and finance lease obligations, net of current portion | 343 | | | 37 | |
| Nitrogen Fertilizer Segment: | | | |
| 6.125% Senior Secured Notes, due June 2028 | 550 | | | 550 | |
| Finance lease obligations, net of current portion | 20 | | | — | |
| Unamortized debt issuance costs | (2) | | | (3) | |
| Total Nitrogen Fertilizer Segment debt and finance lease obligations, net of current portion | 568 | | | 547 | |
| Total long-term debt and finance lease obligations, net of current portion | 1,907 | | | 1,579 | |
Current portion of long-term debt and finance lease obligations (1) | 12 | | | 606 | |
| Total long-term debt and finance lease obligations, including current portion | $ | 1,919 | | | $ | 2,185 | |
(1)On December 21, 2023, the Company delivered a notice of redemption to the holders of its 5.25% Senior Notes, due February 2025 (the “2025 Notes”), that all outstanding amounts of the 2025 Notes, plus any accrued and unpaid interest to the redemption date, would be redeemed on February 15, 2024. As such, the outstanding balance of the $600 million principal amount of the 2025 Notes was classified
CVR ENERGY, INC. AND SUBSIDIARIES
NOTES TO CONSOLIDATED FINANCIAL STATEMENTS
as short-term as of December 31, 2023. On February 15, 2024, the 2025 Notes were redeemed in full, at par, plus accrued and unpaid interest to the redemption date.
Credit Agreements
| | | | | | | | | | | | | | | | | | | | | | | | | | | | | |
| (in millions) | Total Available Borrowing Capacity | | Amount Borrowed as of December 31, 2024 | | Outstanding Letters of Credit | | Available Capacity as of December 31, 2024 | | Maturity Date |
| Petroleum Segment: | | | | | | | | | |
CVR Energy’s Amended and Restated ABL Credit Agreement (“CVR Energy ABL”) (1) | $ | 262 | | | $ | — | | | $ | 24 | | | $ | 238 | | | June 30, 2027 |
| Nitrogen Fertilizer Segment: | | | | | | | | | |
| CVR Partners’ Credit Agreement (“CVR Partners ABL”) | $ | 39 | | | $ | — | | | $ | — | | | $ | 39 | | | September 26, 2028 |
CVR Energy
2029 Notes - On December 21, 2023, CVR Energy completed the issuance of $600 million in aggregate principal amount of 8.50% Senior Notes, due 2029 (the “2029 Notes”). Interest on the 2029 Notes is payable semi-annually in arrears on February 15 and August 15 each year, commencing on February 15, 2024. The 2029 Notes mature on January 15, 2029, unless earlier redeemed or purchased. The 2029 Notes are fully and unconditionally guaranteed on a senior unsecured basis, jointly and severally, by all of the Company’s existing domestic subsidiaries (other than Wynnewood Insurance Corporation, CVR Aviation, LLC, CVR GP, LLC, CVR Partners, LP, UAN Services, LLC and each of their respective subsidiaries and CHC GP, LLC, RHC GP, LLC and FHC GP, LLC).
In relation to the issuance of the 2029 Notes, the Company received $598 million of net cash proceeds, net of underwriting fees and certain other third-party fees and expenses associated with the offering. The debt issuance costs of the 2029 Notes totaled approximately $4 million and will be amortized over the term of the 2029 Notes as interest expense using the effective-interest amortization method. These proceeds were reserved for the payment of the 2025 Notes, as defined below, on February 15, 2024 and are presented in Reserved funds for debt payment on our Consolidated Balance Sheets as of December 31, 2023.
On or after January 15, 2026, we may on any one or more occasions, redeem all or part of the 2029 Notes at the redemption price set forth below expressed as a percentage of the principal amount of the respective note, plus accrued and unpaid interest to the applicable redemption date.
| | | | | | | | |
| 12-month period beginning February 15, | | Percentage |
| 2026 | | 104.250% |
| 2027 | | 102.125% |
| 2028 | | 100.000% |
The indenture governing the 2029 Notes contains restrictive covenants limiting our ability and the ability of our restricted subsidiaries (as defined in the indenture) to: (i) incur additional indebtedness or issue certain shares of capital stock; (ii) grant or permit to exist liens on certain assets to secure debt; (iii) pay dividends or make other equity distributions; (iv) purchase or redeem capital stock; (v) make certain investments; (vi) sell assets; (vii) agree to certain restrictions on the ability of restricted subsidiaries to make distributions, loans or other asset transfers to the Company; (viii) consolidate, merge, sell or otherwise dispose of all or substantially all assets; or (ix) engage in transactions with affiliates. The indenture also contains customary events of default.
2025 Notes and 2028 Notes - On January 27, 2020, CVR Energy completed a private offering of $600 million aggregate principal amount of 5.25% Senior Unsecured Notes due 2025 (the “2025 Notes”) and $400 million aggregate principal amount of 5.75% Senior Unsecured Notes due 2028 (the “2028 Notes” and, collectively with the 2025 Notes, the “Notes”). Interest on the Notes is payable semi-annually in arrears on February 15 and August 15 each year, commencing on August 15, 2020. The 2025 Notes mature on February 15, 2025, unless earlier redeemed or repurchased by the issuers. The 2028 Notes mature on February 15, 2028, unless earlier redeemed or repurchased by the issuers. The Notes are jointly and severally guaranteed on a
CVR ENERGY, INC. AND SUBSIDIARIES
NOTES TO CONSOLIDATED FINANCIAL STATEMENTS
senior unsecured basis by the wholly owned subsidiaries of CVR Energy with the exception of CVR Partners and its subsidiaries and certain immaterial wholly owned subsidiaries of CVR Energy.
On February 15, 2024, CVR Energy redeemed all of the outstanding 2025 Notes, at par, and settled accrued interest of approximately $16 million through the date of redemption. As a result of this transaction, the Company recognized a $1 million loss on extinguishment of debt in the first quarter of 2024, which consists of the write-off of unamortized deferred financing costs.
We may on any one or more occasions, redeem all or part of the 2028 Notes at the redemption prices set forth below expressed as a percentage of the principal amount of the respective notes, plus accrued and unpaid interest to the applicable redemption date.
| | | | | | | | | | | | |
| | |
| | | | 12-month period beginning February 15, | | Percentage |
| | | | | | |
| | | | | | |
| | | | 2024 | | 101.917% |
| | | | 2025 | | 100.958% |
| | | | 2026 and thereafter | | 100.000% |
The indenture governing the 2028 Notes imposes covenants that will, among other things, limit our ability and the ability of our restricted subsidiaries to: (i) incur additional indebtedness or issue certain disqualified equity; (ii) create liens on certain assets to secure debt; (iii) pay dividends or make other equity distributions; (iv) purchase or redeem capital stock; (v) make certain investments; (vi) sell assets; (vii) agree to certain restrictions on the ability of restricted subsidiaries to make distributions, loans, or other asset transfers to us; (viii) consolidate, merge, sell, or otherwise dispose of all or substantially all of our assets; (ix) engage in transactions with affiliates; and (x) designate our restricted subsidiaries as unrestricted subsidiaries. In addition, the indenture contains customary events of default, the occurrence of which would result in or permit the trustee or the holders of at least 25% of the 2028 Notes to cause, amongst other available remedies, the acceleration of the respective notes.
Petroleum Segment
Term Loan - On December 19, 2024, certain of the Company’s subsidiaries (together, the “Term Loan Borrowers”) entered into a senior secured term loan facility in the amount of $325 million (the “Term Loan”), which was borrowed in full on the closing date, with net proceeds of $318 million after deducting the original issue discount, deferred financing costs, commitment and other fees. At the option of the Term Loan Borrowers, loans under the Term Loan bear interest at a variable rate based on SOFR plus 4.00% per annum, or an alternate base rate, plus 3.00%.
The Term Loan Borrowers are required to make scheduled quarterly principal amortization payments in an amount equal to 0.25% of the aggregate principal amount of the initial term loans, with a balance of the principal due on the scheduled maturity date of December 30, 2027. The Term Loan contains customary prepayment requirements, covenants and events of default.
The obligations under the Term Loan are guaranteed by the Term Loan Borrowers’ direct and indirect, existing and future, wholly owned domestic subsidiaries. The obligations under the Term Loan and the related guarantees are secured by a second priority lien on the collateral under the CVR Energy ABL, and a first priority lien over substantially all of the Term Loan Borrowers’ and each guarantor’s other assets, including all of the equity interests of any subsidiary held by the Term Loan Borrowers or any guarantor and certain real property owned by the Term Loan Borrowers and the guarantors in each case subject to certain customary exceptions.
CVR Energy ABL - Certain subsidiaries of the Company (the “Credit Parties”) are parties to that certain Amended and Restated ABL Credit Agreement, dated December 20, 2012, as heretofore amended (as amended, the “CVR Energy ABL”) with a group of lenders and Wells Fargo Bank, National Association, as administrative agent and collateral agent (the “Agent”). The CVR Energy ABL is a senior secured asset based revolving credit facility in an aggregate principal amount of up to $275 million with a $125 million incremental facility, which is subject to additional lender commitments and certain other conditions. The CVR Energy ABL provides for loans and letters of credit in an amount up to the aggregate availability under the facility, subject to meeting certain borrowing base conditions, with sub-limits of $30 million for swingline loans and $60 million (or $100 million if increased by the Agent) for letters of credit. The proceeds of the loans may be used for capital expenditures, working capital and general corporate purposes of the Credit Parties and their subsidiaries. The CVR Energy ABL is scheduled to mature on June 30, 2027.
CVR ENERGY, INC. AND SUBSIDIARIES
NOTES TO CONSOLIDATED FINANCIAL STATEMENTS
Loans under the CVR Energy ABL bear interest at an annual rate equal to, at the option of the borrowers, (i) (a) 1.50% plus the Term SOFR or (b) 0.50% plus a base rate, if the Credit Parties’ quarterly excess availability is greater than 50%, and (ii) (a) 1.75% plus the Term SOFR or (b) 0.75% plus a base rate, otherwise. All borrowings under the CVR Energy ABL are subject to the satisfaction of customary conditions, including absence of a default and accuracy of representations and warranties. The Credit Parties must also pay a commitment fee on the unutilized commitments and pay customary letter of credit fees.
The CVR Energy ABL contains customary covenants for a financing of this type and requires the Credit Parties in certain circumstances to comply with a minimum fixed charge coverage ratio test, and contains other customary restrictive covenants that limit the Credit Parties’ ability and the ability of their subsidiaries to, among other things, incur liens, engage in a consolidation, merger and purchase or sale of assets, pay dividends, incur indebtedness, make advances, investment and loans, enter into affiliate transactions, issue equity interests, or create subsidiaries and unrestricted subsidiaries.
On September 26, 2023, the Credit Parties entered into Amendment No. 4 to the Amended and Restated ABL Credit Agreement (the “CVR Energy ABL Amendment”), dated December 20, 2012, with Wells Fargo, as administrative agent and collateral agent, to make certain administrative updates thereto. The foregoing description of the CVR Energy ABL and CVR Energy ABL Amendment does not purport to be complete and is qualified in its entirety by its terms, which is furnished as an exhibit to this Report.
On September 25, 2024, certain subsidiaries of the Company entered into an Incremental Commitment Agreement, as permitted under the CVR Energy ABL, for an amount of $70 million, which increased the total aggregate principal amount available under the CVR Energy ABL from $275 million to $345 million.
Nitrogen Fertilizer Segment
2028 UAN Notes - On June 23, 2021, CVR Partners and CVR Nitrogen Finance Corporation (“Finance Co.” and collectively, the “Issuers”), completed a private offering of $550 million aggregate principal amount of 6.125% Senior Secured Notes due 2028 (the “2028 UAN Notes”). Interest on the 2028 UAN Notes is payable semi-annually in arrears on June 15 and December 15 each year, commencing on December 15, 2021. The 2028 UAN Notes mature on June 15, 2028, unless earlier redeemed or repurchased by the Issuers. The 2028 UAN Notes are jointly and severally guaranteed on a senior secured basis by all the existing domestic subsidiaries of CVR Partners, excluding Finance Co.
The Issuers may, at their option, at any time and from time to time prior to June 15, 2024, on any one or more occasions, redeem all or part of the 2028 UAN Notes, at a price equal to 100% of the principal amount plus a “make whole” premium, plus accrued and unpaid interest. On or after June 15, 2024, the Issuers may, on any one or more occasions, redeem all or part of the 2028 UAN Notes at the redemption prices set forth below, expressed as a percentage of the principal amount of the respective notes, plus accrued and unpaid interest to the applicable redemption date.
| | | | | | | | |
| 12-month period beginning June 15, | | Percentage |
| 2024 | | 103.063% |
| 2025 | | 101.531% |
| 2026 and thereafter | | 100.000% |
The 2028 UAN Notes contain customary covenants for a financing of this type that, among other things, restricts CVR Partners’ ability and the ability of certain of its subsidiaries to: (i) sell assets; (ii) pay distributions on, redeem or repurchase CVR Partners’ units or redeem or repurchase its subordinated debt; (iii) make investments; (iv) incur or guarantee additional indebtedness or issue disqualified stock; (v) create or incur certain liens; (vi) enter into agreements that restrict distributions or other payments from CVR Partners’ restricted subsidiaries to CVR Partners; (vii) consolidate, merge or transfer all or substantially all of CVR Partners’ assets; (viii) engage in transactions with affiliates; and (ix) create unrestricted subsidiaries. The 2028 UAN Notes contains a permitted investment activity carveout that allows for the transfer of certain carbon capture assets to a joint venture for the purpose of monetizing potential tax credits. In addition, the indenture contains customary events of default, the occurrence of which would result in or permit the trustee or the holders of at least 25% of the 2028 UAN Notes to cause the acceleration of the 2028 UAN Notes, in addition to the pursuit of other available remedies.
CVR Partners ABL - On September 26, 2023, CVR Partners and certain of its subsidiaries entered into Amendment No. 1 to the Credit Agreement (the “CVR Partners ABL Amendment”) with Wells Fargo Bank, National Association, a national banking association (“Wells Fargo”), as administrative agent, collateral agent and a lender. The CVR Partners ABL
CVR ENERGY, INC. AND SUBSIDIARIES
NOTES TO CONSOLIDATED FINANCIAL STATEMENTS
Amendment amended that certain Credit Agreement, dated as of September 30, 2021 (as amended, the “CVR Partners ABL”), by and among the credit parties thereto and Wells Fargo, as administrative agent, collateral agent and a lender, to, among other things, (i) increase the aggregate principal amount available under the credit facility by an additional $15 million to a total of $50 million in the aggregate, with an incremental facility of an additional $15 million in the aggregate subject to additional lender commitments and certain other conditions, and (ii) extend the maturity date by an additional four years to September 26, 2028. The CVR Partners ABL provides for loans and letters of credit, subject to meeting certain borrowing base conditions, with sub-limits of $4 million for swingline loans and $10 million for letters of credit. The proceeds of the loans may be used for general corporate purposes of CVR Partners and its subsidiaries. The foregoing description of the CVR Partners ABL Amendment does not purport to be complete and is qualified in its entirety by its terms, which is furnished as an exhibit to this Report.
Loans under the CVR Partners ABL bear interest at an annual rate equal to, at the option of the borrowers, (i) (a) 1.615% plus the daily simple Secured Overnight Financing Rate (“SOFR”) or (b) 0.615% plus a base rate, if our quarterly excess availability is greater than or equal to 75%, (ii) (a) 1.865% plus SOFR or (b) 0.865% plus a base rate, if our quarterly excess availability is greater than or equal to 50% but less than 75%, or (iii) (a) 2.115% plus SOFR or (b) 1.115% plus a base rate, otherwise. The borrowers must also pay a commitment fee on the unutilized commitments and also pay customary letter of credit fees.
The CVR Partners ABL contains customary covenants for a financing of this type and requires CVR Partners in certain circumstances to comply with a minimum fixed charge coverage ratio test and contains other restrictive covenants that limit the ability of CVR Partners and its subsidiaries ability to, among other things, incur liens, engage in a consolidation, merger, purchase or sale of assets, pay dividends, incur indebtedness, make advances, investments and loans, enter into affiliate transactions, issue certain equity interests, create subsidiaries and unrestricted subsidiaries, and create certain restrictions on the ability to make distributions, loans, and asset transfers among CVR Partners or its subsidiaries.
Covenant Compliance
The Company and its subsidiaries, as applicable, were in compliance with all covenants of their debt instruments as of December 31, 2024.
CVR ENERGY, INC. AND SUBSIDIARIES
NOTES TO CONSOLIDATED FINANCIAL STATEMENTS
(9) Revenue
The following tables provides a disaggregation of revenues from external customers for our principal products by reportable segment.
| | | | | | | | | | | | | | | | | |
| Year Ended December 31, |
| (in millions) | 2024 | | 2023 | | 2022 |
| Petroleum Segment: | | | | | |
| Gasoline | $ | 3,596 | | | $ | 4,288 | | | $ | 4,830 | |
Distillates (1) | 2,934 | | | 3,746 | | | 4,788 | |
| Other revenue | 379 | | | 233 | | | 284 | |
| | | | | |
| | | | | |
| | | | | |
| | | | | |
| Total Petroleum Segment revenue | 6,909 | | | 8,267 | | | 9,902 | |
| Renewables Segment: | | | | | |
| | | | | |
| Renewable diesel | 103 | | | 194 | | | 111 | |
| Renewable fuel credits | 74 | | | 105 | | | 47 | |
| Total Renewables Segment revenue | 177 | | | 299 | | | 158 | |
| Nitrogen Fertilizer Segment: | | | | | |
| Ammonia | 130 | | | 161 | | | 200 | |
| UAN | 312 | | | 431 | | | 557 | |
| Urea products | 30 | | | 29 | | | 33 | |
Other revenue (2) | 52 | | | 60 | | | 46 | |
| | | | | |
| | | | | |
| Total Nitrogen Fertilizer Segment revenue | 524 | | | 681 | | | 836 | |
| Total revenue | $ | 7,610 | | | $ | 9,247 | | | $ | 10,896 | |
(1)Distillates consist primarily of diesel fuel, kerosene, and jet fuel.
(2)Includes sales made in connection with the 45Q Transaction and the noncash consideration received, which is recognized as the performance obligation associated with the CO Contract is satisfied over its term through April 2030. Revenue from the CO Contract is recognized over time based on carbon oxide volumes measured at delivery.
Remaining Performance Obligations
We have spot and term contracts with customers and the transaction prices are either fixed or based on market indices (variable consideration). We do not disclose remaining performance obligations for contracts that have terms of one year or less and for contracts where the variable consideration was entirely allocated to an unsatisfied performance obligation. As of December 31, 2024, these contracts have a remaining duration of one year.
As of December 31, 2024, the Nitrogen Fertilizer Segment had approximately $8 million of remaining performance obligations for contracts with an original expected duration of more than one year. The Nitrogen Fertilizer Segment expects to recognize $4 million of these performance obligations as revenue by the end of 2025, an additional $3 million in 2026, and the remaining balance thereafter.
Contract Balances
A summary of the Nitrogen Fertilizer Segment’s deferred revenue activity during the year ended December 31, 2024 is presented below (in millions):
| | | | | | | | | | | | | | | | | | | | |
| Contract Balance Type | | Balance Sheet Location | | December 31, 2024 | | December 31, 2023 |
| Deferred revenue | | Other current liabilities | | $ | 51 | | | $ | 16 | |
| Long-term deferred revenue | | Other long-term liabilities | | 27 | | | 33 | |
During the years ended December 31, 2024 and 2023, the Company recognized revenue of $16 million and $46 million, respectively, that was included in the deferred revenue balances as of December 31, 2023 and December 31, 2022, respectively.
CVR ENERGY, INC. AND SUBSIDIARIES
NOTES TO CONSOLIDATED FINANCIAL STATEMENTS
Major Customers
Petroleum Segment - The Petroleum Segment had one customer that accounted for 10% or more of the petroleum net sales at approximately 13% for the year ended December 31, 2024 and had two customers that accounted for 10% or more of the petroleum net sales at approximately 15% and 12% for the year ended December 31, 2023 and 15% and 10% for the year ended December 31, 2022.
Renewables Segment - The Renewables Segment has two customers that each account for approximately 50% of the renewable net sales for the years ended December 31, 2024, 2023 and 2022.
Nitrogen Fertilizer Segment - The Nitrogen Fertilizer Segment had one customer that accounted for 10% or more of the nitrogen fertilizer net sales at approximately 14% for the year ended December 31, 2024 and had two customers that accounted for 10% or more of the nitrogen fertilizer net sales at approximately 13% and 12% for the year ended December 31, 2023 and 16% and 14% for the year ended December 31, 2022.
(10) Derivative Financial Instruments
Derivative Financial Instruments
Our segments are subject to fluctuations of commodity prices caused by supply and economic conditions, weather, interest rates, and other factors. To manage the impact of price fluctuations of crude oil and other commodities in our results of operations and certain inventories, and to fix margins on future sales and purchases, the Petroleum Segment uses various commodity derivative instruments, such as futures and swaps. The Company has not designated any of its derivative contracts as hedge accounting and records changes in fair value and cash settlements in the Consolidated Statements of Operations.
The following outlines the net notional buy (sell) position of our commodity derivative instruments held as of December 31, 2024 and 2023:
| | | | | | | | | | | | | | | | | |
| | | December 31, |
| (in thousands of barrels) | Commodity | | 2024 | | 2023 |
| Forwards | Crude | | (11) | | | 247 | |
| Swaps | NYMEX Diesel Cracks (1) | | (63) | | | (6,780) | |
| Swaps | NYMEX RBOB Cracks | | — | | | (1,275) | |
| Swaps | NYMEX 2-1-1 Cracks | | — | | | (3,030) | |
| | | | | |
| Futures | ULSD | | (80) | | | — | |
| Futures | Soybean | | 79 | | | — | |
(1)As of December 31, 2024, the Company held offsetting NYMEX Diesel Crack commodity buy and sell positions of approximately 2.5 million barrels.
The following outlines the balances of our commodity derivative instruments after the effects of contract netting and allocation of collateral and their classifications on our Consolidated Balance Sheets. Refer to Note 11 (“Fair Value Measurements”) for the gross amounts of the commodity derivative instruments (before the effects of contract netting and allocation of collateral):
| | | | | | | | | | | | | | | | | | | | | | | |
| December 31, |
| 2024 | | 2023 |
| (in millions) | Assets | | Liabilities | | Assets | | Liabilities |
| Other current assets | $ | 4 | | | $ | — | | | $ | 24 | | | $ | — | |
| Other long-term assets | — | | | — | | | 1 | | | — | |
| | | | | | | |
| | | | | | | |
CVR ENERGY, INC. AND SUBSIDIARIES
NOTES TO CONSOLIDATED FINANCIAL STATEMENTS
The following table represents CVR Energy’s incurred realized and unrealized net gains (losses) from derivative activities, recorded in Cost of materials and other on the Consolidated Statements of Operations:
| | | | | | | | | | | | | | | | | |
| Year Ended December 31, |
| (in millions) | 2024 | | 2023 | | 2022 |
| | | | | |
| | | | | |
| | | | | |
| Commodity derivative instruments | $ | 13 | | | $ | 5 | | | $ | (55) | |
CVR Energy has certain derivative instruments that contain credit risk-related contingent provisions associated with our credit ratings. If our credit rating were to be downgraded, it would allow the counterparty to require us to post collateral or to request immediate, full settlement of derivative instruments in liability positions. There were no derivative liabilities with credit risk-related contingent provisions as of December 31, 2024 and 2023, and no collateral has been posted.
(11) Fair Value Measurements
In accordance with FASB ASC Topic 820, Fair Value Measurements and Disclosures (“Topic 820”), certain assets and liabilities of the Company are measured at fair value on a recurring and nonrecurring basis at December 31, 2024 and 2023. Topic 820 utilizes a fair value hierarchy considering the inputs and valuation techniques used to measure fair value into the following three broad levels:
•Level 1 — Quoted prices in active markets for identical assets or liabilities.
•Level 2 — Observable inputs other than quoted prices included within Level 1 for the asset or liability either directly or indirectly, which include quoted prices for similar assets or liabilities in active markets and quoted prices for identical or similar assets and liabilities in markets that are not active.
•Level 3 — Unobservable inputs that are significant to the fair value of the asset or liability, which include valuation techniques that involve significant unobservable inputs and Company’s own assumptions of market inputs/valuation.
Assets and liabilities measured at fair value on a recurring basis
The following tables set forth information about the assets and liabilities measured at fair value on a recurring basis, by input level, as of December 31, 2024 and 2023. Such amounts are presented on a gross basis, before the effects of netting and allocation of collateral. The Company elected to offset the fair value amounts recognized for derivative assets and liabilities
CVR ENERGY, INC. AND SUBSIDIARIES
NOTES TO CONSOLIDATED FINANCIAL STATEMENTS
executed with the same counterparty under a master netting arrangement, including fair value amounts recognized for the right to reclaim or the obligation to return cash collateral.
| | | | | | | | | | | | | | | | | | | | | | | | | | | | | | | | | | | | | | | | | |
| December 31, 2024 |
| Fair Value Hierarchy | | Total gross fair value | | Contract netting | | Collateral netting (1) | | Net value |
| (in millions) | Level 1 | | Level 2 | | Level 3 | | | | |
| Assets | | | | | | | | | | | | | |
| Commodity derivative instruments | $ | — | | | $ | 17 | | | $ | — | | | $ | 17 | | | $ | (13) | | | $ | — | | | $ | 4 | |
| | | | | | | | | | | | | |
| Liabilities | | | | | | | | | | | | | |
| Commodity derivative instruments | — | | | 13 | | | — | | | 13 | | | (13) | | | — | | | — | |
| RFS | — | | | 323 | | | — | | | 323 | | | — | | | — | | | 323 | |
| | | | | | | | | | | | | | | | | | | | | | | | | | | | | | | | | | | | | | | | | |
| December 31, 2023 |
| Fair Value Hierarchy | | Total gross fair value | | Contract netting | | Collateral netting (1) | | Net value |
| Level 1 | | Level 2 | | Level 3 | | | | |
| Assets | | | | | | | | | | | | | |
| Commodity derivative instruments | $ | — | | | $ | 31 | | | $ | — | | | $ | 31 | | | $ | (6) | | | $ | — | | | $ | 25 | |
| | | | | | | | | | | | | |
| Liabilities | | | | | | | | | | | | | |
| Commodity derivative instruments | — | | | 6 | | | — | | | 6 | | | (6) | | | — | | | — | |
| RFS | — | | | 329 | | | — | | | 329 | | | — | | | — | | | 329 | |
(1)At December 31, 2024 and 2023, the Company had $3 million and $13 million of collateral under master netting arrangements not offset against the derivatives within Prepaid expenses and other current assets on the Consolidated Balance Sheets, respectively, primarily related to initial margin requirements.
The Company’s commodity derivative contracts consist of exchange traded futures, commodity price swaps, and sale and purchase forwards that are measured at fair value using a market approach based on available broker quoted market prices of identical or similar instruments. Similarly, RFS obligations are measured at fair value using a market approach based on available broker quoted market RIN prices for each specific or closest vintage year.
The Company had no transfers of assets or liabilities between any of the above levels during the years ended December 31, 2024 and 2023.
Assets and liabilities measured at fair value on a nonrecurring basis
CVR Partners performed a nonrecurring fair value measurement of the equity interest received as part of the 45Q Transaction in the first quarter of 2023. Such valuation used a combination of the market approach and the discounted cash flow methodology with key inputs including the discount rate, contractual and expected future cash flows, and market multiples. CVR Partners determined the estimated fair value of the consideration received to be $46 million, which is a nonrecurring Level 3 measurement, as defined by Topic 820, based on the use of CVR Partners’ own assumptions described above. There are no other assets or liabilities that were measured at fair value on a nonrecurring basis as of December 31, 2024 and 2023.
Assets and liabilities not required to be measured at fair value
CVR Energy holds cash equivalents which consist primarily of bank time deposits with maturities of 90 days or less. Cash and cash equivalents and reserved funds had carrying and fair values of $987 million and $1.2 billion at December 31, 2024 and 2023, respectively, and are classified as Level 1 in the fair value hierarchy.
Long-term debt of $1.9 billion and $2.1 billion at December 31, 2024 and 2023, respectively, had estimated fair values of $1.5 billion and $2.1 billion, respectively, and are classified as Level 2 in the fair value hierarchy.
CVR ENERGY, INC. AND SUBSIDIARIES
NOTES TO CONSOLIDATED FINANCIAL STATEMENTS
Other short-term financial assets and liabilities, which consist of reserved funds, restricted cash, accounts receivable, accounts payable, and operating and finance lease obligations, are carried at cost on the Consolidated Balance Sheets and approximate their estimated fair values.
(12) Share-Based Compensation
Overview
CVR Energy has a Long-Term Incentive Plan (the “CVR Energy LTIP”) that permits the granting of restricted stock, restricted stock units, options, stock appreciation rights, dividend equivalent rights, performance awards, and share awards to the employees, officers, and directors of the Company and its subsidiaries. The Company had 5.6 million shares available for future grants under the CVR Energy LTIP at December 31, 2024.
CVR Partners had a Long-Term Incentive Plan (“CVR Partners LTIP”) which permitted the granting of options, unit appreciation rights, distribution equivalent rights; restricted and phantom units, and other unit-based unit-based awards to the employees, officers, consultants and directors of CVR Partners and its subsidiaries, which expired by its terms in 2021. However, CVR Partners may grant long-term cash awards in connection with (and not under) the CVR Partners LTIP to directors, officers, employees, employee candidates, consultants, or advisors of CVR Partners, its subsidiaries, or its parent.
Incentive and Phantom Unit Awards
The Company has issued long-term incentive unit awards under the CVR Energy LTIP, which represent the right to receive, upon vesting, at the Compensation Committee’s election (i) one share of CVR Energy common stock together with the per share value of all dividends declared and paid on CVR Energy common stock, from the grant date through the vesting date, or (ii) a cash payment equal to the average fair market value of one share of CVR Energy common stock calculated in accordance with the award agreement, plus the per share value of all dividends declared and paid on CVR Energy common stock from the grant date through the vesting date, both subject to the terms of the applicable award agreement (“CVI LTIP Awards”).
The Company and CVR Partners have also issued long-term, cash incentive or phantom unit awards in connection with (but not under) the CVR Energy LTIP and CVR Partners LTIP, as applicable (collectively, the “Cash Share-Based Awards” and together with the CVI LTIP Awards, “Share-Based Awards”). These Cash Share-Based Awards represent the right to receive, upon vesting, a cash payment equal to (i) the average fair market value of one share of CVR Energy common stock or CVR Partners common units, as applicable, calculated in accordance with the award agreement, plus (ii) the per share value of all dividends or distributions declared and paid on CVR Energy common stock or CVR Partners common units, as applicable, from the grant date through the vesting date, subject to the terms of the applicable award agreement.
The Share-Based Awards are generally graded-vesting awards, which vest over three years with one-third of the award vesting each year provided the grantee remains employed by the Company or its subsidiaries on the applicable vesting date. Compensation expense is recognized ratably, based on service provided to the Company and its subsidiaries, with the amount recognized fluctuating as a result of the Share-Based Awards being remeasured to fair value at the end of each reporting period due to their liability-award classification.
A summary of activity for the Company’s Share-Based Awards for the year ended December 31, 2024 is presented below:
| | | | | | | | | | | | | | | | | | |
| Shares or Units (1) | | Weighted-Average Grant-Date Fair Value (per share or unit) | | Aggregate Intrinsic Value (in millions) | |
| | | | | | |
| | | | | | |
| | | | | | |
| | | | | | |
| | | | | | |
| | | | | | |
| | | | | | |
| | | | | | |
| Non-vested at December 31, 2023 | 1,438,905 | | | $ | 30.67 | | | $ | 47 | | |
Granted (2) | 1,288,232 | | | 22.61 | | | | |
| Vested | (685,779) | | | 28.05 | | | | |
| Forfeited | (94,088) | | | 30.91 | | | | |
| Non-vested at December 31, 2024 | 1,947,270 | | | $ | 26.25 | | | $ | 43 | | |
(1)Includes all units outstanding under Share-Based Awards.
CVR ENERGY, INC. AND SUBSIDIARIES
NOTES TO CONSOLIDATED FINANCIAL STATEMENTS
(2)Includes 1,218,813 units granted under the CVR Energy LTIP with a weighted-average grant-date fair value of $19.88. The remainder of the outstanding and unvested units, as well as the vested and forfeited awards, were issued as Cash Share-Based Awards in connection with (and not under) the CVR Energy LTIP and CVR Partners LTIP.
Performance Unit Awards
A performance award agreement effective November 1, 2017, as amended (the “CEO Performance Award”), represents our Chief Executive Officer’s right to receive upon vesting, a cash payment equal to $10 million if the average closing price of CVR Energy’s common stock over the 30-day trading period from January 6, 2025 through February 20, 2025 is equal to or greater than $60 per share (subject to any equitable adjustments required to account for splits, dividends, combinations, acquisitions, dispositions, recapitalizations, and the like). The Performance Cycle (as such term is defined in the CEO Performance Award) ended on December 31, 2024, and the measurement period thereunder will expire on February 20, 2025, after which the CEO Performance Award will no longer be in effect. At this time, it is not probable that the condition under the CEO Performance Award will be achieved or that any amounts will be paid thereunder. Under the CEO Performance Award, as of December 31, 2024 and 2023, the Company had no outstanding liability.
Compensation Expense
A summary of total share-based compensation expense and unrecognized compensation expense related to the Share-Based Awards and the CEO Performance Award during the years ended December 31, 2024, 2023, and 2022 is presented below:
| | | | | | | | | | | | | | | | | | | | | | | | | | | | | |
| Expenses | | Unrecognized Expense |
| For the year ended December 31, | | At December 31, 2024 |
| (in millions) | 2024 | | 2023 | | 2022 | | Amount | | Weighted-Average Remaining Years |
| Share-Based Awards: | | | | | | | | | |
Incentive Units (1) | $ | 10 | | | $ | 28 | | | $ | 45 | | | $ | 30 | | | 1.8 |
CVR Partners - Phantom Units (2) | 5 | | | 6 | | | 26 | | | 6 | | | 1.8 |
| | | | | | | | | |
| Performance Unit Awards: | | | | | | | | | |
CEO Performance Award (3) | — | | | — | | | — | | | 10 | | | 0.1 |
| | | | | | | | | |
| | | | | | | | | |
| Total share-based compensation expense | $ | 15 | | | $ | 34 | | | $ | 71 | | | $ | 46 | | | |
(1)Includes expense associated with incentive units granted as Cash Share-Based Awards and CVI LTIP Awards by CVR Energy.
(2)Comprised of expense associated with the phantom units granted as Cash Share-Based Awards by CVR Partners.
(3)All expenses, recognized and unrecognized, related to the CEO Performance Award are contingent upon whether the performance parameters are probable of being met. If the performance parameters are not met, no expense will be recognized.
The total tax benefit recognized during the years ended December 31, 2024, 2023, and 2022 related to compensation expense was $4 million, $9 million, and $19 million, respectively. As of December 31, 2024 and 2023, the Company had a liability of $10 million and $16 million, respectively, for cash settled non-vested Share-Based Awards and associated dividend and distribution equivalent rights. For the years ended December 31, 2024, 2023, and 2022, the Company paid cash of $21 million, $54 million, and $58 million, respectively, to settle liability-classified awards upon vesting.
Other Benefit Plans
The Company sponsors and administers two defined-contribution 401(k) plans, the CVR Energy 401(k) Plan and the CVR Energy 401(k) Plan for Represented Employees (collectively, the “Plans”), in which the Company’s employees may participate. Participants in the Plans may elect to contribute a designated percentage of their eligible compensation in accordance with the Plans, subject to statutory limits. The Company provides a matching contribution of 100% of the first 6% of eligible compensation contributed by participants. Participants in the Plans are immediately vested in their individual contributions. The Plans provide for a three-year vesting schedule for the Company’s matching contributions and contain a provision to count service with predecessor organizations. The Company had contributions under the Plans of $13 million, $12 million, and $11 million for the years ended December 31, 2024, 2023, and 2022, respectively.
CVR ENERGY, INC. AND SUBSIDIARIES
NOTES TO CONSOLIDATED FINANCIAL STATEMENTS
(13) Income Taxes
As of December 31, 2024 and 2023, the Company’s Consolidated Balance Sheets reflected a receivable of $11 million and a payable of $25 million, respectively, from the IRS and certain state jurisdictions.
Income Tax (Benefit) Expense
Income tax (benefit) expense is comprised of the following:
| | | | | | | | | | | | | | | | | |
| Year Ended December 31, |
| (in millions) | 2024 | | 2023 | | 2022 |
| Current: | | | | | |
| Federal | $ | 23 | | | $ | 118 | | | $ | 156 | |
| State | — | | | 9 | | | 14 | |
| Total current | 23 | | | 127 | | | 170 | |
| Deferred: | | | | | |
| Federal | (33) | | | 73 | | | (26) | |
| State | (16) | | | 7 | | | 13 | |
| Total deferred | (49) | | | 80 | | | (13) | |
| Total income tax (benefit) expense | $ | (26) | | | $ | 207 | | | $ | 157 | |
The following is a reconciliation of total income tax (benefit) expense to income tax (benefit) expense computed by applying the statutory federal income tax rate to pretax income:
| | | | | | | | | | | | | | | | | |
| Year Ended December 31, |
| (in millions) | 2024 | | 2023 | | 2022 |
| Tax computed at federal statutory rate | $ | 4 | | | $ | 228 | | | $ | 168 | |
| State income taxes, net of federal tax benefit | (4) | | | 28 | | | 28 | |
| Changes in enacted state tax rates, net of federal tax expense | — | | | (5) | | | — | |
| State tax incentives, net of federal tax expense | (9) | | | (11) | | | (6) | |
| Executive compensation | 1 | | | 4 | | | 2 | |
| Noncontrolling interest | (8) | | | (23) | | | (38) | |
| Renewable fuel incentives | (10) | | | (15) | | | (7) | |
| Other, net | — | | | 1 | | | 10 | |
| Total income tax (benefit) expense | $ | (26) | | | $ | 207 | | | $ | 157 | |
CVR ENERGY, INC. AND SUBSIDIARIES
NOTES TO CONSOLIDATED FINANCIAL STATEMENTS
Deferred Tax Assets and Liabilities
The income tax effect of temporary differences that give rise to the Deferred income tax assets and Deferred income tax liabilities at December 31, 2024 and 2023 are as follows:
| | | | | | | | | | | |
| December 31, |
| (in millions) | 2024 | | 2023 |
| Deferred income tax assets: | | | |
| Personnel accruals | $ | 10 | | | $ | 11 | |
| Inventories | 1 | | | 3 | |
| Right of use lease liability | 14 | | | 9 | |
| Contingent liabilities | 56 | | | 61 | |
| State tax credit carryforward, net | 17 | | | 12 | |
| | | |
| Interest expense | 2 | | | — | |
| | | |
| Total gross deferred income tax assets | 100 | | | 96 | |
| | | |
| | | |
| | | |
| Unrealized gains/losses | (1) | | | (6) | |
| Prepaid expenses | (1) | | | (6) | |
| Right of use lease asset | (14) | | | (10) | |
| Investment in CVR Partners | (55) | | | (60) | |
| | | |
| Investment in Joint Ventures | (1) | | | (15) | |
| Property, plant and equipment | (274) | | | (295) | |
| Turnaround costs | (31) | | | (30) | |
| Other | — | | | (1) | |
| Total gross deferred income tax liabilities | (377) | | | (423) | |
| Net deferred income tax liabilities | $ | (277) | | | $ | (327) | |
Although realization is not assured, management believes that it is more likely than not that all of the deferred income tax assets will be realized, and therefore, no valuation allowance was recognized as of December 31, 2024 and 2023.
As of December 31, 2024, CVR Energy has state tax credits of approximately $22 million, which are available to reduce future state income taxes. These credits, if not used, will begin expiring in 2040.
Uncertain Tax Positions
A reconciliation of unrecognized tax benefits is as follows:
| | | | | | | | | | | | | | | | | |
| Year Ended December 31, |
| (in millions) | 2024 | | 2023 | | 2022 |
| Balance, beginning of year | $ | 1 | | | $ | 11 | | | $ | 17 | |
| | | | | |
| | | | | |
| Reductions related to expirations from statute of limitations | — | | | (10) | | | (6) | |
| Balance, end of year | $ | 1 | | | $ | 1 | | | $ | 11 | |
Included in the balance of unrecognized tax benefits as of December 31, 2024, 2023, and 2022 are $1 million, $1 million, and $9 million, respectively, of tax benefits that, if recognized, would affect the effective tax rate. Additionally, the Company reasonably believes that no unrecognized tax positions related to state income tax credits will be recognized by the end of 2025 as a result of the expiration of statute of limitations. No unrecognized tax benefits were netted with Deferred income tax asset carryforwards as of December 31, 2024 and 2023. The remaining unrecognized tax benefits are included in Other long-term liabilities in the Consolidated Balance Sheets.
CVR ENERGY, INC. AND SUBSIDIARIES
NOTES TO CONSOLIDATED FINANCIAL STATEMENTS
CVR Energy recognized no interest benefit and no liability for interest as of December 31, 2024, $3 million interest benefit and no liability for interest as of December 31, 2023, and $1 million interest expense and $3 million liability for interest as of December 31, 2022. No penalties were recognized during 2024, 2023, or 2022.
At December 31, 2024, the Company’s tax filings are open to examination in the United States for the tax years ended December 31, 2021 through December 31, 2023 and in various individual states for the tax years ended December 31, 2020 through December 31, 2023.
(14) Commitments and Contingencies
Unconditional Purchase Obligations
The minimum required payments for unconditional purchase obligations, as defined in ASC 440, Commitments, primarily related to transportation agreements are as follows:
| | | | | |
| (in millions) | Unconditional Purchase Obligations |
| Year Ended December 31, | |
| 2025 | $ | 73 | |
| 2026 | 75 | |
| 2027 | 96 | |
| 2028 | 96 | |
| 2029 | 94 | |
| Thereafter | 577 | |
| $ | 1,011 | |
Expenses associated with these obligations are included in Direct operating expenses (exclusive of depreciation and amortization), and, for the years ended December 31, 2024, 2023, and 2022, totaled $75 million, $72 million, and $72 million, respectively.
Crude Oil Supply Agreement
The Petroleum Segment has a crude oil supply agreement with Gunvor USA LLC (“Gunvor”), which commenced on January 1, 2024 (as amended, the “Gunvor Crude Oil Supply Agreement”), pursuant to which Gunvor supplies the Petroleum Segment with certain crude oil and intermediation logistics helping to reduce the amount of inventory held at certain locations and mitigate crude oil pricing risk. The Gunvor Crude Oil Supply Agreement replaced a similar agreement with a different supplier that expired on December 31, 2023. Volumes contracted under these agreements, as a percentage of the total crude oil purchases (in barrels), were approximately 21%, 26%, and 34% for the years ended December 31, 2024, 2023, and 2022, respectively. The Gunvor Crude Oil Supply Agreement, which currently extends through January 31, 2026, is subject to automatic one-year renewals following the expiration of the initial term in the absence of either party providing 180 days’ notice of termination.
45Q Transaction
Under the agreements entered into in connection with the 45Q Transaction, the Company’s indirect subsidiary CRNF is obligated to meet certain minimum quantities of carbon oxide supply each year during the term of the agreement and is subject to fees of up to $15 million per year (reduced pro rata for partial years) to the unaffiliated third-party investors, subject to an overall $45 million cap, if these minimum quantities are not delivered. CVR Partners issued a guarantee to the unaffiliated third-party investors and certain of their affiliates involved in the 45Q Transaction of the payment and performance obligations of CRNF and CVRP JV, which include the aforementioned fees. This guarantee has no impacts on the accounting records of CVR Partners unless the parties fail to comply with the terms of the 45Q Transaction contracts.
CVR ENERGY, INC. AND SUBSIDIARIES
NOTES TO CONSOLIDATED FINANCIAL STATEMENTS
Contingencies
Call Option Coverage Cases - The Company and certain of its affiliates (the “Call Defendants”) are engaged in two lawsuits relating to settlement of the consolidated lawsuits (collectively, the “Call Option Lawsuits”) filed by purported former unitholders of CVR Refining on behalf of themselves and an alleged class of similarly situated unitholders against the Company and certain of its affiliates (the “Call Defendants”) relating to the Company’s exercise of the call option under the CVR Refining Amended and Restated Agreement of Limited Partnership assigned to it by CVR Refining’s general partner including the Stipulation, Compromise and Release (the “Settlement”), which Settlement was entered into in August 2022 and had no further impact on the Company’s financial position or results of operations beyond the amount recognized within Other (expense) income, net in the Consolidated Statements of Operations for the year ended December 31, 2022. In the Texas declaratory judgment action commenced by the Company’s primary and excess insurers (the “Insurers”) seeking determination that the Insurers owe no indemnity coverage under policies with coverage limits of $50 million, the Call Defendants have appealed the entry of summary judgment by the lower court to the Texas First Court of Appeals, which appeal remains pending. In the Delaware action filed by the Call Defendants against the Insurers seeking recovery of all amounts paid in connection with Settlement, mediation in 2024 was unsuccessful and motion practice remains in process. While both cases remain pending, the Company does not expect the outcome of these lawsuits to have a material adverse impact on the Company’s financial position, results of operations, or cash flows.
Renewable Fuel Standard - Coffeyville Resources Refining & Marketing, LLC (“CRRM”) and Wynnewood Refining Company, LLC (“WRC”, and together with CRRM, the “obligated-party subsidiaries”) are subject to the RFS implemented by the U.S. Environmental Protection Agency (the “EPA”), which requires obligated parties to blend a certain amount of renewable fuels, called a Renewable Volume Obligation (“RVO”), into their transportation fuels or purchase renewable fuel credits, known as RINs, in lieu of blending. The Petroleum Segment’s obligated-party subsidiaries are not able to blend the majority of their transportation fuels with renewable fuels and, unless their RFS obligations are waived or exempted, must either purchase RINs from third parties including its affiliate or obtain waiver credits for cellulosic biofuels in order to comply with the RFS.
For the years ended December 31, 2024, 2023, and 2022, the Company’s obligated-party subsidiaries recognized, net of RINs sales, an expense of approximately $46 million, a benefit of $114 million, and an expense of $435 million, respectively, for their compliance with the RFS (based on the 2020 through 2024 renewable volume obligation (“RVO”), for the respective periods, excluding the impacts of any exemptions or waivers to which the Company’s obligated-party subsidiaries may be entitled). The costs to comply with the RFS obligation through purchasing of RINs not otherwise reduced by blending of ethanol, biodiesel, or renewable diesel are included within Cost of materials and other in the Consolidated Statements of Operations. At each reporting period, to the extent RINs purchased and generated through blending are less than the RFS obligation (excluding the impact of exemptions or waivers to which the Company may be entitled), the remaining position is valued using RIN market prices at period end for each specific or closest vintage year. As of December 31, 2024 and 2023, the Company’s obligated-party subsidiaries’ RFS positions were approximately $323 million and $329 million, respectively, and are recorded in Other current liabilities in the Consolidated Balance Sheets.
RFS Disputes - CRRM and WRC have been parties to numerous lawsuits relating to the RFS, including lawsuits relating to petitions for small refinery exemptions (“SREs”) filed by WRC for the 2017 through 2024 compliance periods, which petitions are in various stages of review by the EPA and/or various courts, primarily including the following:
•Regarding WRC’s petitions for the 2017 to 2021 compliance periods which, together with the SRE petitions from certain other small refineries, had been denied by the EPA in 2022 (the “2022 Denials”), the EPA has yet to act on those petitions after the EPA’s denials were vacated by the United States Court of Appeals for the Fifth Circuit (the “Fifth Circuit”) in November 2023 and remanded back to the EPA on the grounds that the EPA’s denials were impermissibly retroactive and that the EPA’s interpretation was contrary to law and arbitrary and capricious as applied to petitioners’ exemptions. In May 2024, the EPA and certain biofuels groups sought certiorari before the Supreme Court of the United States (“SCOTUS”) seeking review of whether venue for these challenges to the 2022 Denials lies exclusively in the United States Court of Appeals for the District of Colombia Circuit (the “DC Circuit”), which certiorari was granted in October 2024. Oral argument is expected sometime in 2025.
•Regarding WRC’s petition for the 2022 compliance period, that petition was denied by the EPA in July 2023 largely on the same grounds as the 2022 Denials and had been stayed by the Fifth Circuit pending issuance of the mandate in a case brought by other small refiners in July 2024 in the DC Circuit, which ruled in favor of certain small refineries also challenging the 2022 Denials, holding that the 2022 Denials as applicable to those small refineries was arbitrary and
CVR ENERGY, INC. AND SUBSIDIARIES
NOTES TO CONSOLIDATED FINANCIAL STATEMENTS
capricious, vacating such denials and remanding such petitions back to the EPA. The DC Circuit also dismissed a challenge brought by biofuel producers to the EPA’s alternative compliance action, concluding that the petitioners had not established any harm from EPA’s decision and therefore lacked standing to sue. WRC’s SRE petition for the 2022 compliance period, which was denied by the EPA in July 2023 largely on the same grounds as the 2022 Denials, had been stayed pending issuance of the mandate in the DC Circuit case.
•Regarding WRC’s petition for the 2023 compliance period, the United States District Court for the Southern District of Texas ruled in favor of WRC in its suit seeking a declaration that the Administrator of the EPA violated the CAA by failing to rule on WRC’s petition within 90 days, and issued a ruling that EPA must act on WRC’s petition in January 2025. In January 2025, the EPA denied WRC’s petition. In February 2025, WRC filed a petition with the Fifth Circuit seeking stay of WRC’s obligations under the RFS. In its filings with the Fifth Circuit in February 2025, the EPA reported that it was reviewing its denial and did not oppose WRC’s stay.
•Regarding WRC’s petition for the 2024 compliance period, EPA has not yet ruled on WRC’s petition despite its ninety day deadline. WRC served on the EPA a notice of intent to sue EPA for this failure.
As these matters are in various stages, the Company cannot yet determine at this time the outcomes of these matters. While we intend to prosecute these actions vigorously, if these matters are ultimately concluded in a manner adverse to the Company, they could have a material effect on the Company’s financial position, results of operations, or cash flows.
Guaranty Dispute – In connection with mediation conducted in September 2024, Exxon Mobil Corporation (“XOM”) formally demanded, pursuant to a guaranty claimed by XOM to have been issued in its favor in 1993 by a subsidiary of CVR Energy (the “Alleged Guaranty”), that such subsidiary defend and indemnify it against claims by numerous property owners in Louisiana alleging contamination from historic well operations relating to oil and gas leases in Lousiana sold by XOM in 1993 (the “LA Leases”). The Company disputes the validity of the alleged guaranty and has filed suit in the Superior Court of the State of Delaware for declaratory judgment relating thereto, which suit remains pending. While CVR Energy vigorously opposes XOM’s claims, if the Alleged Guaranty is determined to obligate CVR Energy to indemnify XOM for all damages it could incur relating to the LA Leases, it could have a material effect on CVR Energy’s financial position, results of operations, or cash flows. However, as this matter remains in its early stages, the Company cannot yet determine whether it will have such an outcome.
Environmental, Health, and Safety (“EHS”) Matters
Environmental Accruals - As of December 31, 2024 and 2023, environmental accruals which also include estimated costs for future remediation efforts at certain Petroleum Segment sites, totaled approximately $3 million and $19 million, respectively. These amounts are reflected in Other current liabilities and Other long-term liabilities depending on when the Company expects to expend such amounts.
(15) Business Segments
Effective with this Report and due to the prominence of the renewables business relative to the Company’s overall 2024 performance, the Company has revised its reportable segments to reflect a new reportable segment – Renewables. The Renewables Segment includes the operations of the renewable diesel unit and renewable feedstock pretreater at the refinery located in Wynnewood, Oklahoma. Results of the Renewables Segment were not previously included within our reportable segments, rather included within “Other”. Prior period segment information has been retrospectively adjusted to reflect the current segment presentation.
As a result, CVR Energy has three reportable segments: Petroleum, Renewables, and Nitrogen Fertilizer, which were determined based on the management approach, reflecting the internal reporting used by the Chief Operating Decision Maker (“CODM”), the Company’s Chief Executive Officer, to evaluate performance and make strategic decisions.
•Petroleum includes the refining and marketing of high value transportation fuels which consist of gasoline, diesel, jet fuel, and distillates. The Petroleum Segment also includes activities related to crude gathering and logistics that support the refinery operations.
•Renewables includes the refining of renewable feedstocks, such as soybean oil, corn oil, and other renewable feedstocks, into renewable diesel and marketing of renewables products.
•Nitrogen Fertilizer includes the production and sales of nitrogen fertilizer products, primarily in the form of ammonia and UAN, for the farming industry.
CVR ENERGY, INC. AND SUBSIDIARIES
NOTES TO CONSOLIDATED FINANCIAL STATEMENTS
The CODM evaluates the performance of each reportable segment and decides how to allocate resources based on segment operating income (loss) which includes the revenue and expenses that are directly attributable to management of each segment, as well as the total assets per segment. The CODM uses segment operating income (loss) and segment total assets to assess the income generated by each reportable segment and to decide which reportable segment to reinvest profits, if at all, or pay dividends. Segment operating income (loss) is also used to analyze performance against the budget and the Company’s competitors.
The other amounts reflect intercompany eliminations, corporate cash and cash equivalents, income tax activities, and other corporate activities that are not allocated or aggregated to the reportable segments.
The following tables present the operating results and capital expenditures information by segment, the reconciliations to the consolidated net profit (loss), and other required disclosures:
| | | | | | | | | | | | | | | | | | | | | | | | | | | | | |
| Year Ended December 31, 2024 |
| (in millions) | Petroleum Segment | | Renewables Segment | | Nitrogen Fertilizer Segment | | Other / Eliminations | | Consolidated |
| Third-party sales | $ | 6,909 | | | $ | 177 | | | $ | 524 | | | $ | — | | | $ | 7,610 | |
| Inter-segment fees and sales | 11 | | | 112 | | | 1 | | | (124) | | | — | |
| Net sales | 6,920 | | | 289 | | | 525 | | | (124) | | | 7,610 | |
| Less: | | | | | | | | | |
| Cost of materials and other | 6,236 | | | 245 | | | 104 | | | (137) | | | 6,448 | |
| Direct operating expenses (exclusive of depreciation and amortization) | 421 | | | 31 | | | 214 | | | 1 | | | 667 | |
| Selling, general and administrative expenses (exclusive of depreciation and amortization) | 77 | | | 10 | | | 29 | | | 23 | | | 139 | |
| Depreciation and amortization | 174 | | | 25 | | | 88 | | | 11 | | | 298 | |
| | | | | | | | | |
| Segment operating income (loss) | $ | 12 | | | $ | (22) | | | $ | 90 | | | $ | (22) | | | $ | 58 | |
| | | | | | | | | |
| Reconciliation of Segment operating income (loss) to Net income: | | | | | | |
| Interest expense, net | | | | | | | | | $ | (77) | |
| Other income, net | | | | | | | | | 38 | |
| Income tax benefit | | | | | | | | | 26 | |
| Net income | | | | | | | | | $ | 45 | |
| | | | | | | | | |
| Other segment disclosures: | | | | | | | | | |
| Interest income | $ | 22 | | | $ | 1 | | | $ | 4 | | | $ | 11 | | | $ | 38 | |
| Interest expense | (1) | | | — | | | (34) | | | (80) | | | (115) | |
Capital expenditures (1) | 128 | | | 11 | | | 37 | | | 5 | | | 181 | |
CVR ENERGY, INC. AND SUBSIDIARIES
NOTES TO CONSOLIDATED FINANCIAL STATEMENTS
| | | | | | | | | | | | | | | | | | | | | | | | | | | | | |
| Year Ended December 31, 2023 |
| (in millions) | Petroleum Segment | | Renewables Segment | | Nitrogen Fertilizer Segment | | Other / Eliminations | | Consolidated |
| Net sales | $ | 8,267 | | | $ | 299 | | | $ | 681 | | | $ | — | | | $ | 9,247 | |
| Inter-segment fees and sales | 20 | | | 260 | | | — | | | (280) | | | — | |
| Total sales | 8,287 | | | 559 | | | 681 | | | (280) | | | 9,247 | |
| Less: | | | | | | | | | |
| Cost of materials and other | 6,629 | | | 537 | | | 134 | | | (287) | | | 7,013 | |
| Direct operating expenses (exclusive of depreciation and amortization) | 406 | | | 28 | | | 235 | | | 1 | | | 670 | |
| Selling, general and administrative expenses (exclusive of depreciation and amortization) | 81 | | | 11 | | | 30 | | | 19 | | | 141 | |
| Depreciation and amortization | 189 | | | 20 | | | 80 | | | 9 | | | 298 | |
| Loss on asset disposals | — | | | — | | | 1 | | | 1 | | | 2 | |
| Segment operating income (loss) | $ | 982 | | | $ | (37) | | | $ | 201 | | | $ | (23) | | | $ | 1,123 | |
| | | | | | | | | |
| Reconciliation of Segment operating income (loss) to Net income: | | | | | | |
| Interest expense, net | | | | | | | | | $ | (52) | |
| Other income, net | | | | | | | | | 14 | |
| Income tax expense | | | | | | | | | (207) | |
| Net income | | | | | | | | | $ | 878 | |
| | | | | | | | | |
| Other segment disclosures: | | | | | | | | | |
| Interest income | $ | 75 | | | $ | 2 | | | $ | 6 | | | $ | (45) | | | $ | 38 | |
| Interest expense | — | | | (1) | | | (35) | | | (54) | | | (90) | |
Capital expenditures (1) | 108 | | | 56 | | | 29 | | | 4 | | | 197 | |
CVR ENERGY, INC. AND SUBSIDIARIES
NOTES TO CONSOLIDATED FINANCIAL STATEMENTS
| | | | | | | | | | | | | | | | | | | | | | | | | | | | | |
| Year Ended December 31, 2022 |
| (in millions) | Petroleum Segment | | Renewables Segment | | Nitrogen Fertilizer Segment | | Other / Eliminations | | Consolidated |
| Net sales | $ | 9,902 | | | $ | 158 | | | $ | 836 | | | $ | — | | | $ | 10,896 | |
| Inter-segment fees and sales | 17 | | | 180 | | | — | | | (197) | | | — | |
| Total sales | 9,919 | | | 338 | | | 836 | | | (197) | | | 10,896 | |
| Less: | | | | | | | | | |
| Cost of materials and other | 8,488 | | | 342 | | | 133 | | | (197) | | | 8,766 | |
| Direct operating expenses (exclusive of depreciation and amortization) | 426 | | | 24 | | | 269 | | | — | | | 719 | |
| Selling, general and administrative expenses (exclusive of depreciation and amortization) | 88 | | | 3 | | | 32 | | | 26 | | | 149 | |
| Depreciation and amortization | 187 | | | 16 | | | 82 | | | 3 | | | 288 | |
| Loss on asset disposals | 11 | | | — | | | — | | | — | | | 11 | |
| Segment operating income (loss) | $ | 719 | | | $ | (47) | | | $ | 320 | | | $ | (29) | | | $ | 963 | |
| | | | | | | | | |
| Reconciliation of Segment operating income (loss) to Net income: | | | | | | |
| Interest expense, net | | | | | | | | | $ | (85) | |
| Other expense, net | | | | | | | | | (77) | |
| Income tax expense | | | | | | | | | (157) | |
| Net income | | | | | | | | | $ | 644 | |
| | | | | | | | | |
| Other segment disclosures: | | | | | | | | | |
| Interest income | $ | 43 | | | $ | — | | | $ | 2 | | | $ | (37) | | | $ | 8 | |
| Interest expense | (2) | | | — | | | (36) | | | (55) | | | (93) | |
Capital expenditures (1) | 86 | | | 69 | | | 41 | | | 7 | | | 203 | |
The following table summarizes the reconciliation of total assets by segment to consolidated total assets:
| | | | | | | | | | | | | |
| December 31, |
| (in millions) | 2024 | | 2023 | | |
| Petroleum | $ | 3,288 | | | $ | 2,978 | | | |
| Renewables | 420 | | | 344 | | | |
| Nitrogen Fertilizer | 1,019 | | | 975 | | | |
| Other, including inter-segment eliminations | (464) | | | 410 | | | |
| Total assets | $ | 4,263 | | | $ | 4,707 | | | |
(1)Capital expenditures are shown exclusive of capitalized turnaround expenditures.
CVR ENERGY, INC. AND SUBSIDIARIES
NOTES TO CONSOLIDATED FINANCIAL STATEMENTS
(16) Supplemental Cash Flow Information
Cash flows related to income taxes, interest, leases, and capital and turnaround expenditures included in accounts payable were as follows:
| | | | | | | | | | | | | | | | | |
| Year Ended December 31, |
| (in millions) | 2024 | | 2023 | | 2022 |
| Supplemental disclosures: | | | | | |
| Cash paid for income taxes, net of refunds | $ | 60 | | | $ | 93 | | | $ | 170 | |
| Cash paid for interest | 112 | | | 95 | | | 96 | |
| Cash paid for amounts included in the measurement of lease liabilities: | | | | | |
| Operating cash flows from operating leases | 19 | | | 19 | | | 17 |
| Operating cash flows from finance leases | 4 | | | 4 | | | 5 |
| Financing cash flows from finance leases | 10 | | | 6 | | | 6 |
| Noncash investing and financing activities: | | | | | |
Change in capital expenditures included in accounts payable (1) | 2 | | | (8) | | | 12 | |
| Change in turnaround expenditures included in accounts payable | 5 | | | 3 | | | (2) | |
| | | | | |
| ROU assets obtained in exchange for new or modified operating lease liabilities | 37 | | | 21 | | | 7 | |
| ROU assets obtained in exchange for new or modified finance lease liabilities | 26 | | | 2 | | | — | |
| | | | | |
(1)Capital expenditures are shown exclusive of capitalized turnaround expenditures.
Cash, cash equivalents and restricted cash consisted of the following:
| | | | | | | | | | | |
| As of December 31, |
| (in millions) | 2024 | | 2023 |
| Cash and cash equivalents | $ | 987 | | | $ | 581 | |
Reserved funds (1) | — | | | 598 | |
Restricted cash (2) | — | | | 7 | |
| Cash, cash equivalents, reserved funds and restricted cash | $ | 987 | | | $ | 1,186 | |
(1)Funds reserved for the redemption of the 2025 Notes in February 2024. See Note 8 (“Long-Term Debt and Finance Lease Obligations”) for further discussion.
(2)Restricted funds were released and paid in February 2024.
CVR ENERGY, INC. AND SUBSIDIARIES
NOTES TO CONSOLIDATED FINANCIAL STATEMENTS
(17) Related Party Transactions
Activity associated with the Company’s related party arrangements for the years ended December 31, 2024, 2023, and 2022 is summarized below:
Related Party Activity
| | | | | | | | | | | | | | | | | |
| Year Ended December 31, |
| (in millions) | 2024 | | 2023 | | 2022 |
| Sales to related parties: | | | | | |
CVRP JV CO Contract (1) | $ | 3 | | | $ | 4 | | | $ | — | |
| Purchases from related parties: | | | | | |
| Enable Joint Venture Transportation Agreement | 13 | | | 12 | | | 10 | |
Midway Joint Venture Agreement (2) | 26 | | | 24 | | | 22 | |
| Payments: | | | | | |
Dividends (3) | 100 | | | 311 | | | 342 | |
| | | | | |
(1)Sales to related parties, included in Net sales in our Consolidated Statements of Operations, consists of CO sales to a CVRP JV subsidiary.
(2)Purchases from related parties, included in Cost of materials and other in our Consolidated Statements of Operations, represents reimbursements for crude oil transportation services incurred on Midway JV through Gunvor as the intermediary purchasing agent. On December 23, 2024, the Company sold the 50% Membership Interests it owned in Midway JV.
(3)See below for a summary of the dividends paid to IEP during the years ended December 31, 2024, 2023, and 2022.
Enable Joint Venture Transportation and Terminalling Services Agreements
We are party to a transportation agreement, effective September 19, 2016, with Enable JV for an initial term of 20 years under which Enable provides transportation services for crude oil purchased within a defined geographic area. Additionally, we entered into a terminalling services agreement, effective September 19, 2016, with Enable JV under which it receives access to Enable JV’s terminal in Lawrence, Oklahoma to unload and pump crude oil into Enable JV’s pipeline for an initial term of 20 years.
Dividends to CVR Energy Stockholders
Dividends, if any, including the payment, amount and timing thereof, are determined at the discretion of the Board. IEP, through its ownership of the Company’s common stock, is entitled to receive dividends that are declared and paid by the Company based on the number of shares held at each record date. The following table presents quarterly and special dividends paid to the Company’s stockholders, including IEP, during 2024, 2023, and 2022 (amounts presented in table below may not add to totals presented due to rounding):
| | | | | | | | | | | | | | | | | | | | | | | | | | | | | | | | |
| | | | | | Quarterly Dividends Paid (in millions) |
| Related Period | | Date Paid | | Quarterly Dividends
Per Share | | Public Stockholders | | IEP | | Total |
| 2023 - 4th Quarter | | March 11, 2024 | | $ | 0.50 | | | $ | 17 | | | $ | 33 | | | $ | 50 | |
| 2024 - 1st Quarter | | May 20, 2024 | | 0.50 | | | 17 | | | 33 | | | 50 | |
| 2024 - 2nd Quarter | | August 19, 2024 | | 0.50 | | | 17 | | | 33 | | | 50 | |
| | | | | | | | | | |
| Total 2024 quarterly dividends | | $ | 1.50 | | | $ | 51 | | | $ | 100 | | | $ | 151 | |
| | | | | | | | | | |
| 2022 - 4th Quarter | | March 13, 2023 | | $ | 0.50 | | | $ | 15 | | | $ | 36 | | | $ | 50 | |
| 2023 - 1st Quarter | | May 22, 2023 | | 0.50 | | | 15 | | | 36 | | | 50 | |
| 2023 - 2nd Quarter | | August 21, 2023 | | 0.50 | | | 15 | | | 36 | | | 50 | |
| 2023 - 3rd Quarter | | November 20, 2023 | | 0.50 | | | 17 | | | 33 | | | 50 | |
| Total 2023 quarterly dividends | | $ | 2.00 | | | $ | 61 | | | $ | 140 | | | $ | 201 | |
| | | | | | | | | | |
| | | | | | | | | | |
CVR ENERGY, INC. AND SUBSIDIARIES
NOTES TO CONSOLIDATED FINANCIAL STATEMENTS
| | | | | | | | | | | | | | | | | | | | | | | | | | | | | | | | |
| | | | | | Quarterly Dividends Paid (in millions) |
| Related Period | | Date Paid | | Quarterly Dividends
Per Share | | Public Stockholders | | IEP | | Total |
| 2022 - 1st Quarter | | May 23, 2022 | | $ | 0.40 | | | $ | 12 | | | $ | 28 | | | $ | 40 | |
| 2022 - 2nd Quarter | | August 22, 2022 | | 0.40 | | | 12 | | | 28 | | | 40 | |
| 2022 - 3rd Quarter | | November 21, 2022 | | 0.40 | | | 12 | | | 28 | | | 40 | |
| Total 2022 quarterly dividends | | $ | 1.20 | | | $ | 36 | | | $ | 85 | | | $ | 121 | |
| | | | | | | | | | |
| | | | | | |
| | | | | | | | | | |
| | | | | | | | | | |
| | | | | | | | | | |
| | | | | | | | |
| | | | | | | | | | |
| | | | | | | | | | |
| | | | | | | | | | |
| | | | | | | | |
| | | | | | | | | | | | | | | | | | | | | | | | | | | | | | | | |
| | | | | | Special Dividends Paid (in millions) |
| Related Period | | Date Paid | | Special Dividends
Per Share | | Public Stockholders | | IEP | | Total |
| 2023 - 2nd Quarter | | August 21, 2023 | | $ | 1.00 | | | $ | 29 | | | $ | 71 | | | $ | 101 | |
| 2023 - 3rd Quarter | | November 20, 2023 | | 1.50 | | | 51 | | | 100 | | | 151 | |
| Total 2023 special dividends | | $ | 2.50 | | | $ | 80 | | | $ | 171 | | | $ | 251 | |
| | | | | | | | | | |
| 2022 - 2nd Quarter | | August 22, 2022 | | $ | 2.60 | | | $ | 76 | | | $ | 185 | | | $ | 261 | |
| 2022 - 3rd Quarter | | November 21, 2022 | | 1.00 | | | 29 | | | 71 | | | 101 | |
| Total 2022 special dividends | | $ | 3.60 | | | $ | 106 | | | $ | 256 | | | $ | 362 | |
There were no quarterly dividends declared or paid during the fourth quarter of 2024 related to the third quarter of 2024, and there were no quarterly dividends declared or paid during the first quarter of 2022 related to the fourth quarter of 2021. No dividends were declared for the fourth quarter of 2024.
Distributions to CVR Partners’ Unitholders
Distributions, if any, including the payment, amount and timing thereof, and UAN GP Board’s distribution policy, including the definition of available cash, are subject to change at the discretion of the UAN GP Board. The following tables present quarterly distributions paid by CVR Partners to CVR Partners’ unitholders, including amounts received by the Company, during 2024, 2023, and 2022 (amounts presented in tables below may not add to totals presented due to rounding):
| | | | | | | | | | | | | | | | | | | | | | | | | | | | | | | | |
| | | | | | | | | | |
| | | | | | Quarterly Distributions Paid (in millions) |
| Related Period | | Date Paid | | Quarterly Distributions
Per Common Unit | | Public Unitholders | | CVR Energy | | Total |
| 2023 - 4th Quarter | | March 11, 2024 | | $ | 1.68 | | | $ | 11 | | | $ | 7 | | | $ | 18 | |
| 2024 - 1st Quarter | | May 20, 2024 | | 1.92 | | | 13 | | | 7 | | | 20 | |
| 2024 - 2nd Quarter | | August 19, 2024 | | 1.90 | | | 13 | | | 7 | | | 20 | |
| 2024 - 3rd Quarter | | November 18, 2024 | | 1.19 | | | 7 | | | 5 | | | 13 | |
| Total 2024 quarterly distributions | | $ | 6.69 | | | $ | 44 | | | $ | 26 | | | $ | 71 | |
| | | | | | | | | | |
| 2022 - 4th Quarter | | March 13, 2023 | | $ | 10.50 | | | $ | 70 | | | $ | 41 | | | $ | 111 | |
| 2023 - 1st Quarter | | May 22, 2023 | | 10.43 | | | 70 | | | 41 | | | 110 | |
| 2023 - 2nd Quarter | | August 21, 2023 | | 4.14 | | | 28 | | | 16 | | | 44 | |
| 2023 - 3rd Quarter | | November 20, 2023 | | 1.55 | | | 10 | | | 6 | | | 16 | |
| Total 2023 quarterly distributions | | $ | 26.62 | | | $ | 178 | | | $ | 104 | | | $ | 281 | |
| | | | | | | | | | |
| | | | | | | | | | | | | | | | | | | | | | | | | | | | | | | | |
| | | | | | | | | | |
| | | | | | Quarterly Distributions Paid (in millions) |
| Related Period | | Date Paid | | Quarterly Distributions
Per Common Unit | | Public Unitholders | | CVR Energy | | Total |
| 2021 - 4th Quarter | | March 14, 2022 | | $ | 5.24 | | | $ | 36 | | | $ | 20 | | | $ | 56 | |
| 2022 - 1st Quarter | | May 23, 2022 | | 2.26 | | | 15 | | | 9 | | | 24 | |
| 2022 - 2nd Quarter | | August 22, 2022 | | 10.05 | | | 67 | | | 39 | | | 106 | |
| 2022 - 3rd Quarter | | November 21, 2022 | | 1.77 | | | 12 | | | 7 | | | 19 | |
| Total 2022 quarterly distributions | | $ | 19.32 | | | $ | 129 | | | $ | 75 | | | $ | 205 | |
For the fourth quarter of 2024, CVR Partners, upon approval by the UAN GP Board on February 18, 2025, declared a distribution of $1.75 per common unit, or $18 million, which is payable March 10, 2025 to unitholders of record as of March 3, 2025. Of this amount, CVR Energy and IEP will receive approximately $7 million and less than $1 million, with the remaining amount payable to public unitholders.
Item 9. Changes in and Disagreements with Accountants on Accounting and Financial Disclosure
None.
Item 9A. Controls and Procedures
Evaluation of Disclosure Controls and Procedures
The Company has evaluated, under the direction and with the participation of the Chief Executive Officer and Chief Financial Officer, the effectiveness of our disclosure controls and procedures, as defined in Exchange Act Rule 13a-15(e) and 15d-15(e). Based upon this evaluation, the Company’s Chief Executive Officer and Chief Financial Officer concluded that disclosure controls and procedures were effective as of December 31, 2024.
Management’s Report on Internal Control Over Financial Reporting
The Company’s management is responsible for establishing and maintaining adequate internal control over financial reporting, as such term is defined in Exchange Act Rule 13a-15(f). Because of its inherent limitations, internal control over financial reporting may not prevent or detect misstatements. Projections of any evaluation of effectiveness to future periods are subject to the risk that controls may become inadequate because of changes in conditions, or that the degree of compliance with the policies or procedures may deteriorate. Under the supervision and with the participation of management, we conducted an evaluation of the effectiveness of its internal control over financial reporting based on the framework in the 2013 Internal Control — Integrated Framework issued by the Committee of Sponsoring Organizations of the Treadway Commission (“COSO”). Based on that evaluation, the Company’s Chief Executive Officer, Chief Financial Officer and Chief Accounting Officer have concluded that internal control over financial reporting was effective as of December 31, 2024. The Company’s independent registered public accounting firm, that audited the consolidated financial statements included herein under Part II, Item 8 of this Report, has issued a report on the effectiveness of the Company’s internal control over financial reporting. This report can be found under Part II, Item 8 of this Report.
Changes in Internal Control Over Financial Reporting
There have been no material changes in our internal controls over financial reporting required by Rule 13a-15 of the Exchange Act that occurred during the fiscal quarter ended December 31, 2024 that materially affected, or are reasonably likely to materially affect, our internal control over financial reporting.
Item 9B. Other Information
In February 2025, the Compensation Committee of our Board adopted and approved an amendment to the CVR Energy, Inc. Change in Control and Severance Plan to clarify that incentive and phantom unit awards that have the option to be settled in cash or shares/units are subject to acceleration upon satisfaction of the change-in-control provisions defined therein. Such amended plan will be filed with the Company’s Quarterly Report on Form 10-Q for the period ending March 31, 2025.
During the three months ended December 31, 2024, no director or officer of the Company adopted or terminated a “Rule 10b5-1 trading arrangement” or “non-Rule 10b5-1 trading arrangement,” as each term is defined in Item 408(a) of Regulation S-K.
Item 9C. Disclosure Regarding Foreign Jurisdictions that Prevent Inspections
Not applicable.
PART III
Item 10. Directors, Executive Officers and Corporate Governance
The information required by Items 401, 405, 406, 407(c)(3), (d)(4), and (d)(5), and 408(b) of Regulation S-K in response to this item will be set forth in our definitive proxy statement for our 2025 annual meeting of stockholders.
Item 11. Executive Compensation
The information required by Items 402 and 407(e)(4) and (e)(5) of Regulation S-K in response to this item will be set forth in our definitive proxy statement for our 2025 annual meeting of stockholders.
Item 12. Security Ownership of Certain Beneficial Owners and Management and Related Stockholder Matters
The equity compensation plan information required by Items 201(d) and the information required by Item 403 of Regulation S-K in response to this item will be set forth in our definitive proxy statement for our 2025 annual meeting of stockholders.
Item 13. Certain Relationships and Related Transactions, and Director Independence
The information required by Items 404 and 407(a) of Regulation S-K in response to this item will be set forth in our definitive proxy statement for our 2025 annual meeting of stockholders.
Item 14. Principal Accounting Fees and Services
The information required by Items 9(e) of Schedule 14A in response to this item will be set forth in our definitive proxy statement for our 2025 annual meeting of stockholders.
PART IV
Item 15. Exhibits, Financial Statement Schedules
(a)(1) Financial Statements - See Part II, Item 8 of this Annual Report on Form 10-K.
(a)(2) Financial Statement Schedules - All schedules for which provision is made in the applicable accounting regulations of the Securities and Exchange Commission (the “SEC”) are not required under the related instructions or are inapplicable and therefore have been omitted.
(a)(3) Exhibits
INDEX TO EXHIBITS
| | | | | |
| Exhibit Number | Exhibit Description |
| |
| 2.1** | |
| |
| 3.1** | |
| |
| 3.2** | |
| |
| 4.1** | |
| |
| 4.2** | |
| |
| 4.3** | |
| |
| 4.4** | |
| |
| 4.5** | |
| |
| 4.6** | |
| |
| 4.7** | Supplemental Indenture, dated as of April 12, 2022, among CVR Renewables, LLC, CVR Energy, Inc., the existing guarantors named therein and Wells Fargo Bank, National Association, as Trustee (Incorporated by reference to Exhibit 4.1 to the Company’s Form 10-Q filed on May 3, 2022). |
| |
| 4.8** | |
| |
| 4.9** | |
| |
| 4.10** | |
| |
| 4.11* | Supplemental Indenture, dated as of December 20, 2024, among UAN Services, LLC, CVR Energy, Inc., the existing guarantors named therein, and Computershare Trust Company, N.A., as Trustee. |
| |
| 4.12* | Supplemental Indenture, dated as of December 20, 2024, among UAN Services, LLC, CVR Energy, Inc., the guarantors party thereto, and U.S. Bank Trust Company, National Association., as Trustee. |
| |
| | | | | |
| 10.1** | Amended and Restated ABL Credit Agreement, dated as of December 20, 2012, among CVR Refining, LP, CVR Refining, LLC, Coffeyville Resources Refining & Marketing, LLC, Coffeyville Resources Pipeline, LLC, Coffeyville Resources Crude Transportation, LLC, Coffeyville Resources Terminal, LLC, Wynnewood Energy Company, LLC, Wynnewood Refining Company, LLC and certain of their affiliates, the lenders from time to time party thereto, Wells Fargo Bank, National Association, as collateral agent and administrative agent (incorporated by reference to Exhibit 1.1 to the Company’s Form 8-K filed on December 27, 2012). |
| |
| 10.1.1** | Amendment No. 1 to Amended and Restated ABL Credit Agreement, dated November 14, 2017, by and among CVR Refining, LP, Coffeyville Finance Inc., CVR Refining, LLC, Coffeyville Resources Refining & Marketing, LLC, Coffeyville Resources Pipeline, LLC, Coffeyville Resources Crude Transportation, LLC, Coffeyville Resources Terminal, LLC, Wynnewood Energy Company, LLC, Wynnewood Refining Company, LLC, CVR Logistics, LLC, a group of lenders and Wells Fargo, National Association, as administrative agent and collateral agent (incorporated by reference as Exhibit 10.1 to the Form 8-K filed by CVR Refining, LP on November 17, 2017). |
| |
| 10.1.2** | Amendment No. 2 to Amended and Restated ABL Credit Agreement, dated as of December 23, 2019, and effective December 31, 2019, by and among CVR Refining, LP, Coffeyville Finance Inc., CVR Refining, LLC, Coffeyville Resources Refining & Marketing, LLC, Coffeyville Resources Pipeline, LLC, Coffeyville Resources Crude Transportation, LLC, Coffeyville Resources Terminal, LLC, Wynnewood Energy Company, LLC, Wynnewood Refining Company, LLC, CVR Logistics, LLC, a group of lenders and Wells Fargo Bank, National Association, as collateral agent and administrative agent (incorporated by reference to Exhibit 10.1.2 to the Company’s Form 10-K filed on February 20, 2020). |
| |
| 10.1.3** | |
| |
| 10.1.4** | |
| |
| 10.2** | Amended and Restated ABL Pledge and Security Agreement, dated as of December 20, 2012, among CVR Refining, LP, CVR Refining, LLC, Coffeyville Resources Refining & Marketing, LLC, Coffeyville Resources Pipeline, LLC, Coffeyville Resources Crude Transportation, LLC, Coffeyville Resources Terminal, LLC, Wynnewood Energy Company, LLC, Wynnewood Refining Company, LLC and certain of their affiliates, and Wells Fargo Bank, National Association, as collateral agent (incorporated by reference to Exhibit 1.2 to the Company’s Form 8-K filed on December 27, 2012). |
| |
| 10.3** | |
| |
| 10.4** | |
| |
| 10.4.1** | |
| |
| 10.5** | |
| |
| 10.6** | |
| |
| 10.6.1** | |
| |
| 10.6.2** | |
| |
| | | | | |
| 10.7** | |
| |
| 10.8** | |
| |
| 10.9**+ | |
| |
| 10.10**+ | |
| |
| 10.11**+ | |
| |
| 10.11.1**+ | |
| |
| 10.11.2**+ | |
| |
| 10.11.3**+ | |
| |
| 10.11.4*+ | |
| |
| 10.11.5*+ | |
| |
| 10.12**+ | |
| |
| 10.13**+ | |
| |
| 10.14**+ | |
| |
| 10.15**+ | |
| |
| 10.15.1**+ | |
| |
| 10.15.2**+ | |
| |
| 10.16** | Collateral Trust Agreement, dated as of June 10, 2016, among CVR Partners, LP, CVR Nitrogen Finance Corporation, the Guarantors (as defined therein) and Wilmington Trust, National Association, as Trustee and Collateral Trustee (incorporated by reference to Exhibit 10.1 of the Form 8-K filed by CVR Partners, LP on June 16, 2016 (Commission File No. 001-35120)). |
| |
| 10.16.1** | Parity Lien Security Agreement, dated as of June 10, 2016, among CVR Partners, LP, CVR Nitrogen Finance Corporation, the Guarantors (as defined therein) and Wilmington Trust, National Association, as Trustee and Collateral Trustee(incorporated by reference to Exhibit 10.2 of the Form 8-K filed by CVR Partners, LP on June 16, 2016 (Commission File No. 001-35120)). |
| |
| 10.17** | Intercreditor Agreement, dated as of September 30, 2016, among CVR Partners, LP, CVR Nitrogen, LP, East Dubuque Nitrogen Fertilizers, LLC, Coffeyville Resources Nitrogen Fertilizers, LLC, CVR Nitrogen Holdings, LLC, CVR Nitrogen Finance Corporation, CVR Nitrogen GP, LLC, certain of their affiliates from time to time party thereto, UBS AG, Stamford Branch, as administrative agent and collateral agent for the secured parties, Wilmington Trust, National Association, as trustee and collateral trustee for the secured parties in respect of the outstanding senior secured notes and other parity lien obligations and other parity lien representative from time to time party thereto (incorporated by reference to Exhibit 10.3 of the Form 8-K filed by CVR Partners, LP on October 6, 2016 (Commission File No. 001-35120)). |
| |
| | | | | |
| 10.18** | |
| |
| 10.19** | |
| |
| 10.20**+ | |
| |
| 10.21**+ | |
| |
| 10.22**+ | |
| |
| 10.23**+^ | |
| |
| 10.24**+^ | |
| |
| 10.25**+^ | |
| |
| 10.26**+^ | |
| |
| 10.27**+^ | |
| |
| 10.28**+^ | |
| |
| 10.29** | |
| |
| 10.30** | The Joinder Agreement (Other Parity Lien Obligations), dated as of June 23, 2021, among Wilmington Trust, National Association, as an other parity obligations representative, UBS AG, Stamford Branch, as collateral agent under the Existing ABL Facility, Wilmington Trust, National Association, as applicable parity lien representative, Wilmington Trust, National Association, as parity lien collateral trustee and CVR Partners, LP (incorporated by reference to Exhibit 10.4 to the Company’s Form 8-K filed on June 23, 2021). |
| |
| 10.31** | Credit Agreement, dated as of September 30, 2021, among CVR Partners, LP, CVR Nitrogen, LP, East Dubuque Nitrogen Fertilizers, LLC, Coffeyville Resources Nitrogen Fertilizers, LLC, CVR Nitrogen Holdings, LLC, CVR Nitrogen Finance Corporation, CVR Nitrogen GP, LLC, certain of their subsidiaries from time to time party thereto, the lenders from time to time party thereto and Wells Fargo Bank, National Association, a national banking association, as administrative agent and collateral agent (incorporated by reference to Exhibit 10.1 to the Company’s Form 8-K filed on September 30, 2021). |
| |
| 10.31.1**^ | Amendment No. 1 to Credit Agreement dated September 26, 2023, among CVR Partners, LP, CVR Nitrogen, LP, East Dubuque Nitrogen Fertilizers, LLC, Coffeyville Resources Nitrogen Fertilizers, LLC, CVR Nitrogen Holdings, LLC, CVR Nitrogen Finance Corporation, CVR Nitrogen GP, LLC, certain of their subsidiaries from time to time party thereto, the lenders from time to time party thereto, and Wells Fargo Bank National Association, a national banking association, as administrative agent and collateral agent (incorporated by reference to Exhibit 10.1 to the Partnership’s Form 8-K filed on September 27, 2023). |
| |
| 10.32** | Guaranty and Security Agreement, dated as of September 30, 2021, among CVR Partners, LP, CVR Nitrogen, LP, East Dubuque Nitrogen Fertilizers, LLC, Coffeyville Resources Nitrogen Fertilizers, LLC, CVR Nitrogen Holdings, LLC, CVR Nitrogen Finance Corporation, CVR Nitrogen GP, LLC, certain of their subsidiaries from time to time party thereto, and Wells Fargo Bank, National Association, a national banking association, as administrative agent and collateral agent (incorporated by reference to Exhibit 10.2 to the Company’s Form 8-K filed on September 30, 2021). |
| |
| | | | | |
| 10.33** | Joinder Agreement (Other Parity Lien Obligations), dated as of September 30, 2021, among Wilmington Trust, National Association (“WTNA”), as an other applicable parity obligations representative, UBS AG, Stamford Branch (“UBS”), as collateral agent under the existing ABL Facility, WTNA, as applicable parity lien representative, WTNA, as parity lien collateral trustee, Wells Fargo, as collateral agent under the ABL Credit Facility and CVR Partners (on behalf of itself and its subsidiaries) to that certain intercreditor agreement dated as of September 30, 2016 (as amended, supplemented or otherwise modified to date), among the Credit Parties, certain of their subsidiaries from time to time party thereto, UBS as trustee and collateral trustee for the secured parties in respect of the outstanding senior secured notes and other parity lien obligations and other parity lien representative from time to time party thereto(incorporated by reference to Exhibit 10.3 to the Company’s Form 8-K filed on September 30, 2021). |
| |
| 10.34**+ | |
| |
| 10.35**+ | |
| |
| 10.36**+ | |
| |
| 10.37**+ | |
| |
10.38**Õ | |
| |
| 10.39** | |
| |
| 10.40** | |
| |
10.41**Õ | |
| |
10.42**Õ^ | |
| |
10.43**Õ^ | |
| |
| 10.44**^ | |
| |
| 10.45** | |
| |
10.46**Õ‡ | Term Loan Credit Agreement, dated as of December 19, 2024, by and among CVR CHC, LP, CVR RHC, LP, CVR FHC, LP and CVR Refining, LP, as the Borrowers, Mizuho Bank, Ltd., as agent and as joint lead arranger and joint bookrunner, Wells Fargo Securities, LLC, as joint lead arranger and joint bookrunner, and the lenders that are parties thereto (incorporated by reference to Exhibit 10.1 to the Company’s Form 8-K filed on December 26, 2024). |
| |
10.47**Õ‡ | |
| |
| | | | | |
| 19.1* | |
| |
| 19.2* | |
| |
| 21.1* | |
| |
| 23.1* | |
| |
| 31.1* | |
| |
| 31.2* | |
| |
| 31.3* | |
| |
| 32.1† | |
| |
| 97.1** | |
| |
| 97.2** | |
| |
| 101* | The following financial information for CVR Energy, Inc.’s Annual Report on Form 10-K for the year ended December 31, 2024, formatted in Inline XBRL (“Extensible Business Reporting Language”) includes: (i) Consolidated Balance Sheets, (ii) Consolidated Statements of Operations, (iii) Consolidated Statements of Comprehensive Income, (iv) Consolidated Statements of Changes in Equity, (v) Consolidated Statements of Cash Flows, and (vi) the Notes to Consolidated Financial Statements, tagged in detail. The instance document does not appear in the Interactive Data File because its XBRL tags are embedded within the Inline XBRL document. |
| |
| 104* | Cover Page Interactive Data File (formatted as Inline XBRL and contained in Exhibit 101). |
* Filed herewith.
** Previously filed.
† Furnished herewith.
+ Denotes management contract or compensatory plan or arrangement.
Õ The exhibits and schedules have been omitted pursuant to Item 601(a)(5) of Regulation S-K and will be provided to the Securities and Exchange Commission upon request.
^ Certain portions of this exhibit have been redacted pursuant to Item 601(b)(10)(iv) of Regulation S-K. The Company agrees to furnish supplementally an unredacted copy of this exhibit to the SEC upon request.
‡ Certain information was redacted from this exhibit pursuant to Item 601(a)(6) of Regulation S-K.
PLEASE NOTE: Pursuant to the rules and regulations of the SEC, we may file or incorporate by reference agreements as exhibits to the reports that we file with or furnish to the SEC. The agreements are filed to provide investors with information regarding their respective terms. The agreements are not intended to provide any other factual information about the Company, its business or operations. In particular, the assertions embodied in any representations, warranties and covenants contained in the agreements may be subject to qualifications with respect to knowledge and materiality different from those applicable to investors and may be qualified by information in confidential disclosure schedules not included with the exhibits. These disclosure schedules may contain information that modifies, qualifies and creates exceptions to the representations, warranties and covenants set forth in the agreements. Moreover, certain representations, warranties and covenants in the agreements may have been used for the purpose of allocating risk between the parties, rather than establishing matters as facts. In addition, information concerning the subject matter of the representations, warranties and covenants may have changed after the date of the respective agreement, which subsequent information may or may not be fully reflected in the Company’s public disclosures. Accordingly, investors should not rely on the representations, warranties and covenants in the agreements as characterizations of the actual state of facts about the Company, its business or operations on the date hereof.
Item 16. Form 10-K Summary
None.
SIGNATURES
Pursuant to the requirements of Section 13 or 15(d) of the Securities Exchange Act of 1934, the registrant has duly caused this Report to be signed on its behalf by the undersigned, thereunto duly authorized.
| | | | | | | | | | | |
| CVR Energy, Inc. |
| By: | /s/ DAVID L. LAMP |
| | David L. Lamp |
| | President and Chief Executive Officer |
Date: February 19, 2025
Pursuant to the requirements of the Securities Exchange Act of 1934, this Report had been signed below by the following persons on behalf of the registrant and in the capacities and on the dates indicated.
| | | | | | | | |
| Signature | Title | Date |
| | |
| /s/ DAVID L. LAMP | President, Chief Executive Officer, and Director
(Principal Executive Officer) | February 19, 2025 |
| David L. Lamp | | |
| | |
| /s/ DANE J. NEUMANN | Executive Vice President, Chief Financial Officer, Treasurer and Assistant Secretary
(Principal Financial Officer) | February 19, 2025 |
| Dane J. Neumann | | |
| | |
| /s/ JEFFREY D. CONAWAY | Vice President, Chief Accounting Officer and Corporate Controller
(Principal Accounting Officer) | February 19, 2025 |
| Jeffrey D. Conaway | | |
| | |
| /s/ TED PAPAPOSTOLOU | Chairman of the Board of Directors | February 19, 2025 |
| Ted Papapostolou | | |
| | |
| /s/ DUSTIN DeMARIA | Director | February 19, 2025 |
| Dustin DeMaria | | |
| | |
| /s/ JAFFREY A. FIRESTONE | Director | February 19, 2025 |
| Jaffrey A. Firestone | | |
| | |
| /s/ STEPHEN MONGILLO | Director | February 19, 2025 |
| Stephen Mongillo | | |
| | |
| /s/ MARK J. SMITH | Director | February 19, 2025 |
| Mark J. Smith | | |
| | |
| /s/ JULIA HEIDENREICH VOLIVA | Director | February 19, 2025 |
| Julia Heidenreich Voliva | | |