PURSUANT TO RULE 13a-16 OR 15d-16 OF THE
For the month of May, 2019
(Commission File No. 001-33356),
Indicate by check mark whether the registrant files or will file
annual reports under cover Form 20-F or Form 40-F.
Form 20-F ___X___ Form 40-F ______
the Form 6-K in paper as permitted by Regulation S-T Rule 101(b)(1)
Yes ______ No ___X___
Indicate by check mark if the registrant is submitting
the Form 6-K in paper as permitted by Regulation S-T Rule 101(b)(7):
Yes ______ No ___X___
Indicate by check mark whether by furnishing the information contained in this Form,
the Registrant is also thereby furnishing the information to the Commission pursuant
to Rule 12g3-2(b) under the Securities Exchange Act of 1934:
Yes ______ No ___X___
If “Yes” is marked, indicate below the file number assigned
to the registrant in connection with Rule 12g3-2(b):N/A

FOR IMMEDIATE RELEASE -São Paulo, May 14, 2019 – Gafisa S.A. (B3: GFSA3; OTC: GFASY), a leading Brazilian homebuilder focused on the upper-middle and high-income segments, announced today its operational and financial results for the first quarter of 2019 ended March 31, 2019.
GAFISA ANNOUNCES
1Q19 RESULTS
Conference Call ► 5:00 p.m. Brasília time ► 4:00 p.m. US EST Code: Gafisa Webcast: www.gafisa.com.br/ri Replay: Shares
| In 2019, Gafisa will focus heavily on the process of rebuilding the Company. To guarantee shareholders’ interests are truly represented, we will take a management ownership approach that ensures the Board of Directors and Board of Executive Officers are integrated and in line with strategic and operational endeavors. To support Management, we will form audit, restructuring, and compensation/governance committees. Although significant challenges lie ahead, we remain confident that we will be able to reinforce our team and set up an experienced team capable of leading Gafisa to a new cycle. Our rebuilding process began in early April when we summoned shareholders for an Extraordinary Shareholders’ Meeting. During the meeting, we developed a restructuring and management plan to facilitate growth and improve our capitalization. Shareholders approved measures to i) hire a consulting firm to help develop our strategic plan and assess new areas of operation; ii) reissue treasury shares canceled by former management that may be sold in the future to generate inflows for Gafisa; and iii) increase capital by 26,273,962 shares, which should equal a total capitalization of R$130-R$134 million. Funds raised will be used to tackle short/medium term cash needs, regularize activities, and deleverage the Company. At the Extraordinary Shareholders’ Meeting held on April 23, the Company’s Bylaws were amended and the authorized capital was increased from 71,031,876 common shares to up to 120,000,000 common shares, giving the Company the flexibility to increase capital in the future. The Board of Directors was also asked to assess the best funding alternatives via issue of securities convertible or not into shares to couple with the strategic plan. We are also considering raising funds of up to US$150 million to place in the domestic or international market. We believe this strategy will pave the way to sustainable growth, with satisfied clients, restoring the company’s position as a highly credible leader in the Brazilian real estate sector and capable of meeting its obligations. We count on the confidence of our investors to forge ahead on this path to success. The first quarter of 2019 results still do not reflect the impact of new Management elected on March 27, 2019, but they are related to decisions made by former Management.
Roberto Luz PortellaChief Executive Officer |

1
OPERATIONAL RESULTS
Table 1 – Operational Performance (R$ 000)
1Q19 | 4Q18 | Q/Q (%) | 1Q18 | Y/Y (%) | |
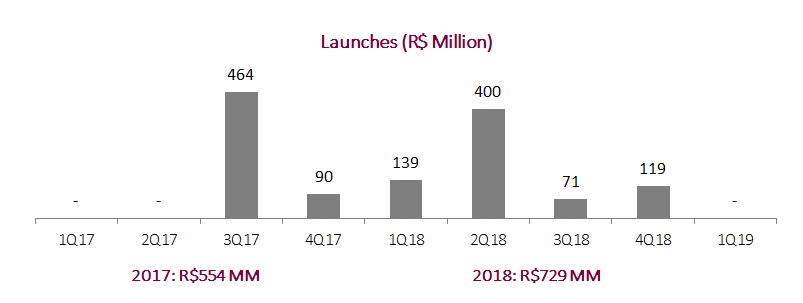
Launches | - | 118,936 | -100.0% | 138,715 | -100.0% |
Gross Sales | 91,270 | 153,406 | -40.5% | 293,460 | -68.9% |
Dissolutions | (41,363) | (58,401) | -29.2% | (57,702) | -28.3% |
Pre-sales | 49,907 | 95,005 | -47.5% | 235,757 | -78.8% |
Speed of Sales (SoS) | 4.3% | 7.2% | -2.9 p.p. | 14.4% | -10.1 p.p. |
Delivered PSV | 80,079 | 263,254 | -69.6% | - | - |
*The amounts reported are net of swap and brokerage.
Table 2 – Financial Performance (R$ 000)
1Q19 | 4Q18 | Q/Q (%) | 1Q187 | Y/Y (%) | |
Net Revenue | 95,421 | 192,917 | -51% | 233,949 | -59% |
Recurring Adjusted Gross Profit¹ | 17,764 | 46,941 | -62% | 61,542 | -74% |
Recurring Adjusted Gross Margin¹ | 18.6% | 24.3% | -572 bps | 26.3% | -769 bps |
Adjusted EBITDA² | (23,006) | (98,421) | -76.6% | 5,653 | -507% |
Adjusted EBITDA Margin² | -24.1% | -51.0% | 2,691 bps | 2.4% | -2,653 bps |
Net Income (ex- AUSA)³ | (46,353) | (121,072) | -62% | (53,516) | -13% |
Backlog Revenues | 533,503 | 551,270 | -3% | 625,251 | -15% |
Backlog Results4 5 | 193,016 | 196,812 | -2% | 231,253 | -17% |
Backlog Results Margin4 5 | 36.2% | 35.7% | 48 bps | 37.0% | -81 bps |
Net Debt | 727,104 | 752,253 | -3% | 778,530 | -7% |
Cash and Cash Equivalents6 | 63,068 | 137,160 | -54% | 204,938 | -69% |
Equity + Minority Shareholders | 449,455 | 493,191 | -9% | 936,904 | -52% |
(Net Debt. – Proj. Fin.) / (Equity + Minority.) | 51.1% | 45.4% | 569 bps | 9.8% | 4,133 bps |
2
³ Adjusted by impairment of inventories, land, and goodwill of interest in Alphaville.
4Backlog results net of PIS/COFINS taxes (3.65%) and excluding the impact of the PVA (Present Value Adjustment) method according to Law No. 11.638.
5Backlogresultscomprisetheprojectsrestrictedbyconditionprecedent.
6 Cash and cash equivalents and marketable securities.
7Restatement due to the adoption of IFRS 15 and IFRS 9.
Launches
In light of the review of launches pipeline projects and the company’s transition process this quarter, Gafisa decided to postpone project launches and focus efforts on inventory sales in 1Q19.
Sales
Gross sales totaled R$91.3 million in 1Q19, down 40.5% q-o-q and 68.9% y-o-y. 1Q19 is seasonally a weaker period because household expenditures increase due to school vacation/Carnival. Sales performance in the period was also affected by the still-fragile economy along with our ongoing restructuring process.
Dissolutions prolonged the downward trend of previous periods, reaching R$41.4 million in 1Q19, 28.3% lower than in 1Q18, despite a delivered PSV volume R$80.1 million higher than in the same period of the previous year.

¹ It considers accumulated in 2019.
3
Net pre-sales totaled R$49.9 million in 1Q19 versus R$235.7 million in 1Q18.

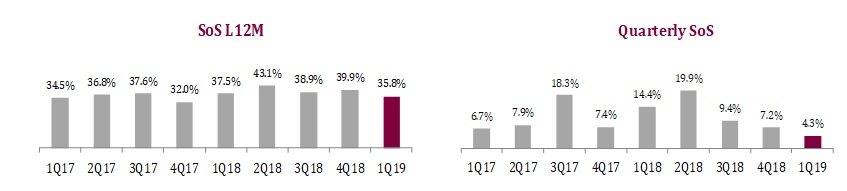
Sales Over Supply (SoS)
SoS was 4.3% in 1Q19. SoS in the last 12 months reached 35.8%, down 1.7 p.p. y-o-y. As previously mentioned, both metrics were affected by the postponement of launches in the period and the current restructuring process of the Company.
Inventory (Property for Sale)
Inventory at market value totaled R$1.12 billion in 1Q19, down 8.3% q-o-q.
It is worth mentioning the denunciation of 3Q18’s Vision Pinheiros project launch development, with a PSV, net of swaps and brokerage, of R$71.1 million. The decision to cancel this development is due to the product’s incompatibility with the profile sought in the region. This project will be reviewed and relaunched in the future.
Table 3 - Inventory at Market Value 4Q18 x 1Q19 (R$ 000)
| Inventories 4Q18 | Launches | Dissolutions | Gross Sales | Adjustments¹ | Inventories 1Q19 | Q/Q(%) |
São Paulo | 1,034,013 | - | 31,985 | (79,515) | (69,044) | 917,439 | -11.3% |
Rio de Janeiro | 143,163 | - | 8,773 | (9,602) | (5,881) | 136,453 | -4.7% |
Other Markets | 47,890 | - | 606 | (2,153) | 23,339 | 69,681 | 45.5% |
Total | 1,225,066 | - | 41,363 | (91,270) | (51,586) | 1,123,573 | -8.3% |
¹Adjustments in the period reflect the updates related to the project scope, launch date, and pricing update.
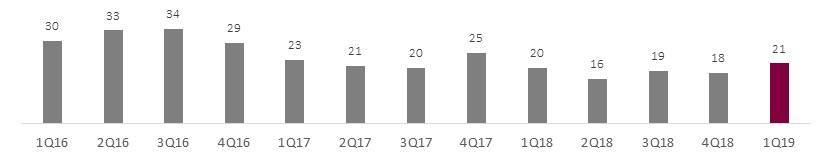
Inventory turnover was 21 months in 1Q19, in line with inventory turnover of 20 months in 1Q18.
4
Currently, approximately 70% of inventory is composed of residential units located in the state of São Paulo, with higher liquidity than commercial units.
Table 4 – Inventory at Market Value – Financial Progress – POC - (R$ 000)
| Not Initiated | Up to 30% built | 30% to 70% built | More than 70% built | Finished Units | Total 1Q19 |
São Paulo | 102,140 | 78,209 | 365,061 | 116,422 | 255,606 | 917,439 |
Rio de Janeiro | - | - | - | - | 136,453 | 136,453 |
Other Markets | - | - | 13,106 | - | 56,575 | 69,681 |
Total | 102,140 | 78,209 | 378,167 | 116,422 | 448,634 | 1,123,573 |
* % POC does not necessarily reveal the status of construction works, but the project’s financial progress.
Table 5 - Inventory at Market Value– Commercial x Residential Breakdown (R$ 000)
GFSA Inventory % | Residential | Commercial | Total |
São Paulo | 780,530 | 136,908 | 917,439 |
Rio de Janeiro | 34,878 | 101,575 | 136,453 |
Other | 69,681 | - | 69,681 |
Total | 885,090 | 238,483 | 1,123,573 |
Delivered Projects and Transfer
In 1Q19, Gafisa delivered the project Like Aclimação, totaling 136 units, net of swap, with PSVs totaling R$80.1 million, net of brokerage. Currently, Gafisa manages the construction of 14 projects, and 4 projects will start works soon.
Table 6 – Deliveries
Project | Delivery Date | Launch Date | Location | % Share | Units 100%¹ | PSV % R$000² |
Like Aclimação | Feb/19 | Mar/16 | São Paulo/SP | 100% | 136 | 80,079 |
Total 1Q19 |
|
|
|
| 136 | 80,079 |
Total 2019 |
|
|
|
| 136 | 80,079 |
¹ Number of units corresponding to 100% share in projects, net of swaps;
² PSV = Potential Sales Value of units, net of brokerage and swap.
PSV transferred in 1Q19 totaled R$64.8 million, up 9.9% y-o-y, boosted by the delivery of project Like Aclimação in the quarter.
5
Table 7 – Transfer and Delivery - (R$ 000)
| 1Q19 | 4Q18 | Q/Q (%) | 1Q18 | Y/Y (%) |
PSV Transferred¹ | 64,821 | 82,400 | -21.3% | 58,998 | 9.9% |
Delivered Projects | 1 | 4 | -75.0% | - | - |
Delivery Units² | 136 | 519 | -73.8% | - | - |
Delivered PSV³ | 80,079 | 263,254 | -69.6% | - | - |
¹ PSV transferred refers to the effective cash inflow from units transferred to financial institutions;
² Number of units corresponding to 100% share in projects, net of swaps;
³ PSV = Potential Sales Value of units, net of brokerage and swap.
Landbank
The Company’s landbank, with an estimated PSV of R$3.83 billion, represents 33 projects/phases totaling 6,782 units. Approximately 70% of land was acquired through swaps, most of it located in the city of São Paulo .
Table 8 - Landbank (R$ 000)
| PSV | % Swap Total ² | % Swap Units | % Swap Financial | Potential Units | Potential Units Total |
São Paulo | 2,486,753 | 79.9% | 71.4% | 8.5% | 4,978 | 5,331 |
Rio de Janeiro | 748,745 | 60.1% | 60.1% | 0.0% | 755 | 892 |
Other | 594,327 | 30.0% | 30.0% | 0.0% | 1,050 | 1,320 |
Total | 3,829,825 | 69.8% | 66.2% | 3.6% | 6,782 | 7,543 |
¹ The PSV (% Gafisa) reported is net of swap and brokerage fee.
²The swap percentage is measured compared to the historical cost of land acquisition.
³Potential units are net of swap and refer to the Gafisa’s and/or its partners’ interest in the project.
The adjustments to landbank include the denunciation of the Vision Pinheiros project development previously mentioned.
Table 9 – Changes in the Landbank (1Q19 x 4Q18 - R$ 000)
| Initial Landbank | Land Acquisition | Launches | Dissolutions | Adjustments | Final Landbank |
São Paulo | 2,410,522 | - | - | - | 76,231 | 2,486,753 |
Rio de Janeiro | 748,745 | - | - | - | - | 748,745 |
Other | 594,327 | - | - | - | - | 594,327 |
Total | 3,753,594 | - | - | - | 76,231 | 3,829,825 |
* The amounts reported are net swap and brokerage.
6
FINANCIAL RESULTS
Revenue
Net revenues totaled R$95.4 million in 1Q19, down 59% from 1Q18, driven by lower sales volume and work evolution in the period.
Table 10 – Revenue Recognition (R$ 000)
| 1Q19 | 1Q18¹ | ||||||
Launches | Pre-Sales | % | Revenue | % Revenue | Pre-Sales | % | Revenue | % Revenue |
2018 | 5,222 | 10.5% | 7,549 | 7.9% | 107,028 | 45.4% | - | - |
2017 | 3,126 | 6.3% | 14,682 | 15.4% | 22,264 | 9.4% | 75,983 | 32.5% |
2016 | 9,037 | 18.1% | 32,733 | 34.3% | 19,038 | 8.1% | 84,273 | 36.0% |
2015 | 27,141 | 54.4% | 27,310 | 28.6% | 62,030 | 26.3% | 11,713 | 5.0% |
<2014 | 5,381 | 10.8% | 13,147 | 13.8% | 25,398 | 10.8% | 61,980 | 26.5% |
Total | 49,907 | 100% | 95,421 | 100.0% | 235,757 | 100% | 233,949 | 100.0% |
¹Restatement due to the adoption of IFRS 15 and IFRS 9.
Gross Profit & Margin
Gafisa’s recurring adjusted gross profit came to R$17.8 million versus R$46.9 million in 4Q18 and R$61.5 million in 1Q18. Adjusted gross margin stood at 18.6%, down 7.69 p.p. from 1Q18. This y-o-y gross margin decrease is chiefly due to discounts granted in the sale of previous years finished units.
Table 11 – Gross Margin (R$ 000)
| 1Q19 | 4Q18 | Q/Q(%) | 1Q18³ | Y/Y (%) |
Net Revenue | 95,421 | 192,917 | -51% | 233,949 | -59% |
Gross Profit | 6,447 | (29,710) | 122% | 25,270 | -74% |
Gross Margin | 6.8% | -15.4% | 2,216 bps | 10.8% | -405 bps |
(-) Financial Costs | (11,317) | (13,506) | -16% | (36,272) | -69% |
Adjusted Gross Profit ¹ | 17,764 | (16,204) | -210% | 61,542 | -71% |
Adjusted Gross Margin¹ | 18.6% | -8.4% | 2,702 bps | 26.3% | -769 bps |
(-) Inventory and landbank adjustment | - | (63,145) | -100% | - | - |
Recurring Adjusted Gross Profit ² | 17,764 | 46,941 | -62% | 61.542 | -71% |
Recurring Adjusted Gross Margin² | 18.6% | 24.3% | -572 bps | 26.3% | -769 bps |
¹ Adjusted by capitalized interests.
² Adjusted byimpairment of land and inventories.
³ Restatement due to the adoption of IFRS 15 and IFRS 9.
Selling, General and Administrative Expenses (SG&A)
Selling, general and administrative expenses totaled R$14.4 million, 66% below 1Q18.
Selling expenses totaled R$6.5 million in 1Q19, down 43% q-o-q, due to lower marketing, condominium, IPTU (Urban Property Tax) and sales commission expenses, reflecting lower sales volume in the period. Y-o-y, selling expenses declined 73%.
General and administrative expenses totaled R$7.9 million, down 58% from 1Q18. This significant decrease was mainly due to (i) a review of services and IT agreements, which reduced expenses by R$3 million y-o-y, and (ii) a 50% cut in headcount in the second half of 2018, which resulted in approximatesavings of R$4 million. Q-o-q, the positive amount of R$4.7 million recorded in 4Q18 was due to a net reversal of provisions for bonus from previous years totaling R$14.8 million in 2018.
7
Table 12 – SG&A Expenses (R$ 000)
| 1Q19 | 4Q18 | Q/Q(%) | 1Q18 | Y/Y (%) |
Selling Expenses | (6,502) | (11,389) | -43% | (24,279) | -73% |
G&A Expenses | (7,900) | 4,752 | -266% | (18,696) | -58% |
Total SG&A Expenses | (14,402) | (6,637) | 117% | (42,975) | -66% |
Other Operating Income/Expenses came to R$22.2 million in 1Q19, down 83% from 4Q18, impacted by impairment referring to Alphaville goodwill; and provisions for four relevant contingencies totaling R$106.9 million.
Y-o-y, other operating income/expenses surged 89% from R$11.8 million recorded in 1Q18. Main contingencies accrued in the period refer to i) construction work delay in previous years’ projects totaling R$4.5 million; and ii) a construction defect in a project launched in May 2005, totaling R$3.1 million.
Table 13 – Other Operating Income/Expenses (R$ 000)
| 1Q19 | 4Q18 | Q/Q(%) | 1Q18 | Y/Y (%) |
Litigation Expenses | (22,225) | (127,668) | -83% | (11,776) | 89% |
Loss on realization of investment valued at fair value | - | (112,800) | -100% | - | - |
Other | (1) | (10,966) | -100% | (429) | -100% |
Total | (22,226) | (251,434) | -91% | (12,205) | 82% |
8
Adjusted EBITDA
Recurring adjusted EBITDA came negative at R$23 million in 1Q19, down 77% from negative R$98.4 million in 4Q18.
Table 14 – Adjusted EBITDA (R$ 000)
| 1Q19 | 4Q18 | Q/Q(%) | 1Q18³ | Y/Y (%) |
Net Income (Loss) | (46,354) | (297,017) | -84% | (53,516) | -13% |
(+) Inventory and Landbank Adjustment | - | 63,145 | -100% | - | - |
Adjusted Net Income¹ | (46,354) | (233,872) | -80% | (53,516) | -13% |
(+) Financial Results | 9,959 | 22,310 | -55% | 19,950 | -50% |
(+) Income Tax / Social Contribution | 404 | (24,085) | -102% | 232 | 74% |
(+) Depreciation and Amortization | 4,373 | 5,772 | -24% | 3,985 | 10% |
(+) Capitalized Interest | 11,317 | 13,506 | -16% | 36,272 | -69% |
(+) Expenses w/ Stock Option Plan | (2,460) | 15 | -16,500% | (91) | 2,603% |
(+) Minority Shareholders | (245) | 170 | -244% | (1,179) | -79% |
(+) AUSA loss on Investment realization Effect | - | 112,800 | -100% | - | - |
(+)Impairment of Software | - | 4,963 | -100% | - | - |
Recurring Adjusted EBITDA² | (23,006) | (98,421) | -77% | 5,653 | -507% |
¹ Adjusted by impairments of inventories and land.
² Adjusted by impairments of inventories and land, capitalized interest, stock option plan (non-cash), minority shareholders, and goodwill write-off in the acquisition of Alphaville.
³Restatement due to the adoption of IFRS 15 and IFRS 9.
Financial Result
In 1Q19, financial results totaled R$3.4 million, down 23% and 37% from 4Q18 and 1Q18, respectively, reflecting a lower balance of cash and cash equivalents in the period. Financial expenses reached R$13.3 million in 1Q19, 50% lower than in 4Q18, due to reduced interest rates on funding in view of a lower level of indebtedness.
In 1Q19, net financial result was negative R$10 million, versus a net loss of R$22.3 million in 4Q18 and R$20.0 million in 1Q18.
Net Result
1Q19 recorded a negative adjusted net result of R$46 million, compared to a net loss of R$121 million and R$53.5 million in 4Q18 and 1Q18, respectively.
9
Tale 15 – Net Result (R$ 000)
| 1Q19 | 4Q18 | Q/Q(%) | 1Q18 ² | Y/Y (%) |
Net Result | (46,354) | (297,017) | -84% | (53,516) | -13% |
(-) Inventory and landbank adjustment | - | (63,145) | -100% | - | - |
(-) Loss of investment in Alphaville | (1) | (112,800) | -100% | - | - |
Adjusted Net Result1 | (46,353) | (121,072) | -62% | (53,516) | -13% |
1Adjusted by impairment of inventories, land, and goodwill of interest in Alphaville.
² Restatement due to the adoption of IFRS 15 and IFRS 9.
Backlog of Revenues and Results
In 1Q19, the balance of backlog revenues by the PoC method totaled R$193.0 million, with a margin of 36.2% to be recognized, 0.48 p.p. above 4Q18, reflecting recent launches assertiveness.
Table 16 – Backlog Results (REF) (R$ 000)
| 1Q19 | 4Q18 | Q/Q(%) | 1Q18 | Y/Y (%) |
Backlog Revenues | 533,503 | 551,270 | -3% | 625,251 | -15% |
Backlog Costs (units sold) | (340,487) | (354,458) | -4% | (393,999) | -14% |
Backlog Results | 193,016 | 196,812 | -2% | (231,253) | -17% |
Backlog Margin | 36.2% | 35.7% | 48 bps | 37.0% | -81 bps |
Notes:Backlog results net of PIS/COFINS taxes (3.65%) and excluding the impact of PVA (PresentValueAdjustment) method according to Law No. 11.638.
Backlogresultscomprisetheprojectsrestrictedbyconditionprecedent.
10
BALANCE SHEET
Cash and Cash Equivalents and Marketable Securities
On March 31, 2019, cash and cash equivalents and marketable securities totaled R$63.1 million.
Receivables
At the end of 1Q19, total accounts receivable totaled R$1.15 billion, down 5% from 4Q18. Of this amount, R$596.4 million were already recognized in the balance sheet, and R$342 million are expected to be received in 2019.
Table 17 – Total Receivables (R$ 000)
| 1Q19 | 4Q18 | Q/Q(%) | 1Q18¹ | Y/Y (%) |
Receivables from developments (off balance sheet) | 553,713 | 572,154 | -3% | 648,938 | -15% |
Receivables from PoC-ST (on balance sheet) | 475,820 | 467,993 | 2% | 511,536 | -7% |
Receivables from PoC-LT (on balance sheet) | 120,614 | 174,017 | -31% | 186,897 | -35% |
Total | 1,150,147 | 1,214,164 | -5% | 1,347,371 | -15% |
¹ Restatement due to the adoption of IFRS 15 and IFRS 9.
Notes: ST – Short term | LT-Long term | PoC – Percentage of Completion Method.
Receivables from developments: Accounts receivable not yet recognized according to PoC and BRGAAP.
Receivables from PoC: Accounts receivable already recognized according to PoC and BRGAAP.
Table 18 – Receivables Schedule (R$ 000)
| Total | 2019 | 2020 | 2021 | 2022 | 2023 – and after |
Receivables from PoC | 596,434 | 342,003 | 187,579 | 61,531 | 1,347 | 3,974 |
Cash Generation
The Company ended the first quarter of 2019 with a positive cash generation of R$25.1 million, the second consecutive quarter of cash generation, as a result of disciplined expense management.
Table 19 – Cash Generation (R$ 000)
| 4Q18 | 1Q19 |
Availabilities1 | 137,160 | 63,068 |
Change in Availabilities (1) | (57,285) | (74,092) |
Total Debt + Investor Obligations | 889,413 | 790,172 |
Change in Total Debt + Investor Obligations (2) | (70,931) | (99,241) |
Cash Generation in the period (1) - (2) | 13,646 | 25,149 |
Final Accumulated Cash Generation | (45,583) | 25,149 |
¹ Cash and cash equivalents and marketable securities.
11
Liquidity
In 1Q19, Net Debt/Shareholders’ Equity ratio stood at 161.8%, an effect of losses accumulated over the last periods, higher than lower indebtedness. Excluding project finance, the Net Debt/Shareholders’ Equity ratio stood at 51.1%.
Net debt in 1Q19 totaled R$727.1 million, down 7% y-o-y.
Table 20 – Debt and Investor Obligations (R$ 000)
| 1Q19 | 4Q18 | Q/Q(%) | 1Q18 | Y/Y (%) |
Debentures – Working Capital (A) | 249,242 | 265,666 | -6% | 168,041 | 48% |
Project Financing SFH – (B) | 497,307 | 528,140 | -6% | 686,728 | -28% |
Working Capital (C) | 43,623 | 95,607 | -54% | 128,699 | -66% |
Total Debt (A)+(B)+(C)= (D) | 790,172 | 889,413 | -11% | 983,468 | -20% |
Cash and Availabilities¹ (E) | 63,068 | 137,160 | -54% | 204,938 | -69% |
Net Debt (D)-(E) = (F) | 727,104 | 752,253 | -3% | 778,530 | -7% |
Equity + Minority Shareholders (G) | 449,455 | 493,191 | -9% | 936,904 | -52% |
(Net Debt) / (Equity) (F)/(G) = (H) | 161.8% | 152.5% | 925 bps | 83.1% | 7,868 bps |
(Net Debt – Proj. Fin.) / Equity ((F)-(B))/(G) = (I) | 51.1% | 45.4% | 569 bps | 9.8% | 4,133 bps |
¹ Cash and cash equivalents and marketable securities.
The Company ended 1Q19 with R$283.8 million total short-term debt, 36% of total debt versus 39% at the end of 4Q18. On March 31, 2019, the consolidated debt average cost was 11.57% p.a., or 180.8% of CDI. We also emphasize that during 1Q19, the Company amortized nearly R$116.1 million of contracted debt principal balance.
Table 21 – Debt Maturity (R$ 000)
Average cost (p.a.) | Total | Until Mar/20 | Until Mar/21 | Until Mar/22 | Until Mar/23 | ||
Debentures – Working Capital (A) | CDI + 3% / CDI + 3.75% / CDI + 5.25% / IPCA + 8.37% | 249,242 | 52,596 | 153,504 | 41,541 | 1,601 | |
Project Financing SFH (B) | TR + 8.30% a 14.19% / 12.87% / 143% CDI | 497,307 | 231,047 | 193,011 | 73,249 | - | |
Working Capital (C) | 135% CDI / CDI + 2.5% / CDI + 3% / CDI + 3.70% / CDI + 4.25% | 43,623 | 188 | 198 | 43,237 | - | |
Total (A)+(B)+(C) = (D) |
| 790,172 | 283,831 | 346,713 | 158,027 | 1,601 | |
Obligations with investors (E) |
| - | - | - | - | - | |
Total Debt (D)+(E) = (F) | 790,172 | 283,831 | 346,713 | 158,027 | 1,601 | ||
% of Total Maturity per period | 36% | 44% | 20% | 0.2% | |||
Project debt maturing as % of total debt (C)/ (F) | 81% | 56% | 46% | - | |||
Corporate debt maturing as % of total debt ((A)+(C) + (E))/ (F) | 19% | 44% | 54% | 100% | |||
Ratio Corporate Debt / Mortgage | 37% / 63% | ||||||
12
SUBSEQUENT EVENTS
Elaboration of a Long-Term Strategic Plan
At the Extraordinary Shareholders’ Meeting held on April 15, 2019, the Board of Directors was authorized to hire a first-tier bank or consulting firm to elaborate a long-term strategic plan for the Company, aiming at resuming the path to growth, taking into account, besides Gafisa’s area of operation, potential opportunities to expand to other segments and new markets.
The Extraordinary Shareholders’ Meeting also approved the hiring of the consulting firm Falconi which will give support to the restructuring plan, focused on change of culture, review of structure, processes and expenses optimization; as well as the implementation of the zero-based budget.
Capital Increase
On April 15, 2019, a capital increase was approved by means of the issue of26,273,962non-par, registered, book-entryshares.
The issue reference price shall be R$6.02 per share, defined based on Article 170, Paragraph 1, items I and III of Law No. 6.404/76, applying a scheduled bonus: (i) 15% applied over the issue reference price in theexercise of preemptive right at a price of R$5.12 per common share ON; and (ii) an additional 3% in the amount ofR$4.96 per common share ON in unsold shares subscription.
The Company’s shareholders shall be ensured the preemptive right to subscribe for new shares based on their ownership position at the closing of the B3 trading session on April 23, 2019.
The term to exercise the preemptive right shall be 30 consecutive days as of April 24, 2019 (inclusive) until May 23, 2019 (inclusive).
Authorized Capital Increase
The Extraordinary Shareholders’ Meeting held on April 23, 2019, approved to increase the limit of the Company’s Authorized Capital from 71,031,876 common shares to 120,000,000 common shares.
Reissue of Shares
On April 24, 2019, the Company announced to its shareholders and to the market in general that, in compliance with decision made by the Board of Directors on a meeting held on April 15, 2019,shares were reissuedon April 23, 2019, totaling one million, four hundred thousand, three hundred and twenty-five(1,400,325) Company’s shares, referring to shares previously canceled by former management. Therefore, the Company’s capital stock is now divided into 44,757,914 non-par, registered, book-entry, common shares.
13
São Paulo, May 14, 2019. |
|

Alphaville Urbanismo SA released its results for the first quarter of 2019.
Financial Results
In 1Q19, net revenue came negative at R$23 million and net loss totaled R$185 million.
|
|
| |||
1Q19 | 1Q18 | 1Q19 vs. 1Q18 | |||
Net revenue | -23 | 86 | -126% | ||
Net income | -185 | -92 | 101% | ||
|
|
|
| ||
It is worth mentioning that Gafisa discontinued the recognition of its share in future losses after reducing the accounting balance of its 30% stake in Alphaville's share capital to zero.
For further information, please contact our Investor Relations team atri@alphaville.com.br or +55 11 3038-7131.
14
Consolidated Income Statement
| 1Q19 | 4Q18 | Q/Q (%) | 1Q18¹ | Y/Y (%) |
Net Revenue | 95,421 | 192,917 | -51% | 233,949 | -59% |
Operating Costs | (88,974) | (222,627) | -60% | (208,679) | -57% |
Gross Profit | 6,447 | (29,710) | -122% | 25,270 | -74% |
Gross Margin | 6.8% | -15.4% | 2,216 bps | 10.8% | -405 bps |
Operating Expenses | (42,683) | (268,912) | -84% | (59,783) | -29% |
Selling Expenses | (6,502) | (11,389) | -43% | (24,279) | -73% |
General and Administrative Expenses | (7,900) | 4,752 | -266% | (18,696) | -58% |
Other Operating Revenue/Expenses | (22,226) | (251,434) | -91% | (12,205) | 82% |
Depreciation and Amortization | (4,373) | (5,772) | -24% | (3,985) | 10% |
Equity Income | (1,682) | (5,069) | -67% | (618) | 172% |
Operational Result | (36,236) | (298,622) | -88% | (34,513) | 5% |
Financial Income | 3,365 | 4,342 | -23% | 5,344 | -37% |
Financial Expenses | (13,324) | (26,652) | -50% | (25,294) | -47% |
Net Income Before Taxes on Income | (46,195) | (320,932) | -86% | (54,463) | -15% |
Deferred Taxes | - | 25,100 | -100% | - | - |
Income Tax and Social Contribution | (404) | (1,015) | -60% | (232) | 74% |
Net Income After Taxes on Income | (46,599) | (296,847) | -84% | (54,695) | -15% |
Continued Op. Net Income | (46,599) | (296,847) | -84% | (54,695) | -15% |
Minority Shareholders | 245 | (170) | -244% | 1.179 | -79% |
Net Income | (46,354) | (297,017) | -84% | (53,516) | -13% |
¹ Restatement due to the adoption of IFRS 15 and IFRS 9.
15
Consolidated Balance Sheet
| 1Q19 | 4Q18 | Q/Q (%) | 1Q18¹ | Y/Y (%) |
Current Assets |
|
|
|
|
|
Cash and Cash equivalents | 12,402 | 32,304 | -62% | 23,654 | 48% |
Securities | 50,666 | 104,856 | -52% | 181,284 | -72% |
Receivables from clients | 475,820 | 467,993 | 2% | 511,536 | -7% |
Properties for sale | 819,458 | 890,460 | -8% | 831,593 | -1% |
Other accounts receivable | 107,370 | 106,943 | 0% | 115,928 | -7% |
Prepaid expenses and other | 2,466 | 2,668 | -8% | 5,136 | -52% |
Land for sale | 38,682 | 78,148 | -51% | 65,798 | -41% |
Subtotal | 1,506,864 | 1,683,372 | -10% | 1,734,929 | -13% |
|
|
|
|
|
|
Long-term Assets |
|
|
|
|
|
Receivables from clients | 120,614 | 174,017 | -31% | 186,897 | -35% |
Properties for sale | 228,228 | 198,941 | 15% | 336,511 | -32% |
Other | 123,755 | 123,602 | 0% | 91,568 | 35% |
Subtotal | 472,597 | 496,560 | -5% | 614,976 | -23% |
Intangible, Property and Equipment | 32,270 | 31,843 | 1% | 41,005 | -21% |
Investments | 309,668 | 314,505 | -2% | 479,445 | -35% |
|
|
|
|
|
|
Total Assets | 2,321,399 | 2,526,280 | -8% | 2,870,355 | -19% |
|
|
|
|
|
|
Current Liabilities |
|
|
|
|
|
Loans and financing | 307,555 | 285,612 | 8% | 324,376 | -5% |
Debentures | 133,636 | 62,783 | 113% | 11,408 | 1,071% |
Obligations for purchase of land advances from customers | 114,237 | 113,355 | 1% | 142,766 | -20% |
Material and service suppliers | 115,114 | 119,847 | -4% | 99,165 | 16% |
Taxes and contributions | 57,445 | 57,276 | 0% | 52,016 | 10% |
Other | 436,573 | 400,142 | 9% | 308,323 | 42% |
Subtotal | 1,164,560 | 1,039,015 | 12% | 938,054 | 24% |
|
|
|
|
|
|
Long-term liabilities |
|
|
|
|
|
Loans and financings | 233,375 | 338,135 | -31% | 491,051 | -52% |
Debentures | 115,606 | 202,883 | -43% | 156,633 | -26% |
Obligations for Purchase of Land and advances from customers | 153,947 | 196,076 | -21% | 134,924 | 14% |
Deferred taxes | 49,372 | 49,372 | 0% | 74,473 | -34% |
Provision for Contingencies | 103,604 | 155,608 | -33% | 78,293 | 32% |
Other | 51,480 | 52,000 | -1% | 57,615 | -11% |
Subtotal | 707,384 | 994,074 | -29% | 992,989 | -29% |
|
|
|
|
|
|
Shareholders’ Equity |
|
|
|
|
|
Shareholders’ Equity | 448,179 | 491,317 | -9% | 936,644 | -52% |
Minority Interest | 1,276 | 1,874 | -32% | 2,668 | -52% |
Subtotal | 449,455 | 493,191 | -9% | 939,312 | -52% |
Total liabilities and Shareholders’ Equity | 2,321,399 | 2,526,280 | -8% | 2,870,355 | -19% |
¹ Restatement due to the adoption of IFRS 15 and IFRS 9.
16
Consolidated Cash Flow
| 1Q19 | 1Q18¹ |
Net Income (Loss) before taxes | (46,195) | (54,463) |
Expenses/revenues that do not impact working capital | (7,714) | (12,486) |
Depreciation and amortization | 4,373 | 3,985 |
Impairment | (841) | (9,176) |
Expense with stock option plan | (2,460) | (91) |
Unrealized interest and fees, Net | 204 | 3,781 |
Equity Income | 1,682 | 617 |
Provision for guarantee | (338) | (834) |
Provision for contingencies | 22,225 | 11,527 |
Profit Sharing provision | - | 1,231 |
Provision (reversal) for doubtful accounts | (18,539) | (23,505) |
Gain / Loss of financial instruments | - | (21) |
Provision for fine due to construction work delay | 1,408 | - |
Clients | 62,313 | (31,059) |
Properties held for sale | 82,022 | 99,612 |
Other accounts receivable | (9,995) | (4,509) |
Prepaid expenses and deferred sale selling expenses | 202 | 399 |
Obligations on land property acquisitions | (41,248) | (31,144) |
Taxes and contributions | 168 | 5,586 |
Suppliers | 323 | 110 |
Payroll, charges, and provision for bonuses | (1,034) | 494 |
Other accounts payable | (96,601) | (29,800) |
Related party operations | 10,851 | (5,269) |
Taxes paid | (404) | (232) |
Cash used in operating activities | (31,884) | (62,761) |
Investment Activities | - | - |
Acquisition of properties and equipment | (343) | (4,368) |
Capital contribution to parent company | - | (499) |
Redemption of securities, collaterals, and credits | 77,456 | 469,903 |
Investment in marketable securities and restricted credits | (23,265) | (532,252) |
Equity instruments | 2,717 | - |
Cash used in investment activities | 56,565 | (67,216) |
Funding Activities | - | - |
Related party contributions | - | - |
Increase in Addition of loans and financing | 16,659 | 51,938 |
Amortization of loans and financing | (116,104) | (177,149) |
Assignment of credit receivables, Net | - | - |
Loan operations | 42 | (451) |
Sale of treasury shares | 148 | - |
Cash used in financing activities/ discontinued | - | - |
Movements related to the share buyback program | 54,672 | - |
Capital Increase | - | 167 |
Subscription and payment of common shares | - | 250,599 |
Net cash from financing activities | (44,583) | 125,104 |
Net cash variation for sales operations | - | - |
Increase (decrease) in cash and cash equivalents | (19,902) | (4,873) |
Beginning of the period | 32,304 | 28,527 |
End of the period | 12,402 | 23,654 |
Increase (decrease) in cash and cash equivalents | (19,902) | (4,873) |
¹ Restatement due to the adoption of IFRS 15 and IFRS 9.
17
| This release contains forward-looking statements about business prospects, estimates for operating and financial results, and Gafisa’s growth prospects. These are merely projections and, as such, are based exclusively on the expectations of management concerning the future of the business and its continued access to capital to fund the Company’s business plan. Such forward-looking statements depend, substantially, on changes in market conditions, government regulations, competitive pressures, the performance of the Brazilian economy, and the industry, among other factors; therefore, they are subject to change without prior notice. |
IR Contacts Media Relations
|
18
SIGNATURE
Gafisa S.A. | |
| By: | /s/ Roberto Portella |
Name: Roberto Portella Title: Chief Executive Officer | |