UNITED STATES
SECURITIES AND EXCHANGE COMMISSION
Washington, D.C. 20549
FORM N-CSR
CERTIFIED SHAREHOLDER REPORT OF REGISTERED MANAGEMENT INVESTMENT COMPANIES
| Investment Company Act file number: | 811-22016 | |
| Exact name of registrant as specified in charter: | abrdn Global Premier Properties Fund | |
| Address of principal executive offices: | 1900 Market Street, Suite 200 | |
| Philadelphia, PA 19103 | ||
| Name and address of agent for service: | Sharon Ferrari | |
| abrdn Inc. | ||
| 1900 Market Street, Suite 200 | ||
| Philadelphia, PA 19103 | ||
| Registrant’s telephone number, including area code: | 1-800-522-5465 | |
| Date of fiscal year end: | October 31 | |
| Date of reporting period: | April 30, 2024 |
Item 1. Reports to Stockholders.
(a) A copy of the report transmitted to shareholders pursuant to Rule 30e-1 under the Investment Company Act of 1940 (the “1940 Act”) is filed herewith.


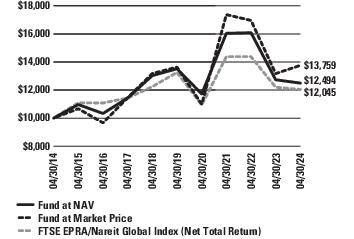
| NAV2,3 | 12.23% |
| Market Price2 | 19.52% |
| FTSE EPRA Nareit Global Real Estate Index (Net Total Return) 4 | 11.93% |
| NAV | Closing Market Price | Premium(+)/ Discount(-) | |
| 4/30/2024 | $3.76 | $3.69 | -1.86% |
| 10/31/2023 | $3.57 | $3.29 | -7.84% |
| 1 | Past performance is no guarantee of future results. Investment returns and principal value will fluctuate and shares, when sold, may be worth more or less than original cost. Current performance may be lower or higher than the performance quoted. NAV return data includes investment management fees, custodial charges and administrative fees (such as Trustee and legal fees) and assumes the reinvestment of all distributions. |
| 2 | Assuming the reinvestment of dividends and distributions. |
| 3 | The Fund’s total return is based on the reported NAV for each financial reporting period end and may differ from what is reported on the Financial Highlights due to financial statement rounding or adjustments. |
| 4 | The FTSE EPRA Nareit Global Real Estate Index (Net Total Return) is a total return index that is designed to represent general trends in eligible real estate equities worldwide. The Index is calculated net of withholding taxes to which the Fund is generally subject. Indexes are unmanaged and have been provided for comparison purposes only. No fees or expenses are reflected. You cannot invest directly in an index. |
| abrdn Global Premier Properties Fund | 1 |
| • | Visit: https://www.abrdn.com/en-us/cefinvestorcenter |
| • | Email: Investor.Relations@abrdn.com; or |
| • | Call: 1-800-522-5465 (toll free in the U.S.). |
Christian Pittard
President
| 2 | abrdn Global Premier Properties Fund |
| 6 Months | 1 Year | 3 Years | 5 Years | 10 Years | |
| Net Asset Value (NAV) | 12.23% | -1.86% | -7.99% | -1.56% | 2.25% |
| Market Price | 19.52% | 4.48% | -7.47% | 0.18% | 3.24% |
| FTSE EPRA Nareit Global Real Estate Index (Net Total Return) | 11.93% | -1.26% | -5.72% | -1.90% | 1.88% |
| abrdn Global Premier Properties Fund | 3 |
| 4 | abrdn Global Premier Properties Fund |
| Sub-Industries | |
| Industrial REITs | 21.2% |
| Retail REITs | 19.6% |
| Health Care REITs | 13.7% |
| Multi-Family Residential REITs | 11.6% |
| Data Center REITs | 11.0% |
| Real Estate Operating Companies | 10.2% |
| Self Storage REITs | 6.7% |
| Office REITs | 6.0% |
| Diversified Real Estate Activities | 5.2% |
| Diversified REITs | 5.0% |
| Hotel & Resort REITs | 4.9% |
| Other Specialized REITs | 4.8% |
| Single-Family Residential REITs | 4.2% |
| Other, less than 2% each | 3.4% |
| Short-Term Investment | 1.1% |
| Liabilities in Excess of Other Assets | (28.6%) |
| 100.0% |
| Countries | |
| United States | 78.5% |
| Japan | 12.5% |
| Australia | 6.4% |
| Mexico | 5.0% |
| United Kingdom | 4.5% |
| Singapore | 4.4% |
| Germany | 3.8% |
| Hong Kong | 2.7% |
| France | 2.6% |
| Canada | 2.3% |
| Other, less than 2% each | 4.8% |
| Short-Term Investment | 1.1% |
| Liabilities in Excess of Other Assets | (28.6%) |
| 100.0% |
| Top Ten Holdings | |
| Prologis, Inc., REIT | 8.8% |
| Welltower, Inc., REIT | 6.4% |
| Equinix, Inc., REIT | 6.1% |
| Digital Realty Trust, Inc., REIT | 4.9% |
| Public Storage, REIT | 4.6% |
| Simon Property Group, Inc., REIT | 4.3% |
| AvalonBay Communities, Inc., REIT | 4.3% |
| Realty Income Corp., REIT | 4.2% |
| Goodman Group, REIT | 3.3% |
| VICI Properties, Inc., REIT | 3.0% |
| abrdn Global Premier Properties Fund | 5 |
| Shares | Value | ||
| COMMON STOCKS—127.2% | |||
| AUSTRALIA—6.4% | |||
| Diversified REITs—1.2% | |||
| Mirvac Group, REIT | 3,036,278 | $ 3,978,339 | |
| Industrial REITs—3.3% | |||
| Goodman Group, REIT | 530,576 | 10,717,438 | |
| Multi-Family Residential REITs—0.5% | |||
| Ingenia Communities Group, REIT | 542,237 | 1,607,158 | |
| Retail REITs—1.4% | |||
| Scentre Group, REIT | 2,138,073 | 4,329,704 | |
| Total Australia | 20,632,639 | ||
| BELGIUM—1.4% | |||
| Health Care REITs—0.7% | |||
| Aedifica SA, REIT | 38,002 | 2,428,237 | |
| Industrial REITs—0.7% | |||
| Warehouses De Pauw CVA, REIT | 81,837 | 2,164,127 | |
| Total Belgium | 4,592,364 | ||
| CANADA—2.3% | |||
| Multi-Family Residential REITs—2.3% | |||
| Boardwalk Real Estate Investment Trust, REIT | 77,979 | 4,014,362 | |
| Canadian Apartment Properties REIT | 103,559 | 3,223,407 | |
| 7,237,769 | |||
| FRANCE—2.6% | |||
| Diversified REITs—0.6% | |||
| Covivio SA, REIT | 39,045 | 1,943,508 | |
| Office REITs—0.7% | |||
| Gecina SA, REIT | 22,053 | 2,251,651 | |
| Retail REITs—1.3% | |||
| Unibail-Rodamco-Westfield, REIT(a) | 47,493 | 3,957,732 | |
| Total France | 8,152,891 | ||
| GERMANY—3.8% | |||
| Real Estate Development—0.7% | |||
| Instone Real Estate Group SE(b) | 249,839 | 2,311,667 | |
| Real Estate Operating Companies—3.1% | |||
| TAG Immobilien AG(a) | 173,115 | 2,461,291 | |
| Vonovia SE(c) | 257,420 | 7,438,415 | |
| 9,899,706 | |||
| Total Germany | 12,211,373 | ||
| HONG KONG—2.7% | |||
| Real Estate Development—0.9% | |||
| CK Asset Holdings Ltd. | 638,500 | 2,723,570 | |
| Real Estate Operating Companies—0.5% | |||
| Swire Properties Ltd. | 836,000 | 1,728,987 | |
| Retail REITs—1.3% | |||
| Link REIT | 974,100 | 4,173,816 | |
| Total Hong Kong | 8,626,373 | ||
| JAPAN—12.5% | |||
| Diversified Real Estate Activities—5.2% | |||
| Mitsubishi Estate Co. Ltd. | 321,800 | 5,896,890 | |
| Mitsui Fudosan Co. Ltd. | 823,100 | 8,376,740 | |
| Tokyu Fudosan Holdings Corp. | 330,000 | 2,417,663 | |
| 16,691,293 | |||
| Shares | Value | ||
| Diversified REITs—2.2% | |||
| Canadian Solar Infrastructure Fund, Inc., UNIT | 5,149 | $ 3,751,197 | |
| KDX Realty Investment Corp., REIT | 3,184 | 3,140,497 | |
| 6,891,694 | |||
| Hotel & Resort REITs—1.6% | |||
| Invincible Investment Corp., REIT | 5,781 | 2,590,123 | |
| Japan Hotel REIT Investment Corp. | 4,723 | 2,481,924 | |
| 5,072,047 | |||
| Industrial REITs—1.3% | |||
| GLP J-Reit | 2,784 | 2,264,261 | |
| Industrial & Infrastructure Fund Investment Corp., REIT | 2,200 | 1,819,137 | |
| 4,083,398 | |||
| Multi-Family Residential REITs—0.5% | |||
| Comforia Residential REIT, Inc. | 794 | 1,718,805 | |
| Office REITs—1.7% | |||
| Nippon Building Fund, Inc., REIT | 928 | 3,545,697 | |
| Orix JREIT, Inc. | 1,918 | 2,021,726 | |
| 5,567,423 | |||
| Total Japan | 40,024,660 | ||
| MEXICO—5.0% | |||
| Industrial REITs—2.7% | |||
| Prologis Property Mexico SA de CV, REIT | 1,444,158 | 5,671,844 | |
| TF Administradora Industrial S de Real de CV, REIT | 1,227,675 | 3,019,963 | |
| 8,691,807 | |||
| Real Estate Operating Companies—2.3% | |||
| Corp. Inmobiliaria Vesta SAB de CV | 2,097,954 | 7,430,082 | |
| Total Mexico | 16,121,889 | ||
| NETHERLANDS—1.5% | |||
| Real Estate Operating Companies—1.5% | |||
| CTP NV(b)(c) | 289,975 | 4,919,047 | |
| SINGAPORE—4.4% | |||
| Industrial REITs—2.2% | |||
| Daiwa House Logistics Trust, REIT | 9,027,600 | 3,802,696 | |
| Frasers Logistics & Commercial Trust, REIT(b) | 1,706,200 | 1,235,945 | |
| Mapletree Industrial Trust, REIT | 1,169,900 | 1,937,161 | |
| 6,975,802 | |||
| Real Estate Operating Companies—0.9% | |||
| Capitaland India Trust, UNIT | 4,069,780 | 2,974,057 | |
| Retail REITs—1.3% | |||
| CapitaLand Integrated Commercial Trust, REIT | 2,861,200 | 4,078,626 | |
| Total Singapore | 14,028,485 | ||
| SWEDEN—1.2% | |||
| Real Estate Operating Companies—1.2% | |||
| Catena AB | 90,513 | 3,961,281 | |
| SWITZERLAND—0.7% | |||
| Real Estate Operating Companies—0.7% | |||
| PSP Swiss Property AG | 18,580 | 2,296,885 | |
| UNITED KINGDOM—4.5% | |||
| Diversified REITs—1.0% | |||
| Land Securities Group PLC, REIT(c) | 399,472 | 3,228,555 | |
| Industrial REITs—2.2% | |||
| Segro PLC, REIT(c) | 663,258 | 6,976,229 | |
| 6 | abrdn Global Premier Properties Fund |
| Shares | Value | ||
| COMMON STOCKS (continued) | |||
| UNITED KINGDOM (continued) | |||
| Multi-Family Residential REITs—1.3% | |||
| UNITE Group PLC, REIT | 361,681 | $ 4,181,227 | |
| Total United Kingdom | 14,386,011 | ||
| UNITED STATES—78.2% | |||
| Data Center REITs—11.0% | |||
| Digital Realty Trust, Inc., REIT(c) | 114,556 | 15,898,082 | |
| Equinix, Inc., REIT(c) | 27,426 | 19,502,903 | |
| 35,400,985 | |||
| Health Care REITs—13.0% | |||
| American Healthcare REIT, Inc. | 327,800 | 4,500,694 | |
| Omega Healthcare Investors, Inc., REIT(c) | 154,034 | 4,684,174 | |
| Sabra Health Care REIT, Inc. | 332,112 | 4,622,999 | |
| Ventas, Inc., REIT(c) | 164,045 | 7,263,912 | |
| Welltower, Inc., REIT(c) | 216,303 | 20,609,350 | |
| 41,681,129 | |||
| Hotel & Resort REITs—3.3% | |||
| DiamondRock Hospitality Co., REIT(c) | 216,003 | 1,922,427 | |
| Host Hotels & Resorts, Inc., REIT(c) | 462,634 | 8,729,903 | |
| 10,652,330 | |||
| Hotels, Resorts & Cruise Lines—0.6% | |||
| Marriott International, Inc., Class A | 8,560 | 2,021,273 | |
| Industrial REITs—8.8% | |||
| Prologis, Inc., REIT(c) | 277,497 | 28,318,569 | |
| Multi-Family Residential REITs—7.0% | |||
| AvalonBay Communities, Inc., REIT(c) | 73,177 | 13,872,164 | |
| Camden Property Trust, REIT | 31,605 | 3,150,386 | |
| Essex Property Trust, Inc., REIT | 22,006 | 5,418,978 | |
| 22,441,528 | |||
| Office REITs—3.6% | |||
| Alexandria Real Estate Equities, Inc., REIT | 51,693 | 5,989,668 | |
| Boston Properties, Inc., REIT(c) | 59,872 | 3,705,478 | |
| Hudson Pacific Properties, Inc., REIT | 336,194 | 1,949,925 | |
| 11,645,071 | |||
| Other Specialized REITs—4.8% | |||
| Gaming & Leisure Properties, Inc., REIT(c) | 133,026 | 5,684,201 | |
| VICI Properties, Inc., REIT(c) | 333,113 | 9,510,376 | |
| 15,194,577 | |||
| Retail REITs—14.3% | |||
| Brixmor Property Group, Inc., REIT(c) | 155,403 | 3,434,406 | |
| Kimco Realty Corp., REIT | 217,405 | 4,050,255 | |
| NNN REIT, Inc. | 125,047 | 5,068,155 | |
| Shares | Value | ||
| Phillips Edison & Co., Inc., REIT | 80,806 | $ 2,642,356 | |
| Realty Income Corp., REIT(c) | 251,790 | 13,480,837 | |
| Simon Property Group, Inc., REIT(c) | 99,453 | 13,976,130 | |
| SITE Centers Corp., REIT | 229,190 | 3,091,773 | |
| 45,743,912 | |||
| Self Storage REITs—6.7% | |||
| CubeSmart, REIT | 46,864 | 1,895,180 | |
| Extra Space Storage, Inc., REIT | 35,686 | 4,791,916 | |
| Public Storage, REIT(c) | 57,188 | 14,837,427 | |
| 21,524,523 | |||
| Single-Family Residential REITs—4.2% | |||
| American Homes 4 Rent, Class A, REIT | 180,698 | 6,468,989 | |
| Equity LifeStyle Properties, Inc., REIT(c) | 116,942 | 7,050,433 | |
| 13,519,422 | |||
| Telecom Tower REITs—0.9% | |||
| American Tower Corp., REIT(c) | 17,292 | 2,966,615 | |
| Total United States | 251,109,934 | ||
| Total Common Stocks | 408,301,601 | ||
| MUTUAL FUNDS—0.3% | |||
| CBRE Global Real Estate Income Fund | 193,046 | 949,786 | |
| SHORT-TERM INVESTMENT—1.1% | |||
| State Street Institutional U.S. Government Money Market Fund, Premier Class, 5.25%(d) | 3,416,318 | 3,416,318 | |
| Total Short-Term Investment | 3,416,318 | ||
| Total Investments (Cost $409,593,545)(e)—128.6% | 412,667,705 | ||
| Liabilities in Excess of Other Assets—(28.6%) | (91,673,413) | ||
| Net Assets—100.0% | $320,994,292 | ||
| (a) | Non-income producing security. |
| (b) | Denotes a security issued under Regulation S or Rule 144A. |
| (c) | All or a portion of the security has been designated as collateral for the line of credit. |
| (d) | Registered investment company advised by State Street Global Advisors. The rate shown is the 7 day yield as of April 30, 2024. |
| (e) | See accompanying Notes to Financial Statements for tax unrealized appreciation/(depreciation) of securities. |
| CVA | Dutch Certificate |
| PLC | Public Limited Company |
| REIT | Real Estate Investment Trust |
| abrdn Global Premier Properties Fund | 7 |
| Assets | |
| Investments, at value (cost $406,177,227) | $ 409,251,387 |
| Short-term investments, at value (cost $3,416,318) | 3,416,318 |
| Foreign currency, at value (cost $32,690) | 32,985 |
| Receivable for investments sold | 1,310,903 |
| Interest and dividends receivable | 1,321,672 |
| Tax reclaim receivable | 292,249 |
| Prepaid expenses | 53,461 |
| Total assets | 415,678,975 |
| Liabilities | |
| Line of credit payable (Note 7) | 88,789,850 |
| Payable for investments purchased | 5,001,359 |
| Interest payable on line of credit | 415,668 |
| Investment management fees payable (Note 3) | 239,038 |
| Investor relations fees payable (Note 3) | 51,430 |
| Administration fees payable (Note 3) | 21,786 |
| Other accrued expenses | 165,552 |
| Total liabilities | 94,684,683 |
| Net Assets | $320,994,292 |
| Composition of Net Assets | |
| Paid-in capital in excess of par | $ 416,729,662 |
| Accumulated loss | (95,735,370) |
| Net Assets | $320,994,292 |
| Net asset value per share based on 85,407,951 shares issued and outstanding | $3.76 |
| 8 | abrdn Global Premier Properties Fund |
| Net Investment Income | |
| Investment Income: | |
| Dividends (net of foreign withholding taxes of $455,955) | $ 8,523,481 |
| Total investment income | 8,523,481 |
| Expenses: | |
| Investment management fee (Note 3) | 2,097,132 |
| Administration fee (Note 3) | 137,203 |
| Investor relations fees and expenses (Note 3) | 77,125 |
| Reports to shareholders and proxy solicitation | 62,422 |
| Legal fees and expenses | 37,533 |
| Trustees' fees and expenses | 37,197 |
| Independent auditors’ fees and tax expenses | 31,632 |
| Custodian’s fees and expenses | 31,373 |
| Transfer agent’s fees and expenses | 8,020 |
| Miscellaneous | 82,057 |
| Total operating expenses, excluding interest expense | 2,601,694 |
| Interest expense (Note 7) | 2,480,958 |
| Total operating expenses before reimbursed/waived expenses | 5,082,652 |
| Expenses waived (Note 3) | (560,801) |
| Net expenses | 4,521,851 |
| Net Investment Income | 4,001,630 |
| Net Realized/Unrealized Gain/(Loss) from Investments and Foreign Currency Related Transactions: | |
| Net realized gain/(loss) from: | |
| Investments (Note 2h) | (7,884,297) |
| Foreign currency transactions | 23,339 |
| (7,860,958) | |
| Net change in unrealized appreciation/(depreciation) on: | |
| Investments (Note 2h) | 40,553,817 |
| Foreign currency translation | (2,128) |
| 40,551,689 | |
| Net realized and unrealized gain from investments and foreign currencies | 32,690,731 |
| Change in Net Assets Resulting from Operations | $36,692,361 |
| abrdn Global Premier Properties Fund | 9 |
| For the Six-Month Period Ended April 30, 2024 (unaudited) | For the Year Ended October 31, 2023 | |
| Increase/(Decrease) in Net Assets: | ||
| Operations: | ||
| Net investment income | $4,001,630 | $8,033,816 |
| Net realized loss from investments and foreign currency transactions | (7,860,958) | (24,777,274) |
| Net change in unrealized appreciation on investments and foreign currency translation | 40,551,689 | 1,204,039 |
| Net increase/(decrease) in net assets resulting from operations | 36,692,361 | (15,539,419) |
| Distributions to Shareholders From: | ||
| Distributable earnings | (20,497,908) | (8,927,290) |
| Return of capital | – | (32,068,527) |
| Net decrease in net assets from distributions | (20,497,908) | (40,995,817) |
| Change in net assets | 16,194,453 | (56,535,236) |
| Net Assets: | ||
| Beginning of period | 304,799,839 | 361,335,075 |
| End of period | $320,994,292 | $304,799,839 |
| 10 | abrdn Global Premier Properties Fund |
| Cash flows from operating activities: | |
| Net increase/(decrease) in net assets resulting from operations | $ 36,692,361 |
| Adjustments to reconcile net decrease in net assets resulting from operations to net cash provided by operating activities: | |
| Investments purchased | (117,586,482) |
| Investments sold and principal repayments | 125,633,560 |
| Increase in interest, dividends and other receivables | (569,356) |
| Increase in prepaid expenses | (47,178) |
| Increase in interest payable on revolving credit facility | 20,131 |
| Decrease in accrued investment advisory fees payable | (1,883) |
| Increase in other accrued expenses | 88,721 |
| Net change in unrealized appreciation of investments | (40,553,817) |
| Net change in unrealized depreciation on foreign currency translations | 2,128 |
| Net realized loss on investments transactions | 7,884,297 |
| Net cash provided by operating activities | 11,562,482 |
| Cash flows from financing activities: | |
| Decrease in payable to custodian | $ (11,709) |
| Increase in line of credit payable | 8,979,825 |
| Distributions paid to shareholders | (20,497,908) |
| Net cash used in financing activities | (11,529,792) |
| Effect of exchange rate on cash | 295 |
| Net change in cash | 32,985 |
| Unrestricted and restricted cash and foreign currency, beginning of period | – |
| Unrestricted and restricted cash and foreign currency, end of period | $32,985 |
| Supplemental disclosure of cash flow information: | |
| Cash paid for interest and fees on borrowing | $2,460,827 |
| abrdn Global Premier Properties Fund | 11 |
| For the Six-Month Period Ended April 30, | For the Fiscal Years Ended October 31, | |||||
| 2024 (unaudited) | 2023 | 2022 | 2021 | 2020 | 2019 | |
| PER SHARE OPERATING PERFORMANCE(a): | ||||||
| Net asset value per common share, beginning of period | $3.57 | $4.23 | $6.84 | $5.23 | $7.28 | $6.14 |
| Net investment income | 0.05 | 0.09 | 0.12 | 0.13 | 0.13 | 0.16 |
| Net realized and unrealized gains/(losses) on investments and foreign currency transactions | 0.38 | (0.27) | (2.25) | 1.96 | (1.70) | 1.55 |
| Total from investment operations applicable to common shareholders | 0.43 | (0.18) | (2.13) | 2.09 | (1.57) | 1.71 |
| Distributions to common shareholders from: | ||||||
| Net investment income | (0.24) | (0.10) | (0.07) | (0.16) | (0.05) | (0.42) |
| Return of capital | – | (0.38) | (0.41) | (0.32) | (0.43) | (0.15) |
| Total distributions | (0.24) | (0.48) | (0.48) | (0.48) | (0.48) | (0.57) |
| Net asset value per common share, end of period | $3.76 | $3.57 | $4.23 | $6.84 | $5.23 | $7.28 |
| Market price, end of period | $3.69 | $3.29 | $3.97 | $6.56 | $4.36 | $6.46 |
| Total Investment Return Based on(b): | ||||||
| Market price | 19.52% | (6.58%) | (33.80%) | 62.89% | (25.81%) | 32.04% |
| Net asset value | 12.23% | (4.86%) | (32.36%) | 41.59% | (21.03%) | 30.38% |
| Ratio to Average Net Assets Applicable to Common Shareholders/Supplementary Data: | ||||||
| Net assets applicable to common shareholders, end of period (000 omitted) | $320,994 | $304,800 | $361,335 | $583,883 | $446,533 | $621,927 |
| Average net assets applicable to common shareholders (000 omitted) | $344,892 | $361,732 | $498,916 | $547,641 | $518,462 | $563,168 |
| Net operating expenses, net of fee waivers/recoupments | 2.64%(c) | 2.22% | 1.62% | 1.40% | 1.27% | 1.37% |
| Net operating expenses, excluding fee waivers | 2.96%(c) | 2.48% | 1.89% | 1.59% | 1.36% | 1.42% |
| Net operating expenses, net of fee waivers and excluding interest expense | 1.19%(c) | 1.19% | 1.19% | 1.19% | 1.19% | 1.19% |
| Net Investment income | 2.33%(c) | 2.22% | 2.05% | 1.99% | 2.12% | 2.45% |
| Portfolio turnover | 27%(d) | 44% | 41% | 36% | 30% | 45% |
| Line of credit payable outstanding (000 omitted) | $88,790 | $79,810 | $65,048 | $106,848 | $30,415 | $37,522 |
| Asset coverage ratio on line of credit payable at period end(e) | 462% | 482% | 655% | 646% | 1,568% | 1,757% See Accompanying Notes to Financial Statements. |
| 12 | abrdn Global Premier Properties Fund |
| For the Six-Month Period Ended April 30, | For the Fiscal Years Ended October 31, | |||||
| 2024 (unaudited) | 2023 | 2022 | 2021 | 2020 | 2019 | |
| Asset coverage per $1,000 on line of credit payable at period end | $4,615 | $4,819 | $6,555 | $6,465 | $15,681 | $17,575 |
| (a) | Based on average shares outstanding. |
| (b) | Total investment return is calculated assuming a purchase of common stock on the first day and a sale on the last day of each reporting period. Dividends and distributions, if any, are assumed, for purposes of this calculation, to be reinvested at prices obtained under the Fund’s dividend reinvestment plan. Total investment return does not reflect brokerage commissions. |
| (c) | Annualized. |
| (d) | Not annualized. |
| (e) | Asset coverage ratio is calculated by dividing net assets plus the amount of any borrowings, for investment purposes by the amount of the Revolving Credit Facility. |
| abrdn Global Premier Properties Fund | 13 |
April 30, 2024
| 14 | abrdn Global Premier Properties Fund |
April 30, 2024
| Security Type | Standard Inputs |
| Foreign equities utilizing a fair value factor | Depositary receipts, indices, futures, sector indices/ETFs, exchange rates, and local exchange opening and closing prices of each security. |
| Investments, at Value | Level 1 – Quoted Prices | Level 2 – Other Significant Observable Inputs | Level 3 – Significant Unobservable Inputs | Total |
| Assets | ||||
| Investments in Securities | ||||
| Common Stocks | $284,335,152 | $123,966,449 | $– | $408,301,601 |
| Mutual Funds | 949,786 | – | – | 949,786 |
| Short-Term Investment | 3,416,318 | – | – | 3,416,318 |
| Total Investments | $288,701,256 | $123,966,449 | $– | $412,667,705 |
| Total Investment Assets | $288,701,256 | $123,966,449 | $– | $412,667,705 |
| abrdn Global Premier Properties Fund | 15 |
April 30, 2024
| 16 | abrdn Global Premier Properties Fund |
April 30, 2024
| abrdn Global Premier Properties Fund | 17 |
April 30, 2024
| Amount Fiscal Year 2021 (Expires 10/31/24) | $1,046,700 | |
| Amount Fiscal Year 2022 (Expires 10/31/25) | $1,378,125 | |
| Amount Fiscal Year 2023 (Expires 10/31/26) | $967,158 | |
| Amount Fiscal Year 2024 (Expires 10/31/27) | $560,801 | |
| Total* | $3,952,784 |
| * | Amounts reported are due to expire throughout the respective 3-year expiration period presented above. |
| 18 | abrdn Global Premier Properties Fund |
April 30, 2024
| abrdn Global Premier Properties Fund | 19 |
April 30, 2024
| 20 | abrdn Global Premier Properties Fund |
April 30, 2024
| Tax Cost of Securities | Unrealized Appreciation | Unrealized Depreciation | Net Unrealized Appreciation/ (Depreciation) |
| $409,411,345 | $39,900,411 | $(36,644,051) | $3,256,360 |
| abrdn Global Premier Properties Fund | 21 |
| 22 | abrdn Global Premier Properties Fund |
| abrdn Global Premier Properties Fund | 23 |
Stephen Bird
Todd Reit
John Sievwright
Nancy Yao
1 George Street
Edinburgh, EH2 2LL
United Kingdom
1900 Market Street, Suite 200
Philadelphia, PA19103
1900 Market Street, Suite 200
Philadelphia, PA 19103
One Congress Street, Suite 1
Boston, MA 02114-2016
P.O. Box 43006
Providence, RI 02940-3078
1601 Market Street
Philadelphia, PA 19103
1900 K Street N.W.
Washington D.C. 20006
1900 Market Street, Suite 200
Philadelphia, PA 19103
1-800-522-5465
Investor.Relations@abrdn.com

(b) Not applicable.
Item 2. Code of Ethics.
This item is inapplicable to semi-annual report on Form N-CSR.
Item 3. Audit Committee Financial Expert.
This item is inapplicable to semi-annual report on Form N-CSR.
Item 4. Principal Accountant Fees and Services.
This item is inapplicable to semi-annual report on Form N-CSR.
Item 5. Audit Committee of Listed Registrants.
This item is inapplicable to semi-annual report on Form N-CSR.
Item 6. Schedule of Investments.
(a) Schedule of Investments in securities of unaffiliated issuers as of close of the reporting period is included as part of the Report to Shareholders filed under Item 1 of this Form N-CSR.
(b) Not applicable.
Item 7. Disclosure of Proxy Voting Policies and Procedures for Closed-End Management Investment Companies.
This item is inapplicable to semi-annual report on Form N-CSR.
Item 8. Portfolio Managers of Closed-End Management Investment Companies.
(a) Not applicable to semi-annual report on Form N-CSR.
(b) There has been no change, as of the date of this filing, in any of the portfolio managers identified in response to paragraph (a)(1)of this Item in the registrant’s most recently filed annual report on Form N-CSR.
Item 9. Purchases of Equity Securities by Closed-End Management Investment Company and Affiliated Purchasers.
| Period | (a) Total No. of Shares Purchased | (b) Average Price Paid per Share | (c) Total No. of Shares Purchased as Part of Publicly Announced Plans or Programs(1) | (d) Maximum No. of Shares that May Yet Be Purchased Under the Plans or Programs(1) | ||||||||||||
| Month #1 (Nov. 1, 2023 — Nov. 30, 2023) | — | — | — | 8,540,795 | ||||||||||||
| Month #2 (Dec. 1, 2023 — Dec. 31, 2023) | — | — | — | 8,540,795 | ||||||||||||
| Month #3 (Jan. 1, 2024 — Jan. 31, 2024) | — | — | — | 8,540,795 | ||||||||||||
| Month #4 (Feb. 1, 2024 — Feb. 29, 2024) | — | — | — | 8,540,795 | ||||||||||||
| Month #5 (Mar. 1, 2024 — Mar. 31, 2024) | — | — | — | 8,540,795 | ||||||||||||
| Month #5 (Apr. 1, 2024 — Apr. 30, 2024) | 8,540,795 | |||||||||||||||
| Total | — | — | — | |||||||||||||
| (1) | On June 13, 2018, the Board approved an open market share repurchase program (the “Program”). The Program allows the Fund to purchase, in the open market, its outstanding common shares, with the amount and timing of any repurchase determined at the discretion of the Fund’s investment adviser. Such purchases may be made opportunistically at certain discounts to NAV per share in the reasonable judgment of management based on historical discount levels and current market conditions. On a quarterly basis, the Fund’s Board will receive information on any transactions made pursuant to this policy during the prior quarter and management will post the number of shares repurchased on the Fund's website on a monthly basis. Under the terms of the Program, the Fund is permitted to repurchase up to 10% of its outstanding shares of common stock in the open market during any 12 month period. For the six-month period ended April 30, 2024, the Fund did not repurchase any shares through this program. |
Item 10. Submission of Matters to a Vote of Security Holders.
During the period ended April 30, 2024, there were no material changes to the procedures by which shareholders may recommend nominees to the Registrant’s Board of Trustees.
Item 11. Controls and Procedures.
| (a) | The Registrant’s principal executive and principal financial officers, or persons performing similar functions, have concluded that the Registrant’s disclosure controls and procedures (as defined in Rule 30a-3(c) under the Investment Company Act of 1940 (the “Act”) (17 CFR 270.30a-3(c))) are effective, as of a date within 90 days of the filing date of the report that includes the disclosure required by this paragraph, based on the evaluation of these controls and procedures required by Rule 30a-3(b) under the Act (17 CFR 270.30a3(b)) and Rule 13a-15(b) or 15d-15(b) under the Securities Exchange Act of 1934, as amended (17 CFR 240.13a-15(b) or 240.15d15(b)). |
| (b) | There were no changes in the Registrant’s internal control over financial reporting (as defined in Rule 30a-3(d) under the Act (17 CFR 270.30a-3(d))) that occurred during the period covered by this report that has materially affected, or is reasonably likely to materially affect, the Registrant’s internal control over financial reporting. |
Item 12. Disclosure of Securities Lending Activities for Closed-End Management Investment Companies
Not applicable
Item 13. Recovery of Erroneously Awarded Compensation
Not appliable
Item 14. Exhibits.
| (a)(1) | Not applicable. |
| (a)(2) | The certifications of the registrant as required by Rule 30a-2(a) under the Act are exhibits to this Form N-CSR. |
| (a)(3) | Not applicable. |
| (a)(4) | Change in Registrant’s independent public accountant. Not applicable. |
| (b) | The certifications of the registrant as required by Rule 30a-2(b) under the Act are exhibits to this Form N-CSR. |
SIGNATURES
Pursuant to the requirements of the Securities Exchange Act of 1934 and the Investment Company Act of 1940, the Registrant has duly caused this report to be signed on its behalf by the undersigned, thereunto duly authorized.
| abrdn Global Premier Properties Fund | ||
| By: | /s/ Alan Goodson | |
| Alan Goodson, | ||
| Principal Executive Officer of abrdn Global Dynamic Dividend Fund | ||
| Date: July 8, 2024 | ||
Pursuant to the requirements of the Securities Exchange Act of 1934 and the Investment Company Act of 1940, this report has been signed below by the following persons on behalf of the Registrant and in the capacities and on the dates indicated.
| By: | /s/ Alan Goodson | |
| Alan Goodson, | ||
| Principal Executive Officer of abrdn Global Premier Properties Fund | ||
| Date: July 8, 2024 | ||
| By: | /s/ Sharon Ferrari | |
| Sharon Ferrari, | ||
| Principal Financial Officer of abrdn Global Premier Properties Fund | ||
| Date: July 8, 2024 | ||