| | Independent NI 43-101 Technical Report AN UPDATED LIFE OF MINE PLAN ("LOMP") FOR CAMPBELL PIT AND PRE-FEASIBILITY STUDY FOR NAN AND GAN DEPOSITS Maracás Menchen Project, Bahia, Brazil Prepared by GE21 Consultoria Mineral on behalf of: Largo Inc. |
| | Issue Date: December 16th, 2021 Effective Date: October 10th, 2021 Qualified Persons: Porfírio Cabaleiro Rodriguez - BSc (Min Eng), FAIG Guilherme Gomides Ferreira - BSc (Min Eng), MAIG Fabio Valério Câmara Xavier - BsC (Geo), MAIG Marlon Sarges Ferreira - BsC (Geo), MAIG |
Authors | Porfirio Cabaleiro Rodriguez | Mining Engineer | BSc (Mine Eng), FAIG |
| Guilherme Gomides Ferreira | Mining Engineer | BSc (Mine Eng), MAIG |
| Fábio Valério Câmara Xavier | Geologist | BSc (Geo), MAIG |
| Marlon Sarges Ferreira | Geologist | BSc (Geo), MAIG |
Effective date: | October 10th, 2021 | |
| | | |
Issue date: | December 16th, 2021 | |
| | | |
GE21 Project no: | GE21_210606 | |
| | | |
Version: | Final | |
| | | |
Work directory: | S:\Projetos\Largo\210606-ReservasLargo\23_Relatorio | |
| | | |
Print date: | December 17, 2021 | |
| | | |
| | |
| | | |
Copies: | Largo Inc. | (1) | |
| | | | |
| GE21 Consultoria Mineral | (1) | |
Change Control
Version | Description | Authors | Date |
| | | |
| | | |
| | | |
Original document signed and sealed | Original document signed and sealed |
Porfírio Cabaleiro Rodriguez BSc (Mine Eng.), FAIG | Guilherme Gomides Ferreira BSc (Mine Eng.), MAIG |
Original document signed and sealed. | Original document signed and sealed |
Fabio Valério Câmara Xavier BSc (Geo.), MAIG | Marlon Sarges Ferreira BSc (Geo.), MAIG |
Date and Signature
This report, entitled "An Updated Life of Mine Plan ("LOMP") for Campbell Pit and Pre-Feasibility Study for Novo Amparo Norte ("NAN") and Gulçari A Norte ("GAN") Deposits, Maracás Menchen Project, Bahia, Brazil", having an effective date of October 10th, 2021, was prepared and signed by the following authors.
Dated in Belo Horizonte, Brazil, on December 16th, 2021.
Original document signed and sealed
|
Porfírio Cabaleiro Rodriguez, BSc (Mine Eng.), FAIG |
Original document signed and sealed
|
Guilherme Gomides Ferreira, BSc (Mine Eng.), MAIG |
Original document signed and sealed.
|
Fabio Valério Câmara Xavier, BSc (Geo.), MAIG |
Original document signed and sealed
|
Marlon Sarges Ferreira, BSc (Geo), MAIG |
QP CERTIFICATE OF PORFÍRIO CABALEIRO RODRIGUEZ
a) I, Porfírio Cabaleiro Rodriguez, am a Mining Engineer and Director for GE21 Consultoria Mineral, located at Avenida Afonso Pena, 3130 - 13º andar, Belo Horizonte, MG, Brazil, CEP 30.130-910.
b) This certificate applies to the Technical Report entitled "An Updated Life of Mine Plan ("LOMP") for Gulçari A ("Campbell Pit") and Pre-Feasibility Study for Novo Amparo Norte ("NAN") and Gulçari A Norte ("GAN") Deposits, Maracás Menchen Project, Bahia, Brazil" with an effective date of October 10th, 2021.
c) I hold the following academic qualifications: a B.A.Sc. in Mining Engineering from the Federal University of Minas Gerais, in Belo Horizonte, Brazil.
d) I am a professional Mining Engineer, with more than 43 years of experience in the mining industry. My relevant experience for the purpose of this Technical Report includes:
1986 to 2015 - Consultant, manager, and director with consulting engineering firms that specialize in technical studies and audits of mineral resource and reserves, mine planning, geometallurgy, pit optimization, and analysis of economic viability for many types of mineral deposits, including gold projects in their exploration and development phases, as well as producing gold mines.
2015 to present - Director of GE21 Consultoria Mineral, which provides advice, assistance, and audits for the entire mining cycle, from defining strategies, generating and selecting targets and investments, mineral exploration, project development, geological assessments, resource reserve estimation for JORC and NI 43-101 reports, conceptual technical and economic studies, and economic feasibility.
e) I am a fellow of the Australian Institute of Geoscientists (#3708).
f) I meet all the education, work experience, and professional registration requirements of a "Qualified Person" as defined in section 1.1 of National Instrument 43-101.
g) I have not inspected the property that is the subject of this Technical Report.
h) I responsable for Technical Report and supervised the production of all sections of the document and am solely responsible for sections 2, 3, 13, 17,18, 19, 20, 21, 22, 23, 24 and jointly responsible for sections through 1, 25, 26 and 27 of this Technical Report.
i) I am independent of the Issuer, Largo Inc.
j) Previously, I have worked on the An Updated Mine Plan, Mineral Reserve and Preliminary Economic Assessment of The Inferred Resources (PEA) for the property that is the subject of this Technical Report and served as a QP for the NI 43-101 report on that document.
k) I have read National Instrument 43-101 and the parts of the Technical Report for which I am responsible have been prepared in compliance with this Instrument, including the CIM Definition Standards on Mineral Resources and Mineral Reserves.
l) At the effective date of the Technical Report, and at the date it was filed, to the best of my knowledge, information, and belief, the parts of the Technical Report for which I am responsible contain all scientific and technical information that is required to be disclosed to make the Technical Report not misleading.
Original document signed and sealed
Belo Horizonte, Brazil, on 16th December 2021.
QP CERTIFICATE OF GUILHERME GOMIDES FERREIRA
a) I, Guilherme Gomides Ferreira, am a Mining Engineer for GE21 Consultoria Mineral, located at Avenida Afonso Pena, 3130 − 12º andar, Belo Horizonte, MG, Brazil, CEP 30.130-910.
b) This certificate applies to the Technical Report entitled "An Updated Life of Mine Plan ("LOMP") for Campbell Pit and Pre-Feasibility Study for Novo Amparo Norte ("NAN") and Gulçari A Norte ("GAN") Deposits, Maracás Menchen Project, Bahia, Brazil" with an effective date of October 10th, 2021.
c) I hold the following academic qualifications: a B.A.Sc. in Mining Engineering from the Federal University of Minas Gerais, in Belo Horizonte, Brazil.
d) I am a professional Mining Engineer, with more than 16 years of experience in the mining industry. My relevant experience for the purpose of this Technical Report includes:
- 2006 to 2017- Mining Engineer at mining companies, developing technical studies of Mineral Reserves, mine planning, pit optimization, and economic analysis as well a producing iron ore and gold mine.
- 2017 to present - Manager of GE21 Consultoria Mineral, which provides advice, assistance, and audits for the entire mining cycle, from defining strategies, generating and selecting targets and investments, mineral exploration, project development, geological assessments, resource reserve estimation for JORC and NI 43-101 reports, conceptual technical and economic studies, and economic feasibility.
e) I am a member of the Australian Institute of Geoscientists (#7586).
f) I meet all the education, work experience, and professional registration requirements of a "Qualified Person" as defined in Section 1.1 of National Instrument 43-101.
g) I inspected between 27th to 29th of April 2021 the property that is the subject of this Technical Report.
m) I am jointly responsible for Sections 15, 16 and I jointly responsible for Sections through 1, 12, 25 and 26 of this Technical Report.
h) of this Technical Report.
i) I am independent of the Issuer, Largo Inc.
j) I have read National Instrument 43-101 and the parts of the Technical Report for which I am responsible have been prepared in compliance with this Instrument, including the CIM Definition Standards on Mineral Resources and Mineral Reserves.
k) At the effective date of the Technical Report, and at the date it was filed, to the best of my knowledge, information, and belief, the parts of the Technical Report for which I am responsible contain all scientific and technical information that is required to be disclosed to make the Technical Report not misleading.
Original document signed and sealed
Belo Horizonte, Brazil, on 16th December 2021.
QP CERTIFICATE OF FÁBIO VALÉRIO CÂMARA XAVIER
a) I, Fábio Valério Câmara Xavier, am a Geologist for GE21 Consultoria Mineral, located at Avenida Afonso Pena, 3130 − 12º andar, Belo Horizonte, MG, Brazil, CEP 30.130-910.
b) This certificate applies to the Technical Report entitled "An Updated Life of Mine Plan ("LOMP") for Gulçari A ("Campbell Pit") and Pre-Feasibility Study for Novo Amparo Norte ("NAN") and Gulçari A Norte ("GAN") Deposits, Maracás Menchen Project, Bahia, Brazil" with an effective date of October 10th, 2021.
c) I hold the following academic qualifications: a B.Sc. (Geology) Universidade Federal do Rio Grande do Norte (UFRN).
d) I am a professional Geologist, with more than 18 years of experience in the mining industry. My relevant experience for the purpose of this Technical Report includes:
• I have 7 years of experience as a specialist geologist on geotechnologies applied to mineral exploration and 11 years as a Mineral Resource Estimatior. My experience includes open pit and underground mines and considerable experience dealing with various commodities, such as phosphate, iron ore, gold and copper ore, vanadium, in addition to rare earth elements, among others.
e) I am a member of the Australian Institute of Geoscientists (#5179).
f) I meet all the education, work experience, and professional registration requirements of a "Qualified Person" as defined in Section 1.1 of National Instrument 43-101.
g) I inspected between 27th to 29th of April 2021 the property that is the subject of this Technical Report.
h) I am jointly responsible for Sections 12 of this Technical Report.
i) I am independent of the Issuer, Largo Inc.
j) I have read National Instrument 43-101 and the parts of the Technical Report for which I am responsible have been prepared in compliance with this Instrument, including the CIM Definition Standards on Mineral Resources and Mineral Reserves.
k) At the effective date of the Technical Report, and at the date, it was filed, to the best of my knowledge, information, and belief, the parts of the Technical Report for which I am responsible contain all scientific and technical information that is required to be disclosed to make the Technical Report not misleading.
Original document signed and sealed
Belo Horizonte, Brazil, on 16th December 2021.
QP CERTIFICATE OF MARLON SARGES FERREIRA
a) I, Marlon Sarges Ferreira, am a Geologist for GE21 Consultoria Mineral, located at Avenida Afonso Pena, 3130 − 12º andar, Belo Horizonte, MG, Brazil, CEP 30.130-910.
b) This certificate applies to the Technical Report entitled "An Updated Life of Mine Plan ("LOMP") for Gulçari A ("Campbell Pit") and Pre-Feasibility Study for Novo Amparo Norte ("NAN") and Gulçari A Norte ("GAN") Deposits, Maracás Menchen Project, Bahia, Brazil" with an effective date of October 10th, 2021.
c) I hold the following academic qualifications: a B.A.Sc. in Geology from Universidade Federal do Pará, Brazil and a masters degree in Mineral Engineering from Universidade Federal de Ouro Preto, Brazil.
d) I am a professional geologist, with more than 15 years of experience in the mining industry. My relevant experience for the purpose of this Technical Report includes:
- 2006 to 2011 - Geologist at various consulting companies, developing technical studies of exploration, open pit design, projects and validation of mineral resources for mining negotiations;
- 2011 and 2015 - Geologist at a mining company responsible by long- term mineral resource supporting company strategies decisions and development of new business;
- 2015 to present - Geologist which provides advice, assistance, and audits for the entire mining cycle, from defining strategies, generating and selecting mineral targets, mineral exploration, geological assessments, resource reserve estimation for JORC and NI 43-101 reports in level of conceptual technical and economic studies, and economic feasibility.
e) I am a member of the Australian Institute of Geoscientists (#6914).
f) I meet all the education, work experience, and professional registration requirements of a "Qualified Person" as defined in Section 1.1 of National Instrument 43-101.
g) I am jointly responsible for Sections 5, 6, 7, 8, 9, 10, 11 and 14, and jointly responsible for Sections through 1 and 25 of this Technical Report.
h) I am independent of the Issuer, Largo Inc.
i) I have read National Instrument 43-101 and the parts of the Technical Report for which I am responsible have been prepared in compliance with this Instrument, including the CIM Definition Standards on Mineral Resources and Mineral Reserves.
j) At the effective date of the Technical Report, and at the date it was filed, to the best of my knowledge, information, and belief, the parts of the Technical Report for which I am responsible contain all scientific and technical information that is required to be disclosed to make the Technical Report not misleading.
Original document signed and sealed
Belo Horizonte, Brazil, on 16th December 2021.
IMPORTANT NOTICE
This report was prepared as National Instrument 43-101 Technical Report for Largo Inc. (Largo or the Company) by GE21 Consultoria Mineral Ltda. (GE21) as part of a team of consultants contracted by Largo. The quality of information, conclusions, and estimates contained herein is consistent with the level of effort involved in the report authors' services, based on i) information available at the time of preparation, ii) data supplied by outside sources, and iii) the assumptions, conditions, and qualifications set forth in this report. This report is intended for use by Largo subject to terms and conditions of its individual contracts with the report authors and to the relevant securities legislation. The contracts between Largo and the authors allow Largo to file this report as a Technical Report with Canadian securities regulatory authorities, pursuant to National Instrument 43-101, Standards of Disclosure for Mineral Projects. Except for the purposes legislated under Canadian provincial and territorial securities laws, any other use of this report by any third party is at that party's sole risk. The responsibility for this disclosure remains with Largo. GE21 is under no obligation to update this Technical Report, except as may be agreed to between Largo and GE21 by contract from time to time. The user of this document should ensure that this is the most recent Technical Report for the property as it is not valid if a new Technical Report has been issued.
Currency is expressed in U.S. dollars and metric units are used, unless otherwise stated.
© 2021 GE21 Consultoria Mineral Ltda.
This document, as a collective work of content and the coordination, arrangement and any enhancement of said content, is protected by copyright held by GE21 Consultoria Mineral Ltda.
| 1 EXECUTIVE SUMMARY | 30 |
| | |
| 1.1 Qualified Persons, Experience, and Independence | 30 |
| | |
| 1.2 Introduction | 30 |
| | |
| 1.3 Reliance on Other Experts | 31 |
| | |
| 1.4 Property Description and Location | 31 |
| | |
| 1.5 Accessibility, Climate, Local Resources, Infrastructure, and Physiography | 31 |
| | |
| 1.6 History | 32 |
| | |
| 1.7 Geological Setting and Mineralization | 32 |
| | |
| 1.8 Deposit Types | 33 |
| | |
| 1.9 Exploration | 33 |
| | |
| 1.10 Drilling | 33 |
| | |
| 1.11 Sample Preparation, Analyses, and Security | 34 |
| | |
| 1.12 Data Verification | 34 |
| | |
| 1.13 Mineral Processing and Metallurgical Testing | 35 |
| | |
| 1.14 Mineral Resource Estimates | 35 |
| | |
| 1.15 Mineral Reserve Estimates | 38 |
| | |
| 1.16 Mining Methods | 41 |
| | |
| 1.17 Recovery Methods | 42 |
| | |
| 1.18 Project Infrastructure | 42 |
| | |
| 1.19 Market Studies and Contracts | 43 |
| | |
| 1.19.1 Demand | 43 |
| | |
| 1.19.2 Vanadium Prices | 44 |
| | |
| 1.19.3 Ilmenite Prices | 45 |
| | |
| 1.19.4 Titanium Pigment Prices | 46 |
| | |
| 1.19.5 Outlook | 47 |
| | |
| 1.19.6 Contracts | 47 |
| | |
| 1.19.7 Selling Prices adopted | 47 |
| | |
| 1.20 Capital and Operating Costs | 47 |
| | |
| 1.20.1 Sustaining Capital Cost | 50 |
| | |
| 1.21 Economic Analysis | 50 |
| | |
| 1.22 Interpretation and Conclusions | 50 |
| | |
| 2 INTRODUCTION | 52 |
| | |
| 2.1 Qualifications, Experience, and Independence | 52 |
| | |
| 2.2 Effective Date | 53 |
| 2.3 Units of Measurement | 53 |
| | |
| 3 RELIANCE ON OTHER EXPERTS | 54 |
| | |
| 4 PROPERTY DESCRIPTION AND LOCATION | 55 |
| | |
| 4.1 Location | 55 |
| | |
| 4.2 Mineral Title in Brazil | 56 |
| | |
| 4.3 Mining Legislation, Administration and Rights | 57 |
| | |
| 4.4 Mineral Exploration Licenses | 58 |
| | |
| 4.5 Mineral Concessions | 58 |
| | |
| 4.6 Annual Fees and Reporting Requirements | 58 |
| | |
| 4.7 Largo Mineral Tenure | 58 |
| | |
| 4.8 Environmental Liabilities and Permits | 63 |
| | |
| 5 ACCESSIBILITY, CLIMATE, LOCAL RESOURCES, INFRASTRUCTURE, AND PHYSIOGRAPHY | 65 |
| | |
| 5.1 Access | 65 |
| | |
| 5.2 Infrastructure | 65 |
| | |
| 5.3 Climate | 65 |
| | |
| 5.4 Landscape | 66 |
| | |
| 5.5 Vegetation | 66 |
| | |
| 6 HISTORY | 67 |
| | |
| 6.1 Summary | 67 |
| | |
| 6.2 Exploration History | 68 |
| | |
| 6.3 Historical Drilling | 71 |
| | |
| 6.4 Historical Resource Estimates - Odebrecht, 1986 | 75 |
| | |
| 6.5 Historical Technical and Environmental Studies | 76 |
| | |
| 7 GEOLOGICAL SETTING AND MINERALIZATION | 78 |
| | |
| 7.1 Regional Geology | 78 |
| | |
| 7.2 Rio Jacaré Intrusion | 79 |
| | |
| 7.3 Property Geology | 81 |
| | |
| 7.4 Individual Deposits | 85 |
| | |
| 7.4.1 Gulçari A Deposit | 86 |
| | |
| 7.4.2 Gulçari A Norte (GAN) Deposit | 88 |
| | |
| 7.4.3 Novo Amparo Norte (NAN) Deposit | 90 |
| | |
| 7.4.4 São José (SJO) Deposit | 92 |
| | |
| 7.4.5 Novo Amparo (NAO) Deposit | 94 |
| | |
| 7.5 Mineralization | 94 |
| | |
| 7.6 Oxidation | 96 |
| | |
| 8 DEPOSIT TYPE | 98 |
| 8.1 Mineralization Styles | 98 |
| | |
| 8.2 Conceptual Models | 99 |
| | |
| 9 EXPLORATION | 102 |
| | |
| 9.1 2006 Exploration Program - Largo Inc. (Micon, 2007) | 102 |
| | |
| 9.2 Previous Geophysical Surveys | 103 |
| | |
| 9.3 Discussion of Present Geophysical Techniques | 103 |
| | |
| 9.4 Geophysical Survey Results | 104 |
| | |
| 9.5 2008 Exploration Program (RungePincockMinarco, 2012) | 104 |
| | |
| 9.6 2011-2012 Exploration Program (RungePincockMinarco, 2012) | 104 |
| | |
| 9.7 2012 Infill Drill Program (Micon, 2016) | 105 |
| | |
| 9.8 2015 Exploration Program (Micon, 2016) | 105 |
| | |
| 9.8.1 Davis Tube Tests | 105 |
| | |
| 9.9 2018-2019 Exploration Program | 106 |
| | |
| 9.10 2020 Exploration Program | 108 |
| | |
| 9.11 Topography Survey | 110 |
| | |
| 10 DRILLING | 112 |
| | |
| 10.1 Drilling by Previous Operators (Micon 2006 and 2007) | 112 |
| | |
| 10.2 2007 Largo Drill Program | 112 |
| | |
| 10.3 2008 Largo Drill Program | 117 |
| | |
| 10.4 2011-2012 Largo Drill Program (RungePincockMinarco, 2012) | 119 |
| | |
| 10.5 2012 Largo Infill Drill Program | 127 |
| | |
| 10.5.1 Logging (Micon, 2016.) | 130 |
| | |
| 10.6 2018 Largo Infill Drill Program (Campbell Pit) | 131 |
| | |
| 10.6.1 Logging | 133 |
| | |
| 10.7 2018 Largo Exploration Drill Program | 133 |
| | |
| 10.7.1 Logging | 137 |
| | |
| 10.8 2019 Largo Exploration Drill Program | 137 |
| | |
| 10.9 2020 Largo Drill Program | 147 |
| | |
| 11 SAMPLE PREPARATION, ANALYSES, AND SECURITY | 160 |
| | |
| 11.1 Sampling Method | 160 |
| | |
| 11.1.1 Previous Operators | 160 |
| | |
| 11.1.2 2006 and Early 2007 Re-logging | 161 |
| | |
| 11.1.3 2007 Exploration Drill Program | 161 |
| | |
| 11.1.4 2018 Largo Core Drill Program | 162 |
| | |
| 11.1.5 2019 Largo Core Drill Program | 163 |
| | |
| 11.1.6 2020 Largo Core Drilling Program | 163 |
| | |
| 11.2 Chemical Sample Preparation, Analyses and Security | 164 |
| 11.2.1 Pre-2006 Analytical Work | 164 |
| | |
| 11.2.2 Largo Analytical Work (2007, 2008 and 2011-2012) | 165 |
| | |
| 11.2.3 2015 Davis tube work | 165 |
| | |
| 11.2.4 2018-2019 Chemical Assay Preparation, Analyses and Security | 169 |
| | |
| 11.2.5 2020 Chemical Assay Preparation, Analyses and Security | 169 |
| | |
| 11.3 Density Determination | 170 |
| | |
| 11.3.1 Until 2015 | 170 |
| | |
| 11.3.2 2020 Determination Density (by Pycnometer) | 172 |
| | |
| 11.4 Largo QAQC program | 173 |
| | |
| 11.4.1 Pre-2006 program | 173 |
| | |
| 11.4.2 2006 program | 173 |
| | |
| 11.4.3 Early 2007 | 174 |
| | |
| 11.4.4 2007 Campaign | 176 |
| | |
| 11.4.5 Coffey Analysis | 183 |
| | |
| 11.4.6 Coffey Verification | 183 |
| | |
| 11.5.1 2021 GE21 QAQC Analysis | 185 |
| | |
| 11.5.2 Qualified Person's opinion | 197 |
| | |
| 12 DATA VERIFICATION | 198 |
| | |
| 12.1 Site visit | 198 |
| | |
| 12.1.1 Topographic survey | 198 |
| | |
| 12.1.2 Drilling | 198 |
| | |
| 12.1.3 Geological Map | 198 |
| | |
| 12.1.4 Core Shed | 199 |
| | |
| 12.1.5 Operating procedures | 201 |
| | |
| 12.1.6 Geological Description | 202 |
| | |
| 12.1.7 QAQC | 202 |
| | |
| 12.1.8 Density | 203 |
| | |
| 12.1.9 Internal Laboratory | 203 |
| | |
| 12.1.10 Drilling Database | 203 |
| | |
| 12.2 Data received for estimate | 203 |
| | |
| 12.2.1 Database | 204 |
| | |
| 12.3 Qualified Person's Opinion | 204 |
| | |
| 13 MINERAL PROCESSING AND METALLURGICAL TESTING | 205 |
| | |
| 13.1 Introduction | 205 |
| | |
| 13.2 Process Technical and Economical References | 205 |
| | |
| 13.3 Metallurgical Recovery of Vanadium and Titanium of Ore from Campbell Pit | 206 |
| | |
| 13.3.1 Sample Characterization - Campbell Pit | 207 |
| | |
| 13.3.2 Dry Magnetic Separation -Campbell Pit | 207 |
| 13.3.3 Wet Magnetic Separation -Campbell Pit | 208 |
| | |
| 13.3.4 Flotation -Campbell Pit | 210 |
| | |
| 13.3.5 Global Recovery of Titanium - Pit Campbell | 212 |
| | |
| 13.4 Metallurgical Recovery of Vanadium and Titanium of Ore from Gulçari A Norte (GAN) | 212 |
| | |
| 13.4.1 Sample Characterization - Gulçari A Norte (GAN) | 213 |
| | |
| 13.4.2 Dry Magnetic Separation Results - Gulçari A Norte (GAN) | 216 |
| | |
| 13.4.3 Wet Magnetic Separation - Gulçari A Norte (GAN) | 218 |
| | |
| 13.4.4 Calcination - Gulçari A Norte (GAN) | 219 |
| | |
| 13.4.5 Leaching and Chemical Treatment - Gulçari A Norte (GAN) | 221 |
| | |
| 13.4.6 Global Recovery of Vanadium - Gulçari A Norte (GAN) | 222 |
| | |
| 13.4.7 Recovery of Titanium - Gulçari A Norte (GAN) | 222 |
| | |
| 13.5 Metallurgical Recovery of Vanadium and Titanium of Ore from Novo Amparo Norte | 228 |
| | |
| 13.5.1 Sample Characterization - Novo Amparo Norte | 229 |
| | |
| 13.5.2 Dry Magnetic Separation Tests - Novo Amparo Norte | 232 |
| | |
| 13.5.3 Wet Magnetic Separation Assays - Novo Amparo Norte | 234 |
| | |
| 13.5.4 Calcination Tests - Novo Amparo Norte | 235 |
| | |
| 13.5.5 Leaching and Chemical Treatment - Novo Amparo Norte | 238 |
| | |
| 13.5.6 Global Recovery of Vanadium - Novo Amparo Norte | 239 |
| | |
| 13.5.7 Metallurgical Recovery of Vanadium and Titanium of Ore from Novo Amparo | 240 |
| | |
| 13.6 Recomendations | 245 |
| | |
| 13.7 Qualified Person's Opinion | 245 |
| | |
| 14 MINERAL RESOURCE ESTIMATION | 246 |
| | |
| 14.1 Introduction | 246 |
| | |
| 14.2 Database | 246 |
| | |
| 14.3 Geological Modelling | 248 |
| | |
| 14.4 Composite Regularization | 253 |
| | |
| 14.5 Exploratory Data Analysis (EDA) | 254 |
| | |
| 14.6 Density | 265 |
| | |
| 14.7 Variographic Analysis | 267 |
| | |
| 14.8 Block Model | 270 |
| | |
| 14.9 Grade Interpolation | 271 |
| | |
| 14.10 Estimate Validation | 273 |
| | |
| 14.11 Mineral Resource Statement | 283 |
| | |
| 14.11.1 TiO2 Resource in Non-Magnetic Tailings | 286 |
| | |
| 14.11.2 Non-Magnetic Ponds Resource Estimate | 289 |
| | |
| 14.12 Qualified Person's Opinion | 290 |
| 15 MINERAL RESERVE ESTIMATES | 291 |
| | |
| 15.1 Summary | 291 |
| | |
| 15.2 Disclosure | 293 |
| | |
| 15.3 Pit Optimization | 293 |
| | |
| 15.3.1 Campbell Pit | 295 |
| | |
| 15.3.2 GAN Deposit | 296 |
| | |
| 15.3.3 NAN Deposit | 298 |
| | |
| 15.4 Ultimate Pit Design | 299 |
| | |
| 15.4.1 Campbell-GAN Pit | 299 |
| | |
| 15.4.2 NAN Pit | 302 |
| | |
| 15.5 TiO2 Reserves in Non-Magnetic Tailings | 304 |
| | |
| 15.5.1 Reconciliation data and topographic surveying of ponds | 304 |
| | |
| 15.5.2 Non-Magnetic Ponds Reserves Estimate | 307 |
| | |
| 15.5.3 Optimization risks assessment | 308 |
| | |
| 15.6 Qualified Person's Opinion | 308 |
| | |
| 16 MINING METHODS | 310 |
| | |
| 16.1 Geotechnical Studies | 310 |
| | |
| 16.1.1 Introduction | 310 |
| | |
| 16.1.2 Local Conditions | 310 |
| | |
| 16.1.3 Geotechnical Analysis | 312 |
| | |
| 16.1.4 Disruption mechanisms | 317 |
| | |
| 16.1.5 Kinematic Analysis | 317 |
| | |
| 16.1.6 Recommended geometry for slopes | 325 |
| | |
| 16.1.7 Final Considerations and Recommendations | 326 |
| | |
| 16.2 Mine Schedule | 327 |
| | |
| 16.2.1 Mining Scheduling Production | 327 |
| | |
| 16.2.2 Non-Magnetic Tailings Reclamation | 339 |
| | |
| 16.3 Waste Disposal | 340 |
| | |
| 16.4 Mining Fleet Sizing | 344 |
| | |
| 17 RECOVERY METHODS | 347 |
| | |
| 17.1 Process Description | 347 |
| | |
| 17.2 Crushing | 350 |
| | |
| 17.3 Dry Magnetic Separation | 350 |
| | |
| 17.4 Milling | 350 |
| | |
| 17.5 Magnetite Concentrate Filtering | 350 |
| | |
| 17.6 Ilmenite Flotation | 351 |
| | |
| 17.7 Ilmenite Concentrate Filtering | 351 |
| 17.8 Roasting (Kiln) | 351 |
| | |
| 17.9 Leaching | 351 |
| | |
| 17.10 Precipitation | 352 |
| | |
| 17.11 Evaporation | 352 |
| | |
| 17.12 AMV Drying | 353 |
| | |
| 17.13 Ammonia Removal | 353 |
| | |
| 17.14 Melting | 353 |
| | |
| 17.15 V2O5 Screening | 353 |
| | |
| 17.16 V2O3 Reactor | 353 |
| | |
| 17.17 Titanium Pigment Processes | 354 |
| | |
| 17.17.1 Ore storage | 354 |
| | |
| 17.17.2 Drying and milling | 354 |
| | |
| 17.17.3 Digestion and black liquor filtration | 354 |
| | |
| 17.17.4 FeSO4 crystallization | 354 |
| | |
| 17.17.5 Hydrolysis | 355 |
| | |
| 17.17.6 Calcination | 355 |
| | |
| 17.17.7 Surface treatment | 355 |
| | |
| 17.17.8 Micronization and Shipment | 355 |
| | |
| 17.17.9 Acid regeneration | 355 |
| | |
| 18 PROJECT INFRASTRUCTURE | 356 |
| | |
| 18.1 Water pumping System | 356 |
| | |
| 18.2 Process Water | 356 |
| | |
| 18.3 Water Treatment | 356 |
| | |
| 18.4 Sewage Treatment | 357 |
| | |
| 18.5 Fuel and Lubricant Storage and Distribution | 357 |
| | |
| 18.6 Compressed Air | 357 |
| | |
| 18.6.1 Air Emissions and Air Quality Monitoring | 357 |
| | |
| 18.7 Heating | 358 |
| | |
| 18.8 Power Supply | 358 |
| | |
| 18.9 Buildings | 360 |
| | |
| 18.10 Assay Laboratory | 363 |
| | |
| 18.11 Miscellaneous Buildings | 363 |
| | |
| 18.12 Explosives Magazine | 363 |
| | |
| 18.13 Communications | 363 |
| | |
| 18.14 Roads | 363 |
| | |
| 18.15 Tailings Facility | 364 |
| | |
| 18.15.1 Tailings Disposal Ponds | 364 |
| 18.16 Waste Management | 366 |
| | |
| 18.17 Future Developments | 368 |
| | |
| 18.17.1 Ilmenite Concentration Plant ("Ilmenite Plant") | 368 |
| | |
| 18.17.2 Expansion Phase 4 - 15,900 t/year of V2O5 | 371 |
| | |
| 18.17.3 TiO2 Pigment and Ammonium Sulfate Plants | 373 |
| | |
| 18.17.4 Other Future Infrastructure | 374 |
| | |
| 19 MARKET STUDY AND CONTRACTS | 376 |
| | |
| 19.1 Information Sources | 376 |
| | |
| 19.2 The Market for Vanadium | 377 |
| | |
| 19.2.1 Demand | 378 |
| | |
| 19.2.2 International Trade | 379 |
| | |
| 19.2.3 Vanadium Prices | 379 |
| | |
| 19.2.4 Ilmenite Prices | 380 |
| | |
| 19.2.5 Titanium Pigment Prices | 381 |
| | |
| 19.3 Outlook | 382 |
| | |
| 19.4 Contracts | 382 |
| | |
| 19.5 Selling Prices adopted | 383 |
| | |
| 20 ENVIRONMENTAL STUDIES, PERMITING AND SOCIAL OR COMMUNITY IMPACT | 384 |
| | |
| 20.1 Regulatory Framework Overview | 384 |
| | |
| 20.2 Environmental Permitting Status | 386 |
| | |
| 20.3 Environmental Baseline Conditions | 386 |
| | |
| 20.3.1 Climate and Physiography | 387 |
| | |
| 20.3.2 Water Resources | 387 |
| | |
| 20.3.3 Flora Characterization | 388 |
| | |
| 20.3.4 Fauna Characterization | 392 |
| | |
| 20.3.5 Aquatic Biota | 394 |
| | |
| 20.4 Social and Economic Baseline | 396 |
| | |
| 20.4.1 Populations Dynamics | 397 |
| | |
| 20.4.2 Employment Structure and Unemployment Rate | 397 |
| | |
| 20.4.3 Economic Aspects | 398 |
| | |
| 20.4.4 Land Use and Occupation | 399 |
| | |
| 20.4.5 Villages around the Project | 399 |
| | |
| 20.4.6 Historical and Cultural Heritage | 404 |
| | |
| 20.4.7 Living Standards | 405 |
| | |
| 20.4.8 Education | 406 |
| | |
| 20.4.9 Health | 406 |
| | |
| 20.4.10 Housing Conditions and Infrastructure | 407 |
| | |
| 20.4.11 Leisure, Tourism and Culture | 408 |
| 20.4.12 Public Safety | 408 |
| | |
| 20.4.13 Property Disputes and Rural Settling | 409 |
| | |
| 20.4.14 Water Supply | 409 |
| | |
| 20.5 Environmental Impact Assessment, Mitigation and Compensation | 409 |
| | |
| 20.5.1 Physical Environment | 410 |
| | |
| 20.5.2 Biotic Environment | 420 |
| | |
| 20.5.3 Environmental Mitigation | 421 |
| | |
| 20.6 Social and Economic Environment | 422 |
| | |
| 20.6.1 Job and Income Generation | 422 |
| | |
| 20.6.2 Boosting the Local and Regional Economy | 423 |
| | |
| 20.6.3 Improvement of Access and Roads | 423 |
| | |
| 20.6.4 Pressure on the Water Supply System | 424 |
| | |
| 20.7 Geotechnics And Hydrology | 424 |
| | |
| 20.7.1 Hydrological Studies | 424 |
| | |
| 20.7.2 Geological/Geotechnical Characterization of the Overall Project Area | 428 |
| | |
| 20.8 Current Activities and Plans | 434 |
| | |
| 20.8.1 Project Organization and Sustainability Team | 434 |
| | |
| 20.8.2 Equator Principles Audit Review | 435 |
| | |
| 20.8.3 Socio-Environmental Action Plan and Environmental Management System | 435 |
| | |
| 21 CAPITAL AND OPERATING COSTS | 440 |
| | |
| 21.1 Mining Costs | 441 |
| | |
| 21.2 Processing Plant and Infrastructure | 441 |
| | |
| 21.2.1 Phase 1: Ilmenite Plant 150 Kt/year Concentrate + Titanium Pigment Plant 30 kt/year Concentrate - Construction (2022-2023); | 442 |
| | |
| 21.2.2 Phase 2: Titanium Pigment Processing Plant + Vanadium Trioxide Plant Expansions (2024-2025); | 444 |
| | |
| 21.2.3 Phase 3: Titanium Pigment Processing + Ilmenite Concentration Plant Expansions (2026-2028) | 446 |
| | |
| 21.2.4 Phase 4: Vanadium Expansion Second Kiln (2029-2032). | 447 |
| | |
| 21.3 Sustaining Capital Cost | 448 |
| | |
| 21.4 CAPEX Summary | 448 |
| | |
| 21.5 Operating Cost Estimate | 450 |
| | |
| 21.5.1 Mining Cost Contracted | 450 |
| | |
| 21.5.1 Processing Cost | 451 |
| | |
| 21.5.2 General and Administration | 452 |
| | |
| 22 ECONOMICAL ANALYSIS | 453 |
| | |
| 22.1 Taxes | 453 |
| | |
| 22.2 Royalties | 453 |
| | |
| 22.3 Depreciation | 454 |
| 22.4 Discounted Cash Flow | 454 |
| | |
| 22.5 Internal Rate Return and Payback Analysis | 458 |
| | |
| 22.6 Sensitivity Analysis | 458 |
| | |
| 23 ADJACENT PROPERTIES | 460 |
| | |
| 24 OTHER RELEVANT DATA INFORMATION | 461 |
| | |
| 25 INTERPRETATION AND CONCLUSIONS | 462 |
| | |
| 25.1 Mineral Exploration and Geology | 462 |
| | |
| 25.2 Security and QA/QC | 462 |
| | |
| 25.3 Geological Model | 462 |
| | |
| 25.4 Grade estimation | 463 |
| | |
| 25.5 Mineral Resource Estimate | 463 |
| | |
| 25.6 Mining | 463 |
| | |
| 25.7 Processing | 465 |
| | |
| 25.8 Economic Analysis | 466 |
| | |
| 26 RECOMMENDATIONS | 467 |
| | |
| 26.1 Mineral Resources | 467 |
| | |
| 26.2 Mining | 467 |
| | |
| 26.3 Metalurgical Testing and Processing | 467 |
| | |
| 26.4 Capital and Operating and Costs | 468 |
| | |
| 26.5 Environment | 468 |
| | |
| 26.6 Estimates Costs | 468 |
| | |
| 27 REFERENCES | 469 |
| Table 1-1 Total Mineral Deposit Resource Statement | 37 |
| Table 1-2: Near Mine Target Mineral Resource (2012) | 38 |
| Table 1-3: TiO2 Resources in Non-Magnetic Tailings | 38 |
| Table 1-4: Maracás Menchen Project - Mineral Reserves Estimate | 40 |
| Table 1-5 Maracás Menchen Project - Non-Magnetic Mineral Reserves in Ponds | 41 |
| Table 1-6: World Mine Production of Vanadium | 43 |
| Table 1-7: Roskill Price Trend (US$/lb V2O5) | 45 |
| Table 1-8: Selling Price | 47 |
| Table 1-9: CAPEX summary | 49 |
| Table 2-1 Qualified Persons | 53 |
| Table 4-1: Largo Mineral Tenure | 60 |
| Table 4-2: Largo Enviromental Permits | 64 |
| Table 6-1: Mineral Exploration areas | 67 |
| Table 6-2: Historic Production Statistic for the Maracás Menchen Mine | 68 |
| Table 6-3: Summary of Total Drill Holes and Meters Drilled. | 70 |
| Table 6-4: Summary of Diamond drilling, Maracás Property. | 72 |
| Table 6-5: Historical Diamond Drilling Gulçari A deposit (1981 - 1987) | 72 |
| Table 6-6: Summary of Historical Drilling by Target | 74 |
| Table 6-7: Historical "Reserve" Estimate (1986) - Campbell | 75 |
| Table 6-8: Historical Reserve Estimate (2017 GE21) - Campbell | 76 |
| Table 7-1: Description of cyclic units of Rio Jacaré Intrusion | 81 |
| Table 7-2: Recovery Reduction Factors for Oxidized material, Campbell | 97 |
| Table 10-1: Summary of Diamond drilling, Maracás Property | 112 |
| Table 10-2: Largo 2007 Maracás Drill Program | 112 |
| Table 10-3: 2007 Novo Amparo drilling campaign | 114 |
| Table 10-4: Drill Hole Summary for the 2007 Campbell Drill Program | 114 |
| Table 10-5: 2007 Campbell Drill Results | 115 |
| Table 10-6: 2008 Drill Program Summary | 118 |
| Table 10-7: 2008 Drill Program Information | 118 |
| Table 10-8: 2008 Drill Program Summary of Significant Results | 119 |
| Table 10-9: Largo 2011 - 2012 Drill Program | 120 |
| Table 10-10: Campbell Zone Drilling | 120 |
| Table 10-11: Gulçari A Norte Zone Drilling | 121 |
| Table 10-12: Gulçari B Zone Drilling | 121 |
| Table 10-13: Gulçari B Sul Zone Drilling | 121 |
| Table 10-14: São José Zone Drilling | 121 |
| Table 10-15: Novo Amparo Zone Drilling | 122 |
| Table 10-16: Novo Amparo Nort Zone Drilling | 122 |
| Table 10-17: 2011-2012 Drill Program Summary of Significant Drill Results | 124 |
| Table 10-18: Total Maracás Drilling to 2012 | 126 |
| Table 10-19: 2007 Late Drill Results | 127 |
| Table 10-20: Largo 2012 Infill Drill Program | 128 |
| Table 10-21: 2012 Infill Drill Program Summary of Significant Results | 130 |
| Table 10-22: Summary 2018 Largo Infill Drill Program | 131 |
| Table 10-23: 2018 Largo Infill Drill Assay Results | 132 |
| Table 10-24: 2018 Largo Exploration Drill Program summary | 134 |
| Table 10-25: 2018 NAN Drill Program | 134 |
| Table 10-26: 2018 NAN Largo Drill Assay | 136 |
| Table 10-27: South Block Drill Campaign: Braga and Jacaré targets, 2018 | 136 |
| Table 10-28: 2019 Drilling Summary | 137 |
| Table 10-29: 2019 NAN Drill Program | 137 |
| Table 10-30: Significant Drill Intercepts from the 2019 NAN Drill Program | 140 |
| Table 10-31: Campbell Pit 2019 Drill Program | 140 |
| Table 10-32: 2019 Campbell Pit Drill Assay of significant results | 141 |
| Table 10-33: GAN - 2019 Drill Program | 142 |
| Table 10-34: 2019 GAN Drill Assay of significant results | 143 |
| Table 10-35: GAS - 2019 Drilling Program | 144 |
| Table 10-36: NAO - 2019 Drill Program | 144 |
| Table 10-37: SJO 2019 Drill Program | 145 |
| Table 10-38: Magmatic Cycle Revision: Relogged Geological Description, 2019 | 146 |
| Table 10-39: 2019 Drilling Summary | 147 |
| Table 10-40: 2020 Campbell Pit Drilling Program | 147 |
| Table 10-41: Campbell Drill Assay of Significant Results | 148 |
| Table 10-42: 2020 GAN Drilling Program | 149 |
| Table 10-43: 2020 GAN Significant Drill Assay Results | 152 |
| Table 10-44: 2020 NAN Drilling Program | 153 |
| Table 10-45: 2020 NAN Drill Assay of Significant Result | 155 |
| Table 10-46: São José Drill Program | 157 |
| Table 10-47: 2020 Novo Amparo Drill Program | 158 |
| Table 11-1:Density Summary (until 2015) | 171 |
| Table 11-2:Average Specific Gravity for the Campbell deposit, Largo Data 2016 | 172 |
| Table 11-3:Average Specific Gravity from 2016 to 2019, Largo Database | 172 |
| Table 11-4:Average Specific Gravity for deposits, 2020 Pycnomter Data | 173 |
| Table 11-5: Internal Standard Detection Limits | 183 |
| Table 11-6:Standards and Blank QA/QC Summary Results | 183 |
| Table 11-7:QA/QC Program Summary | 184 |
| Table 11-8- Main Certified Reference Mateial used by Largo | 185 |
| Table 13-1: Summary of Results - TiO2 Recovery - Campbell Pit | 206 |
| Table 13-2: Lithologies of Samples - Campbell Pit | 207 |
| Table 13-3: Chemical Analysis of Samples - Campbell Pit | 207 |
| Table 13-4: Summary of Results - Dry Magnetic Separation - Campbell Pit | 208 |
| Table 13-5: Top and Bottom Zones - Dry Magnetic Separation Recoveries - Campbell Pit | 208 |
| Table 13-6: Proportions - Blend B and C - Campbell Pit | 209 |
| Table 13-7: Chemical Analysis - Blend B and C - Campbell Pit | 209 |
| Table 13-8: Summary of Results - Wet Magnetic Separation - Blend B and C - Campbell Pit | 209 |
| Table 13-9: Chemical Analysis - Wet Non-Magnetic Blend B and C - Campbell Pit | 210 |
| Table 13-10: Desliming Results - Wet Non-Magnetic Blend B and C - Campbell Pit | 210 |
| Table 13-11: Flotation Results - Blend B and C - Campbell Pit | 211 |
| Table 13-12: Summary of Results - Global Recovery of TiO2 - Campbell Pit | 212 |
| Table 13-13: Summary of V2O5 Recoveries - Gulçari A Norte (GAN) | 213 |
| Table 13-14: Summary of TiO2 Recoveries - Gulçari A Norte (GAN) | 213 |
| Table 13-15: Chemical Analysis of Lithologies (GAN) | 213 |
| Table 13-16: Chemical Analysis of Samples (GAN) | 214 |
| Table 13-17: Mineralogical Distribution of Samples (GAN) (-150+20 µm) | 215 |
| Table 13-18: Vanadium Distribution by Mineral (GAN) (-150+20 µm) | 215 |
| Table 13-19: Titanium Distribution by Mineral (GAN) (-150+20 µm) | 215 |
| Table 13-20: Liberation - Magnetite and Ilmenite (GAN) | 216 |
| Table 13-21: Dry Magnetic Separation Results - Low Intensity | 217 |
| Table 13-22: Dry Magnetic Product - Wi and Specific Weight | 218 |
| Table 13-23: Chemical Analysis - Wet Magnetic Separation Feed | 218 |
| Table 13-24: Summary of Results - Wet Magnetic Separation | 219 |
| Table 13-25: Chemical Analysis - Calcination Feed | 220 |
| Table 13-26: Calcination Results | 221 |
| Table 13-27: Leaching and Chemical Treatment | 222 |
| Table 13-28: Summary - V2O5 Recoveries | 222 |
| Table 13-29: Chemical Analysis - Desliming Feed | 223 |
| Table 13-30: Chemical Analysis - Desliming | 223 |
| Table 13-31: Flotation Results | 224 |
| Table 13-32: Summary of Results - Collect 3 - Flotation | 225 |
| Table 13-33: Summary of Results - Flotation VMSA Lab | 226 |
| Table 13-34: Summary of Results - Dry Magnetic Separation - Titanium Recoveries | 227 |
| Table 13-35: Summary of Results - Wet Magnetic Separation - Titanium Recoveries | 228 |
| Table 13-36: Summary of Results - Titanium Recoveries by Area/Process | 228 |
| Table 13-37: Summary of V2O5 Recoveries - Novo Amparo Norte (NAN) | 229 |
| Table 13-38: Summary of TiO2 Recoveries - Novo Amparo Norte (NAN) | 229 |
| Table 13-39: Particle Size Distribution and Chemical - Samples M3, M4 and M5 | 230 |
| Table 13-40: Mineralogical Analysis - Sample HBPC (M3 and M4) | 231 |
| Table 13-41: Liberation Analysis - Sample HBPC (M3 and M4) | 231 |
| Table 13-42: Work Index and Abrasiveness Index | 231 |
| Table 13-43: Dry Magnetic Separation by Set Up - Mass Recovery, Magnetic Recovery and Enrichment | 233 |
| Table 13-44: Dry Magnetic Separation - Summary of Results | 234 |
| Table 13-45: Wet Magnetic Separation - Summary of Results | 235 |
| Table 13-46: Calcination - Summary of Results | 237 |
| Table 13-47: Global Recovery per Sample | 239 |
| Table 13-48: Average Global Recovery - Resources | 240 |
| Table 13-49: Particle Size Distribution and Chemical Analysis | 241 |
| Table 13-50: Cycloning of Non-magnetic | 242 |
| Table 13-51: Flotation Test Results - Accumulated Grades and Recoveries | 243 |
| Table 13-52: Flotation Test Results - Collect 2 - Average Results Summary | 244 |
| Table 13-53: Flotation Test Results - By Fraction - Average Results Summary | 244 |
| Table 13-54: TiO2 Recovery by Area, by Sample and Reserve - Average Summary | 244 |
| Table 14-1: Drilling Campbell Pit Summary | 247 |
| Table 14-2: Drilling GAN Summary | 247 |
| Table 14-3: Drilling NAN Summary | 247 |
| Table 14-4: Campbell Pit, NAN and GAN Typology | 249 |
| Table 14-5: Campbell Pit Descriptive statistic. "XH" suffix means content in head grades and "XC" means content in the Davis Tube magnetic concentrates | 257 |
| Table 14-6: GAN Deposit Descriptive statistic. "XH" suffix means content in head grades and "XC" means content in the Davis Tube magnetic concentrates | 260 |
| Table 14-7: NAN deposit Descriptive statistic. "XH" suffix means content in head grades and "XC" means content in the Davis Tube magnetic concentrates | 264 |
| Table 14-8: Average Specific Gravity for the Campbell deposit, Largo Database. 2012-2019 | 266 |
| Table 14-9: Average Specific Gravity by pycnometer for deposits, 2020 Largo Data 2020 | 266 |
| Table 14-10: Average Specific Gravity assigned in Mineral Resource Estimates in 2021 | 267 |
| Table 14-11: Campbell Pit Deposit Variographic Parameters | 267 |
| Table 14-12: GAN Deposit Variographic Parameters | 268 |
| Table 14-13: NAN area Varigraphic Parameters | 270 |
| Table 14-14: Campbell Pit Block Model Summary | 270 |
| Table 14-15: GAN Block Model Summary (block corner) | 271 |
| Table 14-16: NAN Block Model Summary (block corner) | 271 |
| Table 14-17: Attributes Summary | 271 |
| Table 14-18: Campbell Pit Kriging Plan | 272 |
| Table 14-19: GAN Deposit Kriking Plan | 273 |
| Table 14-20: NAN Deposit Kriging Plan | 273 |
| Table 14-21: Campbell Pit Mineral Resource Statement. (Ordinary Kriging Method) | 285 |
| Table 14-22: GAN Mineral Resource Statement. (Ordinary Kriging Method) | 285 |
| Table 14-23: NAN Mineral Resource Statement. (Ordinary Kriging Method) | 286 |
| Table 14-24: 2013 Satellite Deposits Mineral Resource (2012) | 286 |
| Table 14-25: TiO2 Resource in Non-Magnetic Tailings | 290 |
| Table 15-1: Maracás Menchen Project - Mineral Reserves Estimate | 292 |
| Table 15-2: Maracás Menchen Project - Non-Magnetic Mineral Reserves in Ponds | 293 |
| Table 15-3: Pit Optimization Parameters for Campbell Pit | 295 |
| Table 15-4: Nested Pits Results for Campbell | 296 |
| Table 15-5: Pit Optimization Parameters for GAN | 296 |
| Table 15-6: Nested Pits Results for GAN | 297 |
| Table 15-7: Pit Optimization Parameters for NAN | 298 |
| Table 15-8: Nested Pits Results for NAN | 299 |
| Table 15-9: Mine Design Parameters for Campbell Pit and GAN | 299 |
| Table 15-10: Maracás Menchen Project - Campbell Pit Reserves | 301 |
| Table 15-11: Maracás Menchen Project - GAN Mine Design Statement | 302 |
| Table 15-12: Mine Design Parameters for NAN | 302 |
| Table 15-13: Maracás Menchen Project - NAN Reserves | 304 |
| Table 15-14: TiO2 Reserves in Non-Magnetic Tailings (Effective Date - October,20, 2021) | 307 |
| Table 16-1: Massif Classes - Bieniawski Geomechanical Classification, 1989 | 313 |
| Table 16-2: Test results of the gabbro gazed (source MFL) | 314 |
| Table 16-3: Pyroxenite - pegmatite - isotropic gabbro test results (Source MFL) | 314 |
| Table 16-4: Campbell Pit Sectors | 316 |
| Table 16-5: Geotechnical Angles Adopted in Campbell's pit | 326 |
| Table 16-6: Geotechnical Angles Adopted for GAN and NAN | 326 |
| Table 16-7: Maracás Menchen Project - Mining Schedule | 328 |
| Table 16-8: Non-Magnetic Volume in Ponds by topography | 339 |
| Table 16-9: Non-Magnetic Tailings Reclaimation Plan | 340 |
| Table 16-10: Waste dumps design parameters | 340 |
| Table 16-11: Waste dumps volume and areas | 341 |
| Table 16-12: Mining Fleet Contract | 344 |
| Table 16-13: Yearly Required Mining Flee | 346 |
| Table 17-1: Summary of Key Process Design Criteria | 348 |
| Table 18-1: List of Equipment | 359 |
| Table 18-2: Ilmenite Concentration Plant Utilities | 370 |
| Table 19-1: World Mins Production and Reserves | 378 |
| Table 19-2: World Crude Steel Production (Million tonnes) | 379 |
| Table 19-3: Roskill Price Trend (US$/lb V2O5) | 380 |
| Table 19-4: Selling Price | 383 |
| Table 20-1: Vulnerable Species | 391 |
| Table 20-2: Rare Species | 391 |
| Table 20-3: Test work results - ABA-M - Waste Rock- Campbell | 411 |
| Table 20-4: Test work results - ABA-M- Waste Rock- Campbell | 412 |
| Table 20-5: Neutralization Potential Ratio (NPR) Screening Criteria (after Price et al, 1997) | 412 |
| Table 20-6: Test work Results - ABA-M -Magnetite Rocks- Campbell | 413 |
| Table 20-7: Test work Results - ABA-M -Magnetite Rocks- Campbell | 414 |
| Table 20-8: Maracás Vanadium Plant Atmospheric Emissions | 418 |
| Table 20-9: Maximum Long-Term Plant Emission Concentrations | 418 |
| Table 20-10: Mitigation Measures - Operations Phase | 422 |
| Table 20-11: Rainfall Rates (mm) | 426 |
| Table 20-12: Design Flow Volumes for the Hydraulic Structures | 427 |
| Table 20-13: Characterization of Soils and Outcrops in the Project Area | 428 |
| Table 20-14: Summary of Key Non-Magnetic Tailings Pond 3 Design Aspects | 428 |
| Table 20-15: Schedule of Non-Magnetic Tailing Pond Construction and Usage | 429 |
| Table 20-16: Main Geometric Characteristics of the Leached Calcine Tailings Stack | 432 |
| Table 20-17: Main Geometric Characteristics of the Chloride Control Purge Pond | 432 |
| Table 20-18: Main Characteristics of the Ridges | 434 |
| Table 20-19: Action Plan - Environmental Programs | 436 |
| Table 21-1: Process Plant Capex - Ilmenite Plant - Maracás - 150 Kt/year concentrate | 443 |
| Table 21-2: Process Plant Capex - TiO2 Pigment - 30 Kt/year | 444 |
| Table 21-3: Process Plant Capex - V2O3 Plant - 7 kt/year | 445 |
| Table 21-4: Process Plant Capex - TiO2 Pigment - 60 kt/year | 445 |
| Table 21-5:Process Plant Capex - TiO2 Pigment - 120 kt/year | 446 |
| Table 21-6: Process Plant Capex - Ilmenite Plant - 425 kt/year concentrate | 447 |
| Table 21-7: Process Plant Capex - V2O5 Expansion Second Kiln | 448 |
| Table 21-8: CAPEX summary | 449 |
| Table 21-9: Contract Loading & Haulage Costs | 450 |
| Table 21-10: Operating Costs - Mining | 451 |
| Table 21-11: Operating Costs - Vanadium Processing | 451 |
| Table 21-12: Operating Costs - Ilmenite Processing | 452 |
| Table 21-13: Operating Costs - Titanium Pigment Chemical Plant | 452 |
| Table 21-14: General and Administration Costs | 452 |
| Table 22-1: Royalties and CFEM | 454 |
| Table 22-2: Product Selling Prices | 455 |
| Table 22-3: Main Economic Parameters | 455 |
| Table 22-4: Base Case Life of Mine Annual Cash Flow | 456 |
| Table 22-5: PROJECT CASH FLOW (US$ x 1000) - Without Leverage | 457 |
| Table 22-6: Economical Analysis Summary | 458 |
| Table 22-7: Marginal Results for IRR and PayBack | 458 |
| Table 25-1: Maracás Menchen Project - Total Mineral Reserves Estimate. | 464 |
| Table 25-2: Maracás Menchen Project - Non-Magnetic Mineral Reserves in Ponds. | 464 |
| Figure 1.1: Vanadium Pentoxide Price Trend (US$/lb V2O5) | 45 |
| Figure 1.2: Ilmenite Price Trend (US$/t) | 46 |
| Figure 1.3: Benchmark imported TiO2 pigment prices (US$/t, CIF Brazilian port) | 46 |
| Figure 4.1 Maracás Menchen Mine Location Map | 56 |
| Figure 4.2: Largo Mineral Tenure Location Map | 59 |
| Figure 4.3: Property area related to Mineral Rights | 62 |
| Figure 5.1: Maracás Menchen Mine with Campbell Hill in Background | 66 |
| Figure 7.1: Maracás Area Simplified Regional Geology Map | 79 |
| Figure 7.2: Geological Geology Map of the Rio Jacaré mafic-ultramafic Intrusion in the general vicinity of the Maracás Menchen Mine showing the Gulcari A Deposit (Campbell Pit) and the other Near Mine Targets | 80 |
| Figure 7.3: Stratigraphic sequence of the magmatic pulses proposal according to last work of Largo | 84 |
| Figure 7.4: Schematic longitudinal section through the Rio Jacaré intrusion, illustrating the continuity of various cyclic units. Note that units are not drawn to scale | 85 |
| Figure 7.5: Schematic map of the location of the various deposits relative to cyclic units | 86 |
| Figure 7.6: Geological Map of the Campbell deposit | 87 |
| Figure 7.7: Cross-section (NW-SE) through the Campbell deposit, showing various lithologies and their subdivision into cyclic units from TZ to C9. Note that magnetite mineralization is contained predominantly within the C3 unit in magnetite pyroxenite and magnetitite. Topography represents the pit in September 2020, however original topography is also indicated | 88 |
| Figure 7.8: Geological Map of the GAN Deposit | 89 |
| Figure 7.9: Cross-section (NW-SE) through the GAN deposit, showing various lithologies and their subdivision into cyclic units from C4 to C9 | 90 |
| Figure 7.10: Geological Map of the NAN deposit | 91 |
| Figure 7.11: NW-SE cross-section (looking towards 020°) through the NAN deposit | 92 |
| Figure 7.12: Shows the integrated map of São José Deposit | 93 |
| Figure 7.13: Shows a representative cross-section of the São José deposit | 94 |
| Figure 7.14: Recovery Reduction Factors for Oxidized material, Campbell | 96 |
| Figure 8.1: Illustration of the general increase in TiO2 and decrease in V2O5 in magnetite with increased stratigraphic height in the upper portions of layered mafic complexes. B: V2O5/TiO2 ratios through the Rio Jacare Intrusion. Note that lower layers (C1-C4) have higher V2O5/TiO2, and that a large change occurs through the C5 and C6 units | 99 |
| Figure 8.2: Illustration of in-situ magnetite crystallization and growth of a magnetitite layer on the base of a magma chamber. From Kruger & Latypov, 2020 | 101 |
| Figure 9.1: Davis Tube Test Apparatus | 106 |
| Figure 9.2: Largo Ground Magnetometer Survey and Key Deposits | 107 |
| Figure 9.3: Geochemical maps of Vanadium and Titanium generated from the 2020 NAN campaign | 109 |
| Figure 9.4: Geochemical maps of Vanadium, Titanium and Nickel generated from the 2020 GAN campaign | 110 |
| Figure 10.1: Gulçari A Deposit Drill-Hole Plan Maracás Vanadium Project | 113 |
| Figure 10.2: Zone Location Map (October 17, 2011) | 123 |
| Figure 10.3: Campbell 2018 Drill Program Grid | 131 |
| Figure 10.4: 2018 NAN Exploration Drill Program Grid | 135 |
| Figure 10.5: NAN 2019 Driling Campaign Grid in green | 139 |
| Figure 10.6: Campbell Pit 2019 Driling Campaign Grid in green | 141 |
| Figure 10.7: GAN Pit 2019 Driling Campaign Grid in green | 142 |
| Figure 10.8: Campbell Pit 2020 Drilling Campaign in red | 148 |
| Figure 10.9: GAN 2020 Driling Campaign in orange | 151 |
| Figure 10.10: 2020 NAN Drilling Program | 154 |
| Figure 10.11: 2020 Drillng Campaign Map of Menchen Maracás Project | 159 |
| Figure 11.1:Largo core cutting facility for the 2018-2019 Exploration Program | 162 |
| Figure 11.2:Largo Core Shed in the 2018-2019 Mineral Exploration | 163 |
| Figure 11.3:Largo's First Davis Tube Device During Implementation on Site | 167 |
| Figure 11.4:Two Davis Tube devices at SGS Geosol in Belo Horizonte | 167 |
| Figure 11.5:Largo Staff During Site Visit at SGS (24th August 2015) | 168 |
| Figure 11.6:Density Determination by Archimedes Principle (until 2015) | 170 |
| Figure 11.7:Gulçari A Core Duplicate Sampling | 175 |
| Figure 11.8:Gulçari A Core Duplicate Sampling With Hole FGA-41 Removed | 176 |
| Figure 11.9:Exploration High Standard V2O5 Assay Results | 177 |
| Figure 11.10:2007 Exploration High Standard V2O5 Assay Results | 178 |
| Figure 11.11:2007 Exploration Field Blank Assay Results | 179 |
| Figure 11.12: Maracás Project - Original vs Duplicate Analyses | 180 |
| Figure 11.13:Secondary Laboratory Check Assays - V2O5 | 181 |
| Figure 11.14:Secondary Laboratory Check Assays - Pt | 182 |
| Figure 11.15:Standard Campbell Graphic | 187 |
| Figure 11.16:Campbell Pit Standard Chart | 189 |
| Figure 11.17:Standard GAN Chart | 191 |
| Figure 11.18:NAN Standard Chart | 193 |
| Figure 11.19:Duplicates Campbell Chart | 194 |
| Figure 11.20:Duplicates GAN Chart | 195 |
| Figure 11.21:Duplicates NAN Chart | 196 |
| Figure 12.1: Core shed infrastructure | 199 |
| Figure 12.2: Pulverized rejects box | 200 |
| Figure 12.3: Core boxes without covering | 201 |
| Figure 13.1: Crushed NAN ore (-12.5mm) and Dry Magnetic Separation Process in Drum Magnetic Separator (Low Intensity) | 232 |
| Figure 14.1: Campbell Pit section A-Aˈ and B-Bˈ with sediments (SED), pegmatite (PEG), granite (GR), granite with magnetite (GCM), anorthosite (ANO), magnetite (MAG), magnetic magnetite-pyroxenite (MPXT - HG_DT)), pyroxenite (PXT), gabbro magnetite (MGB) and gabbro | 250 |
| Figure 14.2: GAN deposit section A-Aˈ and B-Bˈ with sediments (SED), pegmatite (PEG), granite (GR), granite with magnetite (GCM), anorthosite (ANO), magnetite (MAG), magnetic magnetite-pyroxenite (MPXT - HG_DT)), pyroxenite (PXT), gabbro magnetite (MGB) and gabbro (GAB). Diagram block without overburden | 251 |
| Figure 14.3: NAN deposit section A-Aˈ and B-Bˈ with sediments (SED), pegmatite (PEG), granite (GR), granite with magnetite (GCM), anorthosite (ANO), magnetite (MAG), magnetic magnetite-pyroxenite (MPXT - HG_DT)), pyroxenite (PXT), gabbro magnetite (MGB) and gabbro (GAB). Diagram block without overburden | 252 |
| Figure 14.4: Histogram and Cumilative Curve of Campbell Pit sample lenght | 253 |
| Figure 14.5: Histogram and Cumulative Curve of GAN deposit sample lenght | 253 |
| Figure 14.6 : Histogram and Cumulative Curve of NAN deposit sample lenght | 254 |
| Figure 14.7- Campbell Pit V2O5 Histogram and Probability curve- MAG/Cycle 4 | 255 |
| Figure 14.8- Campbell Pit TiO2 Histogram and Probability curve- MAG/Cycle 4 | 255 |
| Figure 14.9- GAN V2O5 Histogram and Probability curve- MAG/Cycle 8 | 256 |
| Figure 14.10-GAN TiO2 Histogram and Probability curve - MAG/Cycle 8 | 256 |
| Figure 14.11- NAN V2O5 Histogram and Probability curve - MAG/Cycle 6 | 256 |
| Figure 14.12- NAN TiO2 Histogram and Probability curve - MAG/Cycle 6 | 257 |
| Figure 14.13: Campbell Pit NN Checks Graphs (%V2O5_XH in MAG) | 274 |
| Figure 14.14: Campbell Pit Checks Graphs (%TiO2_XH in MAG) | 275 |
| Figure 14.15: GAN deposit Checks Graphs (%V2O5_XH in MAG) | 276 |
| Figure 14.16: GAN deposit Checks Graphs (%TiO2_XH in MAG) | 277 |
| Figure 14.17: NAN deposit Checks Graphs (%V2O5_XH in MAG) | 278 |
| Figure 14.18: NAN deposit Checks Graphs (%TiO2_XH in MAG) | 279 |
| Figure 14.19: Campbell Pit Swath Plots (%V2O5_H in MAG) | 280 |
| Figure 14.20: Campbell Pit Swath Plots (%TiO2_XH in MAG) | 281 |
| Figure 14.21: GAN deposit Swath Plots (%V2O5_H in MAG) | 281 |
| Figure 14.22: GAN deposit Swath Plots (%TiO2_XH in MAG) | 282 |
| Figure 14.23: NAN deposit Swath Plots (%V2O5_H in MAG) | 282 |
| Figure 14.24: NAN deposit Swat Plots (%TiO2_XH in MAG) | 283 |
| Figure 14.25: TiO2 Tailings Histogram | 287 |
| Figure 14.26: Monthly Average TiO2 Grade in Ponds | 288 |
| Figure 14.27: Monthly Average TiO2 Grade in Ponds | 288 |
| Figure 14.28: Non-magnetic Tailings Ponds | 289 |
| Figure 15.1: Campbell - Pit Optimization Results Graph | 295 |
| Figure 15.2: GAN - Pit Optimization Results Graph | 297 |
| Figure 15.3: NAN - Pit Optimization Results Graph | 298 |
| Figure 15.4: Campbell Pit and GAN - Final Pit Design | 300 |
| Figure 15.5: NAN - Final Pit Design | 303 |
| Figure 15.6: TiO2 Tailings Histogram | 305 |
| Figure 15.7: Monthly Average TiO2 Grade in Ponds | 305 |
| Figure 15.8: Monthly Average TiO2 Grade in Ponds | 306 |
| Figure 15.9: Non-magnetic Tailings Ponds | 307 |
| Figure 16.1: Stereo system of the main structures in the pit | 312 |
| Figure 16.2: Campbell pit sectors | 317 |
| Figure 16.3: Key design of elements considered in Kinematic Analysis | 318 |
| Figure 16.4: Pit sector A1 showing wedge ruptures and planar rupture | 319 |
| Figure 16.5: Pit sector A1 showing wedge ruptures and planar rupture | 319 |
| Figure 16.6: A3 sector of the pit showing planar and tipping ruptures | 320 |
| Figure 16.7: A4 sector of the pit showing planar and wedge breaks | 321 |
| Figure 16.8: Sector A5 of the pit showing planar ruptures blocked by friction and a dip greater than that of the slope | 321 |
| Figure 16.9: Sector B1 of the pit showing planar and wedge ruptures near the limit of the friction cone | 322 |
| Figure 16.10: B2 sector of the pit without ruptures by foundation structures | 323 |
| Figure 16.11: Sector B3 of the pit, ruptures may occur due to tipping along the foliation and plan along the joint 8 (Tobogã) | 323 |
| Figure 16.12: Sector B4 of the pit, wedge ruptures may occur, planar rupture in joint 8 | 324 |
| Figure 16.13: Sector B5 of the pit indicating that the ruptures were blocked | 325 |
| Figure 16.14: Campbell-Year 01 | 329 |
| Figure 16.15: Campbell-Year 02 | 330 |
| Figure 16.16: Campbell-Year 03 | 331 |
| Figure 16.17: Campbell-Year 04 | 332 |
| Figure 16.18: Campbell-Year 05 | 333 |
| Figure 16.19: Campbell-Year 10 | 334 |
| Figure 16.20: Campbell, GAN and NAN - Year 11 | 335 |
| Figure 16.21: GAN and NAN - Year 12 | 336 |
| Figure 16.22: GAN and NAN - Year 13 | 337 |
| Figure 16.23: Maracás Menchen Project - Final Pit Design | 338 |
| Figure 16.24: Campbell/GAN Waste Dump | 341 |
| Figure 16.25: NAN Waste Dump | 342 |
| Figure 16.26: Maracás Menchen Project - Final Pit Design | 343 |
| Figure 16.27: Minax Mining Equipments | 345 |
| Figure 17.1 Conceptual Process Flow Sheet - Vanadium Pentoxide | 349 |
| Figure 18.1: General Layout - Plant Facility and Office Buildings | 361 |
| Figure 18.2: Plant Site Layout | 362 |
| Figure 18.3: Non-magnectic Talling Ponds | 366 |
| Figure 18.4: General arrangement of ilmenite plant Phase 1 | 369 |
| Figure 18.5: 3D model of ilmenite plant Phase 1 | 369 |
| Figure 18.6: Road to Enseada | 371 |
| Figure 18.7: Road to Camaçari | 371 |
| Figure 18.8: Preliminary 3D model of Largo's Camaçari plant | 373 |
| Figure 18.9: Planned Infrastructure of Maracás Complex | 374 |
| Figure 19.1: Vanadium Pentoxide Price Trend (US$/lb V2O5) | 380 |
| Figure 19.2: Ilmenite Price Trend (US$/t) | 381 |
| Figure 19.3: Benchmark imported TiO2 pigment prices (US$/t, CIF Brazilian port) | 381 |
| Figure 20.1: Jacaré River (Dry period) | 388 |
| Figure 20.2: Pedras` Dam reservoir at Porto Alegre | 396 |
| Figure 20.3: Average Monthly Rainfall for the Pluviometric Station at Fazenda Alagadiço (ANA Code - 01340019) | 425 |
| Figure 20.4: Intensity, Duration and Frequency Curves | 426 |
| Figure 20.5: Flow Chart of the Water Balance for the Project | 427 |
| Figure 20.6: Typical Cross-Section of the Non-Magnetic Tailings Pond | 429 |
| Figure 20.7: Layout of Non-Magnetic Tailings Ponds | 430 |
| Figure 20.8: Typical Cross-Section of the Leached Calcine Tailings Stack | 431 |
| Figure 20.9 Typical Cross-Section of the Chloride Control Purge Pond | 432 |
| Figure 22.1: Sensitivity analysis | 459 |
UNITS, SYMBOLS AND ABBREVIATIONS
% | Percent |
°C | Degrees Celsius |
µm | Micron |
2D | Two Dimensional |
3D | Three Dimensional |
AIG | Australian Institute og Geoscientists |
Al2O3 | Alumina |
AMF | Fauna Management Authorization |
AMV | Ammonium meta vanadate |
ANM | Agência Nacional de Mineração |
ANO | Anorthosite |
ASV | Vegetation Suppression Authorization |
BA | Bahia |
Bsc | Bachelor of science |
CaO | Calcium Oxide |
CAPEX | Capital Expenditure |
CBPM | Companhia Baiana de Pesquisa Mineral |
CIM | Canadian Institute of Mining |
CONAMA | Concelho Nacional do Meio Ambiente |
CRM | Certified Reference Material |
CSA | CSA Global |
CSLL | Social Contribution on Net Income |
DCF | Discounted Cash Flow |
DFS | Definitive Feasibility Study |
DGI | DGI Geoscience |
DNPM | Departamento Nacional de Produção Mineral |
DTRP | Hazardours Waste Transport Declaration |
DXF | Drawing Interchange Format |
EAP | Economico Agropastoril e Industrial S. A |
ECM | Engenharia e Consultoria Mineral S.A. |
EDA | Exploratory data analysis |
EIA | Environmental Impact Assessment |
FAIG | Fellow of the Australian Institute of Geoscientists |
Fe | Iron |
Fe2O3 | Iron Oxide |
FeSO4 | Ferrous sulfate |
FOS | Safety Factor |
ft | Feet |
G | Gauss |
G&A | General and administrative |
g/l | grams per liter |
g/t | Grams per Tonne |
GAN | Gulçari A Norte |
GE21 | GE21 Consultoria Mineral |
Geo | Geologist |
GFE | Gesellschaft fur Electrometallurgical |
GIS | Geographic Information System |
GPa | Giga Pascal |
GPS | Global Positioning System |
GR | Grafite |
h | Hour |
HPGR | High Pressure Grinding Rolls |
HSLA | High Srenght low alloy |
ICMS | Tax on Circulation of Goods and Services for Interstate and Intercity Transportation and Communication |
II | Import Tax |
IK | Indicator Kriging |
INCRA | National Land Reform Agency |
IPI | Tax on Manufactured Products |
IRPJ | Income tax |
IRR | Internal rate of return |
ISO | International Organization for Standardization |
ISSQN | Tax upon services of any kind |
K2O | Potassium oxide |
Kg or kg | Kilogram |
l | Liter |
L.A | Alteration License |
l/s | Liter per second |
LI | Installation License |
LIDAR | Light Detection and Ranging |
LO | Operational License |
LOM | Life of Mine |
LP | Preliminary License |
Ltda | Limited |
m³/h | Cubic meter per hour |
Ma | Million Years |
MAG | Magnetite |
MAIG | Member of the Australian Institute of Geoscientists |
MAX | Maximum |
MG | Minas Gerais |
MGB | Magnetite Gabbro |
MgO | Magnesium Oxide |
min | Minute |
MIN | Minimum |
ml | Millilitre |
mm | Millimeter |
MMA | Ministry of Environment |
MME | Ministry of Mines and Energy |
MnO | Manganese oxide |
MP | Provisional Measures |
QA/QC | Quality Assurance/Quality Control |
R$ or BRL | Brazilian Real |
ROM | Run-of-Mine |
SIRGAS | Sistema de Referencia Geocentric para Las Américas |
WRD | Waste rock dump |
OPEX | Operational Expenditure |
1 EXECUTIVE SUMMARY
1.1 Qualified Persons, Experience, and Independence
GE21 is an independent mineral consulting firm based in Brazil formed by a team of professionals accredited by the Australian Institute of Geoscientists ("AIG") as Qualified Persons ("QP") for declaration of Mineral Resources and Mineral Reserves in accordance with National Instrument 43-101 - Standards of Disclosure for Mineral Projects ("NI 43-101").
The independent QP responsible for this report's content on issues related to mining, processing, mineral reserve and resource estimates and economic analysis is Porfírio Cabaleiro Rodriguez (FAIG, B.Sc.), a Principal Mining Engineer and Managing Director of GE21 Consultoria Mineral, who has at least 43 years of experience in all aspects of assessment of mining projects, from early exploration through to bankable feasibility studies.
The independent QP responsible for this report's content on issues related to Geology and Mineral Resources is Marlon Sarges Ferreira (MAIG, B.Sc.), a Geologist, who has at least 15 years of experience in the mineral industry.
The independent QP responsible for this report's content on issues related to Data Verification is Fábio Valério Câmara Xavier (MAIG, B.Sc.), a Geologist, who has at least 18 years of experience in mineral Industry.
The independent QP responsible for this report's content on issues related to Mineral Reserves estimation is Guilherme Gomides Ferreira (MAIG, B.Sc.), a Mining Engineer and Manager Engineer of GE21 Consultoria Mineral, who has at least 16 years of experience in mining projects.
1.2 Introduction
This technical report is "An updated Life of Mine Plan ("LOMP") for Campbell Pit and Pre-Feasibility Study for Novo Amparo Norte ("NAN") and Gulçari A Norte ("GAN") Deposits, Maracás Menchen Project, Bahia, Brazil". Largo has undertaken a comprehensive optimization study for the Maracás Menchen Mine, with the objective of improving forecast vanadium production efficacy and extending mine life. Latest engineering works indicated that modest grades of titanium can be recovered from the Gulçari A deposit (Campbell Pit) and relatively higher grades of titanium can be recovered from the GAN and NAN deposits with the addition of specific process streams to current Largo circuit. Of this form titanium dioxide was classified as Resource and Reserve Mineral.
GE21 Consultoria Mineral was hired by Largo to update the Life of Mine Plan ("LOMP") for Campbell Pit and provide a Pre-Feasibility Study for Novo Amparo Norte ("NAN") and Gulçari A Norte ("GAN") deposits. The Maracás Menchen Project is located within the greater municipality of Maracás in eastern Bahia State, Brazil. Maracás lies about 250 km southwest of the City of Salvador, the capital of Bahia.
Largo's mining rights consist of eighteen (18) concessions, including 15 mineral exploration licenses and 3 exploitation licenses (one granted and two pending), totaling almost 18,000 ha.
1.3 Reliance on Other Experts
On issues related to ownership and mineral concession rights, the authors rely on legal opinions given to Largo by Stocche Forbes, namely that the Largo holds all of the necessary surface and access right required for the Project through its Brazilian subsidiary, and that its mineral concession rights are in good standing with the Agência Nacional de Mineração ("ANM"), the Brazilian federal agency that regulates and oversees mining. GE21's QP Marlon Sarges Ferreira verified on ANM's online platform that status of each of the eighteen Mineral Concessions is in accordance with the information in this Report.
On issues related to environmental permitting and studies, taxation and royalties, the authors rely on the information provided by Largo.
1.4 Property Description and Location
The Project is located in the greater municipality of Maracás in Bahia State in eastern Brazil. Maracás is approximately 250 km southwest of Bahia's capital city, Salvador. The City of Maracás has a population of approximately 20,393 inhabitants (IBGE 2020 Census) engaged primarily in the agriculture and livestock industries and a skilled labor force for mining activities.
Mineral exploration and mining licenses are independent from land ownership. To the extent that Largo requires additional surface or access rights for the Project, it must negotiate directly with the owner or lessee of the relevant portion of land.
1.5 Accessibility, Climate, Local Resources, Infrastructure, and Physiography
The town of Maracás is accessible by a paved secondary highway from the main Brazilian coastal highway through Bahia State. It is approximately 405 road kilometers from Salvador (population: 2.9 million (2020)). The Project is accessed by 29 km paved secondary highway, west from Maracás, followed by 20 km gravel road that leads to a ranch gate. The Project is located on the ranch and a 2.5-km sand and gravel trail leads to the Campbell Pit.
The local climate has two distinct seasons, one is typically hot and humid and the other during the winter is dry. The climate does not create any problem for exploration with diamond drilling or other geological/geochemical work. Tropical weathering can create specific issues for geochemistry and mapping. Exploration can be carried out at any time without facing difficulties.
Domestic power and telephone service are available both at the Property and in the town of Maracás, which is linked to the power grid. Maracás has a population of approximately 20,000. The water supply is available from a number of rivers and creeks which drain into the general area.
The Maracás Property is located in the region between the coast and the high plateau in an area of moderate to low-lying relief. At the Project itself site, the maximum relief is about 30 m. The surrounding terrain is a typical ranch/farm with low trees and shrubs and consists of a number of relatively flat plateaus adjacent to a series of creeks and ponds.
The local land is primarily used for agriculture with ranching and grazing being the primary activity on the land at the Maracás Project where both mining and exploration activities are permitted.
1.6 History
Exploration of the Rio Jacaré mafic to ultramafic intrusion by CBPM started in 1980 during a regional geological survey. This work led to the discovery of the vanadium-rich titaniferous magnetite occurrence on what is now part of the Maracás Property. In 1981, CBPM conducted an exploration program which included geological mapping, ground geophysical surveys (magnetic and VLF electromagnetic surveys), test pitting and trenching, and diamond drilling of two holes totaling 147 m. In 1983, CBPM continued work and focused on the Campbell deposit when it completed an additional 12 holes totaling 985 m.
Over the past 40 years, the Maracás Menchen Mine (the "Project") has undergone several additional phases of exploration and economic evaluation, including geophysical surveys, prospecting, trenching, diamond drilling programs, geological studies, resource estimates, petrographic studies, metallurgical studies, mining studies and economic analyses. These studies have advanced the Project to its present status of mine and to the development of exploration campaigns in target areas along the Rio Jacaré Intrusion.
The Project began mining operations in 2013, on the Gulçari A Deposit, now known as the Campbell Pit, with first V2O5 production commencing in August of 2014. It is the only vanadium mine in Latin America.
In 2018, the Company started an expansion process in the production plant to reach the capacity of 12 thousand tons per year. In July 2019, the Project achieved a monthly production record of 1,042 tons of vanadium pentoxide (V205). Also, in 2019, research and test projects were undertaken to recover titanium (pilot phase) and V2O3 conversion.
1.7 Geological Setting and Mineralization
The Rio Jacaré Intrusion, which hosts the Project's vanadium mineralization, is located in the south-central part of Bahia state in northeastern Brazil. It lies within the Archean São Francisco craton, which in this area is composed of the Contendas-Mirante Complex and the Gavião and Jequié blocks. The intrusion is located on the eastern edge of the Contendas-Mirante supracrustal sequence, which forms a large anticlinorium trending approximately north-south.
The Rio Jacaré mafic-ultramafic Intrusion is composed mainly of gabbro. It is a linear sheet-like structure that strikes almost north-south, with a length of approximately 70 km, an average width of 1.2 km, and a dip of 70° E.
Along the strike of the Rio Jacaré Intrusion within the property, several discrete deposits or areas containing vanadium-rich titanomagnetite bodies have been defined, namely the Gulçari A (Campbell Pit) deposit, the Gulçari A North (GAN) deposit, Gulçari B deposit (currently part of GAN), the São Jose deposit (SJO), the Novo Amparo (NAO) deposit and the Novo Amparo North (NAN) deposit. Each of these deposits are located at various stratigraphic heights within the Rio Jacaré Intrusion, and thus occur within different cyclic units.
Within all deposits, mineralized bodies consist of magnetitite layers or magnetite pyroxenite layers formed as cyclic magmatic units associated with the surrounding gabbro. Typically, magnetite-enriched units have sharp magmatic contacts with units below and gradational contacts with the units above.
Elements of interest at the Project are vanadium and titanium. Vanadium is hosted within titaniferous magnetite, which is the major oxide phase found within the deposit. Ilmenite forms a second oxide phase which is commonly present, and which hosts titanium mineralization.
1.8 Deposit Types
Vanadiferous titano-magnetite (VTM) mineralization at the Project shows similarities to other magmatic VTM or ilmenite deposits associated with layered mafic intrusive complexes including the Bushveld Complex (South Africa), the Lac Doré Complex (Quebec, Canada) and the Skaergard Intrusion (Greenland). In these layered complexes VTM and ilmenite deposits typically form in the upper portions of the magmatic stratigraphy It is believed that magnetite crystallization is initiated when the evolving magma becomes sufficiently iron-enriched to form oxide minerals.
Knowing that vanadium is compatible in the magnetite crystal structure, it is incorporated into this mineral, depleting the magma in vanadium. Consequently, this process will result in magnetite-carrying units having the highest V2O5 values, with the vanadium content of the magnetite gradually decreasing in the upper parts of the stratigraphy as the mineral density increases and it becomes concentrated in the lower layers. Titanium is less compatible with the magnetite structure, enriching the residual magma. This process is responsible for an overall decrease in the V2O5 / TiO2 ratio of the upper stratigraphy units observed in the Project.
1.9 Exploration
Since 80's the area being studied by several methodology as regional and detailed geological mapping; geophysical survey with magnetometers; soil geochemistry campaigns; chemical analysis of rock (borehole and drill core); exploratory drilling on other targets; infill drilling and deep drilling on the target; topographic surveys and petrographic studies.
In Menchen Maracás Project the mineral research has approximately 550 km of geophysical research line, 700 geochemical samples, 74,000 meters drilling with 29,000 m sampled close Campbell Pit, GAN and NAN deposits.
1.10 Drilling
Between 2007 and 2017, the Company drilled 263 drill holes totaling 50,088.71 meters for exploration and resource development. In addition, metallurgical and geotechnical holes were also completed. At Gulçari A (Campbell) 160 holes were drilled, totaling approximately 27,594 meters drilled. Of these, 103 holes with 12,959.82 meters of core were drilled as part of an infill campaign carried out between 2012 and 2013. A new infill drilling campaign was carried out in 2018 with 31 holes totaling 2,323.7 meters of core.
During 2018, Largo completed a drilling campaign with a further 24 holes in NAN with 4,223.30 m core and 14 holes in the South Block (Braga-Jacaré-Água Branca) with 2,218.70 meters drilled.
In 2019, Largo drilled 72 holes over three main areas. At Campbell, the Company drilled a total of 1,924.65 meters, at GAN 3,050.95 meters were drilled and at NAN 5,404.15 meters of drilling were completed. At other targets named GAS, SJO and NAO, approximately 57 holes were drilled totaling 9,475 m of core drilled.
In 2020 Largo drilled 94 holes over three areas. At Campbell 4,755.3 meters of core were drilled, at GAN 6,899.00 meters of cored were drilled and at NAN a total of 8,187.65 meters of core were drilled. At other targets 30 holes were drilled totalling approximately 4,923.80 meters of core. Table 6.6 shows the details of this drilling by operator, year and target.
1.11 Sample Preparation, Analyses, and Security
Largo's sampling procedures are well-defined and in line with the industry best practices. GE21 evaluated the sample collection, analysis and security methods, as well as the procedures used by Largo's internal laboratory.
Since 2009 Largo has implemented a QAQC program on all drilling programs. This quality control allows for the confirmation of the precision and accuracy of %V2O5, %TiO2 and other elements (platinum and palladium contents) reported in the previous Mineral Resource Estimation.
The analysis of quality control, transportation to the laboratory, sample preparation and storage conditions in prior reports performed by the former owners and Largo, allowed us to assume that the historical data is acceptable for a more current resource estimate. All current procedures have been validated by GE21's QP.
The primary and secondary labs involved in all drilling programs use the same control procedures as noted above and acknowledged as "best practice" by the QP in this report. Therefore, it also attests to its acceptability for mineral resource analysis.
After the consolidation and understanding of all data received, such as data acquisition procedures, analytical results (chemical results and geophysical survey points) together with their corresponding quality control programs, QP attests that the data is suitable for the Mineral Resource Estimate.
1.12 Data Verification
A technical visit to the Project site was performed by the geologist Fabio Valério and mining engineer Guilherme Gomides, between 27th to 29th of April 2021. During the technical visit the follow points were verified:
Drillhole landmarks and topography registers.
Core shed and drillhole intercepts with sampling registers.
Operating procedures and geological description.
QAQC and Density procedures.
Internal Laboratory.
Drilling Database.
Largo used a millimeter precision GPS with RTK for the final drillhole collar location. The topography of the open pit is updated via Drone three times per week. The topography covers the entire open pit. There are operational procedures for all drilling phases. Most of the mineral research data received and used to define the 3D geological model and resource estimate was compiled into Leapfrog Software and classified by target to improve file organization, integrity and security.
After the consolidation and understanding of all data received, such as data acquisition procedures, analytical results (chemical results and geophysical survey points) together with their corresponding quality control programs, technical responsible by revision consider that the data is appropriate for the mineral resource estimate.
1.13 Mineral Processing and Metallurgical Testing
Research of metallurgical tests performed to recover vanadium and titanium at Gulçari A (Campbell Pit), Novo Amparo Norte (NAN) and Gulçari A Norte (GAN) deposits have shown that is possible to recover vanadium from all three deposits by the same production process used in Largo's vanadium plant. Significant metallurgical test work has been completed by Largo and those results show the recovery of titanium from all three deposits using desliming and flotation to treat the nonmagnetic tailings generated in Largo's vanadium plant is successful in reaching economic recoveries. The metallurgical tests achieved 51%, 54% and 38% of titanium recovery for GAN, NAN and GAN respectively, and 70% and 67% of vanadium recovery for NAN and GAN respectively. The grade of TiO2 in achieved in ilmenite concentrate were higher than 40% for all deposits.
1.14 Mineral Resource Estimates
Mineral resource for Campbell Pit, GAN and NAN deposits were classified and prepared in accordance with the Canadian Institute of Mining, Metallurgy and Petroleum ("CIM") Definition Standards for Mineral Resources and Mineral Reserves, adopted by the CIM Council on May 10, 2014, as amended (the "CIM Standards"), and the CIM Estimation of Mineral Resources and Mineral Reserves Best Practice Guidelines, adopted by CIM Council on November 29, 2019, as amended (the "CIM Guidelines") by Sr. Porfirio Cabaleiro Rodriguez, FAIG, with contributions from others at GE21. All are independent Qualified Persons as such term is defined under NI 43-101.
QP Marlon Sarges Ferreira, MAIG, independent consultor, classified Mineral Resource according to the CIM Standards and the CIM Guidelines as such term is defined unde NI 43-101.
The 3D geological Campbell, GAN and NAN models were prepared by Largo using Leapfrog Geo software, to define and interpolate geological domains. The QP validated and adjusted these models as necessary. The variograms prepared for each domain by QP were used in Ordinary Kriging for %V2O5, %TiO2, %Fe, %SiO2, and %MAG estimates, using Leapfrog Edge software.
The vanadiferous mineralization was classified as a Mineral Resource based on a 0.3% V2O5 cutoff. A cut-off grade of 1% TiO2 head, derivered from an economic function is associated to TiO2 Mineral Resource. These parameters were used to define a Reasonable Prospects for Eventual Economic Extraction (RPEEE) limited by mining rights.
With the positive results of the metallurgical characterization of the material not recovered from the vanadium plant (Campbell Pit, GAN and NAN deposits), titanium was classified as Mineral Resource.
The Mineral Resource value was quantified inside resource pit based on the current cost and assumed commodity price, represented for the Reasonable Prospect for Eventual Economic Extraction (RPEEE). Table 1-1 summarizes the Mineral Resources of Gulcari A (Campbell Pit), GAN and NAN deposit.
Table 1-1 Total Mineral Deposit Resource Statement
Classification | Mass (Mt) | Head | Magnetic Concentrate | Metal Content |
%V2O5 | %TiO2 | %MAG | %V2O5 | %TiO2 | V205 (kt) | TiO2 (kt) |
Campbell Pit a, i |
Measured (M) | 16.36 | 1.23 | 7.98 | 31.84 | 3.15 | 5.04 | 201.2 | 1,305.6 |
Indicated (I) | 3.07 | 0.98 | 7.97 | 28.2 | 2.69 | 4.45 | 30.1 | 244.5 |
Total Campbell Pit M+I | 19.43 | 1.19 | 7.98 | 31.27 | 3.08 | 4.95 | 231.3 | 1,550.1 |
GANb, ii |
Measured (M) | 12.11 | 0.49 | 7.55 | 17.70 | 1.88 | 1.93 | 59.8 | 914.5 |
Indicated (I) | 9.25 | 0.58 | 8.28 | 21.13 | 2.08 | 2.27 | 54.1 | 766.5 |
Total GAN M+I | 21.37 | 0.53 | 7.87 | 19.18 | 1.97 | 2.07 | 113.8 | 1,681.0 |
NANc, iii |
Measured (M) | 17.48 | 0.7 | 8.73 | 23.43 | 2.38 | 2.97 | 122.4 | 1,526.0 |
Indicated (I) | 5.41 | 0.74 | 8.76 | 23.51 | 2.48 | 2.78 | 40.1 | 474.1 |
Total NAN M+I | 22.89 | 0.71 | 8.74 | 23.45 | 2.40 | 2.92 | 162.4 | 2,000.1 |
Total Maracás Menchen Mine M+I |
Measured (M) | 45.95 | 0.83 | 8.15 | 24.91 | 2.52 | 3.43 | 383.3 | 3,746.1 |
Indicated (I) | 17.73 | 0.70 | 8.37 | 23.08 | 2.31 | 2.80 | 124.2 | 1,485.1 |
Total M+I | 63.69 | 0.80 | 8.21 | 24.40 | 2.46 | 3.26 | 507.6 | 5,231.2 |
Campbell Pit Inferred | 5.10 | 0.92 | 8.20 | 26.68 | 2.63 | 3.98 | 47.0 | 418.6 |
GAN Inferred | 4.52 | 0.64 | 8.40 | 22.37 | 2.15 | 2.49 | 29.0 | 380.1 |
NAN Inferred | 5.90 | 0.67 | 7.75 | 21.01 | 2.47 | 2.89 | 39.5 | 456.9 |
Total Maracás Menchen Mine Inferred | 15.52 | 0.74 | 8.09 | 23.27 | 2.44 | 3.13 | 115.5 | 1,255.6 |
Notes: 1. Mineral Resources that are not Mineral Reserves do not have demonstrated economic viability. 2. Mineral resources were estimated by Marlon Sarges Ferreira, BSc. (Geo), MAIG, a GE21 Associate, meet the requirements of a "Qualified Person" as established by the Canadian Institute of Mining, Metallurgy and Petroleum (CIM) Definition Standards for Mineral Resources and Mineral Reserves (May 2014) ("the CIM Standards"). 3. The Mineral Resource estimates were prepared in accordance with the CIM Standards, and the CIM Guidelines, using geostatistical, plus economic and mining parameters appropriate to the deposit.
a. Ordinary kriging inside 5m x 5m x 5m block size. b. Ordinary kriging inside 10m by 10m by 5m block size. c. Ordinary kriging inside 20m by 20m by 5m block size. 4. Presented Mineral Resources inclusive of mineral reserves. All figures have been rounded to the relative accuracy of the estimates. Summed amounts may not add due to rounding. 5. Mineral Resource is reported with effective date July 12th, 2021. 6. A cut-off grade of 0.3% V2O5 head is applied in V2O5 Mineral Resource. 7. A cut-off grade of 1% TiO2 head, deriverd from an economic fucnction is associated to TiO2 Mineral Resource. 8. Mineral Resources were limited by an economic pit built in Geovia Whittle 4.3 software and following the geometric and economic parameters: i. Pit slope angles ranging from 37.5° to 64°. V2O5 long term price of $15.60/lb, with an additional premium of $5.50/lb for high purity product. TiO2 pigment selling price of $7,382/tonne. Mining costs of $1.60/tonne for mineralization and waste. Vanadium processing costs of $37.80/tonne ore feed. V2O5 concentrate recovery of 80.5%. Ilmenite concentrate costs of $55.00/tonne processed. TiO2 pigment costs of $1,374/tonne of Ilmenite concentrate. TiO2 overall recovery of 37.9%. General and Administrative (G&A) costs of $0.16/lb V2O5. ii. Pit slope angles ranging from 40.0° to 64°. V2O5 long term price of $15.60/lb, with an additional premium of $5.50/lb for high purity product. TiO2 pigment selling price of $7,382/tonne. Mining costs of $1.60/tonne for mineralization and waste. Vanadium processing costs of $37.80/tonne ore feed. V2O5 concentrate recovery of 79.2%. Ilmenite concentrate costs of $55.00/tonne processed. TiO2 pigment costs of $1,374/tonne of Ilmenite concentrate. TiO2 overall recovery of 40.25%. General and Administrative (G&A) costs of $0.16/lb V2O5. iii. Pit slope angles ranging from 40.0° to 64°. V2O5 long term price of $15.60/lb, with an additional premium of $5.50/lb for high purity product. TiO2 pigment selling price of $7,382/tonne. Mining costs of $1.60/tonne for mineralization and waste. Vanadium processing costs of $37.80/tonne ore feed. V2O5 concentrate recovery of 70.0%. Ilmenite concentrate costs of $55.00/tonne processed. TiO2 pigment costs of $1,374/tonne of Ilmenite concentrate. TiO2 overall recovery of 38.25%. General and Administrative (G&A) costs of $0.16/lb V2O5. |
No Mineral Resources were updated from Novo Amparo and São José deposits, Table 1-2 shows the resources estimated by RPM in 2012 and revised and confirmed by QP in 2017.
Table 1-2: Near Mine Target Mineral Resource (2012)
Deposit | Rec Class | Kt | V2O5 | Contained V2O5 (tonnes) |
Novo Amparo** | inferred | 1.5 | 0.72 | 11.20 |
São José** | inferred | 3.9 | 0.89 | 34.70 |
Total | Inferred | 18 | 0.82 | 147.30 |
| **Resource within a pit using US$ 2.720/t all in operating cost and reported at a 0.45% V2O5 cutt-off, reviewed at the Effective Date of May 2nd 2017 and confirmed by Porfirio Cabaleiro Rodriguez (GE21 2017). |
Largo (2021) approved the construction of an ilmenite concentration plant at the Maracas Menchen mine site that will come into operation in 2023 producing a concentrate that will feed a TiO2 pigment plant which will be build the same year. This process will partially consume the non-magnetic concentrate from the vanadium plant until the mine is exhausted. This allowed three of Largo's TiO2 tailling dams to be considered as an Indicated Mineral Resource. The Mineral Resource contained in the tailings dam were estimated based on topographic surveys (historic data and 1ccess1 data) and validated with monthly process and reconciliation data from mine production Tailing material data was sampled once every 8 hours, with an average TiO2 content of 11.35%. Table 1-3 shows TiO2 Resources in Non-Magnetic Tailings.
Table 1-3: TiO2 Resources in Non-Magnetic Tailings
Pond | Resource Class | Volum (km3) | Density (t/m3) | Resorce in
Stock (kt) | TiO2 (%) | Contained
Metal (kt) |
BNM04 | Indicated | 830 | 1.8 | 1,494 | 11.35 | 170 |
BNM02 | Indicated | 640 | 1.8 | 1,153 | 11.35 | 131 |
BNM03 | Indicated | 521 | 1.8 | 938 | 11.35 | 106 |
Total | 1,991 | 1.8 | 3,584 | 11.35 | 407 |
i. Stock of "Non- Magnetic" material available in the pounds; |
ii. Mineral Resource in pounds were estimated based on topographic surveys primitive data and current data) and validated with monthly process and reconciliation data. |
iii. Tailing material data was sampled once every 8 hours, with an average TiO2 content of 11.35%. iv. No dilution was Applied to the Resource. v. Mineral Resource estimated by Marlon Sarges Ferreira, Bsc.(Geo), MAIG. |
No current significant factors or risks were identified by QP that could materially affect the potential development of the Mineral Resources.
1.15 Mineral Reserve Estimates
Mineral Reserves for Campbell Pit, GAN Deposit and NAN Deposit have an effective date of October 10th, 2021. To convert Measured Resources into Proven Reserves and Indicated Resources into Probable Reserves, consideration was given to products metallurgical recoveries, mining dilution and ore loss factors, costs of mining, processing, SG&A and logistics, as well as the forecasts and estimates of prices for vanadium and titanium products.
The Mineral Reserves summary for Campbell Pit, GAN Deposit and NAN Deposit are presented on Table 1-4. Aside from Mineral Reserves from the ultimate pit, three tailings ponds bearing titanium enriched material from pre-processed non-magnetic tailings of vanadium magnetic separation process are estimated separately as Probable Reserves.
Mineral Reserves were estimated under the supervision of Mr Guilherme Gomides Ferreira who is a Qualified Person as defined in NI43-101, an associate of GE21 and member of the Australian Institute of Geoscientists, also independent of Largo Resources.
Table 1-4: Maracás Menchen Project - Mineral Reserves Estimate
(Effective Date - October,10, 2021)
Category | Tonnage
(Mt) | % Magnetics | Head | Magnetic Concentrate | Metal Contained |
% V2O5 | % TiO2 | Mag
(Mt) | % V2O5 | % TiO2 | V2O5 in
Magnetic
Concentrate
(t) | TiO2 in Non-
Magnetic
Concentrate
(t) |
Campbell Piti |
Proven | 15.64 | 31.91 | 1.22 | 8.02 | 4.99 | 3.14 | 5.04 | 156,686 | 1,002,650 |
Probable | 2.21 | 29.77 | 1.02 | 8.22 | 0.66 | 2.69 | 4.54 | 17,677 | 151,610 |
Total Campbell Pit Reserve | 17.85 | 31.65 | 1.20 | 8.04 | 5.65 | 3.09 | 4.98 | 174,363 | 1,154,260 |
GANii |
Proven | 12.1 | 17.75 | 0.49 | 7.57 | 2.15 | 1.88 | 1.94 | 40,375 | 874,242 |
Probable | 8.06 | 21.15 | 0.57 | 8.33 | 1.71 | 2.04 | 2.29 | 34,790 | 632,616 |
Total GAN Reserve | 20.16 | 19.11 | 0.52 | 7.87 | 3.85 | 1.95 | 2.08 | 75,165 | 1,506,858 |
NANiii |
Proven | 17.43 | 23.22 | 0.7 | 8.71 | 4.05 | 2.36 | 2.95 | 95,538 | 1,399,099 |
Probable | 4.92 | 23.38 | 0.72 | 8.76 | 1.15 | 2.44 | 2.78 | 28,059 | 398,901 |
Total NAN Reserve | 22.35 | 23.26 | 0.7 | 8.72 | 5.2 | 2.38 | 2.91 | 123,598 | 1,798,000 |
Total Maracás Menchen Mine Proven and Probable Reserves |
Proven | 45.17 | 24.76 | 0.82 | 8.17 | 11.19 | 2.62 | 3.4 | 292,599 | 3,275,992 |
Probable | 15.19 | 23.12 | 0.68 | 8.45 | 3.51 | 2.29 | 2.78 | 80,526 | 1,183,126 |
Total | 60.36 | 24.35 | 0.79 | 8.24 | 14.7 | 2.54 | 3.25 | 373,125 | 4,459,118 |
Notes: 1. Mineral Reserves estimates were prepared in accordance with the CIM Standards. 2. Mineral Reserves are the economic portion of the Measured and Indicated Mineral Resources. 3. Mineral Reserves were estimated by Guilherme Gomides Ferreira, BSc. (Meng), MAIG, a GE21 associate, who meets the requirements of a "Qualified Person" as established by the Canadian Institute of Mining, Metallurgy and Petroleum (CIM) Definition Standards for Mineral Resources and Mineral Reserves (May 2014) ("the CIM Standards"). 4. Mineral Reserves is reported effective date October 10th, 2021. 5. The reference point at which the Mineral Reserves are defined is the point where the ore is delivered from the open pit to the crushing plant. 6. Vanadium product comes from magnetic concentrate, while TiO2 product from non-magnetic portion. 7. Exchange rate $1.00 = R$5.10. 8. Mineral Reserves were estimated using the Geovia Whittle 4.3 software and following the geometric and economic parameters: i. Recovery 100% and dilution 3%. Pit slope angles ranging from 37.5° to 64°. V2O5 long term price of $7.80/lb, with an additional premium of $2.50/lb for high purity product. TiO2 pigment selling price of $3,691/tonne. Mining costs of $1.60/tonne for mineralization and waste. Vanadium processing costs of $37.80/tonne ore feed. V2O5 concentrate recovery of 80.5%. Ilmenite concentrate costs of $55.00/tonne processed. TiO2 pigment costs of $1.374/tonne of Ilmenite concentrate. TiO2 overall recovery of 37.9%. General and Administrative (G&A) costs of $0.16/lb V2O5. ii. Recovery 95% and dilution 5%. Pit slope angles ranging from 40° to 64°. V2O5 long term price of $7.80/lb, with an additional premium of $2.50/lb for high purity product. TiO2 pigment selling price of $3,691/tonne. Mining costs of $1.60/tonne for mineralization and waste. Vanadium processing costs of $37.80/tonne ore feed. V2O5 concentrate recovery of 79.2%. Ilmenite concentrate costs of $55.00/tonne processed. TiO2 pigment costs of $1,374/tonne of Ilmenite concentrate. TiO2 overall recovery of 40.25%. General and Administrative (G&A) costs of $0.16/lb V2O5. iii. Recovery 95% and dilution 5%. Pit slope angles ranging from 40° to 64°. V2O5 long term price of $7.80/lb, with an additional premium of $2.50/lb for high purity product. TiO2 pigment selling price of $3,691/tonne. Mining costs of $1.60/tonne for mineralization and waste. Vanadium processing costs of $37.80/tonne ore feed. V2O5 concentrate recovery of 70.0%. Ilmenite concentrate costs of $55.00/tonne processed. TiO2 pigment costs of $1,374/tonne of Ilmenite concentrate. TiO2 overall recovery of 38.25%. General and Administrative (G&A) costs of $0.16/lb V2O5 |
Table 1-5 Maracás Menchen Project - Non-Magnetic Mineral Reserves in Ponds
(Effective Date - October,10, 2021)
Pond | Reserves
Classification | Volume
(km3) | Density
(t/m3) | Reserve in
Stock
(kt) | Grade TiO2
(%) | Metal content
(kt) |
BNM 04 | Probable | 829.75 | 1.80 | 1,493.55 | 11.35 | 169.52 |
BNM 02 | Probable | 640.30 | 1.80 | 1,152.53 | 11.35 | 130.81 |
BNM 03 | Probable | 521.14 | 1.80 | 938.05 | 11.35 | 106.47 |
Total | Probable | 1,991.18 | 1.80 | 3,584.12 | 11.35 | 406.80 |
i. Stock of "Non-Magnetic concentrate" available in the tailings ponds. ii. Mineral Reserve in tailings were estimated based on topographic surveys (primitive data and current data) and validated with monthly processing and reconciliation data. iii. Tailings material data was sampled once every 8 hours, with an average TiO2 content of 11.35%. iv. Recovery is 100% and no dilution was applied to these Reserves. |
1.16 Mining Methods
Mining will be conducted using conventional open pit methods (drill-blast-load-haul), by third-party contractor. The mine plan adopted a dilution of 3% for Campbell Pit, with 100% mining recovery, and for GAN and NAN Deposits, 5% dilution with 95% mining recovery.
Geotechnical studies were the basis for slope angle definition on Campbell Pit, with values extended to both GAN and NAN Deposits, as their geotechnical assessments are still under development.
The mining schedule was developed to support a 4 phases plan of production for Maracás Menchen Project:
- Phase 1 (2022-2023) is an ilmenite concentration plant (the "Ilmenite Plant") with a capacity to produce 150,000 tonnes of ilmenite concentrate per year at the mine site and a TiO2 pigment processing plant (the "Pigment Plant") with a capacity to produce 30,000 tonnes of TiO2 at a new site to be constructed in Camaçari, Bahia, an industrial suburb of Salvador;
- In Phase 2 (2024-2025) the Pigment Plant will be expanded to a nameplate capacity of 60,000 tonnes of TiO2 pigment per year, The Company will also undertake an expansion of the vanadium trioxide (the "V2O3 Plant") plant in Maracás to double the Phase 1 capacity of 14 tonnes per day to 28 tonnes per day to support the Company's Vanadium Re-dox Flow Battery ("VRFB") deployment plans;
- Phase 3 (2026-2028) will consider a further expansion of the Company's Pigment Plant at Camaçari to a capacity of 120,000 tonnes of pigment production per year, concurrently the Company will expand the Ilmenite Plant in Maracás to a new average production rate of approximately 425,000 tonnes of ilmenite concentrate per year in support its Pigment Plant expansion;
- Phase 4 (2029-2032) will occur as the Campbell Pit is depleted in 2032 at which point the Company expects to begin mining and processing of its NAN and GAN deposits. In this stage the Company plans to invest in duplicate crushing, milling, kiln and leaching circuits, increasing the V2O5 production to 15,900 tonnes.
The Life-of-mine (LOM) comprises of 20 years of operation, starting with Campbell Pit until 2032, where GAN and NAN Deposits start mining, with both lasting until 2041.
Aside from the material mined and scheduled from open pit operations, three ponds containing pre-processed non-magnetic tailings from vanadium magnetic separation are available to reclaiming and processing for titanium production. These ponds are to be reclaimed from years 2026 to 2033, complementing the ilmenite concentration feed.
The ROM with grade below the minimum acceptable by the Processing Plant, even though mineralized, will be excavated, loaded, transported and disposed in proper waste dumps, together with the waste mined, following the respective project designed and schedule for each dump. The waste disposition operation uses the ascending method, beginning during the construction of the heap at the base of this area. Waste rock will be disposed of by truck, which will then be uniformly distributed and leveled by an operator using a tractor.
1.17 Recovery Methods
This chapter has described the current production process used in Largo's vanadium plant and the processes that will be implemented in Phase 1 of Largo's expansion strategy. The current process comprises three stages of crushing, one stage of grinding, two stages of magnetic separation, magnetic concentrate roasting, vanadium leaching, ammonium meta-vanadate (AMV) precipitation, AMV filtration and from this step to a reactor remove ammonia and produce V2O3 or V2O5, both in powder. For V2O5 is possible to send the reactor product to a furnace to fuse the V2O5 into flakes. V2O3 powder, V2O5 powder and V2O5 flakes are final products.The future processes are related with the titanium production and will include the flotation of nonmagnetic tailings generated in Largo's vanadium plant in flotation cells, to produce an ilmenite concentrate and the chemical plant that will produce TiO2 that comprises a rotary dryer, a milling plant, a digestion step with sulfuric acid to "leach" the titanium from the ilmenite, a crystallization system to remove the iron, a thermal hydrolysis to precipitate the titanium in a hydroxide form, a rotary kiln, that produces TiO2 from the hydroxide and a superficial treatment step.
1.18 Project Infrastructure
The current and future infrastructure of Largos' vanadium plant is described. The current infrastructure comprises administrative buildings, mine structures (stockpiles, roads, explosive shed) and plant structures (industrial areas, laboratory, sheds). The future infrastructure comprises an ilmenite concentration plant, with its necessary equipment, an industrial shed and an utility building (Phase 1 of Largos expansion plan), the duplication of V2O3 production area (Phase 2 of Largos expansion plan), the expansion of the ilmenite concentration plant (Phase 3 of Largos expansion plan), the duplication of the vanadium production plant and the new roads for NAN and GAN pits (Phase 4 of Largos expansion plan). In addition, the future TiO2 pigment chemical processing plant was described which is to be constructed in industrial area of Camaçari city, at Bahia state (Phase 1 of Largos expansion plan) and will consider a complete pigment production plant with administrative buildings, ilmenite and pigment sheds, warehouses, a plant to regenerate the acid and produce sulfate salts and utility facilities.
1.19 Market Studies and Contracts
Vanadium is recovered principally from magnetite and titanomagnetite ores, either as the primary product or as a co-product with iron. It is also recovered as a secondary product from fly ash, petroleum residues, alumina slag, and from the recycling of spent catalysts used for some crude oil refining and which have accumulated vanadium. Roskill (2021) estimates that co-production with iron accounted for 72.6% of supply in 2014, primary production accounted for 17.6% and secondary production for the remainder.
Vanadium pentoxide is the principal intermediate product from treatment of magnetite ores, vanadiferous slags and secondary materials. It is used directly in non-metallurgical applications and in the production of a range of vanadium chemicals. It is also the starting material for production of ferrovanadium and master alloys. Most vanadium is used in the form of ferrovanadium as a steel additive.
Production and demand figures may be reported in terms of contained vanadium metal or the pentoxide (V2O5) equivalent. Trade statistics are reported in terms of gross weight.
World production in 2020 as estimated by the U.S. Geological Survey (USGS) is summarized in Table below. China, South Africa and Russia accounted for nearly 92.1% of world supply in 2020. South Africa is the largest producer of primary vanadium, followed by China. Production in Brazil commenced from Largo's Maracás operation in 2014. The United States no longer produces vanadium from primary sources but produces vanadium products based on secondary sources and imported material. (Table 1-6).
Table 1-6: World Mine Production of Vanadium.
Mine Production |
| 2019 | 2020* |
United States | 460 | 170 |
Brazil | 5,940 | 6,600 |
China | 54,000 | 53,000 |
Russia | 18,400 | 18,000 |
South Africa | 8,030 | 8,200 |
World Total (Rounded) | 86,830 | 85,970 |
*Estimated.
U.S. Geological Survey, 2021 Minerals Yearbook and Mineral Commodity Summaries. |
Co-production of vanadium with iron ore results in conditions in the iron ore industry having a direct impact on vanadium supply.
1.19.1 Demand
Roskill estimates that 93.1% of vanadium production is used in the steel industry in a wide range of steel formulations to meet a variety of end-use applications. (Roskill, 2021). It is also used in titanium-aluminum and other non-ferrous alloys, in catalysts for the production of maleic anhydride and sulphuric acid and petroleum fracking, in batteries and in a number of chemical applications.
Vanadium consumption trends reflect the general trend of steel making and production of high strength steel, in particular. In turn, conditions in the steel industry are affected by global economic conditions.
Vanadium increases the strength of a variety of steels by forming carbides and nitrides. For 2020, Roskill (2021) estimated that high strength low-alloy (HSLA) steels accounted for about 85 % of use of vanadium in steels. In these applications, HSLA steels provide increased strength and weldability and reduced weight compared with other steels. Full alloy steels are the second largest market for vanadium in the steel industry, followed by tool and carbon steels.
As noted above, most vanadium is used in the form of ferrovanadium as a steel additive. Ferrovanadium is available containing 45 % to 50 % V and 80 % V. The 80 % V grade material is produced by reduction of the pentoxide (V2O5) or trioxide (V2O3), generally using the aluminothermic process. Lower grade ferrovanadium is generally produced by reduction of slag or other vanadium-containing feedstocks by the silicothermic process.
Titanium alloys are the principal non-ferrous alloys using vanadium. These have high strength to weight ratios and are used in aircraft components, including structural elements, hydraulic systems and jet engine parts. The vanadium used in the form of vanadium-aluminum master alloys.
1.19.2 Vanadium Prices
Ferrovanadium and vanadium pentoxide are the principal commercially traded vanadium products. Neither these, nor any other vanadium products are traded by means of an exchange or terminal market such as the London Metal Exchange or COMEX Division of the New York Mercantile Exchange (NYMEX). Prices for ferrovanadium and vanadium pentoxide are quoted in publications including Metal Bulletin (ferrovanadium and vanadium pentoxide) and CRU (ferrovanadium and vanadium pentoxide).
Transactions are usually negotiated under 12-months contracts between producers and consumers or trading houses. Prices are generally quoted in terms of US dollars per pound or per kilogram gross weight of contained vanadium pentoxide or vanadium.
Figure 1.1 illustrates the trend in vanadium pentoxide prices over the past 12 years from November 2009.
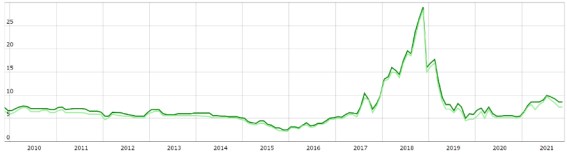
Figure 1.1: Vanadium Pentoxide Price Trend (US$/lb V2O5).
Metal Bulletin, data provided by Largo.
Over the past 12 years prices peaked at US$29 /lb V2O5 in 2018 and hit a low of US$2.25 /lb V2O5 in 2015. Accounting for inflation, the average price was US$ 7.87/lb V2O5 since the start of reporting by Metal Bulletin in 1997.
In its report, commissioned by Largo in 2021, Roskill forecasts sustained high prices for V2O5 over the coming years due to favourable supply/demand dynamics: Table 1-7.
Table 1-7: Roskill Price Trend (US$/lb V2O5).
| 2021 | 2022 | 2023 | 2024 | 2025 | 2026 | 2027 | 2028 | 2029 | 2030 |
V2O5 Standart | 6.70 | 8.64 | 8.68 | 8.05 | 7.01 | 7.80 | 7.80 | 7.80 | 7.80 | 7.80 |
HP V2O5 Premium | 1.50 | 1.50 | 1.80 | 2.00 | 2.10 | 2.20 | 2.30 | 2.40 | 2.50 | 2.50 |
HP V2O5 Price | 8.20 | 10.14 | 10.48 | 10.05 | 9.11 | 10.00 | 10.10 | 10.20 | 10.30 | 10.30 |
V2O3 Premium(%) | 21.35 | 21.35 | 21.35 | 21.35 | 21.35 | 21.35 | 21.35 | 21.35 | 21.35 | 21.35 |
V2O3 Price | 8.13 | 10.49 | 10.53 | 9.77 | 8.51 | 9.47 | 9.47 | 9.47 | 9.47 | 9.47 |
Source: Roskill (2021).
1.19.3 Ilmenite Prices
Ilmenite is a titanium-iron oxide mineral. From a commercial perspective, ilmenite is the main source of titanium dioxide, which is used in paints, printing inks, fabrics, plastics, paper, sunscreen, food and cosmetics.
Transactions are usually negotiated under 3 to 12-month contracts between producers and consumers or trading houses. Prices are generally quoted in terms of US dollars per tonne.
Figure 1.2 illustrates the trend in Ilmenite prices over the past 4 years from December 2017.
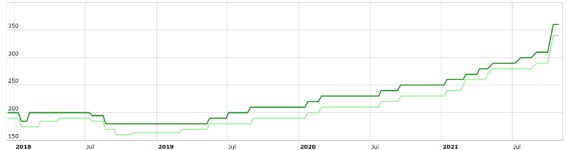
Figure 1.2: Ilmenite Price Trend (US$/t).
Metal Bulletin, data provided by Largo.
1.19.4 Titanium Pigment Prices
Titanium dioxide is the inorganic compound with the chemical formula TiO2. It is a white, water-insoluble solid, although mineral forms can appear black. As a pigment, it has a wide range of applications, including paint, sunscreen, and food colouring. It is estimated that titanium dioxide is used in two-thirds of all pigments, and pigments based on the oxide have been valued at $13.2 billion.
Transactions are usually negotiated under 3 to 12-month contracts between producers and consumers or trading houses. Prices are generally quoted in terms of US dollars per tonne.
Figure 1.3 illustrates the trend in Titanium pigment prices over the past 4 years from January 2018.
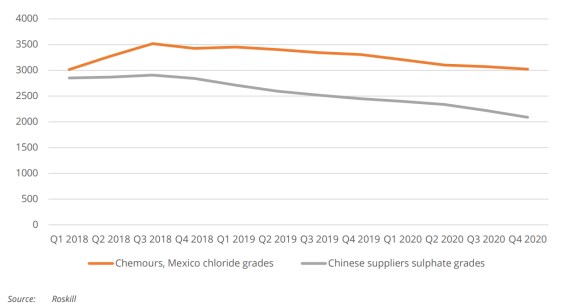
Figure 1.3: Benchmark imported TiO2 pigment prices (US$/t, CIF Brazilian port).
Roskill, data provided by Largo.
1.19.5 Outlook
Roskill believes that China's TiO2 pigment export price to world markets fell to an average of US$1,950/t (FOB China) in 2020 and this is expected to be the nadir of the current price cycle. There were several waves of price increases posted by major Chinese suppliers near the end of 2020 and the effect of COVID on supply chain and production pushed prices higher than 3,000/t in 2021 and Roskill anticipates sustained prices above US$3,500 over the medium/long run.
1.19.6 Contracts
For the year 2021, Largo committed approximately 85% of its forecasted production under long term, 12 months or more, agreements with vanadium end users, converters and trader in the steel, aerospace and chemical industries. The balance material was sold in the spot market according to availability and demand from time to time. The yearly negotiations for 2022 is ongoing as of November 6th 2021 and expected to be finalized by mid-December 2021.
1.19.7 Selling Prices adopted
GE21 adopted the following selling prices in Table 1-8 below in the economic analysis presented in this report.
Table 1-8: Selling Price.
Description | Unit | 2022 | 2023 | 2024 | 2025 | 2026 | 2027 | 2028 | 2029 | 2030 to 2041 |
Average Dollar | R$/US$ | 5.10 | 5.10 | 5.10 | 5.10 | 5.10 | 5.10 | 5.10 | 5.10 | 5.10 |
Tonnes / lb | nº | 2,204.62 | 2,204.62 | 2,204.62 | 2,204.62 | 2,204.62 | 2,204.62 | 2,204.62 | 2,204.62 | 2,204.62 |
Vanadium - V2O5 standard | US$/lb | 8.64 | 8.68 | 8.05 | 7.80 | 7.80 | 8.20 | 8.20 | 8.20 | 8.20 |
Vanadium - V2O5 Premium | US$/lb | 1.50 | 1.80 | 2.00 | 2.10 | 2.20 | 2.30 | 2.40 | 2.40 | 2.40 |
Vanadium Premium - Sale Price | US$/lb | 10.14 | 10.48 | 10.05 | 9.90 | 10.00 | 10.50 | 10.60 | 10.60 | 10.60 |
Vanadium Premium - % of sales | % | 25.0% | 25.0% | 25.0% | 25.0% | 25.0% | 25.0% | 25.0% | 25.0% | 25.0% |
Ilmenite - Sale Price | US$/Tonne | 210.00 | 210.00 | 210.00 | 210.00 | 210.00 | 210.00 | 210.00 | 210.00 | 210.00 |
Titanium (Pigment) - Sale Price | US$/Tonne | 2,884.00 | 3,136.00 | 3,332.00 | 3,528.00 | 3,696.00 | 3,696.00 | 3,668.00 | 3,724.00 | 3,836.00 |
1.20 Capital and Operating Costs
The capital cost estimate includes all direct and indirect costs, along with the appropriate contingencies necessary for production. All equipment and materials are considered new.
The CAPEX estimate for Phase 1 meets the international AACE Class 3 classification standard defined as having an intended accuracy of ± 15%. For phases 2 to 4 the capital cost estimate has the level of accuracy for an AACE Class 4 estimate that ranges from -15% to 50% accuracy.
For Phase 1 of the project, which includes the implementation of the Ilmenite Plant for the production of 150 kt/year and the Pigment Plant for the production of 30 kt/year. The investment in the Ilmenite Plant will take place in the year 2022, with production starting in 2023. For the chemical Pigment Plant, investments will be made in the years 2022 and 2023, with production starting in 2024.
Phase 2 consists of the implantation of the expansion of the Pigment Plant to 60kt/year and expansion of the V2O3 plant to 28t/day. Both investments will be carried out between the years 2024 to 2025, starting operations in 2025 for the V2O3 plant and 2026 for the Pigment Plant.
Phase 3 consists in expansion of the Pigment Plant to 120 kt/y and the expansion of the Ilmenite Plant to 1.1 Mt/year, with investments scheduled between 2026 and 2027, starting operations in 2028. In 2031 there is a mining preparation CAPEX for GAN and NAN that includes pre-stripping and the haul road preparation of 6 km linking NAN to Campbell beneficiation plant.
Phase 4 consists in expansion of the Vanadium Plant to 15.9 kt/y of flake, with investments scheduled between 2029 to 2032. In 2032 the Campbell Pit will be depleted and mining operations will shift to the GAN and NAN deposits. GAN and NAN will cease operations in 2041. Table 1-9 summarizes the Project's CAPEX, Sustaining CAPEX, and Mine Closure estimates for project in their respective years.
| Period | 2022 | 2023 | 2024 | 2025 | 2026 | 2027 | 2028 | 2029 | 2030 | 2031 | 2032 | 2033 | 2034 | 2035 | 2036 | 2037 | 2038 | 2039 | 2040 | 2041 | 2042 | 2043 | 2044 | 2045 |
Investiment | Millions (US$) |
Phase 1 | Ilmenite Concentration Plant 770 kt/year | 25.2 | | | | | | | | | | | | | | | | | | | | | | | |
TiO2 pigment plant 30 kt/year | 50.7 | 45.7 | | | | | | | | | | | | | | | | | | | | | | |
Phase 2 | V2O3 Plant 7 kt/year | | | 4.7 | | | | | | | | | | | | | | | | | | | | | |
TiO2 pigment Plant 60 kt/year | | | 29.9 | 29.9 | | | | | | | | | | | | | | | | | | | | |
Phase 3 | Ilmenite Concentration Plant 1.1 Mt/year | | | | | 18.3 | 18.3 | | | | | | | | | | | | | | | | | | |
TiO2 pigment Plant 120 kt/year | | | | | 66.0 | 66.0 | | | | | | | | | | | | | | | | | | |
Roads / 1ccess to NAN&GAN | | | | | | | | | | 0.9 | | | | | | | | | | | | | | |
Pre-Stripping GAN | | | | | | | | | | 0.7 | | | | | | | | | | | | | | |
Pre-Stripping NAN | | | | | | | | | | 3.0 | | | | | | | | | | | | | | |
Phase 4 | V2O5 Expansion Second Kiln | | | | | | | | 23.1 | 69.2 | 92.3 | 46.1 | | | | | | | | | | | | | |
TOTAL CAPEX | 75.9 | 45.7 | 34.6 | 29.9 | 84.3 | 84.3 | - | 23.1 | 69.2 | 96.9 | 46.1 | - | - | - | - | - | - | - | - | - | - | - | - | - |
SUSTAINING CAPEX | 6.6 | 5.7 | 8.7 | 7.0 | 10.1 | 11.1 | 13.7 | 10.7 | 14.2 | 14.3 | 14.2 | 15.3 | 18.9 | 15.2 | 21.7 | 17.4 | 15.6 | 7.1 | 6.3 | - | - | - | - | - |
TOTAL CAPEX+SUSTAINING CAPEX | 82.5 | 51.4 | 43.3 | 36.9 | 94.3 | 95.4 | 13.7 | 33.8 | 83.4 | 111.2 | 60.3 | 15.3 | 18.9 | 15.2 | 21.7 | 17.4 | 15.6 | 7.1 | 6.3 | - | - | - | - | - |
MINE CLOSURE | - | - | - | - | - | - | - | - | - | - | 1.5 | 1.5 | - | - | - | - | - | - | - | 19.4 | 0.9 | 0.8 | 0.2 | 0.2 |
Table 1-9: CAPEX summary
1.20.1 Sustaining Capital Cost
The sustaining cost estimation from 2022 to 2032 is US$ 10.58 M/y on average and for the years 2033 to 2041 the estimate is US$ 13.06 M/y, already including new plants and respective expansions.
1.21 Economic Analysis
The project estimates an NPV (7%) for Largo of US$ 2.0 billions post-tax and US$ 2.8 billions pre-tax. Economic study analyzed Largo Inc.'s Investment Plan from 2022 to 2041 as a whole and its benefit to the company's strategy. In this way, the calculated NPV, reflect the value of the company in its current situation together with the benefits of the projected investments.
Maracas Menchen Project is a singular project (a running project), economics parameters indicators as IRR and Payback can't be calculated separated for each project phases. GE21 carried out a study aiming to present marginal results associated with the parameters. Marginal result for Internal Rate of Return (IRR) is 47.85% and Discounted Payback 6.1 years related to the whole project, not considered for individual investments or expansions.
1.22 Interpretation and Conclusions
This Updated Mineral Reserves for Campbell Pit and PFS for GAN and NAN are based on a combination of geological, geotechnical, and metallurgical studies which, taken together, establish vanadium and titanium pigment production from Maracás Menchen complex is both technically and economically feasible.
GE21 developed a Mineral Resource and Mineral Reserve for Campbell Pit, GAN and NAN. QP Marlon Sarges Ferreira (MAIG) is responsible for Mineral Resources Estimate and QP Guilherme Gomides Ferreira (MAIG) is responsible for Mineral Reserves estimation. QP Porfirio Cabaleiro Rodriguez (FAIG) is responsable for Technical Report and supervised the production of all sections of the Technical Report.
Mineral Reserves estimate for Campbell Pit, GAN and NAN deposits together, resulted in a total Reserves of 60.4Mt @0.79%V2O5 head grade and 8.24%TiO2 head grade. Furthermore, Non-Magnetic Tailings Ponds comprise a total Probable Reserves of 3.6Mt @11.35% TiO2.
Maracás Vanadium Project is an open-pit design utilizing a contract mining fleet of 2.5m3 bucket small-hydraulic excavators, 2.5m3 bucket front-end loaders and 36-tonne trucks. Mine plan model for Campbell Pit defined a 3% dilution and a 100% mining recovery based on reconciliation data provided by Largo. For GAN and NAN mine plan models used an assumption of 5% dilution and 95% of mining recovery. Ponds recovery was used as assumption 93% as presented in chapter 16.
In 2022, Largo Inc. will start a series of expansions of the vanadium plant and implementation of new processing plants for Ilmenite and pigment generation. These expansions and implementation will extend to 2032 as described below:
- Phase 1: Ilmenite Concentration Plant 150 kt/y + TiO2 Pigment Processing Plant 30kt/year. Construction period is scheduled for 2022-2023;
- Phase 2: TiO2 Pigment Processing Plant + Vanadium Trioxide Plant Expansions (2024-2025);
- Phase 3: TiO2 Pigment Processing + Ilmenite Concentration Plant Expansions (2026-2028) + Site preparation for GAN and NAN (roads/access and pre-stripping);
- Phase 4: V2O5 Expansion Second Kiln (2029-2032) with start of mining operations at GAN and NAN.
To support this expansions and new plants, mining scheduling has 20 years of production, in the first 10 years of production from 2022 to 2031, the vanadium plant uses 100% material from Campbell Pit. In 2032 a transition year, the vanadium plant will be fed with Campbell Pit, GAN and NAN. From 2033 onwards material fed into the vanadium plant will be a blend of 45% GAN and 55% NAN (an expectation), with both mines expected to be exhausted in 2041.
Non-magnetic ponds material recovery will start in 2026 with the start of operation of Pigment Plant, which will be fed together with the tailings coming from the Vanadium Plant. Tailings ponds reserves will deplete in 2033, after exhausted tailings ponds, Ilmenite plant and Pigment plant will be fed with the non-magnetic tailings from GAN and NAN deposits where the titanium concentration will be sufficient to secure production.
Based on expansions and new plants described above, Largo's production will be:
From 2022 to 2032
Flake 99.5% production average - 13.4 kt/year;
Ilmenite production average from 2023 to 2032 - 243.6 kt/year;
Pigment production average from 2024 to 2032 - 86.7 kt/year.
From 2033 to 2041
Flake 99.5% production average - 14.3 kt/year;
Ilmenite production average from 2023 to 2032 - 217.6 kt/year.
Pigment production average from 2024 to 2032 - 109.5 kt/year.
Based on economic-financial parameters and products generation, discounted cash flow scenario was developed to assess the Project. The Project estimates an NPV (7%) for Largo of US$ 2.0 billion post-tax and US$ 2.8 billion pre-tax. Maracas Menchen Project is a singular project (a running project), economics parameters indicators as IRR and Payback can't be calculated separated for each project phases. GE21 carried out a study aiming to present marginal results associated with the parameters. Marginal result for Internal Rate of Return (IRR) is 47.85% and Discounted Payback 6.1 years related to the whole project, not considered for individual investments or expansions.
2 INTRODUCTION
This report contains "An Updated Life of Mine Plan ("LOMP") for Gulçari A ("Campbell Pit") and Pre-Feasibility Study for Novo Amparo Norte ("NAN") and Gulçari A Norte ("GAN") deposits, Maracás Menchen Project, Bahia, Brazil". The Company has undertaken a comprehensive optimization study for the Maracás Menchen Mine, with the objectives of improving forecast vanadium production efficacy and extending mine life. Drilling and engineering work performed on the Campbell Pit, and NAN and GAN deposits, sustained this update and the addition in Resource Mineral of titanium dioxide.
GE21 was hired by Largo to prepare an updated Life of Mine Plan ("LOMP") for Gulçari A ("Campbell Pit") and Pre-Feasibility Study for Novo Amparo Norte ("NAN") and Gulçari A Norte ("GAN") deposits. The Project (as defined below) is located within the greater municipality of Maracás in eastern Bahia State, Brazil. Maracás lies about 250 km southwest of the City of Salvador, the capital of Bahia.
The Maracás Menchen Project consists of eighteen (18) concessions with a total area of approximately 18,000 ha (the "Project"). Three of this concession, including the original two mining concessions (DNPM 870134/82 and DNPM 870135/82) and are held by Vanadio de Maracás S.A. which is controlled 99.9% directly and indirectly by Largo. The remaining 15 concessions are owned by Largo Mineração Ltda., a wholly owned subsidiary of Largo.
The principal Qualified Person with respect to the objectives of this report is Mining Engineer Porfírio Cabaleiro Rodriguez. Mr. Rodriguez is a mine engineer that has 43 years of experience in the field of mineral resource and reserve estimation. He possesses considerable experience dealing with various commodities, such as phosphate, iron, uranium, gold and nickel ore, in addition to rare earth elements, among others. Mr. Rodriguez is a Fellow of the Australian Institute of Geoscientists (FAIG).
2.1 Qualifications, Experience, and Independence
GE21 is an independent mineral consulting firm based in Brazil formed by a team of professionals accredited by the Australian Institute of Geoscientists ("AIG") as Qualified Persons for declaration of Mineral Resources and Mineral Reserves in accordance with NI 43-101.
Each of the authors of this Report has the appropriate qualifications, experience, competence, and independence, to be considered as a Qualified Person ("QP"), as defined in NI 43-101. Neither GE21 nor the authors of this Report have or have had any material interest in Largo or related entities. The relationship with Largo is solely professional, acting as an independent consultant. Payment of service fees is not related to the results of this Report.
The Lead Qualified Person of this Report is Eng. Porfirio Cabaleiro Rodriguez, a mining engineer with over 43 years of experience in Mineral Resource and Mineral Reserve estimates. Eng. Rodriguez is a Fellow of the Australian Institute of Geoscientists (FAIG).
Geologist Marlon Sarges Ferreira has over 15 years of experience in resource modelling and estimation. Geol. Ferreira is a member of the Australian Institute of Geoscientists (MAIG).
The independent QP responsible for this report's content on issues related to Data Verification is Fábio Valério Câmara Xavier (MAIG, B.Sc.), a Geologist, who has at least 18 years of experience in mineral Industry.
Mining Engineer Guilherme Gomides Ferreira has over 16 years experience in open-pit mining with focus on mining planning (pit optimization, mining scheduler and fleet), economics analysis, (CAPEX/OPEX, DCF), risk analysis, and Mineral Reserve estimates. Eng. Ferreira is a member of the Australian Institute of Geoscientists (MAIG).
Table 2-1 presents the summary information about QPs. The Qualified Person certificate are presented below.
Table 2-1 Qualified Persons
Company | Qualified Person | Site Visit | Section Responsibility |
GE21 | Porfirio Cabaleiro Rodriguez, FAIG | not inspected the property | Lead QP. Overall responsibility on behalf of GE21, as informed on following Certificate |
GE21 | Fabio Valerio Xavier, MAIG | 3 days duration in May 2021 | Data Verification |
GE21 | Guilherme Gomides Ferreira, MAIG | 3 days duration in May 2021 | Mineral Reserves and Mine Planning, as informed on following Certificate |
GE21 | Marlon Sarges Ferreira, MAIG | not inspected the property | Geological and geotechnical studies, as informed on following Certificate |
2.2 Effective Date
Mineral Resources Estimate for the Maracás Menchen Project has an effective date of July 12, 2021 for reviewed deposits. For Mineral Reserve Estimate are effective as at October 10, 2021.
2.3 Units of Measurement
The units of measurement used in this report are all metric (DATUM SIRGAS 2000), in accordance with the International System of Units (SI).
Unless indicated otherwise, all monetary units are expressed in Brazilian Reais (R$) or United States Dollars (US$). Although some cost figures have been taken from local sources in Brazil, each of these figures were converted to US$ for the compilation and presentation of the financial analysis.
An exchange rate of R$ 5.10 = 1US$ was applied throughout study
3 RELIANCE ON OTHER EXPERTS
On issues related to ownership and mineral concession rights, the authors rely on legal opinions given to the Company by Stocche Forbes namely that the Company does have a legal right to 100% of the surface rights required for the Maracás Menchen Project through its Brazilian subsidiary, and that its mineral concession rights are in good standing with the Agência Nacional de Mineração (ANM), the Brazilian federal agency that regulates and oversees mining. GE21's QP Marlon Sarges Ferreira verified on ANM's online platform that status of each of the eighteen Mineral Concessions is in accordance with the information in this Report.
Information regarding the status of environmental licensing procedures, market conditions, and contracts, are based on information described by, or obtained from Largo.
4 PROPERTY DESCRIPTION AND LOCATION
4.1 Location
The Maracás Menchen Mine is located in the greater municipality of Maracás in Bahia State in eastern of Brazil Figure 4.1. Maracás is approximately 250 km southwest of Bahia's capital city, Salvador. The distance by road from Salvador to the Project is 405 km via a paved secondary road from the main coastal highway in Bahia. The Project is accessed by a 50 km secondary highway and a gravel road west of Maracás. Access to water, the electric power grid and a railroad are within a reasonable distance, and a trained workforce familiar with the mining and mineral exploration industries can be found in the State of Bahia and also within the country generally.
The City of Maracás has a population of approximately 20,393 inhabitants (IBGE 2010 Census) engaged primarily in the agriculture and livestock industries and a skilled labor force for mining activities. Mineral exploration/concession licenses are isolated from other mining and mineral exploration properties.
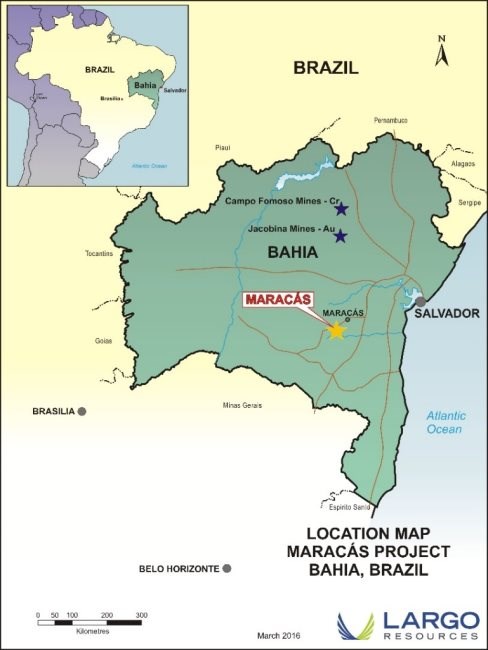
Figure 4.1 Maracás Menchen Mine Location Map.
4.2 Mineral Title in Brazil
In Brazil, mineral resources are the property of the Federal Government under the Federal Constitution of 1988 and are governed by the Federal Mining Code of 1967 (the "Mining Code"), as significantly amended in 1996. Additional changes regarding the administration of the Mining Code and the royalty (CFEM) legislation applicable to mineral products were introduced in 2017. The 2017 amendments resulted in the creation of the National Mining Agency (ANM) to replace the former National Department of Mineral Research (DNPM) and, with respect to the CFEM, the increase of the royalty from 1% NSR to 2% of gross revenue and disallowing the deduction of certain costs (such as transport and insurance costs) which had previously been permitted. The effect of these measures is captured in in the economic projections of the assets, as described in Chapter 22 - Economic Analysis.
In June 2018, the executive branch enacted new regulations under the Minubf Code. These new regulations did not require the approval of the legislature and focused on simplifying the process of conversion of an exploration license to a concession license either as permitted under the Mineral Code or through the performance of complimentary work after the submission of a final mineral research report. Neither the process of obtaining a mining rights concession nor the investment commitments for each license was affected by the new regulations. As of the effective date of this Report, the authors do not foresee any significant changes in Brazilian mineral legislation which would affect the Company's operations.
4.3 Mining Legislation, Administration and Rights
As mentioned in the section above, the ANM is the federal agency with the right to manage, regulate and supervise mining activities in Brazil, under the coordination of the Ministry of Mines and Energy (MME). Exploration and mining rights are granted by the ANM to Brazilian citizens and legal entities incorporated in Brazil. In general, there are no restrictions on foreign participation in these entities.
Surface rights owners, which can be either private owners or federal, state and municipal governments, are entitled to a royalty payable on extracted minerals. The CFEM varies from 1% to 3.5% depending on the mineral substance and is divided between the federal, state and municipal levels. If any minerals are extracted from private land that is not owned by the Project, the landowner is entitled to a royalty equivalent to 50% of the amount payable under the CFEM.
Legally, holders of an exploration license have the right to perform research in the licensed area, regardless of whether the surface rights are publicly or privately held, so long as the owner or occupant of the surface rights is financially compensated (lease) and the affected area is environmentally reclaimed after the research is completed. The amount of compensation payable to the surface rights owner (or occupant) is not fixed under the Mining Code and varies on a case-by-case basis. However, the Mining Code does state that if a court is required to fix the values, the rent for land occupation may not exceed the maximum net profit that the owner or occupant would earn from agricultural activity on the licensed the property and the indemnity may not exceed the assessed value of the area of the licensed property intended.
In response to the Brumadinho disaster, new regulations and laws were enacted regarding the design, operation and monitoring of tailings dams as outlined. On October 1, 2020, Law nº. 14,066/2020 was enacted, which amended the National Dam Security Policy. As at the time of this Report, the Company continues to work with ANM to assess any requirements for operational changes and or additional monitoring requirements for its tailings facilities. The authors of this report reviewed the new legislative requirements and did not identify any material risk factors associated with compliance with the new legislation or any impacts on the extraction of existing mineral reserves.
4.4 Mineral Exploration Licenses
Mineral exploration licenses are granted for up to three years and can be renewed for a further three years upon the approval of the ANM following an inspection and compliance with certain environmental requirements. The size of an individual license area ranges from 50 hectares ("ha") to 10,000 ha, depending on the state in which the license in sought.
4.5 Mineral Concessions
Mining concessions are valid until such time that the deposit for which the concession was granted is exhausted. The concession holder is required to comply with any additional conditions imposed by the ANM and applicable laws.
A specific type of mining concession is available for areas smaller than 20 ha and for mineral resources required for the construction sector, neither of which is relevant in the context of this Report.
4.6 Annual Fees and Reporting Requirements
Annual license fees for Exploration Licenses are based on size and are calculated at US$ 0.64/ha for the first license term and US$0.98/ha in subsequent terms. Each license holder must submit an exploration plan, budget and timeline, although there is no work or expenditure requirement. Licenses require an interim report two-months prior to license expiration (if an extension is to be applied for), describing exploration results, interpretation and expenditures. The renewal of a license may be granted at the discretion of the ANM considering the exploration works undertaken by the holder. A final report is due at the end the term or on relinquishment of the license.
Within this context of updating the laws, Largo has adapted to these main items below:
Government royalty payments changed from 1% NSR to 2% of gross revenue;
Align Brazil's mineral reserve and research report formats with international reports subject to international codes, such as NI 43-101.
4.7 Largo Mineral Tenure
Largo's mining rights consist of eighteen (18) concessions, including 15 mineral exploration licenses and 3 exploitation licenses (one granted and two pending), as highlighted in green in Figure 4.2 below, totaling almost 18,000 ha (see Figure 4.3). The concessions are listed in Table 4-1.
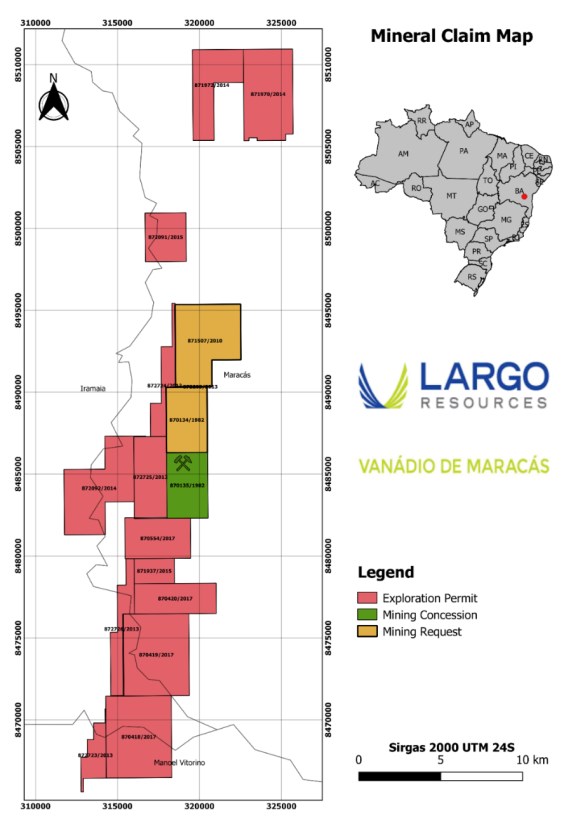
Figure 4.2: Largo Mineral Tenure Location Map.
Table 4-1: Largo Mineral Tenure.
Holder | DNPM | Publication
Date | Substance | Granted Area
(ha) | Status | Research deadline | Deadline for the Final
Research Report
(resolution 55)(1) | City |
VMSA | 870.134/1982 | 07/15/83 | V, Ag | 1,000 | Mining concession pending | Mining concession pending | Not applied | Maracás |
VMSA | 870.135/1982 | 02/03/1983 | V, Fe, Ag | 1,000 | Mining concession granted | Not applied | Not applied | Maracás |
VMSA | 872.202/2013 | 22/03/2017 | V | 115,59 | Exploration Permit | 3 years | 29/09/2024 | Manoel Vitorino |
VMSA | 872.203/2013 | 18/10/2018 | V | 6,42 | Exploration Permit | 3 years | 29/04/2023 | Maracás |
VMSA | 872.723/2013 | 18/10/2018 | V | 413,71 | Exploration Permit | 3 years | 29/04/2023 | Iramaia, M. Vitorino |
VMSA | 872.724/2013 | 18/10/2018 | V | 495,75 | Exploration Permit | 3 years | 29/04/2023 | Maracás |
VMSA | 872.725/2013 | 18/10/2018 | V | 988,46 | Exploration Permit | 3 years | 29/04/2023 | Maracás |
VMSA | 872.726/2013 | 18/10/2018 | V | 593,75 | Exploration Permit | 3 years | 29/04/2023 | Iramaia e Maracás |
VMSA | 871.507/2010 | 05/09/2013 | V | 1.713,88 | Mining permit application | R.F.P.P. | Not applied | Maracás |
VMSA | 870.540/2012 | 16/03/2017 | V | 1.439,15 | Exploration Permit | 3 years | Not applied | Maracás |
VMSA | 871.485/2016 | 17/10/2016 | Fe,V | 1.887,73 | Exploration Permit | 3 years | 29/09/2024 | Maracás |
VMSA | 871.483/2016 | 17/10/2016 | Fe,V | 1.833,58 | Exploration Permit | 3 years | 29/09/2024 | Maracás |
VMSA | 871.937/2015 | 14/03/2016 | V | 375,87 | Exploration Permit | 3 years | 29/03/2024 | Maracás |
VMSA | 872.263/2016 | 30/03/2017 | V | 11,11 | Exploration Permit | 3 years | 29/09/2024 | Maracás |
VMSA | 870.418/2017 | 06/12/2017 | V, Fe, Ti, Pt | 1.999,81 | Exploration Permit | 3 years | 29/09/2024 | Iramaia, Maracás, M. Vit. |
VMSA | 870.419/2017 | 06/12/2017 | V, Fe, Ti, Pt | 1.999,56 | Exploration Permit | 3 years | 29/09/2024 | Iramaia e Maracás |
VMSA | 870.420/2017 | 06/12/2017 | V, Fe, Ti, Pt | 926,91 | Exploration Permit | 3 years | 29/09/2024 | Maracás |
VMSA | 870.554/2017 | 27/06/2017 | V, Fe, Ti, Pt | 981,52 | Exploration Permit | 3 years | 29/09/2024 | Maracás |
(1) As noted earlier in this chapter, if a concession holder files a negative Final Research Report on an exploration concession or, in the case of a positive report, does not apply for the extension or conversion into a mining concession, the exploration concession will expire.
Largo reports that most mining rights are registered as mineral exploration licenses. A mining concession was granted to DNPM 870.135/1982. Mining concession DNPM 870.134/1982 is stillpending, but the Installation Permit (LI) has been granted. There is no tax on mineral exploration licenses until an exploration license is granted.
VMSA executed an agreement with Companhia Baiana de Pesquisa Mineral (CBPM) for acquire 90% of the stakes in mining rigths (DNPM 870.135/1982 and DNPM 870.134/982). In this agreement, Largo was required to maintain the exploration licenses in good regulatory condition. On December 22, 2012, VMSA purchased the decrees from Vale and Odebrecht, giving Largo 100% ownership of mining rights. The other mineral rights were obtained by mineral concurrence following the rules defined by the ANM.
Largo states that, to its knowledge, there are no environmental liabilities on mining decrees.
The Geological Service of Bahia - CBPM, owns the mining rights of most of the adjacent deposits, other than Novo Amparo Norte, which is wholly owned by VMSA. In the agreement between VMSA and CBPM, there is a royalty clause stating that 3% of gross sales revenue will be allocated to CBPM.
The Project's activities are carried out on 41 properties enrolled on at the Real Estate Registry Office of Maracas. These properties are registered under the name of Banco Economico S.A, which is a party to a Free Lease Agreement (Contrato de Comodato) with Econômico Agropastoril e Industrial S.A. ("EAP") and an intervening consenting party to the Rural Lease Agreement and Easement Right mentioned below. Largo's surface and access rights to the properties are held pursuant to a Rural Lease Agreement (Contrato Particular de Arrendamento) and public deed of Easement (Escritura de Servidão) dated May 30, 2011, among VMSA, Mineração Campo Alegre de Lourdes Ltda. (a Largo controlled subsidiary), EAP and Banco Econômico S.A.
In addition to the required surface rights for the mined areas, Largo has negotiated access rights and necessary surface rights for its exploration concessions. The Company intends to enter negotiations with individual landowners or leasees for the surface rights required to undertake mining activities at NAN and GAN significantly in advance of 2032. Should any of such negotiations be unsuccessful, Largo has the right to apply to the local court to establish a compensation fee to be paid to the surface rights holder in exchange for the surface rights required to perform the mining activity.
Figure 4.3 shows the sketch of the non-mining rights of the property.
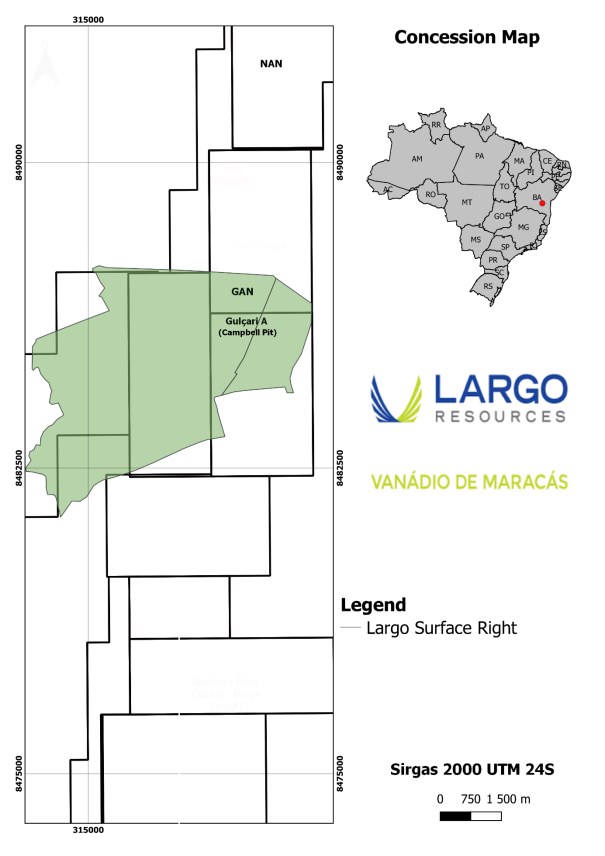
Figure 4.3: Property area related to Mineral Rights.
4.8 Environmental Liabilities and Permits
Largo's environmental liabilities are currently related to the Campbell Pit operation. The Environmental reclamation of these activities is supervised by the Instituto do Meio Ambiente e Recursos Hídricos (Bahia State Institute of Environment and Water Resources) ("INEMA"), which is a government run entity overseen by the Secretariat of Environment of the State of Bahia.
No significant factors or risks were identified by GE21 that could jeopardize the logistics, surface rights, mining rights and/or experience required to perform work on Largo mining right.
Largo filed the renewal of the Campbell Pit environmental license, and this action considers this LO in effect until the regulatory authority has issued its opinion. A production change was also requested for the mine expansion plan.Table 4-2 summarizes Largo's current environmental permits.
Largo posesses all the necessary permits and licenses to conduct its current activities and has applied to ANM to add TiO2 to the list of elements authorized for exploitation under the mining concessions covering the Campbell Pit. The Company plans to convert its current exploration licenses covering the relevant portions of the NAN and GAN deposits into mining concessions prior to the beginning of mining at such deposits in 2032. A further discussion of the Company's timeline for applying for the necessary environmental permits and licenses is set out in Chapter 20.
Environmental Licenses |
Process number | Opening date | Status | Formation date | Ordinance/Certified | License | Issuance date | Expiration date |
2019.001.005745/INEMA/LIC-05745 | 18/10/2018 | Formed | 43 721 | 22 245 | Granting the use of water resources | 02/05/2021 | 02/05/2025 |
2019.001.007534/INEMA/LIC-07534 | 21/08/2019 | Formed | 11/21/2019 | 21 302 | Alteration License (L.A) - Waste rock stack 2 and BCl03 and Vegetation Suppression Authorization (ASV) | 8/26/2020 | 08/26/2022 |
2020.001.001535/INEMA/LIC-01535 | 09/12/2019 | Docketed Process | 03/04/2020 | N/A | FeV alteration license | N/A | N/A |
2020.001.003148/INEMA/LIC-03148 | 11/03/2020 | Formed | 06/01/2020 | 21 121 | V2O3 Modification License | 07/29/2020 | 07/29/2022 |
2020.001.006773/INEMA/LIC-06773 | 18/05/2020 | Docketed Process | 12/04/2020 | N/A | Renewal of Operating License | N/A | N/A |
2021.001.008493/INEMA/LIC-08493 | 10/05/2021 | Docketed Process | 12/02/2021 | N/A | Ilmenita alteration license | N/A | N/A |
2021.001.006045/INEMA/LIC-06045 | 09/04/2020 | Formed | 09/02/2021 | 2021.001.001855/DTRP | Hazardous Waste Transport Declaration (DTRP) | 09/02/2021 | 09/02/2022 |
2021.001.000158/INEMA/JUR-00158 | 16/07/2021 | Formed | 07/16/2021 | 23 486 | Alteration of ALRS Corporate Name | 07/19/2021 | N/A |
2021.001.000660/INEMA/LIC-00660 | 06/11/2020 | Filed Process | 02/12/2021 | N/A | Alteration License BNM04 | N/A | N/A |
2021.001.026926 /INEMA/REQ | 25/03/2021 | Requeriment Docketed | N/A | N/A | Vegetation Suppression Authorization (ASV) of concession 872.726/2013 | N/A | N/A |
2021.001.047248 /INEMA/REQ | 04/06/2021 | Requeriment Docketed | N/A | N/A | Fauna Management Authorization - AMF | N/A | N/A |
| | | | | | | |
N/A= Not applicable | | | | | | | |
Table 4-2: Largo Enviromental Permits
5 ACCESSIBILITY, CLIMATE, LOCAL RESOURCES, INFRASTRUCTURE, AND PHYSIOGRAPHY
Most Part of this section has been reproduced in its entirety from the A Preliminary Assessment of The Maracás Vanadium Project (2007, B.T. Hennessey), Bahia State, Brazil by Micon, as fully cited in Chapter 27 - "References". GE21 has verified the accuracy and completeness of the information contained herein and updated as required.
5.1 Access
The town of Maracás is accessible by a paved secondary highway from the main Brazilian coastal highway through Bahia State. It is approximately 405 road kilometers from Salvador (population: 2.9 million (2020)). The Project is accessed by 29 km paved secondary highway, west from Maracás, followed by 20 km gravel road that leads to a ranch gate. The Project is located on the ranch and a 2.5-km sand and gravel trail leads to the Campbell Pit in a small hill.
Maracás has a small general aviation airstrip but no commercial air service. Salvador, being the state capital and one of the larger cities in Brazil, is served by an international airport with several daily flights from São Paulo and Brasilia.
5.2 Infrastructure
Domestic power and telephone service are available both at the Property and in the town of Maracás, which is linked to the power grid. Maracás has a population of approximately 20,000. The water supply is available from a number of rivers and creeks which drain into the general area.
Brazil has a large and very active mining industry. Infrastructure for mining equipment, services and personnel are available in a number of centers, including São Paulo, Belo Horizonte and Cuiabá. The Jacobina gold mine is located 275 km to the north of Maracás. There are several other small active mines in the general area and thus some local mining services are available in Salvador. There is a rail line close to the property and deep-water port facilities are also available. The Porto Alegre village is located south of the Project.
5.3 Climate
The local climate has two distinct seasons, one is typically hot and humid and the other during the winter is dry. This climate occurs predominantly in the state's countryside. The average day time temperature in the countryside is near 30 °C. The temperatures drop in May and June when minimum day time temperatures stay above 10 °C. Daytime temperatures rise to 40 °C in January and February. The average rainfall is about 1000 mm/a.
The rain season runs from November to March. During that time, the rains are intense, and the temperatures are high. Some low-lying areas can experience flooding. The dry season is from July to September. The climate does not create any problem for exploration with diamond drilling or other geological/geochemical work. Tropical weathering can create specific issues for geochemistry and mapping. Exploration can be carried out at any time without facing difficulties.
5.4 Landscape
Approximately 23% of the State of Bahia lies at less than 300 masl, 70% is between 300 to 900 masl and 7% is above 900 masl. There are three types of relief observed, high plateau, coastal, and areas extending between the coast and the high plateau.
The Maracás Property is located in the region between the coast and the high plateau in an area of moderate to low-lying relief.
At the Project site itself, the maximum relief is about 30 m. The surrounding terrain is a typical ranch/farm with low trees and shrubs and consists of a number of relatively flat plateaus adjacent to a series of creeks and ponds. The property is bounded to the east by a steep cliff that rises 300 m to an area of higher land where the town of Maracás is located. Figure 5.1 is a photograph of the Maracás Property with the hill on which is possible to see the Campbell outcrops in the background.
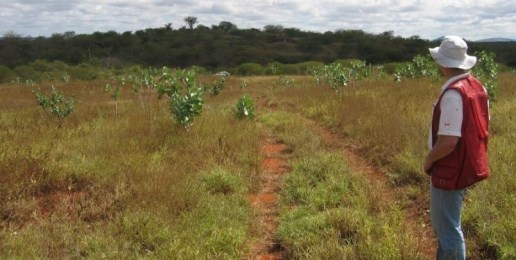
Figure 5.1: Maracás Menchen Mine with Campbell Hill in Background.
Occasional outcrops of pegmatite dike and gabbro are present on the property. The local overburden, which consists of residual soils, lesser alluvial and colluvial soils, ranges from 3 to 10 m in thickness.
The local land is primarily used for agriculture with ranching and grazing being the primary activity on the land at the Maracás Project where both mining and exploration activities are permitted.
5.5 Vegetation
Central Bahia Region can be characterized as having Caatinga-type vegetation, of low thorny plants and bushes adapted to the extreme arid climate. Predominant plants in the mining and development areas include cacti such as the mandacarú and xique-xique, as well as baraúna and umburana trees and bromeliads. The Central Bahia Region vegetation ranges from shrubby, sparsely vegetated type to rocky, savanna type and typically ranges from 10% to 60% cover with lesser coverage typically associated in areas of goat farming activity and subsistence agriculture.
6 HISTORY
The history of the Maracás Property has been previously described by Menezes (2005) with a Feasibility Study Summary. The information in this section was taken from research by Brito et al (1981), Galvão et al (1984), Brito (2000), Menezes (2005) and other unpublished internal documents from previous operators. Later, more information about the deposit and research was also obtained from more recent publications such as Arsenault, D. et al., (2013), Costa (2014), Largo Resources Ltd. (2015), Largo Resources Ltd. (2016), Lordão (2020) and other internal performance reports. Much of the following chapter has been taken from the Micon 2007 NI 43-101 Technical Report (Hennessey, B., et. al. 2007).
6.1 Summary
Exploration of the Rio Jacaré mafic to ultramafic intrusion by the geologists of CBPM started in 1980 during a regional geological survey. This work led to the discovery of the vanadium-rich titaniferous magnetite occurrence on what is now part of the Maracás Property. In 1981, CBPM conducted an exploration program which included geological mapping, ground geophysical surveys (magnetic and VLF electromagnetic surveys), test pitting and trenching, and diamond drilling of two holes totaling 147 m. In 1983, CBPM continued work and focused on the Campbell deposit when it completed an additional 12 holes totaling 985 m.
Over the past 40 years, the Maracás Menchen Mine has undergone several additional phases of exploration and economic evaluation, including geophysical surveys, prospecting, trenching, diamond drilling programs, geological studies, resource estimates, petrographic studies, metallurgical studies, mining studies and economic analyses. These studies have advanced the Project to its present status of mine and to the development of exploration campaigns in target areas along the Rio Jacaré Sill (Table 6-1).
Table 6-1: Mineral Exploration areas
| Areas | Acronyms of holes |
Pit | Gulçari A - GA - Campbell | FGA, FDGA |
North of the Pit | Gulçari A Norte - GAN | FGAN, FGB, FGBS, EXP-03 |
São José - SJO | FSJ, EXP-01, EXP-02 |
Novo Amparo - NAO | FNA |
Novo Amparo Norte - NAN | FNAN |
Capivara | FC |
South of the Pit | Gulçari A Sul - GAS | FGAS, EXP-04, EXP-05 |
Água Branca | FAB |
Jacaré | FJ |
Braga | FB |
The Maracás Menchen Mine (Campbell Pit) began mining operating in 2013 with first V2O5 production in August of 2014, making it the only vanadium miner in Latin America. The mine has seen constant increases in production sine that time reaching record production levels in 2020 (Table 6-2).
Table 6-2: Historic Production Statistic for the Maracás Menchen Mine.
Year | Tonnes Mined ('000) | Concentrate Grade (V2O5%) | V2O5 Produced (tonnes) |
2014* | 1,022 | 3.23 | 1,032 |
2015 | 1,026 | 3.13 | 5,810 |
2016 | 1,045 | 3.38 | 7,966 |
2017 | 1,114 | 3.38 | 9,297 |
2018 | 991 | 3.41 | 9,830 |
2019 | 1,156 | 3.29 | 10,577 |
2020 | 1,088 | 3.28 | 11,825 |
*Sept 2013 to Dec 2014, includes start up and stockpile management |
In 2018, the company started an expansion process in the production plant to reach the capacity of 12 thousand tons per year. In July 2019, a monthly production record of 1,042 tons of vanadium pentoxide (V205) was achieved. Also, in 2019, research and test projects were undertaken to recover titanium (pilot phase) and V2O3 conversion.
The following is a historical summary of the exploration work that has taken place since CBPM involvement, taken, in part, from the reports by CBPM (1981 and 1984) a report by Menezes (2005). Since Largo's involvement a number of NI 43-101 Technical Reports and internal reports, including Micon 2006, Micon 2007, Akers 2009, RungePincockMinarco 2012, Micon 2016 and finally GE21, 2017.
6.2 Exploration History
Between 1981 and 1983, CBPM carried out 14 exploratory holes totaling 1132 meters. In 1984, CBPM formed a joint venture with the Odebrecht Group, after the conclusion of a prefeasibility study completed by CEPED, the State of Bahia Research and Engineering Centre. The joint venture formed a new company, Vanádio de Maracás Ltda., in order to explore and develop a mine and metallurgical plant to exploit the vanadium-bearing titaniferous magnetite deposit.
During that year, Odebrecht S.A. carried out systematic exploration work including 1,492 m of diamond drilling in 18 holes on the Campbell deposit. Over the next 3 years (1985 to 1987), Odebrecht completed three more drilling programs to further define the resource at Campbell including nine holes (1985) totaling 971 m, eight holes (1986) totaling 1,136 m and four holes (1987) for 421 m, respectively. An additional 24 vertical holes totaling 648 m were drilled for geotechnical information regarding open-pit boundaries and overburden. These holes were not analyzed or included in the database used for the resource estimate presented in this Report. Odebrecht also carried out an exploration program testing the three other prospects on the property (Gulçari B, São José and Nova Amparo), which included geological mapping, ground geophysical surveys (magnetics and VLF), trenching, and diamond drilling of 13 holes totaling 661 m.
In 1986, CBPM and Odebrecht Group completed a "reserve" estimate for the Campbell deposit. The holes of 1987 and geotechnical holes were not considered for this estimate.
Odebrecht S.A. conducted a number of petrographic studies, metallurgical tests and feasibility studies intermittently from 1984 to 1988. These were performed with recognized engineering companies such as CEPED from Brazil, Lurgi GMBH and Gesellschaft für Elektrometallurgie (GFE) from Germany, Mintek from South Africa, Rautaruukki Oyj from Finland, Jaakko Pöyry Engineering and Engenharia e Consultoria Mineral S.A. (ECM), both from Brazil. The conclusion of these studies in 1990 resulted in what was determined to be a feasible project for the production of 4000 t/a of vanadium pentoxide (V2O5) with part converted to ferrovanadium as a final, value-added product. As a consequence of the evaluation, the joint venture decided to contract Finnish company Rautaruukki Oyj for the implementation of final pilot plant tests and basic engineering design for the Project.
Early in the 1990s, Odebrecht S. A., owning 93% of Vanádio de Maracás' shares, decided to restructure the joint venture on a 50/50 basis with CAEMI (VALE) with the intention of bringing to the Project expertise in mining, metallurgy and marketing.
In 1990, a sampling program of the drill core from Maracás was conducted. The samples were also analyzed for platinum and palladium. A total of 167 samples from 10 drill holes were selected for analysis. Ninety-six samples were from magnetite and 71 samples from pyroxenite. The results indicated potentially significant platinum and palladium values associated with high-grade V2O5 values.
The following is a list of studies completed on the property by the above listed companies:
- CBPM Geological Study;
- Lurgi GMBH Feasibility Study;
- Rautaruukki Oyj Feasibility Study;
- Jaakko Pöyry Feasibility Study;
- Natron Environmental Impact Study;
- ECM Feasibility Study;
- CAEMI (VALE) (VALE)/MBR 1996 Revision of Feasibility Study;
- CRU Market Study;
- CRA Market Study;
- IMS Processing plant Study;
- MINTEK Test Reports;
- Paulo Abib Geo-Statistical Evaluation & Mining Plan;
- VMSA - DNPM Economic Development Plan;
- 1996 CAEMI (now VALE S.A.) Feasibility Study;
- 1999 Economic Update Report of 1996 Study.
In 2006, Largo signed an agreement with Odebrecht, and CAEMI (now VALE) for the Maracás property. Largo carried out a re-sampling program to analyze a portion (approximately 10%) of the old drill core (CBPM and Odebrecht) to verify the past analytical database on the property (see Section 11). Analyses were done at SGS Minerals (SGS) laboratories, both in Belo Horizonte, Brazil and Lakefield, Ontario. Chemical analyses were validated for FeO, Fe2O3, SiO2, TiO2 and V2O5 by by the XRF method and for platinum and palladium by a 50 g fire assay technique. Based on the verification of the database, Largo completed a revised block model and NI 43-101-compliant mineral resource estimate which was the subject of an Hennesey (2006) report.
Between 2007 and 2020, the following works were carried out:
- Geological mappings and refinements to existing maps;
- Geophysical survey with magnetometers;
- Soil geochemistry campaigns;
- Chemical analysis of rock (borehole and field testimonies);
- Exploratory Drilling on Other Targets;
- Drill Mesh Refinements;
- Infill drilling and deep drilling on the Gulari A target;
- topographic surveys;
- petrographic studies.
Between 2011 and 2015 the Maracás Project was carried out with the preparation of an integrated geological map considering targets such as NAO, NAN, GAN, GA and SJO. These maps are presented in Chapter 7 of this report, item 7.2.2 Near Mine Targets.
In 2019, a geotechnical study of the Campbell Pit was carried out recording four main structures: Foliation N101/63; NW-SE subvertical fracture plane; fracture plane N287/38 and sub-horizontal fracture plane N204/03.
Also, in 2019, a re-logging campaign was undertaken to redescribe old holes to obtain further clarification on the stratigraphy of the Rio Jacare Sill. More than 18,000 meters of drill core were redescribed. These data supported the concept of cycles within the Rio Jacare Sill including key marker layers and brought greater detail to the understanding of the current genesis of the deposit.
Between 2007 and 2017, the company drilled 263 drill holes totaling 50,088.71 meters for resource calculation and exploration. The table below shows the number of holes and the meters drilled for the companies CBPM, Odebrecht and VMSA for Campbell Pit and for the satellite deposits. Considering up to the year 2020, the technical inventory has around 651 holes totaling more than 104,000 meters drilled (Table 6-3).
Table 6-3: Summary of Total Drill Holes and Meters Drilled.
Áreas | CBPM | Odebrecht | VMSA | Total |
Holes | Total (m) | Holes | Total (m) | Holes | Total (m) | Holes | Total (m) |
Campbell | 14 | 1,132.98 | 39 | 4,020.18 | 214 | 36,596.88 | 267 | 41,750.04 |
Targets | | | 13 | 661 | 371 | 61,877.41 | 384 | 62,538.41 |
Total | 14 | 1,132.98 | 52 | 4,681.18 | 585 | 98,474.29 | 651 | 104,288.55 |
Examples of some of the work developed in recent years are:
- Platinum Group Element (PGE) Mineralization Associated with Fe-Ti-V Deposit, Rio Jacaré Intrusion, Bahia State, Brazil (CAMPBELL, 2012)
- Magnetic Pre-Concentration of Magnetite-Pyroxenite From Vanadium From Maracás S/A (COSTA, 2014)
- Petrographic and Geochemical Characterization of Phosphorus Mineralizations in Apatite of Novo Amparo Norte Target in Sill Do Rio Jacaré - Maracás/Ba (VASCONCELLOS, 2015)
- Petrographic and Geochemical Characterization of Titanium Mineralizations in the Target Gulçari North of the Sill Do Rio Jacaré - Maracás - Bahia (FRÓES, 2015)
- Petrographic and Geochemical Characterization of Magnetitites in the Upper Zone of the Capivara Complex, Maracás - Bahia (KNUPPEL, 2017)
- Petrographic and Geochemical characterization of the mineralizations of elements of the Platinum Group in the Novo Amparo Norte deposit, Maracás-Bahia. (ALMEIDA, 2018)
- Integration of geological and geophysical data from the Ti-Magnetite Vanadifera 1eposito f Novo Amparo Norte, Sill do Rio Jacaré, Maracás - Ba (CARVALHO, 2018)
- Geological and Structural Mapping of the Vanadiferous Titano-Magnetite Deposit at Santa Fé Farm, Maracás - Ba (SANTOS, 2018a)
- Descriptive model of chromium mineralizations in the Capivara Complex - Maracás, Bahia and Metalogenetic Implications (SANTOS, 2018b)
- Geological-Geophysical Characterization of the Sill of the Jacaré River in the São José Target - Maracás-Ba (JESUS, 2019)
- Mapping and Petrographic Characterization of the Titano-Magnetite Vanadiferous Deposit of the Gulçari Target in the South, Maracás/Ba - Contribution to the Understanding of the Economic Geology of the Sill of the Jacaré River (SANTOS, 2020)
- Mapping and Petrographic Characterization of the Vanadiferous Titano-Magnetite Deposit of the Gulçari Target North, Maracás/Ba-Contribution to the understanding of the economic geology of the Rio Jacaré Sill. (PEREIRA, 2020)
- Stratigraphic Compartmentation of the Mafic-Ultramafic Complex of the Sill of Rio Jacaré in the Campbell Sector and its Implication for Vanadium Mineralization/Maracás-BA (LORDÃO, 2020)
6.3 Historical Drilling
Between 1981 and 1987, CBPM/Odebrecht S.A. drilled 66 holes totaling 5,814 m, testing four deposits on the Maracás property, namely, ranging from south to north, Gulçari A (Campbell Pit), Gulçari B (now part of the GAN deposit), São José and Nova Amparo deposit. A summary of the complete drilling is set out by deposit in Table 6-4.
Table 6-4: Summary of Diamond drilling, Maracás Property.
Deposit | No.
Of Holes | Length (m) |
Gulçari A (Campbell Pit) | 53 | 5,153 |
Gulçari B | 4 | 169 |
Sao Jose | 2 | 115 |
Nova Amparo | 7 | 377 |
Total | 66 | 5,814 |
Most of the work to this point was focused on the Campbell deposit. Previous diamond drilling on the Gulçari A deposit (Campbell Pit), completed by CBPM and Odebrecht S.A. is summarized in Table 6-5. The analytical results from the diamond drilling form the basis for the subsequent, historical "reserve" estimates and metallurgical and feasibility studies on the deposit.
Table 6-5: Historical Diamond Drilling Gulçari A deposit (1981 - 1987).
Company | Period | No. of Holes | Length (m) |
CPBM | 1981 | 2 | 147.2 |
CPBM | 1983 | 12 | 985.4 |
CPBM/Odebrecht | 1984 | 18 | 1,492.6 |
CPBM/Odebrecht | 1985 | 9 | 971.2 |
CPBM/Odebrecht | 1986 | 8 | 1,135.9 |
CPBM/Odebrecht | 1987 | 4 | 421.3 |
Total | | 53 | 5,153.6 |
In addition to Gulçari A, other deposits that are the focus of this report are NAN and GAN. As of 1987, the NAN deposit had not yet been drilled and the GAN deposit (integration of GAN, GB and GBS) had only 4 holes measuring about 169 meters. In 2007, Largo initiated a number of drilling campaigns to define additional mineral resources at the project.
Between 2007 and 2017, the company drilled 263 drill holes totaling 50,088.71 meters for exploration and resource development. In addition, metallurgical and geotechnical holes were also completed. For Gulçari A, 160 holes were drilled, totaling approximately 27,594 meters drilled. Of these, 103 holes with 12,959.82 meters of core were drilled as part of an infill campaign carried out between 2012 and 2013. A new infill drilling campaign was carried out in 2018 with 31 holes totaling 2,323.7 meters of core.
The table below shows the number and total of holes per target in detail. More details are presented in Chapter 10 of this report.
During 2018, Largo completed drilling campaign with a further 24 holes in NAN with 4,223.30 m core and 14 holes in the South Block (Braga-Jacaré-Água Branca) with 2,218.70 meters drilled.
In 2019, Largo drilled 71 holes over three main areas. At Campbell the Company drilled a totaled of 1,924.65 meters, at GAN 3,050.95 meters were drilled and in NAN 4,404.15 meters of drilling were completed. At other targets named GAS, SJO and NAO, approximately 57 holes were drilled totaling 9,475 m of core drilled.
In 2020 Largo drilled 94 holes over three areas. At Campbell 4,755.3 meters of core were drilled, at GAN 6,899.00 meters of cored were drilled and at NAN a total of 8,187.65 meters of core were drilled. At other targets 30 holes were drilled totalling approximately 4,923.80 meters of core. Table 6-6 shows the details of this drilling by operator, year and target.
Table 6-6: Summary of Historical Drilling by Target.
Areas | Type/Purpose | 2007-2017 | 2018 | 2019 | 2020 |
Holes | Total (m) | Holes | Total (m) | Holes | Total (m) | Holes | Total (m) |
Campbell | Exploration | 57 | 14,634.03 | | | 5 | 1,924.65 | 18 | 4,755.30 |
Campbell | In Fill | 103 | 12,959.82 | 31 | 2,323.08 | | | | |
Gulçari A North (GAN, GB & GBS) | Exploration | 34 | 5,622.77 | | | 20 | 3,050.95 | 45 | 6,899.00 |
Novo Amparo North | Exploration | 17 | 3,283.50 | 24 | 4,223.30 | 46 | 5,404.15 | 32 | 8,187.65 |
Novo Amparo | Exploration | 13 | 6,149.44 | | | 24 | 4,646.40 | 14 | 2,260.60 |
São José | Exploration | 25 | 5,031.15 | | | 18 | 2,812.60 | 15 | 2,474.95 |
Gulçari A South | Exploration | 2 | 261.00 | | | 15 | 2,016.00 | 1 | 188.25 |
South Block (Braga-Jacaré-Água Branca) | Exploration | 4 | 628.95 | 14 | 2,218.70 | | | | |
Capivara | Exploration | 8 | 1,518.05 | | | | | | |
Total | - | 263 | 50,088.71 | 69 | 8,765.08 | 128 | 19,854.75 | 125 | 24,765.75 |
6.4 Historical Resource Estimates - Odebrecht, 1986
The Project in 1986 the historical mineral reserve was based on detailed geological mapping, geological sections incorporating structural geology and mineralogical and analytical results, sampling of 46 trenches totaling 1,950 m and 53 diamond drill holes totaling 5,153 m, density tests and ore microscopy. The work was prepared by staff geologists from both CBPM and Odebrecht.
The Odebrecht "geological reserve" had a kriging estimation done on a block model of 5 m x 5 m x 15 m. At the time, the mineral inventory was classified as measured reserves above 150 m of vertical depth. This historical mineral "reserve" estimate, as summarized in Menezes (2005), is set out in Table 6-7. This historical estimate was reported at various cut-off grades as shown in Table 6-8 and is not considered to be compliant with NI 43-101 and should not be taken as supporting data. The qualified person failed to properly classify this historical estimate as current mineral resources or mineral reserves, therefore, the historical estimate is not being treated as current mineral resources or mineral reserves by the issuer.
Table 6-7: Historical "Reserve" Estimate (1986) - Campbell.
Cut-off Grade (% V2O5) | Average Grade (% V2O5) | Tonnes (millions) |
0.0 | 1.13 | 13.2 |
0.1 | 1.13 | 13.1 |
0.2 | 1.14 | 13.0 |
0.3 | 1.19 | 12.4 |
0.4 | 1.28 | 11.4 |
0.5 | 1.37 | 10.4 |
0.6 | 1.45 | 9.6 |
0.7 | 1.53 | 8.8 |
0.8 | 1.62 | 7.9 |
0.9 | 1.72 | 7.1 |
1.0 | 1.82 | 6.4 |
Largo's program intended to verify the database and provide a mineral resource estimate for the deposit in accordance with CIM NI 43-101 (Hennessey, 2006), which was updated in 2007 (Hennessey, 2007).
From the information provided above, Paulo Abib Engenharia S.A. built a complete geological and analytical database in the 1990s. This database was used in a geostatistical study of the deposit where grades were interpolated into a block model by ordinary kriging. The geostatistics were also used to generate a variographic analysis of the deposit.
Within the historical context still, there were two validations of the resource estimate in 2009 (Asker Solutions) and 2012 (Runge Pincock Minarco).
In 2017, Largo retained GE21 to review the optimized mine plan and plant feed schedule for the Maracás Menchen Mine based on the new pit slope and on two proposed expansions that would increase the production rate to 11,520 tonnes per annum of V2O5 in 2019 and to 13,200 per annum of V2O5 for 2020 though to the end of life of the mine.
Table 6-8: Historical Reserve Estimate (2017 GE21) - Campbell.
Class | Tonnage (kt) | % V2O5 Head | % Magnetics | % V2O5 Concetrate | V2O5 Contained (kt) |
Proven | 17.57 | 1.14 | 29.66 | 3.21 | 167.3 |
Probable | 1.44 | 1.26 | 33.89 | 3.20 | 15.6 |
Total | 19.01 | 1.15 | 29.98 | 3.21 | 182.9 |
Notes: Block 5m x 5m x 5m; Mining Recovery 100%; Dilution 5%.and Effective date May2, 2017 |
6.5 Historical Technical and Environmental Studies
In 2008, Aker Solutions were retained by Largo to complete a Definitive Feasibility Study ("DFS") for the Maracás Vanadium Project. The results of that study were presented in a NI 43-101 Technical Report titled "Technical Report of the Feasibility Study for the Maracás Vanadium Project, Brazil", Amended version dated May 2009.
Since the completion of this DFS, Largo has continued to advance the Project. Additional studies and technical effort have been completed in the following areas:
- Pilot-scale metallurgical testing at Fundação Gorceix, Ouro Preto, August- September 2010.
- Conceptual design of alternatives for disposal of non-magnetic tailings, Ausenco Minerals, May-June 2010.
- Dry stacking feasibility study, Ausenco Minerals, September 2010
- Land Agreement with Banco Economico S/A to secure land rights for mining and project development at São Conrado and São Pedro da Goiania lands, July 2011.
- Environmental permit issuing:
- Localization license - CEPRAM Resolution No. 3941, 10/10/2008.
- Installation (Construction) license - INEMA Resolution No. 1286, 10/20/2011.
- Grant of Water Rights - ANA resolution No. 684, 09/16/2011.
- Air pollutant emissions modeling and simulation by SECA, February 2012.
- 13,401 m of additional resource drilling in Campbell and B trends.
- Promon Engenharia - basic engineering work for a hydrometallurgical plant, including infrastructure, process flowsheet re-evaluation and design, infrastructure engineering, capital and operating cost updates, production throughput review, March - November 2011.
- HYDROS Engineering - basic engineering work for water pipeline and, capital and operating costs estimates, May - November 2011.
- VOGBR, basic engineering of main geotechnical structures, waste dump, tailings facility, site drainage design, hydrogeological studies and costs estimates, May - November 2011.
- RPM, basic mine design, with Capex and Opex estimates, May - November 2011.
- Project financed by Bank ITAÚ BBA.
- Construction began in June 2012.
- Commissioning began in March 2014.
- Mining started in September 2013.
- Ramp-up to full production on the expanded case started in August 2014 and in May 2016 were 97.5% of nameplate production (800 tonnes V2O5/month).
This Technical Report includes the results of the updated engineering and environmental studies as well as everything describe above.
7 GEOLOGICAL SETTING AND MINERALIZATION
Sections 7.1 - Regional Geology and 7.2 - Rio Jacaré Intrusion have been reproduced from the NI 43-101 compliant technical report entitled "Maracás Vanadium Project, 1.4 Million Tonnes per Year Processing Plant" dated March 4, 2013, prepared for Largo Resources Ltd. by RungePincockMinarco (as fully cited in "References"). The remainder of the information on which this chapter is based is taken from internal documents provided to GE21 by Largo Inc. GE21 has reviewed such information and is confident as to its accuracy and completeness.
7.1 Regional Geology
Brito (2000), Sá et al. (2005) and Teixeira et al. (2000) have described the regional geological setting for the Maracás property. These references give a detailed description of the geotectonic evolution of the São Francisco craton. The following is a brief summary of their work. The Rio Jacaré Intrusion, which hosts the Maracás Project vanadium mineralization, is located in the south-central part of Bahia state in northeastern Brazil. It lies within the Archean São Francisco craton, which in this area is composed of the Contendas-Mirante Complex and the Gavião and Jequié blocks (see Figure 7.1). The intrusion is located on the eastern edge of the Contendas-Mirante supracrustal sequence, which forms a large anticlinorium trending approximately north-south. The supracrustal rocks are located between the early Archean Gavião block to the west, which is composed predominantly of tonalite-trondhjemite granodiorite, and the Archean Jequié block to the east, which is composed predominantly of charnockite and enderbite intrusive rocks with strong calc-alkaline affinities and granulite facies metamorphic rocks (Teixeira et al., 2000). The Contendas-Mirante Sequence is thought to be younger than the adjacent Gavião and Jequié blocks and consists of an Archean basal volcanic unit overlain by a Paleoproterozoic member containing flysch and metavolcanic rocks that are overlain by a clastic member. A Rb/Sr age of 2.0 Ga for the granite, derived from melting of the Contendas-Mirante metapelites, corresponds to the timing of the Tran Amazonian orogeny (2.14 to 1.94 Ga; Teixeira et al., 2000). The Contendas-Mirante Sequence was deformed by the collision of the Gavião and Jequié blocks during the Tran Amazonian orogeny and is now located along part of the major Contendas-Jacobina lineament (Teixeira et al., 2000)
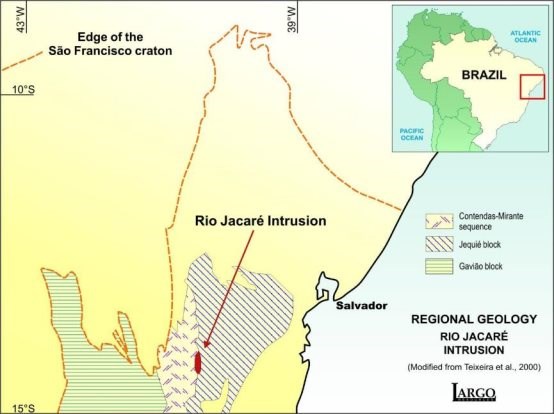
Figure 7.1: Maracás Area Simplified Regional Geology Map.
7.2 Rio Jacaré Intrusion
The Rio Jacaré mafic-ultramafic Intrusion (Figure 7.2) is composed mainly of gabbro. It is a linear sheet-like structure that strikes almost north-south, with a length of approximately 70 km, an average width of 1.2 km, and a dip of 70° E. The intrusion has been described previously as a sill intruded into the volcanic rocks of the lower unit of the Contendas-Mirante gneissic complex (Brito, 1984; Galvão et al., 1986). However, the Rio Jacaré Intrusion is fault bounded to the east and west, and, therefore, its contacts with both the Contendas-Mirante Sequence and Jequié block are tectonic. The age of the intrusion is poorly known. Whole rock dating of rocks from the intrusion itself includes a Pb/Pb age of 2.47 Ga ±72 Ma, a Sm/Nd age of 2.8 Ga ± 68 Ma, and a zircon age of 2.64 Ga ± 5 Ma (Brito et al., 2001). The intrusion is cut by granitic pegmatite veins that are closely related to a granite intrusion that has an age of 1.94 Ga ±54 Ma (Brito et al., 2001). Metamorphism and deformation have modified many of the igneous textures and minerals of the intrusion. Relict minerals are rare, but some igneous textures are still preserved such as olivine cumulate textures and layering between pyroxenite and gabbro. The pyroxene in these rock types is now largely altered to hornblende, which is in turn replaced by actinolite, tremolite and chlorite in many samples. The presence of amphibole and garnet in the gabbro and magnetitite (an igneous rock composed largely of magnetite) in the Rio Jacaré Intrusion indicates amphibolite grade metamorphism.
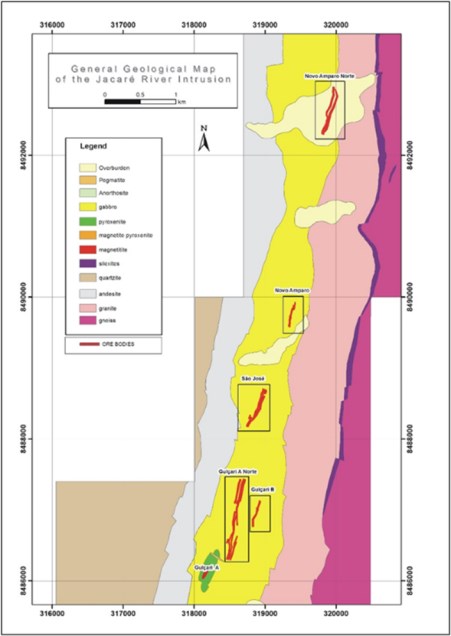
Figure 7.2: Geological Geology Map of the Rio Jacaré mafic-ultramafic Intrusion in the general vicinity of the Maracás Menchen Mine showing the Gulcari A Deposit (Campbell Pit) and the other Near Mine Targets.
The gabbro is massive, coarse grained, and slightly foliated, whereas the diorite is massive and mainly fine grained. The primary igneous mineralogy of the gabbro consisted of plagioclase and orthopyroxene as cumulate phases, with interstitial clinopyroxene. The orthopyroxene, clinopyroxene and olivine mineralogy has been examined in detail by Brito (2000). Quartz and biotite are present as minor phases, and apatite and titanite are common accessory phases. Within the Lower zone, there are lenses of magnetite-rich rocks. The outer margins of the lenses consist of magnetite-bearing pyroxenite with 30% to 70% opaque minerals. The centers of the lenses consist of massive magnetite (magnetitite). These bodies were previously described as forming pipes and plugs intruded into the gabbro of the Lower zone (Brito, 1984). However, the contact relationships with the gabbro are not clear, because the bodies are usually bounded by faults and are poorly exposed. They are described in greater detail below. The Upper zone has an average thickness of 600 m and is formed mainly of layered gabbro varying from leucogabbro to melagabbro with some cyclic units of gabbro, pyroxenite, magnetite-bearing pyroxenite, and magnetitite. The pyroxenite consists of thin layers, typically a few centimetres to less than 1 m in thickness, and which are in many cases associated with the magnetite bodies
7.3 Property Geology
The north-south trending Rio Jacaré Intrusion underlying the Maracás Mine property and can be traced for the full 8 km strike length which occurs on the property to the north of Campbell Pit, and for more than 25 km to the south. Recent work by Largo Resources has resulted in a detailed subdivision of the Upper Zone of the Rio Jacaré Intrusion within the project area into a number of cyclic units. These cyclic units are as follows (lowermost to uppermost) (Table 7-1) (Figure 7.3).
Table 7-1: Description of cyclic units of Rio Jacaré Intrusion
Cycle | Description |
TZ (Transition Zone) | The TZ comprises a thick layer of leucogabbro (70-110 meters) interspersed with pyroxenites (3-10 meters) and magnetite pyroxenites (1-5 meters). The TZ is the lowermost stratigraphic unit within the Rio Jacaré Intrusion containing modal magnetite, although it is only weakly mineralized. Note that the Lower Zone, which lies below the TZ, has not been described in detail as no magnetite mineralization is known to occur within it. |
C1 | C1 - The base of the C1 cycle is market by a massive magnetitite layer ~ 1-3 m thick, that grades upwards into magnetite pyroxenite or pyroxenite with magnetite, and then into a biotite gabbro with sparse disseminated magnetite and thin pyroxenite bands. The SiO2 values increase to the top of the cycle, defining a modal stratification that shows the crystallization sequence of the magma depleting in modal magnetite and enriching in plagioclase. |
C2 | The C2 cycle is thin (maximum 5-20 m) and laterally discontinuous, comprising a thin basal magnetitite (1-3 m), grading into a magnetite pyroxenite and an upper biotite gabbro. |
C3 | The C3 cycle contains the most well-developed magnetite mineralization within the project area and hosts the bulk of the mineralized material at the Campbell Pit. It is comprised of a lower magnetite pyroxenite, grading into a ~20-40 m thick magnetitite unit, followed by another magnetite pyroxenite, a magnetite gabbro and an upper band of unmineralized gabbro. The magnetitite is interspersed with magnetite pyroxenite, and unlike the upper cycles where igneous rocks form laterally continuous stratigraphic units, the magnetitite within the C3 cycle does not appear laterally continuous and pinches out to the north and to the south. Some portions of the rock have a cumulative texture (pyroxene crystals and opaque minerals immersed in hornblende). Another important characteristic of this cycle is the presence of anomalous PGE values with Pd and Pt values up to 700 ppb. |
Cycle | Description |
C4 | This cycle comprises a basal magnetite pyroxenite, overlain by magnetite gabbro and gabbro and leucogabbro containing disseminated magnetite. These gabbroic units display compositional macro-layering. The upper part of this cycle is marked by a ~ 3 m anorthosite unit. AT the GAN and SJO deposits, additional magnetite gabbro and magnetite pyroxenite units are observed within the cycle that are not observed elsewhere. In the contact of C4 with C5, a titano-biotite-gabbro occurs with well-developed biotites and mylonitization features. In a more current analysis, this is considered the last cycle to present the biotite-gabbro lithotype (occurring from TZ to C4). |
C5 | A unit of predominantly gabbro with a band of magnetite gabbro and magnetite pyroxenite, and an upper pyroxenite overlain by an anorthosite band. This magnetite metagabbro layer is one of the main layers of the Novo Amparo Norte target. In the São José target, a layer of metamagnetitite is common in the middle of the cycle. Occurrences of PGE in the ore at the base of the cycle. |
C6 | The cycle is described as a metamagnetitite layer with an approximate thickness of ten meters grading into magnetite-gabbro and enriching in plagioclase towards the top. This defines the following stratigraphic sequence: Metamagnetitite>magnetite metagabbro> gabbro with magnetite> metagabbro> metanorthosite. This cycle represents an important resource for the company due to the geological continuity and the occurrence of high grades of V2O5, mainly in the targets Novo Amparo Norte and São José. |
C7 | This cycle is characterized from the bottom to the top, by metamagnetitites, magnetite metagabbros and metagabbros, showing a reduction in magnetite and an increase in plagioclase to the top. This cycle has high levels of TiO2 (15 to 25 wt%) in the metamagnetitite and magnetite metagabbro. The C7 cycle is also noted for cumulus apatite, which appears immediately above the magnetite-enriched lower portion, within the lower part of the gabbro or magnetite gabbro unit. |
Cycle | Description |
C8 | This thick cyclic unit contains a lower zone of magnetite gabbro grading into a ~20 m thick magnetitite overlain by a 2-3 m mottled anorthosite with clinopyroxene oikocrysts and a ~130 m thick package of gabbro and leucogabbro. The gabbro displays distinctive plagioclase phenocrysts, and the base of the sequence (with a gradation upwards from magnetite gabbro to magnetitite) differs from typical sequences with basal magnetitite units having sharp lower contacts. Anomalous copper values (of up to 3000 ppm) are also noted in this cycle. |
C9 | This is a broad cycle with a ~30 m magnetite gabbro package at the base, overlain by gabbro, anorthosite and magnetite leucogabbro, and characterised by a thick (40-150 m) unit of anorthosite making up the uppermost portion of the cycle. This anorthosite has a cumulus texture and distinctive pyroxene oikocrysts near the top of the cycle. |
C10 | The uppermost cyclic unit observed at the Rio Jacaré Intrusion comprises a ~5-20 m thick magnetite gabbro grading upwards into gabbro, leucogabbro and anorthosite. The upper contact of the C10 cycle with the Pé de Serra Gneiss is a tectonic contact. |
Different areas of the sequence (Figure 7.3) are present in different areas of the project -the lowermost stratigraphic units (TZ, C1, C2, C3) are only observed in or near the Campbell Pit, whereas the upper portions of the sequence (C4 to C10) are observed elsewhere through the deposit.
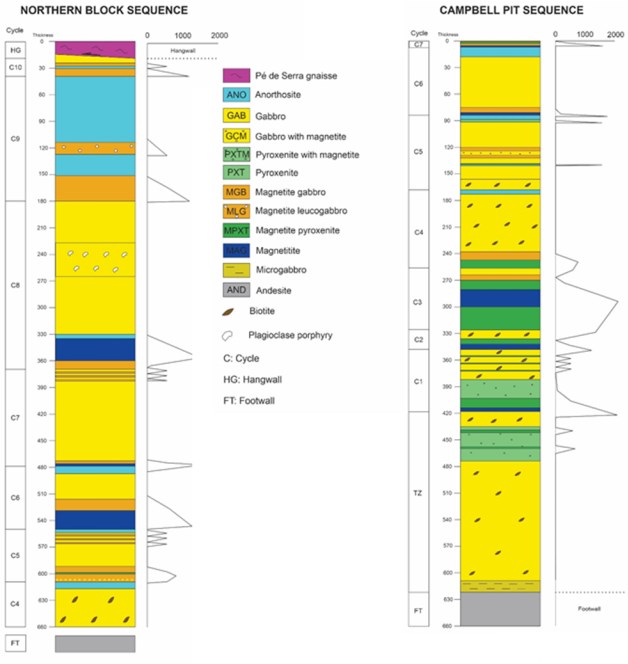
Figure 7.3: Stratigraphic sequence of the magmatic pulses proposal according to last work of Largo.
It is interpreted that cycles C1 to C4 represent the feeder zone of the Rio Jacaré Intrusion, and that these cycles are not laterally continuous across the entire length of the deposit but are rather restricted to this feeder zone. In contrast, cycles C5 to C10, which form the upper portions of the deposit, are laterally extensive over the entire strike length of the Rio Jacaré Intrusion. A schematic longitudinal section illustrating this relationship is shown in Figure 7.4.
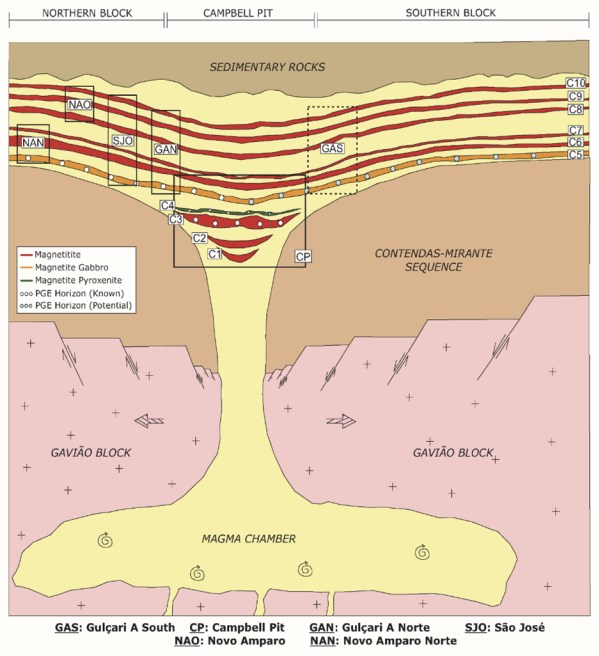
Figure 7.4: Schematic longitudinal section through the Rio Jacaré intrusion, illustrating the continuity of various cyclic units. Note that units are not drawn to scale.
7.4 Individual Deposits
The NNE-striking, ~70° ESE-dipping Paleoproterozoic Rio Jacaré Intrusion occurs throughout the 40 km long Maracás Project exploration permits. Along the strike of the Rio Jacaré Intrusion within the property, several discrete deposits or areas containing vanadium-rich titanomagnetite bodies have been defined, namely the Gulçari A (Campbell) deposit, the Gulçari A North (GAN) deposit, Gulçari B deposit (currently part of GAN), the Sao Jose deposit (SJO), the Novo Amparo (NAO) deposit and the Novo Amparo North (NAN) deposit. Each of these deposits are located at various stratigraphic heights within the Rio Jacaré Intrusion, and thus occur within different cyclic units (Figure 7.5).
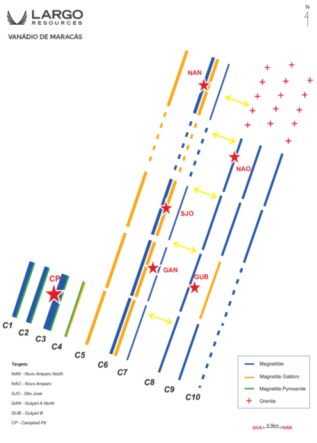
Figure 7.5: Schematic map of the location of the various deposits relative to cyclic units.
Within all deposits, mineralized bodies consist of magnetitite layers or magnetite pyroxenite layers formed as cyclic magmatic units associated with the surrounding gabbro. Typically, magnetite-enriched units have sharp magmatic contacts with units below and gradational contacts with the units above.
7.4.1 Gulçari A Deposit
The Gulçari A deposit (also referred to Campbell Pit) is hosted in the lower parts of the Upper Zone of the Rio Jacaré Intrusion, between cyclic units C1 and C6, with magnetite mineralization hosted predominantly within the C3 unit. This C3 unit comprises medium to coarse-grained gabbro containing lenses of magnetitite, magnetite-pyroxenite and pyroxenite. These lenses are interpreted to pinch out along strike (i.e. in a N-S direction), and it is within this C3 unit that the largest concentrations of vanadium-rich magnetite known on the property are found (Brito, 1984). This magnetite deposit extends for approximately 350 m along strike, is up to 150 m wide and has been intersected in drilling to vertical depths of at least 300 m, and it likely extends below these depths. The deposit has been disrupted by northwest-southeast faulting (Figure 7.6).
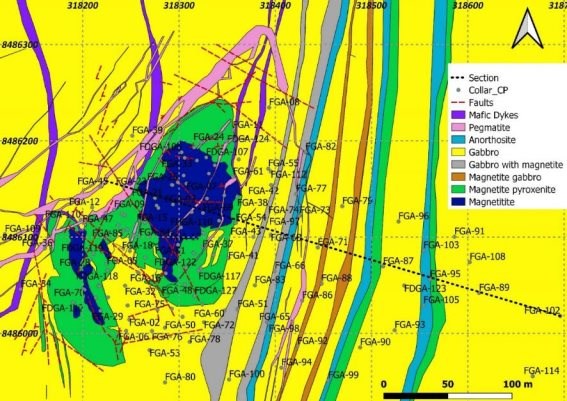
Figure 7.6: Geological Map of the Campbell deposit.
The magnetite-pyroxenite body at the Campbell deposit was previously interpreted as a separate pipe-like intrusion cross-cutting the gabbro (Sá, 1992), but more recently has been understood as having formed within the feeder zone of the Rio Jacaré intrusion and representing one of the lower cyclic units (the C3 unit) of this intrusion. An example cross-section through the Campbell deposit is shown in Figure 7.7.
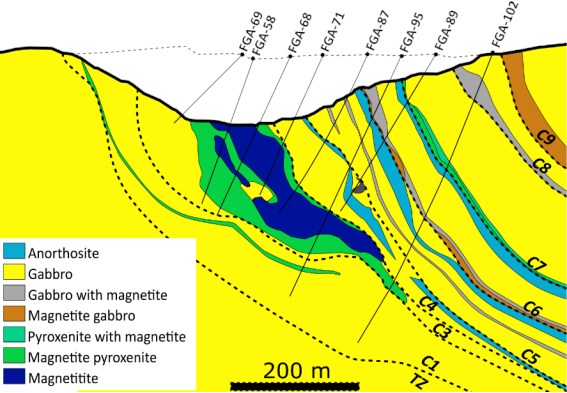
Figure 7.7: Cross-section (NW-SE) through the Campbell deposit, showing various lithologies and their subdivision into cyclic units from TZ to C9. Note that magnetite mineralization is contained predominantly within the C3 unit in magnetite pyroxenite and magnetitite. Topography represents the pit in September 2020, however original topography is also indicated.
7.4.2 Gulçari A Norte (GAN) Deposit
The GAN deposit is located immediately to the north of the Campbell deposit and is considered to be a northward continuation of the upper, more continuous cyclic zones of the Campbell deposit. The GAN deposit extends for approximately 1.2 km strike, with mineralization hosted within magnetite, magnetite gabbro and magnetite pyroxenite between the C4 and C9 cyclic units. Lithologies comprise medium to coarse grained magnetite gabbro with local layers of massive magnetitite and fine to medium grained gabbro with narrow interlayers of magnetite gabbro, pyroxenite, and anorthosite. The massive magnetitite is black with 60-70% magnetic oxides and traces of disseminated sulphide (pyrite and chalcopyrite) as well as small interlayers of magnetite-pyroxenite and anorthosite.
The bulk of mineralization is contained within two magnetite-rich horizons (magnetitite and magnetite gabbro) in the C6 and C8 cycles, as well as within a magnetite gabbro in the C9 cycle. The C6 magnetitite is approximately 7.5 m in average thickness and extends for a known strike length of ~1 km. The C8 magnetitite extends for approximately 350 m along strike and has with a width of up to 25 m, averaging approximately 10 m. The C9 magnetite gabbro extends for a known strike of ~1.2 km and averages 30 m in thickness. The magmatic layering and mineralized zones have strike direction of 020° with a dip ranging from 60° - 65° to the southeast. In the southern part of the deposit the main ore body is cut by fault with a northwest/southeast strike direction. All layered magmatic rocks are cute by later pegmatite dykes with a range of orientations.
Figure 7.8 shows the geological map of the GAN deposit, and Figure 7.9 shows a representative cross-section of the GAN deposit.
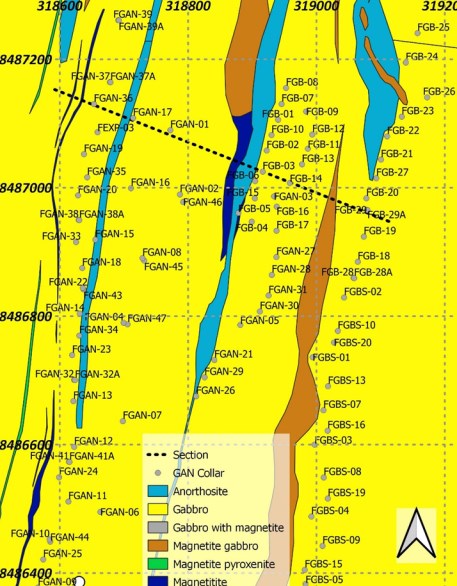
Figure 7.8: Geological Map of the GAN Deposit.
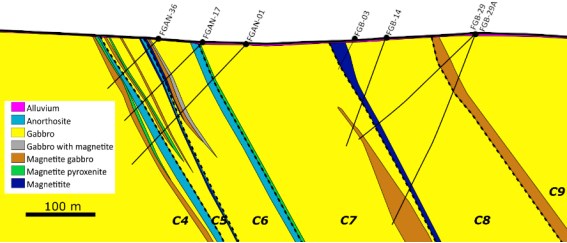
Figure 7.9: Cross-section (NW-SE) through the GAN deposit, showing various lithologies and their subdivision into cyclic units from C4 to C9.
7.4.3 Novo Amparo Norte (NAN) Deposit
The NAN Deposit is the northernmost deposit identified to date within the project area and is considered to be the northern extension of the C4 to C7 cyclic units of the Upper Zone of the Rio Jacaré intrusion. The deposit is overlain by tertiary cover and was detected by a ground magnetometer survey carried out in 2011, which was followed-up with drilling that intersected a 7 m thick massive magnetitite layer in the first hole drilled.
The deposit extends for approximately 2.5 km of strike length and has been drilled in detail over approximately 1.8 km of this strike. Figure 7.10 shows the geological map of the NAN deposit. The geology of this deposit comprises fine to medium grained gabbro and magnetite gabbro, with layers of anorthosite, magnetite pyroxenite and magnetitite. All layers strike 020° and dip approximately 70-75° SE. Mineralization is hosted predominantly in a ~10-20 m thick magnetitite layer that grades upwards into magnetite gabbro. This layer is found within the C6 cyclic unit and is made up of >60% of magnetic oxides in addition to pyroxene, amphibole, garnet and disseminated sulphides (pyrite). Small interbedded layers of magnetite pyroxenite, magnetite gabbro and anorthosite are observed within this magnetitite. At the northern end of the deposit, the mineralized zone is interrupted by a northwest-southeast trending fault. Figure 7.11 shows a representative cross-section of The NAN deposit.
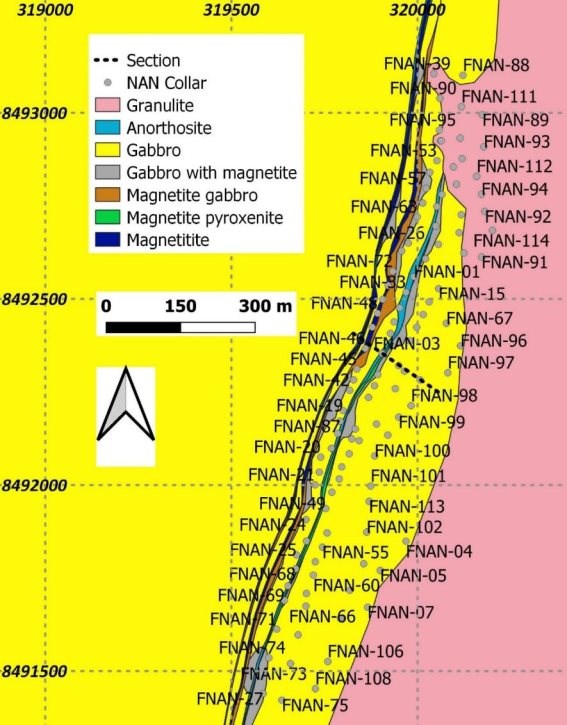
Figure 7.10: Geological Map of the NAN deposit.
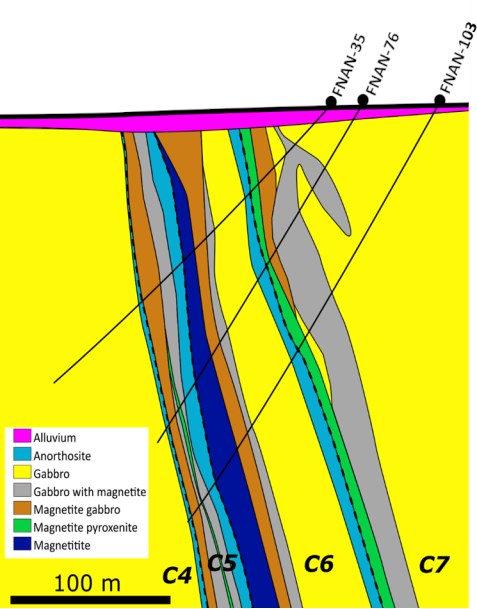
Figure 7.11: NW-SE cross-section (looking towards 020°) through the NAN deposit.
7.4.4 São José (SJO) Deposit
The SJO Deposit (Figure 7.12 and Figure 7.13) is situated in the upper zone of the Rio Jacare Intrusion and comprises two magnetitite units in the C6 and C8 cycles, as well as an additional mineralized magnetite gabbro within the C9 cycle. The mineralized zones and other unmineralized magmatic lithologies have a strike of 020° and dip at 65° to the southeast. The magnetitite units are fine to medium grained and massive, and the magnetite gabbro is coarse grained and foliated, with a mineral assemblage composed of plagioclase and amphibole, with garnet and magnetite. The C6 magnetitite unit is on average 8 m thick has been drill tested along approximately 400 m of strike. The C8 magnetite is narrower, approximately 3 m thick, and has been tested for approximately 250 m of strike. The C9 magnetite gabbro is approximately 20 m thick and has been tested over approximately 300 m of strike.
On the east side, this deposit is hosted by magnetite gabbro and is characterized by a coarse grained, foliated mineral assemblage composed of plagioclase and amphibole, with garnet and magnetite. The west side the ore body is in contact with a fine grained gabbro strongly foliated with narrow bands of pyroxenite. The magnetitite is dark gray to black, fine to medium grained and massive. Figure 7.13 shows a representative cross section of the São José deposit. The São José deposit were completed a total of 60 drill holes, 2 of them by were completed by CBPM. The total drilled length was over 10,300 meters.
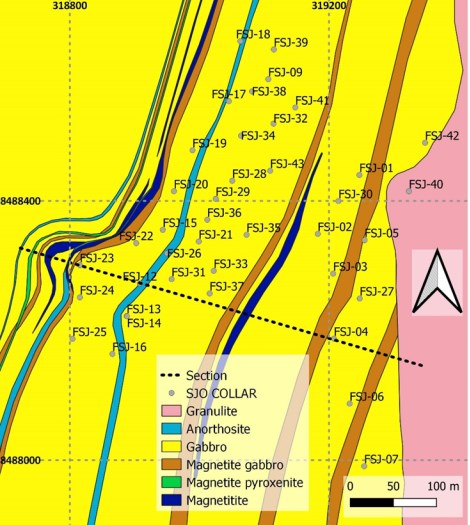
Figure 7.12: Shows the integrated map of São José Deposit.
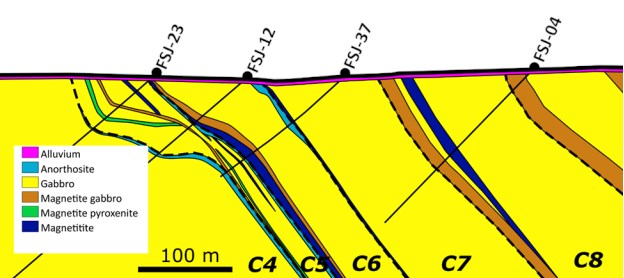
Figure 7.13: Shows a representative cross-section of the São José deposit.
7.4.5 Novo Amparo (NAO) Deposit
The NAO Deposit is located between the NAN and SJO deposits in the upper cyclic units of the Rio Jacare Intrusion. The exact stratigraphic position of the mineralization has not yet been determined, but based on airborne magnetic data, it appears likely to be within the C8 unit. The mineralization occurs in a magnetitite to magnetite gabbro that extends for >300 m along a north-northeast/south-southwest strike, with a dip of 70° SE and widths ranging from 11 m to 21 m.
The magnetitite mineralization contains over 60% titanomagnetite, is dark gray to black and has a massive structure, with a locally developed foliation observed in the gangue minerals, which consist of amphibole, biotite, chlorite and garnet. Commonly interlayered with the massive ore are minor, thinner layers of magnetite pyroxenite, magnetite gabbro and pyroxenite.
The magnetite gabbro occurs in the western part of the deposit and is characterized by fine- to coarse-grained mineral assemblage of plagioclase, amphibole, titanomagnetite, and disseminated sulphide (pyrite and chalcopyrite). The deposit is cut longitudinally by bodies of quartz-feldspar pegmatite that cross the mineralized zone. These pegmatites have a strike direction of approximately 030° and dip at 60 - 70° to the northwest.
7.5 Mineralization
Elements of interest at the Maracás Mine are vanadium and titanium. Vanadium is hosted within titaniferous magnetite, which is the major oxide phase found within the deposit. Ilmenite forms a second oxide phase which is commonly present, and which hosts titanium mineralization. Magnetite occurs as primary magmatic crystal grains that may be partly to martitized. These occur as anhedral grains, with grain sizes of between 0.3 mm and 2.0 mm, that form a polygonal mosaic together with ilmenite, which generally occurs as discrete anhedral magmatic crystals but may also occurs as inclusions within in the titaniferous magnetite, commonly displaying exsolution textures. Magnetite from the lower cyclic units (particularly the C3 unit at the Campbell deposit) has higher V2O5 concentrations than magnetite from the upper cyclic units - this is consistent across all deposits and is typical of layered magmatic magnetite deposits.
Massive magnetitite bodies are formed by ilmenite-magnetite heteradcumulates that form 2 cm to 3 m thick layers containing variable amounts of clinopyroxene. They occur together with layered mafic and ultramafic cumulates, which consist of olivine-magnetite cumulates and clinopyroxene-magnetite heteradcumulates, and together form rhythmically micro-layered gabbro, magnetite, and magnetite-pyroxenite bands.
In addition to primary magnetite, fine-grained magnetite also occurs locally as inclusions within silicate grains, and is the result of alteration of iron-rich silicates (e.g. uralitization of pyroxene and serpentinization of olivine).
Silicate phases associated with the magnetite include augite, plagioclase, hornblende, and rare grains of clinopyroxene, olivine and spinel. Rare olivine and pyroxene grains are observed within the magnetitite, but most are altered to serpentine or chlorite. The Rio Jacaré Intrusion has been intensely metamorphosed, so the pyroxene compositions observed probably reflect metamorphic re-equilibration rather than original magmatic compositions. In addition, Brito (2000) also documented the presence of orthopyroxene. Garnet and biotite are present in the Gulçari B and Novo Amparo deposits.
Sulphides (chalcopyrite and pentlandite with rare pyrite and pyrrhotite) are minor, and only account for up to 1% of the rock within the magnetitite units. Chalcopyrite is more abundant than the other sulphides and is most common in the rock types containing 50% magnetite or less. It commonly occurs in association with magnetite or ilmenite enclosed by amphibole and plagioclase. Pentlandite is much less abundant and occurs within in the magnetitite. Minor sphalerite and galena grains are found together in the silicates, associated with the other sulphides especially in the magnetite-poor rock types. However, the dominant trace minerals are nickel and cobalt sulphides and arsenides and cobalt-rich pentlandite. In many cases the arsenides are associated with the sulphides and appear to be alteration products of the sulphides.
In addition to the vanadium and titanium that form the focus of exploration and mining at the Maracás Mine, elevated platinum and palladium values have been found associated with magnetite-rich zones in the Rio Jacaré Intrusion. They are much richer in platinum-group metals than the surrounding silicate rocks, and there are significant correlations among all the PGMs and between PGM and copper.
In the magnetite zones, palladium-rich minerals, especially bismuthides and antimonides, are the most abundant PGM minerals. In most cases, these occur with interstitial silicates or within silicate inclusions in magnetite and ilmenite grains, and are associated with pentlandite and, in a few cases, with arsenides. Sperrylite is the most abundant platinum mineral and is associated with silicates interstitial to magnetite and ilmenite grains. At sites where the igneous mafic minerals have been altered to amphiboles, sperrylite may be altered to platinum-iron alloys.
It is suggested that copper, nickel and PGM were concentrated in the magnetite layers by the co-precipitation of a small quantity of sulphide with the magnetite. These PGM-bearing base metal sulphides subsequently exsolved the platinum minerals. The association of palladium minerals with base metal sulphides and the small variation in the Pt/Pd ratio (4:1) suggests that the PGMs have not been extensively remobilized in the magnetite.
The association of PGM enrichment with magnetite layers in the Rio Jacaré Intrusion has similarities with the Rincón del Tigre, Skaergaard and Stella Complexes. This enrichment is rarely associated with visible sulphides but suggests a possible target for PGM exploration.
7.6 Oxidation
In the Maracás area the water table generally lies 30 m below surface. The rocks are generally fresh below this water table and over it they weather and oxidize to varying degrees, with deeper oxidation in the proximity of faults, that may provide a conduit for fluid ingress. In weathered zones, silicate minerals generally weather (to clay minerals) more rapidly than oxides weather (Figure 7.14). Oxide minerals such as magnetite and ilmenite oxidize to other minerals such as maghemite, hematite, goethite and other iron oxides. The main effect of weathering/oxidation is a potential reduction in vanadium recovery to the magnetite concentrates - since the oxidized products of magnetite (e.g., hematite) are not magnetic, increased weathering may result in a lowering of vanadium recoveries.
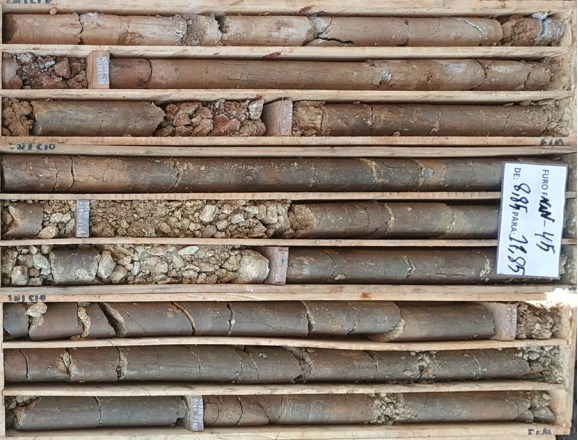
Figure 7.14: Recovery Reduction Factors for Oxidized material, Campbell.
Tests conducted to quantify the reduction in vanadium recoveries with depth showed lower V2O5 to-magnetite recoveries in oxidized material, and recovery factors for massive or disseminated material at different depths have been quantified for the Campbell deposit (Table 7-2).
Table 7-2: Recovery Reduction Factors for Oxidized material, Campbell.
| Metres Depth | Bench | Massive | Disseminated |
| 30 | 270 - 275 | 10% | 10% |
| 20 | 280 - 285 | 20% | 32% |
| 10 | 290 - 295 | 9% | 19% |
| 5 | 300 - 305 | 32% | 36% |
8 DEPOSIT TYPE
8.1 Mineralization Styles
The information on which this chapter is based has been taken from internal documents provided to GE21 by the Company. GE21 has independently verified this information and has confidence in its accuracy and completeness.
According to Gross (1996), orthomagmatic Fe-Ti-V deposits, or Vanadiferous Titano-Magnetite (VTM) deposits are classified into two types: (i) Ilmenite type, which has ilmenite as its predominant oxide and occurs associated with anorthosite complexes, and (ii) Titanomagnetite type, in which the predominant oxide is titanomagnetite and occurs related to stratified gabbroanorthosite complexes. The largest known vanadiferous deposits are classified as type (ii) deposits, such as: Bushveld located in South Africa (Tegner et al., 2006), Mustavaara, in Finland (Karinen, et al., 2015) and Maracás, in Brazil (Brito, 2000).
The deposits which are subjects of this report are hosted within the Rio Jacaré Intrusion, which contains the largest known vanadium resources in the Americas. The Rio Jacaré Intrusion is composed of a series of mafic-ultramafic rocks with a strike length of 70 km along the N-S direction and 1.2 km wide in the E-W direction. The Rio Jacaré Intrusion is a layered mafic to ultramafic intrusion characterized by rhythmic and cryptic layers the deposit was assigned this way by the way it was generated: an initial magmatic ore type deposit formed by concentration through liquid immiscibility.
According to Reynolds (1985), the favorable physicochemical conditions for generating large amounts of titan-vanadiferous magnetite are created from a prolonged period of fractional crystallization, concentrating elements in the residual magma. This author also suggests that the liquid Fe2O3/FeO ratio (linked to the water content and the oxygen fugacity) is decisive in the process. The genesis of the Rio Jacaré Intrusion is also related to an open magmatic system, but with periodic supply of three magma flows (BRITO, 2000). The same attributes, therefore, the interaction between magma mixing processes and fractional crystallization as the main genetic processes of the Rio Jacaré Intrusion.
Vanadiferous titano-magnetite (VTM) mineralization at the Maracás Project shows similarities to other magmatic VTM or ilmenite deposits associated with layered mafic intrusive complexes including the Bushveld Complex (South Africa), the Lac Doré Complex (Quebec, Canada) and the Skaergard Intrusion (Greenland). In these layered complexes VTM and ilmenite deposits typically form in the upper portions of the magmatic stratigraphy It is believed that magnetite crystallization is initiated when the evolving magma becomes sufficiently iron-enriched to form oxide minerals.
Knowing that vanadium is compatible in the magnetite crystal structure, it is incorporated into this mineral, depleting the magma in vanadium. Consequently, this process will result in magnetite-carrying units having the highest V2O5 values, with the vanadium content of the magnetite gradually decreasing in the upper parts of the stratigraphy as the mineral density increases and it becomes concentrated in the lower layers. Titanium is incompatible with the magnetite structure, enriching the residual magma. This process is responsible for an overall decrease in the V2O5 / TiO2 ratio of the upper stratigraphy units observed in the Project (Figure 8.1).
'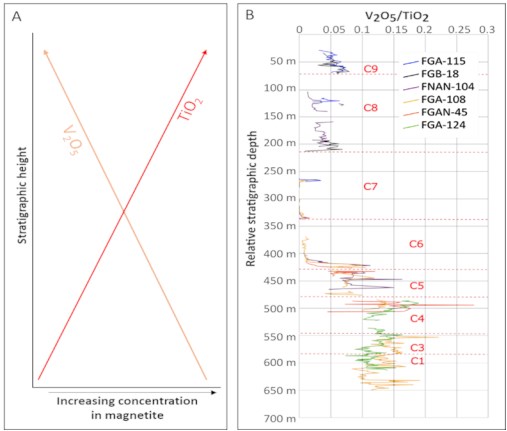
Figure 8.1: Illustration of the general increase in TiO2 and decrease in V2O5 in magnetite with increased stratigraphic height in the upper portions of layered mafic complexes. B: V2O5/TiO2 ratios through the Rio Jacare Intrusion. Note that lower layers (C1-C4) have higher V2O5/TiO2, and that a large change occurs through the C5 and C6 units.
Lower magnetitite and magnetite gabbro layers, such as those in the C3 cyclic unit at the Project, can locally have V2O5 contents of over 5% V2O5 in magnetite, and this drops to below 1% V2O5 in the upper layers (C8). Lower magnetite-rich horizons at Maracás layers have TiO2 contents between 4-6% TiO2, while upper layers can reach up to 20% TiO2. Often in VTM deposits, apatite crystallization and P2O5 enrichment may be associated with upper layers enriched in TiO2, and nelsonite (ilmenite + apatite) units may form locally. Nelsonites have not yet been observed in the Rio Jacaré Intrusion, but local enrichment in P2O5 has been observed in the C7 cycle at the NAN deposit.
8.2 Conceptual Models
The Bushveld Complex is the largest repository of mafic and ultramafic deposits in the world, and among them the Fe-Ti-V deposits of its upper zone stand out (TEGNER et al., 2006; WILLEMSE, 1969). For the authors, the magnetitites found in the deposit in question were formed by differentiation in a stagnant magmatic chamber, where the segregation of magnetite occurred through fractional crystallization and precipitation by gravitational accumulation of magnetite and ilmenite; crystallization is initiated when the evolving magma becomes sufficiently enriched in iron to form oxides. Magnetite may crystallize and gravitationally settle, creating localized lowering of the magma density from ~2.7 to ~2.5, creating a density inversion. This density inversion results in overturn of the magma and magma mixing, thereby precipitating additional magnetite. The repetition of this process may lead to the formation of several stratified layers of magnetite, often with sharp bases and gradational upper contacts.
VTM deposits are typically found in the upper, more fractionated portions of layered complexes. In the Upper Zone of the Bushveld Complex, which has been extensively studied, the formation of VTM-enriched layers has been attributed several formation mechanisms - the most likely of these appears to be that magnetite crystallization is initiated when the evolving magma becomes sufficiently iron-enriched to form oxide minerals. Magnetite may crystallize and gravitationally settle, creating localized lowering of the magma density from ~2.7 to ~2.5, creating a density inversion. This density inversion results in overturn of the magma and magma mixing, thereby precipitating additional magnetite. The repetition of this process may lead to the formation of several stratified layers of magnetite, often with sharp bases and gradational upper contacts.
Recently, Kruger & Latypov (2020) have argued that for some magnetitite layers in the Bushveld Complex, magnetite crystallization occurs in-situ on the base of the magma chamber, rather than crystals gravitationally settling, and that this solidification front moves upwards (Figure 8.2). Additional formation mechanisms that have also been suggested also include magma mixing during the influx of new magma (Harne and Von Gruenewaldt, 1995), or separation of a dense, iron-rich magma owing to large-scale silicate liquid immiscibility (Van Tongeren and Mathez, 2012). The latter mechanism (liquid immiscibility) may explain the occurrence of apatite-oxide layers in the upper portions of some layered mafic complexes. The Rio Jacaré Intrusion has not been extensively studied and does not yet have a well-defined mechanism for magnetite crystallization, but recent studies suggest a metallogenesis similar to other complexes rich in this mineral.
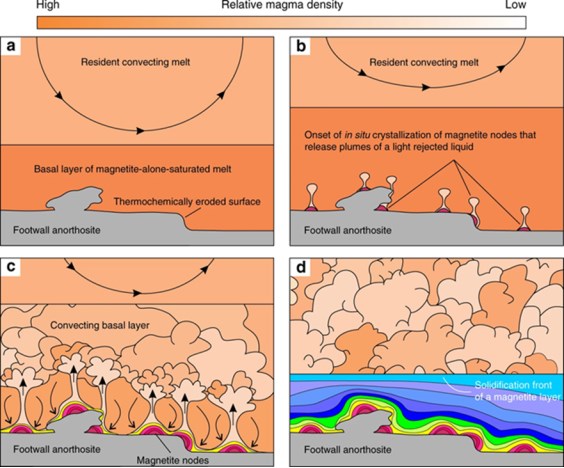
Figure 8.2: Illustration of in-situ magnetite crystallization and growth of a magnetitite layer on the base of a magma chamber. From Kruger & Latypov, 2020.
9 EXPLORATION
9.1 2006 Exploration Program - Largo Inc. (Micon, 2007)
Largo signed a letter of intent to acquire the Maracás Project in October 2006. Largo completed an extensive due diligence and technical audit as part of their process. Prior to completing due diligence work a mineral resource estimate (Hennessy 2006) was undertaken for the previous owners and the Largo data was excluded from this assessment.
By the end of 2006, Largo reinstated the exploration grid and had competed check surveys of drill hole collars that were marked with casing or plastic pipe.
Most of the historic drill core (CBPM and Odebrecht Group) was stored in a rented facility in the town of Maracás and was considered to be in excellent condition. Largo personnel re-logged and re-sampled much of the historic core and verified assay results for V2O5, TiO2 and Platinum Group Elements (PGMs).
2006 Exploration Program - Largo Inc.In this section has been reproduced in its entirety from the Technical Report titled "Technical Report of the Feasibility Study for the Maracás Vanadium Project Brazil by Akers Solutions (2009), as fully cited in Chapter 27 - "References".GE21 has verified the accuracy of the information contained herein and updated as required.
In 2007 Largo conducted an exploration plan with the following steps:
- 175 km of line cutting;
- 175-km line of ground magnetic geophysical surveying;
- 136-km line of induced polarization (IP) geophysical surveying;
- geological mapping of the property at a scale of 1:2,500;
- resampling old drill holes from 1981 through 1986 for PGMs;
- surveying;
- thin section and lithogeochemical studies;
- diamond drilling, 61 holes totaling 13,876 m.
The surveying program aimed to standardize the coordinate system, both for the previous work and also for basis for future work. UTM (Universal Transverse Mercator/Corrego Alegre) was the chosen system. All holes and trenches since 1981 have been converted to UTM.
The entire property has been covered by 175-km of line cutting. The grid lines are 2.5 km long and oriented east-west with 100-m line spacing and 25-m stations along the lines. This line cutting work has been done in order to conduct geological mapping, sampling and ground geophysical surveys (magnetic and IP). Geological mapping was done at a scale of 1:2,500 over the entire property, concentrating on favorable areas that have a limited amount of information. These include Campbell, Gulçari B, Novo Amparo and São José. This work was completed in order to get a better understanding of the area's potential prior to conducting further drill testing.
Ground magnetic surveying was completed over the entire property. It was hoped that the magnetic survey would help in understanding the geology that underlies the property and trace the magnetite-rich horizons associated with the mineralization along strike and at depth. The results were reasonably encouraging given that the magnetite horizons are good magnetic anomalies that respond reasonably strongly.
A total of 136-km line of IP surveying have been completed on the property. IP responds well to the magnetite and disseminated sulphide mineralization found at Maracás. Geophysical surveys are considered important in this phase of work and their use will be discussed in the next section.
Data compilation, re-logging and additional resampling of previously drilled holes (1981 to 1986) were undertaken. This work was done to correlate the lithologies between holes and from section to section, and to test the platinum and palladium potential of the deposit, in order to better understand the geological setting and help in future work plans.
Petrographic analysis was carried out on 56 polished thin sections from drill holes representing the various rock types, including highly mineralized samples from Campbell and Novo Amparo. They were used to characterize the rock types and mineralization in the immediate area around the deposits. The mineralized samples were also analyzed with inductively coupled argon plasma (ICP) multi-element package. Fresh, relatively unaltered samples were also chosen for whole rock analysis, in order to characterize the intrusive rocks in the belt.
A diamond-drilling program of 61 holes totaling 13,876 m was completed in 2007 on the property.
9.2 Previous Geophysical Surveys
A limited number of geophysical surveys were conducted by previous operators (CBPM, Odebrecht and CAEMI,) over the Maracás property during the period 1980 to 1986. These include magnetic and very low frequency EM (VLF) surveys. A review of this coverage is beyond the scope of this Report. Any new drill targets will be generated by the new geophysical surveys.
9.3 Discussion of Present Geophysical Techniques
Systems such as magnetic and IP surveys are the optimum methods for detecting both massive magnetite and disseminated sulphides in the Rio Jacaré belt. Both techniques generally result in good responses to this style of mineralization. The advantage of spectral IP over traditional IP is in its ability to distinguish between strictly massive magnetite and a mixture of massive magnetite and disseminated sulphides.
The total field magnetic responses reflect major changes in the magnetite content of the underlying rock units. The amplitude of the magnetic responses concerned to the regional background assists in identifying specific magnetic and non-magnetic units related to, for example, gabbro, pyroxenite, magnetite units, felsic intrusions and sedimentary rocks. Alteration and fault zones often have distinctive non-magnetic below background responses.
Spectral IP surveys involve measurement of the magnitude and relative phase of the polarization voltage that results from the injection of an alternating current into the ground. Polarization voltages primarily result from electrochemical action within the pores and pore fluids of the material being energized. Measurements of relative phase shift between transmitted current and measured signal and magnitude of the polarization voltage are taken over a range of different frequencies, typically between 0.125 and 1,000 Hz. This results in a distinct IP response spectrum or "dispersion" at each measurement position that can be characterized with Cole-Cole theoretical spectral parameters called tau, M-IP and c, such as relaxation time and chargeability which are influenced by chargeable grain size and the type of chargeable source.
These spectral parameters complement chargeability and apparent resistivity data and have proven successful for detecting favorable gold and PGM mineralization.
A combination of magnetic and spectral IP techniques appears to be more diagnostic in detecting the massive magnetite and disseminated sulphide mineralization on the property and was thus recommended as the only geophysical tool remaining that can provide diagnostic survey coverage. As these new IP progresses are made, the spectral IP method is a useful ground geophysical tool in detecting the disseminated sulphide mineralization along strike and at depth.
9.4 Geophysical Survey Results
Three relatively continuous, parallel to sub-parallel, magnetic trends can be traced north-south using the results of the new ground magnetic survey data. These are associated, from west to east, with Campbell, Novo Amparo-São José-Gulçari B and a third unknown trend. The two western trends are associated with the Rio Jacaré layered mafic intrusion, whereas the eastern, most magnetic trend, is of unknown origin. The few available outcrops suggest that the trend is underlain by felsic intrusive rocks. There is a strong possibility, however, that there are northeast-trending listric normal faults and that a magnetic horizon hosted in the mafic layered intrusion at depth may be responsible for the trend.
The IP conductors discovered are coincident with the trends of strong magnetic highs. In 2008, a work to examine the spectral IP parameters was carried out and is nearing completion. At that time Largo reported initial indications that the spectral data suggested areas along the magnetic trend where there is potential for disseminated sulphides. Largo also reported that these would become targets for future drilling programs at Maracás.
9.5 2008 Exploration Program (RungePincockMinarco, 2012)
The following sections have been taken from the RungePincockMinarco report titled "Amended: Technical Report for the Largo Maracás Vanadium Project, 1 Million Tonnes per Year Processing Plant, Brazil" prepared for Largo and filed on SEDAR in 2012. GE21 has verified the accuracy of the information contained herein and updated as required.
In 2008 Largo conducted a 5,000 m drill program at Maracás, largely designed to test IP targets other than Gulçari A. This program is described in Section 10 below.
9.6 2011-2012 Exploration Program (RungePincockMinarco, 2012)
In 2011 and 2012, Largo executed a diamond drilling program of approximately 13,400 m. Part of this program was still carried out at the Campbell deposit, but the majority of the holes were drilled at other anomalies known throughout the project. The results of the program are described in Section 10 below.
9.7 2012 Infill Drill Program (Micon, 2016)
The following sections have been taken in whole or in part from the Micon report titled "An Updated Mine Plan and Mineral Reserve for the Maracás Menchen Project, Bahia State, Brazil" prepared for Largo and filed on SEDAR in 2016. GE21 has verified the accuracy of the information contained herein and updated as required.
In 2012 Largo completed an additional infill diamond drilling campaign at the Campbell deposit consisting of 103 vertical drill holes totaling 3,929.15 m. The aim of this campaign was to ensure the initial 2-3 years of mine operation. At the time of this report, this material had been mined out and the information is contained within the overall database but was not used in the current mineral resource or reserve estimates. These holes were included in the database used in the Resource estimate. This campaign is best described in Section 10 below.
9.8 2015 Exploration Program (Micon, 2016)
The following sections have been taken in whole or in part from the Micon report titled "An Updated Mine Plan and Mineral Reserve for the Maracás Menchen Project, Bahia State, Brazil" prepared for Largo and filed on SEDAR in 2016. GE21 has verified the accuracy of the information contained herein and updated as required.
In 2015 Largo conducted a Davis Tube Test program on all pulp samples from the 2007, 2008, 2011 and 2012 Campbell drilling campaigns. The Davis Tube Test concentrated the magnetic fraction of the samples and that magnetite concentrate was analyzed for V2O5 and SiO2. A total of 7,567 samples were reanalyzed from the previous campaigns. These samples were collected from a secure lock storage area at Largo's exploration camp near the mine site. The samples were then shipped to SGS facility near Belo Horizonte, Brazil. All test work was done at SGS's Laboratory. The results have been inputted into the drill hole database used to create the block model for the Gulçari A deposit at the time. Results of this sampling have been utilized in the current mineral resource and reserve calculations that are the subject of this report if those results exist below the current mining topography.
9.8.1 Davis Tube Tests
Davis Tube electromagnetic separators create a magnetic field which is able to extract magnetic particles from pulverized ore. With this instrument, the percentage of magnetic and non-magnetic material in a sample may be determined (Figure 9.1). Further chemical analysis by XRF is performed on the magnetic fraction to determine V2O5 and SiO2 in the concentrate.
A 30 g aliquot of pulp sample is gradually added to the cylindrical glass tube which oscillates at 60 strokes per minute. As the sample progresses down the inclined tube the magnetic particles are captured by the magnetic field; wash water flushes the non-magnetic fraction out of the tube until only the magnetic fraction remains. Both the magnetic and non-magnetic fractions are dried and weighed to determine the percentage of magnetics in each sample.
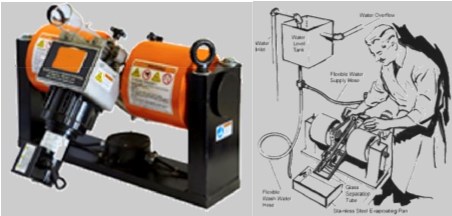
Figure 9.1: Davis Tube Test Apparatus.
The Davis Tube test results were used to help determine what portion of the mineralization in the mineral resources contains magnetite of sufficient vanadium content and silica of low enough content to be processed through the magnetic separators and, therefore, can be determined to be a mineral reserve.
9.9 2018-2019 Exploration Program
Between April 15 and May 20, 2019, the Largo conducted a ground magnetometer survey on concessions 871,483/2016 and 871,485/2016, located north of the Novo Amparo Norte deposit (Figure 9.2). show the location of ground magnetometer surveys completed by Largo and the location of key deposits.
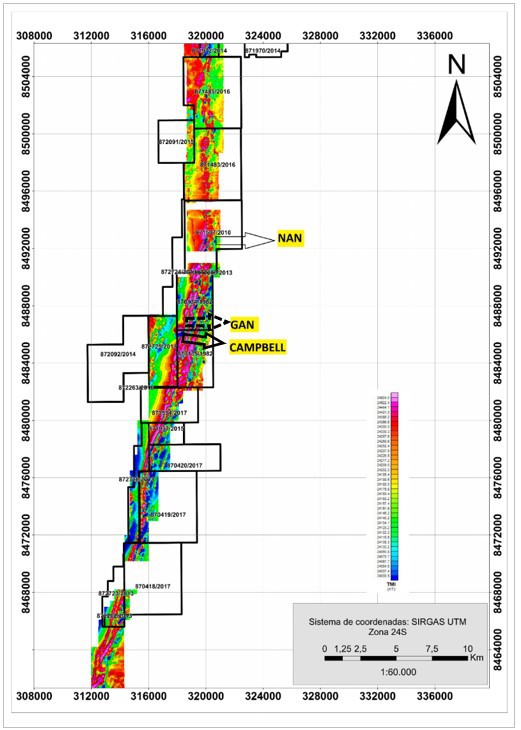
Figure 9.2: Largo Ground Magnetometer Survey and Key Deposits
The survey was carried out on east-west survey lines spaced 100 m apart. In total the surveyed area covered approximately 99-line kilometers on concession 871.483/2016 and 123 line kilometers on concession 871.485/2016. The survey equipment was set up for continuous readings. Considering a typical walking speed (≈ 5 km/h), there is a station spacing of approximately 3 m along each survey line.
Magnetic data was acquired with Largo's GSM-19W Overhauser GEM magnetometers and a GEM GSM-19T proton precession magnetometer that was operated as a base station to provide data for daytime corrections.
The data were collected, corrected and processed using Oasis Montaj®. All data collected were standardized in the UTM coordinate system in DATUM SIRGASS 2000 (24S). Magnetic anomalies indicate an N-S magnetic tendency.
In 2018, more detailed exploration was carried out at the NAN and Jacare deposits. At NAN (Carvalho, 2018), the field campaign was completed in 18 days and recorded 477 map data points. The methodology used comprised activities such as aerial photography interpretation, geological mapping on a scale of 1:5,000, petrographic studies, qualitative geophysical modeling through the interpretation of ground magnetometer data and structural analysis.
Exploration was also undertaken in the area of the Jacare deposit (Santos, 2018B). Work included geological mapping focusing on understanding the geological relationship of the deposit within the Rio Jacare Intrusion. Rock units were defined based on known stratigraphy of the sill, including petrographic studies.
In 2019, mapping was carried out on the scale of 1: 10,000 in the São Jose area (Jesus, 2019) whose field campaign was carried out for 8 days totaling 650 points described. Work again focused on the stratigraphic relationship of the deposit within the Rio Jacare Intrusion. Specific lithotypes were macroscopically defined and an attempt was made to correlate these rock units with the detailed ground magnetic data to help define stratigraphy and ultimately drill targets.
9.10 2020 Exploration Program
In 2020, the processing, presentation, interpretation and integration of government aerial geophysical data (Gamma spectrometry and magnetometry) and Largo's detailed ground magnetic survey results was completed by Dr. Moraes.
According to Moraes (2020):
"The work in question focused on the processing, interpretation and integration of surface magnetometry data (acquired between 2007 and 2014) and magnetometry and gamma spectrometry of part of aerogeophysical survey performed for CBPM (Aerogeophysical Project Ruy Barbosa / Vitória da Conquista, 2006). The surface survey covered an area with 87.7 km2 and the aerial comprised a window with 8,700 km2 centered in the region where Soleira do Rio Jacaré (SRJ) and its most immediate surroundings are located.
The aerial served as the basis for the more regional understanding of geophysical signatures and their relations with the geometric entities of the cartography and the terrestrial, served for a vision focused more specifically on the SRJ. The objective was to offer a complement to what is known about local geology, and was concerned with developing, objectively, themes that would help prospect for geoeconomics targets in the focus of the work."
Largo also undertook an experimental soil geochemical sampling campaign to test the effectiveness of multi-element soil responses to further refine drill targeting along the strong and continuous magnetic survey results that define potential mineralized zones within the Rio Jacare Sill. Largo collected 198 samples at NAN in June and collected 165 samples in March at GAN. All samples were analyzed by 32 element ICP technique at the ALS laboratory in Belo Horizonte, Brazil.
All data collected were standardized in the UTM coordinate system in DATUM SIRGASS 2000. Test surveys were based on known magnetic anomalies and stratigraphic relationships of areas of known vanadium and titanium mineralization. Analytical data was contoured using the Kriging method in Leapfrog Geo software.
At NAN, six survey lines, spaced of 100 m apart with sample stations every 25 m were established. Results indicate that elements correlated with geophysics are vanadium and titanium (Figure 9.3).
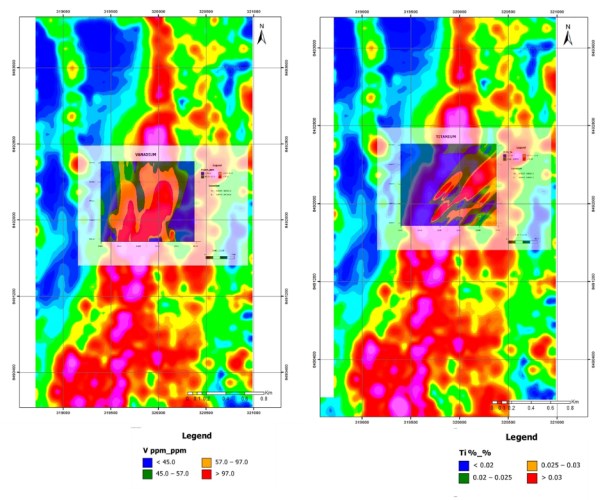
Figure 9.3: Geochemical maps of Vanadium and Titanium generated from the 2020 NAN campaign.
At GAN 5 grid lines with spacing of 100 m were established. Each line had sample stations at 25 m intervals (33 samples per line). Among the elements correlated with geophysics and stratigraphy are V, Ti and Ni (Figure 9.4).
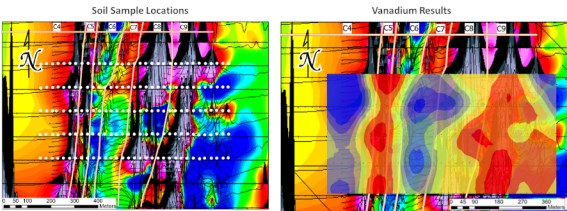
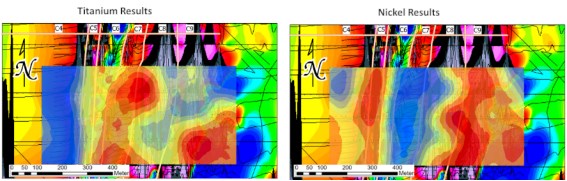
Figure 9.4: Geochemical maps of Vanadium, Titanium and Nickel generated from the 2020 GAN campaign.
In 2020, geological mapping, at 1:5,000 scale, and petrographic studies was carried out in the areas of GAN and GAS. In the GAN area (PEREIRA, 2020) the field stage lasted 10 days, with 59 outcrop points identified, in which lithologies were described macroscopically and correlated with magnetic anomalies and stratigraphy.
At GAS the mapping was done on the scale of 1:10,000 (Santos, 2020). The field campaign was carried out over the course of 13 days with 259 survey points described. Parameters such as mineralogical composition, textures, granulometry, magnetic susceptibility, degree of metamorphism and structures were considered.
9.11 Topography Survey
Topographic survey was carried out at the Campbell Pit, GAN and NAN deposit using Trimble R8s receivers, including two integrated Maxwell™ 6 chips and 440 GNSS channels, capable of tracking a wide range of satellite systems including GPS, GLONASS, Galileo, BeiDou and QZSS. All these functions coupled with the CMRx communication protocol provide the user with different data correction and compression tools.
The topographic points surveyed such as drill holes, access ramps, talus crest, etc. allowed the interpolation of the Campbell area in more details. At GAN and NAN, the topography used was based only on the altitudes of the hole collar surveyed in the same system. All coordinates are in the DATUM SIRGAS 2000 (24S) and UTM coordinate system. The effective date of Campbell Pit, GAN and NAN deposit was July 12, 2021.
At the GAN and NAN deposits topography was based on drill hole collars, and no discrepancies were found in relation to the final interpolated topography. At Campbell, in areas without rock movement, no relevant inconsistencies between the most current topographic and holes surveyed were found either.
10 DRILLING
10.1 Drilling by Previous Operators (Micon 2006 and 2007)
CBPM and Odebrecht Group completed a first drilling campaign in 1986 at Campbell's deposit. The data from this survey were used as input data for the first Resources estimative of project.
Between 1981 and 1987, previous CBPM/Odebrecht drilled 66 holes totaling 5,814 m (Table 10-1), testing four deposits on the Maracás property, namely, ranging from south to north, Campbell, Gulçari B, São José and Nova Amparo deposits. A summary of the complete drilling is set out by deposit in Table below
Table 10-1: Summary of Diamond drilling, Maracás Property
| Deposit | No. Of
Holes | Length
(m) |
| Campbell | 53 | 5,153 |
| Gulçari B | 4 | 169 |
| Sao Jose | 2 | 115 |
| Nova Amparo | 7 | 377 |
| Total | 66 | 5,814 |
10.2 2007 Largo Drill Program
Most part of the section has been reproduced in its entirety from the Technical Report fo the Feasibility Study for the Maracás Vanadium Project (2009), Bahia State, Brazil by Akers Solutions, as fully cited in Chapter •27 - "References". GE21 has verified the accuracy of the information contained herein and updated as required.
During 2007, Largo completed a drilling program consisting of 61 holes totaling 13,876 m as set out in Table 10-2. This subsection of the report deals with the updated estimate of mineral resources at Campbell and will generally address drilling at other deposits.
Table 10-2: Largo 2007 Maracás Drill Program.
| Areas | Type/Purpose | Number
of Holes | Total
(m) |
| Campbell | Resource | 42 | 10,896 |
| Campbell | Metallurgical & Geotech | 3 | 300 |
| Novo Amparo | Exploration | 11 | 1,852 |
| Regional | Exploration | 5 | 828 |
| Total | - | 61 | 13,876 |
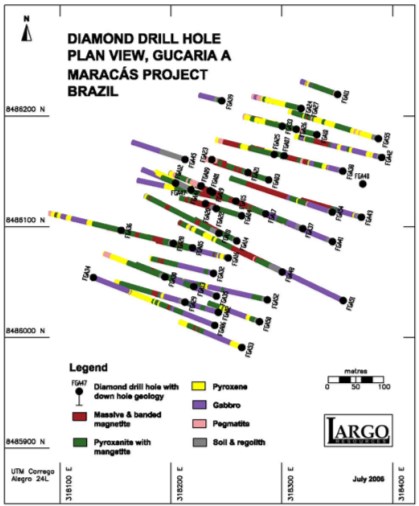
Figure 10.1: Gulçari A Deposit Drill-Hole Plan Maracás Vanadium Project.
Source: Micon, 2007..
Boart Longyear (Geoserv Pesquisas Geológicas S/A) began the program with one drill rig on February 15, 2007 and added a second drill rig on March 5, 2007. Two rigs continued on the property until August 19, 2007, at which time drilling was completed on the Campbell deposit. One rig was released and the second drill went to Novo Amparo where 11 holes totaling 1,852 m were completed. The drill then cored five regional holes testing geophysical deposits totaling 827,40 m. Drilling was completed on October 29, 2007.
Table 10-3: 2007 Novo Amparo drilling campaign.
Drill | UTM Coordinates
(Corrego Alegre) | Elevation | Azimuth | Dip | Depth | Near Mine Targets |
Hole | N | E | (m) | (°) | (°) | (m) | Definition after 2007 |
FEXP 01 | 8,488,396 | 319,152 | 338 | 290 | -60 | 205.1 | São José - SJO |
FEXP 02 | 8,488,450 | 319,000 | 342 | 290 | -60 | 220.1 | São José - SJO |
FEXP 03 | 8,487,092 | 318,653 | 339 | 290 | -60 | 141.2 | Gulçari A Norte - GAN |
FEXP 04 | 8,485,487 | 318,655 | 340 | 290 | -60 | 152 | Gulçari A Sul - GAS |
FEXP 05 | 8,484,085 | 319,058 | 341 | 290 | -60 | 109 | Gulçari A Sul - GAS |
Total | | | | | 5 | 827.40 | |
Boart Longyear drilled with NQ-sized core and an average of 1,000 m per rig/month. Core recovery was good with a reported average of 90%. Detailed drill hole information for Campbell is listed in Table 10-4.
The main focus of the diamond drilling program was to upgrade the confidence of the previous inferred resource at Campbell to the measured and indicated categories, and to expand upon it sufficiently to demonstrate its potential economic viability. A secondary objective was to evaluate the PGM potential in the Campbell deposit.
Table 10-4: Drill Hole Summary for the 2007 Campbell Drill Program.
Drill
Hole | UTM Coordinates (Corrego Alegre) | Elevation
(m) | Azimuth
(°) | Dip
(°) | Depth
(m) |
| N | E |
| FGA 56 | 8,486,090 | 318,346 | 294.04 | 290 | -55 | 229.10 |
| FGA 57 | 8,486,090 | 318,346 | 295.04 | 290 | -70 | 265.10 |
| FGA 58 | 8,486,125 | 318,353 | 294.96 | 290 | -70 | 238.40 |
| FGA 59 | 8,486,151 | 318,358 | 294.76 | 290 | -45 | 138.60 |
| FGA 60 | 8,486,032 | 318,360 | 297.52 | 290 | -50 | 254.00 |
| FGA 61 | 8,486,162 | 318,364 | 296.29 | 290 | -60 | 139.60 |
| FGA 62 | 8,486,074 | 318,332 | 296.09 | 290 | -50 | 214.00 |
| FGA 63 | 8,486,038 | 318,334 | 293.09 | 290 | -50 | 229.30 |
| FGA 64 | 8,486,074 | 318,332 | 295.09 | 290 | -65 | 267.00 |
| FGA 65 | 8,486,020 | 318,402 | 299.25 | 290 | -50 | 197.50 |
| FGA 66 | 8,486,073 | 318,409 | 299.18 | 290 | -65 | 247.15 |
| FGA 67 | 8,486,090 | 318,296 | 301.09 | 290 | -45 | 206.60 |
| FGA 68 | 8,486,111 | 318,405 | 297.73 | 290 | -65 | 270.60 |
| FGA 69 | 8,486,133 | 318,319 | 302.71 | 290 | -45 | 151.00 |
| FGA 70 | 8,486,053 | 318,213 | 302.74 | 290 | -45 | 94.70 |
| FGA 71 | 8,486,097 | 318,454 | 300.84 | 290 | -65 | 236.20 |
| FGA 72 | 8,486,020 | 318,336 | 296.00 | 290 | -45 | 285.60 |
| FGA 73 | 8,486,130 | 318,435 | 299.00 | 290 | -50 | 224.55 |
| FGA 74 | 8,486,130 | 318,435 | 299.00 | 290 | -80 | 292.80 |
| FGA 75 | 8,486,033 | 318,288 | 293.99 | 290 | -45 | 267.60 |
| FGA 76 | 8,486,011 | 318,281 | 293.68 | 290 | -55 | 151.10 |
| FGA 77 | 8,486,145 | 318,429 | 297.82 | 290 | -60 | 159.70 |
| FGA 78 | 8,486,000 | 318,320 | 295.64 | 290 | -65 | 190.00 |
| FGA 79 | 8,486,133 | 318,478 | 300.03 | 290 | -60 | 229.00 |
| FGA 80 | 8,485,941 | 318,301 | 294.70 | 290 | -60 | 222.95 |
Drill
Hole | UTM Coordinates (Corrego Alegre) | Elevation
(m) | Azimuth
(°) | Dip
(°) | Depth
(m) |
| N | E |
| FGA 81* | 8,486,101 | 318,250 | 302.40 | 290 | -50 | 205.00 |
| FGA 82 | 8,486,201 | 318,926 | 298.99 | 290 | -60 | 169.40 |
| FGA 83 | 8,486,065 | 318,380 | 298.05 | 290 | -65 | 188.60 |
| FGA 84* | 8,486,110 | 318,226 | 302.40 | 290 | -50 | 50.50 |
| FGA 85* | 8,486,120 | 318,205 | 313.30 | 290 | -50 | 44.50 |
| FGA 86 | 8,486,048 | 318,432 | 302.00 | 290 | -65 | 214.10 |
| FGA 87 | 8,486,079 | 318,523 | 305.00 | 290 | -65 | 352.00 |
| FGA 88 | 8,486,055 | 318,479 | 309.00 | 290 | -65 | 336.64 |
| FGA 89 | 8,486,051 | 318,620 | 304.00 | 290 | -65 | 436.00 |
| FGA 90 | 8,485,993 | 318,498 | 309.00 | 290 | -65 | 404.25 |
| FGA 91 | 8,486,106 | 318,594 | 300.00 | 290 | -60 | 382.20 |
| FGA 92 | 8,485,991 | 318,430 | 301.00 | 290 | -60 | 351.80 |
| FGA 93 | 8,486,007 | 318,530 | 304.00 | 290 | -65 | 358.10 |
| FGA 94 | 8,485,968 | 318,412 | 301.00 | 290 | -65 | 336.00 |
| FGA 95 | 8,486,068 | 318,567 | 301.41 | 290 | -65 | 413.95 |
| FGA 96 | 8,486,129 | 318,531 | 304.10 | 290 | -60 | 369.65 |
| FGA 97 | 8,486,130 | 318,435 | 298.00 | 290 | -65 | 280.30 |
| FGA 98 | 8,486,020 | 318,402 | 296.00 | 290 | -73 | 325.00 |
| FGA 99 | 8,485,955 | 318,465 | 302.00 | 290 | -65 | 394.30 |
| FGA 100 | 8,485,962 | 318,348 | 296.00 | 290 | -65 | 181.50 |
| Total | | | | | 45 | 11,196.00 |
* Holes drilled for metallurgical testing and geotechnical information.
Source:.Micon, 2007
The drilling at Novo Amparo was designed to test and characterize the mineralization 4 km to the north, along strike of Campbell and, in particular, the sulphide content and PGM potential of the mineralization. Finally, after the ground magnetic survey was completed, five deposits that had not been previously tested were selected. These showings occur along magnetic trends that can be traced across the property for 4 km from Novo Amparo in the north to Campbell in the south.
At the time, the Campbell deposit, as outlined from the drilling programs, extended 400 m along strike, to a vertical depth of over 320 m with true widths ranging from 11 to 100 m with an average width of about 40 m. This deposit is part of a mineralizing system that extends for 8 km across the property. All the results from the drilling program up to hole FGA-99 (the 2007 drilling program) were completed and incorporated in the block model at that time.
Of the 45 holes drilled at the Campbell deposit, 39 intersected wide well-mineralized zones. Table 10-5 and below is a summary of all significant Largo assay results from the drilling at Campbell up to the end of 2007.
Table 10-5: 2007 Campbell Drill Results.
Hole
Number | From
(m) | To
(m) | V2O5
(%) | Pt
(g/t) | Pd
(g/t) | PGM
(g/t) | Interval
(m) | True
Thickness
(m) |
| FGA56 | 82.00 | 119.00 | 1.68 | 0.28 | 0.21 | 0.49 | 37.00 | 32.00 |
| including | 102.00 | 118.00 | 2.17 | 0.40 | 0.29 | 0.69 | 16.00 | 15.00 |
| FGA57 | 104.00 | 140.10 | 1.85 | 0.27 | 0.21 | 0.48 | 36.10 | 30.00 |
Hole
Number | From
(m) | To
(m) | V2O5
(%) | Pt
(g/t) | Pd
(g/t) | PGM
(g/t) | Interval
(m) | True
Thickness
(m) |
| including | 121.00 | 138.10 | 2.31 | 0.36 | 0.28 | 0.66 | 19.10 | 17.00 |
| FGA58 | 61.30 | 120.00 | 2.22 | 0.45 | 0.11 | 0.56 | 58.70 | 54.00 |
| including | 79.00 | 103.00 | 2.55 | 0.44 | 0.11 | 0.55 | 24.00 | 21.00 |
| and | 136.00 | 158.00 | 2.12 | 0.41 | 0.20 | 0.61 | 22.00 | 22.00 |
| including | 136.00 | 141.00 | 1.79 | 1.07 | 0.33 | 1.40 | 5.00 | 5.00 |
| FGA59 | 50.00 | 122.00 | 1.88 | 0.52 | 0.08 | 0.60 | 72.00 | 72.00 |
| including | 65.00 | 73.00 | 2.65 | 0.91 | 0.10 | 1.01 | 8.00 | 8.00 |
| FGA60 | 75.00 | 91.00 | 0.82 | 0.12 | 0.13 | 0.25 | 16.00 | 16.00 |
| FGA61 | 76.00 | 121.00 | 1.97 | 0.44 | 0.11 | 0.55 | 45.00 | 44.00 |
| including | 95.00 | 106.00 | 2.64 | 0.57 | 0.21 | 0.78 | 11.00 | 10.00 |
| FGA62 | 62.00 | 104.00 | 1.77 | 0.24 | 0.22 | 0.46 | 42.00 | 42.00 |
| including | 83.00 | 103.00 | 2.13 | 0.36 | 0.34 | 0.70 | 20.00 | 20.00 |
| and | 160.00 | 191.00 | 1.13 | 0.08 | 0.11 | 0.19 | 31.00 | 31.00 |
| FGA63 | 54.47 | 70.00 | 0.91 | 0.18 | 0.11 | 0.29 | 15.53 | 15.00 |
| FGA64 | 72.00 | 116.00 | 1.41 | 0.24 | 0.21 | 0.45 | 44.00 | 42.00 |
| including | 96.87 | 114.34 | 2.03 | 0.37 | 0.33 | 0.70 | 17.47 | 16.00 |
| and | 238.05 | 262.40 | 1.27 | 0.44 | 0.28 | 0.72 | 24.35 | 23.00 |
| FGA65 | 129.08 | 155.52 | 1.09 | 0.18 | 0.08 | 0.26 | 26.44 | 25.00 |
| FGA66 | 136.91 | 182.80 | 1.46 | 0.22 | 0.18 | 0.40 | 45.89 | 43.00 |
| including | 156.94 | 182.00 | 2.03 | 0.39 | 0.31 | 0.70 | 25.06 | 23.00 |
| FGA67 | 30.00 | 76.00 | 2.10 | 0.44 | 0.17 | 0.61 | 46.00 | 46.00 |
| including | 32.00 | 55.00 | 2.47 | 0.42 | 0.14 | 0.56 | 23.00 | 23.00 |
| including | 62.00 | 73.00 | 2.21 | 0.54 | 0.26 | 0.80 | 11.00 | 11.00 |
| and | 137.00 | 154.00 | 1.42 | 0.13 | 0.10 | 0.23 | 17.00 | 17.00 |
| FGA68 | 105.00 | 147.00 | 1.80 | 0.36 | 0.14 | 0.50 | 42.00 | 40.00 |
| including | 124.00 | 147.00 | 2.25 | 0.40 | 0.19 | 0.59 | 23.00 | 21.00 |
| and | 168.00 | 217.00 | 1.64 | 0.28 | 0.22 | 0.50 | 49.00 | 47.00 |
| FGA69 | 44.26 | 112.73 | 2.42 | 0.53 | 0.12 | 0.65 | 68.00 | 68.00 |
| FGA70 | 23.00 | 36.00 | 2.15 | 0.21 | 0.09 | 0.30 | 13.00 | 13.00 |
| FGA71 | 151.22 | 193.20 | 2.07 | 0.24 | 0.08 | 0.32 | 41.98 | 40.00 |
| FGA72 | 211.55 | 224.60 | 1.30 | 0.12 | 0.08 | 0.20 | 13.05 | 12.00 |
| and | 229.90 | 239.15 | 1.43 | 0.13 | 0.11 | 0.24 | 9.25 | 9.00 |
| and | 249.15 | 268.15 | 1.06 | 0.04 | 0.05 | 0.09 | 19.00 | 18.00 |
| FGA73 | 128.60 | 148.00 | 2.81 | 0.54 | 0.05 | 0.59 | 19.40 | 17.50 |
| and | 151.46 | 195.46 | 1.62 | 0.24 | 0.10 | 0.34 | 44.00 | 40.00 |
| FGA74 | 136.38 | 175.38 | 1.86 | 0.24 | 0.03 | 0.27 | 39.00 | 39.00 |
| including | 148.38 | 173.38 | 2.15 | 0.21 | 0.04 | 0.25 | 25.00 | 25.00 |
| FGA75 | 181.00 | 216.89 | 1.19 | 0.05 | 0.04 | 0.09 | 35.00 | 35.00 |
| FGA76 | 89.00 | 118.00 | 1.43 | 0.08 | 0.06 | 0.14 | 29.00 | 29.00 |
| including | 105.00 | 118.00 | 1.93 | 0.09 | 0.08 | 0.17 | 13.00 | 13.00 |
| and | 128.00 | 135.00 | 1.32 | 0.06 | 0.08 | 0.14 | 7.00 | 7.00 |
| FGA77 | 127.50 | 145.42 | 2.37 | 0.22 | 0.03 | 0.25 | 17.92 | 17.92 |
| FGA78 | 106.95 | 117.40 | 0.68 | 0.08 | 0.07 | 0.15 | 10.45 | 9.00 |
| FGA79 | 148.75 | 221.00 | 1.60 | 0.26 | 0.06 | 0.32 | 72.25 | 70.00 |
| including | 150.00 | 191.00 | 2.32 | 0.35 | 0.08 | 0.43 | 41.00 | 38.00 |
| FGA80 | 83.70 | 90.70 | 0.69 | 0.07 | 0.04 | 0.11 | 7.00 | 7.00 |
| and | 94.70 | 98.70 | 1.02 | 0.09 | 0.11 | 0.20 | 4.00 | 4.00 |
| and | 114.10 | 118.10 | 1.22 | 0.09 | 0.08 | 0.17 | 4.00 | 4.00 |
| FGA82 | No significant results |
| FGA83 | 134.00 | 152.93 | 1.77 | 0.23 | 0.21 | 0.44 | 18.93 | 18.93 |
| including | 139.00 | 152.93 | 1.99 | 0.26 | 0.25 | 0.51 | 13.93 | 13.93 |
Hole
Number | From
(m) | To
(m) | V2O5
(%) | Pt
(g/t) | Pd
(g/t) | PGM
(g/t) | Interval
(m) | True
Thickness
(m) |
| and | 159.72 | 172.72 | 1.18 | 0.05 | 0.06 | 0.11 | 13.00 | 13.00 |
| FGA86 | 178.50 | 191.16 | 1.43 | 0.01 | 0.02 | 0.03 | 12.66 | 10.00 |
| and | 241.00 | 247.45 | 1.45 | 0.19 | 0.14 | 0.33 | 6.45 | 5.00 |
| and | 259.00 | 265.00 | 1.28 | 0.06 | 0.02 | 0.08 | 6.00 | 5.00 |
| and | 276.00 | 298.00 | 1.54 | 0.33 | 0.19 | 0.52 | 22.00 | 20.00 |
| FGA87 | 244.50 | 259.83 | 1.93 | 0.16 | 0.21 | 0.37 | 15.33 | 15.33 |
| and | 267.00 | 289.00 | 1.82 | 0.19 | 0.22 | 0.41 | 22.00 | 22.00 |
| and | 306.00 | 323.00 | 0.86 | 0.05 | 0.06 | 0.11 | 17.00 | 17.00 |
| FGA88 | 177.10 | 183.10 | 1.02 | 0.13 | 0.10 | 0.23 | 6.00 | 6.00 |
| and | 303.10 | 308.10 | 1.07 | 0.25 | 0.16 | 0.41 | 5.00 | 5.00 |
| FGA89 | 297.00 | 356.00 | 2.11 | 0.19 | 0.07 | 0.26 | 59.00 | 59.00 |
| including | 302.00 | 338.00 | 2.40 | 0.20 | 0.07 | 0.27 | 36.00 | 36.00 |
| FGA90 | 279.00 | 293.00 | 1.05 | 0.09 | 0.07 | 0.16 | 14.00 | 14.00 |
| FGA91 | 285.60 | 294.60 | 1.32 | 0.21 | 0.10 | 0.31 | 9.00 | 9.00 |
| FGA92 | 249.00 | 270.00 | 0.99 | 0.07 | 0.05 | 0.12 | 21.00 | 21.00 |
| FGA93 | 264.00 | 278.00 | 1.94 | 0.24 | 0.18 | 0.42 | 14.00 | 14.00 |
| and | 299.00 | 309.00 | 1.31 | 0.10 | 0.07 | 0.17 | 10.00 | 10.00 |
| FGA94 | 172.00 | 242.12 | 1.35 | 0.09 | 0.05 | 0.14 | 70.12 | 65.00 |
| and | 269.00 | 281.00 | 1.12 | 0.08 | 0.05 | 0.13 | 12.00 | 10.00 |
| and | 292.47 | 298.00 | 1.28 | 0.07 | 0.06 | 0.13 | 5.53 | 5.00 |
| FGA95 | 268.80 | 336.00 | 1.46 | 0.11 | 0.10 | 0.21 | 67.20 | 65.00 |
| including | 268.80 | 284.60 | 2.24 | 0.09 | 0.09 | 0.18 | 15.80 | 15.80 |
| FGA96 | 283.84 | 290.00 | 0.81 | 0.08 | 0.04 | 0.12 | 6.16 | 6.16 |
| FGA97 | 142.73 | 193.00 | 1.83 | 0.28 | 0.19 | 0.47 | 50.27 | 50.27 |
| including | 143.73 | 173.00 | 2.26 | 0.34 | 0.16 | 0.50 | 29.27 | 29.27 |
| and | 218.00 | 228.00 | 1.40 | 0.30 | 0.30 | 0.60 | 10.00 | 10.00 |
| FGA98 | 175.00 | 187.00 | 0.80 | 0.20 | 0.06 | 0.26 | 12.00 | 12.00 |
| FGA99 | 224.00 | 233.00 | 1.38 | 0.10 | 0.11 | 0.21 | 9.00 | 9.00 |
| and | 237.00 | 241.00 | 1.55 | 0.06 | 0.04 | 0.10 | 4.00 | 4.00 |
Source:Micon, 2007
10.3 2008 Largo Drill Program
This section has been reproduced in its entirety from the Technical Report for the Largo Maracás Vanadium Project, 1 Million Tonnes per Year Processing Plant (2012), Brazil by Runge Pincock Minarco, as fully cited in Chapter 27 - "References". GE21 has verified the accuracy of the information contained herein and updated as required.
In May 2008, Largo began a 5,000-m drill campaign to test high-priority IP targets for PGM mineralization. Boart Longyear (Geoserv Pesquisas Geológicas S/A) began the program with one drill rig on May 28, 2008 and continued until September 19, 2008, at which time the drilling program was terminated due to the capital market collapse. It was decided that it was more prudent to discontinue drilling and save the resources. At the time the program was suspended, Largo had completed 16 holes totaling 3,842.7m. The program is summarized in Table 10-6 below.
Table 10-6: 2008 Drill Program Summary.
| Areas | Type | No of
Holes | Total
Metres |
| Campbell | Exploration | 1 | 211.00 |
| Gulçari A Norte | Exploration | 5 | 1,137.20 |
| São Jose | Exploration | 9 | 2,209.50 |
| Novo Amparo | Exploration | 1 | 285.00 |
| Total | | 16 | 3,842.70 |
Source: RungePincockMinarco, 2012
Ten of the sixteen holes were analyzed in 2008. The remaining six holes were analyzed in 2011, during the 2011-2012 drilling program. Boart Longyear drilled with NQ-sized rods an average of 1,000 m per rig/month. Core recovery was good with a reported average of 90%. Detailed drill hole information is listed in Table 10-7:
Table 10-7: 2008 Drill Program Information
Drill
Hole # | UTM Coordinates
(Corrego Alegre) | Elevation
(m) | Azimuth
(°) | Inclination
(°) | Depth
(m) |
| N | E |
| FGA 101 | 8,486,386 | 318,630 | 300 | 270 | -45 | 211.00 |
| FGAN 01 | 8,487,100 | 318,775 | 307 | 270 | -45 | 259.00 |
| FGAN 02 | 8,487,000 | 318,785 | 310 | 270 | -45 | 260.80 |
| FGAN 03 | 8,487,000 | 318,925 | 312 | 270 | -45 | 225.40 |
| FGAN 04 | 8,486,800 | 318,700 | 308 | 270 | -45 | 196.00 |
| FGAN 05 | 8,486,800 | 318,875 | 330 | 270 | -45 | 196.00 |
| FSJ 03 | 8,488,300 | 319,200 | 325 | 290 | -50 | 244.30 |
| FSJ 04 | 8,488,200 | 319,200 | 330 | 290 | -50 | 250.00 |
| FSJ 05 | 8,488,350 | 319,250 | 323 | 290 | -50 | 232.60 |
| FSJ 06 | 8,488,100 | 319,225 | 332 | 290 | -45 | 229.30 |
| FSJ 07 | 8,488,000 | 319,243 | 330 | 290 | -45 | 280.00 |
| FSJ 08 | 8,487,303 | 318,806 | 321 | 290 | -45 | 253.00 |
| FSJ 09 | 8,488,398 | 319,104 | 320 | 290 | -50 | 178.00 |
| FSJ 10 | 8,487,800 | 319,200 | 332 | 290 | -50 | 262.30 |
| FSJ 11 | 8,487,298 | 318,863 | 320 | 270 | -50 | 280.00 |
| FNA 19 | 8,489,599 | 319,679 | 307 | 270 | -45 | 285.00 |
| TOTAL | | | | | | 3,842.70 |
Source: RungePincockMinarco, 2012
The diamond drilling program focused on testing a number of high priorities PGM deposits on the property. These holes were targeted based on the magnetic and IP geophysical surveys completed in 2007, lithogeochemical results from drill core sampling done across the property and some modeling, lithological and petrographic studies done by Dr. Keays.
Dr. Keays considers that there is a strong possibility for a PGM-rich horizon to occur at a stratigraphic interval higher than that in which the Campbell deposit is located. The field work completed to date, including geological mapping and sampling, magnetic and spectral IP ground surveys, has identified a number of high priority deposits to be tested, in particular by the sulphide content and PGM potential of the mineralization.
Significant assay results for all the 2008 drilling are reported in Table 10-8 below.
Table 10-8: 2008 Drill Program Summary of Significant Results.
Hole
Number | From
(m) | To
(m) | V2O5
(%) | Pt
(g/t) | Pd
(g/t) | PGM
(g/t) | Interval
(m) | True
Thickness
(m) |
| FSJ 03 | 75.00 | 90.00 | 0.55 | | | | 15.00 | 15.00 |
| FSJ04 | 22.00 | 35.00 | 0.56 | | | | 13.00 | 13.00 |
| and | 128.00 | 138.00 | 0.50 | | | | 10.00 | 10.00 |
| FSJ05 | 2.00 | 21.00 | 0.55 | 0.32 | 0.12 | 0.44 | 19.00 | 19.00 |
| FSJ06 | 68.00 | 88.00 | 0.52 | 0.34 | 0.14 | 0.48 | 20.00 | 20.00 |
| including | 83.00 | 88.00 | 0.63 | 0.37 | 0.25 | 0.63 | 5.00 | 5.00 |
| FSJ07 | 20.00 | 30.00 | 0.74 | 0.40 | 0.12 | 0.52 | 10.00 | 10.00 |
| and | 113.00 | 129.00 | 0.65 | 0.40 | 0.22 | 0.62 | 16.00 | 16.00 |
| FSJ 08 | No significant results |
| FGA101 | 93.00 | 98.27 | 1.00 | 0.10 | 0.10 | 0.20 | 5.27 | 5.00 |
| and | 156.00 | 163.00 | 1.08 | 0.32 | 0.31 | 0.63 | 7.00 | 7.00 |
| including | 157.22 | 160.00 | 1.17 | 0.73 | 0.69 | 1.42 | 2.78 | 2.78 |
| FNA 19 | No significant results |
| FGAN01 | 211.80 | 220.00 | 1.00 | 0.1 | 0.1 | 0.2 | 8.20 | 8.00 |
| including | 216.00 | 220.00 | 1.16 | 0.1 | 0.1 | 0.2 | 4.00 | 4.00 |
| FGAN02 | 192.00 | 195.45 | 1.00 | 0.1 | 0.1 | 0.2 | 3.45 | 3.00 |
| FGAN03 | No significant results |
| FGAN04 | 105.00 | 107.82 | 0.95 | 0.1 | 0.1 | 0.2 | 2.82 | 2.82 |
| and | 153.78 | 162.00 | 1.02 | 0.22 | 0.25 | 0.47 | 8.22 | 8.22 |
| including | 157.00 | 160.63 | 1.21 | 0.39 | 0.44 | 0.83 | 3.63 | 3.50 |
| FGAN05 | 48.94 | 62.70 | 0.75 | 0.2 | 0.1 | 0.3 | 13.76 | 13.50 |
Source: RungePincockMinarco, 2012.
10.4 2011-2012 Largo Drill Program (RungePincockMinarco, 2012)
The following sections have been reproduced, with minor changes, from the NI 43-101 Technical Report titled "Amended: Technical Report for the Largo Maracás Vanadium Project, 1 Million Tonnes per Year Processing Plant, Brazil" by RungePincockMinarco (2012) as fully cited in Chapter 27 - "References". GE21 has verified the accuracy of the information contained herein and updated as required.
Between May 16, 2011 and February 16, 2012, Largo completed a drill campaign consisting of 72 holes totaling 13,401 m as set out in Table 10-9
Layne Christensen (Layne do Brasil Sondagens Ltda.) began the program with one drill rig on May 16, 2011 and added a second drill rig on June 1, 2011. Two rigs continued on the property until December 20, 2011 at which time one was released, and the second drill went to Gulçari A Norte where 8 holes totaling 1,006.55 m were completed. Drilling was completed on February 5, 2012. Layne Christensen drilled with NQ-sized rods and an average of 900 m per rig/month. Core recovery was good with a reported average of about 90%. Detailed drill hole information for the seven zones tested is set out in Table 10-9 to Table 10-16
Table 10-9: Largo 2011 - 2012 Drill Program.
| Areas | Type | No. of
Holes | Total
Metres |
| Campbell | Exploration | 11 | 3,117.61 |
| Gulçari A Norte | Exploration | 12 | 1,766.73 |
| Gulçari B | Exploration | 10 | 1,367.81 |
| Gulçari B Sul | Exploration | 6 | 1,150.00 |
| São Jose | Exploration | 14 | 2,389.75 |
| Novo Amparo | Exploration | 2 | 357.95 |
| Novo Amparo Norte | Exploration | 17 | 3,251.50 |
| Total | | 72 | 13,401,35 |
Source: RungePincockMinarco, 2012
The drill hole collar coordinates and other data from the 2011-2012 program are summarized in Table 10-10 to Table 10-16 below.
Table 10-10: Campbell Zone Drilling.
| Hole ID | Northing | Easting | Elevation
(m) | Azimuth
(º) | Dip
(º) | Depth
(m) |
| FGA 102 | 8,486,018 | 318,696 | 304 | 290 | -70° | 506.00 |
| FGA 103 | 8,486,086 | 318,554 | 301 | 290 | -70° | 364.05 |
| FGA 104 | 8,486,081 | 318,058 | 303 | 290 | -45° | 196.85 |
| FGA 105 | 8,486,029 | 318,554 | 310 | 290 | -70° | 404.90 |
| FGA 106 | 8,486,120 | 318,082 | 304 | 290 | -60° | 195.04 |
| FGA 107 | 8,486,169 | 318,089 | 306 | 290 | -60° | 154.07 |
| FGA 108 | 8,486,074 | 318,602 | 303 | 290 | -75° | 446.60 |
| FGA 109 | 8,486,103 | 318,119 | 338 | 290 | -60° | 194.00 |
| FGA 110 | 8,486,125 | 318,194 | 339 | 290 | -60º | 104.00 |
| FGA 111 | 8,485,902 | 318,422 | 295 | 290 | -60º | 300.50 |
| FGA 112 | 8,486,176 | 318,390 | 301 | 290 | -50º | 251.60 |
Source: RungePincockMinarco, 2012
Table 10-11: Gulçari A Norte Zone Drilling.
| Hole ID | Northing | Easting | Elevation
(m) | Azimuth
(°) | Dip
(º) | Depth
(m) |
| FGAN 06 | 8,486,501 | 318,658 | 305 | 290 | -45° | 189.30 |
| FGAN 07 | 8,486,644 | 318,695 | 307 | 290 | -45° | 198.10 |
| FGAN 08 | 8,486,896 | 318,728 | 307 | 290 | -45° | 216.65 |
| FGAN 09 | 8,486,382 | 318,562 | 301 | 290 | -45° | 130.75 |
| FGAN 10 | 8,486,458 | 318,581 | 305 | 290 | -45° | 130.45 |
| FGAN 11 | 8,486,520 | 318,612 | 312 | 290 | -45° | 122.48 |
| FGAN 12 | 8,486,605 | 318,620 | 304 | 290 | -45° | 131.40 |
| FGAN 13 | 8,486,676 | 318,620 | 310 | 290 | -45° | 117.60 |
| FGAN 14 | 8,486,814 | 318,629 | 312 | 270 | -45° | 118.30 |
| FGAN 15 | 8,486,926 | 318,652 | 319 | 290 | -45° | 121.85 |
| FGAN 16 | 8,487,009 | 318,710 | 312 | 290 | -45° | 128.50 |
| FGAN 17 | 8,487,116 | 318,711 | 316 | 290 | -45° | 161.35 |
Source: RungePincockMinarco, 2012
Table 10-12: Gulçari B Zone Drilling.
| Hole ID | Northing | Easting | Elevation
(m) | Azimuth
(°) | Dip
(º) | Depth
(m) |
| FGB 08 | 8,487,166 | 318,945 | 319 | 290 | -65° | 99.15 |
| FGB 09 | 8,487,127 | 318,982 | 320 | 290 | -65° | 102.62 |
| FGB 10 | 8,487,091 | 318,928 | 316 | 290 | -65° | 99.33 |
| FGB 11 | 8,487,068 | 318,984 | 320 | 290 | -65° | 171.06 |
| FGB 12 | 8,487,090 | 318,991 | 322 | 290 | -70° | 136.90 |
| FGB 13 | 8,487,044 | 318,976 | 324 | 290 | -70° | 173.40 |
| FGB 14 | 8,487,013 | 318,957 | 319 | 290 | -70° | 164.70 |
| FGB 15 | 8,486,992 | 318,902 | 319 | 290 | -60° | 103.80 |
| FGB 16 | 8,486,978 | 318,937 | 322 | 290 | -70° | 155.70 |
| FGB 17 | 8,486,937 | 318,933 | 325 | 290 | -70° | 161.15 |
Source: RungePincockMinarco, 2012
Table 10-13: Gulçari B Sul Zone Drilling.
| Hole Id | Northing | Easting | Elevation (m) | Azimuth | Dip | Depth(m) |
| FGBS1 | 8,486,749 | 318,992 | 317 | 290 | -45° | 212.15 |
| FGBS2 | 8,486,840 | 319,041 | 325 | 290 | -45° | 167.25 |
| FGBS3 | 8,486,606 | 318,996 | 309 | 290 | -45° | 174.8 |
| FGBS4 | 8,486,496 | 318,988 | 312 | 290 | -45° | 219.75 |
| FGBS5 | 8,486,393 | 318,983 | 314 | 290 | -45° | 169.7 |
| FGBS6 | 8,486,293 | 318,940 | 325 | 290 | -45° | 206.35 |
Source: RungePincockMinarco, 2012
Table 10-14: São José Zone Drilling.
| Hole ID | Northing | Easting | Elevation
(m) | Azimuth
(°) | Dip
(º) | Depth
(m) |
| FSJ 12 | 8,488,280 | 318,907 | 319 | 290 | -45° | 368.80 |
| FSJ 13 | 8,488,230 | 318,884 | 320 | 290 | -45° | 187.70 |
| FSJ 14 | 8,488,230 | 318,884 | 320 | 290 | -70° | 169.15 |
| Hole ID | Northing | Easting | Elevation
(m) | Azimuth
(°) | Dip
(º) | Depth
(m) |
| FSJ 15 | 8,488,364 | 318,940 | 325 | 290 | -65° | 152.30 |
| FSJ 16 | 8,488,171 | 318,863 | 321 | 290 | -45° | 161.20 |
| FSJ 17 | 8,488,564 | 319,041 | 323 | 290 | -45° | 124.60 |
| FSJ 18 | 8,488,656 | 319,059 | 338 | 290 | -45° | 156.40 |
| FSJ 19 | 8,488,492 | 318,989 | 331 | 290 | -45° | 142.40 |
| FSJ 20 | 8,488,425 | 318,957 | 327 | 290 | -45° | 132.20 |
| FSJ 21 | 8,488,344 | 318,997 | 322 | 290 | -45° | 180.65 |
| FSJ 22 | 8,488,346 | 318,899 | 319 | 290 | -45° | 153.85 |
| FSJ 23 | 8,488,313 | 318,811 | 320 | 290 | -45° | 150.70 |
| FSJ 24 | 8,488,260 | 318,812 | 321 | 290 | -45° | 153.80 |
| FSJ 25 | 8,488,196 | 318,800 | 319 | 290 | -45° | 156.00 |
Source: RungePincockMinarco, 2012
Table 10-15: Novo Amparo Zone Drilling.
| Hole ID | Northing | Easting | Elevation
(m) | Azimuth
(°) | Dip
(º) | Depth
(m) |
| FNA 20 | 8,489,491 | 319,632 | 349 | 290 | -45° | 137.70 |
| FNA 21 | 8,489,690 | 319,623 | 343 | 290 | -45° | 220.25 |
Source: RungePincockMinarco, 2012
Table 10-16: Novo Amparo Nort Zone Drilling.
| Hole ID | Northing | Easting | Elevation
(m) | Azimuth
(°) | Dip
(º) | Depth
(m) |
| FNAN 01 | 8,492,565 | 319,989 | 354 | 290 | -45° | 213.65 |
| FNAN 02 | 8,492,479 | 319,953 | 362 | 290 | -45° | 169.95 |
| FNAN 03 | 8,492,414 | 319,923 | 354 | 290 | -45° | 167.00 |
| FNAN 04 | 8,491,855 | 319,967 | 341 | 290 | -45° | 239.40 |
| FNAN 05 | 8,491,780 | 319,895 | 335 | 290 | -45° | 150.50 |
| FNAN 06 | 8,492,657 | 320,053 | 351 | 290 | -45° | 184.15 |
| FNAN 07 | 8,491,679 | 319,865 | 343 | 290 | -45° | 240.75 |
| FNAN 08 | 8,492,732 | 320,115 | 355 | 290 | -45° | 186.00 |
| FNAN 09 | 8,492,303 | 319,981 | 339 | 290 | -45° | 170.80 |
| FNAN 10 | 8,492,400 | 319,978 | 339 | 290 | -45° | 175.80 |
| FNAN 11 | 8,492,885 | 320,117 | 352 | 290 | -45° | 223.10 |
| FNAN 12 | 8,492,756 | 320,048 | 354 | 290 | -45° | 196.95 |
| FNAN 13 | 8,492,458 | 320,015 | 355 | 290 | -45° | 187.50 |
| FNAN 14 | 8,492,634 | 320,120 | 354 | 290 | -45° | 231.50 |
| FNAN 15 | 8,492,536 | 320,051 | 365 | 290 | -60° | 286.90 |
| FNAN 16 | 8,492,361 | 319,900 | 350 | 290 | -45° | 113.20 |
| FNAN 17 | 8,492,448 | 319,934 | 351 | 290 | -45° | 114.35 |
Source: RungePincockMinarco, 2012
The diamond drilling program focused on further delineating additional resources on the Maracás property. The area encompassed by the drilling includes a 6.5-km strike length from, south to north, Gulçari A Norte to Novo Amparo Norte and a 1.5-km strike length on the east side from São José to Gulçari B Sul (Figure 10.2). (RungePincockMinarco, 2012).
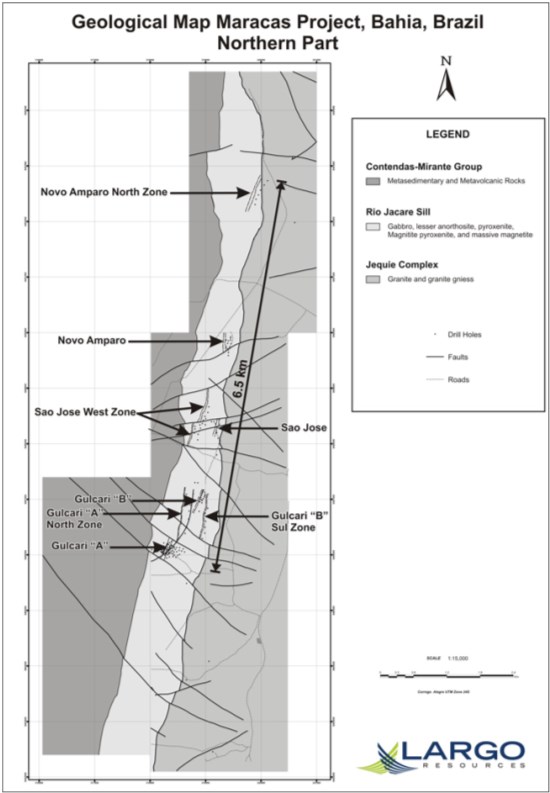
Figure 10.2: Zone Location Map (October 17, 2011).
Source: RungePincockMinarco, 2012
Table 10-17 the outlines significant drill results from the 2011-2012 drilling campaign.
Table 10-17: 2011-2012 Drill Program Summary of Significant Drill Results.
Hole
Number | From
(m) | To
(m) | Interval
(m) | True
Thickness
(m) | V2O5
(%) | Pd
(g/t) | Pt
(g/t) | Zones |
| FGA101 | 93.00 | 98.27 | 5.27 | 5.00 | 1.00 | 0.10 | 0.10 | Gulçari A Norte |
| and | 156.00 | 163.00 | 7.00 | 7.00 | 1.08 | 0.31 | 0.32 | |
| including | 157.22 | 160.00 | 2.78 | 2.78 | 1.17 | 0.69 | 0.73 | |
| FGA102 | 385.95 | 399.40 | 13.45 | 10.00 | 1.05 | 0.16 | 0.16 | Campbell |
| FGA103 | 254.68 | 322.80 | 78.14 | 62.00 | 1.64 | 0.15 | 0.10 | Campbell |
| including | 260.00 | 290.00 | 30.00 | 25.00 | 2.09 | 0.16 | 0.11 | |
| FGA104 | 31.00 | 35.90 | 4.90 | 4.90 | 0.70 | 0.21 | 0.22 | Campbell |
| FGA105 | 99.00 | 103.39 | 4.39 | 4.30 | 1.00 | - | - | Campbell |
| and | 274.60 | 293.57 | 18.97 | 15.00 | 1.34 | 0.15 | 0.12 | |
| and | 308.18 | 327.18 | 19.00 | 15.10 | 1.00 | 0.12 | 0.14 | |
| FGA106 | 37.50 | 52.44 | 14.94 | 14.00 | 1.03 | 0.31 | 0.18 | Campbell |
| including | 47.34 | 51.62 | 4.28 | 4.00 | 1.32 | 0.61 | 0.41 | |
| FGA107 | 29.00 | 34.20 | 5.20 | 5.00 | 1.00 | 0.10 | 0.10 | Campbell |
| FGA108 | 154.00 | 159.40 | 5.40 | 5.00 | 1.00 | | | Campbell |
| and | 287.00 | 318.00 | 41.00 | 35.00 | 1.68 | 0.10 | 0.14 | |
| including | 294.00 | 305.00 | 11.00 | 8.00 | 1.87 | 0.04 | 0.09 | |
| including | 307.00 | 317.00 | 10.00 | 7.00 | 2.09 | 0.24 | 0.27 | |
| FGA109 | - | 37.00 | 37.00 | 37.00 | 1.00 | 0.06 | 0.09 | Campbell |
| including | - | 3.00 | 3.00 | 3.00 | 1.87 | 0.10 | 0.19 | |
| and | 93.00 | 99.00 | 6.00 | 5.00 | 1.01 | 0.03 | 0.03 | |
| and | 136.00 | 141.00 | 5.00 | 4.50 | 1.28 | 0.33 | 0.46 | |
| FGA110 | 14.00 | 35.00 | 21.00 | 15.00 | 1.00 | 0.12 | 0.14 | Campbell |
| FGA111 | 240.00 | 243.00 | 3.00 | 3.00 | 1.00 | 0.31 | 0.18 | Campbell |
| FGA112 | 47.00 | 61.65 | 14.65 | | 0.90 | 0.01 | 0.33 | Campbell |
| and | 91.20 | 94.00 | 2.80 | | 1.82 | 0.13 | 0.52 | |
| and | 96.60 | 107.00 | 10.40 | | 1.19 | 0.22 | 0.30 | |
| FGAN06 | 169.00 | 176.00 | 7.00 | 6.00 | 1.09 | | | Gulçari A Norte |
| including | 172.00 | 175.00 | 3.00 | 3.00 | 1.18 | 0.46 | 0.46 | |
| FGAN07 | 177.00 | 184.00 | 7.00 | 6.00 | 1.05 | 0.41 | 0.44 | Gulçari A Norte |
| FGAN08 | 138.00 | 143.00 | 5.00 | 5.00 | 0.88 | | | Gulçari A Norte |
| and | 204.00 | 207.93 | 3.93 | 3.50 | 0.95 | | | |
| FGAN09 | 89.30 | 97.50 | 8.20 | 8.00 | 0.87 | 0.11 | 0.58 | Gulçari A Norte |
| FGAN10 | 26.00 | 29.00 | 3.00 | 3.00 | 0.73 | | | Gulçari A Norte |
| and | 86.00 | 89.00 | 3.00 | 3.00 | 0.52 | 0.41 | 0.28 | |
| FGAN11 | 34.00 | 38.00 | 4.00 | 4.00 | 1.04 | | | Gulçari A Norte |
| and | 48.00 | 52.00 | 4.00 | 4.00 | 1.00 | | | |
| and | 110.00 | 112.00 | 2.00 | 2.00 | 0.56 | 0.56 | 0.34 | |
| FGAN12 | 106.00 | 110.00 | 4.00 | 4.00 | 0.93 | 0.47 | 0.55 | Gulçari A Norte |
| FGAN13 | 82.50 | 86.50 | 4.00 | 4.00 | 0.50 | 0.33 | 0.33 | Gulçari A Norte |
| FGAN14 | 31.00 | 34.30 | 3.30 | 3.30 | 1.06 | | | Gulçari A Norte |
| and | 90.00 | 95.10 | 5.10 | 5.00 | 1.00 | 0.23 | 0.42 | |
| FGAN15 | 60.00 | 63.00 | 3.00 | 3.00 | 1.00 | | | Gulçari A Norte |
| and | 104.75 | 116.25 | 12.50 | 12.00 | 1.03 | 0.14 | 0.26 | |
| FGAN16 | 109.00 | 112.00 | 3.00 | 3.00 | 1.08 | | | Gulçari A Norte |
| FGAN17 | 77.00 | 79.20 | 2.20 | 2.00 | 1.07 | | | Gulçari A Norte |
| and | 104.25 | 106.40 | 2.15 | 2.00 | 1.00 | | | |
| and | 137.00 | 146.00 | 9.00 | 8.00 | 1.10 | 0.09 | 0.09 | |
Hole
Number | From
(m) | To
(m) | Interval
(m) | True
Thickness
(m) | V2O5
(%) | Pd
(g/t) | Pt
(g/t) | Zones |
| FGB08 | No significant results | Gulçari B |
| FGB09 | No significant results | Gulçari B |
| FGB10 | 13.00 | 29.00 | 16.00 | 16.00 | 0.83 | 0.08 | 0.20 | Gulçari B |
| FGB11 | 92.90 | 101.30 | 8.40 | 8.40 | 0.89 | 0.15 | 0.32 | Gulçari B |
| FGB12 | No significant results | Gulçari B |
| FGB13 | 98.00 | 108.60 | 10.60 | 10.00 | 0.80 | 0.09 | 0.22 | Gulçari B |
| FGB14 | 88.80 | 99.40 | 10.60 | 10.00 | 0.76 | 0.09 | 0.20 | Gulçari B |
| FGB15 | 15.00 | 37.00 | 22.00 | 22.00 | 0.66 | 0.05 | 0.11 | Gulçari B |
| FGB16 | 72.00 | 100.00 | 28.00 | 26.00 | 0.62 | 0.04 | 0.08 | Gulçari B |
| FGB17 | 85.00 | 105.00 | 20.00 | 20.00 | 0.67 | 0.06 | 0.14 | Gulçari B |
| FGBS01 | 9.00 | 17.00 | 8.00 | 8.00 | 0.50 | | | Gulçari B Sul |
| FGBS02 | 31.00 | 57.00 | 26.00 | 26.00 | 0.50 | | | Gulçari B Sul |
| FGBS03 | 15.00 | 20.00 | 5.00 | 5.00 | 0.43 | | | Gulçari B Sul |
| FGBS04 | 46.00 | 58.00 | 12.00 | 12.00 | 0.43 | 0.06 | 0.18 | Gulçari B Sul |
| FGBS05 | 54.00 | 70.00 | 16.00 | 16.00 | 0.42 | 0.09 | 0.20 | Gulçari B Sul |
| FGBS06 | 41.00 | 48.00 | 7.00 | 7.00 | 0.43 | | | Gulçari B Sul |
| and | 55.00 | 65.00 | 10.00 | 10.00 | 0.36 | 0.06 | 0.20 | |
| FSJ12 | 50.00 | 54.00 | 4.00 | 4.00 | 0.88 | | | São Jose West |
| and | 80.00 | 83.00 | 3.00 | 3.00 | 0.80 | | | São Jose West |
| FSJ13 | 71.00 | 75.00 | 4.00 | 4.00 | 0.86 | | | São Jose West |
| and | 91.00 | 93.00 | 2.00 | 2.00 | 0.96 | | | São Jose West |
| FSJ14 | 96.00 | 100.20 | 4.20 | 4.20 | 0.90 | | | São Jose West |
| and | 117.00 | 118.75 | 1.75 | 1.75 | 1.20 | | | São Jose West |
| FSJ15 | 35.00 | 46.00 | 11.00 | 11.00 | 0.98 | | | São Jose West |
| including | 40.00 | 45.00 | 5.00 | 5.00 | 1.16 | | | São Jose West |
| FSJ16 | 90.00 | 94.00 | 4.00 | 4.00 | 0.90 | | | São Jose West |
| FSJ17 | 57.00 | 66.00 | 9.00 | 9.00 | 1.08 | | | São Jose West |
| including | 60.00 | 66.00 | 6.00 | 6.00 | 1.25 | | | |
| and | 83.47 | 91.60 | 8.13 | 8.00 | 0.77 | | | |
| FSJ18 | 44.00 | 50.00 | 6.00 | 6.00 | 1.00 | | | São Jose West |
| FSJ19 | 62.00 | 67.00 | 5.00 | 5.00 | 0.78 | | | São Jose West |
| FSJ20 | 21.00 | 29.00 | 8.00 | 8.00 | 0.93 | | | São Jose West |
| and | 53.00 | 57.40 | 4.40 | 4.40 | 0.82 | | | |
| FSJ21 | 77.00 | 89.90 | 12.90 | 12.50 | 1.05 | | | São Jose West |
| including | 83.00 | 89.90 | 6.90 | 6.50 | 1.23 | | | |
| and | 112.00 | 115.20 | 3.20 | 3.00 | 0.71 | | | |
| FSJ22 | 12.00 | 23.00 | 11.00 | 11.00 | 0.67 | | | São Jose West |
| FSJ23 | 7.70 | 9.00 | 1.30 | 1.30 | 1.14 | | | São Jose West |
| and | 26.65 | 29.85 | 3.20 | 3.20 | 0.73 | | | |
| FSJ24 | 9.00 | 12.00 | 3.00 | 3.00 | 1.00 | | | São Jose West |
| FSJ25 | 31.00 | 34.00 | 3.00 | 3.00 | 0.94 | | | São Jose West |
| FNA21 | 45.15 | 52.00 | 6.85 | 6.85 | 0.80 | | | Novo Amparo |
| FNAN01 | 79.00 | 100.00 | 21.00 | 20.00 | 1.00 | | | Novo Amparo Norte |
| including | 83.00 | 99.00 | 16.00 | 15.00 | 1.11 | | | |
| and | 136.00 | 141.90 | 5.90 | 5.00 | 0.82 | 0.10 | 0.10 | |
| FNAN02 | 61.00 | 67.00 | 6.00 | 6.00 | 1.04 | | | Novo Amparo Norte |
| and | 72.00 | 78.15 | 6.15 | 6.00 | 0.90 | | | |
| and | 91.00 | 93.00 | 2.00 | 2.00 | 1.10 | 1.46 | 0.53 | |
| FNAN03 | 55.52 | 73.70 | 18.18 | 18.00 | 0.92 | | | Novo Amparo Norte |
| including | 55.52 | 66.00 | 10.48 | 10.00 | 1.08 | | | |
| and | 81.00 | 90.00 | 9.00 | 8.50 | 0.88 | 0.29 | 0.16 | |
Hole
Number | From
(m) | To
(m) | Interval
(m) | True
Thickness
(m) | V2O5
(%) | Pd
(g/t) | Pt
(g/t) | Zones |
FNAN04 | No significant results | Novo Amparo Norte |
FNAN05 | No significant results | Novo Amparo Norte |
FNAN06 | 109.00 | 122.00 | 13.00 | 13.00 | 0.98 | | | Novo Amparo Norte |
including | 115.00 | 122.00 | 7.00 | 7.00 | 1.25 | | | |
and | 152.00 | 155.00 | 3.00 | 3.00 | 0.89 | | | |
and | 161.00 | 163.10 | 2.10 | 2.00 | 1.09 | 0.76 | 0.33 | |
FNAN07 | No significant results | Novo Amparo Norte |
FNAN08 | 159.00 | 173.35 | 14.35 | 14.00 | 0.81 | | | Novo Amparo Norte |
including | 164.00 | 170.00 | 6.00 | 5.00 | 1.10 | | | Novo Amparo Norte |
FNAN09 | 102.00 | 106.80 | 4.80 | 4.50 | 0.84 | | | Novo Amparo Norte |
FNAN10 | 106.45 | 134.45 | 28.00 | 27.00 | 1.07 | | | Novo Amparo Norte |
including | 112.45 | 134.45 | 22.00 | 21.00 | 1.18 | | | |
and | 144.45 | 152.00 | 7.55 | 7.00 | 0.83 | | | |
including | 149.45 | 152.00 | 2.55 | 2.00 | 0.93 | 0.80 | 0.48 | |
FNAN11 | 190.00 | 200.00 | 10.00 | 9.00 | 0.95 | | | Novo Amparo Norte |
including | 197.00 | 200.00 | 3.00 | 2.50 | 0.93 | 1.00 | 0.42 | |
FNAN12 | 72.00 | 84.00 | 12.00 | 12.00 | 1.02 | | | Novo Amparo Norte |
and | 123.00 | 135.00 | 12.00 | 11.00 | 0.90 | | | |
including | 133.00 | 135.00 | 2.00 | 2.00 | 1.03 | 1.38 | 0.69 | |
FNAN13 | 129.00 | 150.00 | 21.00 | 20.00 | 0.79 | | | Novo Amparo Norte |
including | 143.00 | 149.00 | 6.00 | 5.00 | 1.24 | | | |
FNAN14 | 190.00 | 200.40 | 10.40 | 9.50 | 0.86 | | | Novo Amparo Norte |
FNAN15 | 203.00 | 224.35 | 21.35 | 20.00 | 1.13 | | | Novo Amparo Norte |
and | | 273.40 | 12.75 | 11.50 | 0.84 | | | |
Source: RungePincockMinarco, 2012
The total drilling completed on the property has tested 7 zones with 319 holes totalling 36,974,59 m (Table 10-18) of which Largo has drilled 250 holes totalling 31,059.70 m between 2007 and 2012.
Table 10-18: Total Maracás Drilling to 2012.
Deposit | Programm | Nº Drill | Total Meters |
Campbell | 1981-87 | 53 | 5,153.16 |
2007-2008 | 46 | 11,514.89 |
2011-12 | 11 | 3,119.14 |
2012-13 (In fill- currently above topography) | 103 | 3.929.50 |
Total | 213 | 19787.19 |
Gulçari B | 1981-83 | 7 | 269.28 |
2011-12 | 10 | 1,427.64 |
Total | 17 | 1,696.92 |
Gulçari A Norte | 2007 | 1 | 141.2 |
2008 | 5 | 1137.2 |
2011-12 | 12 | 1,766.73 |
Total | 18 | 3.045.13 |
Gulçari B Sul | 2011-12 | 6 | 1,150 |
Total | 6 | 1,150 |
Deposit | Programm | Nº Drill | Total Meters |
| Sâo José | 1983 | 2 | 115.15 |
2008 | 11 | 2,634.7 |
2011-12 | 14 | 2,389.75 |
Total | 27 | 5,139.6 |
Novo Amparo | 1983 | 7 | 377.3 |
2007 | 11 | 1,852 |
2008 | 1 | 285 |
2011-12 | 2 | 357.95 |
Total | 21 | 2,872.25 |
Novo Amparo Norte | 2011-12 | 17 | 3,283.5 |
Total | 17 | 3,283.5 |
| | | |
Grande Total | | 319 | 36.974.59 |
Source: RungePincockMinarco, 2012
There has been sufficient drilling in this area to demonstrate the continuity of the magnetite-rich horizons which is also supported by the ground magnetic survey that traces the known zones on surface. The ground magnetic survey also has identified a number of deposits that had not been previously tested.
The Campbell deposit, as outlined from the drilling programs, now extends 400 m along strike, and to a vertical depth of over 350 m with true widths ranging from 11 to 100 m and with an average width of about 40 m. This deposit is part of a mineralizing system that extends the length of the property. All the assays from this drilling program are completed and results received.
RungePincockMinarco (2012) reported the chemical results of the FGA100 hole end executed in Campbell Pit and it was included in the resource estimate. Table 10-19 shows the relevant results of this hole.
Table 10-19: 2007 Late Drill Results.
Hole
Number | From | To | Interval
(m) | True
thickness
(m) | V2O5 (%) | Pd (g) | Pt (g) | Zones |
FGA100 | 83.00 | 85.00 | 2.00 | 2.00 | 1.62 | 0.14 | 0.13 | Campbell |
and | 93.00 | 95.00 | 2.00 | 2.00 | 1.24 | 0.10 | 0.10 | |
and | 119.00 | 122.00 | 3.00 | 3.00 | 1.45 | 0.05 | 0.10 | |
Source: RungePincockMinarco, 2012
10.5 2012 Largo Infill Drill Program
Most Part of this section has been reproduced in its entirety from the Technical "An Updated Mine Plan and Mineral Reserve for the Maracás Menchen Project, Bahia State, Brazil" July 8, 2016, as fully cited in Chapter 27 - "References". GE21 has verified the accuracy of the information contained herein and updated as required.
Between September 10, 2012 and January 21, 2013, Largo completed an infill drilling campaign consisting of 103 vertical holes totaling 3,929.35 m.
Layne Christensen (Layne do Brasil Sondagens Ltda.) began the program with one drill rig on September 10, 2012. The rig continued the property until January 21, 2013 at which time it had completed the drilling on Campbell. Layne Christensen drilled with NQ-sized rods and an average of 980 m per month. Core recovery was good with a reported average of about 90%. Detailed drill hole information for the infill drilling program is set out in Table 10-20.
Table 10-20: Largo 2012 Infill Drill Program.
HOLE-ID | LOCATION | Length (m) | Azimuth (◦) | Dip (◦) |
Northing | Easting | Elevation (m) |
FDGA01 | 8,486,130 | 318,244 | 314.83 | 55.45 | 0.00 | -90 |
FDGA02 | 8,486,139 | 318,235 | 314.56 | 55.10 | 0.00 | -90 |
FDGA03 | 8,486,131 | 318,226 | 314.22 | 55.00 | 0.00 | -90 |
FDGA04 | 8,486,122 | 318,235 | 314.75 | 56.10 | 0.00 | -90 |
FDGA05 | 8,486,122 | 318,218 | 313.08 | 53.50 | 0.00 | -90 |
FDGA06 | 8,486,113 | 318,226 | 312.92 | 53.00 | 0.00 | -90 |
FDGA07 | 8,486,113 | 318,209 | 311.74 | 52.50 | 0.00 | -90 |
FDGA08 | 8,486,103 | 318,218 | 311.59 | 52.00 | 0.00 | -90 |
FDGA09 | 8,486,095 | 318,209 | 310.82 | 51.00 | 0.00 | -90 |
FDGA10 | 8,486,086 | 318,200 | 310.03 | 50.00 | 0.00 | -90 |
FDGA11 | 8,486,077 | 318,191 | 308.82 | 49.00 | 0.00 | -90 |
FDGA12 | 8,486,086 | 318,182 | 308.89 | 49.00 | 0.00 | -90 |
FDGA13 | 8,486,104 | 318,200 | 310.97 | 51.50 | 0.00 | -90 |
FDGA14 | 8,486,094 | 318,191 | 310.11 | 51.10 | 0.00 | -90 |
FDGA15 | 8,486,148 | 318,245 | 314.40 | 54.50 | 0.00 | -90 |
FDGA16 | 8,486,077 | 318,175 | 307.06 | 37.50 | 0.00 | -90 |
FDGA17 | 8,486,068 | 318,164 | 305.78 | 36.40 | 0.00 | -90 |
FDGA18 | 8,486,059 | 318,173 | 305.78 | 36.50 | 0.00 | -90 |
FDGA19 | 8,486,166 | 318,262 | 313.65 | 54.00 | 0.00 | -90 |
FDGA20 | 8,486,069 | 318,182 | 307.42 | 37.60 | 0.00 | -90 |
FDGA21 | 8,486,183 | 318,280 | 312.06 | 52.50 | 0.00 | -90 |
FDGA22 | 8,486,148 | 318,226 | 314.05 | 55.05 | 0.00 | -90 |
FDGA23 | 8,486,157 | 318,235 | 314.09 | 54.10 | 0.00 | -90 |
FDGA24 | 8,486,201 | 318,297 | 310.63 | 51.00 | 0.00 | -90 |
FDGA25 | 8,486,166 | 318,244 | 314.10 | 54.00 | 0.00 | -90 |
FDGA26 | 8,486,175 | 318,271 | 313.17 | 52.50 | 0.00 | -90 |
FDGA27 | 8,486,174 | 318,253 | 313.78 | 54.00 | 0.00 | -90 |
FDGA28 | 8,486,219 | 318,315 | 309.13 | 29.20 | 0.00 | -90 |
FDGA29 | 8,486,157 | 318,271 | 312.75 | 53.00 | 0.00 | -90 |
FDGA30 | 8,486,175 | 318,288 | 311.23 | 51.30 | 0.00 | -90 |
FDGA31 | 8,486,192 | 318,306 | 310.00 | 50.10 | 0.00 | -90 |
FDGA32 | 8,486,210 | 318,324 | 308.71 | 28.70 | 0.00 | -90 |
FDGA33 | 8,486,236 | 318,333 | 307.01 | 27.20 | 0.00 | -90 |
FDGA34 | 8,486,254 | 318,350 | 303.59 | 23.70 | 0.00 | -90 |
FDGA35 | 8,486,228 | 318,341 | 307.04 | 27.00 | 0.00 | -90 |
FDGA36 | 8,486,139 | 318,218 | 314.11 | 49.20 | 0.00 | -90 |
FDGA37 | 8,486,157 | 318,288 | 310.59 | 51.00 | 0.00 | -90 |
FDGA38 | 8,486,130 | 318,209 | 313.46 | 43.60 | 0.00 | -90 |
FDGA39 | 8,486,174 | 318,305 | 309.63 | 39.80 | 0.00 | -90 |
FDGA40 | 8,486,121 | 318,200 | 312.32 | 42.20 | 0.00 | -90 |
FDGA41 | 8,486,192 | 318,324 | 308.32 | 38.80 | 0.00 | -90 |
FDGA42 | 8,486,060 | 318,191 | 306.59 | 46.90 | 0.00 | -90 |
FDGA43 | 8,486,210 | 318,342 | 307.67 | 28.60 | 0.00 | -90 |
FDGA44 | 8,486,210 | 318,359 | 305.33 | 25.30 | 0.00 | -90 |
FDGA45 | 8,486,068 | 318,200 | 307.65 | 47.90 | 0.00 | -90 |
FDGA46 | 8,486,192 | 318,341 | 306.90 | 27.20 | 0.00 | -90 |
FDGA47 | 8,486,077 | 318,208 | 308.55 | 48.80 | 0.00 | -90 |
FDGA48 | 8,486,174 | 318,324 | 307.59 | 27.80 | 0.00 | -90 |
FDGA49 | 8,486,086 | 318,217 | 309.63 | 49.80 | 0.00 | -90 |
FDGA50 | 8,486,157 | 318,306 | 309.24 | 29.50 | 0.00 | -90 |
HOLE-ID | LOCATION | Length (m) | Azimuth (◦) | Dip (◦) |
Northing | Easting | Elevation (m) |
FDGA51 | 8,486,051 | 318,200 | 305.41 | 35.50 | 0.00 | -90 |
FDGA52 | 8,486,059 | 318,208 | 305.84 | 36.00 | 0.00 | -90 |
FDGA53 | 8,486,094 | 318,226 | 310.79 | 51.50 | 0.00 | -90 |
FDGA54 | 8,486,068 | 318,218 | 306.82 | 37.30 | 0.00 | -90 |
FDGA55 | 8,486,077 | 318,226 | 308.25 | 38.40 | 0.00 | -90 |
FDGA56 | 8,486,086 | 318,236 | 309.27 | 49.50 | 0.00 | -90 |
FDGA57 | 8,486,095 | 318,244 | 311.52 | 51.70 | 0.00 | -90 |
FDGA58 | 8,486,104 | 318,253 | 312.00 | 52.00 | 0.00 | -90 |
FDGA59 | 8,486,104 | 318,235 | 312.54 | 52.40 | 0.00 | -90 |
FDGA60 | 8,486,113 | 318,262 | 311.56 | 51.80 | 0.00 | -90 |
FDGA61 | 8,486,113 | 318,244 | 314.58 | 54.50 | 0.00 | -90 |
FDGA62 | 8,486,121 | 318,271 | 311.11 | 51.20 | 0.00 | -90 |
FDGA63 | 8,486,122 | 318,253 | 314.29 | 54.00 | 0.00 | -90 |
FDGA64 | 8,486,121 | 318,288 | 309.28 | 39.60 | 0.00 | -90 |
FDGA65 | 8,486,104 | 318,270 | 309.73 | 39.80 | 0.00 | -90 |
FDGA66 | 8,486,086 | 318,253 | 308.42 | 38.60 | 0.00 | -90 |
FDGA67 | 8,486,192 | 318,359 | 304.87 | 28.00 | 0.00 | -90 |
FDGA68 | 8,486,068 | 318,235 | 306.37 | 26.40 | 0.00 | -90 |
FDGA69 | 8,486,050 | 318,218 | 304.42 | 24.50 | 0.00 | -90 |
FDGA70 | 8,486,051 | 318,236 | 303.36 | 23.50 | 0.00 | -90 |
FDGA71 | 8,486,069 | 318,254 | 304.74 | 25.00 | 0.00 | -90 |
FDGA72 | 8,486,174 | 318,342 | 304.42 | 24.70 | 0.00 | -90 |
FDGA73 | 8,486,086 | 318,271 | 306.81 | 27.10 | 0.00 | -90 |
FDGA74 | 8,486,104 | 318,289 | 308.19 | 28.40 | 0.00 | -90 |
FDGA75 | 8,486,120 | 318,305 | 307.14 | 27.10 | 0.00 | -90 |
FDGA76 | 8,486,103 | 318,306 | 305.76 | 26.00 | 0.00 | -90 |
FDGA77 | 8,486,086 | 318,288 | 305.66 | 24.60 | 0.00 | -90 |
FDGA78 | 8,486,068 | 318,271 | 302.50 | 22.50 | 0.00 | -90 |
FDGA79 | 8,486,131 | 318,192 | 311.44 | 31.50 | 0.00 | -90 |
FDGA80 | 8,486,148 | 318,209 | 312.90 | 33.20 | 0.00 | -90 |
FDGA81 | 8,486,157 | 318,324 | 306.52 | 26.60 | 0.00 | -90 |
FDGA82 | 8,486,166 | 318,226 | 313.39 | 33.50 | 0.00 | -90 |
FDGA83 | 8,486,140 | 318,306 | 307.25 | 27.20 | 0.00 | -90 |
FDGA84 | 8,486,139 | 318,324 | 305.69 | 25.60 | 0.00 | -90 |
FDGA85 | 8,486,166 | 318,350 | 300.90 | 20.60 | 0.00 | -90 |
FDGA86 | 8,486,183 | 318,368 | 302.49 | 22.60 | 0.00 | -90 |
FDGA87 | 8,486,201 | 318,262 | 312.38 | 32.50 | 0.00 | -90 |
FDGA88 | 8,486,201 | 318,244 | 312.79 | 32.60 | 0.00 | -90 |
FDGA89 | 8,486,166 | 318,209 | 312.06 | 32.10 | 0.00 | -90 |
FDGA90 | 8,486,120 | 318,324 | 303.56 | 23.40 | 0.00 | -90 |
FDGA91 | 8,486,148 | 318,191 | 310.90 | 31.00 | 0.00 | -90 |
FDGA92 | 8,486,051 | 318,254 | 301.43 | 21.80 | 0.00 | -90 |
FDGA93 | 8,486,130 | 318,173 | 309.34 | 30.00 | 0.00 | -90 |
FDGA94 | 8,486,051 | 318,182 | 305.59 | 26.00 | 0.00 | -90 |
FDGA95 | 8,486,042 | 318,191 | 305.01 | 25.05 | 0.00 | -90 |
FDGA96 | 8,486,033 | 318,236 | 301.19 | 21.00 | 0.00 | -90 |
FDGA97 | 8,486,034 | 318,218 | 302.90 | 23.00 | 0.00 | -90 |
FDGA98 | 8,486,015 | 318,219 | 299.30 | 20.00 | 0.00 | -90 |
FDGA99 | 8,486,033 | 318,200 | 303.98 | 24.00 | 0.00 | -90 |
FDGA100 | 8,486,131 | 318,166 | 308.64 | 28.90 | 0.00 | -90 |
FDGA101 | 8,486,015 | 318,175 | 295.50 | 15.80 | 0.00 | -90 |
FDGA102 | 8,486,015 | 318,199 | 297.55 | 18.00 | 0.00 | -90 |
FDGA103 | 8,485,988 | 318,202 | 290.93 | 11.30 | 0.00 | -90 |
Source: Micon, 2016.
The drilling program focused on further identifying and delineating the first 2 to 3 years of mining at the Campbell deposit. The holes were spaced on 12.5-m centers and encompassed an area of about 300 m by 150 m. The results from the 2012 program are summarized in Table 10-21.
Table 10-21: 2012 Infill Drill Program Summary of Significant Results.
Hole
Number | From (m) | To (m) | V2O5 (%) | Pt (g/t) | Pd (g/t) | PGM (g/t) | Interval (m) | True
Thickness
(m) |
FDGA01 | 3.10 | 55.45 | 2.15 | 0.34 | 0.20 | 0.54 | 52.35 | 26.18 |
FDGA02 | 5.00 | 55.10 | 2.51 | 0.59 | 0.28 | 0.87 | 50.10 | 25.05 |
FDGA04 | 1.50 | 56.10 | 2.54 | 0.52 | 0.24 | 0.76 | 54.60 | 27.30 |
FDGA06 | 10.10 | 21.63 | 2.22 | 0.37 | 0.16 | 0.53 | 11.53 | 5.77 |
FDGA11 | 4.00 | 16.00 | 2.30 | 0.22 | 0.11 | 0.33 | 12.00 | 6.00 |
FDGA12 | 28.00 | 40.00 | 2.23 | 0.24 | 0.11 | 0.35 | 12.00 | 6.00 |
FDGA15 | 3.40 | 16.20 | 2.32 | 0.58 | 0.24 | 0.82 | 12.80 | 6.40 |
and | 19.20 | 54.50 | 2.27 | 0.42 | 0.21 | 0.63 | 35.30 | 17.65 |
FDGA19 | 20.40 | 54.00 | 2.65 | 0.72 | 0.11 | 0.83 | 33.60 | 16.80 |
FDGA22 | 17.30 | 31.00 | 2.64 | 0.29 | 0.11 | 0.40 | 45.00 | 22.50 |
FDGA26 | 39.20 | 52.50 | 2.44 | 1.10 | 0.21 | 1.31 | 13.30 | 6.65 |
FDGA29 | 25.00 | 53.00 | 2.90 | 0.70 | 0.06 | 0.76 | 28.00 | 14.00 |
FDGA36 | 0.00 | 17.00 | 2.63 | 0.37 | 0.18 | 0.55 | 17.00 | 8.50 |
FDGA53 | 0.00 | 29.00 | 1.98 | 0.39 | 0.24 | 0.63 | 29.00 | 14.50 |
FDGA56 | 9.19 | 49.50 | 2.24 | 0.60 | 0.33 | 0.93 | 40.31 | 20.16 |
FDGA57 | 22.62 | 51.70 | 2.31 | 0.55 | 0.38 | 0.93 | 29.08 | 14.54 |
FDGA58 | 10.86 | 39.61 | 2.08 | 0.48 | 0.29 | 0.77 | 28.75 | 14.38 |
FDGA59 | 2.90 | 48.16 | 2.78 | 0.87 | 0.18 | 1.05 | 45.26 | 22.63 |
FDGA60 | 23.25 | 31.63 | 2.42 | 0.77 | 0.39 | 1.16 | 8.38 | 4.19 |
FDGA61 | 0.00 | 22.00 | 2.59 | 0.53 | 0.27 | 0.80 | 22.00 | 11.00 |
and | 30.17 | 54.50 | 2.30 | 0.43 | 0.25 | 0.68 | 24.33 | 12.17 |
FDGA63 | 27.69 | 54.00 | 2.07 | 0.37 | 0.27 | 0.64 | 26.31 | 13.16 |
FDGA65 | 21.70 | 34.20 | 2.31 | 0.57 | 0.34 | 0.91 | 12.50 | 6.25 |
FDGA66 | 2.35 | 38.60 | 2.36 | 0.42 | 0.24 | 0.66 | 36.25 | 18.13 |
FDGA95 | 11.03 | 25.05 | 2.27 | 0.17 | 0.22 | 0.39 | 14.02 | 7.01 |
Source: Micon, 2016.
10.5.1 Logging (Micon, 2016.)
For the 2012 drill program, Largo rented a farmhouse immediately adjacent to the Maracás property and about 2 km south from Campbell. This house was used as an office, bunkhouse for the geologists and a core logging and storage facility. Covered and shaded logging racks have been built for the geologists to lay out and examine core.
The core boxes had nailed-on lids and were delivered to this location daily, where they were sorted by hole and stacked. Later, the lids were removed and they were placed on the logging racks, where box markings and footage blocks are checked for accuracy.
Holes are logged in a conventional manner with lithologies and mineralization marked up with a lumber crayon and described, as well as the recording of basic geotechnical observations (rock quality designation, RQD). Particular attention was placed on the degree of magnetism in the core. Logging was performed using a computer and the "Logger" front-end data collector program written for Gemcom®.
At the time of Micon's site visit in April 2007, drilling had just commenced and core had not yet been photographed. Micon was informed that this was to be done, and a digital camera had just been purchased. At the time of Micon's 2011 visit, core was being photographed. Other than this change the core logging procedures used in later drilling programs have remained the same.
10.6 2018 Largo Infill Drill Program (Campbell Pit)
Between April 19 and May 30, 2018, Largo completed a drilling program with 31 vertical and inclined holes totaling 2,323.10 m at the Campbell Pit (Figure 10.3 and Table 10-22). The project had 4 drill rigs (rigs 204, 237, 270 and 277) working with an average production of 387 meters per month each. The purpose was to confirm the production for the next 2 to 3 years.
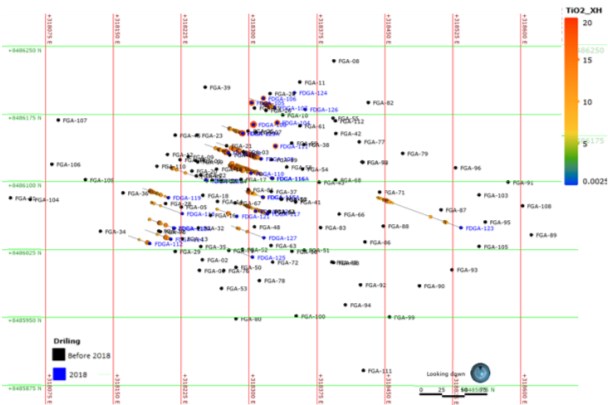
Figure 10.3: Campbell 2018 Drill Program Grid.
Table 10-22: Summary 2018 Largo Infill Drill Program.
Hole ID | Northing | Easting | Elevation
(m) | Av. Azimuth
(º) | Av. Dip (°) | Length
(m) | Year |
FDGA104 | 8486166 | 318331 | 230.2 | 0 | -90 | 50.00 | 2018 |
FDGA105 | 8486188 | 318303 | 230.3 | 0 | -90 | 50.90 | 2018 |
FDGA106 | 8486193 | 318316 | 230 | 0 | -90 | 50.40 | 2018 |
FDGA107 | 8486183 | 318328 | 230.88 | 290 | -60 | 60.20 | 2018 |
FDGA108 | 8486164 | 318305 | 230.03 | 0 | -90 | 95.15 | 2018 |
FDGA109 | 8486126 | 318313 | 230.81 | 290 | -60 | 105.85 | 2018 |
FDGA110 | 8486110 | 318302 | 230.04 | 290 | -60 | 50.15 | 2018 |
FDGA111 | 8486140 | 318329 | 230.02 | 0 | -90 | 50.95 | 2018 |
Hole ID | Northing | Easting | Elevation
(m) | Av. Azimuth
(º) | Av. Dip (°) | Length
(m) | Year |
FDGA112 | 8486032 | 318190 | 234.62 | 290 | -60 | 50.25 | 2018 |
FDGA113 | 8486049 | 318217 | 235.26 | 290 | -60 | 60.25 | 2018 |
FDGA113A | 8486049 | 318217 | 235.35 | 0 | -90 | 50.90 | 2018 |
FDGA114 | 8486037 | 318213 | 235.1 | 290 | -60 | 60.85 | 2018 |
FDGA115 | 8486084 | 318315 | 229.83 | 290 | -75 | 81.20 | 2018 |
FDGA115A | 8486083 | 318315 | 229.88 | 0 | -90 | 100.35 | 2018 |
FDGA116 | 8486105 | 318325 | 230.03 | 290 | -60 | 95.85 | 2018 |
FDGA116A | 8486104 | 318326 | 229.97 | 0 | -90 | 115.45 | 2018 |
FDGA117 | 8486065 | 318320 | 230.15 | 290 | -60 | 65.25 | 2018 |
FDGA118 | 8486065 | 318226 | 229.45 | 290 | -60 | 72.40 | 2018 |
FDGA119 | 8486083 | 318211 | 229.28 | 290 | -60 | 60.55 | 2018 |
FDGA120 | 8486102 | 318252 | 230.28 | 290 | -60 | 100.25 | 2018 |
FDGA120A | 8486102 | 318253 | 230.08 | 0 | -90 | 75.10 | 2018 |
FDGA121 | 8486062 | 318286 | 230.03 | 290 | -60 | 50.35 | 2018 |
FDGA122 | 8486068 | 318307 | 229.79 | 0 | -90 | 90.45 | 2018 |
FDGA123 | 8486050 | 318534 | 282.5 | 290 | -70 | 291.95 | 2018 |
FDGA124 | 8486199 | 318350 | 240 | 0 | -90 | 49.05 | 2018 |
FDGA125 | 8486017 | 318304 | 239.68 | 290 | -60 | 60.35 | 2018 |
FDGA126 | 8486181 | 318362 | 241.58 | 0 | -90 | 61.00 | 2018 |
FDGA127 | 8486039 | 318316 | 240.06 | 290 | -50 | 60.55 | 2018 |
FDGA128 | 8486133 | 318277 | 226.71 | 290 | -60 | 55.40 | 2018 |
FDGA129 | 8486154 | 318292 | 226.23 | 0 | -90 | 51.15 | 2018 |
FDGA129A | 8486154 | 318293 | 226.4 | 290 | -60 | 50.60 | 2018 |
| | | | | Total | 2,323.10 | |
SGS GEOSEOL started the program with a rig in April 2018. The rig was kept in the area until May 2018, with NQ-sized rods and an average of 1.161.55 m per month. The average recovery reported was about 99%.
At the Campbell Pit, drilling indicated the local change in the thickness and magnetite-pyroxenite modeled bodies. The regional context of mineralized bodies was not changed by this drilling.
From a total of 31 holes drilled, 24 intercepted by mineralization. The Ti-V intervals ranged from 1.34 m to 56.52 m in length with a weighted average of 2.09% V2O5 and 15.71 % TiO2. Table 10-23 shows a summary significance results of 2018 Campbell Pit drilling. All data from this campaign was used in the resource estimate that is the subject of this report.
Table 10-23: 2018 Largo Infill Drill Assay Results.
Hole
Number | From (m) | To (m) | V2O5 (%) | Fe (%) | TiO2 (%) | Interval
(m) |
FDGA104 | 14.30 | 50.00 | 2.46 | 43.42 | 10.03 | 35.70 |
FDGA105 | 0.00 | 23.00 | 2.61 | 44.53 | 9.60 | 23.00 |
FDGA106 | 6.60 | 26.61 | 1.31 | 28.79 | 29.15 | 20.01 |
FDGA107 | 2.68 | 31.37 | 2.64 | 44.74 | 8.49 | 28.69 |
FDGA108 | 0.15 | 34.59 | 2.49 | 43.90 | 10.62 | 34.44 |
FDGA108 | 36.27 | 49.00 | 1.61 | 36.31 | 22.07 | 12.73 |
FDGA109 | 0.00 | 55.00 | 2.37 | 42.23 | 12.06 | 55.00 |
FDGA110 | 17.00 | 50.15 | 2.36 | 45.02 | 8.90 | 33.15 |
FDGA111 | 0.00 | 50.95 | 2.91 | 45.51 | 7.92 | 50.95 |
FDGA115 | 36.00 | 67.80 | 2.26 | 43.03 | 11.33 | 31.80 |
Hole
Number | From (m) | To (m) | V2O5 (%) | Fe (%) | TiO2 (%) | Interval
(m) |
FDGA115A | 42.75 | 88.92 | 1.80 | 38.72 | 17.58 | 46.17 |
FDGA116 | 25.68 | 82.20 | 1.94 | 41.04 | 14.21 | 56.52 |
FDGA116A | 35.74 | 41.58 | 1.63 | 37.69 | 18.25 | 5.84 |
FDGA116A | 46.63 | 71.00 | 2.23 | 45.85 | 8.10 | 24.37 |
FDGA116A | 82.00 | 92.05 | 1.22 | 30.25 | 28.36 | 10.05 |
FDGA117 | 7.30 | 30.00 | 2.12 | 41.53 | 15.25 | 22.70 |
FDGA117 | 35.00 | 55.00 | 1.75 | 37.82 | 17.88 | 20.00 |
FDGA121 | 5.21 | 13.30 | 0.98 | 26.08 | 29.42 | 8.09 |
FDGA121 | 43.60 | 47.92 | 1.15 | 31.78 | 26.83 | 4.32 |
FDGA122 | 2.75 | 27.24 | 1.15 | 30.91 | 25.59 | 24.49 |
FDGA122 | 45.00 | 65.99 | 2.00 | 40.52 | 14.26 | 20.99 |
FDGA123 | 244.88 | 264.45 | 2.23 | 45.66 | 8.08 | 19.57 |
FDGA126 | 49.42 | 61.00 | 1.28 | 25.53 | 29.17 | 11.58 |
FDGA128 | 0.00 | 23.00 | 2.47 | 43.85 | 11.00 | 23.00 |
FDGA129 | 0.00 | 46.25 | 2.44 | 40.81 | 15.71 | 46.25 |
FDGA129A | 0.00 | 31.57 | 2.17 | 39.05 | 16.90 | 31.57 |
FDGA113 | 28.00 | 29.39 | 1.38 | 35.86 | 21.98 | 1.39 |
FDGA118 | 31.18 | 58.44 | 0.96 | 25.15 | 31.13 | 27.26 |
FDGA119 | 6.25 | 45.00 | 1.72 | 36.67 | 17.32 | 38.75 |
FDGA120A | 55.00 | 73.00 | 1.76 | 40.86 | 15.89 | 18.00 |
10.6.1 Logging
The geological description process was realized in a rented warehouse near of the Campbell Pit. This location served as the basis for Largo's exploration team. The description of the core occurred outside of the warehouse on racks built specifically for this stage.
The core was stored in wooden core boxes with lids and delivered daily in the warehouse. After being received, recorded and photographed, the boxes were set up on core racks for logging and other geotechnical activities.
Lithologies, mineralized zones and geotechnical observations (rock quality and RQD) were marked with pencils on the core box, as well as in the standard description worksheet used by the Largo team. All core were submitted to magnetic susceptibility analysis.
10.7 2018 Largo Exploration Drill Program
During 2018, Largo completed an exploration drilling campaign (Table 10-24) totalling 38 diamond drill holes: 24 drilll holes in NAN totaling 4,223.30 m, and 14 drill holes in Braga-Jacaré totalling 2,218.70 m drilled.
Table 10-24: 2018 Largo Exploration Drill Program summary.
Areas | Type/Purpose | 2018 |
Number of Holes | Total (m) |
Novo Amparo North | Exploration | 24 | 4,223.3 |
Jacaré | Exploration | 7 | 931.55 |
Braga | Exploration | 7 | 1,287.15 |
Total | - | 69 | 8,765.08 |
At NAN the 2018 drill program began on May 29 and ended on September 1, with 24 holes drilled (Figure 10.4), completing 4,223.3 m. In this year, two Mach Sonda 320 model diamond drills were used. Average monthly drill core production per rig was 703 m. Table 10-25 defines the collar coordinates and other details of the drill holes. Subsequently, these rigs were mobilized to areas in the southern extension of the Rio Jacaré Intrusion. A total of 14 regional holes (2,218.7 m) confirmed the anomalies, showing the continuity of the metallogenetic potential of mafic-ultramafic intrusion to the south. The rigs were demobilized on October 23.
Table 10-25: 2018 NAN Drill Program.
Hole ID | Northing | Easting | Elevation (m) | Av. Azimuth
(°) | Av. Dip
(°) | Length
(m) | Year |
FNAN-18 | 8492925 | 320062 | 341.62 | 273 | -43 | 150.05 | 2018 |
FNAN-18A | 8492925 | 320063 | 341.62 | 271 | -74 | 240.35 | 2018 |
FNAN-19 | 8492200 | 319800 | 344.98 | 299 | -44 | 150.45 | 2018 |
FNAN-20 | 8492075 | 319740 | 334.89 | 300 | -43 | 117.90 | 2018 |
FNAN-21 | 8492001 | 319724 | 335.00 | 301 | -45 | 105.35 | 2018 |
FNAN-22 | 8492840 | 320033 | 347.23 | 301 | -44 | 131.75 | 2018 |
FNAN-23 | 8492696 | 320049 | 351.10 | 292 | -44 | 158.80 | 2018 |
FNAN-24 | 8491907 | 319700 | 335.72 | 301 | -44 | 71.75 | 2018 |
FNAN-25 | 8491812 | 319675 | 335.66 | 302 | -45 | 89.00 | 2018 |
FNAN-26 | 8492650 | 319975 | 350.69 | 306 | -43 | 357.35 | 2018 |
FNAN-27 | 8491440 | 319585 | 336.47 | 301 | -44 | 119.55 | 2018 |
FNAN-28 | 8491175 | 319499 | 335.92 | 273 | -44 | 152.95 | 2018 |
FNAN-29 | 8492678 | 320112 | 352.58 | 307 | -45 | 233.15 | 2018 |
FNAN-30 | 8490440 | 319150 | 334.84 | 291 | -45 | 116.85 | 2018 |
FNAN-31 | 8492608 | 320021 | 352.54 | 295 | -45 | 165.60 | 2018 |
FNAN-32 | 8492492 | 320031 | 353.22 | 296 | -46 | 243.75 | 2018 |
FNAN-33 | 8492518 | 319969 | 351.33 | 286 | -43 | 300.35 | 2018 |
FNAN-34 | 8492424 | 319998 | 352.31 | 293 | -46 | 206.70 | 2018 |
FNAN-35 | 8492321 | 319949 | 351.36 | 291 | -43 | 240.10 | 2018 |
FNAN-36 | 8492259 | 319940 | 350.58 | 294 | -43 | 219.35 | 2018 |
FNAN-37 | 8492808 | 320105 | 349.05 | 284 | -45 | 222.90 | 2018 |
FNAN-38 | 8492164 | 319890 | 345.03 | 290 | -42 | 208.20 | 2018 |
FNAN-39 | 8493105 | 320044 | 349.91 | 281 | -44 | 117.95 | 2018 |
FNAN-40 | 8491729 | 319652 | 335.12 | 299 | -45 | 103.15 | 2018 |
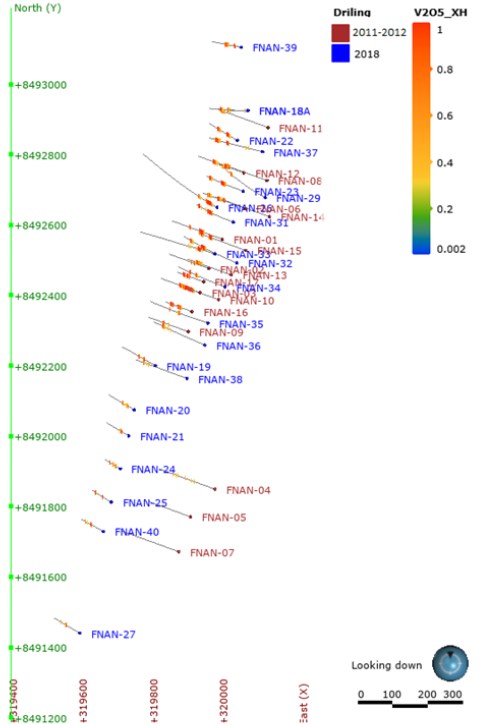
Figure 10.4: 2018 NAN Exploration Drill Program Grid.
The average diameter of the drill rods was NQ and the average recovery in all areas was above 95%. All data collected were standardized in the UTM coordinate system in DATUM SIRGASS 2000. Mineral research was also based on NNE-SSW regional magnetic anomalies associated with the base lithology of the magmatic differentiation of the region.
The propose of drilling was to confirm the NAN mineralization at depth and along strike to the south. In Jacaré-Braga drilling confirmed the NNE-SSW regional magnetic trend.
Of the 24 drill holes completed at NAN, 21 drill holes intercepted Ti-V intervals. Intercept lengths ranged from 2.69 m to 21.63 m in length with a weighted average of 1.98% V2O5 and 12.53%TiO2 (Table 10-26).
Table 10-26: 2018 NAN Largo Drill Assay.
Hole Number | From (m) | To (m) | V2O5 (%) | Fe (%) | TiO2 (%) | Interval (m) |
FNAN-19 | 49.70 | 55.34 | 2.26 | 43.59 | 12.46 | 5.64 |
FNAN-20 | 28.70 | 32.21 | 2.07 | 40.64 | 11.79 | 3.51 |
FNAN-21 | 32.25 | 38.89 | 1.98 | 42.02 | 12.95 | 6.64 |
FNAN-22 | 39.23 | 45.23 | 2.00 | 43.97 | 13.68 | 6.00 |
FNAN-23 | 77.39 | 95.82 | 2.02 | 44.23 | 13.46 | 18.43 |
FNAN-24 | 22.80 | 26.80 | 2.38 | 41.62 | 12.10 | 4.00 |
FNAN-25 | 39.53 | 44.94 | 1.85 | 43.97 | 13.61 | 5.41 |
FNAN-26 | 30.84 | 45.37 | 2.55 | 43.81 | 12.53 | 14.53 |
FNAN-27 | 62.74 | 65.65 | 1.96 | 42.88 | 13.57 | 2.91 |
FNAN-28 | 28.07 | 33.59 | 1.69 | 37.78 | 12.20 | 5.52 |
FNAN-29 | 162.44 | 174.12 | 1.57 | 37.18 | 10.90 | 11.68 |
FNAN-31 | 91.88 | 112.60 | 2.10 | 42.67 | 12.50 | 20.72 |
FNAN-32 | 144.62 | 165.92 | 2.17 | 40.38 | 11.76 | 21.30 |
FNAN-33 | 58.20 | 77.68 | 2.05 | 42.77 | 12.81 | 19.48 |
FNAN-34 | 123.32 | 132.10 | 1.71 | 42.58 | 13.40 | 8.78 |
FNAN-35 | 117.17 | 127.81 | 1.35 | 39.08 | 12.72 | 10.64 |
FNAN-36 | 147.20 | 152.08 | 0.81 | 35.05 | 12.20 | 4.88 |
FNAN-37 | 142.61 | 148.61 | 1.95 | 43.95 | 13.37 | 6.00 |
FNAN-38 | 156.03 | 158.72 | 1.49 | 38.21 | 12.53 | 2.69 |
FNAN-39 | 24.85 | 29.75 | 2.53 | 37.96 | 10.04 | 4.90 |
FNAN-40 | 54.88 | 61.64 | 1.99 | 42.55 | 12.73 | 6.76 |
The Table 10-27 shows a summary of drilling campaign performed Braga and Jacaré targets.
Table 10-27: South Block Drill Campaign: Braga and Jacaré targets, 2018.
Hole-ID | X | Y | Z | Length (m) | Azimuth | Dip |
FB-02 | 315885 | 8476890 | 250.28 | 178.9 | 271.5 | -45.3 |
FB-02A | 315886.1 | 8476890 | 250.11 | 159.85 | 271.5 | -75.6 |
FB-03 | 316169.8 | 8476790 | 251.99 | 179.2 | 270 | -43.6 |
FB-04 | 316153.5 | 8476542 | 241.52 | 179.25 | 269.5 | -45.1 |
FB-05 | 315852.9 | 8474090 | 237.38 | 204.15 | 271.1 | -43.9 |
FB-05A | 315853.9 | 8474090 | 237.2 | 200 | 260.9 | -74.9 |
FB-06 | 315794.8 | 8474769 | 257.93 | 185.8 | 272.5 | -45.7 |
FJ-03 | 316692.9 | 8479125 | 269.26 | 161.85 | 296.4 | -44.5 |
FJ-04 | 317006.4 | 8479137 | 272.3 | 147.15 | 296 | -44 |
FJ-05 | 316740.2 | 8479212 | 268.93 | 141.25 | 290 | -45.4 |
FJ-05A | 316741.3 | 8479211 | 269 | 128.75 | 292.5 | -75.2 |
FJ-06 | 316369.2 | 8478372 | 259.54 | 151.5 | 290 | -41.5 |
FJ-06A | 316370.2 | 8478372 | 259.62 | 99.2 | 293.1 | -74.8 |
FJ-07 | 316387.4 | 8478429 | 261.158 | 101.85 | 290.7 | -45 |
10.7.1 Logging
The geological description process was realized in a rented warehouse near of the Campbell Pit. This location served as the basis for Largo's exploration team. The description of the core occurred outside of the warehouse on racks built specifically for this stage.
The core was stored in wooden core boxes with lids and delivered daily in the warehouse. After being received, recorded and photographed, the boxes were set up on core racks for logging and other geotechnical activities.
Lithologies, mineralized zones and geotechnical observations (rock quality and RQD) were marked with pencils on the core box, as well as in the standard description worksheet used by the Largo team. All core was submitted to magnetic susceptibility analysis.
10.8 2019 Largo Exploration Drill Program
In 2019 Largo drilled 129 holes totaling 19,854.75m at 6 deposits (Table 10-28). Drilling was distributed as follows; 5 drill holes in Campbell Pit totaling1,924.65m; 20 drill holes in GAN deposit with a total of 3,050.95 m drilled; 47 drilled in NAN holes totaling 5,404.15m and in the Near Mine Targets 57 drill holes totaling 9,475m (NAO, SJO and GAS).
Table 10-28: 2019 Drilling Summary.
Deposit | Type/Purpose | 2019 |
Number of Holes | Total (m) |
Campbell | Exploration | 5 | 1,924.65 |
Gulçari A North (GAN, GB and GBS) | Exploration | 20 | 3,050.95 |
Novo Amparo North | Exploration | 47 | 5,404.15 |
Novo Amparo | Exploration | 24 | 4,646.4 |
São José | Exploration | 18 | 2,812.6 |
Gulçari A South | Exploration | 15 | 2,016.0 |
Total | | 129 | 19,854.75 |
At NAN the drill program began on January 15, 2019 and ended on March 14, 2019 with 47 holes (Figure 10.5) being drilled for 5,404.15 m of core (Table 10-29). For this program, five drills were used, two Mach Sonda - 320 model and another three Mach Sonda 1200 model, which worked with a monthly average of 540 m per drill rig.
Table 10-29: 2019 NAN Drill Program.
Hole ID | Northing | Easting | Elevation (m) | Av. Azimuth
(°) | Av. Dip
(°) | Length
(m) | Year |
FNAN-41 | 8492235 | 319868 | 349.00 | 292 | -43 | 133.80 | 2019 |
FNAN-42 | 8492255 | 319818 | 347.24 | 291 | -44 | 70.85 | 2019 |
FNAN-43 | 8492124 | 319823 | 340.52 | 291 | -44 | 134.30 | 2019 |
FNAN-44 | 8492138 | 319785 | 339.12 | 290 | -45 | 79.30 | 2019 |
Hole ID | Northing | Easting | Elevation (m) | Av. Azimuth
(°) | Av. Dip
(°) | Length
(m) | Year |
FNAN-45 | 8492311 | 319837 | 347.95 | 289 | -44 | 58.30 | 2019 |
FNAN-46 | 8492367 | 319859 | 347.97 | 290 | -45 | 34.45 | 2019 |
FNAN-47 | 8,492,424 | 319,878 | 348.61 | 290 | -45 | 44.95 | 2019 |
FNAN-48 | 8,492,461 | 319,893 | 349.21 | 289 | -45 | 36.70 | 2019 |
FNAN-49 | 8,491,937 | 319,753 | 335.77 | 288 | -44 | 99.70 | 2019 |
FNAN-50 | 8,491,950 | 319,718 | 335.18 | 289 | -45 | 59.10 | 2019 |
FNAN-51 | 8,492,499 | 319,907 | 349.73 | 291 | -45 | 40.20 | 2019 |
FNAN-52 | 8,492,855 | 320,096 | 346.66 | 292 | -45 | 176.05 | 2019 |
FNAN-53 | 8,492,872 | 320,052 | 346.26 | 292 | -45 | 111.50 | 2019 |
FNAN-54 | 8,492,049 | 319,796 | 337.24 | 295 | -44 | 133.45 | 2019 |
FNAN-55 | 8,491,833 | 319,744 | 337.82 | 294 | -43 | 141.30 | 2019 |
FNAN-56 | 8,491,794 | 319,725 | 336.92 | 292 | -44 | 134.60 | 2019 |
FNAN-57 | 8,492,797 | 320,023 | 348.50 | 290 | -45 | 93.70 | 2019 |
FNAN-58 | 8,492,781 | 320,066 | 349.28 | 289 | -44 | 150.05 | 2019 |
FNAN-59 | 8,491,981 | 319,770 | 335.80 | 291 | -44 | 123.85 | 2019 |
FNAN-60 | 8,491,758 | 319,720 | 336.72 | 292 | -44 | 141.40 | 2019 |
FNAN-61 | 8,491,849 | 319,702 | 335.85 | 291 | -43 | 100.15 | 2019 |
FNAN-62 | 8,492,758 | 320,014 | 349.32 | 287 | -46 | 93.75 | 2019 |
FNAN-63 | 8,492,720 | 319,999 | 349.94 | 291 | -44 | 92.35 | 2019 |
FNAN-64 | 8,492,629 | 319,957 | 350.62 | 289 | -44 | 90.15 | 2019 |
FNAN-65 | 8,491,709 | 319,701 | 336.33 | 295 | -44 | 149.35 | 2019 |
FNAN-66 | 8,491,675 | 319,700 | 336.31 | 297 | -42 | 165.30 | 2019 |
FNAN-67 | 8,492,434 | 320,077 | 354.44 | 294 | -42 | 266.40 | 2019 |
FNAN-68 | 8,491,775 | 319,672 | 335.88 | 294 | -43 | 99.00 | 2019 |
FNAN-69 | 8,491,690 | 319,642 | 336.10 | 292 | -42 | 101.65 | 2019 |
FNAN-70 | 8,491,597 | 319,679 | 336.65 | 294 | -41 | 162.25 | 2019 |
FNAN-71 | 8,491,613 | 319,621 | 337.42 | 289 | -44 | 94.40 | 2019 |
FNAN-72 | 8,492,574 | 319,933 | 350.72 | 292 | -43 | 138.35 | 2019 |
FNAN-73 | 8,491,520 | 319,659 | 337.56 | 293 | -41 | 162.50 | 2019 |
FNAN-74 | 8,491,536 | 319,600 | 337.24 | 291 | -45 | 97.40 | 2019 |
FNAN-75 | 8,491,422 | 319,636 | 336.67 | 289 | -40 | 169.40 | 2019 |
FNAN-76 | 8,492,306 | 319,965 | 351.77 | 297 | -56 | 237.75 | 2019 |
FNAN-77 | 8,491,871 | 319,757 | 337.21 | 291 | -44 | 137.45 | 2019 |
FNAN-78 | 8,492,119 | 319,843 | 341.21 | 298 | -57 | 180.75 | 2019 |
FNAN-79 | 8,492,536 | 319,921 | 350.24 | 288 | -43 | 56.40 | 2019 |
FNAN-80 | 8,492,084 | 319,816 | 338.98 | 294 | -45 | 136.25 | 2019 |
FNAN-81 | 8,492,267 | 319,884 | 349.43 | 292 | -42 | 130.55 | 2019 |
FNAN-82 | 8,492,283 | 319,828 | 347.68 | 291 | -44 | 60.85 | 2019 |
FNAN-83 | 8,492,098 | 319,768 | 335.81 | 293 | -43 | 74.90 | 2019 |
FNAN-84 | 8,492,150 | 319,833 | 342.50 | 292 | -42 | 130.70 | 2019 |
FNAN-85 | 8,492,016 | 319,790 | 336.68 | 292 | -44 | 132.60 | 2019 |
FNAN-86 | 8,492,035 | 319,736 | 335.31 | 291 | -43 | 69.45 | 2019 |
FNAN-87 | 8,492,172 | 319,792 | 342.77 | 294 | -43 | 76.55 | 2019 |

Figure 10.5: NAN 2019 Driling Campaign Grid in green.
The main objective of NAN drilling program was to increase the confidence of the previous Inferred resource by increasing density of drilling to meet Measured and Indicated category requirements and to expand the mineral resource sufficiently to confirm its economic potential.
Drilling confirmed the main mineralized body (magnetitite) to approximately 2.5 km in strike length and to a vertical depth of 360 m. All results from this program through the FNAN-87 hole have been incorporated into this new mineral resource estimate. Table 10-30 lists some of the more significant drill intercepts from this program.
Table 10-30: Significant Drill Intercepts from the 2019 NAN Drill Program.
Hole Number | From (m) | To (m) | V2O5 (%) | TiO2 (%) | Interval (m) |
FNAN-41 | 99.1 | 100.37 | 0.98 | 9.21 | 1.27 |
FNAN-43 | 97.6 | 104.96 | 0.97 | 11.21 | 7.36 |
FNAN-44 | 53.75 | 59.34 | 0.82 | 11.01 | 5.59 |
FNAN-48 | 19.65 | 25.17 | 0.88 | 6.23 | 5.52 |
FNAN-49 | 61.01 | 68.73 | 0.81 | 12.93 | 7.72 |
FNAN-50 | 21.5 | 28.2 | 0.85 | 12.32 | 6.7 |
FNAN-51 | 14.98 | 17.05 | 0.82 | 7.03 | 2.07 |
FNAN-51 | 19.43 | 23.76 | 1.23 | 12.26 | 4.33 |
FNAN-51 | 30.92 | 34.21 | 0.96 | 6.69 | 3.29 |
FNAN-52 | 130.36 | 131.5 | 0.83 | 10.15 | 1.14 |
FNAN-53 | 67.98 | 72.19 | 1.12 | 13.16 | 4.21 |
FNAN-54 | 94.74 | 99.46 | 0.83 | 11.82 | 4.72 |
FNAN-55 | 99.97 | 106.81 | 0.94 | 12.55 | 6.84 |
FNAN-56 | 95.4 | 103.45 | 0.89 | 12.81 | 8.05 |
FNAN-57 | 25.3 | 42.11 | 0.90 | 11.12 | 16.81 |
FNAN-60 | 106.37 | 114.04 | 0.85 | 12.71 | 7.67 |
FNAN-61 | 48.85 | 56.83 | 0.91 | 12.74 | 7.98 |
FNAN-62 | 21.36 | 37.97 | 0.83 | 11.82 | 16.61 |
FNAN-63 | 20.37 | 38.34 | 0.87 | 11.96 | 17.97 |
FNAN-64 | 17.08 | 39.92 | 0.92 | 11.13 | 22.84 |
FNAN-66 | 120.48 | 128.13 | 0.86 | 12.78 | 7.65 |
FNAN-67 | 201.02 | 224.9 | 0.85 | 11.42 | 23.88 |
FNAN-69 | 90.14 | 91.39 | 0.86 | 6.32 | 1.25 |
FNAN-71 | 63.54 | 67.25 | 0.81 | 11.63 | 3.71 |
FNAN-72 | 16.65 | 28.85 | 1.00 | 11.15 | 12.2 |
FNAN-74 | 57.8 | 65.45 | 0.86 | 12.04 | 7.65 |
FNAN-75 | 146.89 | 149.33 | 0.81 | 7.09 | 2.44 |
FNAN-76 | 210.42 | 219.67 | 0.80 | 6.94 | 9.25 |
FNAN-77 | 89.98 | 97.8 | 0.90 | 12.65 | 7.82 |
FNAN-77 | 123.74 | 127.01 | 0.81 | 7.02 | 3.27 |
FNAN-78 | 140.03 | 147.55 | 0.81 | 11.25 | 7.52 |
FNAN-84 | 98.21 | 105.51 | 0.80 | 9.27 | 7.3 |
FNAN-87 | 48.2 | 55.72 | 0.90 | 9.94 | 7.52 |
At Campbell Pit (Gulçari A target) in 2019, the campaign began on May 30, 2019 and ended on November 18 of the same year with a break from July to August.Five drill holes were drilled totaling 1,924.65 m (Table 10-31 and Figure 10.6) utilizing 2 drill rigs (rigs 274 and 286) working with an average production of 588 meters per month each
Table 10-31: Campbell Pit 2019 Drill Program.
Hole_id | x | y | z | Length (m) | Driling Campaing | AZIMUTH | DIP |
FGA-113 | 318,625.4 | 8,485,900 | 306.60 | 462.95 | 2019 | 280.1 | -68.8 |
FGA-114 | 318,667.4 | 8,485,955 | 299.89 | 443.45 | 2019 | 289.1 | -70.7 |
FGA-115 | 318,743.3 | 8,485,704 | 315.00 | 270.65 | 2019 | 297.5 | -46.1 |
FGA-116 | 318,432.8 | 8,485,647 | 308.26 | 297.25 | 2019 | 299.9 | -46.7 |
FGA-117 | 318,698.8 | 8,486,137 | 311.08 | 450.35 | 2019 | 296.0 | -44.8 |
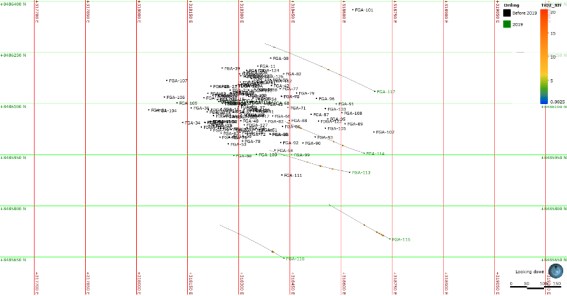
Figure 10.6: Campbell Pit 2019 Driling Campaign Grid in green.
In 2019 drilling program was to confirm additional mineralisation within the west wall portion of Campbell Pit to expand the mineral resource sufficiently to confirm its economic potential.
The drilling confirmed the mineralized body (magnetitite gabbro) in depth and down-dip direction.
The 5 drill holes intercepted Ti-V intervals of magnetite gabbro. Table 10-32 outlines a number of significant drill intercepts from this drilling.
Table 10-32: 2019 Campbell Pit Drill Assay of significant results.
Hole ID
| From (m) | To (m) | V2O5 (%) | TiO2 (%) | Interval (m) |
FGA-113 | 198.05 | 199.55 | 1.1 | 12.4 | 1.50 |
FGA-113 | 385.02 | 391.62 | 1.4 | 7 | 6.60 |
FGA-114 | 224.14 | 225.33 | 1.2 | 12.9 | 1.19 |
FGA-114 | 366.40 | 377.75 | 1.1 | 6.8 | 11.35 |
FGA-114 | 378.75 | 386.29 | 1.2 | 6.9 | 7.54 |
FGA-114 | 388.41 | 391.75 | 1.1 | 6.9 | 3.34 |
FGA-114 | 426.69 | 428.64 | 1 | 8.1 | 1.95 |
At the GAN deposit, the drilling campaign began on August 21, 2019 and ended on October 26, 2019. The Company drilled 20 holes totaling 3,050.95 m of core (Figure 10.7 and Table 10-33). Two diamond drill rigs (rigs 274 and 286) were available working with an average production of 583 meters per month each.
Table 10-33: GAN - 2019 Drill Program.
HOLEID | X | Y | Z | Length (m) | DIP | AZIM |
FGAN-18 | 318,634.90 | 8,486,875.00 | 310.71 | 114 | -44 | 288 |
FGAN-19 | 318,637.60 | 8,487,052.00 | 318.35 | 108.35 | -44.5 | 284.8 |
FGAN-20 | 318,628.30 | 8,486,988.00 | 315.6 | 102.5 | -45.8 | 287.9 |
FGAN-21 | 318,840.90 | 8,486,732.00 | 308.87 | 74.45 | -46.8 | 292.8 |
FGAN-22 | 318,635.80 | 8,486,844.00 | 310.08 | 87.5 | -46.1 | 292 |
FGAN-23 | 318,619.20 | 8,486,739.00 | 309.86 | 99.6 | -44.3 | 293.8 |
FGAN-24 | 318,598.80 | 8,486,549.00 | 291.35 | 104.25 | -45.2 | 290 |
FGAN-25 | 318,574.10 | 8,486,421.00 | 299.53 | 136 | -68.7 | 290.4 |
FGB-18 | 319,064.40 | 8,486,885.00 | 321.39 | 222.35 | -45.8 | 287.7 |
FGB-19 | 319,073.80 | 8,486,924.00 | 322.5 | 227.75 | -45.6 | 292.3 |
FGB-20 | 319,077.70 | 8,486,984.00 | 322.71 | 195.65 | -44 | 292.3 |
FGB-21 | 319,100.50 | 8,487,044.00 | 323.53 | 219.4 | -44.3 | 292 |
FGB-22 | 319,110.20 | 8,487,080.00 | 324.16 | 193.15 | -44 | 291.5 |
FGB-23 | 319,132.90 | 8,487,111.00 | 324.75 | 245.55 | -45.7 | 292.2 |
FGB-24 | 319,139.30 | 8,487,195.00 | 324.62 | 204.15 | -44.4 | 290.1 |
FGBS-07 | 319,010.90 | 8,486,653.00 | 309.45 | 251.95 | -43.9 | 291.8 |
FGBS-08 | 319,011.30 | 8,486,549.00 | 307.87 | 81.35 | -45.7 | 289.8 |
FGBS-09 | 319,009.40 | 8,486,442.00 | 311.04 | 100.85 | -45.2 | 295.4 |
FGBS-10 | 319,033.30 | 8,486,777.00 | 316.86 | 197.85 | -44.2 | 294.4 |
FGBS-11 | 318,978.50 | 8,486,349.00 | 313.48 | 84.3 | -45.9 | 287.5 |
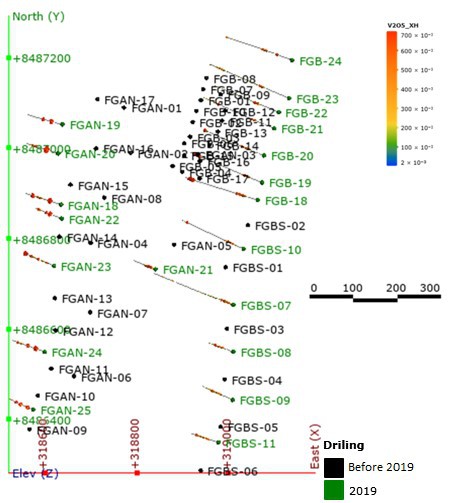
Figure 10.7: GAN Pit 2019 Driling Campaign Grid in green.
The intention of GAN drilling program was to expand the mineralization for SW portion and to confirm the continuity in depth to expand the mineral resource sufficiently to confirm its economic potential.
The outlines values of drill intercepts from this drilling are shown in Table 10-34 where the ranged intervals is of 1 m to 40.95 m with a weighted average of 11.2%TiO2.
Table 10-34: 2019 GAN Drill Assay of significant results.
Hole ID | From (m) | To (m) | TiO2 (%) | Interval (m) |
FGAN-18 | 31.7 | 35.1 | 12.68 | 3.4 |
FGAN-19 | 30.3 | 34.95 | 10.74 | 4.65 |
FGAN-20 | 35.1 | 38.6 | 13.81 | 3.5 |
FGAN-21 | 5.5 | 6.8 | 9.75 | 1.3 |
FGAN-21 | 11.85 | 22.1 | 12.06 | 10.25 |
FGAN-21 | 24.3 | 29.65 | 12.47 | 5.35 |
FGAN-21 | 30.75 | 33.35 | 10.85 | 2.6 |
FGAN-22 | 35.7 | 38.3 | 10.88 | 2.6 |
FGAN-23 | 22.9 | 24.05 | 10.75 | 1.15 |
FGAN-24 | 21.5 | 24.25 | 10.73 | 2.75 |
FGAN-24 | 25.55 | 28.25 | 9.57 | 2.7 |
FGAN-25 | 32.6 | 35.65 | 10.85 | 3.05 |
FGAN-25 | 37.2 | 38.25 | 8.64 | 1.05 |
FGAN-25 | 96.85 | 98.85 | 8.52 | 2 |
FGB-18 | 40.85 | 49.45 | 9.24 | 8.6 |
FGB-18 | 57.75 | 63.75 | 8.30 | 6 |
FGB-18 | 193.05 | 210.9 | 14.22 | 17.85 |
FGB-19 | 195.05 | 220 | 17.67 | 24.95 |
FGB-20 | 45.65 | 57.5 | 8.62 | 11.85 |
FGB-20 | 58.75 | 59.9 | 9.50 | 1.15 |
FGB-20 | 176.2 | 184.95 | 13.76 | 8.75 |
FGB-21 | 59.4 | 67.75 | 8.45 | 8.35 |
FGB-21 | 70.6 | 71.7 | 10.10 | 1.1 |
FGB-21 | 178.45 | 219.4 | 10.23 | 40.95 |
FGB-22 | 63.1 | 70.25 | 8.87 | 7.15 |
FGB-23 | 82.65 | 89.55 | 9.29 | 6.9 |
FGB-23 | 90.1 | 97.25 | 8.37 | 7.15 |
FGB-23 | 199.3 | 216.45 | 9.08 | 17.15 |
FGB-24 | 79.7 | 86.95 | 9.75 | 7.25 |
FGBS-07 | 9.15 | 12.15 | 8.85 | 3 |
FGBS-08 | 34.85 | 35.85 | 9.75 | 1 |
FGBS-08 | 46.85 | 51.65 | 8.48 | 4.8 |
FGBS-09 | 44.25 | 45.75 | 8.23 | 1.5 |
FGBS-10 | 41.95 | 42.95 | 8.72 | 1 |
FGBS-10 | 181.3 | 184.7 | 16.24 | 3.4 |
FGBS-11 | 30.85 | 33.4 | 9.59 | 2.55 |
FGBS-11 | 34.7 | 35.85 | 8.23 | 1.15 |
Table 10-37 shows a summary of drilling campaign performed at the GAS, NAO and SJO targets.
Table 10-35: GAS - 2019 Drilling Program.
HOLEID | X | Y | Z | Length (m) | DIP | AZIM |
FGAS-01 | 317999.6 | 8484788 | 308.72 | 201.5 | -45.3 | 303.9 |
FGAS-02 | 318090.3 | 8484779 | 309.87 | 135 | -46.6 | 299.7 |
FGAS-02A | 318091.2 | 8484779 | 309.87 | 158 | -69.6 | 306 |
FGAS-03 | 317976.4 | 8484414 | 302.3 | 96.75 | -68.6 | 297.1 |
FGAS-04 | 317901 | 8484221 | 299.45 | 119.45 | -71 | 306.6 |
FGAS-05 | 317884.7 | 8484036 | 295.65 | 114.85 | -69.4 | 303.3 |
FGAS-06 | 317886.8 | 8483918 | 295.84 | 120.8 | -70.6 | 316.6 |
FGAS-07 | 317876.1 | 8483850 | 295.4142 | 137.4 | -70.3 | 295.4 |
FGAS-08 | 317836 | 8483682 | 296.35 | 148.05 | -72.5 | 297.5 |
FGAS-09 | 317797.8 | 8483598 | 293.04 | 121.05 | -70.6 | 294.4 |
FGAS-10 | 317742.1 | 8483459 | 296.87 | 106.1 | -70.8 | 270 |
FGAS-11 | 317721.3 | 8483333 | 298.54 | 106.15 | -68.7 | 263.9 |
FGAS-12 | 317992.4 | 8483411 | 306.87 | 150.4 | -44.1 | 273 |
FGAS-13 | 317983.1 | 8483318 | 303.4 | 150.15 | -45.8 | 270.6 |
FGAS-14 | 318011.5 | 8483486 | 305.87 | 150.35 | -43.1 | 268.3 |
Table 10-36: NAO - 2019 Drill Program.
hole_id | x | y | z | Length (m) | dip | azim |
FNA-22 | 319586 | 8489742 | 338.671 | 293.85 | -44.9 | 290.4 |
FNA-23 | 319590.9 | 8489797 | 337.341 | 302.00 | -44.5 | 288.8 |
FNA-24 | 319590.8 | 8489829 | 337.728 | 280.60 | -46.9 | 279.8 |
FNA-25 | 319650.4 | 8489518 | 343.701 | 239.70 | -47.1 | 291.6 |
FNA-26 | 319464 | 8489907 | 338.447 | 77.35 | -45.6 | 290.4 |
FNA-27 | 319415.1 | 8489610 | 336.121 | 111.70 | -45.2 | 293 |
FNA-28 | 319404.5 | 8489766 | 339.121 | 72.30 | -60.3 | 294.5 |
FNA-29 | 319619.5 | 8489431 | 339.816 | 237.20 | -45.4 | 291.1 |
FNA-30 | 319642.2 | 8489630 | 343.698 | 201.30 | -45.8 | 291.2 |
FNA-31 | 319555.3 | 8489656 | 340.271 | 273.55 | -44.9 | 292.7 |
FNA-32 | 319524.6 | 8489564 | 340.221 | 257.85 | -46.4 | 290.5 |
FNA-33 | 319505.3 | 8489473 | 338.57 | 252.35 | -45.2 | 287.4 |
FNA-34 | 319541.7 | 8489626 | 340.22 | 267.30 | -46.9 | 289.1 |
FNA-35 | 319639.6 | 8489486 | 342.59 | 227.05 | -43.7 | 289.4 |
FNA-36 | 319528.3 | 8489529 | 339.91 | 268.20 | -46.9 | 291 |
FNA-37 | 319379.9 | 8489521 | 338.04 | 94.25 | -45 | 288 |
FNA-38 | 319532.9 | 8489591 | 340.22 | 112.85 | -46.9 | 287.9 |
FNA-39 | 319395.8 | 8489548 | 338.14 | 102.00 | -44.6 | 288.8 |
FNA-40 | 319633.7 | 8489554 | 343.17 | 84.35 | -45.5 | 291.3 |
FNA-41 | 319626.2 | 8489459 | 341.04 | 235.35 | -45.8 | 290.5 |
FNA-42 | 319519.5 | 8489500 | 339.18 | 120.00 | -46.2 | 290 |
FNA-43 | 319469.4 | 8489440 | 339.14 | 80.75 | -46.3 | 290 |
FNA-44 | 319591.3 | 8489404 | 337.64 | 221.60 | -44.7 | 289.3 |
FNA-45 | 319603.8 | 8489852 | 337.98 | 232.95 | -44.1 | 288.8 |
Table 10-37: SJO 2019 Drill Program.
hole_id | x | y | z | Length (m) | dip | azim |
FSJ-26 | 318950.1 | 8488319 | 318.068 | 102.3 | -51.2 | 292.4 |
FSJ-27 | 319247.5 | 8488249 | 327.962 | 147.5 | -43.4 | 289.1 |
FSJ-28 | 319050.7 | 8488431 | 323.242 | 162.45 | -58 | 290.1 |
FSJ-29 | 319025.1 | 8488403 | 320.97 | 131.45 | -45.6 | 290.3 |
FSJ-30 | 319214.6 | 8488400 | 328.419 | 136.85 | -43.3 | 286.5 |
FSJ-31 | 318957.1 | 8488279 | 317.324 | 121.2 | -44.6 | 292.6 |
FSJ-32 | 319114.4 | 8488519 | 329.82 | 177.05 | -45.9 | 291.5 |
FSJ-33 | 319022 | 8488292 | 319.65 | 169.95 | -48.9 | 290.5 |
FSJ-34 | 319064.3 | 8488501 | 324.154 | 136.05 | -45.3 | 288.7 |
FSJ-35 | 319072.7 | 8488348 | 323.353 | 196 | -49.8 | 292.1 |
FSJ-36 | 319012 | 8488371 | 319.874 | 126.6 | -44.7 | 291 |
FSJ-37 | 319015.8 | 8488257 | 321.763 | 183.5 | -47.8 | 280.9 |
FSJ-38 | 319081.2 | 8488569 | 326.564 | 129.4 | -45 | 289 |
FSJ-39 | 319114.9 | 8488634 | 329.331 | 147.1 | -45.4 | 292.9 |
FSJ-40 | 319323.5 | 8488415 | 327.326 | 179.75 | -43.3 | 292 |
FSJ-41 | 319148.1 | 8488544 | 332.051 | 200.05 | -46 | 291.1 |
FSJ-42 | 319348.3 | 8488490 | 330.506 | 163.15 | -43.5 | 291.8 |
FSJ-43 | 319109.2 | 8488447 | 327.596 | 202.25 | -50.8 | 291.3 |
The geological description process was realized in a rented warehouse near of the Campbell Pit. This location served as the basis for Largo's exploration team. The description of the core occurred outside of the warehouse on racks built specifically for this stage.
The core was stored in wooden core boxes with lids and delivered daily in the warehouse. After being received, recorded and photographed, the boxes were set up on core racks for logging and other geotechnical activities.
Lithologies, mineralized zones and geotechnical observations (rock quality and RQD) were marked with pencils on the core box, as well as in the standard description worksheet used by the Largo team. All core were submitted to magnetic susceptibility analysis.
The campaigns have average diameter of the drill rods was NQ and the average recovery in all areas was above 95%. All data collected were standardized in the UTM coordinate system in DATUM SIRGASS 2000. The survey was also based on NNE-SSW regional magnetic anomalies associated with the base lithology of the magmatic differentiation of the region.
Also in 2019, a review of the geological description of older drill holes was carried out in order to obtain further clarification on stratigraphy across the Rio Jacaré Intrusion. More than 18,000 meters of historic drill core were reviewed in relation to the last survey description (Table 10-38).
Table 10-38: Magmatic Cycle Revision: Relogged Geological Description, 2019 .
Target Area | Drill Core (m) Relogged |
SJO | 4,060.65 |
NAO | 724.05 |
GAN | 2,516.70 |
GAN (anterior GBS) | 813.05 |
GAN (Anterior GB) | 1,541.22 |
South Block (Agua Branca-Braga-Jacaré) | 889.95 |
Campbell Pit | 7,457.93 |
10.9 2020 Largo Drill Program
In 2020 Largo drilled 124 diamond drill holes over areas (Campbell Pit, GAN, NAN and Near Mine Targets, Table 10-39). At Campbell Pit Largo completed 4,757.30 m of coring (17 holes), at GAN deposit 6,899.00 m of coring (45 holes) was completed and at NAN 32 holes were drilled totaling 8,187.65 m of core. Thirty drill holes were executed at the São José and Novo Amparo deposits for about 4,923.80 m of core.
It is important to emphasize that in this current evaluation of the Rio Jacaré Intrusion Largo has combined the Gulcari B (GAB), Gulcari B South (GBS) within the overall Gulcari A Norte (GAN) deposit for future reference. The Table 10-39 shows summary drilling in the deposits in 2020.
Table 10-39: 2019 Drilling Summary.
Deposit | Type/Purpose | 2020 |
Number of Holes | Total (m) |
Campbell | Exploration | 17 | 4,757.30 |
GAN (GAN, GAB and GBS) | Exploration | 45 | 6,899.00 |
Novo Amparo North | Exploration | 32 | 8,187.65 |
São José and Novo Amparo | Exploration | 30 | 4,923.8 |
Total | | 124 | 24,767.75 |
The Campbell Pit campaign started on August 20, 2020 and ended on December 16 with 17 holes drilled (Figure 10.8) holes totaling 4,757.75 m (including two very short holes aborted within the open pit). The project had up to four diamond drill rigs (rigs 273, 274, 337 and 309) with an average production of 595 meters per month each. Table 10-40 define the collar coordinates and other technical information about the drill holes.
Table 10-40: 2020 Campbell Pit Drilling Program.
Hole ID | Easting | Northing | Elevation (m) | Av. Azimuth (°) | Av. Dip (°) | Depth (m) | Year |
FGA-118 | 318063 | 8486089 | 270.16 | 293 | -44 | 81.5 | 2020 |
FGA-119 | 318089 | 8486144 | 269.71 | 293 | -43 | 90.15 | 2020 |
FGA-120 | 318087 | 8486086 | 260.77 | 297 | -43 | 111.95 | 2020 |
FGA-120ª | 318088 | 8486086 | 260.64 | 297 | -61 | 130.15 | 2020 |
FGA-121 | 318092 | 8486109 | 260.96 | 287 | -53 | 131.95 | 2020 |
FGA-121ª | 318093 | 8486109 | 260.65 | 287 | -75 | 160.65 | 2020 |
FGA-122 | 318107 | 8486137 | 260.38 | 289 | -53 | 121 | 2020 |
FGA-122ª | 318108 | 8486136 | 260.32 | 290 | -75 | 168.5 | 2020 |
FGA-123 | 318184 | 8486051 | 220.42 | 293 | -47 | 240.2 | 2020 |
FGA-124 | 318181 | 8486089 | 221.67 | 289 | -41 | 202.95 | 2020 |
FGA-125 | 318667 | 8486016 | 289.83 | 294 | -53 | 471.6 | 2020 |
FGA-126 | 318665 | 8486051 | 290.03 | 292 | -64 | 485.15 | 2020 |
FGA-127 | 318664 | 8486073 | 290.26 | 298 | -51 | 451.75 | 2020 |
FGA-128 | 318665 | 8485995 | 289.62 | 289 | -51 | 507.05 | 2020 |
FGA-129 | 318722 | 8485944 | 306.74 | 297 | -59 | 493.5 | 2020 |
FGA-130 | 318609 | 8485996 | 273.06 | 286 | -49 | 450.35 | 2020 |
FGA-131 | 318595 | 8485976 | 272.53 | 292 | -46 | 458.9 | 2020 |
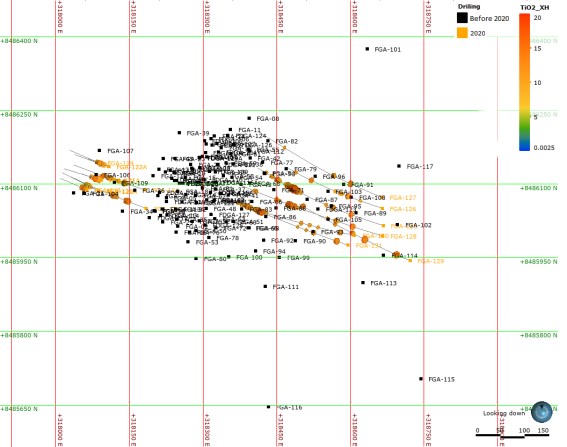
Figure 10.8: Campbell Pit 2020 Drilling Campaign in red.
At Campbell Pit the 2020 drill program focused on targets to the northwest and southeast in relation to the main ore body with the aim of better defining the geometry of mineralization and increasing the confidence of inferred resources classified in the last resource estimate.
The outlines values of drill intercepts from this drilling are shown in Table 10-41 where the intervals ranged from 1.45 m to 57.75 m in length with a weighted average 1.32%V2O5 and 11.65%TiO2. Holes FGA118 to FGA124 were drilled to define Cycle 1/Cycle 2 in the western edge of the current pit and the holes FGA 125 to FGA131 were drilled to depth in eastern edge to define Cycle 7/Cycle 8/Cycle 9, within or below the deeper portions of the current resource estimate. Such holes proved the continuity of less magnetic mineralization (magnetite pyroxenite and magnetite gabbro) at depth and but supported additional mineral resource to those previously declared.
Table 10-41: Campbell Drill Assay of Significant Results.
holeid | from | to | V2O5_XH | TiO2_XH | Interval (m) |
FGA-118 | 5.25 | 8.75 | 1.3 | 9.4 | 3.5 |
FGA-119 | 0.3 | 8.2 | 0.9 | 9.5 | 7.9 |
FGA-123 | 1 | 2.85 | 0.9 | 5.5 | 1.85 |
FGA-123 | 55.15 | 57.4 | 1.1 | 8.2 | 2.25 |
FGA-123 | 57.9 | 62.9 | 1.3 | 10.4 | 5 |
FGA-123 | 65.05 | 69.75 | 0.9 | 6.8 | 4.7 |
FGA-123 | 106.55 | 108.15 | 1.8 | 13.9 | 1.6 |
holeid | from | to | V2O5_XH | TiO2_XH | Interval (m) |
FGA-124 | 52.55 | 63.5 | 1.4 | 10.6 | 10.95 |
FGA-124 | 72.1 | 89.45 | 0.9 | 7.6 | 17.35 |
FGA-124 | 89.7 | 97.3 | 0.9 | 8.3 | 7.6 |
FGA-124 | 102.55 | 106.75 | 1.2 | 10.4 | 4.2 |
FGA-124 | 117.4 | 127.55 | 0.8 | 7 | 10.15 |
FGA-125 | 192.1 | 196.45 | 0.9 | 11.6 | 4.35 |
FGA-125 | 313.7 | 371.45 | 1.8 | 11.6 | 57.75 |
FGA-126 | 220.3 | 223.85 | 1 | 12.3 | 3.55 |
FGA-127 | 181.55 | 185.8 | 0.9 | 11.6 | 4.25 |
FGA-128 | 239.8 | 241.25 | 0.8 | 7.2 | 1.45 |
FGA-128 | 322.95 | 325.15 | 0.9 | 5.6 | 2.2 |
FGA-128 | 325.85 | 329.05 | 0.9 | 6.7 | 3.2 |
FGA-128 | 339.55 | 343.6 | 0.8 | 5.4 | 4.05 |
FGA-128 | 344.4 | 358.8 | 2 | 12.7 | 14.4 |
FGA-128 | 448.6 | 450.8 | 1.6 | 10.6 | 2.2 |
FGA-128 | 454.15 | 457.35 | 0.9 | 6.6 | 3.2 |
FGA-129 | 285.55 | 288.7 | 0.8 | 9.5 | 3.15 |
FGA-130 | 294.45 | 302.35 | 0.9 | 6.6 | 7.9 |
FGA-130 | 313.65 | 315.35 | 0.8 | 5.8 | 1.7 |
FGA-130 | 318.3 | 323.4 | 1.2 | 8.1 | 5.1 |
FGA-131 | 113.7 | 117.5 | 0.8 | 11.4 | 3.8 |
FGA-131 | 277.85 | 288.9 | 2.1 | 13.2 | 11.05 |
FGA-131 | 294.55 | 296.45 | 1 | 7.3 | 1.9 |
FGA-131 | 301.1 | 304.25 | 0.8 | 5.9 | 3.15 |
FGA-131 | 309.6 | 323.35 | 1.5 | 9.6 | 13.75 |
FGA-131 | 324.8 | 334.4 | 0.9 | 6.2 | 9.6 |
FGA-131 | 336.75 | 338.95 | 0.8 | 6.6 | 2.2 |
FGA-131 | 348.9 | 353.9 | 1 | 7.5 | 5 |
Drilling at the GAN deposit started August 27 and was completed on October 16. In total 45 drill (Figure 10.9: GAN 2020 Driling Campaign in orange) holes were completed (6,899.0 m of core). Table 10-42 provides details on the drilling. Six diamond drill rigs (rigs 507, 245, 337, 274, 309 and 285) were utilized at the target with an average production rate of 574 meters per month for each drill rig.
Table 10-42: 2020 GAN Drilling Program
Hole ID | Easting | Northing | Elevation (m) | Av. Azimuth (°) | Av. Dip (°) | Length (m) | Year |
FGAN-26 | 318812 | 8486675 | 307.20 | 288 | -44 | 54.9 | 2020 |
FGAN-27 | 318938 | 8486892 | 316.05 | 292 | -42 | 116.4 | 2020 |
FGAN-28 | 318930 | 8486864 | 315.14 | 292 | -42 | 104.95 | 2020 |
FGAN-29 | 318826 | 8486705 | 307.95 | 291 | -46 | 50.65 | 2020 |
FGAN-30 | 318912 | 8486807 | 314.07 | 290 | -44 | 105.1 | 2020 |
FGAN-31 | 318925 | 8486832 | 315.02 | 291 | -42 | 107.75 | 2020 |
FGAN-32 | 318622 | 8486701 | 308.35 | 290 | -43 | 122.8 | 2020 |
FGAN-32A | 318624 | 8486700 | 308.30 | 288 | -64 | 138.55 | 2020 |
FGAN-33 | 318625 | 8486915 | 313.31 | 290 | -42 | 101.2 | 2020 |
FGAN-34 | 318630 | 8486770 | 310.03 | 293 | -44 | 115.8 | 2020 |
FGAN-35 | 318643 | 8487016 | 315.70 | 288 | -43 | 121.55 | 2020 |
FGAN-36 | 318653 | 8487130 | 316.99 | 291 | -44 | 102.5 | 2020 |
FGAN-37 | 318678 | 8487164 | 318.96 | 292 | -42 | 111.45 | 2020 |
FGAN-37A | 318679 | 8487164 | 318.82 | 290 | -65 | 151.25 | 2020 |
FGAN-38 | 318629 | 8486950 | 314.22 | 288 | -41 | 121.15 | 2020 |
FGAN-38A | 318630 | 8486950 | 314.03 | 286 | -65 | 153.6 | 2020 |
FGAN-39 | 318691 | 8487261 | 322.20 | 289 | -44 | 120.05 | 2020 |
FGAN-39A | 318692 | 8487261 | 321.99 | 287 | -68 | 150.95 | 2020 |
Hole ID | Easting | Northing | Elevation (m) | Av. Azimuth (°) | Av. Dip (°) | Length (m) | Year |
FGAN-40 | 318560 | 8486352 | 299.32 | 291 | -57 | 124.05 | 2020 |
FGAN-41 | 318614 | 8486573 | 304.67 | 292 | -44 | 133.7 | 2020 |
FGAN-41A | 318615 | 8486573 | 304.58 | 289 | -65 | 167.6 | 2020 |
FGAN-42 | 318555 | 8486309 | 292.83 | 291 | -43 | 126.7 | 2020 |
FGAN-42A | 318556 | 8486309 | 292.71 | 295 | -66 | 136.2 | 2020 |
FGAN-43 | 318637 | 8486842 | 310.04 | 289 | -68 | 144.15 | 2020 |
FGAN-44 | 318585 | 8486449 | 301.45 | 291 | -68 | 161.95 | 2020 |
FGAN-45 | 318731 | 8486887 | 305.52 | 293 | -57 | 276.4 | 2020 |
FGAN-46 | 318792 | 8486978 | 308.77 | 295 | -59 | 302.55 | 2020 |
FGAN-47 | 318706 | 8486787 | 306.13 | 287 | -62 | 231.15 | 2020 |
FGB-25 | 319157 | 8487241 | 325.10 | 293 | -44 | 200.1 | 2020 |
FGB-26 | 319172 | 8487141 | 324.76 | 293 | -43 | 251.9 | 2020 |
FGB-27 | 319093 | 8487015 | 323.32 | 292 | -41 | 244.15 | 2020 |
FGB-28 | 319058 | 8486860 | 320.66 | 294 | -41 | 219.4 | 2020 |
FGB-28A | 319059 | 8486859 | 320.50 | 294 | -65 | 267.7 | 2020 |
FGB-29 | 319078 | 8486966 | 322.90 | 291 | -42 | 224.5 | 2020 |
FGB-29A | 319079 | 8486965 | 323.36 | 290 | -67 | 297.3 | 2020 |
FGBS-12 | 318886 | 8486087 | 318.11 | 294 | -44 | 102.25 | 2020 |
FGBS-13 | 319018 | 8486691 | 311.10 | 291 | -43 | 201.55 | 2020 |
FGBS-14 | 318932 | 8486253 | 316.44 | 293 | -43 | 102.4 | 2020 |
FGBS-14A | 318933 | 8486252 | 316.33 | 294 | -67 | 152.1 | 2020 |
FGBS-15 | 318982 | 8486405 | 311.39 | 290 | -43 | 128.1 | 2020 |
FGBS-16 | 319017 | 8486622 | 307.53 | 290 | -45 | 114.5 | 2020 |
FGBS-17 | 318907 | 8486173 | 315.28 | 292 | -44 | 108.7 | 2020 |
FGBS-18 | 318947 | 8486320 | 314.61 | 289 | -44 | 122.1 | 2020 |
FGBS-19 | 319018 | 8486516 | 310.25 | 290 | -42 | 83.15 | 2020 |
FGBS-20 | 319027 | 8486759 | 315.90 | 293 | -41 | 224.05 | 2020 |
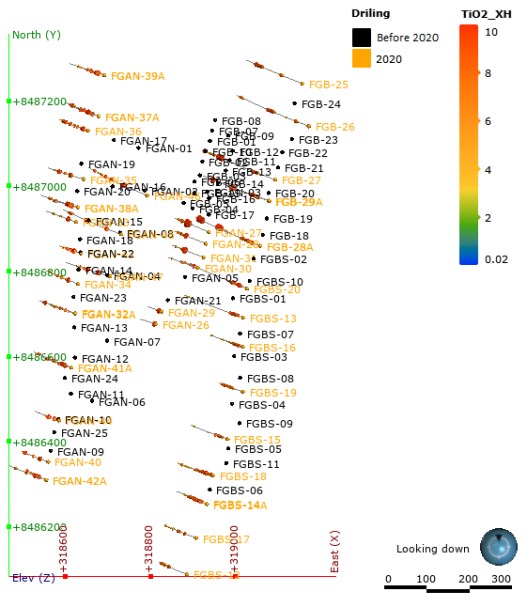
Figure 10.9: GAN 2020 Driling Campaign in orange
At GAN the drill program covered all portions of deposit. Drill holes added to the database and confirmed the prior interpretation and model. Results improved the level of confidence of the interpretation.
The most recent drilling updated the extension of the main GAN body (magnetitite, magnetite-gabbro and magnetite-pyroxenite) to approximately 1.4 km in strike length and to an average vertical depth of 300 m.
Significant drill intercepts from this drilling is show in Table 10-43 where drill intercepts ranged from 1 m to 18.3 m with a weighted average grades of 0.67%V2O5 and 11.50%TiO2.
Table 10-43: 2020 GAN Significant Drill Assay Results
Holeid | from | to | V2O5_XH | TiO2_XH | Interval (m) |
FGAN-26 | 2.2 | 3.65 | 0.41 | 9.70 | 1.45 |
FGAN-27 | 65.3 | 75.65 | 0.69 | 17.72 | 10.35 |
FGAN-28 | 65.6 | 68 | 0.68 | 13.93 | 2.40 |
FGAN-29 | 5.8 | 9.8 | 0.68 | 12.66 | 4.00 |
FGAN-31 | 62.5 | 66.1 | 0.55 | 15.06 | 3.60 |
FGAN-31 | 70.2 | 71.2 | 0.35 | 8.84 | 1.00 |
FGAN-33 | 23.9 | 27.6 | 0.80 | 11.45 | 3.70 |
FGAN-34 | 31.9 | 35.2 | 0.85 | 11.80 | 3.30 |
FGAN-34 | 59.75 | 60.95 | 1.00 | 8.63 | 1.20 |
FGAN-35 | 42.05 | 45.4 | 0.96 | 11.51 | 3.35 |
FGAN-35 | 62.85 | 64.3 | 1.07 | 8.83 | 1.45 |
FGAN-36 | 13.05 | 18.05 | 0.89 | 11.76 | 5.00 |
FGAN-37 | 30 | 35.3 | 0.78 | 11.70 | 5.30 |
FGAN-38 | 27.25 | 33.15 | 0.89 | 11.69 | 5.90 |
FGAN-39 | 24.65 | 28.25 | 1.00 | 12.27 | 3.60 |
FGAN-40 | 35.6 | 39.25 | 0.80 | 11.08 | 3.65 |
FGAN-41 | 28.4 | 32.2 | 0.47 | 8.44 | 3.80 |
FGAN-42 | 34 | 37 | 0.78 | 10.65 | 3.00 |
FGAN-43 | 43.1 | 48.6 | 0.84 | 11.60 | 5.50 |
FGAN-44 | 30.55 | 33.85 | 0.79 | 10.45 | 3.30 |
FGAN-45 | 171.7 | 175.55 | 0.74 | 11.20 | 3.85 |
FGAN-46 | 222.75 | 224.1 | 1.12 | 9.85 | 1.35 |
FGAN-47 | 121.95 | 124.45 | 0.88 | 11.39 | 2.50 |
FGAN-47 | 142.35 | 143.4 | 1.03 | 8.95 | 1.05 |
FGB-26 | 121.95 | 140.25 | 0.47 | 8.45 | 18.30 |
FGB-27 | 61.3 | 66.55 | 0.45 | 8.83 | 5.25 |
FGB-27 | 72.95 | 76.05 | 0.57 | 8.73 | 3.10 |
FGB-27 | 179 | 195.1 | 0.74 | 12.98 | 16.10 |
FGB-28 | 36.35 | 50.05 | 0.41 | 8.50 | 13.70 |
FGB-28 | 192.95 | 208.3 | 0.76 | 15.85 | 15.35 |
FGB-29 | 52.1 | 61.85 | 0.51 | 8.87 | 9.75 |
FGB-29 | 185.15 | 187.15 | 0.43 | 9.92 | 2.00 |
FGB-29 | 187.95 | 192.15 | 0.68 | 13.51 | 4.20 |
FGBS-12 | 63.15 | 67.1 | 0.46 | 9.38 | 3.95 |
FGBS-14 | 24.75 | 29.65 | - | 9.35 | 4.90 |
FGBS-16 | 13.3 | 17.15 | - | 8.86 | 3.85 |
FGBS-17 | 37.35 | 40.1 | - | 9.72 | 2.75 |
FGBS-18 | 5.7 | 8.7 | - | 9.01 | 0.48 |
FGBS-18 | 21.05 | 32 | - | 8.21 | 0.43 |
FGBS-19 | 38.95 | 40.55 | - | 9.45 | 0.50 |
FGBS-19 | 54.35 | 58.45 | - | 8.29 | 0.49 |
FGBS-20 | 20.95 | 33.2 | - | 8.62 | 0.45 |
FGBS-20 | 33.65 | 35.35 | - | 8.10 | 0.41 |
FGBS-20 | 178.9 | 180.2 | - | 11.99 | 0.73 |
Drilling at NAN commenced June 24th and was completed on October 24th. The program consisted of 32 holes (Figure 10.10) for 8,187.65 m of drill core (Table 10-44). In total 8 diamond drill rigs were used at the deposit (rigs 245, 273, 274, 285, 309, 320, 337 and 507). They were available working with an average production rate of 481 meters per month for each drill rig.
Table 10-44: 2020 NAN Drilling Program
Hole ID | Easting | Northing | Elevation (m) | Av. Azimuth (°) | Av. Dip (°) | Length (m) | Year |
FNAN-88 | 320122 | 8493101 | 343.25 | 289 | -46 | 177.55 | 2020 |
FNAN-89 | 320174 | 8492995 | 344.61 | 290 | -43 | 250.35 | 2020 |
FNAN-90 | 320060 | 8493039 | 345.94 | 290 | -44 | 100.75 | 2020 |
FNAN-91 | 320172 | 8492612 | 355.06 | 300 | -59 | 430.80 | 2020 |
FNAN-92 | 320181 | 8492735 | 352.17 | 297 | -47 | 326.35 | 2020 |
FNAN-93 | 320178 | 8492909 | 344.75 | 294 | -44 | 263.80 | 2020 |
FNAN-94 | 320172 | 8492781 | 350.75 | 294 | -44 | 294.40 | 2020 |
FNAN-95 | 320059 | 8492954 | 341.38 | 294 | -43 | 111.35 | 2020 |
FNAN-96 | 320115 | 8492374 | 356.20 | 293 | -43 | 345.00 | 2020 |
FNAN-97 | 320081 | 8492301 | 354.88 | 295 | -45 | 337.10 | 2020 |
FNAN-98 | 319983 | 8492213 | 349.49 | 295 | -57 | 298.05 | 2020 |
FNAN-99 | 319949 | 8492183 | 347.13 | 299 | -57 | 277.65 | 2020 |
FNAN-100 | 319885 | 8492078 | 339.77 | 295 | -55 | 234.90 | 2020 |
FNAN-101 | 319874 | 8491997 | 337.81 | 295 | -56 | 259.30 | 2020 |
FNAN-102 | 319863 | 8491873 | 338.59 | 293 | -55 | 275.70 | 2020 |
FNAN-103 | 320007 | 8492282 | 352.52 | 293 | -58 | 293.70 | 2020 |
FNAN-104 | 319855 | 8491788 | 340.27 | 294 | -38 | 255.50 | 2020 |
FNAN-105 | 319818 | 8491717 | 339.51 | 294 | -42 | 252.55 | 2020 |
FNAN-106 | 319759 | 8491526 | 339.13 | 295 | -40 | 252.85 | 2020 |
FNAN-107 | 319793 | 8491641 | 338.16 | 295 | -44 | 286.30 | 2020 |
FNAN-108 | 319726 | 8491453 | 339.28 | 291 | -40 | 232.65 | 2020 |
FNAN-109 | 319920 | 8492134 | 343.16 | 293 | -58 | 269.05 | 2020 |
FNAN-110 | 320115 | 8492932 | 342.98 | 294 | -43 | 180.20 | 2020 |
FNAN-111 | 320118 | 8493016 | 346.55 | 292 | -45 | 177.40 | 2020 |
FNAN-112 | 320159 | 8492829 | 349.16 | 295 | -45 | 267.65 | 2020 |
FNAN-113 | 319870 | 8491956 | 337.29 | 297 | -55 | 279.50 | 2020 |
FNAN-114 | 320201 | 8492684 | 353.89 | 292 | -44 | 350.80 | 2020 |
FNAN-115 | 320108 | 8492977 | 343.00 | 289 | -42 | 162.80 | 2020 |
FNAN-116 | 320099 | 8492338 | 355.80 | 293 | -43 | 314.75 | 2020 |
FNAN-117 | 319834 | 8491754 | 339.67 | 296 | -42 | 263.25 | 2020 |
FNAN-118 | 320052 | 8492999 | 343.13 | 291 | -44 | 99.20 | 2020 |
FNAN-119 | 319861 | 8491829 | 339.69 | 293 | -41 | 266.45 | 2020 |

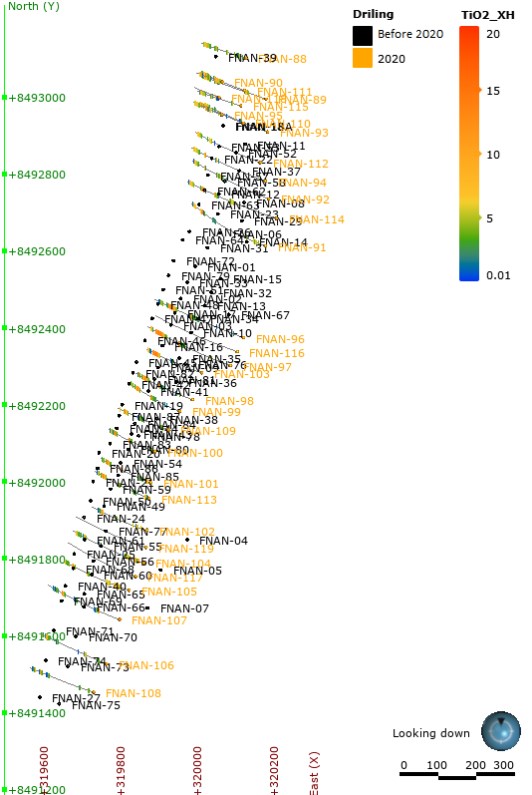
An Updated LOMP for Campbell Pit and Pre-feasibility Study for GAN and NAN Deposits | |
| December 16th 2021 | Page 154 de 474 |
 | Independent NI 43-101 Technical Report
NI 43-101 Technical Report |  |
Significant drill intercepts from this drilling are shown in Table 10-45 where mineralised intercepts ranged from 1m to 22.5 m with a weighted average 0.68%V2O5 and 8.07%TiO2 for samples with V and Ti content.
Table 10-45: 2020 NAN Drill Assay of Significant Result
Holeid | from | to | V2O5_XH | TiO2_XH | Interval (m) |
FNAN-88 | 12 | 13.9 | 0.57 | 5.97 | 1.90 |
FNAN-88 | 36.35 | 38.3 | 0.39 | 4.10 | 1.95 |
FNAN-88 | 114.5 | 117.55 | 1.15 | 12.23 | 3.05 |
FNAN-88 | 117.85 | 120.25 | 0.47 | 5.63 | 2.40 |
FNAN-88 | 120.8 | 123.15 | 0.32 | 4.12 | 2.35 |
FNAN-88 | 146.4 | 167.6 | 0.70 | 6.58 | 21.20 |
FNAN-89 | 73.4 | 81.05 | 0.78 | 9.05 | 7.65 |
FNAN-89 | 176.55 | 178.95 | 0.39 | 7.38 | 2.40 |
FNAN-89 | 188.15 | 192.3 | 0.90 | 10.44 | 4.15 |
FNAN-89 | 210.95 | 212.95 | 0.32 | 4.38 | 2.00 |
FNAN-89 | 213.95 | 236.45 | 0.69 | 6.23 | 22.50 |
FNAN-90 | 16.95 | 17.95 | 0.32 | 7.11 | 1.00 |
FNAN-90 | 18.95 | 25.8 | 0.51 | 9.28 | 6.85 |
FNAN-90 | 46.55 | 51.55 | 0.84 | 8.92 | 5.00 |
FNAN-90 | 51.8 | 52.85 | 0.51 | 6.27 | 1.05 |
FNAN-90 | 76.3 | 87.75 | 0.54 | 6.14 | 11.45 |
FNAN-91 | 357.4 | 372.2 | 0.89 | 11.38 | 14.80 |
FNAN-91 | 399.75 | 415.6 | 0.76 | 6.39 | 15.85 |
FNAN-91 | 418.4 | 419.4 | 0.41 | 6.14 | 1.00 |
FNAN-92 | 191.95 | 192.95 | 0.33 | 4.54 | 1.00 |
FNAN-92 | 202 | 203.6 | 0.38 | 9.26 | 1.60 |
FNAN-92 | 215.35 | 217.35 | 0.35 | 6.09 | 2.00 |
FNAN-92 | 269.65 | 272.55 | 0.82 | 9.92 | 2.90 |
FNAN-92 | 299.65 | 302.05 | 0.32 | 4.28 | 2.40 |
FNAN-92 | 303.7 | 319.2 | 0.63 | 5.93 | 15.50 |
FNAN-93 | 210.15 | 211.45 | 0.78 | 8.38 | 1.30 |
FNAN-93 | 231.5 | 233.5 | 0.33 | 4.64 | 2.00 |
FNAN-93 | 235.05 | 250.95 | 0.72 | 6.60 | 15.90 |
FNAN-94 | 193.65 | 196.85 | 0.61 | 8.48 | 3.20 |
FNAN-94 | 237.8 | 240.3 | 0.68 | 8.94 | 2.50 |
FNAN-94 | 264.95 | 266.45 | 0.31 | 4.42 | 1.50 |
FNAN-94 | 267 | 285.45 | 0.67 | 6.34 | 18.45 |
FNAN-95 | 46.2 | 47.5 | 0.47 | 9.07 | 1.30 |
FNAN-95 | 58.2 | 62.8 | 1.15 | 11.96 | 4.60 |
FNAN-95 | 87.4 | 88.4 | 0.36 | 5.07 | 1.00 |
FNAN-95 | 90.4 | 105.3 | 0.72 | 6.85 | 14.90 |
FNAN-96 | 37.55 | 40.4 | 0.58 | 7.03 | 2.85 |
FNAN-96 | 275.35 | 292.5 | 0.94 | 11.88 | 17.15 |
FNAN-96 | 313 | 314 | 0.33 | 4.53 | 1.00 |
FNAN-96 | 316.95 | 322.35 | 0.38 | 4.74 | 5.40 |
FNAN-97 | 77.1 | 80.45 | 0.47 | 5.99 | 3.35 |
FNAN-97 | 277.1 | 304.8 | 1.04 | 13.22 | 27.70 |
FNAN-97 | 316.7 | 322.95 | 0.90 | 6.76 | 6.25 |
FNAN-98 | 69.9 | 72.3 | 0.56 | 6.91 | 2.40 |
FNAN-98 | 248.15 | 259.3 | 0.57 | 13.06 | 11.15 |
FNAN-98 | 263.55 | 265.35 | 0.46 | 5.46 | 1.80 |
FNAN-98 | 277.65 | 278.65 | 0.31 | 4.17 | 1.00 |
FNAN-98 | 280.05 | 289.75 | 0.69 | 6.21 | 9.70 |
FNAN-99 | 231.2 | 237.2 | 0.36 | 12.52 | 6.00 |
FNAN-99 | 244.35 | 246.2 | 0.47 | 5.09 | 1.85 |
Holeid | from | to | V2O5_XH | TiO2_XH | Interval (m) |
FNAN-99 | 247.55 | 249.65 | 0.32 | 3.78 | 2.10 |
FNAN-99 | 251.75 | 252.75 | 0.33 | 4.17 | 1.00 |
FNAN-99 | 259 | 260 | 0.30 | 4.18 | 1.00 |
FNAN-99 | 262 | 271.2 | 0.62 | 5.65 | 9.20 |
FNAN-100 | 22.45 | 23.85 | 0.30 | 5.74 | 1.40 |
FNAN-100 | 199.25 | 208.2 | 0.68 | 10.52 | 8.95 |
FNAN-100 | 216.2 | 217.4 | 0.30 | 4.14 | 1.20 |
FNAN-100 | 218.9 | 228.2 | 0.68 | 6.10 | 9.30 |
FNAN-101 | 14.55 | 24.5 | 0.48 | 7.78 | 9.95 |
FNAN-101 | 50.15 | 51.15 | 0.47 | 8.00 | 1.00 |
FNAN-101 | 54.35 | 57.35 | 0.35 | 6.41 | 3.00 |
FNAN-101 | 224.55 | 234.7 | 0.67 | 10.02 | 10.15 |
FNAN-101 | 247.6 | 253.9 | 0.74 | 6.46 | 6.30 |
FNAN-102 | 26.65 | 27.65 | 0.31 | 8.46 | 1.00 |
FNAN-102 | 50.1 | 51.1 | 0.34 | 6.34 | 1.00 |
FNAN-102 | 223.65 | 228.65 | 0.62 | 13.33 | 5.00 |
FNAN-102 | 229.8 | 231.75 | 1.17 | 10.50 | 1.95 |
FNAN-102 | 236.4 | 239.2 | 0.45 | 5.01 | 2.80 |
FNAN-102 | 240.2 | 241.2 | 0.31 | 3.78 | 1.00 |
FNAN-102 | 245.4 | 246.55 | 0.33 | 3.88 | 1.15 |
FNAN-103 | 237.6 | 264.25 | 0.80 | 13.18 | 26.65 |
FNAN-103 | 278.1 | 286.05 | 0.77 | 7.16 | 7.95 |
FNAN-104 | 213.6 | 219.75 | 0.78 | 11.18 | 6.15 |
FNAN-104 | 227.45 | 230.4 | 0.47 | 5.06 | 2.95 |
FNAN-104 | 240.6 | 245.7 | 0.74 | 6.40 | 5.10 |
FNAN-105 | 213.9 | 220.35 | 0.95 | 12.78 | 6.45 |
FNAN-105 | 229.25 | 232.15 | 0.46 | 4.97 | 2.90 |
FNAN-105 | 242.85 | 246.4 | 0.85 | 6.98 | 3.55 |
FNAN-106 | 227.1 | 230.9 | 0.97 | 12.00 | 3.80 |
FNAN-106 | 239.85 | 242.55 | 0.42 | 4.72 | 2.70 |
FNAN-107 | 227.85 | 230.85 | 0.54 | 12.98 | 3.00 |
FNAN-107 | 246.6 | 253.4 | 0.39 | 4.27 | 6.80 |
FNAN-107 | 261.95 | 265.25 | 0.73 | 6.36 | 3.30 |
FNAN-108 | 196.75 | 200.25 | 0.78 | 12.27 | 3.50 |
FNAN-108 | 214.65 | 217.65 | 0.46 | 5.09 | 3.00 |
FNAN-108 | 222.2 | 224.15 | 0.65 | 6.36 | 1.95 |
FNAN-109 | 232.1 | 239.35 | 0.84 | 10.21 | 7.25 |
FNAN-109 | 257.2 | 262.25 | 0.76 | 7.21 | 5.05 |
FNAN-110 | 131.9 | 134.65 | 0.63 | 6.71 | 2.75 |
FNAN-110 | 155.1 | 172.2 | 0.68 | 6.46 | 17.10 |
FNAN-111 | 94.85 | 101.9 | 0.42 | 8.45 | 7.05 |
FNAN-111 | 115 | 119.15 | 0.87 | 9.47 | 4.15 |
FNAN-111 | 144.7 | 145.7 | 0.31 | 4.53 | 1.00 |
FNAN-111 | 146.9 | 165.05 | 0.63 | 6.16 | 18.15 |
FNAN-111 | 165.65 | 167.7 | 0.57 | 3.90 | 2.05 |
FNAN-112 | 206.15 | 208.05 | 0.40 | 5.28 | 1.90 |
FNAN-112 | 214.95 | 216.05 | 0.44 | 5.54 | 1.10 |
FNAN-112 | 241.1 | 258.8 | 0.63 | 6.05 | 17.70 |
FNAN-113 | 7.1 | 8.1 | 0.38 | 8.06 | 1.00 |
FNAN-113 | 9.1 | 10.4 | 0.32 | 6.67 | 1.30 |
FNAN-113 | 12.7 | 13.7 | 0.31 | 6.57 | 1.00 |
FNAN-113 | 23 | 24 | 0.31 | 6.45 | 1.00 |
FNAN-113 | 83 | 84 | 0.30 | 6.17 | 1.00 |
FNAN-113 | 234.35 | 237.45 | 0.68 | 13.43 | 3.10 |
FNAN-113 | 239 | 240.95 | 1.09 | 9.62 | 1.95 |
FNAN-113 | 242.3 | 243.4 | 0.64 | 6.39 | 1.10 |
FNAN-113 | 243.8 | 246.2 | 0.38 | 4.53 | 2.40 |
Holeid | from | to | V2O5_XH | TiO2_XH | Interval (m) |
FNAN-113 | 257.5 | 266.2 | 0.67 | 6.07 | 8.70 |
FNAN-114 | 279.9 | 295.9 | 0.90 | 10.73 | 16.00 |
FNAN-114 | 323.2 | 324.9 | 0.32 | 4.37 | 1.70 |
FNAN-114 | 325.95 | 344 | 0.71 | 6.39 | 18.05 |
FNAN-115 | 82.95 | 85.1 | 0.35 | 6.94 | 2.15 |
FNAN-115 | 105.75 | 111.3 | 0.81 | 8.35 | 5.55 |
FNAN-115 | 133.75 | 151.55 | 0.64 | 6.30 | 17.80 |
Drill holes were cased with HQ rods and reduced to NQ rods for normal drilling. On occasion, holes were downsized to BQ rods if drillers encountered downhole issue, but this was rare. The average recovery in all areas was above 97%.
The holes in NAN ore body were arranged further north and east of the main structure line to confirm the ore body at depth, as well as increase confidence in the longitudinal direction of interpretation.
The drilling updated the extent of NAN ore (magnetitite) to approximately 2.4 km strike length to an average vertical depth of 350 m.
All data collected were standardized in the UTM coordinate system in DATUM SIRGASS 2000. The magnetic anomalies identified by Largo drilling are within the regional context of the region. The drill programs confirmed the continuity of these magnetic anomalies reinforcing the potential of Largo's Near Mine Targets.
Also in 2020 the Largo drilled 15 holes totaling 2,474.95 m of core at the São José deposit (Table 10-46) and at Novo Amparo deposit the Company drilled 14 holes totaling 2,260.6 m of core (Table 10-47). The São José and Novo Amparo deposits are not part of the updated mineral resource or mineral reserve estimate in this report.
All drill rigs were demobilized from Maracás Menche Mine at the end of 2020.
Table 10-46: São José Drill Program
Campanha 2020-SJO |
hole_id | x | y | z | Length (m) | dip | azim |
FSJ-44 | 319305,955 | 8488080,620 | 336,151 | 300,5 | -48.2 | 289.45 |
FSJ-45 | 319337,153 | 8488184,927 | 333,948 | 284,35 | -44.92 | 287.75 |
FSJ-46 | 319192,028 | 8488145,613 | 331,401 | 178,05 | -45.08 | 287.95 |
FSJ-47 | 319284,659 | 8488371,678 | 325,229 | 151,2 | -44.48 | 289.13 |
FSJ-48 | 319004,572 | 8488220,428 | 323,849 | 202,55 | -47.56 | 289.11 |
FSJ-49 | 318787,023 | 8488157,623 | 318,943 | 101,25 | -42.27 | 291.45 |
FSJ-50 | 318878,822 | 8488197,347 | 318,051 | 148,2 | -45.09 | 291.58 |
FSJ-51 | 319387,586 | 8488336,399 | 326,699 | 250 | -44.94 | 290.74 |
FSJ-52 | 318964,711 | 8488198,313 | 321,457 | 201,8 | -56.83 | 291.14 |
FSJ-53 | 318884,21 | 8488309,609 | 320,748 | 100,65 | -44.07 | 288.1 |
FSJ-54 | 319052,323 | 8488316,423 | 320,178 | 195,7 | -45.19 | 289.52 |
FSJ-55 | 318993,848 | 8488525,699 | 325,092 | 70,75 | -44.5 | 290.31 |
FSJ-56 | 319013,881 | 8488594,746 | 326,463 | 68,75 | -45.2 | 290.96 |
FSJ-57 | 319056,426 | 8488472,099 | 323,404 | 140,4 | -46.84 | 289.35 |
FSJ-58 | 319037,822 | 8488625,703 | 326,29 | 80,8 | -44.29 | 291.59 |
Table 10-47: 2020 Novo Amparo Drill Program
hole_id | x | y | z | Length (m) | dip | azim |
FNA-46 | 319253.416 | 8489997.123 | 340.426 | 143.20 | -44.36 | 289.91 |
FNA-47 | 319221.453 | 8489898.342 | 340.713 | 144.65 | -44.68 | 289.79 |
FNA-48 | 319160.930 | 8489634.515 | 332.685 | 150.70 | -45.66 | 290.23 |
FNA-49 | 319179.738 | 8489740.689 | 336.36 | 149.60 | -45.95 | 291.56 |
FNA-50 | 319452.675 | 8489758.651 | 337.655 | 144.20 | -45.43 | 289.48 |
FNA-50A | 319453.380 | 8489758.380 | 337.503 | 181.70 | -65.79 | 286.99 |
FNA-51 | 319433.474 | 8489701.321 | 335.705 | 142.55 | -44.52 | 291.59 |
FNA-52 | 319491.033 | 8489893.654 | 337.294 | 173.05 | -49.22 | 290.33 |
FNA-53 | 319479.998 | 8489844.423 | 337.826 | 156.80 | -49.19 | 289.9 |
FNA-54 | 319669.637 | 8489708.669 | 343.162 | 191.65 | -45.92 | 288.58 |
FNA-55 | 319676.858 | 8489748.062 | 342.348 | 200.50 | -46 | 289.6 |
FNA-56 | 319451.354 | 8489654.498 | 336.470 | 161.70 | -45.62 | 289.81 |
FNA-57 | 319481.645 | 8489939.670 | 337.572 | 129.20 | -46.07 | 288.73 |
FNA-58 | 319397.653 | 8489548.98 | 338.232 | 191.10 | -65.2 | 291.46 |
The geological description process was realized in a rented warehouse near of the Campbell Pit. This location served as the basis for Largo's exploration team. The description of the core occurred outside of the warehouse on racks built specifically for this stage.
The core was stored in wooden core boxes with lids and delivered daily in the warehouse. After being received, recorded and photographed, the boxes were set up on core racks for logging and other geotechnical activities.
Lithologies, mineralized zones and geotechnical observations (rock quality and RQD) were marked with pencils on the core box, as well as in the standard description worksheet used by the Largo team. All core were submitted to magnetic susceptibility analysis.
Figure 10.11 shows 2020 Drillng Campaign Map of Menchen Maracás Project.
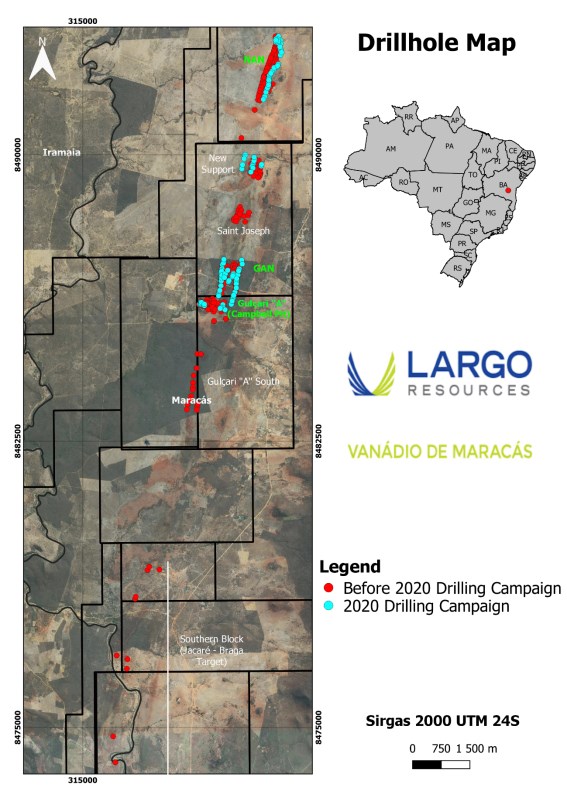
Figure 10.11: 2020 Drillng Campaign Map of Menchen Maracás Project.
11 SAMPLE PREPARATION, ANALYSES, AND SECURITY
QP assessed all data and interpretation available, as Largo has kept the main procedures unchanged, this assessment represents QP's opinion over all campaigns.
11.1 Sampling Method
11.1.1 Previous Operators
This following section has been reproduced in its entirety from the report titled "Technical Report of the Feasibility Study for the Maracás Vanadium Project, Brazil" by AkersSolutions in 2009, as fully cited in Chapter 27 - "References". GE21 has verified the accuracy of the information contained herein and updated as required.
Sampling of mineralization within the Study area by previous operators has been conducted by both diamond-drilling and trench-sampling methods.
The actual sampling method and approach carried out by CBPM (1981 and 1983) is not known by Largo. However, during Largo's visit to the core facility, it was observed that the drill core had been carefully sawn in half with all of the drill holes at Maracás available for review in the core warehouse. The remaining half showed the core to be very competent. It is believed by Largo, given the competent nature of the rock, together with clearly-marked sample intervals, that careful sampling procedures were carried out and that the sampling method had been conducted in a professional manner. Micon visited the core shed and spent several days reviewing the core. Nothing viewed during the visit would cause Micon to come to a different conclusion. Sampled intervals were easy to identify and the core was in good condition.
Personal communication between R. A. Campbell and Marcos Nunes, then Project Geologist for Odebrecht, described the drill-core sampling procedures for 1984 through 1987, as set out below.
"Drill core was split using a diamond blade tile saw. The core pans were cleaned between each split sample. The remaining half of the core sample was returned to the core box. Half the core was then bagged along with its corresponding sample tag and bagged for shipment. Commercial trucking shipped the core samples to GEOSOL's Laboratory (1983 to 1987), Paulo Abib Engenharia S.A. laboratory (1985 to 1987) both in Belo Horizonte. Core trays with the remaining half core sample were placed in core racks at the exploration office in Maracás and remain intact for future reference."
"During the Odebrecht drilling programs samples were crushed, ground completely to pulp passing - 150 mesh and then split at the GEOSOL and Paulo Abib Engenharia S.A.'s preparation facilities in Belo Horizonte, Brazil. The split pulps were then analyzed by XRF method also in GEOSOL and Paulo Abib Engenharia S.A.'s laboratory in Belo Horizonte."
"The sample core length was 2.0 m in all cases in past sampling programs. The layered nature of the deposit and thicknesses of the mineralized zone from 4 to 100 m justified this interval. The potential mining method of large tonnage open pit was also considered when selecting sample intervals. Smaller intervals would only be taken if there was a particular geological reason to do so."
"Channel samples were also cut on 2.0 m intervals and usually no greater than this, due to the large amount of material generated. Channel intervals were also governed by topography and geology so their lengths varied on occasion."
11.1.2 2006 and Early 2007 Re-logging
At the time of preparation of the mineral resource estimate used in this study Largo had drilled no core of its own. It had only re-sampled old drill holes from earlier programs.
In collecting its samples, Largo split all core using a diamond blade tile saw. Half of the core was placed in a numbered plastic sample bag with the sample tag. The remaining half core was returned to the core box. A brick was briefly sawn between each sample cut, in order to clean the blade and prevent any contamination between samples.
The half core was then sealed in the bags along with its corresponding sample tag. The sample bags were placed into larger "rice" bags, in groups of 15 samples, for shipment. The samples were transported in a company-operated vehicle from the office in Maracás to Salvador, where they were handed over to a commercial transport company for truck delivery to SGS Geosol Laboratorios Ltda. (SGS) in Belo Horizonte. The core trays with the remaining quarter-core were placed in core racks at the core storage facility/office in Maracás, so as to be available for future reference.
The sampled core length was 2.0 m in all cases, in order to duplicate past sampling programs. Largo agreed that the layered nature of the deposit and thicknesses of the mineralized zone from 2 to 100 m justified this interval.
11.1.3 2007 Exploration Drill Program
This following section has been reproduced in its entirety from the report titled "Technical Report of the Feasibility Study for the Maracás Vanadium Project, Brazil" by AkersSolutions in 2009, as fully cited in Chapter 27 - "References". GE21 has verified the accuracy of the information contained herein and has updated as required.
Sample boundaries were marked up by the geologists during the logging process. Generally, core was selected for sampling based on magnetite content or nearby strong alteration. Intervals to be sampled were marked in red lumber crayon. The beginning of each sample interval was marked on the edge of the core box with a felt tip marker and with a sample tag, affixed to the box with a staple, at the end of the interval. Overall about 45% of the core drilled was sampled.
Sampling commenced several meters prior to the beginning of mineralization and proceeded down to the hole, usually at 1-m intervals, until a major lithologic contact. Sampling did not cross these contacts. Sample intervals could be shortened or lengthened depending on these observations. Magnetite and magnetite-pyroxenite were generally sampled separately, if the magnetite bands were approximately 1 m in size or larger.
Samples were collected by sawing the core in half with a diamond blade tile saw at the logging facility. Once sawn, the half core was placed in a numbered plastic sample bag with the corresponding sample tag. The remaining half core was returned to the core box. A brick was briefly sawn between each sample cut, in order to clean the blade and prevent any contamination between samples. The sample bags were placed into larger plastic containers, in groups of 15 samples, for shipment. The samples were transported in a company-operated vehicle from the office in Maracás to Jequié where they were handed over to a commercial transport company for truck delivery to SGS in Belo Horizonte.
Logged and sampled core boxes were stored in a roofed, fenced-in enclosure with a concrete floor and knee wall, within the fenced yard of the farmhouse.
These procedures continued to be used in the 2008, 2011-2012 drilling programs and 2012 infill drilling program.
11.1.4 2018 Largo Core Drill Program
During the geological logging of drill core, the exploration team (geologists) marked the sampling intervals with their corresponding identification in the core box. In general, the sample was selected based on the magnetite content (Kappa Measurement) or based on contacts between guiding mineralization lithologies. Before and after core removal for sampling, all core boxes were photographed. All this data was stored in MS Excel digital files.
After sample intervals were marked, the core was sent to be sawn in half by diamond blades (Figure 11.1). The sampling interval defined was 1m (≈ 3kg), following the same pattern as previous programs. After being cut, an identified half went to the laboratory (batches), and the second part was returned to the core box to be stored in the shed and available for further investigation. The transportation to SGS laboratory in Belo Horizonte-MG was made by road by an outsourced company.
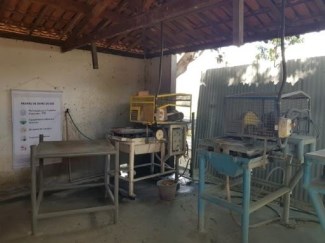
Figure 11.1:Largo core cutting facility for the 2018-2019 Exploration Program.
QP visited the core shed and no noncompliance was seen during that visit. The intervals sampled were easy to identify and the core was in good condition.
The core boxes were properly stored at a Largo rented farm next to Campbell Pit (Figure 11.2).
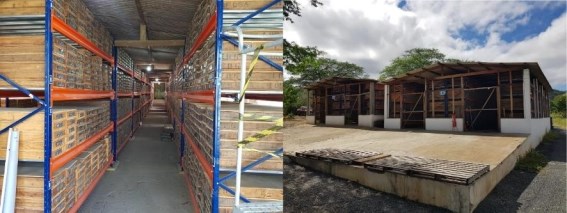
Figure 11.2:Largo Core Shed in the 2018-2019 Mineral Exploration.
.
11.1.5 2019 Largo Core Drill Program
The 2019 sampling method was the same of 2018 drilling campaign.
GE21 QP visited the core shed and no noncompliance was seen during that visit. The intervals sampled were easy to identify and the core was in good condition. The core boxes were properly stored at a Largo rented farm next to Campbell Pit.
11.1.6 2020 Largo Core Drilling Program
As holes are being drilled, filled core boxes are delivered by the drilling company directly to the core shed in a location specified by the geologist responsible.
The receipt and registration, and storage of core at the central core facility followed the same acceptable procedures as the previous programs. The box number, final depth, footage markers with depth/feed/recovery of each box are checked. All core boxes are photographed (both whole core and half sawn core) and magnetic susceptibility measurements are made every 25 cm over the length of the entire length of each drill hole.
After geological descriptions are completed, sample intervals are determined by geologists based on a number of geological factors. The sample intervals are marked on the core and on the core box as well with sample tickets stapled to the box.
The drill core is hand sawn by assistants using electrical core cutting saws with diamond blades. The sampling interval is generally 1 m in length (≈ 3 kg). This follows the same procedures as Largo's previous exploration programs.
After sawing, half of the sample was placed in a plastic bag identified with the corresponding sample label. The other half was returned to the core box. A clay brick was sawed briefly between each sample cut in order to clean the blade and avoid any contamination between samples. The sample bags are collected in batches were placed in larger plastic containers and transported to the ALS laboratory in VESPASIANO-MG.
The remaining core boxes are stored at the core facility at just south of the mine complex and is available for future reference.
GE21 QP visited the core shed and no noncompliance was seen during that visit. The intervals sampled were easy to identify and the core was in good condition. The core boxes were properly stored at a Largo rented farm next to Campbell Pit.
11.2 Chemical Sample Preparation, Analyses and Security
11.2.1 Pre-2006 Analytical Work
Most Part of this section has been reproduced in its entirety from the A Preliminary Assessment of The Maracás Vanadium Project (2007), Bahia State, Brazil by Micon, as fully cited in Chapter •27 - "References". GE21 has verified the accuracy of the information contained herein and updated as required.
Personal communication between R. A. Campbell and Mr. Marco Nunes also described the sample preparation and analytical protocols in use prior to Largo's involvement in the Project, but after 1983. According to Nunes, CBPM and Odebrecht used GEOSOL and Paulo Abib Engenharia S.A. as their analytical laboratories during the 1981 to 1983 exploration programs and again between 1984 and 1987. Their procedures were summarized as follows.
"A total of 1,675 core samples were prepared at GEOSOL and Paulo Abib Engenharia S.A.'s laboratories in Belo Horizonte, Brazil. These core samples were packaged in batches of 40 samples which included two replicates, one reference standard and one blank, inserted randomly. All samples underwent standard crushing and pulverizing techniques. The entire drill sample was passed through a primary crusher to yield a fine crushed product, with better than 75% of the sample passing 2 mm. When the crushed sample yielded approximately 2 kg the entire sample was pulverized."
"A crushed 2 kg sample was ground using a ring and puck mill pulverizer. The pulverizer uses a chrome steel ring and puck set. All samples were pulverized to over than 95% of the ground material passing through a -150-mesh screen. Grinding with chrome steel may impart trace amounts of iron and chromium into the sample."
"Core samples were then analyzed at GEOSOL and Paulo Abib Engenharia S.A.'s laboratories in Belo Horizonte, Brazil. All samples were analyzed for FeO, Fe2O3, SiO2, TiO2 and V2O5. Routinely, a sample weight of 0.66 grams was fused with 7.2 g of flux to prepare each bead. However, there were variations to this ratio for some matrices, giving a lower limit for detection of 0.01% and an upper limit of detection of 5.0% for V2O5. Samples were fused into a glass disc using a Lithium Borate flux much as described for normal fused glass beads. For "ore grade", materials flux composition and sample/flux ratios were varied to ensure all of the sample dissolves and that recrystallization does not occur as the melt is cooled."
The CBPM and Odebrecht sample pulps are still available to Largo. They have been placed in storage in the office in Maracás. While not climate-controlled storage, the sample pulps are protected from direct exposure to the elements and sunlight in a secure location.
11.2.2 Largo Analytical Work (2007, 2008 and 2011-2012)
Most Part of this section has been reproduced in its entirety from the technical report titled " Technical Report of the Feasibility Study for the Maracás Vanadium Project, Brazil" by AkersSolutions, 2012 as fully cited in Chapter 27 - "References". GE21 has verified the accuracy of the information contained herein and updated as required.
All sample preparation and primary analyses of drill core from the 2006/2007 resampling program and the 2007, 2008 and 2011-2012 drilling programs were performed by SGS in Belo Horizonte, Brazil and Lakefield, Ontario. During 2012 infill drilling program, both SGS in Belo Horizonte, Brazil and Intertek in Cotia, Brazil were used for sample preparation and analyses. Originally, the samples were analyzed for FeO, Fe2O3, SiO2, TiO2 and V2O5 by the XRF method and for platinum and palladium by a 50 g fire-assay technique at SGS. This was changed to a 20 g fire assay for the 2007 and later drilling programs, as a result of some initial problems with flux and the amount of magnetite in some of the samples. The XRF method gives a lower limit of detection of 0.01% V2O5.
SGS claims that their quality assurance system "complies with the requirements of the international standards ISO 9001:2000 and ISO 14001:2004 to chemical analysis and geochem of soils, rocks and ores" (SGS Minerals, 2006). Intertek also claims that their quality assurance system complies with the requirements of the international standards ISO 9001:2008 to chemical analysis and geochemistry of soils, rocks and ores
Core samples were prepared similarly at both labs using the following protocol:
- weigh, dry and reweigh sample;
- primary crush to -2 mm (70% passing);
- pulverize split fraction to -150 mesh in chrome steel ring mill pulverizer.
The fire-assay procedure employed for platinum and palladium used a 50 g aliquot (later changed to 20 g as described above) with aqua regia digestion, followed by an atomic absorption (AA) spectroscopy finish. Since this was a check sampling program, there were no field duplicates and field blanks inserted by Largo for this resampling program.
Both labs (SGS and Intertek) prepared and analyzed its own laboratory duplicates and inserted its own internal reference standards and blanks. Largo reviewed the quality control data files from both labs, which were verified by the Largo staff member responsible. Also, the Largo staff member made a site visit to each facility to inspect and review the procedure on-site at least one time during the program. There were no abnormalities detected in either the procedures or the results. SGS has ISO/IEC 17025 accreditation for its mineral analytical services.
11.2.3 2015 Davis tube work
Most of this section has been reproduced in its entirety from the technical report titled "An Update Mine Plan and Mineral Reserve for Maracás Menchen Project, Bahia State, Brazil by Micon (2016), as fully cited in Chapter 27 - "References". QP has verified the accuracy of the information contained herein and updated as required.
In June 2015, Largo staff seeking to improve their understanding of vanadium in the ore at the Campbell, started a program of Davis Tube test work to determine the magnetic percentage and the V2O5 grade and SiO2 grade in the magnetic concentrate.
Davis tube testing is considered by metallurgists to be a simulation of industrial wet magnetic separation. The test is a two-stage process, a pulverizing step and the Davis Tube wash. Davis Tube tests use an electromagnet to separate material into magnetic and non-magnetic/paramagnetic fraction. The DTR test generates the weight recovery/magnetic iron content, or proportion of the deposit which is magnetite and the "probable" grade of concentrate at a given grind size. The quality of a vanadium-bearing titanomagnetite Davis tube concentrate is process-sensitive depending on the feed size and as well on other parameters like magnetic field strength, current intensity, tube oscillation, tube inclination and wash-water rate during the test work.
The program was completed by September 2015 using the facilities of SGS Geosol and an-instrument purchased by Largo (see Figure 11.3 to Figure 11.5). A total of 7,567 pulp-samples were collected from the previous drilling programs. These samples were stored in a secure lock storage area at Largo's exploration camp near the mine site. The samples were collected and packaged into large plastic crates, labeled and strapped down securely, for shipping. A local shipping company picked up the crates and transported them to SGS's facility in Vespasiano suburb in Belo Horizonte. For pulp and coarse reject samples the amount sent was approximately 100 g. The grind size of the stored pulps was, according to historical information, always 95% passing 106 microns. In case any of the pulp samples were not available (lost), coarse reject fractions were chosen. In the event of both missing pulp and reject samples a quarter of the core was sampled at the core facility. This happened exclusively on historical CBPM holes, where most of the pulps and coarse reject fractions are systematically missing.
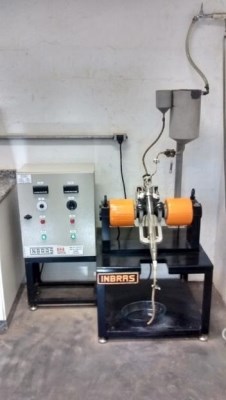
Figure 11.3:Largo's First Davis Tube Device During Implementation on Site.
Source: Micon (2016)
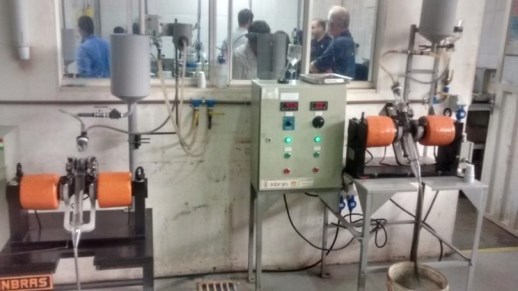
Figure 11.4:Two Davis Tube devices at SGS Geosol in Belo Horizonte.
Source: Micon (2016)
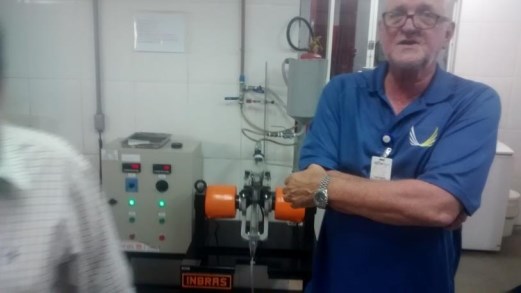
Figure 11.5:Largo Staff During Site Visit at SGS (24th August 2015).
Source: MIcon (2016)
The sample preparation process was as follows:
sample all pulps (p) + rejects (r) + core (c);
received sample weighing (p + r + c);
drying at 105°C (p + r + c);
crush to 90% passing 3 mm (c);
split sample with riffle splitter (c);
pulverize 250-300 g to 95% passing 106 microns (c);
pulverizing - quality control test (p + r + c);
The following are the specifications and settings used for the Davis tube equipment:
Feed sample mass: 30 g
Tube inclination: 45°
Initial tube oscillation: 30 rpm
Final tube oscillation: 60 rpm
Wash-water rate: 540 l/min.
Magnetic field strength: At the beginning, during the sample feeding procedure in the glass tube, is applied 3,700 Gauss (1.6A) to avoid premature loss of the sample mass. After the entire sample is added the test began applying 1,480 Gauss (0.5A);
Davis tube washing period: 20 to 30 minutes (dependent on the degree of difficulty for washing the sample).
QA/QC sampling protocol was implemented whereby a pulp duplicate and one certified standard were inserted into every 40-sample batch.
11.2.4 2018-2019 Chemical Assay Preparation, Analyses and Security
Largo core samples were prepared and analyzed by SGS in an ISO 9000-2001 certified laboratory. The main analysis procedures performed in this laboratory in Belo Horizonte, Minas Gerais were:
Titration with Potassium Dichromate;
Fire Assay - ICP;
LOI: Loss by fire - Calcination of samples at 405 °C / 1000 °C;
Fusion with lithium tetraborate - X-Ray Fluorescence;
Davis Tube;
Pulp samples were also analyzed for V2O5 using an atomic absorption fire-assay technique. The selected samples were subsequently sent for multiple element analysis by ICP spectrometry as previously described.
11.2.5 2020 Chemical Assay Preparation, Analyses and Security
Largo core samples were prepared and analyzed by ALS in a laboratory that operates under the ISO 17025 quality management system. The physical preparation of the sample was made by ALS with sample registration in the tracking system, drying, crushing of the entire sample up to 70% < 2 mm (-10 #); the crushed samples are quartered using a riffle splitter to obtain a sub sample of approximately 250 g. The sub-sample is pulverized to 85% < 75 microns (-200 #).
The main analysis procedures performed in this laboratory were:
11.3 Density Determination
11.3.1 Until 2015
Most of this section has been reproduced in its entirety from the technical report titled "Technical Report the Largo Maracás Vanadium Project, 1 Million Tonnes per Year Processing Plant, Brazil by RungePincockMinarco (2012), as fully cited in Chapter 27 - "References". The QP has verified the accuracy of the information contained herein and updated as required.
The mass density or density of a material is defined as its mass per unit volume. Mathematically, density (ρ) is defined as mass (m) divided by volume (V). From this equation, mass density must have units of a unit of mass per unit of volume (e.g. g/cm3, kg/m³, etc.).
The Archimedes principle was used to determine the density, further reasoned that if the liquid in this volume were removed and replaced by an object of exactly the same size and shape as this liquid portion, none of the liquid pressure forces acting on its surface would change. Because the object is exactly the same shape and volume as the fluid removed, it would fit exactly into the previous volume without compressing the surrounding fluid. Therefore, Archimedes (287 - 212 B.C) had concluded that the net buoyant for B upward on any object immersed in a fluid is equal to the weight of the fluid displaced.
Up until 2015, all of Largo's Density samples were analyzed in Federal University of Bahia State, using Archimedes principle. Some of this procedure is illustrated in Figure 11.6. The results are shown in Table 11-1.
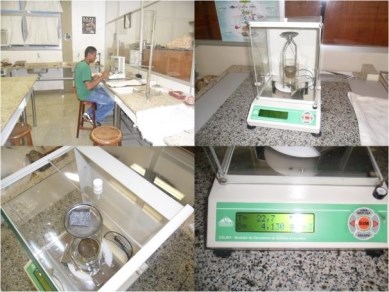
Figure 11.6:Density Determination by Archimedes Principle (until 2015).
Source: Pincock, (2012)
Table 11-1:Density Summary (until 2015).
Target | Lithology | Number of Samples | Density (g/cm3) |
NOVO AMPARO | MAGNETITITO | 26 | 4.36 |
MAGNETITA GABRO | 11 | 3.38 |
GABRO | 11 | 3.00 |
ANORTOSITO | 3 | 2.88 |
PEGMATITO | 2 | 2.61 |
NOVO AMPARO NORTH | MAGNETITITO | 30 | 4.26 |
MAGNETITA GABRO | 11 | 3.33 |
GABRO | 11 | 3.06 |
ANORTOSITO | 5 | 2.86 |
PEGMATITO | 3 | 2.6 |
SÃO JOSE | MAGNETITITO | 19 | 4.3 |
MAGNETITA GABRO | 13 | 3.33 |
GABRO | 9 | 3.05 |
ANORTOSITO | 3 | 2.84 |
PEGMATITO | 3 | 2.58 |
GULÇARI A NORTH | MAGNETITITO | 14 | 4.28 |
MAGNETITA GABRO | 12 | 3.32 |
GABRO | 8 | 3.03 |
ANORTOSITO | 5 | 2.84 |
PEGMATITO | 2 | 2.62 |
GULÇARI B | MAGNETITITO | 15 | 4.42 |
MAGNETITA GABRO | 14 | 3.35 |
GABRO | 3 | 2.90 |
ANORTOSITO | 1 | 2.83 |
PEGMATITO | 2 | 2.63 |
(Source: Pincock, 2012)
Most Part of this section has been reproduced in its entirety from the report titled "An Update Mine Plan and Mineral Reserve for Maracás Menchen project (2016), Bahia State, Brazil by Micon, as fully cited in Chapter •27 - "References". QP has verified the accuracy of the information contained herein and updated as required.
In 2015 Largo acquired their own density determination equipment and started making measurements with in-house staff. They used the water immersion method on diamond core sections with a digital density scale (Gehaka DSL 910). Best care and attention were taken by staff as of June 1, 2015. (Micon, 2016)
A total of 297 core samples were measured to determine the specific gravity of the various ore and waste rock domains and these were added to Campbell's density database. In Micon (2016) report the Largo showed a summary of the Specific Gravity (SG) according to this new series of measurements and the new domain classification is presented in Table 11-2
Table 11-2:Average Specific Gravity for the Campbell deposit, Largo Data 2016.
Rock Type | Rock Code | Number of Samples | Average SG |
Massive and banded magnetite 1 | 10 | 97 | 4.38 |
Massive and banded magnetite 2 | 11 | 39 | 4.24 |
Massive and banded magnetite 3 | 12 | 4 | 4.14 |
Massive and banded magnetite 4 | 13 | 5 | 4.17 |
Magnetite-pyroxenite 1 | 20 | 116 | 3.52 |
Magnetite-pyroxenite 2 | 21 | 21 | 3.60 |
Magnetite-pyroxenite 3 | 22 | 3 | 3.58 |
Magnetite-pyroxenite 4 | 23 | 3 | 3.46 |
Pyroxenite | 25 | 98 | 3.23 |
Magnetite Gabbro | 40 | 13 | 3.37 |
Gabbro | 45 | 130 | 3.01 |
Anorthosite | 50 | 16 | 2.78 |
Pegmatite | 80 | 64 | 2.58 |
Overburden | 90 | 0* | 1.80* |
Source: Micon (2016)
*According to operating experience during Campbell operation and as in Coffey (2012) for the Satellite.
In Total, between 2016 and 2019 Largo completed 1555 density determinations in Campbell Pit, GAN and NAN deposits. Table 11-3 summarizes average density obtained in database of this campaign.
Table 11-3:Average Specific Gravity from 2016 to 2019, Largo Database.
2012-2019 | average (g/cm3) |
Rock Type | GA (906 samples) | GAN (330 samples) | NAN (319 samples) |
ANO | 2.77 | 2.83 | 2.81 |
GAB | 3.08 | 3.09 | 3.1 |
GCM | | 3.21 | 3.22 |
GPS | | | |
MAG | 4.39 | 4.2 | 4.32 |
MGB | | 3.51 | 3.5 |
MGTGAB | | 3.26 | 3.28 |
MGPYXT | 3.47 | 3.82 | 3.51 |
MPXT | | 3.62 | 3.62 |
PEG | 2.58 | 2.62 | 2.59 |
PYXT | 3.23 | 3.34 | 3.23 |
PXTM | | 3.36 | 3.36 |
11.3.2 2020 Determination Density (by Pycnometer)
In the 2020 campaign, density was determined by specific mass of pulps using a pycnometer, another density method also to validate the previous determinations. This pycnometer was performed at the ALS GLOBAL Laboratory in Vespasiano- MG.
Largo obtained 601 density determinations considering different lithotypes and magmatic cycles for Gulçari A (Campbell Pit) with 143 samples, NAN with 229 samples and GAN with 229 samples. These data were entered in the database duly identified for future use. Table 11-4 summarizes density values by pycnometers determined in 2020.
Table 11-4:Average Specific Gravity for deposits, 2020 Pycnomter Data.
| Average (g/cm3) |
Rock Type | Campbell Pit (143 samples) | GAN (229 samples) | NAN (229 samples) |
ANO | 2.76 | 2.75 | 2.76 |
GAB | 3.02 | 3.00 | 3.04 |
GCM | 3.16 | 3.14 | 3.10 |
GPS | | 2.62 | 2.67 |
MAG | 3.95 | 3.97 | 3.95 |
MGB | 3.52 | 3.42 | 3.30 |
MPXT | 3.67 | 3.48 | 3.61 |
MPXT | 3.78 | | |
PEG | 2.70 | 2.69 | 2.52 |
PXT | 3.27 | 3.13 | 3.15 |
PXTM | 3.22 | 3.28 | 3.32 |
11.4 Largo QAQC program
This section has been reproduced in its entirety from the technical report titled "A Preliminary Assessment of The Maracás Vanadium Project, Municipality of Maracás , Bahia State, Brazil." by Micon 2007, as fully cited in Chapter 27 - "References". The QP has verified the accuracy of the information contained herein and updated as required.
11.4.1 Pre-2006 program
It is reported that CBPM and Odebrecht made use of replicate and blank samples along with reference standard materials during their sampling and assaying programs. No detailed results are available for the results of these programs. Therefore, before using the data in a resource estimate, Largo decided to conduct a check sampling program on approximately 8% of the mineralized core. That program is described the following.
11.4.2 2006 program
Largo's drill core re-sampling program was conducted during May 2006 in order to verify the precision of the V2O5 grades reported during the 1981 through 1987 drill campaigns. It was also used to provide additional data on the PGM content of the mineralization. A total of 123 quartercore samples from 8 drill holes (7.3% of samples) were analyzed. Check analyses were systematically completed at a second laboratory during the re-sampling program.
The original analyses were done at GEOSOL and Paulo Abib Engenharia S.A. laboratories in Belo Horizonte, Brazil between 1981 and 1987. The 2006 duplicate sample analyses were conducted at SGS Minerals laboratories, both in Belo Horizonte, Brazil and Lakefield, Ontario. Every effort was made to use similar techniques and sample sizes in order to compare results. Check analyses on the 2006 duplicate samples were analyzed by Ultra Trace Analytical Laboratories in Perth, Australia (Ultra Trace). A total of 25 pulp samples (20%) from the resampling program were sent to Ultra Trace for analysis to compare against the duplicate results. Again, every effort was made to use similar techniques.
The duplicate samples sent to SGS were analyzed for the major oxides (FeO, Fe2O3, SiO2, TiO2 and V2O5) using borate fusion XRF. The lower detection limit for V2O5, for this method, was 0.01% while the upper limit was 5%. Elements were reported as oxides. The samples were also analyzed by SGS for platinum and palladium by fire assay with an AA finish on a 50-g sample. Internal quality control procedures included duplicate and blank sample and certified reference material analysis. These data were used to check the analytical reproducibility and precision of the assays.
Ultra Trace's XRF method used a fusion technique, with a high-energy X-ray instrument. The resulting detection limits are reported to often be better than those obtained by pressed methods on older instruments. The lower detection limit for V2O5 was 0.01% while the Upper limit was 5%. A sample weight of 0.66 g was fused with 7.2 g of flux to prepare each bead. However, there are variations to this ratio for some matrices. Samples were fused into a glass discusing a lithium borate flux much as described for normal fused glass beads. For ore grade materials, flux composition and sample/flux ratios are varied to ensure the entire sample dissolves and that re- crystallisation does not occur as the melt is cooled.
Two comparisons of the results were carried out:
In both cases, the agreement is generally good. Overall there is little evidence of any systematic or conditional bias. The correlation coefficient between the original samples and the duplicate samples is 0.84 a number considered reasonably good for quarter-core field duplicate samples. Any variability in the sample results can be attributed to a number of conditions including differences in sample mass or half core versus quartered core. This is partly confirmed by the comparison of the SGS duplicate samples and the check sample results of the pulps from Ultra Trace where the correlation coefficient is 0.89.
It is therefore concluded that the analytical reproducibility is satisfactory, and that the analytical accuracy is equally acceptable. Consequently, Largo chose to use the original assay data for the geostatistical analysis.
Micon concurs with Largo's decision and concludes that the data are suitable for use in the resource estimate presented herein. Micon understands that Largo intends to continue sampling the core in order to get more data on PGM content. It is recommended that, while doing this, Largo continue with the practice of assaying for vanadium pentoxide as well.
11.4.3 Early 2007
In accordance with the recommendations made in Micon's December, 2006 Technical Report (Hennessey, 2006), Largo has continued with a program of resampling of old drill core from the Campbell deposit.
The results, which are graphed on Figure 11.7 below show generally good agreement clustered about the 45° black reference line, with the exception of a clustered group of data (see red ellipse) appearing to fall on a flatter line of about 30° dip. Further investigation revealed that all of these data points were from drill hole FGA-41.
Figure 11.8 shows a similar graph with the results of hole FGA-41 removed from the analysis. The red fitted trend line shows agreement is extremely close with y = 0.97x and a correlation coefficient of 0.92. The data are generally clustered about the black 45° reference line. Micon concludes that something went awry in the analysis of this hole, possibly a calibration or dilution issue with the readings taken in the laboratory.
As a result of this analysis, it was decided that drill hole FGA-41 should be removed from the database and the block model re-interpolated. The resulting mineral resource estimate was essentially identical in tonnage to that published in Hennessey (2006) and the V2O5 grade dropped marginally from 1.37% to 1.35%, a difference of only 1.5%.
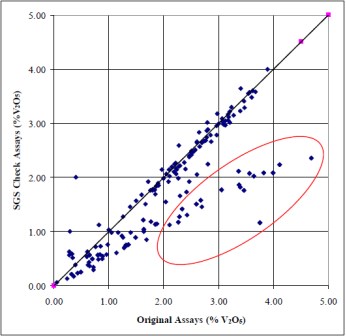
Figure 11.7:Gulçari A Core Duplicate Sampling
Source: Micon (2007)
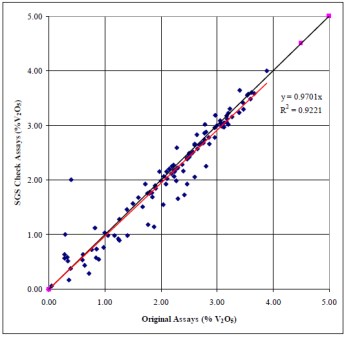
Figure 11.8:Gulçari A Core Duplicate Sampling With Hole FGA-41 Removed.
Source: Micon (2007)
11.4.4 2007 Campaign
This section has been reproduced in its entirety from the report titled "Technical Report of the Feasibility Study for the Maracás Vanadium Project, Brazil" by AkerSolutions 2012, as fully cited in Chapter 27 - "References". The QP has verified the accuracy of the information contained herein and updated as required.
Largo's drill-core sampling program was conducted from April 3 to October 30, 2007. A quality assurance/quality control (QA/QC) program was conducted, in order to verify the precision of the V2O5, platinum and palladium grades reported during the drill campaign. It was also used to provide additional data on the PGM content of the mineralization.
The QA/QC procedures consisted of the insertion of one of two certified reference standards, two field duplicate samples, and one field blank sample with each batch of samples sent to the laboratory. The laboratory batch size is 40 samples, of which 5 were Largo QA/QC samples. There were also laboratory-inserted blanks and duplicates used by SGS in accordance with its own QA/QC policy.
11.4.4.1 Certified Reference Standards
Largo had two certified reference standards made using pulps from an earlier drill program that sampled material from the Gulçari A deposit. The standards consisted of both a high-grade (magnetitite) and lower-grade (magnetite-pyroxenite) material. The high and low standards were inserted at a rate of approximately one each per batch (40 samples).
These certified reference standards were prepared and packaged by CDN Resource Laboratories of Delta, B.C. Each sample was pulverized in a large rod mill, screened through a 200 mesh screen using an electric sieve and homogenized in a large rotating mixer. Each standard was sealed in plastic to prevent gravity separation and oxidation.
Each of the standards underwent blind round robin assaying for V2O5 by five laboratories and the data were reviewed and certified by Barry W. Smee, Ph.D., P.Geo. (Smee & Associates Consulting Ltd., see Appendix 2 of Hennessey, 2007). Both standards were also analysed for PGM and the high-grade magnetitite was found to have high enough values to potentially be useful as a precious metals standard. Experience with it has found that while it repeated well as a platinum standard, it did not perform well as a palladium standard.
All of the analytical results for the high and low standards were tracked on control charts on a continuous basis from April 3 to October 30, 2007. Each of these charts tracks the results of assaying of a single standard over time and plots it against the accepted value (the mean from the round robin assay program) and ±2 standard deviations (SD) from the mean. Staying within the ±2 SD lines is acceptable performance for precision and accuracy at a laboratory.
The performance of the in-house V2O5 standards used by Largo is judged to be acceptable. Figure Figure 11.9 and Figure 11.10 show the V2O5 analytical results for the high and low standard, as well as the platinum and palladium results for the high standard.
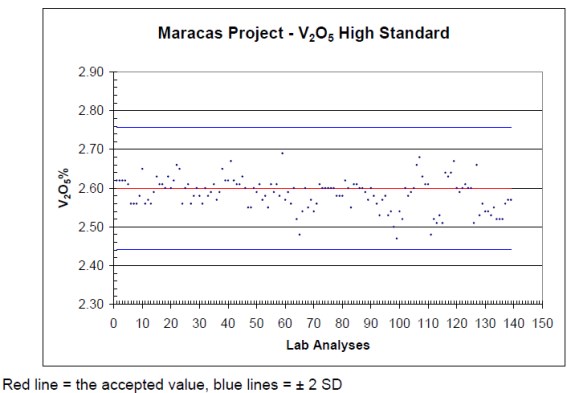
Figure 11.9:Exploration High Standard V2O5 Assay Results
Source: AkerSolutions (2012)
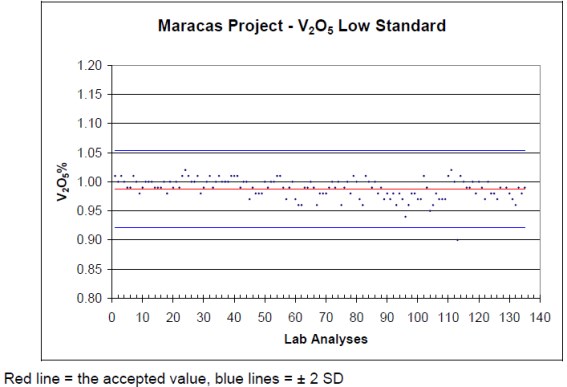
Figure 11.10:2007 Exploration High Standard V2O5 Assay Results.
Source: AkerSolutions (2012)
11.4.4.2 Field Blanks
Field blanks of a known barren rock were randomly inserted at least once in every 40 samples, usually resulting in one sample per batch. This was done to check for cross contamination at any point in the sample preparation or assaying. Micon has reviewed the analytical results for the field blanks (Figure 11.11) and found them to be acceptable.
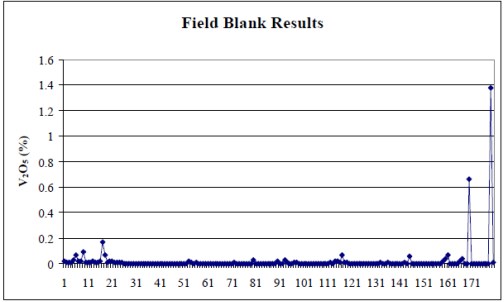
Figure 11.11:2007 Exploration Field Blank Assay Results.
Source: AkerSolutions (2012)
11.4.4.3 Duplicates Samples
Two field duplicate samples were randomly inserted in each batch. These samples are used to determine the precision of the assay laboratory and the degree of nugget effect introduced in sampling. Detailed records were kept at the core shed for all field duplicate sample locations.
SGS also introduced sample duplicates prepared at the laboratory into the stream. These samples are useful in determining the analytical precision of the laboratory.
The results of the field duplicate sampling are presented in Figure 16.8 and the results of the sample duplicate assaying are presented in Figure 11.12 Micon has reviewed these results and finds them to be acceptable and better behaved than most.
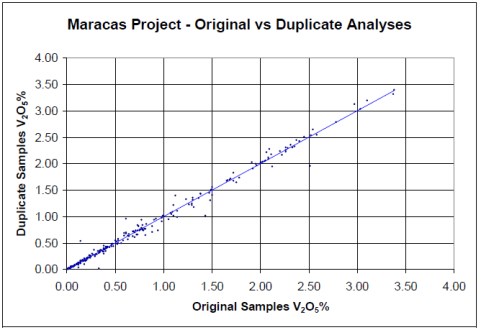
Figure 11.12: Maracás Project - Original vs Duplicate Analyses.
Source: AkerSolutions (2012)
11.4.4.4 Secondary Laboratory Checks
Check analyses were systematically completed at a second laboratory during the drill program, in order to test the precision and relative bias of the primary laboratory. A total of 500 pulp samples from 40 drill holes (9.1% of samples) were analysed (Figure 11.13 and Figure 11.14).
The original analyses were done at the SGS laboratory in Belo Horizonte, Brazil. The 2007 duplicate sample analyses were conducted at ALS Chemex laboratory in Vancouver, B.C. Every effort was made to use similar techniques and sample sizes, in order to compare results. The longest lapse of time between the original assays at SGS and the secondary checks at ALS Chemex was 4 months, and the shortest period of time was 2 months.
The samples sent to SGS were analysed for the major oxides (FeO, Fe2O3, SiO2, TiO2 and V2O5) using borate fusion XRF. The lower detection limit for V2O5, for this method, was 0.01%, while the upper limit was 5%. Elements were reported as oxides. The samples were also analysed by SGS for platinum and palladium by fire assay with an AA finish on a 20-g sample. Internal quality control procedures included duplicate and blank sample and certified reference material analysis. These data were used to check the analytical reproducibility and precision of the assays.
ALS Chemex's XRF method used a fusion technique, with a high-energy X-ray instrument. The lower detection limit for V2O5 was 0.01%, while the upper limit was 5%. A sample weight of 0.66 g was fused with 7.2 g of flux to prepare each bead. Samples were fused into a glass disc using a lithium borate flux much as described for normal fused glass beads. The samples were also analysed for platinum and palladium by fire assay with an AA finish on a 20-g sample.
ALS Chemex's XRF method used a fusion technique, with a high-energy X-ray instrument. The lower detection limit for V2O5 was 0.01%, while the upper limit was 5%. A sample weight of 0.66 g was fused with 7.2 g of flux to prepare each bead. Samples were fused into a glass disc using a lithium borate flux much as described for normal fused glass beads. The samples were also analysed for platinum and palladium by fire assay with an AA finish on a 20-g sample.
Largo, therefore, concluded that the analytical reproducibility was satisfactory, and that the analytical accuracy is equally acceptable. Consequently, Largo chose to use the original 2007 assay data for the geostatistical analysis. Micon supports the decision.
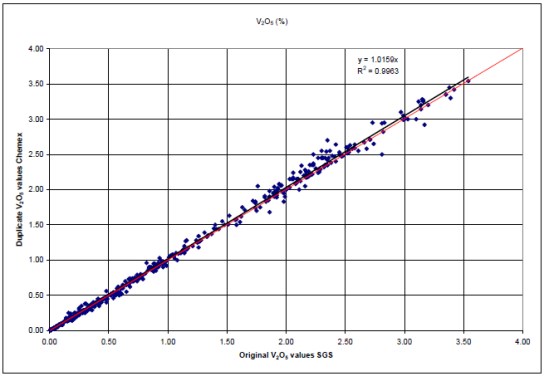
Figure 11.13:Secondary Laboratory Check Assays - V2O5.
Source: AkerSolutions (2012)
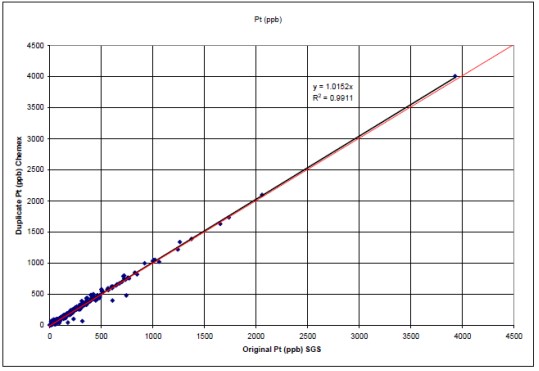
Figure 11.14:Secondary Laboratory Check Assays - Pt.
Source: AkerSolutions (2012)
11.4.4.5 AkersSolutions QAQC Summary (2012)
The purpose of adding a QC program to any drill program is to verify the accuracy and precision of the laboratory's results and to react immediately to any deviation at the laboratory demonstrated by the standards. Use of the certified reference materials in this case has meant that the laboratory results for the metals can be said to be reasonably accurate and precise.
The SGS pulp duplicates from the 2007 drilling generally show close agreement and little bias between first and second assay. The correlation coefficients confirm the close agreements between the original and the laboratory duplicates. Largo's field duplicates also showed good reproducibility.
Largo's 180 field blanks routinely returned very low values for all elements with three exceptions. Two samples, LML6272 and VML1682, assayed above background precious metal levels and V2O5 and one sample, LML6056, showed elevated V2O5 levels.
The performance of the certified reference standards were generally good for the high V2O5, low V2O5 and platinum determinations with over and under limit palladium assays returned. The high V2O5 results were stable and consistent and all clustered between the ±2 SD control limits. The results for low V2O5 standard were good with only one sample that fell outside the ± 2SD control limits. The high V2O5 standard is not really a precious metal standard. However, the values for platinum were very consistent, except for one sample and within acceptable ±2 SD limits. The palladium results on the other hand were variable showing no consistent drift.
11.4.5 Coffey Analysis
Most of this section has been reproduced from the technical report titled "Technical Report the Largo Maracás Vanadium Project, 1 Million Tonnes per Year Processing Plant, Brazil by RungePincockMinarco (2012), as fully cited in Chapter 27 - "References". The QP has verified the accuracy of the information contained herein and updated as required.
In 2011-2012 Coffey Mining validated Largo's QAQC data since 2006. The program was implemented by Largo to complete the survey campaigns analyzed by the companies Intertek and SGS laboratory. The controls defined for the analysis were field white, internal standards (material in certification) and sample duplicates.
The objective of the analysis was to determine the accuracy and accuracy of the values of the retested pairs and to monitor their relative errors.
At the same time as the verification Largo certified two internal standards of high content and lower vanadium content. The Table 11-5 and Table 11-6 show the certified standards and statistical results of the certification.
Table 11-5: Internal Standard Detection Limits
Standard | Mean | Mean + 2SD | Mean -2 SD | Mean + 3 SD | Mean - 3 SD |
V2O5 High grade | 2.6 | 2.76 | 2.54 | 2.84 | 2.46 |
V2O5 Low grade | 0.988 | 1.054 | 0.922 | 1.087 | 0.889 |
Source: RungePincockMinarco (2012)
Table 11-6:Standards and Blank QA/QC Summary Results
Reference values | Analyzed Results | Results |
Standard/variable | Origin
(%) | Min
(%) | Max
(%) | Sample
N | Min
(%) | Max
(%) | Mean
(%) | % Inside
precision
limits | %
Outside
precision
limits |
Site Project |
Blank/V2O5 | 0.01 | 0.005 | 0.015 | 199 | 0.001 | 0.18 | 0.008 | 84.422 | 15.578 |
High Grade/ V2O5 | 2.6 | 2.52 | 2.68 | 187 | 2.38 | 2.53 | 2.45 | 3.21 | 96.76 |
Low Grade/ V2O5 | 0.988 | 0.955 | 1.021 | 193 | 0.95 | 1.06 | 1.015 | 63.212 | 36.788 |
XRF_SGS |
Blank/ V2O5 | 0.01 | 0.01 | 0.01 | 173 | 0.005 | 0.05 | 0.007 | 95.954 | 4.046 |
Source: RungePincockMinarco (2012)
11.4.6 Coffey Verification
The verification of Coffey (2012) consisted of comparatively analyzing all the controls made available by Largo in addition to analyzing remonstrate values in the core. Table 11-7 shows the quantity of this study.
The pairs of field duplicates showed that 88.78% of the analyses were within the acceptance limit (10%) stipulated. Another observation was that 93.82% of the pairs of pulp duplicates were within the same acceptance limit. On the same condition the Replicate (SGS) with 93.6%, SGS labor vs. Intertek labor interlaboratory check with 96.94% and SGS labor vs ALS labor interlaboratory check with 94.43% showed adequate correlation rates.
Coffey Mining concluded that the patterns showed moderate to high accuracy regarding the interlaboratory check (SGS vs. Intertek) and the other controls were also considered adequate.
Table 11-7:QA/QC Program Summary
Chemical Element | Sample Type | Number of Samples Analyzed |
V2O5 | Field Duplicate | 196 |
Duplicate (Lab SGS) | 275 |
Replicate (Lab SGS) | 296 |
Check Lab SGS vs Intertek | 359 |
Check Lab SGS vs ALS | 305 |
11.5.1 2021 GE21 QAQC Analysis
Since 2009 Largo has implemented a QAQC program on all drilling programs. This quality control allowed to check precision and accuracy of %V2O5, %TiO2 and other elements (platinum and palladium contents) reported in the previous Mineral Resource estimative.
The program consisted of routinely inserting certified standards and blanks throughout the laboratory analysis process. The main features do control samples are described below.
Blank - Until 2018 blank was unmineralized building material acquired at one specific supplier in Maracás city, close to the Project site. From 2018 blank samples were from pegmatites from Gulçari A (Campbell Pit). They are separated in bags of approximately 1 kg and the label is placed regarding the position in the lot. In the control sample the following characteristics are observed:
Internal high and low V2O5 content standards - In 2018 Largo had Smee and Associates Consulting Ltd. create additional CRM samples for use in the QAQC program. In later campaigns Largo used also externally certified reference material from SGS. Normally these samples were separated into small bags with 50g of aliquot for each. The Table 11-8 shows Certified Reference Material used in QAQC internal program of Largo.
Table 11-8- Main Certified Reference Mateial used by Largo.
Name | Responsible Company |
Certified Reference Material HCV | SGS-GEOSOL |
Certified Reference Material LCV |
Certificate of Analysis Largo Standard 2018 HG | SMEE & Associates Consulting Ltd. |
Certificate of Analysis Largo Standard 2018 LG |
Duplicate coarse - Duplicate samples of course correspond to samples from previous drilling campaigns and will was resent. In this way, there are chemical results from two campaigns in different years. The physical preparation will already be completed, and the sample will be quarantined and resent.
Pulp Duplicate - The samples used as duplicates normally were pulp samples returned by the laboratories from previous drilling campaigns. With this type of sample it was not possible to assess possible contamination in the sample preparation process.
Since 2018 Largo implemented QAQC program with following controls:
- 2018 (Coffey, 2012).
Blank - sample intern the chemical analysis for V2O5 and TiO2. The insertion rate of 1 control sample per 32 samples.
Standards - external and internal certified sample. The insertion rate of 1 standard sample per 16 samples.
Duplicates - verification of laboratory precision. The insertion rate of 1 standard sample per 16 samples
After 2019 normally in batch of 40 samples, at least 5 were control samples. The Interteck, ALS and SGS laboratory also subjected all Largo samples to its internal quality control procedure (standards and blanks). QP has not checked the procedures of this control program each laboratory.
Followiings main control applied Largo's QAQC program:
- 2019
blank sample;
high grade standard;
low grade standard.
- 2020
blank sample;
high grade standard;
low grade standard;
coarse duplicate;
pulp duplicate.
The QP performed an evaluation of the controls in general for each deposit but respecting the certified reference material of each drill campaign.
Blanks:
The blanks used by Largo were from pulps of pegmatite material from Campbell Pit programs, i.e., they were not certified. These control samples Figure 11.15 were randomly inserted during shipment to the Laboratory throughout the program. This control allowed to check a point in the analysis and preparation process for contamination.
A total of 463 samples were inserted in the program with reference value of 0.001% and 0.01% V2O5. Most of the values obtained in the analysis show the absence of %V2O5 (below detection limit), that is, a source of possible contamination in the analytical circuit was not found.
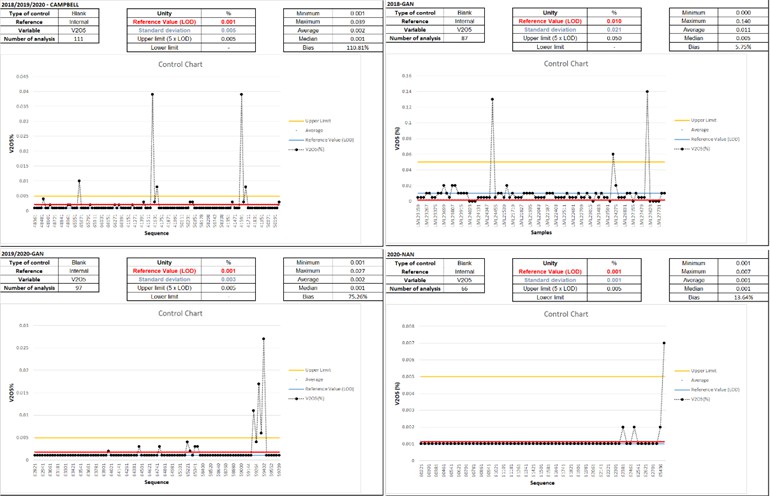
Figure 11.15:Standard Campbell Graphic
QP validated the analytical results of blanks and found them acceptable in 2018, 2019, 2020 campaign of deposits (Campbell Pit, GAN and NAN deposits). The analyses of blank prior to 2018 received by QP did not show values that compromise the data for the estimative of the Mineral Resource.
Standard samples were also randomly inserted into program batches. These samples were used to determine laboratory accuracy and to measure a possible nugget effect of the samples. Throughout the program, four standards were used, where two had high %V2O5 values and two, low %V2O5 values of companies SGS and SMEE & ASSOCIATES CONSULTING LTD.
In total survey campaigns, 344 standards have been inserted into the sampling circuit in Campbell since the beginning of the exploration by Largo. The resulting bias in the control charts of high and low value of % V2O5 was within the acceptable limits stipulated for this type of deposit (bias ±10%) of average V2O5. Figure 11.16 shows the comparative graphs of this control measure.
The major difference (4.37%) is related to data prior to 2018 and to the low value standard of % V2O5 LCV-GEOSOL-V2015. Possibly related to calibration of the instrument at the beginning of chemical analyses. The inverse situation in relation to calibration occurs in the analyses of the 2018 HG and LG standards of SMEE analyzed in 2020, showing a better adherence to the certified value.
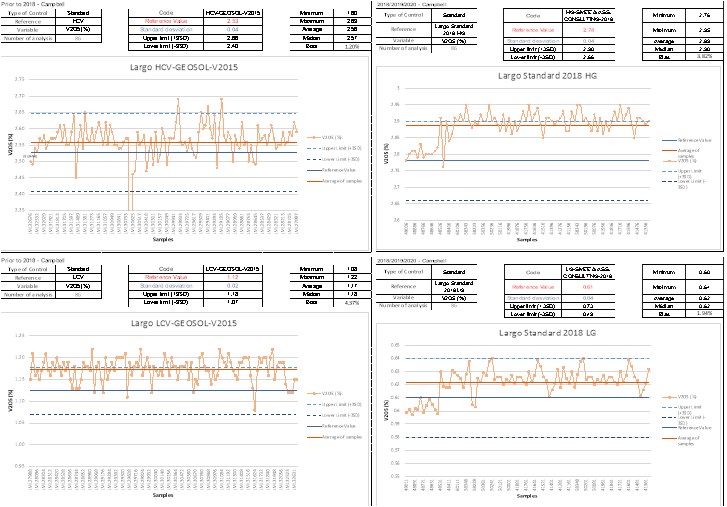
Figure 11.16:Campbell Pit Standard Chart
During the drilling campaigns on the GAN deposit, 364 standards were inserted into the sampling circuit. The resulting bias in the high and low value control charts of %V2O5 stayed also within the acceptable limits stipulated for this control (bias ±10%) Figure 11.17 shows the comparative graphs of this control measure.
The largest difference (-7.26%) observed is related to data prior to 2018 and to the high value standard of % V2O5 HCV-GEOSOL-V2008 showing accurate but not certified results. Possibly related to instrument calibration. A continuous improvement in time calibration occurs in the analyses of the 2018 HG and LG standards of SMEE analyzed in 2020, showing a better adherence to the reference value.
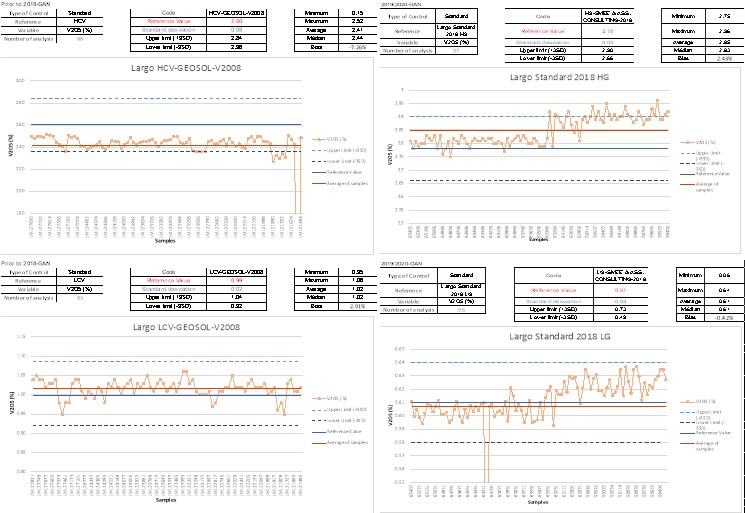
Figure 11.17:Standard GAN Chart
At NAN, 313 standards were inserted into the sampling circuit. The resulting bias in the high and low value control charts of % V2O5 were also within the acceptable limits stipulated (bias ±10%). Figure 11.18 shows the comparative graphs of this control measure.
The behavior of the same standards used in Campbell and GAN showed a better adherence to the reference value of each certificate. The bias observed is less than 4% showing a good accuracy in general form in relation year of campaign and V2O5 and TiO2 content.

Figure 11.18:NAN Standard Chart
The QP validated the standard samples and found them acceptable in 2018, 2019, 2020 sampling campaigns (Campbell Pit, GAN and NAN deposits). The analyses of standard samples prior to 2018 received by QP did not show values that committed the data for the estimative of the Mineral Resource.
Duplicate samples are taken from the remaining mass of each sample that was stored in the core shed. Its objective is to control the effect of variance in the processes of sample preparation and chemical analysis, with greater focus on the control of quartered crushed material, as well as to evaluate analytical and sampling precision and identify possible sample changes.
In Campbell's sample flow, considering all existing surveys, 161 coarse samples were inserted. Among which only 7.45% of the total exceeded the 10% limit for this analysis Figure 11.19 .The data showed a good correlation between the original samples and their respective duplicates, as well as relating their respective statistical distributions.
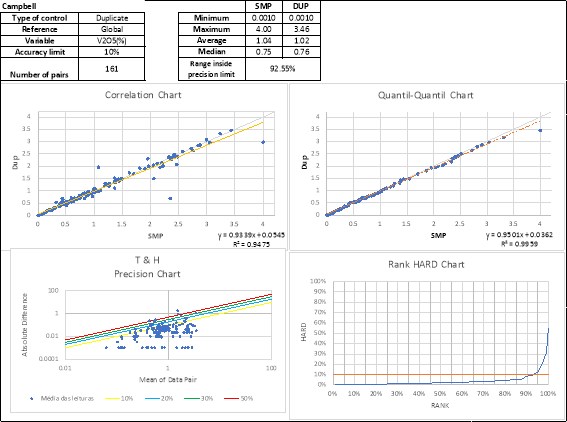
Figure 11.19:Duplicates Campbell Chart
In the GAN drill sampling program, 257 coarse samples were inserted. Among which only 0.78% of the total exceeded the 10% limit for this analysis.Figure 11.20. The data showed a high correlation between the original samples and their respective duplicates, as well as relating their respective statistical distributions.
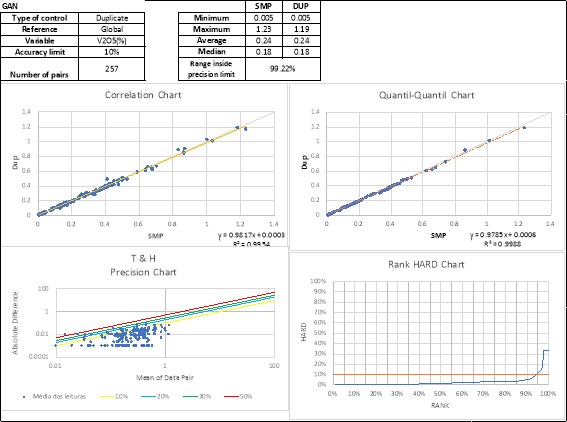
Figure 11.20:Duplicates GAN Chart
In the NAN deposit, 174 samples were inserted into the sampling circuit. Among which almost 40% of the total exceeded the 10% limit for this analysis Figure 11.21. However, considering that this analysis is in the samples of low content of %V2O5, this bias can be explained by inadequate manipulation of samples in laboratory. Nevertheless, the data showed a good correlation between the original samples and their respective duplicates, as well as relating their respective statistical distributions. The difference of 10% between the average of the original samples and their duplicates was considered acceptable by QP considering the analysis conditions and type of deposit.
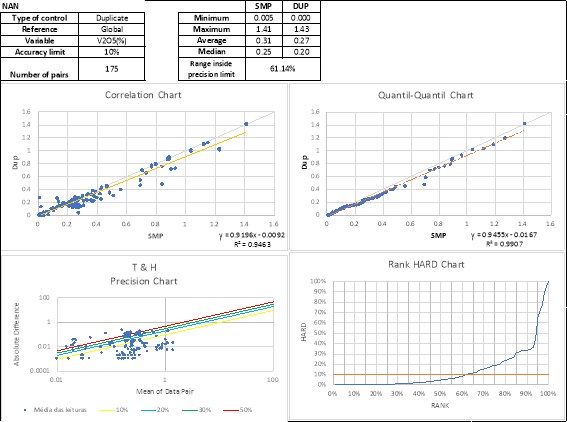
Figure 11.21:Duplicates NAN Chart
The QP validated the coarse duplicate and found them acceptable in 2018, 2019, 2020 campaign of depostis (Campbell Pit, GAN and NAN deposits). There are not course duplicate samples prior 2018.
11.5.1.1 GE21 considerations
The values of the standard LCV-GEOSOL-V2015 and Largo Standard 2018 HG for V2O5% analyzed normally were above the reference value, close to +3SD. This bias does not compromise the sample values but draws attention to the reasons for this change and the measures not to occur in future campaigns.
In GAN, the high % V2O5 (GEOSOL and internal Largo) standards showed an improvement in relation to the difference with the reference value from 2019 to 2020.
11.5.2 Qualified Person's opinion
In the opinion of the QP, the sampling methods are acceptable, consistent with industry-standard practice, and adequate for Mineral Resource and Mineral Reserve estimation purposes at Campbell Pit, GAN and NAN deposits, based on the following:
- The QP has reviewed all historic documents and believes that the observations and conclusions drawn by the authors of the previous reports are valid and are acceptable for use in Mineral Resource and Mineral Reserve Estimation;
- Data are collected following company-approved sampling protocols;
- Sampling has been performed in accordance with industry-standard practices;
- Sample intervals of approximately 1 m for core drilling, broken at lithological and mineralisation changes in the core, are typical of sample intervals used for VTM style mineralisation and are consistent with proven results from Campbell Pit production;
- Sampling is considered to be representative of the true thicknesses of mineralisation. Not all drill core is sampled; sampling depends on location in the stratigraphic sequence and logging of visible magnetite mineralisation and non-mineralised intervals based on geological units;
- The specific gravity determination procedure is consistent with industry-standard procedures. There are sufficient specific gravity determinations to support the specific gravity values used in tonnage estimates;
- Preparation and analytical procedures are in line with industry-standard methods for VTM style mineralisation and are suitable for the deposit type;
- The QA/QC programme comprising blank, CRM, and duplicate samples, meets QA/QC submission rates and industry-accepted standards;
- Sample security has relied upon the fact that the samples were always attended or locked in the on-site sample preparation facility. The chain-of-custody procedure consists of filling out sample submittal forms that are sent to the laboratory with sample shipments to make certain that all samples are received by the laboratory;
- Current sample-storage procedures and storage areas are consistent with industry standards;
- SGS Geosol laboratories Ltda. and ALS Laboratories, both located in Belo Horizonte, and Intertek located in Cotia, Brazil is full service laboratories with state of the art equipment and procedures and are fully independent of Largo Inc.
12 DATA VERIFICATION
12.1 Site visit
Mr. Xavier and Mr. Gomides visited the site from April 27th to 29th, 2021 and were accompanied by the Largo team responsible for providing the information necessary to develop this report. Below are descriptions of some items observed during the site visit.
12.1.1 Topographic survey
The project uses the coordinate system UTM- Zona 24S and Datum SIRGAS2000 as a cartographic reference.
Largo used a millimeter precision GPS with RTK for the final drillhole collar location. The topography of the open pit is updated via Drone with a frequency of 3 times per week. The topography covers the entire open pit.
12.1.2 Drilling
In the site visit time, four drill holes drilled in 2020 at the Campbell pit were check and dril holes confirmed the mineralization with irregular geometry to the south. The mineralization remains open. Largo's team interpretation, based on the magnetic data, considers low continuity to south. The 2021 drilling campaign investigated the mineralization continuity and limits.
After the 2018 drilling campaign, Largo used SPT (Standard Penetration Test) down hole surveys for all drill holes.
In NAN and GAN, total of 15 holes were checked in the field. In general, the location and the main information observed are consistent with the official database.
12.1.3 Geological Map
Largo's team has some NW-SE and E-W faults inferred in the regional geology map but not in the geological model. They do not believe that there is a strong influence of these faults in the continuity of the bodies.
The in-pit short-term mapping is based on the chemical classification of grade control holes, long-term geological model, and horizontal section of the upper bench.
12.1.4 Core Shed
Core Shed is located near to central office and shows good conditions to store the core samples. Largo informed to QP will build new core shed more adequate in future. Figure 12.1 and Figure 12.2 show the infrastructure of the core shed.

Figure 12.1: Core shed infrastructure.

Figure 12.2: Pulverized rejects box.
The core shed is clean and well organized. There are rooms to support geologists (computer, printer, etc.) and appropriate places for the description, sampling, and core split activities. There is space to store core boxes and lab reject samples.
Minimum quantity of core boxes are stored without appropriate cover, but they are in good condition (see Figure 12.3).
The core shed is being moved to a definitive location with sufficient space to store all drill core.
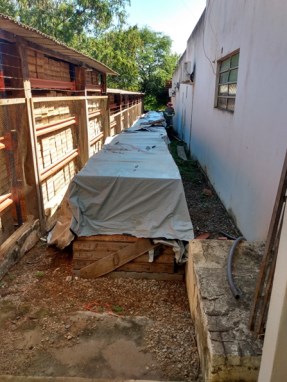
Figure 12.3: Core boxes without covering.
12.1.5 Operating procedures
There are operational procedures for all drilling phases. Geological and geotechnical descriptions are conducted by a geologist. The magnetic susceptibility is measured each 25 cm along the core downhole and data are stored in a excel database for each drill hole. Prior of geological description geologist used portable magnetometer to help define the contacts of the magnetic lithologies.
Logging and sampling are captured on handwritten drill logs and transferred digitally to a main database. Bellow follows sampling procedures summary:
- Drill hole starts on HQ rods and reduces to NQ when there is no more risk of decrease the recovery.
- Sample length = 1m. Sample can vary from 0.25 m to 1.5 m in length.
- Sample = ½ of core drilling.
All description criteria on the geological log are used to define the geological and sample intervals (weathering, lithology, alteration, etc.). The main criteria to define mineralization in the geological log is logging of geological rock units and magnetic intensity, but there is no restriction to sampling. Any characteristics related to mineralization observed by geologists can justify the sampling.
Procedure defines taking at least 1 m of sampling above and below the mineralized zones. Zones containing low grade or barren material of <0.25 m are included in the sample. Intervals <0.25 m are not individualized and considered as internal waste. Low grade or barren sections of >0.25 m are sampled individually.
In general drilling recovery >85%. There were few intervals with low recovery in NAN.
12.1.6 Geological Description
The geological description now is based on the magmatic differentiation concept (Cycle) (see section 7):
- 100% of core was re-described in Campbell, NAN and GAN applying the new magmatic cycle model.
- The definition of mineralization is strongly based on the magnetism of the rocks.
- The magnetic minerals present are: mainly magnetite, ilmenite and secondarily pyrrhotite.
- There is a photobook, with corresponding geological and chemical descriptions for to aid geologists in classification of rock type and the position of that rock within the overall classification of unit cycles at the project.
A check of the geological log of the FNAN-14 and FGB-12, and part of other drillholes, was conducted during the site visit and no inconsistencies were found.
12.1.7 QAQC
In 2020, the batch of samples sent to the laboratory consists of 35 drill samples and 5 quality control samples approximately. The batches were separated by campaign area and then shipped to the laboratory.
Quality control is done by inserting control samples in the analysis batches:
- 1 Blank preparation sample
- 1 High Grade CRM
- 1 Low Grade CRM
- 1 Crushed Duplicate
- 1 Pulverized Duplicate
Blank sample is carried out using pegmatite from the mine without certification. The material is crushed and washed for use as a control sample.
Internal standards samples were developed under the supervision of Smee & Associates specifically for Largo in 2018. These standards samples have been used in 2018, 2019, 2020 and 2021 drill programs for accuracy analysis.
- Magnetite ore was used for high grade and magnetic pyroxenite ore was used for low grade and was derived from the Campbell pit.
Samples analyzed in the previous campaign are used as duplicate samples in the current campaign.
12.1.8 Density
Density was calculated using a Jouly balance by the Largo team (pre 2020) and using a pycnometer in an external laboratory (2020). Density tests were not carried out in weathered rock by the geology team.
12.1.9 Internal Laboratory
The Largo internal laboratory is used to analyze samples from the mine operation (grade control) and plant. The samples from exploration drilling are analyzed in a certified external laboratory (SGS-Geosol or ALS Geochemistry).
The internal laboratory is in the process of ISO 9001 certification (scheduling external visit to auditing) and has internal system for managing operational procedures.
The procedures for traceability of samples in the laboratory and reported analyzes are in the process of automation.
The Largo laboratory participates in the material certification (CRM) process through a CSIRO program. The laboratory has quality control, within industry standards, based on control tools such as the insertion of Blank control samples, Duplicates and Standards, as well as a check in a certified external laboratory. Follows some controls used to certification:
- Lithium tetraborate reagent to produce of the aliquots also is used as Blank in QAQC internal program of Largo Laboratory;
- CRM samples are prepared from the material in the mine;
12.1.10 Drilling Database
There is no specialist system or software for managing the database. The files are stored and handled manually in MS-Excel spreadsheets. Tables are stored in folders on Largo's corporate network with corporate access control and backup.
The database is imported into the Leapfrog Geo software where the geological modeling takes place.
12.2 Data received for estimate
Largo digitally provided topography, geological maps, geophysical surveys, core photographs, mineral resource estimation reports (internal and consultants), mineral processing reports and so on, via e-mail, FTP and external HD. These data correspond to the majority of mineral programs in the areas belonging to Largo. QP has not checked the original procedures and database from pre-2015 programs.
However, the QP had access to the data and previous reports (AkerSolutions (2009), RungePincockMinarco (2012)) that described these procedures before 2015 and has confirmed them adequate for the purpose of estimating Resources.
The QP has access of audit work conducted by Micon, 2007and Micon 2016 and GE21 considers the QA/QC procedures to be in accordance with mining industry norms and valid for use in the current mineral resource estimate.
12.2.1 Database
Most of the mineral research data received and used to define the 3D geological model and resource estimate was compiled into Leapfrog Software and classified by target to improve file organization, integrity and security.
For Pit Campbell, drilling database consists of 163 vertical and inclined holes, totaling 28,792.84 m of diamond drill core. At GAN, 106 inclined holes were drilled totalling 15,842 m of diamond drill core. At NAN deposit, 120 inclined holes were drilled, totaling 21,098.6 m of diamond drill core.
The databases of other Near Mine Targets (SJO and NAO) were not checked in this report.
12.3 Qualified Person's Opinion
The QP has reviewed the historical documents regarding the pre-2015 exploration history and believe the procedures and database suitable for use in the Mineral Resource Estimate
After the consolidation and understanding of all data received, such as data acquisition procedures, analytical results (chemical results and geophysical survey points) together with their corresponding quality control programs, technical responsible by revision consider that the data is appropriate for the mineral resource estimate.
13 MINERAL PROCESSING AND METALLURGICAL TESTING
13.1 Introduction
The vanadium recovery plant for the for ore extracted from Campbell Pit located in Maracás (BA) was based on extensive process development tests carried out between 1986 and 2010 and is described in detail in the GE21 report, prepared in May 2017 and issued in October of the same year. The report is titled: Maracás Menchen Project, Bahia, Brazil. Independent Technical Report. AN UPDATED MINE PLAN, MINERAL RESERVE AND PRELIMINARY ECONOMIC ASSESMENT OF THE INFERRED RESOURCES. The report, prepared by GE21 Ltd on behalf of Largo Resources Ltd. is filed on SEDAR.
13.2 Process Technical and Economical References
In this GE21 report, data and information from the following reports were analyzed:
- Lurgi, "Feasibility Study, Maracás Vanadium Project, prepared for Pedreiras Valeria Ltda., Salvador/Bahia, Brazil", May 1986.
- Rautaruukki Oy Tutkimuskeskus Research Centre, "Laboratory Research of the Suitability of the Otankäki Process for Extracting Vanadium from Maracás Ore", December 1989.
- Engenharia e Consultoria Mineral S.A., "Projeto Vanádio de Maracás Projecto Conceitual e Estimativa de Investimento, Produção: 4,500 t/a de V2O5", September 1990.
- IMS Processing plant, "Vanádio de Maracás Ltda., Vanadium Pentoxide Production Plant", 1990.
- SGS Minerals Services, "The Beneficiation Characteristics of Samples from the Vanádio De Maracás Deposit" November 2007.
- SGS Minerals Services, "Recovery of Vanadium from the Maracás Ore Deposit", April 2008.
- SGS Minerals Services, "The Solid-Liquid Separation of the Maracás Ore Deposit", July 2008.
- Vendors' budgetary quotes.
- Largo Resources Ltd. (Les Ford), "Pilot Plant Testing of Maracás Magnetite Ore", Oct 2010.
- Ausenco Minerals and Metals, "Conceptual design of alternatives for non-magnetic tailings deposition", Sep 2010.
The assessment contained in the aforementioned 2017 GE21 report had as its main focus the preliminary feasibility analysis for the production of vanadium concentrate, from the Gulcari A deposit, now known as the Campbell Pit.
The main objective of this report is to update the Campbell Pit mineral resources/reserves including an evaluation for the production of ilmenite concentrate through the use of waste from the vanadium concentrate production plant and update the mine plan as required. Of equal importance to this report was to evaluate the GAN and NAN deposits for the recovery of vanadium and titanium using existing new plant infrastructure as required.
The following process test reports for vanadium and titanium recovery were evaluated:
- Recuperação de Titânio do Minério do Campbell Pit - Novembro 2020 - Gerência Técnica - Largo Resources - Mineração Menchen da Vanádio Maracás (Titanium Recovery from Campbell Pit Ore - November 2020 - Technical Management - Largo Resources - Menchen Mining by Vanádio Maracás).
- Recuperação Metalúrgica do Depósito Gulçari A Norte - Janeiro 2021 - Gerência Técnica - Largo Resources - Mineração Menchen da Vanádio Maracás (Metallurgical Recovery of the Gulçari A Norte Deposit - January 2021 - Technical Management - Largo Resources - Menchen Mining of Vanádio Maracás).
- Recuperação Metalúrgica do Minério de Novo Amparo Norte - Agosto 2020 - Gerência de Processos Largo Resources - Mineração Menchen da Vanádio Maracás (Metallurgical Recovery of Novo Amparo Norte Ore - August 2020 - Largo Resources Process Management - Menchen Mining of Vanádio Maracás).
13.3 Metallurgical Recovery of Vanadium and Titanium of Ore from Campbell Pit
The tests were carried out on lithologies MAG01, MAG02 and MP01, from the Gulçari A deposit, currently mined in Campbell Pit, located in the municipality of Maracás, Bahia. This test work showed that the titanium present in the deposit is associated with ilmenite, making it possible for the recovery of approximately 75% from the wet non-magnetitic concentrate and an overall recovery from the mined material of about 51%. The tests were carried out at the SGS Geosol laboratory in Belo Horizonte, Brazil and VMSA laboratories at the mine site during the period from March to October 2020. Table 13-1 below summarizes the expected recoveries per separation process.
Table 13-1: Summary of Results - TiO2 Recovery - Campbell Pit.
Area/Process | Recovery TiO2 (%) |
Top* Zone | Bottom** Zone | Average |
Crushing/Dry Magnetic Concentration | 97.9 | 98.0 | 98.0 |
Grinding/Wet Magnetic Concentration | 69.2 | 69.2 | 69.2 |
Desliming | 95.3 | 91.3 | 93.2 |
Flotation | 80.4 | 81.3 | 80.9 |
Global | 51.9 | 50.3 | 51.1 |
*Top Zone (or Upper Zone), elevation above 120 m, and Bottom** Zone (or Lower Zone), elevation below 120 m, in the deposit.
13.3.1 Sample Characterization - Campbell Pit
Sample material was derived from drill core and was split into two sections, one for testing purposes and the remaining sample was kept for reference. The samples were then separated for metallurgical testing by lithology and zone forming six large samples, A2, A4, A6, A7, A8 and A9. Table 13-2 indicates what each sample represents.
Table 13-2: Lithologies of Samples - Campbell Pit.
Sample | Description | % of Deposit |
Lithology | Zone |
A2 | MAG01 | Bottom | 15.8 |
A4 | MAG02 | Bottom | 6.7 |
A6 | MP01 | Bottom | 21.7 |
A7 | MAG01 | Top | 12.3 |
A8 | MAG02 | Top | 3.8 |
A9 | MP01 | Top | 25.6 |
The chemical characterization of the samples was carried out using X-ray fluorescence with the use of borate fused beads. The percentage of magnetics was determined using a Davis Tube with a field strength of 1,500 Gauss, and the loss on ignition in a muffle furnace. The results of these analyses are detailed in Table 13-3 below.
Table 13-3: Chemical Analysis of Samples - Campbell Pit.
Sample | Grade (%) | Magnetic
(%) | LOI
(%) |
V2O5 | SiO2 | Al2O3 | Fe2O3 | CaO | MgO | TiO2 | P2O5 |
A2 | 2.03 | 10.20 | 2.54 | 65.50 | 1.94 | 5.38 | 13.50 | 0.01 | 59.4 | -1.96 |
A4 | 1.69 | 15.80 | 3.25 | 59.30 | 4.33 | 4.79 | 11.40 | 0.01 | 50.4 | -2.02 |
A6 | 1.11 | 26.60 | 4.88 | 46.00 | 7.32 | 6.07 | 7.99 | 0.01 | 31.7 | -1.17 |
A7 | 2.05 | 9.82 | 2.50 | 66.60 | 1.83 | 5.28 | 13.60 | 0.01 | 59.7 | -2.24 |
A8 | 1.53 | 19.20 | 2.84 | 56.30 | 5.01 | 6.35 | 10.60 | 0.01 | 46.8 | -1.77 |
A9 | 0.91 | 33.00 | 4.16 | 39.00 | 9.50 | 8.52 | 5.83 | 0.01 | 25.9 | -0.91 |
13.3.2 Dry Magnetic Separation -Campbell Pit
Dry Magnetic Separation tests were carried out on sample A6 and A9 using a 1,500 Gauss drum magnetic separator, operating at 33 rpm and fed at a rate of 1.4 kg/min. In each concentration test, the mass, contents and percentage of magnetic feed, concentrate (magnetic fraction) and tailings (non-magnetic fraction) were measured. The dry concentration tests were not carried out for the other samples as these have a magnetic concentration above 40%, a value that meets the current requirements of the wet magnetic concentration process at the VMSA plant. The contents were analysed using X-ray fluorescence with the use of borate fused beads and the percentage of magnetics was measured using a Davis Tube with a field strength intensity of 1,500 Gauss. Table 13-4 present a results summary of Dry Magnetic Separation.
Table 13-4: Summary of Results - Dry Magnetic Separation - Campbell Pit.
Sample | % Magnetic | Magnetic
Recovery (%) | Mass
Recovery
(%) | Enrichment |
Feed | Concentrate | Tailings |
A6 | 31.7 | 35.6 | 1.2 | 99.6 | 89.0 | 1.10 |
A9 | 25.9 | 28.9 | 4.7 | 97.8 | 90.0 | 1.10 |
Sample | TiO2 (%) | Recovery TiO2
(%) | Mass
Recovery
(%) | Enrichment |
Feed | Concentrate | Tailings |
A6 | 8.04 | 8.59 | 4.04 | 93.9 | 89.0 | 1.07 |
A9 | 5.76 | 6.17 | 2.02 | 96.5 | 90.0 | 1.07 |
Based on the results in Table 13-4, a titanium recovery of 93.9% for sample A6 and 96.5% for sample A9 was estimated. With these results and the proportions of each ore body in the Gulçari A deposit, the titanium recovery for the upper and lower zones of the deposit can be estimated, as shown in Table 13-5 below.
Table 13-5: Top and Bottom Zones - Dry Magnetic Separation Recoveries - Campbell Pit.
Sample | TiO2 (%) | Recovery (%) | Proportion (%) |
Feed | Concentrate | Tailings | TiO2 | Mass | In Deposit | In Blend
C |
A7 (Top Zone) | 5.28 | 5.28 | - | 100.0 | 100.0 | 12.3 | 31.0 |
A8 (Top Zone) | 6.35 | 6.35 | - | 100.0 | 100.0 | 3.8 | 10.0 |
A9 (Top Zone) | 5.76 | 6.17 | 2.02 | 96.5 | 90.0 | 25.6 | 59.0 |
Total (Top Zone) | 5.70 | 5.90 | 2.02 | 97.9 | 94.0 | 41.7 | 100.0 |
Sample | Feed | Concentrate | Tailings | TiO2 | Mass | In Deposit | In Blend
B |
A2 (Bottom Zone) | 13.50 | 13.50 | - | 100.0 | 100.0 | 15.8 | 38.0 |
A4 (Bottom Zone) | 11.40 | 11.40 | - | 100.0 | 100.0 | 6.7 | 17.0 |
A6 (Bottom Zone) | 8.04 | 8.59 | 4.04 | 93.9 | 89.0 | 21.7 | 45.0 |
Total (Bottom Zone) | 10.50 | 10.93 | 4.04 | 98.0 | 94.1 | 44.2 | 100.0 |
13.3.3 Wet Magnetic Separation -Campbell Pit
VMSA's production process includes a grinding circuit, responsible for the liberation of magnetite minerals, integrated with wet magnetic separation in open circuit low-field magnetic separators with one roughing step and two cleaning steps (Rougher+Cleaner+ Recleaner). This same concentration method was used on a laboratory scale to assess the behaviour of the two samples composed of blends.
In order to perform the wet magnetic concentration tests, samples A2, A4, A7 and A8 were used, in addition to the dry magnetic separation test concentrates of the A6 and A9 lithologies, which were named PCA6 and PCA9. In preparation for the wet magnetic concentration tests two samples were formed by blending samples from the upper zone (A7, A8 and PCA9) and the samples from the lower zone (A2, A4 and PCA6), proportionally to that found in the Gulçari A deposit. Table 13-6 presents the proportion used to carry out blends in the lower and upper zone, respectively called blends B and C. and Table 13-7 presents the chemical analysis of both blends.
Table 13-6: Proportions - Blend B and C - Campbell Pit.
Sample | A2 | A4 | PCA6 | Blend B |
% in Deposit (%) | 16.0 | 7.0 | 19.3 | 42.0 |
% in Blend B (%) | 38.0 | 17.0 | 45.0 | 100.0 |
Sample | A7 | A8 | PCA9 | Blend C |
% in Deposit (%) | 12.0 | 4.0 | 23.0 | 39.0 |
% in Blend C (%) | 31.0 | 10.0 | 59.0 | 100.0 |
Table 13-7: Chemical Analysis - Blend B and C - Campbell Pit.
Sample | Grade (%) | Magnetic
(%) | LOI
(%) |
V2O5 | SiO2 | Al2O3 | Fe2O3 | CaO | MgO | TiO2 | P2O5 |
Blend B | 1,63 | 17,7 | 3,56 | 57,5 | 4,61 | 5,36 | 11,0 | 0,01 | 48,7 | -1,79 |
Blend C | 1,47 | 21,9 | 3,11 | 52,6 | 5,78 | 6,38 | 9,35 | 0,01 | 41,6 | 1,58 |
Blend B and Blend C samples (Table 13-8) were used to perform the wet magnetic concentration tests using a 1,500 Gauss drum magnetic separator. The material was mixed with water, forming a pulp with 30% solids by weight that was fed into the magnetic separator.
Table 13-8: Summary of Results - Wet Magnetic Separation - Blend B and C - Campbell Pit.
Sample | Magnetic (%) | Recovery (%) |
Feed | Concentrate | Tailings | Magnetic | Mass |
Blend B | 48.7 | 97.7 | - | 96.7 | 48.2 |
Blend C | 41.6 | 95.8 | 0.8 | 98.9 | 44.0 |
Sample | TiO2 (%) | Recovery (%) |
Feed | Concentrate
(Magnetic) | Tailings
(non-
magnetic) | TiO2 | Mass |
Blend B | 11.00 | 6.83 | 14.30 | 69.2 | 52.8 |
Blend C | 9.60 | 6.68 | 11.80 | 69.2 | 56.0 |
13.3.4 Flotation -Campbell Pit
Two samples of non-magnetic tailings were formed after wet magnetic concentration tests performed with blends B and C described earlier in this report. These samples were named, respectively, as RNM B and RNM C. All samples were chemically characterized using X-ray fluorescence with Panalytical's XRF Magix Fast equipment and the use of borate fused beads. Table 13-9 presents the results of the chemical analysis of samples RNM B and RNM C.
Table 13-9: Chemical Analysis - Wet Non-Magnetic Blend B and C - Campbell Pit.
Sample | Grade (%) | LOI (%) |
V2O5 | SiO2 | Al2O3 | Fe2O3 | CaO | MgO | TiO2 | P2O5 |
RNM B | 0.22 | 32.80 | 5.27 | 27.80 | 8.61 | 9.59 | 14.30 | 0.01 | -0.08 |
RNM C | 0.18 | 37.50 | 4.44 | 25.10 | 10.20 | 11.30 | 11.80 | 0.01 | 0.21 |
The flotation tests with the two samples were carried out at the SGS GEOSOL laboratory in Brazil, using Flotinor 10068 reagents (Clariant industrial mixture containing carboxylic acids), which acts as a collector, DP-OMC-1178 (polymer non-ionic BASF), which acts as a co-collector, and fluosilicic acid (H2SiF6) to regulate the pH to 4. All tests were performed only on the fraction retained in 10 µm of samples RNM B and RNM C.
The desliming in 10 µm was carried out in a hydrocyclone. The product underflow and the slurry (overflow) of each sample were analyzed using Panalytical's XRF Magix Fast and the use of borate fused beads. Table 13-10 presents the results obtained in the desliming of non-magnetic (RNM B and RNM C) of the samples of blends B and C.
Table 13-10: Desliming Results - Wet Non-Magnetic Blend B and C - Campbell Pit.
Sample | Flux | TiO2 (%) | Recovery
TiO2 (%) | Mass
Recovery
(%) |
RNM B | Feed | 14.30 | 93.0 | 91.3 |
Underflow | 14.60 |
Overflow | 11.40 |
RNM C | Feed | 11.70 | 95.3 | 93.8 |
Underflow | 11.90 |
Overflow | 8.90 |
In flotation, a Denver D12 bench flotation machine was used, with 2.5 L tanks, 2 L/min air flow, 1,000 rpm rotation. All products generated were analyzed using Panalytical's XRF Magix Fast and use of borate fused beads.
In all these tests, a 10-minute attrition step at 50% solids was applied, followed by a 2-minute pre-conditioning with fluosilicic acid and the reagent DP-OMC-1178, added in a unique way in this step. The Flotinor 10068 collector, on the other hand, was dosed in a staged way, with the addition divided equally between each of the conditionings that preceded the froth collections. Thus, a test with a dosage of 200 g/t of collector in 4 conditioning stages had the addition of 50 g/t in each stage.
Table 13-11 presents the titanium content and recoveries obtained in the flotation for each collection stage. The results are accumulated, which means that the grade and recovery indicated in the table as the second collection represents the mass of the first collection plus the second collection, whereas the grade and recovery indicated in the table as the second collection represents the mass of the first collection plus the second collection plus the third collection.
Table 13-11: Flotation Results - Blend B and C - Campbell Pit.
Sample | Test | Reagent Concentration (g/t) | Collect | Concentrate
TiO2 (%) | Recovery
TiO2 (%) |
Flotinor 10068 | DP-OMC-1178 |
RNM B | 2A | 200 | 400 | 1 | 42.40 | 66.3 |
2 | 41.10 | 76.1 |
3 | 40.10 | 80.4 |
2B | 200 | 400 | 1 | 41.80 | 67.5 |
2 | 40.60 | 77.6 |
3 | 39.50 | 82.3 |
RNM C | 7A | 200 | 400 | 1 | 41.40 | 60.8 |
2 | 40.00 | 74.5 |
3 | 38.60 | 80.3 |
7B | 200 | 400 | 1 | 38.60 | 60.4 |
2 | 36.70 | 76.0 |
3 | 35.20 | 83.0 |
8A | 200 | 200 | 1 | 41.20 | 61.5 |
2 | 39.80 | 79.6 |
3 | 38.70 | 83.1 |
8B | 200 | 200 | 1 | 43.40 | 59.4 |
2 | 41.80 | 78.5 |
3 | 40.90 | 81.6 |
RNM B | Average - Collect 3 | 3 | 39.80 | 81.3 |
RNM C | Average - Collect 3 | 3 | 39.80 | 80.4 |
The average of the results of the third collection, it can be assumed that the average of the flotation step can achieve a recovery of more than 80% TiO2 and generate a concentrate with about 40% TiO2.
13.3.5 Global Recovery of Titanium - Pit Campbell
Global recovery is the multiplication of all sequential recoveries of the proposed process route, that is, dry Crushing/Magnetic Separation recovery, wet Grinding/Magnetic Separation recovery, desliming recovery, flotation recovery.
RGlobal = Rcrushing x Rgrinding x RDesliming x RFlotation
Table 13-12 presents a summary of titanium recoveries obtained in the dry magnetic concentration, wet magnetic concentration, desliming and flotation steps.
Table 13-12: Summary of Results - Global Recovery of TiO2 - Campbell Pit.
Area/Process | Recovery (%) |
Top Zone | Bottom Zone | Average |
Crushing/Dry Magnetic Concentration | 97.9 | 98.0 | 98.0 |
Grinding/Wet Magnetic Concentration | 69.2 | 69.2 | 69.2 |
Desliming | 95.3 | 91.3 | 93.2 |
Flotation | 80.4 | 81.3 | 80.9 |
Global | 51.9 | 50.3 | 51.1 |
Therefore, it is possible to recover 51% of the titanium present in the Gulçari A deposit with the production of an ilmenite concentrate with 40% TiO2, the minimum requirement of its most probable application (pigment manufacturing).
13.4 Metallurgical Recovery of Vanadium and Titanium of Ore from Gulçari A Norte (GAN)
The test program for the GAN deposit was carried out by MinPro Solutions, Technological Characterization Laboratory at USP (Universidade de São Paulo) and at the VMSA laboratory during the period June to November 2020. The tests were carried out with GAN samples 1, 2, 3, 4, 5, 6, 7, and 8 representing the Magnetite, Magnetite-Pyroxenite and Magnetite-Gabbro lithologies of the Gulçari A Norte deposit. Tests showed that the vanadium present in this deposit is associated with magnetite and can be recovered using the same beneficiation process currently used at the Maracás Menchen Mine. Tests also indicate that the titanium present in this deposit is associated with ilmenite and can be recovered using flotation. The results are summarized in Table 13-13 and Table 13-14 below.
Table 13-13: Summary of V2O5 Recoveries - Gulçari A Norte (GAN).
Area/Process | Recovery per Sample V2O5 (%) |
1 | 2 | 3 | 4 | 5 | 6 | 7 | 8 |
Crushing/Dry Magnetic Concentration | 95.2 | 97.4 | 97.3 | 97.2 | 100.0 | 100.0 | 98.7 | 96. 9 |
Grinding/Wet Magnetic Concentration | 99.8 | 99.9 | 99.9 | 99.9 | 98.2 | 99.9 | 99.9 | 99.9 |
Calcination | 85.0 | 86.8 | 83.8 | 82.5 | - | 84.7 | 67.3 | 73.6 |
Leaching | 96.8 | 96.8 | 96.8 | 96.8 | - | 96.8 | 96.8 | 96.8 |
Chemical Plant/Purification and Precipitation | 96.8 | 96.8 | 96.8 | 96.8 | - | 96.8 | 96.8 | 96.8 |
Global | 75.7 | 79.1 | 76.3 | 75.1 | - | 79.3 | 62.2 | 66.8 |
Table 13-14: Summary of TiO2 Recoveries - Gulçari A Norte (GAN).
Area/Process | Recovery per Sample TiO2 (%) |
1 | 2 | 3 | 4 | 5 | 6 | 7 | 8 |
Crushing/Dry Magnetic Concentration | 59.7 | 62.2 | 50.9 | 68.5 | 100.0 | 100.0 | 63.2 | 65.0 |
Grinding/Wet Magnetic Concentration | 77.5 | 76.0 | 79.8 | 83.1 | 94.7 | 75.8 | 78.0 | 79.5 |
Desliming | 77.5 | 77.5 | 77.5 | 77.5 | 77.5 | 77.5 | 77.5 | 77.5 |
Flotation | 88.6 | 94.1 | 92.5 | 82.2 | 83.5 | 98.3 | 96.1 | 89.7 |
Global | 31.8 | 34.5 | 29.1 | 36.3 | 61.3 | 57.7 | 36.7 | 35.9 |
It is observed that, for the GAN 5 sample, no Vanadium recovery tests were performed, since the Vanadium content is less than 0.10%.
13.4.1 Sample Characterization - Gulçari A Norte (GAN)
Table 13-15 reports the chemical analysis of the lithologies of the samples used for the tests.
Table 13-15: Chemical Analysis of Lithologies (GAN).
Sample | | Chemical Analysis (%) |
Magnetic
Fraction | V2O5 | TiO2 | Fe | SiO2 | Al2O3 | P | Cr2O3 |
Magnetitito C5 (Magnetitite C5) | A | 14.0 | 0.94 | 8.10 | 32.70 | 26.30 | 8.83 | 0.03 | <0.10 |
B | 13.0 | 0.93 | 8.10 | 32.70 | 26.30 | 8.74 | 0.02 | <0.10 |
Magnetitito C6 (Magnetitite C6) | A | 16.0 | 0.64 | 5.30 | 23.60 | 35.20 | 11.80 | 0.02 | <0.10 |
B | 17.0 | 0.65 | 5.30 | 23.80 | 35.30 | 11.80 | 0.02 | <0.10 |
Magnetitito C8 (Magnetitite C8) | A | 51.0 | 0.69 | 15.20 | 45.20 | 11.90 | 5.64 | 0.03 | <0.10 |
B | 51.0 | 0.69 | 15.20 | 45.00 | 11.80 | 5.57 | 0.03 | <0.10 |
Magnetita-Piroxenito C4 (Magnetite-Pyroxenite) C4 | A | 26.0 | 1.13 | 7.20 | 31.70 | 26.40 | 8.55 | 0.01 | <0.10 |
B | 27.0 | 1.14 | 7.20 | 31.70 | 26.50 | 8.57 | 0.01 | <0.10 |
Magnetita-Piroxenito C5 (Magnetite-Pyroxenite C5) | A | 18.0 | 0.58 | 7.80 | 32.10 | 26.50 | 8.30 | 0.02 | <0.10 |
B | 23.0 | 0.58 | 7.80 | 32.20 | 26.70 | 8.37 | 0.02 | <0.10 |
Magnetita-Piroxenito C7 (Magnetite-Pyroxenite C7) | A | 9.0 | 0.02 | 6.20 | 30.00 | 33.90 | 7.35 | 0.21 | <0.10 |
B | 11.0 | 0.02 | 6.30 | 29.90 | 34.00 | 7.43 | 0.21 | <0.10 |
Magnetita-Gabro C4 (Magnetite-Gabbro C4) | A | 22.0 | 0.98 | 6.80 | 27.80 | 29.30 | 12.50 | 0.02 | <0.10 |
B | 24.0 | 0.99 | 6.80 | 27.70 | 29.00 | 12.50 | 0.02 | <0.10 |
Magnetita-Gabro C5 (Magnetite-Gabbro C5) | A | 37.0 | 1.02 | 12.20 | 40.20 | 17.20 | 7.34 | 0.03 | <0.10 |
B | 37.0 | 1.02 | 12.10 | 40.00 | 17.20 | 7.31 | 0.03 | <0.10 |
Magnetita-Gabro C6 (Magnetite-Gabbro C6) | A | 27.0 | 0.67 | 10.50 | 35.80 | 22.80 | 8.55 | 0.04 | <0.10 |
B | 28.0 | 0.67 | 10.60 | 35.80 | 22.90 | 8.63 | 0.04 | <0.10 |
Magnetita-Gabro C8 (Magnetite-Gabbro C8) | A | 21.0 | 0.32 | 9.70 | 29.60 | 28.20 | 11.10 | 0.03 | <0.10 |
B | 22.0 | 0.32 | 9.70 | 29.90 | 28.10 | 10.90 | 0.03 | <0.10 |
Magnetita-Gabro C9 (Magnetite-Gabbro C9) | A | 19.0 | 0.40 | 7.70 | 27.00 | 30.90 | 11.40 | 0.02 | <0.10 |
B | 20.0 | 0.41 | 7.70 | 27.10 | 30.80 | 11.50 | 0.02 | <0.10 |
In order to carry out the processing and metallurgy tests, the samples were blended to form 8 different samples, called GAN 1, GAN2, GAN 3, GAN 4, GAN, 5, GAN 6, GAN 7 and GAN 8. Table 13-16 to Table 13-20 present metallurgical tests result for each sample.
Table 13-16: Chemical Analysis of Samples (GAN).
Sample | Grade (%) | Magnetic
(%) | LOI
(%) |
V2O5 | TiO2 | Fe | SiO2 | Al2O3 | P |
GAN 1 | 1.07 | 6.96 | 29.30 | 27.80 | 10.70 | 0.01 | 24.2 | - |
GAN 2 | 1.00 | 11.50 | 38.50 | 18.60 | 7.46 | 0.02 | 32.8 | - |
GAN 3 | 0.67 | 10.50 | 35.10 | 23.00 | 8.70 | 0.04 | 27.2 | 0.40 |
GAN 4 | 0.64 | 5.94 | 25.50 | 32.70 | 10.90 | 0.01 | 17.2 | 0.78 |
GAN 5 | <0.10 | 6.21 | 29.10 | 33.40 | 7.48 | 0.20 | 9.8 | 0.79 |
GAN 6 | 0.68 | 15.20 | 44.30 | 11.90 | 5.65 | 0.02 | 51.6 | - |
GAN 7 | 0.32 | 9.67 | 29.30 | 27.30 | 10.80 | 0.03 | 21.1 | - |
GAN 8 | 0.40 | 7.66 | 26.30 | 30.50 | 11.50 | 0.02 | 19.1 | 0.25 |
Mineralogical characterization was performed using scanning electron microscopy and X-ray diffractometry.
Table 13-17: Mineralogical Distribution of Samples (GAN) (-150+20 µm).
Mineral | Proportion of the Main Minerals of Each Sample (%) |
GAN1 | GAN2 | GAN3 | GAN4 | GAN5 | GAN6 | GAN7 | GAN8 |
Amphibole-FeAlCa | 41.0 | 29.0 | 32.0 | 46.0 | 35.0 | 19.0 | 35.0 | 40.0 |
Magnetite | 26.0 | 37.0 | 31.0 | 20.0 | 11.0 | 46.0 | 22.0 | 20.0 |
Ilmenite | 14.0 | 21.0 | 21.0 | 12.0 | 14.0 | 27.0 | 18.0 | 15.0 |
Feldspar | 8.7 | 4.8 | 9.0 | 14.0 | 6.2 | 1.3 | 14.0 | 16.0 |
Amphibole-FeMg | 2.8 | 1.0 | 0.7 | 0.9 | 4.7 | 2.6 | 1.6 | 0.9 |
Garnet | 3.1 | 0.4 | 0.3 | 1.7 | 0.1 | 0.1 | 1.9 | 2.5 |
Phyllosilicates | 2.9 | 3.9 | 1.4 | 1.8 | 5.0 | 2.6 | 3.0 | 2.6 |
Quartz | 0.6 | 0.5 | 0.9 | 2.8 | 3.8 | 0.2 | 1.6 | 1.5 |
Amphibole-Fe | 0.1 | 0.6 | 2.3 | 0.6 | 16.0 | 0.4 | 1.4 | 0.3 |
Titanite | 0.3 | 1.0 | 0.2 | 0.3 | 0.1 | 0.1 | 0.3 | 0.5 |
Goethite | 0.1 | 0.4 | 1.1 | 0.1 | 0.4 | 0.4 | 0.2 | 0.2 |
Pyrite | 0.2 | 0.6 | 0.2 | 0.4 | 2.4 | 0.3 | 0.3 | 0.3 |
Apatite | 0.1 | 0.1 | 0.2 | 0.1 | 1.1 | 0.1 | 0.1 | 0.1 |
Table 13-18: Vanadium Distribution by Mineral (GAN) (-150+20 µm).
Mineral | Distribution of Vanadium by Mineral for Each Sample (%) |
GAN 1 | GAN 2 | GAN 3 | GAN 4 | GAN 5 | GAN 6 | GAN 7 | GAN 8 |
Magnetite | 81.0 | 93.0 | 89.0 | 71.0 | 93.0 | 98.0 | 93.0 | 96.0 |
Amphibole-FeAlCa | 16.0 | 4.0 | 10.0 | 28.0 | <1.0 | 1.0 | 5.0 | 1.0 |
Garnet | 1.0 | 0.0 | 0.0 | 1.0 | 1.0 | 0.0 | 2.0 | 2.0 |
Phyllosilicates | 1.0 | 2.0 | 0.0 | 1.0 | 4.0 | 1.0 | 1.0 | 1.0 |
Goethite | 0.0 | 0.0 | 0.0 | 0.0 | 2.0 | 0.0 | 0.0 | 0.0 |
Table 13-19: Titanium Distribution by Mineral (GAN) (-150+20 µm).
Mineral | Distribution of Titanium by Mineral for Each Sample (%) |
GAN 1 | GAN 2 | GAN 3 | GAN 4 | GAN 5 | GAN 6 | GAN 7 | GAN 8 |
Magnetite | 2.0 | 7.0 | 3.0 | 1.0 | 2.0 | 11.0 | 5.0 | 1.0 |
Ilmenite | 93.0 | 90.0 | 95.0 | 91.0 | 92.0 | 89.0 | 93.0 | 97.0 |
Amphibole-FeAlCa | 4.0 | 1.0 | 2.0 | 6.0 | 4.0 | 0.0 | 1.0 | 1.0 |
Phyllosilicates | 0.0 | 0.0 | 0.0 | 0.0 | 2.0 | 0.0 | 0.0 | 0.0 |
Titanite | 1.0 | 3.0 | 0.0 | 1.0 | 0.0 | 0.0 | 1.0 | 2.0 |
Table 13-20: Liberation - Magnetite and Ilmenite (GAN).
Size (µm) | Magnetite Liberation per Size Distribution (%) |
GAN1 | GAN2 | GAN3 | GAN4 | GAN5 | GAN6 | GAN7 | GAN8 |
-150 + 20 (Total) | 88.0 | 87.0 | 86.0 | 87.0 | 85.0 | 86.0 | 85.0 | 90.0 |
-150 +106 | 76.0 | 72.0 | 75.0 | 76.0 | 75.0 | 73.0 | 73.0 | 82.0 |
-106 +74 | 85.0 | 84.0 | 82.0 | 82.0 | 80.0 | 82.0 | 81.0 | 87.0 |
-74 +37 | 90.0 | 90.0 | 90.0 | 90.0 | 89.0 | 88.0 | 88.0 | 92.0 |
-37 +20 | 96.0 | 96.0 | 97.0 | 97.0 | 96.0 | 97.0 | 96.0 | 97.0 |
Size (µm) | Ilmenite Liberation per Size Distribution (%) |
GAN1 | GAN2 | GAN3 | GAN4 | GAN5 | GAN6 | GAN7 | GAN8 |
-150 + 20 (Total) | 81.0 | 85.0 | 87.0 | 82.0 | 79.0 | 87.0 | 87.0 | 83.0 |
-150 +106 | 66.0 | 76.0 | 79.0 | 66.0 | 62.0 | 79.0 | 78.0 | 69.0 |
-106 +74 | 77.0 | 83.0 | 84.0 | 78.0 | 73.0 | 85.0 | 84.0 | 79.0 |
-74 +37 | 85.0 | 88.0 | 89.0 | 86.0 | 85.0 | 89.0 | 88.0 | 86.0 |
-37 +20 | 94.0 | 95.0 | 96.0 | 94.0 | 95.0 | 95.0 | 96.0 | 96.0 |
Association | Magnetite Liberation per Sample (%) |
GAN1 | GAN2 | GAN3 | GAN4 | GAN5 | GAN6 | GAN7 | GAN8 |
Free | 88.0 | 87.0 | 86.0 | 87.0 | 85.0 | 86.0 | 85.0 | 90.0 |
Mixed in binary | 11.0 | 12.0 | 13.0 | 12.0 | 13.0 | 14.0 | 14.0 | 8.9 |
Mixed in ternary | 1.2 | 1.0 | 0.8 | 1.4 | 2.4 | 0.9 | 0.8 | 1.2 |
Association | Ilmenite Liberation per Sample (%) |
GAN1 | GAN2 | GAN3 | GAN4 | GAN5 | GAN6 | GAN7 | GAN8 |
Free | 81.0 | 85.0 | 87.0 | 82.0 | 79.0 | 87.0 | 87.0 | 83.0 |
Mixed in binary | 16.0 | 13.0 | 12.0 | 16.0 | 18.0 | 12.0 | 12.0 | 14.0 |
Mixed in ternary | 2.3 | 1.4 | 1.2 | 2.1 | 3.2 | 1.1 | 1.3 | 2.6 |
13.4.2 Dry Magnetic Separation Results - Gulçari A Norte (GAN)
The dry magnetic concentration tests were performed for the GAN 1, 2, 3, 4, 7 and 8 samples. The GAN 5 sample was not concentrated by dry separation because the C7 zone, from which this sample was composed does not contain significant vanadium, therefore, pre-concentration testing is not required. The GAN 6 sample has more than 50% magnetic, a value that meets the current requirements of the wet magnetic concentration process at the VMSA plant, so no dry magnetic concentration is necessary. The tests were carried out in a 1,500 Gauss drum magnetic separator. In each concentration test, the mass, contents and percentage of magnetic feed (GAN samples 1, 2, 3, 4, 7 and 8), concentrate (magnetic fraction) and tailings (non-magnetic fraction) were measured. The contents were analysed using X-ray fluorescence and the use of borate fused beads and the percentage of magnetics was measured using a Davis tube with an intensity of 1,500 Gauss. The results are shown in Table 13-21.
Table 13-21: Dry Magnetic Separation Results - Low Intensity.
Sample | Magnetic (%) | Magnetic
Recovery
(%) | Mass
Recovery
(%) | Enrichment |
Feed | Concentrate
(magnetic) | Tailings (non-
magnetic) |
GAN 1 | 22.4 | 39.53 | 2.02 | 95.9 | 54.4 | 1.76 |
GAN 2 | 32.1 | 46.50 | 1.27 | 98.7 | 68.2 | 1.45 |
GAN 3 | 28.0 | 49.12 | 2.15 | 96.5 | 55.0 | 1.76 |
GAN 4 | 20.9 | 34.66 | 1.19 | 97.7 | 58.9 | 1.66 |
GAN 7 | 21.1 | 38.10 | 0.68 | 98.5 | 54.5 | 1.81 |
GAN 8 | 16.3 | 25.62 | 1.24 | 97.1 | 61.8 | 1.57 |
Sample | V2O5 (%) | Recovery
V2O5 (%) | Mass
Recovery
(%) | Enrichment |
Feed | Magnetic | Non-magnetic |
GAN 1 | 0.71 | 1.35 | 0.07 | 95.2 | 49.8 | 1.91 |
GAN 2 | 0.56 | 1.15 | 0.03 | 97.4 | 47.1 | 2.07 |
GAN 3 | 0.59 | 0.98 | 0.04 | 97.3 | 58.8 | 1.65 |
GAN 4 | 0.43 | 0.77 | 0.03 | 97.2 | 54.1 | 1.80 |
GAN 7 | 0.26 | 0.49 | 0.01 | 98.7 | 53.0 | 1.86 |
GAN 8 | 0.24 | 0.40 | 0.02 | 96.9 | 57.7 | 1.68 |
Sample | TiO2 (%) | Recovery
TiO2 (%) | Mass
Recovery
(%) | Enrichment |
Feed | Concentrate | Tailings |
GAN 1 | 6.92 | 7.55 | 6.16 | 59.7 | 54.7 | 1.09 |
GAN 2 | 11.39 | 10.40 | 13.50 | 62.2 | 68.1 | 0.91 |
GAN 3 | 10.59 | 9.84 | 11.50 | 50.9 | 54.8 | 0.93 |
GAN 4 | 5.94 | 6.90 | 4.56 | 68.5 | 59.0 | 1.16 |
GAN 7 | 9.55 | 11.10 | 7.70 | 63.2 | 54.4 | 1.16 |
GAN 8 | 7.52 | 7.86 | 6.96 | 65.0 | 62.2 | 1.05 |
Additionally, the dry magnetic separation products were physically characterized, and the Wi (Bond Work Index) and the specific mass of the products were evaluated as shown in Table 13-22 below.
Table 13-22: Dry Magnetic Product - Wi and Specific Weight.
Sample | Wi (kWh/t) | Specific Weight (g/cm³) |
Concentrate | Concentrate | Tailings |
GAN 1 | 14.1 | 3.92 | 3.45 |
GAN 2 | 13.7 | 3.72 | 3.33 |
GAN 3 | 13.3 | 4.12 | 3.49 |
GAN 4 | 14.0 | 4.23 | 3.58 |
GAN 5 | 14.3 | 3.51 | - |
GAN 6 | 13.9 | 4.71 | - |
GAN 7 | 14.8 | 3.98 | 3.35 |
GAN 8 | 12.7 | 3.64 | 3.35 |
13.4.3 Wet Magnetic Separation - Gulçari A Norte (GAN)
As already mentioned in this report, VMSA's production process includes a grinding circuit, responsible for the liberation of magnetite minerals, integrated with wet magnetic separation in open circuit low-field magnetic separators, with one roughing step and two cleaning steps (Rougher+Cleaner+Recleaner). This same concentration method was used on a laboratory scale to evaluate the behaviour of the six dry magnetic separation concentrate samples generated from GAN samples 1, 2, 3, 4, 7 and 8, and for the original GAN 5 and 6 samples, which did not undergo dry concentration. Dry magnetic separation concentrates were renamed and labelled with the PCGAN code, replacing the GAN label. For example, the GAN 1 sample pre-concentrate will be labeled as PCGAN 1.
Before performing the wet tests, the eight samples were chemically characterized using X-ray fluorescence, as shown in Table 13-23 below.
Table 13-23: Chemical Analysis - Wet Magnetic Separation Feed.
Sample | Grade (%) | Magnetic
(%) |
V2O5* | SiO2 | Al2O3 | Fe | CaO | MgO | TiO2 | P | Na2O | K2O | Mn |
PCGAN 1 | 1.35 | 20.24 | 8.23 | 38.55 | 4.20 | 2.64 | 7.71 | 0.01 | 0.80 | 0.39 | 0.14 | 39.5 |
PCGAN 2 | 1.15 | 14.06 | 5.87 | 45.87 | 2.15 | 1.33 | 10.27 | 0.03 | 0.40 | 0.47 | 0.15 | 46.5 |
PCGAN 3 | 0.98 | 15.52 | 6.11 | 44.79 | 2.16 | 1.04 | 10.14 | 0.03 | 0.59 | 0.33 | 0.15 | 49.1 |
PCGAN 4 | 0.77 | 27.00 | 9.20 | 32.17 | 5.46 | 2.68 | 7.05 | 0.04 | 1.27 | 0.48 | 0.16 | 34.7 |
GAN 5 | 0.02 | 34.02 | 7.32 | 30.01 | 3.67 | 2.31 | 6.43 | 0.20 | 1.09 | 1.14 | 0.28 | 9.8 |
GAN 6 | 0.67 | 11.71 | 5.50 | 44.88 | 1.55 | 1.83 | 15.51 | 0.03 | 0.26 | 0.29 | 0.19 | 51.6 |
PCGAN 7 | 0.49 | 18.63 | 7.77 | 39.71 | 2.99 | 1.45 | 11.62 | 0.03 | 0.90 | 0.44 | 0.16 | 38.1 |
PCGAN 8 | 0.40 | 26.69 | 10.53 | 31.00 | 4.96 | 2.30 | 8.66 | 0.02 | 1.53 | 0.45 | 0.14 | 25.6 |
*V2O5 effective (considers only the vanadium contained in the magnetite). |
In order to perform the wet tests, the eight samples were ground so that the wet magnetic separation feed had 90% of the mass pass through 106 µm, a size defined as optimal for the liberation of magnetite. The concentration tests were carried out in three stages: rougher, cleaner and recleaner, all with a magnetic field with an intensity of 1,500 Gauss. The feed of each magnetic separation stage was done with 30% solids by weight. The non-magnetic tailings from the three stages were grouped together to form a single final non-magnetic tailing product.Table 13-24 present the wet magnetic separation results.
Table 13-24: Summary of Results - Wet Magnetic Separation.
Sample | Magnetic (%) | Recovery (%) |
Feed | Concentrate | Tailings | Magnetic | Mass |
PCGAN 1 | 39.50 | 95.14 | 0.16 | 99.8 | 43.1 |
PCGAN 2 | 46.50 | 95.35 | 0.13 | 99.9 | 52.1 |
PCGAN 3 | 49.10 | 95.33 | 0.03 | 99.9 | 49.1 |
PCGAN 4 | 34.70 | 95.51 | 0.07 | 99.9 | 30.1 |
GAN 5 | 9.80 | 90.02 | 0.20 | 98.2 | 11.0 |
GAN 6 | 51.60 | 94.13 | 0.03 | 99.9 | 48.9 |
PCGAN 7 | 38.10 | 93.18 | 0.03 | 99.9 | 41.5 |
PCGAN 8 | 25.60 | 93.89 | 0.03 | 99.9 | 28.9 |
Sample | V2O5 effective (%) | Recovery (%) |
Feed | Concentrate | Tailings | V2O5 | Mass |
PCGAN 1 | 1.35 | 3.27 | 0.006 | 99.8 | 43.1 |
PCGAN 2 | 1.15 | 2.32 | 0.003 | 99.9 | 52.1 |
PCGAN 3 | 0.98 | 1.98 | 0.001 | 99.9 | 49.1 |
PCGAN 4 | 0.77 | 2.34 | 0.002 | 99.9 | 30.1 |
GAN 5 | 0.02 | 0.13 | 0.000 | 98.2 | 11.0 |
GAN 6 | 0.67 | 1.33 | 0.000 | 99.9 | 48.9 |
PCGAN 7 | 0.49 | 1.17 | 0.000 | 99.9 | 41.5 |
PCGAN 8 | 0.40 | 1.49 | 0.001 | 99.9 | 28.9 |
Sample | TiO2 (%) | Recovery (%) |
Feed | Concentrate | Tailings | TiO2 | Mass |
PCGAN 1 | 7.71 | 4.03 | 10.50 | 22.5 | 43.1 |
PCGAN 2 | 10.27 | 4.73 | 16.30 | 24.0 | 52.1 |
PCGAN 3 | 10.14 | 4.17 | 15.90 | 20.2 | 49.1 |
PCGAN 4 | 7.05 | 3.96 | 8.38 | 16.9 | 30.1 |
GAN 5 | 6.43 | 3.07 | 6.85 | 5.3 | 11.0 |
GAN 6 | 15.51 | 7.67 | 23.00 | 24.2 | 48.9 |
PCGAN 7 | 11.62 | 6.15 | 15.50 | 22.0 | 41.5 |
PCGAN 8 | 8.66 | 6.13 | 9.68 | 20.5 | 28.9 |
13.4.4 Calcination - Gulçari A Norte (GAN)
The calcination tests were carried out in the VMSA laboratory, using concentrates produced in the wet magnetic separations described in this report. Each sample was characterized by X-ray fluorescence and a Davis tube, and then directed to calcination assays.
Table 13-25 presents the results of the chemical analysis of the concentrate samples that were called MGAN. In each test, a sample of concentrate was mixed with sodium carbonate (Na2CO3), in a proportion of 100 g of concentrate to 7 g of sodium carbonate, and then distributed in a metallic crucible forming a thin layer of the mixture. Each crucible with material was placed in a muffle oven heated to 1,150°C for 6 h. Every 55 min, the sample was removed to be homogenized and then placed back in the muffle. The homogenization process aims to provide a homogeneous calcination throughout the material and to increase the chances of the concentrate being in contact with the sodium carbonate, seeking to simulate the rotation of the industrial furnace that provides this contact. After calcination, the mixture, now called calcined material, was cooled and subjected to a disaggregation step, to eliminate any type of grain agglomeration that could interfere with the following steps.
Table 13-25: Chemical Analysis - Calcination Feed.
Sample | Grade (%) | Magnetic
(%) |
V2O5 | SiO2 | Al2O3 | Fe | CaO | MgO | TiO2 | P | Na2O | K2O | Mn |
MGAN 1 | 3.25 | 2.98 | 2.19 | 62.80 | 0.66 | 0.45 | 4.03 | 0.01 | <0.10 | <0.10 | 0.05 | 95.1 |
MGAN 2 | 2.29 | 2.43 | 1.98 | 63.50 | 0.36 | 0.21 | 4.73 | 0.02 | <0.10 | <0.10 | 0.04 | 95.4 |
MGAN 3 | 1.98 | 2.15 | 1.66 | 64.70 | 0.29 | 0.15 | 4.17 | 0.01 | <0.10 | <0.10 | 0.03 | 95.3 |
MGAN 4 | 2.32 | 3.35 | 2.02 | 62.70 | 0.91 | 0.38 | 3.96 | 0.07 | <0.10 | <0.10 | 0.06 | 95.5 |
MGAN 5 | 0.12 | 6.76 | 1.72 | 60.80 | 0.65 | 0.50 | 3.07 | 0.02 | <0.10 | 0.25 | 0.08 | 90.0 |
MGAN 6 | 1.32 | 2.00 | 2.63 | 61.80 | 0.23 | 0.43 | 7.67 | 0.01 | <0.10 | <0.10 | 0.06 | 94.1 |
MGAN 7 | 1.18 | 2.48 | 2.24 | 62.80 | 0.37 | 0.27 | 6.15 | 0.01 | <0.10 | <0.10 | 0.05 | 93.2 |
MGAN 8 | 1.18 | 2.50 | 2.22 | 62.30 | 0.37 | 0.27 | 6.13 | 0.01 | <0.10 | <0.10 | 0.04 | 93.9 |
After disaggregation, the sample was homogenized and divided to carry out leaching tests using 50 g of each sample. To carry out this leaching test, each sample was mixed with 1 liter of water at 70°C in a 2 liter beaker, forming a pulp that was stirred for 1 h by a mechanical stirrer, and heated on an electric plate to maintain the temperature of the pulp at 70 °C. After stirring, the pulp was filtered and the resulting mass re-emerged in 900 ml of water at 70°C, forming a new pulp that was stirred for another 15 minutes. After this step, the pulp was filtered again, and the cake formed was washed with 500 ml of water at room temperature. The filtered solids, called the washed sample, are dried and analysed by X-ray fluorescence.
The purpose of this test is to assess how much of the vanadium present in each sample can be leached into water. This evaluation indicates what recovery is possible in calcination. The equation that calculates calcination recovery is:
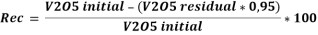
- Initial V2O5: V2O5 in the calcined, determined by the initial chemical analysis right after calcination;
- Residual V2O5: V2O5 of the calcined leached after filtering and washing the cake, determined by chemical analysis of the cake;
- Factor 0.95 of the formula: represents an estimated 5% reduction in the initial mass of calcined concentrate due to dissolution (leaching).
Two calcination tests were carried out with each sample from the Gulçari A Norte deposit. Table 13-26 summarizes the results of each test.
Table 13-26: Calcination Results.
Sample | Test | V2O5 (%) | Recovery (%) |
Calcined Sample | Washed
Sample | Per Test | Average |
GAN 1 | A | 2.78 | 0.40 | 86.3 | 85.0 |
B | 2.63 | 0.46 | 83.6 |
GAN 2 | A | 1.98 | 0.32 | 84.8 | 86.8 |
B | 1.98 | 0.24 | 88.7 |
GAN 3 | A | 1.79 | 0.42 | 78.0 | 83.8 |
B | 1.79 | 0.20 | 89.5 |
GAN 4 | A | 2.21 | 0.36 | 84.6 | 82.5 |
B | 1.85 | 0.38 | 80.4 |
GAN 6 | A | 0.97 | 0.20 | 80.7 | 84.7 |
B | 1.22 | 0.15 | 88.7 |
GAN 7 | A | 0.90 | 0.29 | 69.3 | 67.3 |
B | 1.01 | 0.37 | 65.3 |
GAN 8 | A | 1.34 | 0.80 | 43.5 | 35.0 |
B | 1.22 | 0.94 | 26.4 |
Additionally, preliminary wet magnetic separation tests were carried out with the MGAN 8 sample in order to reduce the SiO2 content, resulting in a magnetite concentrate with less than 1.5% SiO2.
13.4.5 Leaching and Chemical Treatment - Gulçari A Norte (GAN)
Considering that, after calcination, the material obtained in the laboratory has a chemical composition very similar to that of the calcined product currently produced at the Maracás Menchen Mine plant, it can be assumed that the subsequent leaching and chemical treatment processes will behave in a similar way in relation to the bodies represented by the samples GAN 1 to GAN 8 (except GAN 5 which was not tested).
Based on this premise, the recovery results achieved in 2019 can be considered in the calculation of global vanadium recovery, as shown in Table 13-27 below.
Table 13-27: Leaching and Chemical Treatment.
Process | Recovery V2O5
(effective) (%) |
Leaching | 96.8% |
Chemical Treatment | 96.8% |
13.4.6 Global Recovery of Vanadium - Gulçari A Norte (GAN)
Global vanadium recovery is the multiplication of all sequential recoveries of the current process route, that is, dry Crushing/Magnetic Separation recovery, wet Grinding/Magnetic Separation recovery, Calcination recovery, Leach recovery and recovery of Chemical Plant, according to the equation below.Table 13-28 presents the V2O5 recovery test results.
RGlobal = RCrushing * RGrinding * Rcalcination * RLeaching *RChemical Treatment
Table 13-28: Summary - V2O5 Recoveries.
Samples | 1 | 2 | 3 | 4 | 5 | 6 | 7 | 8 |
Estimated Proportion of V2O5 in Deposit (%) | 8.4 | 10.0 | 8.7 | 9.5 | 0.7 | 7.3 | 8.0 | 47.6 |
Grade of Concentrate (%V2O5) | 3.3 | 2.3 | 2.0 | 2.3 | 0.1 | 1.3 | 1.2 | 1.5 |
Recovery by Area/Process (%) | Crushing/Dry Magnetic Concentration | 95.2 | 97.4 | 97.3 | 97.2 | 100.0 | 100.0 | 98.7 | 96.9 |
Grinding/Wet Magnetic Concentration | 99.8 | 99.9 | 99.9 | 99.9 | 98.2 | 99.9 | 99.9 | 99.9 |
Calcination | 85.0 | 86.8 | 83.8 | 82.5 | - | 84.7 | 67.3 | 73.6 |
Leaching | 96.8 | 96.8 | 96.8 | 96.8 | - | 96.8 | 96.8 | 96.8 |
Chemical Plant/Purification and Precipitation | 96.8 | 96.8 | 96.8 | 96.8 | - | 96.8 | 96.8 | 96.8 |
Global | 75.7 | 79.1 | 76.3 | 75.1 | - | 79.3 | 62.2 | 66.8 |
13.4.7 Recovery of Titanium - Gulçari A Norte (GAN)
Titanium recovery studies in the Gulçari A Norte deposit, described in this report, were based on the premise that this metal is a by-product of the V2O5 production process, as well as the TiO2 recoveries obtained in the dry and wet magnetic concentration steps are a consequence of the need to recover V2O5, without any optimization having been carried out to recover more TiO2.
Previous studies show that the titanium present in the Gulçari A deposit is associated with ilmenite. The same studies indicate that the use of flotation with a carboxylic acid-based collector (Flotinor 10068) and non-ionic co-collector (DP-OMC-1178) is capable of selectively recovering the ilmenite contained in the wet waste of the magnetic separation process. Thus, it was decided to use the same parameters indicated in the studies mentioned to carry out flotation tests with the Gulçari A Norte deposit, whose geological formation is similar to that of the Gulçari A deposit.
Eight samples of non-magnetic tailings were formed after the wet magnetic concentration tests described earlier in this report. These samples were respectively called RGAN 1, RGAN 2. up to RGAN 8. All samples were chemically characterized using X-ray fluorescence and use of borate fused beads.Table 13-29 presents the results of the chemical analysis of the flotation feed samples.
Table 13-29: Chemical Analysis - Desliming Feed.
Sample | (%) |
V2O5 | SiO2 | Al2O3 | Fe | CaO | MgO | TiO2 | P | Na2O | K2O | Mn |
RGAN 1 | 0.32 | 33.30 | 12.80 | 20.20 | 6.87 | 4.29 | 10.50 | 0.015 | 1.44 | 0.62 | 0.21 |
RGAN 2 | 0.22 | 26.70 | 10.10 | 26.70 | 4.10 | 2.54 | 16.30 | 0.042 | 0.85 | 0.87 | 0.26 |
RGAN 3 | 0.14 | 28.40 | 10.40 | 25.60 | 3.97 | 1.89 | 15.90 | 0.049 | 1.22 | 0.60 | 0.26 |
RGAN 4 | 0.24 | 37.20 | 12.30 | 19.00 | 7.42 | 3.67 | 8.38 | 0.022 | 1.74 | 0.65 | 0.21 |
RGAN 5 | <0.10 | 37.40 | 8.01 | 26.20 | 4.04 | 2.53 | 6.85 | 0.225 | 1.13 | 1.21 | 0.31 |
RGAN 6 | <0.10 | 21.00 | 8.24 | 28.70 | 2.82 | 3.17 | 23.00 | 0.043 | 0.41 | 0.50 | 0.31 |
RGAN 7 | <0.10 | 30.10 | 11.70 | 23.30 | 4.85 | 2.28 | 15.50 | 0.042 | 1.45 | 0.65 | 0.23 |
RGAN 8 | 0.14 | 36.50 | 13.90 | 18.30 | 6.82 | 3.13 | 9.68 | 0.029 | 2.11 | 0.60 | 0.18 |
The flotation tests were carried out with Flotinor 10068 reagents (Clariant industrial mixture containing carboxylic acids) which acts as a collector, DP-OMC-1178 (BASF non-ionic polymer) which acts as a co-collector, and fluosilicic acid (H2SiF6) to regulate the pH to 4. All tests were performed only on the fraction retained in 20 µm of samples RGAN 1 to RGAN 8.
The desliming at 20 µm was performed using a vibrating sieve in wet operation. The oversize product and the undersize slurry from each sample were analysed by X-ray fluorescence with the use of borate fused beads. Table 13-30 presents the results obtained from these analyses.
Table 13-30: Chemical Analysis - Desliming.
Sample | TiO2 (%) | Recovery
TiO2 (%) | Mass
Recovery
(%) |
Feed | Oversize | Undersize |
RGAN 1 | 10.30 | 10.50 | 10.00 | 61.0 | 59.8 |
RGAN 2 | 16.93 | 17.50 | 16.20 | 58.2 | 56.3 |
RGAN 3 | 15.62 | 17.50 | 13.30 | 62.0 | 55.3 |
RGAN 4 | 8.41 | 8.81 | 7.64 | 69.0 | 65.9 |
RGAN 5 | 6.67 | 6.92 | 6.09 | 73.0 | 70.4 |
RGAN 6 | 22.97 | 23.40 | 22.10 | 68.3 | 67.0 |
RGAN 7 | 15.10 | 15.10 | 15.10 | 68.3 | 68.3 |
RGAN 8 | 9.69 | 10.30 | 8.27 | 74.4 | 70.0 |
For flotation, a Denver D12 bench flotation machine was used, with 2.5 L tanks, 1,000 rpm rotation. All products generated were analysed using X-ray fluorescence with the use of borate fused beads.
In all tests, a 10-minute attrition step at 50% solids by weight was applied, followed by a 2-minute pre-conditioning with fluosilicic acid and the reagent DP-OMC-1178, added in a unique way in this step. The Flotinor 10068 collector, on the other hand, was dosed in a staged way, with the addition divided equally between each of the conditionings that preceded the froth collections. Thus, a test with a dosage of 200 g/t of collector in 4 conditioning stages had the addition of 50 g/t in each stage.
Table 13-31 indicates that the titanium contained in GGAN samples 1 to 8, which represent the non-magnetic tailings of the wet concentration of the Gulçari A Norte deposit, can be concentrated by flotation. The recoveries achieved varied considerably between tests and zones. Considering the result of the third collection of each test, it can be said that the average recovery and content for each sample can be assumed as presented in Table 13-32 below.
Table 13-31: Flotation Results.
Sample | Test | Reagent concentration (g/t) | Collect | Concentrate
TiO2 (%) | Recovery
TiO2 (%) |
Flotinor 10068 | DP-OMC-1178 |
GGAN 1 | A | 200 | 400 | 1 | 33.30 | 40.9 |
2 | 28.60 | 71.2 |
3 | 24.00 | 80.4 |
B | 200 | 400 | 1 | 38.10 | 36.4 |
2 | 36.30 | 53.9 |
3 | 33.90 | 64.1 |
GGAN 2 | A | 200 | 400 | 1 | 38.30 | 23.2 |
2 | 36.90 | 38.0 |
3 | 35.46 | 45.9 |
B | 200 | 400 | 1 | 40.80 | 19.4 |
2 | 39.60 | 30.6 |
3 | 38.10 | 41.7 |
GGAN 3 | A | 200 | 400 | 1 | 42.10 | 20.7 |
2 | 41.40 | 26.7 |
3 | 41.00 | 30.4 |
B | 200 | 400 | 1 | 40.30 | 4.8 |
2 | 39.40 | 8.6 |
3 | 38.50 | 12.5 |
GGAN 4 | A | 200 | 400 | 1 | 23.00 | 18.6 |
2 | 21.70 | 26.0 |
3 | 20.20 | 32.1 |
B | 200 | 400 | 1 | 21.20 | 12.2 |
2 | 20.40 | 18.0 |
3 | 19.00 | 23.3 |
Sample | Test | Reagent concentration (g/t) | Collect | Concentrate
TiO2 (%) | Recovery
TiO2 (%) |
Flotinor 10068 | DP-OMC-1178 |
GGAN 5 | A | 200 | 400 | 1 | 21.80 | 33.6 |
2 | 19.90 | 51.4 |
3 | 18.10 | 58.8 |
B | 200 | 400 | 1 | 8.70 | 19.3 |
2 | 8.40 | 28.3 |
3 | 8.10 | 36.0 |
GGAN 6 | A | 200 | 400 | 1 | 34.10 | 22.6 |
2 | 32.80 | 36.1 |
3 | 32.10 | 42.7 |
B | 200 | 400 | 1 | 34.10 | 24.6 |
2 | 32.40 | 42.6 |
3 | 30.20 | 55.5 |
GGAN 7 | A | 200 | 400 | 1 | 31.80 | 24.7 |
2 | 30.70 | 35.8 |
3 | 30.10 | 45.6 |
B | 200 | 400 | 1 | 39.70 | 19.3 |
2 | 38.90 | 38.2 |
3 | 37.50 | 57.2 |
GGAN 8 | A | 200 | 400 | 1 | 25.00 | 10.5 |
2 | 24.40 | 14.4 |
3 | 24.20 | 18.1 |
B | 200 | 400 | 1 | 30.10 | 7.7 |
2 | 29.20 | 11.8 |
3 | 27.90 | 16.6 |
Table 13-32: Summary of Results - Collect 3 - Flotation.
Sample | Collect 3 - Average Results |
Concentrate TiO2 (%) | Recovery TiO2 (%) |
GGAN 1 | 29.00 | 72.3 |
GGAN 2 | 36.80 | 43.8 |
GGAN 3 | 39.80 | 21.5 |
GGAN 4 | 19.60 | 27.7 |
GGAN 5 | 13.10 | 47.4 |
GGAN 6 | 31.20 | 49.1 |
GGAN 7 | 33.80 | 51.4 |
GGAN 8 | 26.10 | 17.4 |
In order to reassess the flotation efficiency for these samples, further tests were carried out, this time at the VMSA laboratory. Table 13-33 presents the test conditions and the results obtained.
Table 13-33: Summary of Results - Flotation VMSA Lab.
Sample | Reagent Concentration (g/t) | Concentrate
TiO2 (%) | Recovery
TiO2 (%) |
Flotinor 10068 | DP-
OMC-
1178 |
GGAN 1 | 200 | 400 | 46.40 | 88.6 |
GGAN 2 | 400 | 400 | 44.80 | 94.1 |
GGAN 3 | 400 | 400 | 43.60 | 92.5 |
GGAN 4 | 200 | 400 | 42.10 | 82.2 |
GGAN 5 | 200 | 400 | 39.40 | 83.5 |
GGAN 6 | 500 | 500 | 45.60 | 98.3 |
GGAN 7 | 200 | 400 | 41.60 | 96.1 |
GGAN 8 | 200 | 400 | 42.50 | 89.7 |
Global recovery is the multiplication of all sequential recoveries of the proposed process route, that is, Crushing/Dry Magnetic Separation, Grinding/Wet Magnetic Separation, Desliming and Flotation recoveries.Table 13-34 to Table 13-36 present the magnetic separation results.
RGlobal = RCrushing x RGrinding x RDesliming x RFlotation
Table 13-34: Summary of Results - Dry Magnetic Separation - Titanium Recoveries.
Sample | TiO2 (%) | Recovery
TiO2 (%) | Mass
Recovery
(%) |
Feed | Concentrate | Tailings |
GAN 1 | 6.92 | 7.55 | 6.16 | 59.7 | 54.7 |
GAN 2 | 11.39 | 10.40 | 13.50 | 62.2 | 68.1 |
GAN 3 | 10.59 | 9.84 | 11.50 | 50.9 | 54.8 |
GAN 4 | 5.94 | 6.90 | 4.56 | 68.5 | 59.0 |
GAN 5 | 6.43 | 6.43 | - | 100.0 | 100.0 |
GAN 6 | 15.51 | 15.51 | - | 100.0 | 100.0 |
GAN 7 | 9.55 | 11.10 | 7.70 | 63.2 | 54.4 |
GAN 8 | 7.52 | 7.86 | 6.96 | 65.0 | 62.2 |
Table 13-35: Summary of Results - Wet Magnetic Separation - Titanium Recoveries.
Sample | TiO2 (%) | Recovery (%) |
Feed | Magnetic
Concentrate | Tailings | TiO2 | Mass |
Non-magnetic |
PCGAN 1 | 7.71 | 4.03 | 10.50 | 77.5 | 56.9 |
PCGAN 2 | 10.27 | 4.73 | 16.30 | 76.0 | 47.9 |
PCGAN 3 | 10.14 | 4.17 | 15.90 | 79.8 | 50.9 |
PCGAN 4 | 7.05 | 3.96 | 8.38 | 83.1 | 69.9 |
GAN 5 | 6.43 | 3.07 | 6.85 | 94.7 | 89.0 |
GAN 6 | 15.51 | 7.67 | 23.00 | 75.8 | 51.1 |
PCGAN 7 | 11.62 | 6.15 | 15.50 | 78.0 | 58.5 |
PCGAN 8 | 8.66 | 6.13 | 9.68 | 79.5 | 71.1 |
Table 13-36: Summary of Results - Titanium Recoveries by Area/Process.
Sample | 1 | 2 | 3 | 4 | 5 | 6 | 7 | 8 |
Estimated Proportion of TiO2 in the Deposit (%) | 3.49 | 5.78 | 9.15 | 6.61 | 4.99 | 9.78 | 11.12 | 49.07 |
Concentrate TiO2 (%) | 46.40 | 44.80 | 43.60 | 42.10 | 39.40 | 45.60 | 41.60 | 42.50 |
Recovery by Area/Process (%) | Crushing/Dry Magnetic Concentration | 59.7 | 62.2 | 50.9 | 68.5 | 100.0 | 100.0 | 63.2 | 65.0 |
Grinding/Wet Magnetic Concentration | 77.5 | 76.0 | 79.8 | 83.1 | 94.7 | 75.8 | 78.0 | 79.5 |
Desliming | 77.5 | 77.5 | 77.5 | 77.5 | 77.5 | 77.5 | 77.5 | 77.5 |
Flotation | 88.6 | 94.1 | 92.5 | 82.2 | 83.5 | 98.3 | 96.1 | 89.7 |
Global | 31.8 | 34.5 | 29.1 | 36.3 | 61.3 | 57.7 | 36.7 | 35.9 |
13.5 Metallurgical Recovery of Vanadium and Titanium of Ore from Novo Amparo Norte
The metallurgical tests with samples from the Novo Amparo Norte (NAN) deposit were carried out at the laboratories of SGS Geosol in Belo Horizonte, Brazil and VMSA at the project site with samples from the lithologies named M3, M4 and M5 during the period from March 2019 to June 2020. Tests showed that vanadium is associated with magnetite and metallurgical recoveries of this metal can reach up to 77%. The test results from the sample (named HBPC) showed that the titanium present in the NAN deposit is associated with ilmenite, making it possible to recover 78% of the titanium present in the waste from the wet magnetic concentration process, resulting in an overall recovery of 58% titanium in the original sample, which corresponds to the run of mine (ROM). The HBPC sample represents the probable feed of the plant, a blend of M3 and M4 lithologies in the proportion of 43% and 57%, respectively.
It was possible to conclude that it is technically feasible to recover the vanadium present in the Novo Amparo Norte deposit using the concentration methods already used in the VMSA plant, such as magnetic concentration and calcination, and that the titanium present in the same deposit can be produced as a by-product from wet magnetic concentration tailings, using desliming followed by flotation.
Table 13-37 and Table 13-38 below summarize the expected vanadium and titanium recoveries by step of the concentration processes.
Table 13-37: Summary of V2O5 Recoveries - Novo Amparo Norte (NAN).
Area/Process | Recovery per Sample V2O5
(%) | Recovery
(Reserve)
V2O5 (%) |
M3 | M4 | M5 | HBPC |
Crushing/Dry Magnetic Concentration | 95.0 | 100.0 | 93.0 | 93.8 | 96.0 |
Grinding/Wet Magnetic Concentration | 97.2 | 97.9 | 95.5 | 95.7 | 97.0 |
Calcination | 83.0 | 84.0 | 71.9 | 80.6 | 80.0 |
Leaching | 97.5 | 97.5 | 97.5 | 97.5 | 97.0 |
Chemical Plant/Purification and Precipitation | 96.7 | 96.7 | 96.7 | 96.7 | 97.0 |
Global | 72.3 | 77.5 | 60.2 | 68.2 | 70.0 |
Table 13-38: Summary of TiO2 Recoveries - Novo Amparo Norte (NAN).
Area/Process | Recovery per Sample TiO2 (%) | Recovery
(Reserve)
TiO2 (%) |
M3 | M4 | M5 | HBPC |
Crushing/Dry Magnetic Concentration | 83.0 | 100.0 | 84.0 | 82.0 | 90.0 |
Grinding/Wet Magnetic Concentration | 92.0 | 83.0 | 94.0 | 89.0 | 89.0 |
Desliming | 83.0 | 98.0 | 88.0 | 96.0 | 90.0 |
Flotation | 89.0 | 83.0 | 45.0 | 81.0 | 74.0 |
Global | 56.0 | 68.0 | 31.0 | 58.0 | 54.0 |
13.5.1 Sample Characterization - Novo Amparo Norte
Chemical characterization was performed using X-ray fluorescence with the use of borate fused beads. The result of these analysis is detailed in Table 13-39 below:
Table 13-39: Particle Size Distribution and Chemical - Samples M3, M4 and M5.
SAMPLE M3 |
Size
(µm) | Mass
(%) | (%) | LOI
(%) |
V2O5 | SiO2 | Al2O3 | Fe2O3 | CaO | MgO | TiO2 | P2O5 | Na2O | K2O | MnO |
212 | 47.80 | 0.51 | 38.60 | 15.60 | 26.70 | 6.83 | 1.82 | 5.06 | 0.03 | 2.81 | 0.88 | 0.19 | -0.25 |
-62 | 13.30 | 0.62 | 35.40 | 13.30 | 33.10 | 7.02 | 2.31 | 6.16 | 0.05 | 2.13 | 0.69 | 0.22 | -0.55 |
-44 | 11.40 | 0.60 | 34.80 | 12.70 | 33.40 | 6.99 | 2.37 | 6.26 | 0.05 | 1.95 | 0.62 | 0.22 | -0.68 |
-16 | 2.53 | 0.63 | 33.90 | 12.20 | 34.40 | 6.88 | 2.27 | 6.64 | 0.08 | 1.83 | 0.58 | 0.23 | -0.62 |
-15 | 2.94 | 0.59 | 34.80 | 12.60 | 33.30 | 7.18 | 2.40 | 6.29 | 0.07 | 1.92 | 0.59 | 0.24 | -0.53 |
-22 | 6.40 | 0.61 | 34.40 | 12.50 | 33.70 | 7.23 | 2.38 | 6.37 | 0.08 | 1.85 | 0.57 | 0.24 | -0.45 |
-15 | 2.58 | 0.69 | 31.10 | 11.30 | 37.30 | 7.03 | 2.31 | 7.52 | 0.09 | 1.53 | 0.49 | 0.24 | -0.74 |
-38 | 13.00 | 0.52 | 35.10 | 13.50 | 30.30 | 7.40 | 2.36 | 5.64 | 0.07 | 2.06 | 0.64 | 0.22 | 0.29 |
Global | 100.00 | 0.57 | 36.80 | 14.40 | 30.40 | 7.03 | 2.14 | 5.65 | 0.04 | 2.30 | 0.75 | 0.20 | -0.09 |
SAMPLE M4 |
Size
(µm) | Mass
(%) | (%) | LOI
(%) |
V2O5 | SiO2 | Al2O3 | Fe2O3 | CaO | MgO | TiO2 | P2O5 | Na2O | K2O | MnO |
212 | 22.6 | 1.15 | 13 | 6.29 | 63.8 | 2.06 | 0.97 | 12.7 | 0.03 | 0.61 | 0.36 | 0.27 | -2.2 |
-62 | 20.5 | 1.08 | 14.4 | 6.6 | 62.4 | 2.41 | 1.1 | 12.9 | 0.06 | 0.64 | 0.36 | 0.28 | -2.38 |
-44 | 15.6 | 1.03 | 15.9 | 7.1 | 60.6 | 2.77 | 1.28 | 13.2 | 0.04 | 0.71 | 0.38 | 0.3 | -1.88 |
-16 | 5.11 | 0.92 | 17.4 | 7.67 | 57.3 | 3.09 | 1.42 | 12.3 | 0.05 | 0.73 | 0.42 | 0.29 | -1.94 |
-15 | 4.32 | 0.95 | 17.6 | 7.77 | 58.4 | 3.21 | 1.44 | 12.8 | 0.05 | 0.74 | 0.39 | 0.31 | -1.95 |
-22 | 8.47 | 0.91 | 16.7 | 7.43 | 57.6 | 3.11 | 1.38 | 12.7 | 0.06 | 0.65 | 0.31 | 0.31 | -2.01 |
-15 | 4.63 | 0.95 | 15.5 | 7.04 | 59.8 | 2.99 | 1.3 | 13.5 | 0.06 | 0.55 | 0.25 | 0.32 | -2.03 |
-38 | 18.8 | 0.71 | 20.4 | 8.68 | 50.7 | 3.48 | 1.76 | 11.8 | 0.08 | 0.8 | 0.4 | 0.26 | -0.54 |
Global | 100 | 0.95 | 17.6 | 7.65 | 57.4 | 2.91 | 1.45 | 12.1 | 0.04 | 0.73 | 0.43 | 0.27 | -1.58 |
SAMPLE M5 |
Size
(µm) | Mass
(%) | (%) | LOI
(%) |
V2O5 | SiO2 | Al2O3 | Fe2O3 | CaO | MgO | TiO2 | P2O5 | Na2O | K2O | MnO |
212 | 37 | 0.22 | 29.1 | 12.4 | 40.8 | 4.12 | 0.91 | 10.2 | 0.03 | 2.15 | 0.6 | 0.23 | -0.94 |
-62 | 14.4 | 0.22 | 28.4 | 11.9 | 41.8 | 4.3 | 1.05 | 10 | 0.07 | 1.94 | 0.52 | 0.25 | -0.95 |
-44 | 12.83 | 0.21 | 28.4 | 11.9 | 41.3 | 4.49 | 1.17 | 9.49 | 0.05 | 1.81 | 0.49 | 0.26 | 0.39 |
-16 | 3.25 | 0.21 | 30 | 12.5 | 41.2 | 4.86 | 1.26 | 9.02 | 0.06 | 1.85 | 0.48 | 0.29 | -0.88 |
-15 | 3.46 | 0.2 | 29.5 | 12.3 | 40.3 | 4.85 | 1.28 | 8.78 | 0.06 | 1.79 | 0.46 | 0.28 | -0.8 |
-22 | 8.12 | 0.18 | 30.5 | 12.8 | 39.7 | 4.98 | 1.32 | 8.35 | 0.07 | 1.84 | 0.46 | 0.29 | -0.71 |
-15 | 3.56 | 0.2 | 28.9 | 12.1 | 41.3 | 4.96 | 1.27 | 9.01 | 0.08 | 1.61 | 0.39 | 0.32 | -1.09 |
-38 | 17.4 | 0.16 | 32.7 | 13.4 | 35.3 | 4.68 | 1.43 | 7.45 | 0.07 | 1.94 | 0.55 | 0.23 | 1.27 |
Global | 100 | 0.2 | 31.1 | 12.9 | 38.6 | 4.64 | 1.27 | 8.71 | 0.04 | 2.06 | 0.54 | 0.25 | -0.4 |
The mineralogical characterization was performed only for the HBPC sample, composed of pre-concentrates (non-magnetic dry) from lithologies M3 and M4. X-ray diffraction and liberation analyzes were performed on the HPPC sample after cyclone desliming, using QEMSCAN, at the SGS LAKEFIELD laboratory, located in Canada. Analysis results are present in Table 13-40 and Table 13-41
Table 13-40: Mineralogical Analysis - Sample HBPC (M3 and M4).
Mineral | Mass (%) |
Iron Oxides | 32.7 |
Amphibole | 22.2 |
Ilmenite | 18.8 |
Plagioclase | 10.5 |
Garnet | 7.6 |
K-feldspar | 1.81 |
Biotite | 1.43 |
Chlorite | 1.22 |
Others | 3.74 |
Table 13-41: Liberation Analysis - Sample HBPC (M3 and M4).
Mineral | Liberation (%) |
Cyclone
Underflow | (-150+106) µm | (-106+90) µm | (-90+75) µm | (-75+38) µm |
Iron Oxides | 87,6 | 89,0 | 90,3 | 85,6 | 85,5 |
Ilmenite | 87,5 | 83,5 | 87,1 | 88,5 | 91,3 |
Table 13-42 below presents the results of the Bond Work Index (Wi) of the pre-concentrates of samples M3, M4 and HBPC and the Bond Abrasiveness Index (Ai) of the samples M3, M4 and M5.
Table 13-42: Work Index and Abrasiveness Index.
Bond Work Index (Wi) - Ball Mill |
Sample | Wi (kWh/t) |
Pre-concentrate (M3PC) | 17.60 |
Pre-concentrate (M4PC) | 15.90 |
HBPC | 16.80 |
Bond Abrasiveness Index (Ai) |
Sample | Ai (g) |
M3 | 0.032 |
M4 | 0.018 |
M5 | 0.025 |
13.5.2 Dry Magnetic Separation Tests - Novo Amparo Norte
The dry magnetic separation tests were carried out in June 2019. To evaluate the magnetic recovery process and the metallurgical recovery by lithology the core samples were crushed to -12.5 mm particle size and submitted to dry magnetic separation tests.
For each NAN ore lithology sample, an equipment set-up was evaluated to produce a theoretical mass and metallurgical recovery limited to a maximum 4% loss of magnetics in the tailings.
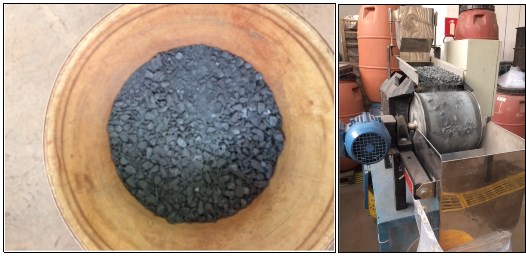
Figure 13.1: Crushed NAN ore (-12.5mm) and Dry Magnetic Separation Process in Drum Magnetic Separator (Low Intensity)
Three tests were performed per sample, the results of which are shown in Table 13-43 below.
Table 13-43: Dry Magnetic Separation by Set Up - Mass Recovery, Magnetic Recovery and Enrichment.
Sample M3 |
Test | Mass
Recovery
(%) | Feed (%
Magnetic) | Concentrate (%
Magnetic) | Tailings (%
Magnetic) | Enrichment | Magnetic
Recovery
(%) |
Set up 02 | 46.79 | 12.95 | 19.62 | 5.99 | 1.52 | 70.89 |
Set up 01 | 64.69 | 12.95 | 17.64 | 4.12 | 1.36 | 88.12 |
Set up 03 | 76.92 | 12.95 | 15.99 | 1.75 | 1.23 | 94.98 |
Sample M4 |
Test | Mass
Recovery
(%) | Feed (%
Magnetic) | Concentrate
(%
Magnetic) | Tailings (%
Magnetic) | Enrichment | Magnetic
Recovery
(%) |
Set up 02 | 77.14 | 37.62 | 45.24 | 18.94 | 1.2 | 92.76 |
Set up 01 | 87.07 | 37.62 | 41.85 | 13.38 | 1.11 | 96.86 |
Set up 03 | 91.77 | 37.62 | 40.96 | 6.06 | 1.09 | 99.92 |
Sample M5 |
Test | Mass
Recovery
(%) | Feed (%
Magnetic) | Concentrate (%
Magnetic) | Tailings (%
Magnetic) | Enrichment | Magnetic
Recovery
(%) |
Set up 02 | 49.85 | 15.4 | 22.82 | 8.36 | 1.48 | 73.87 |
Set up 01 | 70.49 | 15.4 | 19.12 | 5.88 | 1.24 | 87.52 |
Set up 03 | 83.53 | 15.4 | 17.83 | 3.65 | 1.16 | 96.71 |
It was found that the lithology represented by sample M4 already contains sufficient magnetic percentage to proceed to grinding without the need to be subjected to dry magnetic separation. Table 13-44 shows a summary of the interpretation of the test results with the three lithologies and the magnetic and vanadium recoveries possible to be obtained in the industrial process.
Table 13-44: Dry Magnetic Separation - Summary of Results.
Sample M3 |
Flux | Mass
(kg) | (%) | Recovery (%) |
Magnetic | V2O5 | Magnetic | V2O5 |
Feed | 59.4 | 12.80 | 0.37 | 93.79% | 95.08% |
Concentrate (Magnetic) | 43.1 | 16.56 | 0.49 |
Non-magnetic | 16.3 | 2.89 | 0.07 |
Sample M5 |
Flux | Mass
(kg) | (%) | Recovery (%) |
Magnetic | V2O5 | Magnetic | V2O5 |
Feed | 59.8 | 15.77 | 0.14 | 93.44% | 92.96% |
Concentrate (Magnetic) | 45.7 | 19.28 | 0.17 |
Non-magnetic | 14.1 | 4.38 | 0.04 |
Sample M4 |
Flux | Mass
(kg) | (%) | Recovery (%) |
Magnetic | V2O5 | Magnetic | Metallurgical |
Feed | - | 36.5 | 0.82 | 100% | 100% |
13.5.3 Wet Magnetic Separation Assays - Novo Amparo Norte
The VMSA process route considers a grinding circuit, responsible for the magnetite liberation, integrated to a wet magnetic separation in low-field magnetic separators in an open circuit of a rougher step followed by two cleaner steps.
The recovery of Grinding and Wet Magnetic Separation was calculated based on a pilot test of wet magnetic separation.
A milling curve was determined for each lithology, in order to meet the premise of magnetic separation feed size at P90 = 106µm, which size is defined as optimal for the liberation of magnetite. From the pre-concentrate (M3 and M5) and ore (M4) ground in this size, the material was fed in wet magnetic separation tests.
The wet tests were performed in a circuit similar to the current plant's magnetic separation circuit, with one rougher step and two cleaner steps. In Table 13-45, a summary of the results of the low intensity wet magnetic separation tests.
Table 13-45: Wet Magnetic Separation - Summary of Results.
Sample Pre-concentrate (M3) |
Flux | Mass
(kg) | (%) | Recovery (%) |
Magnetic | V2O5 | Magnetic | V2O5 |
Feed | 30.0 | 18.38 | 0.55 | 99.53% | 99.17% |
Concentrate (Magnetic) | 5.7 | 96.08 | 2.86 |
Non-magnetic | 24.3 | 0.11 | 0.01 |
Sample Pre-concentrate (M4) |
Flux | Mass
(kg) | (%) | Recovery (%) |
Magnetic | V2O5 | Magnetic | V2O5 |
Feed | 30.0 | 38.31 | 0.83 | 99.84% | 99.87% |
Concentrate (Magnetic) | 12.1 | 94.63 | 2.05 |
Non-magnetic | 17.9 | 0.10 | 0.002 |
Sample Pre-concentrate (M5) |
Flux | Mass
(kg) | (%) | Recovery (%) |
Magnetic | V2O5 | Magnetic | V2O5 |
Feed | 30.0 | 18.17 | 0.19 | 99.36% | 97.44% |
Concentrate (Magnetic) | 5.7 | 95.12 | 0.96 |
Non-magnetic | 24.3 | 0.14 | 0.01 |
Sample Pre-concentrate (HBPC) |
Flux | Mass
(kg) | (%) | Recovery (%) |
Magnetic | V2O5 | Magnetic | V2O5 |
Feed | 30 | 27.70 | 0.66 | 99.74% | 99.70% |
Concentrate (Magnetic) | 8.5 | 97.87 | 2.34 |
Non-magnetic | 21.5 | 0.09 | 0.003 |
13.5.4 Calcination Tests - Novo Amparo Norte
In June 2019, calcination tests were carried out in a muffle oven at the VMSA laboratory on samples of magnetic concentrate from the Novo Amparo Norte ore (NAN) separated by lithology (M3 concentrate, M4 concentrate and M5 concentrate). The concentrate work carried out at the SGS Geosol facility included crushing, dry magnetic separation, milling and wet magnetic separation tests.
The standard procedure defined for the calcination tests in a muffle oven was defined with the following steps. A concentrate sample (80g) is mixed with sodium carbonate (Na2CO3). The mixture is then taken to the muffle oven, which is already heated to the calcination temperature required for the test (1,050°C). The time of this test is 6h, and every 0.5h the sample must be removed from the muffle oven and manually homogenized and then placed back in the muffle oven. The homogenization process takes about a minute and must be done intensively to ensure the best contact of the sample with the soda ash. After 6 hours of heating the material is cooled and is subjected to a brief pulverization only to break up the particles that agglomerated in the process. The material is then homogenized, and an aliquot is separated for initial chemical analysis (initial V2O5).
The next step of the procedure is the leaching of the material at 70°C for 1 hour, followed by transfer of the leached pulp to a 500 ml volumetric flask for cooling. The pulp is then filtered and washed with 1,000 ml of water. The cake is analysed and the residual content of V2O5 is determined. The recovery of the calcination process in muffle is given by the formula:
- Initial V2O5: V2O5 in the calcined, determined by the initial chemical analysis right after calcination;
- Residual V2O5: V2O5 of the calcined leached after filtering and washing the cake, determined by chemical analysis of the cake;
- Factor 0.95 of the formula: represents an estimated 5% reduction in the initial mass of calcined concentrate due to dissolution (leaching).
In Table 13-46, a summary of the results of the calcination tests in a muffle.
Table 13-46: Calcination - Summary of Results.
Test | NAN - M3 - Metallurgical Recovery | ScaleUp
Factor:
Ind/Lab |
Laboratory | Industrial
(estimated) |
1 | 79.4 | 84.5 | 1.065 |
2 | 82.0 | 86.6 | 1.057 |
3 | 80.6 | 85.3 | 1.058 |
4 | 78.2 | 82.3 | 1.052 |
5 | 81.3 | 84.4 | 1.037 |
6 | 79.8 | 81.5 | 1.022 |
7 | 77 | 80.4 | 1.044 |
8 | 77.9 | 78.8 | 1.012 |
9 | 80 | 83.7 | 1.046 |
10 | 81 | 83 | 1.025 |
Average | 79.7 | 83 | 1.042 |
St. Dv. | 1.6 | 2.3 | - |
Test | NAN - M4 - Metallurgical Recovery | ScaleUp
Factor:
Ind/Lab |
Laboratory | Industrial
(estimated) |
1 | 89.9 | 88.6 | 0.986 |
2 | 83.8 | 85.1 | 1.015 |
3 | 80.9 | 82.8 | 1.024 |
4 | 89.8 | 92.2 | 1.027 |
5 | 85.4 | 88.8 | 1.041 |
6 | 79 | 81.4 | 1.030 |
7 | 78 | 78.0 | 1.000 |
8 | 77.2 | 80.4 | 1.041 |
9 | 78.5 | 78.7 | 1.003 |
10 | 83.8 | 84.4 | 1.007 |
Average | 82.6 | 84 | 1.017 |
St. Dv. | 4.7 | 4.7 | - |
Test | NAN - M5 - Metallurgical Recovery | ScaleUp
Factor:
Ind/Lab |
Laboratory | Industrial
(estimated) |
1 | 75.4 | 75.8 | 1.006 |
2 | 70.2 | 73.6 | 1.049 |
3 | 65.9 | 68.3 | 1.036 |
4 | 71.1 | 73.1 | 1.027 |
5 | 69.5 | 71.5 | 1.029 |
6 | 69.1 | 71.9 | 1.040 |
7 | 67.8 | 68.7 | 1.015 |
8 | 67.6 | 69.7 | 1.032 |
9 | 71.6 | 70.8 | 0.989 |
10 | 76.2 | 75.8 | 0.995 |
Average | 70.4 | 71.9 | 1.021 |
St. Dv. | 3.3 | 2.7 | - |
Each lithology has a different behaviour in the calcination process with regard to the recoveries obtained. After determining the correlation factors between Process / Laboratory and performing the calcination tests, the estimated average industrial calcination recovery for the NAN-M3 concentrate was 83.0%, that of the NAN-M4 concentrate was 84.0 % and that of the concentrate NAN-M5 was 71.9%.
The fact that the recovery of the NAN-M5 concentrate is much lower compared to other lithologies is explained by the low content of V2O5 in the M5 concentrate (0.96% effective V2O5 in the concentrate produced in the wet magnetic separation step) compared to M3 (mean 2.86% effective V2O5) and M4 (mean 2.05% effective V2O5).
For the HBPC sample no calcination test was performed. However, the recovery of the calcination step for the HBPC sample can be inferred from the evaluation of the results of the M3 and M4 samples. Considering that the recovery obtained in the laboratory for the M3 lithology was 79.7% and for the M4 it was 82.6%, it can be said that the expected recovery in the laboratory for the HBPC sample is 80.6% (43% x79.7+57%x82.6=80.6).
13.5.5 Leaching and Chemical Treatment - Novo Amparo Norte
After the calcination step and the production of sodium metavanadate in soluble form, the production process of Vanadium Pentoxide (V2O5) is a chemical process that basically depends on chemical reactions directed by the appropriate additions of reagents and temperature controls and concentration. In addition to chemical reaction controls, filtering, washing and handling equipment efficiencies are also important factors for process efficiency.
Considering these premises, it is understood that Leaching Recovery, Silica Removal, Precipitation and Ammonia Removal should have their parameters defined by benchmarking and comparison with the current Industrial Plant. Therefore, for the leaching area estimates, no laboratory tests are necessary.
Leaching Recovery: The leaching efficiency and recovery of soluble metavanadate in the leach area will basically depend on the calcination process and hot water dissolution, as well as the process of filtering and washing the leached tailings.
The dissolution of metavanate in hot water has already been evaluated and calculated in the calcination tests shown earlier in this report, leaving only estimates of filtering and washing efficiency for soluble vanadium recovery.
It was then decided to use the historical (benchmarking) and optimized values of the current Industrial Plant. So, for the Leaching stage, it is considered that the recovery is 97.5%, the same as in the current Industrial Plant.
Recovery of the Chemical Plant: similar to Leaching, the recovery of the Chemical Plant, which comprises the areas of Silica Removal, Precipitation, Drying and Ammonia Removal, is 96.7%, the same as in the current Industrial Plant.
13.5.6 Global Recovery of Vanadium - Novo Amparo Norte
Global recovery (Table 13-47) is the multiplication of all sequential recoveries of the current process route, that is, dry Crushing/Magnetic Separation recovery, wet Grinding/Magnetic Separation recovery, Calcination recovery, Leaching recovery and Chemical Plant recovery, according to the equation below:
RGlobal = RCrushing * RGrinding *RCalcination *RLeaching *RChemical Treatment
Table 13-47: Global Recovery per Sample.
Area/Process | Recoveries per Sample (%) |
M3 | M4 | M5 | HBPC |
Crushing/Dry Magnetic Concentration | 95.08 | 100.00 | 92.96 | 93.80 |
Grinding/Wet Magnetic Concentration | 97.19 | 97.87 | 95.49 | 95.70 |
Calcination | 83.00 | 84.00 | 71.90 | 80.60 |
Leaching | 97.50 | 97.50 | 97.50 | 97.50 |
Chemical Plant/Purification and Precipitation | 96.70 | 96.70 | 96.70 | 96.70 |
Global | 72.31 | 77.51 | 60.17 | 68.20 |
Considering the approximate proportions of the lithologies in the resources of the deposit (M3: 33%, M4: 39%, M5: 28%), the recoveries of each stage should be very close to those estimated for the HBPC blending, as shown in Table 13-48 below.
Table 13-48: Average Global Recovery - Resources.
Area/Process | Recoveries (%) |
Reserve Average | HBPC |
Crushing/Dry Magnetic Concentration | 96.41 | 93.80 |
Grinding/Wet Magnetic Concentration | 96.98 | 95.70 |
Calcination | 80.28 | 80.60 |
Leaching | 97.50 | 97.50 |
Chemical Plant/Purification and Precipitation | 96.70 | 96.70 |
Global | 70.77 | 68.20 |
13.5.7 Metallurgical Recovery of Vanadium and Titanium of Ore from Novo Amparo
The titanium recovery studies from the ore at the Novo Amparo Norte deposit was based on the assumption that this metal is a by-product of the V2O5 production process. Thus, the TiO2 recoveries obtained in the dry magnetic concentration and wet magnetic concentration steps are consequences of the priority of recovering V2O5. Therefore, until the wet magnetic separation step, no step for the optimization of TiO2 recovery was studied.
Previous studies show that the titanium contained in the ore of the Gulçari A deposit, which is part of the same geological formation as the Novo Amparo Norte deposit, is associated with ilmenite. The same studies indicate that the use of flotation with a carboxylic acid-based collector (Flotinor 10068) and non-ionic co-collector (DP-OMC-1178) is capable of selectively recovering the ilmenite contained in the magnetic separation waste. Thus, it was decided to use the same parameters indicated in the studies mentioned to carry out flotation tests with the tailings obtained in the wet magnetic concentration tests described in this report.
13.5.7.1 Characterization of Samples for Titanium Recovery - Novo Amparo Norte
Four tailings samples were formed after wet magnetic concentration tests performed with the M3, M4, M5 and HBPC ores described earlier in this report. These samples were named, respectively, RM3, RM4, RM5 and RHBPC. All samples were chemically characterized by particle size range, using X-ray fluorescence with Panalytical's XRF Magix Fast equipment and the use of borate fused beads.
Table 13-49 presents the results of the chemical analysis of the samples by size range.
Table 13-49: Particle Size Distribution and Chemical Analysis.
Sample RHBPC. |
Size | Mass (%) | (%) | LOI |
(mm) | SiO2 | Al2O3 | Fe2O3 | CaO | MgO | TiO2 | P2O5 | Na2O | K2O | MnO | V2O5 |
+0.075 | 21.10 | 33.70 | 14.00 | 29.80 | 5.94 | 2.28 | 12.80 | 0.02 | 1.99 | 0.91 | 0.32 | 0.21 | -0.76 |
-0.075 +0.053 | 15.50 | 34.00 | 14.00 | 29.10 | 6.23 | 2.15 | 12.20 | 0.04 | 1.96 | 0.66 | 0.35 | 0.20 | -0.97 |
-0.053 +0.045 | 9.80 | 34.50 | 14.00 | 29.50 | 6.45 | 2.26 | 12.00 | 0.05 | 1.95 | 0.62 | 0.36 | 0.21 | -0.90 |
-0.045 +0.038 | 6.00 | 34.60 | 14.00 | 29.00 | 6.52 | 2.27 | 11.20 | 0.05 | 1.93 | 0.60 | 0.35 | 0.21 | -0.75 |
-0.038 | 47.60 | 33.70 | 13.70 | 28.90 | 6.38 | 2.40 | 11.00 | 0.06 | 1.90 | 0.63 | 0.29 | 0.23 | -0.22 |
Global | 100.00 | 33.90 | 13.90 | 29.20 | 6.28 | 2.31 | 11.70 | 0.05 | 1.93 | 0.69 | 0.32 | 0.22 | -0.55 |
Sample RM3 |
Size | Mass
(%) | (%) | LOI |
(mm) | SiO2 | Al2O3 | Fe2O3 | CaO | MgO | TiO2 | P2O5 | Na2O | K2O | MnO | V2O5 |
+0.075 | 27.60 | 39.90 | 16.50 | 23.30 | 7.25 | 2.14 | 7.70 | 0.03 | 2.56 | 0.97 | 0.24 | 0.22 | -0.21 |
-0.075 +0.053 | 14.50 | 38.90 | 15.60 | 25.00 | 7.46 | 2.11 | 8.76 | 0.05 | 2.32 | 0.70 | 0.28 | 0.23 | -0.49 |
-0.053 +0.045 | 7.20 | 38.70 | 15.30 | 25.50 | 7.58 | 2.16 | 8.69 | 0.05 | 2.29 | 0.66 | 0.29 | 0.24 | -0.48 |
-0.045 +0.038 | 6.10 | 39.40 | 15.80 | 24.80 | 7.75 | 2.28 | 7.83 | 0.06 | 2.38 | 0.70 | 0.26 | 0.24 | -0.27 |
-0.038 | 44.60 | 38.60 | 15.30 | 24.90 | 7.62 | 2.35 | 7.62 | 0.06 | 2.28 | 0.70 | 0.24 | 0.25 | 0.01 |
Global | 100.00 | 39.10 | 15.70 | 24.50 | 7.50 | 2.24 | 7.90 | 0.05 | 2.37 | 0.77 | 0.25 | 0.24 | -0.18 |
Sample RM4 |
Size | Mass
(%) | (%) | LOI |
(mm) | SiO2 | Al2O3 | Fe2O3 | CaO | MgO | TiO2 | P2O5 | Na2O | K2O | MnO | V2O5 |
+0.075 | 26.80 | 28.10 | 11.90 | 34.90 | 4.50 | 2.22 | 16.40 | 0.05 | 1.41 | 0.87 | 0.40 | 0.18 | -1.34 |
-0.075 +0.053 | 13.80 | 27.80 | 11.80 | 35.60 | 4.75 | 2.13 | 16.20 | 0.06 | 1.28 | 0.56 | 0.46 | 0.17 | -1.54 |
-0.053 +0.045 | 7.90 | 28.30 | 12.00 | 35.20 | 4.98 | 2.23 | 15.40 | 0.06 | 1.29 | 0.56 | 0.45 | 0.18 | -1.36 |
-0.045 +0.038 | 5.40 | 29.40 | 12.50 | 35.20 | 5.13 | 2.36 | 14.80 | 0.07 | 1.36 | 0.62 | 0.44 | 0.18 | -1.07 |
-0.038 | 46.10 | 28.30 | 11.80 | 36.00 | 4.88 | 2.45 | 15.50 | 0.07 | 1.27 | 0.59 | 0.36 | 0.22 | -0.23 |
Global | 100.00 | 28.20 | 11.90 | 35.50 | 4.78 | 2.32 | 15.80 | 0.06 | 1.32 | 0.66 | 0.40 | 0.20 | -0.84 |
Sample RM5 |
Size | Mass
(%) | (%) | LOI |
(mm) | SiO2 | Al2O3 | Fe2O3 | CaO | MgO | TiO2 | P2O5 | Na2O | K2O | MnO | V2O5 |
+0.075 | 27.70 | 34.30 | 14.60 | 29.30 | 4.97 | 1.34 | 12.60 | 0.03 | 2.49 | 0.75 | 0.27 | 0.06 | -0.85 |
-0.075 +0.053 | 13.90 | 32.60 | 14.10 | 31.60 | 5.07 | 1.33 | 13.00 | 0.04 | 2.12 | 0.51 | 0.38 | 0.06 | -1.24 |
-0.053 +0.045 | 7.60 | 33.70 | 14.40 | 31.30 | 5.31 | 1.43 | 11.90 | 0.05 | 2.12 | 0.50 | 0.36 | 0.07 | -1.03 |
-0.045 +0.038 | 5.20 | 34.70 | 14.90 | 30.40 | 5.38 | 1.45 | 10.70 | 0.05 | 2.22 | 0.53 | 0.35 | 0.07 | -0.74 |
-0.038 | 45.60 | 34.10 | 14.20 | 30.00 | 4.85 | 1.55 | 9.90 | 0.06 | 2.08 | 0.58 | 0.25 | 0.07 | 0.55 |
Global | 100.00 | 33.90 | 14.30 | 30.10 | 4.98 | 1.45 | 11.30 | 0.05 | 2.21 | 0.61 | 0.29 | 0.07 | -0.27 |
The desliming at 10 µm was carried out in a hydrocyclone. The underflow and fines (overflow) of each sample were analyzed using Panalytical's XRF Magix Fast and the use of borate fused beads. Table 13-50 presents the results obtained in the cycloning.
Table 13-50: Cycloning of Non-magnetic.
Sample | Flux | TiO2 (%) | TiO2
Recovery
(%) | Mass
Recovery
(%) |
M3 | Feed | 7.90 | 83.0 | 77.0 |
Underflow | 8.50 |
Overflow | 5.86 |
M4 | Feed | 15.80 | 98.0 | 97.0 |
Underflow | 15.90 |
Overflow | 12.60 |
M5 | Feed | 11.30 | 88.0 | 82.0 |
Underflow | 12.20 |
Overflow | 7.33 |
HBPC | Feed | 11.70 | 96.0 | 94.0 |
Underflow | 11.90 |
Overflow | 8.31 |
The results presented in Table 13-50 indicate that cyclone desliming can generate losses of up to 20% of TiO2, as shown for sample M3, and the expected average recovery is close to 90%, considering the proportion of resources of each lithological type (M3: 33%, M4: 39%, M5: 28%). That is, a loss of 10% of TiO2, a value that is similar to the amount of titanium found in the slurry currently generated at VMSA, for the production process of V2O5, carried out from the Gulçari A deposit.
13.5.7.2 Flotation of Samples for Titanium Recovery - Novo Amparo Norte
For flotation, a Denver D12 bench flotation machine was used, with 2.5 liter tanks, air flow of 2 liters/minute, rotation of 1,000 rpm. All products generated were analyzed using Panalytical's XRF Magix Fast and use of borate fused beads.
In all tests, a 10-minute attrition step was applied to 50% solids by weight, followed by a 2-minute pre-conditioning with fluosilicic acid and the reagent DP-OMC-1178, added in a single dose in this stage. The Flotinor 10068 collector was dosed in a staged way, with the addition divided equally between each of the conditionings that preceded the froth collections. Thus, a test with a dosage of 200 g/t of collector in 4 conditioning stages had the addition of 50 g/t in each stage. All tests were performed only on the fraction retained in 10 µm of the RM3, RM4, RM5 and RHBPC samples. The results are presented in the tables below.
Table 13-51 presents the titanium contents and recoveries obtained in the flotation for each collection stage. The results are accumulated, which means that the grade and recovery indicated in the table as the second collection represents the mass of the first collection plus that of the second collection. The grade and recovery indicated in the table as the second collection represents the mass of the first collection plus the second and third collections.
Table 13-51: Flotation Test Results - Accumulated Grades and Recoveries.
Sample | Test | Reagent Dosage (g/t) | Collect | Concentrate
TiO2 (%) | TiO2
Recovery
(%) |
Flotinor 10068 | DP-OMC-
1178 |
RHBPC | 1ª | 200 | 400 | 1 | 44.1 | 68.3 |
2 | 43.1 | 80.4 |
3 | 42.3 | 84.4 |
1B | 200 | 400 | 1 | 42.7 | 67.3 |
2 | 40.8 | 81.0 |
3 | 40.0 | 83.8 |
1C | 200 | 400 | 1 | 41.0 | 68.9 |
2 | 39.3 | 81.2 |
3 | 38.3 | 84.6 |
RM3 | 2ª | 200 | 400 | 1 | 32.3 | 80.6 |
2 | 30.6 | 89.4 |
3 | 29.0 | 91.4 |
2B | 200 | 400 | 1 | 29.4 | 81.2 |
2 | 27.5 | 89.4 |
3 | 26.1 | 91.3 |
RM4 | 3ª | 200 | 400 | 1 | 48.5 | 37.7 |
2 | 48.3 | 41.3 |
3B | 200 | 400 | 1 | 49.2 | 31.6 |
2 | 48.9 | 36.4 |
9 | 300 | 400 | 1 | 47.7 | 66.1 |
2 | 47.5 | 76.5 |
3 | 47.3 | 78.5 |
10 | 400 | 400 | 1 | 46.5 | 57.3 |
2 | 46.0 | 77.9 |
3 | 45.6 | 82.6 |
RM5 | 4ª | 200 | 400 | 1 | 47.9 | 13.9 |
2 | 47.9 | 16.3 |
4B | 200 | 400 | 1 | 49.4 | 12.9 |
2 | 49.3 | 14.9 |
11 | 400 | 400 | 1 | 45.1 | 25.0 |
2 | 45.1 | 29.2 |
12 | 500 | 400 | 1 | 43.7 | 36.8 |
2 | 43.4 | 45.4 |
13 | 800 | 800 | 1 | 37.6 | 42.6 |
2 | 36.6 | 60.9 |
3 | 36.0 | 67.6 |
Considering the result of the second collection of each test, it can be said that the average recovery and grade for each sample is presented in Table 13-52.
Table 13-52: Flotation Test Results - Collect 2 - Average Results Summary.
Sample | Concentrate
TiO2 (%) | Recovery TiO2
(%) |
RM3 | 29.1 | 89.4 |
RM4 | 45.6 | 82.6 |
RM5 | 43.4 | 45.4 |
RHBPC | 41.1 | 80.9 |
A flotation test of the non-magnetic tailings from the M5 lithology, by particle size range, was carried out, showing that fines smaller than 38 µm have low recovery. Table 13-53 shows the results obtained.
Table 13-53: Flotation Test Results - By Fraction - Average Results Summary.
Size
(µm) | Test | Collect | Concentrate TiO2
(%) | Recovery
TiO2 (%) |
+53 | 6 | 1 | 46.5 | 86.5 |
2 | 45.9 | 95.8 |
-53+38 | 7 | 1 | 35.1 | 89.8 |
2 | 33.2 | 96.1 |
3 | 32.4 | 96.4 |
-38 | 8 | 1 | 45.7 | 6.2 |
2 | 45.6 | 7.4 |
The global TiO2 recovery (Table 13-54) was estimated based on the recoveries of dry Crushing/Magnetic Separation, wet Grinding/Magnetic Separation, Desliming and Flotation.
RGlobal = RCrushing x RGrinding x RDesliming x RFlotation
Table 13-54: TiO2 Recovery by Area, by Sample and Reserve - Average Summary.
Area/Process | Recovery per Sample TiO2 (%) |
M3 | M4 | M5 | HBPC |
Crushing/Dry Magnetic Concentration | 83.0 | 100.0 | 84.0 | 82.0 |
Grinding/Wet Magnetic Concentration | 92.0 | 83.0 | 94.0 | 89.0 |
Desliming | 83.0 | 98.0 | 88.0 | 96.0 |
Flotation | 89.0 | 83.0 | 45.0 | 81.0 |
Global | 56.0 | 68.0 | 31.0 | 58.0 |
Reserve (M3: 33%; M4: 39%, M5: 28%) - Global | 53.7 |
13.6 Recomendations
Improve flotation studies, also consider the development of pilot scale tests, in traditional circuit in rougher, scavenger and cleaner stages, using column cells.
Study, on a bench scale, the wet magnetic separation of medium intensity (up to 7,000 Gauss) for the low intensity wet non-magnetic waste of the current plant, rich in titanium, before the desliming step in a hydrocyclone. Assess, technically and economically, whether medium-intensity magnetic separation can be introduced as a pre-concentration and desliming step prior to flotation.
Evaluate, through bench tests with small samples, the recovery of titanium from dry low-intensity non-magnetic tailings, as well as residual vanadium, for each lithology and deposit, with the following process developments:
Crushing in a vertical shaft crusher (VSI), in a closed circuit with vibrating screen, with reduction below approximately 3.0 mm, followed by low (800 Gauss; 1,500 Gauss) and medium intensity wet or dry magnetic separation (up to 7,000 Gauss), in rougher, scavenger and cleaner stages.
Milling in HPGR (High Pressure Grinding Rolls), in a closed circuit with vibrating sieve, with reduction below approximately 2.0 mm (or, if possible, < 2.0 mm), followed by magnetic separation in dry or wet low (800 Gauss: 1,500 Gauss) and medium intensity (up to 7,000 Gauss), in rougher, scavenger and cleaner stages.
Conduct a trade-off study to evaluate OPEX and CAPEX crushing in a VSI crusher and grinding in HPGR (High Pressure Grinding Rolls), as well as comparison with the current plant's crushing and grinding circuit.
13.7 Qualified Person's Opinion
In the opinion of the QP the metallurgical test work conducted for the Campbell Pit, GAN and NAN deposits, as it relates to both the V2O5 process and the TiO2 process is sufficient for pre-feasibility and feasibility level process design. The comminution characteristics are well established at Campbell Pit and have consistency across the various testing phases. These characteristics have been tested at GAN and NAN and found to be similar. Sufficient testing of the ilmenite concentration process for each deposit has been performed. Metallurgical test work for the TiO2 Pigment Plant process has also undergone sufficient testing to be relied on for both Mineral Reserve estimates and for initial project design engineering. The samples tested reasonably represent the material to be mined and processed according to the mine schedule. The project mineralised zones do not contain deleterious elements.
14 MINERAL RESOURCE ESTIMATION
14.1 Introduction
The QP validated geological models received from Largo and then adjusted these models, when necessary, to produce updated block models and consequent declare the mineral resources estimates for Campbell Pit, GAN and NAN deposits using new topographic and current drilling data. The main factors considered for the resource estimate classification were quantity and spatial arrangement of data, interpretation of mineralization controls, type of mineralization and data quality. The Mineral Resource was marked off within the geological and mining right limits.
As described in chapter 8, the deposits identified within the Rio Jacaré Intrusion are similar in nature to the V-Ti-Fe Bushveld Complex (South Africa). The vanadiferous-titanomagnetite mineralization occurs associated stratified gabbro-anorthosite complexes. The Gulçari A deposit has demonstrated high vanadium content and is currently in production for vanadium only. The GAN and NAN deposit exhibit similar geological controls but drilling and metallurgical testing indicating lower concentrations of vanadium. Recent work by Largo indicate that modest grades of titanium can be recovered from the Gulçari A deposit (Campbell Pit) and relatively higher grades of titanium can be recovered from the GAN and NAN deposits with the addition of specific process streams as defined previously in this report. The QP has validated the geological model(s) and process assumptions and propose the modelling of the deposit to create an updated minerals resource models for Campbell Pit and the GAN and NAN deposits.
This section presents the main evaluations made to consolidate the Mineral Resources of the Menchen Maracás Project. The steps for validation were:
- Database analysis;
- Validation of the 3D geological model;
- Analysis of sample support;
- Descriptive statistic of the domains;
- Density;
- Variography;
- Block model;
- Interpolation.
14.2 Database
Most of the mineral research data received and used to define the 3D geological model and resource estimate was compiled into Leapfrog Software and classified by deposit to improve file organization, integrity and security. Table 14-1 to Table 14-3 summarize the databases for Campbell Pit, GAN and NAN deposits.
Table 14-1: Drilling Campbell Pit Summary
Target | Company | Year | Nº Drill | Drilling (m) | Logging (m) | Number of samples | Total Size of samples (m) |
Gulçari A (Campbell Pit) | CBPM | 1981 | 2 | 147.60 | 147.20 | 49 | 97.20 |
1983 | 12 | 985.38 | 985.38 | 450 | 743.69 |
SubTotal | 14 | 1,132.98 | 1,132.58 | 499 | 840.89 |
Odebrecht | 1984 | 16 | 1,261.85 | 1,261.85 | 481 | 954.21 |
1985 | 11 | 1,201.11 | 1,201.11 | 489 | 971.82 |
1986 | 8 | 1,135.93 | 1,065.83 | 443 | 659.58 |
1987 | 4 | 421.29 | 352.05 | 96 | 184.50 |
SubTotal | 39 | 4,020.18 | 3,880.84 | 1,509 | 2,770.11 |
VMSA | 2007 | 45 | 11,303.89 | 11,208.89 | 5,799 | 5,805.68 |
2008 | 1 | 211.00 | 211.00 | 181 | 184.00 |
2011 | 11 | 3,119.14 | 3,119.14 | 1,320 | 1,332.01 |
2018 | 31 | 2,323.70 | 2,323.10 | 1,319 | 1,656.05 |
2019 | 5 | 1,924.65 | 1,924.65 | 322 | 310.58 |
2020 | 17 | 4,757.30 | 4,757.20 | 1,432 | 1,234.36 |
SubTotal | 110 | 23,639.68 | 23,543.98 | 10,373 | 10,522.68 |
| | Total | 163 | 28,792.84 | 28,557.40 | 12,381 | 14,133.68 |
Table 14-2: Drilling GAN Summary
Target | Company | Year | Nº Drill | Drilling (m) | Logging (m) | Number of samples | Total Size of samples (m) |
GAN | CBPM | 1983 | 7 | 269.28 | 122.15 | 60 | 52 |
SubTotal | 7 | 269.28 | 122.15 | 60 | 52 |
VMSA | 2007 | 3 | 745.20 | 745.20 | 624 | 621 |
2008 | 1 | 196.00 | 196.00 | 158 | 144 |
2012 | 29 | 4,540.37 | 4,437.75 | 3,112 | 3,132 |
2019 | 20 | 3,050.95 | 3,056.10 | 1,135 | 963 |
2020 | 45 | 6,899.00 | 6 899.00 | 2,288 | 1,561 |
- | 1 | 141.20 | 141.20 | 109 | 106 |
SubTotal | 99 | 15,572.72 | 15,475.25 | 7,426 | 6,527 |
| | Total | 106 | 15,842.00 | 15,597.40 | 7,486 | 6,579 |
Table 14-3: Drilling NAN Summary
Target | Company | Year | Nº Drill | Drilling (m) | Logging (m) | Number of
samples | Total Size of
samples (m) |
NAN | VMSA | 2018 | 24 | 4,223.30 | 4,220.30 | 1,461 | 1,526.55 |
2019 | 47 | 5,404.15 | 5,404.15 | 2,060 | 2,156.95 |
2020 | 32 | 8,187.65 | 7,244.10 | 2,045 | 2,116.65 |
2011/2012 | 17 | 3,283.50 | 3,283.50 | 1,627 | 1,878.09 |
| | Total | 120 | 21,098.60 | 20,152.05 | 7,193 | 7,678.24 |
All data from drilling programs were in MS Excel containing grade analysis for V2O5, TiO2, Fe, SiO2, Davis Tube Test results (when available) as well as other element and oxide analysis including PGE results.
Such database consists of the following tables:
- Collar - Table with the location, azimuth, inclination and final length of the drill holes;
Survey - Hole inclination and azimuth information along the drill holes trace;
Lithology - Geological description of rock types and degree of weathering;
Assay - Information on the results of multi-element chemical analysis of several methods (ICP, XRF and etc.);
QA/QC - Summary of QA/QC program.
Standard validation of this database followed the steps:
- Final Depth - Check for consistency between the final depths listed in the assay and litho tables and the values listed in the collar table;
- Gaps Overlap - Checking gaps overlap in same hole;
- Collar - Checking of coordinate consistency and final depths - Filling error.
Relevant inconsistency was not found during the database validation process.
14.3 Geological Modelling
The mineralized mafic-ultramafic intrusion is within a regional geological context called Rio Jacaré Intrusion, which has a sheet-like structure in the north-south direction, with a length of approximately 70 km, an average width of 1.2 km, and a dip of 70° E.
This igneous body was divided by Brito (2000) into three main zones, namely, Lower Zone, Upper Zone I and Upper Zone II, and between the Lower Zone and the Upper Zone there is a Transition Zone, characterized by the presence of rocks mineralized in iron, titanium and vanadium oxides, organized in layers interspersed with pyrogenic and gabbroic rocks.
Most intrusion textures have been modified by metamorphism and deformation. Relic minerals are rare, but some igneous textures are still preserved, such as olivine cumulates and the lodge between pyroxenite and gabbro. The presence of amphiboles and garnet in the gabbro and magnetitites (igneous rock composed predominantly of magnetite) indicates that the intrusion has undergone an amphibolite facies metamorphism.
Recent work by Largo has resulted in a detailed subdivision of the Upper Zone of the Rio Jacaré intrusion within the project area into several cyclic units cited in Section 7. The typologies were modelled by each magmatic cycle and form the basis of the new geological models.
The 3D geological Campbell, GAN and NAN models were made available by Largo and were validated by QP and adjusted when necessary. All typologies are modelled by implicit method using Leapfrog Geo software. Most of the typological contacts in the holes were respected using the "Intrusion" interpolator and adjusted manually. The wireframes (solids) of this interpretation are the results of domain-based models based primarily on geological description and degree of magnetism.
Since 2015, results from Davis Tube (%MAG) have helped define the types of mineralization. Table 14-4 shows the main rock types modelled at Campbell Pit, NAN and GAN deposits. The waste typologies such as pegmatite, gabbro, anorthosite, granite and soils also were modelled by implicit method.
Table 14-4: Campbell Pit, NAN and GAN Typology
RockType | Abbreviation | Magnetics Mass (Tube
Davis) |
Massive and banded Magnetite | MAG | Massive ore (>45%); Banded ore (35-45%) |
Magnetite-pyroxenite | MPXT | 10-35% |
Pyroxenite | PYXT | <10% |
MagnetiteGabbro | MGB | <10% |
This classification standard has assisted in the mixing of ore types before feeding the processing plant.
At Campbell Pit, GAN and NAN deposits a value of 0.3% V2O5, associated with MAG and MPXT lithologies, were applied as a lower cut-off and was also used as guides in defining mineralization for geological continuity. TiO2 model was associated, in addition to the MAG/MPXT lithologies, the MGB and PXTM lithologies, and a cut-off related grade to the economic function that defined the resource pit, of the order 1%TiO2.
The interpretation of small intervals of non-magnetic horizons within the mineralized interval are considered internal dilution. Figure 14.1 to Figure 14.3 show typical cross sections of the Campbell Pit, NAN and GAN deposits.
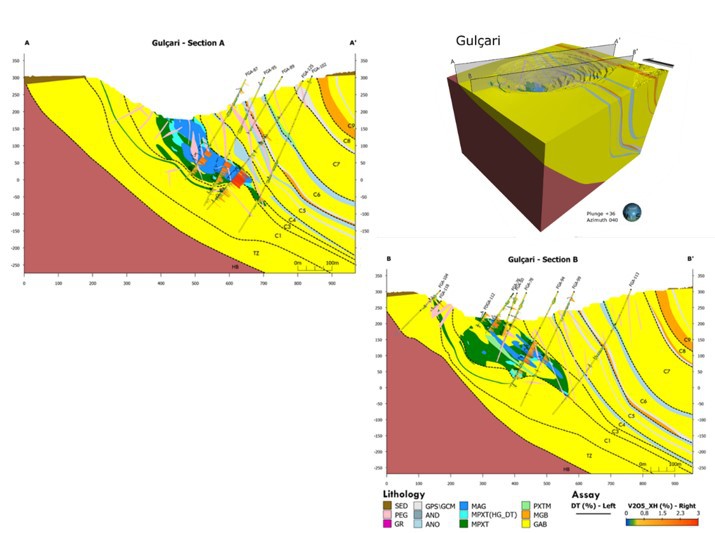
Figure 14.1: Campbell Pit section A-Aˈ and B-Bˈ with sediments (SED), pegmatite (PEG), granite (GR), granite with magnetite (GCM), anorthosite (ANO), magnetite (MAG), magnetic magnetite-pyroxenite (MPXT - HG_DT)), pyroxenite (PXT), gabbro magnetite (MGB) and gabbro.
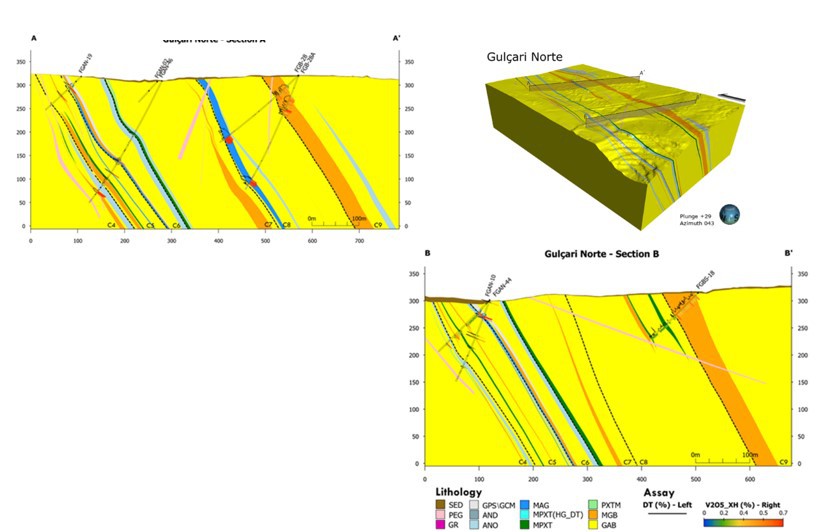
Figure 14.2: GAN deposit section A-Aˈ and B-Bˈ with sediments (SED), pegmatite (PEG), granite (GR), granite with magnetite (GCM), anorthosite (ANO), magnetite (MAG), magnetic magnetite-pyroxenite (MPXT - HG_DT)), pyroxenite (PXT), gabbro magnetite (MGB) and gabbro (GAB). Diagram block without overburden.
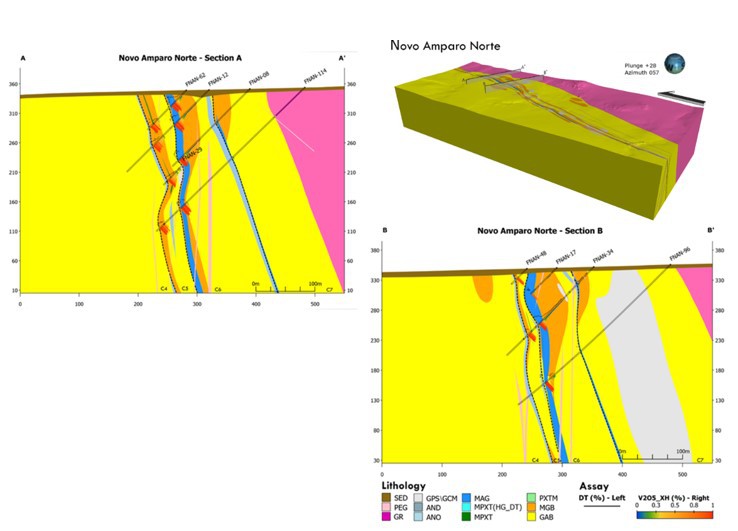
Figure 14.3: NAN deposit section A-Aˈ and B-Bˈ with sediments (SED), pegmatite (PEG), granite (GR), granite with magnetite (GCM), anorthosite (ANO), magnetite (MAG), magnetic magnetite-pyroxenite (MPXT - HG_DT)), pyroxenite (PXT), gabbro magnetite (MGB) and gabbro (GAB). Diagram block without overburden.
14.4 Composite Regularization
The analysis of composite support was done on the samples at Campbell Pit, GAN and NAN deposit indicated the 1 m modal used in sampling. Such samples length ranged from 0.05 m to 3.86 m when V2O5 analysis was greater than 0.3%. Considering the dimensions of the mineralized horizons, the QP generated regularized composites of one meter for EDA and geostatistical studies. Composites smaller than 0.75 m were not used in the estimate.In the Figure 14.4 to Figure 14.6 show the histogram and cumulative curve of the length of the samples.
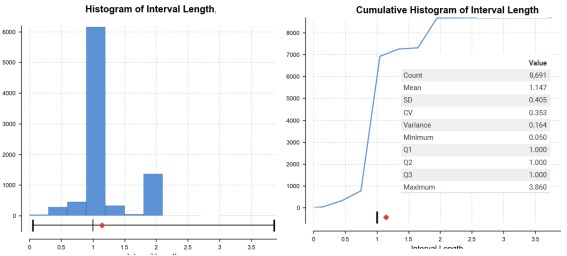
Figure 14.4: Histogram and Cumilative Curve of Campbell Pit sample lenght.
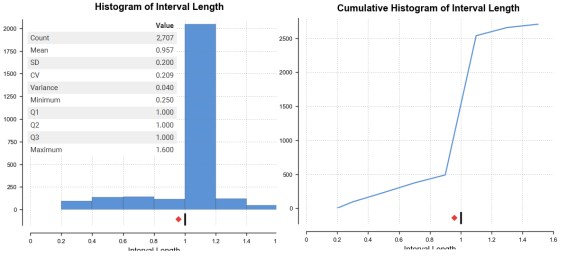
Figure 14.5: Histogram and Cumulative Curve of GAN deposit sample lenght.
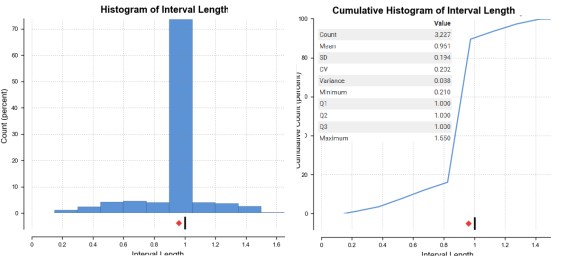
Figure 14.6 : Histogram and Cumulative Curve of NAN deposit sample lenght.
14.5 Exploratory Data Analysis (EDA)
Exploratory analysis was made over composite data for %V2O5, %TiO2, Fe%, %SiO2 and %MAG in composite. The following is a brief description of attributes analysed:
- V2O5 XH - V2O5 content in head grades;
- SiO2 XH - SiO2 content in head grades;
- Fe XH - Fe content head grades;
- TiO2 XH - TiO2 content in head grades;
- V2O5 XC - V2O5 content in the Davis Tube magnetic concentrates;
- SiO2 XC - SiO2 content in the Davis Tube magnetic concentrates;
- Fe XC - Fe content in the Davis Tube magnetic concentrates;
- TiO2 XC - TiO2 content in the Davis Tube magnetic concentrates;
- MAG - mass recovery of magnetite in the Davis Tube magnetic concentrates.
Table 14-5 to Table 14-7 shows a summary of the statistical analysis conducted for the estimated domain on each target. Figure 14.7 to Figure 14.12 shows the descriptive statistical results of MAG (cycle 4, cycle 8 and cycle 6) domain in the deposits:
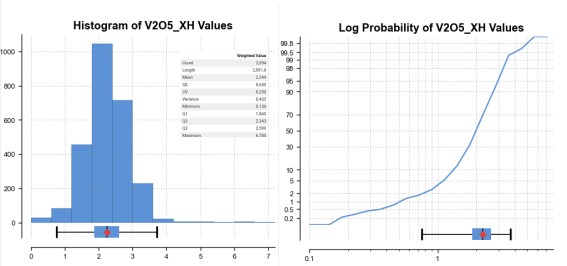
Figure 14.7- Campbell Pit V2O5 Histogram and Probability curve- MAG/Cycle 4
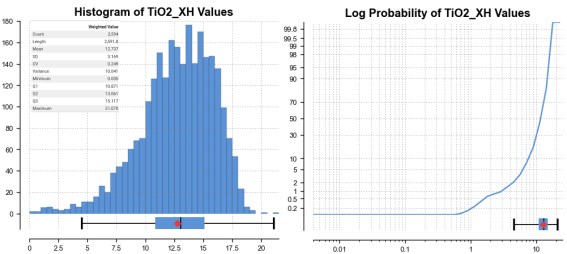
Figure 14.8- Campbell Pit TiO2 Histogram and Probability curve- MAG/Cycle 4
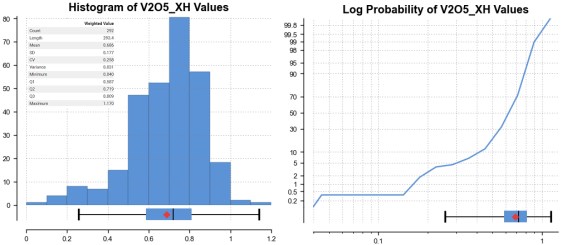
Figure 14.9- GAN V2O5 Histogram and Probability curve- MAG/Cycle 8
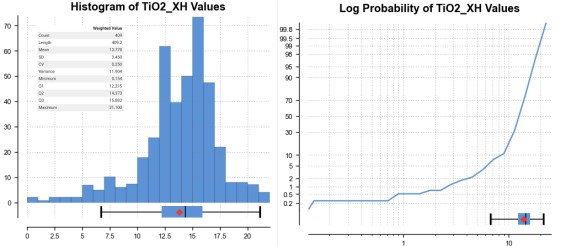
Figure 14.10-GAN TiO2 Histogram and Probability curve - MAG/Cycle 8
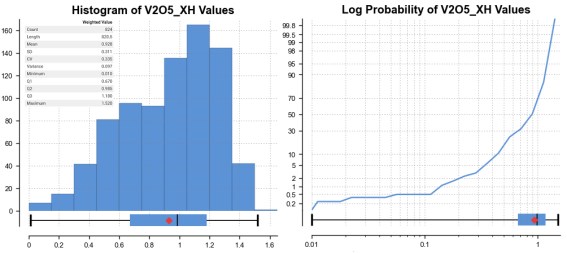
Figure 14.11- NAN V2O5 Histogram and Probability curve - MAG/Cycle 6.
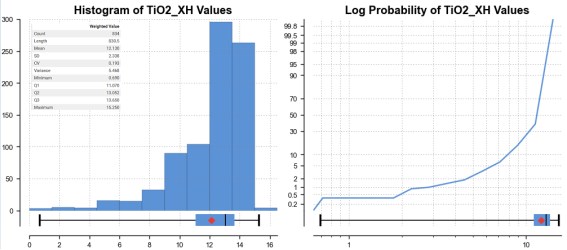
Figure 14.12- NAN TiO2 Histogram and Probability curve - MAG/Cycle 6.
Table 14-5: Campbell Pit Descriptive statistic. "XH" suffix means content in head grades and "XC" means content in the Davis Tube magnetic concentrates.
Cycle | Domain | Variable | Count | Mean | Median | Min. | Max. | S.dv. | Variance | C.V. |
TZ | MPXT_LG | V2O5_XH | 41 | 0.47 | 0.28 | 0.11 | 1.50 | 0.41 | 0.17 | 87.03% |
TiO2_XH | 41 | 3.82 | 2.32 | 0.73 | 12.36 | 3.52 | 12.38 | 92.05% |
Fe_XH | 41 | 23.13 | 20.81 | 15.91 | 41.26 | 6.86 | 47.05 | 29.65% |
SiO2_XH | 41 | 38.81 | 42.70 | 17.50 | 49.30 | 8.73 | 76.26 | 22.50% |
DT | 41 | 15.90 | 12.39 | 1.07 | 48.71 | 12.40 | 153.72 | 77.99% |
V2O5_XC | 39 | 1.80 | 1.73 | 0.47 | 4.05 | 0.97 | 0.95 | 54.17% |
TiO2_XC | 39 | 4.12 | 4.06 | 0.76 | 7.19 | 1.34 | 1.80 | 32.56% |
Fe_XC | 38 | 56.56 | 55.36 | 43.66 | 65.05 | 5.04 | 25.37 | 8.91% |
SiO2_XC | 39 | 9.02 | 9.67 | 1.26 | 16.92 | 4.81 | 23.13 | 53.34% |
PXTM | V2O5_XH | 35 | 0.23 | 0.21 | 0.05 | 0.87 | 0.13 | 0.02 | 57.73% |
TiO2_XH | 35 | 1.81 | 1.63 | 0.47 | 7.29 | 1.09 | 1.20 | 60.62% |
Fe_XH | 35 | 17.67 | 18.04 | 7.99 | 23.74 | 2.43 | 5.88 | 13.73% |
SiO2_XH | 35 | 44.93 | 44.90 | 35.19 | 52.20 | 2.29 | 5.23 | 5.09% |
DT | 32 | 5.21 | 5.14 | 0.05 | 13.77 | 3.74 | 13.98 | 71.77% |
V2O5_XC | 29 | 1.04 | 1.02 | 0.05 | 3.37 | 0.89 | 0.79 | 85.83% |
TiO2_XC | 29 | 3.22 | 2.61 | 0.05 | 19.50 | 3.74 | 14.01 | 116.18% |
Fe_XC | 20 | 56.54 | 54.98 | 48.15 | 64.28 | 4.28 | 18.33 | 7.57% |
SiO2_XC | 29 | 6.61 | 6.61 | 0.05 | 16.78 | 5.37 | 28.86 | 81.24% |
C1 | MPXT_LG | V2O5_XH | 213 | 0.82 | 0.78 | 0.03 | 2.10 | 0.42 | 0.17 | 50.73% |
TiO2_XH | 213 | 6.98 | 7.11 | 0.27 | 15.07 | 3.39 | 11.51 | 48.57% |
Fe_XH | 213 | 27.55 | 27.18 | 7.70 | 46.83 | 8.18 | 66.99 | 29.71% |
SiO2_XH | 213 | 31.79 | 32.09 | 10.50 | 59.84 | 9.17 | 84.08 | 28.84% |
DT | 201 | 22.17 | 19.26 | 0.01 | 57.91 | 14.78 | 218.48 | 66.67% |
V2O5_XC | 178 | 2.67 | 2.82 | 0.05 | 3.96 | 0.69 | 0.48 | 26.01% |
TiO2_XC | 178 | 5.41 | 4.68 | 0.05 | 16.64 | 3.20 | 10.24 | 59.10% |
Fe_XC | 171 | 61.65 | 62.58 | 44.68 | 67.57 | 3.98 | 15.84 | 6.46% |
SiO2_XC | 178 | 3.28 | 2.01 | 0.05 | 21.60 | 3.34 | 11.15 | 101.84% |
PXTM | V2O5_XH | 66 | 0.45 | 0.37 | 0.08 | 1.84 | 0.36 | 0.13 | 79.79% |
TiO2_XH | 66 | 4.19 | 4.09 | 0.51 | 13.80 | 2.88 | 8.30 | 68.69% |
Fe_XH | 66 | 19.60 | 18.20 | 10.78 | 42.18 | 4.94 | 24.44 | 25.23% |
SiO2_XH | 66 | 40.84 | 41.02 | 13.75 | 48.91 | 6.11 | 37.31 | 14.96% |
DT | 62 | 7.37 | 5.73 | 0.05 | 58.20 | 8.39 | 70.46 | 113.85% |
V2O5_XC | 49 | 2.18 | 2.31 | 0.05 | 5.27 | 1.14 | 1.31 | 52.49% |
TiO2_XC | 49 | 6.17 | 5.19 | 0.05 | 17.55 | 4.43 | 19.60 | 71.72% |
Fe_XC | 42 | 59.56 | 59.52 | 49.67 | 65.33 | 4.12 | 17.01 | 6.92% |
SiO2_XC | 49 | 4.13 | 3.08 | 0.05 | 12.45 | 3.26 | 10.64 | 78.90% |
Cycle | Domain | Variable | Count | Mean | Median | Min. | Max. | S.dv. | Variance | C.V. |
C3 | MAG | V2O5_XH | 2591 | 2.24 | 2.24 | 0.12 | 6.78 | 0.65 | 0.42 | 28.95% |
TiO2_XH | 2591 | 12.74 | 13.06 | 0.01 | 21.07 | 3.17 | 10.04 | 24.88% |
Fe_XH | 2574 | 45.56 | 46.94 | 10.19 | 79.45 | 7.26 | 52.65 | 15.93% |
SiO2_XH | 2591 | 11.11 | 9.29 | 0.23 | 67.02 | 8.29 | 68.70 | 74.59% |
DT | 2026 | 56.90 | 59.34 | 0.10 | 91.95 | 13.09 | 171.44 | 23.01% |
V2O5_XC | 2024 | 3.51 | 3.40 | 0.05 | 7.90 | 0.63 | 0.39 | 17.82% |
TiO2_XC | 2021 | 6.88 | 6.83 | 0.05 | 59.92 | 2.51 | 6.28 | 36.42% |
Fe_XC | 2015 | 60.57 | 61.07 | 1.90 | 66.58 | 3.54 | 12.52 | 5.84% |
SiO2_XC | 2024 | 1.60 | 1.26 | 0.05 | 15.00 | 1.37 | 1.87 | 85.54% |
MPXT_HG_DT | V2O5_XH | 531 | 1.48 | 1.45 | 0.01 | 4.01 | 0.49 | 0.24 | 33.37% |
TiO2_XH | 531 | 8.70 | 8.60 | 0.17 | 18.40 | 2.86 | 8.17 | 32.86% |
Fe_XH | 513 | 35.86 | 35.73 | 2.60 | 61.05 | 7.23 | 52.25 | 20.16% |
SiO2_XH | 531 | 23.19 | 22.91 | 3.21 | 65.40 | 8.14 | 66.26 | 35.09% |
DT | 447 | 39.62 | 39.66 | 0.01 | 71.54 | 10.96 | 120.20 | 27.67% |
V2O5_XC | 446 | 3.30 | 3.23 | 0.93 | 6.30 | 0.59 | 0.35 | 17.91% |
TiO2_XC | 445 | 5.97 | 6.04 | 1.46 | 8.90 | 1.09 | 1.19 | 18.27% |
Fe_XC | 443 | 60.79 | 61.39 | 48.63 | 66.14 | 2.66 | 7.08 | 4.38% |
SiO2_XC | 446 | 2.67 | 2.13 | 0.05 | 13.62 | 1.83 | 3.35 | 68.56% |
MPXT_LG_DT | V2O5_XH | 3538 | 0.83 | 0.74 | 0.02 | 4.41 | 0.45 | 0.21 | 54.65% |
TiO2_XH | 3538 | 5.20 | 4.80 | 0.20 | 19.60 | 2.56 | 6.55 | 49.20% |
Fe_XH | 3474 | 25.85 | 24.57 | 5.13 | 77.33 | 7.44 | 55.43 | 28.80% |
SiO2_XH | 3538 | 34.78 | 36.05 | 1.10 | 66.33 | 7.89 | 62.21 | 22.68% |
DT | 2950 | 18.38 | 16.29 | 0.01 | 67.00 | 10.20 | 104.09 | 55.51% |
V2O5_XC | 2849 | 2.97 | 3.01 | 0.05 | 9.81 | 0.83 | 0.69 | 27.97% |
TiO2_XC | 2830 | 4.39 | 4.41 | 0.05 | 10.88 | 1.41 | 1.98 | 32.11% |
Fe_XC | 2781 | 60.12 | 60.34 | 34.97 | 68.09 | 3.93 | 15.45 | 6.54% |
SiO2_XC | 2847 | 4.64 | 3.88 | 0.05 | 26.40 | 3.27 | 10.67 | 70.38% |
PXTM | V2O5_XH | 668 | 0.54 | 0.49 | 0.01 | 2.20 | 0.28 | 0.08 | 51.07% |
TiO2_XH | 669 | 4.01 | 3.72 | 0.05 | 12.99 | 1.91 | 3.64 | 47.61% |
Fe_XH | 669 | 20.93 | 20.10 | 0.89 | 42.13 | 4.62 | 21.31 | 22.06% |
SiO2_XH | 669 | 39.07 | 39.80 | 13.42 | 75.10 | 5.95 | 35.41 | 15.23% |
DT | 413 | 6.88 | 6.20 | 0.00 | 34.37 | 4.87 | 23.72 | 70.77% |
V2O5_XC | 373 | 2.93 | 3.07 | 0.05 | 5.39 | 1.05 | 1.10 | 35.76% |
TiO2_XC | 366 | 3.17 | 2.64 | 0.05 | 63.27 | 3.76 | 14.11 | 118.32% |
Fe_XC | 348 | 61.90 | 62.54 | 0.91 | 68.54 | 5.01 | 25.10 | 8.09% |
SiO2_XC | 373 | 3.85 | 3.35 | 0.05 | 13.90 | 2.64 | 6.96 | 68.59% |
Cycle | Domain | Variable | Count | Mean | Median | Min. | Max. | S.dv. | Variance | C.V. |
C4 | MAG | V2O5_XH | 2 | 1.40 | 1.08 | 1.08 | 1.71 | 0.45 | 0.20 | 31.92% |
TiO2_XH | 2 | 10.01 | 8.16 | 8.16 | 11.87 | 2.62 | 6.87 | 26.18% |
Fe_XH | 2 | 37.64 | 32.66 | 32.66 | 42.63 | 7.05 | 49.70 | 18.73% |
SiO2_XH | 2 | 20.14 | 25.68 | 14.59 | 25.68 | 7.84 | 61.50 | 38.95% |
DT | 0 | - | - | - | - | - | - | - |
V2O5_XC | 0 | - | - | - | - | - | - | - |
TiO2_XC | 0 | - | - | - | - | - | - | - |
Fe_XC | 0 | - | - | - | - | - | - | - |
SiO2_XC | 0 | - | - | - | - | - | - | - |
MGB | V2O5_XH | 128 | 0.92 | 0.86 | 0.42 | 2.69 | 0.29 | 0.08 | 31.45% |
TiO2_XH | 123 | 5.49 | 5.53 | 2.30 | 8.35 | 1.06 | 1.12 | 19.30% |
Fe_XH | 123 | 25.99 | 24.62 | 15.80 | 54.54 | 5.31 | 28.22 | 20.44% |
SiO2_XH | 123 | 33.61 | 33.63 | 22.40 | 45.80 | 3.92 | 15.36 | 11.66% |
DT | 91 | 15.81 | 14.24 | 4.00 | 34.40 | 5.59 | 31.21 | 35.33% |
V2O5_XC | 91 | 3.44 | 3.36 | 2.56 | 5.37 | 0.40 | 0.16 | 11.66% |
TiO2_XC | 91 | 2.79 | 2.72 | 1.19 | 7.50 | 0.95 | 0.91 | 34.15% |
Fe_XC | 91 | 64.53 | 65.29 | 52.81 | 67.61 | 2.48 | 6.17 | 3.85% |
SiO2_XC | 91 | 1.94 | 1.49 | 0.48 | 11.17 | 1.61 | 2.60 | 83.27% |
MPXT | V2O5_XH | 182 | 0.83 | 0.78 | 0.10 | 2.43 | 0.38 | 0.14 | 44.95% |
TiO2_XH | 182 | 5.47 | 5.07 | 0.82 | 14.00 | 2.38 | 5.67 | 43.50% |
Fe_XH | 182 | 25.26 | 23.94 | 13.57 | 52.23 | 6.90 | 47.56 | 27.31% |
SiO2_XH | 182 | 35.87 | 37.24 | 19.65 | 48.81 | 6.48 | 42.01 | 18.07% |
DT | 123 | 17.16 | 16.70 | 2.40 | 42.68 | 8.06 | 64.92 | 46.96% |
V2O5_XC | 123 | 3.27 | 3.25 | 0.52 | 5.08 | 0.84 | 0.70 | 25.60% |
TiO2_XC | 123 | 3.88 | 3.64 | 1.40 | 6.93 | 1.31 | 1.73 | 33.88% |
Fe_XC | 123 | 61.73 | 62.91 | 48.48 | 66.66 | 3.67 | 13.50 | 5.95% |
SiO2_XC | 123 | 4.12 | 3.08 | 0.54 | 15.46 | 3.31 | 10.95 | 80.37% |
PXTM | V2O5_XH | 262 | 0.62 | 0.55 | 0.13 | 2.00 | 0.29 | 0.08 | 46.46% |
TiO2_XH | 262 | 4.64 | 4.43 | 0.80 | 12.95 | 2.02 | 4.07 | 43.48% |
Fe_XH | 262 | 22.21 | 21.38 | 14.66 | 41.67 | 4.72 | 22.24 | 21.23% |
SiO2_XH | 262 | 38.94 | 40.10 | 15.24 | 50.37 | 5.76 | 33.18 | 14.79% |
DT | 70 | 7.83 | 6.81 | 0.80 | 31.13 | 4.85 | 23.54 | 61.92% |
V2O5_XC | 69 | 3.20 | 3.48 | 0.05 | 5.01 | 1.09 | 1.19 | 34.15% |
TiO2_XC | 69 | 2.58 | 2.46 | 0.05 | 5.26 | 1.06 | 1.12 | 41.03% |
Fe_XC | 63 | 63.57 | 63.98 | 57.00 | 68.38 | 2.29 | 5.23 | 3.60% |
SiO2_XC | 69 | 3.37 | 3.19 | 0.05 | 9.22 | 1.86 | 3.46 | 55.23% |
C5 | MPXT_LG_DT | V2O5_XH | 2 | 0.29 | 0.38 | 0.19 | 0.38 | 0.13 | 0.02 | 46.44% |
TiO2_XH | 0 | - | - | - | - | - | - | - |
Fe_XH | 0 | - | - | - | - | - | - | - |
SiO2_XH | 0 | - | - | - | - | - | - | - |
DT | 0 | - | - | - | - | - | - | - |
V2O5_XC | 0 | - | - | - | - | - | - | - |
TiO2_XC | 0 | - | - | - | - | - | - | - |
Fe_XC | 0 | - | - | - | - | - | - | - |
SiO2_XC | 0 | - | - | - | - | - | - | - |
C6 | MGB | V2O5_XH | 111 | 0.61 | 0.54 | 0.01 | 1.30 | 0.38 | 0.14 | 61.47% |
TiO2_XH | 109 | 9.62 | 10.27 | 0.64 | 14.13 | 3.01 | 9.04 | 31.25% |
Fe_XH | 109 | 31.79 | 32.27 | 4.23 | 46.42 | 9.28 | 86.05 | 29.18% |
SiO2_XH | 109 | 27.24 | 26.36 | 11.85 | 67.63 | 10.62 | 112.74 | 38.98% |
DT | 113 | 22.34 | 21.45 | 0.02 | 53.39 | 12.77 | 163.10 | 57.18% |
V2O5_XC | 95 | 1.78 | 1.94 | 0.44 | 2.62 | 0.63 | 0.39 | 35.25% |
TiO2_XC | 95 | 2.71 | 2.56 | 0.86 | 7.45 | 1.32 | 1.74 | 48.68% |
Fe_XC | 94 | 65.85 | 66.37 | 53.56 | 70.36 | 3.41 | 11.60 | 5.17% |
SiO2_XC | 95 | 2.02 | 1.22 | 0.25 | 11.66 | 2.03 | 4.13 | 100.58% |
C7 | PXTM | V2O5_XH | 46 | 0.05 | 0.04 | 0.00 | 0.16 | 0.05 | 0.00 | 85.27% |
TiO2_XH | 45 | 6.58 | 6.89 | 1.01 | 13.98 | 4.13 | 17.07 | 62.77% |
Fe_XH | 45 | 26.03 | 25.93 | 6.50 | 40.88 | 10.13 | 102.68 | 38.92% |
SiO2_XH | 45 | 36.01 | 36.02 | 19.82 | 54.93 | 10.66 | 113.56 | 29.59% |
DT | 31 | 10.78 | 8.93 | 0.04 | 28.34 | 9.03 | 81.61 | 83.83% |
V2O5_XC | 21 | 0.25 | 0.17 | 0.05 | 0.82 | 0.20 | 0.04 | 80.74% |
TiO2_XC | 21 | 2.57 | 2.45 | 0.05 | 6.27 | 1.56 | 2.45 | 60.87% |
Fe_XC | 18 | 65.01 | 67.15 | 47.99 | 69.17 | 5.12 | 26.21 | 7.88% |
SiO2_XC | 21 | 3.32 | 2.23 | 0.05 | 16.26 | 3.66 | 13.39 | 110.36% |
C8 | MGB | V2O5_XH | 5 | 0.24 | 0.16 | 0.12 | 0.40 | 0.14 | 0.02 | 60.56% |
TiO2_XH | 5 | 5.42 | 3.39 | 2.93 | 8.89 | 3.07 | 9.40 | 56.60% |
Fe_XH | 5 | 20.08 | 15.74 | 13.40 | 28.27 | 7.06 | 49.85 | 35.15% |
SiO2_XH | 5 | 40.15 | 44.86 | 30.04 | 47.60 | 8.75 | 76.57 | 21.79% |
DT | 5 | 8.23 | 3.63 | 0.11 | 17.94 | 9.08 | 82.38 | 110.24% |
V2O5_XC | 2 | 1.32 | 1.22 | 1.22 | 1.43 | 0.15 | 0.02 | 11.19% |
TiO2_XC | 2 | 1.99 | 1.82 | 1.82 | 2.16 | 0.24 | 0.06 | 12.16% |
Fe_XC | 2 | 67.98 | 67.94 | 67.94 | 68.01 | 0.05 | 0.00 | 0.07% |
SiO2_XC | 2 | 1.02 | 0.77 | 0.77 | 1.27 | 0.35 | 0.12 | 34.34% |
Cycle | Domain | Variable | Count | Mean | Median | Min. | Max. | S.dv. | Variance | C.V. |
C9 | MGB | V2O5_XH | 34 | 0.47 | 0.48 | 0.13 | 0.70 | 0.13 | 0.02 | 27.08% |
TiO2_XH | 34 | 7.90 | 7.95 | 2.18 | 10.69 | 1.77 | 3.15 | 22.46% |
Fe_XH | 34 | 27.92 | 28.19 | 9.21 | 36.02 | 4.97 | 24.73 | 17.81% |
SiO2_XH | 34 | 30.62 | 29.50 | 21.64 | 54.11 | 6.24 | 39.00 | 20.40% |
DT | 34 | 19.98 | 20.64 | 3.42 | 33.57 | 7.34 | 53.84 | 36.72% |
V2O5_XC | 33 | 1.63 | 1.67 | 1.31 | 1.88 | 0.17 | 0.03 | 10.73% |
TiO2_XC | 33 | 4.30 | 3.69 | 1.22 | 10.16 | 2.49 | 6.18 | 57.75% |
Fe_XC | 33 | 65.99 | 66.33 | 59.74 | 69.15 | 2.31 | 5.31 | 3.49% |
SiO2_XC | 33 | 1.02 | 0.76 | 0.43 | 3.04 | 0.57 | 0.32 | 55.53% |
Table 14-6: GAN Deposit Descriptive statistic. "XH" suffix means content in head grades and "XC" means content in the Davis Tube magnetic concentrates.
Cycle | Domain | Lens | Variable | Count | Mean | Median | Min | Max | S.dv. | Variance | C.V. |
C4 | MGB | | V2O5_XH | 180 | 0.98 | 1.04 | 0.29 | 1.42 | 0.22 | 0.05 | 22% |
TiO2_XH | 183 | 6.67 | 6.70 | 2.24 | 9.04 | 1.23 | 1.51 | 18% |
Fe_XH | 183 | 27.91 | 28.57 | 15.74 | 38.90 | 3.81 | 14.52 | 14% |
SiO2_XH | 183 | 29.53 | 29.33 | 20.34 | 49.80 | 4.46 | 19.85 | 15% |
DT | 126 | 20.02 | 20.20 | 0.77 | 32.26 | 5.68 | 32.32 | 28% |
V2O5_XC | 123 | 3.62 | 3.75 | 1.75 | 4.94 | 0.49 | 0.24 | 13% |
TiO2_XC | 123 | 1.66 | 1.59 | 0.54 | 3.85 | 0.52 | 0.27 | 31% |
Fe_XC | 123 | 67.18 | 67.30 | 63.43 | 68.82 | 0.92 | 0.84 | 1% |
SiO2_XC | 123 | 0.78 | 0.61 | 0.32 | 3.62 | 0.50 | 0.25 | 64% |
2 | V2O5_XH | 31 | 0.99 | 1.02 | 0.46 | 1.48 | 0.27 | 0.07 | 27% |
TiO2_XH | 31 | 6.55 | 7.06 | 3.39 | 9.05 | 1.54 | 2.38 | 24% |
Fe_XH | 25 | 27.04 | 27.85 | 13.64 | 36.17 | 5.24 | 27.43 | 19% |
SiO2_XH | 31 | 30.74 | 27.88 | 21.10 | 54.57 | 7.04 | 49.61 | 23% |
DT | 16 | 19.90 | 19.68 | 10.12 | 31.40 | 5.92 | 35.04 | 30% |
V2O5_XC | 12 | 3.90 | 3.91 | 3.61 | 4.19 | 0.16 | 0.03 | 4% |
TiO2_XC | 12 | 2.44 | 2.57 | 1.38 | 3.67 | 0.61 | 0.37 | 25% |
Fe_XC | 12 | 66.52 | 66.54 | 65.93 | 67.22 | 0.34 | 0.11 | 1% |
SiO2_XC | 12 | 0.71 | 0.57 | 0.40 | 1.57 | 0.34 | 0.12 | 48% |
MPXT | TOPO | V2O5_XH | 33 | 0.84 | 0.79 | 0.07 | 1.84 | 0.45 | 0.20 | 53% |
TiO2_XH | 28 | 5.92 | 5.07 | 1.87 | 11.65 | 2.52 | 6.35 | 43% |
Fe_XH | 28 | 30.26 | 27.71 | 18.49 | 48.30 | 8.73 | 76.16 | 29% |
SiO2_XH | 28 | 30.53 | 33.38 | 8.34 | 47.21 | 10.23 | 104.66 | 34% |
DT | 22 | 20.67 | 14.04 | 3.70 | 53.90 | 15.82 | 250.14 | 77% |
V2O5_XC | 19 | 3.30 | 3.22 | 1.74 | 6.06 | 1.00 | 1.00 | 30% |
TiO2_XC | 19 | 1.72 | 1.48 | 0.58 | 3.55 | 0.96 | 0.92 | 56% |
Fe_XC | 19 | 67.43 | 67.23 | 65.70 | 69.01 | 0.93 | 0.87 | 1% |
SiO2_XC | 19 | 0.92 | 0.78 | 0.27 | 3.24 | 0.69 | 0.48 | 75% |
PXTM | | V2O5_XH | 7 | 0.43 | 0.43 | 0.29 | 0.63 | 0.10 | 0.01 | 24% |
TiO2_XH | 7 | 3.43 | 3.64 | 2.38 | 4.50 | 0.75 | 0.57 | 22% |
Fe_XH | 7 | 19.64 | 20.07 | 16.15 | 22.21 | 2.39 | 5.72 | 12% |
SiO2_XH | 7 | 38.92 | 37.65 | 35.35 | 43.25 | 3.08 | 9.47 | 8% |
DT | 5 | 3.41 | 3.14 | 0.16 | 6.64 | 2.41 | 5.80 | 71% |
V2O5_XC | 3 | 2.31 | 2.30 | 1.92 | 2.67 | 0.37 | 0.14 | 16% |
TiO2_XC | 3 | 0.62 | 0.58 | 0.55 | 0.71 | 0.09 | 0.01 | 14% |
Fe_XC | 3 | 68.62 | 68.60 | 68.54 | 68.73 | 0.10 | 0.01 | 0% |
SiO2_XC | 3 | 0.96 | 0.91 | 0.87 | 1.11 | 0.13 | 0.02 | 14% |
Cycle | Domain | Lens | Variable | Count | Mean | Median | Min | Max | S.dv. | Variance | C.V. |
C5 | MAG | | V2O5_XH | 32 | 0.80 | 0.83 | 0.13 | 1.38 | 0.36 | 0.13 | 45% |
TiO2_XH | 30 | 7.51 | 7.68 | 1.67 | 12.15 | 2.63 | 6.93 | 35% |
Fe_XH | 30 | 30.69 | 30.38 | 10.88 | 43.63 | 7.29 | 53.13 | 24% |
SiO2_XH | 30 | 28.96 | 28.67 | 14.05 | 53.30 | 9.38 | 87.98 | 32% |
DT | 21 | 19.03 | 19.12 | 1.91 | 38.20 | 11.96 | 143.09 | 63% |
V2O5_XC | 17 | 2.94 | 3.06 | 1.99 | 3.62 | 0.52 | 0.27 | 18% |
TiO2_XC | 17 | 1.88 | 1.80 | 0.91 | 4.28 | 0.83 | 0.69 | 44% |
Fe_XC | 17 | 67.03 | 67.24 | 63.93 | 68.65 | 1.17 | 1.36 | 2% |
SiO2_XC | 17 | 0.89 | 0.89 | 0.30 | 2.97 | 0.56 | 0.32 | 63% |
MGB | BASE | V2O5_XH | 173 | 0.39 | 0.39 | 0.12 | 0.71 | 0.12 | 0.01 | 31% |
TiO2_XH | 162 | 3.71 | 3.83 | 0.04 | 6.40 | 0.71 | 0.50 | 19% |
Fe_XH | 161 | 18.90 | 19.15 | 0.83 | 31.06 | 3.04 | 9.24 | 16% |
SiO2_XH | 162 | 41.53 | 40.96 | 29.48 | 70.00 | 4.34 | 18.82 | 10% |
DT | 109 | 6.37 | 5.56 | 0.07 | 21.13 | 3.84 | 14.72 | 60% |
V2O5_XC | 85 | 2.43 | 2.74 | 0.60 | 3.85 | 0.83 | 0.70 | 34% |
TiO2_XC | 84 | 1.42 | 0.62 | 0.31 | 7.20 | 1.91 | 3.67 | 135% |
Fe_XC | 85 | 67.23 | 68.82 | 0.01 | 70.57 | 7.80 | 60.83 | 12% |
SiO2_XC | 85 | 1.05 | 0.82 | 0.04 | 3.56 | 0.71 | 0.50 | 67% |
TOPO | V2O5_XH | 61 | 0.64 | 0.61 | 0.17 | 1.13 | 0.31 | 0.09 | 48% |
TiO2_XH | 60 | 6.12 | 5.62 | 1.94 | 9.80 | 2.16 | 4.66 | 35% |
Fe_XH | 60 | 25.77 | 24.96 | 13.22 | 37.22 | 6.90 | 47.55 | 27% |
SiO2_XH | 60 | 33.54 | 34.90 | 19.35 | 48.91 | 8.19 | 67.12 | 24% |
DT | 35 | 19.45 | 17.40 | 0.08 | 39.10 | 11.73 | 137.55 | 60% |
V2O5_XC | 27 | 2.72 | 2.68 | 2.31 | 4.25 | 0.33 | 0.11 | 12% |
TiO2_XC | 27 | 2.09 | 2.14 | 1.03 | 2.96 | 0.60 | 0.36 | 29% |
Fe_XC | 27 | 67.29 | 67.36 | 63.66 | 69.24 | 1.12 | 1.26 | 2% |
SiO2_XC | 27 | 0.77 | 0.67 | 0.28 | 3.00 | 0.51 | 0.26 | 66% |
MPXT | | V2O5_XH | 85 | 0.26 | 0.22 | 0.12 | 0.82 | 0.12 | 0.01 | 46% |
TiO2_XH | 78 | 5.30 | 4.91 | 2.17 | 9.37 | 1.39 | 1.94 | 26% |
Fe_XH | 78 | 25.92 | 25.41 | 15.67 | 40.39 | 4.94 | 24.38 | 19% |
SiO2_XH | 78 | 34.50 | 35.73 | 19.26 | 46.24 | 5.44 | 29.55 | 16% |
DT | 55 | 13.69 | 10.57 | 1.41 | 38.15 | 8.69 | 75.58 | 63% |
V2O5_XC | 50 | 1.09 | 0.96 | 0.60 | 2.38 | 0.45 | 0.21 | 41% |
TiO2_XC | 50 | 0.97 | 0.76 | 0.35 | 8.87 | 1.08 | 1.16 | 112% |
Fe_XC | 50 | 68.87 | 69.30 | 35.91 | 70.94 | 4.18 | 17.44 | 6% |
SiO2_XC | 50 | 1.12 | 0.73 | 0.42 | 21.20 | 2.53 | 6.38 | 226% |
C6 | MAG | 1 | V2O5_XH | 117 | 0.88 | 1.03 | 0.01 | 1.73 | 0.36 | 0.13 | 41% |
TiO2_XH | 113 | 11.07 | 12.15 | 0.15 | 19.45 | 3.00 | 9.02 | 27% |
Fe_XH | 107 | 38.12 | 41.66 | 1.04 | 48.68 | 9.25 | 85.63 | 24% |
SiO2_XH | 113 | 21.40 | 16.75 | 7.91 | 76.27 | 11.42 | 130.37 | 53% |
DT | 67 | 32.81 | 36.30 | 0.17 | 52.00 | 12.19 | 148.50 | 37% |
V2O5_XC | 62 | 2.40 | 2.46 | 1.27 | 3.47 | 0.38 | 0.15 | 16% |
TiO2_XC | 62 | 3.06 | 3.08 | 1.26 | 5.49 | 0.84 | 0.70 | 27% |
Fe_XC | 62 | 66.47 | 66.73 | 55.74 | 69.22 | 1.88 | 3.55 | 3% |
SiO2_XC | 62 | 0.91 | 0.55 | 0.29 | 6.98 | 1.07 | 1.14 | 118% |
2 | V2O5_XH | 4 | 1.02 | 0.99 | 0.69 | 1.24 | 0.25 | 0.06 | 24% |
TiO2_XH | 4 | 12.33 | 12.60 | 10.75 | 13.17 | 1.08 | 1.16 | 9% |
Fe_XH | 4 | 41.53 | 41.80 | 35.14 | 45.19 | 4.49 | 20.14 | 11% |
SiO2_XH | 4 | 16.87 | 13.83 | 13.38 | 23.60 | 4.72 | 22.25 | 28% |
DT | - | - | - | - | - | - | - | - |
V2O5_XC | - | - | - | - | - | - | - | - |
TiO2_XC | - | - | - | - | - | - | - | - |
Fe_XC | - | - | - | - | - | - | - | - |
SiO2_XC | - | - | - | - | - | - | - | - |
MGB | TOPO | V2O5_XH | 157 | 0.29 | 0.20 | 0.02 | 1.02 | 0.23 | 0.05 | 79% |
TiO2_XH | 150 | 7.84 | 8.04 | 3.08 | 12.15 | 2.34 | 5.47 | 30% |
Fe_XH | 145 | 27.28 | 26.15 | 16.73 | 42.20 | 5.30 | 28.08 | 19% |
SiO2_XH | 150 | 32.69 | 33.53 | 15.45 | 45.31 | 6.45 | 41.57 | 20% |
DT | 81 | 16.38 | 15.52 | 3.14 | 33.50 | 7.49 | 56.04 | 46% |
V2O5_XC | 73 | 1.46 | 1.43 | 0.43 | 2.48 | 0.52 | 0.27 | 35% |
TiO2_XC | 74 | 1.89 | 1.66 | 0.83 | 4.47 | 0.81 | 0.65 | 43% |
Fe_XC | 74 | 68.44 | 68.52 | 65.32 | 70.47 | 1.02 | 1.05 | 1% |
SiO2_XC | 74 | 0.67 | 0.56 | 0.35 | 1.64 | 0.31 | 0.09 | 46% |
Cycle | Domain | Lens | Variable | Count | Mean | Median | Min | Max | S.dv. | Variance | C.V. |
C7 | MGB | | V2O5_XH | 135 | 0.13 | 0.10 | 0.02 | 0.67 | 0.11 | 0.01 | 83% |
TiO2_XH | 138 | 6.10 | 5.76 | 0.97 | 12.39 | 2.10 | 4.39 | 34% |
Fe_XH | 131 | 22.33 | 22.34 | 9.53 | 33.42 | 3.83 | 14.71 | 17% |
SiO2_XH | 138 | 38.82 | 38.35 | 24.02 | 62.28 | 5.66 | 32.07 | 15% |
DT | 52 | 8.67 | 7.61 | 2.15 | 21.40 | 3.96 | 15.71 | 46% |
V2O5_XC | 47 | 0.95 | 0.53 | 0.37 | 2.32 | 0.68 | 0.47 | 72% |
TiO2_XC | 47 | 1.55 | 1.50 | 0.64 | 3.92 | 0.61 | 0.37 | 39% |
Fe_XC | 47 | 68.92 | 69.00 | 66.88 | 70.34 | 0.73 | 0.53 | 1% |
SiO2_XC | 47 | 1.09 | 1.07 | 0.44 | 1.87 | 0.29 | 0.09 | 27% |
MPXT | | V2O5_XH | 39 | 0.07 | 0.05 | 0.01 | 0.19 | 0.05 | 0.00 | 75% |
TiO2_XH | 33 | 8.49 | 8.04 | 2.85 | 14.50 | 2.90 | 8.42 | 34% |
Fe_XH | 29 | 32.24 | 33.26 | 24.12 | 40.66 | 4.28 | 18.28 | 13% |
SiO2_XH | 33 | 29.80 | 29.00 | 16.54 | 44.00 | 6.05 | 36.63 | 20% |
DT | 14 | 13.77 | 13.20 | 4.69 | 28.95 | 6.41 | 41.12 | 47% |
V2O5_XC | 12 | 0.26 | 0.16 | 0.09 | 0.75 | 0.20 | 0.04 | 78% |
TiO2_XC | 12 | 1.57 | 1.61 | 0.88 | 2.38 | 0.53 | 0.28 | 34% |
Fe_XC | 12 | 66.25 | 66.95 | 61.42 | 69.42 | 2.44 | 5.97 | 4% |
SiO2_XC | 12 | 2.48 | 2.15 | 0.46 | 6.38 | 1.60 | 2.56 | 65% |
| | | | | | | | | | |
PXTM | | V2O5_XH | 16 | 0.01 | 0.01 | 0.01 | 0.03 | 0.00 | 0.00 | 39% |
TiO2_XH | 14 | 2.72 | 2.53 | 2.17 | 4.18 | 0.59 | 0.34 | 21% |
Fe_XH | 14 | 23.05 | 22.89 | 19.18 | 26.33 | 1.78 | 3.18 | 8% |
SiO2_XH | 14 | 41.71 | 41.73 | 36.82 | 48.00 | 2.64 | 6.97 | 6% |
DT | - | - | - | - | - | - | - | - |
V2O5_XC | - | - | - | - | - | - | - | - |
TiO2_XC | - | - | - | - | - | - | - | - |
Fe_XC | - | - | - | - | - | - | - | - |
SiO2_XC | - | - | - | - | - | - | - | - |
Cycle | Domain | Lens | Variable | Count | Mean | Median | Min | Max | S.dv. | Variance | C.V. |
C8 | MAG | | V2O5_XH | 292 | 0.69 | 0.72 | 0.04 | 1.17 | 0.18 | 0.03 | 26% |
TiO2_XH | 292 | 14.83 | 15.30 | 0.96 | 21.10 | 3.04 | 9.23 | 20% |
Fe_XH | 291 | 43.11 | 44.65 | 6.10 | 53.79 | 7.26 | 52.64 | 17% |
SiO2_XH | 292 | 14.09 | 12.11 | 1.65 | 55.34 | 8.54 | 72.87 | 61% |
DT | 129 | 40.99 | 42.50 | 3.73 | 60.47 | 12.75 | 162.54 | 31% |
V2O5_XC | 118 | 1.51 | 1.57 | 0.69 | 2.65 | 0.35 | 0.12 | 23% |
TiO2_XC | 118 | 4.68 | 5.07 | 1.36 | 6.35 | 1.09 | 1.18 | 23% |
Fe_XC | 118 | 65.68 | 65.54 | 63.71 | 68.83 | 1.14 | 1.29 | 2% |
SiO2_XC | 118 | 0.65 | 0.61 | 0.15 | 2.25 | 0.30 | 0.09 | 46% |
MGB | 1 | V2O5_XH | 203 | 0.21 | 0.18 | 0.03 | 0.73 | 0.12 | 0.01 | 57% |
TiO2_XH | 204 | 7.64 | 7.49 | 0.80 | 15.44 | 2.93 | 8.57 | 38% |
Fe_XH | 204 | 23.31 | 21.58 | 4.31 | 38.58 | 6.00 | 36.04 | 26% |
SiO2_XH | 204 | 35.30 | 36.21 | 16.44 | 66.44 | 7.39 | 54.63 | 21% |
DT | 94 | 14.02 | 14.50 | 0.01 | 32.55 | 6.68 | 44.61 | 48% |
V2O5_XC | 83 | 1.19 | 1.05 | 0.56 | 2.09 | 0.41 | 0.17 | 34% |
TiO2_XC | 83 | 1.83 | 1.84 | 0.63 | 3.47 | 0.57 | 0.32 | 31% |
Fe_XC | 83 | 68.48 | 68.48 | 65.28 | 70.35 | 0.99 | 0.98 | 1% |
SiO2_XC | 83 | 0.90 | 0.81 | 0.49 | 3.57 | 0.42 | 0.17 | 46% |
2 | V2O5_XH | 91 | 0.37 | 0.31 | 0.01 | 0.83 | 0.21 | 0.04 | 56% |
TiO2_XH | 91 | 8.19 | 7.55 | 1.25 | 15.28 | 3.45 | 11.91 | 42% |
Fe_XH | 91 | 27.22 | 25.20 | 5.00 | 44.74 | 8.63 | 74.45 | 32% |
SiO2_XH | 91 | 31.95 | 33.35 | 12.33 | 57.69 | 9.51 | 90.53 | 30% |
DT | 64 | 15.52 | 12.10 | 0.17 | 37.06 | 10.48 | 109.77 | 67% |
V2O5_XC | 53 | 1.38 | 1.48 | 0.10 | 2.34 | 0.52 | 0.28 | 38% |
TiO2_XC | 53 | 2.99 | 2.45 | 0.58 | 6.16 | 1.78 | 3.16 | 59% |
Fe_XC | 53 | 67.30 | 67.27 | 63.82 | 69.91 | 1.77 | 3.12 | 3% |
SiO2_XC | 53 | 0.68 | 0.62 | 0.36 | 1.50 | 0.24 | 0.06 | 36% |
TOPO | V2O5_XH | 8 | 0.18 | 0.20 | 0.14 | 0.23 | 0.03 | 0.00 | 19% |
TiO2_XH | 8 | 2.95 | 3.02 | 2.11 | 4.37 | 0.79 | 0.63 | 27% |
Fe_XH | 8 | 16.29 | 17.26 | 13.32 | 20.38 | 2.57 | 6.58 | 16% |
SiO2_XH | 8 | 43.84 | 43.29 | 38.95 | 46.80 | 2.59 | 6.70 | 6% |
DT | - | - | - | - | - | - | - | - |
V2O5_XC | - | - | - | - | - | - | - | - |
TiO2_XC | - | - | - | - | - | - | - | - |
Fe_XC | - | - | - | - | - | - | - | - |
SiO2_XC | - | - | - | - | - | - | - | - |
MPXT | | V2O5_XH | 39 | 0.19 | 0.18 | 0.14 | 0.27 | 0.02 | 0.00 | 12% |
TiO2_XH | 39 | 4.24 | 4.13 | 3.27 | 7.26 | 0.74 | 0.55 | 17% |
Fe_XH | 39 | 20.29 | 20.06 | 16.43 | 30.58 | 2.51 | 6.33 | 12% |
SiO2_XH | 39 | 40.17 | 40.65 | 29.70 | 44.18 | 2.47 | 6.09 | 6% |
DT | 29 | 6.99 | 6.14 | 2.11 | 20.90 | 3.58 | 12.82 | 51% |
V2O5_XC | 23 | 0.97 | 1.00 | 0.22 | 1.09 | 0.17 | 0.03 | 18% |
TiO2_XC | 23 | 1.16 | 1.04 | 0.66 | 1.94 | 0.36 | 0.13 | 31% |
Fe_XC | 23 | 69.44 | 69.36 | 68.41 | 70.61 | 0.63 | 0.40 | 1% |
SiO2_XC | 23 | 1.02 | 1.00 | 0.65 | 1.41 | 0.21 | 0.05 | 21% |
2 | V2O5_XH | 3 | 0.30 | 0.29 | 0.27 | 0.34 | 0.03 | 0.00 | 12% |
TiO2_XH | 3 | 12.14 | 12.58 | 10.40 | 13.43 | 1.56 | 2.45 | 13% |
Fe_XH | 3 | 33.17 | 33.62 | 31.10 | 34.79 | 1.89 | 3.56 | 6% |
SiO2_XH | 3 | 22.99 | 22.39 | 20.59 | 26.00 | 2.76 | 7.60 | 12% |
DT | - | - | - | - | - | - | - | - |
V2O5_XC | - | - | - | - | - | - | - | - |
TiO2_XC | - | - | - | - | - | - | - | - |
Fe_XC | - | - | - | - | - | - | - | - |
SiO2_XC | - | - | - | - | - | - | - | - |
3 | V2O5_XH | 15 | 0.19 | 0.19 | 0.13 | 0.24 | 0.03 | 0.00 | 16% |
TiO2_XH | 15 | 4.35 | 4.29 | 3.45 | 5.22 | 0.51 | 0.26 | 12% |
Fe_XH | 15 | 20.44 | 21.02 | 16.71 | 23.27 | 1.93 | 3.74 | 9% |
SiO2_XH | 15 | 40.32 | 40.10 | 37.63 | 43.45 | 1.71 | 2.93 | 4% |
DT | 15 | 6.77 | 6.78 | 3.11 | 9.28 | 1.70 | 2.91 | 25% |
V2O5_XC | 15 | 1.06 | 1.04 | 0.96 | 1.44 | 0.12 | 0.01 | 11% |
TiO2_XC | 15 | 1.37 | 1.01 | 0.67 | 3.89 | 0.94 | 0.89 | 69% |
Fe_XC | 15 | 68.82 | 69.28 | 64.86 | 70.23 | 1.54 | 2.36 | 2% |
SiO2_XC | 15 | 1.04 | 0.79 | 0.65 | 2.70 | 0.62 | 0.38 | 59% |
4 | V2O5_XH | 2 | 0.19 | 0.18 | 0.18 | 0.20 | 0.02 | 0.00 | 8% |
TiO2_XH | 2 | 3.43 | 3.46 | 3.40 | 3.46 | 0.04 | 0.00 | 1% |
Fe_XH | 2 | 17.77 | 17.66 | 17.66 | 17.88 | 0.16 | 0.02 | 1% |
SiO2_XH | 2 | 42.93 | 43.04 | 42.82 | 43.04 | 0.16 | 0.02 | 0% |
DT | - | - | - | - | - | - | - | - |
V2O5_XC | - | - | - | - | - | - | - | - |
TiO2_XC | - | - | - | - | - | - | - | - |
Fe_XC | - | - | - | - | - | - | - | - |
SiO2_XC | - | - | - | - | - | - | - | - |
5 | V2O5_XH | 4 | 0.25 | 0.20 | 0.19 | 0.38 | 0.10 | 0.01 | 38% |
TiO2_XH | 4 | 5.00 | 4.00 | 3.93 | 7.52 | 1.86 | 3.47 | 37% |
Fe_XH | 4 | 22.16 | 19.90 | 19.67 | 27.94 | 4.26 | 18.18 | 19% |
SiO2_XH | 4 | 37.92 | 40.69 | 30.52 | 41.30 | 5.46 | 29.83 | 14% |
DT | 3 | 5.27 | 5.20 | 5.15 | 5.45 | 0.16 | 0.03 | 3% |
V2O5_XC | 2 | 1.12 | 1.12 | 1.12 | 1.13 | 0.01 | 0.00 | 1% |
TiO2_XC | 2 | 1.24 | 1.20 | 1.20 | 1.29 | 0.06 | 0.00 | 5% |
Fe_XC | 2 | 68.80 | 68.87 | 68.73 | 68.87 | 0.10 | 0.01 | 0% |
SiO2_XC | 2 | 0.84 | 0.77 | 0.77 | 0.91 | 0.10 | 0.01 | 12% |
Cycle | Domain | Lens | Variable | Count | Mean | Median | Min | Max | S.dv. | Variance | C.V. |
C9 | MGB | 1 | V2O5_XH | 13 | 0.45 | 0.39 | 0.11 | 0.80 | 0.20 | 0.04 | 44% |
TiO2_XH | 13 | 4.82 | 4.55 | 1.14 | 8.32 | 2.06 | 4.23 | 43% |
Fe_XH | 13 | 18.56 | 17.00 | 5.22 | 30.85 | 7.06 | 49.88 | 38% |
SiO2_XH | 13 | 37.72 | 37.81 | 25.41 | 55.90 | 8.05 | 64.78 | 21% |
DT | 13 | 15.26 | 15.18 | 0.02 | 30.09 | 8.64 | 74.68 | 57% |
V2O5_XC | 9 | 1.81 | 1.69 | 1.51 | 2.33 | 0.29 | 0.08 | 16% |
TiO2_XC | 9 | 8.68 | 12.04 | 0.54 | 12.67 | 5.44 | 29.55 | 63% |
Fe_XC | 9 | 61.92 | 59.93 | 58.18 | 69.25 | 4.47 | 19.96 | 7% |
SiO2_XC | 9 | 1.57 | 1.55 | 1.04 | 2.04 | 0.34 | 0.11 | 22% |
2 | V2O5_XH | 1147 | 0.37 | 0.37 | 0.01 | 0.77 | 0.13 | 0.02 | 34% |
TiO2_XH | 1148 | 6.77 | 6.79 | 0.06 | 10.98 | 1.96 | 3.82 | 29% |
Fe_XH | 1148 | 24.90 | 25.61 | 0.83 | 36.68 | 5.30 | 28.06 | 21% |
SiO2_XH | 1148 | 33.82 | 33.26 | 17.58 | 74.20 | 6.86 | 47.11 | 20% |
DT | 923 | 14.55 | 14.09 | 0.00 | 37.54 | 7.12 | 50.75 | 49% |
V2O5_XC | 819 | 1.53 | 1.61 | 0.29 | 2.15 | 0.32 | 0.10 | 21% |
TiO2_XC | 819 | 1.64 | 1.34 | 0.39 | 8.07 | 1.03 | 1.06 | 63% |
Fe_XC | 819 | 68.07 | 68.53 | 48.96 | 70.89 | 2.18 | 4.76 | 3% |
SiO2_XC | 819 | 1.01 | 0.73 | 0.30 | 13.39 | 1.17 | 1.36 | 115% |
3 | V2O5_XH | 10 | 0.59 | 0.57 | 0.36 | 0.90 | 0.20 | 0.04 | 34% |
TiO2_XH | 10 | 6.83 | 7.99 | 4.20 | 9.44 | 2.04 | 4.15 | 30% |
Fe_XH | 10 | 25.42 | 28.91 | 16.47 | 34.72 | 6.82 | 46.53 | 27% |
SiO2_XH | 10 | 30.66 | 27.50 | 20.48 | 39.60 | 6.82 | 46.56 | 22% |
DT | 10 | 20.35 | 20.16 | 9.76 | 36.24 | 10.03 | 100.64 | 49% |
V2O5_XC | 10 | 2.08 | 2.09 | 1.95 | 2.20 | 0.10 | 0.01 | 5% |
TiO2_XC | 10 | 2.85 | 2.56 | 1.60 | 7.06 | 1.44 | 2.07 | 51% |
Fe_XC | 10 | 66.66 | 66.54 | 62.66 | 68.11 | 1.55 | 2.41 | 2% |
SiO2_XC | 10 | 1.23 | 1.08 | 0.69 | 2.12 | 0.46 | 0.22 | 38% |
Table 14-7: NAN deposit Descriptive statistic. "XH" suffix means content in head grades and "XC" means content in the Davis Tube magnetic concentrates.
Cycle | Domain | Variable | Count | Mean | Median | Min. | Max. | S.dv. | Variance | C.V. |
C4 | MGB | V2O5_XH | 40 | 0.32 | 0.06 | 0.01 | 1.23 | 0.35 | 0.12 | 110.38% |
TiO2_XH | 51 | 4.70 | 4.04 | 1.58 | 12.80 | 2.83 | 8.00 | 60.22% |
Fe_XH | 51 | 23.61 | 22.40 | 18.10 | 38.70 | 4.57 | 20.89 | 19.36% |
SiO2_XH | 51 | 38.69 | 39.60 | 19.20 | 50.00 | 7.49 | 56.16 | 19.37% |
DT | 51 | 8.91 | 5.00 | 0.50 | 34.70 | 8.92 | 79.64 | 100.13% |
V2O5_XC | 24 | 1.83 | 1.70 | 0.02 | 3.93 | 1.32 | 1.74 | 72.05% |
TiO2_XC | 24 | 2.26 | 2.58 | 0.69 | 4.46 | 1.23 | 1.52 | 54.67% |
Fe_XC | 24 | 65.18 | 65.62 | 59.20 | 67.30 | 1.94 | 3.76 | 2.97% |
SiO2_XC | 24 | 2.89 | 3.09 | 0.95 | 6.35 | 1.62 | 2.63 | 56.11% |
MPXT | V2O5_XH | 6 | 0.67 | 0.69 | 0.43 | 0.76 | 0.13 | 0.02 | 18.57% |
TiO2_XH | 7 | 10.56 | 11.80 | 4.37 | 14.30 | 3.66 | 13.39 | 34.65% |
Fe_XH | 7 | 29.08 | 28.30 | 22.89 | 39.31 | 5.63 | 31.65 | 19.35% |
SiO2_XH | 7 | 28.56 | 29.00 | 17.75 | 41.46 | 7.49 | 56.10 | 26.22% |
DT | 7 | 12.98 | 6.99 | 1.20 | 36.36 | 12.29 | 150.99 | 94.68% |
V2O5_XC | 2 | 2.11 | 1.56 | 1.56 | 2.65 | 0.77 | 0.59 | 36.48% |
TiO2_XC | 2 | 4.06 | 2.56 | 2.56 | 5.56 | 2.12 | 4.51 | 52.30% |
Fe_XC | 2 | 60.27 | 57.83 | 57.83 | 62.70 | 3.44 | 11.83 | 5.71% |
SiO2_XC | 2 | 4.83 | 3.29 | 3.29 | 6.37 | 2.18 | 4.74 | 45.08% |
Cycle | Domain | Variable | Count | Mean | Median | Min. | Max. | S.dv. | Variance | C.V. |
C5 | MGB | V2O5_XH | 1099 | 0.58 | 0.49 | 0.01 | 1.75 | 0.30 | 0.09 | 51.63% |
TiO2_XH | 1100 | 5.59 | 5.51 | 0.29 | 19.96 | 1.99 | 3.95 | 35.54% |
Fe_XH | 1100 | 21.43 | 20.80 | 1.74 | 45.85 | 4.92 | 24.22 | 22.97% |
SiO2_XH | 1100 | 36.51 | 36.85 | 11.77 | 70.39 | 6.29 | 39.52 | 17.22% |
DT | 1011 | 12.38 | 11.90 | 0.01 | 37.94 | 7.59 | 57.54 | 61.28% |
V2O5_XC | 706 | 2.98 | 2.99 | 0.26 | 6.20 | 0.73 | 0.53 | 24.53% |
TiO2_XC | 706 | 1.95 | 1.85 | 0.56 | 6.81 | 0.87 | 0.75 | 44.45% |
Fe_XC | 706 | 64.61 | 65.40 | 43.75 | 69.63 | 3.40 | 11.54 | 5.26% |
SiO2_XC | 706 | 2.86 | 2.28 | 0.51 | 17.66 | 2.35 | 5.50 | 81.98% |
MPXT | V2O5_XH | 26 | 0.98 | 1.01 | 0.55 | 1.51 | 0.24 | 0.06 | 24.10% |
TiO2_XH | 26 | 11.14 | 11.10 | 6.27 | 17.10 | 2.51 | 6.28 | 22.49% |
Fe_XH | 26 | 36.05 | 35.30 | 25.80 | 49.80 | 6.43 | 41.36 | 17.84% |
SiO2_XH | 26 | 19.93 | 19.30 | 7.36 | 32.20 | 6.27 | 39.29 | 31.45% |
DT | 26 | 30.66 | 29.80 | 8.60 | 59.90 | 12.82 | 164.43 | 41.82% |
V2O5_XC | 25 | 2.37 | 2.33 | 1.63 | 3.28 | 0.42 | 0.18 | 17.67% |
TiO2_XC | 25 | 3.68 | 3.57 | 1.55 | 9.03 | 1.67 | 2.77 | 45.23% |
Fe_XC | 25 | 60.27 | 62.70 | 42.80 | 66.60 | 6.78 | 45.93 | 11.24% |
SiO2_XC | 25 | 5.09 | 3.99 | 1.17 | 16.10 | 4.45 | 19.81 | 87.37% |
C6 | MAG | V2O5_XH | 825 | 0.93 | 0.98 | 0.01 | 1.52 | 0.31 | 0.10 | 33.54% |
TiO2_XH | 835 | 12.12 | 13.05 | 0.69 | 15.25 | 2.35 | 5.53 | 19.41% |
Fe_XH | 835 | 40.35 | 41.70 | 4.21 | 50.70 | 6.37 | 40.52 | 15.78% |
SiO2_XH | 835 | 17.32 | 15.75 | 7.11 | 69.70 | 7.08 | 50.09 | 40.86% |
DT | 819 | 37.90 | 38.20 | 0.20 | 64.02 | 10.62 | 112.86 | 28.03% |
V2O5_XC | 807 | 2.05 | 2.14 | 0.46 | 3.23 | 0.51 | 0.27 | 25.17% |
TiO2_XC | 807 | 4.20 | 4.08 | 0.86 | 9.05 | 1.34 | 1.81 | 32.03% |
Fe_XC | 807 | 63.07 | 63.80 | 41.56 | 68.48 | 3.27 | 10.68 | 5.18% |
SiO2_XC | 807 | 3.08 | 2.51 | 0.36 | 18.86 | 2.14 | 4.60 | 69.52% |
MGB | V2O5_XH | 1760 | 0.12 | 0.05 | 0.002 | 1.14 | 0.14 | 0.02 | 116.95% |
TiO2_XH | 1800 | 5.69 | 3.91 | 0.03 | 14.20 | 3.14 | 9.86 | 55.18% |
Fe_XH | 1800 | 24.19 | 23.06 | 0.80 | 44.29 | 4.43 | 19.64 | 18.32% |
SiO2_XH | 1800 | 36.37 | 38.80 | 12.40 | 68.60 | 6.52 | 42.51 | 17.93% |
DT | 1269 | 8.34 | 4.80 | 0.01 | 42.56 | 8.00 | 64.07 | 95.95% |
V2O5_XC | 506 | 0.95 | 0.85 | 0.05 | 2.96 | 0.45 | 0.20 | 47.73% |
TiO2_XC | 506 | 2.11 | 1.88 | 0.52 | 7.85 | 1.03 | 1.06 | 48.84% |
Fe_XC | 506 | 65.22 | 66.10 | 43.20 | 69.61 | 3.55 | 12.62 | 5.45% |
SiO2_XC | 506 | 3.11 | 2.20 | 0.49 | 18.60 | 2.65 | 7.01 | 85.00% |
C7 | MAG | V2O5_XH | 97 | 0.12 | 0.12 | 0.00 | 0.45 | 0.07 | 0.01 | 58.93% |
TiO2_XH | 99 | 13.60 | 13.70 | 3.19 | 17.70 | 2.76 | 7.62 | 20.30% |
Fe_XH | 99 | 40.60 | 41.38 | 24.00 | 46.10 | 4.16 | 17.30 | 10.24% |
SiO2_XH | 99 | 18.42 | 17.70 | 11.00 | 37.60 | 5.12 | 26.18 | 27.78% |
DT | 79 | 29.69 | 30.94 | 6.26 | 46.90 | 7.63 | 58.24 | 25.71% |
V2O5_XC | 79 | 0.33 | 0.30 | 0.03 | 1.12 | 0.20 | 0.04 | 60.81% |
TiO2_XC | 79 | 3.76 | 3.33 | 1.70 | 6.91 | 1.21 | 1.46 | 32.18% |
Fe_XC | 79 | 64.81 | 65.90 | 55.73 | 69.31 | 2.99 | 8.94 | 4.61% |
SiO2_XC | 79 | 3.19 | 2.42 | 0.72 | 15.85 | 2.53 | 6.40 | 79.19% |
MGB | V2O5_XH | 782 | 0.09 | 0.02 | 0.01 | 0.93 | 0.10 | 0.01 | 118.05% |
TiO2_XH | 1159 | 3.82 | 3.14 | 0.02 | 16.42 | 2.19 | 4.79 | 57.31% |
Fe_XH | 1159 | 23.73 | 24.70 | 0.71 | 60.05 | 5.58 | 31.13 | 23.51% |
SiO2_XH | 1159 | 38.32 | 37.70 | 7.28 | 74.00 | 6.33 | 40.12 | 16.53% |
DT | 623 | 6.00 | 4.30 | 0.02 | 43.20 | 6.01 | 36.15 | 100.15% |
V2O5_XC | 230 | 0.27 | 0.06 | 0.01 | 1.71 | 0.46 | 0.21 | 172.47% |
TiO2_XC | 233 | 2.22 | 2.13 | 0.33 | 7.17 | 0.96 | 0.92 | 43.01% |
Fe_XC | 233 | 60.91 | 62.70 | 38.50 | 70.50 | 7.09 | 50.28 | 11.64% |
SiO2_XC | 233 | 8.01 | 6.25 | 0.36 | 35.10 | 6.98 | 48.79 | 87.18% |
14.6 Density
In total, between 2012 and 2019 Largo made 1,555 density determinations in Campbell Pit, GAN and NAN deposits using an appropriate procedure the volume displacement method (Archimedes) used then by Largo for different lithological types. Table 14-8 summarizes average density obtained of the campaigns in 2019 3D model.
Table 14-8: Average Specific Gravity for the Campbell deposit, Largo Database. 2012-2019
2012-2019 | Average (g/cm3) |
Rock Type | GA (906
samples) | GAN (330
samples) | NAN (319
samples) |
ANO | 2.77 | 2.83 | 2.81 |
GAB | 3.08 | 3.09 | 3.1 |
GCM | | 3.21 | 3.22 |
GPS | | | |
MAG | 4.39 | 4.2 | 4.32 |
MGB | | 3.51 | 3.5 |
MGTGAB | | 3.26 | 3.28 |
MGPYXT | 3.47 | 3.82 | 3.51 |
MPXT | | 3.62 | 3.62 |
PEG | 2.58 | 2.62 | 2.59 |
PYXT | 3.23 | 3.34 | 3.23 |
PXTM | | 3.36 | 3.36 |
LARGO in 2020 conducted a density determination campaign using a pycnometer, another density method to add and validate previous determinations. This determination by Pycnometer was made at the ALS GLOBAL Laboratory in Vespasiano - MG.
A total of 601 density determinations were obtained by ALS using the Pycnometer method from different lithotypes and magmatic cycles for Campbell Pit (143 samples), NAN deposit (229 samples) and GAN deposit (229 samples). These data were entered in the database identified and used in the joint analysis with the previous densities. Table 14-9 summarizes pycnometers density values obtained in 2020.
Table 14-9: Average Specific Gravity by pycnometer for deposits, 2020 Largo Data 2020.
2020 | Average (g/cm3) |
Rock Type | Campbell Pit (143 samples) | GAN (229 samples) | NAN (229 samples) |
ANO | 2.76 | 2.75 | 2.76 |
GAB | 3.02 | 3.00 | 3.04 |
GCM | 3.16 | 3.14 | 3.10 |
GPS | | 2.62 | 2.67 |
MAG | 3.95 | 3.97 | 3.95 |
MGB | 3.52 | 3.42 | 3.30 |
MPXT | 3.67 | 3.48 | 3.61 |
MPXT | 3.78 | | |
PEG | 2.70 | 2.69 | 2.52 |
PXT | 3.27 | 3.13 | 3.15 |
PXTM | 3.22 | 3.28 | 3.32 |
Following the history of density determination and realizing that the values for each type of rock are similar, the QP assumed the density general average of all data according to the geologic modeling 2021. Table 14-10 shows the assumed average for each typology in the deposits based on 2021 3D modeling.
Table 14-10: Average Specific Gravity assigned in Mineral Resource Estimates in 2021.
2021 | Average (g/cm3) |
Rock Type | Campbell | GAN | NAN |
COV | 1.80 | 1.80 | 1.80 |
GAB; HB | 3.22 | 2.99 | 3.04 |
PEG | 2.89 | 2.66 | 2.50 |
MGB | 3.52 | 3.38 | 3.29 |
MAG | 4.32 | 3.99 | 3.96 |
MPXT (HG) | 3.85 | - | - |
MPXT(LG) | 3.58 | - | - |
MPXT | 2.94+0.0195*MAG% | 3.47 | 3.61 |
PXTM | 3.22 | 3.11 | 3.32 |
GCM;GPS | 3.45 | 3.13 | 3.09 |
ANO | 3.04 | 2.74 | 2.73 |
14.7 Variographic Analysis
Variographic analysis was carried out for the Magnetitite, Magnetite-Gabbro and Magnetite - Pyroxenite domains. The main objectives of this analysis are:
1. To mathematically structure the variability between two points in space to measure the area of influence and the degree and type of variability restricted to a homogeneous field.
2. To establish a spatial distribution model of a regionalized variable to measure estimation precision.
The QP prepared variographic analysis of the composites for each domain separately. In some situations, in domains with a few samples, domains were grouped for create robust variograms. A theoretical variogram was modeled along the hole to evaluate the behavior at the origin of the variogram of each domain. The directional variograms of the global content ("Head Grade") and Concentrate ("Concentrate Grade") for %V2O5, %Fe, %SiO2, %TiO2 were modelled in each main domain for each deposit.
Table 14-11 to Table 14-13 show the adjusted variographic parameters of the treated variables by deposit.
Table 14-11: Campbell Pit Deposit Variographic Parameters.
Domain | Solids | Variable | Dip | Dip Az | Pitch | Nugget | Structure1 | Structure2 |
Sill1 | Y1 | X1 | Z1 | Sill2 | Y2 | X2 | Z2 |
General Parameters: |
Sphericals Variograms; Normalized variographic parameters;Yn=major axis;Xn=semi-major axis and Zn=minor axis |
MAG | C3,C4 | V2O5_XH | 50 | 110 | 10 | 0.07 | 0.16 | 20 | 15 | 8 | 0.12 | 100 | 70 | 30 |
TiO2_XH | 50 | 110 | 90 | 1.00 | 6.63 | 16 | 17 | 6 | 2.37 | 90 | 45 | 7 |
FE_XH | 50 | 110 | 42 | 5.29 | 32.29 | 20 | 20 | 4 | 14.82 | 200 | 120 | 13 |
SiO2_XH | 50 | 110 | 42 | 0.05 | 0.25 | 22 | 17 | 5 | 0.16 | 150 | 117 | 12 |
DT | 50 | 110 | 10 | 15.80 | 62.15 | 30 | 10 | 4 | 28.44 | 100 | 60 | 15 |
V2O5_XC | 50 | 110 | 55 | 0.09 | 0.06 | 40 | 15 | 8 | 0.24 | 160 | 50 | 30 |
TiO2_XC | 50 | 110 | 55 | 0.00 | 0.01 | 40 | 15 | 3 | 0.02 | 120 | 75 | 35 |
FE_XC | 50 | 110 | 55 | 0.87 | 3.60 | 20 | 14 | 20 | 2.84 | 65 | 65 | 25 |
SiO2_XC | 50 | 110 | 42 | 0.15 | 0.36 | 30 | 20 | 5 | 0.52 | 150 | 45 | 15 |
Domain | Solids | Variable | Dip | Dip Az | Pitch | Nugget | Structure1 | Structure2 |
Sill1 | Y1 | X1 | Z1 | Sill2 | Y2 | X2 | Z2 |
MGB | C4,C6,C8,C9 | V2O5_XH | 50 | 110 | 110 | 0.01 | 0.14 | 16 | 10 | 7 | 0.08 | 110 | 30 | 30 |
TiO2_XH | 50 | 110 | 90 | 0.00 | 0.04 | 25 | 17 | 5 | 0.02 | 130 | 45 | 10 |
FE_XH | 50 | 110 | 42 | 6.63 | 45.76 | 20 | 20 | 10 | 13.26 | 110 | 75 | 30 |
SiO2_XH | 50 | 110 | 42 | 7.80 | 55.40 | 20 | 20 | 10 | 14.83 | 190 | 155 | 35 |
DT | 50 | 110 | 110 | 25.68 | 87.62 | 30 | 20 | 3 | 49.02 | 100 | 55 | 25 |
V2O5_XC | 50 | 110 | 110 | 0.11 | 0.30 | 25 | 10 | 5 | 0.27 | 140 | 95 | 45 |
TiO2_XC | 50 | 110 | 55 | 0.00 | 0.05 | 14 | 14 | 8 | 0.03 | 120 | 45 | 15 |
FE_XC | 50 | 110 | 10 | 1.76 | 4.11 | 10 | 10 | 7 | 8.84 | 75 | 65 | 60 |
SiO2_XC | 50 | 110 | 42 | 2.08 | 4.26 | 15 | 15 | 20 | 4.05 | 155 | 70 | 20 |
MPXT_HG_DT and MPXT_LG_DT | TZ,C1,C3,C4,C5 | V2O5_XH | 50 | 110 | 110 | 0.01 | 0.14 | 16 | 10 | 7 | 0.08 | 110 | 30 | 30 |
TiO2_XH | 50 | 110 | 90 | 0.00 | 0.04 | 25 | 17 | 5 | 0.02 | 130 | 45 | 10 |
FE_XH | 50 | 110 | 42 | 6.63 | 45.76 | 20 | 20 | 10 | 13.26 | 110 | 75 | 30 |
SiO2_XH | 50 | 110 | 42 | 7.80 | 55.40 | 20 | 20 | 10 | 14.83 | 190 | 155 | 35 |
DT | 50 | 110 | 110 | 25.68 | 87.62 | 30 | 20 | 3 | 49.02 | 100 | 55 | 25 |
V2O5_XC | 50 | 110 | 110 | 0.11 | 0.30 | 25 | 10 | 5 | 0.27 | 140 | 95 | 45 |
TiO2_XC | 50 | 110 | 55 | 0.00 | 0.05 | 14 | 14 | 8 | 0.03 | 120 | 45 | 15 |
FE_XC | 50 | 110 | 10 | 1.76 | 4.11 | 10 | 10 | 7 | 8.84 | 75 | 65 | 60 |
SiO2_XC | 50 | 110 | 42 | 2.08 | 4.26 | 15 | 15 | 20 | 4.05 | 155 | 70 | 20 |
PXTM | TZ,C1,C3,C4,C7 | V2O5_XH | 50 | 110 | 110 | 0.01 | 0.14 | 16 | 10 | 7 | 0.08 | 110 | 30 | 30 |
TiO2_XH | 50 | 110 | 90 | 0.00 | 0.04 | 25 | 17 | 5 | 0.02 | 130 | 45 | 10 |
FE_XH | 50 | 110 | 42 | 6.63 | 45.76 | 20 | 20 | 10 | 13.26 | 110 | 75 | 30 |
SiO2_XH | 50 | 110 | 42 | 7.80 | 55.40 | 20 | 20 | 10 | 14.83 | 190 | 155 | 35 |
DT | 50 | 110 | 110 | 25.68 | 87.62 | 30 | 20 | 3 | 49.02 | 100 | 55 | 25 |
V2O5_XC | 50 | 110 | 110 | 0.11 | 0.30 | 25 | 10 | 5 | 0.27 | 140 | 95 | 45 |
TiO2_XC | 50 | 110 | 55 | 0.00 | 0.05 | 14 | 14 | 8 | 0.03 | 120 | 45 | 15 |
FE_XC | 50 | 110 | 10 | 1.76 | 4.11 | 10 | 10 | 7 | 8.84 | 75 | 65 | 60 |
SiO2_XC | 50 | 110 | 42 | 2.08 | 4.26 | 15 | 15 | 20 | 4.05 | 155 | 70 | 20 |
Table 14-12: GAN Deposit Variographic Parameters.
Domain | Solids | Variable | Dip | Dip Az | Pitch | Nugget | Structure1 | Structure2 |
Sill1 | Y1 | X1 | Z1 | Sill2 | Y2 | X2 | Z2 |
General Parameters: |
Sphericals Variograms;Normalized variographic parameters;Yn=major axis;Xn=semi-major axis and Zn=minor axis |
MAG | C5,C6(1-
2),C8 | V2O5_XH | 65 | 105 | 0 | 0.15 | 0.23 | 75 | 55 | 4 | 0.62 | 200 | 140 | 12 |
TiO2_XH | 65 | 105 | 0 | 0.13 | 0.30 | 85 | 75 | 12 | 0.58 | 135 | 135 | 20 |
Fe_XH | 65 | 105 | 0 | 0.20 | 0.31 | 50 | 50 | 7 | 0.50 | 175 | 150 | 20 |
SiO2_XH | 65 | 105 | 0 | 0.20 | 0.31 | 50 | 50 | 7 | 0.50 | 175 | 150 | 20 |
DT | 65 | 105 | 0 | 0.20 | 0.15 | 30 | 25 | 4 | 0.66 | 160 | 120 | 12 |
V2O5_XC | 65 | 105 | 0 | 0.05 | 0.22 | 140 | 60 | 15 | 0.74 | 300 | 120 | 50 |
TiO2_XC | 65 | 105 | 0 | 0.10 | 0.33 | 85 | 75 | 12 | 0.57 | 135 | 135 | 20 |
Fe_XC | 65 | 105 | 0 | 0.20 | 0.31 | 50 | 50 | 7 | 0.50 | 175 | 150 | 20 |
SiO2_XC | 65 | 105 | 0 | 0.20 | 0.42 | 25 | 25 | 7 | 0.38 | 175 | 150 | 15 |
MGB | C4,C4(2),
C5(topo),
C5(base),
C6(topo),
C7,C8(1-2),
C8(topo),
C9(1-3) | V2O5_XH | 65 | 105 | 0 | 0.15 | 0.15 | 45 | 45 | 20 | 0.69 | 405 | 150 | 55 |
TiO2_XH | 65 | 105 | 0 | 0.10 | 0.50 | 66 | 55 | 3 | 0.39 | 350 | 85 | 35 |
Fe_XH | 65 | 105 | 0 | 0.20 | 0.52 | 55 | 40 | 5 | 0.28 | 350 | 70 | 35 |
SiO2_XH | 65 | 105 | 0 | 0.20 | 0.52 | 55 | 40 | 5 | 0.28 | 350 | 70 | 35 |
DT | 65 | 105 | 0 | 0.20 | 0.51 | 45 | 35 | 5 | 0.28 | 220 | 100 | 35 |
V2O5_XC | 65 | 105 | 0 | 0.05 | 0.34 | 200 | 45 | 45 | 0.61 | 400 | 100 | 50 |
TiO2_XC | 65 | 105 | 0 | 0.05 | 0.10 | 65 | 55 | 4 | 0.84 | 275 | 85 | 35 |
Fe_XC | 65 | 105 | 0 | 0.20 | 0.30 | 65 | 20 | 3 | 0.50 | 200 | 55 | 21 |
SiO2_XC | 65 | 105 | 0 | 0.20 | 0.52 | 55 | 40 | 5 | 0.28 | 350 | 70 | 35 |
Domain | Solids | Variable | Dip | Dip Az | Pitch | Nugget | Structure1 | Structure2 |
Sill1 | Y1 | X1 | Z1 | Sill2 | Y2 | X2 | Z2 |
MPXT | C4(topo),
C5,C7,C8,
C8(2-5) | V2O5_XH | 65 | 105 | 0 | 0.20 | 0.20 | 150 | 55 | 4 | 0.61 | 300 | 100 | 10 |
TiO2_XH | 65 | 105 | 0 | 0.20 | 0.20 | 150 | 55 | 4 | 0.61 | 300 | 100 | 10 |
Fe_XH | 65 | 105 | 0 | 0.20 | 0.34 | 70 | 55 | 4 | 0.47 | 195 | 100 | 10 |
SiO2_XH | 65 | 105 | 0 | 0.20 | 0.34 | 70 | 55 | 4 | 0.47 | 195 | 100 | 10 |
DT | 55 | 100 | 0 | 0.32 | 0.37 | 40 | 6 | 2 | 0.31 | 85 | 55 | 6 |
V2O5_XC | 60 | 100 | 2 | 0.10 | 0.49 | 35 | 25 | 20 | 0.42 | 120 | 100 | 40 |
TiO2_XC | 65 | 105 | 0 | 0.20 | 0.20 | 150 | 55 | 4 | 0.61 | 300 | 100 | 10 |
Fe_XC | 65 | 105 | 0 | 0.20 | 0.23 | 115 | 55 | 10 | 0.58 | 130 | 100 | 15 |
SiO2_XC | 65 | 105 | 0 | 0.20 | 0.34 | 70 | 55 | 4 | 0.47 | 195 | 100 | 10 |
PXTM | C4,C7 | V2O5_XH | 65 | 105 | 0 | 0.20 | 0.20 | 150 | 55 | 4 | 0.61 | 300 | 100 | 10 |
TiO2_XH | 65 | 105 | 0 | 0.20 | 0.20 | 150 | 55 | 4 | 0.61 | 300 | 100 | 10 |
Fe_XH | 65 | 105 | 0 | 0.20 | 0.34 | 70 | 55 | 4 | 0.47 | 195 | 100 | 10 |
SiO2_XH | 65 | 105 | 0 | 0.20 | 0.34 | 70 | 55 | 4 | 0.47 | 195 | 100 | 10 |
DT | 55 | 100 | 0 | 0.32 | 0.37 | 40 | 6 | 2 | 0.31 | 85 | 55 | 6 |
V2O5_XC | 60 | 100 | 2 | 0.10 | 0.49 | 35 | 25 | 20 | 0.42 | 120 | 100 | 40 |
TiO2_XC | 65 | 105 | 0 | 0.20 | 0.20 | 150 | 55 | 4 | 0.61 | 300 | 100 | 10 |
Fe_XC | 65 | 105 | 0 | 0.20 | 0.23 | 115 | 55 | 10 | 0.58 | 130 | 100 | 15 |
SiO2_XC | 65 | 105 | 0 | 0.20 | 0.34 | 70 | 55 | 4 | 0.47 | 195 | 100 | 10 |
Table 14-13: NAN area Varigraphic Parameters.
Domain | Solids | Variable | Dip | Dip Az | Pitch | Nugget | Structure1 | Structure2 |
Sill1 | Y1 | X1 | Z1 | Sill2 | Y2 | X2 | Z2 |
General Parameters: |
Sphericals Variograms;Normalized variographic parameters;Yn=major axis;Xn=semi major axis and Zn=minor axis |
MAG | C6,C7 | V2O5_XH | 75 | 110 | 105 | 0.05 | 0.35 | 60 | 45 | 4 | 0.60 | 115 | 85 | 11 |
TiO2_XH | 75 | 110 | 110 | 0.10 | 0.90 | 95 | 80 | 6 | - | - | - | - |
Fe_XH | 75 | 110 | 110 | 0.20 | 0.80 | 85 | 60 | 5 | - | - | - | - |
SiO2_XH | 75 | 110 | 110 | 0.20 | 0.30 | 75 | 45 | 5 | 0.50 | 100 | 90 | 5 |
DT | 75 | 110 | 110 | 0.20 | 0.80 | 80 | 50 | 5 | - | - | - | - |
V2O5_XC | 75 | 110 | 150 | 0.05 | 0.10 | 50 | 50 | 10 | 0.85 | 140 | 90 | 10 |
TiO2_XC | 75 | 110 | 150 | 0.20 | 0.80 | 100 | 100 | 8 | - | - | - | - |
Fe_XC | 75 | 110 | 150 | 0.20 | 0.80 | 120 | 90 | 15 | - | - | - | - |
SiO2_XC | 75 | 110 | 150 | 0.20 | 0.20 | 70 | 50 | 10 | 0.60 | 160 | 95 | 20 |
MGB | C4,C5, C6,C7 | V2O5_XH | 75 | 110 | 150 | 0.05 | 0.30 | 120 | 120 | 20 | 0.65 | 300 | 170 | 35 |
TiO2_XH | 75 | 110 | 35 | 0.05 | 0.09 | 40 | 40 | 10 | 0.82 | 130 | 130 | 13 |
Fe_XH | 75 | 110 | 100 | 0.05 | 0.90 | 130 | 130 | 15 | | | | |
SiO2_XH | 75 | 110 | 110 | 0.05 | 0.25 | 55 | 40 | 15 | 0.71 | 130 | 130 | 15 |
DT | 75 | 110 | 110 | 0.05 | 0.58 | 40 | 40 | 10 | 0.37 | 140 | 140 | 10 |
V2O5_XC | 75 | 110 | 150 | 0.01 | 0.16 | 120 | 120 | 30 | 0.83 | 320 | 250 | 30 |
TiO2_XC | 75 | 110 | 140 | 0.05 | 0.39 | 60 | 60 | 10 | 0.56 | 110 | 110 | 10 |
Fe_XC | 75 | 110 | 140 | 0.13 | 0.16 | 170 | 45 | 10 | 0.72 | 200 | 110 | 10 |
SiO2_XC | 75 | 110 | 110 | 0.10 | 0.17 | 10 | 10 | 10 | 0.74 | 160 | 160 | 10 |
MPXT | C4,C5 | V2O5_XH | 75 | 110 | 150 | 0.05 | 0.30 | 120 | 120 | 20 | 0.65 | 300 | 170 | 35 |
TiO2_XH | 75 | 110 | 35 | 0.05 | 0.09 | 40 | 40 | 10 | 0.82 | 130 | 130 | 13 |
Fe_XH | 75 | 110 | 100 | 0.05 | 0.90 | 130 | 130 | 15 | | | | |
SiO2_XH | 75 | 110 | 110 | 0.05 | 0.25 | 55 | 40 | 15 | 0.71 | 130 | 130 | 15 |
DT | 75 | 110 | 110 | 0.05 | 0.58 | 40 | 40 | 10 | 0.37 | 140 | 140 | 10 |
V2O5_XC | 75 | 110 | 150 | 0.01 | 0.16 | 120 | 120 | 30 | 0.83 | 320 | 250 | 30 |
TiO2_XC | 75 | 110 | 140 | 0.05 | 0.39 | 60 | 60 | 10 | 0.56 | 110 | 110 | 10 |
Fe_XC | 75 | 110 | 140 | 0.13 | 0.16 | 170 | 45 | 10 | 0.72 | 200 | 110 | 10 |
SiO2_XC | 75 | 110 | 110 | 0.10 | 0.17 | 10 | 10 | 10 | 0.74 | 160 | 160 | 10 |
14.8 Block Model
The QP built block models for the Campbell Pit, GAN and NAN deposits, as summarized in Table 14-14 to Table 14-16, respectively.
The dimensions of the blocks were based on the average spacing of the drilling grid and the mining areas. Sub-blocks were used to ensure adherence between modeled surfaces/solids and block models.
Table 14-14: Campbell Pit Block Model Summary.
| Y(m) | X(m) | Z(m) |
Min.Coordinates | 8,485,619 | 317,898 | -275 |
Max.Coordinates | 8,486,419 | 318,818 | 340 |
Blocks dimensions | 5 | 5 | 5 |
Sub blocks dimensions | 2.5 | 2.5 | 2.5 |
Rotation | 0 | 0 | 0 |
Table 14-15: GAN Block Model Summary (block corner).
| Y (m) | X (m) | Z (m) |
Min. Coordinates | 8,486,059 | 318,398 | -10 |
Max. Coordinates | 8,487,439 | 319,328 | 350 |
Block dimensions | 10 | 10 | 5 |
Subblocks dimensions | 2.5 | 2.5 | 2.5 |
Rotation | 0 | 0 | 0 |
Table 14-16: NAN Block Model Summary (block corner).
| Y (m) | X (m) | Z (m) |
Min. Coordinates | 8,491,000 | 319,350 | -40 |
Max. Coordinates | 8,493,300 | 320,290 | 400 |
Blocs dimensions | 20 | 20 | 5 |
Subblocks dimensions | 0.625 | 0.625 | 2.5 |
Rotation | 0 | 0 | 0 |
The attributes of the block model were standardized for all deposits. Table 14-17 shows a description of each one.
Table 14-17: Attributes Summary
Attribute Name | Type | Decimals | Description |
rec_class | Character | - | 1=measured 2=indicated 3=inferred 4=potential |
density | Float | 2 | dry density in g/cm3. |
dnpm | Integer | - | 0=out;1=into |
Domain | Integer | - | MAG; MPXT; MGB; PXTM; COV; GAB; GCM; GPS; GR; ANOR; PEG |
nn_v2o5 | Float | 4 | Grade by nn-check |
ok_v2o5 | Float | 4 | Grade by kriging |
ok_sio2 | Float | 4 | Grade by kinging |
ok_tio2 | Float | 4 | Grade by kriging |
ok_fe | Float | 4 | Grade by kinging |
ok_mag_con | Float | 4 | Grade by kinging (concentrate) |
ok_v2o5_con | Float | 4 | Grade by kinging (concentrate) |
ok_sio2_con | Float | 4 | Grade by kinging (concentrate) |
ok_tio2_con | Float | 4 | Grade by kinging (concentrate) |
ok_fe_con | Float | 4 | Grade by kinging (concentrate) |
14.9 Grade Interpolation
The Ordinary Kriging (OK) estimation method was used to estimate the global contents (Head) and, when existing, of the Concentrate for % V2O5, % TiO2, %Fe, % SiO2, and %MAG obtained for all delimited domain by magmatic cycle.
OK is one of the most widely used geostatistical methods in the sector. In this interpolation, the blocks are estimated based on the regularized intervals (composites). Estimated points are weighted to minimize the variance error in that space, considering the spatial location of the selected composites and the modeled variogram. Variography describes the correlation between regularized samples in relation to the distance and the direction of search.
The estimates were separated for each marked domain, respecting the composites of each horizon. Domains were estimated using the Hard Boundary Concept. In few situations (insufficient samples) was applied the Soft Boundary Concept.
The estimate was made using four steps, varying the neighboring search main radius, named P1, P2, P3, and P4, which was defined based on the range of the variogram modeled for each domain or cluster. The parameters used in the estimation are summarized in Table 14-18 to Table 14-20.
Table 14-18: Campbell Pit Kriging Plan.
Domain | Solids | Variable | Radius | Ellipsoid Ranges | Nº Samples | Drill Hole Limit |
Max | Interm | Min | Min | Max | Max Samples per
hole |
General Parameters: |
Interpolation method:kriging;Sector Search method:Ellipsoid; Ellipsoid Directions:Variable orientation |
MAG | C3,C4 | V2O5_XH,
TiO2_XH,
Fe_XH,
SiO2_XH,
DT,V2O5_XC,
TiO2_XC,
Fe_XC,
SiO2_XC | P1 | 33 | 23 | 10 | 5 | 10 | 2 |
P2 | 66 | 46 | 20 | 5 | 10 | 2 |
P3 | 150 | 105 | 45 | 5 | 10 | 2 |
P4 | 300 | 210 | 90 | 1 | 10 | 2 |
MGB | C4,C6,C8,C9 | P1 | 36 | 10 | 10 | 5 | 10 | 2 |
P2 | 72 | 20 | 20 | 5 | 10 | 2 |
P3 | 165 | 45 | 45 | 5 | 10 | 2 |
P4 | 3000 | 1000 | 1000 | 1 | 10 | 2 |
MPXT_HG_DT and MPXT_LG_DT | TZ,C1,C3,C4,C5 | P1 | 36 | 10 | 10 | 5 | 10 | 2 |
P2 | 72 | 20 | 20 | 5 | 10 | 2 |
P3 | 165 | 45 | 45 | 5 | 10 | 2 |
P4 | 3000 | 1000 | 1000 | 1 | 10 | 2 |
PXTM | TZ,C1,C3,C4,C7 | P1 | 36 | 10 | 10 | 5 | 10 | 2 |
P2 | 72 | 20 | 20 | 5 | 10 | 2 |
P3 | 165 | 45 | 45 | 5 | 10 | 2 |
P4 | 3000 | 1000 | 1000 | 1 | 10 | 2 |
Table 14-19: GAN Deposit Kriking Plan.
Domain | Solids | Variable | Radiius | Ellipsoid Ranges | NºSamples | Drill Hole Limit |
Max | Interm | Min | Min | Max | Max samples per
hole |
General Parameters: |
Interpolation method: kriging; Sector search method: Ellipsoid; Ellipsoid Directions: Variable orientation |
MAG | C5,C6(1-2),C8 | V2O5_XH,
TiO2_XH,
Fe_XH,
SiO2_XH,
DT,V2O5_XC,
TiO2_XC,
Fe_XC,
SiO2_XC | P1 | 66 | 46 | 4 | 5 | 10 | 2 |
P2 | 132 | 92 | 8 | 5 | 10 | 2 |
P3 | 300 | 210 | 18 | 5 | 10 | 2 |
P4 | 4000 | 2800 | 240 | 1 | 10 | 2 |
MGB | C4,C4(2),C5(topo), C5(base),C6(topo) ,C7,C8(1-2), C8(topo), C9(1-3) | P1 | 134 | 50 | 18 | 5 | 10 | 2 |
P2 | 267 | 99 | 36 | 5 | 10 | 2 |
P3 | 608 | 225 | 83 | 5 | 10 | 2 |
P4 | 8100 | 3000 | 1100 | 1 | 10 | 2 |
MPXT | C4(topo),C5,C7,C8,
C8(2-5) | P1 | 99 | 33 | 3 | 5 | 10 | 2 |
P2 | 198 | 66 | 7 | 5 | 10 | 2 |
P3 | 450 | 150 | 15 | 5 | 10 | 2 |
P4 | 6000 | 2000 | 200 | 1 | 10 | 2 |
PXTM | C4,C7 | P1 | 99 | 33 | 3 | 5 | 10 | 2 |
P2 | 198 | 66 | 7 | 5 | 10 | 2 |
P3 | 450 | 150 | 15 | 5 | 10 | 2 |
P4 | 6000 | 2000 | 2000 | 1 | 10 | 2 |
Table 14-20: NAN Deposit Kriging Plan.
Domain | Solids | Variable | Radius | Ellipsoid Ranges | Nº Samples | Drillhole Limit |
Max | Interm | Min | Min | Max | Max samples per
hole |
General Parameters: |
Interpolation method: kriging; Sector search method: Ellipsoid; Ellipsoid Directions: Variable orientation |
MAG | C6,C7 | V2O5_XH,
TiO2_XH,
Fe_XH,
SiO2_XH, DT, V2O5_XC,
TiO2_XC,
Fe_XC,
SiO2_XC | P1 | 40 | 30 | 5 | 5 | 10 | 2 |
P2 | 80 | 60 | 10 | 5 | 10 | 2 |
P3 | 170 | 130 | 20 | 5 | 10 | 2 |
P4 | 1000 | 750 | 250 | 1 | 10 | 2 |
MGB | C4,C5,C6,C7 | P1 | 100 | 57 | 12 | 5 | 10 | 2 |
P2 | 200 | 113 | 23 | 5 | 10 | 2 |
P3 | 450 | 255 | 53 | 5 | 10 | 2 |
P4 | 3000 | 1700 | 350 | 1 | 10 | 2 |
MPXT | C4,C5 | P1 | 100 | 57 | 12 | 5 | 10 | 2 |
P2 | 200 | 113 | 23 | 5 | 10 | 2 |
P3 | 450 | 255 | 53 | 5 | 10 | 2 |
P4 | 3000 | 1700 | 350 | 1 | 10 | 2 |
14.10 Estimate Validation
The analysis of the global bias was conducted on %V2O5, %TiO2, %Fe and %SiO2 (head and concentrate) by comparing the estimate grade, block by block with the grade estimated by Nearest Neighboring method, which aims represent the original sample population in deposits Campbell, NAN and GAN and typologies.
It is expected that the mean or median of the two populations will remain close, honoring the hypothesis of law of permanence, and evaluating the decrease in variance as a function of increased support. Figure 14.13, Figure 14.15 and Figure 14.17 shows the results of the % V2O5 and Figure 14.14, Figure 14.16 Figure 14.18 shows the results of the % TIO2 analysis of the Measured and Indicated Resources of Campbell, GAN and NAN respectively.
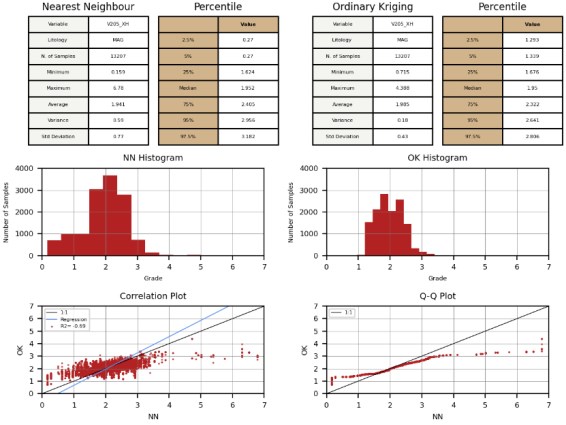
Figure 14.13: Campbell Pit NN Checks Graphs (%V2O5_XH in MAG).
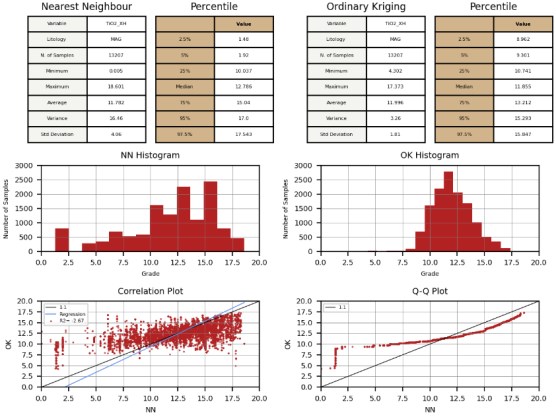
Figure 14.14: Campbell Pit Checks Graphs (%TiO2_XH in MAG).
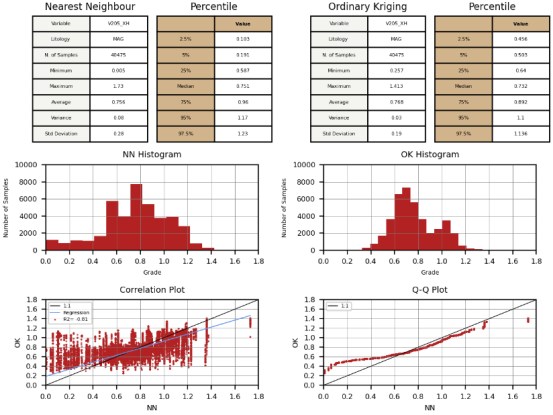
Figure 14.15: GAN deposit Checks Graphs (%V2O5_XH in MAG).
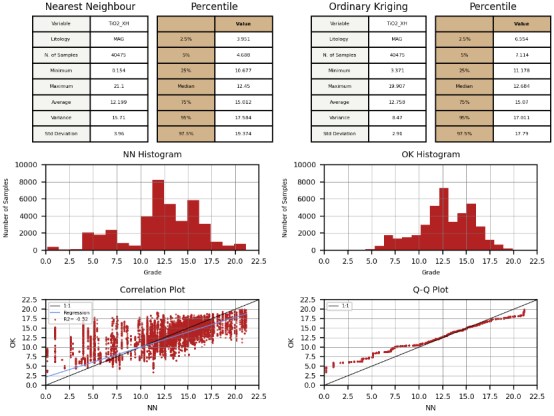
Figure 14.16: GAN deposit Checks Graphs (%TiO2_XH in MAG).
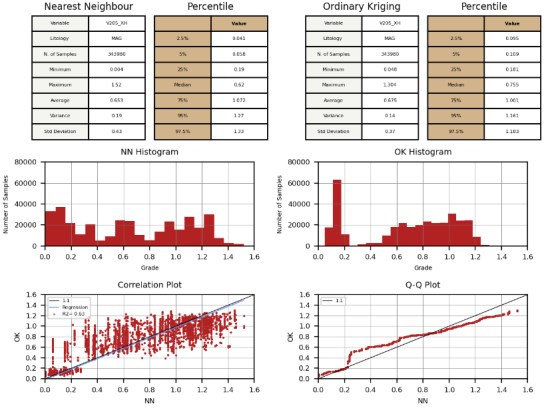
Figure 14.17: NAN deposit Checks Graphs (%V2O5_XH in MAG).
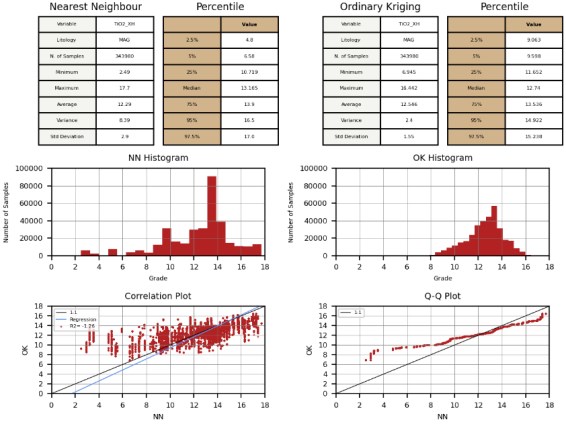
Figure 14.18: NAN deposit Checks Graphs (%TiO2_XH in MAG).
The QP assumes there isn't notable bias on the current estimates, and the smoothing in grades estimates is compatible with the estimate strategies used.
Estimation of local bias was analysed by the swath-plot technique, which similarly to global analysis, verifies the permanence of the mean by deposit zones. The validation results are shown in Figure 14.19 to Figure 14.24 for Campbell Pit, GAN and NAN deposits respectively.
The QP assumes that the validation did not demonstrate an excessive smoothing of the estimate considering the resulting values.
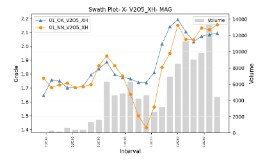
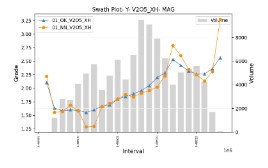
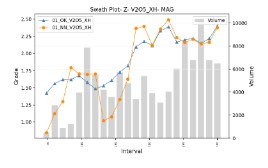
Figure 14.19: Campbell Pit Swath Plots (%V2O5_H in MAG).
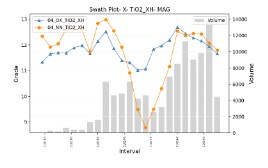

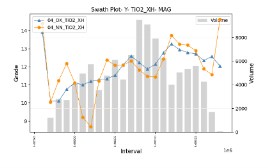
Figure 14.20: Campbell Pit Swath Plots (%TiO2_XH in MAG).
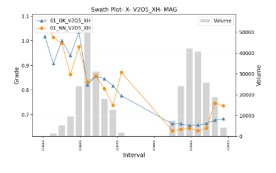


Figure 14.21: GAN deposit Swath Plots (%V2O5_H in MAG).
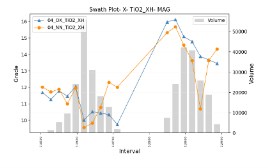
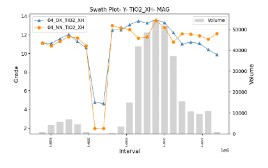
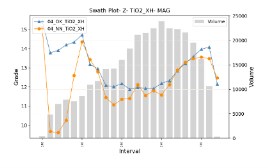
Figure 14.22: GAN deposit Swath Plots (%TiO2_XH in MAG).
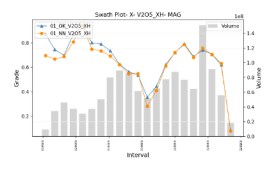
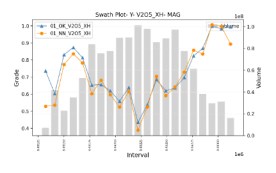
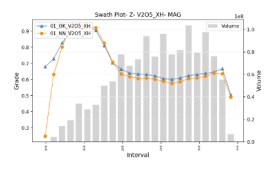
Figure 14.23: NAN deposit Swath Plots (%V2O5_H in MAG).
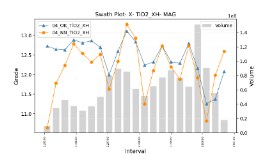
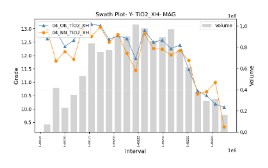
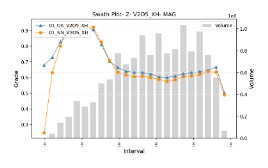
Figure 14.24: NAN deposit Swat Plots (%TiO2_XH in MAG).
14.11 Mineral Resource Statement
QP classified the mineral resources of the Campbell, GAN and NAN deposits based on QP's internal standards. The data collected was evaluated in terms of quality and quantity data.
The definitions of the Resources established by the CIM are as follows:
- A Mineral Resource is a concentration or occurrence of solid material of economic interest in or on the earth's crust in such form, grade or quality and quantity that there are reasonable prospects for eventual economic extraction. The location, quantity, grade or quality, continuity and other geological characteristics of a Mineral Resource are known, estimated or interpreted from specific geological evidence and knowledge, including sampling.
- An Inferred Mineral Resource is that part of a Mineral Resource for which quantity and grade or quality are estimated on the basis of limited geological evidence and sampling. Geological evidence is sufficient to imply but not verify geological and grade or quality continuity. An Inferred Mineral Resource has a lower level of confidence than that applying to an Indicated Mineral Resource and must not be converted to a Mineral Reserve. It is reasonably expected that the majority of Inferred Mineral Resources could be upgraded to Indicated Mineral Resources with continued exploration.
- An Indicated Mineral Resource is that part of a Mineral Resource for which quantity, grade or quality, densities, shape and physical characteristics are estimated with sufficient confidence to allow the application of Modifying Factors in sufficient detail to support mine planning and evaluation of the economic viability of the deposit. Geological evidence is derived from adequately detailed and reliable exploration, sampling and testing and is sufficient to assume geological and grade or quality continuity between points of observation. An Indicated Mineral Resource has a lower level of confidence than that applying to a Measured Mineral Resource and may only be converted to a Probable Mineral Reserve.
- A Measured Mineral Resource is that part of a Mineral Resource for which quantity, grade or quality, densities, shape, and physical characteristics are estimated with confidence sufficient to allow the application of Modifying Factors to support detailed mine planning and final evaluation of the economic viability of the deposit. Geological evidence is derived from detailed and reliable exploration, sampling and testing and is sufficient to confirm geological and grade or quality continuity between points of observation. A Measured Mineral Resource has a higher level of confidence than that applying to either an Indicated Mineral Resource or an Inferred Mineral Resource. It may be converted to a Proven Mineral Reserve or to a Probable Mineral Reserve.
The vanadiferous mineralization was classified as a Mineral Resource based on a 0.3% V2O5 cutoff. A cut-off grade of 1% TiO2 head, derivered from an economic function is associated to TiO2 Mineral Resource. This was based on the principle that TiO2 will be a co-product, derived from the V2O5 treatment. The change of concept about TiO2 was supported by the metallurgy tests described in Section 13.
The Resource was quantified inside resource pit based on the current cost and assumed a forecasted commodity price. This was considered to define the Reasonable Prospect for Eventual Economic Extraction (RPEEE). Table 14-21, Table 14-22 and Table 14-23 presents the Estimated Mineral Resource for each deposit.
The following are the principal assumptions which were used in the generation of the Mineral Resource Estimate:
With respect to density, assuming the general density average of all data according to the 2021 geologic model, based on the QP's review of the history of density determination and the realization that the values of each rock type were similar (as discussed in Section 14.6).
With respect to Estimate Validation, it was assumed that there was not a notable bias on the current estimate. This assumption was based on an analysis of the estimation of local bias using the swath-plot technique, as shown in Figures 14.16 to 14.21. Furthermore, the QP assumed that the validation did not demonstrate an excessive smoothing based on the results of the validation.
Table 14-21: Campbell Pit Mineral Resource Statement. (Ordinary Kriging Method)
Classification | Mass (Mt) | Grade | Metal Content |
Head | Magnetic Concentrate |
%V2O5 | %TiO2 | %MAG | %V2O5 | %TiO2 | V205 (kt) | TiO2 (kt) |
Measured (M) | 16.36 | 1.23 | 7.98 | 31.84 | 3.15 | 5.04 | 201.2 | 1,305.6 |
Indicated (I) | 3.07 | 0.98 | 7.97 | 28.2 | 2.69 | 4.45 | 30.1 | 244.5 |
Total Campbell Pit M+I | 19.43 | 1.19 | 7.98 | 31.27 | 3.08 | 4.95 | 231.3 | 1,550.1 |
Campbell Pit Inferred | 5.10 | 0.92 | 8.20 | 26.68 | 2.63 | 3.98 | 47.0 | 418.6 |
Notes: 1. Mineral Resources that are not Mineral Reserves do not have demonstrated economic viability. 2. Mineral resources were estimated by Marlon Sarges Ferreira, BSc. (Geo), MAIG, a GE21 Associate, meet the requirements of a "Qualified Person" as established by the Canadian Institute of Mining, Metallurgy and Petroleum (CIM) Definition Standards for Mineral Resources and Mineral Reserves (May 2014) ("the CIM Standards"). 3. The Mineral Resource estimates were prepared in accordance with the CIM Standards, and the CIM Guidelines, using geostatistical, plus economic and mining parameters appropriate to the deposit. (Ordinary kriging inside 5m x 5m x 5m block size). 4. Presented Mineral Resources inclusive of mineral reserves. All figures have been rounded to the relative accuracy of the estimates. Summed amounts may not add due to rounding. 5. Mineral Resource is reported with effective date July 12th, 2021. 6. A cut-off grade of 0.3% V2O5 head is applied in V2O5 Mineral Resource. 7. A cut-off grade of 1% TiO2 head, deriverd from an economic fucnction is associated to TiO2 Mineral Resource. 8. Mineral Resources were limited by an economic pit built in Geovia Whittle 4.3 software and following the geometric and economic parameters: Pit slope angles ranging from 37.5° to 64°. V2O5 long term price of $15.60/lb, with an additional premium of $5.50/lb for high purity product. TiO2 pigment selling price of $7,382/tonne. Mining costs of $1.60/tonne for mineralization and waste. Vanadium processing costs of $37.80/tonne ore feed. V2O5 concentrate recovery of 80.5%. Ilmenite concentrate costs of $55.00/tonne processed. TiO2 pigment costs of $1,374/tonne of Ilmenite concentrate. TiO2 overall recovery of 37.9%. General and Administrative (G&A) costs of $0.16/lb V2O5. |
Table 14-22: GAN Mineral Resource Statement. (Ordinary Kriging Method)
Classification | Mass (Mt) | Grade | Metal Content |
Head | Magnetic Concentrate |
%V2O5 | %TiO2 | %MAG | %V2O5 | %TiO2 | V205 (kt) | TiO2 (kt) |
Measured (M) | 12.11 | 0.49 | 7.55 | 17.70 | 1.88 | 1.93 | 59.8 | 914.5 |
Indicated (I) | 9.25 | 0.58 | 8.28 | 21.13 | 2.08 | 2.27 | 54.1 | 766.5 |
Total GAN M+I | 21.37 | 0.53 | 7.87 | 19.18 | 1.97 | 2.07 | 113.8 | 1,681.0 |
GAN Inferred | 4.52 | 0.64 | 8.40 | 22.37 | 2.15 | 2.49 | 29.0 | 380.1 |
Notes: 1. Mineral Resources that are not Mineral Reserves do not have demonstrated economic viability. 2. Mineral resources were estimated by Marlon Sarges Ferreira, BSc. (Geo), MAIG, a GE21 Associate, meet the requirements of a "Qualified Person" as established by the Canadian Institute of Mining, Metallurgy and Petroleum (CIM) Definition Standards for Mineral Resources and Mineral Reserves (May 2014) ("the CIM Standards"). 3. The Mineral Resource estimates were prepared in accordance with the CIM Standards, and the CIM Guidelines, using geostatistical, plus economic and mining parameters appropriate to the deposit. (Ordinary kriging inside 10m by 10m by 5m block size). 4. Presented Mineral Resources inclusive of mineral reserves. All figures have been rounded to the relative accuracy of the estimates. Summed amounts may not add due to rounding. 5. Mineral Resource is reported with effective date July 12th, 2021. 6. A cut-off grade of 0.3% V2O5 head is applied in V2O5 Mineral Resource. 7. A cut-off grade of 1% TiO2 head, deriverd from an economic fucnction is associated to TiO2 Mineral Resource. 8. Mineral Resources were limited by an economic pit built in Geovia Whittle 4.3 software and following the geometric and economic parameters: Pit slope angles ranging from 40.0° to 64°. V2O5 long term price of $15.60/lb, with an additional premium of $5.50/lb for high purity product. TiO2 pigment selling price of $7,382/tonne. Mining costs of $1.60/tonne for mineralization and waste. Vanadium processing costs of $37.80/tonne ore feed. V2O5 concentrate recovery of 79.2%. Ilmenite concentrate costs of $55.00/tonne processed. TiO2 pigment costs of $1,374/tonne of Ilmenite concentrate. TiO2 overall recovery of 40.25%. General and Administrative (G&A) costs of $0.16/lb V2O5. |
Table 14-23: NAN Mineral Resource Statement. (Ordinary Kriging Method)
Classification | Mass (Mt) | Grade | Metal Content |
Head | Magnetic Concentrate |
%V2O5 | %TiO2 | %MAG | %V2O5 | %TiO2 | V205 (kt) | TiO2 (kt) |
Measured (M) | 17.48 | 0.7 | 8.73 | 23.43 | 2.38 | 2.97 | 122.4 | 1,526.0 |
Indicated (I) | 5.41 | 0.74 | 8.76 | 23.51 | 2.48 | 2.78 | 40.1 | 474.1 |
Total NAN M+I | 22.89 | 0.71 | 8.74 | 23.45 | 2.40 | 2.92 | 162.4 | 2,000.1 |
NAN Inferred | 5.90 | 0.67 | 7.75 | 21.01 | 2.47 | 2.89 | 39.5 | 456.9 |
Notes: 1. Mineral Resources that are not Mineral Reserves do not have demonstrated economic viability. 2. Mineral resources were estimated by Marlon Sarges Ferreira, BSc. (Geo), MAIG, a GE21 Associate, meet the requirements of a "Qualified Person" as established by the Canadian Institute of Mining, Metallurgy and Petroleum (CIM) Definition Standards for Mineral Resources and Mineral Reserves (May 2014) ("the CIM Standards"). 3. The Mineral Resource estimates were prepared in accordance with the CIM Standards, and the CIM Guidelines, using geostatistical, plus economic and mining parameters appropriate to the deposit. (Ordinary kriging inside 20m by 20m by 5m block size). 4. Presented Mineral Resources inclusive of mineral reserves. All figures have been rounded to the relative accuracy of the estimates. Summed amounts may not add due to rounding. 5. Mineral Resource is reported with effective date July 12th, 2021. 6. A cut-off grade of 0.3% V2O5 head is applied in V2O5 Mineral Resource. 7. A cut-off grade of 1% TiO2 head, deriverd from an economic fucnction is associated to TiO2 Mineral Resource. 8. Mineral Resources were limited by an economic pit built in Geovia Whittle 4.3 software and following the geometric and economic parameters: Pit slope angles ranging from 40.0° to 64°. V2O5 long term price of $15.60/lb, with an additional premium of $5.50/lb for high purity product. TiO2 pigment selling price of $7,382/tonne. Mining costs of $1.60/tonne for mineralization and waste. Vanadium processing costs of $37.80/tonne ore feed. V2O5 concentrate recovery of 70.0%. Ilmenite concentrate costs of $55.00/tonne processed. TiO2 pigment costs of $1,374/tonne of Ilmenite concentrate. TiO2 overall recovery of 38.25%. General and Administrative (G&A) costs of $0.16/lb V2O5. |
No Mineral Resources were updated from Novo Amparo and São José deposits, Table 14-24 shows the historical resources declared in RPM 2012 report, which was confirmed by GE21 in 2017.
Table 14-24: 2013 Satellite Deposits Mineral Resource (2012).
Deposit | Rec Class | Kt | V2O5 | Contained V2O5 (tonnes) |
Novo Amparo** | inferred | 1.5 | 0.72 | 11.20 |
São José** | inferred | 3.9 | 0.89 | 34.70 |
Total | Inferred | 18 | 0.82 | 147.30 |
**Resource within a pit using US$ 2.720/t all in operating cost and reported at a 0.45% V2O5 cut-off, reviewed at the Effective Date of May 2nd 2017 and confirmed by Porfirio Cabaleiro Rodriguez (GE21 2017).
14.11.1 TiO2 Resource in Non-Magnetic Tailings
Aside from mineral resource estimated within the remaining Campbell Pit, three tailings ponds with material from pre-processed non-magnetic tailings from the vanadium magnetic separation process containing enriched titanium material is available for processing of Ilmenite and further concentration into titanium pigment.
The methodology applied to Resource classification was based on production reconciliation data and topographic surveying of the ponds.
14.11.1.1 Reconciliation data and topographic surveying of ponds
Largo reconciliation data from 2016 to 2021, together with the topographic survey of the three ponds containing non-magnetic tailings that were used as basis for the classification of pond material.
As standard procedure, Largo samples and assays the tailings from magnetic separation every eight hours. From January 2016 to October 2021, a total of 4537 chemical assays of the tailings sent to the ponds were performed. The average grade of TiO2 contained in this material was a 11.35%, with standard deviation of 2.49%. Figure 14.25 presents the histogram for all samples available from material destinated to the ponds.
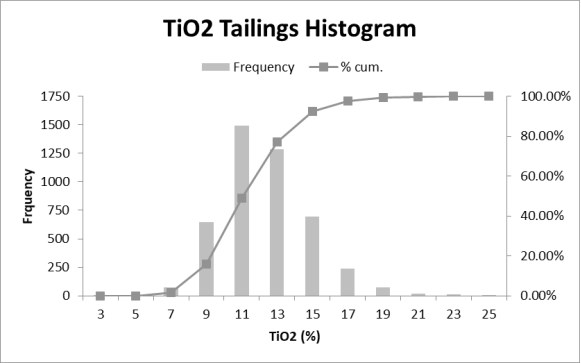
Figure 14.25: TiO2 Tailings Histogram.
The grade variation for TiO2 in ponds, on a monthly basis, is presented in Figure 14.26, with no clear tendencies observed over time.
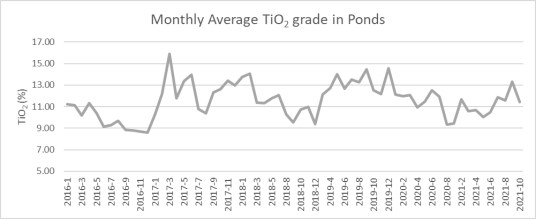
Figure 14.26: Monthly Average TiO2 Grade in Ponds.
For the measurement of tonnage deposited in ponds, Largo reconciliation data from 2014 to 2021, together with the topographic survey of the three ponds containing non-magnetic tailings were used as basis for the estimate.
The historical data and forecast of non-magnetic tailings disposal into ponds are presented as a graph in Figure 14.27.
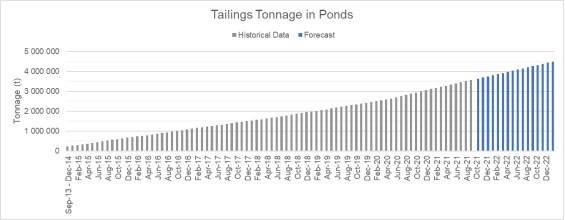
Figure 14.27: Monthly Average TiO2 Grade in Ponds.
The production data from September 2013 to December 2014 reports a total of 230 kt of tailings material allocated in the ponds. From 2015 to 2018, an average 36 kt of tailings per month was created, while from 2019 to September 2021, an average 49 kt of tailings per month was produced.
The topographic survey's effective date for measurement of the tonnage of non-magnetic tailings allocated in the ponds as at October 10th, 2021, totals 3,584 kt of disposed material. The September 2021 data reconciliation reports 3,576 kt of accumulated tailings produced, showing an expected adherence between both methods of measurement. Figure 14.28 presents the three non-magnetic tailings ponds, BNM-02, BNM-03 and BNM-04.
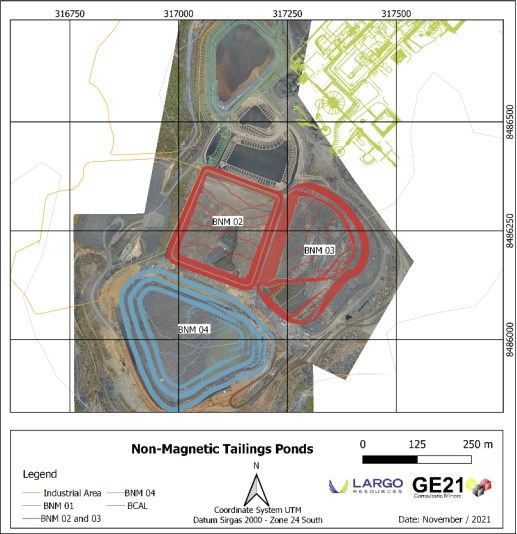
Figure 14.28: Non-magnetic Tailings Ponds.
The Non-Magnetic Ponds Resource Estimate used the tonnage of material allocated in the ponds as surveyed as at October 10th, 2021, together with the average TiO2 grade from all chemical assays reported up to the date. Statemented Mineral Resource herein is just the material to be mined from all pits.
14.11.2 Non-Magnetic Ponds Resource Estimate
Table 14-25 shows the accumulated volumes of non-magnetics in the period from September 2013 to October 2021.
Table 14-25: TiO2 Resource in Non-Magnetic Tailings.
(Effective Date - October,20, 2021)
Pond | Resources
Classification | Volume | Density | Resource in
Stock | Grade TiO2 | Metal content |
(km3) | (t/m3) | (kt) | (%) | (kt) |
BNM 04 | Probable | 829.75 | 1.80 | 1,493.55 | 11.35 | 169.52 |
BNM 02 | Probable | 640.30 | 1.80 | 1,152.53 | 11.35 | 130.81 |
BNM 03 | Probable | 521.14 | 1.80 | 938.05 | 11.35 | 106.47 |
Total in Ponds Resource | Probable | 1,991.18 | 1.80 | 3,584.12 | 11.35 | 406.80 |
i. Stock of "Non-Magnetic concentrate" available in the tailings ponds. ii. Mineral Resource in tailings were estimated based on topographic surveys (primitive data and current data) and validated with monthly processing and reconciliation data. iii. Tailings material data was sampled once every 8 hours, with an average TiO2 content of 11.35%. iv. Recovery is 100% and no dilution was applied to these Resource. |
No current significant factors or risks were identified by QP that could materially affect the potential development of the mineral resources.
14.12 Qualified Person's Opinion
In generating the Mineral Resource Estimate, the QP used various assumptions which are discussed below and throughout this Chapter.
- Measured, Indicated and Inferred Mineral Resources were classified using the 2014 CIM Definition standards, considering the density and quality of the data to delineate the final contours of resource pits in Gulçari A (Campbell Pit), NAN and GAN deposits.
- All Mineral Resource tonnages are expressed as "dry" tonnes and are based on density values as presented in the block model.
- With respect to density, was assumed he general density average of all data according to the 2021 geologic model, based on the QP's review of the history of density determination and the realization that the values of each rock type were similar
- With respect to Estimate Validation, it was assumed that there was not a notable bias on the current estimate. This assumption was based on an analysis of the estimation of local bias using the swath-plot technique, as shown in Figures 14.16 to 14.21. Furthermore, the QP assumed that the validation did not demonstrate an excessive smoothing based on the results of the validation.
- On the Mineral Resource Statement, assumptions on the forecasted commodity prices are set out in Chapters 15 and 19 of this Report. Assumptions on the pit slope angles are also discussed in Chapter 15.
15 MINERAL RESERVE ESTIMATES
15.1 Summary
Mineral Reserves are an assessment of the economic portions of Measured and Indicated Resources described in Section 14, that can be feasibly mined and processed. GE21 estimated the Mineral Reserves for Campbell Pit, GAN and NAN with an effective date of October 10th, 2021, based on CIM guidelines.
To convert Measured Resources into Proven Reserves and Indicated Resources into Probable Reserves, consideration was given to products metallurgical recoveries, mining dilution and ore loss factors, costs of mining, processing, SG&A and logistics, as well as the forecasts and estimates of prices for vanadium and titanium products.
The ultimate pit definition was guided by the optimization works completed by GE21 using GEOVIA Whittle 4.7 software. The ultimate pit design and mining plan developed in this report is based on the Proven and Probable Reserves presented in this Section. The mine schedule for all deposits is presented in Section 16.
The Mineral Reserves summary for Campbell Pit, GAN and NAN are presented on Table 15-1.
Aside from Mineral Reserves from the ultimate pit, three tailings' ponds bearing titanium enriched material from pre-processed non-magnetic tailings of vanadium magnetic separation are estimated separately as Probable Reserves, as presented on Table 15-2. Details on TiO2 Mineral Reserves from ponds are provided on Subsection 15.5 and Section 16.
Table 15-1: Maracás Menchen Project - Mineral Reserves Estimate
(Effective Date - October,10, 2021) |
Category | Tonnage
(Mt) | %Magnetics | Head | Magnetic Concentrate | Metal Contained |
%V2O5 | %TiO2 | Mag
(Mt) | %V2O5 | %TiO2 | V2O5 in
Magnetic
Concentrate
(t) | TiO2 in Non-
Magnetic
Concentrate
(t) |
Campbell Piti |
Proven | 15.64 | 31.91 | 1.22 | 8.02 | 4.99 | 3.14 | 5.04 | 156,686 | 1,002,650 |
Probable | 2.21 | 29.77 | 1.02 | 8.22 | 0.66 | 2.69 | 4.54 | 17,677 | 151,610 |
Total Campbell Pit Reserve | 17.85 | 31.65 | 1.20 | 8.04 | 5.65 | 3.09 | 4.98 | 174,363 | 1,154,260 |
GANii |
Proven | 12.1 | 17.75 | 0.49 | 7.57 | 2.15 | 1.88 | 1.94 | 40,375 | 874,242 |
Probable | 8.06 | 21.15 | 0.57 | 8.33 | 1.71 | 2.04 | 2.29 | 34,790 | 632,616 |
Total GAN Reserve | 20.16 | 19.11 | 0.52 | 7.87 | 3.85 | 1.95 | 2.08 | 75,165 | 1,506,858 |
NANiii |
Proven | 17.43 | 23.22 | 0.7 | 8.71 | 4.05 | 2.36 | 2.95 | 95,538 | 1,399,099 |
Probable | 4.92 | 23.38 | 0.72 | 8.76 | 1.15 | 2.44 | 2.78 | 28,059 | 398,901 |
Total NAN Reserve | 22.35 | 23.26 | 0.7 | 8.72 | 5.2 | 2.38 | 2.91 | 123,598 | 1,798,000 |
Total Maracás Menchen Mine Proven and Probable Reserves |
Proven | 45.17 | 24.76 | 0.82 | 8.17 | 11.19 | 2.62 | 3.4 | 292,599 | 3,275,992 |
Probable | 15.19 | 23.12 | 0.68 | 8.45 | 3.51 | 2.29 | 2.78 | 80,526 | 1,183,126 |
Total | 60.36 | 24.35 | 0.79 | 8.24 | 14.7 | 2.54 | 3.25 | 373,125 | 4,459,118 |
Notes:
1. Mineral Reserves estimates were prepared in accordance with the CIM Standards.
2. Mineral Reserves are the economic portion of the Measured and Indicated Mineral Resources.
3. Mineral Reserves were estimated by Guilherme Gomides Ferreira, BSc. (MEng), MAIG, a GE21 associate, who meets the requirements of a "Qualified Person" as established by the Canadian Institute of Mining, Metallurgy and Petroleum (CIM) Definition Standards for Mineral Resources and Mineral Reserves (May 2014) ("the CIM Standards").
4. Mineral Reserves is reported effective date October 10th, 2021.
5. The reference point at which the Mineral Reserves are defined is the point where the ore is delivered from the open pit to the crushing plant.
6. Vanadium product comes from magnetic concentrate, while TiO2 product from non-magnetic portion.
7. Exchange rate $1.00 = R$5.10.
8. Mineral Reserves were estimated using the Geovia Whittle 4.3 software and following the geometric and economic parameters:
i. Recovery 100% and dilution 3%. Pit slope angles ranging from 37.5° to 64°. V2O5 long term price of $7.80/lb, with an additional premium of $2.50/lb for high purity product. TiO2 pigment selling price of $3,691/tonne. Mining costs of $1.60/tonne for mineralization and waste. Vanadium processing costs of $37.80/tonne ore feed. V2O5 concentrate recovery of 80.5%. Ilmenite concentrate costs of $55.00/tonne processed. TiO2 pigment costs of $1.374/tonne of Ilmenite concentrate. TiO2 overall recovery of 37.9%. General and Administrative (G&A) costs of $0.16/lb V2O5.
ii. Recovery 95% and dilution 5%. Pit slope angles ranging from 40° to 64°. V2O5 long term price of $7.80/lb, with an additional premium of $2.50/lb for high purity product. TiO2 pigment selling price of $3,691/tonne. Mining costs of $1.60/tonne for mineralization and waste. Vanadium processing costs of $37.80/tonne ore feed. V2O5 concentrate recovery of 79.2%. Ilmenite concentrate costs of $55.00/tonne processed. TiO2 pigment costs of $1,374/tonne of Ilmenite concentrate. TiO2 overall recovery of 40.25%. General and Administrative (G&A) costs of $0.16/lb V2O5.
iii. Recovery 95% and dilution 5%. Pit slope angles ranging from 40° to 64°. V2O5 long term price of $7.80/lb, with an additional premium of $2.50/lb for high purity product. TiO2 pigment selling price of $3,691/tonne. Mining costs of $1.60/tonne for mineralization and waste. Vanadium processing costs of $37.80/tonne ore feed. V2O5 concentrate recovery of 70.0%. Ilmenite concentrate costs of $55.00/tonne processed. TiO2 pigment costs of $1,374/tonne of Ilmenite concentrate. TiO2 overall recovery of 38.25%. General and Administrative (G&A) costs of $0.16/lb V2O5
Table 15-2: Maracás Menchen Project - Non-Magnetic Mineral Reserves in Ponds.
(Effective Date - October,10, 2021) |
Pond | Reserves
Classification | Volume | Density | Reserve in Stock | Grade TiO2 | Metal content |
(km3) | (t/m3) | (kt) | (%) | (kt) |
BNM 04 | Probable | 829.75 | 1.80 | 1,493.55 | 11.35 | 169.52 |
BNM 02 | Probable | 640.30 | 1.80 | 1,152.53 | 11.35 | 130.81 |
BNM 03 | Probable | 521.14 | 1.80 | 938.05 | 11.35 | 106.47 |
Total | Probable | 1,991.18 | 1.80 | 3,584.12 | 11.35 | 406.80 |
Notes:
v. Stock of "Non-Magnetic concentrate" available in the tailings ponds.
vi. Mineral Reserve in tailings were estimated based on topographic surveys (primitive data and current data) and validated with monthly processing and reconciliation data.
vii. Tailings material data was sampled once every 8 hours, with an average TiO2 content of 11.35%.
viii. Recovery is 100% and no dilution was applied to these Reserves.
15.2 Disclosure
Mineral Reserves reported in Section 15 were estimated under the supervision of Mr. Guilherme Gomides Ferreira who is a Qualified Person as defined in NI43-101, an associate of GE21 and member of the Australian Institute of Geoscientists, also independent of Largo Inc.
15.3 Pit Optimization
The development of the optimal pits and the ultimate pit selection was guided by the optimization works completed by GE21 using GEOVIA Whittle 4.7 software, giving proper consideration to economic, metallurgical and geotechnical parameters in order to define the benefit function, as well as legal and proprietary restrictions, and modifying factor such as mining dilution and ore loss factors.
Economic parameters such as costs of mining, processing, SG&A and logistics, forecasts and estimates of prices for vanadium and titanium products, were provided by Largo. Geotechnical parameters were also provided by Largo, separately for Campbell Pit, GAN and NAN. Further detailing on geotechnical studies are provided in Section 16.
Geometry for optimal pits was executed through the generation of an optimal sequence of pushbacks, which correspond to increments in the geometry of the pit resulting from the repeated use of the three-dimensional Lerchs-Grossman algorithm for different values of blocks that are obtained by varying the price of the product through the use of revenue factors.
This sequence of pit expansions, or pushbacks, is the basis of open pit mine planning when using Whittle software, which projects the evolution of the geometry of the pit over time. The evolution of the mining process over time can be simulated with two criteria: the maximizing route or the stationary route. The first attempts to maximize the operation's financial returns based on a sequence of pushbacks that optimize the cash flow; the latter aims to maintain the processing plant feed material parameters constant.
The sequence of optimal pits was obtained by varying the revenue factor from 10% to 200% with respect to the product's selling price. To determine the evolution of the pits over time, an annual production scale of 1.7Mt/year of ROM on first ten years for Campbell, for next years in GAN and NAN a production rate of 5.0 Mt/year until the end of the deposits was adopted. The modifying factors for Campbell Pit are 3% dilution and a 100% mining recovery, estimated from historical operation data. For GAN and NAN, as there is no current production activities, more conservative modifying factor were assumed, including a dilution factor of 5% and 95% of mining recovery.
The mining plan for Maracás Menchen Project foresees 4 phases of production:
- Phase 1 - (2022-2023): Construction of both an Ilmenite Concentration Plant 150 kt/year and Titanium Pigment Processing Plant 30 kt/year.
- Phase 2 - (2024-2025): Titanium Pigment Processing Plant (60 kt/year) + Vanadium Trioxide Plant expansions (7 kt/year).
- Phase 3 - (2026-2028): Titanium Pigment Processing (120kt/year) + Ilmenite Concentration Plant (425 kt/year) expansions + Site preparation for GAN and NAN (roads / access and pre-stripping).
- Phase 4 - (2029-2032): Vanadium Expansion Second Kiln and mining of GAN and NAN deposits.
The pits were optimized and designed to support the feasibility of the plan, assessing the results from optimization of Measured and Indicated Mineral Resources for each phase. The ultimate pits are reported considering full production on Phase 4, with each phase being detailed during mine scheduling in Section 16.
Subsection 15.3.1 to 15.3.3 present the optimization parameters applied and optimal pit results from GEOVIA Whittle software for Campbell, GAN and NAN, respectively.
15.3.1 Campbell Pit
The pit optimization parameters for Campbell Pit are presented in Table 15-3. The optimization results pit-by-pit graph is presented in Figure 15.1. Table 15-4 presents the selected pit highlighted.
Table 15-3: Pit Optimization Parameters for Campbell Pit.
Inputs | Unit | Value |
Exchange rate | US$/R$ | 5.1 |
V2O5 Selling Price | US$/lb V2O5 | 8.43 |
TiO2 pigment selling price | US$/t | 3,691.0 |
Mining recovery | % | 100 |
Dilution | % | 3 |
Pit slope angles ranging | Degrees | 37.5-64 |
V2O5 concentrate recovery | % | 80.5 |
V2O5 grade cut-off | % | 0.3 |
TiO2 overall recovery | % | 37.9 |
TiO2 grade cut-off | % | N/A |
Mining Cost | US$/t ROM | 1.60 |
Vanadium processing costs | US$/t ore feed | 37.8 |
Ilmenite concentrate costs | US$/t processed | 55.0 |
TiO2 pigment costs | US$/t Ilmenite concentrate | 1,374.0 |
SG&A costs | US$/lb V2O5 | 0.16 |
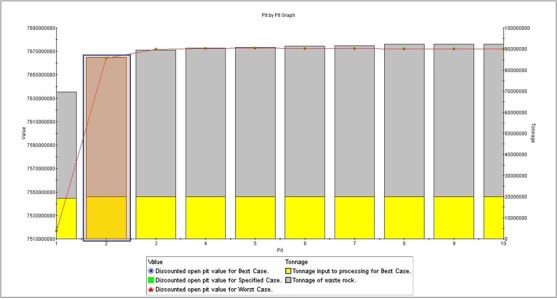
Figure 15.1: Campbell - Pit Optimization Results Graph.
Table 15-4: Nested Pits Results for Campbell.
Pit | Revenue
Factor | Ore
(Mt) | Waste
(Mt) | Strip
Ratio | Conc V2O5
(%) | Conc TiO2
(%) | %
Magnetic |
1 | 0.2 | 18.25 | 51.46 | 2.82 | 3.05 | 8.07 | 31.73 |
2 | 0.4 | 19.95 | 66.13 | 3.32 | 2.99 | 7.75 | 30.39 |
3 | 0.6 | 19.99 | 69.53 | 3.48 | 2.99 | 7.75 | 30.37 |
4 | 0.8 | 20 | 70.44 | 3.52 | 2.99 | 7.75 | 30.36 |
5 | 1 | 20 | 70.91 | 3.55 | 2.99 | 7.75 | 30.36 |
6 | 1.2 | 20 | 71.39 | 3.57 | 2.99 | 7.75 | 30.36 |
7 | 1.4 | 20 | 71.71 | 3.58 | 2.99 | 7.75 | 30.36 |
8 | 1.6 | 20.01 | 72.31 | 3.61 | 2.99 | 7.75 | 30.36 |
9 | 1.8 | 20.01 | 72.37 | 3.62 | 2.99 | 7.75 | 30.36 |
10 | 2 | 20.01 | 72.45 | 3.62 | 2.99 | 7.75 | 30.36 |
15.3.2 GAN Deposit
The pit optimization parameters for GAN are presented in Table 15-5. The optimization results pit-by-pit graph is presented in Figure 15.2. Table 15-6 presents the selected pit highlighted.
Table 15-5: Pit Optimization Parameters for GAN.
Inputs | Unit | Value |
Exchange rate | US$/R$ | 5.1 |
V2O5 Selling Price | US$/lb V2O5 | 8.43 |
TiO2 pigment selling price | US$/t | 3,691.0 |
Mining recovery | % | 95 |
Dilution | % | 5 |
Pit slope angles ranging | Degrees | 40-64 |
V2O5 concentrate recovery | % | 79.2 |
V2O5 grade cut-off | % | 0.3 |
TiO2 overall recovery | % | 40.25 |
TiO2 grade cut-off | % | N/A |
Mining Cost | US$/t ROM | 1.60 |
Vanadium processing costs | US$/t ore feed | 37.8 |
Ilmenite concentrate costs | US$/t processed | 55.0 |
TiO2 pigment costs | US$/t Ilmenite concentrate | 1,374.0 |
SG&A costs | US$/lb V2O5 | 0.16 |
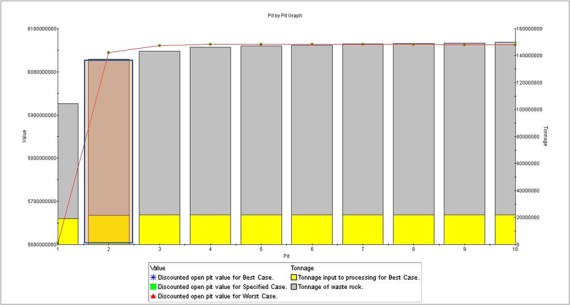
Figure 15.2: GAN - Pit Optimization Results Graph.
Table 15-6: Nested Pits Results for GAN.
Pit | Revenue Factor | Ore (Mt) | Waste (Mt) | Strip Ratio | Conc V2O5 (%) | Conc TiO2 (%) | % Magnetic |
1 | 0.2 | 18.17 | 86.39 | 4.76 | 1.76 | 8.02 | 19.66 |
2 | 0.4 | 21.68 | 115.87 | 5.35 | 1.86 | 7.49 | 18.23 |
3 | 0.6 | 21.79 | 121.55 | 5.58 | 1.86 | 7.48 | 18.2 |
4 | 0.8 | 21.83 | 124.42 | 5.7 | 1.86 | 7.48 | 18.19 |
5 | 1 | 21.83 | 125.42 | 5.74 | 1.86 | 7.48 | 18.19 |
6 | 1.2 | 21.84 | 125.98 | 5.77 | 1.86 | 7.48 | 18.19 |
7 | 1.4 | 21.84 | 126.86 | 5.81 | 1.86 | 7.48 | 18.19 |
8 | 1.6 | 21.84 | 127.21 | 5.82 | 1.86 | 7.48 | 18.19 |
9 | 1.8 | 21.85 | 127.53 | 5.84 | 1.86 | 7.48 | 18.19 |
10 | 2 | 21.85 | 128.21 | 5.87 | 1.86 | 7.48 | 18.19 |
15.3.3 NAN Deposit
The pit optimization parameters for NAN are presented in Table 15-7. The optimization results pit-by-pit graph is presented in Figure 15.3. Table 15-8 presents the selected pit highlighted.
Table 15-7: Pit Optimization Parameters for NAN.
Inputs | Unit | Value |
Exchange rate | US$/R$ | 5.1 |
V2O5 Selling Price | US$/lb V2O5 | 8.43 |
TiO2 pigment selling price | US$/t | 3,691.0 |
Mining recovery | % | 95 |
Dilution | % | 5 |
Pit slope angles ranging | Degrees | 40-64 |
V2O5 concentrate recovery | % | 70.0 |
V2O5 grade cut-off | % | 0.3 |
TiO2 overall recovery | % | 38.25 |
TiO2 grade cut-off | % | N/A |
Mining Cost | US$/t ROM | 1.60 |
Vanadium processing costs | US$/t ore feed | 37.8 |
Ilmenite concentrate costs | US$/t processed | 55.0 |
TiO2 pigment costs | US$/t Ilmenite concentrate | 1,374.0 |
SG&A costs | US$/lb V2O5 | 0.16 |
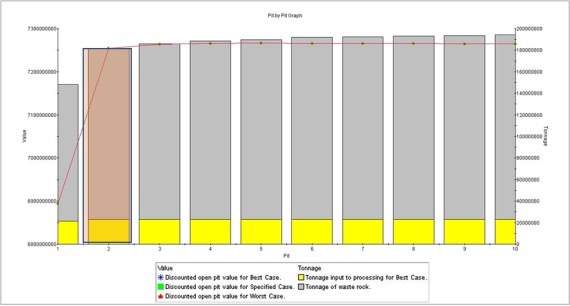
Figure 15.3: NAN - Pit Optimization Results Graph.
Table 15-8: Nested Pits Results for NAN
Pit | Revenue
Factor | Ore
(Mt) | Waste
(Mt) | Strip
Ratio | Conc V2O5
(%) | Conc TiO2
(%) | %
Magnetic |
1 | 0.2 | 19.23 | 128.84 | 6.7 | 2.24 | 8.87 | 24.18 |
2 | 0.4 | 22.88 | 158.39 | 6.92 | 2.27 | 8.28 | 22.08 |
3 | 0.6 | 22.95 | 163 | 7.1 | 2.27 | 8.28 | 22.07 |
4 | 0.8 | 22.96 | 165.54 | 7.21 | 2.27 | 8.28 | 22.07 |
5 | 1 | 22.97 | 166.86 | 7.26 | 2.27 | 8.28 | 22.08 |
6 | 1.2 | 22.98 | 168.95 | 7.35 | 2.27 | 8.28 | 22.08 |
7 | 1.4 | 22.98 | 169.49 | 7.38 | 2.27 | 8.28 | 22.08 |
8 | 1.6 | 22.98 | 170.15 | 7.4 | 2.27 | 8.28 | 22.08 |
9 | 1.8 | 22.98 | 170.71 | 7.43 | 2.27 | 8.28 | 22.08 |
10 | 2 | 22.98 | 171.29 | 7.45 | 2.27 | 8.28 | 22.08 |
15.4 Ultimate Pit Design
The Ultimate Pit Design, consists of projecting, based on an optimal pit, an operational pit that allows for the safe and efficient development of mining operations.
The methodology consists of establishing an outline of the toes and crests of the benches, safety berms, work sites and mining site access ramps while adhering to the geometric and geotechnical parameters that were defined.
15.4.1 Campbell-GAN Pit
Table 15-9 present the geometric parameters adopted to develop the mine design for Campbell Pit and GAN. Figure 15.4 present the final pits for the two deposits. Table 15-10 and Table 15-11 presents the Mineral Reserves for the Campbell Pit and the GAN Deposit respectively.
Table 15-9: Mine Design Parameters for Campbell Pit and GAN.
Description | Units | Value |
Road Ramp Width | m | 15 |
Ramp Grade | % | 10 |
Bench Face Angle | degrees | 55 - 80 |
Bench Height | m | 10 - 20 |
Berm Width | m | 6 - 8 |
Mininum Botton Area | m² | 30 |
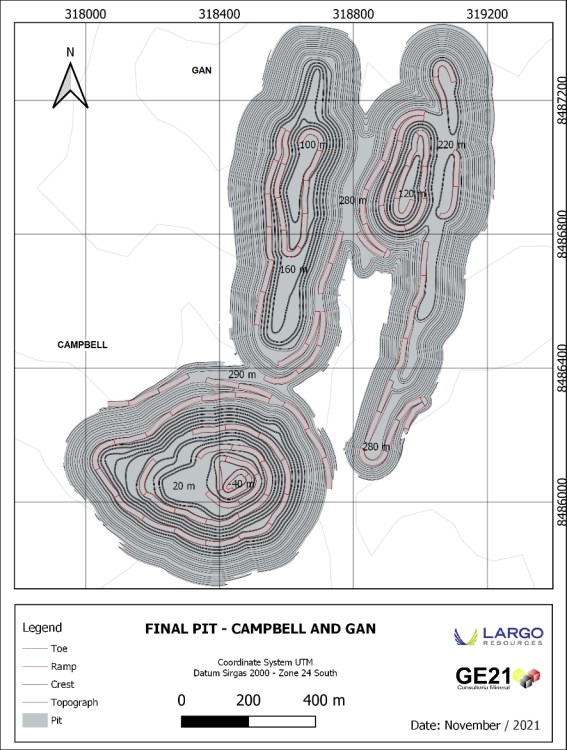
Figure 15.4: Campbell Pit and GAN - Final Pit Design.
Table 15-10: Maracás Menchen Project - Campbell Pit Reserves
(Effective Date - October,10, 2021) |
Block Dimensions 5x5x5 (m) |
Mine Recovery 100% - Dilution 3% |
Category | Tonnage
(Mt) | % Magnetics | Head | Magnetic Concentrate | Metal Contained |
% V2O5 | % TiO2 | % Fe | % SiO2 | MAG
(Mt) | % V2O5 | % TiO2 | % Fe | % SiO2 | V2O5 in
Magnetic
Concentrate
(t) | TiO2
Magnetic
Tailings (t) |
Proven | 15.64 | 31.91 | 1.22 | 8.02 | 31.76 | 27.24 | 4.99 | 3.14 | 5.04 | 61.46 | 3.03 | 156,686 | 1,002,650 |
Probable | 2.21 | 29.77 | 1.02 | 8.22 | 32.34 | 26.89 | 0.66 | 2.69 | 4.54 | 61.82 | 8.52 | 17,677 | 151,610 |
Total Reserve | 17.85 | 31.65 | 1.20 | 8.04 | 31.83 | 27.20 | 5.65 | 3.09 | 4.98 | 61.50 | 3.71 | 174,363 | 1,154,260 |
Notes:
1. Mineral Reserves estimates were prepared in accordance with the CIM Standards.
2. Mineral Reserves are the economic portion of the Measured and Indicated Mineral Resources.
3. Mineral Reserves were estimated by Guilherme Gomides Ferreira, BSc. (Meng), MAIG, a GE21 associate, who meets the requirements of a "Qualified Person" as established by the Canadian Institute of Mining, Metallurgy and Petroleum (CIM) Definition Standards for Mineral Resources and Mineral Reserves (May 2014) ("the CIM Standards").
4. Mineral Reserves is reported effective date October 10th, 2021.
5. The reference point at which the Mineral Reserves are defined is the point where the ore is delivered from the open pit to the crushing plant.
6. Vanadium product comes from magnetic concentrate, while TiO2 product from non-magnetic portion.
7. Exchange rate $1.00 = R$5.10.
8. Mineral Reserves were estimated using the Geovia Whittle 4.3 software and following the geometric and economic parameters:
Recovery 100% and dilution 3%. Pit slope angles ranging from 37.5° to 64°. V2O5 long term price of $7.80/lb, with an additional premium of $2.50/lb for high purity product. TiO2 pigment selling price of $3,691/tonne. Mining costs of $1.60/tonne for mineralization and waste. Vanadium processing costs of $37.80/tonne ore feed. V2O5 concentrate recovery of 80.5%. Ilmenite concentrate costs of $55.00/tonne processed. TiO2 pigment costs of $1.374/tonne of Ilmenite concentrate. TiO2 overall recovery of 37.9%. General and Administrative (G&A) costs of $0.16/lb V2O5.
Table 15-11: Maracás Menchen Project - GAN Mine Design Statement
(Effective Date - October,10, 2021) |
Block dimensions 10x10x5 (m) |
Mine Recovery 95% - Dilution 5% |
Category | Tonnage (Mt) | % Magnetics | Head | Magnetic Concentrate | Metal Contained |
% V2O5 | % TiO2 | % Fe | % SiO2 | MAG (Mt) | % V2O5 | % TiO2 | % Fe | % SiO2 | V2O5 in
Magnetic
Concentrate
(t) | TiO2
Magnetic
Tailings (t) |
Proven | 12.10 | 17.75 | 0.49 | 7.57 | 27.27 | 31.28 | 2.15 | 1.88 | 1.94 | 67.74 | 0.92 | 40,375 | 874,242 |
Probable | 8.06 | 21.15 | 0.57 | 8.33 | 29.30 | 29.16 | 1.71 | 2.04 | 2.29 | 67.21 | 0.97 | 34,790 | 632,616 |
Total Reserve | 20.16 | 19.11 | 0.52 | 7.87 | 28.08 | 30.43 | 3.85 | 1.95 | 2.08 | 67.53 | 0.94 | 75,165 | 1,506,858 |
Notes:
1. Mineral Reserves estimates were prepared in accordance with the CIM Standards.
2. Mineral Reserves are the economic portion of the Measured and Indicated Mineral Resources.
3. Mineral Reserves were estimated by Guilherme Gomides Ferreira, BSc. (MEng), MAIG, a GE21 associate, who meets the requirements of a "Qualified Person" as established by the Canadian Institute of Mining, Metallurgy and Petroleum (CIM) Definition Standards for Mineral Resources and Mineral Reserves (May 2014) ("the CIM Standards").
4. Mineral Reserves is reported effective date October 10th, 2021.
5. The reference point at which the Mineral Reserves are defined is the point where the ore is delivered from the open pit to the crushing plant.
6. Vanadium product comes from magnetic concentrate, while TiO2 product from non-magnetic portion.
7. Exchange rate $1.00 = R$5.10.
8. Mineral Reserves were estimated using the Geovia Whittle 4.3 software and following the geometric and economic parameters:
Recovery 95% and dilution 5%. Pit slope angles ranging from 40° to 64°. V2O5 long term price of $7.80/lb, with an additional premium of $2.50/lb for high purity product. TiO2 pigment selling price of $3,691/tonne. Mining costs of $1.60/tonne for mineralization and waste. Vanadium processing costs of $37.80/tonne ore feed. V2O5 concentrate recovery of 79.2%. Ilmenite concentrate costs of $55.00/tonne processed. TiO2 pigment costs of $1,374/tonne of Ilmenite concentrate. TiO2 overall recovery of 40.25%. General and Administrative (G&A) costs of $0.16/lb V2O5.
15.4.2 NAN Pit
Table 15-12 presents geometric parameters adopted in mine design for the NAN Deposit. Figure 15.5 presents the final pit for the NAN deposit. Table 15-13 presents the final Mineral Reserves for the NAN Deposit.
Table 15-12: Mine Design Parameters for NAN.
Description | Units | Value |
Road Ramp Width | m | 15 |
Ramp Grade | % | 10 |
Bench Face Angle | degrees | 60 - 80 |
Bench Height | m | 10 - 20 |
Berm Width | m | 6 - 8 |
Mininum Botton Area | m² | 30 |
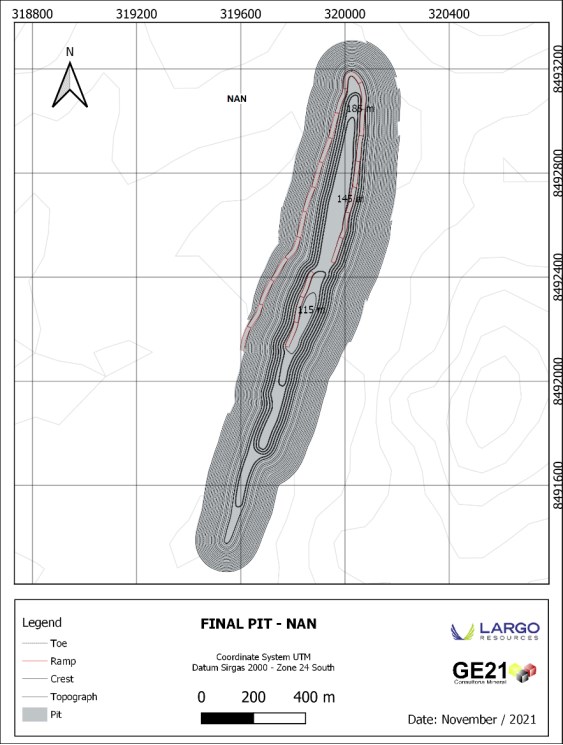
Figure 15.5: NAN - Final Pit Design.
Table 15-13: Maracás Menchen Project - NAN Reserves.
(Effective Date - October,10, 2021) |
Block Dimensions 20x20x5 (m) |
Mine Recovery 95% - Dilution 5% |
Category | Tonnage (Mt) | % Magnetics | Head | Magnetic Concentrate | Metal Contained |
% V2O5 | % TiO2 | % Fe | % SiO2 | MAG (Mt) | % V2O5 | % TiO2 | % Fe | % SiO2 | V2O5 in
Magnetic
Concentrate (t) | TiO2
Magnetic
Tailings (t) |
Proven | 17.43 | 23.22 | 0.70 | 8.71 | 29.96 | 27.72 | 4.05 | 2.36 | 2.95 | 63.38 | 3.43 | 95,538 | 1,399,099 |
Probable | 4.92 | 23.38 | 0.72 | 8.76 | 30.06 | 27.43 | 1.15 | 2.44 | 2.78 | 64.40 | 2.76 | 28,059 | 398,901 |
Total Reserve | 22.35 | 23.26 | 0.70 | 8.72 | 29.98 | 27.66 | 5.20 | 2.38 | 2.91 | 63.60 | 3.28 | 123,598 | 1,798,000 |
Notes:
1. Mineral Reserves estimates were prepared in accordance with the CIM Standards.
2. Mineral Reserves are the economic portion of the Measured and Indicated Mineral Resources.
3. Mineral Reserves were estimated by Guilherme Gomides Ferreira, BSc. (MEng), MAIG, a GE21 associate, who meets the requirements of a "Qualified Person" as established by the Canadian Institute of Mining, Metallurgy and Petroleum (CIM) Definition Standards for Mineral Resources and Mineral Reserves (May 2014) ("the CIM Standards").
4. Mineral Reserves is reported effective date October 10th, 2021.
5. The reference point at which the Mineral Reserves are defined is the point where the ore is delivered from the open pit to the crushing plant.
6. Vanadium product comes from magnetic concentrate, while TiO2 product from non-magnetic portion.
7. Exchange rate $1.00 = R$5.10.
8. Mineral Reserves were estimated using the Geovia Whittle 4.3 software and following the geometric and economic parameters:
Recovery 95% and dilution 5%. Pit slope angles ranging from 40° to 64°. V2O5 long term price of $7.80/lb, with an additional premium of $2.50/lb for high purity product. TiO2 pigment selling price of $3,691/tonne. Mining costs of $1.60/tonne for mineralization and waste. Vanadium processing costs of $37.80/tonne ore feed. V2O5 concentrate recovery of 70.0%. Ilmenite concentrate costs of $55.00/tonne processed. TiO2 pigment costs of $1,374/tonne of Ilmenite concentrate. TiO2 overall recovery of 38.25%. General and Administrative (G&A) costs of $0.16/lb V2O5
15.5 TiO2 Reserves in Non-Magnetic Tailings
Aside from Mineral Reserves from the ultimate pit, three tailings ponds with material from pre-processed non-magnetic tailings of vanadium magnetic separation, containing enriched titanium material is available for processing of Ilmenite and further concentration into Titanium Pigment.
The non-magnetic tailings material conversion from Indicated Mineral Resources to Probable Reserves was applied to the full extent of the Non-Magnetic Pond Mineral Resources, as the reconciliation data available shows that the pond material has higher grades than the in-situ mineralization of Maracás Menchen Project and reclaiming costs are far cheaper than mining and pre-processing.
The methodology applied to Reserves classification was based on production reconciliation data and topographic surveying of the ponds.
15.5.1 Reconciliation data and topographic surveying of ponds
Largo reconciliation data from 2016 to 2021, together with the topographic survey of the three ponds containing non-magnetic tailings were used as basis for the classification of pond material.
As standard procedure, Largo samples and assays the tailings from magnetic separation every eight hours. From January 2016 to October 2021, a total of 4537 chemical assays of the tailings sent to the pounds were performed, averaging a TiO2 grade of 11.35%, with standard deviation of 2.49%. The Figure 15.6 presents the histogram for all samples available from material destinated to the ponds.

Figure 15.6: TiO2 Tailings Histogram.
The grade variation for TiO2 in ponds, on a monthly basis, is presented in Figure 15.7, with no clear tendencies observed over time.
Figure 15.7: Monthly Average TiO2 Grade in Ponds.
For the measurement of tonnage deposited in ponds, Largo reconciliation data from 2014 to 2021, together with the topographic survey of the three ponds containing non-magnetic tailings were used as basis for the estimate.
The historical data and forecast of non-magnetic tailings disposal into ponds are presented as a graph in Figure 15.8.
Figure 15.8: Monthly Average TiO2 Grade in Ponds.
The production data from September 2013 to December 2014 reports a total of 230 kt of tailings material allocated in the ponds. From 2015 to 2018, an average 36 kt of tailings per month was deposited, while from 2019 to September 2021, an average 49 kt of tailings per month was produced.
The topographic survey's effective date for measurement of the tonnage of non-magnetic tailings allocated in the ponds is October 10th, 2021, totalling 3,584 kt of disposed material. The September 2021 data reconciliation reports 3,576 kt of accumulated tailings produced, showing an expected adherence between both methods of measurement. The Figure 15.9 presents the three non-magnetic tailings ponds, BNM-02, BNM-03 and BNM-04.

Figure 15.9: Non-magnetic Tailings Ponds.
The Non-Magnetic Ponds Reserves Estimate used the tonnage of material allocated in the ponds as surveyed as at October 10th, 2021, together with the average TiO2 grade from all chemical assays reported up to the date. Forecasted production of tailings were not reported in Reserves.
15.5.2 Non-Magnetic Ponds Reserves Estimate
Table 15-14 shows the accumulated volumes of non-magnetics in the period from September 2013 to October 2021.
Table 15-14: TiO2 Reserves in Non-Magnetic Tailings (Effective Date - October,20, 2021).
Pond | Reserve
Classification | Volume | Density | Reserve in Stock | Grade TiO2 | Metal content |
(km3) | (t/m3) | (kt) | (%) | (kt) |
BNM 04 | Probable | 829.75 | 1.80 | 1,493.55 | 11.35 | 169.52 |
BNM 02 | Probable | 640.30 | 1.80 | 1,152.53 | 11.35 | 130.81 |
BNM 03 | Probable | 521.14 | 1.80 | 938.05 | 11.35 | 106.47 |
Total | Probable | 1,991.18 | 1.80 | 3,584.12 | 11.35 | 406.80 |
v. Stock of "Non-Magnetic concentrate" available in the tailings ponds.
vi. Mineral Reserve in tailings were estimated based on topographic surveys (primitive data and current data) and validated with monthly processing and reconciliation data.
vii. Tailings material data was sampled once every 8 hours, with an average TiO2 content of 11.35%.
viii. Recovery is 100% and no dilution was applied to these Reserves.
15.5.3 Optimization risks assessment
GE21 evaluated the potential risks of mining and geotechnical activities that can affect the ultimate pit definitions and the risks appraised are:
- Geotechnical studies for GAN and NAN are conservative, further geotechnical studies need to be developed to increase the accuracy of slope angles and after these analyses, a review of the pit studies should be carried out;
- Production interruption due to dewatering issues in Campbell Pit can affect the production rates and must be mitigated;
- A complete mining recovery and dilution study must be prepared to increase robustness of Mineral Reserves of GAN and NAN, as well as a developing a mine reconciliation program for GAN and NAN, allowing to confirm the assumptions of mine recovery and dilution. Campbell is expected to improve its reconciliation program for the same reasons, increasing the level of confidence of the modifying factors applied;
- Starting production delay for GAN and NAN due to environmental licensing;
Permanent monitoring of the risks must be implemented. Follow-up reports shall be prepared and submitted to management departments with consolidated information, allowing better grounding for decision making.
15.6 Qualified Person's Opinion
Proven and Probable Mineral Reserves were classified using the 2014 CIM Definition standards and were estimated based on Measured and Indicated Mineral Resources, after application of appropriate modifying factors, as described above, to delineate the final contours of operation pits in Campbel Pit, NAN and GAN deposits. In the QP's opinion the estimate of Mineral Reserves as well as the parameters and assumptions used are sufficient for the level of study conducted. No Inferred Resources were converted to Reserves and that material is being treated as waste. All Mineral Reserve tonnages are expressed as "dry" tonnes and are based on density values as presented in the block model. The geotechnical parameters for GAN and NAN deposits are derived from Campbell Pit studies and must be detailed for the next level of study, the feasibility study of GAN and NAN deposits.
In preparing the Mineral Reserve Estimate, the QP used various assumptions regarding the conversion of mineral resources to mineral reserves which are discussed below and throughout this Chapter.
The principal assumptions are as follows:
The long-term prices for vanadium and titanium prices and the discount that will be achievable were provided to the Company by Roskill and are discussed in further detail in Chapter 19;
The economic assumptions regarding the costs of mining, processing and SG&A and logistics were provided by the Company based on historical costs;
The average pit range angles used in preparing the Mineral Reserve and Resource Estimate is the based on the well-established geotechnical work done on the Campbell Pit, given the similar mineralization and rock type at NAN and GAN and is discussed in further detail in section 15.4.
GE21 estimated the non-magnetic ponds grades based chemical control assays, took at each 8 hours, since 2016 to 2021, as presented at section 15.5. The distribution of such grades is presented on the histogram provided. No spatial relationship can be implied from the deposition of material on the ponds.
16 MINING METHODS
The Project consists of three open-pit operations utilizing a contract mining fleet of hydraulic excavators, front-end loaders and 36-tonne haul trucks. The mine plan model for Campbell Pit defined a 3% dilution and a 100% mining recovery from the reconciliation data, and a 5% dilution and 95% of mining recovery for GAN and NAN.
The waste dump formation for Campbell Pit will follow the ascending methodology and include drainage bases and channels for dump stability. For GAN and NAN, the waste dumps site shall be adequately prepared to include drainage at its base and channels to direct the flow of water with the aim of aiding geotechnical stability and mitigating the erosion of the stockpiled material.
The waste disposition operation uses the ascending method, beginning during the construction of the heap at the base of the area. Waste rock will be disposed of by truck and then uniformly distributed and leveled by an operator using a tractor. This process is then repeated, stacking another bank above the original one, while maintaining a ramp for the trucks to access the area.
16.1 Geotechnical Studies
16.1.1 Introduction
The aim of this section is to present the results of the geotechnical assessment for the definition of slope angles at the Campbell Pit, located in Pé de Serra, Maracás, Bahia. In respect of the GAN and NAN pit definitions, as of the date of this Technical R, the geotechnical assessments are still under development, and, therefore, the geotechnical parameters assumed for the Campbell Pit were extended to the GAN and NAN deposits.
To carry out the work, a bibliographic review of the documents noted herein was carried out, together with a review of the reports and description of the rotary drilling holes provided by Largo. The geotechnical study was carried out based on the analysis of geological and geotechnical data collected in the field, with a kinematic analysis of the mapped structures being carried out, as due to the high strength of the rocks, such type of analysis provides the best results, as simulations using the Limit or Stress Equilibrium Method / Deformation are known give very high safety factor values.
ISRM/ABGE criteria were used and for this phase of the work, resistance parameters were adopted based on previous work carried out for Largo, and in the literature, for materials with similar characteristics and behavior and used by consulting and mining companies.
16.1.2 Local Conditions
16.1.2.1 Physical Characteristics
The pit area is located in a region of flat slope, between intermittent springs, with the water level being considered non-existent, rainfall around 600 mm per year.
16.1.2.2 Summary of Local Geology
Local geology is detailed in Section 7. Below the summary to contextualize the Geotechical Studies:
- Stratified Sill of the Jacaré River:
According to Brito (1983) the stratified Rio Jacaré Intrusion is composed of two zones, the lower gabbro-dioritic and the upper stratified zone.
- Lower gabbro-dioritic zone:
The lower gabbro-dioritic zone is composed of rocks of the gabbro-diorite clan, massive, mesocratic, with gray coloration, medium grain, macroscopically classified as diorites, gabbros and subordinately as anorthosites.
The stratified zone has an average thickness of 600 m and has been divided into four zone. It is formed by cycles of gabbros, pyroxenites and magnetitites that alternate until the top, with the characteristic of layered rocks, consisting of gabbro (80%), with a lower percentage of pyroxenitic and tonalitic rocks and levels of stratiform magnetitites.
Thin lateritic soils cover parts of the mineralised zones and are comprised of altered rocks (W3/4) up to 20±5m thick, covering an area of 50±10 m of slightly altered (W2/3), but relaxed rock, and thereafter sound rock (W1/2).
16.1.3 Geotechnical Analysis
Preparation for this study included: a survey and analysis of available technical data; a field visit with a survey of the main structural features of the pit; description of drilling holes for alignment; and validation of previous descriptions.
The main structural feature is the foliation with an attitude at the maximum concentration of 105/56º which generates planar ruptures in sectors 1 and toppling in sectors 3. The other structures are limited to the relaxed portion of the pit, either by excavation or by the effect of detonations. Figure 16.1 presents the characteristics of the main structures identified in the mapping.
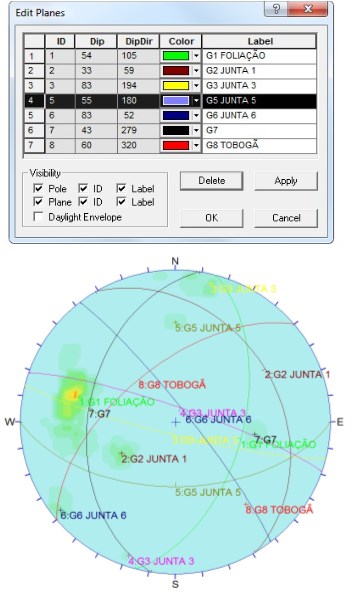
Figure 16.1: Stereo system of the main structures in the pit.
16.1.3.1 Rock mass classification
The rock mass classification followed the criteria of the Bieniawski classification (1989), or RMR (Rock Mass Rating), using data collected in the mapping and stored in an attached Table 16-1.
Table 16-1: Massif Classes - Bieniawski Geomechanical Classification, 1989.
CLASS | I | II | III | IV | V | VI |
RMR | 100 - 80 | 80 - 60 | 60 - 40 | 40 - 20 | 20 - 0 | - |
TERM | Very good | Good | Fair | Poor | Very poor | Cohesive/Saprolite Soil |
DESCRIPTIVE | Very good | Good | Fair | Poor | Very poor | Stiff soil |
Basically, there are regular to poor class materials in the upper portions and very good in the lower portions, despite the massif being at low stress condition at around 60 m in depth.
The main rupture mechanism that may occur in the pit is planar rupture along the foliation, mainly in the west portion, and tipping in the east portion. In other regions, planar and wedge breaks occur less frequently. From 50 m to 60 m, ruptures occur mainly along the foliation and can be blocked by the friction angle and by interventions with active or passive anchorages. Falling blocks can occur as a result of fragmentation due to detonations and are also minimized with the use of double-twisted meshes or nets, to mitigate the falling of blocks. Circular breaks connecting together were not observed.
16.1.3.2 Resistance Parameters
The strength parameters were obtained from the results of laboratory tests performed on a sample of drill cores.
The results are shown in Table 16-2 and Table 16-3.
| MATERIAL | SAMPLE | SPR | DEPTH
(m) | TESTS | λ | Ab(%) | P(%) | d(g/cm³) | V1(m/s) | σt(MPa) | σc(MPa) | E(GPa) |
| (1.2)PYROXENITE | 16 | 101 | 33 | A,B,C | - | 0.32 | 1.05 | 3.32 | - | 5 | - | - |
| 17 | 101 | 47 | A,B,C | 2.6 | 0.11 | 0.36 | 3.35 | 6,800 | 19 | 159 | - |
| 02 | 101 | 61 | A,B | 2.6 | 0.23 | 0.76 | 3.25 | 6,200 | - | 55 | 136 |
| (1.3)PEGMATITE | 08 | 102 | 39 | A,B,C | 2.6 | 0.39 | 0.99 | 2.57 | 4,900 | 9 | 67 | 48 |
| 06 | 101 | 44 | A,B | 2.6 | 0.50 | 1.30 | 2.57 | 4,200 | - | - | - |
| 04 | 103 | 61 | A,B,C | 2.5 | 0.55 | 1.40 | 2.57 | 4,900 | 10 | 167 | 77 |
| (1.4)ISOTROPICGABBER | 13 | 103 | 53 | A,B,C | 2.6 | 0.18 | 0.51 | 2.90 | 6,200 | 14 | | |
| 07 | 103 | 56 | A,B,C | 2.6 | 0.25 | 0.72 | 2.86 | 5,980 | 15 | 156 | 87 |
| 14 | 102 | 58 | A,B,C | 2.6 | 0.19 | 0.57 | 2.94 | 6,400 | 17 | 176 | 99 |
| | | |
| NOTE: | A) | 1 MPa ≈ 10 kgf/cm² |
| | | |
| | B) | 1 GPa ≈ 104 kgf/cm² |
Table 16-2: Test results of the gabbro gazed (source MFL)
SAMPLE | SPR | DEPTH (m) | TESTS | λ | Ab(%) | P(%) | d(g/cm³) | V1(m/s) | σt(MPa) | σc(MPa) | E(GPa) |
12 | 103 | 20 | A | - | 1.96 | 5.45 | 2.78 | - | - | - | - |
11 | 103 | 21 | A | - | 0.38 | 1.09 | 2.89 | - | - | - | - |
05 | 103 | 24 | A,B,C | 2.5 | 0.29 | 0.85 | 2.90 | 5,970 | 10 | 163 | 79 |
09 | 103 | 34 | B,C | 2.6 | - | - | - | 4,800 | 10 | 67 | 48 |
10 | 102 | 38 | C | 2.6 | - | - | - | - | 15 | - | - |
03 | 101 | 65 | A,B,C | 2.6 | 0.26 | 0.77 | 2.95 | 5,800 | 15 | 167 | 77 |
15 | 101 | 74 | A,B,C | 2.6 | 0.18 | 0.50 | 2.92 | 6,300 | 15 | 156 | 87 |
01 | 103 | 78 | B | 2.5 | - | - | - | 6,300 | - | 176 | 99 |
NOTE: | A) | 1 MPa ≈ 10 kgf/cm² |
| | | |
| B) | 1 GPa ≈ 104 kgf/cm² |
Table 16-3: Pyroxenite - pegmatite - isotropic gabbro test results (Source MFL).
| MATERIAL | SAMPLE | SPR | DEPTH
(m) | TESTS | λ | Ab(%) | P(%) | d(g/cm³) | V1(m/s) | σt(MPa) | σc(MPa) | E(GPa) |
(1.2)
PYROXENITE | 16 | 101 | 33 | A,B,C | - | 0.32 | 1.05 | 3.32 | - | 5 | - | - |
| 17 | 101 | 47 | A,B,C | 2.6 | 0.11 | 0.36 | 3.35 | 6,800 | 19 | 159 | - |
| 02 | 101 | 61 | A,B | 2.6 | 0.23 | 0.76 | 3.25 | 6,200 | - | 55 | 136 |
(1.3)
PEGMATITE | 08 | 102 | 39 | A,B,C | 2.6 | 0.39 | 0.99 | 2.57 | 4,900 | 9 | 67 | 48 |
| 06 | 101 | 44 | A,B | 2.6 | 0.50 | 1.30 | 2.57 | 4,200 | - | - | - |
| 04 | 103 | 61 | A,B,C | 2.5 | 0.55 | 1.40 | 2.57 | 4,900 | 10 | 167 | 77 |
(1.4)
ISOTROPIC
GABBER | 13 | 103 | 53 | A,B,C | 2.6 | 0.18 | 0.51 | 2.90 | 6,200 | 14 | | |
| 07 | 103 | 56 | A,B,C | 2.6 | 0.25 | 0.72 | 2.86 | 5,980 | 15 | 156 | 87 |
| 14 | 102 | 58 | A,B,C | 2.6 | 0.19 | 0.57 | 2.94 | 6,400 | 17 | 176 | 99 |
NOTE: | A) | 1 MPa ≈ 10 kgf/cm² |
| | | |
| B) | 1 GPa ≈ 104 kgf/cm² |
16.1.3.3 Hydrogeological Aspects
The occurrence of a regional water table in the pit region is not expected. A few well individualized springs with limited flow rates that do not influence the stability of the slopes and interfer little in the mining operations are noted, Flow rates are not sufficient to warrant the need for significant water pumping and only limited collection and redirecting to places where water can be pumped out of the pit without interfering with mining operations is required.
16.1.3.4 Pit Sectorization
Campbell pit has an almost circular geometry, with no preferential direction of elongation of the slopes. The sectorization was carried out in relation to of the state of alteration of the materials, spatial arrangement of the structures and expected rupture mechanisms.
Sectors A represent the portion of the slope with a degree of alteration greater than or equal to three (W3/4) with up to 20±5m in depth, with open fractures and very altered surface, sectors B are the regions of relaxed massif with 50± 10 m depth of rock with little change (W2), but relaxed and sectors C represent the massif portions of class I and II (very good and good), in the lower portions. Table 16-4 and Figure 16.2: Campbell pit sectors. show the characteristics of the sectors and the sectorization of the pit respectively.
Table 16-4: Campbell Pit Sectors.
Slope | Sector characteristic | Sector azimuths |
Sector 1A Sector 1B Sector 1C | Alteration (W3/4) up to 20±5 m in depth Alteration (W2) 50±10 m deep, relaxed Class I/II (W2/1) | S77E - N15W |
Sector 2A Sector 2B Sector 2C | Alteration (W3/4) up to 20±5 m in depth Alteration (W2) 50±10 m deep, relaxed Class I/II (W2/1) | N15W - N77W |
Sector 3A Sector 3B Sector 3C | Alteration (W3/4) up to 20±5 m in depth Alteration (W2) 50±10 m deep, relaxed Class I/II (W2/1) | N77W - S33 W |
Sector 4A Sector 4B Sector 4C | Alteration (W3/4) up to 20±5 m in depth Alteration (W2) 50±10 m deep, relaxed Class I/II (W2/1) | S33W - S24E |
Sector 5A Sector 5B Sector 5C | Alteration (W3/4) up to 20±5 m in depth Alteration (W2) 50±10 m deep, relaxed Class I/II (W2/1) | S24E - S77E |
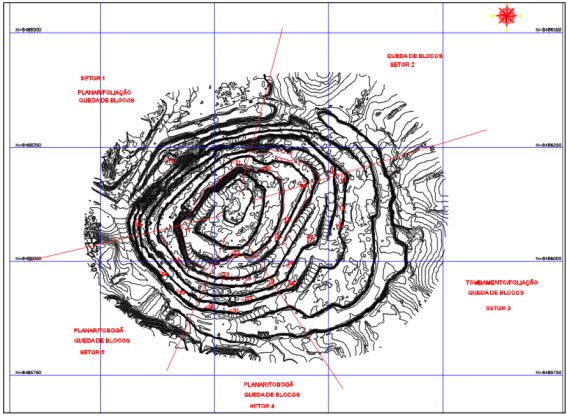
Figure 16.2: Campbell pit sectors.
16.1.4 Disruption mechanisms
The main rupture mechanism that may occur in the pit is planar rupture in the most altered materials and in the low stress condition portion, along the foliation, which is a feature present throughout the pit. The second most important mechanism is blockage, also caused by foliation, but it is a mechanism that can be coexisted or even avoided. There are other planar ruptures that occur in almost every sector, but their effect is restricted to the bench level, in the altered portions and in the low stress condition portions. It is observed that in portions below 50±10 m in depth, the mechanism of planar ruptures and tippling practically disappears, with the massif becoming more homogeneous, being little influenced by foliation.
16.1.5 Kinematic Analysis
The kinematic/geometric analysis is fundamental to understand the relationship between the structures in a rock massif and the slope to be implemented. The slopes for the sectors were initially designed with a face inclination of 80 degrees to simulate what would happen in the mine and what ruptures would be generated.
Figure 16.3 is the key to understanding the elements considered in the kinematic analysis and the regions with the types of probable instabilities for each sector.
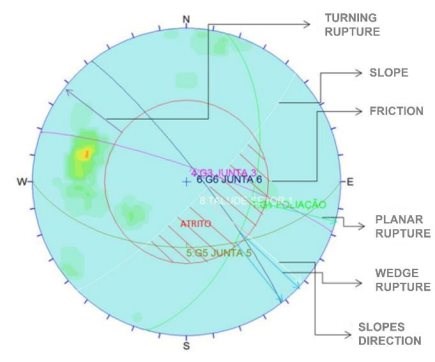
Figure 16.3: Key design of elements considered in Kinematic Analysis.
16.1.5.1 Kinematic analysis of sectors
The representative stereonet of sector A1 is shown in Figure 16.4, with a planar rupture along the foliation and two wedge ruptures by the intersection of joints 5 with the foliation and of joint 6 with the foliation. Joint 4 and foliation generate a wedge, but the wedge is blocked because the direction of the intersection line makes an angle greater than 20 degrees with the direction of the slope.
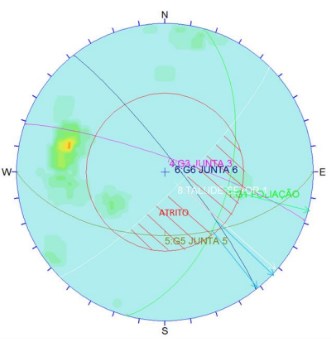
Figure 16.4: Pit sector A1 showing wedge ruptures and planar rupture.
Figure 16.5 shows the stereonet of sector A2 where ruptures in the slopes caused by structures are not expected, as they are all blocked by the position of the slope. Only falling blocks are expected due to an eventual lack of proper clearance.
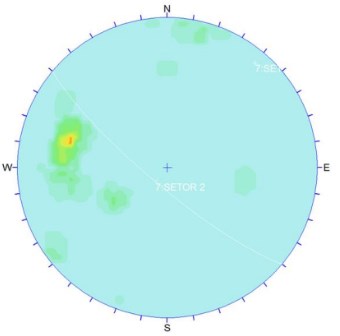
Figure 16.5: Pit sector A1 showing wedge ruptures and planar rupture.
For sector A3 planar ruptures are expected along the so-called Tobogã joint, due to tipping in the foliation that dips into the massif. The joint 7 is blocked by the friction angle, but it can eventually slip (Figure 16.6).
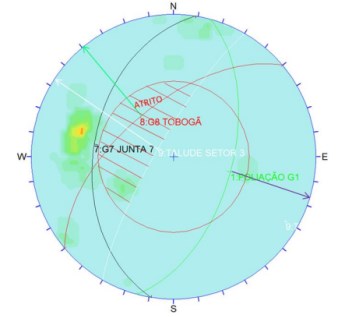
Figure 16.6: A3 sector of the pit showing planar and tipping ruptures.
For sector A4, planar ruptures are expected along joint 8, Tobogã, wedge rupture by the intersection of joint 8 and joint 6, whose intersection line falls into the unstable zone formed by the friction cone and the direction of the slope (Figure 16.7).

Figure 16.7: A4 sector of the pit showing planar and wedge breaks.
For sector A5, planar ruptures by joints 4 and 6 are unlikely, which present a dip greater than the dip of the slope, but within 20% of occurring due to the undulation of the surfaces. Joint 1 has a dip smaller than the friction angle, being blocked by it, but ruptures can occur if there is loss of resistance over time. (Figure 16.8)
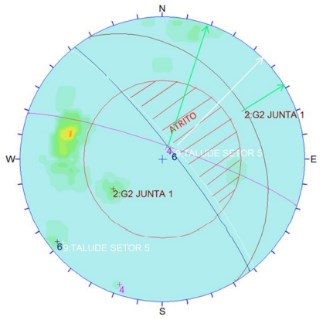
Figure 16.8: Sector A5 of the pit showing planar ruptures blocked by friction and a dip greater than that of the slope.
For sector B1 that presents an angle of friction estimated by RocLab (source MFL) of 48º, planar ruptures along the foliation and wedge ruptures at the limit of the friction cone may still occur. It is the relaxed portion of the slope that may eventually present these ruptures. (Figure 16.9)
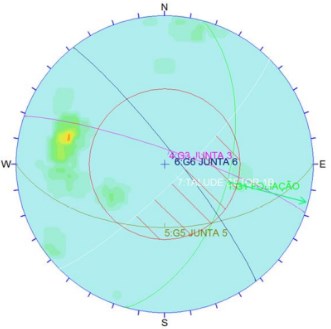
Figure 16.9: Sector B1 of the pit showing planar and wedge ruptures near the limit of the friction cone.
As in sector A2, in sector B2 ruptures due to preexisting structures are not expected.
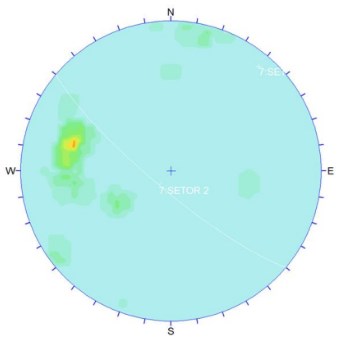
Figure 16.10: B2 sector of the pit without ruptures by foundation structures.
In sector B3 planar ruptures can still occur along the joint 8 (Slide) and ruptures due to toppling along the foliation. (Figure 16.11)
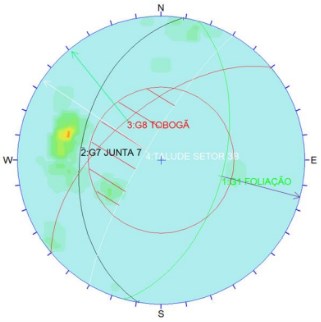
Figure 16.11: Sector B3 of the pit, ruptures may occur due to tipping along the foliation and plan along the joint 8 (Tobogã).
In sector B4, planar and pro wedge ruptures may occur through the intersection of joints 6 and 8 and planar ruptures through joint 8 (Tobogã). (Figure 16.12)
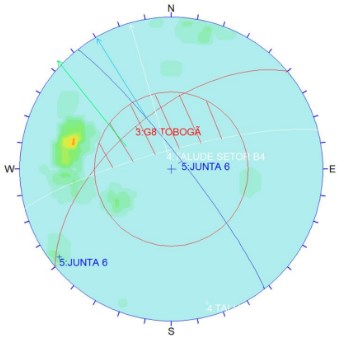
Figure 16.12: Sector B4 of the pit, wedge ruptures may occur, planar rupture in joint 8.
In sector B5, the intersection of joints 3 and 5 form wedges, but with a greater inclination than that of the slope, being blocked (Figure 16.13). The planar rupture that could be generated by joint 2 is blocked by the friction cone. In theory, no disruption is expected in sector B5.
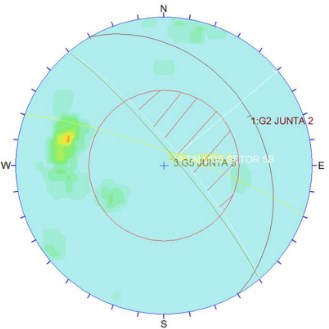
Figure 16.13: Sector B5 of the pit indicating that the ruptures were blocked.
No breakages are expected in all sectors C, as the joint surfaces are closed.
16.1.6 Recommended geometry for slopes
Based on the results of the kinematic analyses, adjustments should be made to the slopes currently used in the mine, mainly in the more altered upper portions and in the portion below, where the massif is more relaxed.
In all sectors, the stability of the slopes is controlled by the structures and not by the strength of the matrix, as occurs in heavily altered materials. Breakdown mechanisms are controlled by discontinuities.
For GAN and NAN, geotechnical studies are still being carried out, and the slope angles adopted are prevenient from Campbell assessment, as shown in the table below. The slope angles used for Campbell Pit presented in Table 16-5 and for GAN and NAN in Table 16-6.
Table 16-5: Geotechnical Angles Adopted in Campbell's pit.
Sectors | Face Angle (º) | Berm width
(m) | Bench height (m) | Angle between
ramps (º) |
A1 | 55 | 6 | 10 | 37.5 |
A2 | 55 | 6 | 10 | 37.5 |
A3 | 60 | 6 | 10 | 40 |
A4 | 60 | 6 | 10 | 40 |
A5 | 60 | 6 | 10 | 40 |
B1 | 55 | 6 | 20 | 45 |
B2 | 60 | 6 | 20 | 48.8 |
B3 | 60 | 6 | 20 | 48.8 |
B4 | 60 | 6 | 20 | 48.8 |
B5 | 60 | 6 | 20 | 48.8 |
C | 80 | 6 | 20 | 64 |
Table 16-6: Geotechnical Angles Adopted for GAN and NAN.
Sectors | Face Angle (º) | berm width
(m) | Bench height
(m) | Angle between
ramps (º) |
A | 60 | 6 | 10 | 40 |
B | 60 | 6 | 20 | 48.8 |
C | 80 | 6 | 20 | 64 |
16.1.7 Final Considerations and Recommendations
After the studies, the following considerations and recommendations can be made:
- Systematic surveys of structural features must be programmed, as they are the ones that control instabilities;
- Surveys of industrial features must be used to adjust the geometry of slopes;
- Some devices can be used to improve the performance of slopes, such as the use of passive and active anchors (rods and clamps) and double-twisted anchorage screens;
- Systematically evaluate blasts in order to improve pit walls slope;
- Start to study the final finish of the slopes, with different measures of production dismantling;
- Conclusion of geotechnical studies for GAN and NAN, following the same lines of those performed for Campbell.
16.2 Mine Schedule
The mining plan for Maracás Menchen Project foresees 4 phases of production:
- Phase 1 - (2022-2023): Construction of both Ilmenite Concentration Plant 150 Kt/year and Titanium Pigment Processing Plant 30kt/year;
- Phase 2 - (2024-2025): Titanium Pigment Processing Plant + Vanadium Trioxide Plant Expansions;
- Phase 3 - (2026-2028): Titanium Pigment Processing + Ilmenite Concentration Plant Expansions + Site preparation for GAN and NAN (roads / access and pre-stripping);
- Phase 4 - (2029-2032): Vanadium Expansion Second Kiln and mining of GAN and NAN.
To achieve the production plan, mine scheduling was performed using GEOVIA Minesched 9.1 software, giving primary focus to the vanadium production, where the following assumptions were used:
Mine assumptions:
- Production rate: 1.7 Mtpa on each of first ten years (Campbell Pit), following by 5.0 Mtpa on remaining years for GAN and NAN;
Vanadium production assumptions:
- 500 kt feed kiln on each of first ten years (Campbell Pit), followed by 1000 kt for remaining years with material from GAN and NAN;
- 13 kt V2O5 product on each first ten years (Campbell Pit), followed by 16 kt for remaining years with material from GAN and NAN.
16.2.1 Mining Scheduling Production
The mining sequencing shown in Table 16-7 below has 20 years of production. For the first 10 years of production, from 2022 to 2031, the vanadium plant is fed 100% with material from Campbell Pit. In 2032, a transition year, the vanadium plant will be fed with material from Campbell Pit, GAN and NAN. By 2032, the vanadium beneficiation plant will have its expansion concluded and the production capacity will go from 13 kt/year of flake to 16 kt/year of flake. From 2033 forward. Material fed into the vanadium plant is expected to be a blend of approximately 45% GAN and 55% NAN, with both mines expected to be exhausted in 2041.
Table 16-7: Maracás Menchen Project - Mining Schedule.
Year | Target | Period | ROM
(Mt) | Waste
(Mt) | Total
Mov.
(Mt) | Grade
V2O5
Conc
(%) | Grade
V2O5
Head
(%) | Grade
TiO2
Conc
(%) | Grade
TiO2
Head
(%) | %
Mag | Feed Kiln (t) | Product
V2O5(t) | Strip
Ratio |
2022 | CAMP | 1 | 1.53 | 6.99 | 8.52 | 3.15 | 1.32 | 5.64 | 7.95 | 33.19 | 492,254 | 13,127 | 4.58 |
2023 | CAMP | 2 | 1.58 | 7.83 | 9.42 | 3.12 | 1.28 | 5.59 | 7.81 | 32.64 | 501,210 | 13,296 | 4.95 |
2024 | CAMP | 3 | 1.58 | 7.83 | 9.41 | 3.10 | 1.23 | 5.39 | 7.93 | 32.64 | 500,077 | 13,094 | 4.96 |
2025 | CAMP | 4 | 1.45 | 7.37 | 8.82 | 3.25 | 1.30 | 5.16 | 8.89 | 35.24 | 494,646 | 13,371 | 5.10 |
2026 | CAMP | 5 | 1.71 | 7.65 | 9.36 | 3.10 | 1.16 | 4.99 | 7.46 | 29.85 | 495,616 | 13,003 | 4.47 |
2027 | CAMP | 6 | 1.68 | 7.17 | 8.85 | 3.04 | 1.14 | 5.11 | 7.87 | 31.69 | 509,011 | 13,100 | 4.62 |
2028 | CAMP | 7 | 1.58 | 6.92 | 8.50 | 3.02 | 1.25 | 5.07 | 8.52 | 34.11 | 515,286 | 13,167 | 4.74 |
2029 | CAMP | 8 | 1.68 | 6.89 | 8.57 | 3.04 | 1.23 | 4.40 | 8.23 | 32.08 | 515,244 | 13,053 | 4.44 |
2030 | CAMP | 9 | 1.68 | 4.46 | 6.14 | 3.15 | 1.22 | 4.40 | 8.31 | 31.54 | 506,557 | 13,228 | 2.88 |
2031 | CAMP | 10 | 1.85 | 3.75 | 5.60 | 3.14 | 1.11 | 4.32 | 7.56 | 28.77 | 453,184 | 14,488 | 3.44 |
2032 | CAMP | 11 | 1.52 | 3.47 | 4.99 | 2.98 | 0.95 | 4.40 | 7.11 | 25.00 | 501,210 | 9,076 | 2.28 |
2032 | GAN | 11 | 0.94 | 6.07 | 7.01 | 1.58 | 0.38 | 1.39 | 7.28 | 15.21 | 42,224 | 1,670 | 6.45 |
2032 | NAN | 11 | 0.96 | 7.86 | 8.82 | 2.33 | 0.68 | 2.73 | 8.57 | 22.29 | 214,131 | 3,291 | 8.19 |
2032 | Subtotal | 11 | 3.42 | 17.40 | 20.82 | 2.42 | 0.72 | 3.10 | 7.57 | 21.55 | 757,564 | 14,036 | 5.09 |
2033 | GAN | 12 | 2.21 | 15.36 | 17.57 | 1.82 | 0.52 | 2.35 | 8.61 | 20.07 | 126,076 | 5,864 | 6.94 |
2033 | NAN | 12 | 2.73 | 17.85 | 20.57 | 2.28 | 0.70 | 3.04 | 8.99 | 23.48 | 639,918 | 9,650 | 6.55 |
2033 | Subtotal | 12 | 4.94 | 33.20 | 38.14 | 2.08 | 0.62 | 2.73 | 8.82 | 21.95 | 765,994 | 15,514 | 6.72 |
2034 | GAN | 13 | 2.51 | 17.43 | 19.94 | 1.99 | 0.56 | 2.04 | 8.12 | 19.63 | 140,035 | 7,019 | 6.95 |
2034 | NAN | 13 | 2.41 | 18.80 | 21.21 | 2.37 | 0.70 | 2.86 | 8.58 | 22.76 | 549,402 | 8,448 | 7.79 |
2034 | Subtotal | 13 | 4.92 | 36.23 | 41.15 | 2.18 | 0.63 | 2.44 | 8.35 | 21.17 | 689,438 | 15,467 | 7.36 |
2035 | GAN | 14 | 2.35 | 16.29 | 18.64 | 1.98 | 0.53 | 2.09 | 7.76 | 19.13 | 450,630 | 6,465 | 6.93 |
2035 | NAN | 14 | 2.65 | 20.27 | 22.92 | 2.39 | 0.71 | 2.91 | 8.70 | 23.35 | 620,235 | 9,448 | 7.65 |
2035 | Subtotal | 14 | 5.00 | 36.56 | 41.56 | 2.20 | 0.62 | 2.52 | 8.26 | 21.36 | 1 ,070,865 | 15,912 | 7.31 |
2036 | GAN | 15 | 2.35 | 16.29 | 18.64 | 1.98 | 0.53 | 2.09 | 7.76 | 19.13 | 450,630 | 6,465 | 6.93 |
2036 | NAN | 15 | 2.65 | 20.27 | 22.92 | 2.39 | 0.71 | 2.91 | 8.70 | 23.35 | 620,235 | 9,448 | 7.65 |
2036 | Subtotal | 15 | 5.00 | 36.56 | 41.56 | 2.20 | 0.62 | 2.52 | 8.26 | 21.36 | 1,070,865 | 15,912 | 7.31 |
2037 | GAN | 16 | 2.35 | 16.29 | 18.64 | 1.98 | 0.53 | 2.09 | 7.76 | 19.13 | 450,630 | 6,465 | 6.93 |
2037 | NAN | 16 | 2.65 | 20.27 | 22.92 | 2.39 | 0.71 | 2.91 | 8.70 | 23.35 | 620,235 | 9,448 | 7.65 |
2037 | Subtotal | 16 | 5.00 | 36.56 | 41.56 | 2.20 | 0.62 | 2.52 | 8.26 | 21.36 | 1,070,865 | 15,912 | 7.31 |
2038 | GAN | 17 | 2.35 | 16.29 | 18.64 | 1.98 | 0.53 | 2.09 | 7.76 | 19.13 | 450,630 | 6,465 | 6.93 |
2038 | NAN | 17 | 2.65 | 20.27 | 22.92 | 2.39 | 0.71 | 2.91 | 8.70 | 23.35 | 620,235 | 9,448 | 7.65 |
2038 | Subtotal | 17 | 5.00 | 36.56 | 41.56 | 2.20 | 0.62 | 2.52 | 8.26 | 21.36 | 1,070,865 | 15,912 | 7.31 |
2039 | GAN | 18 | 2.35 | 16.29 | 18.64 | 1.98 | 0.53 | 2.09 | 7.76 | 19.13 | 450,630 | 6,465 | 6.93 |
2039 | NAN | 18 | 2.65 | 20.27 | 22.92 | 2.39 | 0.71 | 2.91 | 8.70 | 23.35 | 620,235 | 9,448 | 7.65 |
2039 | Subtotal | 18 | 5.00 | 36.56 | 41.56 | 2.20 | 0.62 | 2.52 | 8.26 | 21.36 | 1,070,865 | 15,912 | 7.31 |
2040 | GAN | 19 | 2.35 | 16.29 | 18.64 | 1.98 | 0.53 | 2.09 | 7.76 | 19.13 | 450,630 | 6,465 | 6.93 |
2040 | NAN | 19 | 2.65 | 20.27 | 22.92 | 2.39 | 0.71 | 2.91 | 8.70 | 23.35 | 620,235 | 9,448 | 7.65 |
2040 | Subtotal | 19 | 5.00 | 36.56 | 41.56 | 2.20 | 0.62 | 2.52 | 8.26 | 21.36 | 1,070,865 | 15,912 | 7.31 |
2041 | GAN | 20 | 0.40 | 2.87 | 3.27 | 1.98 | 0.53 | 2.09 | 7.76 | 19.13 | 79,384 | 1,139 | 7.18 |
2041 | NAN | 20 | 0.35 | 2.92 | 3.27 | 2.39 | 0.71 | 2.91 | 8.70 | 23.35 | 86,222 | 1,313 | 8.25 |
2041 | Subtotal | 20 | 0.75 | 5.79 | 6.54 | 2.20 | 0.62 | 2.52 | 8.26 | 21.36 | 165,605 | 2,452 | 7.68 |
The End of Period mine design for years 1 to 5, 10, 11, 12 and 13 are shown in the Figure 16.14 to Figure 16.22 below. The final pits design is presented in Figure 16.23.
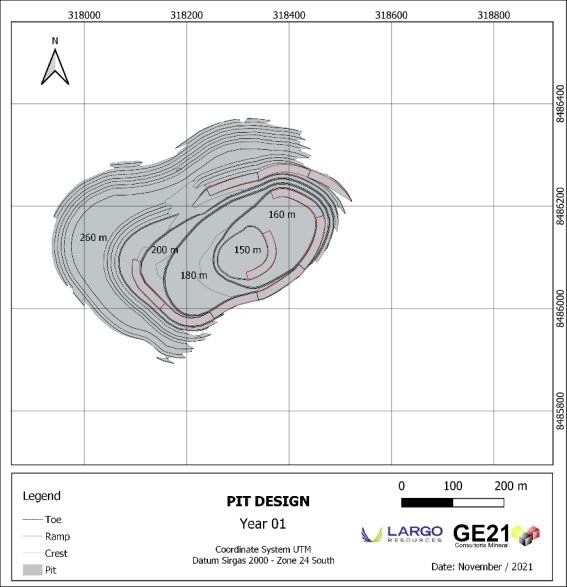
Figure 16.14: Campbell-Year 01.
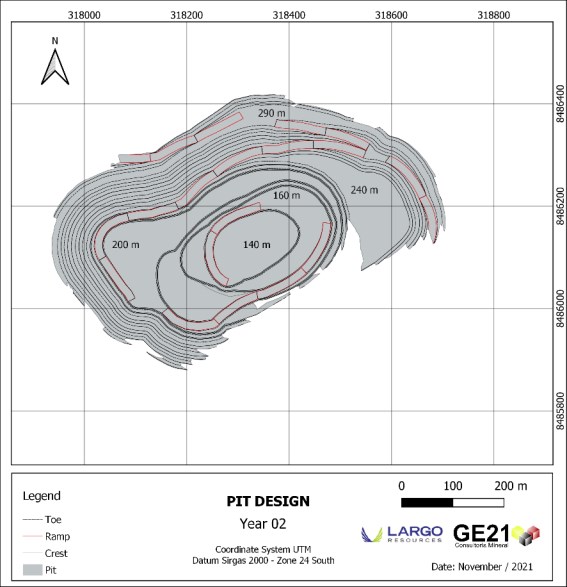
Figure 16.15: Campbell-Year 02.
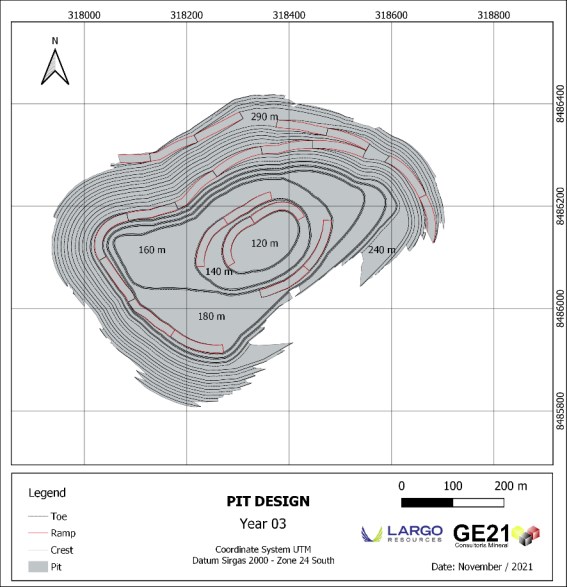
Figure 16.16: Campbell-Year 03.
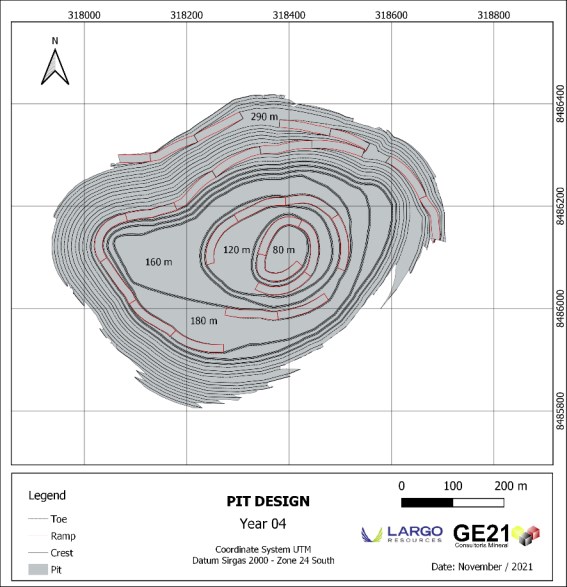
Figure 16.17: Campbell-Year 04.
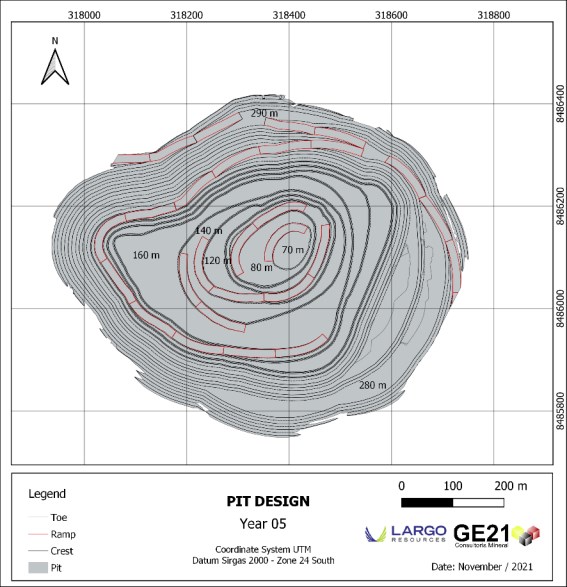
Figure 16.18: Campbell-Year 05.
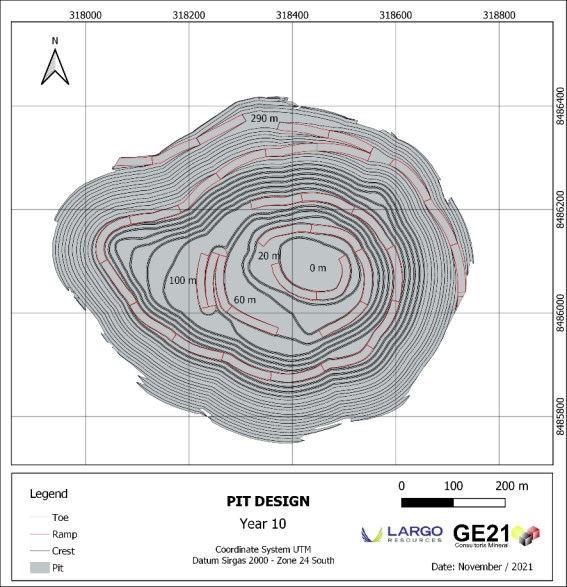
Figure 16.19: Campbell-Year 10.
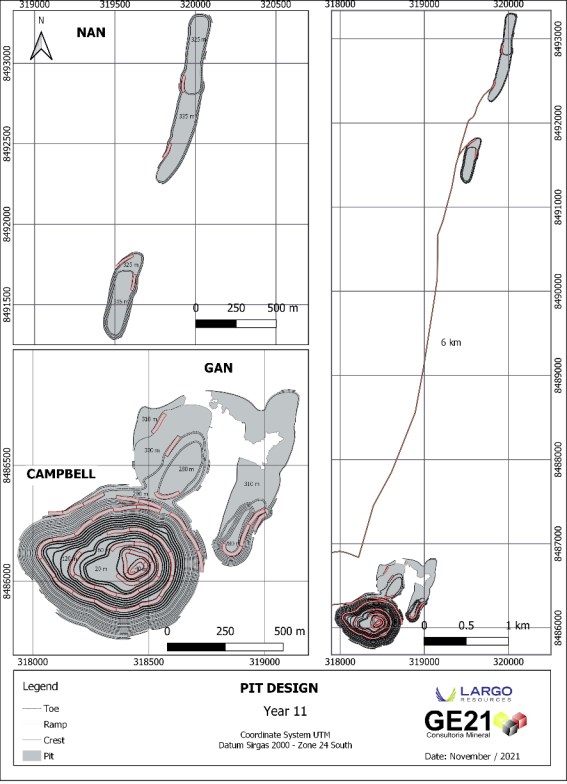
Figure 16.20: Campbell, GAN and NAN - Year 11.
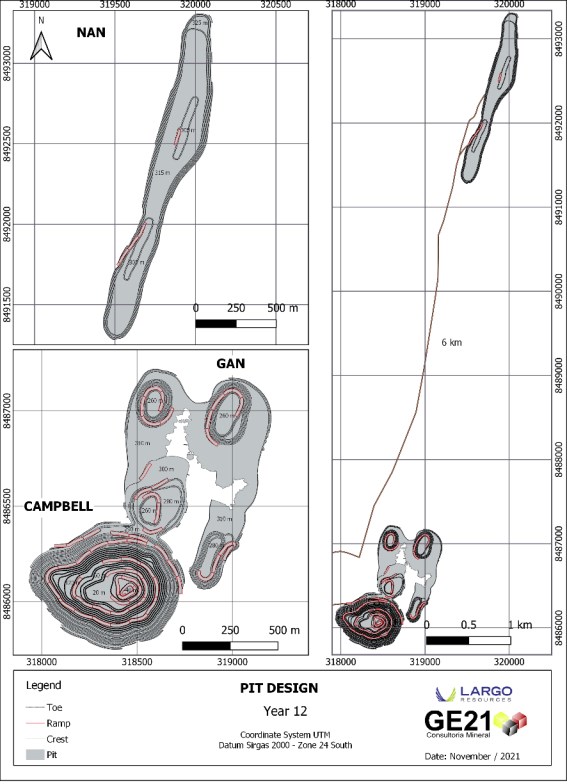
Figure 16.21: GAN and NAN - Year 12.
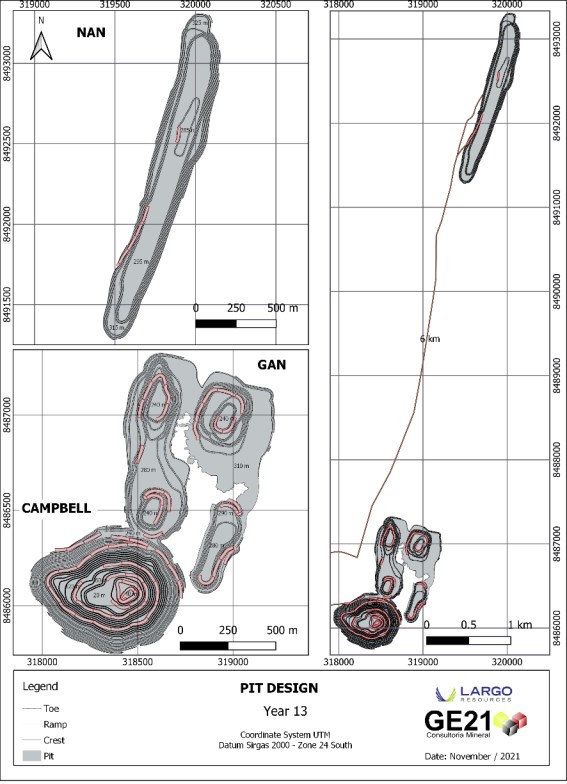
Figure 16.22: GAN and NAN - Year 13.
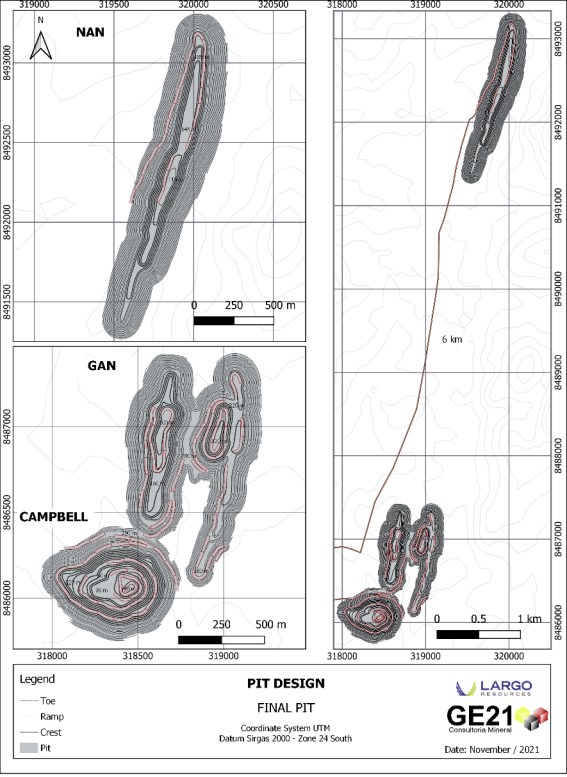
Figure 16.23: Maracás Menchen Project - Final Pit Design.
16.2.2 Non-Magnetic Tailings Reclamation
Aside from the material mined and scheduled from open pit operations, three ponds bearing titanium enriched material from pre-processed non-magnetic tailings of vanadium magnetic separation are available to reclaiming and processing for titanium production.
The reclaiming of non-magnetic tailings from ponds is scheduled for year 2026, aiming to complement the nominal capacity of the titanium pigment plant. Table 16-8 shows the accumulated volumes of non-magnetic tailings in the period from Sep/2013 to Oct/2021.
Table 16-8: Non-Magnetic Volume in Ponds by topography.
Date | Pond | Water
level Max. | Freeboard | Water
level Real | Pond Capacity
(m³) | Occupied
volume (m³) |
20/Oct/2021 | BNM 04 | 330 | 329 | 326 | 1,047,532 | 829,748 |
20/Oct/2021 | BNM 02 | 324 | 323 | 323 | 649,623 | 640,295 |
20/Oct/2021 | BNM 03 | 324 | 323 | 322 | 549,701 | 521,137 |
| | | | | 2,246,856 | 1,991,180 |
| | | | | Density (t/m³) | 1.8 |
| | | | | tonnes | 3,584,124 |
An additional generation of 950 kt non-magnetic tailings is forecasted until Dec/2022, totalling 4.5 Mt of material in the ponds. The assumptions for this forecast are:
- Volume of non-magnetics generated informed by monthly reconciliation data and confirmed by topographic measurement on 20/Oct/2021.
- Forecasted volume from Oct/2021 to Jan/2023 following the average production for the last 12 months (57.8 kt);
- Average TiO2 grade of 11.35 % of the non-magnetic tailings deposited in the ponds, regarding data since 2016, with sampling every 8 hours.
Table 16-9 presents the reclaiming plan for the non-magnetic tailings from the ponds, with forecasted volumes from Nov/2021 to Dec/2022. The reclaiming will start in 2026, together with the start-up of the Pigment Plant, which will be fed together with the tailings coming from the Vanadium Plant. The non-magnetic tailings ponds will be exhausted in 2033 and after that, Ilmenite Plant and Pigment Plant will be fed with the non-magnetic tailings from GAN and NAN, where the titanium concentration will be sufficient to secure pigment production.
Table 16-9: Non-Magnetic Tailings Reclaimation Plan.
Period | Non-Magnetic
(t) | Recovered
Non-Magnetic (t) | Grade TiO2
(%) | Ilmenite
(t) | Pigment
(t) |
Volume generated between Sep/13 to Sep/21 | 3,548,120 | - | 11.35 | - | - |
Forecasted Volume from Oct/21 to Dec/2022 | 952,482 | - | 11.35 | - | - |
Total accumulated volume | 4,500,602 | - | 11.35 | - | - |
| | - | | - | - |
2026 | | 133,258 | 11.35 | 26,161 | 9,339 |
2027 | | 105,702 | 11.35 | 20,751 | 7,408 |
2028 | | 948,203 | 11.35 | 186,149 | 66,455 |
2029 | | 928,094 | 11.35 | 182,201 | 65,046 |
2030 | | 920,642 | 11.35 | 180,738 | 64,523 |
2031 | | 917,621 | 11.35 | 180,145 | 64,312 |
2032 | | 213,602 | 11.35 | 41,934 | 14,970 |
2033 | | - | - | - | - |
Total Recovered | 4,167,123 | 11.35 | 818,079 | 292,054 |
16.3 Waste Disposal
The ROM with grade below the minimum acceptable by the Processing Plant, even though mineralized, will be excavated, loaded, transported and disposed in proper waste dumps, following the respective project designed for each dump. All fleets for mining activities have been selected and sized for both mining and waste removal.
All the layouts must to be in conformity with the waste dump projects and in accordance with the projected disposal sequencing of waste rock.
The waste disposal operation uses the ascending method, beginning during the construction of the heap at the base area. Waste rock will be disposed of by truck, then uniformly distributed and leveled by an operator using a tractor. The process is then repeated by stacking another bank above the original one, while maintaining a ramp for the trucks to access the area. In the top benches of the waste dumps, final steps necessary for the installation of the superficial drainage system and revegetation will be carried out.
Table 16-10 and Table 16.11 presents the geometric parameters and volumes of each projected waste dump. Figure 16.24 and Figure 16.25 present waste dump for GAN and NAN, Figure 16.26 present project layout.
Table 16-10: Waste dumps design parameters.
Slope Angle | 32° |
Bench Height | 10 m |
Berm width | 10 m |
Road Ramp width | 15 m |
Table 16-11: Waste dumps volume and areas.
Waste Dump | Volume (Mm3) | Area (ha) |
Campbell/GAN | 94.3 | 132.3 |
NAN | 80.2 | 119.0 |
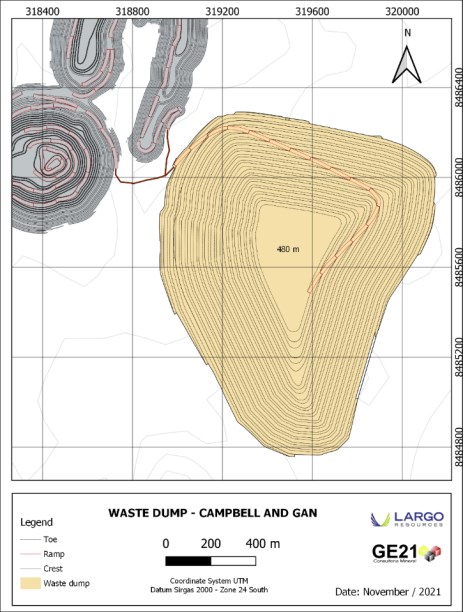
Figure 16.24: Campbell/GAN Waste Dump.
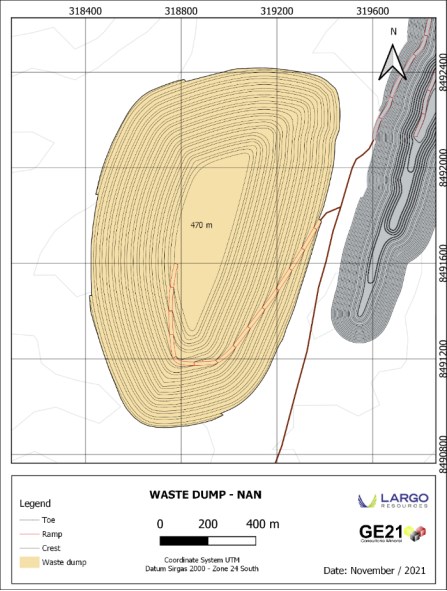
Figure 16.25: NAN Waste Dump.
Figure 16.26 presents Maracás Project Site Layout for the Campbell, GAN and NAN mines facilities.
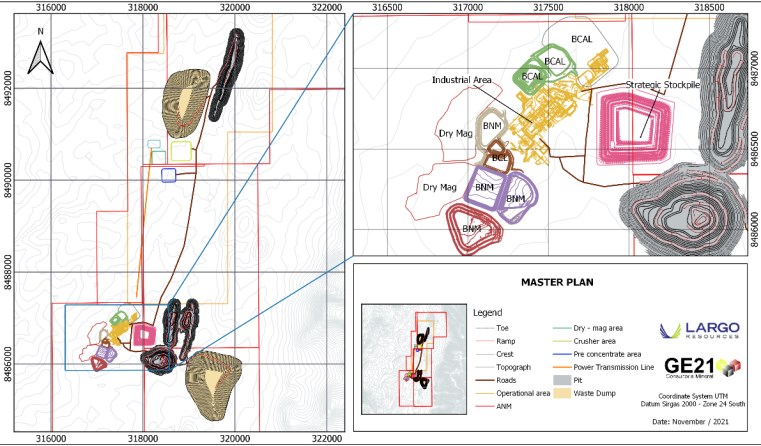
Figure 16.26: Maracás Menchen Project - Final Pit Design.
16.4 Mining Fleet Sizing
Currently, Largo has a mining fleet contract with Minax Tranportes, Construções e Mineração, which consists of 4 Volvo EC750 hydraulic excavators equipped with a 2.5 m3 bucket and a total of 24 Scania 8x4 36-tonne capacity trucks. The contract drilling fleet consists of 6 Sandvik Ranger DX800 rotary drill rigs. The equipment list is presented in Table 16-12 below. Figure 16.26 shows the mining equipment currently in operation.
Table 16-12: Mining Fleet Contract.
Description | Quantity |
Scania Truck 8x4 Heavy tipper 25m3 | 24 |
Scania Truck 8x4 Heavy tipper 25m3 (stand by) | 6 |
Volvo EC750 excavator | 4 |
Volvo EC480 excavator (stand by) | 4 |
Volvo EC380 excavator | 1 |
Volvo EC 360 excavator (stand by) | 1 |
Volvo EC220 excavator with breaker | 1 |
Volvo EC220 excavator with breaker | 1 |
D6T Crawler Tractor | 3 |
D6T Crawler Tractor (stand by) | 1 |
CAT 140k Motor Grader | 2 |
CAT 140k Motor Grader (stand by) | 1 |
CA250 Compactor Roller (stand by) | 1 |
Backhoe Excavator CAT 416E (stand by) | 1 |
L120 wheel loader | 1 |
L120 Loader (stand by) | 1 |
6x4 Water Truck 20,000 Lts | 4 |
MB train 6x4 | 2 |
Pancha Cart 4 axles 75 t | 1 |
Sandvick DX800 Drilling Rig | 6 |
Munck Truck | 1 |
Tower Lighting | 10 |
Chemical Bathrooms | 10 |
Toyota Hilux 4x4 pickup trucks | 6 |
Mercedes Bens bus | 3 |
Total Mining Fleet | 96 |
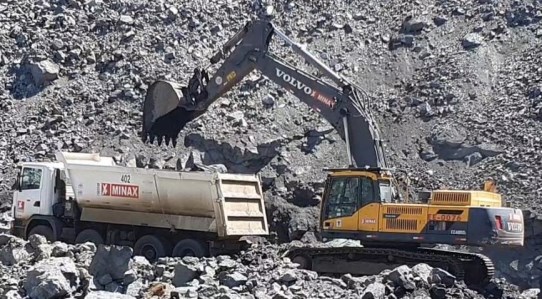
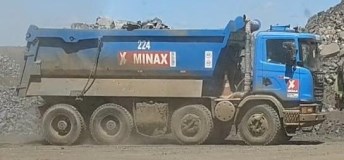
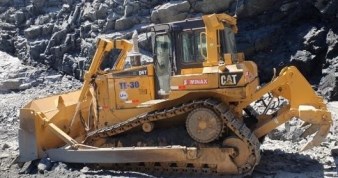
Figure 16.27: Minax Mining Equipments.
GE21 has estimated the yearly requirements for the mine fleet to perform the projected mine schedule and the results are presented in Table 16-13: Yearly Required Mining Flee.
Table 16-13: Yearly Required Mining Flee.
Mining Fleet | 1 | 2 | 3 | 4 | 5 | 6 | 7 | 8 | 9 | 10 | 11 | 12 | 13 | 14 | 15 | 16 | 17 | 18 | 19 | 20 |
Hydraulic Excavator -70 t | 4 | 4 | 4 | 4 | 4 | 4 | 4 | 4 | 4 | 4 | 7 | 12 | 13 | 13 | 13 | 13 | 13 | 13 | 13 | 4 |
Road Truck 42 t | 24 | 24 | 24 | 24 | 24 | 24 | 24 | 24 | 24 | 24 | 29 | 49 | 55 | 58 | 61 | 64 | 67 | 70 | 73 | 12 |
Haul Truck (40 t) - Scania | 0 | 0 | 0 | 0 | 0 | 0 | 0 | 0 | 0 | 0 | 2 | 6 | 6 | 6 | 6 | 6 | 6 | 6 | 6 | 1 |
Drilling Machine | 6 | 6 | 6 | 6 | 6 | 6 | 6 | 6 | 6 | 6 | 6 | 11 | 12 | 12 | 12 | 12 | 12 | 12 | 12 | 6 |
Wheel Loader (7 - 10 m3) | 1 | 1 | 1 | 1 | 1 | 1 | 1 | 1 | 1 | 1 | 1 | 1 | 1 | 1 | 1 | 1 | 1 | 1 | 1 | 1 |
Bulldozer CAT D8 | 1 | 1 | 1 | 1 | 1 | 1 | 1 | 1 | 1 | 1 | 2 | 4 | 4 | 4 | 4 | 4 | 4 | 4 | 4 | 1 |
Bulldozer CAT D6 | 2 | 2 | 2 | 2 | 2 | 2 | 2 | 2 | 2 | 2 | 4 | 7 | 7 | 7 | 7 | 7 | 7 | 7 | 7 | 2 |
Wheel Dozer CAT 834H | 1 | 1 | 1 | 1 | 1 | 1 | 1 | 1 | 1 | 1 | 2 | 4 | 4 | 4 | 4 | 4 | 4 | 4 | 4 | 1 |
Grader - CAT 16 M | 2 | 2 | 2 | 2 | 2 | 2 | 2 | 2 | 1 | 1 | 2 | 4 | 4 | 4 | 4 | 4 | 4 | 4 | 4 | 1 |
Operation Support Truck - Scania | 2 | 2 | 2 | 2 | 2 | 2 | 2 | 2 | 1 | 1 | 2 | 4 | 4 | 4 | 4 | 4 | 4 | 4 | 4 | 1 |
Water Truck - 20.000 L | 2 | 2 | 2 | 2 | 2 | 2 | 2 | 2 | 2 | 2 | 2 | 4 | 4 | 4 | 4 | 4 | 4 | 4 | 4 | 2 |
Backhoe Excavator | 1 | 1 | 1 | 1 | 1 | 1 | 1 | 1 | 1 | 1 | 1 | 2 | 3 | 3 | 3 | 3 | 3 | 3 | 3 | 1 |
Hydraulic Excavator - 35 t with Hammer | 1 | 1 | 1 | 1 | 1 | 1 | 1 | 1 | 1 | 1 | 2 | 3 | 3 | 3 | 3 | 3 | 3 | 3 | 3 | 1 |
Fork Lift | 1 | 1 | 1 | 1 | 1 | 1 | 1 | 1 | 1 | 1 | 2 | 4 | 4 | 4 | 4 | 4 | 4 | 4 | 4 | 1 |
Blasting & Support Truck - Scania | 1 | 1 | 1 | 1 | 1 | 1 | 1 | 1 | 1 | 1 | 2 | 3 | 3 | 3 | 3 | 3 | 3 | 3 | 3 | 1 |
Fuel & Lube Truck - 8.000 L | 2 | 2 | 2 | 2 | 2 | 2 | 2 | 2 | 2 | 2 | 4 | 4 | 5 | 5 | 5 | 5 | 5 | 5 | 5 | 1 |
Maintenance Support Truck - Munck | 1 | 1 | 1 | 1 | 1 | 1 | 1 | 1 | 1 | 1 | 2 | 3 | 4 | 4 | 4 | 4 | 4 | 4 | 4 | 1 |
Crane - 30 t of capacity | 1 | 1 | 1 | 1 | 1 | 1 | 1 | 1 | 1 | 1 | 1 | 1 | 1 | 1 | 1 | 1 | 1 | 1 | 1 | 1 |
Portable Lightning Tower | 2 | 2 | 2 | 2 | 2 | 2 | 2 | 2 | 2 | 2 | 4 | 9 | 9 | 9 | 9 | 9 | 9 | 9 | 9 | 4 |
Light Vehicle | 4 | 4 | 4 | 4 | 4 | 4 | 4 | 4 | 3 | 3 | 7 | 12 | 13 | 13 | 13 | 13 | 13 | 13 | 13 | 4 |
Total | 47 | 47 | 47 | 49 | 49 | 49 | 48 | 48 | 36 | 35 | 84 | 147 | 158 | 162 | 165 | 168 | 171 | 174 | 177 | 40 |
17 RECOVERY METHODS
The Maracás vanadium recovery plant was commissioned in 2014 and achieved its nameplate capacity in 2018. In 2019, an expansion project was implemented increasing the process capacity to 1,900,000 t/year of ROM and the V2O5 production capacity to 12,000 t/year. In 2020, 11,825 t of V2O5 was produced with 81,5% of overall recovery. In 2021, improvements in the roasting/burning system increased the production capacity to 13,200 t/year V2O5 At the time of writing this report, the plant produces up to 1,087 t of V2O5 equivalent per month with a trend approaching design capacity of 13,200 per year.
The current process flow sheet comprises three stages of crushing, one stage of grinding, two stages of magnetic separation, magnetic concentrate roasting, vanadium leaching, ammonium meta-vanadate (AMV) precipitation, AMV filtration, AMV calcining, and fusing V2O5 into flakes or screening V2O5 to produce powder, both as final products.
In order to enter the battery market and increase Largo's market share in high purity sectors, Maracás Vanadium plant is commissioning a new reactor that transforms AMV into V2O3 as final product. This project should be concluded at the end of 2021. At that time Largo will be able to produce 5,000 tonnes of V2O3/year (5,760 tonnes of V2O5 equivalent). This will not increase the total plant capacity, which will stay at 13,200 tons of V2O5 equivalent per year.
Largo expects to increase V2O5 production in 2032 through the expansion of Maracás plant. The construction of the expansion project is scheduled to begin in 2028 and, when complete, will increase the production capacity from 13,200 t/year to 16,000 t/year in 2032 and coincide with mining expansion at the GAN and NAN deposits. In 2023, an ilmenite production plant will be implemented at Maracás to treat non-magnetic concentrate material generated from the wet magnetic separation process to produce an ilmenite concentrate. The ilmenite plant will be able to produce 145,000 t of concentrate per year, that represents 60,000 t of TiO2 in the same period.
Largo anticipates developing a titanium pigment project in Camaçari city (in Bahia state) between 2021 to 2024, with an initial capability to produce 30,000 t/year of TiO2 pigment as main product and 20,000 t/year of ammonium sulfate and 14,500 t/year of sodium carbonate as co-products.
17.1 Process Description
A simplified process flow diagram to produce vanadium pentoxide is presented in Figure 17.1, a simplified mass balance is presented in Figure 17.1 and a summary of key process design criteria are shown in Table 17-1.
Table 17-1: Summary of Key Process Design Criteria.
Criterion | Units | 2020 Production | 2022 - 2031 | 2033 onwards |
Average Ore Processing rate | t/a | 1,296,084 | 1,632,808 | 4,809,218 |
V2O5 Production | t/a | 11,825 | 13,293 | 15,610 |
Average V2O5 effective grade | % | 1,07 | 0,98 | 0,47 |
Plant availability | % | 87% | 87% | 87% |
Plant Operating hours | h/y | 7,500 | 7,500 | 7,500 |
Average plant daily ore throughput | t/d | 3,551 | 4,473 | 13,176 |
Number of crushing stages | # | 3 | 3 | 3 |
Crusher product size (80% passing) | mm | 10 | 10 | 10 |
Number of grinding stages | # | 2 | 2 | 2 |
Grind product size (80% passing) | µm | 106 | 106 | 106 |
Magnetic Product solids yield | % | 32 | 29 | 20 |
Average magnetic concentrate V2O5 grade | % | 3,28 | 3,09 | 2,18 |
Roasting reaction zone residence time | h | 1 | 1 | 1 |
Leach retention time | h | 2 | 2 | 2 |
Average roasting/leach V2O5 conversion | % | 89,7 | 88,2 | 76,0 |
Chemical plant V2O5 recovery | % | 96,3 | 97,6 | 97,3 |
Total average recovery to V2O5 | % | 81,5 | 80,5 | 68,1 |
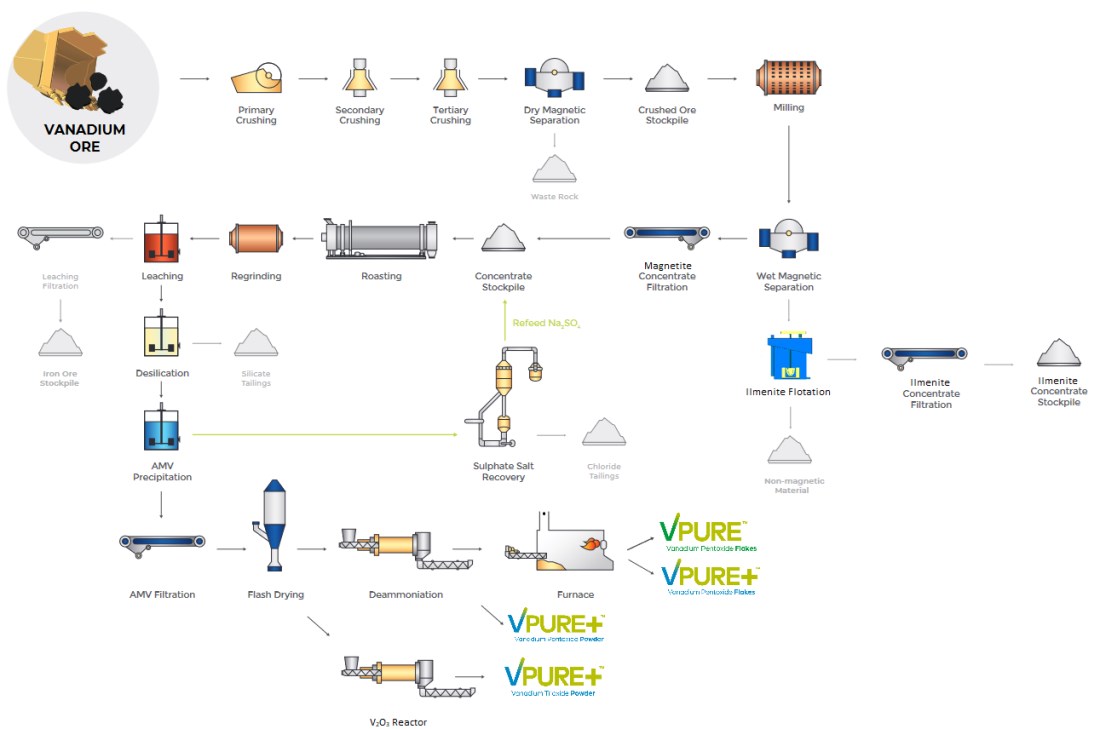
Figure 17.1 Conceptual Process Flow Sheet - Vanadium Pentoxide
17.2 Crushing
The ore is crushed via a three-stage crushing circuit comprised of a primary jaw crusher, two cone crushers and two vibrating sizing screens. The fine crushed product is fed to dry-magnetic separator. The magnetic material is disposed in a 4,200-m³-capacity stockpile from which it is withdrawn at a controlled rate to feed the grinding circuit.
17.3 Dry Magnetic Separation
The vanadium is contained within the magnetite fraction of the resource. Magnetite is recovered by using low intensity magnetic separator (LIMS) of 1,500 Gauss. There are two roll magnetic separator Imbras of 36"x120" with 150t/h of capacity each. The separation is done in the unique step (the separators are in parallel) where the pre magnetic concentrate is blended with the massive ore (magnetite) and sent to the grinding circuit.
17.4 Milling
The dry magnetic separation product is sent to the stockpile to feed the grinding circuit. The objective is to feed the mill with a magnetic grade of 42%.
This step of processing uses two ball mills in series. Both mills are similar, with the dimensions of 13x26' and 2.275 KWh (3.000 HP). The primary mill is fed with dry material and water and operate in a conventional closed circuit with a hydrocyclone battery (primary battery), which has six hydrocyclones Krebs GMax 20 (three operating and three in standby). The secondary mill operates in a undirect closed circuit with the secondary hydrocyclone battery, that means it is fed with the underflow of the secondary hydrocyclone battery, which has ten hydrocyclones Krebs GMax 20 (six operating and four in standby).
The primary mill works with maximum ball size of 80 mm (Magoteaux), and a consumption of 250 g/t, and the secondary mill with maximum ball size of 60 mm (Magoteaux), and a consumption of 200 g/t. The product of this process is a P80 with 106 mµ.
This milled material is fed in the low intensity magnetic separation (LIMS) circuit, with 1 (one) rougher and 2 (two) cleaner stages. There are 4 (four) wet magnetic separators from Inbras Eriez, WD 48x125".
17.5 Magnetite Concentrate Filtering
The final magnetic concentrate is filtered in a Westech filter of 20 m2. The filtered concentrate is disposed in a stockpile to be fed in the roasting section of the plant. The non-magnetic concentrate fraction from the beneficiation plant is thickened and pumped to the non-magnetic tailings pond. After the Phase 1 of expansion, this non-magnetic concentrate will be pumped to the ilmenite flotation plant.
17.6 Ilmenite Flotation
The non-magnetic concentrate, generated at the wet magnetic concentrator from milling plant is pumped to a battery of desliming hidrociclones, which separates the slimes from the coarse particles. The slime material is sent to the tailing pond and the coarse particles is sent to a flotation circuit with 6 rougher cells, 1 cleaner cell and 1 recleaner cell. The flotation generates an ilmenite concentrate and tailings that are pumped to the final tailings pond.
17.7 Ilmenite Concentrate Filtering
The final ilmenite concentrate is filtered in a horizontal filter. The filtered concentrate with 10% moisture is collected in a stockpile to be analyzed, conditioned, and shipped in trucks. The ilmenite concentrate can be sold or used in the future Largo TiO2 pigment plant in to be established in Camaçari.
17.8 Roasting (Kiln)
The filtered magnetic concentrate, containing approximately 3% V2O5, is roasted at high temperature (+1,100 °C) in a rotary kiln (FLSmidth) with diameter of 4,2 m and length of 90 m with rotation rate of 1 rpm. The kiln capacity is 88 t/h. Sodium carbonate (Na2CO3) is added to the magnetic concentrate at the beginning of the kiln at a rate of 65 kg/t of concentrate. This material is roasted until the temperature mentioned previously (1.100 ºC) where magnetite (Fe3O4) is oxided to hematite (Fe2O3), losing the magnetic characteristic after 3 hours of roasting. The vanadium is extract from magnetite structure in the sodium vanadate. The consumption of HFO+Diesel at the kiln is 34 kg/t of concentrate.
An off-gas control system with capacity of 13t/h will collect any dust entrained in the gas from the roaster. To meet local environmental regulation, an electrostatic precipitator is installed to remove such particulates.
The calcined material temperature is reduced in a rotary cooler (FLSmidth) with diameter of 4m and length of 34 m with rotation rate of 2 rpm achieving 400°C. The calcined material has sodium vanadate that can be leached in hot water.
17.9 Leaching
The calcined material is ground in a ball mill (FLSmith) to liberate the sodium vanadate contained. The ground calcined material is then leached for one hour and twenty minutes in each of the two agitated tanks installed in series of 120 m3 of capacity.
The leach discharge is sent to thickner (Westech) with 14m of diameter and then filtered and washed using a vacuum belt filter. The solution containing approximately 110 g/L V2O5 is pumped to chemical plant for de-silication stage and it is called dirty preg solution.
The solids retained on the filter cloth forms a cake with 10% of moisture, 60% Fe, 2.9% SiO2 and 6.8% TiO2 which is stockpiled in a pond at the mine site.
Largo hopes to be able to sell the "cake" from leach stage at some point in the future, notwithstanding that product has a high TiO2 grade and a low Fe grade. It may be possible to blend it with richer magnetite concentrate, which can be found in the region, to create a saleable product.
The desilication is achieved using 398 kg/t of H2SO4 to reduce the pH from 11 to 8 in three in line agitated tanks, with 111 kg/t of aluminum sulphate and sulphuric acid. Follow the chemical reaction in this process:
3Na2O.2SiO2 +2NaOH + Al2 (SO4)3 → Na2O.Al2O3.6SiO2 + 3Na2SO4 + H2O
After desilication, the solution is pumped to a filter (Andritz, 1200 x 200) with 72 plaques with 16,7 m3/h where the solids are removed and sent to disposal along with the effluent tailings from the evaporator/precipitation. The filtrate, called as pregnant leach solution (PLS), is pumped to the precipitation stage.
17.10 Precipitation
The dirty preg solution is pumped (17 m3/h) to a heat exchanger to reduce the temperature lower than 40º. This solution goes to another series of agitated tanks (75 m3), where the vanadium is precipitated as ammonium meta-vanadate (AMV), with the addition of ammonium sulphate after 6 hours of residence.
The reaction is showed below:
2NaVO3 + (NH4)2SO4 = 2NH4VO3 + Na2SO4
The precipitate is filtered, washed, and fed to a dryer prior to being calcined to produce V2O5 powder. The barren solution, which contains sodium and ammonium sulphate salts, is treated to recover ammonium sulphate, which is recycled to precipitation, and sodium sulphate part of which is recycled to the roasting stage.
17.11 Evaporation
A crystallization circuit has been designed to recover sodium sulphate salt, ammonium sulphate solution and water from the barren leach liquor
The barren liquor, which contains ammonium sulphate, sodium sulphate plus small amounts of dissolved AMV and impurities, is first concentrated by evaporation to a predetermined ammonium sulphate concentration.
As this solution approaches a concentration of 250 g/L of Na2SO4, the salt will start to precipitate. The pulp, with 20% of solid, is pumped to a cyclone where the underflow feed a centrifuged. This centrifugal produce salt sulfate solid with 5% of moisture. The overflow material (ammonium sulphate) is sent back to precipitation stage and a portion of this slurry is purged to a sealed purged dam as a mean of controlling chlorides build up in the circuit.
17.12 AMV Drying
Wet AMV (15%) solids are dried in a flash dryer (Drytech) with capacity of 6t/h of air. The dried AMV is calcined under oxidizing conditions to produce V2O5 and then melted and cast into flakes for sale.
17.13 Ammonia Removal
This process is done in the electric kiln, a Drytech with capacity of 1.5 t/h, at oxided conditions at temperature of 600ºC.
The exhausted system permit that the air pass through the kiln that promote the reaction below:
2NH4VO3 → V2O5 + 2NH3
The ammonium divides into N2 and H2, but, because of oxidized conditions the H2 is converted to H2O before the V2O5 could be reduced, based on this reaction below:
2NH3 → N2 + 3H2
2H2 + O2 → 2H2O
In the Ammonia Removal reactor, a V2O5 powder is produced. This powder can be sent to the melting stage (producing V2O5 fused flakes), or to the screening stage (producing V2O5 powder).
17.14 Melting
The V2O5 produced at Ammonia Removal reactor is transported to a fusion furnace that melts the V2O5 powder at 900ºC to produce the final flake product. The fused material is fed in the flocculating table (Drytech) at a capacity of 1.5t/h.
The flakes are crushed and stored in a silo as a final product. This product is packed in large bags (1 tonne) or drums (250 kg) and shipped.
17.15 V2O5 Screening
The V2O5 produced at Ammonia Removal reactor is transported to a vibrating screen to remove all the coarse particles. The screen undersize is sent to a package system to be shipped in bags or drums and the oversize returns to the melting stage.
17.16 V2O3 Reactor
After the start-up of V2O3 plant, the wet AMV from precipitation belt filter will be divided in two flows, one will be sent to the current flash dryer and other to the new V2O3 reaction plant, which includes a flash dryer and a rotary kiln.
The V2O3 reaction plant transforms AMV into V2O3. This process will be done in a kiln with capacity of 942 kg of AMV per hour, at reduced conditions at temperature of 800ºC, which promotes the reaction below:
6NH4VO3 → 3V2O3 + 9H2O + 3N2 + 2H3
Inside the reactor a V2O3 power is produced. This powder is packed in large bags (1 tonne) or drums (200 kg) and shipped
17.17 Titanium Pigment Processes
Largo intends to implement two new processes in Camaçari industrial complex, one to produce TiO2 and other to produce. This process is the well-known TiO2 pigment sulfate process, that uses sulfuric acid to attack the ilmenite in order transforming the oxides into sulphates to solubilize them and produces TiO2 after steps of hydrolysis and calcination. An acid regeneration plant will be implemented to have zero effluent emission of acid solution, reduce the sulfuric acid consumption, produce a valuable iron product and a fertilizer with ammonium.
The TiO2 production process can be divided in 9 steps: Ore storage; Drying and milling; Digestion and black liquor filtration; FeSO4 crystallization; Hydrolysis; Calcination; Surface treatment; Micronization and Shipment and Acid regeneration.
17.17.1 Ore storage
The TiO2 pigment plant will receive the ilmenite concentrate from Maracás plant and process it in several stages. The ilmenite with more than 42% of TiO2 will be storage in a shed to be fed in the rotary dryer, that will reduce the moisture from 10% to 0%.
17.17.2 Drying and milling
The ilmenite will be transported to rotary dryer that will burn natural gas to dry the concentrate and storage it in bins. The dried concentrate will be fed a ball or vertical mill, to reduce the particle size distribution. The milled concentrate will be storage in bins.
17.17.3 Digestion and black liquor filtration
The milled concentrate will be subjected to a digestion step with sulfuric acid. During this reaction, the metal oxides, which are contained in the ore, are transformed to metal sulphates. The resulting solids are mixed with diluted acid to form a slurry, the so-called "black liquor" (Metal-SOx) which is fed to filtration and crystallization. Resulting off-gas is treated before release to atmosphere.
The solids in the raw black liquor, which are mainly unreacted oxides, are separated by filtration and sedimentation. The filtrated black liquor will be pumped into a crystallization system.
17.17.4 FeSO4 crystallization
The filtrated black liquor will be pumped into a crystallization system where the containing FeSO4 is removed as copperas (FeSO4.7H2O) which can be reacted with ammonia solution to produce iron valuable by-products and ammonium sulfate, which will be sold for fertilizing market.
The resulting pure black liquor will feed the hydrolysis unit.
17.17.5 Hydrolysis
Hydrolysis is the step that aims to orient the crystals towards a given crystallographic form through the addition of a seed. The latter initiates the precipitation of titanium oxide and promotes the efficiency of hydrolysis.
The seed is made by neutralizing titanium sulfate:
Ti(SO4)2 + 4 NaOH → TiO2 + 2 Na2SO4 + 2H2O
The seed is introduced into the hydrolyser, then the temperature is increased to about 107 ° C.
TiOSO4 + 2H2O → TiO2 + H2SO4
The titanium oxide that precipitates will have a large specific surface area, so it absorbs water and acid which forms titanium hydroxide. The titanium hydroxide is cooled and filtered. The filtrate, consisting of diluted sulfuric acid, is partially recycled on the attack, in the Black Part. The titanium hydroxide is filtered and washed to remove unwanted components (e.g. Vanadium (V)).
17.17.6 Calcination
The filtrated titanium hydroxide is sent to the calciner kiln with rutile seeds and rutilization promoter additives. In the calciner, operated at 900-1,000ºC the titanium hydroxide is decomposed in TiO2 rutile and releasing water steam. The resulting off-gas is treated to remove fine particulates (TiO2) and other contaminants before release to atmosphere.
The TiO2 discharged of the calciner is sent to surface treatment area, also called, post treatment unit.
17.17.7 Surface treatment
The base rutile TiO2 from calciner discharge is neutralized, wet milled and fed to the wet surface treatment. In this unit, the pigment surface is improved by precipitation of inorganic hydroxides/oxides on to the pigment surface to reach the desired product quality. The resulting material is washed, filtrated and finally dried.
17.17.8 Micronization and Shipment
Final product is attained by micronization using high-pressure steam. Final pigment product is packed, stored, and sold.
17.17.9 Acid regeneration
The remaining filtrate solution from hydrolysis, also called waste acid, containing low concentration of sulfuric acid, is pumped to the regeneration unit. Using evaporation and filtration, the concentration of the waste acid is increased to a level that can be recycled to ilmenite digestion.
18 PROJECT INFRASTRUCTURE
The infrastructure requirements for the Project are summarized in the following sections and are incorporated in the capital cost estimate for the Project.
18.1 Water pumping System
The raw water used in Maracás plant is pumped from Rio de Contas, specifically from the lake formed by the Pedra Dam of Porto Alegre village, in Maracás, Bahia, Brazil.
A 35 km pipeline connects the intake with two concrete tanks with a capacity of 1,000 m3 each, installed on the Maracás site. This volume guarantees the plants operation for up to 20 hours, in case of intake / pipeline failure. The pumping system is composed of three pumping stations and two transition stations. Each pumping station has two pumps, one operational and one standby, to guarantee 100% availability. The nominal capacity of the pumping system is 190 m3/h. The average amount of raw water collected is 60,030 m3/month (January to October 2021). Of the total raw water abstracted, 868 m3/month is made available to the water treatment plant in Água Branca village (a community through which the aqueduct passes), 6,461 m3/month for the operation of the mine and 52,701 m3/month are treated, being distributed for the treatment of ore and service water for human use.
18.2 Process Water
The water pumped from the Rio de Contas is used primarily by the processing plant at the mine. Currently, the plant recovers water from the reclamation circuit and reuses it. The thickeners are sized to contain the reclaimed water. A water demineralizing unit and a cooling tower have been installed to treat the water for equipment cooling.
The water taken from Rio de Contas is stored in two concrete tanks with a total volume of 2000 m³. The raw water tanks contain enough water for 20 hours of plant operation. These tanks will also contain a permanent water reserve of 240 m³ for firefighting purposes, which is in accordance with the laws of Bahia State and the National Fire Protection Association. The water reserve is enough for 2 hours of firefighting.
18.3 Water Treatment
Raw water is transferred from the concrete tanks by gravity to the water treatment plant, located in the industrial area. The water treatment plant has a nominal capacity of 90 m3/h. The water is clarified, sterilized with sodium hypochlorite, stored in the treated water tank with a useful volume of 800 m3. Treated water is distributed to the following systems:
- 46,575 m3/month for the ore treatment plant;
- 1,544 m3/month for potabilization (human use - not used for watering);
- 4,582 m3/month for reverse osmosis and WTP operation.
The ore treatment plant has a steel tank, with a designed volume of 360 m³, to storage the water. This tank will store the water recovered from the thickeners and tailings ponds. Almost all of the water used in the industrial process is recovered from the tailing's ponds. Collected water represents the amount needed to replace the losses inherent in the process (evaporation, moisture retention in the tailings). In case make-up water is needed, it will be supplied from a centrifugal pump installed at the treated water tank.
The potable water is storage in a steel tank, with a volume of 220 m³, sufficient for 24 hours of consumption.
Half of the treated water tank (400 m3) is a strategic reserve for fire fighting. If there is an additional need for fire fighting, it is possible to have raw water at a rate of 100 m3/h, and the entire reserve of 2,000 m3 of raw water can be used or more, if the pipeline is available for operation.
18.4 Sewage Treatment
The site has a compact sewage treatment plant with a nominal capacity of 80 m3/day. The treated effluent from this treatment is destined for a waterproof reservoir that also receives rainwater from the ore treatment plant. All this water is pumped into the leaching process from the calcined tailings piles, reintegrating into the process. In total, 1,544 m3/month are treated.
18.5 Fuel and Lubricant Storage and Distribution
Diesel oil is delivered by the distributor at the unit by tanker trucks and stored in two tanks with a capacity of 30,000 liters each Mobile vehicles and convoy trucks are refueled to supply equipment in the mining fronts and auxiliary equipment of the processing plant.
To supply the kiln, the OCP200 and/or OC2B fuel oil is stored in a tank with a storage capacity of 100,000 liters, from which the fuel is transferred to an auxiliary tank that feeds the kiln.
Lubricants are delivered to the site in drums that are stored in a safe area in accordance with state regulations. Lubricants are distributed through the convoy truck and/or distribution lines at maintenance workshops.
18.6 Compressed Air
Four screw compressors supply high pressure air to instruments, general plant and tanks. A refrigerant air dryer and filters are provided to ensure the instrument air is of good quality. Compressors are properly stored in a compressor building.
18.6.1 Air Emissions and Air Quality Monitoring
The air monitoring system provides information on which air emissions management strategies are developed. The project has five air quality monitoring stations installed. These stations monitor on monthly basis, 24 hours a point, the levels of SOx, NOx, NH3, V, V2O5, particulate matter and PM-10. Together with these air quality stations, monitoring of SOx, NOx, NH3, V, V2O5 and particulate matter in the chimneys in operation is carried out, ensuring that emissions remain within the limits allowed by current environmental legislation.
18.7 Heating
A complete system, consisting of two fire tube boilers, with a capacity of 5,200 kg/h, at an operational gauge of 10 kgf/cm² and temperature of 180ºC (saturated steam), burners operating with fuel oil, fuel oil storage tank, day tank, heat exchangers for heating the fuel oil, and all the necessary devices for safe and reliable operation, are in place.
18.8 Power Supply
The electrical power requirements for the plant, including the beneficiation, hydrometallurgy and installed utilities are approximately of 12 MVA. In order to fulfill this demand, power is supplied at 138 kV, 60 Hz, by an 85 km long transmission line from Coelba's Ibicoara regional Substation. A step-down substation of 13.8 kV is installed at the plant site. Two power transformers of 13.8 kV 15 / 15 MVA each are installed.
The 13.8-kV power distribution system for the plant is supplied by means of insulated cables or conventional aerial cable system. Substations are designed to meet the requirements of the concentrator, hydrometallurgy plant, crushing and supporting areas.
The power required at the water pumping intake at Rio de Contas is supplied by a substation at 13.8 kV.
All electrical distribution is achieved via cable trays using armored interlocked PVC coated cables. The process and plant site ancillary facilities switchgear and electrical equipment is installed in modular electrical rooms adjacent to, or within, their respective buildings.
The current situation, for all equipment the sum total installed power is 21,308 CV (approximately of 12 MVA). After the ilmenite plant installation, the installed power will be increased to 28,000 CV. Power demands are expected to almost triple after the expansion in 2033. The Table 18-1 below shown the summary of this sceneries.
Table 18-1: List of Equipment.
Unit | Equipment | Power (CV) |
Current | With
Flotation | After 2033 |
Crushing | Main equipment | Primary crusher line 1 | 150 | 150 | 600 |
Primary crusher line 2 | 150 | 150 | 600 |
Secondary crusher line 1 | 350 | 350 | 1.400 |
Secondary crusher line 2 | 300 | 300 | 1.200 |
Tertiary crusher line 1 | 400 | 400 | 1.600 |
Other equipment | 778 | 778 | 3.113 |
Crushing total | 2.128 | 2.128 | 8.513 |
Milling | Main equipment | Primary Mill | 3.200 | 3.200 | 9.600 |
Secondary Mill | 3.200 | 3.200 | 9.600 |
Vaccum pump A | 250 | 250 | 750 |
Vaccum pump B | 300 | 300 | 900 |
Hydrociclone pump A of line 1 | 400 | 400 | 1.200 |
Hydrociclone pump A of line 1 | 400 | 400 | 1.200 |
Hydrociclone pump B of line 2 | 350 | 350 | 1.050 |
Hydrociclone pump B of line 2 | 350 | 350 | 1.050 |
Other equipment | 1.763 | 1.763 | 5.288 |
Milling total | 10.213 | 10.213 | 30.638 |
Flotation | Main equipment | Pump A of desliming 001 | 0 | 550 | 1.650 |
Pump B of desliming 001 | 0 | 550 | 1.650 |
Pump A of desliming 101 | 0 | 550 | 1.650 |
Pump B of desliming 101 | 0 | 550 | 1.650 |
Pump A of desliming 002 | 0 | 261 | 783 |
Pump B of desliming 002 | 0 | 261 | 783 |
Pump A of desliming 003 | 0 | 212 | 636 |
Pump B of desliming 003 | 0 | 212 | 636 |
Other equipment | 0 | 4.017 | 12.051 |
Flotation total | 0 | 7.163 | 21.489 |
Roasting | Main equipment | Main Engine 1 | 272 | 272 | 544 |
Main Engine 2 | 272 | 272 | 544 |
Main Engine 3 | 408 | 408 | 816 |
Main Engine 4 | 408 | 408 | 816 |
Other equipment | 985 | 985 | 1.970 |
Roasting total | 2.344 | 2.344 | 4.689 |
Leaching | Main equipment | Vaccum pump of 1° filter | 350 | 350 | 700 |
Vaccum pump of 3° filter | 400 | 400 | 800 |
Regriding mill | 473 | 473 | 945 |
Other equipment | 1.159 | 1.159 | 2.318 |
Liaching total | 2.382 | 2.382 | 4.763 |
Chemical plant | Main equipment | Engine 1 of evaporation MVR | 581 | 581 | 1.161 |
Engine 2 of evaporation MVR | 581 | 581 | 1.161 |
MVR of preevaporation | 178 | 178 | 356 |
Other equipment | 2.199 | 2.199 | 4.398 |
Chemical plant total | 3.538 | 3.538 | 7.076 |
Utililities and laboratory | 703 | 703 | 1.406 |
| | Total plant | 21.308 | 28.471 | 78.575 |
18.9 Buildings
The construction and architecture of the Maracás plant buildings takes into account the climatic characteristics, environmental comfort, ergonomics, durability, standards and codes suitable for a Project of this size.
All buildings are constructed with pillars of reinforced concrete, beams and slabs with concrete block masonry walls with a layer of mortar and paint finishing, ceramic or vinyl flooring and metallic cover. The buildings of Maracás plant are:
- Main entrance;
- Administrative building;
- Refectory;
- Living area and changing room;
- Workshops;
- Electrical rooms;
- Warehouses;
- Laboratory and control room.
The main entrance, located in east of the plant, is a one-floor mansory building, that contains the nursery, equipped for "first aid", the entrance gate, the waiting room, and the room for the property security team.
The administrative building is made of masonry and consists of one floor and contains specific areas for Mining Engineering, Geology, Administrative, Industrial Maintenance, Occupational Safety, Environment, Production Process Control and Operational Directorate.
A general layout of the of the plant facility and office buildings etc. is shown in Figure 18.1 and Figure 18.2.
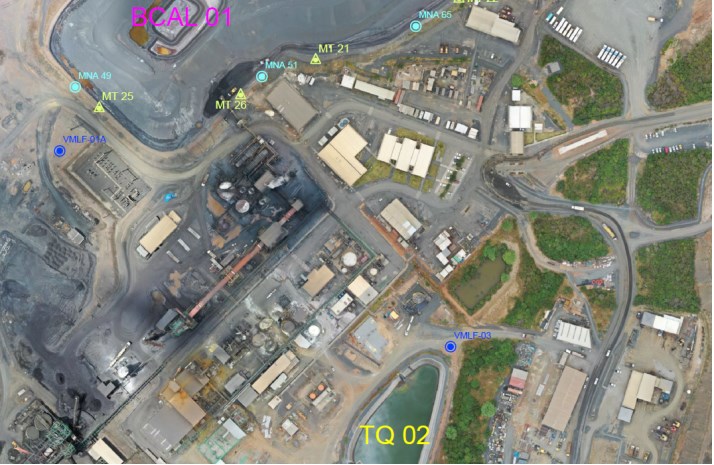
Figure 18.1: General Layout - Plant Facility and Office Buildings.
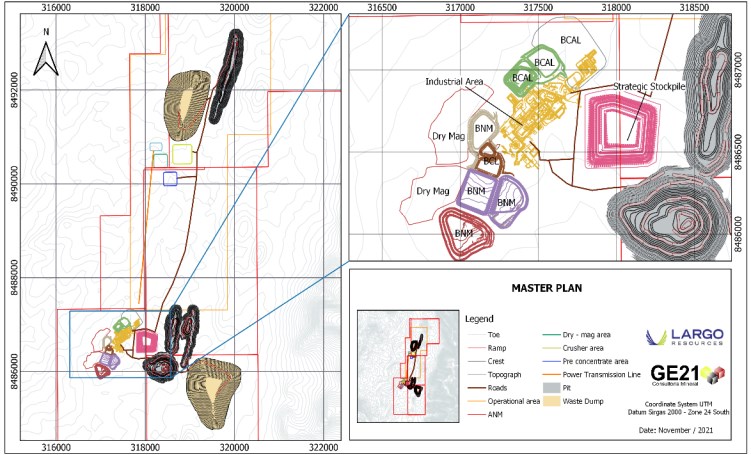
Figure 18.2: Plant Site Layout.
18.10 Assay Laboratory
A fully equipped assay laboratory is located at the plant site. The laboratory delivers daily analysis of mining and process samples. The laboratory is a single storey structure located next to the utility area in the plant area.
18.11 Miscellaneous Buildings
A main gatehouse is located at the entrance of the plant site. This building is a single-story cinder block structure. A first aid post, equipped for "first response", is located inside the administration building
18.12 Explosives Magazine
The project has two storage warehouses, one for explosives and accessories and the other for ammonium nitrate emulsion. Both occupy an area of 31,760 m² with storage capacity for:
- Cartridge Emulsion - 10,000 kg;
- Starter Accessories - 30,000 units;
- Detonating cord -18,000 m;
- Base Emulsion - 150,000 kg;
- Booster (Booster) - 3,750 kg.
The safe distances adopted (based on R-105) for sizing the magazines indicate that the distance from the explosives magazine to the emulsion storage area and the accessories magazine to the emulsion storage area will be 150 meters in both cases.
For access to the storage area, for stock management and loading of products for use in the mine operation, two independent roads are used.
18.13 Communications
The Maracás facility is connected to the public communication system through telephone and internet services. Internal communication is carried out by portable and fixed short-frequency radios in all vehicles and equipment. They are also available for plant operators, industrial maintenance, mine operation, occupational safety, property security, environment and occupational medicine.
A wireless network is in operation for use by the mine dispatcher and onboard fleet management system devices.
18.14 Roads
Access to the area, departing from Salvador, capital of Bahia state in Brazil, is via the BR 324 road to Feira de Santana, a distance of 110 km, then by the BR 116 to the junction 20 km after the Municipality of Milagres, a distance of 140 km. From the turn off, a driver follows BA 026 highway to Maracás and past the village of Pé-de-Serra, a distance of 125 km, from this point the driver follows a gravel road for 20.0 km to the mine facility. The total distance is 415 km.
The on-site roads, that provide access for people, vehicles and equipment in the mine's operational area are constructed in accordance the standards established in the NRM, Mining Regulatory Standards, and are included in the mine's internal traffic plan. As for access between industrial and administrative areas, they are paved and signposted in accordance with internal safety regulations.
Some studies have been developed for improvements to the existing public county road, which has a length of about 42 km, between the BA-026 crossing the Maracás Menchen Project area and the village of Porto Alegre. Largo has been engaged in discussions with the Bahia State transportation agency which is considering paving the existing dirt road in partnership with Largo. Negotiations on this issue have not been concluded. However, the current road is being upgraded with minor improvements needed to ensure timely and efficient transportation of goods, supplies and workers.
18.15 Tailings Facility
Three types of tailings are produced and stored in the following facilities:
- Leached Calcine Tailings Dump (potentially saleable as an iron ore by product);
- Chloride Purge Tailings Pond;
- Non-Magnetic Tailings Dump.
The leached calcine tailings are constructed using a "dry stacking" impounding approach and the Chloride Purge and Non-Magnetic facilities are constructed as ponds.
All tailings facility characteristics and designs included in this report relate to the previous production scenario as laid out in the Technical Report "Preliminary Economic Assessment of the Maracás Vanadium Project, 1.4 Million Tonnes per Year Processing Plant", issued March 04, 2013.
The same tailings management strategies will be employed for this production scenario to accommodate required tailings storage for life of the Project, including production from the Campbell Pit and all satellite pits Novo Amparo Norte (NAN) and Gulçari A Norte (GAN).
18.15.1 Tailings Disposal Ponds
The tailings generated by the beneficiation process and the vanadium ore processing plant derive from the following process areas:
- Leached calcine from the processing of kiln discharge;
- Filter cake from the de-silication process;
- Chloride control purge from the evaporation circuit;
- Primary non-magnetic tailings from magnetic separation.
The Leached Calcine Tailings are discharged into the Leached Calcine Tailings Stack. A new stack will be constructed to meet future needs the tailings from the leach operation is an iron ore concentrate and the company is entertaining selling it as a by-product once material impounded is suitable from the environmental perspective. Currently the stacked material is being rinsed with water to recover soluble vanadium back to the processing plant.
The chloride control purge tailings from the evaporation circuit are deposited in the Chloride Purge Tailing Pond together with the cake from the de-silication plant. The original Chloride Purge Tailings Pond is currently full and a new tailings pond has been constructed and fully licensed and is in operation.
The Non-Magnetic Tailings Ponds Figure 18.3 have been designed to receive the primary non-magnetic tailings originated from the magnetic separation after thickening.
All ponds have similar structures to contain the tailings. These structures are formed by rock-fill structure and sealed by compacted clay and liners on the bottom and side walls. The construction method can be summarized by:
- The deposits have high-width dams, built with waste material from the pit. Due to the availability of space and operational conveniences, these dams constitute a "controlled waste dump";
- The disposal of the tailings is carried out in waterproof tailings facilities;
- In accordance with Standard NBR 10.157/87, tailings facility must be a minimum distance of 200.0 m from the watercourses, and the bottom must be at least 1.5 m from the maximum level of the water table;
- The construction materials come from mining operations, and all operating procedures follow the same construction technique adopted for deposits already implemented;
- The waterproofing system is specific for each type of tailings stored; the definition of the type of waterproofing material is based on the physical and chemical characteristics of the tailings.
- If any leakage occurs, the leachate is collected in the detection channels and pumped back into the respective deposit, thus preventing any possibility of contamination of the land;
- The release of the tailings to the Non-Magnetic and Chloride tailings deposits is done through hydraulic pumping, with the excess supernatant being returned to the processing plant; the calcined tailings are placed in piles;
- Due to the characteristics of the tailings, the basins are built to be watertight and with no prediction of spillage of deposited liquid material, with the surface defined for a free edge of 1 meter.
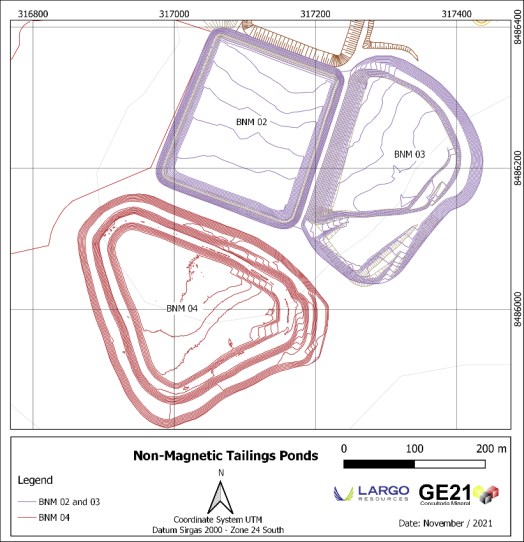
Figure 18.3: Non-magnectic Talling Ponds.
18.16 Waste Management
Solid waste generated from the mine plant site, including ancillary buildings, is primarily domestic and industrial non-hazardous waste. A comprehensive Waste Management Plan is in place at the mine site. Solid waste includes:
- Rejects from construction (scrap wood, metal, concrete, etc.);
- Rejects from the mine (empty drums, packing materials, etc.);
- General domestic garbage from the offices and ancillary buildings (paper, refuse, food, etc.).
Construction debris, inert waste and used tires are placed in designated cells and proper disposal procedures of the material is in place. Domestic and industrial solid waste from the mine plant facilities are recycled and re-used in a proper manner, where applicable.
The actions related to the management of solid waste generated in the enterprise, covering aspects related to the characterization, classification, segregation, handling, packaging, identification, temporary storage, transport, treatment and final destination of the waste are:
- Description: The solid waste generated is identified at the generation points, being classified in accordance with ABNT Standard nº 10004:2004:
- Class I Waste: Hazardous - They are those that are dangerous due to their physical, chemical or contagious infectious properties, which may present risks to public health and the environment;
- Class II-A Waste: Noninert - They are those that do not fit the classification of Class I or Class II B waste. Class II A - Non-inert waste may have properties such as: biodegradability, combustibility or solubility in water. A residue is classified as Class II A - Non-Inert, when one or more parameters obtained for the Solubilized extract are above the maximum values allowed by Annex G of NBR 10004:2004;
- Class II-B Waste: Inert - They are those that submitted to the solubilization test, do not have any of its constituents solubilized at concentrations above the drinking water standards, with the exception of appearance, color, hardness, turbidity and flavor, as per annex G of the ABNT NBR 10.004:2004 standard.
- Segregation: The segregation of waste is done at the time of generation, considering its class in order to preserve its characteristics and enable its eventual reuse or recycling;
- Handling: To carry out the handling of solid waste during the complete management, it is necessary to use the following Personal Protective Equipment - PPE's: uniform (pants and long-sleeved shirt made of denim fabric); gloves; safety glasses; helmet; hearing protection; breath protection; leather boots; and, when necessary, protective clothing. In addition to the use of PPE to carry out activities in the operational area, the issuance of control and prevention documents is required, such as the Work Permit (PT) and Preliminary Task Analysis (APT);
- Packaging and Temporary Storage: Hazardous waste (Class I), inert and non-inert (Class II-A and II-B) are temporarily stored in the Waste Treatment Center (CTR) and organized in their respective bays;
- External transport: The collection of segregated waste is done according to its generation, and the collection takes place after identification and packaging by means of a specific vehicle. Waste destined for recyclers or landfill disposal can be sent directly from the generating source to the final destination or temporary storage. All collections of waste from the enterprise's health services are formally registered in a document entitled Collection Report and Cargo Manifest;
- Environmentally Appropriate Destination / Final Disposal: The choice of destination and/or final disposal of solid waste generated in the project is based on treatment technologies that consider the least environmental impact, in accordance with the applicable environmental legislation in force.
18.17 Future Developments
Beginning in 2022, several projects will be developed at the Maracás plant which will each require specific infrastructure. In this chapter, the Ilmenite production project, V2O5 production expansion project, the GAN and NAN pit developments and TiO2 project will be described.
These projects will be delivered in 4 phases:
- Phase 1 (2022-2023) is an ilmenite concentration plant (the "Ilmenite Plant") with a capacity to produce 150,000 tonnes of ilmenite concentrate per year at the mine site and a TiO2 pigment processing plant (the "Pigment Plant") with a capacity to produce 30,000 tonnes of TiO2 at a new site in Camaçari, Bahia, an industrial suburb of Salvador;
- In Phase 2 (2024-2025) the Pigment Plant will be expanded to a nameplate capacity of 60,000 tonnes of TiO2 pigment per year, The Company will also undertake an expansion of the vanadium trioxide (the "V2O3 Plant") plant in Maracás to double the Phase 1 capacity of 14 tonnes per day to 28 tonnes per day to support the Company's Vanadium Re-dox Flow Battery ("VRFB") deployment plans;
- Phase 3 (2026-2028) will consider a further expansion of the Company's Pigment Plant at Camaçari to a capacity of 120,000 tonnes of pigment production per year, concurrently the Company will expand the Ilmenite Plant in Maracás to a new average production rate of approximately 425,000 tonnes of ilmenite concentrate per year in support its Pigment Plant expansion;
- Phase 4 (2029-2032) will occur as the Campbell Pit is depleted in 2032 at which point the Company expects to begin mining and processing of its NAN and GAN deposits. In this stage the Company plans to invest in duplicate crushing, milling, kiln and leaching circuits, increasing the V2O5 production to 15,900 tonnes.
18.17.1 Ilmenite Concentration Plant ("Ilmenite Plant")
The Ilmenite Plant, with capacity to produce 150,000 tonnes of ilmenite concentrate in the Phase 1, will be constructed between the Calcined tailings Pond 1 and Chlorides Pond 3, inside the industrial area of Maracás plant. Figure 18.4 shows the location of the plant.
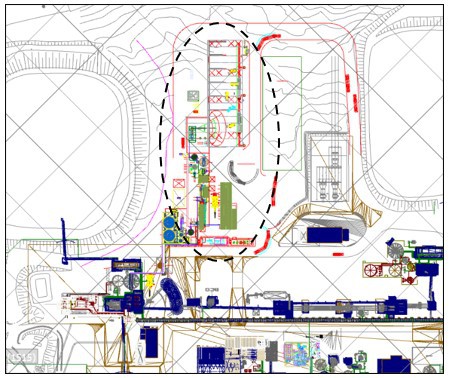
Figure 18.4: General arrangement of ilmenite plant Phase 1.
The operation of the Ilmenite Plant will require the installation of desliming, flotation and filtration equipment, an industrial shed to stockpile the ilmenite concentrate, a utility building, with compressors, blowers and electrical equipment, a building with a preparation laboratory, rooms and bathrooms. Figure 18.5 shows a 3D perspective of the flotation plant.
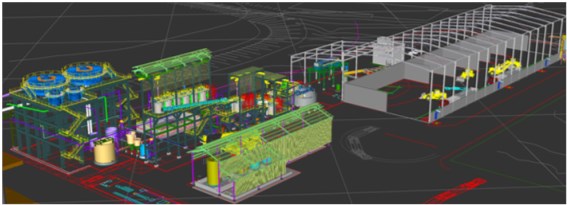
Figure 18.5: 3D model of ilmenite plant Phase 1.
The Ilmenite Plant will require the utilities presented in Table 18-2 below
Table 18-2: Ilmenite Concentration Plant Utilities.
Utility | Application |
Compressed air | - Filtration operation - Instruments - Service stations |
Service water | - Firefighting system - Insdustrial equipment |
Potable water | - Sample preparations lab - Field rooms - Field bathrooms |
Organic efluents | - Bathroom efluent |
Power | - Industrial equipment - Electrical tools - Lighting - Sample preparations lab - Field rooms - Field bathrooms |
The expansion of this plant in phases 2 and 3 will consider a similar infrastructure, but with additional equipment to meet the new design capacity.
18.17.1.1 Ilmenite Concentrate Transportation
The ilmenite produced at the Maracás flotation plant will be loaded into trucks and transported from the industrial shed in Maracás to two main destinations. The first one will be the future Largo's Pigment Plant located in Camaçari petrochemical complex, and the second site will be the Enseada Shipyard, when the concentrate is expected to be exported. In both cases, the initial route will be the same, leaving plant by the dirt road that connects the Pé de Serra village to the Porto Alegre village, then following the road BA-130 to Maracás and from there to Jaguaquara via the BA-250. From this point, the concentrate will proceed to the Enseada Shipyard by the BR-420 Figure 18.6 or to the Camaçari Petrochemical Complex by the BR-116, passing through Feira de Santana, and following the BR-324 and BA-524 Figure 18.7.
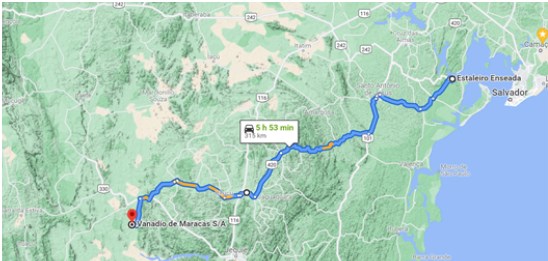
Figure 18.6: Road to Enseada.
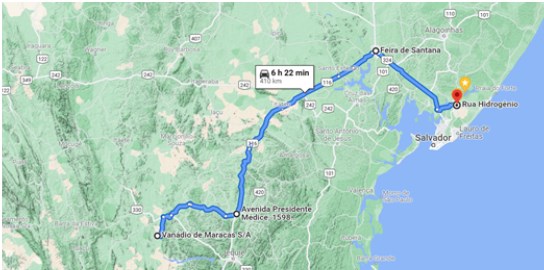
Figure 18.7: Road to Camaçari.
Unloading at the shipyard or at the Pigment Plant will be done in an area prepared for the storage of materials with a particle size of less than 1 mm.
18.17.2 Expansion Phase 4 - 15,900 t/year of V2O5
Beginning in 2029 with expected completion in 2032, an expansion project will increase the V2O5 production capacity of Maracás plant, from 13,200 t/year to 16,000 t/year. This expansion coincides with the depletion of the Campbell Pit and the expected mining of the GAN and NAN deposits. Due to lower magnetic concentrate grades at GAN and NAN, the project requires a significant increase in the infrastructure for mining and crushing and for the chemical plant. The Company expects the following expansions to current infrastructure:
- Doubling the capacity of the current crushing plant and dry magnetic separation equipment;
- Doubling of the capacity of the milling equipment and magnetic separation systems;
- Doubling the capacity of the roasting, leaching and chemical plants;
- Triple the power supply;
- Triple the capacity of utilities like water treatment, compressed air supply and steam;
- Duplicate the building structures.
It will also be necessary to increase the essential mining infrastructure for mineral exploitation at Gulçari A Norte (GAN) and Novo Amparo Norte (NAN).
As a fundamental part of the expansion project and in addition to the technical-economic considerations, environmental factors were also considered, such as the most suitable places for deposition of mine waste, low-grade stock piles and pre-concentrate stockpiles, tailings from dry magnetic separation, as well as for the installation of other infrastructures (accesses, electricity and water network), conveyor belts, crushing stations, yard and other support structures necessary for mining operations.
A suitable place is understood to be one that is strictly in line with legal, technical, economic, and environmental aspects.
18.17.2.1 Novo Amparo Norte (NAN)
Novo Amparo Norte will be mined by open pit methods and will occupy an estimated area of 240.0 ha. The pit is expected to reach a depth of 170.0 meters below surface. Service roads will be established that will serve as access for people, equipment, vehicles, and production flow to the main mine complex. The main road that will connect the NAN mine to the main mine complex will also be built considering the GAN deposit and its location within the overall project. This road is expected to extend for 6.5 km from the main mine complex and will occupying 36 ha.
A crushing plant and a dry magnetic separation circuit will be installed near to the pit to reduce the mass transported to the milling plant which will be located in the current site of Maracás plant. Only the pre-concentrate will be transported by truck to the milling plant,
The area where crushers (primary, secondary and tertiary), screening (primary and secondary), conveyor belt system (crushers, sieves and dry magnetic separator) and dry magnetic separator will be installed should occupy 17.5 ha, and the ore pad to feed the crushers will occupy approximately 8.6 ha.
The area of the pre-concentrated ore pile will be 8.5 ha in size and dry sorting tailings pile areas will occupy 30.5 ha.
Low grade ore, which will be stockpiled for later resumption to feed the plant. The low-grade ore stockpile area will occupy 11.0 ha. The waste stockpile from NAN will be stacked and the overall area will occupy 100.0 ha.
To keep all the structure running, an infrastructure with auxiliary building will be constructed, considering a building with rooms, bathrooms, a small officine and a substation that will feed the crushing system (crushers, sieves, dry magnetic separator) and the other facilities mentioned.
18.17.2.2 Novo Amparo Norte (NAN)
Gulçari A Norte will be mined by open pit methods and will occupy an estimated area of 333.0 ha and reach a vertical depth of 210.0 m below surface. Service roads will be established that will serve as access for people, equipment, vehicles, and production flow to the Complex. This road will connect GAN to the current mine complex and will extend for 3.5 km, occupying 57 ha.
As the GAN deposit is close to Campbell pit and current mine infrastructure ore will be processed at the existing infrastructure
18.17.3 TiO2 Pigment and Ammonium Sulfate Plants
The TiO2 pigment plant (Pigment Plant) and the ammonium sulfate plants (Ammonium Plant) will be constructed in industrial area of Camaçari city, at Bahia state as part of the Phase 1 expansion. The Pigment Plant is expected to produce 30,000 tonnes of TiO2 pigment per year beginning in 2024 and will be expanded in Phase 2 to 60,000 tonnes per year in 2024-2025 and to 120,000 tonnes per year in Phase 3 in 2026-2028.
The infrastructure will be detailed in 2022 and will consider a complete pigment production plant with administrative buildings, ilmenite and pigment sheds, warehouses and utility facilities. Figure 18.8 present the Pigment Plant layout.
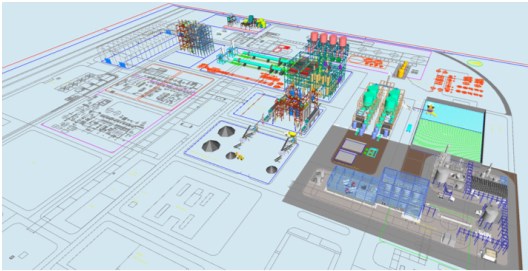
Figure 18.8: Preliminary 3D model of Largo's Camaçari plant.
The Camaçari industrial complex was chosen for the Pigment and Ammonium plants for several logistical, environmental and synergistic reasons. This location will minimize the environmental impact of the plant operation and provide synergies with other operators such as the availability of ammonia gas at the industrial complex that is required for the production of ammonium sulfate from the TiO2 pigment effluent.
18.17.4 Other Future Infrastructure
To continue the production process in the mining area, it will be necessary to expand and/or build new structures including additional stockpiles, waste piles and tailing impoundment areas Figure 18.9.
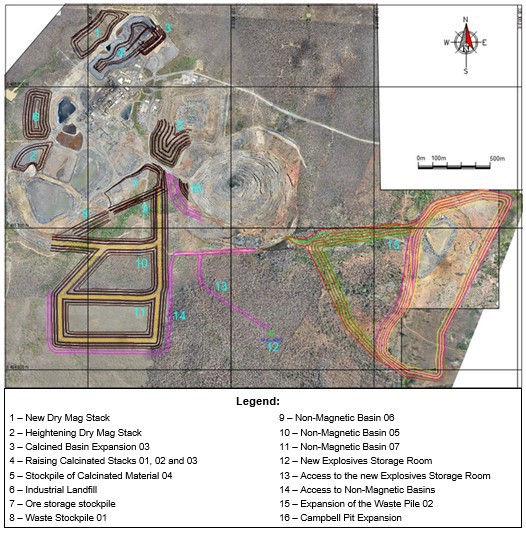
Figure 18.9: Planned Infrastructure of Maracás Complex.
- Areas 01 and 02: Dry Mag Stock Stack:
The non-magnetic material generated in the dry magnetic separation must be stored in order to facilitate its future use, hence the need to create specific stockpiles;
- Areas 03, 04 and 05: Calcinated ponds:
Part of the production process is the generation of dry tailings from the kiln operation stage and is classified according to NBR 10.004 (ABNT), as Class I-A tailings (hazardous). This waste is of continuous generation and must be stored separately from the others in view of the future use of this material;
- Area 06: Industrial Landfill:
Given the need to store contaminated materials during the production process, it is necessary to create a suitable place for their disposal;
- Areas 07 and 08: Ore Stockpiles:
Given the storage needs of mined ore for use in crushing feed blends, it is necessary to create stockpiles for ore types from mining. The proposed location minimizes the cost and makes operation easier since the piles will be taken back and transported to the crushing stockpiles;
- Areas 09, 10 and 11: Non-Magnetic Tailings Basins:
The generation of wet tailings from the milling stage is part of the production processand is classified as Class II-A Non-Inert according to the criteria of NBR 10.004 of ABNT. This waste is of continuous generation and must be stored separately from the others in view of the future use of this material;
- Area 12: New Explosives Locker:
With the company's expansion project, it is necessary to adapt the existing structures. To support this growth, the demand for explosives will also increase and this will require adapting existing structures to meet NR-19 (Explosives) guidelines. This situation is influenced by the increased production of the Campbell pit and the planned mining of the GAN and NAN deposits.
With the construction and/or expansion of structures, it is necessary to expand and open new accesses to optimize operations;
- Area 15: Construction of the Waste Pile 02:
Due to the increase in the production from Campbell Pit and the optimization of the operation Waste Pile 2 will need to be expanded;
With the geological reassessment, increase in reserves and optimization of the Campbell Pit, new limits to the final pit have been accounted for in the overall plan.
19 MARKET STUDY AND CONTRACTS
19.1 Information Sources
Largo subscribes to several associations, publications and industry related websites, as listed below:
- Associate Member of Vanitec (www.vanitec.org);
A global organization which encourages and assists technical research and education about vanadium and its world-wide application in the steel, titanium and chemical industries. Vanitec convenes international representatives of companies involved in the mining, processing, manufacturing, research and use of vanadium and vanadium-containing products.
- Subscription to Fastmarkets Metal Bulletin (www.metalbulletin.com);
The industry leading publication for pricing information globally. It publishes news, expert market commentary, statistics and pricing for over 900 metals, including 7 vanadium indexes covering various products and regions.
- Subscription to CRU (https://cruonline.crugroup.com/);
An industry accepted source for metal prices, news, conferences and information for nonferrous metals, rare earths and ferroalloys.
- Subscription to FerroAlloyNet (https:// https://www.ferroalloynet.com/);
An industry accepted source for metal prices, news, conferences and information for nonferrous metals, rare earths and ferroalloys focused on the Chinese market.
- Roskill Information Services - Outlook to 2030, 19th Edition, published in 2021;
Report includes data and information relating to: Vanadium sources and resources, global production and consumption, supply demand outlook, historical and price forecasts, a review of production by country, uses of vanadium and an overview of the international market.
Roskill is considered a leader in independent, international metals and minerals research, producing 75 market reports, databooks and newsletters designed for the purposes of formulating company strategies, following industry trends, competitor analysis, and gaining a complete overview of a single industry.
- Associate Member - U.S. Energy Storage Association, joined in Q1 2021;
The U.S. Energy Storage Association ("ESA") is the national trade association dedicated to energy storage and represents a diverse group of companies, including independent power producers, electric utilities, energy service companies, financiers, insurers, law firms, installers, manufacturers, component suppliers, and integrators involved in manufacturing, deploying and operating energy storage systems around the globe.
- Associate Member of the Brazilian Institute of Mining (IBRAM);
IBRAM is a Brazilian private non-profit organization, with more than 130 associates responsible for 85% of Brazil's mineral production. It carries with it the essence and strength of the true #BrazilianMining.
- Founding Member - Flow Batteries Europe Association - joined in April 2021.
Flow Batteries Europe represents flow battery stakeholders with a united voice to shape a long-term strategy for the flow battery sector. It aims to provide help to shape the legal framework for flow batteries at the EU level, contribute to the EU decision-making process as well as help to define R&D priorities.
- Associate Member - California Energy Storage Alliance - joined in Q1 2021.
The California Energy Storage Alliance (CESA) is the definitive voice of energy storage in California. At 100+ members strong, CESA is committed to advancing the role of energy storage in the electric power sector.
Attendance at various industry related conferences and events including:
- Fastmarket Metal Bulletin conferences;
- CRU conferences;
- FerroAlloyNet conference;
- Vanitec meetings;
- Energy Storage Association conference.
19.2 The Market for Vanadium
Vanadium is recovered principally from magnetite and titanomagnetite ores, either as the primary product or as a co-product with iron. It is also recovered as a secondary product from fly ash, petroleum residues, alumina slag, and from the recycling of spent catalysts used for some crude oil refining and which have accumulated vanadium. Roskill (2021) estimates that co-production with iron accounted for 72.6% of supply in 2014, primary production accounted for 17.6% and secondary production for the remainder.
Vanadium pentoxide is the principal intermediate product from treatment of magnetite ores, vanadiferous slags and secondary materials. It is used directly in non-metallurgical applications and in the production of a range of vanadium chemicals. It is also the starting material for production of ferrovanadium and master alloys. Most vanadium is used in the form of ferrovanadium as a steel additive.
Production and demand figures may be reported in terms of contained vanadium metal or the pentoxide (V2O5) equivalent. Trade statistics are reported in terms of gross weight.
World production in 2020 as estimated by the U.S. Geological Survey (USGS) is summarized in Table below. China, South Africa and Russia accounted for nearly 92.1% of world supply in 2020. South Africa is the largest producer of primary vanadium, followed by China. Production in Brazil commenced from Largo's Maracás operation in 2014. The United States no longer produces vanadium from primary sources but produces vanadium products based on secondary sources and imported material. (Table 19-1)
Table 19-1: World Mins Production and Reserves.
Mine Produciton |
| 2019 | 2020* |
United States | 460 | 170 |
Brazil | 5,940 | 6,600 |
China | 54,000 | 53,000 |
Russia | 18,400 | 18,000 |
South Africa | 8,030 | 8,200 |
World Total (Rounded) | 86,800 | 86,000 |
*Estimated.
U.S. Geological Survey, 2021 Minerals Yearbook and Mineral Commodity Summaries.
Co-production of vanadium with iron ore results in conditions in the iron ore industry having a direct impact on vanadium supply.
19.2.1 Demand
Roskill estimates that 93.1% of vanadium production is used in the steel industry in a wide range of steel formulations to meet a variety of end-use applications. (Roskill, 2021). It is also used in titanium-aluminum and other non-ferrous alloys, in catalysts for the production of maleic anhydride and sulphuric acid and petroleum cracking, in batteries and in a number of chemical applications.
Vanadium consumption trends reflect the general trend of steel making and production of high strength steel, in particular. In turn, conditions in the steel industry are affected by global economic conditions. Table 19-2 shows crude steel output in China, the rest of the world, and the world total, from 2015. The increasingly dominant position of China in the steel industry is shown clearly and, in 2021, it accounted for approximately 56.5% of world crude steel production. Although world production dropped slightly in 2020 as a result of the global pandemic, steel production has shown a solid and consistent growth since 2015.
Table 19-2: World Crude Steel Production (Million tonnes).
| 2015 | 2016 | 2017 | 2018 | 2019 | 2020 |
China | 803.8 | 807.6 | 870.9 | 928.3 | 1,001.3 | 1,053.0 |
Rest of World | 819.1 | 823.7 | 864.1 | 897.3 | 878.8 | 811.0 |
Total | 1,622.9 | 1,631.3 | 1,734.9 | 1,825.6 | 1,880.1 | 1,864.0 |
World Steel Association, www.worldsteel.org/statistics.
Vanadium increases the strength of a variety of steels by forming carbides and nitrides. For 2020, Roskill (2021) estimated that high strength low-alloy (HSLA) steels accounted for about 85 % of use of vanadium in steels. In these applications, HSLA steels provide increased strength and weldability and reduced weight compared with other steels. Full alloy steels are the second largest market for vanadium in the steel industry, followed by tool and carbon steels.
As noted above, most vanadium is used in the form of ferrovanadium as a steel additive. Ferrovanadium is available containing 45 % to 50 % V and 80 % V. The 80 % V grade material is produced by reduction of the pentoxide (V2O5) or trioxide (V2O3), generally using the aluminothermic process. Lower grade ferrovanadium is generally produced by reduction of slag or other vanadium-containing feedstocks by the silicothermic process.
Titanium alloys are the principal non-ferrous alloys using vanadium. These have high strength to weight ratios and are used in aircraft components, including structural elements, hydraulic systems and jet engine parts. The vanadium used in the form of vanadium-aluminum master alloys.
19.2.2 International Trade
In the international trade, vanadium is mainly exported and imported in the form of oxide or ferrovanadium. Brazil and Russia are the world's largest oxide exporters while the EU is the leading exporter of ferrovanadium. Roskill (2021) estimated total export trade in vanadium oxides in 2020 at 44,356 t gross weight and total export trade in ferrovanadium in 2020 at 45,768t gross weight.
In 2020, Roskill saw Czech Republic and China as the largest importers of vanadium oxides while EU and China where the largest importers of ferrovanadium.
19.2.3 Vanadium Prices
Ferrovanadium and vanadium pentoxide are the principal commercially-traded vanadium products. Neither these, nor any other vanadium products are traded by means of an exchange or terminal market such as the London Metal Exchange or COMEX Division of the New York Mercantile Exchange (NYMEX). Prices for ferrovanadium and vanadium pentoxide are quoted in publications including Metal Bulletin (ferrovanadium and vanadium pentoxide) and CRU (ferrovanadium and vanadium pentoxide).
Transactions are usually negotiated under 12-months contracts between producers and consumers or trading houses. Prices are generally quoted in terms of US dollars per pound or per kilogram gross weight of contained vanadium pentoxide or vanadium.
Figure 19.1 illustrates the trend in vanadium pentoxide prices over the past 12 years from November, 2009.

Figure 19.1: Vanadium Pentoxide Price Trend (US$/lb V2O5).
Metal Bulletin, data provided by Largo.
Over the past 12 years prices peaked at US$29 /lb V2O5 in 2018 and hit a low of US$2.25 /lb V2O5 in 2015. Accounting for inflation, the average price was US$ 7.87/lb V2O5 since the start of reporting by Metal Bulletin in 1997.
In its report, commissioned by Largo in 2021, Roskill forecasts sustained high prices for V2O5 over the coming years due to favorable supply/demand dynamics: (Table 19-3)
Table 19-3: Roskill Price Trend (US$/lb V2O5).
| 2021 | 2022 | 2023 | 2024 | 2025 | 2026 | 2027 | 2028 | 2029 | 2030 |
V2O5 Standart | 6.70 | 8.64 | 8.68 | 8.05 | 7.01 | 7.80 | 7.80 | 7.80 | 7.80 | 7.80 |
HP V2O5 Premium | 1.50 | 1.50 | 1.80 | 2.00 | 2.10 | 2.20 | 2.30 | 2.40 | 2.50 | 2.50 |
HP V2O5 Price | 8.20 | 10.14 | 10.48 | 10.05 | 9.11 | 10.00 | 10.10 | 10.20 | 10.30 | 10.30 |
V2O3 Premium(%) | 21.35 | 21.35 | 21.35 | 21.35 | 21.35 | 21.35 | 21.35 | 21.35 | 21.35 | 21.35 |
V2O3 Price | 8.13 | 10.49 | 10.53 | 9.77 | 8.51 | 9.47 | 9.47 | 9.47 | 9.47 | |
Source: Roskill
19.2.4 Ilmenite Prices
Ilmenite is a titanium-iron oxide mineral. From a commercial perspective, ilmenite is the main source of titanium dioxide, which is used in paints, printing inks, fabrics, plastics, paper, sunscreen, food and cosmetics.
Transactions are usually negotiated under 3 to 12-month contracts between producers and consumers or trading houses. Prices are generally quoted in terms of US dollars per ton.
Figure 19.2 illustrates the trend in Ilmenite prices over the past 4 years from December 2017.
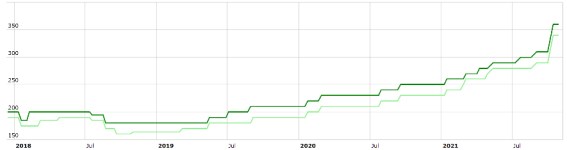
Figure 19.2: Ilmenite Price Trend (US$/t).
Metal Bulletin, data provided by Largo.
19.2.5 Titanium Pigment Prices
Titanium dioxide is the inorganic compound with the chemical formula TiO2. It is a white, water-insoluble solid, although mineral forms can appear black. As a pigment, it has a wide range of applications, including paint, sunscreen, and food coloring. It is estimated that titanium dioxide is used in two-thirds of all pigments, and pigments based on the oxide have been valued at $13.2 billion.
Transactions are usually negotiated under 3 to 12-month contracts between producers and consumers or trading houses. Prices are generally quoted in terms of US dollars per ton.
Figure 19.3 illustrates the trend in Titanium pigment prices over the past 4 years from January 2018.
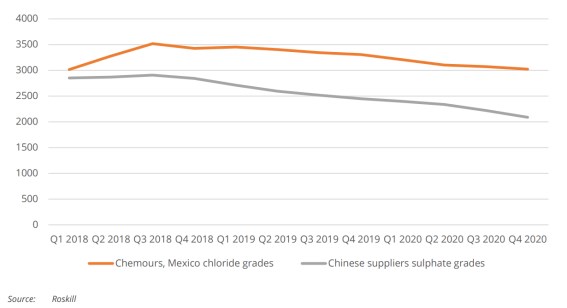
Figure 19.3: Benchmark imported TiO2 pigment prices (US$/t, CIF Brazilian port).
Roskill, data provided by Largo.
19.3 Outlook
Roskill believes that China's TiO2 pigment export price to world markets fell to an average of US$1,950/t (FOB China) in 2020 and this is expected to be the nadir of the current price cycle. There were several waves of price increases posted by major Chinese suppliers near the end of 2020 and the effect of COVID on supply chain and production pushed prices higher than 3,000/t in 2021 and Roskill anticipates sustained prices above US$3,500 over the medium/long run.
19.4 Contracts
For the year 2021, Largo committed approximately 85% of its forecasted production under long term, 12 months or more, agreements with vanadium end users, converters and trader in the steel, aerospace and chemical industries. The balance material was sold in the spot market according to availability and demand from time to time. The yearly negotiations for 2022 is ongoing as of November 6th, 2021 and expected to be finalized by mid-December 2021.
19.5 Selling Prices adopted
GE21 adopted the following selling prices in Table 19-4 below in the economic analysis presented in this report.
Table 19-4: Selling Price.
Description | Unit | 2022 | 2023 | 2024 | 2025 | 2026 | 2027 | 2028 | 2029 | 2030 to 2041 |
Average Dollar | R$/US$ | 5.10 | 5.10 | 5.10 | 5.10 | 5.10 | 5.10 | 5.10 | 5.10 | 5.10 |
Tonnes / lb | nº | 2,204.62 | 2,204.62 | 2,204.62 | 2,204.62 | 2,204.62 | 2,204.62 | 2,204.62 | 2,204.62 | 2,204.62 |
Vanadium - V2O5 standard | US$/lb | 8.64 | 8.68 | 8.05 | 7.80 | 7.80 | 8.20 | 8.20 | 8.20 | 8.20 |
Vanadium - V2O5 Premium | US$/lb | 1.50 | 1.80 | 2.00 | 2.10 | 2.20 | 2.30 | 2.40 | 2.40 | 2.40 |
Vanadium Premium - Sale Price | US$/lb | 10.14 | 10.48 | 10.05 | 9.90 | 10.00 | 10.50 | 10.60 | 10.60 | 10.60 |
Vanadium Premium - % of sales | % | 25.0% | 25.0% | 25.0% | 25.0% | 25.0% | 25.0% | 25.0% | 25.0% | 25.0% |
Ilmenite - Sale Price | US$/Ton | 210.00 | 210.00 | 210.00 | 210.00 | 210.00 | 210.00 | 210.00 | 210.00 | 210.00 |
Titanium (Pigment) - Sale Price | US$/Ton | 2,884.00 | 3,136.00 | 3,332.00 | 3,528.00 | 3,696.00 | 3,696.00 | 3,668.00 | 3,724.00 | 3,836.00 |
20 ENVIRONMENTAL STUDIES, PERMITING AND SOCIAL OR COMMUNITY IMPACT
20.1 Regulatory Framework Overview
The licensing process in Brazil, includes two kinds of licensing processes: the licensing of exploration and mining concessions, as discussed in Chapter 4, and environmental licensing (also known as social and environmental licensing).
Environmental licenses are established, implemented, and enforced through various levels of the legal systems, including, constitutional dispositions and federal and state laws. The licensing process is administered through a national system of environmental authorities known as SISNAMA.
The Brazilian Constitution grants the concurrent legal authority to multiple levels of government to regulate environmental activities (Federal, States and Municipalities), SISNAMA sets out the parameters which allow for the activities at each level to be coordinated by assigning to each entity the capacity to grant environmental licensing, according to the size and characteristics of the licensed activity which provides juridical safety and clarity.
The environmental licenses granted by any entity belonging to the SISNAMA are structured in three phases, each one requiring different environmental studies and validation routines, as defined by the applicable legal framework (laws, resolutions, administrative acts etc.).
Environmental permitting in the State of Bahia is the responsibility of INEMA - Instituto do Meio Ambiente e Recursos Hídricos, which regulates, approves and issues environmental permits or licenses.
The permitting process in Bahia considers the nature and size of the projects and activities, the characteristics of the affected ecosystem and the supporting capacity of the area being impacted.
The following types of environmental licenses are necessary for the projects in Bahia:
- Preliminary Environmental License (LP): The LP is the most critical license and is granted in the preliminary planning phase of the project or operation, and it approves the location and the conceptual design of the project, attesting to its environmental feasibility and determining the basic requirements and conditions to be observed in the subsequent permitting stages;
- Installation License (LI): The LI is granted so that a project or operation can be installed (or constructed), in accordance with the specifications presented in the plans, programs and project specifications proposed by the environmental studies that were approved, including the environmental control measures and other conditions;
- Operational License (LO): The LO is granted for a project to commence its operational phase, after the satisfaction of all the requirements of the previous licenses have been confirmed and the conditions and procedures to be observed during the operation are defined.
Licenses and authorizations are granted based on an analysis of the environmental studies that have been completed. This analysis considers the objectives, criteria and norms for the conservation, preservation, protection and improvement of the environment, the possible cumulative impacts and the planning and land use guidelines of the State. For mining projects that are exceptionally large, as is the case of the Project, the preparation of the EIA and RIMA must comply with the TR (Reference Term Sheet) issued specifically for the Project.
Environmental licenses have a definite validity or term, which can be renewed or extended, based on the nature of the project and activities. The validity is defined for each license and is stated on the environmental certificate issued; the validity period starts on the day the license is published in the Official Newspaper of the State of Bahia. If the renewal of any license is requested 120 days or more in advance of its expiration date, the validity of that license is automatically extended until INEMA issues a formal response, either positive or negative.
For permitting purposes, the classification of mining operations in Bahia is divided in five categories: micro, small, medium, large and exceptionally large. These categories are determined based on three criteria: built area, total investment (capital investment + cash flow, in Brazilian Currency, R$), and number of employees. The project is classified based on the highest ranking of the three criteria. The Project is classified as exceptionally large.
The grant or license for water resources usage in the State of Bahia is governed by the State Decree N. 6,296, from March 21st, 1997; State Law N. 10,431, from December 20th, 2006, substituted by law nº12 377 on November 28th, 2011; and Federal Decree N. 24,643, from July 10th, 1934 (Código de Águas).
The water grant is obligatory for the lawful and legitimate use of water resources whose purpose is the construction, expansion or alteration of any project that requires surface or groundwater, as well as for any work that alters the water regime, quantity or quality.
The VMSA water grant, as a concession, (as it is the case of the Largo Project) has a validity of 4 years and is renewable. State water grants are issued by the INEMA through specific publications in the Official Gazette of the State of Bahia. The request for water grants in mining involves the execution of hydrologic, hydrogeological and hydro chemical studies. The VMSA received its water grant renewal in February 2021.
In the State of Bahia, INEMA is responsible for issuing authorizations for native vegetation suppression, which are necessary to alter the land use for the installation or expansion of mining operations. Authorizations are only issued if the environmental, technical and economic feasibility of the project has been established and can be renewed only once. The administrative process involving the authorization for vegetal suppression must be conducted by the INEMA, based on a specific TR (Reference Term sheet). The documents to be submitted include the PTSV (Technical Project for Vegetation Suppression) and the Forest Inventory, as required by the SEMARH Norm 29/05, as well as the PRAD (Plan Rehabilitation of Degraded Areas).
The CONAMA Norm 369/2006, from March 28th, 2006, defines extraordinary cases, in which the competent authority may authorize intervention or vegetal suppression in APP (Area of Permanent Preservation), for implementation of projects, plans and activities that result in significant public benefits.
The clause I, letter C, from article 2 of the Norm 369/06 explicitly recognizes the public benefits of minerals exploration and extraction granted by the competent authority, except sand, clay, silt and gravel.
The section II, Article 7 of the Norm deals specifically with the activities of mineral exploration and extraction in order to obtain environmental licenses. It is understood, therefore, that once the guidelines and obligations defined by the CONAMA Normative 369/2006 are observed, the public benefits of the Maracás Project are automatically recognized for environmental permitting purposes and for purposes of obtaining authorization for vegetal suppression and intervention within APPs.
20.2 Environmental Permitting Status
The Project (through VMSA) produces vanadium pentoxide and vanadium trioxide (V2O5 and V2O3) are possess all the necessary licenses to conduct its operations, includes those regarding the construction of the Project.
The Operational License for the Campbell Pit operation was published in the Official Gazette on November 8th and 9th, 2014. The renewal process was filed by May 2020 and is under analysis by INEMA technicians.
VMSA applied for the Ilmenite project environmental license after fulfilling INEMA requirements in November 2021 and the granting process is ongoing, with support of both the local community and government authorities. It is important highlight that the Ilmenite project is within the Project's facilities area and no archaeological impact, deforestation, new grant water, road and powerline construction environmental license process will be needed.
Studies submitted at Environmental Agency as part of request to Installation License for Ilmenite project is currently being reviewed by INEMA. The technical analysis is scheduled to commence by December 2021 and the license is expected by beginning of March 2021. The main potential risk associated with environmental permitting is related to the delay in the grating of the issuing the license for Ilmenite Project. Environmental process progress is followed carefully by the Project's environmental team. .
Additional environmental licences/processes for the Project's expansions (e.g. non magnetic waste dam, calcinated dam) and new projects (e.g. NAN and GAN) will be submitted fulfilling INEMA's requirements on time and accordingly with projects phase/timeline.
20.3 Environmental Baseline Conditions
The environmental baseline study was carried out as part of the preparation of the EIA. The baseline study was completed by Brandt Meio Ambiente Ltda. in June 2011. The study also included supplemental information related to an Equator Principles Compliance Audit carried out by Mineral Engenharia e Meio Ambiente Ltda (Mineral) dated December 2011 as requested by parties involved in the financing of the Project: Brazilian finance institutions Itau BBA, Bradesco and Banco Votorantim Minerals are acting as the financing bank's environmental auditor.
20.3.1 Climate and Physiography
The local climate has two distinct seasons, the rainy season (hot and humid) from October to March, and the dry season from April to September. The average daytime temperature in the Project area is 22.3ºC. The months of May to August are the most representative of winter conditions, at which time the average temperature is 18ºC.
Rainfall in the Project area generally ranges from 480 mm at the Porto Alegre gauge station to 630 mm at the Alagadiço gauge station, both of which are located in the local area adjacent to the Project. There is rainfall each month of the year, with the driest period being from May to September, when the monthly precipitation is typically below 20 mm.
The Project is located in the middle branch of the Jacaré River, about 3 km west of the western border of the Maracás plateau, in a region of very flat terrain with maximum relief changes of 25 to 30 m. The altitude in the area averages between 310 m and 340 m and seldom exceeds 400 m. The Jacaré River valley constitutes a long north-south depression with an average width of 10 km and a length of approximately 70 km.
The surrounding terrain is typically ranch/farm land with low trees and shrubs, relatively-flat platforms adjacent to a series of creeks and ponds. The property is bounded to the east by a steep cliff that rises 300 m to the Maracás plateau.
20.3.2 Water Resources
The Project is located in the Rio de Contas basin, which has an elongated shape with length of 620 km and average width of 185 km. The Project is located in the municipality of Maracás located in the Jacaré River sub-basin.
The Contas River is a perennial river, although most of its tributaries are intermittent during the dry season. At the Jequié river flow gauging station, the 26-yr average is 25 m3/s, and 99 m³/s at the Ubaitaba station closer to the delta. The main tributaries are the Ourives, Sincorá de Santana, Jacaré and Caldeiras Rivers.
The Jacaré River is located 4 km downstream from the Gulçari-A deposit (Campbell Pit) where it receives flow contributions from the João River. The Jacaré River and its tributaries are intermittent watercourses.
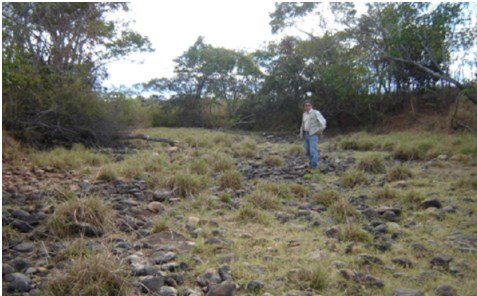
Figure 20.1: Jacaré River (Dry period).
Surface water quality monitoring has been divided into two groups: one group comprising two monitoring stations at the João River (upstream and downstream from the mine site area) and two monitoring stations at the Jacaré River (upstream and downstream from the confluence with the João River), and one group comprising the two monitoring stations located at the Rio de Contas River (upstream and downstream from the confluence with the João River). This area is under a water deficit and the surface water bodies are, most of the time, dry.
The monitoring stations generally have pH values slightly above neutral. The dissolved oxygen (DO) concentrations were in compliance with the recommended standards in every monitored point. At most of the monitoring points, the majority of metals were not detected, particularly heavy metals. However, aluminum was detected in every monitoring station, at levels above the legal standard. The elevated aluminum concentrations have been attributed to the geology and soil composition of the region.
The results of the groundwater monitoring campaign carried out by Brandt Meio Ambiente in March 2008 were in compliance with the standards set by the CONAMA regulation 396/2008. The author is not aware of additional studies subsequent to 2008.
20.3.3 Flora Characterization
The area of influence of the Project consists predominantly of large portions of land covered with natural vegetation and pasture. The natural vegetation is well preserved, but there are areas with secondary vegetation and areas where vegetation was cut down to allow for pasture planting.
Along road BA-026 through Porto Alegre, there are many small communities and the vegetation is deeply modified. In the vicinity of the Porto Alegre District, there are irrigated plantations, with a complete alteration of the natural landscape and large areas used to grow beans, cassava, watermelons, mangos, and other fruits and vegetables.
The preserved vegetation was classified by MMA (2006) as Forest Steppe Savannah and Arborous Steppe Savannah. The portions that were subject to human modification and pressure were classified as Forest Steppe Savannah/Agriculture and Arborous Steppe Savannah/Agriculture.
20.3.3.1 Forest Steppe Savannah
Forest steppe savannah is a subtype of vegetation characterized by moderately densely packed 5 to 20 m tall trees (averaging 5 m) with thick trunks and numerous branches; within the Project area some trees taller than 7 m have been observed. This vegetation pattern corresponds to the Arborous Caatinga, according to Carvalho e Junior (2005).
The primary defining species of this vegetation are the Aspidosperma pirifolium, Myracrodruon urundeuva, Schinopsis brasiliensis, Commiphora leptophloeos, and Pseudobombax simplicifolium, and are usually taller than 10 m. The species Spondias tuberosa, Maytenus rígida, Capparis yco and Jatropha ribifolia contribute to the overall density of the vegetation, with average heights of up to 5 The insolation at the ground level has been estimated at only 5% at some preserved areas during the rainy season, a function of the vegetation density.
This type of vegetation usually occurs in the river sides, even if the rivers are partially or totally dry during most of the year. The deep soils and the higher relative humidity enable the growth of this vegetation type.
20.3.3.2 Arborous Steppe Savannah
This subtype of vegetation exhibits comparable floristic characteristics as Forest Steppe Savannah; however, the individuals of the Arborous Steepe Savannah are typically shorter, resulting in greater ground level insolation. This subtype corresponds to the Arborous-bushy Caatinga, according to Carvalho e Junior (2005).
The shorter individuals in Arborous Steppe Savannah are categorized as bushy-arborous and bushy. The prevailing species differs from Forest Steppe Savannah, with greater frequency of smaller individuals including Mimosa spp e de Spondias Tuberosa, Maytenus rigid, Capparis yco and Jatropha ribifolia. These are coincident with Sideroxylon obtusifolium and various individuals from the malvaceae family, resulting in a denser herbaceous stratum than in other subtypes. Arborous individuals are still present but are typically more spread out, along with individuals from the Bromeliaceae and Cactaceae families, reaching 10% to 60% cover in some areas.
This type of vegetation is found in areas further away from the rivers, with more compact soils and low humidity.
20.3.3.3 Recovering Steppe Savannah
Recovering Steppe Savannah is classified by the absence of a variety of species, with individuals generally more diffusely spaced. Arborous or bushy individuals from the Forest and Arborous Steep Savannah types can occur (generally 2 to 7 m tall). Due to historical exploration activities, their branches are not as numerous or dense as in the past.
The management and soil use activities are the main factors shaping this subtype. Man-made fires occur frequently, designed to "clean" the land for pastures and agriculture; this results in development of a new vegetation cover at a secondary stage of ecological evolution.
20.3.3.4 Human occupation - Anthropized areas
Anthropized Vegetation is characterized by various types of clean pastures or bushy-arborous vegetation cover, resulting in dirty pastures that, if left without management, can evolve to recover vegetation.
Exotic grass is often introduced to these pastures: Aristida setifolia (capim-panasco), Bracchiaria decumbens (braquiária) and Cenchrus ciliaris (capim-bufel). The annual herb Estilosantes (Styloranthes humiles) and the algodãozinho de seda (Calotropis procera) can be cited as intrusive/invasive vegetation associated with disturbance of the natural vegetation rather than the management of the pastures.
Pasture management is predominantly undertaken for cattle and to a lesser extent for caprines, the latter of which is closely related to the presence of communities. Local residents use the land to plant and to raise cattle and goats. Cattle raising activities require larger areas and an alteration of the natural environment with continuous suppression of natural vegetation and replacement exotic grass species. Goat raising, while generally considered to be as impactful as cattle raising, is less frequent and does not require the continuous removal of natural vegetation.
The revegetation plant used in the area is the Cactaceae (palmatória) or Palma (Opuntia palmadora, Cactaceae), which is consumed as a water source for cattle during the dry season. The poor soil and the lack of regular rainfall limit development of satisfactory agriculture. At Porto Alegre, the original Caatinga vegetation was replaced to a large extent by small plantations, where the population uses the water from the Rio de Contas for irrigation.
20.3.3.5 Forest Inventory
The forest inventory was carried out by Brandt in 2008 and audited by Mineral Engenharia em Meio Ambiente Ltda. (Mineral) in 2011 showed 141 vegetation species, with 111 being identified at the species level (78.7%), 13 at the genus level (9.2%), 10 species remained to conferatum (cf.) and seven species were not identified. The reasons were largely due to the absence of reproductive material, available literature, or available herbarium material for comparison. The author is not aware of additional studies subsequent to 2008
The most representative family was Fabaceae (20.57%), followed by Cactaceae (8.51%), Malvaceae and Euphorbiaceae (6.4%). These four families represent approximately 41.9% of the observed species. The remaining species are distributed in 39 other families, with a total of 43 botanical families.
The utilization of the region's native species as a source of natural remedies, food and water sources when the dry season becomes too intense is widely known among the local residents. The bark and leaves of trees like the pau-ferro (Caesalpinia férrea) and the quixabeira (Bumelia sartorum) are used to produce tea against rheumatism and diabetes. The fruit from the icó (Capparis yco) and from the umbuzeiro (Spondias tuberosa) are part of the diet of the local population, with the latter forming underground tubercles that are used to quench the thirst during harsh dry periods.
Based on the official list of endangered flora, from the IBAMA Norm 06/2008, and from the list of IUCN the following tables (Table 20-1 and Table 20-2) present the species found and considered vulnerable and rare.
Table 20-1: Vulnerable Species.
Name | Popular Name |
Astronium fraxinifolium | Gonçalo - Alves |
Myracroduon urundeuva | Aroeira do sertão |
Pereskia cf. aculeata | *** |
Pilocereus piauhyensis | Facheiro |
Caryocar brasiliensis | Pequi |
Anadenanthera macrocarpa | Angico |
Chloroleucon tortum | Jurema |
Mimosa caesalpinifolia | Sabiá |
Amburana cearensis | Umburana |
Psidium rufum | Araça |
Manilkara elata | Maçaranduba |
Sideroxylum obtusifolium | Quixabeira |
Schinopsis brasiliensis | Braúna |
Table 20-2: Rare Species
Rare Species |
Scientific Name | Popular name | Family |
Astronium fraxinifolium | Sete cascas | Anacardiaceae |
Cnidoscolus pubescens | Cansanção | Euphorbiaceae |
Jacaranda cuspidifolia | Pau de colher | Bignoniaceae |
Luehea paniculata | Açoita cavalo | Malvaceae |
Mimosa tenuiflora | Buranhém | Fabaceae |
Not identified | Borracha | Not identified |
Not identified | Pau de curral | Not identified |
Not identified | Pinheiro Roxo | Not identified |
Patagonula bahiensis | Casca fina | Fabaceae |
The species categorized as rare are those with a density smaller than one individual per hectare, according to the methodology proposed by Kageyama e Gandara (1993). These species should also be the targets of environmental management actions for conservation.
20.3.4 Fauna Characterization
The fauna characterization was based on a qualitative survey of the various vertebrate groups throughout the Project's area of direct and indirect influence. The survey was carried out in the beginning of 2008 and audited in 2011 by Mineral, through field surveys, interviews with residents and specialized literature.
During the field survey, the entire area of direct influence (ADI) and area of indirect influence (AII) were covered, aiming at identifying wild fauna species present in the region. For the mastofauna survey, direct observations were made through the method of linear transects, walking along existing trails in search of animals or traces such as animal tracks, fur, feces, or dead animals. The animals were identified according to the references Cabrera, 1961; Silva, 1994; Emmons, 1997.
The same method (linear transects) was used for the avifauna survey, but with the help of binoculars. The AID and AII were searched, along the existing trails, with the purpose of finding individuals, nests, dead animals or vocalizations. The guide for field surveys by Souza, 2004 was used, as well as specialized literature (Sic, 1997).
The survey of herpetofauna, reptiles and amphibians were conducted directly at the ponds, water bodies, fallen logs, hollow trees and shadows. The methodology used for identification was recommended by Peters & Orejas Miranda, 1971; Marques et al., 2001; Campbell & Lamar, 2004; and Kwet & Dibernardo, 1999.
20.3.4.1 Mammals
The region contains diversified mammal fauna, including species ranging from small mammals (rodents) to large-sized animals. Mammals are capable of occupying a large variety of habitats. There are not a significant number of big animals in the region of the project, but there are numerous small-sized species, such as bats and rodents. The majority of the mammals are singular and nocturnal and are seldom observed.
Footprints of a Puma Concolor (sussuarana), considered to have its largest habitat in the vicinity of the Project, have been observed in the region. In total, 47 species have been identified, belonging to 19 families.
Several mammals have been identified with economic value derived from consumption as food by local residents: armadillos (Dasypodidae), preás (Caviidae), mocó (Caviidae), agoutis (Dasyproctidae) and tapetis (Leporidae).
According to the Official List of Brazilian Fauna Threatened by Extinction (MMA - Instrução Normativa, no 3, de 27/05/03), the Brazilian three-banded armadillo (Tolypeutes tricinctus) is categorized as threatened. The following species are classified as vulnerable: giant anteater (Myrmecophaga tridactyla), ocelot (Leopardus pardalis), little spotted cat (Leopardus tigrinus), and cougar (Puma concolor).
20.3.4.2 Avifauna
The avifauna was the most representative group during the field survey and is associated with the Project area vegetation and habitat. Birds are considered imperative in any ecosystem, due to the fact that they combat plagues, contribute with flower pollination, seed spreading, in the control of rodent and venomous animals, collecting and recycling biological wastes and as a bioindicator of environmental conditions.
Limiting the scope of analysis only to the caatinga of the State of Bahia, two studies found approximately 283 and 280 species (Fiúza, 1999 and Lima, 2004 respectively). Both studies considered seasonal and year-long species in the Porto Alegre region in the county of Maracás, considered to be within the Project's area of influence. An additional study in 2005 (CBRO, 2005) identified 247 bird species distributed among 51 zoological families.
The Project area contains a large species diversity, estimated at approximately 88.2% of all species found in the State of Bahia. However, due to the relatively good conservation of natural resources and habitat, this diversity is not uncommon in the area. Aquatic birds, which use the region's ponds, lakes and rivers for various purposes, contribute significantly to this diversity.
The families with the largest number of individuals (above 4% species / family) were: Tyranidae (20 species), Emberezidae (19 species), Thraupidae (16), Furnairdae (15), Thamnophilidae (14) and Trochilidae (11). These six families encompass 38.3% of all species observed.
The consumption of wild avifauna as food and raising as pets are common in many regions of Bahia, including the county of Maracás. This tradition threatens numerous species, including xerimbabos and cinegetic species. The tinamidae family (quails, partridges and tinamous) and the columbidae family (doves and pigeons) are frequently sought as food in the region. The main ornamental birds are the melro (Icberidae), galo-de-campina (Fringillidae), canário-da-terra (Fringillidae), caatinga parakeet (Psittacidae), maritaca (Pittaicidae), among others.
Based on the Official List of Brazilian Fauna Threatened by Extinction (MMA - Instrução Normativa, No 3, de 27/05/03), none of the species are categorized as threatened.
20.3.4.3 Herpetofauna
Though the caatinga reptiles are considered well surveyed (Vanzolini et al., 1980), unexpected findings suggest that little is known about the patterns, which govern their evolution and differentiation (Rodrigues, 2005). This group is evenly distributed throughout the caatinga, with the only absentees being the crocodilians.
The reptile fauna of the region is very rich. During the field survey, the following groups were registered (seen or mentioned during interviews): chelonian, serpents and amphisbaenidae.
The venomous reptile fauna of the region shows ample distribution in every biome, except for the jararaca-da-caatinga (Bothrops erythromelas), which is restricted to the caatinga. Species of note include the tropical rattlesnake (Crotalus durissus), jararaca (Bothrops jararaca), Jararacussu (Bothrops erythromelas), cobra-patrona (Bothrops sp.) and coral snake (Micrurus sp.).
Amongst this group, species more susceptible to human activities include the snakes and lizards that live in forested environments, mainly small species and species adapted to the microclimate. These species are usually incapable of enduring the high temperatures of the open fields; consequently, maintenance of the remaining forested environments is critical for the survival of these communities. A total of 19 species, distributed in 9 families, were registered during the surveys.
The lizards are known as frugivorous reptiles and play an important role in the spreading of seeds.
Twelve species of amphibians were found in the following families: Bufonidae, Leptodactylidae, Hylidae e Microhylidae (Quadro B-listanfíbios). These are mainly found in ponds, wells and streams, but larger amphibians have been observed farther away from water resources in drier areas including toads (Bufo crucifer) and treefrogs (Hyla spp.). In more humid areas, the rãs (Leptodactylus spp.) and the black frogs (Ololygoe spp.) have been observed.
The red-tailed boa (Boa constrictor), rainbow boa (Epicrates cenchria), Argentine tegu (Tupinambis teguixin e Tupinambis meriane) and the tuberculate toad-headed turtle (Phrynoes tuberculatus e Geochelone carbonaria) are considered the main cinegetic species in the region. However, they do not have the same cinegetic value as the mammals, thus they are only occasionally hunted or captured.
The snakes of epidemiological importance in the region, include tropical rattlesnake (Crotalus durissus), jararaca-vermelha (Bothrops erythromelas), jararaca (Bothrops sp) and the coral snake (Micrurus sp). All of them are capable of injuries which, if not properly treated, can lead to death or irreversible damage. Injuries or incidents involving snakes is a common aspect of rural communities where agriculture and pasture are the main labor activities.
20.3.5 Aquatic Biota
Aquatic biota samples were collected along the Rio de Contas River to the end of the reservoir, Pedras Dam, including zooplankton, phytoplankton, ichthyoplankton, macrophyte and benthic communities were collected (EIA, 2008).
20.3.5.1 Zooplankton community
The qualitative analysis of the samples identified components of the zooplankton community, distributed in the groups Protozoa, Rotifera, Crustacea, Copepoda, Cladocera, Crustacea and Insecta.
The samples showed a high concentration of rotifers, cladocerans and copepods, which may be related to anthropogenic eutrophication of the system, due to excess organic matter.
20.3.5.2 Phytoplankton community
The qualitative an alysis of the samples identified components of the phytoplankton community distributed in the following divisions: Chlorophyta, Cyanophyta, Bacillariophyta and Euglenophyta.
The results showed a high concentration of the class Chlorophyta inferred to be associated with eutrophication by inputs of inorganic nutrients from agricultural activities for livelihood.
The high concentrations of this class are associated with the hydrodynamic regime change of systems due to damming of rivers, causing deep and abrupt changes in the conditions of phytoplankton communities BICUDO (2005). This is reflective of the transformation of an open system for transportation to a more closed system.
20.3.5.3 Icthyoplankton community
Identification of representatives of the icthyoplankton community came from observation of Pedras dam and the collection of eggs and larval fish states EIA (2008). The qualitative analysis identified larvae distributed in the following families: Erythrinidae, Cichlidae and Characidae, Poeciliidae, and Engraulidae Ariidae.
Upstream of the Pedras dam, the following adult families were identified: Characidae (piaba) Erythrnidae (betrayed) Anostomidae (piau) Loricariidae (charitable or catfish), cichlids and Scianidae (croaker). Some of the observed species, such as genus Hoplias sp (Traíra), Astyanax sp larvae (Piaba), genus Poecilia sp (Barrigudinho), are abundant in most of the watersheds of the Northeast and Bahia.
One of the representatives of the Family Cichlidae, urolepis Oreochromis (Tilapia), is considered exotic and introduced in Brazil through fishing projects in watersheds. The occurrence of peacock bass (Cichla sp) was confirmed by in situ verification of fishing carried out upstream of the Pedras dam.
Some species, Aspistor sp (Catfish), are not native to the basins of Bahia and were introduced through fishing projects. Additionally, representatives of the Family Engraulidae, Anchoa spinifer (sardines) or Anchoviella vaillanti (anchovy) have been identified in the rivers of the Northeast and comprise an important food source to coastal communities.
20.3.5.4 Benthic community
Representatives belonging to the class Gastropoda with a predominance of Melanoides tuberculatus (Grastropoda; Thiaridae) (Muller, 1774) were identified in the project area. This species is native to East Africa, Southeast Asia, China and Indo-Pacific Islands, and its introduction in Brazil is inferred to be related to trade in ornamental fish and plants (France, 2007). The Melanoides tuberculatus occurs in disturbed areas and is usually associated with inputs of organic matter.
20.3.5.5 Aquatic Macrophytes
Aquatic macrophytes are important components of aquatic ecosystems because they contribute to improve the structure and diversity of habitats, interfere with nutrient cycling and participate in the base of food webs (Esteves, 1998).
A hydroelectric dam on the Rio de Contas River has created the Pedras Dam lake. According to the sampling program, only 2 species (Salvinus Chara sp and sp) were identified in this lake. However, according to residents there are other species of aquatic macrophytes that have not been confirmed.
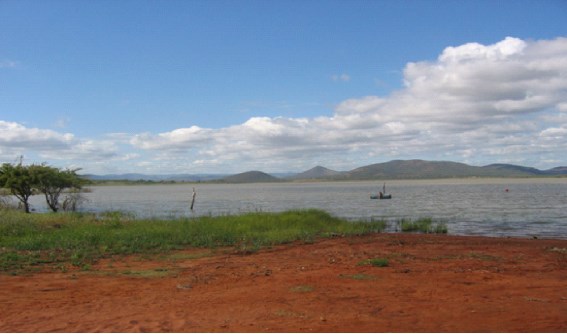
Figure 20.2: Pedras` Dam reservoir at Porto Alegre.
20.4 Social and Economic Baseline
This section presents and discusses the various social and economic (socio-economic) aspects of the Project, including discussion of potential modifications to these aspects throughout the Project lifecycle.
Although the municipality of Maracás will be directly benefited/supported by the Project, the indirect benefits extend beyond that county. The changes in the municipality of Maracás will result in new relationships and interactions between the municipality and proximal regional neighbours including, but not limited to economic structure, job opportunities, taxes, income of families and companies, and distribution of work force.
The socio-economic assessment completed for the Environmental Assessment comprised a systematic methodology involving the integration of 25 counties which make up the micro regions that will be impacted by the Project. This assessment emphasizes the Maracás municipality and the area of direct influence of the Project.
The social and economic assessment was based on interviews with local residents through March 2008 (primary data) and on secondary data obtained from an audit review report completed by Mineral Engenharia Ambiental Ltda. in 2011.
20.4.1 Populations Dynamics
A study of the evolution of the population of the counties included in the Maracás micro region encompassing the last four decades was undertaken with the purpose of portraying a broad view of the demographic processes experienced by the 25 municipalities. Generally, the urban population showed larger growth rates, changing the distribution of the population while maintaining a rural profile in the majority of the counties.
From 1991 to 2000, the average annual population growth rate of the 27 counties remained positive (1.62%), resulting in a population growth from 509,378 to 532,409. The urban population of all counties grew from 276,868 to 325,905, with Maracás showing the largest annual urban population growth rate (4.75%). Only nine counties (33.3% of the counties) had predominantly urban populations, with the remaining 18 counties staying rural.
In the same period, the average annual population growth rate in Maracás was 1.73%. This county, which in 1991 still showed a predominantly rural population (44.91% urbanization rate) was considered an urban county by 2000, with 58.44% of its population in cities.
In 2007, the population of Maracás was the third largest of all the counties studied, being smaller than Jequié and Jaguaquara. The average annual population growth rate from 2000 to 2007 was 1.11%. Over the same period the average annual population growth rate of the region's main county, Jequié, fell 0.12%.
20.4.2 Employment Structure and Unemployment Rate
In Brazil, the service sector employs the largest number of economically active people. In Bahia, the relative importance of the different economic sectors is similar to the national situation: 29.4% of employment in agriculture and grazing; 56.2% in services; and 14.4% in industry. The 27 counties included in the study showed a similar distribution of economic activities: service sector, followed by the agriculture and grazing sector and the industrial sector.
In Maracás county, the largest share of workers is found in the agriculture and grazing sector (45.7%), while the industrial sector provides 11.6% of the county's employment.
In general, the unemployment rate of the Maracás micro region shows a considerable variability (3.92% to 24.94%). Maracás is among the counties with the largest unemployment rates in the region (19.41% in 2000), above the Bahia and Brazilian averages.
In the county of Maracás, the share of the population that is younger than 29 years is 62.56%, which is slightly above the region's average. The portion of the population older than 60 years is smaller than the region's average (8.92% compared to the regional average of 10%). The county is faced with the challenge of providing education, leisure and work opportunities to its predominantly young population.
The comparison of the literate population in the micro regional area of influence of the Project from 1991 to 2000 reveals a significant increase in literacy rates. In 1991, the literacy rate of the population between 5 and 9 years was 16.9%. In 2000, this percentage increased to 44.4%. Between 10 and 14 years, 54.8% of the people were literate in 1991 and this rate increased to 91.6% in 2000. The growth in literacy rates was observed in every age demographic in Maracás, even among the oldest people.
20.4.3 Economic Aspects
In 1991, the average monthly income at Maracás was R$62.10 (eighth place in the region). From 1991 to 2000, the county showed the smallest income growth rate in the region (18.4%). In 2000, its average per capita income was only R$73.50.
The Gini index is a measure of the income concentration and varies from 0 to 1. The closer it is to 1, the worse the income distribution is (income is more concentrated). If the value is closer to 0, the income is more evenly distributed through the population.
In 1991, the best income distribution of all the counties in the micro region was measured in Maracás (0.44). From 1991 to 2000, the income distribution in the counties followed different paths, but income concentration was observed in most of them. In 2000, Maracás still showed one of the best income distributions of the micro region, with 0.5.
The economic activities of the counties of the micro region are highly concentrated in the county of Jequié. Of all the goods produced in the region, Jequié alone is responsible for 45.24%. That means almost half of all the economic activity of the entire region is limited to one county, so, this one county tends to exert a strong attractive force over the others.
The service sector is the main source of income for the counties in the Project's area of influence. However, the economical results of agriculture and grazing activities are also significant. Maracás represents 3.95% of all income generated in the region.
The per capita gross internal product is led by Jequié which remains in front of all other counties with a value of R$7,091.48 per year; this value is greater than the state value of R$6,582.00. Maracás per capita gross internal product (R$2,318.45) is the ninth largest of the micro region. The smallest one of all the 27 counties is Iramaia with R$1,785.93.
20.4.3.1 Production Structure on the Maracás County
There was a reduction in the number of businesses that produced cow milk in Maracás from 1996 to 2006, from 400 milk-producing businesses to 282. Over the same period, cow milk production in the municipality increased by 51% while goat milk production declined 67% and egg production decreased 96% suggesting significant consolidation in cow-milk production.
Seasonal products, particularly sugar cane, beans, and tomato decreased from 1997 to 2006 in Maracás. The only exception was mamona, whose production increased 172%. The area used to grow produce expanded 8.5% over this period.
The total area with permanent crops has been subject to significant changes in the last 10 years. From 1996 to 2006, areas assigned to permanent crops in the county of Maracás shrunk 20%. Coffee production increased from 2000 to 2006, but the 2006 production was smaller than that of 1996. The orange and lemon productions did not change significantly, while passion fruit production fell 89.45% from 1996 to 2000.
20.4.4 Land Use and Occupation
The land use and occupation study focused on the communities around the Project site and on the capital of Maracás County. The study examined public services infrastructure, land management and the dependence of local residents on natural resources (i.e., water resources) considering this is a semiarid region with established water scarcity concerns.
The goal was to provide an adequate view of the area where the effects of the Project will be greatest. This mapping covered the Project's directly influenced area (DIA), which includes all pits, waste rock/ore piles, tailings ponds, processing units and all other operational and administrative support units.
20.4.4.1 Rural Properties
There are four large rural properties in the DIA, averaging more than 2400 ha where extensive and semi-extensive cattle raising activities are carried out, which requires large pasture areas and small bushes. All landowners of these properties visit them regularly and employ a number of employees to run the operations. The facilities that exist in the largest properties include barns and warehouses and all show good construction standards including brick walls. Most of these facilities are sized adequately to the property's production.
The construction standard for the houses of the workers is not ideal, but most of them have electric power supply. Water is supplied through rainwater collection and water trucks. There are only a few houses and due to the size of the properties they are relatively far apart from one other.
There are also three smaller properties in the DIA with only one proprietor living onsite and taking care of the land. Secondary activities include household agriculture and traditional cheese production. Temporary employment is common in the region.
Temporary rural workers live in the nearby villages. Most of these villages are along the main road that connects the highway BA-026 (at the community of Pé de Serra) to the village of Porto Alegre.
20.4.5 Villages around the Project
20.4.5.1 Pé de Serra
Pé de Serra village lies on BA-026 highway in the foothills of the mountains that divide the east-central (upper) and west (bottom) of the municipality of Maracás. The community is characterized by a cluster that was established and developed on the edge of the highway.
Among the communities surrounding the Project, Pé de Serra is the one with the best infrastructure, including power, telephone network, water supply through underground wells, some paved roads and garbage collection. There are inns, small shops and bars. Many homes are vacant waiting for new residents.
There is no sewage collection infrastructure therefore many houses have poor sanitary facilities erected outside the house. Drinking water supply is provided through wells with high levels of salts, necessitating the use of desalination plants operated by the city to make the water potable for human consumption. The water supply is at its limit, and the residences are supplied on alternate days to ensure all have access to water.
There is a Family Health Center and a school that offers elementary school grades. Young people are required to move to Maracás to continue their studies.
20.4.5.2 Água Branca
Água Branca village is located in an area adjacent to the municipal road that connects Pé de Serra and Porto Alegre, east-southeast of the project. Água Branca is the closest town directly affected by the Project. It is characterized as a cluster of typical rural buildings, with houses located on the edge of the road, amid agricultural lands and pastures.
The community has just over 35 homes of farm workers who subsist from the land work in the large surrounding properties. The houses are typically based off a very simple pattern, some using adobe-type construction. Most do not have toilets and water supply is provided from wells which require the use of desalination (Section 20.4.5.1). The main source of income is farm work, with some people providing services for the Maracás Project under a formal contract.
Public transport is limited to a line connecting the center of Porto Alegre to Maracás, with service running a couple of times during the day. School transport is served by buses and vans provided by the municipality of Maracás.
Among the nine communities visited, Água Branca is the one that has the highest expectations regarding the Project. Specifically, residents are viewing the proposed infrastructure (which was suggested at a public hearing) as extremely positive. The infrastructure includes road improvement and the construction of a potable water treatment plant. The water treatment plant for this community has not yet been implemented due to bureaucratic delays at the state government level.
20.4.5.3 Antonio Caetano
The village of Antonio Caetano comprises 10 houses located near the Santo Antonio Farm, owned by Mr. Antonio Caetano Neto. This village is located near the present Project headquarters along the municipal road that connects Pé de Serra to Porto Alegre.
Households are made up of rural workers who survive from the land in large surrounding properties. It is common to see the cultivation of palm and other crops for subsistence farming, such as beans, corn and watermelon within the properties. The survival of such subsistence crops is threatened by low water availability in the region.
The houses are generally very simple in pattern, some of adobe-type construction. Most homes do not have toilets and the water supply is inadequate with the use of wells, rainwater collection systems, and water trucks provided by the city.
Public transport is limited to a route connecting the center of Porto Alegre to Maracás, a couple times during the day. School transport is served by buses and vans provided by the municipality of Maracás.
20.4.5.4 Braga
This village has very similar characteristics to the Antonio Caetano. It is located along a neighboring municipal road that connects Pé de Serra to Porto Alegre, east-southeast of the project.
20.4.5.5 Caldeirãozinho
Caldeirãozinho village is located at the margins of the municipal road near the district of Porto Alegre and follows the pattern of occupancy and structure observed in the other villages in the region.
The buildings are simple, with small areas used to grow subsistence crops. They are served by the electric power grid and have a phone network available. The majority of homes do not have toilets and sewage is held in common pits. The existing trade focuses on Pindobeiras, since the acquisition of products not found in the region are available in Maracás. It has a public school that provides elementary education. The streets are not paved and public transportation is limited to the route connecting Porto Alegre to Maracás.
20.4.5.6 Jacaré
Jacaré village is approximately six kilometers south-southwest from the plant site situated on the banks of the Jacaré River. It borders the municipalities of Maracás and Iramaia and consists of approximately 20 homes of low constructive pattern, some of adobe construction. There is electric power supply to the Village but access to a telephone network is limited. Water supply is limited to individual tanks to capture rainwater or tanker trucks supplied by the City of Maracás.
It is common to have small yards where palm is usually grown for human and animal consumption. There is a school that offers grade 4 elementary education. To continue their education, students go to Porto Alegre.
20.4.5.7 Lagoa Comprida
Lagoa Comprida village is located east-southeast of the project along a municipal road that connects the neighboring villages of Pé de Serra and Porto Alegre. The village has a small number of households comprised of rural and agricultural workers who survive from land deals in the large surrounding properties. It is common to cultivate palm and other crops such as beans, corn and watermelon for subsistence. This village has strong relations with the communities of Água Branca and Antonio Caetano based on their proximity.
The houses follow the same regional pattern with most not having toilets, and the water supplied with the use of wells, rainwater collection systems, and water trucks provided by the city.
Public transport is limited to the same line connecting the center of Porto Alegre to Maracás, a few times during the day.
20.4.5.8 Pindobeiras
Pindobeiras is established at the margins of the municipal road, near the district of Porto Alegre. The village of Pindobeiras comprises 30 houses with a population of 122. Five houses are currently vacant. Houses are simple, but are served by the electric power grid and telephone network. The majority of homes do not have toilets.
According to the local leader, since the population does not receive government assistance for the development of agriculture in the settlement, it develops activities in large farms in Maracás. Public transportation is limited to the service connecting Porto Alegre to Maracás.
20.4.5.9 Porto Alegre
Situated close to the Pedras Dam, Porto Alegre is an urban center comprising predominantly residential of low to medium quality. Community employment is predominantly from fishing and the cultivation of fruits and vegetables at lake banks, including corn, watermelon, and mango. In some areas cattle ranching was identified.
Porto Alegre is the region's most populous village with approximately 250 residences. Residents reported that the increase in the population began with the construction of the railway on the opposite side of the lake.
Infrastructure includes a power grid, public water supply, health services, education and locations for social interaction and leisure. Sanitation is inadequate, with the use of mass pits which have high potential for soil contamination.
The main resource of the Porto Alegre residents is the lake, which provides the water for development of agriculture, fishery and leisure. According to local information, approximately 80 men are engaged in agriculture and fisheries with the most common fish caught being tilapia and piranha. The shrimp fishery is largely staffed by a group of approximately 25 women.
20.4.5.10 Quilombola and Indian Communities
Throughout the Project's DIA (made up of the 27 counties), only the county of Jequie has a Quilombola community that is officially recognized. Quilombola are the descendants of slaves who escaped from slave plantations in Brazil prior to abolition in 1888. The most famous Quilombola was Zumbi and the most famous Quilombo was Palmares.
The people of Maracás consider the communities of Cuscus, Pindobeiras, Caldeirão dos Miranda and Jacaré as being quilombolas, in spite of not being legally recognized by the Palmares Foundation and INCRA (National Institute for Colonization and Land Reconstruction).
There are no Indian communities in the county of Maracás.
The majority of the nine villages within the Project area have less than 24 houses. The exceptions are Pé de Serra and Porto Alegre, which have approximately 220 houses. Most of the houses show humble construction standards, with brick walls and clay. Several houses were built in the 1950s. Many houses have backyards with small plantations and animals for personal consumption. Villages are accessed by a main road and houses are relatively close to one another. The public services are modest with some villages having schools, health clinics and small commercial centers.
All of the nine communities have electric power supply. Porto Alegre has some paved streets. Water is obtained from wells, rainwater collected from rooftops and water trucks supplied by the city. In the case of Porto Alegre, the water is drawn from the Contas River, which is dammed 85 km downstream from the community.
Porto Alegre is the village that shows the best sanitary conditions. The main economic activity for many residents of these villages is working with cattle on the farms. In Porto Alegre, there is also commercial irrigated production of fruits and vegetables.
20.4.5.11 Municipality of Maracás
Maracás is an urban conglomerate located in the central portion of the county on a plateau at a higher elevation than the surrounding valleys. It is a typical town in the interior of Bahia, with a small population that cultivates the habits and customs of their ancestors. Currently known as the "city of flowers", Maracás had a population of 20,393 in 2020.
Downtown Maracás has two main avenues, Brasília and João Durval, and has good urban infrastructure with paved streets, a water supply system (the water is withdrawn from the Boca do Mato reservoir, 9 km away), an electric power supply and telephone lines. There is regular waste collection and street sweeping services making the public avenues much more aesthetically pleasing than many villages. However, there is no wastewater collection system and the domestic sewage is disposed of in pits typically located in the backyard of the houses.
Maracás has legal regulations regarding urbanization, such as those established in the city's development plan.
The tertiary sector, represented by activities of trade and services, is the main source of municipal income and in 2008 it contributed 65% of Gross Domestic Product (GDP).
The agricultural sector plays an important role in the economy of the city with the agricultural sector accounting for 23% of GDP. Labor absorption accounts for 45.7% of registered jobs in 2008.
The city's economy is not diversified, resulting in low employment. The unemployment rate was 19.41% in 2000, exceeding state and national levels. This generates a high number of people living below the poverty line. In 2003, according to IBGE data, 54.63% of the population of the city was below the poverty line.
Commerce and services are distributed along the main avenues and streets. The local commerce is relatively diversified and in harmony with the size of the city. It includes clothing stores, cellular phone shops, furniture stores, house appliance stores, bookstores, construction supply shops, grocery stores, drugstores, and restaurants. Among the institutional services are a branch of the Banco do Brasil, lotteries, post offices, schools, social centers, health clinic, a Catholic Church and an Evangelical Church.
The educational system is made up of eight public schools, which offer elementary and high school courses. Five of these schools are municipal and three are run by the State. There is a private elementary school and private kindergarten schools. The municipal education system is supplemented by kindergartens available for the children that live downtown and in the surrounding neighborhoods.
The local college is called Faculdade de Tecnologia e Ciências (FTC), and has on-line graduation courses including business, biology, mathematics, languages as well as some specialization courses.
Water supply is insufficient for the city. For human supply, the municipality makes use of surface waters (rivers and springs) and underground (wells). The county is supplied by a small dam known as Boca do Mato.
Violence and drug use are the most common social issues. According to a representative of the Judiciary, violence involving young people is increasing with narcotics most often cited as a generator. This scenario may reflect different situations, such as lack of perspective and employment opportunities, and poor choice of leisure involvement with people from different places among many others.
20.4.6 Historical and Cultural Heritage
Maracás is a typical city of the Bahia's countryside with a small population that perpetuates the habits and customs of its ancestors. The name of the city comes from Maracás, which is an Indian tool used by the Cariris tribe that lived in the Paraguaçu region.
According to studies by Prof. Carlos Ott, the Portuguese arrived at the Paraguaçu valley doing exploration research of gold and diamonds and found the Indians. Many bloody battles were fought, resulting in the disappearance of the Indians. These Indians are still remembered today in the history of Maracás as being brave and aggressive warriors.
The influence of the gold cycle on the county can be seen today by the city's architecture, showing houses with styles that are typical of that period. The houses are narrow, with high doors and windows, similar to the ones found in Chapada Diamantina and Ouro Preto.
The Portuguese occupation of the region is evident through the main houses of the farms, in colonial style. One example is the Santa Rita farm, which still keeps the big main house with its 18th century furniture and chapel.
Since the occupation of the region started in the period in which Brazil was still a colony of Portugal, and during which slavery still existed in Brazil, the presence of black people is very pronounced.
According to Prof. Marina Silva, Maracás was one of the five Brazilian towns that hosted Germans during the Second World War. The German presence in the county is clearly seen by the main church's German gothic style architecture, and by other houses in the same style.
Besides the areas of historical and architectural value, there are some areas that are part of the county's natural heritage and should be protected. For instance, the Jequiriça River headwaters park was rebuilt by the municipal government, the Eucalyptus Park, the water spring of Jequiriça River, and mountains of the region.
20.4.6.1 Archaeological Heritage
The report "Programa de Diagnóstico e Prospecção para o Projeto Vanádio de Maracás, Maracás, Bahia" submitted to INEMA and IPHAN (Instituto do Patrimônio Histórico e Artístico Nacional) for the Installation Permit, presents the archaeological studies carried out in 2007 by the company Arqueologia Brasil - Projetos, Pesquisas e Planejamento Cultural e Arqueológico Ltda., whose principal office is in Espírito Santo do Pinhal - São Paulo. The archaeological survey was approved by Acervo - Centro de Referência em Patrimônio e Pesquisa, based on Porto Seguro - Bahia. The leader of the technical team was Prof. Dr. Walter Fagundes Morales (archaeologist and sociologist). The other archaeologists of the team were: Luiz Augusto Vivas, Flávia Prado Moi, Daniel Bertrand e Diego Palma Rocha.
The archaeological studies were authorized through the IPHAN publication N. 162 from July 30, 2007, which deals with the permission to carry out archaeological survey and analysis for the Project, in the county of Maracás, State of Bahia.
The archaeological survey was concentrated in the areas of the mining rights DNPM 870.134/82 and DNPM 870.135/82, where the mineral targets of the Project are located. In these areas, 20 archaeological sites and 62 occurrences of archaeological materials were identified. Every archaeological site and occurrence is identified by its geographical coordinates and described in the report with photographs.
This last stage of the archaeological rescue of artifacts includes archeological heritage education activities. The programs of archaeological recovery and heritage education will be included in the PCA (Environmental Control Plan), which is part of the environmental permitting process for the Project.
20.4.7 Living Standards
The human development index - IDH was created in 1989 to represent the level of development and living standards of a community. The intention of this index is to represent development based on three criteria: life expectancy, education and GDP per capita.
The criterion life expectancy - life expectancy at birth - aims to represent the health condition of a society. In 1991, the Maracás life expectancy index (0.541) was categorized as medium and the county was sixteenth in the micro region. In 2000, the county improved its life expectancy index by 6.7%, reaching 0.577 and achieved the 12th position.
In 1991, generally speaking, the educational indices of the counties in the Project's area of influence were worse than the life expectancy ones. However, from 1991 to 2000, this index increased and overcame the life expectancy values. The Maracás' educational index in 1991 was 0.490 (low). In 2000, this value had increased to 0.714, showing a 59.4% increase and, hence, was classified as medium.
The GDP per capita index is the one that has the smallest contribution to the IDH of the region's counties. In 1991, Maracás had a GDP per capita index of 0.462, placing it in the seventh position out of the 27 counties of the micro region. In the period from 1991 to 2000, the growth of that index in Maracás was only 6.1%, so the county moved down to the fifteenth position, with a GDP per capita index of 0.490.
Out of all the 27 counties located in the Project's area of influence, in 1991, Maracás was in the fourteenth position, with an IDH of 0.498 (low). From 1991 to 2000, the increase in the IDH index of that county was the sixteenth best (22.3%) and its IDH reached 0.609 (medium). As such, the county was in the sixteenth position, losing two positions. The most important of the three criteria, in the case of Maracás, was the education index (0.759).
20.4.8 Education
In 1991, Jequié had the largest average school years of all the counties in the Project's area of influence, and had the same value as the State of Bahia (3.3 years). Maracás' average was only 1.5 years and that placed the county in the ninth position among the counties in the micro region. In 2000, Maracás moved to fifth place with a 73.3% increase in its average school years, reaching 2.6 (still low).
Maracás' position with respect to adult illiteracy (older than 25 years) was 14th in 1991 (56.7%). In 2000, Maracás reduced its adult illiteracy rate to 38.6%.
In general, data showed an improvement in the number of Maracás residents that have educational services. However, additional efforts are needed to reach the educational level of the Bahia State (average of 4.5 school years and illiteracy rate of 28.5% in 2000).
At the municipal and state system, Maracás provides education at three levels: kindergarten, elementary and high school. The rural population has free transportation to the schools, provided by the county administration. The population in the villages located near the area of the Project has access to municipal schools.
20.4.9 Health
The hospital beds available in the Project's area of influence are predominantly privately owned (52.5% or 741 beds). The public hospital beds total 693 or 47.5%.
Maracás has 64 hospital beds, with 40 being municipal owned and 24 privately owned. This represents a ratio of 1.9 beds for a thousand inhabitants; a value that is smaller than the OMS standard. With respect to hospital beds, Maracás occupies the 13th out of the 27 counties of the micro region.
Maracás has one of the worst (26th) healthcare coverage of all the 27 studied counties, with only 67.4% of the population assisted with such programs. Of the 27 counties that make up the micro region, Jequié has the largest number and the greatest variety of medical equipment and is the region's center for medical care. Even so, the medical services are still very precarious.
Maracás has only one piece of X-ray equipment (100-500 mA). Thus, the Maracás' population needs to go to another county if a more complex medical examination is necessary.
In 2008, the healthcare system had six public health clinics; four family health units, one healthcare center, one clinic specialized in birth surgery, and one hospital. There is a shortage of doctors for the urban and rural communities. Due to this shortage, the public health clinics in the rural zone operate with nurses and assistants, while doctors are available usually once a month.
From 1999 to 2005, the main cause of death in Maracás was caused by brain / vascular diseases. Heart strokes were the second and diabetes mellitus and transit accidents were third.
20.4.10 Housing Conditions and Infrastructure
In the last census (2000), Maracás had 7,430 families living in private houses (31,678 people) and 7,430 people declared they provided money for their family; 5,288 were spouses; 16,330 were sons and daughters; 152 were parents or mother / father in law; 1,035 had another type of relationship, and 220 had no family relationship with the owner of the house.
According to the same census, there were 6,832 houses with adequate sanitary installations in Maracás. Out of these 6,832, 28% had treated water supply, 0.9% wastewater collection, and 76.7% had proper waste disposal.
The data from the last census shows that, though the population of Maracás does not have easy access to basic consumption goods (refrigerators, etc.) or to sanitation services, the housing conditions are not as bad as that seen in many large urban centers, mainly with respect to the number of people per room.
The Maracás' water supply system has 2,914 active water connections, supplying water to 18,533 inhabitants, through a 58-km-long network. The county does not have a sewage collection network, so wastewater is disposed of by individual households.
The public cleaning services are limited to the county's capital and includes tree trimming, street sweeping and waste collection. The waste is disposed of at a simple landfill that started in November 2005.
The city does not have a rainwater drainage system, but the reconstruction of the BA-026 (connects Maracás to Contendas do Sincorá) includes storm water drainage adjacent to the road.
The following roads are used to get to Maracás: BA-026 (Maracás /Contendas do Sincorá), BA-250 (Maracás /Lajedo do Tabocal) and BR-330 (Maracás /Jequié). There is a bus station, where the inter-municipal routes connect to Salvador, Vitoria da Conquista, Iramaia, Jaguaquara, Jequie, Ilheus and Porto Seguro, and interstate routes from Rio de Janeiro and São Paulo arrive. The county has a landing strip called Luís Eduardo Magalhães.
Maracás also has a community radio station, loud-speaker services, telephone lines, cellular coverage, post offices and four small newspapers. The TV broadcasts are TV - Sudoeste, Aratú, TVE Bahia and Bandeirantes.
There is a municipal market on Saturdays when products from Maracás and Jaguaquara are sold including live animals (i.e. pigs, goats, chicken, ducks), cereals, grains, vegetables and meat. Almost all the products and meat consumed in the county are produced locally. The cereals are brought from other cities in the southeastern region.
20.4.11 Leisure, Tourism and Culture
The cultural aspects of Maracás are intimately related to the religion of the population. The most important cultural events, both in the rural and urban zones, show traces of popular Catholicism mixed with enjoyment. The main events of the county are: Ternos de Reis, Festejos Juninos (Trezenas de Santo Antônio e São João), Festa de São Roque, Festa de Nossa Senhora da Graça and Cosme e Damião.
The city has a few public leisure areas, such as the Eucalyptus Park, where environmental institutions are located (ADAB, EBDA, Production Secretary and Flower Project of Maracás). The park is also used for various sports. Besides this park, there is the park of the springs of the Jequiriçá River, where there are ecological tracks, sports court and municipal squares.
There are also very few leisure areas in the communities surrounding the future Project area. Most of the villages have only small soccer fields. The exception is Porto Alegre that has a sports court built by the municipal government.
20.4.12 Public Safety
Maracás' public safety is ensured by the 19º Batalhão da Polícia Militar (Military Police) by the 4ª CIA de Polícia Comunitária (Communitarian Police), by Delegacia de Polícia Civil (Civil Police Delegacy) and by the Guarda Municipal de Maracás (County Police).
The Military Police is composed of 14 police officers and 1 vehicle. This structure is enough to ensure the public safety of the county and the services provided include: rural surveillance, school surveillance, road blocking at night and drug traffic combat, among others.
The Civil Police has five officers and five public agents, as well as one vehicle. There is no fire department in the municipality.
20.4.13 Property Disputes and Rural Settling
There are no property or land disputes in the Project's DIA. There is a program for rural settling (Pakhaeta) at the California Farm, village of Pindobeiras. The area available for settling is 2035 ha and is large enough to settle 63 families. The registration process is underway. All the people to be settled will be rural workers in the region.
20.4.14 Water Supply
The water sources for human consumption include surface water bodies (rivers and springs) and groundwater (wells). The public raw water comes from a small dam called Boca do Mato. The villages of Porto Alegre and Pindobeira obtain their water from the reservoir of the Pedras dam, Contas River. The other villages get their water from wells and water trucks.
Due to the fact that it is located in the margin of the Pedras dam, the community of Porto Alegre can use the water from the Rio de Contas for various purposes, including irrigation, leisure and fishing. These multiple water uses do not occur in any other village in the region.
With irrigation and fertile soils, the rural properties of Porto Alegre deliver fruits for export (mango, papaya and cashew) and vegetables for the regional market. Nevertheless, irrigation is not a threat to the supply of water for human consumption, because the lake volume is approximately 1,750 million m3.
Although the fruit production is very large at Porto Alegre, fishing is still the most important economic activity in the district of Porto Alegre. Besides fishing, the people also produce fresh water shrimp to be sold in Jequié.
Navigation is done only in the Pedras dam, but it is restricted to small fishing boats and a special boat that transports goods and people among Porto Alegre, Jequié and Iramaia.
The reservoir is also used for leisure purposes such as carnivals and other events, when tents and public shows are set up.
20.5 Environmental Impact Assessment, Mitigation and Compensation
This is based on a technical report prepared by Mineral Engenharia em Meio Ambiente Ltda, an independent consulting company retained by Largo in 2011 to carry out an Equator Principles Compliance Audit in the Maracás Vanadium Project (the "Audit Report").
The Audit Report focused on the aspects recognized by Principle 2 - Environmental Assessment, and as advocated, it identified and discussed the impacts and relevant social and environmental risks of the project, during the phases of installation, operation and decommissioning. Furthermore, it examined the proposed controls, monitoring programs and mitigation measures and appropriate management programs for enforcement of the principles.
20.5.1 Physical Environment
20.5.1.1 Erosion and Silting of water bodies
The excavation, removal, and storage of soil creates points susceptible to erosion resulting in laminar flow of rainwater, which can generate localized silting. The deforested areas, the excavated slope, openings of access roads, and water catchment systems are all susceptible to low-level erosion. This is due to low annual precipitation and the smooth topography in the DIA. During periods of short, intense rainfall, solids removal and silting of the João River and Jacaré River can occur.
Environmental, Health and Safety Guidelines for Mining establish some protocols and procedures (best management practices) to be considered for the prevention of erosion processes and settling in industrial and mining activities. To decrease the incidence of erosion processes in the area and settling of water bodies, the project has implemented several mitigation measures, including the implementation of the various measures proposed in the PRAD (Plan of Rehabilitation of Degraded Areas). An example is the erection of protection barriers for the North and South ridges around the Campbell pit to avoid sediment being washed inside the pit.
The access routes will be constructed with drainage channels to drain off rain water for a containment basin, where the sediments will be cached. The channels are designed for the rainy season (i.e., peak rainfall).
The existing water bodies in the project, specifically the João and Jacaré Rivers may have their quality affected by solids and dissolved or suspended substances washed from the installations. Groundwater contamination can occur from the infiltration of water impacted by mine contact water or other sources of surficial contamination. Potential contamination point-sources include:
- Waste piles;
- Non-magnetic tailings ponds;
- Leached calcine tailings dumps;
- Chloride purge tailings ponds;
- Storm water drainage system;
- Effluent from the processing plant;
- Oily effluent.
20.5.1.2 Waste piles
The project will feature external waste (rock) dumps or piles generated from the mining of various open pits. The waste material originating from the open pits, which will be placed in a waste pile or catchment dyke, is predominantly rock consisting of boulders of varying sizes. The area destined for the Campbell Pit Phase 1 waste pile covers approximately 47 ha and the area destined for the Campbell Pit Phase 2 waste pile covers approximately 119 ha. The waste piles for the satellite pits vary in size ranging from 16 ha to 55 ha.
To assess the potential for leaching of mine rock waste into groundwater or surface water, SGS Laboratories undertook leaching and solubility testing of representative waste materials. This analytical work was undertaken following procedures regulated by the Brazilian Association of Technical Norms-ABNT, according to NBR 10.004/2004.
To assess the potential for acid generating materials (i.e., acid rock draining, or ARD), three types of rocks were submitted for analysis by ABA-M tests for prediction of acid drainage.
Table 20-3 and Table 20-4 show the results of these analyses and Table 20-5 presents the Neutralization Potential Ratio (NPR) Screening Criteria (after Price et al, 1997) in English.
Table 20-3: Test work results - ABA-M - Waste Rock- Campbell.
N | Rock | Sample Reference | PN(1) | PA(2) | PNA(3) | Potential
Acid
Generation | RPN (4) | Potential
Acid
Generation |
Em t CaCO3 equiv./ 1,000t
rock |
1 | Gabbro | Top extract - 12 to 60 | 3.0 | <0.01 | 3.0 | Potential | 3.0 | Potential |
2 | Medium extract - 60 to 100 | 2.0 | <0.01 | 2.0 | Potential | 2.0 | Potential |
3 | Lower extract - below 100 | 11.5 | <0.01 | 11.5 | Potential | 11.5 | Potential |
4 | Pyroxenite | FGA 61 - LML 7364 | 8.5 | <0.01 | 8.5 | Potential | 8.5 | Potential |
| FGA 67 - LML 7369 - Test 1 | 214.0 | <0.01 | 214.0 | Potential | 214.0 | Potential |
5 | FGA 67 - LML 7369 - Test 2 | 224.0 | <0.01 | 224.0 | Potential | 224.0 | Potential |
6 | FGA 68 - LML 7371 | 12.0 | <0.01 | 12.0 | Potential | 12.0 | Potential |
| FGA 76 - LML 7375 - Test 1 | 10.5 | <0.01 | 10.5 | Potential | 10.5 | Potential |
7 | FGA 76 - LML 7375 - Test 2 | 11.8 | <0.01 | 11.8 | Potential | 11.8 | Potential |
8 | FGA 79 - LML 7378 | 10.0 | <0.01 | 10.0 | Potential | 10.0 | Potential |
9 | FGA 86 - LML 7387 | 9.7 | <0.01 | 9.7 | Potential | 9.7 | Potential |
| FGA 96 - LML 7395 / 7396 - Test 1 | 13.5 | <0.01 | 13.5 | Potential | 13.5 | Potential |
1 | FGA 96 - LML 7395 / 7396 - Test 2 | 11.8 | <0.01 | 11.8 | Potential | 11.8 | Potential |
1 | FGA 99 - LML 7398 | 11.0 | 1.2 | 9.7 | Potential | 9.7 | Potential |
1 | Pegmatite | LML | 13.0 | <0.01 | 13.0 | Potential | 13.0 | Potential |
Notes | Interpretation of ANP Values and RPN |
(1) | PN = Potential neutralizing | PNA < -20 | Probable generation |
(2) | PA = Potential rock acid | -20 < PNA < +20 | Uncertainty zone - test with RPN or more methods |
(3) | PNA = Neutralization potential assessed = PN - PA | PNA > +20 | Non Acid Generating |
(4) | RPN = Potential ratio of neutralization = PN/PA | | |
| RPN < 1.0 | Probably generation of |
| | 1.0 < RPN < 2.0 | Possible generation of |
OBSERVATION: Test performed in the
laboratory of SGS GEOSOL in Belo
Horizonte - MG, in December of 2007 in
sample (drill core) collected by the client in
the field, Campbell, municipality of Maracás,
State of Bahia. | 2.0 < RPN < 4.0 | Small generating potential |
| RPN > 4.0 | Potential to generate acid |
Table 20-4: Test work results - ABA-M- Waste Rock- Campbell.
No | Rock | Sample Reference | Residue
Type | Class IIB | Class
IIA | Class I | Observation |
Not Dangerous | Dangerous |
Inert | Not
inert | Corrosive | Reactive | Toxic |
1 | Gabbro | Top extract - 12 to 60 m | Solid and dry | Yes | No | No | No | No | None |
2 | Medium extract - 60 to 100 m | Solid and dry | No | Yes | No | No | No | Aluminum above the VMP |
3 | Lower extract - below 100 m | Solid and dry | Yes | No | No | No | No | None |
4 | Pyroxenite | FGA 61 - LML 7364 | Solid and dry | Yes | No | No | No | No | None |
5 | FGA 67 - LML 7369 | Solid and dry | No | Yes | No | No | No | Arsenic and Aluminum above the VMP |
6 | FGA 68 - LML 7371 | Solid and dry | Yes | No | No | No | No | None |
7 | FGA 76 - LML 7375 | Solid and dry | Yes | No | No | No | No | None |
8 | FGA 79 - LML 7378 | Solid and dry | Yes | No | No | No | No | None |
9 | FGA 86 - LML 7387 | Solid and dry | Yes | No | No | No | No | None |
10 | FGA 96 - LML 7395 / 7396 | Solid and dry | No | Yes | No | No | No | Aluminum above the VMP |
11 | FGA 99 - LML 7396 | Solid and dry | Yes | No | No | No | No | None |
12 | Pegmatite | LML 7372/80/84/85/91/94 | Solid and dry | Yes | No | No | No | No | None |
Table 20-5: Neutralization Potential Ratio (NPR) Screening Criteria (after Price et al, 1997).
Potential for ARD | Initial NPR Screening Criteria | Comments |
Likely | <1:1 | Likely ARD Generating |
Possibly | 1:1 - 2:1 | Possible ARD generating if NP is sufficiently reactive or is depleted at a faster rate than sulphides |
Low | 2:1 - 4:1 | Not potentially ARD generating unless significant preferential exposure of sulphides along fracture planes, or extremely reactive sulphides in combination with insufficiently reactive NP |
None | >4:1 | No further ARD testing required unless materials are to be used as a source of alkalinity |
NPR=NP/AP (RPN = PN/PA) | NP = neutralization potential = PN | AP = acid generation potential = PA |
The analytical results indicate that gabbro, which constitutes the largest component of the waste rock, has a low potential for acid generation (potentially acid generating; PAG). The remaining rock types (pyroxenite and pegmatite) are not considered to be potentially acid generating (i.e., Non-Acid Generating; NAG) with all NPR/RPN values in excess of 4 (8.5 to 224 for pyroxenite; 9.7 to 13.5 for pegmatite).
20.5.1.3 Non - Magnetic Tailings Ponds
The non-magnetic tailings ponds are formed from the deposition of weakly magnetic or non-magnetic minerals obtained from the magnetic separation of titano-magnetite ore after grinding and filtering. This tailings structure was designed and incorporated into the industrial layout as an alternative solution to conventional tailings deposition in the Jacaré River valley, in order to protect and preserve an arborous caatinga area near the mine site.
The magnetite rock was subjected to acid drainage prediction tests, solubility testing and leaching of heavy metals, in accordance with the norms of ABNT. The results of such testing are shown in Table 20-6 and Table 20-7 below:
Table 20-6: Test work Results - ABA-M -Magnetite Rocks- Campbell.
N | Rock | Sample Reference | PN (1) | PA (2) | PNA (3) | Potential
Acid
Generation | RPN (4) | Potential
Acid
Generation |
Em t CaCO3 equiv./ 1,000 t rock |
13 | Magnetite | Top extract - 12 to 60 m | 13.50 | < 0.01 | 13.50 | Potential uncertain | 13.50 | Potential non-existent |
| Medium extract - 60 to 100 m - Test 1 | 22.20 | < 0.01 | 22.20 | Potential non-existent | 22.20 | Potential non-existent |
14 | Medium extract - 60 to 100 m - Test 2 | 19.20 | < 0.01 | 19.20 | Potential uncertain | 19.20 | Potential non-existent |
15 | Lower extract - below 100 m | 3.00 | < 0.01 | 3.00 | Potential uncertain | 3.00 | Small potential |
Notes | Interpretation of ANP Values and RPN |
(1) | PN = Potential neutralizing | PNA < -20 | Probable generation |
(2) | PA = Potential rock acid | -20 < PNA < +20 | Uncertainty zone - test with RPN or more methods |
(3) | PNA = Neutralization potential assessed = PN - PA | PNA > +20 | Rock not producing acid |
(4) | RPN = Potential ratio of neutralization = PN/PA | | |
| RPN < 1.0 | Probably generation of acid |
OBSERVATION: Tests performed in the laboratory of SGS GEOSOL in Belo Horizonte - MG, in December of 2007, in samples (drill core) collected by the client in the field Campbell, municipality of Maracás, State of Bahia. | 1.0 < RPN < 2.0 | Possible generation of acid |
2.0 < RPN < 4.0 | Small potential for acid generation |
RPN > 4.0 | Potential non-existent acid generation |
Table 20-7: Test work Results - ABA-M -Magnetite Rocks- Campbell.
No | Rock | Sample
Reference | Residue
Type | Class IIB | Class
IIA | Class I | | | Observation |
Not Dangerous | Dangerous |
Inert | Not
inert | Corrosive | Reactive | Toxic |
13 | Magnetite | Top extract - 12 to 60 m | Solid and dry | Yes | No | No | No | No | None |
14 | Medium extract - 60 to 100 m | Solid and dry | Yes | No | No | No | No | None |
15 | Lower extract - below 100 m | Solid and dry | Yes | No | No | No | No | None |
As shown in Table 20-6 only the magnetite originating from the 100 m level horizon has a (low) potential of acid generation. The upper and middle magnetite has no acidic drainage generation potential.
According to the results presented in Table 20-7, this residue was classified as inert (class IIB) according to ABNT NBR 10.004/2004. Therefore, the risk of leaching and infiltration of dissolved constituents into the soil from the reaction in the stack with rainwater is not anticipated.
According to the design of the tailings facility the first cell will be sealed and monitored as a precaution. The design of the final drainage system for the system will be done after completion of all the "ponds".
20.5.1.4 Calcine Residue Stack
The calcine residue tailings consist of synthetic hematite (calcined magnetite) that will contain, regardless of the effectiveness of the leaching and filtering processes, some residues of vanadium and sodium salts soluble in the form of sodium vanadate (NaVO3, Na3VO4, Na6V10O28).
This material is stacked in a lined and impermeable structure after filtering and washing. The residue stack was formerly wetted by sprinkling water on top of it, progressively washing for removal of soluble salts. The solution will be collected in tanks and returned by pumping to the metallurgical plant thereby limiting potential infiltration into the subsurface.
The residue remaining on the stack is considered a Class I (dangerous), and the leaching pad is fully waterproof with high density dual layer polyethylene.
This material is not being sold, however Largo continues to explore opportunities to sell this material as iron ore. The report considered that this material will be stored in appropriate areas (calcined dams).
20.5.1.5 Chloride Salts Residue Pond
The chloride salt pond contains a solution rich in chlorine, present in the purging of the evaporation system. The effluent flow is in the order of 2.9 m³/h, arranged in a dam type structure ("pond") lined with high density polyethylene, dual layer.
20.5.1.6 Storm Water Drainage System
Each area of the plant has a containment reservoir in which rainwater and washing water from process will be continually collected and recirculated.
20.5.1.7 Waste Oil Effluent
The maintenance of machinery, vehicles and equipment is a potential source of effluent (impacted discharge water) containing oils and greases and other chemicals. The generation of this effluent or contamination can occur in storage and work areas throughout the project development lifecycle.
To mitigate the possible impacts on the quality of surface and groundwater resources, the Project will implement the following measures:
- Solid material from the tailings ponds as the solution percolates will be systematically and periodically sampled and tested to determine the concentrations of soluble vanadium salts. Upon confirmation of tailings neutralization as class IIB (non-hazardous and inert) based on ABNT NBR 10,004/2004, the stack will be covered with sterile/unreactive rock and soil and vegetated;
- The plant is designed to not generate effluent other than chlorine salt solution, which is sent to a dike designed for evaporation. All other solutions are recycled back in the process;
- An ETS (Effluent Treatment System) has been installed for sanitary effluent treatment and is currently in operation until the end of commissioning and installation phases. The ETS will be decommissioned after this period. The effluent from the ETS is recirculated to the tank and used to wet the calcine leach pad. The effluent from the ETS is assessed under the Effluent Monitoring Program with quarterly analysis of physiochemical parameters including, at a minimum: pH, BOD (Biochemical Oxygen Demand), suspended solids, dissolved solids, total coliforms, color, turbidity, nitrates, nitrites, total nitrogen, total phosphorus, sulphates and sulfides;
- Each plant area has a containment tank where rainwater and washing water is continually collected and recycled back to process water and all impoundment structures and yards (non-magnetic tailings pond, calcine pond, chloride pond, waste and ore piles), must have containment barriers that prevent the contamination/sedimentation of natural drainage;
- The Plan for Monitoring and Quality Control of Surface Water, Groundwater and Sediment (an Environmental Management Plan) outlines biannual sampling of 14 points for surface water and sediment collecting and 10 wells for monitoring groundwater;
- Mechanical repair areas are equipped with waterproof flooring with collection systems and water/oil separators and are constructed in accordance with legal standards and compatible with the estimated flows to control wastewater and oily effluent. The effluent from oil and water separators is sampled quarterly for pH, BTEX (Benzene, Toluene, Ethylbenzene, and Xylene), TPH (total Petroleum Hydrocarbons) and oils, greases, and lubricants.
20.5.1.8 Leachate Spill - November 22, 2015
On November 22, 2015, a leachate spill occurred outside the waterproofed area of the Leaching Plant. The incident occurred due to a failure of a part of the belt filter tray, which collects the solution containing soluble vanadium mixed with solid calcined material (hematite) resulting from cleaning the belt filter cloth. Because the tray fell, material that is normally pumped to the storage tanks fell on the waterproofed area, under the filter. Due to the elevated volume and high density of the soils, the sump pump on the waterproofed area was swamped (flooded) and had failed. Ultimately, the solution on the waterproofed surface ponded and discharged to the area adjacent to the Leaching Plant. This impacted the drainage used for rainwater and affected the area's naturally dry natural drainage. It is estimated that approximately 20 m of natural drainage was impacted by the spill.
A portable pump was immediately installed to direct additional solutions back to the storage tanks. The total spill volume is estimated at 10 m3 with 60 grams of V2O5 per litre
In order to minimize the impacts from the spill, the following measures were immediately implemented:
- Suspension of activities until the tray was changed and the pumping system regularized;
- Solution that remained in ponds near the plant and in the rainwater drainage channel was pumped to the storage tanks located at the Leaching Plant;
- Rainwater was blocked from the drainage channel with a masonry wall to prevent solution from affecting the natural drainage;
- Following the initial response, additional mitigation measures were implemented including:
- Cleaning and removal of the solution pools after the drainage channel as well as in the area's natural drainage.
- The affected area and natural drainage were cleaned with water with the rinsate collected at barriers downstream of the impacted area. The water was then pumped into a water truck for transportation and proper disposal in the calcine basin.
20.5.1.9 Soil Contamination
The Solid Waste Management Program presents guidelines for the packaging and disposal of waste generated in the project. The plan identifies the waste types, volume of generation, packaging and disposal of all waste generated in all the project phases. It also presents a list of recycling companies that should be intended for recyclable waste.
A landfill project near the industrial area has been recently approved by INEMA for disposal of non-toxic wastes. The sludge generated in the ETA will be wrapped in a drying bed to separate solid and liquid phases and prepared to be donated to the nearby potteries.
20.5.1.10 Change in Air Quality
Fugitive dust from moving vehicles on unpaved access roads and ore and waste stockpiles, particularly in the dry period, generates and mobilizes particulate material. The operation of machinery and equipment will generate dust and atmosphere gases resulting from the combustion of diesel in combustion engines, which can potentially result in a change in air quality in the vicinity of the Project.
In the comminution process (reduction of the ore to small particles or fragments), primary crushing will also generate particulate material. In the calcination stage, kiln emissions will contain SO2, CO2, and H2O. All the sulfur contained in the feed (reagents and fuel) is converted to SO2 and, in smaller proportions, to SO3. The chlorine present is converted into gaseous HCl and released into the furnace.
A scrubbing system will be installed for MVA dust (Ammonium Metavanadate; NH4VO3) recovery during the MVA drying process.
The ammonia removal system will comprise a scrubbing system to remove any ammonia residue. Sulphuric acid reacts with ammonia to produce ammonium sulfate, which will be pumped into the reagent recovery system.
The future production of ferrovanadium will be by aluminothermic reaction (chemical reduction by aluminium) which does not use an electric furnace. The fumes generated in the process of casting will be extracted by a hood and passed by bag filters for removal of particulates. Dust collected will be re-routed to the furnace.
In order to verify the emission impacts from pollutants sourced from the Project on air quality in the regions close to the project, atmospheric dispersion modelling was undertaken with base case scenarios of FeV and V2O5 production. The mathematical simulation (analytical model) was redone in December 2015 by SECA (Sistema de Estudos Climáticos e Ambientais), an independent consulting company, based in São Paulo. This new set of mathematical simulations were completed with the last generation EPA-AERMOD model, using:
- Two years of weather data collected from the company's site meteorological station;
- Terrain topography;
- Pollutant emission data generated by the plant's five stacks monitoring system;
- The escape parameters on a grid of the domain area of 2,500 km2 in the municipality of Maracás, State of Bahia.
Table 20-8 and Table 20-9 show the results of atmospheric emissions for the production scenarios, according to Atmospheric Dispersion modelling completed by SECA in 2015.
Table 20-8: Maracás Vanadium Plant Atmospheric Emissions.
Scenery | Sources | Emission Rates (g/s) |
NOx | SO2 | MP | V | NH3 |
Ferro
Vanadium
FeV | Kiln off gas | 23.1 | 120 | 0.59 | 0.005 | 0 |
AMV Flash Dryer | 1.2 | 0.28 | 0.1 | 0.045 | 0 |
AMV Reduction Kilns | 0 | 0 | 0.04 | 0.023 | 9.1 |
FeV Furnace Baghouse | 0 | 0 | 0.02 | 0.001 | 0 |
Quench Scrubber | 0 | 0 | 0.14 | 0.026 | 0 |
Screen Dust Collector | 0 | 0 | 0.56 | 0.002 | 0 |
Crushing Dust collector | 0 | 0 | 0.83 | 0.002 | 0 |
Vanadium
Pentoxide
V2O5 | Kiln off gas | 23.1 | 120 | 0.59 | 0.005 | 0 |
AMV Flash Dryer | 1.2 | 0.28 | 0.1 | 0.045 | 0 |
AMV De-ammoniator Kiln | 0 | 0 | 0.07 | 0.029 | 19.7 |
Quench Scrubber | 0 | 0 | 0.14 | 0.026 | 0 |
Screen Dust Collector | 0 | 0 | 0.56 | 0.002 | 0 |
Crushing Dust collector | 0 | 0 | 0.83 | 0.002 | 0 |
The modelling results indicate that independent of the regulated pollutant, there is no violation of air quality standards in the short and long term of CONAMA resolution No. 3/90 or IFC standard regulations.
As shown on Table 20-9, the maximum daily average concentration of SO2 was 7.3 µg/ m3 for the current short time (24 hrs) scenario. This value represents 2.0% of the daily CONAMA standard for SO2 of 365 µg/ m3 and 5.84% of the daily IFC standard of 125 µg/m3. The maximum point is found inside the industrial facility.
Table 20-9: Maximum Long-Term Plant Emission Concentrations.
Pollutant | Maximum Concentrations (µg/m3) - 24 hours |
MP10 (24h) | SO2 (24h) | NOx (1h) | Vanadium, V. (24h) | NH3 (24h) |
Scenario 1 FeV Production | 2.3 | 7.3 | 1.0 | - | - |
Scenario 2 V2O5 Production | 2.3 | 7.3 | 1.0 | - | - |
Primary Standard CONAMA 3/90 | 50 (Year) | 80 (Year) | 100 (Year) | - | - |
Equator Principles | 35 (Year) | 50 (Year) | 40 (Year) | - | - |
Maximum annual average concentration of SO2 is 0.63 µg/ m3 for long term (one year). This value represents 0.79% for the annual standard of CONAMA 3/90 for SO2, 80 µg/ m3, and 0.50% of the annual IFC standard of 125 µg/ m3. The maximum point was identified inside the industrial facility.
Maximum hourly average concentration of NOx was 20.5 µg/ m3 for the short term (24 hrs) current production scenario. This value is 15.6 times smaller than the default zone of CONAMA 3/90 for the NO2 of 320 µg/ m3 and 9.76% times smaller than the default zone of the IFC for the NO2 of 200 µg/ m3. Maximum annual average concentration of NOx was 1.0 µg/ m3, for both scenarios. This value represents 1% of the annual CONAMA standard of NO2 100g/m3 and 2.5% of the annual IFC standard of NO2 40 µg/ m3. The maximum point was identified to the east approximately 3.11 miles distant from the project.
It will be necessary to develop a new dispersion model for the expansion scenario. The quantities of pollutants (apart from SO2) are expected to increase coincident with an increase in the volume of gas and increasing stack exit velocities. This expected increase will result in different dispersion levels; however, the levels are expected to be within the approved ambient air guidelines. A new dispersion model will be developed to confirm this expectation.
The mine owns and operates an atmospheric emission abatement system consisting of an electrostatic precipitator on the rotary kiln exhaust system and baghouses on different dust generating equipment. The emissions are monitored for the following pollutants on a biannual basis: MP, NOx, SOx, V and NH3.
The Air Quality Monitoring program operates three monitoring stations in the area. The three stations monitor on a monthly basis the following parameters: SOx, NOx, MP, V and NH3.
For combustion gas emissions on mobile sources, the mine uses preventive maintenance and control of emissions from vehicles, equipment and machinery in order to ensure that operational conditions are per normal standards. The frequency of maintenance of the fleet to control emission of pollutants is set out as per equipment standards.
20.5.1.11 Change in Noise Levels
The sources of noise in the study area will be linked to the movement of small vehicles, trucks, machinery and equipment used for the opening of access roads, preparation of mine site and infrastructure.
During the operation phase there are activities with intense movement of machinery and equipment that can change the sound pressure level, mainly in the areas of mining and processing. The use of explosives for blasting and the activities carried out in day-to-day life (workshops, offices, cafeterias and other) are also sources of noise.
The community closest to the location of the mine is the village of Água Branca, located about 4 km from the processing plant and mine. Considering the distance of the communities to the installations, the sound levels in these communities will be impacted by moving vehicles, machines and equipment near the villages of Água Branca and Pindobeiras.
A Noise Monitoring Program has been established with points and periodicity defined. To mitigate the impacts of increasing sound levels in the vicinity of the installations, the project proposes the following mitigating measures:
- The purchase of machinery and equipment with low noise potential;
- Establish routine procedures for motor inspection and preventive maintenance;
- To focus the activities of greater intensity of noise during the day, preferably between 8:00am and 5:00 pm;
- The Noise Monitoring Program calls for biannual monitoring during operation phases, at the same locations used to determine the baseline data.
In addition to the measures proposed by the project, the audit report suggested that the noise monitoring points should be reviewed every six months to check for new developments, changed conditions, and impacts in the vicinity of the project.
20.5.2 Biotic Environment
20.5.2.1 Fauna
Fauna environmental impacts occur from vegetal suppression, earth-moving, soil exposure, solid waste generation including organic food, atmospheric emissions, fugitive dust and gases, noise, machines and vehicles traffic on the roads, and the changes introduced to ecological corridors through mine activity.
Vegetation suppression may unintentionally cause loss of fauna occupation and land use change. In the areas with the occurrence of amphibians and reptiles, a more intense impact due to suppression of vegetation may have caused reduction of individuals. Removal of vegetation had a more intense impact on birds during the deforestation period, when dispersion of several species of birds in search of refuge, food and safer areas in the surrounding areas occurred.
According to the data, the identified endangered species are not restricted to a single habitat, but instead occupy various habitats and are inferred to have sufficient living area. The endangered fauna, mainly characterized by mammals (cats) are not restricted to the area of the project and move around easily. Another aspect that can mitigate this impact is that the region offers a good amount of natural environment where fauna can roam.
The presence of extensive vegetal refuges (i.e., areas unmodified or only slightly modified by human activity) can support the mammals in dispersion, with good environmental quality and connectivity, and may encourage the displacement of mammals and birds in search of refuge, food and security.
Similarly, the conservation of the João River valley (former proposed location for the tailings dam) will also mitigate this potential fauna impact by providing shelter, as it is located in close proximity to the area to be suppressed. The herpetofauna will have some of their representatives dispersed to adjacent areas, but it can also experience loss of local populations. Negative ecological interaction amongst displaced species may result in loss of fauna, predominantly through food and space competition and potential predation.
Deforestation eliminates habitats where wildlife acquires food and shelter, and where wildlife has places to roam. Preserving areas with pristine vegetation in the surrounding areas of the mine site will reduce this impact and, in accordance with the standard 8 item 6 of IFC (International Finance Corporation), a net loss of biodiversity should be avoided. The requirement is a compensation of losses by creating ecologically comparable areas for the preservation of biodiversity.
According to the potential and realized impacts, and to minimize the loss of wild fauna due to suppression, the project environmental management plan proposes the following plans and programs:
- The Plan for Deforestation Actions. The main objective of this plan is to minimize the loss of local fauna by ensuring that deforestation actions are performed in a progressive manner and oriented in a single direction. This is intended to create opportunity for the spontaneous movement of animals into new areas and provide mechanisms and actions to prevent unauthorized intervention. The plan also supports the presence of professional experts in wildlife management before and during the deforestation actions for the rescue and salvage of fauna;
- The Fauna Rescue and Relocation Plan. The objective of this plan is to rescue and relocate fauna individuals unable to escape through the passages that would be created by the previous Plan. The plan also provides for a Fauna Provisional Rehabilitation Center with infrastructure and equipment required for such activity in order to facilitate the management of individuals saved in the area of the project;
- Acquisition and legal establishment of a conservation area with 2178 hectares of pristine arboreous caatinga, San Conrado Farm, Municipality of Iramaia; This is well beyond the minimum legal requirement (Law nº 4771, September 15, 1965, Código Florestal).
20.5.2.2 Flora
Vegetation suppression directly and indirectly impacted the flora in the Project Direct Influence Area (DIA). The estimated total vegetation affected by suppression is 150.48 ha, typified by bushy Caatinga, bushy/dense Caatinga, bushy/arboreal Caatinga and dense/arboreal Caatinga. The existing biome is at different stages of conservation and diversity.
The potential impact of the project on the flora is negative based on the studies completed to date. The potential impact will have direct and local coverage, because it acts on the directly affected area (DAA) and the direct influence area (DIA), interfering negatively in the dynamics of surrounding populations.
To minimize those potential impacts, it is proposed that ethnobotanical programs be established (through targeted management) to encourage the continuation and multiplication of identified endangered species that have historical-cultural value and are rare. Such a program requires the collection of seeds and seedlings of species (forms of germplasm), for their germination/development in the nursery and the eventual reintroduction to the natural environment. For the success of this program, it is important to identify an appropriate location for the maintenance of seedlings/seedling and training of staff.
20.5.3 Environmental Mitigation
The environmental mitigation plans shown in Table 20-10 and Table 20-11 were proposed as part of the measures to reduce the overall environmental impacts of the Project and were complied with during the different stages of the construction period.
These mitigation measures are intended to facilitate the preservation of the current natural conditions of the site and to reduce the risks that could compromise worker health and safety in a practical, feasible framework.
No conditions were observed by Mineral during their Project audit that would compromise the environment and worker safety. The Project has a very strong commitment to preserve natural resources and to improve the current social conditions at the Maracás micro region.
Table 20-10: Mitigation Measures - Operations Phase.
Subject | Mitigation Measure |
Erosion | Ditching and Silt Catchment |
| PRAD - Plan of Rehabilitation of Degraded Areas |
Land use | Erosion Control Program |
Fauna | Environmental Training and Awareness Campaign |
| Environmental Compensation Program - Legal Reserve |
Flora | Erosion Control Program |
| Environmental Compensation Program - Legal reserve |
Surface/underground water | Discharge Management Program |
| Water Monitoring Program |
| Remediation Program |
Storm Water Drainage | Storm Water Natural Drainage Modification Plan |
| Remediation Plan |
Soil | Erosion Control Program |
| Soil remediation Plan |
Noise | Noise Monitoring Program |
| Maintenance Program |
Air Quality | Dust Control |
| Monitoring Program (MP, NOx, SOx, CO, V, and NH3) |
| Maintenance Program |
Waste Material Disposal | Waste Management Program |
Workers' Safety | Accident Prevention Plan |
| Emergency Plan |
Fire and Explosion Risk | Accident Prevention Plan |
20.6 Social and Economic Environment
The Vanadium Maracás Project has expended substantial effort characterizing and understanding the socio-economic context of the project as has been reported in the EIA studies prepared by Integratio, independent consultants responsible for social- communication aspects of the project.
This section summarizes major social and economic impacts arising from different stages of the project as portrayed in the EIA and Audit report prepared by Mineral Engenharia e Meio Ambiente Ltda.
20.6.1 Job and Income Generation
In accordance with the impact study, the duration of the installation period lasted approximately 22 months. During this period approximately 1,200 jobs were created. The employment generated by the Project is the main benefit to the local population.
During operation the project is responsible for generating approximately 430 direct jobs with the majority related to the operation of equipment (crushing, grinding and concentration systems), as well as administrative, managerial and operational positions and approximately 5000 related jobs. For Ilmenite Project, 500 jobs for installation period is expected and 22 direct and 286 related jobs are expected for operational phase.
Wage expenditures are in order of USD $8,500,000 per year. A significant portion is spent in the market of Maracás. The direct spending for goods, services and materials purchased on the local market and additional spending of Maracás County due to increased taxes revenues also provide economic stimulus.
In order to increase the positive effects on the municipality, management was mandated to give priority to the hiring of local workers and to provide training to people to acquire the necessary skills required for the jobs.
The work force training program is associated with the Environmental Management system, in order to compensate the population directly affected by the project, as stated in the performance standard 1 of IFC, "avoid, minimize or offset the negative impacts on workers, communities and the environment." Training or educating manpower can be an efficient way to benefit the local population with the generation of jobs, since the majority of the population do not have the skills or education required for the venture.
20.6.2 Boosting the Local and Regional Economy
The municipality has noticed an increase in economic activities which are the result of the creation of new jobs, income generation and increased public revenue
The distribution of the expenditure pertaining to investment (USD 250 million) was as follows: 10% in Maracás, purchase of land, labor, taxes, transport and rents; 30% in the State of Bahia, purchase of cement, supplies, taxes and services; 20% in the State of Minas Gerais, purchase of engineering, services, equipment and steel; 20% in the State of São Paulo, purchase of equipment; and 20% overseas for purchase of equipment from South Africa and China.
In order to maximize this positive impact, the company developed a training program for local suppliers with the objective of ensuring that local communities are appropriately included appropriately in the businesses that may potentially affect them.
Largo is focused on strengthening local identity and regional socioeconomic development. The Project supports various initiatives related to quality of life, well-being, education, health and cultural appreciation of the communities in which it operates. It also offers professional qualification programs and sustainable projects that allow jobs creation and income for the residents of the city of Maracás.
20.6.3 Improvement of Access and Roads
The company graded and enlarged approximately 42 km of existing dirt road between the villages of Pé de Serra and Porto Alegre during the construction process. This road will be further upgraded and paved through a joint effort with the Bahia State Government. It is proposed that sections of the road be reconstructed, and the entire corridor will be paved with an asphaltic cover, improving the access between villages. It is noted that paving the roads with an asphaltic cover will modify the local hydrological and storm water run-off regimes. The timing of this proposed improvement has not yet been determined due to financial constraints by both the company and the government of Bahia. A duly protocol has been signed by both parties to that end.
20.6.4 Pressure on the Water Supply System
Water supply, water capacity and water availability are heterogeneous and diverse in the municipality. In Maracás and in the district of Porto Alegre, communities that receive the majority of migrants, the currently installed capacity is being subjected to additional demand.
Population increases in the villages of Caldeirãozinho, Pindobeiras, Jacaré, Água Branca and Lagoa Comprida, which rely on water supply through trucks and tanks, necessitate additional water supply. This has resulted in an additional stress to the currently limited supply.
The village of Pé de Serra is supplied by an artesian well with reasonable water availability.
The mine built and commissioned a 10-inch diameter, 33-km long water pipeline that brings raw water from Rio de Contas dam to a water treatment plant at the site area for industrial and human use. The system capacity is designed for 250 m3/h, currently demands only about 100 m3/h.
As a socioeconomic compensation, the Project intends on building a water treatment station in 2018 which will be located near the village of Água Branca that will be handed over to the municipality for water distribution by the municipality.
20.7 Geotechnics And Hydrology
Hydrological and geological characterization studies were completed in 2008 by VOGBR and revised in 2011 for Basic Engineering. A summary of these studies is presented in the sections below.
20.7.1 Hydrological Studies
The pluviometric and fluviometric data that were incorporated into this assessment were obtained from the Brazilian National Waters Agency - ANA - Agencia Nacional de Águas. Stations were selected based on location:
- Pluviometric (rain gauge) Station at Fazenda Alagadiço, ANA code - 01340019;
- Fluviometric Station (flow station using a staff gauge) at Roçados, ANA code - 52265000.
The climatological characterization is derived from average monthly figures from the Ituaçu Station (code 83,292), obtained from the INMET Publication entitled "Normais Climatológicas", 1992.
20.7.1.1 Climatological Characterization
The Project area is located in the southwestern region of the State of Bahia (Brazil), in the municipality of Maracás. The Maracás climate is classified as Tropical-Monsoon (Am), alternatively called "tropical wet climate" under the Koppen classification (Climatologia do Brasil, Edmon Nimer, 1979). This climate is characterized by hot and semi-arid tropical conditions with 6 dry months. The average annual temperature is 24°C, with December, January and February being the hottest months, and July and August having the lowest average daily temperatures.
The precipitation regime is characterized by one rainy period during the summer during which the wettest quarter is from November to January and by one dry period in the winter during the quarter ranging from June to August. The average annual rainfall is approximately 600 mm. Figure 20.3: Average Monthly Rainfall for the Pluviometric Station at Fazenda Alagadiço (ANA Code - 01340019).shows the average monthly rainfall for the Project region.
The region's annual evaporation rate is high, close to 1,600 mm, with approximately 180 hours average monthly sunlight and average relative humidity that varies between 50% to 73%, based on the average monthly data obtained from the Ituaçú weather station.
20.7.1.2 Hydrographical Characterization
The Project area is contained within the hydrographical basin of the "João" creek, which is a tributary to the right bank of the Jacaré River, which in turn is a tributary to the Contas River. The basin extends over approximately 57.4 k m2 and the length of its main course is 18 km with a 550 m difference of elevation. Water flows are intermittent (Figure 20.3).
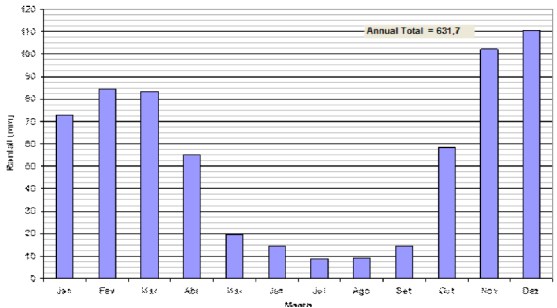
Figure 20.3: Average Monthly Rainfall for the Pluviometric Station at Fazenda Alagadiço (ANA Code - 01340019).
20.7.1.3 Intense Rains
The main characteristics of the intense rains include the total amount of rainfall, the spatial and temporal distribution, and the frequency of occurrence. Intense rainfall data is used in the hydraulic dimensioning of the various project structures (e.g., Probable Maximum Flood; PMF).
The estimated various return periods for rainfall height and intensity ratio (Table 20-11), and for duration and frequency (Figure 20.4), were derived on the basis of statistical treatment of daily rainfall volume figures obtained from the weather station at Fazenda Alagadiço.
Table 20-11: Rainfall Rates (mm).
Duration | Return Period - TR (years) |
2 | 5 | 10 | 20 | 25 | 50 | 100 | 200 | 500 | 1 | 10 |
5 min | 5.76 | 7.29 | 8.3 | 9.27 | 9.58 | 10.5 | 11.5 | 12.4 | 13.6 | 14.6 | 17.7 |
10 min | 10.3 | 13.1 | 14.9 | 16.6 | 17.2 | 18.9 | 20.6 | 22.2 | 24.5 | 26.1 | 31.7 |
15 min | 14.1 | 17.8 | 20.3 | 22.6 | 23.4 | 25.7 | 28 | 30.3 | 33.3 | 35.6 | 43.1 |
20 min | 17.2 | 21.7 | 24.7 | 27.6 | 28.6 | 31.4 | 34.2 | 37 | 40.7 | 43.4 | 52.7 |
25 min | 19.8 | 25.1 | 28.6 | 31.9 | 33 | 36.2 | 39.5 | 42.7 | 46.9 | 50.1 | 60.8 |
30 min | 22.1 | 28 | 31.9 | 35.6 | 36.8 | 40.4 | 44 | 47.6 | 52.4 | 55.9 | 67.8 |
1hr | 31.4 | 39.7 | 45.2 | 50.4 | 52.1 | 57.3 | 62.4 | 67.5 | 74.2 | 79.3 | 96.2 |
2hr | 40.4 | 51.1 | 58.2 | 65 | 67.2 | 73.8 | 80.4 | 87 | 95.7 | 102 | 124 |
4hr | 48.5 | 61.3 | 69.8 | 78 | 80.6 | 88.6 | 96.5 | 104 | 115 | 123 | 149 |
6hr | 52.7 | 66.7 | 76 | 84.8 | 87.7 | 96.3 | 105 | 114 | 125 | 133 | 162 |
8hr | 55.6 | 70.3 | 80.1 | 89.4 | 92.4 | 102 | 111 | 120 | 132 | 141 | 171 |
10hr | 57.7 | 73 | 83.1 | 92.9 | 95.9 | 105 | 115 | 124 | 137 | 146 | 177 |
12hr | 59.4 | 75.2 | 85.6 | 95.6 | 98.8 | 109 | 118 | 128 | 141 | 150 | 182 |
14hr | 60.9 | 77 | 87.7 | 97.9 | 101 | 111 | 121 | 131 | 144 | 154 | 187 |
24hr | 65.8 | 83.2 | 94.7 | 106 | 109 | 120 | 131 | 142 | 156 | 166 | 202 |
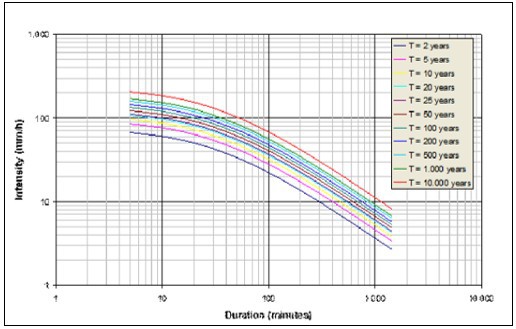
Figure 20.4: Intensity, Duration and Frequency Curves.
20.7.1.4 Design Output Volumes
The estimated design output volumes were determined to provide input data for use in the hydraulic dimensioning of the structures proposed for the Project.
The design output volumes correspond to 1,000-yr return period high water events criteria. Table 20-12: Design Flow Volumes for the Hydraulic Structures.presents the design flow volumes for the proposed hydraulic structures
Table 20-12: Design Flow Volumes for the Hydraulic Structures.
Structure | Elements | Flow Volume (m3/s) |
Flood Control System | Northern Ridge | 20.6 |
| Southern Ridge | 202.4 |
Sediment Catchment | Dyke | - |
20.7.1.5 Site Water Balance
The processing plant make-up water requirement during operations is 81.6 m3/hr where 75.0 m3/hr is provided from the Rio de Contas (Contas River) and 5.6 m3/hr is sourced from the water content in the mined ore. The licence provided by the federal water agency, ANA, (Agência Nacional De Aguas) allows a maximum water taking rate of 300 m3/hr from the Rio de Contas. The pumping system from the Rio de Contas is sized at 200 m3/hr. There is a circulating water load within the plant with the net make-up being 75 m3/hr.
Figure 20.5 shows a water balance flow chart, involving the structures under consideration and their corresponding flow rates.
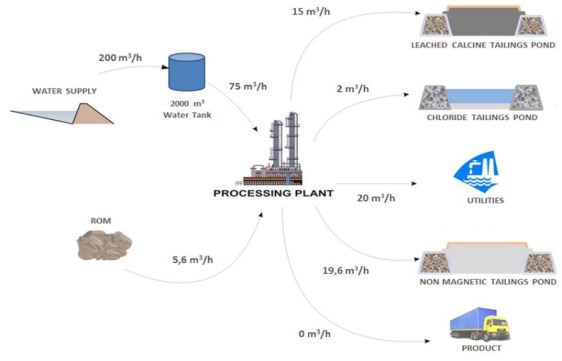
Figure 20.5: Flow Chart of the Water Balance for the Project.
Originally, the plan for a conventional slurried tailings system with a tailings pond resulted in a greater demand for water. In response to local stakeholder concerns regarding water supply, this water demand has been reduced with the introduction of ponds and reuse of the water to the plant.
20.7.2 Geological/Geotechnical Characterization of the Overall Project Area
The geological/geotechnical characterization of the project area is intended to provide input data for engineering design work, namely: the pit, processing plant installations, waste and stockpiles, tailings disposal system and flood control system.
The main activities undertaken to achieve the proposed objectives are as follows:
- Overall geological/geotechnical mapping of the entire installation area;
- Identification, characterization, distribution and use of overburden and outcropping substrate rock materials as cut and fill and foundation material;
- Mapping of areas subject to flooding and waterlogged areas, erosion features, landslides (geohazards) and areas with rock boulders;
- Analysis of field investigations and monitoring, consisting of inspection test pits, geotechnical drilling programs to facilitate in situ viewing of the soil and saprolite stratigraphy;
- Extrapolation and projection of geological/geotechnical vertical sections for the main units within the Project Area;
- Characterization of the foundation conditions of the main component units of the Master Plan.
20.7.2.1 Overall Geological/Geotechnical Characteristics
The geological/geotechnical mapping for the Project area, in conjunction with the geotechnical investigations, allowed the identification, characterization and mapping of the distribution of the different types of materials throughout the area as illustrated in Table 20-13.
Table 20-13: Characterization of Soils and Outcrops in the Project Area.
Type of Material | Tactile-Visual Classification | Average Thickness (m) |
Alluvium | Yellowish brown, fine to medium-sized sand, with boulders and pebbles of quartz, rare rounded rock (quartzites, andesites). | 0.2 to 0.5 |
Red Colluvium | Clayey silt and/or sandy silt matrix, red colored with small amounts of pebbles and granules of quartz or other rock. | 0.5 to 3.0 (Max. 8) |
Brown Colluvium | Brown colored matrix, normally silty, variable quantities of granules and pebbles of weathered rock and/or quartz. | 0.5 to 2.0 |
Residual Soil / Saprolite | Soils consisting of clayey-silty material with varying amounts of sand and fragments of weathered rock, which may contain foliation structures and veins of quartz. | 1.5 to 3.0 (max. 10) |
Outcrops | Slightly weathered to very weathered and/or fractured undifferentiated rocks, consisting of granitoids, gabbros, pegmatites, andesites, etc. | Not determined |
Table 20-14: Summary of Key Non-Magnetic Tailings Pond 3 Design Aspects.
Design Aspect | Measurement |
Maximum height (m) | 20 |
Length of stack structure (m) | 300 |
Width of stack structure (m) | 250 |
Maximum crest elevation (m) | 325 |
Minimum downstream elevation (m) | 305 |
Center road width (m) | 10 |
Height of slopes between berms (m) | 10 |
Tailings capacity - (m3) | 600,000 |
Maximum area occupied (m2) | 740,000 |
The non-magnetic tailings pond concept consists of a series of ponds formed by rock-fill structures sealed by compacted clayey/saprolitic material as illustrated in Figure 20.6.
The proposed arrangement will be applied to the construction of the various ponds outlined in Table 20-15, which outlines the schedule of pond construction and usage.
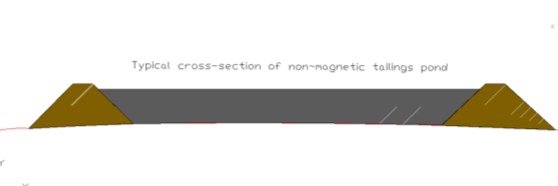
Figure 20.6: Typical Cross-Section of the Non-Magnetic Tailings Pond.
Table 20-15: Schedule of Non-Magnetic Tailing Pond Construction and Usage.
pond | 2017 | 2018 | 2019 | 2020 | 2021 | 2022 | 2023 | 2024 | 2025 | 2026 | 2027 | 2028 | 2029 | 2030 |
1 | | | | | | | | | | | | | | |
2 | | | | | | | | | | | | | | |
3 | | | | | | | | | | | | | | |
4 | | | | | | | | | | | | | | |
5 | | | | | | | | | | | | | | |
6 | | | | | | | | | | | | | | |
| in use for tailing disposal | | | | | | | | | |
| in construction | | | | | | | | | |
In year one the first non-magnetic pond was completed with rejects and a second one was built near and south of the plant and inside the area projected for waste pile. Pond 1 was decommissioned and reused as calcinated tailingsl. Pond 2 finished by Feb 2017. Pond 3 operated until 2019. Pond 4was constructed with rock waste from the mine and started 06/2019. Pond 5 is a project to build with waste from the mine during the years 2022 and 2028. Pond 6 tailings pond is shown in Figures Figure 20.7.
The pond construction sequence consists of stages of vegetation clearing, removal of organic topsoil and other material until the appropriate foundation depths are achieved for rockfill structures.
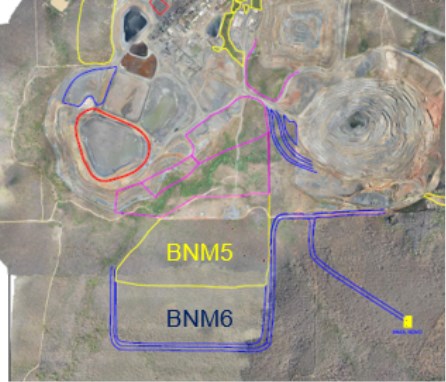
Figure 20.7: Layout of Non-Magnetic Tailings Ponds.
20.7.2.2 Tailings Disposal Facilities
The tailings generated by the ore process are of three types: leached calcine from the processing kiln discharge, filter cake from the desilication process and chloride control purge from the evaporation circuit.
The leached calcine tailings are discharged into the Leached Calcine Tailings Stack. The desilication process tailings and the chloride control purge tailings will be deposited in the Chloride Control Purge Tailings Pond. The intended construction location for these ponds is northwest of the open pit, close to the processing plant.
The dikes were built using compacted earth and their base areas are leak-proof using a double-layer geomembrane liner featuring a leak detection system. The construction consists of clearing vegetation from the areas to be occupied by the ponds, removal of organic material, and excavation of material inappropriate for foundations. The perimeter of each pond will be protected by rock-fill channels.
The leached calcine tailings stack was built initially as a first stage to handle the first two years of production. The pond will later be expanded, if required, possibly in a different location, to accommodate Life of Mine (LOM) tailings production for the expanded production scenario.
The initial Chloride Control Purge Pond has been built to accommodate 3 years of tailings production. The pond will later be expanded, if required, possibly in a different location, to accommodate LOM tailings.
Typical sections of the leached calcine stack and chloride control purge ponds are presented on Figure 20.8 and Figure 20.9, respectively.

Figure 20.8: Typical Cross-Section of the Leached Calcine Tailings Stack.
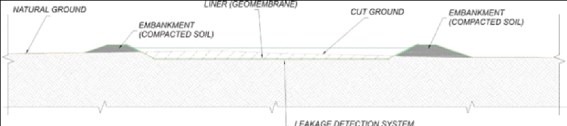
Figure 20.9 Typical Cross-Section of the Chloride Control Purge Pond.
The main geometric characteristics of the Leached Calcine Tailings Stack and the Chloride Control Purge Pond are presented in Table 20-16 and Table 20-17, respectively.
Table 20-16: Main Geometric Characteristics of the Leached Calcine Tailings Stack.
Design Aspect | Measurement |
Maximum dike height (m) | 12 |
Area occupied (m2) | 120,000 |
Maximum capacity (volumetric; m3) | 2,500,000 |
Slant of pond slope | 1V:2H |
Slant of pile slope | 1V:3H |
Maximum height of the slopes between the berms (m) | 10 |
Pile berm width (m) | 5 |
Pond crest width (m) | 7 |
The leached calcine tailings stack is sized according to 10 years of operation at the expanded production rate. The design will be updated to accommodate tailings storage requirements beyond production Year 10.
Table 20-17: Main Geometric Characteristics of the Chloride Control Purge Pond.
Design Aspect | Measurement |
Maximum height (m) | 5 |
Area occupied (m2) | 10,000 |
Maximum capacity (volumetric; m3) | 17,500 |
Slant of pond slope | 1V:2H |
Pond crest width (m) | 7 |
The chloride control purge pond is sized according to 10 years of operation at the expanded production rate. The design will be updated to accommodate tailings storage requirements beyond production Year 10.
20.7.2.3 Flood Control System
The designated area for the Campbell Phase 1 open pit intercepts the João Creek and three direct tributaries. Consequently, installation of a protection system is required to impede the influx of surface water runoff into the pit to allow mining activities to proceed.
For the initial phase, VOGBR proposed that the pit protection system consist of dikes and channels. The selection of this design allows for a good balance between the volume of earth cuts and landfills. However, following ensuing project development it was decided to use a system of protection ridges because of the proximity and the economical usage of waste material from within the open pit. The efficacy of the seepage collection system has not been assessed quantitatively (i.e., theoretical seepage losses versus observed seepage); however, VMSA is currently installing monitoring wells through the walls of the ponds to check and assess any potential bypass seepage. These wells are in addition to monitoring wells installed during construction
The revised conceptual system was designed with a pair of ridges located around the open pit designated as the Northern Ridge and the Southern Ridge. The intent is to redirect the water downstream from the open pit. The protection ridges form a barrier around the open pit to intercept the watercourses and to raise their water levels above localized topographical elevation variations. The diverted flow then discharges as surface runoff downstream from the open pit.
The design specifics for the Ridges were dictated by the design basis criteria of a 100 m minimum setback distance from the final pit extent. Furthermore, issues relating to the volume of landfill, feasibility of execution and hydraulic workings were also considered in efforts to optimize the adopted system.
The protection ridges have been installed pursuant to the mining activity plan defined for the Campbell Phase 1 pit. The North and South Ridge were completed by the end of Year 2. Vegetation clearing, removal of organic materials, and excavation of appropriate materials for foundation preceded the construction of the ridges. Two levies/ridges are part of the conceptual plan that was developed during the construction period. This conceptual plan indicates the use of an upstream clay-lined "wall" to store storm water during the rainy season and prevent water from entering the pit and retain sediment carried by the runoff water.
Consequently, the water management in the vicinity of the pit is effectively a "closed system", whereby water pumped from the pit is discharged above the berms and reports back towards the pit or evaporates.
The use of overburden material from the Campbell Phase 1 pit was included in the protection ridge designs. Accordingly, the ridge structures were designed to consist of rock fill, transition material and compacted earth (residual soil/saprolitic material). A summary of the main ridge characteristics is provided in Table 20-18.
Table 20-18: Main Characteristics of the Ridges.
Design Aspect | Ridge Measurement |
Northern | Southern |
Maximum height (m) | 14 | 13 |
Length of structure (m) | 915 | 875 |
Maximum crest elevation (m) | 312 | 313 |
Minimum downstream elevation (m) | 298 | 300 |
Slant of downstream-side embankment | 1V:1.5H | 1V:1.5H |
Crest width (m) | 6 | 6 |
NCL do Brasil further advanced the design of the waste pile and ore stockpile based on geometric parameters defined by VOGBR.
The material from the open pit will be placed on the waste pile or the ore stockpile, predominantly as varying sizes of boulders. The design criteria geometry for the proposed waste pile can be seen section 16.
20.8 Current Activities and Plans
Maracás Project construction was concluded in May 2014 and the key ongoing socio-environmental activities consist of community meetings and communication, water, aquatic biota, fauna and flora monitoring, air quality checks and stacks emissions monitoring in 2021 are still in place.
The Action Plan containing the integrated framework of environmental management plan components during operations is in place and an adequate environmental management and structure is active following Environmental Social Health and Safety and Governance - ESG aspects are demanded nowadays.
20.8.1 Project Organization and Sustainability Team
In order to fulfill Largo's commitments to complying with the Equator Principals, a 'Sustainability Team' was created in February 2011 and was increased during the years. It consists of the following skills and positions:
- One Sustainability General manager;
- One Safety/Health Coordinator responsible for the operation;
- One Safety Engineer and four Safety Technicians;
- One Agronomist;
- One Biologist;
- One Integrated Management System Coordinator and four Analysts;
- One Communications person.
The Sustainability General Manager report directly to the Operational Director. The participation of senior corporate management relating to the environmental aspects of the project is required for the implementation of the EMPs described in the Actions Plan.
20.8.2 Equator Principles Audit Review
As mentioned previously, Largo and its subsidiary, Vanádio de Maracás S.A have committed to comply with best management practices accepted by the International Mining Industry, all Brazilian environmental laws and regulations, and the conditions of all environmental permits issued for the Project.
A finance consortium composed of Itaú-BBA, Bradesco and Banco Vororantin have provided a portion of the finance for the Project in the form of a loan. A requirement for such financial Institutions/IFC Guidelines related to participation in projects such as the Maracás Project is the performance of a socio/environmental audit by a qualified, independent third party. In discussion with Bank representatives, it was agreed that the audit could be performed by Mineral Engenharia em Meio Ambiente Ltda. (Mineral), a well-known environmental engineering consulting firm, familiar with project permitting in Brazil and having recognized expertise in the performance of environmental audits.
The scope of the audit followed generally accepted auditing principles, reviewing the Ten Equator Principles and respective Performance Standards.
As part of the background review, an evaluation of the permitting and regulatory environment surrounding the Project was completed. This involved a review of the currently issued permits and permits that are pending or in the process of being obtained. During the EIA process, a number of commitments were made by the Project in the form of preparing and adopting a series of Environmental Management Plans. The content, status and implementation of these plans was reviewed and assessed. The EMP review and the implementation of the environmental management process required for the Project was also assessed with respect to the status of the Project during the audit. This included a review of Largo's monitoring of the Project and the Project's compliance with its permits and internationally accepted best management practices.
20.8.3 Socio-Environmental Action Plan and Environmental Management System
The Action Plan is an outcome of Equator Principle nº 04. It states that an action plan should be drawn up with a description of the actions required for management of any mitigation measures, corrective actions and supplementing measures identified through the Environmental Assessment.
The Action Plan was drawn up by VMSA corporate staff jointly with Mineral, and it incorporates compliance requirements with Brazilian laws and regulations and applicable environmental performance standards and EHS guidelines.
The list of programs is presented in the next section and summarized in Table 20-19.
Table 20-19: Action Plan - Environmental Programs.
Program | Description | Phase |
1) Environment, Health, and Safety Organization Plan | Plan to manage, apply and supervise the Safety, Health and Environment plans | Construction and Operation |
2) Fauna Management Plan | Plan to manage and protect wild fauna. | Construction and Operation |
3) Forest Management Plan | Plan to manage and protect forests. | Construction and Operation |
4) Aquatic Biota Management Plan | Plan to manage and protect forests. | Construction and Operation |
5) Water Management Plan | Plan to manage industrial and domestic waste waters and their treatment prior to releases to the environment. | Construction and Operation |
6) Surface Water Management Plan | Plan to manage industrial and domestic waste waters and their treatment prior to releases to the environment. | Construction and Operation |
7) Waste Management Plan | Plan to manage the solid waste, inert industrial wastes and oily contaminated soils at the project. | Construction and Operation |
8) Environmental Monitoring Plan | Plan to monitor specific aspects throughout the life of the mine. Establishment of an "Observer Commission" consisting of local government, ONGs, County leaders, which regularly assess the implementation of the project. | Construction and Operation |
9) Plan Rehabilitation of Degraded Areas | Plan to manage the rehabilitation and reclamation activities of the mine site | Construction and Operation |
10) Plan of Social Communication | Plan to manage the public and internal communication to assure transparency and democratization of information. | Construction and Operation |
11) Plan of Hiring Local People | Plan to hire 60% of people from Municipality of Maracás | Construction |
12) Plan of Labor Training | Plan to manage the training of skills and competences of local people for project opportunities | Construction and Operation |
13) Plan of Guidance of Local Suppliers | Plan to guide local suppliers on project opportunities for new business | Construction |
14) Health and Safety Plans | Risk Management Plan- PGR | Construction and Operation |
Environmental Risks Prevention Plan - PPRA |
Health Control Plan- PCMSO |
15) Contingency Plan | Plan to identify and enforce actions in the event of unforeseen events or an "upset" condition and to simulate emergency response. | Construction and Operation |
16) Closure and Reclamation Plan | Plan to identify the concurrent and ultimate reclamation and closure of the mine area and any off site impacts or disturbances. | Decommissioning |
The Mine Closure and Reclamation Plan calculated for includes expenses, covering mine site, plant, stockpile, tailing dams, waste disposal area, buildings and facilities. Mine closure costs are present in the section 21 of this report.
The Maracás Menchen Project must meet the standards required with respect to the legal aspects of the environmental licensing process and the License of Implementation and Operation and Environmental Control Programs,and be consistent with the Equator Principles as required by the International Finance Corporation (IFC) and the banks (Itaú, Vororantin and Bradesco) financing a portion of the Project.
Integration has been involved with the Maracás Vanadium Project since November 2012 providing guidance and support for the physical, biotic and anthropic/socio-economic characteristics of the project. The objective of the integration of the three characteristics is to meet the requirements of the PD and the IFC, while observing the conditions and restrictions of all licenses.
The audit company for the PD is Mineral Engineering and Environment (MEE). They have performed audits during the years, e.g. the first being in December 2011, September 2015 and is planned to occur regularly during the project life. MEE through the course of their audits have identified certain non-conformities (documents PD01, PD02, PD03, PD04, and PD08). These non-conformities are being addressed. Existing response mechanisms are being amended and where no response mechanism exists, new ones are being developed.
The general planning consists of the following:
1. Situational Diagnosis including:
- Analysis of the Social-Environmental Aspects of the Project
- Stakeholders Mapping and Analysis
o Assessment of the Requirements and Referential of Development
o Performance Standards of the IFC
o Conditions of the Environmental Control Programs
o Current activities and commitments
- Impacts and expectations for the role of the Company by the Stakeholders
o Geographic scope (Areas of Influence)
o Relevant Environmental Questions/Concerns
2. Operationalization
▪ Action Plan
o Macro Plan
o Detailing
o Monitoring of implementation
o Internal pre-audits
o External audit (preparing and monitoring)
o Periodic Follow up with financial agents and external audit
3. Internal Governance
- Constitution of the Environment Evaluation and Management System (Standard 1 of the IFC)
o Definition of the full monitoring programs for the physical, biotic, and social economic dimensions of the Project
- Empowerment of the Sustainability Coordinator on the Best Management Practices
- Implementation of the Social-Environment Internal Committee
- Addressing and responding to internal demands
- Definition of the monitoring and evaluation criteria (performance indexes)
4. Development of Social Investment and Responsibility Guidelines
5. Design of Projects and Programs for local development and environmental impact mitigation.
During MEE's audit, Performance Standards 1 (PD-1) was adhered to which focuses on the structure of the Environmental Evaluation and Management System. Integratio's priority is for the consolidation of these systems to enable the Company to answer the social, environmental, and economic demands of the Maracás Vanadium Project.
It is important to emphasize the social and environmental investment requirement of the Banco Nacional de Desenvolvimento (BNDES), which is to strengthen the social and economic development of the regions that will receive investments.
The requirement of addressing the social and economic values is a new approach for BNDES which now places an emphasis on sustainable development initiatives so as to not cause social, economic and environmental impacts to the surrounding regions of the project.
The Main Equator Principles Framework for VMSA Social Investments are as follows:
1. Principle 2: Social and Environmental Assessment
This assessment proposes mitigation and management relevant and appropriate to the nature and scale of the proposed project.
- Social assessment (Main Impacts from Environmental Impact Study)
- Population expectations
- Provide employment and income
- Stimulation of local and regional economy - investment
2. Principle 3: Applicable Social and Environmental Standards
Assessment will refer to the applicable IFC Performance Standards
▪ Performance Standard 1: Management System and Environmental Assessment
▪ Stakeholders engagement
3. Principle 5: Consultation and Disclosure
For projects with significant adverse impacts on affected communities, the process will ensure there is informed consultation and opportunity for participation as a means to address any issues.
The Main IFC approach for VMSA Social Investments is as follows:
1. Addressing the Social Dimensions of Private Sector Projects - Good Practice Note (IFC)
- Traditionally, the "do-no-harm" approach of the World Bank Group's social safeguard policies has made social mitigation plans the primary entry point for distributing benefits to local communities impacted by IFC investments.
- Unlike mitigation and compensation which have important but limited objectives of protecting affected persons from adverse impacts, sustainable development actions enable the wider population in a project's area of influence to gain access to and take better advantage of the range of opportunities brought about by private sector development.
Regarding Environmental, Social and Governance - ESG aspects, VMSA has initiatives to identify and manage risks related to material ESG issues, i.e., community involvement programs, health and safety management, greenhouse gas emission inventory and report relevant ESG data to shareholders and stakeholders. Additional work and data collection will be done to achieve market and community ESG requirements.
21 CAPITAL AND OPERATING COSTS
The capital cost estimate includes all direct and indirect costs, along with the appropriate contingencies necessary for production. All equipment and materials are considered new.
The execution strategy is based on an Engineering, Procurement and Construction Management (EPCM) implementation and a horizontal (discipline-based) construction contract package.
The CAPEX estimate for Phase 1 meets the international AACE Class 3 classification standard defined as having an intended accuracy of ± 15%.
Phase 1 considers an Ilmenite Concentration Plant (the "Ilmenite Plant") at the Maracás Menchen Mine site with a capacity to produce 150 kt/year of ilmenite concentrate from the Campbell Pit non-magnetic concentrate. Construction of the Ilmenite Plant will begin in 2022 and initial production of ilmenite concentrate is scheduled for 2023. A TiO2 Pigment Plant (the "Pigment Plant") with an initial planned capacity of 30kt/year TiO2 pigment will also see construction begin in 2022 at Camaçari, Brazil. Initial production of pigment scheduled for 2024.
For phases 2 to 4 the capital cost estimate has the level of accuracy for an AACE Class 4 estimate that ranges from -15% to 50% accuracy.
Phase 2 will see the expansion of the Pigment Plant to 60 kt/year TiO2 pigment with capital investments and construction beginning in 2024 and 2025 with increased production being in 2026. The Company will also expand its V2O3 Plant to from 14 t/day to 28 t/day in 2024.
Phase 3 consists of the expansion of the existing Pigment Plant to 120 kt/year TiO2 pigment. TiO2 pigment production at the expanded levels will begin in 2028 and continue to 2040. The Ilmenite Plant will also be expanded to produce 425 kt/year ilmenite concentrate to meet the demands of the Pigment plant. Investments and construction at both plants are scheduled between 2026 and 2027 with operations starting in 2028.
Phase 4 will see a shift in mining once Campbell Pit is depleted in 2032 to the GAN and NAN deposits. The Company will invest is duplicate crushing, milling, kiln and leaching circuits to handle the increased material flow from mining operations. Investments and construction is anticipated to begin in 2029 with completion in 2032. Production of V2O5 flake is expected to average 15,900 tonnes from 2032 to 2041.
The estimate is reported in constant dollars for the first quarter of 2021. The capital cost estimate reflects an approach that is based on key engineering deliverables that define the scope of the project. Sustaining capital costs relate to process plant, infrastructure maintenance, tailings management and contingency.
The capital cost estimate (CAPEX) was developed based on the following assumptions:
- Estimated currency: US dollar (US$);
- Exchange rate: 1.00 = R$5.10;
- A 15% contingency factor was applied.
CAPEX related to the expansion steps and detailed are presented in sections 21.1 to 21.4.
21.1 Mining Costs
Currently, Largo has a mining fleet contract with the company Minax Transportes, Construções e Mineração, which is responsible for operating the Campbell Pit. There is no CAPEX for the mine fleet. GAN and NAN will be operated by the contractor as well and there is no CAPEX required for the fleet.
Mining CAPEX includes pre-stripping for GAN and NAN (US$3.7Mi) and the haul road preparation of 6 km linking NAN and the Campbell beneficiation plant (US$0.9Mi).
21.2 Processing Plant and Infrastructure
The Ilmenite Plant and the duplicate vanadium processing facilities will be constructed at the Maracás Menchen Complex. The Titanium Plant for the pigment production will be located in Camaçari, BA. The deployments and expansions have been split into four phases:
Phase 1: Ilmenite Plant 150 kt/year concentrate capacity and the Titanium Plant with 30 kt/year TiO2 pigment concentrate capacity - Construction (2022-2023)
Phase 2: Titanium Plant expansion to 150 kt/year TiO2 pigment concentrate capacity + Vanadium Trioxide Plant Expansions (2024-2025)
Phase 3: Titanium Plant + Ilmenite Plant Expansions (2026-2028) + Site preparation for GAN and NAN (roads / access and pre-stripping)
Phase 4: Start of mining at GAN and NAN contiguous with the expansion of the vanadium processing plant and infrastructure (2029-2032).
To prepared plant CAPEXs, the following criteria were considered:
Direct costs were calculated for main mechanical equipment. Other permanent equipment, materials and labour associated with the physical construction of the site infrastructure, process plant and ancillary facilities were factored according to similar projects.
For all major equipment, budget quotes were obtained from pre-approved vendors. These quotes were benchmarked against pricing for similar equipment from databases. Pricing for minor equipment was obtained from a general database. An example of the equipment that was quoted is listed below:
- Ammonium sulfate drying system;
- Sodium carbonate kiln & cooler system;
- Evaporator system;
- Revamp current system;
- New reactor + steel structure;
- Agitator;
- Pumps;
- Conveyors;
- Filters;
- Tanks;
- Kiln;
- Others.
- Contractor's Indirect costs
Contractors' indirect costs are part of civil works and cover the costs for mobilization and demobilization of labour, equipment, and contractor facilities to and from the Project site.
- Engineering, Procurement and Construction Management Services
The Engineering, Procurement and Construction Management Services (EPCM) costs, required for execution of the Project, includes detailed engineering, drafting, project management and project controls hours and were estimated applying a typical factor over direct cost.
The considered owner's costs include the necessary consultants for the next phases of the project, such as:
- Risk Analysis
- Project team
- Diligence and inspection
- Technology control
- Project insurance
- Duties and Taxes
The duties and taxes for the Project are included in the capital costs and were considered in its full amount, without consideration of incentives or taxes reductions.
This estimate contains all local, state and federal taxes and also import duties on a line-item basis.
The capital cost estimate is based on the following exclusion and qualifications:
- Cost of bankable feasibility study, financing and interest during construction is excluded.
- Sunk costs are excluded.
21.2.1 Phase 1: Ilmenite Plant 150 Kt/year Concentrate + Titanium Pigment Plant 30 kt/year Concentrate - Construction (2022-2023);
Phase 1 considers an Ilmenite Plant with a capacity to produce 150 kt of ilmenite concentrate per year from the Campbell Pit non-magnetic concentrate. Concurrent with this approval, the Company will invest $25.2 million in 2022 to construct the Ilmenite Plant with production expected to commence in 2023.
The majority of the ilmenite concentrate will be fed through the Company's new TiO2 Pigment Plant which is to be constructed in Camaçari, Brazil in 2022 and 2023. The TiO2 Pigment Plant is expected to produce 30 kt of TiO2 pigment per year beginning in 2024 with a total investment of $96.4 million ($50.7 million in 2022 and $45.7 million in 2023).
The Company anticipates that the total investment for Phase 1 will be $121.6 million and will generate an average production of 140 kt of ilmenite concentrate per year (from 2023 to 2025) and 30 kt of TiO2 pigment per year (from 2024 to 2025).
The ilmenite concentrate production is expected to supply all necessary feedstock for the TiO2 Pigment Plant with any surplus being sold in the open market. The Company's annual V2O5 equivalent production capacity of 13.2 kt/year will remain unchanged during this period.
Table 21-1 presents the Ilmenite Plant processing plant CAPEX estimation with a production capacity of 150 kt/year of concentrate.
Table 21-1: Process Plant Capex - Ilmenite Plant - Maracás - 150 Kt/year concentrate
DESCRIPTION | Detailed | CAPEX (US$ Million) |
Electromechanics supply | 11.08 |
| QUOTED | 5.34 |
| - Desliming | 0.86 |
| - Flotation | 2.99 |
| - Thickener and filtration | 1.49 |
| ESTIMATED | 5.74 |
| - Pumps | 0.88 |
| - Steel structure | 0.56 |
| - Agitators | 0.08 |
| - Samplers | 0.08 |
| - Compressor | 0.03 |
| - Electrical substation | 0.30 |
| - Valves | 0.36 |
Electromechanics assembly | 5.67 |
Civil Works | 3.12 |
Engineering, Procurement and Construction | 2.05 |
TOTAL DISREGARDING CONTINGENCY | 21.92 |
CONTINGENCY (15%) | 3.28 |
TOTAL WITH CONTINGENCY | 25.2 |
Table 21-2 present Capex estimation for new TiO2 Pigment with capacity 30 Kt/year of concentrate.
Table 21-2: Process Plant Capex - TiO2 Pigment - 30 Kt/year
DESCRIPTION | Detailed | CAPEX (US$ Million) |
Electromechanics supply | 57.48 |
| QUOTED | 21.77 |
| - Pumps | 4.02 |
| - Agitator | 2.06 |
| - Conveyors | 0.15 |
| - Filters | 6.21 |
| - Tanks | 3.55 |
| - Evaporator | 0.36 |
| - Kiln | 5.42 |
| ESTIMATED | 35.69 |
| - Steel structure | 9.53 |
| - Electrical substation | 1.37 |
| - Piping | 1.27 |
| - Other equipment | 23.52 |
Electromechanics assembly | 15.1 |
Civil Works | 3.18 |
Engineering, Procurement and Construction | 3.91 |
Owner's cost | 5 |
TOTAL DISREGARDING CONTINGENCY | 84.67 |
CONTINGENCY (13.8%) | 11.72 |
TOTAL WITH CONTINGENCY | 96.39 |
21.2.2 Phase 2: Titanium Pigment Processing Plant + Vanadium Trioxide Plant Expansions (2024-2025);
Phase 2 will consider the expansion TiO2 Pigment chemical processing plant to be located in Camaçari, Brazil to a nameplate capacity of 60 kt/year of TiO2 pigment. The Company estimates a total investment of $59.8 million with $29.9 million to be incurred in 2024 and $29.9 million in 2025.
The ilmenite concentrate feedstock that will support the Company's TiO2 pigment production in 2026 and 2027 will be sourced from the current Campbell Pit non-magnetic concentrate (86%) and from the non-magnetic stock contained within tailings ponds (14%) from past operations. The Company does not estimate any surplus of Ilmenite concentrate production during this period. In 2024, the Company will consider an expansion of the vanadium trioxide ("V2O3") plant in Maracás with a total investment of $4.7 million. This expansion is expected to double current capacity of 14 tonnes per day to 28 t/day The Company's annual V2O5 equivalent production capacity of 13.2 kt will remain unchanged during this period.
Table 21-3 presents the CAPEX estimation for the V2O3 Plant with a production capacity of 7 kt/year.
Table 21-3: Process Plant Capex - V2O3 Plant - 7 kt/year
DESCRIPTION | Detailed | CAPEX (US$ Million) |
Electromechanics supply | | 2.27 |
| QUOTED | 2.27 |
| - Revamp current system | 0.03 |
| - New Reactor + Steel Structure | 2.24 |
| ESTIMATED | - |
Electromechanics assembly | | 0.95 |
Civil Works | | 0.46 |
Engineering, Procurement and Construction | 0.37 |
Owner's cost | | - |
TOTAL DISREGARDING CONTINGENCY | 4.05 |
CONTINGENCY (15%) | | 0.61 |
TOTAL WITH CONTINGENCY | | 4.66 |
Table 21-4 Pigment Plant CAPEX estimation for the expanded processing capacity of 60 Kt/year of concentrate.
Table 21-4: Process Plant Capex - TiO2 Pigment - 60 kt/year
DESCRIPTION | Detailed | CAPEX (US$ Million) |
Electromechanics supply | 35.64 |
| QUOTED | 21.77 |
| - Pumps | 4.02 |
| - Agitator | 2.06 |
| - Conveyors | 0.15 |
| - Filters | 6.21 |
| - Tanks | 3.55 |
| - Evaporator | 0.36 |
| - Kiln | 5.42 |
| ESTIMATED | 13.85 |
| - Steel structure | 9.53 |
| - Electrical substation | 1.37 |
| - Piping | 1.27 |
| - Other equipment | 1.68 |
Electromechanics assembly | 11.33 |
Civil Works | 2.23 |
Engineering, Procurement and Construction | 2.82 |
Owner's cost | - |
TOTAL DISREGARDING CONTINGENCY | 52.00 |
CONTINGENCY (15%) | 7.80 |
TOTAL WITH CONTINGENCY | 59.80 |
21.2.3 Phase 3: Titanium Pigment Processing + Ilmenite Concentration Plant Expansions (2026-2028)
Phase 3 will consider a further expansion of the Company's TiO2 Pigment Plant to a capacity of 120 kt of pigment production per year at an expected cost of $132.0 million to be incurred in 2026 and 2027. The Company expects to reach a production rate of 120 kt of TiO2 pigment from 2028 to 2040.
Concurrent with the TiO2 Pigment Plant expansion, the Company will also perform an expansion of its Ilmenite Plant in Maracás to support its TiO2 Pigment Plant expansion to a new average production rate of approximately 425 kt of ilmenite concentrate per year. The Company plans to invest $36.5 million to support this expansion and will source the ilmenite concentrate feedstock from its stocks of non-magnetic material located in its tailing's ponds from past operations. The stocked material in the Company's tailings ponds will be depleted in 2032, at which point the Company plans to source feedstock for its ilmenite concentrate processing plant from the non-magnetic concentrate generated from the GAN and NAN operations.
From 2033 to 2040, there will be an average ilmenite concentrate surplus of 144 kt, which the Company expects to sell in the open market. The Company's annual V2O5 equivalent production capacity of 13.2 kt will remain unchanged during this period and for the years 2029 and 2030.
Table 21-5 present the TiO2 Pigment Plant Capex estimation expansion to of 120 kt/year concentrate capacity.
Table 21-5:Process Plant Capex - TiO2 Pigment - 120 kt/year
DESCRIPTION | Detailed | CAPEX (US$ Million) |
Electromechanics supply | 80.00 |
| QUOTED | 21.77 |
| - Bombas | 4.02 |
| - Agitator | 2.06 |
| - Conveyors | 0.15 |
| - Filters | 6.21 |
| - Tanks | 3.55 |
| - Evaporator | 0.36 |
| - Kiln | 5.42 |
| ESTIMATED | 58.21 |
| - Steel structure | 9.53 |
| - Electrical substation | 1.37 |
| - Piping | 1.27 |
| - Other equipment | 46.04 |
Electromechanics assembly | 21.26 |
Civil Works | 7.74 |
Engineering, Procurement and Construction | 5.78 |
TOTAL DISREGARDING CONTINGENCY | 114.78 |
CONTINGENCY (15%) | 17.22 |
TOTAL WITH CONTINGENCY | 132.00 |
Table 21-6 presents the Ilmenite Plant Capex estimation with production capacity to 425 kt/year concentrate.
Table 21-6: Process Plant Capex - Ilmenite Plant - 425 kt/year concentrate
DESCRIPTION | Detailed | CAPEX (US$ Million) |
Electromechanics supply | 16.09 |
| QUOTED | - |
| ESTIMATED | 16.09 |
| - Pumps
- Steel structure
- Agitators
- Samplers
- Compressor
- Desliming
- Flotation
- Thickener and filtration | 16.09 |
Electromechanics assembly | 8.19 |
Civil Works | 4.50 |
Engineering, Procurement and Construction | 2.96 |
TOTAL DISREGARDING CONTINGENCY | 31.74 |
CONTINGENCY (15%) | 4.76 |
TOTAL WITH CONTINGENCY | 36.50 |
21.2.4 Phase 4: Vanadium Expansion Second Kiln (2029-2032).
The Company's Campbell Pit will be depleted in 2032 at which point the Company expects to begin the mining and processing of its NAN and GAN deposits.
The Company plans to invest in duplicate crushing, milling, kiln and leaching circuits, with a total investment of $230.6 million ($23.1 million in 2029, $69.2 million 2030, $92.3 million in 2031 and $46.1 million in 2032).
This expansion is expected to result in an approximate average of 15.9 kt/year V2O5 production from 2033 to 2041. The duplicate crushing circuit will be located near the NAN orebody, which is roughly 6.5 km from the Campbell Pit. The pre-concentrate will be transported by truck and milling circuit, second kiln and leaching circuit will be located near the Company's current operations.
Table 21-7 presents the V2O5 Expansion Second Kiln Capex estimation.
Table 21-7: Process Plant Capex - V2O5 Expansion Second Kiln
DESCRIPTION | Detailed | CAPEX (US$ Million) |
Electromechanics supply | 103.47 |
| QUOTED | - |
| ESTIMATED | 103.47 |
| - Ball mill | 1.47 |
| - Pumps | 1.18 |
| - Tanks | 1.18 |
| - Thickener | 0.98 |
| - Agitators | 1.47 |
| - Conveyors | 2.35 |
| - Crushers | 2.94 |
| - Feeders | 0.88 |
| - Other equipment | 91.02 |
Electromechanics assembly | 33.71 |
Civil Works | 31.71 |
Engineering, Procurement and Construction | 20.25 |
Owner's cost | 11.44 |
TOTAL DISREGARDING CONTINGENCY | 200.58 |
CONTINGENCY (15%) | 30.09 |
TOTAL WITH CONTINGENCY | 230.67 |
21.3 Sustaining Capital Cost
The sustaining cost estimation from 2022 to 2032 is US$ 10.58 Mi/y on average and for the years 2033 to 2041 the estimate is US$ 13.06 Mi/y, already including new plants and respective expansions.
21.4 CAPEX Summary
Table 21-8 summarizes the Project's CAPEX, Sustaining CAPEX, and Mine Closure estimates for project in their respective years.
Table 21-8: CAPEX summary
| Period | 2022 | 2023 | 2024 | 2025 | 2026 | 2027 | 2028 | 2029 | 2030 | 2031 | 2032 | 2033 | 2034 | 2035 | 2036 | 2037 | 2038 | 2039 | 2040 | 2041 | 2042 | 2043 | 2044 | 2045 |
Investment | Millions (US$) |
Phase 1 | Ilmenite Plant 150 kt/year | 25.2 | | | | | | | | | | | | | | | | | | | | | | | |
TiO2 Pigment Plant 30 kt/year | 50.7 | 45.7 | | | | | | | | | | | | | | | | | | | | | | |
Phase 2 | V2O3 Plant 7 kt/year | | | 4.7 | | | | | | | | | | | | | | | | | | | | | |
TiO2 Pigment Plant 60 kt/year | | | 29.9 | 29.9 | | | | | | | | | | | | | | | | | | | | |
Phase 3 | Ilmenite Plant 425 kt/year | | | | | 18.3 | 18.3 | | | | | | | | | | | | | | | | | | |
TiO2 Pigment Plant 120 kt/year | | | | | 66.0 | 66.0 | | | | | | | | | | | | | | | | | | |
Roads / acess to NAN & GAN | | | | | | | | | | 0.9 | | | | | | | | | | | | | | |
Pre-Stripping GAN | | | | | | | | | | 0.7 | | | | | | | | | | | | | | |
Pre-Stripping NAN | | | | | | | | | | 3.0 | | | | | | | | | | | | | | |
Phase 4 | V2O5 Expansion Second Kiln | | | | | | | | 23.1 | 69.2 | 92.3 | 46.1 | | | | | | | | | | | | | |
TOTAL CAPEX | 75.9 | 45.7 | 34.6 | 29.9 | 84.3 | 84.3 | - | 23.1 | 69.2 | 96.9 | 46.1 | - | - | - | - | - | - | - | - | - | - | - | - | - |
SUSTAINING CAPEX | 6.6 | 5.7 | 8.7 | 7.0 | 10.1 | 11.1 | 13.7 | 10.7 | 14.2 | 14.3 | 14.2 | 15.3 | 18.9 | 15.2 | 21.7 | 17.4 | 15.6 | 7.1 | 6.3 | - | - | - | - | - |
TOTAL CAPEX+SUSTAINING CAPEX | 82.5 | 51.4 | 43.3 | 36.9 | 94.3 | 95.4 | 13.7 | 33.8 | 83.4 | 111.2 | 60.3 | 15.3 | 18.9 | 15.2 | 21.7 | 17.4 | 15.6 | 7.1 | 6.3 | - | - | - | - | - |
MINE CLOSURE | - | - | - | - | - | - | - | - | - | - | 1.5 | 1.5 | - | - | - | - | - | - | - | 19.4 | 0.9 | 0.8 | 0.2 | 0.2 |
21.5 Operating Cost Estimate
The operating cost includes the mines, process plants and general and administration (G&A) for the project phases. All operating costs are in U$ dollars.
Expenditures and costs were predominantly extracted or calculated from spreadsheets and information collected from Largo and reflecting the actual costs collected from January to September 2021. Expenses and costs for periods after 2021, for new factories in 2024, 2028 were quoted and estimated. For vanadium plant expansion in 2032, were calculated based on the specific consumptions.
21.5.1 Mining Cost Contracted
Largo's unit mining costs were based on the costs currently contracted with Minax Trasportes, Construções e Mineração contractors.
The loading and haulage operations are performed Minax. This contract provides the loading with hydraulic excavator Volvo EC750 with 2.5 m3 bucket (ore and waste). The transportation is done by Scania Truck 8x4 Heavy tipper 25 m3. The unit cost is charged in relation to the load, transport and haul distance is shown in Table 21-9 and Table 21-10 presents the average mining costs for project related to Campbell Pit, GAN and NAN.
Table 21-9: Contract Loading & Haulage Costs
Haul Distance (km) | Load/Haul/Spread ($) |
0 to 0.50 | 0.91 |
0.51 to 1.0 | 0.98 |
1.01 to 1.5 | 1.03 |
1.51 to 2.0 | 1.05 |
2.01 to 2.5 | 1.07 |
2.51 to 3.0 | 1.12 |
3.01 to 3.5 | 1.17 |
3.51 to 4.0 | 1.22 |
4.01 to 4.5 | 1.28 |
4.51 to 5.0 | 1.33 |
5.01 to 5.5 | 1.38 |
5.51 to 6.0 | 1.44 |
6.01 to 6.5 | 1.49 |
6.51 to 7.0 | 1.54 |
7.01 to 7.5 | 1.60 |
7.51 to 8.0 | 1.65 |
8.01 to 8.5 | 1.71 |
Table 21-10: Operating Costs - Mining
Area | Type of Cost | Unit | Campbell Pit | NAN and GAN |
Mining | Transportation | US$/ t moved | 0.90 | 0.76 |
Diesel oil | 0.32 | 0.30 |
Drilling | 0.26 | 0.28 |
Blasting | 0.19 | 0.19 |
Equipment rental | 0.10 | 0.09 |
Labor | 0.06 | 0.02 |
Other | 0.05 | 0.02 |
Topography | 0.02 | 0.02 |
Total Mining Costs | US$/ t moved | 1.90 | 1.68 |
21.5.1 Processing Cost
The OPEX estimate for the Vanadium Plant and its expansion was estimated on an actual basis from current plant data. OPEX for the Ilmenite and Titanium plants was based on similar operations and quotations. All OPEX are summarized in Table 21-11 to Table 21-13.
Table 21-11: Operating Costs - Vanadium Processing.
Area | Type of Cost | Unit | Campbell Pit | NAN and GAN |
Vanadium Processing | Reagents and Consumables | US$ / t ROM | 17.84 | 11.78 |
Labor | 6.16 | 3.00 |
Equipment rental | 1.78 | 1.37 |
Power | 2.61 | 1.06 |
Other | 1.56 | 0.80 |
Third-party service providers | 3.70 | 1.78 |
Maintenance Spares and Tools | 1.88 | 1.88 |
Maintenance Third-party service providers | 0.72 | 0.50 |
Maintenance Others | 0.79 | 0.60 |
Maintenance Equipment rental | 0.13 | 0.13 |
Total Vanadium Processing Costs | US$ / t ROM | 37.17 | 22.90 |
Table 21-12: Operating Costs - Ilmenite Processing.
Area | Type of Cost | Unit | Campbell Pit | NAN ad GAN |
Ilmenite Processing | Power | US$ / t product | 4.26 | 4.26 |
Consumables | 11.87 | 11.87 |
Wearing parts | 1.70 | 1.70 |
Maintenance | 2.88 | 2.88 |
Labor | 1.46 | 1.46 |
Equipment rental | 0.76 | 0.76 |
Other | 5.07 | 5.07 |
Total Ilmenite Processing Costs | US$ / t product | 28.00 | 28.00 |
Table 21-13: Operating Costs - Titanium Pigment Chemical Plant.
Area | Type of Cost | Unit | 30 Kt/year | 60 and 120 kt/year |
Chemical Plant - Titanium Pigment | Variavel Cost | US$/t TiO2 | 746.86 | 746.86 |
Fixed Cost | 580.30 | 348.16 |
Total Chemical Plant - Processing Costs | US$ /t TiO2 | 1,327.16 | 1,095.02 |
For tailings ponds recovery, the cost per ton of material estimated is US$ 1.04/t. This reclaimed material will be processed at the Ilmenite Plant from the year 2026 to 2032. The processing cost estimation is US$28.00/t product.
21.5.2 General and Administration
General and Administration (G&A) include items that are not captured in the mine or the process costs. These costs include items such as management and administration personnel and labor, environmental monitoring, safety, medical, catering expenses, travel expenses, communications, shared equipment, emergency response, site-wide maintenance, insurance, legal fees, property taxes, as well as other miscellaneous office expenses.
The annual G&A costs are estimated annually as described in Table 21-14 below.
Table 21-14: General and Administration Costs.
Type | Unid | Period |
2022-2027 | 2028-2041 |
Vanadium | Million US$ | 5.66 | 5.66 |
Ilmenite | 3.00 | 4.50 |
Titanium Pigment | 2024-2027 | 2028-2041 |
Titanium Pigment (SG&A + R&D) | 3.00 | 3.50 |
Sales Comission for Titanium | | 4.87 | 13.96 |
22 ECONOMICAL ANALYSIS
22.1 Taxes
- National Income Tax / Imposto de Renda - IR
A 15% tax rate on pre-tax profit, based on real profit, is applied if the profit is less than R$ 240,000/ year. A rate of 25% on pre-tax profit is applied if the profit is greater than R$ 240,000/ year. The Maracás Menchen Mine has been granted a reduction of 75% of this income tax based on a SUDENE resolution, the details of which are provided below, resulting in an effective tax rate of 6.25%. This reduction of 75% in the income tax was extended by Brazilian Federal government until 2028. The Discounted Cash Flow considered this benefit until 2028.
The Board of Management of Funds and Incentives and Investment Attraction of the Northeast Development Superintendency - SUDENE based on Decree No. 6,219 of October 4, 2007 grants the right to a reduction of 75% of non-refundable Income Tax and Additions, calculated with profit basis of the holding in favor of Vanadio de Maracás S / A, CNPJ 15,191,786 / 0001-49, case number 59334.001815 / 2014-91, based on art. 1 of Provisional Measure No. 2.199-14, dated August 24, 2001, according to the criteria established by Decree No. 6,539, of August 18, 2008, and also in accordance with the tax incentive regulation, with a view to or conditions and legal requirements.
- Compensation of Tax Losses and CSLL Negative Calculation Bases - CSLL
Article 510. The tax loss calculated as from the close of the calendar year of 1995 may be compensated, in addition to the tax loss calculated up to December 31, 1994, with the net income adjusted by the additions and exclusions set forth in this decree, with the maximum limit for compensation of thirty percent of said adjusted net income (Law No. 9.065, of 1995, article 15).
Paragraph 1. The provisions of this article only apply to legal entities that keep the books and documents required by tax legislation, proving the amount of tax loss used for compensation (Law No. 9565 of 1995, article 15, sole paragraph).
Paragraph 2. The balances of tax losses existing on December 31, 1994 are subject to compensation under this article, regardless of the period established in the legislation in force at the time of its determination.
Paragraph 3. The limit provided in the caput does not apply to the hypothesis dealt with in item I of art. 470.
- Social Contribution on Net Profits
The Social Contribution on Profits is a federal tax charged at 9% of taxable income. For the Maracás Menchen Mine, taxable income is calculated using the actual profits regime.
22.2 Royalties
- Compensação Financeira pela Exploração Mineral - CFEM
Financial Compensation by Exploration of Mineral Resources
Financial Compensation for the Exploration of Mineral Resources (CFEM) is the consideration paid to the Government of Brazil for the extraction and economic exploration of Brazilian mineral resources.
CFEM focuses on net sales of the raw mineral product, or on the intermediate cost of production when the mineral product is consumed or transformed in an industrial process.
Largo's Maracás Menchen Mine calculates CFEM using both methods above, being 1) for Vanadium products it is calculated from the operating costs incurred in the vanadium products (about 30% of total OPEX+Depreciation). Since the Maracás Menchen Mine uses the ore in an industrial process, CFEM for vanadium products is calculated based on the cost of production; and 2) for the Illmenite products the CFEM is calculated based on its Net Sales.
- Companhia Baiana de Pesquisa Mineral - CBPM
CBPM is the Bahia State Geological Survey and was the owner of the mining rights over most of the deposits, only Novo Amparo Norte is the property of VMSA. Pursuant to the terms of the agreement whereby VMSA acquired the mining rigths from CBPM, CBPM was granted a 3% royalty over gross sales revenues, less the VAT sales taxes.
For the Campbell Pit and Gulçari A Norte (GAN), a royalty of 2% is payable to Anglo Pacific PLC and 3% is payable to CBPM. For the Novo Amparo Norte (NAN) no royalty besides CFEM is applied. Table 22-1 presents the detailed royalties and CFEM for vanadium products and ilmenite concentrate.
Table 22-1: Royalties and CFEM.
| Gulçari A - Campbell | Gulçari A Norte (NAN) | Novo Amparo Norte (NAN) |
Products | CFEM | CBPM | Anglo Pacific | CFEM | CBPM | Anglo Pacific | CFEM | CBPM | Anglo Pacific |
Vanadium Products | 2% of cost of concentrate production | 3% on net revenues (sales revenue - taxes) | 2% on net revenues (sales revenue - taxes - CFEM - CBPM) | 2% of cost of concentrate production | 3% on net revenues (sales revenue - taxes) | 2% on net revenues (sales revenue - taxes - CFEM - CBPM) | 2% of cost of concentrate production. | N/A | N/A |
Ilmenite Concentrate | 2% on net revenues (sales revenue - taxes) | 3% on net revenues of Ilmenite Concentrate (sales revenue - taxes) | 2% on net revenues (sales revenue - taxes - CFEM - CBPM) | 2% on net revenues (sales revenue - taxes) | 3% on net revenues of Ilmenite Concentrate (sales revenue - taxes) | 2% on net revenues (sales revenue - taxes - CFEM - CBPM) | 2% on net revenues (sales revenue - taxes) | N/A | N/A |
22.3 Depreciation
Depreciation of plant infrastructure and equipment was calculated in a simplified way, depreciating the investment in annual values over the mine life.
22.4 Discounted Cash Flow
Discounted Cash Flow (DCF) scenario was developed to assess all 4 phases project (Ilmenite and Pigment new plants and plant vanadium expansion) based on economic and financial parameters together with mine scheduling and on the CAPEX and OPEX estimate. Table 22-2 and Table 22-3 present the main economic and financial parameters used in economic analysis of the project.
Table 22-2: Product Selling Prices.
Product | Unit | 2022 | 2023 | 2024 | 2025 | 2026 | 2027 | 2028 | 2029 | 2030 to
2041 |
Vanadium Standard | US$/lb | 8.64 | 8.68 | 8.05 | 7.80 | 7.80 | 8.20 | 8.20 | 8.20 | 8.20 |
Vanadium Premium* | US$/lb | 10.14 | 10.48 | 10.05 | 9.90 | 10.00 | 10.50 | 10.60 | 10.60 | 10.60 |
Ilmenite | US$/t | 210.00 | 210.00 | 210.00 | 210.00 | 210.00 | 210.00 | 210.00 | 210.00 | 210.00 |
Titanium (Pigment) | US$/t | 2,884.00 | 3,136.00 | 3,332.00 | 3,528.00 | 3,696.00 | 3,696.00 | 3,668.00 | 3,724.00 | 3,836.00 |
*Sales estimates for High Purity product (Vanadium Premium) correspond to 25% of Largo's total vanadium sales.
Table 22-3: Main Economic Parameters.
Taxes and Royalties |
CFEM | 2.0% |
INCOME TAX | 25% (SUDENE Discount of 75% until 2028) |
CSLL | 9.0% |
Surface Royalties | Based on subsection 22.2 |
Financial Parameters |
Discount rate | 7.0% |
NPV | Beginning of the year |
Discounted cash flow for 4 phases estimates a Net Present Value of $2.04 billion, at a Discount Rate of 7% per year, as shown in Table 22-4 and Table 22-5. Table 22-6 presents NPV 7% results Pre-tax and After-Tax and Discounted Life of Mine Cash Flow Results Pre-tax and After-Tax.
Table 22-4: Base Case Life of Mine Annual Cash Flow
| Description | 2022 | 2023 | 2024 | 2025 | 2026 | 2027 | 2028 | 2029 | 2030 | 2031 | 2032 | 2033 | 2034 | 2035 | 2036 | 2037 | 2038 | 2039 | 2040 | 2041 | 2042 | 2043 | 2044 | 2045 |
| Vanadium - lb x 1000 | 28,941 | 29,312 | 28,867 | 29,479 | 28,668 | 28,880 | 29,028 | 28,776 | 29,163 | 31,941 | 30,945 | 34,202 | 34,100 | 35,081 | 35,081 | 35,081 | 35,081 | 35,081 | 35,081 | 5,406 | 0 | 0 | 0 | 0 |
| Ilmenite - Ton x 1000 - China | 0 | 137 | 55 | 59 | 0 | 0 | 0 | 0 | 0 | 0 | 0 | 170 | 131 | 142 | 142 | 142 | 142 | 142 | 142 | 0 | 0 | 0 | 0 | 0 |
| Ilmenite - Ton x 1000 => Titanium (Pigment) | 0 | 0 | 84 | 84 | 168 | 168 | 336 | 336 | 336 | 336 | 336 | 336 | 336 | 336 | 336 | 336 | 336 | 336 | 336 | 73 | 0 | 0 | 0 | 0 |
| Titanium (Pigment) - Ton x 1000 | 0 | 0 | 30 | 30 | 60 | 60 | 120 | 120 | 120 | 120 | 120 | 120 | 120 | 120 | 120 | 120 | 120 | 120 | 120 | 26 | 0 | 0 | 0 | 0 |
| Gross Revenue | 260,899 | 296,486 | 358,356 | 363,623 | 461,135 | 475,185 | 695,604 | 700,111 | 716,958 | 741,399 | 732,632 | 796,960 | 787,825 | 798,947 | 798,947 | 798,947 | 798,947 | 798,947 | 798,947 | 147,187 | 0 | 0 | 0 | 0 |
| Production Cost | (72,773) | (79,421) | (119,192) | (114,374) | (151,846) | (150,013) | (216,735) | (221,185) | (216,667) | (222,086) | (276,197) | (321,071) | (324,044) | (329,087) | (329,642) | (330,111) | (331,045) | (332,339) | (332,339) | (59,127) | 0 | 0 | 0 | 0 |
| Logistic Cost | (5,244) | (14,658) | (12,592) | (12,818) | (12,629) | (12,911) | (20,769) | (20,725) | (20,793) | (21,284) | (21,108) | (33,148) | (30,482) | (31,455) | (31,455) | (31,455) | (31,455) | (31,455) | (31,455) | (4,340) | 0 | 0 | 0 | 0 |
| Depreciation | (24,273) | (27,456) | (37,666) | (39,004) | (45,684) | (46,690) | (56,879) | (38,099) | (39,171) | (40,592) | (69,197) | (67,436) | (58,760) | (59,310) | (54,154) | (55,314) | (42,739) | (42,933) | (42,574) | (101,612) | 0 | 0 | 0 | 0 |
| Gross Profit | 158,609 | 174,951 | 188,907 | 197,426 | 250,976 | 265,570 | 401,221 | 420,103 | 440,327 | 457,437 | 366,130 | 375,305 | 374,539 | 379,094 | 383,695 | 382,066 | 393,708 | 392,219 | 392,578 | (17,891) | 0 | 0 | 0 | 0 |
| Gross Margin | 60.8% | 59.0% | 52.7% | 54.3% | 54.4% | 55.9% | 57.7% | 60.0% | 61.4% | 61.7% | 50.0% | 47.1% | 47.5% | 47.4% | 48.0% | 47.8% | 49.3% | 49.1% | 49.1% | -12.2% | 0.0% | 0.0% | 0.0% | 0.0% |
| SG&A | (5,660) | (5,660) | (14,658) | (14,835) | (18,312) | (18,312) | (26,864) | (27,066) | (27,469) | (27,469) | (27,469) | (27,469) | (27,469) | (27,469) | (27,469) | (27,469) | (27,469) | (27,469) | (27,469) | (16,648) | 0 | 0 | 0 | 0 |
| SG & A / Net Revenue | 2.2% | 1.9% | 4.1% | 4.1% | 4.0% | 3.9% | 3.9% | 3.9% | 3.8% | 3.7% | 3.7% | 3.4% | 3.5% | 3.4% | 3.4% | 3.4% | 3.4% | 3.4% | 3.4% | 11.3% | 0.0% | 0.0% | 0.0% | 0.0% |
| CFEM | (478) | (1,083) | (1,122) | (1,134) | (1,293) | (1,279) | (1,993) | (1,957) | (1,870) | (1,865) | (2,472) | (3,745) | (3,642) | (3,808) | (3,803) | (3,816) | (3,797) | (3,824) | (3,823) | (872) | 0 | 0 | 0 | 0 |
| Royalties | (12,879) | (14,625) | (13,614) | (13,584) | (13,543) | (14,237) | (16,066) | (15,958) | (16,128) | (17,335) | (12,582) | (7,359) | (8,593) | (7,853) | (7,853) | (7,853) | (7,854) | (7,853) | (7,853) | (1,379) | 0 | 0 | 0 | 0 |
| Income before Income Tax / Social Contribution | 139,593 | 153,583 | 159,512 | 167,874 | 217,827 | 231,742 | 356,297 | 375,122 | 394,860 | 410,768 | 323,608 | 336,732 | 334,835 | 339,964 | 344,569 | 342,928 | 354,588 | 353,073 | 353,433 | (36,791) | 0 | 0 | 0 | 0 |
| Income Tax | (20,939) | (23,038) | (23,927) | (25,181) | (32,674) | (34,761) | (53,445) | (56,268) | (59,229) | (61,615) | (48,541) | (50,510) | (50,225) | (50,995) | (51,685) | (51,439) | (53,188) | (52,961) | (53,015) | 0 | 0 | 0 | 0 | 0 |
| Income Tax (above R$ 60 thousand in the quarter) | (13,955) | (15,354) | (15,947) | (16,783) | (21,778) | (23,169) | (35,625) | (37,508) | (39,481) | (41,072) | (32,356) | (33,668) | (33,479) | (33,992) | (34,452) | (34,288) | (35,454) | (35,303) | (35,339) | 0 | 0 | 0 | 0 | 0 |
| Income Tax - Benefit | 26,174 | 28,797 | 29,909 | 31,476 | 40,843 | 43,452 | 66,806 | 0 | 0 | 0 | 0 | 0 | 0 | 0 | 0 | 0 | 0 | 0 | 0 | 0 | 0 | 0 | 0 | 0 |
| Social Contribution | (12,563) | (13,823) | (14,356) | (15,109) | (19,604) | (20,857) | (32,067) | (33,761) | (35,537) | (36,969) | (29,125) | (30,306) | (30,135) | (30,597) | (31,011) | (30,863) | (31,913) | (31,777) | (31,809) | 0 | 0 | 0 | 0 | 0 |
| Income Tax / Social Contribution | 15.25% | 15.25% | 15.25% | 15.25% | 15.25% | 15.25% | 15.25% | 34.00% | 34.00% | 34.00% | 34.00% | 34.00% | 34.00% | 34.00% | 34.00% | 34.00% | 34.00% | 34.00% | 34.00% | 0.00% | 0.00% | 0.00% | 0.00% | 0.00% |
| Net Income | 118,310 | 130,167 | 135,191 | 142,278 | 184,613 | 196,406 | 301,967 | 247,585 | 260,612 | 271,112 | 213,586 | 222,248 | 220,996 | 224,381 | 227,420 | 226,337 | 234,033 | 233,033 | 233,271 | (36,791) | 0 | 0 | 0 | 0 |
| Net Margin | 45.3% | 43.9% | 37.7% | 39.1% | 40.0% | 41.3% | 43.4% | 35.4% | 36.3% | 36.6% | 29.2% | 27.9% | 28.1% | 28.1% | 28.5% | 28.3% | 29.3% | 29.2% | 29.2% | -25.0% | 0.0% | 0.0% | 0.0% | 0.0% |
| | | | | | | | | | | | | | | | | | | | | | | | | |
| EBITDA | 163,866 | 181,039 | 197,178 | 206,878 | 263,512 | 278,432 | 413,176 | 413,221 | 434,031 | 451,360 | 392,805 | 404,168 | 393,595 | 399,274 | 398,723 | 398,242 | 397,327 | 396,006 | 396,007 | 64,821 | 0 | 0 | 0 | 0 |
| EBITDA margin | 62.8% | 61.1% | 55.0% | 56.9% | 57.1% | 58.6% | 59.4% | 59.0% | 60.5% | 60.9% | 53.6% | 50.7% | 50.0% | 50.0% | 49.9% | 49.8% | 49.7% | 49.6% | 49.6% | 44.0% | 0.0% | 0.0% | 0.0% | 0.0% |
Table 22-5: PROJECT CASH FLOW (US$ x 1000) - Without Leverage.
Description | 2022 | 2023 | 2024 | 2025 | 2026 | 2027 | 2028 | 2029 | 2030 | 2031 | 2032 | 2033 | 2034 | 2035 | 2036 | 2037 | 2038 | 2039 | 2040 | 2041 | 2042 | 2043 | 2044 | 2045 |
EBIT | 139,593 | 153,583 | 159,512 | 167,874 | 217,827 | 231,742 | 356,297 | 375,122 | 394,860 | 410,768 | 323,608 | 336,732 | 334,835 | 339,964 | 344,569 | 342,928 | 354,588 | 353,073 | 353,433 | (36,791) | 0 | 0 | 0 | 0 |
(+) Depreciation | 24,273 | 27,456 | 37,666 | 39,004 | 45,684 | 46,690 | 56,879 | 38,099 | 39,171 | 40,592 | 69,197 | 67,436 | 58,760 | 59,310 | 54,154 | 55,314 | 42,739 | 42,933 | 42,574 | 101,612 | 0 | 0 | 0 | 0 |
(=) EBITDA | 163,866 | 181,039 | 197,178 | 206,878 | 263,512 | 278,432 | 413,176 | 413,221 | 434,031 | 451,360 | 392,805 | 404,168 | 393,595 | 399,274 | 398,723 | 398,242 | 397,327 | 396,006 | 396,007 | 64,821 | 0 | 0 | 0 | 0 |
(-) CAPEX | (82,520) | (51,407) | (43,285) | (36,897) | (94,309) | (95,401) | (13,668) | (33,791) | (83,403) | (111,155) | (60,348) | (15,345) | (18,884) | (15,240) | (21,654) | (17,402) | (15,611) | (7,132) | (6,305) | 0 | 0 | 0 | 0 | 0 |
(+-) Working Capital Variation | 1,792 | (4,590) | (22,148) | 480 | (26,100) | (1,184) | (52,025) | 7,599 | (490) | (3,636) | (14,300) | (16,714) | 377 | (2,327) | 80 | (166) | 299 | (331) | 15 | 180,867 | 0 | 0 | 0 | 0 |
(-) Mine Closure Cost | 0 | 0 | 0 | 0 | 0 | 0 | 0 | 0 | 0 | 0 | (1,500) | (1,500) | 0 | 0 | 0 | 0 | 0 | 0 | 0 | (19,400) | (850) | (800) | (200) | (200) |
(-) Income Tax / Social Contribution | (21,283) | (23,417) | (24,321) | (25,596) | (33,214) | (35,336) | (54,331) | (127,537) | (134,248) | (139,657) | (110,022) | (114,484) | (113,839) | (115,583) | (117,149) | (116,591) | (120,555) | (120,040) | (120,163) | 0 | 0 | 0 | 0 | 0 |
(=) Free Cash Flow to Firm (FCFF) | 61,855 | 101,625 | 107,424 | 144,864 | 109,889 | 146,511 | 293,153 | 259,492 | 215,890 | 196,913 | 206,635 | 256,125 | 261,249 | 266,124 | 260,000 | 264,083 | 261,460 | 268,504 | 269,554 | 226,288 | (850) | (800) | (200) | (200) |
(=) Accumulated Free Cash Flow to Firm | 61,855 | 163,480 | 270,905 | 415,769 | 525,658 | 672,169 | 965,322 | 1,224,813 | 1,440,704 | 1,637,616 | 1,844,251 | 2,100,376 | 2,361,625 | 2,627,749 | 2,887,748 | 3,151,832 | 3,413,291 | 3,681,795 | 3,951,349 | 4,177,637 | 4,176,787 | 4,175,987 | 4,175,787 | 4,175,587 |
| | | | | | | | | | | | | | | | | | | | | | | | |
CAPEX flow | (82,520) | (51,407) | (43,285) | (36,897) | (94,309) | (95,401) | (13,668) | (33,791) | (83,403) | (111,155) | (60,348) | (15,345) | (18,884) | (15,240) | (21,654) | (17,402) | (15,611) | (7,132) | (6,305) | 0 | 0 | 0 | 0 | 0 |
Operational flow | 144,375 | 153,032 | 150,709 | 181,762 | 204,198 | 241,912 | 306,820 | 293,283 | 299,293 | 308,068 | 266,983 | 271,470 | 280,133 | 281,364 | 281,654 | 281,485 | 277,070 | 275,635 | 275,860 | 226,288 | (850) | (800) | (200) | (200) |
(=) Accumulated Free Cash Flow to Firm | 61,855 | 163,480 | 270,905 | 415,769 | 525,658 | 672,169 | 965,322 | 1,224,813 | 1,440,704 | 1,637,616 | 1,844,251 | 2,100,376 | 2,361,625 | 2,627,749 | 2,887,748 | 3,151,832 | 3,413,291 | 3,681,795 | 3,951,349 | 4,177,637 | 4,176,787 | 4,175,987 | 4,175,787 | 4,175,587 |
| | | | | | | | | | | | | | | | | | | | | | | | |
Free Cash Flow (without taxes) | 83,138 | 125,042 | 131,745 | 170,461 | 143,103 | 181,847 | 347,483 | 387,029 | 350,138 | 336,569 | 316,657 | 370,609 | 375,088 | 381,707 | 377,148 | 380,674 | 382,015 | 388,544 | 389,717 | 226,288 | (850) | (800) | (200) | (200) |
Accumulated Free Cash Flow (without taxes) | 83,138 | 208,180 | 339,925 | 510,386 | 653,489 | 835,336 | 1,182,819 | 1,569,848 | 1,919,986 | 2,256,555 | 2,573,211 | 2,943,820 | 3,318,908 | 3,700,615 | 4,077,764 | 4,458,438 | 4,840,452 | 5,228,996 | 5,618,713 | 5,845,001 | 5,844,151 | 5,843,351 | 5,843,151 | 5,842,951 |
Table 22-6: Economical Analysis Summary.
Project Economics |
NPV7% (Pre-tax, After-Tax) | $2.8 billion, $2.0 billion |
Discounted Life of Mine Cash Flow (Pre-Tax, After-Tax) | $5.8 billion, $4.2 billion |
22.5 Internal Rate Return and Payback Analysis
The project estimates an NPV (7%) for Largo of US$ 2.0 billions post-tax and US$ 2.8 billions pre-tax. Economic study analyzed Largo Inc.'s Investment Plan from 2022 to 2041 as a whole and its benefit to the company's strategy. In this way, the calculated NPV, reflect the value of the company in its current situation together with the benefits of the projected investments.
Maracas Menchen Project is a singular project (a running project), economics parameters indicators as IRR and Payback can't be calculated separated for each project phases. GE21 carried out a study aiming to present marginal results associated with the parameters. Table 22-7 present a marginal result for Internal Rate of Return (IRR) and Payback related to the whole project, not considered for individual investments or expansions.
Table 22-7: Marginal Results for IRR and PayBack
IRR | % | 47.85% |
Discounted Payback | Years | 6.1 |
22.6 Sensitivity Analysis
A sensitivity analysis was undertaken to evaluate the impact of the resulting economic indicators for the following attributes, within the cash flow:
- Selling Prices;
- CAPEX;
- Cash Costs;
- Discount rate.
The NPV7% after-tax was evaluated by varying Prices, CAPEX, Cash Cost and Discount Rate values from -20% to +20%. The presents the sensitivity analysis of the cash flow.
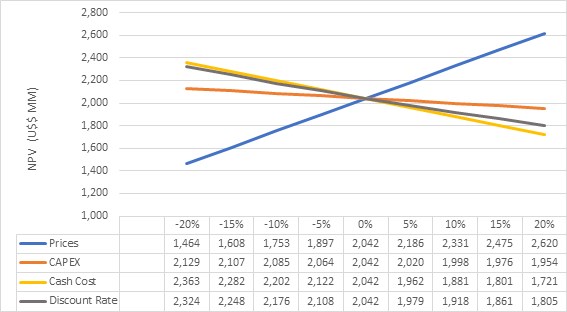
Figure 22.1: Sensitivity analysis.
GE21 concluded, based on the sensitivity analysis, that the project profitability is most affected by the prices, and to a lesser degree by the CAPEX
23 ADJACENT PROPERTIES
There are no properties immediately adjacent to the Project.
24 OTHER RELEVANT DATA INFORMATION
All relevant data known to the Qualified Persons are reported in the appropriate Sections. No other relevant data information must be disclosed.
25 INTERPRETATION AND CONCLUSIONS
This updated Mineral Reserves estimate for Campbell Pit and PFS for GAN and NAN is based on a combination of geological, geotechnical, and metallurgical studies which, taken together, establish that vanadium and titanium pigment production from Maracás Menchen Project is both technically and economically feasible.
GE21 developed a Mineral Resource and Mineral Reserve for Campbell Pit, GAN, and NAN. QP Marlon Sarges Ferreira (MAIG) is responsible for Mineral Resources Estimate and Guilherme Gomides Ferreira (MAIG) is responsible for Mineral Reserves estimation. QP Porfirio Cabaleiro Rodrigues (FAIG) supervised the entire report and is responsible for the other sections of this document.
25.1 Mineral Exploration and Geology
The procedures of geological description, sampling and preparation of samples for the laboratory and determination of densities were evaluated and considered as acceptable according to the best practices of the industry.
All processes related to the acquisition and organization of the database for the declaration of the Mineral Resources of Largo followed appropriate safety standards. The data collection has been standardized within a secure digital environment by resetting the concepts of security and rateability.
Largo has been executing an extensive mineral research program over the years using the most appropriate techniques given the type of deposit, with, for example, geophysical survey (airborne and terrestrial magnetometry), geochemical surveys, geological mappings, density determinations and studies of the recovery of other minerals (TiO2). Concomitantly with the conclusions of these studies, Largo Inc. increasingly improves their understanding of mineral deposit.
The QP has been following the density studies of the Maracás Menchen Project since 2017 and attesting that the determinations are in accordance with the best practices of the industry and certifying the density with other methods of determination.
25.2 Security and QA/QC
The analysis of quality control, transportation to the laboratory, the conditions of preparation and storage of samples reported in previous reports of former owners and Largo, in addition to the current procedures that have been validated currently, allowed QP to assume that the data is acceptable for a proposed resource estimate.
The same control procedures as the primary and secondary laboratories involved in all drilling programs have so far been recognised as "best practices" by QP in this report.
25.3 Geological Model
The 3D geological Campbell, GAN and NAN models provided by Largo were validated by the QP and adjusted when necessary. All typologies were modelled by implicit method using Leapfrog Geo software. The wireframes (solids) of this interpretation are the results of domain-based models based primarily on geological description and degree of magnetism.
At Campbell Pit, GAN and NAN deposits a value of 0.3% V2O5, associated with MAG and MPXT lithologies, were applied as a lower cut-off and was also used as guides in defining mineralization for geological continuity. TiO2 model was associated, in addition to the MAG/MPXT lithologies, the MGB and PXTM lithologies, and a cut-off related grade to the economic function that defined the resource pit, of the order 1%TiO2.
The entire geological modelling procedure followed was respecting as much as possible the geological contacts bore by hole of the domains of interest and the waste lithologies. The methodology and the result were considered adequate by the QP for the purpose of estimative Mineral Resources
25.4 Grade estimation
The variographic study of the main commodities of Campbell Pit, GAN and NAN deposits allowed the use of a consistent and satisfactory estimative method in relation to the estimative of the contents via Ordinary Kringing using the variography parameters to better understand the variability of the mineral body around of the three main directions, in order to assist in the estimation planning. The QP recognizes that choice of estimation method and the criteria of classification of Mineral Resources as adequate and considered as best practices of the industry. This does not exclude the search for continuous improvement. Such improvements do not limit the classification of mineral resource measured and indicated.
25.5 Mineral Resource Estimate
The vanadiferous mineralization was classified as a Mineral Resource based on a 0.3%V2O5 cutoff. A cut-off grade of 1%TiO2 head, derivered from an economic function is associated to TiO2 Mineral Resource. This was based on the principle that TiO2 will be a co-product, derived from the V2O5 treatment. The change of concept about TiO2 was supported by the metallurgy tests described in Section 13.
No current significant factors or risks were identified by QP that could materially affect the potential development of the mineral resources.
The TiO2 tailings dam was considered as Resource Indicated for the reasons already mentioned above and quantified and qualified with mine reconciliation data and topographic surveys.
25.6 Mining
The ultimate pit design and mining plan developed in this report is based on the Proven and Probable Reserves presented in Section 15. The Mineral Reserves summary for Campbell Pit, GAN and NAN are presented on Table 25-1.
Aside from Mineral Reserves from the ultimate pit, three tailings' ponds bearing titanium enriched material from pre-processed non-magnetic tailings of vanadium magnetic separation are estimated separately as Probable Reserves, as presented on Table 25-2 Details on TiO2 Mineral Reserves from ponds are provided on Subsection 15.5 and Section 16.
Table 25-1: Maracás Menchen Project - Total Mineral Reserves Estimate.
(Effective Date - October,10, 2021) |
Category | Tonnage
(Mt) | %Magnetics | Head | Magnetic Concentrate | Metal Contained |
%V2O5 | %TiO2 | Mag
(Mt) | %V2O5 | %TiO2 | V2O5 in
Magnetic
Concentrate
(t) | TiO2 in Non-
Magnetic
Concentrate
(t) |
Proven | 45.17 | 24.76 | 0.82 | 8.17 | 11.19 | 2.62 | 3.4 | 292,599 | 3,275,992 |
Probable | 15.19 | 23.12 | 0.68 | 8.45 | 3.51 | 2.29 | 2.78 | 80,526 | 1,183,126 |
Total | 60.36 | 24.35 | 0.79 | 8.24 | 14.7 | 2.54 | 3.25 | 373,125 | 4,459,118 |
Notes:
1. Mineral Reserves estimates were prepared in accordance with the CIM Standards.
2. Mineral Reserves are the economic portion of the Measured and Indicated Mineral Resources.
3. Mineral Reserves were estimated by Guilherme Gomides Ferreira, BSc. (MEng), MAIG, a GE21 associate, who meets the requirements of a "Qualified Person" as established by the Canadian Institute of Mining, Metallurgy and Petroleum (CIM) Definition Standards for Mineral Resources and Mineral Reserves (May 2014) ("the CIM Standards").
4. Mineral Reserves is reported effective date October 10th, 2021.
5. The reference point at which the Mineral Reserves are defined is the point where the ore is delivered from the open pit to the crushing plant.
6. Vanadium product comes from magnetic concentrate, while TiO2 product from non-magnetic portion.
7. Exchange rate $1.00 = R$5.10.
8. Mineral Resources were limited by an economic pit built in Geovia Whittle 4.3 software and following the geometric and economic parameters:
i. Recovery 100% and dilution 3%. Pit slope angles ranging from 37.5° to 64°. V2O5 long term price of $7.80/lb, with an additional premium of $2.50/lb for high purity product. TiO2 pigment selling price of $3,691/tonne. Mining costs of $1.60/tonne for mineralization and waste. Vanadium processing costs of $37.80/tonne ore feed. V2O5 concentrate recovery of 80.5%. Ilmenite concentrate costs of $55.00/tonne processed. TiO2 pigment costs of $1.374/tonne of Ilmenite concentrate. TiO2 overall recovery of 37.9%. General and Administrative (G&A) costs of $0.16/lb V2O5.
ii. Recovery 95% and dilution 5%. Pit slope angles ranging from 40° to 64°. V2O5 long term price of $7.80/lb, with an additional premium of $2.50/lb for high purity product. TiO2 pigment selling price of $3,691/tonne. Mining costs of $1.60/tonne for mineralization and waste. Vanadium processing costs of $37.80/tonne ore feed. V2O5 concentrate recovery of 79.2%. Ilmenite concentrate costs of $55.00/tonne processed. TiO2 pigment costs of $1,374/tonne of Ilmenite concentrate. TiO2 overall recovery of 40.25%. General and Administrative (G&A) costs of $0.16/lb V2O5.
iii. Recovery 95% and dilution 5%. Pit slope angles ranging from 40° to 64°. V2O5 long term price of $7.80/lb, with an additional premium of $2.50/lb for high purity product. TiO2 pigment selling price of $3,691/tonne. Mining costs of $1.60/tonne for mineralization and waste. Vanadium processing costs of $37.80/tonne ore feed. V2O5 concentrate recovery of 70.0%. Ilmenite concentrate costs of $55.00/tonne processed. TiO2 pigment costs of $1,374/tonne of Ilmenite concentrate. TiO2 overall recovery of 38.25%. General and Administrative (G&A) costs of $0.16/lb V2O5
Table 25-2: Maracás Menchen Project - Non-Magnetic Mineral Reserves in Ponds.
(Effective Date - October,10, 2021) |
Pond | Reserves
Classification | Volume | Density | Reserve in
Stock | Grade TiO2 | Metal content |
(km3) | (t/m3) | (kt) | (%) | (kt) |
BNM 04 | Probable | 829.75 | 1.80 | 1,493.55 | 11.35 | 169.52 |
BNM 02 | Probable | 640.30 | 1.80 | 1,152.53 | 11.35 | 130.81 |
BNM 03 | Probable | 521.14 | 1.80 | 938.05 | 11.35 | 106.47 |
Total | Probable | 1,991.18 | 1.80 | 3,584.12 | 11.35 | 406.80 |
Notes:
ix. Stock of "Non-Magnetic concentrate" available in the tailings ponds.
x. Mineral Reserve in tailings were estimated based on topographic surveys (primitive data and current data) and validated with monthly processing and reconciliation data.
xi. Tailings material data was sampled once every 8 hours, with an average TiO2 content of 11.35%.
Recovery is 100% and no dilution was applied to these Reserves.
The Project is an open-pit design utilizing a contract mining fleet of 2.5 m3 bucket small-hydraulic excavators, 2.5 m3 bucket front-end loaders and 36 tonne on-road trucks.
The life of mine has 20 years of production. For the first 10 years of production, from 2022 to 2031, the vanadium plant is fed 100% with material from Campbell Pit. In 2032, a transition year, the vanadium plant will be fed with material from Campbell Pit, GAN and NAN. By 2032, the vanadium beneficiation plant will have its expansion concluded and the production capacity will go from 13 kt/year of flake to 16 kt/year of flake. From 2033 forward. Material fed into the vanadium plant is expected to be a blend of approximately 45% GAN and 55% NAN, with both mines expected to be exhausted in 2041.
The ROM with grade below the minimum acceptable by the Processing Plant, even though mineralized, together with waste material, will be excavated, loaded, transported and disposed in proper waste dumps, following the respective project designed for each dump. All fleets for mining activities have been selected and sized for both mining and waste removal.
25.7 Processing
In 2022, Largo will start a series of expansions of the vanadium plant and implementation of new processing plants for Ilmenite and pigment generation. These expansions and implementation will extend to 2032 as described below:
- Phase 1: Ilmenite Concentration Plant 150 kt/year + TiO2 Pigment Processing Plant 30 kt/year Construction (2022-2023);
- Phase 2: TiO2 Pigment Processing Plant + Vanadium Trioxide Plant Expansions (2024-2025);
- Phase 3: TiO2 Pigment Processing + Ilmenite Concentration Plant Expansions (2026-2028) + Site preparation for GAN and NAN (roads/access and pre-stripping);
- Phase 4: V2O5 Expansion Second Kiln (2029-2032) and mining on GAN and NAN.
To support these expansions and the new plants, the mining schedule has 20 years of production, in the first 10 years of production from 2022 to 2031, the vanadium plant will use 100% material from Campbell Pit. In 2032, a transition year, the vanadium plant will be fed with Campbell Pit, GAN and NAN ore. From 2032 onwards material fed into the vanadium process plant will be a blend of 45% GAN and 55% NAN (an expectation), with both mines expected to be exhausted in 2041.
Non-magnetic ponds material recovery will start in 2026 with the start of operation of Pigment Plant, which will be fed together with the tailings coming from the Vanadium Plant. Tailings ponds reserves will deplete in 2033, after exhausted tailings ponds, Ilmenite plant and Pigment plant will be fed with the non-magnetic tailings from GAN and NAN deposits where the titanium concentration will be sufficient to secure production.
Based on expansions and new plants described above, Largo's production will be:
Flake 99.5% production average - 13.4 kt/year;
Ilmenite production average from 2023 to 2032 - 243.6 kt/year
Pigment production average from 2024 to 2032 - 86.7 kt/year
- From 2033 to 2041
Flake 99.5% production average - 14.3 kt/year;
Ilmenite production average from 2023 to 2032 - 217.6 kt/year
Pigment production average from 2024 to 2032 - 109.5 kt/year
25.8 Economic Analysis
Based on economic-financial parameters and products generation, discounted cash flow scenario was developed to assess the Project. The Project estimates an NPV (7%) for Largo of US$ 2.0 billion post-tax and US$ 2.8 billion pre-tax. Maracas Menchen Project is a singular project (a running project), economics parameters indicators as IRR and Payback can't be calculated separated for each project phases. GE21 carried out a study aiming to present marginal results associated with the parameters. Marginal result for Internal Rate of Return (IRR) is 47.85% and Discounted Payback 6.1 years related to the whole project, not considered for individual investments or expansions.
The economic model for the Project demonstrates that under the current set of economic assumptions the Project provides a robust positive post-tax Net Present Value (NPV). Thus, it can be concluded that the Project is economically viable under the base case technical, legal and economic parameters presented in this report. GE21 developed the report the NI 43-101 guidelines and using CIM standards for the reporting of Mineral Resources and Mineral Reserves.
26 RECOMMENDATIONS
GE21's QP recommends advancing the project to a feasibility study, which should consider the following recommendations:
26.1 Mineral Resources
☐ holes that extend current resources into adjacent areas where the deposits remain open along strike and down-dip. Estimated drilling length for Campbell Pit: 4,250m; GAN deposit: 3,500m; NAN deposit: 3,100m.
☐ holes that infill drilling to improve the classification of resources from Inferred to Indicated;
26.2 Mining
Develop detailed grade control procedures for GAN and NAN deposits before starting to mine.
Improve a grade control program and reconciliation program for Campbell Pit.
Measure the moisture and blasted swell effect for ore and waste.
Conduct a detailed geotechnical analysis for GAN and NAN deposits including a geotechnical oriented diamond drilling campaign and logging, with sampling collecting for tensile, compressive and shear strength tests and review the pit optimization parameters.
Perform supplementary geotechnical investigations of planned infrastructure sites including waste dump areas.
Implement hydrological and hydrogeological studies for the GAN and NAN deposits and continuous monitoring of water level for Campbell Pit.
Grade control procedures for the reclaiming of ponds to complement the control of the blend to fed on the ilmenite plant.
26.3 Metalurgical Testing and Processing
Develop density measurement tests to confirm non-magnetic ponds values.
Conduct metallurgical tests for the titanium production from non-magnetic tailings material in ponds.
Carry out a large-scale flotation tests and/or Locked Cycle Tests (LCT) to assess the ilmenite concentrate recovery and production.
26.4 Capital and Operating and Costs
- Improve CAPEX and OPEX estimates for Ilmenite, Pigment and Vanadium expansion plants, presents in the chapter 21 for next stage of the project, the Feasibility Study.
26.5 Environment
- Start of environmental studies to obtain the environmental license before the date planned for the start of operations in GAN and NAN, thus avoiding delays in production.
26.6 Estimates Costs
An estimate for the costs of the recommended items is shown below:
Density test work at an estimated cost of US$ 30,000;
Drilling campaigns for Campbell Pit at an estimated cost of US$ 650,000.
Drilling campaigns for GAN deposit at an estimated cost of US$ 510,000.
Drilling campaigns for NAN deposit at an estimated cost of US$ 400,000 for infill and US$ 70,000 for exploration drilling.
Swell effect analysis tests at an estimated cost of US$ 30,000.
Hydrological and hydrogeological studies at an estimated cost of US$ 300,000.
Development of a Feasibility Study for GAN and NAN deposits at an estimated cost of US$ 1,500,000.
27 REFERENCES
- Arsenault, D. et al., 2013; Preliminary Economic Assessment of the Maracás Vanadium Project, 1.4 Million Tonnes per Year Processing Plant. NI 43-101 Technical Report by RungePincockMinarco for Largo Resources Ltd.
- Aurox Resources Limited, 2006; Press Release, January 11, 2006, Balla Balla - Largest Vanadium Ore Reserve In Australia, 4 p.
- Ausenco Minerals and Metals, "Conceptual design of alternatives for non-magnetic tailings deposition", Sep 2010.
- Brandt Meio Ambiente Ltda; Environment Study, Project Vanádio de Maracás, Largo Mineraçáo Ltda, Maio 2008.
- Brito, R. S. C. et al., "Geochemistry and mineralization of the PGE-bearing vanadiferous magnetic iron ores of the Rio Jacar sil, Bahia, Brazil. International Geological Congress, Rio de Janeiro, Abstract Resumes Volume 31, 2001 (unpaginated).
- Brito, R. S. C. et al., "Geochemistry and mineralization of the PGE-bearing vanadiferous magnetic iron ores of the Rio Jacar sil, Bahia, Brazil. International Geological Congress, Rio de Janeiro, Abstract Resumes Volume 31, 2001 (unpaginated).
- Brito, R. S. C., 1984; Geologia do Sill Estratificado do Rio Jacaré-Maracás, Bahia: Congresso Brasileiro de Geologia, Sociedade Brasileira Geociências, 9th, Rio de Janeiro, Anais do 33, p. 4316-4334.
- Brito, R. S. C., 2000; Geologia e Petrologia do Sill Máfico Ultramáfico do Rio Jacaré, Bahia Estudio das Mineralizacoes de Fe-Ti-V e Platinoides Associados: Unpublished Ph.D. thesis, Brasilia, Brazil, Universidade do Brasilia, no. 39 325 p.
- Brito, R. S. C., et al, 1981; Projeto Fazenda Gulçari, Companhia Baiana de Pesquisa Mineral (CBPM), Salvador, Convenio SME-CBPM, 102 p.
- Campbell et al., 2016; "An Update Mine Plan and Mineral Reserve for the Maracás Menchen Project, Bahia State, Brazil. NI 43-101 Technical Report by Micon for Largo Resources Ltd.
- Campbell et al., 2016; "An Update Mine Plan and Mineral Reserve for the Maracás Menchen Project, Bahia State, Brazil. NI 43-101 Technical Report by Micon for Largo Resources Ltd.
- CPM Group; Vanadium Industry Outlook, Largo Resources Ltd., July 2008.
- ECM S.A. Projetos Indústrias; Processing and Infrastructuré Study, Projeto Vanádio de Maracás, Largo Resources Ltd., July 2008.
- Engenharia e Consultoria Mineral S.A., "Projeto Vanádio de Maracás Projecto Conceitual e Estimativa de Investimento, Produção: 4,500 t/a de V2O5", September 1990.
- Galvão, C. F., 1984; Projeto Fazenda Gulçari - Alvo A, National Department of Mineral Production (DNPM), Salvador, v. 1, 102 p.
- Galvão, C. F., and Nonato, I. F. B. P., 1984; Projeto Fazenda Gulçari III, Companhia Baiana de Pesquisa Mineral (CBPM), Salvador, Convenio SME-CBPM, 51 p.
- Galvão, C. F., Vianna, I. A., Nonato, I. F. B. P., and Brito, R. S. C., 1986; Depósito de Magnetita Vanadífera de Fazenda Gulçari, Maracás, Bahia, in Schobbenhaus, C. and Coelho, C.E.S. eds., Principais Depósitos Minerais do Brasil: National Department of Mineral Production (DNPM), Brasília, v. 2 (XL), p. 493-501.
- Gross, G., 1996. Mafic intrusion-hosted titanium-iron, in: Eckstrand, O.R., Sinclair, W.D., Thorpe, R.I. (Eds.), Geology of Canadian mineral deposit types. Geologica Survey of Canada, Geology of Canada, pp. 573-582.
- Harne, D. M. W., Gruenewaldt, G., Von., (1995). Ore-forming processes in the upper part of the Bushveld complex, South Africa, Journal of African Earth Sciences, Volume 20, Issue 2, 1995, Pages 77-89
- Hennessey, B. T., 2006; A Review of, and A Mineral Resource Estimate For, The Maracás Vanadium Project, Municipality Of Maracás, Bahia State, Brazil. An NI 43-101 Technical Report prepared for Largo Resources Ltd. by Micon International Limited, filed on SEDAR, www.sedar.com.
- Hennessey, B. T., 2007; An Updated Mineral Resource Estimate for The Maracás Vanadium Project, Municipality Of Maracás, Bahia State, Brazil. An NI 43-101 Technical Report prepared for Largo Resources Ltd. by Micon International Limited, filed on SEDAR, www.sedar.com.
- Hennessey, B. T. et al, 2008; An Updated Preliminary Assessment of the Maracás Vanadium Project, Municipality of Maracás, Bahia State, Brazil. An NI 43-101 Technical Report prepared for Largo Resources Ltd. by Micon International Limited, filed on SEDAR, www.sedar.com.
- Hennessey et al., 2009; Technical Report of the Feasibility Study for Maracás Vanadium Project, Brazil. NI 43-101 Technical Report by AkerSolutions for Largo Resources Ltd.
- IMS Processing plant, "Vanádio de Maracás Ltda., Vanadium Pentoxide Production Plant", 1990.
- IMS Processing plant, "Vanádio de Maracás Ltda., Vanadium Pentoxide Production Plant", 1990.
- Jacobs, C. A. et al., 2007; A Preliminary Assessment of the Maracás Vanadium Project, Municipality of Maracás, Bahia State, Brazil. An NI 43-101 Technical Report prepared for Largo Resources Ltd. by Micon International Limited, filed on SEDAR, www.sedar.com.
- Karinen, T., Hanski E., Taipale A., (2015). The Mustavaara Fe-Ti-V Oxide Deposit, Mineral Deposits of Finland, Maier, et al., Elsevier, 2015, Pages 179-194,
- Karinen, T., Hanski E., Taipale A., (2015). The Mustavaara Fe-Ti-V Oxide Deposit, Mineral Deposits of Finland, Maier, et al., Elsevier, 2015, Pages 179-194,
- Kruger, W., Latypov, R. (2020) Fossilized solidification fronts in the Bushveld Complex argue for liquid-dominated magmatic systems. Nat Commun 11, 2909.
- Largo Resources Ltd. (2015). Plant Blending Reports - Jan 2015 to Dec 2015. Maracás Menchen: Largo Resources Ltd.
- Largo Resources Ltd. (2016). Power Consumption Report - Jan 2015 - May 2016. Maracás Menchen: Largo Resources Ltd.
- Largo Resources Ltd. (2016). Processing plant Production Reports - Jan 2015 to June 2016. Maracás Menchen: Largo Resources Ltd.
- Largo Resources Ltd. (2016). Water and Fuel Consumption Report - Jan 2015 to May 2016. Maracás Menchen: Largo Resources Ltd.
- Largo Resources Ltd. (Les Ford), "Pilot Plant Testing of Maracás Magnetite Ore", Oct 2010.
- Lopes, J. J. V., 1991; Composicão Mineralogica e Tenor de Oxidos Estimados: Gulçari A: Furos de Sondagem FGA01 - FGA55, Unpublished internal report, Vanádio de Maracás Ltda, Salvador, 85 p.
- Lurgi Staff, 1986; Feasibility Study: Maracás Vanadium Project, Lurgi Unpublished internal report, Lurgi GMBH, Frankfurt, Germany, 18 p.
- Lurgi, "Feasibility Study, Maracás Vanadium Project, prepared for Pedreiras Valeria Ltda., Salvador/Bahia, Brazil", May 1986.
- Marques, R., 2006; Draft Projecto Vanádio de Maracás, Estudo de Impacto Ambiental.
- Menezes, J., 2005; Feasibility Study Summary, Unpublished internal report, Vanádio de Maracás Ltda, Salvador, 56 p.
- NCL Brasil Ltda; Mine Feasibility Study, Executive Summary, Maracás Vanadium Project, Bahia, Brazil, for Largo Resources Ltd., August 2008.
- PMA, Precious Metals Australia Limited, 2005; Press Release, December 20, 2005, JORC Compliant Ore Reserve at Windimurra - Largest in the World, 5 p.
- Poylio, E., and Hiltunen, A., 1987; DDT - Test and Mineralogical Characterizations of Maracás Samples AA - 29 -90, Unpublished Research Report, Rautaruukki Oy Tutkimuskeskus Research Centre, Finland, 5 p.
- Price, W.A., Morin, K. and Hutt, N. (1997), Guidelines for the Prediction of Acid Rock Drainage and Metal Leaching for Mines in British Columbia: Part II. Recommended Procedures for Static and Kinetic Testing, Proc. 4th International Conference on Acid Mine Drainage, Vancouver, BC, p15-30.
- Rautaruukki Oy Tutkimuskeskus Research Centre, "Laboratory Research of the Suitability of the Otankäki Process for Extracting Vanadium from Maracás Ore", December 1989.
- Recuperação de Titânio do Minério do Campbell Pit - Novembro 2020 - Gerência Técnica - Largo Resources - Mineração Menchen da Vanádio Maracás (Titanium Recovery from Campbell Pit Ore - November 2020 - Technical Management - Largo Resources - Menchen Mining by Vanádio Maracás).
- Recuperação Metalúrgica do Depósito Gulçari A Norte - Janeiro 2021 - Gerência Técnica - Largo Resources - Mineração Menchen da Vanádio Maracás (Metallurgical Recovery of the Gulçari A Norte Deposit - January 2021 - Technical Management - Largo Resources - Menchen Mining of Vanádio Maracás).
- Recuperação Metalúrgica do Minério de Novo Amparo Norte - Agosto 2020 - Gerência de Processos Largo Resources - Mineração Menchen da Vanádio Maracás (Metallurgical Recovery of Novo Amparo Norte Ore - August 2020 - Largo Resources Process Management - Menchen Mining of Vanádio Maracás).
- Reynolds, I., 1985. Vanadium-bearing titaniferous iron ores of the Rooiwater Complex, north eastern Transvaal, in: Anhaeusser, C.R., Maske, S. (Eds.), Mineral deposits of Southern Africa. Geological Society of South Africa, Johannesburg, pp. 451-460
- Rodriguez at al., 2017; "An Update Mine Plan, Mineral Reserve and Preliminary Economic Assessment of the Inferred Resources". NI 43-101 Technical Report by GE21 for Largo Resources Ltd.
- Roskill Information Services Ltd., 2010, Vanadium Global Industry Markets and Outlook, Twelfth Edition.
- Roskill Information Services Ltd., 2015, The World Market for Vanadium to 2025, Fourteenth Edition.
- Sá, J. H. S., 1985; Pesquisa de Platinoides no Complexo do Rio Jacaré: Internal report, Bahia, Brazil, Companhia Baiana de Pesquisa Mineral, Salvador, 9 p.
- Sá, J. H. S., 1992; Feições Petroquímicas Relacionadas a Estrutura do Corpo Gulçari A no Complexo Máfico - Ultramáfico do Rio Jacaré, Maracás, Bahia [abs.]: 37o Congresso Brasileiro do Geologia, São Paulo, Botetim de Resumos Expandidos, p. 460-462.
- Sá, J. H. S., Merkle R. K. W., and Von Gruenewaldt, G., 2005; The Distribution of Base Metals and Platinum-Group Elements in Magnetite and Its Host Rocks in the Rio Jacaré Intrusion, Northeastern Brazil: Economic Geology, v. 100, p. 333-348.
- SGS Minerals Services, "Recovery of Vanadium from the Maracás Ore Deposit", April 2008.
- SGS Minerals Services, "The Beneficiation Characteristics of Samples from The Vanádio De Maracás Deposit" November 2007.
- SGS Minerals Services, "The Solid-Liquid Separation of the Maracás Ore Deposit", July 2008
- SGS Minerals Services, "The Solid-Liquid Separation of the Maracás Ore Deposit", July 2008.
- Tegner, C., Cawthorn, R.G., Kruger, F.J., 2006. Cyclicity in the Main and Upper Zones of the Bushveld complex, South Africa: Crystallization from a zoned magma sheet. Journal of Petrology 47, 2257-2279.
- Tegner, C., Cawthorn, R.G., Kruger, F.J., 2006. Cyclicity in the Main and Upper Zones of the Bushveld complex, South Africa: Crystallization from a zoned magma sheet. Journal of Petrology 47, 2257-2279.
- Teixeira, W., Sabaté, P., Barbosa, J., Noce, C. M., and Carneiro, M. A., 2000; Archean and Paleoproterozoic Tectonic Evolution of the São Francisco Craton: International Geological Congress, 31st, Rio de Janeiro, Brazil, August 6-17, 2000, Proceedings, p.101-137.
- The World Steel Association, 2016, Short Range Outlook 2016-2017, 13 April, 2016,
- TTP Squared, Inc, Vanadium Market Analysis, August 31, 2017
- U.S. Geological Survey, 2011, 2010 Minerals Yearbook, Vanadium [Advance Release], November, 2011.
- U.S. Geological Survey, 2012, 2011 Minerals Yearbook, Vanadium [Advance Release], December, 2012.
- U.S. Geological Survey, 2013, Mineral Commodity Summaries, Vanadium, January, 2013.
- U.S. Geological Survey, 2016, 2014 Minerals Yearbook, Vanadium [Advance Release], February, 2016.
- U.S. Geological Survey, 2016, Mineral Commodity Summaries, Vanadium, January, 2016.
- United Nations COMTRADE database, DESA/UNSD, http://comtrade.un.org.
- Vanádio de Maracás Staff, 1987; Estimacão Preliminar do Depósito de Vanádio Maracás, Unpublished internal report, Vanádio de Maracás Ltda, Salvador, 61 p.
- Vendors' budgetary quotes.
- Westman, K., and Poylio, E., 1989; Laboratory Research of the Suitability of the Otanmaki Process for Extracting Vanadium from Maracás Ore, Unpublished Research Report, Rautaruukki Oy Tutkimuskeskus Research Centre, Finland, 22 p.
- Willemse, J., (1969). The Geology of the Bushveld Igneous Complex, the Largest Repository of Magmatic Ore Deposits in the World. Magmatic Ore Deposits, H. D. B. Wilson. Society Exploration Geophysicist Geophysysical Monograph Series. Volume 4,
- World Steel Association, 2012, Short Range Outlook, 11 October, 2012,
- World Steel Association, Annual Crude Steel Production, 1980-2014, and Monthly Crude Steel Production, 2015, www.worldsteel.org/statistics.
- www.worldsteel.org/media-centre/press-releases/2012/worldsteel-short-range-outlook.html.
- www.worldsteel.org/media-centre/press-releases/2016/worldsteel-Short-Range-Outlook-2016-2017.html.