FORM 6-K
SECURITIES AND EXCHANGE COMMISSION
Washington, D.C. 20549
Report of Foreign Issuer
Pursuant to Rule 13a-16 or 15d-16
of the Securities Exchange Act of 1934
For the month of February, 2011
Commission File Number: 1-33659
COSAN LIMITED
(Translation of registrant’s name into English)
Av. Juscelino Kubitschek, 1726 – 6th floor
São Paulo, SP 04543-000 Brazil
(Address of principal executive offices)
Indicate by check mark whether the registrant files or will file annual reports under cover of Form 20-F or Form 40-F:
| Form 20-F | X | Form 40-F |
Indicate by check mark if the registrant is submitting the Form 6-K in paper as permitted by Regulation S-T Rule 101(b)(1):
| Yes | No | X |
Indicate by check mark if the registrant is submitting the Form 6-K in paper as permitted by Regulation S-T Rule 101(b)(7):
| Yes | No | X |
Indicate by check mark whether by furnishing the information contained in this Form, the Registrant is also thereby furnishing the information to the Commission pursuant to Rule 12g3-2(b) under the Securities Exchange Act of 1934:
| Yes | No | X |
If “Yes” is marked, indicate below the file number assigned to the registrant in connection with Rule 12g3-2(b): N/A
COSAN LIMITED
Item | |
| 1. | Communication regarding 3rd Quarter Fiscal Year 2011 earnings release |
Item 1
CCL, Rumo and Cogen reach 45% of the
total EBITDA in the quarter
São Paulo, February 09, 2011 - COSAN LIMITED (NYSE: CZZ; Bovespa: CZLT11) and COSAN S.A. INDÚSTRIA E COMÉRCIO (Bovespa: CSAN3) are announcing today their results for the third quarter of fiscal year 2011 (3Q’11), ended on December 31, 2010. The results for 3Q’11 are shown in consolidated form, according to Brazilian corporate legislation.
| 3Q’11 Highlights |
Marcelo Martins | ● | Record Revenues of R$3.1billion from CCL |
CFO & IRO
● | EBITDA of R$ 98.1 million from CCL |
Head of IR | ● | Transportation Revenues of R$80.9 million from Rumo |
● | Rumo’s EBITDA of R$37.7 million |
www.cosan.com.br | ● | Revenues of R$53.7 million from Cogeneration |
● | Record Revenues of R$ 1.37 billion from CAA |
 | Summary of Financial and Operating Information (R$MM) | |||||
| 3Q'10 | 3Q'11 | YTD'10 | YTD'11 | |||
| 3,800.5 | 4,738.4 | Net sales | 10,941.9 | 13,454.1 | ||
| 460.0 | 577.9 | l | Gross profit | 1,351.5 | 1,812.9 | |
| 12.1% | 12.2% | Gross Margin | 12.4% | 13.5% | ||
| 253.0 | 75.2 | l | Operating income (loss) | 1,016.4 | 691.0 | |
| 6.7% | 1.6% | Operating margin | 9.3% | 5.1% | ||
| 490.4 | 410.5 | l | EBITDA | 1,157.2 | 1,565.3 | |
| 12.9% | 8.7% | EBITDA Margin | 10.6% | 11.6% | ||
| 167.8 | 35.5 | l | Income (loss) before minority interest | 669.4 | 505.7 | |
| 167.1 | 27.9 | l | Net income (loss) | 677.8 | 476.3 | |
| 4.4% | 0.6% | Profit (loss) Margin | 6.2% | 3.5% | ||
| 401.0 | 548.7 | Capex | 1,182.5 | 1,543.5 | ||
| 4,300.8 | 5,301.1 | Net Debt | 4,300.8 | 5,301.1 | ||
| 4,963.9 | 5,496.9 | Shareholders' & Minorities Equity | 4,963.9 | 5,496.9 | ||
1 of 31

A. Market Overview
According to data from UNICA, the 2010/11 crop of the Center -South region of Brazil (CS) was already almost concluded at the end of December 2010, totaling 555.0 million tons of sugar, 2.4% higher than the same period of the previous crop. The production mix maximized the sugar production, including the entry into operation of about 10 new sugar plants. This product accounted for 44.79% of processed cane, compared to 42.59% of the previous crop, resulting in the production of 33.5 million tons of sugar and 25.3 billion of liters of ethanol, 16.8% and 6 71% higher, respectively, the previous crop. This production increase was mainly due to higher amount of TSR (total sugar recoverable) per ton of cane, which totaled 141.3 kg / ton, compared to 130.2 kg / ton in 2009/10.
Despite the above-mentioned significant production growth, the 2010/11 crop has suffered the impacts of the drought in the period that affected the CS and showed a lower yield per hectare, which reduced the availability of cane. A drop of nearly 7.0% on UNICA’ s first harvest estimate (595.9 million tons of cane), partially offset by a 1.9% higher TSR and the mix of sugar above expected, resulted in a production of 0.6 million tons of sugar and 2.1 billion liters of ethanol lower than expected.
The sugar production growth in the CS was accompanied by the strong pace of exports. In the period between April and December 2010, 23.5 million tons of sugar were exported by Brazil, a volume 19.9% higher than the previous year's harvest. Raw sugar accounted for 75.2% of total exports, mainly intended to UAE, Russia, Malaysia and India. White sugar exports totaled 5.8 million tons, mainly to Yemen, Ghana, Mauritania and Ivory Coast.

The high sugar prices in international markets reflected the reversal of the global production and consumption balance for the 2009/10 crop. Earlier this year, market estimates foresaw a surplus of more than 5 million tons. Due to lower production in countries like Brazil, Russia, Australia and others, new estimates range from an equilibrated supply and demand to a deficit of 3 million tons for the 2010/11 crop.
In India, the current crop already presented a production 15% higher than the same period last year, with 8.5 million tons of sugar, indicating that the total output should be close to market consensus of 25.0 million tons. Due to the evolution of this crop and high food prices, the
2 of 31
government of that country adopted a more cautious export policy, postponing the decision to issue the licenses (OGLS).
In Australia, the 2010/11 harvest was significantly affected by the rains, with floods hitting the main producing regions. As a result, almost 20.0% of the cane was left for the next harvest (called "cana bisada") and difficulties were faced in the application of fertilizers and pest control, which should impact the productivity of the next crop.
In the EU, due to news on a shortage of sugar in retail and aiming to contain inflation of agricultural products prices, the European Commission signaled that it may approve additional “out-of-quota" sugar imports, which indicates that this year's volume available for exports will be significantly below the previous year, when the exports were 500,000 tons above the volume allowed by the WTO.
In China, during the quarter ended December, the local government held several auctions to sell the product in the domestic market and contain prices in the local market, which was also affected by lower product availability. Consequently, China has become one of the main Brazilian destinations, importing about 1 million tons.
In Russia, traditionally Brazil's main sugar importer, the local government started discussions on the reduction of the import tax due to the reduced inventory levels.
As a result of this scenario, the raw sugar price strongly recovered in the 3Q’11, with an average of ¢US$29.07/lb, 44.4% above the 2Q’11 and 22.8% above the average of the 3Q’10, reaching ¢US$32.12/lb at the end of December. The refined sugar in international market had an average price of US$731.08/ton in the period, which represents a 19.1% increase in comparison with the 3Q’10 and 25.7% above the 2Q’11.
In the 3Q’11, the average price of the Brazilian real in relation to the US dollar was R$ 1.70/US$, 3.0% below the average of the previous quarter and 2.4% lower than the 3Q’10. The exchange rate at the end of the period was R$1.67/US$, compared with R$1.69/US$ in September 2010 and R$1.74/US$ in December 2009.
In the domestic market, the average refined sugar price for the 3Q’11 (based on data of the Luiz de Queiroz School of Agriculture - ESALQ) was R$74.2 per 50Kg bag, which is equivalent to ¢US$39.67/lb, 54.7% higher than the previous quarter and 28.7% above the 3Q’10, mainly due to the crop shortfall in Brazil.
3 of 31
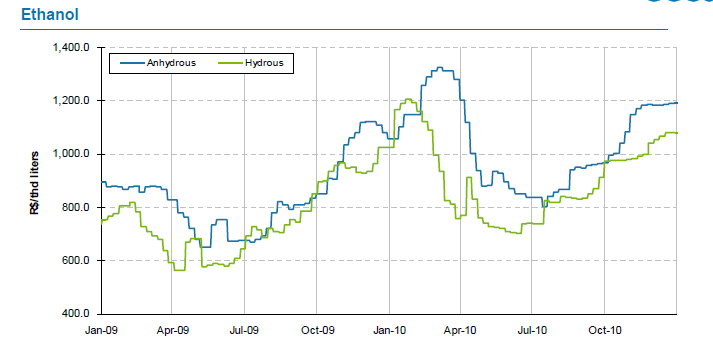
In the ethanol domestic ethanol market, the anhydrous and hydrous ethanol prices strongly recovered due to the start of the interharvest season and lower carryover stocks, due to (i) crop shortfall in Brazil, (ii) maximization of sugar production and (iii) increased demand for anhydrous and hydrous ethanol due to growing demand, reflecting the increased vehicle fleet. The average hydrous ethanol price (ESALQ’s base) was R $ 1,015.2 / cbm in the 3Q’11, 22.9% higher than the previous quarter and 6.9% above the 3Q’10. The average anhydrous ethanol price was R $ 1,187.1 / cbm, representing an increase of 23.1% compared to the 2Q’11 and 8.5% compared to the same quarter of last year.
The average parity (weighted by the fleet) of the hydrous ethanol price compared to gasoline in Brazil, according to the National Petroleum Agency (ANP), was approximately 72.5% at the end of the 3Q11, leaving only four states within the 70% parity, which together represent approximately 41.0% of the country's flex-fuel fleet.
Fuel
According to ANP, the volume of diesel sold in October and November 2010 (December data not yet available) was 6.9% higher than the same period of last year, reaching 8.7 billion liters. With higher prices throughout 2010, hydrous ethanol had unfavorable parity in relation to gasoline in many states, hence the volume of product sold decreased by 5.2%, totaling 2.6 billion liters. In contrast, the volume sold of gasoline C (with a blend of 25% anhydrous ethanol) rose by 12.7%, reaching 3.7 billion liters in that period.
4 of 31
| B. Production Figures | ||||
| 3Q'10 | 3Q'11 | Production Highlights | YTD'10 | YTD'11 |
| 14,228 | 11,299 | Sugarcane Crushed (thd tons) | 50,133 | 54,238 |
| 5,778 | 6,092 | Own Cane (thd tons) | 23,443 | 27,400 |
| 8,450 | 5,207 | Suppliers (thd tons) | 26,690 | 26,838 |
| Production | - | |||
| 662 | 485 | Raw Sugar (thd tons) | 2,520 | 2,515 |
| 274 | 324 | White Sugar (thd tons) | 993 | 1,405 |
| 228 | 174 | Anhydrous Ethanol (thd cbm) | 623 | 686 |
| 303 | 280 | Hydrous Ethanol (thd cbm) | 1,203 | 1,513 |
| 126.6 | 138.5 | Sugarcane TSR (kg/ton) | 131.1 | 139.9 |
| 68.4% | 78.1% | Mechanization (%) | 68.4% | 78.1% |
This year’s crop was affected by severe drought which impacted the Center-South region of Brazil, reducing the availability of sugarcane. Consequently, the mills ended their harvest in the beginning of December with a total crushed volume of 11.3 million tons of sugarcane in the quarter, 20.1% lower than the 3Q’10. During this quarter the own cane represented 53.9% of total processed cane, with a mechanization rate of 78.1%.
The 11.9 kg /ton increase in the ATR, compared with the same quarter of last year, was insufficient to offset the smaller amount of cane processed. Therefore, this quarter sugar and ethanol production was 16.0% and 17.0%, respectively lower than that of the 3Q’10. The good sugar prices, especially in the domestic market, allowed a strategy to prioritize the production of white sugar with higher added value, which reached 324 thousand tons or an increase of 50 thousand tons in relation to the 3Q’10.
5 of 31
C. Operating Performance
As of the 2011 fiscal year, the Company adopted the hedge accounting criteria with the goal of providing greater transparency regarding hedges and their results. All of its effects will be described in detail in the section "Hedge Accounting Impacts.”
EBITDA by Business Unit
| EBITDA (R$ MM) - 3Q'11 | CAA | Rumo | CCL | Total* |
| Net Revenues | 1,683.0 | 113.7 | 3,084.8 | 4,738.4 |
| (-) Cost of Product Sold / Services Rendered | (1,369.1) | (75.3) | (2,863.3) | (4,160.5) |
| (=) Gross Profit | 313.9 | 38.3 | 221.5 | 577.9 |
| Gross Margin | 18.7% | 33.7% | 7.2% | 12.2% |
| (-) Selling Expenses | (153.4) | - | (113.4) | (271.0) |
| (-) General and Administrative Expenses | (101.8) | (5.8) | (24.4) | (132.0) |
| (-) Other Operating Revenues | (7.5) | (0.3) | 4.2 | (3.6) |
| (+) Depreciation and Amortization | 223.6 | 5.5 | 10.2 | 239.2 |
| (=) EBITDA | 274.8 | 37.7 | 98.1 | 410.5 |
| EBITDA Margin | 16.3% | 33.2% | 3.2% | 8.7% |
| * Total contemplates the effects of consolidation elimination |
6 of 31
| Net Revenue | |||||
| 3Q'10 | 3Q'11 | Sales Composition (R$MM) | YTD'10 | YTD'11 | |
| 3,800.5 | 4,738.4 | Net Operating Revenue | 10,941.9 | 13,454.1 | |
| 1,146.2 | 1,683.0 | CAA | 3,563.7 | 4,715.2 | |
| 735.6 | 931.9 | l | Sugar Revenue - CAA | 2,162.3 | 2,868.3 |
| 299.2 | 367.0 | Local | 714.6 | 1,015.3 | |
| 436.5 | 564.9 | Export | 1,447.7 | 1,853.0 | |
| 338.3 | 647.7 | l | Ethanol Revenue - CAA | 1,145.5 | 1,537.0 |
| 249.3 | 557.9 | Local | 776.2 | 1,318.0 | |
| 89.0 | 89.9 | Export | 369.3 | 219.0 | |
| 19.4 | 53.7 | l | Energy Cogeneration - CAA | 87.9 | 190.5 |
| 52.8 | 49.7 | l | Other Revenue - CAA | 168.0 | 119.4 |
| 35.7 | 113.7 | Rumo | 118.0 | 363.6 | |
| 35.7 | 32.7 | l | Loading | 115.3 | 114.2 |
| - | 80.9 | l | Transportation | 2.7 | 249.5 |
| 2,699.6 | 3,084.8 | CCL | 7,556.4 | 8,883.5 | |
| 2,537.0 | 2,865.7 | l | Fuels Revenue - CCL | 7,035.7 | 8,220.4 |
| 240.7 | 238.5 | Ethanol | 586.5 | 611.5 | |
| 1,102.4 | 1,213.5 | Gasoline | 2,902.3 | 3,391.1 | |
| 1,166.5 | 1,381.2 | Diesel | 3,339.3 | 4,139.7 | |
| 27.4 | 32.5 | Other | 207.6 | 78.2 | |
| 143.9 | 207.4 | l | Lubes Revenue - CCL | 465.1 | 613.6 |
| 18.7 | 11.8 | l | Other Revenue - CCL | 55.6 | 49.4 |
| (81.1) | (143.1) | Eliminations from Consolidation | (296.1) | (508.1) | |
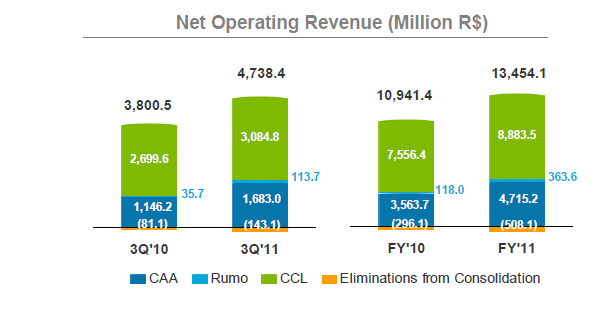
Cosan’s net revenue amounted to R$4.7 billion in the 3Q11, compared with R$3.8 billion in the same quarter of the previous year. This increase of 24.7% reflects the growth in all business units through the increase in the production capacity and volume sold and services provided. At CAA, the growth was due to (i) the increase in the use of the installed capacity of two greenfield projects (Jataí and Caarapó) and (ii) the entry into operation of other co-generation projects which, aligned with the best sugar and ethanol prices, increased CAA’s revenues by 46.8%, changing to R$1.68 billion. CCL’s net revenues increased by 14.3%, totaling R$3.1 billion, mainly due to a 18.4% increase in diesel revenues, a 44.1 % increase in lubricants revenues and 10.1% increase in gasoline revenues. At Rumo, the beginning of transport operations, which is primarily based on the partnership agreement with ALL – America Latina Logística S.A., was the main responsible for the 218.1% increase in its net revenues, which totaled R$113.7 million, of which R$80.9 million resulted from services and transport and R$32.7 million from loading services.
7 of 31
Sugar Sales - CAA
Sugar sales in the quarter totaled R $ 931.9 million, an increase of 26.7% over the same quarter last year. The main effects that contributed to the increase of R $ 196.3 million were:
| Þ | Increase of R $ 131.8 million from the higher sales volume, 17.9% above the same quarter of last year. Domestic sales increased 4.4%, totaling 295.1 thousand tons, while exports amounted to 751.0 thousand tons, an increase of 24.2%; |
| Þ | Increase of R $ 55.0 million due to prices 7.4% higher, while domestic prices were 17.5% higher, prices in international markets increased of only 4.2% compared with the same period of last year due to the hedge accounting effects. |
| Þ | In contrast, the domestic market accounted for 28.2% of sales in comparison with 31.9% in the 3Q10. This mix reduction offset part of the gains of higher volumes and prices |
8 of 31
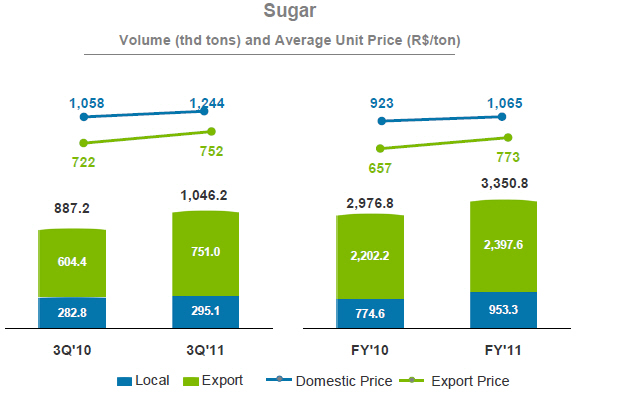
The amount of sugar in stock at the end of this quarter, of 998 thousand tons, fell by 18.8% compared to the 3Q10 and reflected the impacts of the sugar production lower than expected.
Sugar Inventories
| Inventories: Sugar | ||
| 3Q'10 | 3Q'11 | |
| '000 ton | 1,229.3 | 998.3 |
| R$'MM | 614.0 | 582.7 |
| R$/ton | 499 | 584 |
9 of 31
Ethanol Sales - CAA
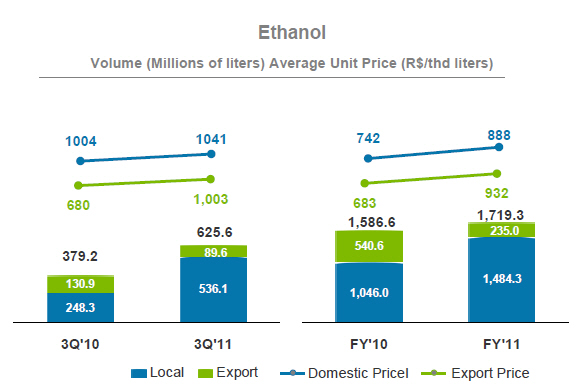
Ethanol revenues in the 3Q11 totaled R$647.7 million, showing a strong increase of 91.5% compared to the 3Q10. It is important to stress the main factors that increased the revenues by R$ 309.5 million:
| Þ | Increase of R$ 219.7 million due to higher sales volume, 65.0% higher than the 3Q10, resulting from the increase of 115.8% in volume sold in the domestic market, partially offset by a decrease of 31.6% in exports. It is worth mentioning that the sales volume in 3Q11 was impacted: |
| o | In the domestic market, by the commercial decision to take the high prices of the product at the end of the harvest and reduce the risk of carrying a high inventory to sell it during the offseason; and |
| o | In international markets, the export opportunity windows remain closed and thus the sales volume just follows the previously established trade agreements. Moreover, competition from ethanol produced in the U.S. has caused major difficulties for the sale of Brazilian ethanol in the European market. |
| Þ | the increment of R$54.3 million from 3.7% higher prices in the domestic market and 47.6% higher in international markets; |
| Þ | In addition, 3Q11 revenues increased by R$ 4.7 million due to the sales mix more focused on the domestic market, which showed slightly higher prices and represented 85.6% of the sales for the period, compared to 65.5% in the 3Q10. |
Throughout this year, the Company opted to keep a steady pace for their ethanol sales as evidenced in previous quarters.
10 of 31
The level of inventories in the 3Q11 showed a decrease of 12.6% compared to the 3Q10, even with production 20.5% higher than last year. This level is mainly a result of an increase of 65.0% in sales volume compared to the same quarter of last year.
Ethanol Inventories
| Inventories: Ethanol | ||
| 3Q'10 | 3Q'11 | |
| '000 cbm | 645.0 | 563.9 |
| R$'MM | 569.6 | 492.5 |
| R$/cbm | 883 | 873 |
Cogeneration of Energy - CAA
The energy revenues totaled R$ 53.7 million through the sale of R$ 2.7 million in steam and 380,8 thousand MWh of energy at an average price of R$134.0 / MWh. The growth of 114.3% in the sales volume results from the startup of new cogeneration units (totaling 10 units this year, compared to 6 last year) and the ramp-up of the others.

Other Products and Services - CAA
CAA’s revenues from other products and services decreased by 5.9%, or R$3.1 million compared to the 3Q10, mainly due to: (i) the decrease in retail sales of DaBarra Alimentos products, such as breakfast foods, as a result of a strategic repositioning of Cosan Alimentos, and (ii) reduction in diesel sales mainly to service providers in the agriculture area, due to increased purchase of agricultural machinery and equipment which increased the Company's mechanization level.
11 of 31
Rumo
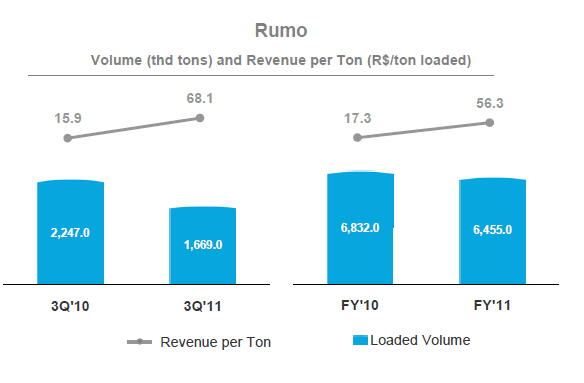
Rumo’s net revenues of R$ 113.7 million in the 3Q11 was 218.1% higher than the 3Q10, reflecting the startup of transport operations in January 2010, which accounted for revenues of R$80.9 million. By reviewing Rumo’s operations separately, one can note a decrease of 8.4% in the revenues from loading services, of R$ 32.7 million, due to a reduction of 25.7% in the volume loaded, partially offset by the increase of 23.3% in the average price of this service.
The lower volume in this quarter reflected the crop shortfall, which reduced the availability of sugar to be exported. Of the total sugar loaded by Rumo in this quarter, CAA represented 35.0% or 589 thousand tons in the period. On the other hand, the increase of the average price of the port services was due to renegotiation of existing commercial contracts and the mix of the loading services with higher participation of white sugar (with margin and prices higher), from 6.5% on 3Q’10 to 10% on 3Q’11.
As a result of higher value added to the shipped product, mainly by the increase in transport operations, revenues per ton loaded this quarter was 4.3 times higher than in the 3Q10.
12 of 31
Fuel Sales - CCL
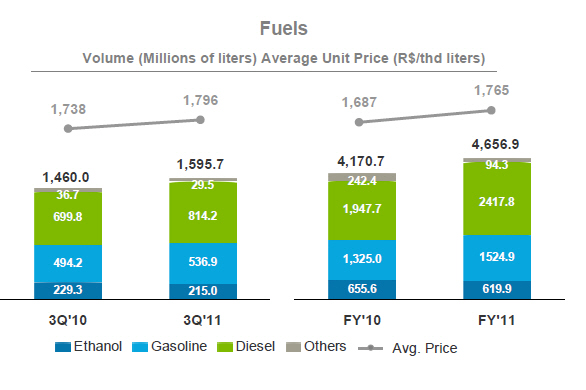
CCL’s net revenues amounted to R$3.1 billion in the 3Q11, 14.3% higher to that of the same quarter of the previous year, and the fuel revenues increased 13.0%, reaching R$2.7 billion. The main factors that affected the fuel revenues in this quarter were:
| Þ | Increase of 16.4% in the volume of diesel sold in comparison with the 3Q10. This increase is due to the following factors: |
| o | Increase of 6.9% in the diesel national consumption, according to ANP, in October and November 2010 (December data are not yet available) due to an increase in the industrial customers and transport demand in view of the recovery of the economic activity in Brazil. |
| o | Market share gains in retail, mainly in the manufacturing industry. |
| Þ | Increase of 8.7% in the gasoline C sales volume in relation to the 3Q10 due to an increase in the percentage of flex fuel car users, who are now opting for this fuel in substitution for the hydrated ethanol; |
| Þ | Increase in the average unit prices of ethanol, gasoline and diesel and higher diesel market share in the sales mix, whose prices are higher than the ethanol. |
13 of 31
Lubricant Sales - CCL
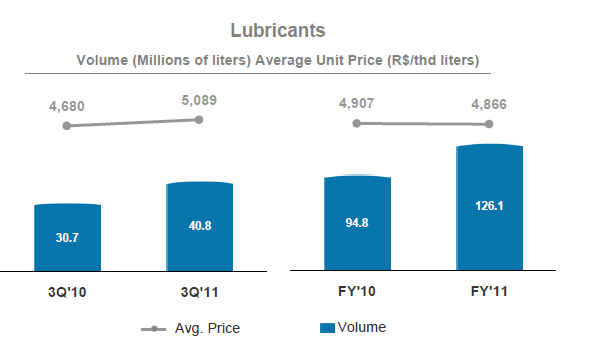
The 44.1% increase in lubricant revenues, which totaled R$ 207.4 million in the quarter, results from the mix with a higher share of premium products with higher added value and the strong sales volume of 40.8 million liters due to the increase of the national consumption and market share gains, which was 11,1% on the accumulated data from April /09 to December/09 and increased to 13,5% on the same period of 2010 . It should be noted that, compared to the 2Q11, the lubricant sales volume decreased 4.1% due to the typical year-end seasonality, while the volume sold by the Sindicom associated companies decreased by approximately 9.0 %.
CCL’s inventories increased by 15.9%, aligned with the growth in the fuel sales volume. Analysing the inventory in days of sales, no significant change was found, remaining at about 9 days.
CCL Inventories
(Includes Fuels and Lubricants)
| Inventories: CCL | ||
| 3Q'10 | 3Q'11 | |
| '000 cbm | 145.1 | 168.2 |
| R$'MM | 290.1 | 335.3 |
| R$/cbm | 1,999 | 1,994 |
14 of 31
Cost of Goods Sold
Cost of Products Sold totaled R$4.2 billion, in comparison with R$3.3 billion in the same quarter of the previous year. At CAA, the increase of 54.3%, or R$482.0 million, results mainly from the higher volume sold, increase in the activity that purchase the sugar for sale in the domestic market and increase in depreciation. At Rumo, the startup of transport activities was the main responsible for the 147.7% increase in the cost of the products sold. At CCL, the 14.2% in the cost of products sold, which amounted to R$2,863.3 million, is due mainly to the higher volume sold, higher diesel and gasoline share in the mix of products sold, in addition to the increase in the acquisition cost of ethanol.
| 3Q'10 | 3Q'11 | COGS per Product | YTD'10 | YTD'11 |
| (3,340.5) | (4,160.5) | Cost of Good Sold (R$MM) | (9,590.4) | (11,641.2) |
| (887.1) | (1,369.1) | CAA | (2,799.5) | (3,658.3) |
| (498.3) | (707.2) | Sugar | (1,429.0) | (1,947.8) |
| (314.2) | (576.8) | Ethanol | (1,178.5) | (1,492.2) |
| (74.6) | (85.1) | Others CAA + Cogeneration | (191.9) | (218.4) |
| (30.4) | (75.3) | Rumo | (88.9) | (248.0) |
| (2,506.8) | (2,863.3) | CCL | (6,992.8) | (8,250.5) |
| 83.7 | 147.2 | Eliminations from Consolidation | 290.8 | 515.7 |
| Average Unit Cost | ||||
| CAA | ||||
| 496 | 589 | Unit Cash COGS of Sugar (R$/ton) | 419 | 500 |
| 656 | 757 | Unit Cash COGS of Ethanol (R$/thd lit | 327 | 355 |
| 1,682 | 1,750 | CCL (R$/thousand liters) | 1,639 | 1,725 |
* the cash-cost of sugar and ethanol does not include depreciation and amortization of planted areas, agricultural depreciation (machinery and equipment), industrial depreciation and inter-harvest maintenance.
CAA
Since the beginning of this fiscal year we have presented the unit cost of sugar and ethanol excluding amortization and depreciation (cost-cash) effects aiming to better analyze their behavior over the quarters.
The depreciation and amortization effects on the unit costs reflected the investments made in the sugar cane planting, maintenance of our industrial units, harvest mechanization, the greenfield projects (Jataí and Caarapó), which entered into operation at the end of the former harvest, and the improvement of safety and sustainability of our operations.
Cost of products sold and services provided by CAA totaled R$1.4 billion, representing an increase of 54.3% or R$ 482.0 million compared to the same period of last year. The main factors behind this increase are:
| Þ | higher volume of sugar and ethanol sold, which was responsible for the increase of R$293.5 million, |
| Þ | R$ 152.2 million for sugar origination, characterized by the purchase of raw material for refining and finished product and subsequent sale and distribution in domestic market. |
| Þ | Increase of approximately R$88.8 million due to an increase in the ATR according to Consecana formula (which defines suppliers’ remuneration and land lease), which changed from R$0.3524/kg of ATR to R$0.3766/kg of ATR. It is worth highlight that the |
15 of 31
ATR price increase impact is not only on the sugar cane harvested this quarter but on all previous quarters of this fiscal year, therefore with negative effects on the unit cost of this quarter;
| Þ | the increase of R$32 million in depreciation due to the investments made over the years |
| Þ | R$16.6 million due to take-or-pay contracts with service providers due to crop shortfall; |
| Þ | All these factors were partially offset by the increase of the amount of ATR, which increased from 126.6kg / ton of cane to 138.5kg / ton due to more appropriate climatic conditions, improving the cost at R$82.9 million in the 3Q11. |
Rumo
The cost of products sold by Rumo in the 3Q11 was R$75.3 million and includes costs of port loading, transshipment, storage services and contracting of rail and road freights. In addition, the participation of the loading of the white sugar (bagged) increased over the total volume of sugar loaded, with higher costs and margin, reflecting an increase of Rumo´s COGS.
CCL
The cost of products sold by CCL increased by 14.2% compared to the 3Q10. Excluding the volume factor the unit cost of R$1,750m3 in the 3Q11 was 4.0% higher than the same quarter of the previous year. This results from the following factors:
| Þ | Cost of ethanol 7.6% higher than the 3Q10; |
| Þ | Sales mix with higher share of gasoline and diesel, which have unit costs higher than the ethanol; |
| Þ | Increase in the unit cost of lubricants, however offset by the increase in revenues resulting from the sales mix with more share of products with higher added value. |
Gross Profit
With these results, the 3Q11 presented gross profit of R $ 577.9 million, 25.6% higher than the same period of the previous year, a margin of 12.2%. CAA has contributed with gross profits of R$313.9 million, a gross cash margin of 26.9% for ethanol and 33.9% for sugar, also benefited by the higher share of cogeneration results. Rumo, in turn, contributed with gross profits of R$38.3 million, with consolidated margin of 33.7%. At CCL, the gross margin remained constant at 7.2% but with a 4.7% increase in gross margin in Reais per thousand liters, which changed from R$129/thousand liters to R$135/thousand liters, benefited mainly by the lubricants business and the mix of products with a higher share of diesel and gasoline.
16 of 31
| 3Q'10 | 3Q'11 | Gross Margin per Product | YTD'10 | YTD'11 |
| Unitary Gross Margin | ||||
| CAA | ||||
| 333 | 302 | Gross Margin (Cash) Sugar (R$/ton) | 308 | 356 |
| 235 | 278 | Gross Margin (Cash) Ethanol (R$/thd liters) | 395 | 539 |
| 129 | 135 | CCL (R$/thousand liters) | 132 | 132 |
| % Gross Margin/Net Revenues | ||||
| CAA | ||||
| 40.1% | 33.9% | Gross Margin (Cash) Sugar | 42.4% | 41.6% |
| 26.4% | 26.9% | Gross Margin (Cash) Ethanol | 54.7% | 60.3% |
| 15.0% | 33.7% | Rumo | 24.6% | 31.8% |
| 7.1% | 7.2% | CCL | 7.5% | 7.1% |
Selling Expenses
Selling expenses increased by 24.1%, or R$52.6 million in relation to the 3Q10 mainly due to the increase in the volume sold by CAA and CCL, which resulted in more freight costs.
| 3Q'10 | 3Q'11 | Selling Expenses | YTD'10 | YTD'11 |
| (218.4) | (271.0) | Selling Expenses (R$MM) | (639.3) | (750.8) |
| (108.4) | (153.4) | CAA | (349.2) | (434.1) |
| - | - | Rumo | - | 0.1 |
| (107.3) | (113.4) | CCL | (295.4) | (319.7) |
| (2.6) | (4.1) | Elimination | 5.3 | 2.9 |
CAA
CAA’s selling expenses in the 3Q11 had a significant increase of 41.5%, reaching R$153.4 million, mainly due to the increase in the sugar sales volume both in the domestic and international markets. In addition, during this quarter the ethanol sales to domestic market under CIF modality increased, which includes logistics costs.
Rumo
Due to the nature of its business, Rumo does not have selling expenses.
CCL
CCL’s selling expenses increased by 5.7% or R$6.1 million, changing from R$113.4 million, mainly due to the increase in the volume sold. Accordingly, by analyzing the selling expenses in unit terms we can note a decrease of 3.7%, changing from R$72.0/m3 in the 3Q10 to R$69.3/ m3 in the 3Q11, benefited by the higher dilution of fixed costs as a result of a 9.8% increase in the volume sold.
General and Administrative Expenses
General and administrative expenses of R$132 million represented an increase of 12% in relation to the amount of R$117.9 million for the 3Q10. This increase refers to CAA and Rumo and reflects the efforts and investments, most of them not recurring, that have been made to improve the controls and management, but mainly aiming at a better operating efficiency for the time the
General and administrative expenses of R$132 million represented an increase of 12% in relation to the amount of R$117.9 million for the 3Q10. This increase refers to CAA and Rumo and reflects the efforts and investments, most of them not recurring, that have been made to improve the controls and management, but mainly aiming at a better operating efficiency for the time the
17 of 31
investments are concluded. On the other hand, CCL had a reduction of 7.6%. The main factors that caused impact on general and administrative expenses are described below.
| 3Q'10 | 3Q'11 | General & Administrative Expenses | YTD'10 | YTD'11 |
| (117.9) | (132.0) | G&A Expenses (R$MM) | (323.4) | (389.7) |
| (87.3) | (101.8) | CAA | (254.9) | (285.9) |
| (4.2) | (5.8) | Rumo | (12.3) | (20.8) |
| (26.4) | (24.4) | CCL | (56.2) | (83.0) |
CAA
General and administrative expenses of R$101.8 million in the 3Q11 increased by 16.6% when compared to the same quarter of last year. This increase of R$14.5 million is due mainly to nonrecurring expenses relating to the Shell Joint Venture process and costs for the areas of Safety, Environment and Sustainability.
Rumo
Rumo’s general and administrative expenses totaled R$5.8 million in the 3Q11, presenting an increase of 37.3%, as already expected due to the hiring of new executives. This results from the hiring of:
| Þ | New executives to strength the Company’s management team and middle management; |
| Þ | Consulting to review and renegotiate contracts of Rumo’s suppliers; |
| Þ | Assistance to start and monitor the transport operations. |
CCL
CCL’s general and administrative expenses totaled R$24.4 million in the 3Q11, representing a decrease of 7.6%. It is worth noting that due to the phase of investments in improvements for the Company, CCL’s expenses are still being negatively impacted by nonrecurring expenses of approximately R$ 5.0 million related to adjustments to the transition to CAN and expenses with the transition team for the beginning of the Joint Venture with Shell.
EBITDA
With these results, Cosan reached EBITDA of R$410.5 million in the 3Q11, 16.9% lower than the EBITDA of the 3Q10, of R$490.4 million. Of this total CAA accounted for R$274.8 million, 33.9% lower than its EBITDA for the 3Q10. CCL accounted for R$98.1 million and Rumo R$37.7 million.
| 3Q'10 | 3Q'11 | EBITDA | YTD'10 | YTD'11 | |
| 490.4 | 410.5 | EBITDA (R$MM) | 1,157.2 | 1,565.3 | |
| 12.9% | 8.7% | Margin | 10.6% | 11.6% | |
| 415.8 | 274.8 | l | CAA | 881.5 | 1,164.7 |
| 35.2% | 16.3% | Margin | 23.9% | 24.7% | |
| 5.9 | 37.7 | l | Rumo | 34.8 | 117.9 |
| 16.4% | 33.2% | Margin | 29.5% | 32.4% | |
| 68.7 | 98.1 | l | CCL | 241.0 | 282.4 |
| 2.5% | 3.2% | Margin | 3.2% | 3.2% | |
18 of 31
CAA
Depreciation and amortization of R$223.6 million, 62.7% higher than those recorded in the 3Q10 (R$137.4 million), result from (i) higher sales volume in the period and (ii) the strong investment plan that is being implemented with the goal of increasing efficiencies of production through mechanization, cogeneration and industrial improvements, in addition to investments to expand sugar production capacity and milling capacity at new units (greenfields). Thus, CAA reported EBITDA of R$ 274.8 million, with a margin of 16.3%.
Rumo
Benefited by the entry into operation of the transportation activities, Rumo’s EBITDA in the 3Q11 reached R$37.7 million, with a margin of 33.2%, amount 6.4 times higher than in that of the 3Q10. Reflecting its investment program, depreciation and amortization showed an increase of 58.4%, reaching R$5.5 million in the period.
CCL
In the quarter, CCL had an EBITDA of R$98.1 million, with a margin of R$59.9 per thousand liters, or 3.2% of the net revenues, reflecting improved product mix of both fuel and lubricants. It is noteworthy that this EBITDA was negatively impacted by extraordinary expenses related to adjustments for the transition to CAN and the transition period for Shell Joint Venture, totaling R$5.0 million, partially offset by other nonrecurring revenues of R$4.2 million, related mostly to the sale of non-operating assets.
The depreciation and amortization of CCL increased by 15.6% compared to the 3Q10, to R$10.2 million, mainly due to (i) the start of the amortization of certain intangible assets, and (ii) amortization of investments in maintenance and repairs of gas stations, aimed at improving their images, and terminal expansion and reforms, such investments are higher than on previous years.
Financial Result
The Company reported net financial expense in the 3Q11 of R$97.8 million compared with a net financial expenses of R$78.3 million in the same quarter of the previous year.
Debt charges expenses increased 13.9% mainly due to higher average indebtedness of the Company, when compared with the same period of last year.
| 3Q'10 | 3Q'11 | Financial Expenses, Net (R$MM) | YTD'10 | YTD'11 | |
| (111.3) | (126.8) | Interest on Financial Debt | (312.8) | (349.0) | |
| 14.1 | 22.2 | Financial Investments Income | 41.7 | 58.4 | |
| (97.2) | (104.6) | (=) Sub-total: Interest on Net Financial | (271.1) | (290.6) | |
| (47.2) | (33.2) | Other charges and monetary variation | (85.5) | (83.9) | |
| 50.1 | 59.3 | Exchange Variation | 628.9 | 214.8 | |
| 18.0 | (17.0) | Gains (losses) with Derivatives | 162.2 | 6.3 | |
| (2.0) | (2.3) | Others | (0.4) | (3.7) | |
| (78.3) | (97.8) | (=) | Net Financial Expenses | 434.0 | (157.0) |
19 of 31
The net effect of exchange rate changes showed a gain of R$59.3 million in the 3Q11 compared to R$50.1 million in the 3Q10. The positive effect of the exchange variation is due to the impacts on assets and liabilities denominated in US dollars by the appreciation of local currency (real) against the US currency (dollar), which has appreciated by 1.7% this quarter compared with an appreciation of 2.1% in the same quarter of last year.
The result of derivatives in the quarter was negative at R$17.0 million compared with a positive result of R$18.0 million in the same quarter of last year, already net of the hedge accounting impacts discussed below.
The result of foreign exchange derivatives was positive in R$14.8 million in this quarter compared to R$46.9 million in the 3Q’10 and reflects the impact on the Company's short position, given its export profile, seeking coverage for its future sales denominated in US dollars in a scenario where the exchange rate depreciated 1.7% this quarter compared to 2.1% in the 3Q10.
In the context of commodity derivatives, mainly sugar, the Company had a negative effect of R$31.8 million in the 3Q11, net of the hedge accounting effects, compared with losses of R$28.9 million in the same quarter of last year due to the Company’s short position in sugar derivatives. It is worth noting that in the 3Q10 the Company did not apply the hedge accounting method.
The position of sugar volumes and prices set forth based on trading or financial instruments as of December 31, 2010, as well as foreign exchange derivative contracts aiming to hedge the Company’s future cash flows are summarized as follows:
| Summary of Hedge* as of December 31, 2010: | Fiscal Year | |
| 2010/11 | 2011/12 | |
| Sugar | ||
| NY#11 | ||
| Volume (thd tons) | 658.9 | 1,545.7 |
| Average Price (¢US$/lb) | 22.8 | 20.6 |
| London #5 | ||
| Volume (thd tons) | 19.1 | - |
| Average Price (US$/ton) | 779.3 | - |
| Ethanol | ||
| BM&F | ||
| Volume (cubic meters) | 1,200.0 | - |
| Average Price (R$/cbm) | 1,053.8 | - |
| US$ | ||
| Volume (US$ million) | 216.8 | 371.3 |
| Average Price (R$/US$) | 1.777 | 2.011 |
Gross debt charges totaled R$126.8 million, an increase of 13.9% compared with the 3Q10, resulting from the higher average indebtedness balance of the Company mainly due to the ongoing projects of investment both in CAA and Rumo, which demanded new credit facilities.
Impacts of Hedge Accounting
As of April 1, 2010, the Company adopted the cash flow hedge accounting method for certain derivative financial instruments designated to cover risks of price and exchange variations on revenues from sugar exports. In the quarter ended December 31, 2010, the Company recorded a deferral (reclassification between financial income (expenses) and the reserve account in the shareholders’ equity) of R$277.5 million of net losses on such derivatives. In the 3Q11 there was the allocation of loss on the variation of fair value of derivatives in the amount of R$84.9 million,
As of April 1, 2010, the Company adopted the cash flow hedge accounting method for certain derivative financial instruments designated to cover risks of price and exchange variations on revenues from sugar exports. In the quarter ended December 31, 2010, the Company recorded a deferral (reclassification between financial income (expenses) and the reserve account in the shareholders’ equity) of R$277.5 million of net losses on such derivatives. In the 3Q11 there was the allocation of loss on the variation of fair value of derivatives in the amount of R$84.9 million,
20 of 31
classified as net operating revenues. The table below shows the expectation of transfer of the balances reclassified from shareholders’ equity to net operating revenues, according to the coverage period of each instrument.
| Expected period to affect P&L | Total | |||
| Derivative | Market | Risk 2010/11 | 2011/12 | |
| Future | OTC/NYBOT | #11 | (378.5) | (480.6) |
| NDF | OTC/CETIP | USD | 93.7 | 104.4 |
| (=) Hedge Accounting impact | (284.8) | (376.2) | ||
| (-) Deferred income taxes | 96.8 | 127.9 | ||
| (=) Other comprehensive income | (188.0) | (248.3) | ||
Net Income
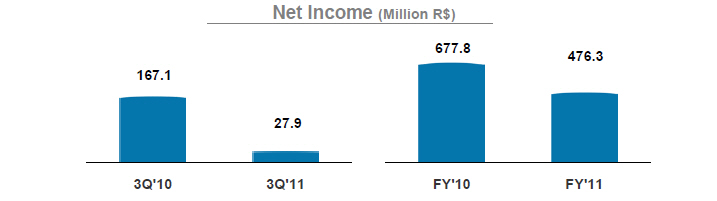
Cosan closed the 3Q11 with net profits of R$27.9 million, compared with net profits of R$167.1 million in the 3Q10. The result of the 3Q11 was favored by higher volumes of CAA and CCL, better prices, mainly of sugar and ethanol, and the ramp-up of the transportation activities of Rumo and the cogeneration projects. However, this quarter was negatively impacted by the effects of the increase in the costs of CAA, mainly resulting from the effects of the shortfall and the cumulative effects of the ATR prices, in addition to more offer of sugar for resale with lower margins. Net profits for the same quarter of last year (3Q10) were also favored by the nonrecurring effect on Other operating revenues from the net gain obtained from the adhesion to the Tax Debt Installment Payment Program (REFIS IV).
21 of 31
D. Indebtedness
The gross financial debt, excluding Resolution 24711, totaled R$6.4 billion in the 3Q11, an increase of 12% in relation to R$5.7 billion in the 2Q11 and 24.7% higher than the indebtedness of R$5.1 billion existing at the end of the 3Q10.
In the 3Q11 the following fund amounts were raised: (i) R$514.0 million referring to the Perpetual Bond (equivalent to USD 300 million) used to settle short-term debts (ii) release of R$543.3 million in credit facilities from the National Bank for Economic and Social Development (BNDES) and the Government Agency for Machinery and Equipment Financing (Finame), mainly for energy cogeneration projects, greenfields, sugar farming mechanization and locomotive investments by Rumo; (iii) R$40 million from the Sugar-Alcohol Support Program (PASS). In addition, over the quarter there was amortization of R$458.2 million of principal and interests paid.
| Debt per Type (R$MM) | 3Q'10 | 2Q'11 | 3Q'11 | % ST | Var. |
| Foreign Currency | 3,415.8 | 3,460.3 | 3,666.4 | 206.0 | |
| Perpetual Notes | 792.8 | 771.4 | 1,264.9 | 1.2% | 493.5 |
| Senior Notes 2017 | 716.7 | 685.5 | 685.8 | 0.3% | 0.3 |
| Senior Notes 2014 | 632.3 | 601.1 | 605.3 | 3.7% | 4.2 |
| IFC | 90.9 | - | - | - | |
| FX Advances | 223.2 | 382.6 | 210.4 | 100.0% | (172.2) |
| Pre-Export Contracts | 960.0 | 845.8 | 731.5 | 37.9% | (114.4) |
| Export Credit Notes | - | 173.9 | 168.4 | 1.1% | (5.5) |
| Local Currency | 1,749.0 | 2,269.1 | 2,771.6 | 502.5 | |
| BNDES | 844.8 | 1,342.9 | 1,623.0 | 8.8% | 280.1 |
| Finame (BNDES) | 156.1 | 456.9 | 682.5 | 10.9% | 225.5 |
| Working Capital | 20.0 | 18.3 | 17.6 | 28.2% | (0.7) |
| Overdraft | 42.0 | 20.2 | 19.0 | 100.0% | (1.2) |
| Credit Banking Notes | 121.1 | - | - | 0.0% | - |
| Credit Notes | 510.5 | 314.8 | 305.8 | 50.9% | (9.1) |
| CDCA | 60.2 | 61.8 | 30.1 | 100.0% | (31.7) |
| PROINFA | 42.2 | - | - | 0.0% | - |
| Rural credit | - | 89.4 | 90.9 | 100.0% | 1.5 |
| PASS | - | - | 40.2 | 100.0% | 40.2 |
| Expenses with Placement of Debt | (47.7) | (35.3) | (37.4) | 26.5% | (2.1) |
| Gross Debt | 5,164.9 | 5,729.4 | 6,438.0 | 35.3% | 708.6 |
| Cash and Marketable Securities | 864.1 | 988.4 | 1,136.9 | 148.5 | |
| Net Debt | 4,300.8 | 4,741.0 | 5,301.1 | 560.0 |
At the end of the 3Q11 Cosan's cash resources totaled R$1.1 billion, leading its indebtedness to R$5.3 billion, which is equivalent to 2.48 times the EBITDA for the past twelve months.
1 As disclosed in Note 13 to the financial statements, this debt of Resolution 2471 is secured by National Treasury certificates acquired by the Company and recorded in noncurrent assets. For this reason, we did not include this debt in the indebtedness analysis.
22 of 31
E. Investments
The capital expenditures with investments in the 3Q11 totaled R$ 548.7 million, 36% above the same period of last year. This change is due to: (i) investments of R$123.6 million made by Rumo mainly on its new business of rail transportation, (ii) planting, totaling R$72.9 million and (iii) investments of R$66.4 million in mechanization and projects related to the Safety, Health and Environment areas. A summary of the investments in the main areas can be found below:
| 3Q'10 | 3Q'11 | Capex (R$MM) | YTD'10 | YTD'11 | |
| 146.7 | 265.9 | CAA - Operating Capex | 410.1 | 731.5 | |
| 48.2 | 72.9 | l | Sugar Cane Planting Costs | 164.7 | 261.3 |
| 36.7 | 55.7 | l | Inter-harvest Maintenance Costs | 63.3 | 111.4 |
| 7.8 | 31.0 | l | SSMA & Sustaining | 14.6 | 83.1 |
| - | 35.4 | l | Mecanização | - | 122.6 |
| 54.0 | 70.9 | l | Projects CAA | 167.5 | 153.0 |
| 231.3 | 110.2 | CAA - Expansion Capex | 728.7 | 341.4 | |
| 93.5 | 84.9 | l | Co-generation Projects | 264.5 | 198.8 |
| 97.5 | 17.4 | l | Greenfield | 416.1 | 60.0 |
| 40.4 | 7.9 | l | Expansion | 48.1 | 82.6 |
| 378.0 | 376.1 | CAA - Total | 1,138.8 | 1,072.8 | |
| 20.5 | 49.0 | CCL | 39.7 | 96.3 | |
| 2.5 | 123.6 | Rumo | 4.0 | 374.4 | |
| 401.0 | 548.7 | (=) | Consolidated Capex | 1,182.5 | 1,543.5 |
| 14.7 | - | l | Investments | (14.6) | 21.0 |
| (1.8) | (2.2) | l | Cash received on Sale of Fixed Assets | (121.0) | (20.1) |
| 413.9 | 546.5 | (=) | Investment Cash Flow | 1,046.9 | 1,544.4 |
| * mechanization during 3Q10 is under CAA Projects | |||||
CAA
In the 3Q11 the Company maintained the high level of investments in planting and interharvest maintenance, which showed an increase of 51.2% and 52.1%, respectively, when compared with the same period of last year, totaling R$128.6 million. In the first three quarters of this year 56.6 thousand hectares were planted, an increase of 47% compared to 38.5 thousand hectares in the same period of last year. With regard to soil tillage in areas not yet planted the growth was also relevant, being approximately 43% higher compared to the same period of last year.
Investments in Safety, Health and Environment (SSMA) were significant in the 3Q11, an increase of 297.5% compared to the same quarter of the previous year. Of the total investment amount in the year, approximately 93% was allocated to investments in projects of vignasse (a liquid byproduct resulting from the processing of ethanol and reused as fertilizer), aiming to reduce its exposure from the mill to the agriculture areas.
Investments in agricultural mechanization remained significant for the quarter, totaling R$35.4 million, composed primarily of agricultural machinery and equipment and fitness of its units to receive the sugarcane from the mechanical harvesting.
CAA projects accounted for R$70.9 million of the total investments in the third quarter, amount 25.5% higher than the amount of R$56.5 million for the same period of last year. Such growth shows that the Company continues to maintain substantial investments in its production units in the processing and agricultural areas.
23 of 31
Cogeneration investments totaled R$84.9 million, of which 84.5% were for Ipaussu and Univalem units. Other units have far less significant realizations, since their projects are already in the final stage of implementation.
The greenfield projects of Cosan, Jataí (GO) and Caarapó (MS) accounted for investments of R$17.4 million in this quarter, of which R$13.9 million in Jataí and R$3.5 million in Caarapó. Of the total investments in Jataí for this period, approximately 69% were allocated to the industrial area.
Investments in expanding sugar plant capacity totaled R$ 7.9 million, 80.4% lower than the investments of the same period of last year. This reduction is due to the completion of the projects of the Gasa, Ipaussu, Bonfim, Junqueira, Tamoio and Costa Pinto units. Construction works remain only at Barra unit, in connection with the processing, logistics and bagging areas.
Rumo
In the 3Q11 Rumo had investments of R$ 123.6 million, in line with the amount invested in the last two quarters of this year. Of this amount, approximately 32% were allocated for the purchase of locomotives and 61% for investments in construction of permanent way.
CCL
In the 3Q11, CCL's capital expenditure for investment in productive capital totaled R$49.0 million, representing an increase of 139% when compared to the same quarter of last year, and 104.8% for the year, when compared to the same period of last year. The main investments in this period focused on the line of supply and distribution and in the fuels distribution bases.
24 of 31
| F. | Relevant Facts |
| Þ | On November 22, Cosan S.A. approved the Buyback Program relating to its common shares for maintenance in treasure, cancelation or sale, with a 365 term. As of December 31, 2010, the Company had purchased 591,400 of its own shares. |
| Þ | On November 23, Cosan S.A. informed that it entered into an Association Commitment with Camargo Correa Óleo e Gás S.A., Copersucar S.A., Odebrecht Transport Participações S.A., Petróleo Brasileiro S.A. and Uniduto Logística S.A. aiming to establish a joint venture to construct and operate a multimodal logistics system for transportation and storage of liquids, mainly ethanol. |
| Þ | On January 4, 2011 the Company announced the receipt of unconditional release from the European Committee to form the previously announced Joint Venture with Shell International Petroleum Company Limited involving certain of their assets, and it may now focus on the conclusion of the conditions precedent of the agreement and the business unit integration process for launching the new company. |
| Þ | On January 7, Cosan entered into a Binding Memorandum of Understandings with the partners of Usina Zanin Açúcar e Álcool Ltda., with exclusivity period of 45 days, aiming the purchase of the total outstanding equity interests of Zanin at the amount of R$142.0 million. In addition, the Company will assume financial debts in the amount of R$236.6 million. This transaction will involve Zanin industrial and agricultural assets with annual crushing capacity of approximately 2.6 million tons of cane, and a greenfield project located in the City of Prata, State of Minas Gerais. |
| Þ | On January 17, Cosan Combustíveis e Lubrificantes, holder of the license to use the trademarks Esso and Mobil in Brazil, and Banco Santander announced the launching, in the first quarter 2011, of the Esso Santander credit card aiming to strengthen the relationship with consumers of the Esso network. |
| Þ | On January 18, Rumo Logística and São Martinho announced the 2nd phase of the agreement for logistics projects and services of storage, transshipment and rail transportation of sugar. This phase estimates investments of approximately R$30.0 million in Usina São Martinho for the construction of a sugar warehouse and modernization of the plant’s extension access to the Pradópolis yard. These investments will increase the transshipment capacity to up to 2,000,000 tons of sugar per year. Any rail transportation adjustments to accomplish the transportation and transshipment obligations shall be responsibility of Rumo, as already provided for in its investment plan. |
25 of 31
G. Guidance
This section contains guidance ranges for selected key parameters of the Company for the fiscal year 2011, which began on April 1st, 2010 and will end on March 31st, 2011. Note that statements in other sections of this letter may also contain projections. These projections and guidance are merely estimates and indicative, and should not be construed as a guarantee of future performance. This guidance takes into consideration the operations held by the Cosan group today, which includes CAA, CCL, and Rumo Logística.
A new update of this fiscal year guidance is shown below due to the shortfall of sugar in the Brazilian Center- South region impacting Rumo´s loaded volume and reducing the estimates for sugar exports on the second half of this fiscal year.
On the other hand, due to market share gains and the growth of the Brazilian economy, the lubricants volume should be higher than previously estimated.
Due to the proximity of the end of fiscal year and consequent better visibility of the year-end results, the range of the guidance for the expected EBITDA was narrowed.
| Guidance | 2009FY | 2010FY | 2011FY - New | |
| Crushed Sugarcane Volume (thousand tons) | 43,127 | 50,314 | 54,000 | ≤ ∆ ≤ 58,000 |
| Sugar Volume Sold (thousand tons) | 3,187 | 4,135 | 4,100 | ≤ ∆ ≤ 4,500 |
| Ethanol Volume Sold (million liters) | 1,671 | 2,148 | 2,000 | ≤ ∆ ≤ 2,200 |
| Volume of Energy Sold (thousand MW) | - | 596 | 1,000 | ≤ ∆ ≤ 1,300 |
| Loading Volume (thousand tons) | 3,479 | 8,124 | 7,500 | ≤ ∆ ≤ 8,500 |
| Transportation Volume (thousand tons) | - | - | 5,000 | ≤ ∆ ≤ 6,000 |
| Volume of Fuels Sold (million liters) | 1,681 | 5,491 | 5,700 | ≤ ∆ ≤ 6,200 |
| Volume of Lubes Sold (million liters) | 34 | 131 | 150 | ≤ ∆ ≤ 170 |
| Net Revenues (R$ MM) | 6,270 | 15,336 | 16,500 ≤ ∆ ≤ 18,500 | |
| EBITDA (R$ MM) | 718 | 1,733 | 2,000 | ≤ ∆ ≤ 2,200 |
| Net Profit/Loss (R$ MM) | (474) | 986 | * | |
| Capex (R$ MM) | 1,346 | 1,926 | 1,900 | ≤ ∆ ≤ 2,300 |
26 of 31
H. Financial Statements of Cosan S.A. - BRGAAP
| Income Statement | Apr'08 | Mar'09 | Mar'10 | Dec'09 | Mar'10 | Jun'10 | Sep'10 | Dec'10 | |
| (In million of reais) | FY'08 | FY'09 | FY'10 | 3Q'10 | 4T'10 | 1T'11 | 2T'11 | 3T'11 | |
| Gross Operating Revenue | 2,978.6 | 6,732.8 | 16,685.9 | 4,145.1 | 4,790.0 | 4,369.4 | 5,199.8 | 5,192.9 | |
| (-) | Sales Taxes and Deductions | (242.5) | (462.7) | (1,349.8) | (344.6) | (395.9) | (369.8) | (483.7) | (454.5) |
| (=) Net Operating Revenue | 2,736.2 | 6,270.1 | 15,336.1 | 3,800.5 | 4,394.1 | 3,999.6 | 4,716.1 | 4,738.4 | |
| (-) | Cost of Goods Sold and Services Rendered | (2,387.1) | (5,470.7) | (13,210.7) | (3,340.5) | (3,620.3) | (3,493.1) | (3,987.6) | (4,160.5) |
| (=) Gross Profit | 349.0 | 799.4 | 2,125.4 | 460.0 | 773.9 | 506.6 | 728.5 | 577.9 | |
| Margin | 12.8% | 12.7% | 13.9% | 12.1% | 17.6% | 12.7% | 15.4% | 12.2% | |
| (-) | Operating Income (Expenses): | (418.0) | (1,508.5) | (712.5) | (206.9) | (377.4) | (477.4) | (141.8) | (502.7) |
| (-) | Selling | (301.3) | (432.6) | (864.6) | (218.4) | (225.3) | (215.2) | (264.6) | (271.0) |
| (-) | General and Administrative | (210.2) | (275.9) | (497.2) | (117.9) | (173.7) | (120.2) | (137.5) | (132.0) |
| (-) | Financial Income (Expenses), Net | 284.3 | (817.4) | 420.4 | (78.3) | (13.7) | (139.3) | 80.2 | (97.8) |
| (±) Earnings (Losses) on Equity Investments | 6.6 | 14.0 | (18.6) | (9.4) | (5.8) | (0.4) | (3.8) | 1.7 | |
| (-) | Goodwill Amortization | (201.4) | (196.5) | (85.6) | - | - | - | - | - |
| (±) Other Operating Income (Expenses), Net | 4.0 | 199.9 | 333.1 | 217.0 | 41.1 | (2.3) | 183.9 | (3.6) | |
| (=) Operating Income (Loss) | (69.0) | (709.1) | 1,412.9 | 253.0 | 396.5 | 29.1 | 586.7 | 75.2 | |
| Margin | -2.5% | -11.3% | 9.2% | 6.7% | 9.0% | 0.7% | 12.4% | 1.6% | |
| (±) Income and Social Contribution Taxes | 18.7 | 234.7 | (433.8) | (85.3) | (86.9) | (18.5) | (127.2) | (39.7) | |
| (±) | Minority Interest | 2.5 | 0.6 | 7.5 | (0.7) | (0.9) | (1.9) | (19.8) | (7.6) |
| (=) Net Income (Loss) for the Year | (48.0) | (474.0) | 986.5 | 167.0 | 309.0 | 9.0 | 440.0 | 28.0 | |
| Margin | -1.8% | -7.6% | 6.4% | 4.4% | 7.0% | 0.2% | 9.3% | 0.6% | |
l EBITDA | 182.9 | 718.0 | 1,733.1 | 490.4 | 575.9 | 358.0 | 796.7 | 410.5 | |
| Margin | 6.7% | 11.5% | 11.3% | 12.9% | 13.1% | 9.0% | 16.9% | 8.7% | |
l Depreciation & Amortization | 341.3 | 427.2 | 636.3 | 149.7 | 160.0 | 189.2 | 286.4 | 239.2 | |
| Balance Sheet | Apr'08 | Mar'09 | Mar'10 | Dec'09 | Mar'10 | Jun'10 | Sep'10 | Dec'10 | |
| (In million of reais) | FY'08 | FY'09 | FY'10 | 3Q'10 | 4T'10 | 1T'11 | 2T'11 | 3T'11 | |
| Cash and Cash Equivalents | 1,010.1 | 719.4 | 1,078.4 | 864.1 | 1,078.4 | 1,054.9 | 988.4 | 1,136.9 | |
| Restricted Cash | 79.6 | 11.8 | 45.0 | 172.1 | 45.0 | 51.3 | 76.0 | 276.2 | |
| Derivative Financial Instruments | 6.9 | 17.0 | 230.6 | 72.0 | 230.6 | 144.5 | 166.0 | 180.0 | |
| Trade Accounts Receivable | 215.2 | 599.2 | 766.4 | 511.1 | 766.4 | 619.1 | 760.0 | 657.5 | |
| Inventories | 570.5 | 1,106.2 | 1,046.7 | 1,936.8 | 1,046.7 | 1,433.7 | 1,938.8 | 2,010.0 | |
| Advances to Suppliers | 226.1 | 206.0 | 235.6 | 241.2 | 235.6 | 323.5 | 293.9 | 268.6 | |
| Related Parties | 16.3 | 57.2 | 24.9 | 24.6 | 24.9 | 49.9 | 21.2 | 20.3 | |
| Deferred Income and Social Contribution Taxes | - | 42.5 | 76.3 | 29.2 | 76.3 | 94.6 | 94.5 | 100.9 | |
| Recoverable Taxes | 129.8 | 265.4 | 327.9 | 307.8 | 327.9 | 355.4 | 396.4 | 401.1 | |
| Other Assets | 17.9 | 50.3 | 61.2 | 54.0 | 61.2 | 68.3 | 71.9 | 102.8 | |
| Current Assets | 2,272.4 | 3,074.9 | 3,892.8 | 4,212.8 | 3,892.8 | 4,195.1 | 4,807.1 | 5,154.3 | |
| Accounts Receivable from Federal Government | 342.2 | 323.4 | 333.7 | 331.4 | 333.7 | 336.3 | 339.2 | 342.1 | |
| CTN's-Restricted Brazilian Treasury Bills | 151.7 | 177.6 | 205.7 | 194.6 | 205.7 | 217.6 | 228.5 | 242.6 | |
| Deferred Income and Social Contribution Taxes | 357.0 | 700.0 | 560.1 | 334.2 | 560.1 | 521.5 | 576.1 | 645.0 | |
| Advances to Suppliers | 77.3 | 48.0 | 63.7 | 132.5 | 63.7 | 52.5 | 65.1 | 85.5 | |
| Related Parties | - | - | 81.4 | 149.9 | 81.4 | 79.6 | 77.8 | 76.0 | |
| Other Assets | 94.4 | 132.4 | 211.8 | 210.8 | 211.8 | 216.7 | 225.2 | 262.8 | |
| Investments | 120.3 | 278.2 | 193.1 | 194.0 | 193.1 | 193.6 | 207.6 | 208.7 | |
| Property, Plant and Equipment | 2,776.3 | 3,465.2 | 5,561.1 | 4,871.5 | 5,561.1 | 5,836.0 | 5,878.4 | 6,173.9 | |
| Intangible | 1,160.7 | 2,447.5 | 2,901.3 | 2,765.5 | 2,901.3 | 2,921.2 | 2,931.8 | 2,938.1 | |
| Noncurrent Assets | 5,079.9 | 7,572.5 | 10,112.0 | 9,184.4 | 10,112.0 | 10,375.0 | 10,529.8 | 10,974.7 | |
| (=) Total Assets | 7,352.4 | 10,647.4 | 14,004.8 | 13,397.2 | 14,004.8 | 14,570.1 | 15,336.9 | 16,129.0 | |
| Loans and Financings | 78.2 | 1,449.5 | 800.9 | 892.6 | 800.9 | 860.3 | 1,058.6 | 1,129.1 | |
| Derivatives Financial Instruments | 50.7 | 66.9 | 76.7 | 232.9 | 76.7 | 37.4 | 96.1 | 379.0 | |
| Trade Accounts Payable | 191.0 | 456.1 | 569.4 | 712.1 | 569.4 | 716.3 | 832.1 | 754.4 | |
| Salaries Payable | 80.7 | 93.2 | 141.6 | 133.0 | 141.6 | 219.9 | 225.5 | 175.6 | |
| Taxes and Social Contributions Payable | 116.1 | 168.6 | 215.9 | 201.0 | 215.9 | 197.4 | 239.2 | 218.8 | |
| Related Parties | - | 5.2 | 14.4 | 50.5 | 14.4 | 120.1 | 66.0 | 74.6 | |
| Dividendos a pagar | - | - | 116.6 | - | 116.6 | 116.6 | 7.0 | 7.0 | |
| Other Liabilities | 49.9 | 85.8 | 182.4 | 123.4 | 182.4 | 189.4 | 198.4 | 180.3 | |
| Current Liabilities | 566.5 | 2,325.2 | 2,117.9 | 2,345.5 | 2,117.9 | 2,457.3 | 2,722.8 | 2,918.9 | |
| Loans and Financing | 2,106.2 | 2,885.5 | 5,136.5 | 4,859.1 | 5,136.5 | 5,322.7 | 5,310.8 | 5,961.7 | |
| Taxes and Social Contributions Payable | 359.3 | 328.8 | 593.5 | 255.7 | 593.5 | 597.9 | 606.3 | 618.7 | |
| Provision for Legal Proceedings | 832.4 | 1,105.9 | 444.4 | 755.7 | 444.4 | 456.1 | 469.3 | 469.2 | |
| Related Parties | - | 405.2 | - | - | - | - | - | - | |
| Pension Fund | - | 60.4 | 61.8 | 61.6 | 61.8 | 59.8 | 57.8 | 53.6 | |
| Other Liabilities | 144.4 | 139.9 | 493.1 | 155.8 | 493.1 | 487.8 | 575.8 | 610.0 | |
| Noncurrent Liabilities | 3,442.3 | 4,925.5 | 6,729.3 | 6,087.8 | 6,729.3 | 6,924.2 | 7,020.0 | 7,713.2 | |
| Minority Shareholders' Interest | 17.7 | 30.9 | 47.8 | 47.0 | 47.8 | 49.7 | 246.5 | 253.6 | |
| Capital | 2,935.3 | 3,819.8 | 4,687.8 | 4,687.7 | 4,687.8 | 4,687.8 | 4,691.1 | 4,691.1 | |
| Capital Reserve | - | 41.7 | 50.6 | 50.1 | 50.6 | 51.1 | 51.5 | 36.1 | |
| Profits Reserve | 180.2 | - | 374.2 | - | 374.2 | 374.2 | 290.8 | 290.8 | |
| Legal Reserve | 16.0 | - | - | - | - | - | - | - | |
| Revaluation Reserves | 194.4 | - | - | - | - | - | - | - | |
| Ajuste de Avaliação Patrimonial | - | - | (2.9) | - | (2.9) | 17.0 | (134.3) | (251.1) | |
| Accumulated losses | - | (495.7) | - | 179.1 | - | 8.7 | 448.4 | 476.3 | |
| Shareholders' Equity | 3,325.8 | 3,365.7 | 5,109.8 | 4,917.0 | 5,109.8 | 5,138.9 | 5,347.6 | 5,243.3 | |
| (=) Total Liabilities & Shareholders' Equity | 7,352.4 | 10,647.4 | 14,004.8 | 13,397.2 | 14,004.8 | 14,570.1 | 15,336.9 | 16,129.0 | |
27 of 31
| Cash Flow Statement | Apr'08 | Mar'09 | Mar'10 | Dec'09 | Mar'10 | Jun'10 | Sep'10 | Dec'10 |
| (In millions of reais) | FY'08 | FY'09 | FY'10 | 3Q'10 | 4T'10 | 1T'11 | 2T'11 | 3T'11 |
| Net Income (Loss) for the Year | (47.8) | (473.8) | 986.5 | 167.1 | 308.7 | 8.7 | 439.7 | 27.9 |
| Non-cash Adjustments: | ||||||||
| Earnings (Losses) from Equity Investments | (6.6) | (14.0) | 18.6 | 9.4 | 5.8 | 0.4 | 3.8 | (1.7) |
| Depreciation & Amortization | 341.3 | 427.2 | 636.3 | 149.7 | 160.0 | 189.2 | 286.4 | 239.2 |
| Losses (Gains) in Fixed Assets Disposals | (1.2) | (208.9) | (80.5) | 1.1 | 20.8 | 3.1 | (11.8) | 2.1 |
| Goodwill Amortization | 201.4 | 196.5 | 85.6 | - | - | - | - | - |
| Accrued Financial Expenses | (116.0) | 932.5 | (150.5) | (60.5) | 281.9 | 162.6 | (56.0) | 61.6 |
| Other Non-cash Items | (42.4) | (197.9) | 104.2 | (154.1) | 51.2 | 38.8 | (90.5) | 24.5 |
| (=) Adjusted Net Profit (Loss) | 328.8 | 661.5 | 1,600.3 | 112.6 | 828.3 | 402.7 | 571.6 | 353.6 |
| (±) Variation on Assets and Liabilities | (360.1) | (234.5) | (42.5) | (142.7) | 217.3 | 96.6 | (725.2) | (286.3) |
| (=) Cash Flow from Operating Activities | (31.3) | 427.0 | 1,557.8 | (30.1) | 1,045.7 | 499.3 | (153.7) | 67.3 |
| Additions on Investments, Net of Cash Received | (160.5) | (1,823.6) | (16.0) | (14.7) | (30.7) | (8.2) | (12.7) | - |
| Additions on Property, Plant and Equipment | (1,053.1) | (1,346.1) | (1,926.1) | (401.0) | (745.4) | (595.9) | (398.9) | (548.8) |
| Cash Received on Sale of Fixed Asset | 12.2 | 372.1 | 126.2 | 1.8 | 5.3 | 0.7 | 17.2 | 2.2 |
| (=) Cash Flow from Investment Activities | (1,201.4) | (2,797.6) | (1,816.0) | (413.9) | (770.9) | (603.5) | (394.4) | (546.6) |
| Additions of Debt | 198.3 | 1,478.0 | 3,427.9 | 1,665.5 | 543.8 | 642.4 | 495.9 | 1,101.2 |
| Payments of Principal and Interest on Debt | (839.4) | (257.2) | (2,846.6) | (1,838.4) | (563.1) | (561.6) | (224.7) | (458.2) |
| Capital Increase | 1,742.6 | 884.5 | 533.9 | 532.4 | 0.1 | - | - | - |
| Treasury Stock | - | (4.2) | - | - | - | - | - | (15.2) |
| Capital Increase by noncontrolling | - | 15.4 | - | - | - | - | 403.3 | - |
| Dividends | (75.8) | - | - | - | - | - | (193.0) | - |
| Other | - | (36.6) | (498.0) | - | (41.3) | - | - | - |
| (=) Cash Flows from Financing Activities | 1,025.7 | 2,079.9 | 617.1 | 359.5 | (60.5) | 80.7 | 481.5 | 627.8 |
| (=) Total Cash Flow | (207.0) | (290.7) | 359.0 | (84.6) | 214.3 | (23.5) | (66.5) | 148.5 |
| (+) Cash & Equivalents, Beginning | 1,217.1 | 1,010.1 | 719.4 | 948.6 | 864.1 | 1,078.4 | 1,054.9 | 988.4 |
| (=) Cash & Equivalents, Closing | 1,010.1 | 719.4 | 1,078.4 | 864.1 | 1,078.4 | 1,054.9 | 988.4 | 1,136.9 |
| Credit Statistics (LTM) | Apr'08 | Mar'09 | Mar'10 | Dec'09 | Mar'10 | Jun'10 | Sep'10 | Dec'10 |
| (In million of reais) | FY'08 | FY'09 | FY'10 | 3Q'10 | 4T'10 | 1T'11 | 2T'11 | 3T'11 |
| Net Operating Revenues | 2,736.2 | 6,270.1 | 15,336.1 | 13,291.7 | 15,336.1 | 15,769.6 | 16,910.3 | 17,848.3 |
l Gross Profit | 349.0 | 799.4 | 2,125.4 | 1,591.4 | 2,125.4 | 2,264.2 | 2,468.9 | 2,586.8 |
l EBITDA | 182.9 | 718.0 | 1,733.1 | 1,323.1 | 1,733.1 | 1,779.9 | 2,220.9 | 2,141.1 |
l EBIT | (158.4) | 290.8 | 1,096.8 | 824.7 | 1,096.8 | 1,124.3 | 1,435.7 | 1,266.3 |
l Net Financial Expenses | 106.2 | 179.9 | 361.8 | 329.8 | 361.8 | 367.7 | 373.9 | 381.2 |
l Net Profit | (47.8) | (473.8) | 986.5 | 637.5 | 986.5 | 657.9 | 924.3 | 785.1 |
| Liquid Funds | ||||||||
l Cash and Cash Equivalents | 1,010.1 | 719.4 | 1,078.4 | 864.1 | 1,078.4 | 1,054.9 | 988.4 | 1,136.9 |
| Short-Term Debt | ||||||||
l Loans and Financings | 69.3 | 1,442.7 | 793.8 | 886.5 | 793.8 | 848.5 | 1,044.7 | 1,122.4 |
| Long-Term Debt | ||||||||
l Loans and Financings | 1,562.5 | 2,312.3 | 4,540.0 | 4,278.4 | 4,540.0 | 4,709.3 | 4,684.7 | 5,315.5 |
| Total Debt | 1,631.8 | 3,755.0 | 5,333.8 | 5,164.9 | 5,333.8 | 5,557.8 | 5,729.4 | 6,438.0 |
| Net Debt | 621.7 | 3,035.6 | 4,255.4 | 4,300.8 | 4,255.4 | 4,502.9 | 4,741.0 | 5,301.1 |
| Current Assets | 2,272.4 | 3,074.9 | 3,892.8 | 4,212.8 | 3,892.8 | 4,195.1 | 4,807.1 | 5,154.3 |
| Current Liabilities | 566.5 | 2,325.2 | 2,117.9 | 2,345.5 | 2,117.9 | 2,457.3 | 2,722.8 | 2,918.9 |
| Shareholders' Equity | 3,325.8 | 3,365.7 | 5,109.8 | 4,917.0 | 5,109.8 | 5,138.9 | 5,347.6 | 5,243.3 |
| Capex - Property, Plant and Equipment | 1,053.1 | 1,346.1 | 1,180.7 | 1,515.3 | 1,180.7 | 2,101.4 | 2,141.2 | 2,289.0 |
| EBITDA Margin | 6.7% | 11.5% | 11.3% | 10.0% | 11.3% | 11.3% | 13.1% | 12.0% |
l Gross Profit Margin | 12.8% | 12.7% | 13.9% | 12.0% | 13.9% | 14.4% | 14.6% | 14.5% |
l EBIT Margin | -5.8% | 4.6% | 7.2% | 6.2% | 7.2% | 7.1% | 8.5% | 7.1% |
l Net Profit Margin | -1.7% | -7.6% | 6.4% | 4.8% | 6.4% | 4.2% | 5.5% | 4.4% |
| Net Debt ÷ Shareholders' Equity | ||||||||
l Net Debt % | 15.8% | 47.4% | 45.4% | 46.7% | 45.4% | 46.7% | 47.0% | 50.3% |
l Shareholders' Equity % | 84.2% | 52.6% | 54.6% | 53.3% | 54.6% | 53.3% | 53.0% | 49.7% |
| Long-Term Payable Debt to Equity Ratio | 0.5x | 0.7x | 0.9x | 0.9x | 0.9x | 0.9x | 0.2x | 0.2x |
| Liquidity Ratio (Current Assets ÷ Current Liabilities) | 4.0x | 1.3x | 1.8x | 1.8x | 1.8x | 1.7x | 1.8x | 1.8x |
| Net Debt ÷ EBITDA | 3.4x | 4.2x | 2.5x | 3.3x | 2.5x | 2.5x | 2.1x | 2.5x |
l Short-Term Net Debt ÷ EBITDA | 0.4x | 2.0x | 0.5x | 0.7x | 0.5x | 0.5x | 0.5x | 0.5x |
| Net Debt ÷ (EBITDA - Capex) | -0.7x | -4.8x | 7.7x | -22.4x | 7.7x | -14.0x | 59.5x | -35.8x |
| Interest Cover (EBITDA ÷ Net Financial Exp.) | 1.7x | 4.0x | 4.8x | 4.0x | 4.8x | 4.8x | 5.9x | 5.6x |
l Interest Cover (EBITDA - Op.Capes)÷Net Fin.) | -5.6x | 0.9x | 3.4x | 2.0x | 3.4x | 4.8x | 5.9x | 5.6x |
| Avg. Debt Cost (Net.Fin.Exp. ÷ Net Debt) | 17.1% | 5.9% | 8.5% | 7.7% | 8.5% | 8.2% | 7.9% | 7.2% |
28 of 31
| I. | Financial Statements of Cosan Limited– USGAAP | |||||||||||
| Income Statement | Apr'08 | Apr'09 | Mar'10 | Dec'09 | Mar'10 | Jun'10 | Sep'10 | Dec'10 | ||||
| (In millions of U.S. dollars) | FY'08 | FY'09 | FY'10 | 3Q'10 | 4T'10 | 1T'11 | 2T'11 | 3T'11 | ||||
| Net sales | 1,491.2 | 2,926.5 | 8,283.2 | 2,209.5 | 2,437.7 | 2,233.8 | 2,695.5 | 2,800.6 | ||||
| (-) | Cost of goods sold | (1,345.6) | (2,621.9) | (7,223.3) | (1,965.3) | (2,041.1) | (1,994.5) | (2,305.7) | (2,484.9) | |||
| (=) Gross profit | 145.6 | 304.6 | 1,059.9 | 244.3 | 396.6 | 239.4 | 389.8 | 315.7 | ||||
| (-) | Selling expenses | (168.6) | (213.3) | (470.3) | (128.0) | (125.2) | (122.7) | (151.2) | (167.7) | |||
| (-) | General and administrative expenses | (115.1) | (140.1) | (271.3) | (106.7) | (93.9) | (68.3) | (79.9) | (81.1) | |||
| (=) Operating income (loss) | (138.1) | (48.8) | 318.3 | 9.6 | 177.6 | 48.4 | 158.7 | 66.9 | ||||
| Operating margin | -9.3% | -1.7% | 3.8% | 0.4% | 7.3% | 2.2% | 5.9% | 2.4% | ||||
| (-) Other income (expense): | ||||||||||||
| Financial | 116.8 | (370.8) | 203.7 | (80.4) | 4.2 | (62.3) | 61.8 | (48.0) | ||||
| Other | (3.7) | (2.3) | 178.9 | 155.5 | 30.5 | (0.1) | (21.4) | 4.2 | ||||
| (=) Income (loss) before income taxes | (25.0) | (421.9) | 700.9 | 84.7 | 212.3 | (14.0) | 199.1 | 23.1 | ||||
| (-) | Income taxes expense (benefit) | 19.8 | 144.7 | (184.8) | (52.3) | (6.5) | (1.2) | (69.9) | (15.3) | |||
| (=) Income (loss) before equity | (5.2) | (277.2) | 516.2 | 32.4 | 205.8 | (15.3) | 129.2 | 7.8 | ||||
| (±) Equity in income of affiliates | (0.2) | 6.1 | (10.3) | (3.8) | (4.8) | 0.6 | (2.1) | 0.3 | ||||
| (±) Minority interest in net (income) loss | 22.0 | 83.0 | (174.0) | (7.3) | (77.0) | 2.8 | (50.4) | (3.9) | ||||
| (=) Net income (loss) | 16.6 | (188.1) | 331.9 | 21.3 | 124.0 | (11.9) | 76.7 | 4.2 | ||||
| Margin | 1.1% | -6.4% | 4.0% | 1.0% | 5.1% | -0.5% | 2.8% | 0.2% | ||||
l EBITDA | 94.3 | 239.6 | 985.8 | 338.8 | 315.8 | 193.5 | 342.0 | 242.5 | ||||
| Margin | 6.3% | 8.2% | 11.9% | 15.3% | 13.0% | 8.7% | 12.7% | 8.7% | ||||
l EBIT | (141.8) | (51.1) | 497.3 | 165.1 | 208.1 | 48.2 | 137.3 | 71.1 | ||||
| Margin | -9.5% | -1.7% | 6.0% | 7.5% | 8.5% | 2.2% | 5.1% | 2.5% | ||||
l Depreciation and amortization | 236.1 | 290.7 | 488.5 | 173.7 | 107.7 | 145.3 | 204.8 | 171.4 | ||||
29 of 31
| Balance Sheet | Apr'08 | Mar'09 | Mar'10 | Dec'09 | Mar'10 | Jun'10 | Sep'10 | Dec'10 |
| (In millions of U.S. dollars) | FY'08 | FY'09 | FY'10 | 3Q'10 | 4T'10 | 1T'11 | 2T'11 | 3T'11 |
| Assets | ||||||||
| Current assets: | ||||||||
| Cash and cash equivalents | 68.4 | 508.8 | 623.7 | 516.7 | 623.7 | 601.4 | 595.5 | 693.6 |
| Restricted cash | 47.2 | 5.1 | 25.3 | 98.8 | 25.3 | 28.5 | 44.8 | 165.8 |
| Marketable securities | 1,014.5 | - | - | - | - | - | - | - |
| Derivative financial instruments | 31.5 | 7.4 | 129.5 | 41.4 | 129.5 | 80.2 | 98.0 | 108.0 |
| Trade accounts receivable, net | 126.9 | 258.9 | 430.3 | 293.5 | 430.3 | 343.7 | 448.6 | 394.6 |
| Inventories | 337.7 | 477.8 | 587.7 | 1,112.3 | 587.7 | 795.8 | 1,144.4 | 1,206.3 |
| Advances to suppliers | 133.7 | 89.0 | 132.3 | 138.6 | 132.3 | 179.6 | 173.5 | 161.2 |
| Deferred income taxes | - | 114.6 | 184.1 | 176.8 | 184.1 | 197.3 | 255.6 | 240.7 |
| Other current assets | 103.2 | 66.0 | 49.2 | 54.1 | 49.2 | 66.6 | 33.5 | 74.3 |
| 1,863.0 | 1,527.5 | 2,161.9 | 2,432.2 | 2,161.9 | 2,292.9 | 2,793.9 | 3,044.5 | |
| Noncurrent assets: | ||||||||
| Property, plant and equipment, net | 2,018.1 | 2,259.4 | 4,146.5 | 3,737.0 | 4,146.5 | 4,205.3 | 4,473.6 | 4,725.5 |
| Goodwill | 772.6 | 888.8 | 1,362.1 | 1,624.4 | 1,362.1 | 1,361.8 | 1,479.7 | 1,492.6 |
| Intangible assets, net | 106.1 | 243.1 | 602.3 | 255.3 | 602.3 | 582.2 | 592.8 | 592.1 |
| Accounts Receivable from Federal Government | 202.8 | 139.7 | 187.4 | 190.3 | 187.4 | 186.7 | 200.2 | 205.3 |
| Other non-current assets | 306.4 | 362.6 | 534.8 | 635.0 | 534.8 | 561.2 | 624.2 | 681.8 |
| 3,406.1 | 3,893.6 | 6,833.0 | 6,442.0 | 6,833.0 | 6,897.2 | 7,370.5 | 7,697.3 | |
| (=) Total assets | 5,269.1 | 5,421.1 | 8,994.9 | 8,874.2 | 8,994.9 | 9,190.2 | 10,164.4 | 10,741.9 |
| Liabilities and shareholders' equity | ||||||||
| Current liabilities: | ||||||||
| Trade accounts payable | 114.4 | 197.2 | 320.0 | 409.3 | 320.0 | 397.9 | 491.6 | 453.2 |
| Taxes payable | 62.9 | 69.0 | 121.2 | 115.4 | 121.2 | 109.5 | 141.2 | 131.3 |
| Salaries payable | 47.8 | 40.2 | 79.5 | 76.4 | 79.5 | 122.1 | 133.1 | 105.4 |
| Current portion of long-term debt | 38.2 | 781.7 | 471.1 | 542.9 | 471.1 | 498.6 | 645.4 | 698.0 |
| Derivative financial instruments | 55.0 | 28.9 | 43.1 | 133.8 | 43.1 | 20.8 | 56.7 | 227.5 |
| Dividends payable | - | - | 24.7 | - | 24.7 | 24.4 | 1.3 | 1.2 |
| Deferred income taxes | - | - | - | - | - | - | - | - |
| Other liabilities | 40.8 | 47.6 | 112.0 | 111.0 | 112.0 | 173.5 | 157.9 | 155.1 |
| 359.1 | 1,164.7 | 1,171.5 | 1,388.8 | 1,171.5 | 1,346.8 | 1,627.2 | 1,771.7 | |
| Long-term liabilities: | ||||||||
| Long-term debt | 1,249.3 | 1,251.1 | 2,845.7 | 2,802.2 | 2,845.7 | 2,917.6 | 3,096.3 | 3,540.0 |
| Estimated liability for legal proceedings | 494.1 | 497.6 | 294.6 | 464.8 | 294.6 | 297.7 | 326.7 | 336.0 |
| Taxes payable | 170.4 | 151.5 | 381.8 | 220.6 | 381.8 | 380.7 | 410.3 | 425.2 |
| Advances from customers | - | - | - | - | - | - | - | - |
| Deferred income taxes | 101.8 | 40.4 | 408.8 | 245.4 | 408.8 | 403.2 | 443.1 | 416.7 |
| Pension Fund | - | - | - | - | - | - | - | - |
| Other long-term liabilities | 101.7 | 175.0 | 209.4 | 219.5 | 209.4 | 205.3 | 215.2 | 213.7 |
| 2,117.4 | 2,115.6 | 4,140.3 | 3,952.4 | 4,140.3 | 4,204.5 | 4,491.7 | 4,931.6 | |
| Minority interest in consolidated subsidiaries | 796.8 | 544.5 | 1,338.9 | 1,296.7 | 1,338.9 | 1,324.1 | 1,570.9 | 1,569.4 |
| Shareholders' equity: | ||||||||
| Common stock | 2.3 | 2.7 | 2.7 | 2.7 | 2.7 | 2.7 | 2.7 | 2.7 |
| Additional paid-in capital | 1,723.1 | 1,926.7 | 1,932.1 | 1,927.3 | 1,932.1 | 1,932.3 | 2,004.0 | 1,997.1 |
| Accumulated other comprehensive income | 171.8 | (243.6) | 167.1 | 188.1 | 167.1 | 149.4 | 231.2 | 228.5 |
| Retained earnings (losses) | 98.5 | (89.6) | 242.3 | 118.3 | 242.3 | 230.3 | 236.6 | 240.9 |
| Total shareholders' equity | 1,995.7 | 1,596.2 | 2,344.2 | 2,236.3 | 2,344.2 | 2,314.7 | 2,474.6 | 2,469.1 |
| (=) Total liabilities and shareholders' equity | 5,269.1 | 5,421.1 | 8,994.9 | 8,874.2 | 8,994.9 | 9,190.2 | 10,164.4 | 10,741.9 |
30 of 31
| Cash Flow Statement | Apr'08 | Mar'09 | Mar'10 | Dec'09 | Mar'10 | Jun'10 | Sep'10 | Dec'10 | |
| (In millions of U.S. dollars) | FY'08 | FY'09 | FY'10 | 3Q'10 | 4T'10 | 1T'11 | 2T'11 | 3T'11 | |
| l | Cash flow from operating activities: | ||||||||
| Net income (loss) for the year/quarter | 16.6 | (188.1) | 331.9 | 21.3 | 124.0 | (11.9) | 76.7 | 4.2 | |
| Adjustments to reconcile net income (loss) to cash provided by operating activities: | |||||||||
| Depreciation and amortization | 236.1 | 290.7 | 488.5 | 173.7 | 107.7 | 145.3 | 204.8 | 171.4 | |
| Deferred income and social contribution taxes | (52.4) | (145.3) | 143.3 | 52.3 | (35.0) | (5.3) | 42.9 | 14.8 | |
| Interest, monetary and exchange variation | (43.7) | 497.3 | (131.4) | (57.8) | 130.6 | 72.3 | (5.6) | (16.7) | |
| Minority interest in net income of subsidiaries | (22.0) | (83.0) | 174.0 | 7.3 | 77.0 | 1.1 | 46.5 | 3.9 | |
| Others | 15.2 | 14.5 | (137.3) | (99.0) | (2.7) | 11.5 | 25.5 | (25.7) | |
| 149.8 | 386.1 | 869.0 | 97.8 | 401.6 | 213.0 | 390.7 | 152.0 | ||
| Decrease/increase in operating assets and liabilities: | |||||||||
| Trade accounts receivable, net | (57.1) | (23.7) | 1.4 | 46.9 | (93.6) | 85.1 | (85.1) | 81.3 | |
| Inventories | (31.7) | (85.9) | 126.2 | (198.8) | 415.1 | (158.0) | (261.3) | (41.5) | |
| Advances to suppliers | (8.4) | 21.1 | 37.4 | 27.0 | 41.9 | (42.6) | 7.3 | 2.4 | |
| Trade accounts payable | 33.7 | 33.4 | (26.1) | 0.9 | (81.4) | 81.5 | 73.5 | (44.0) | |
| Derivative financial instruments | 90.4 | 4.4 | (111.1) | 25.5 | (178.2) | 67.7 | (107.8) | 54.5 | |
| Taxes payable | (19.6) | (17.1) | 192.5 | (0.6) | 252.1 | (16.1) | 19.2 | (13.9) | |
| Other assets and liabilities, net | (99.4) | (61.8) | (278.2) | 11.2 | (310.3) | 64.7 | (54.0) | (96.1) | |
| (92.2) | (129.6) | (58.1) | (88.0) | 45.6 | 82.4 | (408.2) | (57.3) | ||
| (=) Net cash provided by operating actitivities | 57.6 | 256.6 | 811.0 | 9.8 | 447.2 | 295.3 | (17.5) | 94.7 | |
| l | Cash flow from investing activities: | ||||||||
| Restricted cash | (25.9) | 29.3 | (18.7) | (14.6) | 73.4 | (28.5) | (16.4) | (121.0) | |
| Marketable securities | (671.0) | 558.8 | - | - | - | - | - | - | |
| Acquisition of property, plant and equipment | (642.9) | (606.2) | (1,081.5) | (239.6) | (403.4) | (333.3) | (256.6) | (339.3) | |
| Acquisitions, net of cash acquired | (102.0) | (930.4) | (9.0) | (239.7) | 230.7 | (2.1) | (7.6) | (0.2) | |
| Other | - | 160.7 | 6.0 | (14.1) | (63.5) | 0.4 | 80.9 | 2.7 | |
| (=) Net cash used in investing actitivities | (1,441.7) | (787.8) | (1,103.2) | (507.9) | (162.8) | (363.4) | (199.6) | (457.7) | |
| l | Cash flow from financing activities: | ||||||||
| Proceeds from issuance of common stock | 1,118.4 | 200.0 | - | 303.7 | (304.4) | - | 227.8 | - | |
| Capital increase on subsidiary from minority | 324.4 | 11.2 | 57.4 | (1.3) | 121.3 | - | - | - | |
| Dividends Paid | (44.9) | - | - | - | - | - | (184.3) | (3.1) | |
| Additions of financial debt | 117.5 | 789.5 | 2,020.7 | 996.1 | 339.2 | 356.6 | 315.3 | 676.4 | |
| Payments of financial debt | (492.1) | (111.1) | (1,839.5) | (1,064.4) | (354.5) | (311.8) | (152.4) | (282.8) | |
| Other | - | (17.8) | (85.6) | - | (85.6) | - | - | (9.0) | |
| (=) Net cash provided by financing actitivities | 1,023.3 | 871.9 | 153.0 | 234.0 | (284.0) | 44.8 | 206.4 | 381.5 | |
| Effect of exchange rate changes on cash and cash | 112.6 | 99.7 | 195.7 | (46.8) | 48.2 | 1.0 | 4.9 | 79.5 | |
| (=) Variation in cash & equivalents | (248.2) | 440.4 | 56.5 | (310.9) | 48.5 | (22.3) | (5.9) | 98.0 | |
| (+) Cash and cash equivalents at beginning of year | 316.5 | 68.4 | 508.8 | 827.6 | 508.8 | 623.7 | 601.4 | 595.5 | |
| (=) Cash and cash equivalents at end of year | 68.4 | 508.8 | 565.2 | 516.7 | 557.3 | 601.4 | 595.5 | 693.6 | |
31 of 31
Cosan Limited
Condensed Consolidated Financial Statements
For the nine-month periods ended December 31, 2010 and 2009
COSAN LIMITED
CONDENSED CONSOLIDATED FINANCIAL STATEMENTS
CONTENTS
| Report of independent registered public accounting firm | 1 |
| Condensed consolidated balance sheets | 2 |
| Condensed consolidated statements of operations | 4 |
| Condensed consolidated statement of shareholders’ equity and comprehensive income | 5 |
| Condensed consolidated statements of cash flows | 6 |
| Notes to the condensed consolidated financial statements | 7 |
Report of independent registered public accounting firm
To the Board of Directors and Shareholders of
Cosan Limited
We have reviewed the condensed consolidated balance sheet of Cosan Limited and subsidiaries as of December 31, 2010, the related condensed consolidated statements of operations and cash flows for the nine-month periods ended December 31, 2010 and 2009 and the condensed consolidated statement of shareholders’ equity and comprehensive income for the nine-month period ended December 31, 2010. These financial statements are the responsibility of the Company's management.
We conducted our review in accordance with the standards of the Public Company Accounting Oversight Board (United States). A review of interim financial information consists principally of applying analytical procedures and making inquiries of persons responsible for financial and accounting matters. It is substantially less in scope than an audit conducted in accordance with the standards of the Public Company Accounting Oversight Board, the objective of which is the expression of an opinion regarding the financial statements taken as whole. Accordingly, we do not express such an opinion.
Based on our review, we are not aware of any material modifications that should be made to the condensed consolidated financial statements referred to above for them to be in conformity with U.S. generally accepted accounting principles.
We have previously audited, in accordance with the standards of the Public Company Accounting Oversight Board (United States), the consolidated balance sheet of Cosan Limited and subsidiaries as of March 31, 2010, and the related consolidated statements of operations, shareholders’ equity and cash flows for the year then ended not presented herein and in our report dated June 10, 2010, we expressed an unqualified opinion on those consolidated financial statements. In our opinion, the information set forth in the accompanying condensed consolidated balance sheet as of March 31, 2010, is fairly stated, in all material respects, in relation to the consolidated balance sheet from which it has been derived.
São Paulo, Brazil
February 9, 2011
ERNST & YOUNG TERCO
Auditores Independentes S.S.
CRC 2SP015199/O-8
Luiz Carlos Nannini
Accountant CRC 1SP171638/O-7
1
COSAN LIMITED
Condensed consolidated balance sheets
December 31, 2010 and March 31, 2010
(In thousands of U.S. dollars, except share data)
(Unaudited) December 31, 2010 | March 31, 2010 | |||||||
| Assets | ||||||||
| Current assets: | ||||||||
| Cash and cash equivalents | 693,566 | 623,675 | ||||||
| Restricted cash | 165,796 | 25,251 | ||||||
| Derivative financial instruments | 108,032 | 129,456 | ||||||
Trade accounts receivable, less allowances: December 31, 2010 – $28,964; March 31, 2010 – $32,144 | 394,582 | 430,328 | ||||||
| Inventories | 1,206,343 | 587,720 | ||||||
| Advances to suppliers | 161,202 | 132,258 | ||||||
| Taxes recoverable | 240,725 | 184,090 | ||||||
| Other current assets | 74,291 | 49,155 | ||||||
| 3,044,537 | 2,161,933 | |||||||
| Non-current assets: | ||||||||
| Property, plant, and equipment, net | 4,725,474 | 4,146,499 | ||||||
| Goodwill | 1,492,633 | 1,362,071 | ||||||
| Intangible assets, net | 592,057 | 602,263 | ||||||
| Accounts receivable from Federal Government | 205,323 | 187,385 | ||||||
| Judicial deposits | 108,558 | 94,083 | ||||||
| Other non-current assets | 573,290 | 440,672 | ||||||
| 7,697,335 | 6,832,973 | |||||||
| Total assets | 10,741,872 | 8,994,906 | ||||||
See accompanying notes to condensed consolidated financial statements.
2
(Unaudited) December 31, 2010 | March 31, 2010 | |||||||
| Liabilities and shareholders’ equity | ||||||||
| Current liabilities: | ||||||||
| Trade accounts payable | 453,184 | 320,044 | ||||||
| Taxes payable | 131,307 | 121,203 | ||||||
| Salaries payable | 105,407 | 79,497 | ||||||
| Current portion of long-term debt | 698,039 | 471,061 | ||||||
| Derivative financial instruments | 227,492 | 43,067 | ||||||
| Dividends payable | 1,193 | 24,696 | ||||||
| Other current liabilities | 155,120 | 111,971 | ||||||
| 1,771,742 | 1,171,539 | |||||||
| Long-term liabilities: | ||||||||
| Long-term debt | 3,539,997 | 2,845,667 | ||||||
| Estimated liability for legal proceedings and labor claims | 335,957 | 294,605 | ||||||
| Taxes payable | 425,212 | 381,805 | ||||||
| Deferred income taxes | 416,744 | 408,832 | ||||||
| Other long-term liabilities | 213,733 | 209,402 | ||||||
| 4,931,643 | 4,140,311 | |||||||
| Shareholders’ equity: | ||||||||
| Common shares class A1, $.01 par value. 1,000,000,000 shares authorized; 174,355,341 shares issued and outstanding | 1,743 | 1,743 | ||||||
| Common shares class B1, $.01 par value. 96,332,044 shares authorized, issued and outstanding | 963 | 963 | ||||||
| Common shares class B2, $.01 par value. 92,554,316 shares authorized | - | - | ||||||
| Additional paid-in capital | 1,997,090 | 1,932,117 | ||||||
| Accumulated other comprehensive income | 228,463 | 167,103 | ||||||
| Retained earnings | 240,857 | 242,264 | ||||||
| Equity attributable to shareholders of Cosan Ltd | 2,469,116 | 2,344,190 | ||||||
| Equity attributable to noncontrolling interests | 1,569,371 | 1,338,866 | ||||||
| Total shareholders’ equity | 4,038,487 | 3,683,056 | ||||||
| Total liabilities and shareholders’ equity | 10,741,872 | 8,994,906 | ||||||
See accompanying notes to condensed consolidated financial statements.
3
COSAN LIMITED
Condensed consolidated statements of operations
Nine-month periods ended December 31, 2010 and 2009
(In thousands of U.S. dollars, except share and per-share data)
(Unaudited)
December 31, 2010 | December 31, 2009 | |||||||
| Net sales | 7,729,980 | 5,845,469 | ||||||
| Cost of goods sold | (6,785,094 | ) | (5,182,198 | ) | ||||
| Gross profit | 944,886 | 663,271 | ||||||
| Selling expenses | (441,685 | ) | (345,159 | ) | ||||
| General and administrative expenses | (229,232 | ) | (177,394 | ) | ||||
| Operating income | 273,969 | 140,718 | ||||||
| Other income (expenses): | ||||||||
| Financial income (expenses), net | (48,391 | ) | 199,497 | |||||
| Gain on tax recovery program | - | 121,554 | ||||||
| Other (expenses) income | (17,348 | ) | 26,878 | |||||
| Income before income taxes and equity loss of affiliates | 208,230 | 488,647 | ||||||
| Income taxes expense | (86,449 | ) | (178,298 | ) | ||||
| Income before equity loss of affiliates | 121,781 | 310,349 | ||||||
| Equity loss of affiliates | (1,247 | ) | (5,464 | ) | ||||
| Net income | 120,534 | 304,885 | ||||||
| Less net income attributable to noncontrolling interests | (51,527 | ) | (97,025 | ) | ||||
| Net income attributable to Cosan Ltd | 69,007 | 207,860 | ||||||
| Per-share amounts attributable to Cosan Ltd | ||||||||
| Basic and diluted | 0.25 | 0.77 | ||||||
| Weighted number of shares outstanding | ||||||||
| Basic and diluted | 270,687,385 | 270,687,385 | ||||||
See accompanying notes to condensed consolidated financial statements.
4
COSAN LIMITED
Condensed consolidated statement of shareholders’ equity and comprehensive income
Nine-month period ended December 31, 2010
(In thousands of U.S. dollars, except share data)
(Unaudited)
| Common stock | ||||||||||||||||||||||||||||||||||||
Common number of class A Shares | Common number of class B shares | Common amount of class A shares | Common amount of class B shares | Additional paid-in capital | Retained earnings | Accumulated other comprehensive income | Noncontrolling interests | Total shareholders’ equity | ||||||||||||||||||||||||||||
| Balances at March 31, 2010 | 174,355,341 | 96,332,044 | 1,743 | 963 | 1,932,117 | 242,264 | 167,103 | 1,338,866 | 3,683,056 | |||||||||||||||||||||||||||
| Exercise of stock options | - | - | - | - | (1,481 | ) | - | (157 | ) | 3,522 | 1,884 | |||||||||||||||||||||||||
| Exercise of common stock warrants | - | - | - | - | - | - | - | 1 | 1 | |||||||||||||||||||||||||||
| Issuance of common shares of Rumo to Non-controlling interest | - | - | - | - | 73,111 | - | - | 154,679 | 227,790 | |||||||||||||||||||||||||||
| Proportionate share on stock issuance costs of investee | - | - | - | - | (307 | ) | - | - | (187 | ) | (494 | ) | ||||||||||||||||||||||||
| Share based compensation | - | - | - | - | 552 | - | - | 335 | 887 | |||||||||||||||||||||||||||
| Dividends | - | - | - | - | - | (70,414 | ) | - | (17,948 | ) | (88,362 | ) | ||||||||||||||||||||||||
| Subsidiary acquisition of its own common stock (treasury shares) | - | - | - | - | (6,902 | ) | - | 215 | (2,282 | ) | (8,969 | ) | ||||||||||||||||||||||||
| Net Income | - | - | - | - | - | 69,007 | - | 51,527 | 120,534 | |||||||||||||||||||||||||||
| Pension plan | - | - | - | - | - | - | (962 | ) | (584 | ) | (1,546 | ) | ||||||||||||||||||||||||
| Effective portion of gains/losses on derivative instrument that qualifies as a cash flow hedge | - | - | - | - | - | - | (89,701 | ) | (54,550 | ) | (144,251 | ) | ||||||||||||||||||||||||
| Gains/losses on available for sale securities | - | - | - | - | - | - | 2,203 | - | 2,203 | |||||||||||||||||||||||||||
| Currency translation adjustment | - | - | - | - | - | - | 149,762 | 95,992 | 245,754 | |||||||||||||||||||||||||||
| Total comprehensive income | - | - | - | - | - | - | 222,694 | |||||||||||||||||||||||||||||
| Balances at December 31, 2010 | 174,355,341 | 96,332,044 | 1,743 | 963 | 1,997,090 | 240,857 | 228,463 | 1,569,371 | 4,038,487 | |||||||||||||||||||||||||||
See accompanying notes to condensed consolidated financial statements.
5
COSAN LIMITED
Condensed consolidated statements of cash flows
Nine-month period ended December 31, 2010 and 2009
(In thousands of U.S. dollars)
(Unaudited)
December 31. 2010 | December 31. 2009 | |||||||
| Cash flows from operating activities: | ||||||||
| Net income attributable to Cosan Limited | 69,007 | 207,860 | ||||||
| Adjustments to reconcile net income to cash provided by operating activities: | ||||||||
| Depreciation and amortization | 521,429 | 380,791 | ||||||
| Deferred income taxes | 52,443 | 137,220 | ||||||
| Interest, monetary and exchange variation | 50,043 | (262,024 | ) | |||||
| Gain on tax recovery program | - | (121,554 | ) | |||||
| Net income attributable to noncontrolling interests | 51,527 | 97,025 | ||||||
| Others | 11,274 | (22,396 | ) | |||||
| Decrease/increase in operating assets and liabilities | ||||||||
| Trade accounts receivable net | 81,253 | 94,947 | ||||||
| Inventories | (460,808 | ) | (288,984 | ) | ||||
| Taxes recoverable | (38,518 | ) | (5,111 | ) | ||||
| Advances to suppliers | (32,877 | ) | (4,520 | ) | ||||
| Trade accounts payable | 111,009 | 55,264 | ||||||
| Derivative financial instruments | 14,403 | 67,138 | ||||||
| Taxes payable | (10,798 | ) | (59,581 | ) | ||||
| Other assets and liabilities, net | (46,797 | ) | 37,227 | |||||
| Net cash provided by operating activities | 372,590 | 313,302 | ||||||
| Cash flows from investing activities: | ||||||||
| Restricted cash | (165,796 | ) | (92,059 | ) | ||||
| Cash received from sales of noncurrent assets | 12,066 | - | ||||||
| Acquisition of investment | (9,883 | ) | - | |||||
| Acquisition of property, plant and equipment | (929,101 | ) | (678,093 | ) | ||||
| Acquisitions, net of cash acquired | - | (239,659 | ) | |||||
| Dividends received | 71,927 | - | ||||||
| Others | - | 69,472 | ||||||
| Net cash used in investing activities | (1,020,787 | ) | (940,339 | ) | ||||
| Cash flows from financing activities: | ||||||||
| Related parties | - | (63,858 | ) | |||||
| Proceeds from issuance of common stock | 227,790 | 304,426 | ||||||
| Acquisition of treasury shares | (8,969 | ) | - | |||||
| Additions of long-term debt | 1,348,242 | 1,681,429 | ||||||
| Dividends payments | (187,407 | ) | - | |||||
| Payments of long-term debt | (746,965 | ) | (1,485,016 | ) | ||||
| Net cash provided by financing activities | 632,691 | 436,981 | ||||||
| Effect of exchange rate changes on cash and cash equivalents | 85,397 | 197,981 | ||||||
| Net increase (decrease) in cash and cash equivalents | 69,891 | 7,925 | ||||||
| Cash and cash equivalents at beginning of period | 623,675 | 508,784 | ||||||
| Cash and cash equivalents at end of period | 693,566 | 516,709 | ||||||
| Supplemental cash flow information | ||||||||
| Cash paid during the period for: | ||||||||
| Interest | 182,149 | 146,041 | ||||||
| Income taxes | 16,045 | 2,189 | ||||||
See accompanying notes to condensed consolidated financial statements.
6
COSAN LIMITED
Notes to the condensed consolidated financial statements
(In thousands of U.S. dollars, unless otherwise stated)
(Unaudited)
| 1. | Operations |
Cosan Limited (“Cosan” and “the Company”) was incorporated in Bermuda as an exempted company on April 30, 2007. In connection with its incorporation, Cosan Limited issued 1,000 shares of common stock for $10.00 to Mr. Rubens Ometto Silveira Mello, who indirectly controls Cosan S.A. Indústria e Comércio and its subsidiaries (“Cosan S.A.”).
The companies included in the condensed consolidated financial statements have as their primary activity the production of ethanol and sugar, the marketing and distribution of fuel and lubricants in Brazil, and logistics services in the state of São Paulo, Brazil.
On February 1, 2010, the Company announced that it, along with Royal Dutch Shell - (“Shell”), had reached a non-binding memorandum of understanding (“MOU”) to form a joint venture for a combined 50/50 investment. On August 25, 2010, Cosan announced the conclusion of the negotiations with Shell and signed a binding MOU along with other arrangements. Cosan will contribute its sugar and ethanol and its distribution assets to the joint venture while Shell will contribute its distribution assets in Brazil. Shell will also make a fixed cash contribution in the amount of $1.6 billion over a 2 year period. The sugar logistics and distribution of lubricants business along with the investment in Radar Propriedades Agrícolas S.A. will not be contributed to the joint venture. On January 4, 2011, the Company received unconditional merger clearance from the European Union to form the proposed Joint Venture in Brazil. The two companies will now focus on securing conditions precedent to be met or waived, and detailed integration work before launching the joint venture, expected for the first half of 2011, as announced on August 25, 2010. The Joint Venture is still under analysis by the Brazilian Competition Authority (CADE. During the nine-month period ended December 31, 2010, this association did not generate any accounting records.
On July 2, 2010, the indirect subsidiary Novo Rumo Logística S.A. (“Novo Rumo”), entered into a Subscription Agreement with TPG Participações and GIF LOG Participações S.A. (“Investors”) whereby the investors would acquire a 25% equity interest of Rumo Logistica S.A. (“Rumo”), a subsidiary of Novo Rumo. On September 2, 2010, the subscription took place through a capital increase in the amount of $227,790, paid in equal portions by the Investors and the issuance of shares by Rumo. Before the payment the Company held, directly and indirectly, an equity interest of 92.9% in Novo Rumo, which, in turn, held an equity interest of 99.9% in Rumo Logistica S.A.. After the contribution, Novo Rumo now holds 75.0% of Rumo’s equity and each of the Investors hold a 12.5% interest. This transa ction was treated as an equity transaction.
7
COSAN LIMITED
Notes to the condensed consolidated financial statements (Continued)
(In thousands of U.S. dollars, unless otherwise stated)
(Unaudited)
| 2. | Presentation of the consolidated financial statements |
| a. | Basis of reporting for interim financial statements |
In the opinion of management, the unaudited condensed consolidated financial statements reflect all adjustments (consisting of normal recurring accruals) considered necessary for a fair presentation of the Company’s results for the periods presented. Interim results for the nine-month period ended December 31, 2010, are not necessarily indicative of the results that may be expected for the fiscal year.
The unaudited condensed consolidated financial statements include the accounts of Cosan Limited and its subsidiaries. All significant intercompany transactions have been eliminated.
These condensed consolidated financial statements should be read in conjunction with Cosan Limited`s annual consolidated financial statements for the fiscal year ended March 31, 2010.
The functional currency and the reporting currency of Cosan is the U.S. dollar. The Brazilian real is the currency of the primary economic environment in which Cosan S.A. and its subsidiaries located in Brazil operate and generate and expend cash and is the functional currency, except for the foreign subsidiaries in which U.S. dollar is the functional currency. However, Cosan S.A. utilizes the U.S. dollar as its reporting currency. The accounts of Cosan S.A. are maintained in Brazilian reais, which have been translated into U.S. dollars in accordance with Accounting Standards Codification (“ASC”) 830 “Foreign Currency Matters”. The assets and liabilities are translated from reais to U.S. d ollars using the official exchange rates reported by the Brazilian Central Bank at the balance sheet date and revenues, expenses, gains and losses are translated using the average exchange rates for the period. The translation gain or loss is included in the accumulated other comprehensive income component of shareholders’ equity, and in the statement of comprehensive income for the period in accordance with the criteria established in ASC 220 “Comprehensive Income”.
The exchange rate of the Brazilian real (R$) to the US$ was R$1.67=US$ 1.00 at December 31, 2010 and R$1.78=US$1.00 at March 31, 2010.
8
COSAN LIMITED
Notes to the condensed consolidated financial statements (Continued)
(In thousands of U.S. dollars, unless otherwise stated)
(Unaudited)
| 2. | Presentation of the consolidated financial statements (Continued) |
| b. | Use of estimates |
The preparation of condensed consolidated financial statements in conformity with U.S. GAAP requires management to make estimates and assumptions that affect the amounts reported in the condensed consolidated financial statements and accompanying notes. Actual results could differ from these estimates. These estimates and assumptions are reviewed and updated regularly to reflect recent experience.
| c. | New Accounting Pronouncements |
In January 2010, the FASB issued ASU 2010-06, Fair Value Measurements and Disclosures (Topic 820): Improving Disclosures about Fair Value Measurements, which will require companies to make new disclosures about recurring or nonrecurring fair value measurements including significant transfers into and out of Level 1 and Level 2 fair value hierarchies and information on purchases, sales, issuance and settlements on a gross basis in the reconciliation of Level 3 fair value measurements. The ASU is effective prospectively for financial statements issued for fiscal years and interim periods beginning after December 15, 2009. The new disclosures about purchases, sales, issuance and settlements on a gross basis in the reconciliation of Level 3 fair value measurements is effective for interim and annual reporting periods beginning after December 15, 2010. The Company expects that the adoption of ASU 2010-06 will not have a material impact on its consolidated financial statements.
9
COSAN LIMITED
Notes to the condensed consolidated financial statements (Continued)
(In thousands of U.S. dollars, unless otherwise stated)
(Unaudited)
| 2. | Presentation of the consolidated financial statements (Continued) |
| c. | New Accounting Pronouncements (Continued) |
In December 2010, the FASB issued ASU 2010-28, When to Perform Step 2 of the Goodwill Impairment Test for Reporting Units with Zero or Negative Carrying Amounts, a consensus of the FASB Emerging Issues Task Force (Issue No. 10-A). This ASU modifies Step 1 of the goodwill impairment test under FASB ASC Topic 350, Intangibles-Goodwill and Other, for reporting units with zero or negative carrying amounts to require an entity to perform Step 2 of the goodwill impairment test if it is more likely than not that a goodwill impairment exists. In determining whether it is more likely than not that a goodwill impairment exists, an entity should consider whether there are adverse qualitative factors in determining whether an interim goodwill impairment test between annual test dates is necessary. Th e ASU allows an entity to use either the entity or enterprise valuation premise to determine the carrying amount of a reporting unit. On adoption of the ASU, goodwill impairment that results from this requirement to perform Step 2 of the goodwill impairment test would be recognized as a cumulative effect adjustment to beginning retained earnings in the period of adoption. This ASU is effective for fiscal years, and interim periods within those years, beginning after December 15, 2010. The Company expects that the adoption of ASU 2010-28 will not have a material impact on its consolidated financial statements.
| d. | Derivative financial instruments |
Cosan accounts for derivative financial instruments utilizing ASC 815, “Accounting for Derivative Instruments and Hedging Activities”, as amended. As part of Cosan’s risk management program, it uses a variety of financial instruments, including commodity futures contracts, forward currency agreements, interest rate and foreign exchange swap contracts and option contracts. Beginning April 1, 2010, Cosan recognized a portion of its derivative instruments as cash flow hedge transactions. The derivative instruments are measured at fair value and the gains or losses resulting from the changes in fair value of the instruments are recorded in financial income or financial expense or other comprehensive income when designated as a cash flow hedge (effective portion on ly). See note 14 for further detail.
10
COSAN LIMITED
Notes to the condensed consolidated financial statements (Continued)
(In thousands of U.S. dollars, unless otherwise stated)
(Unaudited)
| 3. | Inventories |
December 31, 2010 | March 31, 2010 | |||||||
| Finished goods: | ||||||||
| Sugar | 349,697 | 52,561 | ||||||
| Ethanol | 300,691 | 31,573 | ||||||
| Lubricants and fuel (Gasoline, Diesel and Ethanol) | 201,254 | 149,613 | ||||||
| 851,642 | 233,747 | |||||||
| Annual maintenance cost of growing crops | 220,475 | 243,709 | ||||||
| Supplies and others | 134,226 | 110,264 | ||||||
| 1,206,343 | 587,720 | |||||||
| 4. | Taxes payable |
December 31, 2010 | March 31, 2010 | |||||||
| ICMS – State VAT | 25,325 | 27,623 | ||||||
| IPI | 22,832 | 3,582 | ||||||
| INSS | 13,932 | 13,414 | ||||||
| PIS | 3,816 | 4,564 | ||||||
| COFINS | 17,571 | 18,010 | ||||||
| Tax Recovery from Brazilian Law No 11.941/09 and MP 470/09 | 398,438 | 373,650 | ||||||
| Income tax and social contribution | 59,000 | 50,471 | ||||||
| Others | 16,045 | 11,694 | ||||||
| 556,959 | 503,008 | |||||||
| Current liabilities | (131,307 | ) | (121,203 | ) | ||||
| Long-term liabilities | 425,652 | 381,805 | ||||||
11
COSAN LIMITED
Notes to the condensed consolidated financial statements (Continued)
(In thousands of U.S. dollars, unless otherwise stated)
(Unaudited)
| 5. | Long-term debt |
The Company’s debt is summarized as follows:
| Index | Average annual interest rate | December 31, 2010 | March 31, 2010 | ||||||||||
| Resolution No. 2471 (PESA) | IGP-M | 3.9 | % | 350,605 | 297,243 | ||||||||
| Senior notes due 2014 | US Dollar | 9.5 | % | 363,300 | 354,433 | ||||||||
| Senior notes due 2017 | US Dollar | 7.0 | % | 412,160 | 405,258 | ||||||||
| Perpetual notes | US Dollar | 8.3 | % | 759,265 | 455,820 | ||||||||
| BNDES | TJLP | 3.6 | % | 974,099 | 520,068 | ||||||||
| Credit notes | DI | 2.4 | % | 183,516 | 212,660 | ||||||||
| Credit notes | US Dollar | 6.2 | % | 101,094 | 102,656 | ||||||||
Export Pre-payments | US Dollar + Libor | 6.3 | % | 435,451 | 547,230 | ||||||||
| ACC – Export pre payments | US Dollar | 1.6 | % | 126,248 | 103,416 | ||||||||
| Others | Various | Various | 532,298 | 317,944 | |||||||||
| 4,238,036 | 3,316,728 | |||||||
| Current portion | (698,039 | ) | (471,061 | ) | ||||
| Long-term debt | 3,539,997 | 2,845,667 |
Long-term debt has the following scheduled maturities:
| 2012 | 526,824 | |||
| 2013 | 229,084 | |||
| 2014 | 573,392 | |||
| 2015 | 428,972 | |||
| 2016 and thereafter | 1,781,725 | |||
| 3,539,997 |
Resolution No. 2471 - Special Agricultural Financing Program (Programa Especial de Saneamento de Ativos), or PESA
To extend the repayment period of debt incurred by Brazilian agricultural producers, the Brazilian government passed Law 9.138 followed by Central Bank Resolution 2,471, which, together, formed the PESA program. PESA offered certain agricultural producers with certain types of debt the opportunity to acquire Brazilian treasury bills (“CTNs”) in an effort to restructure their agricultural debt. The face value of the Brazilian treasury bills was the equivalent of the value of the restructured debt and was for a term of 20 years.
12
COSAN LIMITED
Notes to the condensed consolidated financial statements (Continued)
(In thousands of U.S. dollars, unless otherwise stated)
(Unaudited)
| 5. | Long-term debt (Continued) |
Resolution No. 2471 - Special Agricultural Financing Program (Programa Especial de Saneamento de Ativos), or PESA (Continued)
The acquisition price was calculated by the present value, discounted at a rate of 12% per year or at the equivalent of 10.4% of its face value. The CTNs were deposited as a guarantee with a financial institution and cannot be renegotiated until the outstanding balance is paid in full. The outstanding balance associated with the principal is adjusted in accordance with the IGP-M until the expiration of the restructuring term, which is also 20 years, at which point the debt will be discharged in exchange for the CTNs. Because the CTNs will have the same face value as the outstanding balance at the end of the term, it will not be necessary to incur additional debt to pay the PESA debt.
On July 31, 2003, the Central Bank issued Resolution 3,114, authorizing the reduction of up to five percentage points of PESA related interest rates, effectively lowering the above-mentioned rates to 3%, 4% and 5%, respectively. The CTNs held by Cosan S.A. as of December 31, 2010 and March 31, 2010 amounted to $172,445 and $143,495, respectively, and are classified as other non-current assets.
Senior notes due 2014
On August 4, 2009, the indirect subsidiary CCL Finance Limited issued $ 350,000 of senior notes in the international capital markets. These senior notes, listed on the Luxembourg Stock Exchange, mature in August 2014 and bear interest at a rate of 9.5% per annum, payable semi-annually in February and August of each year, from February of 2010.
Senior notes due 2017
On January 26, 2007, Cosan Finance Limited, an indirect subsidiary of the Company, issued $400,000 of senior notes in the international capital markets. These senior notes, listed on the Luxembourg Stock Exchange, mature in November 2017 and bear interest at a rate of 7% per annum, payable semi-annually. The senior notes are guaranteed by Cosan S.A., and its subsidiary, Cosan Açucar e Álcool.
13
COSAN LIMITED
Notes to the condensed consolidated financial statements (Continued)
(In thousands of U.S. dollars, unless otherwise stated)
(Unaudited)
| 5. | Long-term debt (Continued) |
Perpetual notes
On January 24 and February 10, 2006, Cosan S.A. issued perpetual notes which are listed on the Luxembourg Stock Exchange - EURO MTF. These notes bear interest at a rate of 8.25% per year, payable quarterly on May 15, August 15, November 15 and February 15 of each year, beginning May 15, 2006. These notes may, at the discretion of Cosan, be redeemed on any interest payment date subsequent to February 15, 2011. The notes are guaranteed by Cosan S.A. and by Cosan Açucar e Álcool.
On November 5, 2010 the subsidiary Cosan Overseas Limited issued $300,000 of perpetual notes in the foreign market, in accordance with “Regulation S”. These notes bear interest at a rate of 8.25% per year, payable quarterly.
BNDES
Refers to the financing of cogeneration and logistics projects, as well as the financing of the Jataí and Caarapó greenfields (sugar and ethanol mills). The BNDES financing is due from 2012 through 2025.
Credit Notes
The Company executed several credit note agreements with several financial institutions during 2010 which will be paid through export operations during 2012. The credit notes bear interest at rates between 2.1% and 6.2% per annum, payable semi-annually.
Export Pre-payment Notes
During the third quarter of 2009, the Company obtained funds from export pre-payment notes for the total amount of $530,000. The export pre-payment notes are due from 2012 through 2014, and bear interest of Libor plus 6.3%.
Covenants
Cosan and its subsidiaries are subject to certain restrictive covenants related to their indebtedness.
At December 31, 2010, Cosan was in compliance with its debt covenants.
14
COSAN LIMITED
Notes to the condensed consolidated financial statements (Continued)
(In thousands of U.S. dollars, unless otherwise stated)
(Unaudited)
6. | Related parties |
Assets and liabilities with related parties are summarized as follows:
| Assets | ||||||||
December 31, 2010 | March 31, 2010 | |||||||
| Rezende Barbosa S.A. Administração e Participações | 50,014 | 48,889 | ||||||
| Vertical UK LLP | 7,575 | 8,403 | ||||||
| Others | 216 | 2,377 | ||||||
| 57,805 | 59,669 | |||||||
| Current (*) | (12,183 | ) | (13,958 | ) | ||||
| Noncurrent (*) | 45,622 | 45,711 | ||||||
| Liabilities | ||||||||
December 31, 2010 | March 31, 2010 | |||||||
| Rezende Barbosa S.A. Administração e Participações | 43,356 | - | ||||||
| Logispot Armazéns Gerais S.A. | - | 6,313 | ||||||
| Others | 1,434 | 1,781 | ||||||
| 44,790 | 8,094 | |||||||
| Current (*) | (44,790 | ) | (8,094 | ) | ||||
| Noncurrent | - | - | ||||||
| (*) included in other current and non-current assets or liabilities |
The receivable of $50,014 ($48,889 as of March 31, 2010) with Rezende Barbosa S.A. Administração e Participações is related to credits assumed by Rezende Barbosa, in connection with the acquisition of Cosan Alimentos and intercompany loans.
The amount receivable from the affiliate Vertical UK LLP, refers to ethanol trading, with an average maturity date of 30 days.
The payable of $43,356 with Rezende Barbosa S.A. Administração e Participações is related to the purchase of sugar cane. This amount is presented offset of credits assumed by Rezende Barbosa, in connection with the acquisition of Cosan Alimentos and intercompany loans.
The payable to Logispot is related to the remaining payment in connection with the interest acquired, which were settled during the period.
15
COSAN LIMITED
Notes to the condensed consolidated financial statements (Continued)
(In thousands of U.S. dollars, unless otherwise stated)
(Unaudited)
| 6. | Related parties (Continued) |
Cosan conducts some of its operations through various ventures and other partnership forms which are principally accounted for using the equity method. The condensed consolidated income statement includes the following amounts resulting from transactions with related parties:
December 31, 2010 | December 31, 2009 | |||||||
| Transactions involving assets | ||||||||
| Sale of products and services to associates | 103,529 | 98,320 | ||||||
| Cash received due to the sale of products, services, and other assets | (109,230 | ) | (109,642 | ) | ||||
| Added through acquisition | - | 73,338 | ||||||
| Transactions involving liabilities | ||||||||
| Purchase of sugar cane from associates | 173,845 | 80,227 | ||||||
| Payments to associates | (139,361 | ) | (52,667 | ) | ||||
The purchase and sale of products are carried out at arm’s length and unrealized profit or losses with consolidated companies have been eliminated. Those operations are also carried out at prices and under conditions similar to those existing in the market.
At December 31 and March 31, 2010, Cosan S.A. and its subsidiaries were lessees of approximately 68,000 hectares (unaudited) of affiliated companies’ land and land of its related party Radar Propriedades Agrícolas S.A., which is controlled by another shareholder. Additionally, Cosan and its subsidiary Cosan S.A. Açucar e Álcool purchased a total of 6,003 thousands of tons of sugar cane (unaudited) from Rezende Barbosa during the nine-month period ended December 31, 2010. These operations are carried out under conditions and prices similar to those prevailing in the market, calculated based on sugarcane tons per hectare, valued in accordance with the price established by CONSECANA (São Paulo State Council of Sugarcane, Sugar and Ethanol Producers).
16
COSAN LIMITED
Notes to the condensed consolidated financial statements (Continued)
(In thousands of U.S. dollars, unless otherwise stated)
(Unaudited)
| 7. | Estimated liability for legal proceedings and labor claims and commitments |
December 31, 2010 | March 31, 2010 | |||||||
| Tax contingencies | 192,615 | 173,924 | ||||||
| Civil and labor contingencies | 143,342 | 120,681 | ||||||
| 335,957 | 294,605 | |||||||
Cosan and its subsidiaries are parties to various ongoing labor claims, civil and tax proceedings in Brazil arising in the normal course of its business. Respective provisions for contingencies were recorded considering those cases in which the likelihood of loss has been rated as probable. Management believes resolution of these disputes will have no significant effect compared to the estimated amounts accrued.
Judicial deposits recorded by Cosan under other non-current assets, in the balance sheet, amounting to $108,558 at December 31, 2010 ($94,083 at March 31, 2010) have been made for certain of these suits. Judicial deposits are restricted assets of Cosan placed on deposit with the court and held in judicial escrow pending legal resolution of the related legal proceedings.
The major tax contingencies as of December 31, 2010 and March 31, 2010 are described as follows:
December 31, 2010 | March 31, 2010 | |||||||
| Compensation with Finsocial | 108,561 | 97,114 | ||||||
| ICMS credits | 43,170 | 33,824 | ||||||
| PIS and Cofins | 15,590 | 11,910 | ||||||
| IPI – Federal VAT | 5,179 | 4,692 | ||||||
| Other | 20,115 | 26,384 | ||||||
| 192,615 | 173,924 | |||||||
17
COSAN LIMITED
Notes to the condensed consolidated financial statements (Continued)
(In thousands of U.S. dollars, unless otherwise stated)
(Unaudited)
| 7. | Estimated liability for legal proceedings and labor claims and commitments (Continued) |
The detail of the movement in the estimated liability for legal proceedings and labor claims is as follows:
| Balance at March 31, 2010 | 294,605 | |||
| Provision | 29,081 | |||
| Settlements | (38,006 | ) | ||
| Accrued interest | 29,282 | |||
| Foreign currency translation | 20,995 | |||
| Balance at December 31, 2010 | 335,957 |
In addition to the aforementioned claims, Cosan and its subsidiaries are involved in other contingent liabilities relating to tax, civil and labor claims and environmental matters, which have not been recorded, considering their current stage and the likelihood of unfavorable outcomes rated as possible. These claims are broken down as follows:
December 31, 2010 | March 31, 2010 | |||||||
| Withholding income tax | 115,103 | 102,652 | ||||||
| ICMS – State VAT | 292,042 | 180,988 | ||||||
| IPI - Federal VAT | 264,375 | 246,190 | ||||||
| PIS and COFINS | 89,068 | 80,604 | ||||||
| Civil and labor | 373,097 | 275,403 | ||||||
| INSS and other | 124,917 | 69,842 | ||||||
| 1,258,602 | 955,679 | |||||||
18
COSAN LIMITED
Notes to the condensed consolidated financial statements (Continued)
(In thousands of U.S. dollars, unless otherwise stated)
(Unaudited)
| 8. | Accounts receivable from Federal Government |
The subsidiary Cosan Açúcar e Álcool has several indemnification suits filed against the Federal Government. The suits relate to product prices that did not conform to the reality of the market, which were mandatorily established at the time the sector was under the Government‘s control.
In connection with one of these suits, a final and unappealable decision in the amount of US$149,121 was rendered in September 2006 in favor of Usina de Barra. This has been recorded as a gain in the statement of operations in 2007. Since the recorded amount is substantially composed of interest and monetary restatement, it was recorded in financial income and in a non-current receivable on the balance sheet. In connection with the settlement process, the form of payment continues to be negotiated with the government.
At December 31, 2010, the receivable and corresponding lawyers’ fees totaled US$205,323 and US$24,639 (US$187,385 and US$22,486 at March 31, 2010), respectively.
| 9. | Financial income and expenses, net |
| Nine-month period ended | ||||||||
December 31, 2010 | December 31, 2009 | |||||||
| Financial expenses | ||||||||
| Interest | (215,661 | ) | (207,538 | ) | ||||
| Monetary variation | (39,246 | ) | (82,777 | ) | ||||
| Other | (2,194 | ) | (3,258 | ) | ||||
| (257,101 | ) | (293,573 | ) | |||||
| Financial income | ||||||||
| Interest | 33,193 | 52,672 | ||||||
| Monetary variation | 14,361 | 2,520 | ||||||
| Other | 34,632 | 39,951 | ||||||
| 82,186 | 95,143 | |||||||
| Foreign exchange gains | 124,640 | 318,098 | ||||||
| Derivatives | ||||||||
| Commodities | (14,380 | ) | (193,880 | ) | ||||
| Exchange rate and interest | 16,264 | 273,709 | ||||||
| 1,884 | 79,829 | |||||||
| Financial income, net | (48,391 | ) | 199,497 | |||||
19
COSAN LIMITED
Notes to the condensed consolidated financial statements (Continued)
(In thousands of U.S. dollars, unless otherwise stated)
(Unaudited)
| 10. | Income taxes |
Income tax expense attributable to income from operations for the nine-month periods ended December 31, 2010 and 2009 consists of:
December 31, 2010 | December 31, 2009 | |||||||
| Income taxes expense: | ||||||||
| Current | (34,016 | ) | (41,078 | ) | ||||
| Deferred | (52,433 | ) | (137,220 | ) | ||||
| (86,449 | ) | (178,298 | ) | |||||
Income taxes for the nine-month periods ended December 31, 2010 and 2009, differed from the amounts computed by applying the income tax rate of 25% and social contribution tax rate of 9% to income before income taxes due to the following:
December 31, 2010 | December 31, 2009 | |||||||
| Income before income taxes and equity in loss of affiliates | 208,230 | 488,647 | ||||||
| Income tax expense at statutory rate — 34% | (70,798 | ) | (166,140 | ) | ||||
| Increase (reduction) in income taxes resulting from: | ||||||||
| Nontaxable income (loss) of the Company | (1,001 | ) | 6,410 | |||||
| Equity in earnings of affiliates not subject to taxation | (430 | ) | (1,840 | ) | ||||
| Nondeductible donations and contributions | (4,610 | ) | (1,437 | ) | ||||
| Recognized granted options | (300 | ) | (1,526 | ) | ||||
| Tax loss carryforward unrealizable in subsidiaries | (4,315 | ) | (1,359 | ) | ||||
| Others | (4,995 | ) | (12,406 | ) | ||||
| Income tax expense | (86,449 | ) | (178,298 | ) | ||||
Cosan accounts for unrecognized tax benefits in accordance with ASC 740, “Accounting for Uncertainly in Income Taxes”. A reconciliation of the beginning and ending amount of unrecognized tax benefits in the estimated liability for legal proceedings, and labor claims, is as follows:
| Balance at March 31, 2010 | 49,013 | |||
| Accrued interest on unrecognized tax benefit | 1,916 | |||
| Settlements | (145 | ) | ||
| Effect of foreign currency translation | 3,428 | |||
| Balance at December 31, 2010 (*) | 54,212 |
(*) Recorded as taxes payable (long-term)
20
COSAN LIMITED
Notes to the condensed consolidated financial statements (Continued)
(In thousands of U.S. dollars, unless otherwise stated)
(Unaudited)
| 10. | Income taxes (Continued) |
It is possible that the amount of unrecognized tax benefits will change in the next twelve months, however, an estimate of the range of the possible change cannot be made at this time due to the long time to reach a settlement agreement or decision with the taxing authorities.
The Company and its subsidiaries file income tax returns in Brazil and they are subject to income tax examinations by the relevant tax authorities for the years 2005 through 2010.
| 11. | Shareholders’ equity |
| a. | Capital |
As of December 31, 2010 and March 31, 2010, Cosan Limited’s share capital consists of:
Shareholder | Class A shares and/or BDRs | % | Class B shares | % | ||||||||||||
| Queluz Holding Limited | 11,111,111 | 6.37 | 66,321,766 | 68.85 | ||||||||||||
| Usina Costa Pinto S.A. Açúcar e Álcool | - | - | 30,010,278 | 31.15 | ||||||||||||
| Aguassanta Participaçơes S.A. | 5,000,000 | 2.87 | - | - | ||||||||||||
| Gávea Funds | 33,333,333 | 19.12 | - | - | ||||||||||||
| Others | 124,910,897 | 71.64 | - | - | ||||||||||||
| Total | 174,355,341 | 100.00 | 96,332,044 | 100.00 | ||||||||||||
| b. Additional paid-in capital and noncontrolling interest |
As mentioned in note 1, on September 2, 2010, the shareholders approved a capital increase at Rumo through issuance of shares in exchange for cash provided by investors. As a result of this transaction Cosan recorded noncontrolling interest at the amount $154,679. The cash contribution in excess of the book value the investors interest in Rumo has been accounted for as an equity transaction, leading to an additional paid-in capital of $73,111.
c. Dividends
On the August 6, 2010, shareholders’ meeting, it was approved the payment of dividends at the amount of $70,414 in relation to the year ended March 31, 2010.
21
COSAN LIMITED
Notes to the condensed consolidated financial statements (Continued)
(In thousands of U.S. dollars, unless otherwise stated)
(Unaudited)
| 12. | Deferred gain on sale of investments in subsidiaries |
Agrícola Ponte Alta S.A. is a subsidiary whose principal assets are land used for the growing of sugarcane for Cosan S.A. On December 15, 2008, the shareholders approved a partial spin-off of the assets of Ponte Alta and created four new subsidiaries. Agricultural land was then transferred from Ponte Alta to each of the entities. On December 30, 2008, two of the entities, Nova Agrícola Ponte Alta S.A. and Terras da Ponte Alta S.A. were sold to Radar, an affiliate company accounted for by the equity method. The selling price was fair value, $123,596, which resulted in a gain of $47,080. This gain has previously been deferred since there were no lease contracts executed for the land, which was being used by Cosan S.A. for a monthly fee. During the year ended March 31, 2009 the lease contracts were executed, and the gain is being amortized to profit and loss over the 19 year average term of the leases since then.
During the nine-month period ended December 31, 2010, Cosan S.A. recognized a gain of $2,893 related to this sale-leaseback transaction.
| 13. | Share-based compensation |
Cosan Limited’s subsidiary, Cosan S.A., offers a stock option plan to officers and employees. The plan authorizes the issue of up to 5% of the shares comprising Cosan S.A.’s share capital. The exercise of options may be settled only through issuance of new common shares or treasury shares.
The employees that resign Cosan S.A. before the vesting period will forfeit 100% of their rights. However, if the employment is terminated by Cosan S.A. without cause, the employees will have right to exercise 100% of their options of that particular year plus the right to exercise 50% of the options of the following year.
22
COSAN LIMITED
Notes to the condensed consolidated financial statements (Continued)
(In thousands of U.S. dollars, unless otherwise stated)
(Unaudited)
| 13. | Share-based compensation (Continued) |
The fair value of share-based awards was estimated using a binominal model with the following assumptions:
Options granted on September 22, 2005 | Options granted on September 11, 2007 | Options granted on August 7, 2009 | ||||
| Grant price - in U.S. dollars | 3.67 | 3.67 | 3.67 | |||
| Expected life (in years) | 7.5 | 7.5 | Immediate | |||
| Interest rate | 14.52% | 9.34% | (1) | |||
| Expected volatility | 34.00% | 46.45% | (1) | |||
| Expected dividend yield | 1.25% | 1.47% | (1) | |||
| Weighted-average fair value at grant date - in U.S. dollars | 7.41 | 10.92 | (1) |
| (1) | The options were fully vested at the date of issuance so the fair value was the quoted market price as of the grant date. |
As of December 31, 2010, the amount of $851 related to the unrecognized compensation cost related to stock options is expected to be recognized in 9 months.
As of December 31, 2010 there were 112,440 options outstanding with a weighted-average exercise price of $3.67.
23
COSAN LIMITED
Notes to the condensed consolidated financial statements (Continued)
(In thousands of U.S. dollars, unless otherwise stated)
(Unaudited)
| 14. | Risk management and financial instruments |
a) Risk management
The Company is exposed to market risks, mainly related to the volatility of sugar prices and foreign exchange rates. Management analyzes these risks and uses financial instruments to hedge a portion of the risk exposure.
On December 31 and March 31, 2010, fair values related to transactions involving derivative financial instruments with the purpose of hedge or other purposes were measured at market value (fair value) by observables factors such as quoted prices in active markets or discounted cash flows based on market curves and are presented below:
| Notional | Fair Value | |||||||||||||||
| December 31, | March 31, | December 31, | March 31, | |||||||||||||
| 2010 | 2010 | 2010 | 2010 | |||||||||||||
| Price risk | ||||||||||||||||
| Commodity derivatives | ||||||||||||||||
| Future contracts | 1,027,319 | 661,110 | (157,488 | ) | 63,101 | |||||||||||
| Options contracts | 11,727 | 603,357 | (25,908 | ) | (6,586 | ) | ||||||||||
| Swap contracts | 758,912 | 56,594 | (4 | ) | 607 | |||||||||||
| (183,400 | ) | 57,122 | ||||||||||||||
| Exchange rate risk | ||||||||||||||||
| Future contracts | 154,309 | 1,180,829 | 1,321 | 264 | ||||||||||||
| Forward contracts | 682,979 | 537,422 | 60,933 | 20,527 | ||||||||||||
| Options contracts | 35,711 | 377,036 | 2,955 | 8,827 | ||||||||||||
| 65,209 | 29,618 | |||||||||||||||
| Interest rate risk | ||||||||||||||||
| Interest derivative | 207,574 | 291,291 | (1,269 | ) | (351 | ) | ||||||||||
| (1,269 | ) | (351 | ) | |||||||||||||
| Total | (119,460 | ) | 86,389 | |||||||||||||
| Total Assets | 108,032 | 129,456 | ||||||||||||||
| Total Liabilities | (227,492 | ) | (43,067 | ) | ||||||||||||
b) Price risk
This arises from the possibility of fluctuations in the market prices of products sold by the Company, mainly raw material sugar - VHP (sugar #11) and white sugar (LIFFE sugar #5). These fluctuations in prices can cause substantial changes in the revenues of the Company. To mitigate these risks, the Company constantly
monitors the markets, seeking to anticipate changes in prices. The positions of the consolidated derivative financial instruments to hedge the price risk of commodities are shown in the table below:
24
COSAN LIMITED
Notes to the condensed consolidated financial statements (Continued)
(In thousands of U.S. dollars, unless otherwise stated)
(Unaudited)
| 14. | Risk management and financial instruments (continued) |
b) Price risk (Continued)
| Price risk: price derivatives outstanding as of December 31, 2010 | |||||||||||||||||
| Derivative | Purchased / sold | Market | Contract | Maturity | Notional | Fair Value | |||||||||||
| Derivative financial instruments designated as cash flow hedges | |||||||||||||||||
| Future | Sold | NYBOT | #11 | 01/Mar/11 | (141.838 | ) | (41.973 | ) | |||||||||
| Future | Sold | NYBOT | #11 | 01/May/11 | (26.294 | ) | (14.623 | ) | |||||||||
| Future | Sold | NYBOT | #11 | 01/Jul/11 | (107.259 | ) | (26.491 | ) | |||||||||
| Future | Sold | NYBOT | #11 | 01/Oct/11 | (74.827 | ) | (19.438 | ) | |||||||||
| Future | Sold | NYBOT | #11 | 01/Mar/12 | (20.049 | ) | (335 | ) | |||||||||
| Swap | Sold | NYBOT | #11 | 01/Mar/11 | (30.238 | ) | (23.353 | ) | |||||||||
| Swap | Sold | NYBOT | #11 | 01/May/11 | (16.534 | ) | 115 | ||||||||||
| Swap | Sold | NYBOT | #11 | 01/Jul/11 | (170.502 | ) | (18.724 | ) | |||||||||
| Swap | Sold | NYBOT | #11 | 01/Oct/11 | (176.946 | ) | (20.452 | ) | |||||||||
| Subtotal designated as cash flow hedges | (764.487 | ) | (165.274 | ) | |||||||||||||
| Derivative financial instruments not designated under hedge accounting | |||||||||||||||||
| Future | Sold | NYBOT | #11 | 01/Mar/11 | (27.017 | ) | (10.414 | ) | |||||||||
| Future | Sold | NYBOT | #11 | 01/Oct/11 | (34.436 | ) | (15.070 | ) | |||||||||
| (61.453 | ) | (25.484 | ) | ||||||||||||||
| Future | Purchased | NYBOT | #11 | 01/Mar/11 | (24.904 | ) | 1.285 | ||||||||||
| Future | Purchased | NYBOT | #11 | 01/Mar/11 | (5.960 | ) | 3.957 | ||||||||||
| Future | Purchased | NYBOT | #11 | 01/Oct/11 | (24.752 | ) | 2.643 | ||||||||||
| Future | Purchased | NYBOT | #11 | 01/Mar/12 | (30.125 | ) | 13.890 | ||||||||||
| Swap | Purchased | NYBOT | #11 | 01/Jul/11 | (53.872 | ) | 4.806 | ||||||||||
| Swap | Purchased | NYBOT | #11 | 01/Oct/11 | (61.768 | ) | 6.688 | ||||||||||
| (201.381 | ) | 33.270 | |||||||||||||||
| Future | Sold | BMFBovespa | Hydrated ethanol | 31/Jan/11 | 758.912 | (4 | ) | ||||||||||
| 758.912 | (4 | ) | |||||||||||||||
| Call | Sold | NYBOT/OTC | #11 | 01/Mar/11 | 3.022 | (13.173 | ) | ||||||||||
| Call | Sold | NYBOT | #11 | 01/Mar/11 | 451 | (2.513 | ) | ||||||||||
| Call | Sold | NYBOT | #11 | 01/Mar/11 | 160 | (865 | ) | ||||||||||
| Call | Sold | NYBOT/OTC | #11 | 01/Oct/11 | 1.711 | (5.293 | ) | ||||||||||
| Call | Sold | NYBOT/OTC | #11 | 01/Oct/11 | 2.390 | (6.531 | ) | ||||||||||
| 7.734 | (28.374 | ) | |||||||||||||||
| Put | Purchased | NYBOT/OTC | #11 | 01/Oct/11 | 1.677 | 1.000 | |||||||||||
| Put | Purchased | NYBOT/OTC | #11 | 01/Oct/11 | 2.316 | 1.466 | |||||||||||
| 3.993 | 2.466 | ||||||||||||||||
| Subtotal derivative financial instruments not designated under hedge accounting | 507.807 | (18.126 | ) | ||||||||||||||
| Total price risk related derivatives | (256.680 | ) | (183.400 | ) | |||||||||||||
25
COSAN LIMITED
Notes to the condensed consolidated financial statements (Continued)
(In thousands of U.S. dollars, unless otherwise stated)
(Unaudited)
14. Risk management and financial instruments (continued)
| c) | Foreign exchange risk |
This arises from the possibility of fluctuations in the exchange rates of the foreign currencies used by the Company for the export revenues of products, imports, debt cash flow and other assets and liabilities denominated in a foreign currency. The Company uses derivative transactions to manage the risks of cash flow coming from the export revenues denominated in U.S. dollars, net of other cash flows denominated in foreign currency. The table below demonstrates the consolidated positions open as of December 31, 2010 of derivatives used to hedge exchange rates:
| Foreing exchange risk: derivatives outstanding as of December 31, 2010 | |||||||||||||
| Derivative | Purchased / Sold | Market | Contract | Maturity | Notional | Fair value | |||||||
| US$ (thousand) | US$ (thousand) | ||||||||||||
| Derivative financial instruments designated as cash flow hedge. | |||||||||||||
| Forward | Sold | OTC/Cetip | NDF | January 3, 2011 | 53,691 | 8,688 | |||||||
| Forward | Sold | OTC/Cetip | NDF | April 1, 2011 | 111,196 | 9,104 | |||||||
| Forward | Sold | OTC/Cetip | NDF | May 31, 2011 | 84,792 | 12,027 | |||||||
| Forward | Sold | OTC/Cetip | NDF | July 1, 2011 | 59,597 | 7,134 | |||||||
| Forward | Sold | OTC/Cetip | NDF | August 1, 2011 | 62,267 | 9,224 | |||||||
| Forward | Sold | OTC/Cetip | NDF | October 3, 2011 | 156,860 | 20,715 | |||||||
| Sub-total designated as cash flow hedge | 528,403 | 66,892 | |||||||||||
| Derivative financial instruments not designated under hedge accounting | |||||||||||||
| Future | Sold | BMFBovespa | Commercial U.S. dollar rate | January 3, 2011 | 228,604 | 1,639 | |||||||
| Future | Sold | BMFBovespa | Commercial U.S. dollar rate | February 1, 2011 | 83,526 | 809 | |||||||
| Sub-total Future Sold | 312,130 | 2,448 | |||||||||||
| Future | Purchased | BMFBovespa | Commercial U.S. dollar rate | January 3, 2011 | (157,821) | (1,126) | |||||||
| Sub-total Future Purchased | (157,821) | (1,126) | |||||||||||
26
COSAN LIMITED
Notes to the condensed consolidated financial statements (Continued)
(In thousands of U.S. dollars, unless otherwise stated)
(Unaudited)
| 14. | Risk management and financial instruments (continued) |
| c) | Foreign exchange risk (Continued) |
Foreign exchange risk: derivatives outstanding as of December 31, 2010 | ||||||||||||||||
| Derivative | Purchased / Sold | Market | Contract | Maturity | Notional | Fair value | ||||||||||
| Forward | Purchased | OTC | NDF (Offshore) | February 2, 2011 | 6,352 | (140 | ) | |||||||||
| Forward | Purchased | OTC | NDF (Offshore) | May 2, 2011 | 6,470 | (138 | ) | |||||||||
| Forward | Purchased | OTC | NDF (Offshore) | August 2, 2011 | 6,610 | (136 | ) | |||||||||
| Forward | Purchased | OTC | NDF (Offshore) | November 1, 2011 | 6,749 | (153 | ) | |||||||||
| Forward | Purchased | OTC | NDF (Offshore) | February 1, 2012 | 6,895 | (190 | ) | |||||||||
| Forward | Purchased | OTC | NDF (Offshore) | May 2, 2012 | 7,035 | (188 | ) | |||||||||
| Forward | Purchased | OTC | NDF (Offshore) | August 1, 2012 | 7,189 | (198 | ) | |||||||||
| Forward | Purchased | OTC | NDF (Offshore) | October 30, 2012 | 7,345 | (212 | ) | |||||||||
| Forward | Purchased | OTC | NDF (Offshore) | January 31, 2013 | 7,505 | (215 | ) | |||||||||
| Forward | Purchased | OTC | NDF (Offshore) | April 30, 2013 | 7,646 | (195 | ) | |||||||||
| Forward | Purchased | OTC | NDF (Offshore) | July 31, 2013 | 7,800 | (181 | ) | |||||||||
| Forward | Purchased | OTC | NDF (Offshore) | October 31, 2013 | 7,956 | (169 | ) | |||||||||
| Forward | Purchased | OTC | NDF (Offshore) | January 31, 2014 | 8,115 | (191 | ) | |||||||||
| Forward | Purchased | OTC | NDF (Offshore) | April 29, 2014 | 8,248 | (278 | ) | |||||||||
| Forward | Purchased | OTC | NDF (Offshore) | July 31, 2014 | 8,404 | (379 | ) | |||||||||
| Forward | Purchased | OTC | NDF (Offshore) | October 31, 2014 | 8,559 | (478 | ) | |||||||||
| Forward | Purchased | OTC | NDF (Offshore) | February 2, 2015 | 8,700 | (551 | ) | |||||||||
| Forward | Purchased | OTC | NDF (Offshore) | April 29, 2015 | 8,838 | (598 | ) | |||||||||
| Forward | Purchased | OTC | NDF (Offshore) | July 31, 2015 | 9,004 | (660 | ) | |||||||||
| Forward | Purchased | OTC | NDF (Offshore) | October 30, 2015 | 9,155 | (710 | ) | |||||||||
| Sub-total Forward Purchased | 154,575 | (5,960 | ) | |||||||||||||
| Commercial U.S. dollar | ||||||||||||||||
| Put Offshore | Purchased | OTC | rate | February 11, 2011 | 25,677 | 1,776 | ||||||||||
| Commercial U.S. dollar | ||||||||||||||||
| Put Offshore | Purchased | OTC | rate | February 11, 2011 | 10,035 | 1,179 | ||||||||||
| Sub-total Put Purchased | 35,711 | 2,955 | ||||||||||||||
| Total de Foreign exchange derivatives designated for exportation | 872,999 | 65,209 | ||||||||||||||
| Swap | Purchased | OTC/Cetip | U.S. dollar/DI | 193,268 | 22,032 | |||||||||||
| Swap | Sold | OTC/Cetip | U.S. dollar/DI | (193,268 | ) | (22,032 | ) | |||||||||
| Total Foreing exchange | 872,999 | 65,209 | ||||||||||||||
27
COSAN LIMITED
Notes to the condensed consolidated financial statements (Continued)
(In thousands of U.S. dollars, unless otherwise stated)
(Unaudited)
| 14. | Risk management and financial instruments (continued) |
| c) | Foreign exchange risk (Continued) |
On December 31, 2010 and March 31, 2010, the Company had the following net exposure to the variation of U.S. dollar assets and liabilities denominated in U.S. dollars
December 31, 2010 | March 31, 2010 | |||||||
| Amounts pending foreign exchange closing | 9,666 | 71,732 | ||||||
| Overnight | 10,161 | 28,338 | ||||||
| Trade notes receivable - foreign | 57,704 | 83,467 | ||||||
| Senior Notes due in 2014 | (363,300 | ) | (354,433 | ) | ||||
| Senior Notes due in 2017 | (412,160 | ) | (405,258 | ) | ||||
| Perpetual bonds | (759,265 | ) | (455,820 | ) | ||||
| Foreign currency-denominated loans | (227,342 | ) | (206,072 | ) | ||||
| Export pre-payments | (435,451 | ) | (547,230 | ) | ||||
| Restricted cash | 165,796 | 25,251 | ||||||
| Exchange exposure | (1,954,191 | ) | (1,760,025 | ) | ||||
d) hedge accounting effects
The Company formally designated its transactions subject to hedge accounting for cash flow hedges from sugar VHP (raw material) export revenue, documenting: (i) the relationship of the hedge, (ii) the Company’s purpose for taking the hedge and its risk management strategy, (iii) identification of the financial instrument, (iv) the transaction or item covered, (v) the nature of the risk being hedged, (vi) a description of the hedging relationship (vii) the demonstration of correlation between the hedge and the object of coverage, and (viii) the prospective analysis of hedge effectiveness. The Company has designated derivative financial instruments of Sugar # 11 (NYBOT or OTC) to cover the risk of price and Non-Deliverable Forwards (NDF) to cover exchange rate risk, as demonstrated in topics (b) and (c) of this Note.
The Company records gains and losses deemed effective for purposes of hedge accounting to a specific account in shareholders´ equity (“other comprehensive income”), until the object of coverage (hedged item) affects the profit and loss.
28
COSAN LIMITED
Notes to the condensed consolidated financial statements (Continued)
(In thousands of U.S. dollars, unless otherwise stated)
(Unaudited)
| 14. | Risk management and financial instruments (continued) |
d) hedge accounting effects (Continued)
| Expected period to affect P&L | ||||||||||||||
| Derivative | Market | Risk | 2010/2011 | 2011/2012 | Total | |||||||||
| Future | OTC/ NYBOT | #11 | (56,790 | ) | (221,363 | ) | (278,153 | ) | ||||||
| NDF | OTC/ CETIP | USD | 5,693 | 53,896 | 59,589 | |||||||||
| (51,097 | ) | (167,467 | ) | (218,564 | ) | |||||||||
| (-) Deferred income taxes | 17,374 | 56,939 | 74,313 | |||||||||||
| Shareholders' equity effect | (33,723 | ) | (110,528 | ) | (144,251 | ) | ||||||||
The detail of the movement of the cash flow hedge gain or loss in other comprehensive income is as follows:
| Cash flow hedges | ||||
| Balance at March 31, 2010 | - | |||
| Gain/(losses) of cash flow hedges for the period | ||||
| Commodities future and swap contracts | (342,540 | ) | ||
| Currency forward contracts | 73,847 | |||
| Reclassification adjustments for losses included in the income statement (net sales) | 50,129 | |||
| Total before tax effect | (218,564 | ) | ||
| Tax effect on gain/(losses) of cash flow hedges for the period – 34% | 74,313 | |||
| Balance at December 31, 2010 | (144,251 | ) | ||
During the nine-month period ended December 31, 2010, the Company recorded the amount of $8,967 on results for operations due to hedged items that would no longer qualify to be designated under hedge accounting. Also, the Company recorded the amount of $219 related to the gains and losses of the hedges’ ineffectiveness during the nine-month period ended December 31, 2010.
29
COSAN LIMITED
Notes to the condensed consolidated financial statements (Continued)
(In thousands of U.S. dollars, unless otherwise stated)
(Unaudited)
| 14. | Risk management and financial instruments (Continued) |
| e) | Interest rate risk |
The Company monitors fluctuations of the interest rates related to certain loan contracts, mainly those with Libor interest rate risk, and in the event of increased volatility of such rates, it may engage in transactions with derivatives so as to minimize such risks. At December 31, 2010, the Company presented the following net balance sheet exposure related to interest rate risk:
| Interest rate risk: outstanding interest rate swap derivatives on December 31, 2010 | |||||||||||||||||||
| Derivative | Purchased/sold | Market | Contract | Number of Contract | Average price | Notional | Fair value | ||||||||||||
| Swap | Purchased | OCT/Cetip | Fix/Libor 3 month | 1 | 1.199%/libor 3 Month | 69,192 | (423 | ) | |||||||||||
| Swap | Purchased | OCT/Cetip | Fix/Libor 3 month | 1 | 1.199%/libor 3 Month | 138,382 | (846 | ) | |||||||||||
| 207,574 | (1,269 | ) | |||||||||||||||||
| f) | Credit risk |
A significant portion of sales made by the Company is to a select group of best-in-class counterparts (i.e. trading companies, fuel distribution companies and large supermarket chains).
Credit risk is managed through specific rules of client acceptance including credit ratings and limits for customer exposure, including the requirement of a letter of credit from major banks and obtaining actual warranties on given credit, when applicable. Management believes that the risk of credit is covered by the allowance for doubtful accounts.
The Company buys and sells commodity derivatives in futures and options markets on the New York Board of Trade (NYBOT) and the London International Financial Futures and Options Exchange (LIFFE), as well as in the over-the-counter (OTC) market with selected counterparties. The Company buys and sells foreign exchange derivatives on BM&FBovespa and OTC contracts registered with CETIP (OTC clearing house) with banks Goldman Sachs & Co, Banco Barclays S.A., BNP Paribas Commodity Futures Ltd, Newedge LLC, Macquarie Bank Ltd, ADM Investors Services International Limited (Hencorp), Prudential Bache Commodities LLC, Natixis Commodity Markets Ltd, Espirito Santo Investmento do Brasil S.A., Deutsche Bank S.A. – Banco Alemão, Banco Bradesco S.A., Banco JP Morgan S.A., Banco Standard de Investimentos S.A., Banco Morgan Stanley Witter S.A . and Banco BTG Pactual S.A.
30
COSAN LIMITED
Notes to the condensed consolidated financial statements (Continued)
(In thousands of U.S. dollars, unless otherwise stated)
(Unaudited)
| 14. | Risk management and financial instruments (Continued) |
| f) | Credit risk (Continued) |
Guarantee margins – The Company’s derivative operations on commodity exchanges (NYBOT, LIFFE and BM&FBovespa) require an initial guarantee margin. The brokers with which the Company operates on these commodity exchanges offer credit limits for these margins. As of December 30, 2010, the total credit limit used as initial margin was $83,227 ($38,543 as of March 31, 2010). As a requirement to trade in BM&FBovespa, the Company posted on December 31, 2010, the amount of $19,061 ($46,627 as of March 31, 2010) as guarantee in the form of a settlement bond issued by a first-class banking institution. Over-the-counter derivative transactions of the Company are exempt from margin guarantees.
| g) | Debt acceleration risk |
As of December 31, 2010 and March 31, 2010, the Company was a party to loan and financing agreements with covenants generally applicable to these operations, including requirements related to cash generation, debt to equity ratio and others. These covenants are being fully complied with by the Company and do not place any restrictions on its operations as a going-concern.
| 15. | Fair value measurements |
Effective May 1, 2008, Cosan adopted ASC 820, Fair Value Measurements (SFAS 157), for all financial instruments and non-financial instruments accounted for at fair value on a recurring basis. ASC 820 establishes a new framework for measuring fair value and expands related disclosures. Broadly, the ASC 820 framework requires fair value to be determined based on the exchange price that would be received for an asset or paid to transfer a liability (an exit price) in the principal or most advantageous market for the asset or liability in an orderly transaction between market participants. ASC 820 establishes market or observable inputs as the preferred source of values, followed by assumptions based on hypothetical transactions in the absence of market inputs.
31
COSAN LIMITED
Notes to the condensed consolidated financial statements (Continued)
(In thousands of U.S. dollars, unless otherwise stated)
(Unaudited)
| 16. | Fair value measurements (continued) |
The valuation techniques required by ASC 820 are based upon observable and unobservable inputs. Observable inputs reflect market data obtained from independent sources, while unobservable inputs reflect market assumptions. These two types of inputs create the following fair value hierarchy:
Level 1 - Quoted prices for identical instruments in active markets.
Level 2 - Quoted prices for similar instruments in active markets; quoted prices for identical or similar instruments in markets that are not active; and model-derived valuations whose inputs are observable or whose significant value drivers are observable.
Level 3 - Significant inputs to the valuation model are unobservable.
The following section describes the valuation methodologies Cosan uses to measure different financial instruments at fair value.
Derivatives
Cosan uses closing prices for derivatives included in Level 1, which are traded either on exchanges or liquid over-the-counter markets.
The remainder of the derivatives portfolio is valued using internal models, most of which are primarily based on market observable inputs including interest rate curves and both forward and spot prices for currencies and commodities. Derivative assets
and liabilities included in Level 2 primarily represent interest rate swaps, foreign currency swaps and commodity forward contracts.
The following table presents our assets and liabilities measured at fair value on a recurring basis as of December 31, 2010.
| Fair value measurements | Level 1 | Level 2 | Total | |||||||||
| Derivatives | (126,028 | ) | 6,568 | (119,460 | ) | |||||||
| Assets | 108,032 | |||||||||||
| Liabilities | (227,492 | ) | ||||||||||
| Total | (119,460 | ) | ||||||||||
32
COSAN LIMITED
Notes to the condensed consolidated financial statements (Continued)
(In thousands of U.S. dollars, unless otherwise stated)
(Unaudited)
| 16. | Segment information |
a. Segment information
The following information about segments is based upon information used by Cosan’s senior management to assess the performance of operating segments and to decide on the allocation of resources. Cosan’s operating and reportable segments are business units in Brazil that target different industry segments. Each reportable segment is managed separately because of the need to specifically address customer needs in these different industries. The operations of these segments are based solely in Brazil.
The Company has three operating segments: Sugar and Ethanol (“S&E”), Fuel Distribution and Lubricants (“CCL”), and Sugar Logistics (“Rumo”).
The S&E segment produces and sells a broad variety of sugar and ethanol products.
The sugar products include raw (also known as very high polarization - VHP sugar), organic, crystal and refined sugars, which are sold to a wide range of customers in Brazil and abroad. Cosan exports the majority of the sugar produced through international commodity trading companies. Cosan’s domestic customers include wholesale distributors, food manufacturers and retail supermarkets, through which it sells its “Da Barra” and “União” branded products. The ethanol products include fuel ethanol and industrial ethanol. Cosan’s principal fuel ethanol products are hydrous and anhydrous. Hydrous ethanol is used as an automotive fuel and anhydrous (which has a lower water content than hydrous ethanol) is used as an additive in ga soline. The fuel ethanol products are mainly sold in the domestic market by fuel distribution companies. Consumption of hydrous ethanol in Brazil is increasing as a result of the introduction of flex fuel vehicles that can run on either gasoline or ethanol (or a combination of both). In addition, the S&E segment sells liquid and gel ethanol products used mainly in the production of paint, cosmetics and alcoholic beverages for industrial clients in various sectors. Also, the S&E segment includes the co-generation activities and most of the corporate activities.
The CCL segment is engaged in the distribution in Brazil of fuel products, derived from petroleum or ethanol, and lubricants as well as the operation of convenience stores.
The network to which the fuel distribution segment distributes such products is comprised of approximately 1,700 fuel stations.
The Rumo segment provides logistics services for the transport, storage and port lifting of sugar for both the S&E segment and third parties.
33
COSAN LIMITED
Notes to the condensed consolidated financial statements (Continued)
(In thousands of U.S. dollars, unless otherwise stated)
(Unaudited)
| 16. | Segment information (Continued) |
a. Segment information (Continued)
*The accounting policies underlying the financial information provided for the segments are based on Brazilian GAAP. We evaluate segment performance based on information generated from the statutory accounting records.
Segment profit and loss and selected balance sheet data under Brazilian GAAP is as follows:
| December 31, 2010 | ||||||||||||||||||||
| S&E | CCL | RUMO | Adjustment/ elimination | Consolidated | ||||||||||||||||
| Brazilian GAAP | US GAAP | |||||||||||||||||||
| Balance sheet: | ||||||||||||||||||||
| Property, plant & equipment (PP&E) | 3,076,888 | 235,627 | 392,876 | 1,020,083 | 4,725,474 | |||||||||||||||
| Goodwill and Intangible assets | 861,051 | 858,060 | 44,213 | 321,366 | 2,084,690 | |||||||||||||||
| Loans, net of cash and cash equivalents | (3,292,443 | ) | (276,906 | ) | (3,985 | ) | 28,864 | (3,544,470 | ) | |||||||||||
| Others assets (liabilities) | 2,518,543 | 349,950 | 14,467 | (2,110,167 | ) | 772,793 | ||||||||||||||
| Total net assets | 3,164,039 | 1,166,731 | 447,571 | (739,854 | ) | 4,038,487 | ||||||||||||||
| Income statements (9 months) | ||||||||||||||||||||
| Net Sales | 2,700,275 | 5,087,365 | 208,236 | (265,896 | ) | 7,729,980 | ||||||||||||||
| Gross profit | 605,232 | 362,451 | 66,202 | (88,999 | ) | 944,886 | ||||||||||||||
| Selling general and administrative expenses | (412,335 | ) | (230,643 | ) | (11,843 | ) | (16,096 | ) | (670,917 | ) | ||||||||||
| Operating income | 192,897 | 131,808 | 54,359 | (105,095 | ) | 273,969 | ||||||||||||||
| Other income (expense) | 94,081 | 8,639 | 4,997 | (125,065 | ) | (17,348 | ) | |||||||||||||
| Other selected data: | ||||||||||||||||||||
| Additions to PP&E (Capex) | 647,701 | 56,486 | 224,914 | - | 929,101 | |||||||||||||||
| Depreciation and amortization | 380,027 | 21,242 | 8,115 | 112,045 | 521,429 | |||||||||||||||
34
COSAN LIMITED
Notes to the condensed consolidated financial statements (Continued)
(In thousands of U.S. dollars, unless otherwise stated)
(Unaudited)
| 16. | Segment information (Continued) |
a. Segment information (Continued)
| March 31, 2010 | ||||||||||||||||||||
| S&E | CCL | RUMO | Adjustment/ elimination | Consolidated | ||||||||||||||||
| Brazilian GAAP | US GAAP | |||||||||||||||||||
| Balance sheet: | ||||||||||||||||||||
| Property, plant & equipment (PP&E) | 2,775,752 | 199,983 | 165,094 | 1,005,670 | 4,146,499 | |||||||||||||||
| Goodwill and Intangible assets | 735,198 | 774,716 | 38,824 | 415,596 | 1,964,334 | |||||||||||||||
| Loans, net of cash and cash equivalents | (2,443,354 | ) | (249,839 | ) | (59,799 | ) | 59,939 | (2,693,053 | ) | |||||||||||
| Others assets (liabilities) | 2,113,306 | 342,720 | 7,696 | (2,198,446 | ) | 265,276 | ||||||||||||||
| Total net assets | 3,180,902 | 1,067,580 | 151,815 | (717,241 | ) | 3,683,056 | ||||||||||||||
| December 31, 2009 | ||||||||||||||||||||
| S&E | CCL | RUMO | Adjustment/ elimination | Consolidated | ||||||||||||||||
| Brazilian GAAP | US GAAP | |||||||||||||||||||
| Income statements (9 months) | ||||||||||||||||||||
| Net sales | 1,888,554 | 4,004,480 | 62,516 | (110,081 | ) | 5,845,469 | ||||||||||||||
| Gross profit | 404,958 | 298,685 | 15,403 | (55,774 | ) | 663,271 | ||||||||||||||
| Selling, general and administrative expenses | (320,130 | ) | (186,328 | ) | (6,528 | ) | (9,566 | ) | (522,553 | ) | ||||||||||
| Operating income | 84,829 | 112,357 | 8,874 | (65,342 | ) | 140,718 | ||||||||||||||
| Other income (expense) | 116,759 | 50,660 | (12,647 | ) | (6,340 | ) | 148,432 | |||||||||||||
| Other selected data: | ||||||||||||||||||||
| Additions to PP&E (Capex) | 654,879 | 22,808 | 406 | - | 678,093 | |||||||||||||||
| Depreciation and amortization | 232,592 | 14,196 | 5,674 | 128,329 | 380,791 | |||||||||||||||
35
COSAN LIMITED
Notes to the condensed consolidated financial statements (Continued)
(In thousands of U.S. dollars, unless otherwise stated)
(Unaudited)
16. Segment information (Continued)
| b. | Detailed net sales per segment |
| December 31, 2010 | December 31, 2009 | |||||||
| S&E (Brazilian GAAP) | ||||||||
| Sugar | 1,642,591 | 1,145,897 | ||||||
| Ethanol | 880,202 | 607,054 | ||||||
| Cogeneration | 109,107 | 45,969 | ||||||
| Other | 68,375 | 89,634 | ||||||
| CCL (Brazilian GAAP) | 2,700,275 | ,888,554 | ||||||
| Fuels | 4,707,665 | 3,728,550 | ||||||
| Lubricants | 351,406 | 246,487 | ||||||
| Other | 28,294 | 29,442 | ||||||
| Rumo (Brazilian GAAP) | 5,087,365 | 4,004,480 | ||||||
| Port lifting | 58,904 | 61,082 | ||||||
| Logistics | 142,862 | 1,432 | ||||||
| Other | 6,470 | - | ||||||
| 208,236 | 62,514 | |||||||
| Adjustments / eliminations | (265,896 | ) | (110,079 | ) | ||||
| Total (US GAAP) | 7,729,980 | 5,845,469 | ||||||
c. Net sales by region
The percentage of net sales by geographic area for the nine-month periods ended December 31, 2010 and 2009 are as follows:
| December 31, 2010 | December 31, 2009 | |||||||
| Sales by geographic area | ||||||||
| Brazil | 67.65% | 80.14% | ||||||
| Europe | 26.45% | 13.33% | ||||||
| Middle east and Asia | 2.51% | 2.06% | ||||||
| North America | 1.01% | 3.43% | ||||||
| Latin American (Except Brazil) | 0.57% | 0.44% | ||||||
| Others | 1.81% | 0.60% | ||||||
| Total | 100.00% | 100.00% | ||||||
36
COSAN LIMITED
Notes to the condensed consolidated financial statements (Continued)
(In thousands of U.S. dollars, unless otherwise stated)
(Unaudited)
| 16. | Segment information (Continued) |
d. Concentration of clients
S&E
There are several clients in this segment, one of which represents more than 10% of the segment net sales -- the SUCDEN Group (16.1% for the nine-month period ended December 31, 2010 and 21.3% for the nine-month period ended December 31, 2009).
CCL
In this segment there are no clients that represent more than 10% of the net sales for the nine-month period ended December 1, 2010 and 2009.
Rumo
For the nine-month period ended December 31, 2010, 55.3% of the segment net sales were generated from sales to the S&E segment (27.7% for the nine-month period ended December 31, 2009). There are two other customers which represented more than 10% of the net sales for nine-month period ended December 31, 2010 and 2009 of this segment. SUCDEN Group accounted for 7.4% of segment sales for the nine-month period ended December 31, 2010 (14.4% for the nine-month period ended December 31, 2009) and the ED&F Man Group accounted for 4.3% of segment sales for the nine-month period ended December 31, 2010.
| 17. | Subsequent events |
On January 11, 2011, Cosan entered into a binding memorandum of understanding with the shareholders of Usina Zanin Açúcar e Álcool Ltda. (“Zanin”), subject to an exclusivity period of 45 days, aiming to purchase the total outstanding equity interests of Zanin for the amount of R$142.0 million (“Transaction”), to be funded with available cash. In addition, Cosan will assume debts amounting to R$236.6 million. This Transaction will include Zanin assets related to the industrial and agricultural activities with annual crushing capacity of approximately 2.6 million tons of sugarcane and a greenfield project in the city of Prata, State of Minas Gerais.
The formation of this Transaction is subject to the satisfaction of some precedent conditions such as the successful renegotiation of the financial liabilities with banks and the negotiation of the final contracts.
37
Cosan S.A. Indústria e Comércio
Condensed Consolidated Financial Statements
For the nine-month periods ended December 31, 2010 and 2009
COSAN S.A. INDÚSTRIA E COMÉRCIO
CONDENSED CONSOLIDATED FINANCIAL STATEMENTS
CONTENTS
| Report of independent registered public accounting firm | 1 |
| Condensed consolidated balance sheets | 2 |
| Condensed consolidated statements of operations | 4 |
Condensed consolidated statement of shareholders’ equity and comprehensive income | 5 |
| Condensed consolidated statements of cash flows | 6 |
| Notes to the condensed consolidated financial statements | 7 |
Report of independent registered public accounting firm
To the Board of Directors and Shareholders of
Cosan S.A. Indústria e Comércio
We have reviewed the condensed consolidated balance sheet of Cosan S.A. Indústria e Comércio and subsidiaries as of December 31, 2010, the related condensed consolidated statements of operations and cash flows for the nine-month periods ended December 31, 2010 and 2009 and the condensed consolidated statement of shareholders’ equity and comprehensive income for the nine-month period ended December 31, 2010. These financial statements are the responsibility of the Company's management.
We conducted our review in accordance with the standards of the Public Company Accounting Oversight Board (United States). A review of interim financial information consists principally of applying analytical procedures and making inquiries of persons responsible for financial and accounting matters. It is substantially less in scope than an audit conducted in accordance with the standards of the Public Company Accounting Oversight Board, the objective of which is the expression of an opinion regarding the financial statements taken as whole. Accordingly, we do not express such an opinion.
Based on our review, we are not aware of any material modifications that should be made to the condensed consolidated financial statements referred to above for them to be in conformity with U.S. generally accepted accounting principles.
We have previously audited, in accordance with the standards of the Public Company Accounting Oversight Board (United States), the consolidated balance sheet of Cosan S.A. Indústria e Comércio and subsidiaries as of March 31, 2010, and the related consolidated statements of operations, shareholders’ equity and cash flows for the year then ended not presented herein and in our report dated June 10, 2010, we expressed an unqualified opinion on those consolidated financial statements. In our opinion, the information set forth in the accompanying condensed consolidated balance sheet as of March 31, 2010, is fairly stated, in all material respects, in relation to the consolidated balance sheet from which it has been derived.
São Paulo, Brazil
February 09, 2011
ERNST & YOUNG TERCO
Auditores Independentes S.S.
CRC 2SP015199/O-8
Luiz Carlos Nannini
Accountant CRC 1SP171638/O-7
1
COSAN S.A. INDÚSTRIA E COMÉRCIO
Condensed consolidated balance sheets
December 31, 2010 and March 31, 2010
(In thousands of U.S. dollars, except share data)
(Unaudited) December 31, | March 31, | |||||||
| 2010 | 2010 | |||||||
| Assets | ||||||||
| Current assets: | ||||||||
| Cash and cash equivalents | 682,320 | 605,483 | ||||||
| Restricted cash | 165,796 | 25,251 | ||||||
| Derivative financial instruments | 108,032 | 129,456 | ||||||
| Trade accounts receivable, less allowances: December 31, 2010 – $28,964; March 31, 2010 – $32,144 | 394,582 | 430,328 | ||||||
| Inventories | 1,206,343 | 587,720 | ||||||
| Advances to suppliers | 161,202 | 132,258 | ||||||
| Recoverable taxes | 240,725 | 184,090 | ||||||
| Other current assets | 74,023 | 48,303 | ||||||
| 3,033,023 | 2,142,889 | |||||||
| Non-current assets: | ||||||||
| Property, plant, and equipment, net | 4,584,208 | 3,997,815 | ||||||
| Goodwill | 1,420,186 | 1,289,625 | ||||||
| Intangible assets, net | 590,465 | 600,573 | ||||||
| Accounts receivable from federal government | 205,323 | 187,385 | ||||||
| Judicial deposits | 108,558 | 94,083 | ||||||
| Other non-current assets | 554,403 | 423,447 | ||||||
| 7,463,143 | 6,592,928 | |||||||
| Total assets | 10,496,166 | 8,735,817 | ||||||
See accompanying notes to condensed consolidated financial statements.
2
(Unaudited) December 31, | March 31, | |||||||
| 2010 | 2010 | |||||||
| Liabilities and shareholders’ equity | ||||||||
| Current liabilities: | ||||||||
| Trade accounts payable | 452,744 | 319,707 | ||||||
| Taxes payable | 131,307 | 121,203 | ||||||
| Salaries payable | 105,407 | 79,497 | ||||||
| Current portion of long-term debt | 672,983 | 445,593 | ||||||
| Derivative financial instruments | 227,492 | 43,067 | ||||||
| Dividends payable | 4,224 | 65,451 | ||||||
| Other current liabilities | 155,119 | 111,971 | ||||||
| 1,749,276 | 1,186,489 | |||||||
| Long-term liabilities: | ||||||||
| Long-term debt | 3,537,602 | 2,842,953 | ||||||
| Estimated liability for legal proceedings and labor claims | 335,957 | 294,605 | ||||||
| Taxes payable | 425,212 | 381,805 | ||||||
| Deferred income taxes | 416,744 | 408,832 | ||||||
| Other long-term liabilities | 164,588 | 154,728 | ||||||
| 4,880,103 | 4,082,923 | |||||||
| Shareholders’ equity | ||||||||
| Cosan shareholders’ equity: | ||||||||
| Common stock, no par value. Authorized 407,101,853 shares; issued and outstanding 407,101,853 as of December 31, 2010 and 406,560,317 shares as of March 31, 2010 | 2,425,641 | 2,420,018 | ||||||
| Treasury stock | (10,948 | ) | (1,979 | ) | ||||
| Additional paid-in capital | 504,796 | 390,600 | ||||||
| Accumulated other comprehensive income | 438,204 | 343,136 | ||||||
| Retained earnings | 349,478 | 281,238 | ||||||
| Equity attributable to shareholders of Cosan | 3,707,171 | 3,433,013 | ||||||
| Equity attributable to noncontrolling interests | 159,616 | 33,392 | ||||||
| Total shareholders’ equity | 3,866,787 | 3,466,405 | ||||||
| Total liabilities and shareholders' equity | 10,496,166 | 8,735,817 | ||||||
See accompanying notes to condensed consolidated financial statements.
3
COSAN S.A. INDÚSTRIA E COMÉRCIO
Condensed consolidated statements of operations
Nine-month period ended December 31, 2010 and 2009
(In thousands of U.S. dollars, except share and per-share data)
(Unaudited)
| December 31, | December 31, | |||||||
| 2010 | 2009 | |||||||
| Net sales | 7,729,980 | 5,845,469 | ||||||
| Cost of goods sold | (6,781,192 | ) | (5,179,260 | ) | ||||
| Gross profit | 948,788 | 666,209 | ||||||
| Selling expenses | (441,685 | ) | (345,159 | ) | ||||
| General and administrative expenses | (227,321 | ) | (175,801 | ) | ||||
| Operating income | 279,782 | 145,249 | ||||||
| Other income (expenses): | ||||||||
| Financial (expense) income, net | (45,614 | ) | 176,107 | |||||
| Gain on tax recovery program | - | 121,554 | ||||||
| Other (expenses) income | (22,995 | ) | 26,882 | |||||
| Income before income taxes and equity loss of affiliates | 211,173 | 469,792 | ||||||
| Income taxes expense | (86,449 | ) | (178,298 | ) | ||||
| Income before equity loss of affiliates | 124,724 | 291,494 | ||||||
| Equity loss of affiliates | (1,264 | ) | (5,413 | ) | ||||
| Net income | 123,460 | 286,081 | ||||||
| Less net (loss) income attributable to noncontrolling interests | (7,741 | ) | 3,075 | |||||
| Net income attributable to Cosan | 115,719 | 289,156 | ||||||
| Per-share amounts attributable to Cosan | ||||||||
| Net income | ||||||||
| Basic | 0.28 | 0.79 | ||||||
| Diluted | 0.28 | 0.78 | ||||||
| Weighted number of shares outstanding | ||||||||
| Basic | 406,849,935 | 365,931,831 | ||||||
| Diluted * | 407,214,304 | 370,136,214 | ||||||
* Adjusted for the effect of dilutive stock options
See accompanying notes to condensed consolidated financial statements.
4
COSAN S.A. INDÚSTRIA E COMÉRCIO
Condensed consolidated statements of shareholders’ equity and comprehensive income
Nine-month period ended December 31, 2010
(In thousands of U.S. dollars, except share data)
(Unaudited)
| Accumulated | ||||||||||||||||||||||||||||||||||||
| Common stock | Treasury stock | Additional | other | Non | Total | |||||||||||||||||||||||||||||||
| paid-in | Retained | comprehensive | controlling | shareholders’ | ||||||||||||||||||||||||||||||||
| shares | amount | shares | amount | capital | earnings | income | interest | equity | ||||||||||||||||||||||||||||
| Balances at March 31, 2010 | 406,560,317 | 2,420,018 | 343,139 | (1,979 | ) | 390,600 | 281,238 | 343,136 | 33,392 | 3,466,405 | ||||||||||||||||||||||||||
| Exercise of stock options | 541,476 | 5,622 | - | - | (3,738 | ) | - | - | - | 1,884 | ||||||||||||||||||||||||||
| Exercise of common stock warrants | 60 | 1 | - | - | - | - | - | - | 1 | |||||||||||||||||||||||||||
| Issuance of common shares of Rumo to non controlling interest | - | - | - | - | 117,543 | - | - | 110,247 | 227,790 | |||||||||||||||||||||||||||
| Proportionate share on stock issuance costs of investee | - | - | - | - | (495 | ) | - | - | (216 | ) | (711 | ) | ||||||||||||||||||||||||
| Share based compensation | - | - | - | - | 886 | - | - | - | 886 | |||||||||||||||||||||||||||
| Dividends | - | - | - | - | - | (47,479 | ) | - | - | (47,479 | ) | |||||||||||||||||||||||||
| Acquisition of treasury shares | - | - | 591,400 | (8,969 | ) | - | - | - | (8,969 | ) | ||||||||||||||||||||||||||
| Net income | - | - | - | - | - | 115,719 | - | 7,741 | 123,460 | |||||||||||||||||||||||||||
| Effective portion of gains/losses on derivative instrument that qualifies as a cash flow hedge | - | - | - | - | - | - | (144,252 | ) | - | (144,252 | ) | |||||||||||||||||||||||||
| Pension Plan | - | - | - | - | - | - | (1,546 | ) | - | (1,546 | ) | |||||||||||||||||||||||||
| Currency translation adjustment | - | - | - | - | - | - | 240,866 | 8,452 | 249,318 | |||||||||||||||||||||||||||
| Total comprehensive income | 226,980 | |||||||||||||||||||||||||||||||||||
| Balances at December 31, 2010 | 407,101,853 | 2,425,641 | 934,539 | (10,948 | ) | 504,796 | 349,478 | 438,204 | 159,616 | 3,866,787 | ||||||||||||||||||||||||||
See accompanying notes to condensed consolidated financial statements.
5
COSAN S.A. INDÚSTRIA E COMÉRCIO
Condensed consolidated statements of cash flows
Nine-month period ended December 31, 2010 and 2009
(In thousands of U.S. dollars)
(Unaudited)
| December 31, | December 31, | |||||||
| 2010 | 2009 | |||||||
| Cash flows from operating activities | ||||||||
| Net income for the year attributable to Cosan | 115,719 | 289,156 | ||||||
| Adjustments to reconcile net income to cash provided by operating activities: | ||||||||
| Depreciation and amortization | 517,528 | 379,497 | ||||||
| Deferred income taxes | 52,443 | 137,220 | ||||||
| Interest, monetary and exchange variation | 51,682 | (264,046 | ) | |||||
| Gain on tax recovery program | - | (121,554 | ) | |||||
| Others | 17,736 | (31,683 | ) | |||||
| Decrease/increase in operating assets and liabilities | ||||||||
| Trade accounts receivable, net | 81,253 | 94,947 | ||||||
| Inventories | (460,808 | ) | (288,984 | ) | ||||
| Recoverable taxes | (38,518 | ) | (5,111 | ) | ||||
| Advances to suppliers | (32,877 | ) | (4,520 | ) | ||||
| Trade accounts payable | 111,009 | 55,264 | ||||||
| Derivative financial instruments | 14,403 | 67,138 | ||||||
| Taxes payable | (10,798 | ) | (59,581 | ) | ||||
| Other assets and liabilities, net | (46,992 | ) | 33,402 | |||||
| Net cash provided by operating activities | 371,780 | 281,145 | ||||||
| Cash flows from investing activities: | ||||||||
| Restricted cash | (165,796 | ) | (92,059 | ) | ||||
| Cash received from sales of noncurrent assets | 12,066 | 69,472 | ||||||
| Acquisition of investment | (9,883 | ) | - | |||||
| Acquisition of property, plant and equipment | (929,101 | ) | (678,093 | ) | ||||
| Others | - | 8,409 | ||||||
| Net cash used in investing activities | (1,092,714 | ) | (692,271 | ) | ||||
| Cash flows from financing activities: | ||||||||
| Related parties | - | (262,340 | ) | |||||
| Proceeds from issuance of common stock | 229,776 | 304,426 | ||||||
| Acquisition of treasury shares | (8,969 | ) | - | |||||
| Additions of long-term debt | 1,348,242 | 1,656,427 | ||||||
| Dividends payments | (115,811 | ) | - | |||||
| Payments of long-term debt | (746,965 | ) | (1,311,464 | ) | ||||
| Net cash provided by financing activities | 706,273 | 387,049 | ||||||
| Effect of exchange rate changes on cash and | ||||||||
| cash equivalents | 91,498 | 209,621 | ||||||
| Net increase in cash and cash equivalents | 76,837 | 185,544 | ||||||
| Cash and cash equivalents at beginning of period | 605,483 | 310,710 | ||||||
| Cash and cash equivalents at end of period | 682,320 | 496,254 | ||||||
| Supplemental cash flow information | ||||||||
| Cash paid during the period for: | ||||||||
| Interest | 181,903 | 146,042 | ||||||
| Income taxes | 16,045 | 2,189 | ||||||
| Non cash transaction: | ||||||||
| Acquisition paid with equity | - | 321,087 | ||||||
See accompanying notes to condensed consolidated financial statements.
6
COSAN S.A. INDÚSTRIA E COMÉRCIO
Notes to the condensed consolidated financial statements
(In thousands of U.S. dollars, unless otherwise stated)
(Unaudited)
| 1. | Operations |
Cosan S.A. Indústria e Comércio and subsidiaries (“Cosan” or “the Company”) is incorporated under the laws of the Federative Republic of Brazil. Cosan shares are traded on the São Paulo Stock Exchange (Bovespa).
Cosan Limited, a company incorporated in Bermuda, is the controlling shareholder of Cosan holding a 62.19% interest therein as of December 31, 2010 (62.27% as of March 31, 2010). The class “A” common shares of Cosan Limited are traded in the New York Stock Exchange (NYSE) and Bovespa.
The companies included in the condensed consolidated financial statements have as their primary activity the production of ethanol and sugar, the marketing and distribution of fuel and lubricants in Brazil, and logistics services in the state of São Paulo, Brazil.
On February 1, 2010, the Company announced that it, along with Royal Dutch Shell (“Shell”), had reached a non-binding memorandum of understanding (“MOU”) to form a joint venture for a combined 50/50 investment. On August 25, 2010 the Company announced the conclusion of the negotiations with Shell and signed a binding MOU along with other arrangements. Cosan will contribute its sugar and ethanol and its distribution assets to the joint venture while Shell will contribute its distribution assets in Brazil. Shell will also make a fixed cash contribution in the amount of $1.6 billion over a 2 year period. The sugar logistics and distribution of lubricants business along with the investment in Radar Propriedades Agrícolas S.A. will not be contributed to the joint venture. On January 4, 2011, the Company received uncondit ional merger clearance from the European Union to form the proposed Joint Venture in Brazil. The two companies will now focus on securing conditions precedent to be met or waived, and detailed integration work before launching the joint venture, expected for the first half of 2011, as announced on August 25, 2010. The Joint Venture is still under analysis by the Brazilian Competition Authority (CADE). During the nine-month period ended December 31, 2010, this association did not generate any accounting records.
7
COSAN S.A. INDÚSTRIA E COMÉRCIO
Notes to the condensed consolidated financial statements
(In thousands of U.S. dollars, unless otherwise stated)
(Unaudited)
8
COSAN S.A. INDÚSTRIA E COMÉRCIO
Notes to the condensed consolidated financial statements (Continued)
(In thousands of U.S. dollars, unless otherwise stated)
(Unaudited)
| 1. | Operations (Continued) |
On July 2, 2010, the indirect subsidiary Novo Rumo Logística S.A. (“Novo Rumo”), entered into a Subscription Agreement with TPG Participações and GIF LOG Participações S.A. (“Investors”) whereby the investors would acquire a 25% equity interest of Rumo Logistica S.A. (“Rumo”), a subsidiary of Novo Rumo. On September 2, 2010, the subscription took place through a capital increase in the amount of $227,790, paid in equal portions by the Investors and the issuance of shares by Rumo. Before the payment the Company held, directly and indirectly, an equity interest of 92.9% in Novo Rumo, which, in turn, held an equity interest of 99.9% in Rumo Logistica S.A. After the contribution, Novo Rumo now holds 75.0% of Rumo’s equity and each of the Investors hold a 12.5% interest. This transac tion was treated as an equity transaction.
| 2. | Presentation of the consolidated financial statements |
| a. | Basis of reporting for interim financial statements |
In the opinion of management, the unaudited condensed consolidated financial statements reflect all adjustments (consisting of normal recurring accruals) considered necessary for a fair presentation of the Company’s results for the periods presented. Interim results for the nine-month period ended December 31, 2010, are not necessarily indicative of the results that may be expected for the fiscal year.
The unaudited condensed consolidated financial statements include the accounts of Cosan and its subsidiaries. All significant intercompany transactions have been eliminated.
These condensed consolidated financial statements should be read in conjunction with Cosan`s annual consolidated financial statements for the fiscal year ended March 31, 2010.
The accounts of Cosan and its subsidiaries are maintained in Brazilian reais, which is the functional currency. The accounts have been translated into U.S. dollars in accordance with Accounting Standards Codification (“ASC”) 830, “Foreign Currency Matters”.
The exchange rate of the Brazilian real (R$) to the US$ was R$1.67=US$ 1.00 at December 31, 2010 and R$1.78=US$1.00 at March 31, 2010.
9
COSAN S.A. INDÚSTRIA E COMÉRCIO
Notes to the condensed consolidated financial statements (Continued)
(In thousands of U.S. dollars, unless otherwise stated)
(Unaudited)
| 2. | Presentation of the consolidated financial statements (Continued) |
| b. | Use of estimates |
The preparation of condensed consolidated financial statements in conformity with U.S. GAAP requires management to make estimates and assumptions that affect the amounts reported in the condensed consolidated financial statements and accompanying notes. Actual results could differ from these estimates. These estimates and assumptions are reviewed and updated regularly to reflect recent experience.
| c. | New Accounting Pronouncements |
In January 2010, the FASB issued ASU 2010-06, Fair Value Measurements and Disclosures (Topic 820): Improving Disclosures about Fair Value Measurements, which will require companies to make new disclosures about recurring or nonrecurring fair value measurements including significant transfers into and out of Level 1 and Level 2 fair value hierarchies and information on purchases, sales, issuance and settlements on a gross basis in the reconciliation of Level 3 fair value measurements. The ASU is effective prospectively for financial statements issued for fiscal years and interim periods beginning after December 15, 2009. The new disclosures about purchases, sales, issuance and settlements on a gross basis in the reconciliation of Level 3 fair value measurements is effective for interim and annual reporting periods beginning after December 15, 2010. The Company expects that the adoption of ASU 2010-06 will not have a material impact on its consolidated financial statements.
10
COSAN S.A. INDÚSTRIA E COMÉRCIO
Notes to the condensed consolidated financial statements (Continued)
(In thousands of U.S. dollars, unless otherwise stated)
(Unaudited)
| 2. | Presentation of the consolidated financial statements (Continued) |
| c. | New Accounting Pronouncements (Continued) |
In December 2010, the FASB issued ASU 2010-28, When to Perform Step 2 of the Goodwill Impairment Test for Reporting Units with Zero or Negative Carrying Amounts, a consensus of the FASB Emerging Issues Task Force (Issue No. 10-A). This ASU modifies Step 1 of the goodwill impairment test under FASB ASC Topic 350, Intangibles-Goodwill and Other, for reporting units with zero or negative carrying amounts to require an entity to perform Step 2 of the goodwill impairment test if it is more likely than not that a goodwill impairment exists. In determining whether it is more likely than not that a goodwill impairment exists, an entity should consider whether there are adverse qualitative factors in determining whether an interim goodwill impairment test between annual test dates is necessary. Th e ASU allows an entity to use either the entity or enterprise valuation premise to determine the carrying amount of a reporting unit. On adoption of the ASU, goodwill impairment that results from this requirement to perform Step 2 of the goodwill impairment test would be recognized as a cumulative effect adjustment to beginning retained earnings in the period of adoption. This ASU is effective for fiscal years, and interim periods within those years, beginning after December 15, 2010. The Company expects that the adoption of ASU 2010-28 will not have a material impact on its consolidated financial statements.
| d. | Derivative financial instruments |
Cosan accounts for derivative financial instruments utilizing ASC 815, Accounting for Derivative Instruments and Hedging Activities, as amended. As part of Cosan’s risk management program, it uses a variety of financial instruments, including commodity futures contracts, forward currency agreements, interest rate and foreign exchange swap contracts and option contracts. Beginning April 1, 2010, Cosan recognized a portion of its derivative instruments as cash flow hedge transactions. The derivative instruments are measured at fair value and the gains or losses resulting from the changes in fair value of the instruments are recorded in financial income or financial expense or other comprehensive income when designated as a cash flow hedge (effective portion only). See note 1 4 for further detail.
11
COSAN S.A. INDÚSTRIA E COMÉRCIO
Notes to the condensed consolidated financial statements (Continued)
(In thousands of U.S. dollars, unless otherwise stated)
(Unaudited)
| 3. | Inventories |
December 31, 2010 | March 31, 2010 | |||||||
| Finished goods: | ||||||||
| Sugar | 349,697 | 52,561 | ||||||
| Ethanol | 300,691 | 31,573 | ||||||
| Lubricants and fuel (Gasoline, Diesel and Ethanol) | 201,254 | 149,613 | ||||||
| 851,642 | 233,747 | |||||||
| Annual maintenance cost of growing crops | 220,475 | 243,709 | ||||||
| Supplies and others | 134,226 | 110,264 | ||||||
| 1,206,343 | 587,720 | |||||||
| 4. | Taxes payable |
December 31, 2010 | March 31, 2010 | |||||||
| ICMS – State VAT | 25,325 | 27,623 | ||||||
| IPI | 22,832 | 3,582 | ||||||
| INSS | 13,932 | 13,414 | ||||||
| PIS | 3,816 | 4,564 | ||||||
| COFINS | 17,571 | 18,010 | ||||||
| Tax Recovery from Brazilian Law No 11.941/09 and MP 470/09 | 398,438 | 373,650 | ||||||
| Income tax and social contribution | 59,000 | 50,471 | ||||||
| Others | 15,605 | 11,694 | ||||||
| 556,519 | 503,008 | |||||||
| Current liabilities | (131,307 | ) | (121,203 | ) | ||||
| Long-term liabilities | 425,212 | 381,805 | ||||||
12
COSAN S.A. INDÚSTRIA E COMÉRCIO
Notes to the condensed consolidated financial statements (Continued)
(In thousands of U.S. dollars, unless otherwise stated)
(Unaudited)
| 5. | Long-term debt |
The Company’s debt is summarized as follows:
Index | Average annual interest rate | December 31, 2010 | March 31, 2010 | ||||||||||
| Resolution No. 2471 (PESA) | IGP-M | 3.9% | 348,890 | 295,291 | |||||||||
| Senior notes due 2014 | US Dollar | 9.5% | 363,300 | 354,433 | |||||||||
| Senior notes due 2017 | US Dollar | 7.0% | 411,589 | 404,589 | |||||||||
| Perpetual notes | US Dollar | 8.3% | 759,154 | 455,304 | |||||||||
| BNDES | TJLP | 3.6% | 974,099 | 520,068 | |||||||||
| Credit notes | DI | 2.1% | 183,516 | 212,660 | |||||||||
| Credit notes | US Dollar | 6.2% | 101,094 | 102,656 | |||||||||
| Export Pre-payments | US Dollar+Libor | 6.3% | 435,451 | 547,230 | |||||||||
| ACC – Export pre-payments | US Dollar | 1.6% | 126,248 | 103,416 | |||||||||
| Others | Various | Various | 507,244 | 292,899 | |||||||||
| 4,210,585 | 3,288,546 | ||||||||||||
| Current portion | (672,983 | ) | (445,593 | ) | |||||||||
| Long-term debt | 3,537,602 | 2,842,953 | |||||||||||
Long-term debt has the following scheduled maturities:
| 2012 | 526,498 | |||
| 2013 | 228,748 | |||
| 2014 | 573,058 | |||
| 2015 | 428,639 | |||
| 2016 and thereafter | 1,780,659 | |||
| 3,537,602 |
Resolution No. 2471 - Special Agricultural Financing Program (Programa Especial de Saneamento de Ativos), or PESA
To extend the repayment period of debts incurred by Brazilian agricultural producers, the Brazilian government passed Law 9.138 followed by Central Bank Resolution 2,471, which, together, formed the PESA program. PESA offered certain agricultural producers with certain types of debt the opportunity to acquire Brazilian treasury bills (“CTNs”) in an effort to restructure their agricultural debt. The face value of the Brazilian treasury bills was the equivalent of the value of the restructured debt and was for a term of 20 years.
13
COSAN S.A. INDÚSTRIA E COMÉRCIO
Notes to the condensed consolidated financial statements (Continued)
(In thousands of U.S. dollars, unless otherwise stated)
(Unaudited)
| 5. | Long-term debt (Continued) |
Resolution No. 2471 - Special Agricultural Financing Program (Programa Especial de Saneamento de Ativos), or PESA (Continued)
The acquisition price was calculated by the present value, discounted at a rate of 12% per year or at the equivalent of 10.4% of its face value. The CTNs were deposited as a guarantee with a financial institution and cannot be renegotiated until the outstanding balance is paid in full. The outstanding balance associated with the principal is adjusted in accordance with the IGP-M until the expiration of the restructuring term, which is also 20 years, at which point the debt will be discharged in exchange for the CTNs. Because the CTNs will have the same face value as the outstanding balance at the end of the term, it will not be necessary to incur additional debt to pay PESA debt.
On July 31, 2003, the Central Bank issued Resolution 3,114, authorizing the reduction of up to five percentage points of PESA related interest rates, effectively lowering the above-mentioned rates to 3%, 4% and 5%, respectively. The CTNs held by Cosan as of December 31, 2010 and March 31, 2010 amounted to $162,836 and $133,039, respectively, and are classified as other non-current assets.
Senior notes due 2014
On August 4, 2009, the indirect subsidiary CCL Finance Limited issued $350,000 of senior notes in the international capital markets. These senior notes, listed on the Luxembourg Stock Exchange, mature in August 2014 and bear interest at a rate of 9.5% per annum, payable semi-annually in February and August of each year, from February of 2010.
Senior notes due 2017
On January 26, 2007, the wholly-owned subsidiary Cosan Finance Limited issued $400,000 of senior notes in the international capital markets. These senior notes, listed on the Luxembourg Stock Exchange, mature in November 2017 and bear interest at a rate of 7% per annum, payable semi-annually. The senior notes are guaranteed by Cosan, and its subsidiary, Cosan Açúcar e Álcool.
14
COSAN S.A. INDÚSTRIA E COMÉRCIO
Notes to the condensed consolidated financial statements (Continued)
(In thousands of U.S. dollars, unless otherwise stated)
(Unaudited)
| 5. | Long-term debt (Continued) |
Perpetual notes
On January 24 and February 10, 2006, Cosan issued perpetual notes which are listed on the Luxembourg Stock Exchange - EURO MTF. These notes bear interest at a rate of 8.25% per year, payable quarterly on May 15, August 15, November 15 and February 15 of each year, beginning May 15, 2006. These notes may, at the discretion of Cosan, be redeemed on any interest payment date subsequent to February 15, 2011. The notes are guaranteed by Cosan and by Cosan S.A. Açúcar e Álcool.
On November 5, 2010 the subsidiary Cosan Overseas Limited issued $300,000 of perpetual notes in the foreign market, in accordance with “Regulation S”. These notes bear interest at a rate of 8.25% per year, payable quarterly.
BNDES
Refers to the financing of cogeneration and logistics projects as well as the financing of the Jataí and Caarapó greenfields (sugar and ethanol mills). The BNDES financing is due from 2012 through 2025.
Credit Notes
The Company executed several credit note agreements with several financial institutions during 2010 which will be paid through export operations during 2012. The credit notes bear interest at rates between 2.1% and 6.2% per annum, payable semi-annually.
Export Pre-payment Notes
During the third quarter of 2009, the Company obtained funds from export pre-payment notes for the total amount of $530,000. The export pre-payment notes are due from 2012 through 2014, and bear interest of Libor plus 6.3%.
15
COSAN S.A. INDÚSTRIA E COMÉRCIO
Notes to the condensed consolidated financial statements (Continued)
(In thousands of U.S. dollars, unless otherwise stated)
(Unaudited)
| 5. | Long-term debt (Continued) |
Covenants
Cosan and its subsidiaries are subject to certain restrictive covenants related to their indebtedness.
At December 31, 2010, Cosan was in compliance with its debt covenants.
| 6. | Related parties |
Assets and liabilities with related parties are summarized as follows:
| Assets | ||||||||
December 31, 2010 | March 31, 2010 | |||||||
| Rezende Barbosa S.A. Administração e Participações | 50,014 | 48,889 | ||||||
| Vertical UK LLP | 7,575 | 8,403 | ||||||
| Others | 216 | 2,377 | ||||||
| 57,805 | 59,669 | |||||||
| Current (*) | (12,183 | ) | (13,958 | ) | ||||
| Noncurrent (*) | 45,622 | 45,711 | ||||||
| Liabilities | ||||||||
December 31, 2010 | March 31, 2010 | |||||||
| Rezende Barbosa S.A. Administração e Participações | 43,356 | - | ||||||
| Logispot Armazéns Gerais S.A. | - | 6,313 | ||||||
| Others | 1,434 | 1,781 | ||||||
| 44,790 | 8,094 | |||||||
| Current (*) | (44,790 | ) | (8,094 | ) | ||||
| Noncurrent | - | - | ||||||
| (*) included in other current and non-current assets or liabilities |
The receivable of $50,014 ($48,889 as of March 31, 2010) with Rezende Barbosa S.A. Administração e Participações is related to credits assumed by Rezende Barbosa, in connection with the acquisition of Cosan Alimentos and intercompany loans.
The amount receivable from the affiliate Vertical UK LLP, refers to ethanol trading, with an average maturity date of 30 days.
16
COSAN S.A. INDÚSTRIA E COMÉRCIO
Notes to the condensed consolidated financial statements (Continued)
(In thousands of U.S. dollars, unless otherwise stated)
(Unaudited)
| 6. | Related parties (Continued) |
The payable of $43,356 with Rezende Barbosa S.A. Administração e Participações is related to the purchase of sugar cane. This amount is presented net of credits assumed by Rezende Barbosa, in connection with the acquisition of Cosan Alimentos and intercompany loans.
The payable to Logispot is related to the remaining payment in connection with the interest acquired, which were settled during the period.
Cosan conducts some of its operations through various ventures and other partnership forms which are principally accounted for using the equity method. The condensed consolidated income statement includes the following amounts resulting from transactions with related parties:
December 31, 2010 | December 31, 2009 | |||||||
| Transactions involving assets | ||||||||
| Sale of products and services to associates | 103,529 | 98,320 | ||||||
| Cash received due to the sale of products, services, and other assets | (109,230 | ) | (109,642 | ) | ||||
| Added through acquisition | - | 73,338 | ||||||
| Transactions involving liabilities | ||||||||
| Purchase of sugar cane from associates | 173,845 | 80,227 | ||||||
| Payment of financial resources, net of funding | - | - | ||||||
| Payments to associates | (139,361 | ) | (52,667 | ) | ||||
| Financial income (expense) | - | (41,573 | ) | |||||
| Payment to Cosan Limited | - | (170,457 | ) | |||||
The purchase and sale of products are carried out at arm’s length and unrealized profit or losses with consolidated companies have been eliminated. Those operations are also carried out at prices and under conditions similar to those existing in the market.
At December 31 and March 31, 2010, Cosan S.A. and its subsidiaries were lessees of approximately 68,000 hectares (unaudited) of affiliated companies’ land and land of its related party Radar Propriedades Agrícolas S.A., which is controlled by another shareholder. Additionally, Cosan and its subsidiary Cosan S.A. Açucar e Álcool purchased a total of 6,003 thousands of tons of sugar cane (unaudited) from Rezende Barbosa during the nine-month period ended December 31, 2010. These operations are carried out under conditions and prices similar to those prevailing in the market, calculated based on sugarcane tons per hectare, valued in accordance with the price established by CONSECANA (São Paulo State Council of Sugarcane, Sugar and Ethanol Producers).
17
COSAN S.A. INDÚSTRIA E COMÉRCIO
Notes to the condensed consolidated financial statements (Continued)
(In thousands of U.S. dollars, unless otherwise stated)
(Unaudited)
| 7. | Estimated liability for legal proceedings and labor claims and commitments |
December 31, 2010 | March 31, 2010 | |||||||
| Tax contingencies | 192,615 | 173,924 | ||||||
| Civil and labor contingencies | 143,342 | 120,681 | ||||||
| 335,957 | 294,605 | |||||||
Cosan and its subsidiaries are parties in various ongoing labor claims, civil and tax proceedings in Brazil arising in the normal course of its business. Respective provisions for contingencies were recorded considering those cases in which the likelihood of loss has been rated as probable. Management believes resolution of these disputes will have no significant effect compared to the estimated amounts accrued.
Judicial deposits recorded by Cosan under other non-current assets, in the balance sheet, amounting to $108,558 at December 31, 2010 ($94,083 at March 31, 2010) have been made for certain of these suits. Judicial deposits are restricted assets of Cosan placed on deposit with the court and held in judicial escrow pending legal resolution of the related legal proceedings.
The major tax contingencies as of December 31, 2010 and March 31, 2010 are described as follows:
December 31, 2010 | March 31,2010 | |||||||
| Compensation with Finsocial | 108,561 | 97,114 | ||||||
| ICMS credits | 43,170 | 33,824 | ||||||
| PIS and Cofins | 15,590 | 11,910 | ||||||
| IPI – Federal VAT | 5,179 | 4,692 | ||||||
| Other | 20,115 | 26,384 | ||||||
| 192,615 | 173,924 | |||||||
The detail of the movement in the estimated liability for legal proceedings and labor claims is as follows:
| Balance at March 31, 2010 | 294,605 | |||
| Provision | 29,081 | |||
| Settlements | (38,006 | ) | ||
| Accrued interest | 29,282 | |||
| Foreign currency translation | 20,995 | |||
| Balance at December 31, 2010 | 335,957 |
18
COSAN S.A. INDÚSTRIA E COMÉRCIO
Notes to the condensed consolidated financial statements (Continued)
(In thousands of U.S. dollars, unless otherwise stated)
(Unaudited)
| 7. | Estimated liability for legal proceedings and labor claims and commitments (Continued) |
In addition to the aforementioned claims, Cosan and its subsidiaries are involved in other contingent liabilities relating to tax, civil and labor claims and environmental matters, which have not been recorded, considering their current stage and the likelihood of unfavorable outcomes rated as possible. These claims are broken down as follows:
December 31, 2010 | March 31, 2010 | |||||||
| Withholding income tax | 115,103 | 102,652 | ||||||
| ICMS – State VAT | 292,042 | 180,988 | ||||||
| IPI - Federal VAT | 264,375 | 246,190 | ||||||
| PIS and COFINS | 89,068 | 80,604 | ||||||
| Civil and labor | 373,097 | 275,403 | ||||||
| INSS and other | 124,917 | 69,842 | ||||||
| 1,258,602 | 955,679 | |||||||
| 8. | Accounts receivable from Federal Government |
The subsidiary Cosan Açúcar e Álcool has several indemnification suits filed against the Federal Government. The suits relate to product prices that did not conform to the reality of the market, which were mandatorily established at the time the sector was under the Government‘s control.
In connection with one of these suits, a final and unappealable decision in the amount of US$149,121 was rendered in September 2006 in favor of Usina de Barra. This has been recorded as a gain in the statement of operations in 2007. Since the recorded amount is substantially composed of interest and monetary restatement, it was recorded in financial income and in a non-current receivable on the balance sheet. In connection with the settlement process, the form of payment continues to be negotiated with the government.
At December 31, 2010, the receivable and corresponding lawyers’ fees totaled US$205,323 and US$24,639 (US$187,385 and US$22,486 at March 31, 2010), respectively.
19
COSAN S.A. INDÚSTRIA E COMÉRCIO
Notes to the condensed consolidated financial statements (Continued)
(In thousands of U.S. dollars, unless otherwise stated)
(Unaudited)
| 9. | Financial income and expenses, net |
| Nine-month period ended | ||||||||
December 31, 2010 | December 31, 2009 | |||||||
| Financial expenses | ||||||||
| Interest | (215,661 | ) | (207,538 | ) | ||||
| Monetary variation | (35,701 | ) | (88,854 | ) | ||||
| Other | (2,195 | ) | (3,258 | ) | ||||
| (253,557 | ) | (299,650 | ) | |||||
| Financial income | ||||||||
| Interest | 33,193 | 52,672 | ||||||
| Monetary variation | 14,361 | 2,520 | ||||||
| Other | 33,865 | 22,639 | ||||||
| 81,419 | 77,831 | |||||||
| Foreign exchange gains | 124,640 | 318,097 | ||||||
| Derivatives | ||||||||
| Commodities | (14,380 | ) | (193,880 | ) | ||||
| Exchange rate and interest | 16,264 | 273,709 | ||||||
| 1,884 | 79,829 | |||||||
| Financial income, net | (45,614 | ) | 176,107 | |||||
| 10. | Income taxes |
Income tax expense attributable to income from operations for the nine-month periods ended December 31, 2010 and 2009 consists of:
December 31, 2010 | December 31, 2009 | |||||||
| Income taxes expense: | ||||||||
| Current | (34,016 | ) | (41,078 | ) | ||||
| Deferred | (52,433 | ) | (137,220 | ) | ||||
| (86,449 | ) | (178,298 | ) | |||||
20
COSAN S.A. INDÚSTRIA E COMÉRCIO
Notes to the condensed consolidated financial statements (Continued)
(In thousands of U.S. dollars, unless otherwise stated)
(Unaudited)
| 10. | Income taxes (Continued) |
Income taxes for the nine-month periods ended December 31, 2010 and 2009, differed from the amounts computed by applying the income tax rate of 25% and social contribution tax rate of 9% to income before income taxes due to the following:
December 31, 2010 | December 31, 2009 | |||||||
| Income before income taxes and equity in loss of affiliates | 211,173 | 469,792 | ||||||
| Income tax expense at statutory rate — 34% | (71,799 | ) | (159,729 | ) | ||||
| Increase (reduction) in income taxes resulting from: | ||||||||
| Equity in earnings of affiliates not subject to taxation | (430 | ) | (1,840 | ) | ||||
| Nondeductible donations and contributions | (4,610 | ) | (1,437 | ) | ||||
| Recognized granted options | (300 | ) | (1,526 | ) | ||||
| Tax loss carryforward unrealizable in subsidiaries | (4,315 | ) | (1,359 | ) | ||||
| Others | (4,995 | ) | (12,407 | ) | ||||
| Income tax expense | (86,449 | ) | (178,298 | ) | ||||
Cosan accounts for unrecognized tax benefits in accordance with ASC 740, “Accounting for Uncertainly in Income Taxes”. A reconciliation of the beginning and ending amount of unrecognized tax benefits in the estimated liability for legal proceedings, and labor claims, is as follows
| Balance at March 31, 2010 | 49,013 | |||
| Accrued interest on unrecognized tax benefit | 1,916 | |||
| Settlements | (145 | ) | ||
| Effect of foreign currency translation | 3,428 | |||
| Balance at December 31, 2010 (*) | 54,212 |
(*) Recorded as taxes payable (long-term)
It is possible that the amount of unrecognized tax benefits will change in the next twelve months, however, an estimate of the range of the possible change cannot be made at this time due to the long time to reach a settlement agreement or decision with the taxing authorities.
The Company and its subsidiaries file income tax returns in Brazil and they are subject to income tax examinations by the relevant tax authorities for the years 2005 through 2010.
21
COSAN S.A. INDÚSTRIA E COMÉRCIO
Notes to the condensed consolidated financial statements (Continued)
(In thousands of U.S. dollars, unless otherwise stated)
(Unaudited)
| 11. | Shareholders’ equity |
| a. | Capital |
On July 29, 2010, the Board of Directors approved a capital increase of US$1 through issuance of 60 new common shares, with no par value, at an issue price of US$9.00, due to exercise of subscription warrants by the holders. On the same day, the shareholders unanimously approved a capital increase of $1,558 through the issuance of 449,819 newly registered uncertificated common shares with no par value, in connection with the “Company’s Stock Option Plan”, due to exercise of such options by qualifying executives.
On September 17, 2010, the Board of Directors approved a capital increase of US$326 through issuance of 91,657 new common shares, with no par value, for purposes of meeting the needs of the Stock Option Plan, due to exercise of such options by qualifying executives.
As of December 31, 2010, the Company’s capital is represented by 407,101,853 common shares (406,560,317 as of March 31, 2010), with no par value.
Treasury stock
During the fiscal year ended March 31, 2009, the Company acquired 343,139 common shares from dissident shareholders related to a prior acquisition. These shares are held in treasury.
On November 22, 2010, the Board of Directors approved a program to buy back the Company‘s common shares, to be held in treasury for future sale or cancellation. The validity period for this operation is up to 365 days (until November 22, 2011) and the maximum number of shares to be repurchased during the period is 6,640,091 shares, with no par value.
During the quarter ended December 31, 2010, the Company acquired 591,400 shares for US$8,969, including expenses associated with the repurchase of shares.
As of December 31, 2010, the Company’s treasury stock is represented by 934,539 shares, which market value per share, on that date, was US$16.57.
22
COSAN S.A. INDÚSTRIA E COMÉRCIO
Notes to the condensed consolidated financial statements (Continued)
(In thousands of U.S. dollars, unless otherwise stated)
(Unaudited)
| 11. | Shareholders’ equity (Continued) |
b. Dividends
On July 30, 2010, additional dividends over the minimum compulsory of $47,479, were approved in the extraordinary general shareholders’ meeting in relation to the year ended March 31, 2010.
c. Additional paid-in capital and noncontrolling interest
As mentioned in note 1, on September 2, 2010, the shareholders approved a capital increase at Rumo through issuance of shares in exchange for cash provided by investors. As a result of this transaction, Cosan recorded noncontrolling interest in the amount of $110,247. The cash contribution in excess of the book value the investors interest in Rumo has been accounted for as an equity transaction, leading to an additional paid-in capital of $117,543.
| 12. | Deferred gain on sale of investments in subsidiaries |
Agrícola Ponte Alta S.A. is a subsidiary whose principal assets are land used for the growing of sugarcane for Cosan. On December 15, 2008, the shareholders approved a partial spin-off of the assets of Ponte Alta and created four new subsidiaries. Agricultural land was then transferred from Ponte Alta to each of the entities. On December 30, 2008, two of the entities, Nova Agrícola Ponte Alta S.A. and Terras da Ponte Alta S.A. were sold to Radar, an affiliate company accounted for by the equity method. The selling price was fair value, $123,596, which resulted in a gain of $47,080. This gain has previously been deferred since there were no lease contracts executed for the land, which was being used by Cosan for a monthly fee. During the year ended March 31, 2009 the lease contracts were executed, and the gain is being amortized to profit and loss over the 19 year aver age term of the leases since then.
During the nine-month period ended December 31, 2010, the Company recognized a gain of $2,893 related to this sale-leaseback transaction.
| 13. | Share-based compensation |
Cosan offers a stock option plan to officers and employees. The plan authorizes the issue of up to 5% of the shares comprising Cosan’s share capital. The exercise of
23
COSAN S.A. INDÚSTRIA E COMÉRCIO
Notes to the condensed consolidated financial statements (Continued)
(In thousands of U.S. dollars, unless otherwise stated)
(Unaudited)
options may be settled only through issuance of new common shares or treasury shares.
| 13. | Share-based compensation (Continued) |
The employees that resign Cosan S.A before the vesting period will forfeit 100% of their rights. However, if the employment is terminated by Cosan without cause, the employees will have right to exercise 100% of their options of that particular year plus the right to exercise 50% of the options of the following year.
The fair value of share-based awards was estimated using a binominal model with the following assumptions:
| Options granted on September 22, 2005 | Options granted on September 11, 2007 | Options granted on August 7, 2009 | ||||
| Grant price - in U.S. dollars | 3.67 | 3.67 | 3.67 | |||
| Expected life (in years) | 7.5 | 7.5 | Immediate | |||
| Interest rate | 14.52% | 9.34% | (1) | |||
| Expected volatility | 34.00% | 46.45% | (1) | |||
| Expected dividend yield | 1.25% | 1.47% | (1) | |||
| Weighted-average fair value at grant date - in U.S. dollars | 7.41 | 10.92 | (1) |
| (1) | The options were fully vested at the date of issuance so the fair value was the quoted market price as of the grant date. |
As of December 31, 2010, the amount of $851 related to the unrecognized compensation cost related to stock options is expected to be recognized in 9 months.
As of December 31, 2010 there were 112,440 options outstanding with a weighted-average exercise price of $3.67.
24
COSAN S.A. INDÚSTRIA E COMÉRCIO
Notes to the condensed consolidated financial statements (Continued)
(In thousands of U.S. dollars, unless otherwise stated)
(Unaudited)
| 14. | Risk management and financial instruments |
| a) | Risk management |
The Company is exposed to market risks, mainly related to the volatility of sugar prices and foreign exchange rates. Management analyzes these risks and uses financial instruments to hedge a portion of the risk exposure.
On December 31 and March 31, 2010, fair values related to transactions involving derivative financial instruments with the purpose of hedge or other purposes were measured at market value (fair value) by observables factors such as quoted prices in active markets or discounted cash flows based on market curves and are presented below:
| Notional | Fair Value | |||||||||||||||
| December 31, | March 31, | December 31, | March 31, | |||||||||||||
| 2010 | 2010 | 2010 | 2010 | |||||||||||||
| Price risk | ||||||||||||||||
| Commodity derivatives | ||||||||||||||||
| Future contracts | 1,027,319 | 661,110 | (157,488 | ) | 63,101 | |||||||||||
| Options contracts | 11,727 | 603,357 | (25,908 | ) | (6,586 | ) | ||||||||||
| Swap contracts | 758,912 | 56,594 | (4 | ) | 607 | |||||||||||
| (183,400 | ) | 57,122 | ||||||||||||||
| Exchange rate risk | ||||||||||||||||
| Future contracts | 154,309 | 1,180,829 | 1,321 | 264 | ||||||||||||
| Forward contracts | 682,979 | 537,422 | 60,933 | 20,527 | ||||||||||||
| Options contracts | 35,711 | 377,036 | 2,955 | 8,827 | ||||||||||||
| 65,209 | 29,618 | |||||||||||||||
| Interest rate risk | ||||||||||||||||
| Interest derivative | 207,574 | 291,291 | (1,269 | ) | (351 | ) | ||||||||||
| (1,269 | ) | (351 | ) | |||||||||||||
| Total | (119,460 | ) | 86,389 | |||||||||||||
| Total Assets | 108,032 | 129,456 | ||||||||||||||
| Total Liabilities | (227,492 | ) | (43,067 | ) | ||||||||||||
| b) | Price risk |
This arises from the possibility of fluctuations in the market prices of products sold by the Company, mainly raw material sugar - VHP (sugar #11) and white sugar (LIFFE sugar #5). These fluctuations in prices can cause substantial changes in the revenues of the Company. To mitigate these risks, the Company constantly monitors the markets, seeking to anticipate changes in prices. The positions of the consolidated derivative financial instruments to hedge the price risk of commodities are shown in the table below:
25
COSAN S.A. INDÚSTRIA E COMÉRCIO
Notes to the condensed consolidated financial statements (Continued)
(In thousands of U.S. dollars, unless otherwise stated)
(Unaudited)
| 14. | Risk management and financial instruments (Continued) |
| Price risk: price derivatives outstanding as of December 31, 2010 | |||||||||||||||
| Derivative | Purchased/ sold | Market | Contract | Maturity | Notional | Fair Value | |||||||||
| Derivative financial instruments designated as cash flow hedges | |||||||||||||||
| Future | Sold | NYBOT | #11 | 01/Mar/11 | (141.838 | ) | (41.973 | ) | |||||||
| Future | Sold | NYBOT | #11 | 01/May/11 | (26.294 | ) | (14.623 | ) | |||||||
| Future | Sold | NYBOT | #11 | 01/Jul/11 | (107.259 | ) | (26.491 | ) | |||||||
| Future | Sold | NYBOT | #11 | 01/Oct/11 | (74.827 | ) | (19.438 | ) | |||||||
| Future | Sold | NYBOT | #11 | 01/Mar/12 | (20.049 | ) | (335 | ) | |||||||
| Swap | Sold | NYBOT | #11 | 01/Mar/11 | (30.238 | ) | (23.353 | ) | |||||||
| Swap | Sold | NYBOT | #11 | 01/May/11 | (16.534 | ) | 115 | ||||||||
| Swap | Sold | NYBOT | #11 | 01/Jul/11 | (170.502 | ) | (18.724 | ) | |||||||
| Swap | Sold | NYBOT | #11 | 01/Oct/11 | (176.946 | ) | (20.452 | ) | |||||||
| Subtotal designated as cash flow hedges | (764.487 | ) | (165.274 | ) | |||||||||||
| Derivative financial instruments not designated under hedge accounting | |||||||||||||||
| Future | Sold | NYBOT | #11 | 01/Mar/11 | (27.017 | ) | (10.414 | ) | |||||||
| Future | Sold | NYBOT | #11 | 01/Oct/11 | (34.436 | ) | (15.070 | ) | |||||||
| (61.453 | ) | (25.484 | ) | ||||||||||||
| Future | Purchased | NYBOT | #11 | 01/Mar/11 | (24.904 | ) | 1.285 | ||||||||
| Future | Purchased | NYBOT | #11 | 01/Mar/11 | (5.960 | ) | 3.957 | ||||||||
| Future | Purchased | NYBOT | #11 | 01/Oct/11 | (24.752 | ) | 2.643 | ||||||||
| Future | Purchased | NYBOT | #11 | 01/Mar/12 | (30.125 | ) | 13.890 | ||||||||
| Swap | Purchased | NYBOT | #11 | 01/Jul/11 | (53.872 | ) | 4.806 | ||||||||
| Swap | Purchased | NYBOT | #11 | 01/Oct/11 | (61.768 | ) | 6.688 | ||||||||
| (201.381 | ) | 33.270 | |||||||||||||
| Future | Sold | BMFBovespa | Hydrated ethanol | 31/Jan/11 | 758.912 | (4 | ) | ||||||||
| 758.912 | (4 | ) | |||||||||||||
| Call | Sold | NYBOT/OTC | #11 | 01/Mar/11 | 3.022 | (13.173 | ) | ||||||||
| Call | Sold | NYBOT | #11 | 01/Mar/11 | 451 | (2.513 | ) | ||||||||
| Call | Sold | NYBOT | #11 | 01/Mar/11 | 160 | (865 | ) | ||||||||
| Call | Sold | NYBOT/OTC | #11 | 01/Oct/11 | 1.711 | (5.293 | ) | ||||||||
| Call | Sold | NYBOT/OTC | #11 | 01/Oct/11 | 2.390 | (6.531 | ) | ||||||||
| 7.734 | (28.374 | ) | |||||||||||||
| Put | Purchased | NYBOT/OTC | #11 | 01/Oct/11 | 1.677 | 1.000 | |||||||||
| Put | Purchased | NYBOT/OTC | #11 | 01/Oct/11 | 2.316 | 1.466 | |||||||||
| 3.993 | 2.466 | ||||||||||||||
| Subtotal derivative financial instruments not designated under hedge accounting | 507.807 | (18.126 | ) | ||||||||||||
| Total price risk related derivatives | (256.680 | ) | (183.400 | ) | |||||||||||
26
COSAN S.A. INDÚSTRIA E COMÉRCIO
Notes to the condensed consolidated financial statements (Continued)
(In thousands of U.S. dollars, unless otherwise stated)
(Unaudited)
| 14. | Risk management and financial instruments (Continued) |
| c) | Foreign exchange risk |
This arises from the possibility of fluctuations in the exchange rates of the foreign currencies used by the Company for the export revenues of products, imports, debt cash flow and other assets and liabilities denominated in a foreign currency. The Company uses derivative transactions to manage the risks of cash flow coming from the export revenues denominated in U.S. dollars, net of other cash flows denominated in foreign currency. The table below demonstrates the consolidated positions open as of December 31, 2010 of derivatives used to hedge exchange rates:
Foreing exchange risk: derivatives outstanding as of December 31, 2010 | |||||||||||||
| Derivative | Purchase/ Sold | Market | Contract | Maturity | Notional | Fair Value | |||||||
| US$ (thousand) | US$ (thousand) | ||||||||||||
| Derivative financial instruments designated as cash flow hedge. | |||||||||||||
| Forward | Sold | OTC/Cetip | NDF | January 3, 2011 | 53,691 | 8,688 | |||||||
| Forward | Sold | OTC/Cetip | NDF | April 1, 2011 | 111,196 | 9,104 | |||||||
| Forward | Sold | OTC/Cetip | NDF | May 31, 2011 | 84,792 | 12,027 | |||||||
| Forward | Sold | OTC/Cetip | NDF | July 1, 2011 | 59,597 | 7,134 | |||||||
| Forward | Sold | OTC/Cetip | NDF | August 1, 2011 | 62,267 | 9,224 | |||||||
| Forward | Sold | OTC/Cetip | NDF | October 3, 2011 | 156,860 | 20,715 | |||||||
| Sub-total designated as cash flow hedge | 528,403 | 66,892 | |||||||||||
| Derivative financial instruments not designated under hedge accounting | |||||||||||||
| Future | Sold | BMFBovespa | Commercial U.S. dollar rate | January 3, 2011 | 228,604 | 1,639 | |||||||
| Future | Sold | BMFBovespa | Commercial U.S. dollar rate | February 1, 2011 | 83,526 | 809 | |||||||
| Future | Purchased | BMFBovespa | Commercial U.S. dolla rrate | January 3, 2011 | (157,821) | (1,126) | |||||||
| Sub-total Future Purchased | (157,821) | (1,126) | |||||||||||
27
COSAN S.A. INDÚSTRIA E COMÉRCIO
Notes to the condensed consolidated financial statements (Continued)
(In thousands of U.S. dollars, unless otherwise stated)
(Unaudited)
| 14. | Risk management and financial instruments (Continued) |
| Foreing exchange risk: derivatives outstanding as of December 31, 2010 | ||||||||||||||||
| Derivative | Purchased / Sold | Market | Contract | Maturity | Notional | Fair value | ||||||||||
| Forward | Purchased | OTC | NDF (Offshore) | February 2, 2011 | 6,352 | (140) | ||||||||||
| Forward | Purchased | OTC | NDF (Offshore) | May 2, 2011 | 6,470 | (138) | ||||||||||
| Forward | Purchased | OTC | NDF (Offshore) | August 2, 2011 | 6,610 | (136) | ||||||||||
| Forward | Purchased | OTC | NDF (Offshore) | November 1, 2011 | 6,749 | (153) | ||||||||||
| Forward | Purchased | OTC | NDF (Offshore) | February 1, 2012 | 6,895 | (190) | ||||||||||
| Forward | Purchased | OTC | NDF (Offshore) | May 2, 2012 | 7,035 | (188) | ||||||||||
| Forward | Purchased | OTC | NDF (Offshore) | August 1, 2012 | 7,189 | (198) | ||||||||||
| Forward | Purchased | OTC | NDF (Offshore) | October 30, 2012 | 7,345 | (212) | ||||||||||
| Forward | Purchased | OTC | NDF (Offshore) | January 31, 2013 | 7,505 | (215) | ||||||||||
| Forward | Purchased | OTC | NDF (Offshore) | April 30, 2013 | 7,646 | (195) | ||||||||||
| Forward | Purchased | OTC | NDF (Offshore) | July 31, 2013 | 7,800 | (181) | ||||||||||
| Forward | Purchased | OTC | NDF (Offshore) | October 31, 2013 | 7,956 | (169) | ||||||||||
| Forward | Purchased | OTC | NDF (Offshore) | January 31, 2014 | 8,115 | (191) | ||||||||||
| Forward | Purchased | OTC | NDF (Offshore) | April 29, 2014 | 8,248 | (278) | ||||||||||
| Forward | Purchased | OTC | NDF (Offshore) | July 31, 2014 | 8,404 | (379) | ||||||||||
| Forward | Purchased | OTC | NDF (Offshore) | October 31, 2014 | 8,559 | (478) | ||||||||||
| Forward | Purchased | OTC | NDF (Offshore) | February 2, 2015 | 8,700 | (551) | ||||||||||
| Forward | Purchased | OTC | NDF (Offshore) | April 29, 2015 | 8,838 | (598) | ||||||||||
| Forward | Purchased | OTC | NDF (Offshore) | July 31, 2015 | 9,004 | (660) | ||||||||||
| Forward | Purchased | OTC | NDF (Offshore) | October 30, 2015 | 9,155 | (710) | ||||||||||
| Sub-total Forward Purchased | 154,575 | (5,960) | ||||||||||||||
| Put Offshore | Purchased | OTC | Commercial U.S. dollar rate | February 11, 2011 | 25,677 | 1,776 | ||||||||||
| Put Offshore | Purchased | OTC | Commercial U.S. dollar rate | February 11, 2011 | 10,035 | 1,179 | ||||||||||
| Sub-total Put Purchased | 35,711 | 2,955 | ||||||||||||||
| Total of Foreign exchange derivatives designated for exportation | 872,999 | 65,209 | ||||||||||||||
| Swap | Purchased | OTC/Cetip | U.S. dollar/DI | 193,268 | 22,032 | |||||||||||
| Swap | Sold | OTC/Cetip | U.S. dollar/DI | (193,268) | (22,032) | |||||||||||
| Total Foreing exchange | 872,999 | 65,209 | ||||||||||||||
28
COSAN S.A. INDÚSTRIA E COMÉRCIO
Notes to the condensed consolidated financial statements (Continued)
(In thousands of U.S. dollars, unless otherwise stated)
(Unaudited)
| 14. | Risk management and financial instruments (Continued) |
On December 31, 2010 and March 31, 2010, the Company had the following net exposure to the variation of U.S. dollar assets and liabilities denominated in U.S. dollars
December 31, 2010 | March 31, 2010 | |||||||
| Amounts pending foreign exchange closing | 9,666 | 71,732 | ||||||
| Overnight | 10,161 | 28,338 | ||||||
| Trade notes receivable - foreign | 57,704 | 83,467 | ||||||
| Senior Notes due in 2014 | (363,300 | ) | (354,433 | ) | ||||
| Senior Notes due in 2017 | (411,589 | ) | (404,589 | ) | ||||
| Perpetual bonds | (759,154 | ) | (455,304 | ) | ||||
| Foreign currency-denominated loans | (227,342 | ) | (269,016 | ) | ||||
| Export pre-payments | (435,451 | ) | (547,230 | ) | ||||
| Restricted cash | 165,796 | 25,251 | ||||||
| Exchange exposure | (1,953,509 | ) | (1,821,784 | ) | ||||
d) hedge accounting effects
The Company formally designated its transactions subject to hedge accounting for cash flow hedges from sugar VHP (raw material) export revenue, documenting: (i) the relationship of the hedge, (ii) the Company’s purpose for taking the hedge and its risk management strategy, (iii) identification of the financial instrument, (iv) the transaction or item covered, (v) the nature of the risk being hedged, (vi) a description of the hedging relationship (vii) the demonstration of correlation between the hedge and the object of coverage, and (viii) the prospective analysis of hedge effectiveness. The Company has designated derivative financial instruments of Sugar # 11 (NYBOT or OTC) to cover the risk of price and Non-Deliverable Forwards (NDF) to cover exchange rate risk, as demonstrated in topics (b) and (c) of this Note.
The Company records gains and losses deemed effective for purposes of hedge accounting to a specific account in shareholders´ equity (“other comprehensive income”), until the object of coverage (hedged item) affects the profit and loss.
29
COSAN S.A. INDÚSTRIA E COMÉRCIO
Notes to the condensed consolidated financial statements (Continued)
(In thousands of U.S. dollars, unless otherwise stated)
(Unaudited)
| 14. | Risk management and financial instruments (Continued) |
| Expected period to affect P&L | ||||||||||||||
| Derivative | Market | Risk | 2010/2011 | 2011/2012 | Total | |||||||||
| Future | OTC/ NYBOT | #11 | (56,790 | ) | (221,363 | ) | (278,153 | ) | ||||||
| NDF | OTC/ CETIP | USD | 5,693 | 53,896 | 59,589 | |||||||||
| (51,097 | ) | (167,467 | ) | (218,564 | ) | |||||||||
| (-) Deferred income taxes | 17,373 | 56,939 | 74,312 | |||||||||||
| Shareholders' equity effect | (33,724 | ) | (110,528 | ) | (144,252 | ) | ||||||||
The detail of the movement of the cash flow hedge gain or loss in other comprehensive income is as follows:
| Cash flow hedges | ||||
| Balance at March 31, 2010 | - | |||
| Gain/(losses) of cash flow hedges for the period | ||||
| Commodities future and swap contracts | (342,540 | ) | ||
| Currency forward contracts | 73,847 | |||
| Reclassification adjustments for losses included in the income statement (net sales) | 50,129 | |||
| Total before tax effect | (218,564 | ) | ||
| Tax effect on gain/(losses) of cash flow hedges for the period – 34% | 74,312 | |||
| Balance at December 31, 2010 | (144,252 | ) | ||
During the nine-month period ended December 31, 2010, the Company recorded the amount of $8,967 on results for operations due to hedged items that would no longer qualify to be designated under hedge accounting. Also, the Company recorded the amount of $219 related to the gains and losses of the hedges’ ineffectiveness during the nine-month period ended December 31, 2010.
| e) | Interest rate risk |
The Company monitors fluctuations of the interest rates related to certain loan contracts, mainly those with Libor interest rate risk, and in the event of increased volatility of such rates, it may engage in transactions with derivatives so as to minimize such risks. At December 31, 2010, the Company presented the following net balance sheet exposure related to interest rate risk:
30
COSAN S.A. INDÚSTRIA E COMÉRCIO
Notes to the condensed consolidated financial statements (Continued)
(In thousands of U.S. dollars, unless otherwise stated)
(Unaudited)
| 14. | Risk management and financial instruments (Continued) |
| e) | Interest rate risk (Continued) |
| Interest rate risk: outstanding interest rate swap derivatives on December 31, 2010 | ||||||||||||
| Number | ||||||||||||
| Purchased | of | |||||||||||
| Derivative | /sold | M arket | Contract | Contract | Average price | Notional | Fair value | |||||
| Swap | Purchased | OCT/Cetip | Fix/Libor 3 month | 1 | 1.199%/libor 3 Month | 69,192 | (423) | |||||
| Swap | Purchased | OCT/Cetip | Fix/Libor 3 month | 1 | 1.199%/libor 3 Month | 138,382 | (846) | |||||
| 207,574 | (1,269) | |||||||||||
| f) | Credit risk |
A significant portion of sales made by the Company is to a select group of best-in-class counterparts (i.e. trading companies, fuel distribution companies and large supermarket chains).
Credit risk is managed through specific rules of client acceptance including credit ratings and limits for customer exposure, including the requirement of a letter of credit from major banks and obtaining actual warranties on given credit, when applicable. Management believes that the risk of credit is covered by the allowance for doubtful accounts.
The Company buys and sells commodity derivatives in futures and options markets on the New York Board of Trade (NYBOT) and the London International Financial Futures and Options Exchange (LIFFE), as well as in the over-the-counter (OTC) market with selected counterparties. The Company buys and sells foreign exchange derivatives on BM&FBovespa and OTC contracts registered with CETIP (OTC clearing house) with banks Goldman Sachs & Co, Banco Barclays S.A., BNP Paribas Commodity Futures Ltd, Newedge LLC, Macquarie Bank Ltd, ADM Investors Services International Limited (Hencorp), Prudential Bache Commodities LLC, Natixis Commodity Markets Ltd, Espirito Santo Investmento do Brasil S.A., Deutsche Bank S.A. – Banco Alemão, Banco Bradesco S.A., Banco JP Morgan S.A., Banco Standard de Investimentos S.A., Banco Morgan Stanley Witter S.A . and Banco BTG Pactual S.A..
31
COSAN S.A. INDÚSTRIA E COMÉRCIO
Notes to the condensed consolidated financial statements (Continued)
(In thousands of U.S. dollars, unless otherwise stated)
(Unaudited)
| 14. | Risk management and financial instruments (Continued) |
Guarantee margins – The Company’s derivative operations on commodity exchanges (NYBOT, LIFFE and BM&FBovespa) require an initial guarantee margin. The brokers with which the Company operates on these commodity exchanges offer credit limits for these margins. As of December 30, 2010, the total credit limit used as initial margin was $83,227 ($38,543 as of March 31, 2010). As a requirement to trade in BM&FBovespa, the Company posted on December 31, 2010, the amount of $19,061 ($46,627 as of March 31, 2010) as guarantee in the form of a settlement bond issued by a first-class banking institution. Over-the-counter derivative transactions of the Company are exempt from margin guarantees.
| g) | Debt acceleration risk |
As of December 31, 2010 and March 31, 2010, the Company was a party to loan and financing agreements with covenants generally applicable to these operations, including requirements related to cash generation, debt to equity ratio and others. These covenants are being fully complied with by the Company and do not place any restrictions on its operations as a going-concern.
| 15. | Fair value measurements |
Effective May 1, 2008, Cosan adopted ASC 820, Fair Value Measurements, for all financial instruments and non-financial instruments accounted for at fair value on a recurring basis. ASC 820 establishes a new framework for measuring fair value and expands related disclosures. Broadly, the ASC 820 framework requires fair value to be determined based on the exchange price that would be received for an asset or paid to transfer a liability (an exit price) in the principal or most advantageous market for the asset or liability in an orderly transaction between market participants. ASC 820 establishes market or observable inputs as the preferred source of values, followed by assumptions based on hypothetical transactions in the absence of market inputs.
The valuation techniques required by ASC 820 are based upon observable and unobservable inputs. Observable inputs reflect market data obtained from independent sources, while unobservable inputs reflect market assumptions. These two types of inputs create the following fair value hierarchy:
Level 1 - Quoted prices for identical instruments in active markets.
32
COSAN S.A. INDÚSTRIA E COMÉRCIO
Notes to the condensed consolidated financial statements (Continued)
(In thousands of U.S. dollars, unless otherwise stated)
(Unaudited)
| 15. | Fair value measurements (Continued) |
Level 2 - Quoted prices for similar instruments in active markets; quoted prices for identical or similar instruments in markets that are not active; and model-derived valuations whose inputs are observable or whose significant value drivers are observable.
Level 3 - Significant inputs to the valuation model are unobservable.
The following section describes the valuation methodologies Cosan uses to measure different financial instruments at fair value.
Derivatives
Cosan uses closing prices for derivatives included in Level 1, which are traded either on exchanges or liquid over-the-counter markets.
The remainder of the derivatives portfolio is valued using internal models, most of which are primarily based on market observable inputs including interest rate curves and both forward and spot prices for currencies and commodities. Derivative assets and liabilities included in Level 2 primarily represent interest rate swaps, foreign currency swaps and commodity forward contracts.
The following table presents our assets and liabilities measured at fair value on a recurring basis as of December 31, 2010.
| Fair value measurements | Level 1 | Level 2 | Total | |||||||||
| Derivatives | (126,028 | ) | 6,568 | (119,460 | ) | |||||||
| Assets | 108,032 | |||||||||||
| Liabilities | (227,492 | ) | ||||||||||
| Total | (119,460 | ) | ||||||||||
33
COSAN S.A. INDÚSTRIA E COMÉRCIO
Notes to the condensed consolidated financial statements (Continued)
(In thousands of U.S. dollars, unless otherwise stated)
(Unaudited)
| 16. | Segment information |
a. Segment information
The following information about segments is based upon information used by Cosan’s senior management to assess the performance of operating segments and to decide on the allocation of resources. Cosan’s operating and reportable segments are business units in Brazil that target different industry segments. Each reportable segment is managed separately because of the need to specifically address customer needs in these different industries. The operations of these segments are based solely in Brazil.
The Company has three operating segments: Sugar and Ethanol (“S&E”), Fuel Distribution and Lubricants (“CCL”), and Sugar Logistics (“Rumo”).
The S&E segment produces and sells a broad variety of sugar and ethanol products.
The sugar products include raw (also known as very high polarization - VHP sugar), organic, crystal and refined sugars, which are sold to a wide range of customers in Brazil and abroad. Cosan exports the majority of the sugar produced through international commodity trading companies. Cosan’s domestic customers include wholesale distributors, food manufacturers and retail supermarkets, through which it sells its “Da Barra” and “União” branded products. The ethanol products include fuel ethanol and industrial ethanol. Cosan’s principal fuel ethanol products are hydrous and anhydrous. Hydrous ethanol is used as an automotive fuel and anhydrous (which has a lower water content than hydrous ethanol) is used as an additive in gasoline. The fuel ethanol products are mainly sold in the domest ic market by fuel distribution companies. Consumption of hydrous ethanol in Brazil is increasing as a result of the introduction of flex fuel vehicles that can run on either gasoline or ethanol (or a combination of both). In addition, the S&E segment sells liquid and gel ethanol products used mainly in the production of paint, cosmetics and alcoholic beverages for industrial clients in various sectors. Also, the S&E segment includes the co-generation activities and most of the corporate activities.
The CCL segment is engaged in the distribution in Brazil of fuel products, derived from petroleum or ethanol, and lubricants as well as the operation of convenience stores. The network to which the fuel distribution segment distributes such products is comprised of approximately 1,700 fuel stations.
34
COSAN S.A. INDÚSTRIA E COMÉRCIO
Notes to the condensed consolidated financial statements (Continued)
(In thousands of U.S. dollars, unless otherwise stated)
(Unaudited)
Segment information (Continued)
a. Segment information (Continued)
The Rumo segment provides logistics services for the transport, storage and port lifting of sugar for both the S&E segment and third parties.
The accounting policies underlying the financial information provided for the segments are based on Brazilian GAAP. We evaluate segment performance based on information generated from the statutory accounting records.
Segment profit and loss and selected balance sheet data under Brazilian GAAP is as follows:
| December 31, 2010 | ||||||||||||||||||||
| S&E | CCL | RUMO | Adjustment/ elimination | Consolidated | ||||||||||||||||
| Brazilian GAAP | US GAAP | |||||||||||||||||||
| Balance sheet: | ||||||||||||||||||||
| Property, plant & equipment (PP&E) | 3,076,888 | 235,627 | 392,876 | 878,817 | 4,584,208 | |||||||||||||||
| Goodwill and Intangible assets | 861,051 | 858,060 | 44,213 | 247,327 | 2,010,651 | |||||||||||||||
| Loans, net of cash and cash equivalents | (3,292,443 | ) | (276,906 | ) | (3,985 | ) | 45,069 | (3,528,265 | ) | |||||||||||
| Others assets (liabilities) | 2,518,543 | 349,950 | 14,467 | (2,082,768 | ) | 800,193 | ||||||||||||||
| Total net assets | 3,164,039 | 1,166,731 | 447,571 | (911,555 | ) | 3,866,787 | ||||||||||||||
| Income statements (9 months) | ||||||||||||||||||||
| Net Sales | 2,700,275 | 5,087,365 | 208,236 | (265,896 | ) | 7,729,980 | ||||||||||||||
| Gross profit | 605,232 | 362,451 | 66,202 | (85,097 | ) | 948,788 | ||||||||||||||
| Selling general and administrative expenses | (412,335 | ) | (230,643 | ) | (11,843 | ) | (14,185 | ) | (669,006 | ) | ||||||||||
| Operating income | 192,897 | 131,808 | 54,359 | (99,282 | ) | 279,782 | ||||||||||||||
| Other income (expense) | 94,081 | 8,639 | 4,997 | (130,712 | ) | (22,995 | ) | |||||||||||||
| Other selected data: | ||||||||||||||||||||
| Additions to PP&E (Capex) | 647,701 | 56,486 | 224,914 | - | 929,101 | |||||||||||||||
| Depreciation and amortization | 380,027 | 21,242 | 8,115 | 108,144 | 517,528 | |||||||||||||||
35
COSAN S.A. INDÚSTRIA E COMÉRCIO
Notes to the condensed consolidated financial statements (Continued)
(In thousands of U.S. dollars, unless otherwise stated)
(Unaudited)
| 16. | Segment information (Continued) |
a. Segment information (Continued)
| March 31, 2010 | ||||||||||||||||||||
| S&E | CCL | RUMO | Adjustment/ elimination | Consolidated | ||||||||||||||||
| Brazilian GAAP | US GAAP | |||||||||||||||||||
| Balance sheet: | ||||||||||||||||||||
| Property, plant & equipment (PP&E) | 2,775,752 | 199,983 | 165,094 | 856,986 | 3,997,815 | |||||||||||||||
| Goodwill and Intangible assets | 735,198 | 774,716 | 38,824 | 341,460 | 1,890,198 | |||||||||||||||
| Loans, net of cash and cash equivalents | (2,443,354 | ) | (249,839 | ) | (59,799 | ) | 69,929 | (2,683,063 | ) | |||||||||||
| Others assets (liabilities) | 2,113,306 | 342,720 | 7,696 | (2,202,267 | ) | 261,455 | ||||||||||||||
| Total net assets | 3,180,902 | 1,067,580 | 151,815 | (933,892 | ) | 3,466,405 | ||||||||||||||
December 31, 2009 | ||||||||||||||||||||
| S&E | CCL | RUMO | Adjustment/ elimination | Consolidated | ||||||||||||||||
| Brazilian GAAP | US GAAP | |||||||||||||||||||
| Income statements (9 months) | ||||||||||||||||||||
| Net sales | 1,888,554 | 4,004,480 | 62,514 | (110,079 | ) | 5,845,469 | ||||||||||||||
| Gross profit | 404,958 | 298,685 | 15,403 | (52,837 | ) | 666,209 | ||||||||||||||
| Selling, general and administrative expenses | (320,130 | ) | (186,328 | ) | (6,528 | ) | (7,974 | ) | (520,960 | ) | ||||||||||
| Operating income | 8,483 | 112,357 | 8,874 | 15,535 | 145,249 | |||||||||||||||
| Other income (expense) | 116,759 | 50,660 | (12,647 | ) | (6,338 | ) | 148,435 | |||||||||||||
| Other selected data: | ||||||||||||||||||||
| Additions to PP&E (Capex) | 654,879 | 22,808 | 406 | - | 678,093 | |||||||||||||||
| Depreciation and amortization | 232,592 | 14,196 | 5,674 | 127,035 | 379,497 | |||||||||||||||
36
COSAN S.A. INDÚSTRIA E COMÉRCIO
Notes to the condensed consolidated financial statements (Continued)
(In thousands of U.S. dollars, unless otherwise stated)
(Unaudited)
| 16. | Segment information (Continued) |
b. Detailed net sales per segment
| S&E (Brazilian GAAP) | December 31, 2010 | December 31, 2009 | |||||||
| Sugar | 1,642,591 | 1,145,897 | |||||||
| Ethanol | 880,202 | 607,054 | |||||||
| Cogeneration | 109,107 | 45,969 | |||||||
| Other | 68,375 | 89,634 | |||||||
| CCL (Brazilian GAAP) | 2,700,275 | 1,888,554 | |||||||
| Fuels | 4,707,665 | 3,728,550 | |||||||
| Lubricants | 351,406 | 246,487 | |||||||
| Other | 28,294 | 29,442 | |||||||
| Rumo (Brazilian GAAP) | 5,087,365 | 4,004,480 | |||||||
| Port lifting | 58,904 | 61,082 | |||||||
| Logistics | 142,862 | 1,432 | |||||||
| Other | 6,470 | - | |||||||
| 208,236 | 62,514 | ||||||||
| Adjustments / eliminations | (265,896 | ) | (110,079 | ) | |||||
| Total (US GAAP) | 7,729,980 | 5,845,469 | |||||||
c. Net sales by region
The percentage of net sales by geographic area for the nine-month periods ended December 31, 2010 and 2009 are as follows:
| December 31, | December 31, | |||||||
| 2010 | 2009 | |||||||
| Sales by geographic area | ||||||||
| Brazil | 67.65% | 80.14% | ||||||
| Europe | 26.45% | 13.33% | ||||||
| Middle east and Asia | 2.51% | 2.06% | ||||||
| North America | 1.01% | 3.43% | ||||||
| Latin American (Except Brazil) | 0.57% | 0.44% | ||||||
| Others | 1.81% | 0.60% | ||||||
| Total | 100.00% | 100.00% | ||||||
37
COSAN S.A. INDÚSTRIA E COMÉRCIO
Notes to the condensed consolidated financial statements (Continued)
(In thousands of U.S. dollars, unless otherwise stated)
(Unaudited)
| 16. | Segment information (Continued) |
d. Concentration of clients
S&E
There are several clients in this segment, one of which represents more than 10% of the segment net sales -- the SUCDEN Group (16.1% for the nine-month period ended December 31, 2010 and 21.3% for the nine-month period ended December 31, 2009).
CCL
In this segment there are no clients that represent more than 10% of the net sales for the nine-month period ended December 31, 2010 and 2009.
Rumo
For the nine-month period ended December 31, 2010, 55.3% of the segment net sales were generated from sales to the S&E segment (27.7% for the nine-month period ended December 31, 2009). There are two other customers which represented more than 10% of the net sales for nine-month period ended December 31, 2010 and 2009 of this segment. SUCDEN Group accounted for 7.4% of segment sales for the nine-month period ended December 31, 2010 (14.4% for the nine-month period ended December 31, 2009) and the ED&F Man Group accounted for 4.3% of segment sales for the nine-month period ended December 31, 2010.
| 17. | Subsequent events |
On January 11, 2011, the Company entered into a binding memorandum of understanding with the shareholders of Usina Zanin Açúcar e Álcool Ltda. (“Zanin”), subject to an exclusivity period of 45 days, aiming to purchase the total outstanding equity interests of Zanin for the amount of R$142.0 million (“Transaction”), to be funded with available cash. In addition, Cosan will assume debts amounting to R$236.6 million. This Transaction will include Zanin assets related to the industrial and agricultural activities with annual crushing capacity of approximately 2.6 million tons of sugarcane and a greenfield project in the city of Prata, State of Minas Gerais.
The formation of this Transaction is subject to the satisfaction of some precedent conditions such as the successful renegotiation of the financial liabilities with banks and the negotiation of the final contracts.
38
COSAN S.A. INDÚSTRIA E COMÉRCIO
Notes to the condensed consolidated financial statements (Continued)
(In thousands of U.S. dollars, unless otherwise stated)
(Unaudited)
39
| Unconsolidated and Consolidated | |
| Quarterly Financial Information | |
Cosan S.A. Indústria e Comércio | |
| December 31, 2010 | |
| “A free translation into English of the original issued in Portuguese” |
COSAN S.A. INDÚSTRIA E COMÉRCIO
UNCONSOLIDATED AND CONSOLIDATED QUARTERLY FINANCIAL INFORMATION
December 31, 2010
Table of contents
| Special review report of independent auditors | 1 |
| Unaudited quarterly financial information | |
| Unaudited balance sheets | 3 |
| Unaudited statements of operations | 5 |
| Unaudited statement of changes in shareholders’ equity | 6 |
| Unaudited statements of cash flows | 9 |
| Notes to the unaudited quarterly financial information | 13 |
A free translation from Portuguese into English of review report on quarterly financial information prepared in Brazilian currency in accordance with the accounting practices adopted in Brazil
REVIEW REPORT ON QUARTERLY FINANCIAL INFORMATION
The Board of Directors and Shareholders of
Cosan S.A. Indústria e Comércio
| 1. | We have reviewed the quarterly financial information which include the balance sheet (individual and consolidated) of Cosan S.A. Indústria e Comércio as of December 31, 2010 and the related statements (individual and consolidated) of income, changes in equity and cash flows for the three-month period then ended. Management is responsible for the preparation and fair presentation of this quarterly financial information in accordance with the accounting practices adopted in Brazil. Our responsibility is to express a conclusion on this quarterly financial information based on our review. |
| 2. | We conducted our review in accordance with the Brazilian and International standards on review engagements. A review of quarterly financial information consists of making inquiries, primarily of persons responsible for financial and accounting matters, and applying analytical and other review procedures. A review is substantially less in scope than an audit conducted in accordance with standards on auditing and consequently does not enable us to obtain assurance that we would become aware of all significant matters that might be identified in an audit. Accordingly, we do not express an audit opinion. |
| 3. | Based on our review, nothing has come to our attention that causes us to believe that the accompanying quarterly financial information has not been prepared, in all material respects, in accordance with the accounting practices adopted in Brazil. |
1
| 4. | As mentioned in Note 2, during the 2009, CVM approved several Pronouncements, Interpretations and Technical Orientations issued by the Committee of Accounting Pronouncements (“CPC”) effective 2010, which have changed accounting practices adopted in Brazil. As permitted by CVM Deliberation 603/09, management of the Company opted to present is Quarterly Financial Information using the same accounting standards adopted in Brazil until December 31, 2009, therefore, it did not apply the new pronouncements effective in 2010. As required by the CVM Deliberation, the Company disclosed this fact in Note 2 of the Quarterly Financial Information as well as the description of the main changes the can have an impact in its financial statements at the end of the year and the reasons that avoid the presentation of the estimated effects in shareholders’ equity and income, as required by the Deliberation. |
São Paulo, February 9, 2011
ERNST & YOUNG TERCO
Auditores Independentes S.S.
CRC 2SP015199/O-6
Luiz Carlos Nannini
Accountant CRC 1SP171638/O-7
2
A free translation from Portuguese into English of financial statements prepared in Brazilian currency in accordance with accounting practices adopted in Brazil
COSAN S.A. INDÚSTRIA E COMÉRCIO
Unaudited balance sheets
December 31, 2010 and September 30, 2010
(In thousands of reais)
| Parent Company | Consolidated | ||||||||||||||||
| December 31, 2010 | September 30, 2010 | December 30, 2010 | September 30, 2010 | ||||||||||||||
| Assets | |||||||||||||||||
| Current assets | |||||||||||||||||
| Cash and cash equivalents | Note 4 | 69,413 | 45,798 | 1,136,882 | 988,367 | ||||||||||||
| Restricted cash | 276,249 | 75,950 | 276,249 | 75,950 | |||||||||||||
| Trade accounts receivable | Note 5 | 56,433 | 58,116 | 657,453 | 760,031 | ||||||||||||
| Derivative financial instruments | Note 20 | 216,712 | 185,594 | 180,003 | 165,981 | ||||||||||||
| Inventories | Note 6 | 511,610 | 527,440 | 2,010,008 | 1,938,814 | ||||||||||||
| Advances to suppliers | 69,493 | 78,730 | 268,595 | 293,879 | |||||||||||||
| Related parties | Note 7 | 472,537 | 559,314 | 20,299 | 21,216 | ||||||||||||
| Deferred income and social contribution taxes | Note 12.b | 18,937 | 12,522 | 100,907 | 94,512 | ||||||||||||
| Recoverable taxes | 116,961 | 124,945 | 401,096 | 396,386 | |||||||||||||
| Dividends | 32,629 | 2,204 | - | - | |||||||||||||
| Other assets | 24,682 | 11,768 | 102,815 | 71,935 | |||||||||||||
| 1,865,656 | 1,682,381 | 5,154,307 | 4,807,071 | ||||||||||||||
| Noncurrent assets | |||||||||||||||||
| Long-term receivables | |||||||||||||||||
| Accounts receivable from federal government | Note 15 | - | - | 342,110 | 339,232 | ||||||||||||
| CTNs-Restricted Brazilian Treasury Bills | Note 13 | 36,847 | 34,705 | 242,617 | 228,513 | ||||||||||||
| Deferred income and social contribution taxes | Note 12.b | 234,052 | 177,292 | 645,038 | 576,128 | ||||||||||||
| Advances to suppliers | 31,716 | 20,062 | 85,478 | 65,142 | |||||||||||||
| Related parties | Note 7 | 1,730 | 681 | 76,016 | 77,845 | ||||||||||||
| Recoverable Taxes | - | - | 35,964 | 36,567 | |||||||||||||
| Other assets | 19,355 | 5,049 | 226,873 | 188,605 | |||||||||||||
| Permanent assets | |||||||||||||||||
| Investments | Note 8 | 6,498,076 | 6,464,172 | 208,655 | 207,585 | ||||||||||||
| Property, plant and equipment | Note 9 | 921,081 | 855,163 | 6,173,922 | 5,878,400 | ||||||||||||
| Intangible assets | Note 10 | 394,076 | 395,265 | 2,938,050 | 2,931,775 | ||||||||||||
| 8,136,933 | 7,952,389 | 10,974,723 | 10,529,792 | ||||||||||||||
| Total assets | 10,002,589 | 9,634,770 | 16,129,030 | 15,336,863 | |||||||||||||
3
| Parent Company | Consolidated | ||||||||||||||||
| December 31, 2010 | September 30, 2010 | December 31, 2010 | September 30, 2010 | ||||||||||||||
| Liabilities | |||||||||||||||||
| Current liabilities | |||||||||||||||||
| Loans and financing | Note 13 | 599,485 | 671,878 | 1,129,092 | 1,058,598 | ||||||||||||
| Derivative financial instruments | Note 20 | 369,116 | 96,123 | 379,048 | 96,123 | ||||||||||||
| Trade accounts payable | 168,607 | 197,970 | 754,362 | 832,087 | |||||||||||||
| Salaries payable | 54,969 | 71,925 | 175,629 | 225,489 | |||||||||||||
| Taxes and social contributions payable | Note 11 | 34,783 | 47,230 | 218,783 | 239,154 | ||||||||||||
| Dividends payable | Note 16.b | 7,038 | 7,038 | 7,038 | 7,038 | ||||||||||||
| Related parties | Note 7 | 194,812 | 155,672 | 74,630 | 65,960 | ||||||||||||
| Other liabilities | 47,873 | 51,280 | 180,338 | 198,362 | |||||||||||||
| 1,476,683 | 1,299,116 | 2,918,920 | 2,722,811 | ||||||||||||||
| Noncurrent liabilities | |||||||||||||||||
| Loans and financing | Note 13 | 1,427,300 | 1,612,915 | 5,961,678 | 5,310,811 | ||||||||||||
| Taxes and social contributions payable | Note 11 | 88,428 | 88,184 | 618,657 | 606,302 | ||||||||||||
| Provision for judicial demands | Note 14 | 78,175 | 82,763 | 469,222 | 469,297 | ||||||||||||
| Related parties | Note 7 | 1,405,440 | 920,798 | - | - | ||||||||||||
| Actuarial liability | Note 24 | - | - | 53,644 | 57,774 | ||||||||||||
| Deferred income and social contribution taxes | Note 12.b | 233,642 | 245,003 | 458,624 | 425,496 | ||||||||||||
| Other liabilities | 49,631 | 38,417 | 151,373 | 150,317 | |||||||||||||
| 3,282,616 | 2,988,080 | 7,713,198 | 7,019,997 | ||||||||||||||
| Minority shareholders’ interest | - | - | 253,622 | 246,481 | |||||||||||||
| Shareholders’ equity | Note 16 | ||||||||||||||||
| Capital | 4,691,135 | 4,691,135 | 4,691,135 | 4,691,135 | |||||||||||||
| Capital reserves | 36,110 | 51,484 | 36,110 | 51,484 | |||||||||||||
| Income reserves | 290,817 | 290,817 | 290,817 | 290,817 | |||||||||||||
| Other comprehensive income | (251,120 | ) | (134,307 | ) | (251,120 | ) | (134,307 | ) | |||||||||
| Accumulated income | 476,348 | 448,445 | 476,348 | 448,445 | |||||||||||||
| 5,243,290 | 5,347,574 | 5,243,290 | 5,347,574 | ||||||||||||||
| Total liabilities and shareholders’ equity | 10,002,589 | 9,634,770 | 16,129,030 | 15,336,863 | |||||||||||||
The notes are an integral part of the financial statements.
4
COSAN S.A. INDÚSTRIA E COMÉRCIO
Unaudited statement of operations
Quarters ended December 31, 2010 and 2009
(In thousands of reais, except earnings per share)
| Parent Company | Consolidated | ||||||||||||||||
| December 31, 2010 | December 31, 2009 | December 31, 2010 | December 31, 2009 | ||||||||||||||
| Gross operating sales | |||||||||||||||||
| Sales of goods and services | 545,249 | 514,709 | 5,192,925 | 4,145,134 | |||||||||||||
| Taxes and sales deductions | (38,369 | ) | (35,403 | ) | (454,492 | ) | (344,634 | ) | |||||||||
| Net operating sales | 506,880 | 479,306 | 4,738,433 | 3,800,500 | |||||||||||||
| Cost of goods sold and services rendered | (459,702 | ) | (391,272 | ) | (4,160,523 | ) | (3,340,517 | ) | |||||||||
| Gross profit | 47,178 | 88,034 | 577,910 | 459,983 | |||||||||||||
| Operating income (expenses) | |||||||||||||||||
| Selling expenses | (38,919 | ) | (33,966 | ) | (270,952 | ) | (218,374 | ) | |||||||||
| General and administrative expenses | (66,849 | ) | (55,281 | ) | (132,026 | ) | (117,932 | ) | |||||||||
| Financial, net | Note 18 | 16,627 | (54,963 | ) | (97,808 | ) | (78,285 | ) | |||||||||
| Income (loss) on equity investments | Note 8 | 57,097 | 151,619 | 1,729 | (9,360 | ) | |||||||||||
| Other operating income (expenses), net | Note 19 | (1,590 | ) | 79,363 | (3,647 | ) | 217,012 | ||||||||||
| (33,634 | ) | 86,772 | (502,704 | ) | (206,939 | ) | |||||||||||
| Operating income before income and social contribution taxes | 13,544 | 174,806 | 75,206 | 253,044 | |||||||||||||
| Income and social contribution taxes | |||||||||||||||||
| Current | Note 12.a | - | - | (25,862 | ) | (26,309 | ) | ||||||||||
| Deferred | Note 12.a | 14,359 | (7,677 | ) | (13,796 | ) | (58,948 | ) | |||||||||
| 14,359 | (7,677 | ) | (39,658 | ) | (85,257 | ) | |||||||||||
| Net income before minority interest | 27,903 | 167,129 | 35,548 | 167,787 | |||||||||||||
| Minority interest | - | - | (7,645 | ) | (658 | ) | |||||||||||
| Net income for the period | 27,903 | 167,129 | 27,903 | 167,129 | |||||||||||||
| Earnings per share – in Reais | 0,06870 | 0,41144 | |||||||||||||||
The notes are an integral part of the financial statements.
5
COSAN S.A. INDÚSTRIA E COMÉRCIO
Unaudited statement of operations
Nine month periods ended December 31, 2010 and 2009
(In thousands of reais, except earnings per share)
| Parent Company | Consolidated | ||||||||||||||||
| December 31, 2010 | December 31, 2009 | December 31, 2010 | December 31, 2009 | ||||||||||||||
| Gross operating sales | |||||||||||||||||
| Sales of goods and services | 1,765,191 | 1,741,694 | 14,762,052 | 11,895,875 | |||||||||||||
| Taxes and sales deductions | (106,155 | ) | (93,613 | ) | (1,307,910 | ) | (953,936 | ) | |||||||||
| Net operating sales | 1,659,036 | 1,648,081 | 13,454,142 | 10,941,939 | |||||||||||||
| Cost of goods sold and services rendered | (1,318,246 | ) | (1,377,328 | ) | (11,641,205 | ) | (9,590,439 | ) | |||||||||
| Gross profit | 340,790 | 270,753 | 1,812,937 | 1,351,500 | |||||||||||||
| Operating income (expenses) | |||||||||||||||||
| Selling expenses | (116,182 | ) | (114,353 | ) | (750,779 | ) | (639,261 | ) | |||||||||
| General and administrative expenses | (188,583 | ) | (161,892 | ) | (389,731 | ) | (323,407 | ) | |||||||||
| Financial, net | Note 18 | 144,968 | 331,975 | (156,985 | ) | 434,037 | |||||||||||
| Income (loss) on equity investments | Note 8 | 386,864 | 411,162 | (2,373 | ) | (12,885 | ) | ||||||||||
| Goodwill realized through sale | Note 8 | - | - | - | (85,589 | ) | |||||||||||
| Other operating income (expenses), net | Note 19 | (40,750 | ) | 86,147 | 177,967 | 292,016 | |||||||||||
| 186,317 | 553,039 | (1,121,901 | ) | (335,089 | ) | ||||||||||||
| Operating income before income and social contribution taxes | 527,107 | 823,792 | 691,036 | 1,016,411 | |||||||||||||
| Income and social contribution taxes | |||||||||||||||||
| Current | Note 12.a | - | - | (59,397 | ) | (77,513 | ) | ||||||||||
| Deferred | Note 12.a | (50,759 | ) | (146,027 | ) | (125,918 | ) | (269,460 | ) | ||||||||
| (50,759 | ) | (146,027 | ) | (185,315 | ) | (346,973 | ) | ||||||||||
| Net income before minority interest | 476,348 | 677,765 | 505,721 | 669,438 | |||||||||||||
| Minority interest | - | - | (29,373 | ) | 8,327 | ||||||||||||
| Net income for the period | 476,348 | 677,765 | 476,348 | 677,765 | |||||||||||||
| Earnings per share – in Reais | 1,17279 | 1,66855 | |||||||||||||||
The notes are an integral part of the financial statements.
6
COSAN S.A. INDÚSTRIA E COMÉRCIO
Unaudited statement of changes in shareholders’ equity
Quarter ended December 31, 2010
(In thousands of reais)
| Unconsolidated and Consolidated | ||||||||||||||||||||||||
Capital | Capital reserve | Income reserve | Accumulated income | Other comprehensive income | Total | |||||||||||||||||||
| Balance on September 30, 2010 | 4,691,135 | 51,484 | 290,817 | 448,445 | (134,307 | ) | 5,347,574 | |||||||||||||||||
| Other comprehensive income | - | - | - | - | (116,813 | ) | (116,813 | ) | ||||||||||||||||
| Treasury shares | - | (15,219 | ) | - | - | - | (15,219 | ) | ||||||||||||||||
| Proportionate share on stock issuance costs of investee | - | (839 | ) | - | - | - | (839 | ) | ||||||||||||||||
| Recorded granted options | - | 684 | - | - | - | 684 | ||||||||||||||||||
| Net income in the period | - | - | - | 27,903 | - | 27,903 | ||||||||||||||||||
| Balance on December 31, 2010 | 4,691,135 | 36,110 | 290,817 | 476,348 | (251,120 | ) | 5,243,290 | |||||||||||||||||
The notes are an integral part of the financial statements.
7
COSAN S.A. INDÚSTRIA E COMÉRCIO
Unaudited statement of changes in shareholders’ equity
Periods of nine months ended December 31, 2010
(In thousands of reais)
| Unconsolidated and Consolidated | ||||||||||||||||||||||||
Capital | Capital reserve | Income reserve | Accumulated income | Other comprehensive income | Total | |||||||||||||||||||
| Balance on March 31, 2010 | 4,687,826 | 50,626 | 374,248 | - | (2,944 | ) | 5,109,756 | |||||||||||||||||
| Capital increase | 3,309 | - | - | - | - | 3,309 | ||||||||||||||||||
| Other comprehensive income | - | - | - | - | (248,176 | ) | (248,176 | ) | ||||||||||||||||
| Treasury shares | - | (15,219 | ) | - | - | - | (15,219 | ) | ||||||||||||||||
| Proportionate share on stock issuance costs of investee | - | (839 | ) | - | - | - | (839 | ) | ||||||||||||||||
| Recorded granted options | - | 1,542 | - | - | - | 1,542 | ||||||||||||||||||
| Dividends | - | - | (83,431 | ) | - | - | (83,431 | ) | ||||||||||||||||
| Net income in the period | - | - | - | 476,348 | - | 476,348 | ||||||||||||||||||
| Balance on December 31, 2010 | 4,691,135 | 36,110 | 290,817 | 476,348 | (251,120 | ) | 5,243,290 | |||||||||||||||||
The notes are an integral part of the financial statements.
8
COSAN S.A. INDÚSTRIA E COMÉRCIO
Unaudited statements of cash flows
Quarters ended December 31, 2010 and 2009
(In thousands of reais)
| Parent Company | Consolidated | |||||||||||||||
| December 31, 2010 | December 31, 2009 | December 31, 2010 | December 31, 2009 | |||||||||||||
| Cash flows from operating activities | ||||||||||||||||
| Net income for the period | 27,903 | 167,129 | 27,903 | 167,129 | ||||||||||||
| Adjustments to reconcile net income for the period to cash provided by operating activities | ||||||||||||||||
| Depreciation and amortization | 57,345 | 46,141 | 239,241 | 149,671 | ||||||||||||
| Losses (income) on equity investments | (57,097 | ) | (151,619 | ) | (1,729 | ) | 9,360 | |||||||||
| Income from disposal of permanent assets | 32 | 43 | 2,092 | 1,053 | ||||||||||||
| Deferred income and social contribution taxes | (14,359 | ) | 7,677 | 13,796 | 58,948 | |||||||||||
| Set-up (reversal) of provision for legal claims, net | (1,792 | ) | 214 | 3,967 | 4,137 | |||||||||||
| Minority interest | - | - | 7,645 | 658 | ||||||||||||
| Recorded granted options | 684 | (76 | ) | 684 | (76 | ) | ||||||||||
| Interest, monetary and exchange variation, net | 21,755 | 42,101 | 61,611 | (47,873 | ) | |||||||||||
| Net earnings from adhesion to tax payment in installments | - | (79,433 | ) | - | (211,649 | ) | ||||||||||
| Other | (780 | ) | (1,764 | ) | (1,633 | ) | 5,246 | |||||||||
| 33,691 | 30,413 | 353,577 | 136,604 | |||||||||||||
| Changes in assets and liabilities | ||||||||||||||||
| Trade accounts receivables | 2,630 | 39,173 | 135,504 | 76,491 | ||||||||||||
| Inventories | 15,529 | (117,182 | ) | (57,471 | ) | (342,805 | ) | |||||||||
| Recoverable taxes | 7,984 | 7,150 | (4,107 | ) | 24,555 | |||||||||||
| Advances to suppliers | (2,417 | ) | 6,575 | 4,948 | 48,173 | |||||||||||
| Suppliers | (29,363 | ) | 5,598 | (77,725 | ) | (492 | ) | |||||||||
| Salaries payable | (16,956 | ) | (20,544 | ) | (49,860 | ) | (48,002 | ) | ||||||||
| Taxes payable | (14,480 | ) | 6,428 | (23,200 | ) | 8,059 | ||||||||||
| Derivative financial instruments and restricted cash | (135,414 | ) | 7,631 | (108,386 | ) | 20,375 | ||||||||||
| Other assets and liabilities, net | (33,183 | ) | (18,182 | ) | (105,980 | ) | 46,899 | |||||||||
| (205,670 | ) | (83,353 | ) | (286,277 | ) | (166,747 | ) | |||||||||
| Net cash generated (used) from operating activities | (171,979 | ) | (52,940 | ) | 67,300 | (30,143 | ) | |||||||||
| Cash flows from investments activities | ||||||||||||||||
| Acquisition of investments, net of cash received and goodwill | - | (29,471 | ) | - | (14,732 | ) | ||||||||||
| Addition to property, plant and equipment, software and other intangible assets | (112,034 | ) | (53,944 | ) | (548,755 | ) | (400,983 | ) | ||||||||
| Cash from the sale of other permanent assets | 480 | 203 | 2,199 | 1,783 | ||||||||||||
| Net cash used in investment activities | (111,554 | ) | (83,212 | ) | (546,556 | ) | (413,932 | ) | ||||||||
9
COSAN S.A. INDÚSTRIA E COMÉRCIO
Notes to the unaudited financial statements
Nine month periods ended December 31, 2010 and 2009
(In thousands of reais, except as otherwise specified)
| Parent Company | Consolidated | |||||||||||||||
| December 31, 2010 | December 31, 2009 | December 31, 2010 | December 31, 2009 | |||||||||||||
| Cash flows from financing activities | ||||||||||||||||
| Loans and financing funded | 28,174 | 1,136,396 | 1,101,215 | 1,665,512 | ||||||||||||
| Amortization of principal and interest on loans and financings | (303,576 | ) | (1,335,786 | ) | (458,225 | ) | (1,838,413 | ) | ||||||||
| Related parties | 93,578 | 136,382 | - | - | ||||||||||||
| Aquisition treasury shares | (15,219 | ) | - | (15,219 | ) | - | ||||||||||
| Export pre-payment financing subsidiary | 504,191 | - | - | - | ||||||||||||
| Capital increase | - | 532,406 | - | 532,406 | ||||||||||||
| Net cash generated by financing activities | 307,148 | 469,398 | 627,771 | 359,505 | ||||||||||||
| Net increase (decrease) in cash and cash equivalents | 23,615 | 333,246 | 148,515 | (84,570 | ) | |||||||||||
| Cash and cash equivalents at the beginning of the period | 45,798 | 177,599 | 988,367 | 948,647 | ||||||||||||
| Cash and cash equivalents at the end of the period | 69,413 | 510,845 | 1,136,882 | 864,077 | ||||||||||||
The notes are an integral part of the financial statements.
10
COSAN S.A. INDÚSTRIA E COMÉRCIO
Notes to the unaudited financial statements
Nine month periods ended December 31, 2010 and 2009
(In thousands of reais, except as otherwise specified)
| Parent Company | Consolidated | |||||||||||||||
| December 31, 2010 | December 31, 2009 | December 31, 2010 | December 31, 2009 | |||||||||||||
| Cash flows from operating activities | ||||||||||||||||
| Net income for the period | 476,348 | 677,765 | 476,348 | 677,765 | ||||||||||||
| Adjustments to reconcile net income for the period to cash provided by operating activities | ||||||||||||||||
| Depreciation and amortization | 186,735 | 162,957 | 714,859 | 476,393 | ||||||||||||
| Losses (income) on equity investments | (386,864 | ) | (411,162 | ) | 2,373 | 12,885 | ||||||||||
| Loss (income) from disposal of permanent assets | 1,731 | (84 | ) | (6,626 | ) | (101,284 | ) | |||||||||
| Goodwill amortization and realized through sale | - | - | - | 85,589 | ||||||||||||
| Deferred income and social contribution taxes | 50,759 | 146,027 | 125,918 | 269,460 | ||||||||||||
| Set-up (reversal) of provision for legal claims, net | 12,067 | (1,283 | ) | 38,255 | 7,519 | |||||||||||
| Minority interest | - | - | 29,373 | (8,327 | ) | |||||||||||
| Recorded granted options | 1,542 | 8,467 | 1,542 | 8,467 | ||||||||||||
| Interest, monetary and exchange variation, net | 6,615 | (288,900 | ) | 168,196 | (419,670 | ) | ||||||||||
| Capital Gain | - | - | (223,074 | ) | - | |||||||||||
| Net earnings from adhesion to tax payment in installments | - | (79,433 | ) | - | (211,649 | ) | ||||||||||
| Other | (1,993 | ) | (12,401 | ) | 713 | 3,747 | ||||||||||
| 346,940 | 201,953 | 1,327,877 | 800,895 | |||||||||||||
| Changes in assets and liabilities | ||||||||||||||||
| Trade accounts receivables | 165,725 | 44,143 | 135,383 | 165,321 | ||||||||||||
| Inventories | (204,940 | ) | (203,653 | ) | (767,799 | ) | (503,179 | ) | ||||||||
| Recoverable taxes | 1,026 | (20,162 | ) | (64,178 | ) | (8,899 | ) | |||||||||
| Advances to suppliers | (27,094 | ) | (35,523 | ) | (54,780 | ) | (7,870 | ) | ||||||||
| Suppliers | 52,244 | 84,873 | 184,963 | 96,225 | ||||||||||||
| Salaries payable | 6,210 | 11,156 | 34,045 | 21,953 | ||||||||||||
| Taxes payable | (13,794 | ) | 12,370 | (17,991 | ) | (45,093 | ) | |||||||||
| Derivative financial instruments and restricted cash | (293,718 | ) | (58,607 | ) | (252,251 | ) | (43,393 | ) | ||||||||
| Other assets and liabilities, net | (61,955 | ) | (24,120 | ) | (112,343 | ) | 36,207 | |||||||||
| (376,296 | ) | (189,523 | ) | (914,951 | ) | (288,728 | ) | |||||||||
| Net cash generated (used) from operating activities | (29,356 | ) | 12,430 | 412,926 | 512,167 | |||||||||||
| Cash flows from investments activities | ||||||||||||||||
| Acquisition of investments, net of cash received and goodwill | (12,720 | ) | (48,715 | ) | (16,467 | ) | 14,642 | |||||||||
| Addition to property, plant and equipment, software and other intangible assets | (324,853 | ) | (139,394 | ) | (1,548,069 | ) | (1,180,696 | ) | ||||||||
| Cash from the sale of other permanent assets | 854 | 512 | 20,105 | 120,964 | ||||||||||||
| Dividends receivables | 100,100 | - | - | - | ||||||||||||
| Net cash used in investment activities | (236,619 | ) | (187,597 | ) | (1,544,431 | ) | (1,045,090 | ) | ||||||||
11
COSAN S.A. INDÚSTRIA E COMÉRCIO
Notes to the unaudited financial statements
Nine month periods ended December 31, 2010 and 2009
(In thousands of reais, except as otherwise specified)
| Parent Company | Consolidated | |||||||||||||||
| December 31, 2010 | December 31, 2009 | December 31, 2010 | December 31, 2009 | |||||||||||||
| Cash flows from financing activities | ||||||||||||||||
| Loans and financing funded | 445,264 | 1,188,635 | 2,239,488 | 2,884,171 | ||||||||||||
| Amortization of principal and interest on loans and financing | (672,700 | ) | (1,516,692 | ) | (1,244,593 | ) | (2,283,521 | ) | ||||||||
| Related parties | (22,418 | ) | 91,563 | - | (456,786 | ) | ||||||||||
| Aquisition treasury shares | (15,219 | ) | - | (15,219 | ) | - | ||||||||||
| Export pre-payment financing subsidiary | 504,191 | - | - | - | ||||||||||||
| Capital increase | 3,309 | 533,780 | 403,309 | 533,780 | ||||||||||||
| Dividends payments | (192,964 | ) | - | (192,964 | ) | - | ||||||||||
| Net cash generated by financing activities | 49,463 | 297,286 | 1,190,021 | 677,644 | ||||||||||||
| Net increase (decrease) in cash and cash equivalents | (216,512 | ) | 122,119 | 58,516 | 144,721 | |||||||||||
| Cash and cash equivalents at the beginning of the period | 285,925 | 388,726 | 1,078,366 | 719,356 | ||||||||||||
| Cash and cash equivalents at the end of the period | 69,413 | 510,845 | 1,136,882 | 864,077 | ||||||||||||
The notes are an integral part of the financial statements.
12
COSAN S.A. INDÚSTRIA E COMÉRCIO
Notes to the unaudited financial statements
Nine month periods ended December 31, 2010 and 2009
(In thousands of reais, except as otherwise specified)
| 1. | Operations |
Cosan S.A. Indústria e Comércio ("Company" or "Cosan"), headquartered in the city of Barra Bonita, São Paulo, is a publicly-held Company, controlled by Cosan Limited, headquartered in Ilhas Bermudas, which holds 62.2% of its capital stock.
Currently, the primary activities of Cosan, and its subsidiaries are (i) the manufacturing and trading of sugar and ethanol, as well as energy cogeneration from sugarcane bagasse, (ii) the distribution of fuel and lubricants, and (iii) logistics transportation, warehousing and port lifting services.
Joint venture with Shell International Petroleum Company (“Shell”)
On August 25, 2010, in accordance with their quarterly financial statements for the year ended September 30, 2010, the Company announced the conclusion of the negotiations with Shell and, together, they have signed definitive contracts establishing the proposed Joint Venture ("JV") involving certain of their respective assets.
On January 4, 2011, the Company received the unconditional release from the European Commission to establish the proposed JV. The Company and Shell are focusing their efforts in the conclusion of other precedent conditions of the agreement and in the integration process of their business units for the launch of the proposed JV. In addition, JV is being analyzed by the Administrative Council of Economic Defense – CADE.
| 2. | Basis of preparation and presentation of the quarterly financial statements |
The Company's quarterly financial statements were prepared based on the accounting standards adopted in Brazil and on the rules issued by the Brazilian Securities and Exchange Commission ("CVM"), observing the accounting guidelines set forth in the corporate law (Law Nº 6404/76) which include the new provisions established, amended and repealed by Laws 11638/07 and 11941/09, as well as standards, guidelines and interpretations issued by the Accounting Standards Board ("CPC"). These quarterly financial statements were approved by the Board of Directors of the Company on February 3, 2011.
During 2009 the CPC issued, and CVM approved, several standards, interpretations and guidelines requiring companies to present new quarterly financial statements for the comparative year. These standards are mandatory only for fiscal years beginning on or after January 1, 2010 with the requirement to present comparative figures.
13
COSAN S.A. INDÚSTRIA E COMÉRCIO
Notes to the unaudited financial statements (Continued)
Nine month periods ended December 31, 2010 and 2009
(In thousands of reais, except as otherwise specified)
| 2. | Basis of preparation and presentation of the quarterly financial statements (Continued) |
CVM, through Resolution 603, of November 10, 2009 and amendments, authorized the publicly-held companies to adopt in advance these pronouncements for the year ended December 31, 2009, provided that these pronouncements were fully adopted.
In addition, it has also provided for the presentation of the quarterly financial statements for the fiscal year of 2010 in accordance with the accounting standards effective since December 31, 2009, with the requirement to disclose the Note describing the main modifications that may have an impact on the financial statements for the year-end, as well as an estimate for the possible effects on the shareholder's equity and on the Company's results, or the clarifications of the reasons that may prevent the company from presenting this estimate. In the case this option is adopted, the companies must present again the financial statements for the quarters ended in 2010, as compared to 2009, also adjusted in accordance with the rules for 2010, at least as regards to the presentation of the financial statements for the first quarter commencing as fro m April 2011.
The Company decided to present its information for the first and second quarters of 2010 in accordance with the rules effective up to December 31, 2009, considering that the adjustments according to the international accounting standards require review of flows, internal controls, systems and other material aspects, which are still in progress and, therefore, the Company is not able to currently present accurate estimates related to the possible effects. However, the Company, in its Best judgment, has carried out the evaluation of the technical pronouncements already issued and concluded that, at the exemption of the below mentioned technical pronouncements, the other pronouncements will not have a relevant impact on the equity and financial condition individual and consolidated of the Company, considering the transactions existent up to the da te of this quarterly information:
| · | CPC 15 – Business combinations |
| · | CPC 16 – Inventories |
| · | CPC 20 – Borrowing costs |
| · | CPC 22 – Segment reporting |
| · | CPC 24 – Subsequent event |
| · | CPC 26 – Presentation of financial statements |
| · | CPC 27 – Property, plant and equipment |
| · | CPC 29 – Biological assets and agricultural products |
| · | CPC 36 – Consolidated Statements |
| · | CPC 37 – First time adoption of International Accounting Standards and CPC 43 Initial adoption of CPC standards 15 through 40 |
| · | CPC 38 – Financial Instruments: Recognition and Measurement |
| · | CPC 39 – Financial Instruments: Presentation |
| · | CPC 40 – Financial Instruments: Disclosure |
14
COSAN S.A. INDÚSTRIA E COMÉRCIO
Notes to the unaudited financial statements (Continued)
Nine month periods ended December 31, 2010 and 2009
(In thousands of reais, except as otherwise specified)
| 3. | Summary of Significant Accounting Policies |
The quarterly financial statements have been prepared according to principles, policies and criteria consistent with those adopted for the preparation of the financial statements as of March 31, 2010 and of the quarterly financial statements as of September 30, 2010, and must be read in conjunction with them.
Derivative financial instruments of protection (hedge)
During the nine months ended December 31, 2010, the Company adopted the hedge accounting following the provisions established by the Technical Guideline OCPC 03, of November 19, 2009.
Generally, the derivative financial instruments are evaluated according to their fair value in contrast of the result.
Some derivative financial instruments may be designated as hedge accounting according to three types of transactions: (i) cash flow hedge, (ii) fair value hedge or (iii) net investment hedge in a cross-border transaction.
Cash flow hedge
In respect of the cash flow hedge, the effective portion of the gain or loss from the hedge instrument which is considered as an effective hedge is directly recognized in shareholders’ equity, in line item Adjustment to Shareholders’ Equity. The ineffective portion of the gain or loss from the hedge instrument is directly recognized in net income (loss) for the period as operating income or expense.
Fair value hedge and cross-border net investment hedge
The Company does not have any derivative financial instruments designated in these types of transactions.
Other financial instruments not classified as hedge instruments
Derivative instruments not classified in the definition of hedge accounting are recorded at fair value against net income (loss).
The effects resulting from the adoption of the hedge accounting are described in Note 20 to the financial statements.
15
COSAN S.A. INDÚSTRIA E COMÉRCIO
Notes to the unaudited financial statements (Continued)
Nine month periods ended December 31, 2010 and 2009
(In thousands of reais, except as otherwise specified)
| 3. | Summary of Significant Accounting Policies (Continued) |
Consolidation of quarterly information
The consolidated quarterly information was prepared in accordance with the basic consolidation principles, including the following main procedures: (i) elimination of asset and liability accounts amongst the consolidated companies; (ii) elimination of investments, proportionally to the parent company’s interest in the subsidiaries’ shareholders’ equity; (iii) elimination of revenues and expenses resulting from the businesses carried out amongst the consolidated companies; and (iv) elimination of unrealized revenues arising from consolidated intercompany transactions, as necessary.
The consolidated companies are listed below:
| Direct and indirect interest as of | ||||||||
| 12/31/10 | 09/30/10 | |||||||
| Administração de Participações Aguassanta Ltda. | 91.5 | % | 91.5 | % | ||||
| Cosan S.A Açúcar e Álcool | 99.6 | % | 99.6 | % | ||||
| Águas da Ponte Alta S.A. | 99.6 | % | 99.6 | % | ||||
| Vale da Ponte Alta S.A. | 99.6 | % | 99.6 | % | ||||
| Agrícola Ponte Alta S.A. | 99.6 | % | 99.6 | % | ||||
| Cosan Centroeste S.A. Açúcar e Álcool | 99.6 | % | 99.6 | % | ||||
| Barra Bioenergia S.A. | 99.6 | % | 99.6 | % | ||||
| DaBarra Alimentos S.A. | 99.6 | % | 99.6 | % | ||||
| Bonfim Nova Tamoio – BNT Agrícola Ltda. | 99.6 | % | 99.6 | % | ||||
| Benálcool Açúcar e Álcool S.A. | 99.6 | % | 99.6 | % | ||||
| Barrapar Participações Ltda. | 99.6 | % | 99.6 | % | ||||
| Aliança Indústria e Comercio de açúcar e Álcool S.A. | 99.6 | % | 99.6 | % | ||||
| Agrobio Investimentos e Participações S.A. | 99.6 | % | 99.6 | % | ||||
| Bioinvestments Negócios e Partipações S.A. | 99.6 | % | 99.6 | % | ||||
| Proud Participações S.A. | 99.9 | % | 99.9 | % | ||||
| Cosan Distribuidora de Combustíveis Ltda. | 99.9 | % | 99.9 | % | ||||
| Executive Participações Limitada | 99.9 | % | 99.9 | % | ||||
| Cosan S.A. Bioenergia | 100.0 | % | 100.0 | % | ||||
| Cosan Biotecnologia S.A. | 100.0 | % | 100.0 | % | ||||
| Cosan International Universal Corporation | 100.0 | % | 100.0 | % | ||||
| Cosan Finance Limited | 100.0 | % | 100.0 | % | ||||
| Cosan Overseas Limited | 100.0 | % | 100.0 | % | ||||
| Grançucar S.A. Refinadora de Açúcar | 100.0 | % | 100.0 | % | ||||
| Cosan Combustíveis e Lubrificantes S.A. | 100.0 | % | 100.0 | % | ||||
| Copsapar Participações S.A. | 90.0 | % | 90.0 | % | ||||
| Novo Rumo Logística S.A. (1) | 92.9 | % | 92.9 | % | ||||
| Rumo Logística S.A. (1) | 69.7 | % | 69.7 | % | ||||
| Cosan Operadora Portuária S.A. (1) | 69.7 | % | 69.7 | % | ||||
| Teaçú Armazéns Gerais S.A. (1) | 69.7 | % | 69.7 | % | ||||
| Pasadena Empreendimentos e Participações S.A. | 100.0 | % | 100.0 | % | ||||
| Teas Terminal Exportador de Álcool de Santos S.A. | 66.7 | % | 66.7 | % | ||||
| Cosan Alimentos S.A. and subsidiaries | 100.0 | % | 100.0 | % | ||||
| (1) | Company incorporated on October 20, 2010, located at Cayman Island through the increase in capital of the amount of US$50 thousand. The mentioned company was used in the process of raising perpetual notes in the amount of R$514,830, equivalent to US$300,000 thousand (note13). |
16
COSAN S.A. INDÚSTRIA E COMÉRCIO
Notes to the unaudited financial statements (Continued)
Nine month periods ended December 31, 2010 and 2009
(In thousands of reais, except as otherwise specified)
4. Cash and cash equivalents
| Parent company | Consolidated | |||||||||||||||
| 12/31/10 | 09/30/10 | 12/31/10 | 09/30/10 | |||||||||||||
| Cash | 141 | 143 | 752 | 256 | ||||||||||||
| Overnight investments | - | - | 16,960 | 23,936 | ||||||||||||
| Banks current account | 15,242 | 4,283 | 67,231 | 66,920 | ||||||||||||
| Amounts pending foreign exchange closing | 1,396 | 2,577 | 16,135 | 5,182 | ||||||||||||
| Financial investments | 52,634 | 38,795 | 1,035,804 | 892,073 | ||||||||||||
| 69,413 | 45,798 | 1,136,882 | 988,367 | |||||||||||||
The balance of Overnight investments refers to financial investments in US dollars made with highly-rated banks, is remunerated according to the Federal Funds rate and may be promptly redeemed.
Amounts pending foreign exchange closing refer to receipts of funds in foreign currency from customers located abroad, whose foreign exchange closing with the applicable financial institutions had not occurred until December 31, 2010.
The balances of financial investments mainly correspond to investments in Bank Deposit Certificates - CDB, allowing immediate redemption, are made with highly-rated banks and accrue in average 100.7% of the Interbank Deposit Certificate - CDI.
5. Trade Accounts Receivable
| Parent company | Consolidated | |||||||||||||||
| 12/31/10 | 09/30/10 | 12/31/10 | 09/30/10 | |||||||||||||
| Domestic | 31,994 | 42,603 | 609,393 | 626,583 | ||||||||||||
| International | 25,439 | 16,594 | 96,319 | 189,195 | ||||||||||||
| (-) Allowance for doubtful accounts | (1,000 | ) | (1,081 | ) | (48,259 | ) | (55,747 | ) | ||||||||
| 56,433 | 58,116 | 657,453 | 760,031 | |||||||||||||
| 6. | Inventories |
| Parent company | Consolidated | |||||||||||||||
| 12/31/10 | 09/30/10 | 12/31/10 | 09/30/10 | |||||||||||||
| Finished goods: | ||||||||||||||||
| Sugar | 188,388 | 222,835 | 582,665 | 569,516 | ||||||||||||
| Ethanol | 124,287 | 138,506 | 501,011 | 561,625 | ||||||||||||
| Fuels and lubricants | - | - | 335,330 | 301,566 | ||||||||||||
| Harvest costs | 136,048 | 108,375 | 367,355 | 312,051 | ||||||||||||
| Supplies and other | 70,526 | 65,363 | 252,474 | 223,736 | ||||||||||||
| (-) Provision for inventory realization and obsolescence | (7,639 | ) | (7,639 | ) | (28,827 | ) | (29,680 | ) | ||||||||
| 511,610 | 527,440 | 2,010,008 | 1,938,814 | |||||||||||||
17
COSAN S.A. INDÚSTRIA E COMÉRCIO
Notes to the unaudited financial statements (Continued)
Nine month periods ended December 31, 2010 and 2009
(In thousands of reais, except as otherwise specified)
| 7. | Related parties |
| Asset | ||||||||||||||||
| Parent company | Consolidated | |||||||||||||||
| 31/12/10 | 30/09/10 | 31/12/10 | 30/09/10 | |||||||||||||
| Cosan S.A. Açúcar e Álcool | 388,941 | 546,164 | - | - | ||||||||||||
| Rezende Barbosa S.A. Administração e Participações | - | - | 83,333 | 85,404 | ||||||||||||
| Cosan Alimentos S.A. | 69,803 | - | - | - | ||||||||||||
| Vertical UK LLP | 9,246 | 8,970 | 12,622 | 13,094 | ||||||||||||
| Others | 6,277 | 4,861 | 360 | 563 | ||||||||||||
| 474,267 | 559,995 | 96,315 | 99,061 | |||||||||||||
| Current assets | (472,537 | ) | (559,314 | ) | (20,299 | ) | (21,216 | ) | ||||||||
| Non current assets | 1,730 | 681 | 76,016 | 77,845 | ||||||||||||
| Liabilities | ||||||||||||||||
| Parent company | Consolidated | |||||||||||||||
| 31/12/10 | 30/09/10 | 31/12/10 | 30/09/10 | |||||||||||||
| Cosan Finance Limited | 657,871 | 658,099 | - | - | ||||||||||||
| CCL Finance Limited | 304,581 | 302,500 | - | |||||||||||||
| Cosan Overseas Limited | 506,373 | - | - | - | ||||||||||||
Rezende Barbosa S.A. Administração e Participações} | - | - | 72,240 | 59,773 | ||||||||||||
| Cosan Combustíveis e Lubrificantes S.A. | 47,353 | 55,758 | - | - | ||||||||||||
| Logispot Armazéns Gerais S.A. | - | - | - | 3,748 | ||||||||||||
| Others | 84,074 | 60,113 | 2,390 | 2,439 | ||||||||||||
| 1,600,252 | 1,076,470 | 74,630 | 65,960 | |||||||||||||
| Current liabilities | (194,812 | ) | (155,672 | ) | (74,630 | ) | (65,960 | ) | ||||||||
| Non current liabilities | 1,405,440 | 920,798 | - | - | ||||||||||||
| Parent company | ||||||||||||||||
| 01/10/10 to 31/12/10 | 01/04/10 to 31/12/10 | 01/10/09 to 31/12/09 | 01/04/09 to 31/12/09 | |||||||||||||
| Asset balance transactions | ||||||||||||||||
| Fund remittances, net of receipts and credit assignments | (50,413 | ) | (61,408 | ) | 15,543 | 692,831 | ||||||||||
| Capital increase in subsidiary through conversion of credits | (8,449 | ) | (41,201 | ) | - | - | ||||||||||
| Sales of finished products, inputs and services (1) | 99,014 | 487,373 | 45,017 | 109,028 | ||||||||||||
| Purchases of finished products, inputs and services (1) | (141,620 | ) | (439,034 | ) | (167,794 | ) | (531,686 | ) | ||||||||
| Sales of finished products, inputs and services to affiliate and related companies | 15,276 | 71,684 | 11,319 | 66,722 | ||||||||||||
| Financial income | 464 | 5,470 | 8,978 | 17,027 | ||||||||||||
| (85,728 | ) | 22,884 | (86,937 | ) | 353,922 | |||||||||||
| Liability balance transactions | ||||||||||||||||
| Fund raising | 15,557 | 46,050 | 54,169 | 124,008 | ||||||||||||
| Export per-payment financing | 504,191 | 504,191 | - | 321,755 | ||||||||||||
| Financial expense (revenue) | 4,034 | (10,781 | ) | (1,367 | ) | (182,230 | ) | |||||||||
| 523,782 | 539,460 | 52,802 | 263,533 | |||||||||||||
18
COSAN S.A. INDÚSTRIA E COMÉRCIO
Notes to the unaudited financial statements (Continued)
Nine month periods ended December 31, 2010 and 2009
(In thousands of reais, except as otherwise specified)
| (1) | It consists of operations carried out between Cosan's direct and indirect subsidiaries included in the consolidation. |
| 7. | Related parties (Continued) |
| Consolidated | ||||||||||||||||
| 01/10/10 to 31/12/10 | 01/04/10 to 31/12/10 | 01/10/09 to 31/12/09 | 01/04/09 to 31/12/09 | |||||||||||||
| Asset balance transactions | ||||||||||||||||
| Net receipts of sales of finished products, inputs and services to affiliate and related companies | (61,021 | ) | (190,736 | ) | (40,317 | ) | (207,332 | ) | ||||||||
| Sales of finished products, inputs and services to affiliate and related companies | 58,275 | 180,781 | 41,388 | 185,923 | ||||||||||||
| Merged assets | - | - | - | 138,682 | ||||||||||||
| (2,746 | ) | (9,955 | ) | 1,071 | 117,273 | |||||||||||
| Liability balance transactions | ||||||||||||||||
| Net payments of purchase of sugarcane raw materials from related companies | (52,164 | ) | (243,350 | ) | 3,635 | (99,595 | ) | |||||||||
| Purchase of sugarcane raw materials from related companies | 60,834 | 303,564 | 44,350 | 151,711 | ||||||||||||
| Payment of debt assumption (Floating Rate Notes) | - | - | - | (322,333 | ) | |||||||||||
| Financial income | - | - | (1,367 | ) | (78,615 | ) | ||||||||||
| 8,670 | 60,214 | 46,618 | (348,832 | ) | ||||||||||||
The purchase and sale transactions are carried out at prices and under conditions similar to those existing in the market.
The accounts receivable of Cosan S.A Açúcar e Álcool as of December 31, 2010, corresponds to funds remitted to its indirect subsidiary Cosan Centroeste S.A., which remittances were made for account and at the order of such subsidiary and which bear no interest.
The accounts payable to Rezende Barbosa S.A. Administração e Participações (“Rezende Barbosa”) refers to the purchase of sugarcane raw materials to be settled during the current year. Moreover, the balance receivable refers to the credits assumed by Rezende Barbosa, in connection with the acquisition of Cosan Alimentos.
The account receivable from Cosan Alimentos S.A. refers to cash transfer which bears no remuneration.
19
COSAN S.A. INDÚSTRIA E COMÉRCIO
Notes to the unaudited financial statements (Continued)
Nine month periods ended December 31, 2010 and 2009
(In thousands of reais, except as otherwise specified)
| 7. | Related parties (Continued) |
The accounts receivable from the subsidiary Vertical UK LLP refers to the sale of ethanol, the receipt term of which is 30 days and to loan contracts, equivalent to USD$2,991 thousand, remunerated at the annual rate of 3% plus exchange rate variation of US dollar.
The accounts payable to Cosan Finance Limited refers to future sugar export prepayment loan agreements to be settled in 2014, 2015 and 2016, which are subject to the US dollar exchange variation and Libor annual interest rate, plus spread from 4.75% to 4.85% per year.
The accounts payable to CCL Finance Limited refers to prepayment contracts for future sugar exports to be settled in 2014, which is subject to US Dollar exchange variation and annual interest of 9.5%.
The accounts payable to Cosan Overseas Limited refers to prepayment contracts for future sugar exports to be settled in 2015, which is subject to US Dollar exchange variation and annual interest of 9.5%.
The accounts payable to Cosan CL refers to financial funds remitted to the Company, without interest.
The balance payable to Logispot Armazéns Gerais S.A. referred to the outstanding payment of interest acquired.
At December 31, 2010, the Company and its subsidiary Cosan Açúcar e Álcool were lessees of approximately 68,000 hectares of related companies land (unaudited information). Moreover, the Company acquired in the three- and nine-month periods ended December 31, 2010 1,183 and 6,003 thousand tons of sugarcane, respectively, from Rezende Barbosa (739 and 2,854 thousand on December 31, 2009) respectively (information not reviewed by the independent auditors). These operations are carried out under conditions and prices similar to those prevailing in the market, calculated based on sugarcane tons per hectare, valued in accordance with the price established by CONSECANA.
20
COSAN S.A. INDÚSTRIA E COMÉRCIO
Notes to the unaudited financial statements (Continued)
Nine month periods ended December 31, 2010 and 2009
(In thousands of reais, except as otherwise specified)
| 8. | Investments |
Parent company | ||||||||||||||||||||||||||||||||||||||||
Investees | Investor | |||||||||||||||||||||||||||||||||||||||
Shareholders' equity | Statement of income | Partnership interests | Investments | Equity method} | ||||||||||||||||||||||||||||||||||||
31/12/10 | 01/04/10 to 31/12/10 | 31/12/10 | 30/09/10 | 31/12/10 | 30/09/10 | 01/10/10 to 31/12/10 | 01/04/10 to 31/12/10 | 01/10/09 to 31/12/09 | 01/04/09 to 31/12/09 | |||||||||||||||||||||||||||||||
| Administração de Participações Aguassanta Ltda. | 139,748 | (1,656 | ) | 91.5 | 91.5 | 127,867 | 127,630 | 237 | (1,515 | ) | 5,506 | 9,312 | ||||||||||||||||||||||||||||
| Cosan S.A. Açúcar e Álcool | 2,821,654 | (33,444 | ) | 95.1 | 95.1 | 2,682,744 | 2,708,033 | 5,137 | (31,798 | ) | 116,263 | 197,216 | ||||||||||||||||||||||||||||
| Copsapar Participações S.A.. | 399,294 | 203,561 | 90.0 | 90.0 | 359,365 | 348,040 | 11,904 | 186,102 | 1,403 | (7,499 | ) | |||||||||||||||||||||||||||||
| Novo Rumo Logística S.A. | 559,983 | 285,982 | 28.8 | 28.8 | 161,387 | 156,292 | 5,355 | 83,723 | 631 | 1,599 | ||||||||||||||||||||||||||||||
| TEAS - Terminal Exportador de Álcool de Santos S.A. (2) | 48,748 | 1,127 | 66.7 | 66.7 | 39,799 | 39,590 | 209 | 678 | 146 | 507 | ||||||||||||||||||||||||||||||
| Cosan S.A. Bioenergia | 137,464 | 5,830 | 100.0 | 100.0 | 137,464 | 140,055 | (2,591 | ) | 5,830 | (7,339 | ) | (3,534 | ) | |||||||||||||||||||||||||||
| Radar Propriedades Agrícolas S.A. | 886,461 | 19,928 | 18.9 | 18.9 | 167,709 | 166,641 | 1,069 | 3,302 | (441 | ) | 623 | |||||||||||||||||||||||||||||
| Cosan International Universal Corporation | 567 | (2 | ) | 100.0 | 100.0 | 567 | 577 | (1 | ) | (2 | ) | (7,817 | ) | (9,033 | ) | |||||||||||||||||||||||||
| Cosan Finance Limited | 18,740 | (2,996 | ) | 100.0 | 100.0 | 18,740 | 20,267 | (1,216 | ) | (3,071 | ) | 517 | 1,738 | |||||||||||||||||||||||||||
| Cosanpar Participações S.A. (1) | - | - | - | - | - | - | - | - | - | 72,212 | ||||||||||||||||||||||||||||||
| Cosan Combustíveis e Lubrificantes S.A. | 1,944,008 | 129,820 | 100.0 | 100.0 | 1,943,982 | 1,903,438 | 40,543 | 129,820 | 30,522 | 116,210 | ||||||||||||||||||||||||||||||
| Cosan Alimentos S.A. (3) | 292,078 | 40,362 | 100.0 | 100.0 | 749,698 | 743,151 | 6,547 | 29,788 | 21,262 | 45,799 | ||||||||||||||||||||||||||||||
| Proud Participações S.A. (4) | 53,237 | - | 100.0 | 93.4 | 53,236 | 55,038 | - | - | - | - | ||||||||||||||||||||||||||||||
| Other investments (5) | - | - | - | 55,518 | 55,420 | (10,096 | ) | (15,993 | ) | (9,034 | ) | (13,988 | ) | |||||||||||||||||||||||||||
| 6,498,076 | 6,464,172 | 57,097 | 386,864 | 151,619 | 411,162 | |||||||||||||||||||||||||||||||||||
| (1) | Merged by Cosan CL on September 23, 2009; |
| (2) | The investment balances, as of December 31 and September 30, 2010, include the goodwill generated from the acquisition of shares in the amount of R$7.301; |
| (3) | As of December 31, 2010, this includes the amounts of R$365,240 (same amount as of September 30, 2010) and R$92,380 (same amount as of September 30, 2010) related to the advances for future capital increase and goodwill from acquisition of Curupay, respectively; |
| (4) | Established upon payment of rural and urban real estate properties; and |
| (5) | Includes negative equity on shareholders’ deficit, in the amount of R$10,195 and R$16,092 in the quarter and nine-month period ended December 31, 2010, respectively. |
21
COSAN S.A. INDÚSTRIA E COMÉRCIO
Notes to the unaudited financial statements (Continued)
Nine month periods ended December 31, 2010 and 2009
(In thousands of reais, except as otherwise specified
| 8. | Investments (Continued) |
During the quarter and nine-month period ended December 31, 2010 and 2009, the line item Investments showed the following transactions:
| Parent company | ||||||||||||||||
01/10/10 to 31/12/10} | 01/04/10 to 31/12/10 | 01/10/09 to 31/12/09 | 01/04/09 to 31/12/09 | |||||||||||||
| Opening balances | 6,464,172 | 6,112,223 | 5,377,928 | 4,788,932 | ||||||||||||
Equity method} | 67,292 | 402,956 | 151,619 | 411,162 | ||||||||||||
| Addition to investments | - | 17,244 | 29,471 | 48,815 | ||||||||||||
| Capital increase in subsidiary through conversion of credits | 8,449 | 41,201 | - | - | ||||||||||||
| Payment of capital with property plant and equipment and additions resulting from merger spin | (10,251 | ) | 44,787 | - | 334,072 | |||||||||||
| Goodwill in the merger | - | - | - | (18,194 | ) | |||||||||||
| Conversion effect | (321 | ) | (1,674 | ) | (626 | ) | (3,875 | ) | ||||||||
| Dividends | (30,426 | ) | (117,597 | ) | - | (2,520 | ) | |||||||||
| Others | (839 | ) | (1,064 | ) | - | - | ||||||||||
Closing balances} | 6,498,076 | 6,498,076 | 5,558,392 | 5,558,392 | ||||||||||||
| Consolidated | ||||||||||||||||
01/10/10 to 31/12/10} | 01/04/10 to 31/12/10} | 01/10/09 to 31/12/09} | 01/04/09 to 31/12/09} | |||||||||||||
| Opening balances | 207,585 | 193,123 | 196,497 | 278,209 | ||||||||||||
| Equity method | 1,070 | 3,302 | (9,360 | ) | (12,885 | ) | ||||||||||
| Addition to investments | - | 12,720 | 25,999 | 46,036 | ||||||||||||
| Payment of capital with property plant and equipment and additions resulting from merger spin | - | - | (19,090 | ) | (16,321 | ) | ||||||||||
| Investment acquisition advancement write-off | - | - | - | (100,000 | ) | |||||||||||
| Dividends | - | - | - | (860 | ) | |||||||||||
| Others | - | (490 | ) | - | (133 | ) | ||||||||||
Closing balances} | 208,655 | 208,655 | 194,046 | 194,046 | ||||||||||||
Subscription Agreement due to capital increase in Rumo Logística S.A. (“Rumo”)
On July 2, 2010, the indirect subsidiary Novo Rumo Logística S.A. has entered into a Subscription Agreement with investment vehicles managed by TPG Participações S.A. and GIF LOG Participações S.A. The subscription was carried out upon capital increase in the amount of R$400,000, which was paid up in equal parts by Investors. At the end of such transaction, the Investors subscribed the shares and paid up the capital, upon execution of a shareholders’ agreement. As a result of such transaction, the Company, that indirectly held 92.9% interest in Rumo, became the holder of 69.7% interest which resulted in a net gain due to reduction of the percentage ownership interest in the amount of R$202,755 in the consolidated, recorded in the income statement in line item Other operating income (expenses), net.
Dividends Receivable from Cosan Açúcar e Álcool
At the Extraordinary and Annual General Meeting held on October 25, 2010, Cosan Açúcar e Álcool approved the payment of dividends in the amount of R$ 32,001, related to the year ended March 31, 2010.
22
COSAN S.A. INDÚSTRIA E COMÉRCIO
Notes to the unaudited financial statements (Continued)
Nine month periods ended December 31, 2010 and 2009
(In thousands of reais, except as otherwise specified)
| 9. | Property, Plant and equipment |
| Parent company | ||||||||||||||||||||
| 12/31/10 | 09/30/10 | |||||||||||||||||||
| Average annual depreciation rates (%) | Cost | Accumulated depreciation and amortization | Net | Net | ||||||||||||||||
| Land and rural properties | - | 15,297 | - | 15,297 | 5,045 | |||||||||||||||
| Machinery, equipment and installations | 9 | 575,882 | (333,105 | ) | 242,777 | 235,280 | ||||||||||||||
| Aircraft | 10 | 13,395 | (13,395 | ) | - | |||||||||||||||
| Vehicles | 20 | 110,023 | (50,904 | ) | 59,119 | 59,418 | ||||||||||||||
| Furniture, fixtures and computer equipment | 16 | 32,467 | (18,177 | ) | 14,290 | 15,029 | ||||||||||||||
| Buildings and improvements | 4 | 180,508 | (39,509 | ) | 140,999 | 137,493 | ||||||||||||||
| Construction in progress | - | 177,183 | - | 177,183 | 141,793 | |||||||||||||||
| Sugarcane planting costs | 20 | 539,474 | (290,635 | ) | 248,839 | 236,579 | ||||||||||||||
| Parts and components to be periodically replaced | 100 | 22,162 | - | 22,162 | 24,108 | |||||||||||||||
| Other | - | 415 | - | 415 | 418 | |||||||||||||||
| 1,666,806 | (745,725 | ) | 921,081 | 855,163 | ||||||||||||||||
| Consolidated | ||||||||||||||||||||
| 12/31/10 | 09/30/10 | |||||||||||||||||||
| Average annual depreciation rates (%) | Cost | Accumulated depreciation and amortization | Net | Net | ||||||||||||||||
| Land and rural properties | - | 220,927 | - | 220,927 | 221,542 | |||||||||||||||
| Machinery, equipment and installations | 10 | 4,403,841 | (1,814,613 | ) | 2,589,228 | 2,566,618 | ||||||||||||||
| Aircraft | 10 | 32,051 | (14,768 | ) | 17,283 | 16,583 | ||||||||||||||
| Vehicles | 19 | 325,673 | (166,316 | ) | 159,357 | 160,880 | ||||||||||||||
| Furniture, fixtures and computer equipment | 14 | 141,283 | (96,779 | ) | 44,504 | 44,393 | ||||||||||||||
| Buildings and improvements | 4 | 1,163,717 | (333,286 | ) | 830,431 | 843,172 | ||||||||||||||
| Vagons | 3 | 141,647 | (2,255 | ) | 139,392 | 140,403 | ||||||||||||||
| Locomotives | 3 | 150,000 | (1,417 | ) | 148,583 | 84,556 | ||||||||||||||
| Construction in progress | - | 1,069,031 | - | 1,069,031 | 841,667 | |||||||||||||||
| Sugarcane planting costs | 20 | 1,684,141 | (896,908 | ) | 787,233 | 769,771 | ||||||||||||||
| Parts and components to be periodically replaced | 107,739 | - | 107,739 | 76,510 | ||||||||||||||||
| Advances for purchase of property, plant and equipment | 100 | 56,633 | - | 56,633 | 110,207 | |||||||||||||||
| Other | - | 3,581 | - | 3,581 | 2,098 | |||||||||||||||
| 9,500,264 | (3,326,342 | 6,173,922 | 5,878,400 | |||||||||||||||||
The consolidated balance of construction in progress and advances for fixed asset purchases corresponds, substantially, to (i) investments in co-generation capacity, (ii) upgrading and expansion of industrial plants, (iii) expanding warehousing capacity, and (iv) advances for purchases of locomotives.
During the quarter and nine-month period ended December 31, 2010 and 2009, the line item Property, Plant and Equipment showed the following transactions:
| Parent company | ||||||||||||||||
| 01/10/10 to 31/12/10 | 01/04/10 to 31/12/10 | 01/10/09 to 31/12/09 | 01/04/09 to 31/12/09 | |||||||||||||
| Opening balances | 855,163 | 872,122 | 734,986 | 789,259 | ||||||||||||
| Additions to the Property Plant and Equipment | 110,980 | 321,885 | 53,944 | 138,756 | ||||||||||||
| Write-offs and transfers | (512 | ) | 3,574 | (251 | ) | (4,316 | ) | |||||||||
| Depreciation and amortization | (54,801 | ) | (231,713 | ) | (55,177 | ) | (190,197 | ) | ||||||||
| Write-off for payment of capital in subsidiary, net | 10,251 | (44,787 | ) | - | - | |||||||||||
| Closing balances | 921,081 | 921,081 | 733,502 | 733,502 | ||||||||||||
23
COSAN S.A. INDÚSTRIA E COMÉRCIO
Notes to the unaudited financial statements (Continued)
Nine month periods ended December 31, 2010 and 2009
(In thousands of reais, except as otherwise specified)
| 9. | Property, Plant and equipment (Continued) |
| Consolidated | ||||||||||||||||
| 01/10/10 to 31/12/10 | 01/04/10 to 31/12/10 | 01/10/09 to 31/12/09 | 01/04/09 to 31/12/09 | |||||||||||||
| Opening balances | 5,878,400 | 5,561,065 | 4,644,199 | 3,493,947 | ||||||||||||
| Additions to the Property Plant and Equipment | 547,687 | 1,535,774 | 400,983 | 1,180,696 | ||||||||||||
| Write-offs and transfers | (4,291 | ) | (25,578 | ) | 24,338 | (19,680 | ) | |||||||||
| Depreciation and amortization | (247,874 | ) | (897,339 | ) | (219,151 | ) | (617,579 | ) | ||||||||
| Accretion from acquisitions/mergers | - | - | 21,165 | 834,150 | ||||||||||||
| Closing balances | 6,173,922 | 6,173,922 | 4,871,534 | 4,871,534 | ||||||||||||
| 10. | Intangible assets |
| Parent company | ||||||||||||||||
| 12/31/10 | 09/30/10 | |||||||||||||||
| Goodwill (amortized on a straight-line basis until March 31, 2009) | Cost | Accumulated amortization | Net | Net | ||||||||||||
| Acquisition of JVM Participações S.A. | 63,720 | (53,100 | ) | 10,620 | 10,620 | |||||||||||
| Acquisition of Grupo Mundial | 127,953 | (40,518 | ) | 87,435 | 87,435 | |||||||||||
| Payment of capital, Mundial | 21,142 | (6,342 | ) | 14,800 | 14,800 | |||||||||||
| Acquisition of Corona (ABC 125 and ABC 126) | 267,824 | (84,811 | ) | 183,013 | 183,013 | |||||||||||
| Acquisition of Usina Açucareira Bom Retiro S.A. | 115,165 | (33,590 | ) | 81,575 | 81,575 | |||||||||||
| 595,804 | (218,361 | ) | 377,443 | 377,443 | ||||||||||||
| Other intangibles | ||||||||||||||||
| Software (amortization at the rate of 20% p. a.) | 47,334 | (30,701 | ) | 16,633 | 17,822 | |||||||||||
| 643,138 | (249,062 | ) | 394,076 | 395,265 | ||||||||||||
| Consolidated | ||||||||||||||||
| 12/31/10 | 09/30/10 | |||||||||||||||
| Goodwill (amortized on a straight-line basis until March 31, 2009) | Cost | Accumulated amortization | Net | Net | ||||||||||||
| Acquisition of JVM Participações S.A. | 63,720 | (53,100 | ) | 10,620 | 10,620 | |||||||||||
| Acquisition of Cosan Açúcar e Álcool | 35,242 | (34,684 | ) | 558 | 558 | |||||||||||
| Formation of FBA | 22,992 | (18,585 | ) | 4,407 | 4,407 | |||||||||||
| Acquisition of Univalem S.A. Açúcar e Álcool | 24,118 | (19,100 | ) | 5,018 | 5,018 | |||||||||||
| Acquisition of Grupo Destivale | 69,917 | (27,423 | ) | 42,494 | 42,494 | |||||||||||
| Acquisition of Grupo Mundial | 127,953 | (40,518 | ) | 87,435 | 87,435 | |||||||||||
| Payment of capital, Mundial | 21,142 | (6,342 | ) | 14,800 | 14,800 | |||||||||||
| Acquisition of Corona | 818,833 | (255,817 | ) | 563,016 | 563,016 | |||||||||||
| Acquisition of Usina Açucareira Bom Retiro S.A. | 115,165 | (33,590 | ) | 81,575 | 81,575 | |||||||||||
| Acquisition of Usina Santa Luíza | 47,053 | (4,705 | ) | 42,348 | 42,348 | |||||||||||
| Acquisition of Benálcool | 167,300 | (18,053 | ) | 149,247 | 149,247 | |||||||||||
| Acquisition of Aliança | 1,860 | - | 1,860 | 1,860 | ||||||||||||
| Acquisition of Cosan CL | 1,406,962 | - | 1,406,962 | 1,397,518 | ||||||||||||
| Acquisition of Teaçu | 73,668 | - | 73,668 | 73,668 | ||||||||||||
| Merger of Curupay (Cosan Alimentos) | 92,380 | - | 92,380 | 92,380 | ||||||||||||
| Acquisition of Açúcar União | 74,832 | (57,371 | ) | 17,461 | 17,461 | |||||||||||
| Acquisition of Destilaria Paraguaçu | 166,656 | - | 166,656 | 166,656 | ||||||||||||
| Subscription of share of Nova América | 121,893 | - | 121,893 | 121,893 | ||||||||||||
| Purchase of shares of TEAS | 7,301 | - | 7,301 | 7,301 | ||||||||||||
| 3,458,987 | (569,288 | ) | 2,889,699 | 2,880,255 | ||||||||||||
| Other intangibles | ||||||||||||||||
| Software (amortization at the rate of 20% p. a.) | 93,274 | (63,474 | ) | 29,800 | 32,287 | |||||||||||
| Others | 20,707 | (2,156 | ) | 18,551 | 19,233 | |||||||||||
| 113,981 | (65,630 | ) | 48,351 | 51,520 | ||||||||||||
| 3,572,968 | (634,918 | ) | 2,938,050 | 2,931,775 | ||||||||||||
24
COSAN S.A. INDÚSTRIA E COMÉRCIO
Notes to the unaudited financial statements (Continued)
Nine month periods ended December 31, 2010 and 2009
(In thousands of reais, except as otherwise specified)
| 10. | Intangible assets (Continued) |
During the quarter and nine-month period ended December 31, 2010 and 2009, the line item Intangible Assets showed the following transactions:
| Parent company | ||||||||||||||||
| 01/10/10 to 31/12/10 | 01/04/10 to 31/12/10 | 01/10/09 to 31/12/09 | 01/04/09 to 31/12/09 | |||||||||||||
| Opening balances | 395,265 | 399,648 | 422,076 | 403,918 | ||||||||||||
| Additions to goodwill, net of write offs | - | - | - | 18,194 | ||||||||||||
| Increase in software and other intangibles | 1,054 | 2,968 | 5 | 638 | ||||||||||||
| Amortization of software and other intangibles | (2,243 | ) | (6,904 | ) | (2,226 | ) | (6,783 | ) | ||||||||
| Others | - | (1,636 | ) | - | 3,888 | |||||||||||
| Closing balances | 394,076 | 394,076 | 419,855 | 419,855 | ||||||||||||
| Consolidated | ||||||||||||||||
| 01/10/10 to 31/12/10 | 01/04/10 to 31/12/10 | 01/10/09 to 31/12/09 | 01/04/09 to 31/12/09 | |||||||||||||
| Opening balances | 2,931,775 | 2,901,308 | 2,764,638 | 2,418,753 | ||||||||||||
| Additions to goodwill, net of write offs | 9,444 | 22,216 | 28,002 | 126,292 | ||||||||||||
| Increase in software and other intangibles | 1,068 | 12,295 | - | - | ||||||||||||
| Accretion from mergers/acquisition | - | - | - | 306,010 | ||||||||||||
| Goodwill derived from disposals | - | - | - | (85,589 | ) | |||||||||||
| Transfers | - | 16,009 | (10,172 | ) | 17,002 | |||||||||||
| Amortization of software and other intangibles | (4,237 | ) | (16,566 | ) | - | - | ||||||||||
| Others | - | 2,788 | - | - | ||||||||||||
| Closing balances | 2,938,050 | 2,938,050 | 2,782,468 | 2,782,468 | ||||||||||||
| 11. | Taxes and social contributions payable |
| Parent company | Consolidated | |||||||||||||||
| 09/30/10 | 06/30/10 | 09/30/10 | 06/30/10 | |||||||||||||
| ICMS | 2,133 | 5,638 | 42,196 | 61,177 | ||||||||||||
| IPI | 1,475 | 1,090 | 38,043 | 23,219 | ||||||||||||
| INSS | 5,679 | 10,840 | 23,214 | 29,939 | ||||||||||||
| PIS | 340 | 467 | 6,358 | 7,148 | ||||||||||||
| COFINS | 1,566 | 2,148 | 29,277 | 32,995 | ||||||||||||
| Installment payments – Refis IV | 99,944 | 99,195 | 663,877 | 659,762 | ||||||||||||
| Income and social contribution taxes payable | - | - | 7,978 | 2,302 | ||||||||||||
| Other | 12,074 | 16,036 | 26,497 | 28,914 | ||||||||||||
| 123,211 | 135,414 | 837,440 | 845,456 | |||||||||||||
| Current | (34,783 | ) | (47,230 | ) | (218,783 | ) | (239,154 | ) | ||||||||
| Noncurrent | 88,428 | 88,184 | 618,657 | 606,302 | ||||||||||||
Noncurrent amounts will become due as follows:
| Parent company | Consolidated | |||||||||||||||
| 09/30/10 | 06/30/10 | 09/30/10 | 06/30/10 | |||||||||||||
| 13 to 24 months | 11,309 | 11,966 | 66,730 | 65,699 | ||||||||||||
| 25 to 36 months | 7,887 | 7,992 | 60,992 | 60,411 | ||||||||||||
| 37 to 48 months | 6,926 | 6,668 | 58,415 | 56,559 | ||||||||||||
| 49 to 60 months | 6,811 | 6,638 | 58,249 | 56,476 | ||||||||||||
| 61 to 72 months | 6,224 | 6,102 | 53,504 | 54,888 | ||||||||||||
| 73 to 84 months | 6,224 | 5,977 | 45,492 | 44,259 | ||||||||||||
| 85 to 96 months | 6,224 | 5,977 | 44,337 | 42,823 | ||||||||||||
| As from 97 months | 36,823 | 36,864 | 230,938 | 225,187 | ||||||||||||
| 88,428 | 88,184 | 618,657 | 606,302 | |||||||||||||
25
COSAN S.A. INDÚSTRIA E COMÉRCIO
Notes to the unaudited financial statements (Continued)
Nine month periods ended December 31, 2010 and 2009
(In thousands of reais, except as otherwise specified)
| 11. | Taxes and social contributions payable (Continued) |
The Company and its subsidiaries must comply with several conditions to continue benefiting from the installment payment programs, particularly with the regular payment of the installments as required by applicable law. The required conditions are fully complied by the Company and its subsidiaries.
General Conditions
Under the self-assessment tax system adopted in Brazil, income tax returns filed may be audited by tax authorities for a period of five years from their filling.
| 12. | Income and Social Contribution Taxes |
a) Reconciliation of income and social contribution tax expenses:
| Parent company | ||||||||||||||||
| 01/10/10 to 31/12/10 | 01/04/10 to 31/12/10 | 01/10/09 to 31/12/09 | 01/04/09 to 31/12/09 | |||||||||||||
| Profit before income tax and social contribution | 13,544 | 527,107 | 174,806 | 823,792 | ||||||||||||
| Income tax and social security contribution at nominal rate (34%) | (4,605 | ) | (179,216 | ) | (59,434 | ) | (280,089 | ) | ||||||||
| Adjustments made for determining the effective rate | ||||||||||||||||
| Equity method | 22,879 | 137,005 | 51,550 | 139,795 | ||||||||||||
| Non deductible donations and contributions | (1,510 | ) | (4,916 | ) | (801 | ) | (1,676 | ) | ||||||||
| Recognized options granted | (233 | ) | (524 | ) | 26 | (2,879 | ) | |||||||||
| Others | (2,172 | ) | (3,108 | ) | 982 | (1,178 | ) | |||||||||
| Total of deferred and current taxes | 14,359 | (50,759 | ) | (7,677 | ) | (146,027 | ) | |||||||||
| Effective rate | - | 9.62 | % | 4.39 | % | 17.73 | % | |||||||||
| Consolidated | ||||||||||||||||
| 01/10/10 to 31/12/10 | 01/04/10 to 31/12/10 | 01/10/09 to 31/12/09 | 01/04/09 to 31/12/09 | |||||||||||||
| Profit before income tax and social contribution | 75,206 | 691,036 | 253,044 | 1,016,411 | ||||||||||||
| Income tax and social security contribution at nominal rate (34%) | (25,570 | ) | (234,952 | ) | (86,035 | ) | (345,580 | ) | ||||||||
| Adjustments made for determining the effective rate | ||||||||||||||||
| Equity method | 364 | 1,123 | (3,182 | ) | (4,381 | ) | ||||||||||
| Non deductible donations and contributions | (2,137 | ) | (8,050 | ) | (1,402 | ) | (2,711 | ) | ||||||||
| Recognized options granted | (233 | ) | (524 | ) | 26 | (2,879 | ) | |||||||||
| Capital gain based on shareholding interest variation | - | 75,846 | - | - | ||||||||||||
| Tax loss and negative social contribution basis not realizable in subsidiaries | (4,810 | ) | (7,534 | ) | (4,609 | ) | (2,564 | ) | ||||||||
| Others | (7,272 | ) | (11,224 | ) | 9,945 | 11,142 | ||||||||||
| Total of deferred and current taxes | (39,658 | ) | (185,315 | ) | (85,257 | ) | (346,973 | ) | ||||||||
| Effective rate | 52.73 | % | 26.82 | % | 33.69 | % | 34.14 | % | ||||||||
26
COSAN S.A. INDÚSTRIA E COMÉRCIO
Notes to the unaudited financial statements (Continued)
Nine month periods ended December 31, 2010 and 2009
(In thousands of reais, except as otherwise specified)
| 12. | Income and Social Contribution Taxes (Continued) |
b) Deferred income and social contribution tax assets:
| Parent company | ||||||||||||||||||||
| 31/12/10 | 30/09/10 | |||||||||||||||||||
| Base | IRPJ 25% | CSSL 9% | Total | Total | ||||||||||||||||
| Provisions for court judgments and other interim differences | 157,246 | 39,313 | 14,152 | 53,465 | 48,599 | |||||||||||||||
| Leasing | 24,088 | 6,022 | 2,168 | 8,190 | 8,000 | |||||||||||||||
| Derivative transactions | 150,288 | 37,572 | 13,526 | 51,098 | (36,190 | ) | ||||||||||||||
| Tax losses | 412,431 | 103,108 | - | 103,108 | 103,828 | |||||||||||||||
| Negative social contribution | 412,532 | - | 37,128 | 37,128 | 37,387 | |||||||||||||||
| 186,015 | 66,974 | 252,989 | 161,624 | |||||||||||||||||
| Exchange rate changes | (595,295 | ) | (148,824 | ) | (53,577 | ) | (202,401 | ) | (189,526 | ) | ||||||||||
| Goodwill | (91,885 | ) | (22,971 | ) | (8,270 | ) | (31,241 | ) | (27,287 | ) | ||||||||||
| (171,795 | ) | (61,847 | ) | (233,642 | ) | (216,813 | ) | |||||||||||||
| Total deferred taxes | 14,220 | 5,127 | 19,347 | (55,189 | ) | |||||||||||||||
| Current assets | 18,937 | 12,522 | ||||||||||||||||||
Non current assets} | 234,052 | 177,292 | ||||||||||||||||||
| Non current liabilities | (233,642 | ) | (245,003 | ) | ||||||||||||||||
| Consolidated | ||||||||||||||||||||
| 31/12/10 | 30/09/10 | |||||||||||||||||||
| Base | IRPJ 25% | CSSL 9% | Total | Total | ||||||||||||||||
| Provisions for court judgments and other interim differences | 974,615 | 243,656 | 87,715 | 331,371 | 327,504 | |||||||||||||||
| Leasing | 24,088 | 6,022 | 2,168 | 8,190 | 8,000 | |||||||||||||||
| Derivative transactions | 186,997 | 46,749 | 16,830 | 63,579 | (36,190 | ) | ||||||||||||||
| Tax losses | 1,004,940 | 251,235 | - | 251,235 | 251,479 | |||||||||||||||
| Negative social contribution | 1,017,448 | - | 91,570 | 91,570 | 91,657 | |||||||||||||||
| 547,662 | 198,283 | 745,945 | 642,450 | |||||||||||||||||
| Exchange rate changes | (713,183 | ) | (178,296 | ) | (64,187 | ) | (242,483 | ) | (221,262 | ) | ||||||||||
| Accelerated depreciation | (8,103 | ) | (2,026 | ) | (729 | ) | (2,755 | ) | (1,266 | ) | ||||||||||
| Goodwill | (627,609 | ) | (156,902 | (56,484 | ) | (213,386 | ) | (174,778 | ) | |||||||||||
| (337,224 | ) | (121,400 | ) | (458,624 | ) | (397,306 | ) | |||||||||||||
| Total deferred taxes | 210,438 | 76,883 | 287,321 | 245,144 | ||||||||||||||||
| Current assets | 100,907 | 94,512 | ||||||||||||||||||
| Non current assets | 645,038 | 576,128 | ||||||||||||||||||
| Non current liabilities | (458,624 | ) | (425,496 | ) | ||||||||||||||||
Deferred income on tax losses and negative social contribution must be realized within 10 years, according to the Company's and its subsidiaries' expected profitability shown in financial projections prepared by management.
The Company expects to realize non-current tax credits and debts in the course of the following years:
| Assets | ||||||||||||||||
| Parent company | Consolidated | |||||||||||||||
| 31/12/10 | 30/09/10 | 31/12/10 | 30/09/10 | |||||||||||||
| 13 to 24 months | 16,878 | 10,463 | 115,930 | 97,029 | ||||||||||||
| 25 to 36 months | 22,666 | 16,251 | 111,389 | 111,833 | ||||||||||||
| 37 to 48 months | 22,597 | 16,182 | 82,402 | 82,810 | ||||||||||||
| 49 to 84 months | 103,458 | 84,212 | 202,667 | 181,199 | ||||||||||||
| 85 to 120 months | 68,453 | 50,184 | 132,650 | 103,257 | ||||||||||||
| 234,052 | 177,292 | 645,038 | 576,128 | |||||||||||||
27
COSAN S.A. INDÚSTRIA E COMÉRCIO
Notes to the unaudited financial statements (Continued)
Nine month periods ended December 31, 2010 and 2009
(In thousands of reais, except as otherwise specified)
| 12. | Income and Social Contribution Taxes (Continued) |
b) Deferred income and social contribution tax assets: (Continued)
| Liabilities | ||||||||||||||||
| Parent company | Consolidated | |||||||||||||||
| 31/12/10 | 30/09/10 | 31/12/10 | 30/09/10 | |||||||||||||
| 13 to 24 months | 20,240 | 21,772 | 38,241 | 28,119 | ||||||||||||
| 25 to 36 months | 20,240 | 21,772 | 25,760 | 28,119 | ||||||||||||
| 37 to 48 months | 20,240 | 21,772 | 25,760 | 28,119 | ||||||||||||
| 49 to 84 months | 60,720 | 65,315 | 178,912 | 161,034 | ||||||||||||
| 85 to 120 months | 112,202 | 114,372 | 189,951 | 180,105 | ||||||||||||
| 233,642 | 245,003 | 458,624 | 425,496 | |||||||||||||
Tax credit recovery estimates were based on taxable profit projections, taking into consideration several financial and business assumptions on the balance sheet preparation date.
28
COSAN S.A. INDÚSTRIA E COMÉRCIO
Notes to the unaudited financial statements (Continued)
Nine month periods ended December 31, 2010 and 2009
(In thousands of reais, except as otherwise specified)
| 13. | Loans and Financing |
Description | Financial charges (1) | Parent company | Consolidated | Due date final | Assurances (2) | ||||
| Index | Annual average interest rate | 31/12/10 | 30/09/10 | 31/12/10 | 30/09/10 | 31/12/10 | 30/09/10 | ||
| Senior Notes Due 2014 | U.S dollar | Interest of 9.5% | - | - | 605,330 | 601,107 | July 2014 | - | - |
| Senior Notes Due 2017 | U.S dollar | Interest of 7.0% | - | - | 685,789 | 685,454 | February/2017 | - | - |
| BNDES (3) | URTJLP PrefixedUMBND | Interest of 2,61% Interest of 4,5% Interest of 7,1% | - - - | - - - | 1,334,667 247,167 41,154 | 1,151,383 147,881 43,615 | October/2025 July 2020 July 2019 | Credit rights from PPA | Credit rights from PPA |
| Bank Credit Certificate | CDCA | Interest of 0.6%+CDI | - | - | 30,090 | 61,804 | December 2011 | Conditional Sale | Conditional Sale |
| ACC | U.S dollar | Interest of 1,60% | 210,442 | 382,618 | 210,442 | 382,618 | March 2011 | - | - |
| Perpetual Notes | U.S dollar | Interest of 8.3% | 758,627 | 771,376 | 1,264,902 | 771,375 | - | - | - |
Resolution 2471 Rural Credit | IGP-M Prefixed Prefixed | Interest of 3,95% Interest of 3.0% Interest of 6,7% | 107,121 114 30,664 | 103,718 121 30,156 | 652,701 114 90,856 | 639,877 121 89,352 | April 2020 October 2025 October2011 | Treasury certificates and mortgaged lands Sugarcane lien | Treasury certificates and mortgaged lands Sugarcane lien |
| Pre payments | Libor US dollar + Libor | Interest of 6,78% | 335,263 | 426,197 | 731,465 | 845,838 | September 2014 | - | - |
| Credit note | 125,0% CD U.S dollar | - Interest of 6,25% | 305,774 168,442 | 314,829 173,950 | 305,774 168,442 | 314,829 173,950 | October 2012 | - | - |
Finame Pass (4) | Prefixed URTJLP U.S dollar Prefixed | Interest of 4,92% Interest of 2,84% Interest of 7,44% Interest of 9.0% | 104,239 16,330 - - | 77,191 17,543 - - | 502,666 179,788 56 40,151 | 373,660 83,278 65 - | July 2020 March 2021 November 2012 April 2011 | Conditional sale of financed assets Conditional Sale | Conditional sale of financed assets Conditional Sale |
| Others | Miscellaneous | Miscellaneous | - | - | 36,661 | 38,505 | Miscellaneous | Mortgage, inventories and conditional sale of financed assets | Mortgage, inventories and conditional sale of financed assets |
| Expenses incurred with security placement | (10,231) | (12,906) | (37,445) | (35,303) | - | - | - | ||
| 2,026,785 | 2,284,793 | 7,090,770 | 6,369,409 | ||||||
| Current | (599,485) | (671,878) | (1,129,092) | (1,058,598) | |||||
| Non current | 1,427,300 | 1,612,915 | 5,961,678 | 5,310,811 | |||||
| (1) | Financial charges as of December 31, 2010, except as indicated otherwise; |
| (2) | All loans and financings are secured by promissory notes and sureties posted by the Company, its subsidiaries and controlling shareholders, in addition to the collateral described above; |
| (3) | These correspond to funds secured by direct and indirect subsidiaries, Cosan S.A. Bioenergia, Barra Bioenergia S.A. and Cosan Centroeste S.A. Açúcar e Álcool, for the purpose of financing cogeneration, greenfield and logistics projects; and Program to support the sugarcane alcohol sector. |
29
COSAN S.A. INDÚSTRIA E COMÉRCIO
Notes to the unaudited financial statements (Continued)
Nine month periods ended December 31, 2010 and 2009
(In thousands of reais, except as otherwise specified)
| 13. | Loans and Financing (Continued) |
Noncurrent loans, net of transaction costs amortization, have the following scheduled maturities:
| Parent company | Consolidated | |||||||||||||||
| 31/12/10 | 30/09/10 | 31/12/10 | 30/09/10 | |||||||||||||
| 13 to 24 months | 513,606 | 376,578 | 884,695 | 767,459 | ||||||||||||
| 25 to 36 months | 21,306 | 349,365 | 388,584 | 656,742 | ||||||||||||
| 37 to 48 months | 21,600 | 16,752 | 962,274 | 904,978 | ||||||||||||
| 49 to 60 months | 4,616 | 4,721 | 721,707 | 179,491 | ||||||||||||
| 61 to 72 months | 3,302 | 109 | 216,713 | 163,865 | ||||||||||||
| 73 to 84 months | 3,146 | 8 | 880,799 | 838,970 | ||||||||||||
| 85 to 96 months | 21,187 | 18,396 | 417,461 | 219,290 | ||||||||||||
| As from 97 months | 838,537 | 846,986 | 1,489,445 | 1,580,016 | ||||||||||||
| 1,427,300 | 1,612,915 | 5,961,678 | 5,310,811 | |||||||||||||
Senior Notes due in 2014
On August 4, 2009, the indirect subsidiary CCL Finance Limited issued US$350,000 of Senior Notes in the international capital markets according to Regulations S and 144A that bear interest at a rate of 9.5% per annum, payable semi-annually in February and August of each year, from February 2010.
Senior Notes due in 2017
On January 26, 2007, wholly-owned subsidiary Cosan Finance Limited issued Senior Notes in the international capital markets under Regulation S and Rule 144A in the amount of US$400 thousand. These Senior Notes bear interest at a rate of 7% per annum, payable semi-annually in February and August of each year.
Credit Notes
The credit notes are equivalent to loans to expand the export activities, which funds, as of October 29 and November 11, 2009, totaled R$174,470 (equivalent to US$100,000 thousand) and R$300,000, respectively, subject to annual interest of 6.25% plus US foreign exchange variation and 125% of the CDI rate, respectively.
Such transactions will be settled through exports to be performed over 2012.
Advances on Foreign Exchange Agreements (ACC)
The advances on foreign exchange agreements, the funds of which, between March and September 2010, totaled R$399,246, equivalent to US$225,000 thousand, were entered into with a number of financial institutions to be settled up to March 2011.
During the quarter ended December 31, 2010, ACC contracted by the Company were settled in the amount of R$196,060, equivalent to US$100,000 thousand.
The remaining balance of these contracts is subject to annual interest from 1.00% to 2.15% plus US foreign exchange variation.
30
COSAN S.A. INDÚSTRIA E COMÉRCIO
Notes to the unaudited financial statements (Continued)
Nine month periods ended December 31, 2010 and 2009
(In thousands of reais, except as otherwise specified)
| 13. | Loans and Financing (Continued) |
Perpetual Notes
On January, 24 and February 10, 2006, the Company issued Perpetual Notes in the international market in accordance with Regulations S and Rule 144A, in the amount of US$450 million for qualified institutional investors. Perpetual notes are listed in the Luxemburg Stock Exchange - EURO MTF and bear interest of 8.25% per year, payable quarterly on the 15th of May, August, November and February of each year, beginning May 15, 2006. These notes may, at the discretion of the Company, be redeemed as from February 15, 2011 on any interest payment date, for their face value. Perpetual Notes are secured by the Company and Cosan Açúcar e Álcool.
In addition, on November 5, 2010, the subsidiary Cosan Overseas Limited issued Perpetual Notes in the international market in accordance with “Regulations S” in the amount of R$514,830, equivalent to US$300,000 thousand, which bear interest of 8.25% p.a., payable on a quarterly basis. The expenses with the placement of said note amounted to R$6,952 and will be amortized, at the Company discretion, over 5 years.
The resources obtained through the Perpetual Notes, on November 5, 2010, were fully transferred to the Company as prepayment of export (note 7).
Resolution 2471
From 1998 to 2000, the Company and its subsidiaries renegotiated their debt related to agricultural funding with several financial institutions, thereby reducing their financial cost to annual interest rates below 10% and guaranteeing the amortization of the updated principal amount with the assignment and transfer of CTNs - Restricted Brazilian Treasury Bills redeemable on the debt maturity dates, using the tax incentive introduced by Resolution No. 2471, issued by the Central Bank of Brazil on February 26, 1998. As of December 31, 2010, these certificates are classified under Non-current Assets, in the amount of R$36,847 (R$34,705 as of September 30, 2010), parent company and R$242,617 (R$228,513 as of September 30, 2010), consolidated and are adjusted based on the IGP-M rate, plus interest rate of 12%. As of the debt settlement date, the r edemption value of these certificates is equivalent to the renegotiated debt value. The interest related to these loans is paid annually and the principal amounts fall due in 2020, parent company and 2025, consolidated.
Pre payments
During the year ended March 31, 2010, the Company and its subsidiary Cosan Alimentos S.A. funded R$924.327, the equivalent to US$530,000 thousand as advances for future sugar exports to be settled in 2012 and 2014. Exchange rate variation and annual interests based on the Libor rate, plus 6.3% spread p.a. are levied over these advances.
31
COSAN S.A. INDÚSTRIA E COMÉRCIO
Notes to the unaudited financial statements (Continued)
Nine month periods ended December 31, 2010 and 2009
(In thousands of reais, except as otherwise specified)
| 13. | Loans and Financing (Continued) |
FINAME
This refers to loans associated with the financing of machinery and equipment
(FINAME – Financiamento de Máquinas e Equipamentos) obtained from several financial institutions. These loans are intended to investment in property, plant and equipment. These loans bear interest at rates that vary from 1.15% to 9.73% per annum, payable monthly, and are secured by statutory liens on the purchased assets.
During the quarter ended December 31, 2010, the indirect subsidiary Rumo, through its subsidiary Cosan Operadora Portuária S.A., obtained the release from BNDES of credit line in the amount of R$125,700, for investments in infrastructure and acquisition of locomotives. The mentioned financing will bear annual interest varying from 1.92% to 4.50% plus TJLP, to be settled up to March 2021.
| 14. | Provision for Judicial Demands |
| Parent company | Consolidated | |||||||||||||||
| 31/12/10 | 30/09/10 | 31/12/10 | 30/09/10 | |||||||||||||
| Tax | 42,217 | 49,136 | 411,263 | 411,838 | ||||||||||||
| Civil | 15,233 | 12,494 | 86,647 | 81,143 | ||||||||||||
| Labor claims | 29,736 | 29,588 | 152,190 | 149,956 | ||||||||||||
| 87,186 | 91,218 | 650,100 | 642,937 | |||||||||||||
| Judicial deposits | (9,011 | ) | (8,455 | ) | (180,878 | ) | (173,640 | ) | ||||||||
| 78,175 | 82,763 | 469,222 | 469,297 | |||||||||||||
During the quarter and nine month period ended December 31, 2010 and 2009, the line item Provision for judicial demands presented the following transactions:
| Parent company | ||||||||||||||||
| 01/10/10 to 31/12/10 | 01/04/10 to 31/12/10 | 01/10/09 to 31/12/09 | 01/04/09 to 31/12/09 | |||||||||||||
| Opening balances | 82,763 | 71,556 | 239,778 | 236,633 | ||||||||||||
| Constitutions (reversals), net and others | (6,191 | ) | 4,646 | (165,629 | ) | (167,635 | ) | |||||||||
| Monetary restatement | 1,603 | 1,973 | 2,282 | 7,433 | ||||||||||||
| 78,175 | 78,175 | 76,431 | 76,431 | |||||||||||||
| Consolidated | ||||||||||||||||
| 01/10/10 to 31/12/10 | 01/04/10 to 31/12/10 | 01/10/09 to 31/12/09 | 01/04/09 to 31/12/09 | |||||||||||||
| Opening balances | 469,297 | 444,421 | 1,143,377 | 1,105,899 | ||||||||||||
| Constitutions (reversals), net and others | (17,694 | ) | (9,640 | ) | (256,461 | ) | (258,232 | ) | ||||||||
| Monetary restatement | 17,619 | 34,441 | (131,266 | ) | (108,348 | ) | ||||||||||
| Accretion from acquisitions, net of write-offs | - | - | - | 16,331 | ||||||||||||
| 469,222 | 469,222 | 755,650 | 755,650 | |||||||||||||
32
COSAN S.A. INDÚSTRIA E COMÉRCIO
Notes to the unaudited financial statements (Continued)
Nine month periods ended December 31, 2010 and 2009
(In thousands of reais, except as otherwise specified)
| 14. | Provision for Judicial Demands (Continued) |
The Company and its subsidiaries are party to various ongoing labor claims, civil and tax proceedings arising from the normal course of their business.
Respective provisions for judicial demands were recorded considering those cases in which the likelihood of loss has been rated as probable based on the opinion of legal advisors. Management believes resolution of these disputes will have no effect significantly different than the estimated amounts accrued.
Judicial demands deemed as probable loss
a) Tax claims
The main tax judicial demands at December 31, 2010 and September 30, 2010,are as follows:
| Parent company | Consolidated | |||||||||||||||
| Description | 31/12/10 | 30/09/10 | 31/12/10 | 30/09/10 | ||||||||||||
| IPI | 6,471 | 6,430 | 8,630 | 8,331 | ||||||||||||
| IPC – 89 (i) | - | - | 88,266 | 88,266 | ||||||||||||
| Finsocial offsetting (ii) | - | - | 180,885 | 178,139 | ||||||||||||
| ICMS credits (iii) | 17,706 | 24,953 | 71,930 | 77,753 | ||||||||||||
| PIS and COFINS | 4,479 | 4,438 | 25,976 | 21,795 | ||||||||||||
| IRPJ and CSLL | 814 | 809 | 2,063 | 2,062 | ||||||||||||
| Others | 12,747 | 12,506 | 33,513 | 35,492 | ||||||||||||
| 42,217 | 49,136 | 411,263 | 411,838 | |||||||||||||
(i) In 1993 subsidiary Cosan CL filed a suit to challenge the balance sheet restatement index (IPC) established by the federal government in 1989, which index did not reflect the actual inflation back then. The use of this index caused the Company to supposedly overstate and overpay the IRPJ and CSLL. Cosan CL obtained a favorable preliminary order that allowed it to recalculate the balance sheet restatement, now using indexes that accurately measured the inflation over the relevant period. In doing so the company rectified the amounts of IRPJ and CSLL payable. Identified overpayments for both taxes were offset in subsequent years until 1997, when the balance was zeroed. Despite the favorable court rulings, tax authorities issued a notice of infringement to the Company challenging all tax offsets performed in 1993 and some offsets in 1994 and 1997 . Given the contingent nature of this tax offsetting, associated amounts were also recorded as a provision for court rulings and have been restated against the variation of the SELIC rate.
33
COSAN S.A. INDÚSTRIA E COMÉRCIO
Notes to the unaudited financial statements (Continued)
Nine month periods ended December 31, 2010 and 2009
(In thousands of reais, except as otherwise specified)
| 14. | Provision for Judicial Demands (Continued) |
Judicial demands deemed as probable loss (Continued)
a) Tax claims (Continued)
(ii) From September through December 1994, subsidiary Conan CL offset COFINS and several other taxes with previously paid amounts of FINSOCIAL. This offsetting was backed in a preliminary order issued by a court of competent jurisdiction in a suit brought to challenge the constitutionality of FINSOCIAL.
In 1995 Cosan CL was declared exempt from COFINS levies. Thus, the company understood that past offsets of COFINS against FINSOCIAL were not in order and in 2003, based on another favorable court ruling relative to FINSOCIAL, concluded that FINSOCIAL credits previously offset against CONFINS were once again available to be offset against other tax liabilities. The Company then offset these credits against IRPJ, CSLL, CIDE, PIS, COFINS and IRRF resulting from its operations. Once again, because of the contingent nature of this procedure the Company recorded the full offset amount as a provision for court rulings until the Federal Revenue Service ratified this offsetting.
In 2008 the Federal Revenue Service dismissed the offsetting performed on the ground that Cosan CL had already used the tax credits to offset COFINS back in 1994. In view of this understanding, the management of the Company decided to challenge the administrative decisions, which is pending judgment at the Taxpayers' Council. The amount recorded as provision for court ruling has been restated against the SELIC rate.
(iii) The amount accrued is represented by a) use of ICMS credits arising from the acquisition of use and consumption materials b) financial charges levied on debts settled in installments granted by the Finance Secretariat of the State of São Paulo, c) ICMS recalculated on the remittances made by Nova América Agroenergia (currently named Cosan Alimentos S.A.) for its branch in the State of Rio de Janeiro and d) several processes related to credits taken and rate differences on sales for other states carried out in FOB condition, basically concentrated in the companies Alcomira S.A. Açúcar e Álcool, Destilaria Vale do Tietê S.A. - Destivale, Benálcool S.A. Açúcar e Álcool e Univalem S.A. Açúcar a Álcool, merged by the Company.
b) Civil and labor claims
The Company and its subsidiaries are parties to a number of civil claims related to (i) indemnity for physical and moral damages; (ii) public civil claims for avoidance of sugarcane burn; and (iii) environmental executions.
34
COSAN S.A. INDÚSTRIA E COMÉRCIO
Notes to the unaudited financial statements (Continued)
Nine month periods ended December 31, 2010 and 2009
(In thousands of reais, except as otherwise specified)
| 14. | Provision for Judicial Demands (Continued) |
Judicial demands deemed as probable loss (Continued)
b) Civil and labor claims
The Company and its subsidiaries are also parties to a number of labor claims filed by former employees and service providers challenging, among other factors, the payment of additional hours, night shift Premium and risk Premium, employment inclusion, reimbursement of discounts from payroll, such as social contribution, trade union charges, among others.
Judicial demands deemed as possible loss
a) Tax claims
The main tax claims, the unfavorable outcome of which is deemed possible and, therefore, no provision for legal claims was recorded in the quarterly information, are as follows:
| Parent company | Consolidated | |||||||||||||||
| 31/12/10 | 30/09/10 | 31/12/10 | 30/09/10 | |||||||||||||
| Notice of infringement – Income tax withheld at source (i) | 190,272 | 187,735 | 191,784 | 189,285 | ||||||||||||
| ICMS – State VAT (ii) | 110,275 | 103,235 | 486,600 | 468,075 | ||||||||||||
| IPI – Federal VAT (iii) | 10,866 | 10,780 | 259,614 | 267,320 | ||||||||||||
| Offsets against IPI credits – IN 67/98 (iv) | - | - | 180,888 | 179,258 | ||||||||||||
| PIS and COFINS | 12,631 | 12,441 | 148,405 | 146,976 | ||||||||||||
| INSS and other | 91,949 | 34,121 | 208,137 | 134,574 | ||||||||||||
| Civil and labor | 93,950 | 100,326 | 621,654 | 601,834 | ||||||||||||
| 509,943 | 448,638 | 2,097,082 | 1,987,322 | |||||||||||||
(i) Tax assessment – withholding income tax
In September 2006 the Federal Revenue Service served another notice of infringement on the Company, this time for failure to withhold and pay income tax at source on capital gains derived from the acquisition of a subsidiary company. This notice of infringement led to an administrative proceeding which is deemed a likely loss in the opinion of the Company's legal counsels, the amount of which was not recorded as a provision in the Company's quarterly financial information.
35
COSAN S.A. INDÚSTRIA E COMÉRCIO
Notes to the unaudited financial statements (Continued)
Nine month periods ended December 31, 2010 and 2009
(In thousands of reais, except as otherwise specified)
| 14. | Provision for Judicial Demands (Continued) |
Judicial demands deemed as possible loss (Continued)
(ii) ICMS – State VAT
Refers mainly to (i) Tax Assessment filed in view of the alleged lack of payment of ICMS and non-compliance with accessory obligation, in connection with the agribusiness partnership and manufacturing upon demand, with Central Paulista Açúcar e Álcool Ltda., between May to December 2006 and May to December 2007; and (ii) ICMS levied on the remittances of crystallized sugar for export purposes. In accordance with the tax agent, such product is classified as semi-finished product and that, in accordance with the ICMS regulation, would be subject to taxation and (iii) ICMS levied on possible differences in terms of sugar and alcohol inventories, arising from magnetic tax files and Inventory Registry Books.
(iii) IPI – Federal VAT
SRF Normative Instruction n° 67/98 approved the procedure adopted by the industrial establishments which performed remittances without registries and payment of the IPI rate, as regards to the sugarcane transactions (demerara), high-quality crystal, special crystal, extra special crystal and refined sugar, carried out between July 6, 1995 and November 16, 1997 and with refined sugar (amorphe) between January 14, 1992 and November 16, 1997. Such rule was considered in the respective proceedings filed by the Federal Revenue Secretariat, the unfavorable outcome of which is deemed as possible, in accordance with the opinion of the Company’s legal advisors.
(iv) Offsets against IPI credits – IN 67/98
SRF Normative Instruction No. 67/98 made it possible to obtain refund of IPI tax payments for sales of refined amorphous sugar from January 14, 1992 through November 16, 1997. In view of this rule, Cosan Açúcar and Álcool applied for offsetting amounts paid during the relevant periods against other tax liabilities of its own. However, the Federal Revenue Service denied its application for both reimbursement and offsetting of such amounts. Cosan Açúcar and Álcool challenged this ruling in an administrative proceeding.
Upon being notified to pay tax debts resulting from offset transactions in light of certain changes introduced by IN SRF No. 210/02, subsidiary Cosan Açúcar and Álcool filed a writ of mandamus and applied for a preliminary injunction seeking to stay enforceability of offset taxes, in an attempt to prevent the tax authorities from demanding the relevant tax debts in court. The preliminary injunction was granted by the competent court. The Company’s legal advisor, responsible for such proceeding, considered the related unfavorable outcome as probable.
36
COSAN S.A. INDÚSTRIA E COMÉRCIO
Notes to the unaudited financial statements (Continued)
Nine month periods ended December 31, 2010 and 2009
(In thousands of reais, except as otherwise specified)
| 14. | Provision for Judicial Demands (Continued) |
Judicial demands deemed as possible loss (Continued)
a) Tax claims (Continued)
(iv) Offsets against IPI credits – IN 67/98 (Continued)
The amount offset, duly restated as of December 31, 2010, is R$167,324 (R$165,814 as of September 30, 2010). Similarly, the subsidiary Cosan Alimentos S.A. filed the same claim before the Brazilian Federal Revenue Secretariat, which amount offset and updated, up to December 31, 2010, amounts to R$12,247 (R$12,141 as of September 30, 2010). In view of the opinion of its legal counsels, the management of the Company has seen fit not to establish an accounting provision for the amounts involved in this lawsuit.
b) Civil and labor claims
The main civil and labor claims, the unfavorable outcome of which is deemed possible and, therefore, no provision for legal claims was recognized in the quarterly information, and which nature of such claims is similar to those accrued, as mentioned above, are as follows:
| Parent company | Consolidated | |||||||||||||||
| 31/12/10 | 30/09/10 | 31/12/10 | 30/09/10 | |||||||||||||
| Civil | 39,891 | 48,977 | 329,195 | 309,848 | ||||||||||||
| Labor | 54,059 | 51,349 | 292,459 | 291,986 | ||||||||||||
| 93,950 | 100,326 | 621,654 | 601,834 | |||||||||||||
| 15. | Accounts Receivable from the Federal Government |
On February 28, 2007, subsidiary Cosan Açúcar e Álcool recognized gain of R$318,358, corresponding to a lawsuit filed against federal government claiming indemnification for damages since prices of its products, at the time the sector was subject to government control, were imposed not observing the prevailing reality of the sector created by government control itself. A final decision in favor of the subsidiary was handed down. The gain was recorded in the statement of operations for the year, the contra entry being to noncurrent assets of the Company, in receivables from federal government.
37
COSAN S.A. INDÚSTRIA E COMÉRCIO
Notes to the unaudited financial statements (Continued)
Nine month periods ended December 31, 2010 and 2009
(In thousands of reais, except as otherwise specified)
| 15. | Accounts Receivable from the Federal Government (Continued) |
The Company awaits a final ruling on the manner of payment. This payment will be effected in the form of court-mandated government bonds which, once issued, will be settled within 10 years.
As of December 31, 2010, the assets reported relative to the suit for loss and damages and related provision for attorney's fees amounted to R$342,110 and R$41,053 (R$339,232 and R$40,708 as of September 30, 2010), respectively.
Subsidiary Cosan Açúcar e Álcool has other claims for damages of this nature filed against the Federal Government, which are not recognized in accounting since these still represent contingent assets.
16. Shareholders’ equity
| a) | Capital stock |
The Board of Directors’ Meeting held on July 29, 2010 approved a capital increase in the amount of R$1 through the issuance of 60 shares due to the exercise of 100 subscription warrants. On the same date, the Board of Directors' Meeting approved the capital increase, in the amount of R$2,749, in the context of the "Company's Stock Option Plan", upon the issuance of 449,819 new nominative and book-entry common shares, with no par value, based on the exercise of such option by the eligible executive officers, at the issuance price of R$6.11 per share. Due to the issuance of new shares, the Company's capital stock increased to R$4,690,575, represented by 407,010,196 nominative and book-entry common shares, with no par value.
On August 31, 2010, a new capital increase was made, in the amount of R$560, through the issuance of 91,657 new non-par registered book-entry common shares under the “Company’s Stock Option Plan”, based on the exercise of such option by the eligible executive officers, at the issuance price of R$6.11 per share, under the terms of such option plan. Due to the issuance of new shares, the Company's capital stock increased to R$4,691,135, represented by 407,101,853 nominative and book-entry common shares, with no par value.
As of December 31, 2010, the Company’s capital stock was represented by 407,101,853 (the same as of September 30, 2010) non-par registered book-entry common shares . The authorized capital stock may be increased up to the limit of R$5,000,000 with no need of an amendment to the Company’s Bylaws, upon a decision of the Board of Directors.
38
16. Shareholders’ equity (Continued)
| b) | Dividends |
The Annual Shareholders’ Meeting held on July 30, 2010 approved the distribution of dividends in the amount of R$200,000 relating to the prior year, of which R$83,431 exceeded the minimum mandatory dividend accounted for in this quarter. As of December 31, 2010 the dividends paid totaled R$192,964.
| c) | Treasury shares |
On November 22, 2010, the Board of Directors approved the plan for repurchase of shares issued by the Company to be held in treasury, cancellation or sale. The term for the operation to be carried out is 365 days and the maximum number of shares that may be repurchased within the period is 6,640,091 common, nominative shares, with no par value (“shares”).
During the quarter ended December 31, 2010, the Company acquired 591,400 shares for the amount of R$15,219, including expenditures with repurchase of shares. The average amount of the acquired shares in the period was R$25.71, and the maximum and minimum amount of R$26.95 and R$24.86, respectively, per share.
On December 31, 2010 the Company held in treasury 934.539 shares, whose market value per share, as of that date, amounted to R$27.61.
| 17. | Management compensation |
Directors and executive officers are paid through pro-labore. The amounts related to such compensation are recorded in the statement of income for the three-month period and nine-month period ended December 31, 2010, in the amount of R$1,688 and R$6,587 (R$1,007 and R$4,732 as of December 31, 2009), respectively, under General and administrative expenses.
39
COSAN S.A. INDÚSTRIA E COMÉRCIO
Notes to the unaudited financial statements (Continued)
Nine month periods ended December 31, 2010 and 2009
(In thousands of reais, except as otherwise specified)
| 18. | Financial, net |
| Parent company | ||||||||||||||||
| 01/10/10 to 31/12/10 | 01/04/10 to 31/12/10 | 01/10/09 to 31/12/09 | 01/04/09 to 31/12/09 | |||||||||||||
| Financial expenses | ||||||||||||||||
| Interest | (71,121 | ) | (204,762 | ) | (87,780 | ) | (250,992 | ) | ||||||||
| Monetary variation | (3,214 | ) | (8,135 | ) | (11,675 | ) | (27,803 | ) | ||||||||
| Bank expenses | (211 | ) | (411 | ) | (48 | ) | (244 | ) | ||||||||
| (74,546 | ) | (213,308 | ) | (99,503 | ) | (279,039 | ) | |||||||||
| Financial income | ||||||||||||||||
| Interest | 3,535 | 16,940 | 14,628 | 30,439 | ||||||||||||
| Monetary variation | 1,114 | 2,707 | (150 | ) | (904 | ) | ||||||||||
| Income from money market investments | 747 | 3,993 | 2,044 | 15,149 | ||||||||||||
| Others | 6 | 25 | 66 | 370 | ||||||||||||
| 5,402 | 23,665 | 16,588 | 45,054 | |||||||||||||
| Net effect on exchange variation | ||||||||||||||||
| Gain on exchange variation | 45,335 | 176,532 | 42,006 | 535,609 | ||||||||||||
| 45,335 | 176,532 | 42,006 | 535,609 | |||||||||||||
| Net impact of derivatives (1) | ||||||||||||||||
| Commodity derivatives | 8,225 | 133,008 | (36,670 | ) | (349,363 | ) | ||||||||||
| Exchange and interest derivatives | 32,211 | 25,071 | 22,616 | 379,714 | ||||||||||||
| 40,436 | 158,079 | (14,054 | ) | 30,351 | ||||||||||||
| 16,627 | 144,968 | (54,963 | ) | 331,975 | ||||||||||||
(1) Includes realized and unrealized income from transactions in futures markets, and with options, swaps and NDFs.
| Consolidated | ||||||||||||||||
| 01/10/10 to 31/12/10 | 01/04/10 to 31/12/10 | 01/10/09 to 31/12/09 | 01/04/09 to 31/12/09 | |||||||||||||
| Financial expenses | ||||||||||||||||
| Interest | (159,549 | ) | (451,849 | ) | (192,705 | ) | (451,659 | ) | ||||||||
| Monetary variation | (25,756 | ) | (58,641 | ) | (17,242 | ) | (41,890 | ) | ||||||||
| Bank expenses | (2,307 | ) | (3,714 | ) | (4,363 | ) | (5,803 | ) | ||||||||
| (187,612 | ) | (514,204 | ) | (214,310 | ) | (499,352 | ) | |||||||||
| Financial income | ||||||||||||||||
| Interest | 15,253 | 51,831 | 51,526 | 95,382 | ||||||||||||
| Monetary variation | 9,928 | 25,314 | 1,511 | 4,791 | ||||||||||||
| Income from money market investments | 22,186 | 58,439 | 14,134 | 41,705 | ||||||||||||
| Others | 104 | 466 | 724 | 426 | ||||||||||||
| 47,471 | 136,050 | 67,895 | 142,304 | |||||||||||||
| Net effect on exchange variation | ||||||||||||||||
| Gain on exchange variation | 59,324 | 214,843 | 50,104 | 628,857 | ||||||||||||
| 59,324 | 214,843 | 50,104 | 628,857 | |||||||||||||
| Net impact of derivatives (1) | ||||||||||||||||
| Commodity derivatives | (31,768 | ) | (35,568 | ) | (28,907 | ) | (399,000 | ) | ||||||||
| Exchange and interest derivatives | 14,777 | 41,894 | 46,933 | 561,228 | ||||||||||||
| (16,991 | ) | 6,326 | 18,026 | 162,228 | ||||||||||||
| (97,808 | ) | (156,985 | ) | (78,285 | ) | 434,037 | ||||||||||
40
COSAN S.A. INDÚSTRIA E COMÉRCIO
Notes to the unaudited financial statements (Continued)
Nine month periods ended December 31, 2010 and 2009
(In thousands of reais, except as otherwise specified)
| 19. | Other operating income (expenses), net |
| Parent company | ||||||||||||||||
| 01/10/10 to 31/12/10 | 01/04/10 to 31/12/10 | 01/10/09 to 31/12/09 | 01/04/09 to 31/12/09 | |||||||||||||
| Capital gain on merger of shares | - | - | - | 3,052 | ||||||||||||
| Gain from the adhesion to payment in installments of Law 11.941/09 and MP 470/09 | - | - | 79,433 | 79,433 | ||||||||||||
| Internal costs for raising funds | - | (18,758 | ) | - | - | |||||||||||
| Reversal (constitution) of provision for judicial demands and indemnities | 1,792 | (12,067 | ) | (214 | ) | 1,283 | ||||||||||
| Result from Sales of property and equipment | (31 | ) | 131 | 275 | ||||||||||||
| Revenue from Sales of scraps and residues | 346 | 1,625 | 267 | 1,072 | ||||||||||||
| Revenue from rental and leasing | 996 | 1,787 | 654 | 2,113 | ||||||||||||
| Donations | (2,640 | ) | (9,105 | ) | - | - | ||||||||||
| Constitution of provision for operating losses in subsidiary | (2,065 | ) | (2,065 | ) | - | - | �� | |||||||||
| Other expenses, net | 12 | (2,298 | ) | (857 | ) | (1,081 | ) | |||||||||
| (1,590 | ) | (40,750 | ) | 79,363 | 86,147 | |||||||||||
| Consolidated | ||||||||||||||||
| 01/10/10 to 31/12/10 | 01/04/10 to 31/12/10 | 01/10/09 to 31/12/09 | 01/04/09 to 31/12/09 | |||||||||||||
| Capital gains from disposal of equity interests, net of losses | - | - | - | 93,097 | ||||||||||||
| Capital loss from business combination | - | - | - | (28,138 | ) | |||||||||||
| Net gain from reduction in equity interest percentage (note 8) | - | 202,755 | - | - | ||||||||||||
| Gain from the adhesion to payment in installments of Law 11.941/09 and MP 470/09 | - | - | 211,649 | 211,649 | ||||||||||||
| Constitution of provision for judicial demands and indemnities | (3,967 | ) | (38,255 | ) | (4,137 | ) | (7,519 | ) | ||||||||
| Result from Sales of property and equipment | 2,199 | 19,031 | 485 | 2,736 | ||||||||||||
| Revenue from Sales of scraps and residues | 857 | 4,979 | 796 | 3,455 | ||||||||||||
| Revenue from rental and leasing | 1,287 | 2,814 | 1,754 | 5,610 | ||||||||||||
| Donations | (2,640 | ) | (12,335 | ) | - | - | ||||||||||
| Constitution of provision for operating losses in subsidiary | (2,065 | ) | (2,065 | ) | - | - | ||||||||||
| Other revenues, net | 682 | 1,043 | 6,465 | 11,126 | ||||||||||||
| (3,647 | ) | 177,967 | 217,012 | 292,016 | ||||||||||||
41
COSAN S.A. INDÚSTRIA E COMÉRCIO
Notes to the unaudited financial statements (Continued)
Nine month periods ended December 31, 2010 and 2009
(In thousands of reais, except as otherwise specified)
| 20. | Financial instruments |
a) Risk management
The main market risks the Company and its subsidiaries are exposed include, among others: (i) volatility of the sugar prices, (ii) volatility of ethanol prices, and (iii) volatility of the exchange rate. The engagement of financial instruments for hedge purposes is carried out based on the analysis of the risk exposures that management intends to assume.
As of December 31, 2010 and September 30, 2010, the fair values related to the transactions with derivative financial instruments for hedge purposes or other purposes were stated at fair value based on the prices exercised in the active markets or cash flows discounted based on the market curves and were presented as follows:
| Parent company | Consolidated | |||||||||||||||||||||||||||||||||||||||
| Notional | Fair value | Notional | Fair value | |||||||||||||||||||||||||||||||||||||
| Price Risk | Dec 31, 2010 | Sep 30, 2010 | Dec 31, 2010 | Sep 30, 2010 | Result (*) | Dec 31, 2010 | Sep 30, 2010 | Dec 31, 2010 | Sep 30, 2010 | Result (*) | ||||||||||||||||||||||||||||||
| Commodity derivatives | ||||||||||||||||||||||||||||||||||||||||
| Future agreements | 2,976,219 | 1,663,613 | (262,414 | ) | (49,796 | ) | (262,414 | ) | 2,976,219 | 1,663,613 | (262,414 | ) | (49,796 | ) | (262,414 | ) | ||||||||||||||||||||||||
| Option agreements | 19,539 | 19,867 | (43,167 | ) | (6,166 | ) | (36,934 | ) | 19,539 | 19,867 | (43,167 | ) | (6,166 | ) | (36,934 | ) | ||||||||||||||||||||||||
| Contratos de Sw ap | ||||||||||||||||||||||||||||||||||||||||
| (305,581 | ) | (55,962 | ) | (299 | ) | (305,581 | ) | (55,962 | ) | (299,348 | ) | |||||||||||||||||||||||||||||
| Exchange rate risk | ||||||||||||||||||||||||||||||||||||||||
| Exchange rate derivatives | ||||||||||||||||||||||||||||||||||||||||
| Future agreements | 257,110 | (501,833 | ) | 2,201 | (3,191 | ) | 2,201 | 257,110 | (501,833 | ) | 2,201 | (3,191 | ) | 2,201 | ||||||||||||||||||||||||||
| Forward agreements | 880,426 | 1,123,505 | 111,458 | 113,186 | 111,458 | 1,137,979 | 1.123,505 | 101,527 | 113,186 | 101,527 | ||||||||||||||||||||||||||||||
| Option agreements | 59,502 | 1,784,502 | 4,923 | 18,793 | 1,027 | 59,502 | 1.784,502 | 4,923 | 18,793 | 1,027 | ||||||||||||||||||||||||||||||
| Swap agreements | 322,023 | 322,023 | 36,709 | 19,613 | 36,709 | - | - | - | - | - | ||||||||||||||||||||||||||||||
| 155,292 | 148,402 | 151,396 | 108,652 | 128,790 | 104,755 | |||||||||||||||||||||||||||||||||||
| Interest rate risk | ||||||||||||||||||||||||||||||||||||||||
| Interest derivatives | 345,860 | 432,325 | (2,115 | ) | (2,969 | ) | (2,115 | ) | 345,860 | 432,325 | (2,115 | ) | (2,969 | ) | (2,115 | ) | ||||||||||||||||||||||||
| (2,115 | ) | (2,969 | ) | (2,115 | ) | (2,115 | ) | (2,969 | ) | (2,115 | ) | |||||||||||||||||||||||||||||
| TOTAL | (152,404 | ) | 89,471 | (150,068 | ) | (199,045 | ) | 69,858 | (196,708 | ) | ||||||||||||||||||||||||||||||
| Total Assets | 216,712 | 185,594 | 180,003 | 165,981 | ||||||||||||||||||||||||||||||||||||
| Total Liabilities | (369,116 | ) | (96,123 | ) | (379,048 | ) | (96,123 | ) | ||||||||||||||||||||||||||||||||
| (*) Results calculated for the twelve-month period ended Dec 31 10, only for derivatives outstanding at this date | ||||||||||||||||||||||||||||||||||||||||
42
COSAN S.A. INDÚSTRIA E COMÉRCIO
Notes to the unaudited financial statements (Continued)
Nine month periods ended December 31, 2010 and 2009
(In thousands of reais, except as otherwise specified)
| 20. | Financial instruments (Continued) |
b) Price risk
Price risk results from the variation of the market prices of the products sold by the Company, mainly sugar #11 and #5 or white sugar. These price variations may significantly affect the Company's sales revenues. In order to mitigate this risk, the Company continuously monitors the market transactions, in order to determine in advance the price variations. The table below shows the consolidated derivative financial instruments transactions to cover the commodities price risk:
| Price risk: commodity derivatives outstanding on Dec 31 2010 | ||||||||||||||||
| Derivatives | Long /Short | Market | Agreement | Maturity | Notional | Fair Value | ||||||||||
| Tons (T) or M³ | (R$ thousands) | |||||||||||||||
| Composition of derivative financial instruments designated in hedge accounting | ||||||||||||||||
| Future | Short | NYBOT | #11 | March-11 | 244,664 | T | (69,935 | ) | ||||||||
| Future | Short | NYBOT | #11 | May-11 | 63,300 | T | (24,365 | ) | ||||||||
| Future | Short | NYBOT | #11 | July-11 | 231,557 | T | (44,139 | ) | ||||||||
| Future | Short | NYBOT | #11 | October-11 | 166,581 | T | (32,387 | ) | ||||||||
| Future | Short | NYBOT | #11 | March-12 | 38,915 | T | (559 | ) | ||||||||
| Swap | Short | NYBOT | #11 | March-11 | 75,696 | T | (38,912 | ) | ||||||||
| Swap | Short | NYBOT | #11 | May-11 | 25,401 | T | 191 | |||||||||
| Swap | Short | NYBOT | #11 | July-11 | 327,675 | T | (31,198 | ) | ||||||||
| Swap | Short | NYBOT | #11 | October-11 | 366,235 | T | (34,077 | ) | ||||||||
| Sub-total of futures of Sugar Sold | 1,540,024 | T | (275,380 | ) | ||||||||||||
Composition of derivative financial instruments not designated in hedge accounting | ||||||||||||||||
| Future | Short | NYBOT | #11 | March-11 | 67,770 | T | (17,353 | ) | ||||||||
| Future | Short | NYBOT | #11 | October-11 | 100,030 | T | (25,110 | ) | ||||||||
| Sub-total of futures Sugar Sold | 167,800 | T | (42,462 | ) | ||||||||||||
| Future | Long | NYBOT | #11 | March-11 | (36,984 | T) | 2,142 | |||||||||
| Future | Long | NYBOT | #11 | May-11 | (15,342 | T) | 6,594 | |||||||||
| Future | Long | NYBOT | #11 | October-11 | (50,802 | T) | 4,404 | |||||||||
| Future | Long | NYBOT | #11 | March-12 | (84,027 | T) | 23,144 | |||||||||
| Swap | Long | NYBOT | #11 | July-11 | (101,605 | T) | 8,006 | |||||||||
| Swap | Long | NYBOT | #11 | October-11 | (127,006 | T) | 11,145 | |||||||||
| Sub-total of futures Sugar Purchased | (415,767 | T) | 55,435 | |||||||||||||
| Sub-total of Futures Sugar | (247,967 | T) | 12,972 | |||||||||||||
| Future | Short | BMFBovespa | Etanol Hidratado | May-11 | 1,200 m³ | (7 | ) | |||||||||
| Sub-total of Futures Hydrated Ethanol | 1,200 m³ | (7 | ) | |||||||||||||
| Sub-total of Futures | (262,414 | ) | ||||||||||||||
| Call | Short | NYBOT/OTC | #11 | July-11 | 75,442 | T | (21,948 | ) | ||||||||
| Call | Short | NYBOT | #11 | October-11 | 15,241 | T | (4,188 | ) | ||||||||
| Call | Short | NYBOT | #11 | March-12 | 10,160 | T | (1,441 | ) | ||||||||
| Call | Short | NYBOT/OTC | #11 | March-11 | 43,182 | T | (8,819 | ) | ||||||||
| Call | Short | NYBOT/OTC | #11 | May-11 | 55,883 | T | (10,880 | ) | ||||||||
| Sub-total of Short Call | 199,907 | T | (47,275 | ) | ||||||||||||
| Put | Long | NYBOT/OTC | #11 | 01/Out/11 | 43,182 T | 1,666 | ||||||||||
| Put | Long | NYBOT/OTC | #11 | 01/Out/11 | 55,883 T | 2,443 | ||||||||||
| Sub-total of Long Put | 99,065 T | 4,108 | ||||||||||||||
| Total Commodities | (305,581 | ) | ||||||||||||||
The fair value of these derivatives was measured through observable factors, such as prices of active markets.
43
COSAN S.A. INDÚSTRIA E COMÉRCIO
Notes to the unaudited financial statements (Continued)
Nine month periods ended December 31, 2010 and 2009
(In thousands of reais, except as otherwise specified)
| 20. | Financial instruments (Continued) |
c) Exchange rate risk
Foreign exchange risk results from the possible variations on foreign exchange rates adopted by the Company as regards to its revenues from exports, imports, debt flows and other assets and liabilities denominated in foreign currency. The Company adopts derivative transactions to manage the cash flow risks resulting from the export revenues denominated in US dollars, net of the other cash flows also denominated in foreign currency. The table below shows the outstanding consolidated positions, as of December 31, 2010, of the derivatives adopted to hedge the foreign exchange risks:
| Price risk : exchange derivatives outstanding on Dec 31 2010 | |||||||||||||||
| Derivatives | Long / Short | Market | Agreement | Maturity | Notional | Fair Value | |||||||||
| (R$ thousands) | (R$ thousands) | ||||||||||||||
Composition of derivative financial instruments designated in hedge accounting | |||||||||||||||
| Forward | Short | OTC/Cetip | NDF | January-11 | 89,460 | 14,475 | |||||||||
| Forward | Short | OTC/Cetip | NDF | April-11 | 185,275 | 15,170 | |||||||||
| Forward | Short | OTC/Cetip | NDF | May-11 | 141,281 | 20,040 | |||||||||
| Forward | Short | OTC/Cetip | NDF | July-11 | 99,300 | 11,886 | |||||||||
| Forward | Short | OTC/Cetip | NDF | August-11 | 103,750 | 15,368 | |||||||||
| Forward | Short | OTC/Cetip | NDF | October-11 | 261,360 | 34,518 | |||||||||
| Sub-total of Short Forward | 880,426 | 111,458 | |||||||||||||
Composition of derivative financial instruments not designated in hedge accounting | |||||||||||||||
| Future | Short | BMFBovespa | Commerc. US Dollar | January-11 | 380,901 | 2,730 | |||||||||
| Future | Short | BMFBovespa | Commer. US Dollar | February-11 | 139,171 | 1,348 | |||||||||
| Sub-total of Short Futures | 520,072 | 4,078 | |||||||||||||
| Future | Long | BMFBovespa | Commerc. US Dollar | January-11 | (262,962) | (1,877 | ) | ||||||||
| Sub-total of Long Futures | (262,962) | (1,877 | ) | ||||||||||||
| Forward | Long | OTC | NDF (Offshore) | February-11 | 10,583 | (233 | ) | ||||||||
| Forward | Long | OTC | NDF (Offshore) | May-11 | 10,780 | (229 | ) | ||||||||
| Forward | Long | OTC | NDF (Offshore) | August-11 | 11,014 | (227 | ) | ||||||||
| Forward | Long | OTC | NDF (Offshore) | November-11 | 11,246 | (255 | ) | ||||||||
| Forward | Long | OTC | NDF (Offshore) | February-12 | 11,489 | (317 | ) | ||||||||
| Forward | Long | OTC | NDF (Offshore) | May-12 | 11,722 | (313 | ) | ||||||||
| Forward | Long | OTC | NDF (Offshore) | August-12 | 11,978 | (330 | ) | ||||||||
| Forward | Long | OTC | NDF (Offshore) | October-12 | 12,239 | (353 | ) | ||||||||
| Forward | Long | OTC | NDF (Offshore) | January-13 | 12,504 | (359 | ) | ||||||||
| Forward | Long | OTC | NDF (Offshore) | April-13 | 12,739 | (324 | ) | ||||||||
| Forward | Long | OTC | NDF (Offshore) | July-13 | 12,997 | (302 | ) | ||||||||
| Forward | Long | OTC | NDF (Offshore) | October-13 | 13,256 | (281 | ) | ||||||||
| Forward | Long | OTC | NDF (Offshore) | January-14 | 13,521 | (319 | ) | ||||||||
| Forward | Long | OTC | NDF (Offshore) | April-14 | 13,743 | (464 | ) | ||||||||
| Forward | Long | OTC | NDF (Offshore) | July-14 | 14,002 | (632 | ) | ||||||||
| Forward | Long | OTC | NDF (Offshore) | October-14 | 14,261 | (797 | ) | ||||||||
| Forward | Long | OTC | NDF (Offshore) | February-15 | 14,497 | (919 | ) | ||||||||
| Forward | Long | OTC | NDF (Offshore) | April-15 | 14,726 | (997 | ) | ||||||||
| Forward | Long | OTC | NDF (Offshore) | July-15 | 15,003 | (1,099 | ) | ||||||||
| Forward | Long | OTC | NDF (Offshore) | October-15 | 15,254 | (1,183 | ) | ||||||||
| Sub-total of Long Forward | 257,553 | (9,931 | ) | ||||||||||||
| Put Offshore | Long | OTC | Commerc.US dollar | February-11 | 42,782 | 2,960 | |||||||||
| Put Offshore | Long | OTC | Commerc. US dollar | February-11 | 16,720 | 1,964 | |||||||||
| Sub-total of Long Put | 59,502 | 4,923 | |||||||||||||
| Total of exchange for exports | 1,454,591 | 108,652 | |||||||||||||
| Swap | Long | OTC/Cetip | US Dollar/DI | 322,023 | 36,709 | ||||||||||
| Swap | Short | OTC/Cetip | US Dollar/DI | (322,023) | (36,709 | ) | |||||||||
| Total of exchange | 1,454,591 | 108,652 | |||||||||||||
44
COSAN S.A. INDÚSTRIA E COMÉRCIO
Notes to the unaudited financial statements (Continued)
Nine month periods ended December 31, 2010 and 2009
(In thousands of reais, except as otherwise specified)
| 20. | Financial instruments (Continued) |
c) Exchange rate risk (continued)
As of December 31, 2010 and September 30, 2010, the Company and its subsidiaries presented the following net exposure to the US exchange rate variation over assets and liabilities denominated in US dollars:
| Consolidated | ||||||||||||||||
| 12/30/10 | 09/30/10 | |||||||||||||||
| R$ | US$ (in thousands) | R$ | US$ (in thousands) | |||||||||||||
| Amounts pending foreign exchange closing | 16,135 | 9,684 | 5,182 | 3,059 | ||||||||||||
| Overnight | 16,960 | 10,179 | 23,936 | 14,128 | ||||||||||||
| Trade notes receivable – foreign | 96,319 | 57,808 | 189,195 | 111,672 | ||||||||||||
| Senior notes due in 2014 | (605,330 | ) | (363,300 | ) | (601,107 | ) | (354,803 | ) | ||||||||
| Senior notes due in 2017 | (685,789 | ) | (411,589 | ) | (685,454 | ) | (404,589 | ) | ||||||||
| Perpetual bonus | (1,264,902 | ) | (759,154 | ) | (771,375 | ) | (455,303 | ) | ||||||||
| Other foreign currency-denominated loans | (378,884 | ) | (227,394 | ) | (556,568 | ) | (328,514 | ) | ||||||||
| Prepayments | (731,465 | ) | (439,002 | ) | (845,838 | ) | (499,255 | ) | ||||||||
| Restricted cash | 276,249 | 165,796 | 75,950 | 44,829 | ||||||||||||
| Foreign exchange exposure, net | (3,260,707 | ) | (1,956,972 | ) | (3,166,079 | ) | (1,868,776 | ) | ||||||||
d) Hedge accounting effects |
| The Company determined its hedge accounting transactions for derivative financial instruments allocated to hedge the cash flows from VHP sugar export revenues, considering: (i) hedge classification; (ii) purpose and strategy to manage the Company’s risk in connection with the adoption of the hedge transactions; (iii) identification of the financial instrument; (iv) purpose or covered transaction; (v) nature of the risk to be covered; (vi) description of the coverage relationship; (vii) description of the relationship between the hedge and the coverage purpose; and (viii) prospective and retrospective hedge effectiveness. The Company allocated the derivative financial instruments of Sugar#11 (NYBOT or OTC) to cover the price risks and Non-Deliverable Forward (NDF) to cover the foreign exchange risks, as referred to in items (b) and (c) of this note. |
45
COSAN S.A. INDÚSTRIA E COMÉRCIO
Notes to the unaudited financial statements (Continued)
Nine month periods ended December 31, 2010 and 2009
(In thousands of reais, except as otherwise specified)
| 20. | Financial instruments (Continued) |
d) Hedge accounting effects (continued) |
| The Company recorded the gains and losses considered as effective for hedge accounting purposes in a specific account in shareholder’s equity, until the time the hedged item affects the net income for the year; in this case, the gain or loss of each instrument must be recorded in the net income for the year under the same account of the hedged item (in this case, sales revenues). As of December 31, 2010, the effects recorded in shareholders' equity and estimated realizable net income are as follows: |
| Realization | ||||||||||||||||
| Derivative | Market | Risk | 2010/11 | 2011/12 | Total | |||||||||||
| Future | OTC / NYBOT | #11 | (102,033 | ) | (378,536 | ) | (480,569 | ) | ||||||||
| NDF | OTC / CETIP | USD | 10,655 | 93,747 | 104,402 | |||||||||||
| (91,378 | ) | (284,789 | ) | (376,167 | ) | |||||||||||
| (-) Deferred IR/CS | 31,068 | 96,828 | 127,897 | |||||||||||||
| Effect on the Company Net Equity | (60,309 | ) | (187,961 | ) | (248,270 | ) | ||||||||||
| During the period, there was the effect on the financial result in the amount of R$15,658 on account of operations that have not been qualified in the hedge accounting. In addition, the Company recorded net gain in the amount of R$104 and R$279 referring to the ineffective hedge accounting amounts for the quarter and the nine-month period ended December 31, 2010, respectively. |
Hedge de Fluxo de caixa | 01/10/10 a 31/12/10 | 01/04/10 a 31/12/10 | ||||||
| Balance at the beginning of the period | (199,169 | ) | - | |||||
| Gains and losses in the period: | ||||||||
| Future agreements and commodities swap | (296,908 | ) | (589,769 | ) | ||||
Forward Exchange agreement (NDF) | 19,440 | 129,007 | ||||||
| Adjustments of reclassification of gains/losses included in the result for the period (Sales revenue/Financial, net) | 100,478 | 84,603 | ||||||
Total effect on Book Value Adjustment resulting from hedge of cash flow (before deferred IR/CS) | (376,159 | ) | (376,159 | ) | ||||
| Effect of deferred IR/CS on Book Value Adjustment | 127,889 | 127,889 | ||||||
| (248,270 | ) | (248,270 | ) | |||||
| e) | Interest rate risk |
The Company monitors fluctuations of the several interest rates to which its assets and liabilities are pegged, mainly those subject to Libor risk, and, in the event of increased volatility of such rates, it may engage in transactions with derivatives so as to minimize such risks. As of December 31, 2010, the Company had US$200,000 thousand (US$250,000 thousand as of September 30, 2010) hedged under swap agreement traded in over-the-counter market, whose market value is evaluated negatively at R$2,115 (the negative amount of R$2,969 as of September 30, 2010).
46
COSAN S.A. INDÚSTRIA E COMÉRCIO
Notes to the unaudited financial statements (Continued)
Nine month periods ended December 31, 2010 and 2009
(In thousands of reais, except as otherwise specified)
| 20. | Financial instruments (Continued) |
| e) | Interest rate risk (Continued) |
| Price risk: Interest derivative outstanding on Dec 31 2010 | ||||||||||
| Derivatives | Purchased / Sold | Market | Agreement | Notional | Fair Value | |||||
| (R$ thousands) | (R$ thousands) | |||||||||
| Swap | Purchased | OTC/Cetip | Fix / Libor 3 Month | 115,287 | (705) | |||||
| Swap | Purchased | OTC/Cetip | Fix / Libor 3 Month | 230,573 | (1,410) | |||||
| 345,860 | (2,115) | |||||||||
| f) | Credit risk |
A significant portion of sales made by the Company and its subsidiaries is for a selected group of best-in-class counterparts, i.e. trading companies, fuel distribution companies and large supermarket chains.
Credit risk is managed through specific rules of client acceptance, credit rating and setting of limits for customer exposure, including the requirement of a letter of credit from major banks and obtaining actual warranties on given credit, when applicable. Management believes that the risk of credit is substantially covered by the allowance for doubtful accounts
The Company carries out commodity derivative transactions in the futures and options markets at the stock exchanges of New York (NYBOT) and London (LIFFE), as well as in the over-the-counter market with selected counterparts. The Company carries out foreign exchange derivative transactions at BM&F Bovespa and over-the-counter agreements registered with CETIP with Goldman Sachs & Co, Banco Barclays S.A., BNP Paribas Commodity Futures Ltd., Newedge LLC, Macquarie Bank Ltd., ADM Investors Services International Limited (Hencorp), Prudential Bache Commodities LLC, Natixis Commodity Markets Ltd., Espirito Santo Investment do Brasil S.A., Deutsche Bank S.A. – Banco Alemão, Banco Bradesco S.A., Banco JP Morgan S.A., Banco Standard de Investimentos S.A., Banco Morgan Stanley Witter S.A. and Banco BTG Pactual S.A.
Guarantee margins – The derivative transactions carried out in stock exchanges (NYBOT, LIFFE and BM&FBovespa) require an initial margin for guarantee purposes. The brokers with which the Company trades at such stock exchanges offer credit limits to these margins. As of December 31, 2010, the total credit limit considered for initial margin is R$138,672 (R$58,097 as of September 30, 2010). In order to trade at BM&F Bovespa, the Company counted with, as of December 31, 2010, R$31,760 (R$57,007 as of September 30, 2010) through the Settlement Guarantee provided by a first-class bank. T he Company’s derivative transactions in the over-the-counter market do not require guarantee margin.
47
COSAN S.A. INDÚSTRIA E COMÉRCIO
Notes to the unaudited financial statements (Continued)
Nine month periods ended December 31, 2010 and 2009
(In thousands of reais, except as otherwise specified)
| 20. | Financial instruments (Continued) |
| g) | Debt acceleration risk |
As of December 31, 2010, the Company was a party to loan and financing agreements with covenants generally applicable to these operations, including requirements related to cash generation, debt to equity ratio and others. These covenants are being fully complied with by the Company and do not place any restrictions on its operations.
| h) | Market values |
As of December 31, 2010 the market values of cash and cash equivalents, trade accounts receivable and trade accounts payable approximate the amounts recorded to the consolidated quarterly information due to their short-term nature.
The fair value of the Senior Notes maturing in 2014 and 2017, as described in Note 13, according to their market value, were 115.5% and 106.0%, respectively, of their face value at December 31, 2010.
The fair value of Perpetual Notes as described in Note 13, according to its market value, was 100.6% of its face value at December 31, 2010.
As for the other loan and financing arrangements, their respective fair values substantially approximate the amounts recorded in the quarterly information considering that such instruments are subject to variable interest rates.
| i) | Sensitivity analysis |
Pursuant to CVM Rule Nº 475 issued on December 17, 2008, following is the sensitivity analysis of the fair value of financial instruments, in accordance with the types of risks deemed to be significant by the Company:
Assumptions for sensitivity analysis
For the analysis, the Company adopted three scenarios, being one probable and two that may have effects from impairment of the fair value of the Company’s financial instruments. The probable scenario was defined based on the futures sugar and US dollar market curves as of December 31, 2010, the same which determines the fair value of the derivatives at that date. Possible and remote scenarios were defined based on adverse impacts of 25% and 50% over the sugar and dollar price curves, which served as basis for the probable scenario.
48
COSAN S.A. INDÚSTRIA E COMÉRCIO
Notes to the unaudited financial statements (Continued)
Nine month periods ended December 31, 2010 and 2009
(In thousands of reais, except as otherwise specified)
| 20. | Financial instruments (Continued) |
| i) | Sensitivity analysis (Continued |
Sensitivity exhibit
Following is the sensitivity exhibit on the change in the fair value of the Company’s financial derivatives:
| Impacts on the result (*) | |||||||||||||
| Risk factor | Probable scenario | Possible scenario (25%) | Remote scenario (50%) | ||||||||||
| Price risk | |||||||||||||
| Commodity derivatives | |||||||||||||
Futures agreements: | |||||||||||||
Sale Commitments | Increase in sugar price | (317,842 | ) | (422,990 | ) | (845,980 | ) | ||||||
Purchase Commitments | Decrease in sugar price | 55,435 | (97,574 | ) | (195,148 | ) | |||||||
Sales Commitments | Increase in hydrated ethanol | (7 | ) | (350 | ) | (700 | ) | ||||||
Options agreements: | |||||||||||||
Call options sold | Increase in sugar price | (47,275 | ) | (45,877 | ) | (95,545 | ) | ||||||
Put options sold | Increase in sugar price | 4,108 | (2,536 | ) | (3,507 | ) | |||||||
| Exchange rate risk | |||||||||||||
| Exchange rate derivatives | |||||||||||||
Futures agreements: | |||||||||||||
Sale Commitments | R / US exchange rate appreciation | 4,078 | (127,198 | ) | (254,395 | ) | |||||||
Purchase Commitments | R / US exchange rate depreciation | (1,877 | ) | (64,149 | ) | (128,297 | ) | ||||||
Forward agreements: | |||||||||||||
Sale Commitments | R / US exchange rate appreciation | 111,458 | (181,249 | ) | (362,497 | ) | |||||||
Purchase Commitments | R / US exchange rate depreciation | (9,931 | ) | (49,662 | ) | (98,514 | ) | ||||||
Options agreements: | |||||||||||||
Put option purchased | R / US exchange rate appreciation | 4,923 | (4,922 | ) | (4,923 | ) | |||||||
| Interest rate risk | |||||||||||||
| Interest derivatives | |||||||||||||
Swap agreements | Libor curve decline | (2,115 | ) | (647 | ) | (1,296 | ) | ||||||
(*) Result expected for up to 12 months as from December 31, 2010
49
COSAN S.A. INDÚSTRIA E COMÉRCIO
Notes to the unaudited financial statements (Continued)
Nine month periods ended December 31, 2010 and 2009
(In thousands of reais, except as otherwise specified)
| 21. | Insurance |
At December 31, 2010, the Company and its subsidiaries maintain insurance coverage against fire, thunderbolts and explosions of any nature for the whole sugar and ethanol inventory and for specific buildings, equipment, facilities and machinery.
The scope of work of our auditors does not include the issue of an opinion on the sufficiency of the insurance coverage, which was considered by the Company's management sufficient to cover any damages.
| 22. | Stock option plan |
The Annual and Extraordinary Shareholders’ Meeting held on August 30, 2005 approved the Guidelines for the Outlining and Structuring of a Stock Option Plan for Company’s officers and employees, thus authorizing the issue of up to 5% of the Company’s share capital. The stock option plan was designed to obtain and retain the services rendered by senior officers and employees, offering them the opportunity to become shareholders of the Company. On September 22, 2005, the Board of Directors approved the distribution of stock options corresponding to 4,302,780 common shares to be issued by the Company, related to 3.25% of the share capital at that time, as authorized by the Annual/Extraordinary Shareholders’ Meeting. On that same date, eligible officers were informed of the material terms and conditions of the share-based com pensation agreement.
On September 11, 2007, the Board of Directors approved the distribution of stock options, corresponding to 450,000 common shares to be issued or purchased by the Company, related to 0.24% of the share capital at that time, as authorized by the Annual/Extraordinary Shareholders’ Meeting. On that same date, the eligible officer was informed of the material terms and conditions of the share-based compensation agreement. The remaining 1.51% may still be distributed.
On August 7, 2009, the Board of Directors approved a new distribution of stock option with no vesting period, corresponding to 165,657 common shares to be issued or purchased by the Company due to a change in the list of Company’s Officers.
50
COSAN S.A. INDÚSTRIA E COMÉRCIO
Notes to the unaudited financial statements (Continued)
Nine month periods ended December 31, 2010 and 2009
(In thousands of reais, except as otherwise specified)
| 22. | Stock option plan (Continued) |
Based on the fair value at the issue date, exercise price is R$6.11 (six Brazilian reais and eleven cents) per share, without discount. The exercise price was calculated before the above evaluation based on an expected private equity agreement, which was not entered into. The options become exercisable after one year period, considering a maximum percentage of 25% p.a. of total stock options offered by the Company, within a period of 5 years.
The exercised options shall be settled only upon the issue of new common or treasury shares that the Company may have on each date.
Should any holder of stock options cease to be an employee or manager of the Company, by death, retirement or permanent disability of the beneficiary, any options not previously vesting shall become extinct on the date that employee or officer separates from the Company. However, in the case of termination without cause, the terminated employees shall be entitled to exercise 100% of their options referring to that particular year, on top of exercising 50% of their options in the coming year.
At December 31, 2010, options equivalent to 112,440 common shares were not exercised.
Until December 31, 2010, all stock option exercises were settled through the issuance of new common shares. Should the remaining options also be exercised through the issuance of new common shares, the current shareholders' interest would be reduced by 0.03% after exercising all remaining options.
As of December 31, 2010, R$1,418 relating to unrecognized compensation cost relating to stock options shall be recognized over approximately 9 months (R$1,934 as of September 30, 2010, with an approximate term of 12 months).
| 23. | Pension plan |
The subsidiary Cosan CL sponsors Previd Exxon - Sociedade de Previdência Privada, a closed-ended supplementary pension entity set up on December 23, 1980 mainly engaged in the supplementation of benefits within certain limits set in its formation deeds, to which all employees of the sponsor and their beneficiaries are entitled as social security insured workers.
Actuarial liability related to Previd Exxon was determined as set forth in NPC 26 issued by IBRACON and is recorded under non-current liabilities, as of December 31, 2010, in the amount of R$53,644 (R$57,774 as of September 30, 2010).
51
COSAN S.A. INDÚSTRIA E COMÉRCIO
Notes to the unaudited financial statements (Continued)
Nine month periods ended December 31, 2010 and 2009
(In thousands of reais, except as otherwise specified)
| 23. | Pension plan (Continued) |
As of the quarter and nine-month period ended December 31, 2010 the contributions to Previd Exxon – Sociedade de Previdência Privada totaled R$1,575 and R$4,897,( as of December 31, 2009, R$ 1,508 and R$ 5,054 respectively).
| 24. | Information per segment (consolidated) |
a) Information per segment
The information per segment is based on the information used by Cosan’s management to evaluate the performance of the operating segments and take the decisions related to the investment of the financial resources. The Company has three segments: (i) sugar and ethanol (products resulting from the “CAA” activities; (ii) distribution of fuel and lubricants (activities performed by “CCL”); and (iii) logistics (operations performed by the indirect subsidiary “RUMO”). Each segment is administered individually in order to facilitate the serving of clients from different segments. The operating assets related to these segments are located solely in Brazil.
Below is a description of the Company’s operating segments.
The CAA segment’s main activities are the production and sale of a number of sugarcane byproducts, including the VHP sugar, ethanol, fuel, anhydride and hydrated ethanol. This segment also includes the activities related to the co-generation of power as from the sugarcane bagasse.
The CCL segment includes the distribution and sale of fuel and lubricants, mainly through the Esso chain located throughout Brazil, as well as convenience stores.
The RUMO segment includes the provision of logistics services involving transportation, warehousing and sugar port lifting to both the CAA segment and third parties.
52
COSAN S.A. INDÚSTRIA E COMÉRCIO
Notes to the unaudited financial statements (Continued)
Nine month periods ended December 31, 2010 and 2009
(In thousands of reais, except as otherwise specified)
| 24. | Information per segment (consolidated) (Continued) |
a) Information per segment (Continued)
The information selected from the statement of income and assets per segment, which information was measured in accordance with the same accounting practices adopted in the preparation of the consolidated quarterly information, is as follows:
| December 31, 2010 | ||||||||||||||||||||
CAA | CCL | Rumo | Adjustments and exclusions | Consolidated | ||||||||||||||||
| Balance sheet: | ||||||||||||||||||||
| Property, plant and equipment | 5,126,710 | 392,602 | 654,610 | - | 6,173,922 | |||||||||||||||
| Intangible assets | 1,434,683 | 1,429,699 | 73,668 | - | 2,938,050 | |||||||||||||||
| Financial debt, net | (5,485,868 | ) | (461,381 | ) | (6,639 | ) | - | (5,953,888 | ) | |||||||||||
| Other assets and liabilities, net | 4,196,397 | 583,087 | 24,105 | (2,464,760 | ) | 2,338,829 | ||||||||||||||
| Total assets (net of liabilities) allocated per segment (1) | 5,271,922 | 1,944,007 | 745,744 | (2,464,760 | ) | 5,496,913 | ||||||||||||||
| (1) | Composed of captions Shareholders' equity and Minority interest. |
| September 30, 2010 | ||||||||||||||||||||
CAA | CCL | Rumo | Adjustments and exclusions | Consolidated | ||||||||||||||||
| Balance sheet: | ||||||||||||||||||||
| Property, plant and equipment | 4,983,323 | 358,631 | 536,446 | - | 5,878,400 | |||||||||||||||
| Intangible assets | 1,436,482 | 1,421,625 | 73,668 | - | 2,931,775 | |||||||||||||||
| Financial debt, net | (4,970,531 | ) | (493,232 | ) | 82,721 | - | (5,381,042 | ) | ||||||||||||
| Other assets and liabilities, net | 3,926,945 | 616,440 | 29,338 | (2,407,801 | ) | 2,164,922 | ||||||||||||||
| Total assets (net of liabilities) allocated per segment (1) | 5,376,219 | 1,903,464 | 722,173 | (2,407,801 | ) | 5,594,055 | ||||||||||||||
| 01/10/10 to 31/12/10 | ||||||||||||||||||||
CAA | CCL | Rumo | Adjustments and exclusions | Consolidate} | ||||||||||||||||
| Statement of income for the period (three months): | ||||||||||||||||||||
| Net operating revenue | 1,683,032 | 3,084,823 | 113,672 | (143,094 | ) | 4,738,433 | ||||||||||||||
| Gross profit | 313,936 | 221,510 | 38,337 | 4,127 | 577,910 | |||||||||||||||
| Sales, general and administrative expenses | (255,216 | ) | (137,850 | ) | (5,785 | ) | (4,127 | ) | (402,978 | ) | ||||||||||
| Operating results (2) | 58,720 | 83,660 | 32,552 | - | 174,932 | |||||||||||||||
| Other operating income (expenses), net | (7,509 | ) | 4,201 | (339 | ) | - | (3,647 | ) | ||||||||||||
| Other selected information: | ||||||||||||||||||||
| Additions to property plant and equipment and intangible assets | 379,186 | 45,891 | 123,678 | - | 548,755 | |||||||||||||||
| Depreciation and amortization | 223,560 | 0,169 | 5,512 | - | 239,241 | |||||||||||||||
| (2) | Composed of Gross Profits less sales, general and administrative expenses. |
53
COSAN S.A. INDÚSTRIA E COMÉRCIO
Notes to the unaudited financial statements (Continued)
Nine month periods ended December 31, 2010 and 2009
(In thousands of reais, except as otherwise specified)
| 24. | Information per segment (consolidated) (Continued) |
a) Information per segment (Continued)
| 01/04/10 to 31/12/10 | ||||||||||||||||||||
| CAA | CCL | Rumo | Adjustments and exclusions | Consolidated | ||||||||||||||||
| Statement of income for the period (nine months): | ||||||||||||||||||||
| Net operating revenue | 4,715,166 | 8,883,453 | 363,618 | (508,095 | ) | 13,454,142 | ||||||||||||||
| Gross profit | 1,056,844 | 632,905 | 115,600 | 7,588 | 1,812,937 | |||||||||||||||
| Sales, general and administrative expenses | (720,011 | ) | (402,744 | ) | (20,680 | ) | 2,925 | (1,140,510 | ) | |||||||||||
| Operating results (2) | 336,833 | 230,161 | 94,920 | 10,513 | 672,427 | |||||||||||||||
| Other operating income (expenses), net | 164,282 | 15,085 | 8,725 | (10,125 | ) | 177,967 | ||||||||||||||
| Other selected information: | ||||||||||||||||||||
| Additions to property plant and equipment and intangible assets | 1,079,200 | 94,117 | 374,752 | - | 1,548,069 | |||||||||||||||
| Depreciation and amortization | 663,596 | 37,092 | 14,171 | - | 714,859 | |||||||||||||||
| 01/10/09 to 31/12/09 | ||||||||||||||||||||
CAA | CCL | Rumo | Adjustments and exclusions | Consolidated | ||||||||||||||||
| Statement of income for the period (three months): | ||||||||||||||||||||
| Net operating revenue | 1,146,180 | 2,699,638 | 35,738 | (81,056 | ) | 3,800,500 | ||||||||||||||
| Gross profit | 259,114 | 192,869 | 5,355 | 2,645 | 459,983 | |||||||||||||||
| Sales, general and administrative expenses | (195,760 | ) | (133,688 | ) | (4,213 | ) | (2,645 | ) | (336,306 | ) | ||||||||||
| Operating results (2) | 63,354 | 59,181 | 1,142 | - | 123,677 | |||||||||||||||
| Other operating income (expenses), net | 215,062 | 704 | 1,246 | - | 217,012 | |||||||||||||||
| Other selected information: | ||||||||||||||||||||
| Additions to property plant and equipment and intangible assets | 380,528 | 20,455 | - | - | 400,983 | |||||||||||||||
| Depreciation and amortization | 137,397 | 8,794 | 3,480 | - | 149,671 | |||||||||||||||
| 01/04/09 to 31/12/09 | ||||||||||||||||||||
CAA | CCL | Rumo | Adjustments and exclusions | Consolidated | ||||||||||||||||
| Statement of income for the period (nine months): | ||||||||||||||||||||
| Net operating revenue | 3,563,670 | 7,556,386 | 117,963 | (296,080 | ) | 10,941,939 | ||||||||||||||
| Gross profit | 764,149 | 563,614 | 29,065 | (5,328 | ) | 1,351,500 | ||||||||||||||
| Sales, general and administrative expenses | (604,079 | ) | (351,598 | ) | (12,319 | ) | 5,328 | (962,668 | ) | |||||||||||
| Operating results (2) | 160,070 | 212,016 | 16,746 | - | 388,832 | |||||||||||||||
| Other operating income (expenses), net | 220,322 | 95,585 | (23,865 | ) | (26 | ) | 292,016 | |||||||||||||
| Other selected information: | ||||||||||||||||||||
| Additions to property plant and equipment and intangible assets | 1,140,276 | 39,713 | 707 | - | 1,180,696 | |||||||||||||||
| Depreciation and amortization | 438,898 | 26,788 | 10,707 | - | 476,393 | |||||||||||||||
54
COSAN S.A. INDÚSTRIA E COMÉRCIO
Notes to the unaudited financial statements (Continued)
Nine month periods ended December 31, 2010 and 2009
(In thousands of reais, except as otherwise specified)
| 24. | Information per segment (consolidated) (Continued) |
a) Sales revenue per segment
| 01/10/10 to 31/12/10 | 01/04/10 to 31/12/10 | 01/10/09 to 31/12/09 | 01/04/09 to 31/12/09 | |||||||||||||
| CAA | ||||||||||||||||
| Sugar | 931,947 | 2,868,259 | 735,635 | 2,162,289 | ||||||||||||
| Ethanol | 647,721 | 1,536,990 | 338,267 | 1,145,499 | ||||||||||||
| Cogeneration | 53,695 | 190,521 | 19,435 | 87,919 | ||||||||||||
| Others | 49,669 | 119,396 | 52,843 | 167,963 | ||||||||||||
| 1,683,032 | 4,715,166 | 1,146,180 | 3,563,670 | |||||||||||||
| CCL | ||||||||||||||||
| Fuels | 2,865,656 | �� | 8,220,428 | 2,537,036 | 7,035,711 | |||||||||||
| Lubricants | 207,367 | 613,618 | 143,886 | 465,117 | ||||||||||||
| Others | 11,800 | 49,407 | 18,716 | 55,557 | ||||||||||||
| 3,084,823 | 8,883,453 | 2,699,638 | 7,556,385 | |||||||||||||
| Rumo | ||||||||||||||||
| Lifting | 29,020 | 102,857 | 35,738 | 115,261 | ||||||||||||
| Freight | 80,945 | 249,463 | - | 2,703 | ||||||||||||
| Others | 3,707 | 11,298 | - | - | ||||||||||||
| 113,672 | 363,618 | 35,738 | 117,964 | |||||||||||||
| Adjustments and exclusions | (143,094 | ) | (508,095 | ) | (81,056 | ) | (296,080 | ) | ||||||||
| 4,738,433 | 13,454,142 | 3,800,500 | 10,941,939 | |||||||||||||
Over the nine-month period ended December 31, 2010 and 2009, the percentage of revenue from sales per region was as follows:
| 31/12/10 | 31/12/09 | |||||||
| Brazil | 67.65 | % | 80.14 | % | ||||
| Europe | 26.45 | % | 13.33 | % | ||||
| Middle East and Asia | 2.51 | % | 2.06 | % | ||||
| North America | 1.01 | % | 3.43 | % | ||||
| Latin America (except Brazil) | 0.57 | % | 0.44 | % | ||||
| Others | 1.81 | % | 0.60 | % | ||||
| Total | 100.00 | % | 100.00 | % | ||||
| b) | Main clients |
| CAA |
| Sales from this segment are relatively diluted, with only one client representing more than 10% of the sales in this segment over the nine-month period ended December 31, 2010 and 2009: SUCDEN Group, with 16.1% and 21.3% of the sales, respectively. |
| CCL |
| Sales from this segment are highly diluted, without specific clients or economic groups representing 10% or more of the sales in this segment |
55
COSAN S.A. INDÚSTRIA E COMÉRCIO
Notes to the unaudited financial statements (Continued)
Nine month periods ended December 31, 2010 and 2009
(In thousands of reais, except as otherwise specified)
| 24. | Information per segment (consolidated) (Continued) |
b) Main clients (Continued)
RUMO
Over the nine-month period ended December 31, 2010 and 2009, 55.3% and 27.71%, respectively, of the sales refer to the CAA segment. In addition, over the same period, this segment had two clients with revenues representing more than 10% of total revenues: (i) SUCDEN Group, representing 7.4% (14.4% as of December 31, 2009) and (ii) ED & F MAN Brasil S.A., representing 4.3% (16.9% as of December 31, 2009).
| 25. | Subsequent Events |
Acquisition of Usina Zanin
On January 7, 2011, the Company entered into a Memorandum of Linking Understanding (“Memorandum”) with Usina Zanin Açúcar e Álcool Ltda. (“Zanin”) partners, located in the region of Araçatuba, State of São Paulo, with exclusivity term of 45 days, aiming at the acquisition of total quotas representing Zanin capital stock, which will involve assets related to the industrial and agriculture activities with annual grind capacity of approximately 2.6 million tons of sugarcane and one greenfield project located in the municipality of Prata, State of Minas Gerais. Under the memorandum, the purchase price will be R$142.0 million (subject to adjustment) payable through cash. In addition, the Company will assume financial debts tot aling R$236.6 million.
The formalization of this acquisition is subject to the satisfaction of certain previous conditions such as the renegotiation of financial liabilities with the creditor banks and the negotiation of definitive contracts.
56
SIGNATURES
Pursuant to the requirements of the Securities Exchange Act of 1934, the registrant has duly caused this report to be signed on its behalf by the undersigned, thereunto duly authorized.
| COSAN LIMITED | ||||||
| Date: | February 11, 2011 | By: | /s/ Marcelo Eduardo Martins | |||
| Name: | Marcelo Eduardo Martins | |||||
| Title: | Chief Financial Officer and Investor Relations Officer | |||||