FORM 6-K
SECURITIES AND EXCHANGE COMMISSION
Washington, D.C. 20549
Report of Foreign Issuer
Pursuant to Rule 13a-16 or 15d-16
of the Securities Exchange Act of 1934
For the month of February, 2012
Commission File Number: 1-33659
COSAN LIMITED
(Translation of registrant’s name into English)
Av. Juscelino Kubitschek, 1726 – 6th floor
São Paulo, SP 04543-000 Brazil
(Address of principal executive offices)
Indicate by check mark whether the registrant files or will file annual reports under cover of Form 20-F or Form 40-F:
| Form 20-F | X | Form 40-F |
Indicate by check mark if the registrant is submitting the Form 6-K in paper as permitted by Regulation S-T Rule 101(b)(1):
| Yes | No | X |
Indicate by check mark if the registrant is submitting the Form 6-K in paper as permitted by Regulation S-T Rule 101(b)(7):
| Yes | No | X |
COSAN LIMITED
Item | |
| 1. | Financial Letter for the 3º Quarter of Fiscal Year 2012 – October, November, and December 2011 |
Efficient integration, synergies apparent in 3Q12
São Paulo, February 8, 2012 – COSAN LIMITED (NYSE: CZZ; BM&FBovespa: CZLQ11) and COSAN S.A. INDÚSTRIA E COMÉRCIO (BM&FBovespa: CSAN3) announce today their results for the third quarter of fiscal year 2012 (3Q12), ended December 31, 2011. The results for 3Q12 are consolidated in accordance with Brazilian (BRGAAP) and international (IFRS) accounting principles.
Marcelo Martins CFO & IRO Guilherme Machado IR Manager Phillipe Casale IR Analyst ri@cosan.com.br www.cosan.com.br/ir | 3Q12 Highlights | |||||||||
| ● | Consolidated EBITDA of R$494.6 million | |||||||||
| ● | Raízen Combustíveis posts EBITDA margin of R$61.7/cbm (excluding non-recurring effects) | |||||||||
| ● | 4.1% growth in Raízen Energia’s net revenue | |||||||||
| ● | Rumo increases transported volume and records EBITDA margin of 42.8% | |||||||||
| ● | Cosan Lubrificantes e Especialidades starts internationalization process through acquisition of lubricants business in Bolivia, Uruguay and Paraguay | |||||||||
Definitions: 3Q12 – quarter ended December 31, 2011 3Q11 – quarter ended December 31, 2010 FY12 – fiscal year beginning on April 1, 2011 and closing on March 31 , 2012 FY11 – fiscal year beginning on April 1, 2010 and closing on March 31 , 2011 YTD12 – period started on the same date of FY12 and ended on the closing date of 3Q12 YTD11 – period started on the same date of FY11 and ended on the closing date of 3Q11 | Summary of Financial Information – Cosan Consolidated | |||||||||
| 3Q12 | 3Q11 | Amounts in R$ MM | YTD12 | YTD11 | ||||||
| 6,310.7 | 4,738.4 | Net Operating Revenue | 18,302.9 | 13,454.1 | ||||||
| 639.8 | 578.5 | Gross Profit | 1,989.7 | 1,776.3 | ||||||
| 10.1% | 12.2% | Gross Margin | 10.9% | 13.2% | ||||||
| 240.0 | 170.5 | Operating Profit | 4,047.5 | 586.8 | ||||||
| 494.6 | 532.0 | EBITDA | 4,971.3 | 1,644.5 | ||||||
| 7.8% | 11.2% | EBITDA Margin | 27.2% | 12.2% | ||||||
| 494.6 | 532.0 | Adjusted EBITDA¹ | 1,674.3 | 1,644.5 | ||||||
| 7.8% | 11.2% | Adjusted EBITDA Margin | 9.1% | 12.2% | ||||||
| 106.7 | 46.7 | Net Income before Non-controlling Interests | 2,496.0 | 289.7 | ||||||
| 93.8 | 38.7 | Net Income | 2,456.3 | 290.6 | ||||||
| 1.5% | 0.8% | Net Margin | 13.4% | 2.2% | ||||||
| 453.3 | 707.7 | CAPEX | 1,523.3 | 1,927.3 | ||||||
| 3,619.9 | 4,735.1 | Net Debt | 3,619.9 | 4,735.1 | ||||||
| 9,433.4 | 6,412.1 | Equity and Non-controlling Interests | 9,433.4 | 6,412.1 | ||||||
Note1: Excluding the effect of Raízen’s formation Note 2: Excluding acquisitions of stakes in other companies and proceeds from divestments | ||||||||||

1 of 39
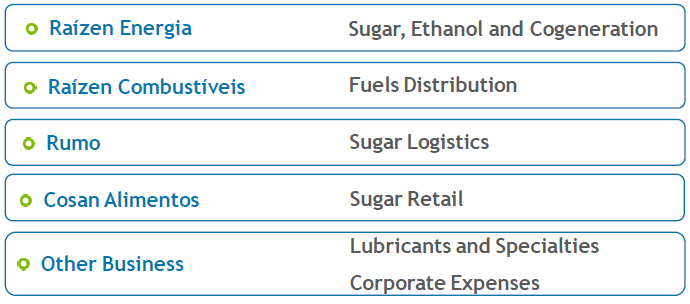
A. Business Units
In order to provide a better understanding of how Cosan Group businesses results are being consolidated, since 1Q12 we changed the Financial Letter presentation. We dedicate a specific section for each business unit with key production data and results analysis, from net revenue to EBITDA.
Our business units are structured as follows:
2 of 39
Below we present EBITDA for the third quarter of crop year 2011/12 (3Q12) for all Cosan Group business units, as described above. All information reflects 100% of our business units’ financial performance, regardless of Cosan’s interest in them. Specifically for YTD12, which represents the period from April to December of 2011, Raízen Combustíveis and Cosan Alimentos results are presented on a pro forma basis with the purposes of comparability between periods.
| EBITDA and EBITDA Margin by Business Unit | 3Q12 | |||||||||||||||||||
| Amounts in R$ MM | Raízen Energia | Raízen Combustíveis | Cosan Alimentos | Rumo | Other Business | |||||||||||||||
| Net Operating Revenue | 1,751.4 | 10,083.2 | 240.0 | 143.1 | 263.5 | |||||||||||||||
| Cost of Goods and Services | (1,375.8 | ) | (9,530.8 | ) | (194.6 | ) | (85.8 | ) | (190.4 | ) | ||||||||||
| Gross Profit | 375.5 | 552.4 | 45.4 | 57.3 | 73.2 | |||||||||||||||
| Gross Margin | 21.4 | % | 5.5 | % | 18.9 | % | 40.0 | % | 27.8 | % | ||||||||||
| Selling Expenses | (119.3 | ) | (320.3 | ) | (27.0 | ) | - | (35.1 | ) | |||||||||||
| General and Administrative Expenses | (111.2 | ) | (55.1 | ) | (4.2 | ) | (9.2 | ) | (50.9 | ) | ||||||||||
| Other Operating Revenues (Expenses) | (7.5 | ) | 72.5 | 0.1 | 2.7 | 2.7 | ||||||||||||||
| Effect from creation of Raízen | - | - | - | - | - | |||||||||||||||
| Depreciation and amortization | 364.5 | 98.2 | 0.7 | 10.4 | 12.2 | |||||||||||||||
| EBITDA | 501.9 | 347.6 | 15.0 | 61.2 | 2.1 | |||||||||||||||
| EBITDA Margin | 28.7 | % | 3.4 | % | 6.2 | % | 42.8 | % | 0.8 | % | ||||||||||
| Adjusted EBITDA | 501.9 | 347.6 | 15.0 | 61.2 | 2.1 | |||||||||||||||
| Adjusted EBITDA Margin | 28.7 | % | 3.4 | % | 6.2 | % | 42.8 | % | 0.8 | % | ||||||||||
| Adjusted EBITDA Margin (R$/cbm) | - | 65.6 | - | - | - | |||||||||||||||
| EBITDA and EBITDA Margin by Business Unit | YTD12 | |||||||||||||||||||
| Amounts in R$ MM | Raízen Energia | Raízen Combustíveis (Pro forma) | Cosan Alimentos (Pro Forma) | Rumo | Other Business | |||||||||||||||
| Net Operating Revenue | 6,054.4 | 29,709.8 | 735.0 | 497.7 | 794.6 | |||||||||||||||
| Cost of Goods and Services | (4,821.7 | ) | (28,131.9 | ) | (569.9 | ) | (316.7 | ) | (539.8 | ) | ||||||||||
| Gross Profit | 1,232.8 | 1,577.9 | 165.1 | 181.0 | 254.7 | |||||||||||||||
| Gross Margin | 20.4 | % | 5.3 | % | 22.5 | % | 36.4 | % | 32.1 | % | ||||||||||
| Selling Expenses | (433.8 | ) | (851.2 | ) | (85.3 | ) | - | (133.0 | ) | |||||||||||
| General and Administrative Expenses | (317.4 | ) | (245.5 | ) | (14.2 | ) | (28.7 | ) | (106.0 | ) | ||||||||||
| Other Operating Revenues (Expenses) | (27.0 | ) | 194.3 | 0.1 | 9.3 | (17.8 | ) | |||||||||||||
| Effect from creation of Raízen | - | - | - | - | 3,297.0 | |||||||||||||||
| Depreciation and amortization | 1,292.0 | 278.5 | 1.2 | 30.9 | 34.6 | |||||||||||||||
| EBITDA | 1,746.6 | 954.0 | 67.6 | 192.6 | 3,329.4 | |||||||||||||||
| EBITDA Margin | 28.8 | % | 3.2 | % | 9.2 | % | 38.7 | % | 419.0 | % | ||||||||||
| Adjusted EBITDA² | 1,746.6 | 954.0 | 67.6 | 192.6 | 32.5 | |||||||||||||||
| Adjusted EBITDA Margin | 28.8 | % | 3.2 | % | 9.2 | % | 38.7 | % | 4.1 | % | ||||||||||
| Adjusted EBITDA Margin (R$/cbm) | - | 60.7 | - | - | - | |||||||||||||||
3 of 39
A.1 Raízen Energia
Following are the results for Raízen Energia, whose core business is the production and sale of a variety of products derived from sugarcane, including raw sugar (Very High Polarization - VHP), anhydrous and hydrous ethanol, as well as activities related to energy cogeneration from sugarcane bagasse.
Production Figures
In 3Q12, Raízen Energia operated 24 sugar, ethanol and energy cogeneration mills, with a crushing capacity of 65 million tonnes per crop year.
| Operational Figures | ||||||||||||||||
| 3Q12 | 3Q11 | YTD12 | YTD11 | |||||||||||||
| 8,219 | 11,299 | Crushed sugarcane | 52,959 | 54,239 | ||||||||||||
| 4,097 | 6,092 | Own (‘000 tonnes) | 26,528 | 26,522 | ||||||||||||
| 4,121 | 5,207 | Suppliers (‘000 tonnes) | 26,430 | 27,717 | ||||||||||||
| 143.6 | 138.5 | Sugarcane TRS (kg/ton) | 136.7 | 139.9 | ||||||||||||
| 86.3 | % | 78.1 | % | Mechanization (%) | 86.1 | % | 78.1 | % | ||||||||
| Production | ||||||||||||||||
| 656 | 809 | Sugar | 3,969 | 3,920 | ||||||||||||
| 403 | 485 | Raw Sugar (‘000 tonnes) | 2,426 | 2,515 | ||||||||||||
| 253 | 324 | White Sugar (‘000 tonnes) | 1,543 | 1,405 | ||||||||||||
| 325 | 454 | Ethanol | 1,921 | 2,199 | ||||||||||||
| 101 | 174 | Anhydrous Ethanol (‘000 cbm) | 688 | 686 | ||||||||||||
| 224 | 280 | Hydrous Ethanol (‘000 cbm) | 1,233 | 1,513 | ||||||||||||
The 2011/12 crop has been severely affected by adverse weather conditions, mainly drought and frost in Center-Southern Brazil (CS region), which has led to decreased productivity of sugarcane fields and decreased sugarcane availability.
In 3Q12, 8.2 million tonnes of sugarcane were crushed, a decrease of 27.3% compared to the volume crushed in 3Q11, of which 49.8% was owned sugarcane and 50.2% was supplier’s cane. Raízen Energia’s units stopped its operations by the end of November with total crushing volume of 53.0 million tonnes for the 2011/12 crop, down 2.4% year-over-year.
In 3Q12 the level of mechanization on owned sugarcane harvest process reached 86.3%. In the same period, the sugarcane TSR level was 143.6 kg/tonne, representing an increase of 3.7% compared to 3Q11 of 138.5 kg/tonne, despite the adverse weather conditions that affected the sugarcane crop this season.
4 of 39
Net Revenue
| Sales Breakdown | ||||||||||||||||
| 3Q12 | 3Q11 | Amounts in R$ MM | YTD12 | YTD11 | ||||||||||||
| 1,751.4 | 1,683.0 | Net Operating Revenue | 6,054.4 | 4,715.2 | ||||||||||||
| 887.6 | 931.9 | Sugar Sales | 3,247.2 | 2,868.3 | ||||||||||||
| 310.5 | 367.0 | Domestic Market | 958.6 | 1,015.3 | ||||||||||||
| 577.1 | 564.9 | Foreign Market | 2,288.5 | 1,853.0 | ||||||||||||
| 744.5 | 647.7 | Ethanol Sales | 2,370.1 | 1,537.0 | ||||||||||||
| 480.1 | 557.9 | Domestic Market | 1,881.1 | 1,318.0 | ||||||||||||
| 264.4 | 89.9 | Foreign Market | 489.0 | 219.0 | ||||||||||||
| 53.0 | 51.0 | Energy Cogeneration | 233.8 | 183.7 | ||||||||||||
| 66.3 | 52.3 | Other Products and Services | 203.4 | 126.2 | ||||||||||||
In 3Q12 Raízen Energia's net revenue was R$1.8 billion, up 4.1% over 3Q11, when reported revenue was R$1.7 billion. The increase was mainly due to higher sale prices of both sugar and ethanol that offset the decrease in the volume sold for both products.
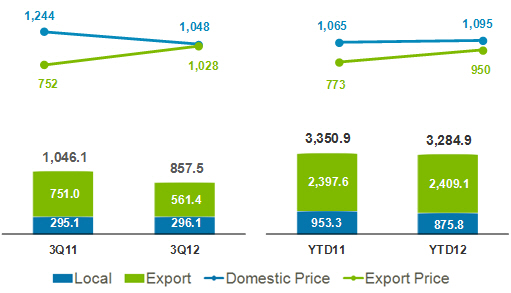
Sugar Sales
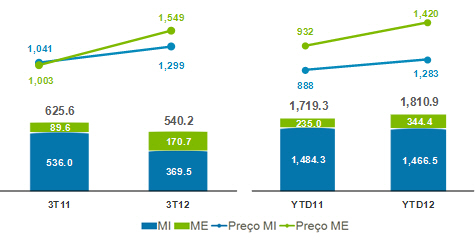
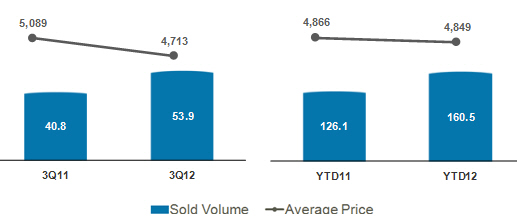
Net revenue from sugar sales in 3Q12 represented 50.7% of Raízen Energia’s overall net revenues and reached R$887.6 million, down 4.8% over 3Q11, when net revenue was R$931.9 million.
The main reasons for this decrease of R$44.3 million in the period were as follows:
| ● | A decrease of R$141.3 million in overall revenues due to the drop of 18.0% in the total volume of sugar sold, mainly explained by the anticipation of sales to the foreign market, which pushed part of the volume to 2Q12. |
| ● | Partially offset by an increase of R$97.0 million in overall revenue due to the rise in the average sugar price, which was up 16.2% from R$890.8/tonne in 3Q11 to R$1,035.0/tonne in 3Q12. |
The reduction in the volume of sugar sold in 3Q12 proportionately reflects the crop disruption in 2011/12, which had a negative impact of 9.8% on Raízen Energia’s crushing. The initial forecast was that crushing would reach 58.1 million tonnes.
Sugar exports represented 65.0% of the overall revenue from sugar sales in 3Q12, up from 60.6% in 3Q11. As reported in 2Q12, the sale mix more focused on the export market reflects the rise in sugar prices in the international market, which increased 36.7% compared to the previous quarter.
5 of 39
Sugar
Volume (’000 tonnes) and Average Unit Price (R$/tonne)
Sugar Inventories
| Sugar Inventories | ||||||||
| 3Q12 | 3Q11 | |||||||
| ´000 tonne | 871.9 | 998.3 | ||||||
| R$'MM | 651.5 | 582.7 | ||||||
| R$/tonnes | 747.3 | 583.7 | ||||||
Ethanol Sales
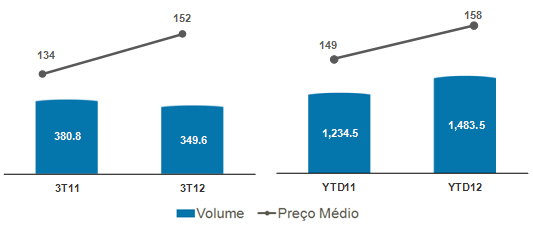
During 3Q12, Raízen Energia’s revenue from ethanol sales was R$744.5 million, representing an increase of 14.9% over 3Q11’s R$647.7 million.
This R$96.8 million rise is basically due to the following factors:
| ● | A 33.1% increase in the average ethanol sale price both in the domestic and international markets, up from R$1,035.3/cbm in 3Q11 to R$1,378.1/cbm in 3Q12, causing an increase of R$188.7 million in the net revenue from ethanol sales. |
| ● | Offset by the 13.7% or 85.4 million liter decrease in the volume of ethanol sold in 3Q12 versus 3Q11, causing net revenue to fall by R$91.9 million. |
Also, increased ethanol imports, lower demand due to prices being higher than the 70% parity with gasoline, and increased crushing volumes in the CS region in October, November and December of 2011 (8 million tonnes above the initial forecasts) signaled a higher volume of ethanol available in the off season. Therefore, Raízen Energia adopted a strategy to anticipate sales of ethanol in 3Q12 so as to benefit from better market conditions.
6 of 39
Ethanol
Volume (million liters) and Average Unit Price (R$/cbm)
Ethanol Inventories
| Ethanol Inventories | ||||||||
| 3Q12 | 3Q11 | |||||||
| ´000 cbm | 445.8 | 563.9 | ||||||
| R$'MM | 533.7 | 492.5 | ||||||
| R$/cbm | 1,197.0 | 873.4 | ||||||
Energy Cogeneration
During 3Q12, net revenue from energy cogeneration totaled R$53.0 million with the sale of 349,600 MWh at an average price of R$151.7/MWh, up 4.0% over 3Q11’s R$51.0 million.
The price of energy sold in 3Q12 rose 13.4% as compared with 3Q11, more than offsetting the lower volume sold (down 31,200 MWh in the quarterly comparison), explained by the fact that most mills stopped operations by the end of November, 2011. Out of Raízen Energia’s 24 mills, 13 sell energy from cogeneration.
Electric Energy
Volume (’000 MWh) and Average Unit Price (R$/MWh)
7 of 39
Other Products and Services
Raízen Energia’s revenue from other products and services, basically represented by steam, molasses and raw material sales to agricultural service providers, totaled R$66.3 million in 3Q12, an increase of 26.8% year-over-year (R$52.3 million in 3Q11).
Cost of Goods Sold
| COGS per Product | ||||||||||||||||
| 3Q12 | 3Q11 | Amounts in R$ MM | YTD12 | YTD11 | ||||||||||||
| (1,375.8 | ) | (1,346.9 | ) | Cost of Goods Sold (COGS) | (4,821.7 | ) | (3,630.6 | ) | ||||||||
| (661.0 | ) | (707.2 | ) | Sugar | (2,386.7 | ) | (1,952.0 | ) | ||||||||
| (616.2 | ) | (576.8 | ) | Ethanol | (2,048.7 | ) | (1,492.4 | ) | ||||||||
| (23.7 | ) | (34.6 | ) | Energy Cogeneration | (86.0 | ) | (101.0 | ) | ||||||||
| (74.9 | ) | (28.3 | ) | Other | (300.2 | ) | (85.2 | ) | ||||||||
| Average Unitary Costs | ||||||||||||||||
| (582.9 | ) | (552.9 | ) | Cash cost of sugar (R$/tonne) | (542.5 | ) | (468.8 | ) | ||||||||
| (843.8 | ) | (690.0 | ) | Cash cost of ethanol (R$/’000 liters) | (799.3 | ) | (622.6 | ) | ||||||||
Note 3: Average unit costs represent the cash cost, which is net of planting depreciation and amortization, agricultural depreciation (machinery and equipment), industrial depreciation, and harvest off-season maintenance.
Raízen Energia's cost of goods sold (COGS) is reported jointly with the average unit costs, net of the effects of depreciation and amortization (cash cost), so as to allow for an analysis of the changes in these items over time.
Since the beginning of this crop year, we have invested heavily in renewing the sugarcane fields so we can resume our record high production levels. Therefore, the cost of goods sold includes, among other factors, the respective depreciation and amortization related to this process.
In 3Q12, COGS reached R$1.4 billion, up 2.1% or R$28.9 million year-over-year, despite the approximately 16% decline in sugar and ethanol (sugar equivalent) sales in the quarter. This increase was mainly due to the rise in the average cost of goods sold, especially sugar and ethanol—up 8.3% and 17.5% respectively, including the increase of R$53.8 million in depreciation and amortization.
In addition to the factors mentioned above, the following also contributed to the rise in Raízen Energia’s COGS:
| ● | 33.5% rise in the TSR/kg cost, up from R$0.3766 in 3Q11 to R$0.5026 in 3Q12, which had a direct impact of R$108.5 million on the cost of sugarcane from suppliers; |
8 of 39
| ● | Increase in the cost of Company-owned sugarcane due to the rise in land leasing costs—up from R$13.0 per tonne of sugarcane in 3Q11 to R$17.3 per tonne of sugarcane in 3Q12—partly as a result of higher TSR prices in the period; |
| ● | Decreased productivity of sugarcane fields represented by a lower TCH level (tonne of cane per hectare)—64.2 in 3Q12 versus 77.7 in 3Q11—which reduced dilution of planting and treatment (biological assets) costs. |
| ● | Improved TSR level—143.6 kg/tonne in 3Q12 versus 138.5 kg/tonne in 3Q11—partially offsetting the above mentioned effects. |
Gross Profit
| Gross Profit and Gross Margin per Product | ||||||||||||||||
| 3Q12 | 3Q11 | Amounts in R$ MM | YTD12 | YTD11 | ||||||||||||
| 375.5 | 336.1 | Gross Profit | 1,232.8 | 1,084.6 | ||||||||||||
| 226.5 | 224.7 | Sugar | 860.5 | 916.3 | ||||||||||||
| 25.5 | % | 24.1 | % | Sugar Gross Margin (%) | 26.5 | % | 31.9 | % | ||||||||
| 43.7 | % | 37.9 | % | Sugar (Cash) Gross Margin (%) | 45.1 | % | 45.2 | % | ||||||||
| 128.3 | 71.0 | Ethanol | 321.4 | 44.6 | ||||||||||||
| 17.2 | % | 11.0 | % | Ethanol Gross Margin (%) | 13.6 | % | 2.9 | % | ||||||||
| 38.8 | % | 33.4 | % | Ethanol (Cash) Gross Margin (%) | 38.9 | % | 30.4 | % | ||||||||
| 29.4 | 16.4 | Energy Cogeneration | 147.8 | 82.7 | ||||||||||||
| (8.6 | ) | 24.1 | Other | (96.8 | ) | 41.0 | ||||||||||
In 3Q12, Raízen Energia recorded gross profit of R$375.5 million, an increase of 11.7% from the R$336.1 million reported in 3Q11.
Ethanol and energy sales drove this increase, up 80.7% and 79.3%, respectively, year-over-year. Gross cash margins for both sugar and ethanol were up by more than 5.0 p.p. in the period, net of depreciation and amortization effects.
Selling, General & Administrative Expenses
| Selling, General and Administrative Expenses | ||||||||||||||||
| 3Q12 | 3Q11 | Amounts in R$ MM | YTD12 | YTD11 | ||||||||||||
| (119.3 | ) | (153.4 | ) | Selling Expenses | (433.8 | ) | (434.1 | ) | ||||||||
| (111.2 | ) | (101.8 | ) | General and Administrative Expenses | (317.4 | ) | (285.9 | ) | ||||||||
Selling expenses amounted to R$119.3 million in 3Q12, down 22.2% year-over-year. This reduction is basically due to savings with freight and commissions, since the sugar trading in the domestic retail market is no longer reflected in Raízen Energia’s results and is reported under Cosan Alimentos.
9 of 39
Also, the 25.2% decrease in the export volume resulted in a decrease in transportation and port elevation costs due to the advanced sales reported in 2Q12.
Raízen Energia’s general and administrative expenses increased 9.2% year-over-year in 3Q12. This increase reflects the allocation of the whole Raízen’s corporate structure into Raízen Energia in order to optimize the activities shared by both Raízen Energia and Raízen Combustíveis.
EBITDA
| EBITDA | ||||||||||||||||
| 3T12 | 3T11 | Valores em R$ MM | YTD12 | YTD11 | ||||||||||||
| 501.9 | 384.1 | EBITDA | 1,746.6 | 1,221.2 | ||||||||||||
| 28.7 | % | 22.8 | % | Margem EBITDA | 28.8 | % | 25.9 | % | ||||||||
In 3Q12, Raízen Energia’s EBITDA was R$501.9 million, an increase of 30.7% over 3Q11. EBITDA margin was at 28.7% in 3Q12, up 5.9 p.p. over 3Q11’s 22.8%.
Hedge
Volume positions and fixed sugar prices agreed on with trading companies or through derivative financial instruments as of December 31, 2011, as well as foreign exchange derivatives contracted by Raízen Energia to hedge future cash flows, are as follows:
| Summary of hedge Operations at December 31st , 2011 | ||||||||
| 2011 / 2012 | 2012 / 2013 | |||||||
| Sugar | ||||||||
| NY #11 | ||||||||
| Volume (‘000 tonnes) | 296.1 | 797.7 | ||||||
| Average Price (¢US$/lb) | 25.19 | 24.55 | ||||||
| London #5 | ||||||||
| Volume (‘000 tonnes) | 13.1 | - | ||||||
| Average Price (US$/lb) | 664.58 | - | ||||||
| Exchange rate | ||||||||
| US$ | ||||||||
| Volume (US$ million) | 427.0 | 276.3 | ||||||
| Average Price (R$/US$) | 1.8622 | 1.8645 | ||||||
| Volume to be sold / Hedged (‘000 tonnes) | 375.3 | 2,931.0 | ||||||
| % Sale Protected Sugar / Fixed | 82.4 | % | 27.2 | % | ||||
10 of 39
Impacts of Hedge Accounting
Raízen Energia uses cash flow hedge accounting for certain derivative financial instruments in order to hedge against the price risk for sugar, and against the foreign exchange risk for revenues from sugar exports.
The table below presents the expected transfer of gain/loss balances from shareholders’ equity as of December 31, 2011 to the net operating income of Raízen Energia4 in future periods, broken down by coverage period for the following hedging instruments:
| Exercício de Realização - (R$MM) | ||||||||||||||
| Derivativo | Mercado | Risco | 2011/12 | 2012/13 | Total | |||||||||
| Futuro | OTC/NYBOT | NY#11 | (33.9 | ) | 82.6 | 48.7 | ||||||||
| NDF | OTC/CETIP | USD | (6.8 | ) | (9.1 | ) | (15.9 | ) | ||||||
(=) Impacto do Hedge Accounting | (40.7 | ) | 73.5 | 32.8 | ||||||||||
| (-) IR Diferido | 13.9 | (25.0 | ) | (11.1 | ) | |||||||||
| (=) Ajuste a Avaliação Patrimonial Raízen | (26.9 | ) | 48.5 | 21.6 | ||||||||||
| (=) Ajuste a Avaliação Patrimonial | (13.4 | ) | 24.3 | 10.8 | ||||||||||
Note 4: The table above shows 100% of the hedge accounting gains/losses reclassified to shareholders’ equity. As Cosan proportionately consolidates Raízen Energia, these effects will impact only 50% of the consolidated financial statements.
CAPEX
| CAPEX | ||||||||||||||||
| 3Q12 | 3Q11 | Amounts in R$ MM | YTD12 | YTD11 | ||||||||||||
| 571.3 | 535.1 | Total Capex | 1,729.5 | 1,459.8 | ||||||||||||
| 402.0 | 424.9 | Operating Capex | 1,171.2 | 1,037.0 | ||||||||||||
| 213.9 | 174.8 | Biological Assets | 720.3 | 567.5 | ||||||||||||
| 155.5 | 112.8 | Inter-harvest Maintenance Costs | 284.5 | 178.2 | ||||||||||||
| 18.6 | 31.0 | SSMA and Sustaining | 79.0 | 107.4 | ||||||||||||
| 14.0 | 35.4 | Mechanization | 87.3 | 113.0 | ||||||||||||
| - | 70.9 | Other | - | 70.9 | ||||||||||||
| 169.3 | 110.2 | Expasion Capex | 558.4 | 422.8 | ||||||||||||
| 83.1 | 84.9 | Cogeneration Projects | 353.5 | 198.7 | ||||||||||||
| 0.3 | 17.4 | Greenfield | 0.3 | 60.0 | ||||||||||||
| 43.9 | 7.9 | Expasion | 99.4 | 82.6 | ||||||||||||
| 42.0 | - | Other | 105.2 | 81.5 | ||||||||||||
Raízen Energia recorded CAPEX of R$571.3 million in 3Q12, an increase of 6.8% year-over-year (R$535.1 million in 3Q11).
Driving this increase were higher investments in biological assets and inter-harvest maintenance, up 22.4% and 37.9%, respectively. These investments are in line with Raízen Energia’s strategy of renewing its sugarcane fields at rates above 20% for the 2011/12 crop year and expanding its planted areas.
Expansion initiatives totaled R$43.9 million, mainly composed of (i) expansion of the Ethanol Terminal at the Port of Santos (TEAS); (ii) equipment acquisition and
11 of 39
industrial expansion; (iii) investments in warehousing; (iv) sugar production process improvements.
We also recorded R$42.0 million in “other investments,” including R$18.4 million in the renovation of our mills’ logistics and distribution assets, and R$10.4 million in capitalization of loan interests.
12 of 39
A.2 Raízen Combustíveis
Below are the results of Raízen Combustíveis, the business unit that represents the fuel distribution sales through a network of service stations under the brand names “Shell” and “ESSO”, industry and wholesale markets and aviation jet fuel distribution.
Like in previous quarters, Raízen Combustíveis’s results are reported on pro forma and accounting bases to allow for comparability.
The major differences between both bases are as follows:
| ● | Accounting |
| o | 3Q12 – three months (October, November, and December, 2011) of Raízen Combustíveis operations |
| o | YTD12 – seven months (June to December, 2011) of Raízen Combustíveis operations, and two months (April and May 2011) of operations of the fuels business under Cosan management (CCL not including the Lubricants results) |
| o | 3Q11 – three months (October, November and December, 2010) of operations of the fuels business under Cosan management (CCL not including the Lubricants results) |
| o | YTD11 – nine months (April to December, 2010) of the operations of the fuel business under Cosan management (CCL not including the Lubricants results) |
| ● | Pro Forma |
| o | YTD12 – seven months (June to December, 2011) of Raízen Combustíveis operations, and two months (April and May, 2011) of carve-out combination of fuel assets of both CCL and Shell. |
| o | 3Q11 – three months (October, November and December, 2011) of carve-out combination of fuel assets of both CCL and Shell. |
| o | YTD11 – nine months (April to December, 2010) of carve-out combination of fuel assets of both CCL and Shell. |
The analysis that follows compares the results of 3Q12 (accounting) with 3Q11 (pro forma), and represent the whole of Raízen Combustíveis’s operations.
13 of 39
Net Revenue
| Book | Pro Forma | Pro Forma | Pro Forma | Sales Breakdown | Book | Book | Book | Book | |||||||||||||||||||||||
| 3Q12 | 3Q11 | YTD12 | YTD11 | Amounts in R$ MM | 3Q12 | 3Q11 | YTD12 | YTD11 | |||||||||||||||||||||||
| 10,083.2 | 9,277.6 | 29,709.8 | 26,641.4 | Net Operating Revenue | 10,083.2 | 2,875.9 | 25,114.1 | 8,265.1 | |||||||||||||||||||||||
| 10,083.2 | 9,267.4 | 29,687.9 | 26,602.8 | Fuel Sales | 10,083.2 | 2,865.7 | 25,097.1 | 8,226.5 | |||||||||||||||||||||||
| 600.7 | 850.9 | 1,793.1 | 2,206.1 | Ethanol | 600.7 | 238.5 | 1,573.3 | 611.5 | |||||||||||||||||||||||
| 4,316.7 | 3,461.1 | 12,443.8 | 9,621.9 | Gasoline | 4,316.7 | 1,213.5 | 10,495.1 | 3,391.1 | |||||||||||||||||||||||
| 3,889.9 | 3,995.8 | 11,854.7 | 11,866.6 | Diesel | 3,889.9 | 1,381.1 | 10,175.9 | 4,139.7 | |||||||||||||||||||||||
| 1,116.2 | 789.1 | 3,136.2 | 2,264.2 | Jet Fuel | 1,116.2 | - | 2,455.7 | - | |||||||||||||||||||||||
| 159.7 | 170.5 | 460.2 | 644.0 | Others | 159.7 | 32.5 | 397.2 | 84.3 | |||||||||||||||||||||||
| - | 10.2 | 21.9 | 38.6 | Other services | - | 10.2 | 16.9 | 38.6 | |||||||||||||||||||||||
Raízen Combustíveis recorded net revenue of R$10.1 billion in 3Q12, an increase of 8.7% over 3Q11, mainly driven by the rise of 24.7% in gasoline sales.
The volume of fuels sold in 3Q12 fell by 3.0% compared to 3Q11 due to the decreased volume of ethanol sales as gasoline prevailed in the sales mix.
According to the National Petroleum Agency (ANP), the average parity, weighted by the fleet, between hydrous ethanol and gasoline prices in Brazil was approximately 75% at the end of 3Q12, and did not fall below 70% in any state in the country in the period.
Therefore, flex fuel car users continued to choose gasoline in 3Q12, causing ethanol sales volumes to fall by 41.5% and gasoline sales to rise 20.2%. The average price of ethanol rose 20.7% to R$1,330.2/cbm in 3Q12 from R$1,102.1/cbm in 3Q11.
Revenues from royalties received for the licensing of convenience stores, which were previously reported under “other services,” are now accounted for under “other operating revenues” and totaled R$7.8 million in 3Q12.
Fuels
Volume (million liters) and Average Unit Price (R$/cbm)

14 of 39
Inventories
| Estoque de Combustíveis | Contábil | Contábil | |||||||
| 3T12 | 3T11 | ||||||||
| ´000 m³ | 459.6 | 138.0 | |||||||
| R$'MM | 802.4 | 236.0 | |||||||
| R$/m³ | 1,745.6 | 1,710.0 | |||||||
Even though there has been a significant increase in fuel inventories in absolute numbers, no significant change has been recorded in the number of selling days, which remained at nearly 7 days.
Cost of Goods Sold
| Book | Pro Forma | Pro Forma | Pro Forma | COGS | Book | Book | Book | Book | ||||||||||||||||||||||||
| 3Q12 | 3Q11 | YTD12 | YTD11 | Amounts in R$ MM | 3Q12 | 3Q11 | YTD12 | YTD11 | ||||||||||||||||||||||||
| (9,530.8 | ) | (8,777.9 | ) | (28,131.9 | ) | (25,240.5 | ) | Fuel Sales | (9,530.8 | ) | (2,751.0 | ) | (23,820.6 | ) | (7,918.5 | ) | ||||||||||||||||
| 3Q12 | 3Q11 | YTD12 | YTD11 | R$/’000 liters | 3Q12 | 3Q11 | YTD12 | YTD11 | ||||||||||||||||||||||||
| (1,800 | ) | (1,610 | ) | (1,790 | ) | (1,588 | ) | Fuel Sales | (1,800 | ) | (1,724 | ) | (1,787 | ) | (1,719 | ) | ||||||||||||||||
Because gasoline and diesel—which have a higher unit cost than ethanol—have prevailed in the sales mix, Raízen Combustíveis’ COGS rose 8.6% to R$9.5 billion in 3Q12, up from R$8.8 billion in 3Q11. The average unit cost also increased in 3Q12, up 11.8% to R$1,800.0/cbm from R$1,610.0/cbm in the same quarter of the previous year.
Gross Profit
| Book | Pro Forma | Pro Forma | Pro Forma | Gross Profit | Book | Book | Book | Book | ||||||||||||||||||||||||
| 3Q12 | 3Q11 | YTD12 | YTD11 | Amounts in R$ MM | 3Q12 | 3Q11 | YTD12 | YTD11 | ||||||||||||||||||||||||
| 552.4 | 499.7 | 1,577.9 | 1,400.9 | Gross Profit | 552.4 | 124.8 | 1,293.5 | 346.6 | ||||||||||||||||||||||||
| 5.5 | % | 5.4 | % | 5.3 | % | 5.3 | % | Gross Margin (%) | 5.5 | % | 4.4 | % | 5.2 | % | 4.2 | % | ||||||||||||||||
| 104.3 | 91.6 | 100.4 | 88.2 | Gross margin (R$/’000 liters) | 104.3 | 78.2 | 97.0 | 75.2 | ||||||||||||||||||||||||
Raízen Combustíveis reported gross profit of R$552.4 million for 3Q12, an increase of 10.5% from the R$499.7 million recorded in 3Q11. Gross margin reached 5.5%, up 0.1 p.p. year-over-year.
Measured in R$/cbm, gross margin was R$104.3/cbm in 3Q12, an increase of 13.9% from 3Q11’s R$91.6/cbm.
15 of 39
Selling, General & Administrative Expenses
| Book | Pro Forma | Pro Forma | Pro Forma | Selling, General and Administrative Expenses | Book | Book | Book | Book | ||||||||||||||||||||||||
| 3Q12 | 3Q11 | YTD12 | YTD11 | Amounts in R$ MM | 3Q12 | 3Q11 | YTD12 | YTD11 | ||||||||||||||||||||||||
| (320.3 | ) | (254.1 | ) | (851.2 | ) | (797.3 | ) | Selling Expenses | (320.3 | ) | (69.7 | ) | (730.0 | ) | (207.8 | ) | ||||||||||||||||
| (55.1 | ) | (94.9 | ) | (245.5 | ) | (259.5 | ) | General and Administrative Expenses | (55.1 | ) | (19.1 | ) | (206.2 | ) | (64.7 | ) | ||||||||||||||||
Raízen Combustíveis’ selling expenses amounted to R$320.3 million in 3Q12, up 26.1% over 3Q11. The main drivers of this increase were:
| ● | addition of R$18.7 million referring to depreciation and amortization as part of the re-evaluation of the assets contributed to Raízen Comubstíveis’ formation; |
| ● | increment of nearly R$36 million due to a change in the criteria for the allocation of transfer and collection freights of Cosan Combustíveis e Lubrificantes, which are no longer recorded under cost of goods sold, but under selling expenses; |
| ● | payment for services provided by the Shared Services Center in the amount of R$21.2 million, not included in the 3Q11 pro forma because the costs with service fees paid by Shell Brasil Ltda to its parent were partially expurgated during the carve-out process. |
General and administrative expenses amounted to R$55.1 million in 3Q12, down 41.9% from 3Q11, especially due to the migration of support employees from Raízen Combustíveis to Raízen Energia, causing not only a reduction in labor costs but also the reversal of the relevant labor provisions.
During the quarter we also recorded other operating revenues in the amount of R$72.5 million relative to merchandising fees, royalties from convenience stores, leasing revenues and fees from the sale of Shell lubricants at Raízen Combustíveis’ service stations, sale of assets among other revenues. Of that amount, approximately R$20 million is a non-recurring revenue.
16 of 39
EBITDA
| Book | Pro Forma | Pro Forma | Pro Forma | EBITDA | Book | Book | Book | Book | ||||||||||||||||||||||||
| 3Q12 | 3Q11 | YTD12 | YTD11 | Amounts in R$ MM | 3Q12 | 3Q11 | YTD12 | YTD11 | ||||||||||||||||||||||||
| 347.6 | 219.7 | 954.0 | 535.1 | EBITDA | 347.6 | 72.1 | 798.8 | 176.2 | ||||||||||||||||||||||||
| 3.4 | % | 2.4 | % | 3.2 | % | 2.0 | % | Margin EBITDA | 3.4 | % | 2.5 | % | 3.2 | % | 2.1 | % | ||||||||||||||||
| 65.6 | 40.3 | 60.7 | 33.7 | EBITDA (R$/cbm) | 65.6 | 45.2 | 59.9 | 38.2 | ||||||||||||||||||||||||
In 3Q12 Raízen Combustíveis reported EBITDA of R$347.6 million with EBITDA margin at 3.4%, equivalent to R$65.6/cbm. Adjusted for the non-recurring effects mentioned above, the margin is R$61.7/cbm.
Compared to 3Q11, EBITDA rose 58.2% and EBITDA margin, 1.0 p.p., basically as a result of a better mix of products sold and an increase in average sales prices, which have more than offset the slight decrease in volume in the period.
CAPEX
| Book | Pro Forma | Pro Forma | Pro Forma | CAPEX | Book | ||||||||||||||||||||||||||
| 3Q12 | 3Q11 | YTD12 | YTD11 | Amounts in R$ MM | 3Q12 | 3Q11 | YTD12 | YTD11 | |||||||||||||||||||||||
| 181.2 | 172.2 | 303.2 | 248.0 | CAPEX | 181.2 | 49.0 | 295.6 | 89.6 | |||||||||||||||||||||||
In 3Q12, Raízen Combustíveis followed its investment plan and recorded CAPEX of R$181.2 million. That amount includes investments related to winning and renewing contracts with resellers, the rebranding of “Esso” stations with the “Shell” brand, maintenance of the network of reseller stations, and investments in health, safety and the environment (SSMA).
17 of 39
A.3 Rumo
Rumo is Cosan’s sugar logistics business, responsible for providing integrated logistics services—including transportation, storage and port elevation of sugar and other agricultural commodities—both for Raízen and third parties.
Net Revenue
| Sales breakdown | ||||||||||||||||
| 3Q12 | 3Q11 | Amounts in R$ MM | YTD12 | YTD11 | ||||||||||||
| 143.1 | 113.7 | Net Operating Revenue | 497.7 | 363.6 | ||||||||||||
| 109.4 | 80.9 | Transportation | 359.8 | 249.5 | ||||||||||||
| 29.6 | 29.0 | Loading | 123.5 | 102.9 | ||||||||||||
| 4.1 | 3.7 | Others | 14.4 | 11.3 | ||||||||||||
Rumo recorded net revenue of R$143.1 million in 3Q12 versus 3Q11, an increase of 25.9% explained by (i) an increase in the volume of sugar transported, (ii) better prices due to the routes mix operated in the period, and (iii) adjustments to maintain the contractual balance of rail transportation with America Latina Logística (ALL)—Rumo’s partner in this transportation mode.
Net revenue from both the volume of sugar transported through the agreement with ALL and the volume directly originated by Rumo represented 76.5% of total net revenues for the quarter, up from 71.2% in 3Q11. Raízen Energia accounted for nearly 33% of the total sugar elevation volume at Rumo’s terminal at the Port of Santos.
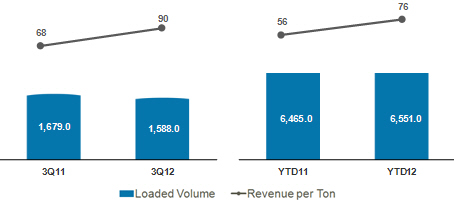
Even with a 5.4% reduction in the elevation volume in 3Q12 versus 3Q11, revenue remained stable, offset by better prices. The reduction in sugar elevation volumes, as reported in the 2Q12 Financial Letter, is the result of shipments anticipation in the previous quarter, following the strategy implemented by some sugar mills of optimizing sales when the commodity’s prices are high. Another important reason for this reduction was the 2011/12 crop failure, which reached 11.5% in January, 2012 according to UNICA data, significantly reducing the availability of sugar for exports.
In 3Q12, average revenue per unit, measured as total net revenue divided by elevation volume, was R$90.1/tonne, considering an elevation volume of 1.6 million tonnes.
Year-to-date, Rumo’s net revenue totaled R$497.7 million. In the full FY11, net revenue amounted to R$448.1 million.
In order to mitigate the risk of lower sugar volumes in the market during the inter-harvest and to optimize the company’s operating structure at the Port of Santos, Rumo is already prepared to operate with other agricultural commodities. These volumes are expected to be shipped during 4Q12.
18 of 39
Average Revenue per tonne5
Volume (’000 tonnes) and Average Revenue per Unit (R$/tonne)
Note 5: Total net revenue divided by elevation volume
Cost of Services Provided
| Costs of Services | ||||||||||||||||
| 3Q12 | 3Q11 | Amounts in R$ MM | YTD12 | YTD11 | ||||||||||||
| (85.8 | ) | (78.7 | ) | Cost of Services Provided | (316.7 | ) | (258.2 | ) | ||||||||
| (54.6 | ) | (49.3 | ) | Transportation | (222.0 | ) | (171.7 | ) | ||||||||
| (25.6 | ) | (26.0 | ) | Loading | (83.9 | ) | (76.3 | ) | ||||||||
| (5.6 | ) | (3.4 | ) | Others | (10.8 | ) | (10.2 | ) | ||||||||
Rumo’s cost of services provided includes railway and highway freight, port elevation, transshipment and storage costs in upstate São Paulo and at the Port of Santos.
The cost of services provided in 3Q12 increased 9.0% compared to 3Q12 due to higher transported volumes. On the other hand, this increase in transported volumes helped dilute fixed costs in the period. During the quarter, costs represented 60.0% of Rumo’s total net revenue, down from 69.2% in 3Q11. In the same period, elevation costs recorded a slight decrease.
Gross Profit
| Gross profit and gross margin | ||||||||||||||||
| 3Q12 | 3Q11 | Amounts in R$ MM | YTD12 | YTD11 | ||||||||||||
| 57.3 | 35.0 | Gross Profit - Rumo | 181.0 | 105.5 | ||||||||||||
| 40.0 | % | 30.8 | % | Gross Margin (%) | 36.4 | % | 29.0 | % | ||||||||
Rumo recorded gross profit of R$57.3 million in 3Q12 and R$181.0 million in YTD12, an increase of 63.7% and 71.6%, respectively, compared to the same periods of the previous year. Gross margin was at 40.0% for the quarter and 36.4% for YTD12, much higher than the margins recorded in the previous year.
19 of 39
General and Administrative Expenses
| Selling, General and Administrative Expenses | ||||||||||||||||
| 3Q12 | 3Q11 | Amounts in R$ MM | YTD12 | YTD11 | ||||||||||||
| (9.2 | ) | (5.8 | ) | General and Administrative Expenses | (28.7 | ) | (20.8 | ) | ||||||||
General and administrative expenses were R$9.2 million, up 58.6% from 3Q11, primarily due to the allocation of R$2.7 million in costs from the Shared Services Center.
EBITDA
| EBITDA | |||||||||||||||
| 3Q12 | 3Q11 | Amounts in R$ MM | YTD12 | YTD11 | |||||||||||
| 61.2 | 37.7 | EBITDA | 192.6 | 117.8 | |||||||||||
| 42.8 | % | 33.2 | % | EBITDA Margin | 38.7 | % | 32.4 | % | |||||||
Rumo recorded EBITDA of R$61.2 million for the quarter, with a 42.8% margin. Depreciation and amortization remained unchanged in the period, at R$10.4 million.
In YTD12, EBITDA was up 63.5% to R$192.6 million, with margin up 6.3 p.p. over YTD11 to 38.7%.
CAPEX
| CAPEX | ||||||||||||||||
| 3Q12 | 3Q11 | Amounts in R$ MM | YTD12 | YTD11 | ||||||||||||
| 67.1 | 123.6 | Capex | 223.4 | 374.6 | ||||||||||||
Rumo’s capital expenditures amounted to R$67.0 million in 3Q12, down 45.8% from 3Q11. Year-to-date, the company has invested R$223.4 million, less than expected for the period due to delays in government authorities’ granting of the necessary licenses for the expansion and duplication of permanent ways. Part of the investments (nearly R$270 million) budgeted for FY12 may be postponed to FY13.
Investments in locomotives and wagons cars have already been completed, but the company still has investments to make in permanent ways and transshipment and port terminals, including the works to cover one of the berths at the Port of Santos, which will allow for Rumo to elevate sugar even on rainy days—these works are already underway and are slated for completion in March of 2013.
20 of 39
A.4 Cosan Alimentos
Established on July 1, 2011, Cosan Alimentos is the group’s company in charge of purchasing, packing and distributing sugar in the Brazilian retail market, mainly via the market leading União and Da Barra brands.
For comparability purposes, Cosan Alimentos’ results are reported both on accounting and pro forma bases, as follows:
| ● | Accounting |
| o | 3Q12 – three months (October, November, and December, 2011) of Cosan Alimentos operations; |
| ● | Pro Forma |
| o | 3Q11 – three months (October, November, and December, 2010) of Cosan Alimentos operations recorded on a management basis according to currently principles; |
| o | YTD11 – nine months (April to December, 2010) of Cosan Alimentos operations recorded on a management basis according to currently principles; |
| o | YTD12 – nine months (April to December, 2011) of Cosan Alimentos operations recorded on a management basis according to currently principles; |
Net Revenue
| Book | Pro Forma | Sales breakdown | Pro Forma | Pro Forma | ||||||||||||
| 3Q12 | 3Q11 | Amounts in R$ MM | YTD12 | YTD11 | ||||||||||||
| 240.0 | 218.8 | Net Operating Revenue | 735.0 | 649.2 | ||||||||||||
| 213.2 | 197.2 | Refined sugar sales | 658.7 | 582.1 | ||||||||||||
| 13.8 | 12.6 | Cristal sugar sales | 38.6 | 39.6 | ||||||||||||
| 13.0 | 9.1 | Special sugar sales | 37.6 | 27.5 | ||||||||||||
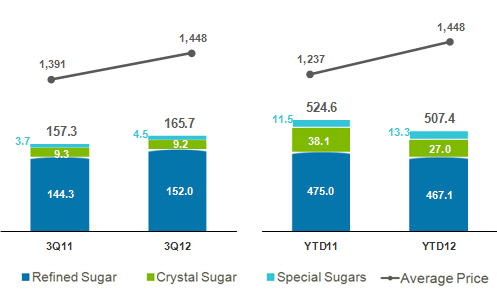
During its second quarter of operations, Cosan Alimentos recorded net revenue of R$240.0 million, an increase of 9.7% over 3Q11. Sales of refined sugar contributed the most to the company’s net revenue, representing 88.8% of total sales in 3Q12.
Special sugars, which include products like União Light, Orgânico, Premium, sachets and others, contributed R$13.0 million to the 3Q12 result, an increase of 42.9% year-over-year.
Despite the year-over-year growth in net revenue, there was nonetheless a 10.2% decline compared to 2Q12 driven by (i) a lower sales volume, which, particularly in November, was below expectations; (ii) nearly 4% lower average sales prices; and (iii) changes in domestic sugar prices.
21 of 39
Sugar
Volume (’000 tonnes) and Average Revenue per Unit (R$/tonne)
Sugar inventories
| Sugar Inventories | ||||
| 3Q12 | ||||
| ´000 tonne | 30.1 | |||
| R$'MM | 36.0 | |||
| R$/tonne | 1,194.0 | |||
Cost of Goods Sold
| Book | Pro Forma | COGS | Pro Forma | Pro Forma | ||||||||||||
| 3Q12 | 3Q11 | Amounts in R$ MM | YTD12 | YTD11 | ||||||||||||
| (194.6 | ) | (169.1 | ) | Cost of Goods Sold | (569.9 | ) | (487.0 | ) | ||||||||
| (171.8 | ) | (150.6 | ) | Refined sugar | (508.7 | ) | (432.9 | ) | ||||||||
| (13.1 | ) | (12.4 | ) | Cristal sugar | (34.5 | ) | (37.1 | ) | ||||||||
| (9.7 | ) | (6.1 | ) | Special sugar | (26.7 | ) | (16.9 | ) | ||||||||
Cost of goods sold was R$194.6 million in 3Q12, an increase of 15.1% over 3Q11 due to a nearly 41% rise in international sugar prices, which is the reference for the key raw material of Cosan Alimentos.
COGS represented 81.1% of net revenues in 3Q12, up from 77.3% in 3Q11 and 74.9% in 2Q12.
Cosan Alimentos has a long-term partnership strategy with suppliers, chief of which is Raízen Energia, to guarantee raw material volumes to meet its commitments.
22 of 39
Gross Profit
| Book | Pro Forma | Gross Profit | Pro forma | Pro forma | ||||||||||||
| 3Q12 | 3Q11 | Amounts in R$ MM | YTD12 | YTD11 | ||||||||||||
| 45.4 | 49.7 | Gross Profit | 165.1 | 162.2 | ||||||||||||
| 18.9 | % | 22.7 | % | Gross Margin | 22.5 | % | 25.0 | % | ||||||||
Gross profit was down 8.7% from R$49.7 million in 3Q11 to R$45.4 million in 3Q12. This reduction reflects the decline in domestic prices, causing the gross margin to fall. YTD12 gross profit increased slightly over the figure recorded for the same period of the previous year, reaching R$165.1 million.
Selling, General & Administrative Expenses
| Book | Pro Forma | Selling, General and Administrative Expenses | Pro Forma | Pro Forma | ||||||||||||
| 3Q12 | 3Q11 | Amounts in R$ MM | YTD12 | YTD11 | ||||||||||||
| (27.0 | ) | (29.4 | ) | Selling Expenses | (85.3 | ) | (85.7 | ) | ||||||||
| (4.2 | ) | (3.3 | ) | General and Administrative Expenses | (14.2 | ) | (11.6 | ) | ||||||||
Selling expenses amounted to R$27.0 million in 3Q12, a decrease of 8.2%, resulting from a lower sugar sales volume and the postponement of marketing investments.
In 3Q12, general and administrative expenses totaled R$4.2 million, up 27.3% over 3Q11 due to the new corporate structure created to support Cosan Alimentos, generating expenses for this business unit that had not been accounted in the pro forma 3Q11, including those relevant to the Shared Services Center and corporate structure.
EBITDA
| Book | Pro Forma | EBITDA | Pro Forma | Pro Forma | ||||||||||||
| 3Q12 | 3Q11 | Amounts in R$ MM | YTD12 | YTD11 | ||||||||||||
| 15.0 | 16.5 | EBITDA | 67.6 | 63.2 | ||||||||||||
| 6.2 | % | 7.5 | % | EBITDA Margin | 9.2 | % | 9.7 | % | ||||||||
EBITDA amounted to R$15.0 million for the quarter, down 9.1% over 3Q11, with EBITDA margin at 6.2%. Compared to the 2Q12, EBITDA decreased 52.7%. It should be noted that EBITDA for the second quarter was an all-time high due to the higher volume sold and, above all, the lower COGS.
YTD12 EBITDA was up 7.0% to R$67.6 million, with margin at 9.2%, stable over YTD11.
23 of 39
A.5 Other Businesses
Below are the results for our Other Businesses, which consist of the activities manufacturing and distribution of Mobil brand lubricants, investments in rural land and other investments, plus the corporate structures of the Cosan Group's business units, except for Raízen.
Net Revenue
| Sales Breakdown | ||||||||||||||||
| 3Q12 | 3Q11 | Amounts in R$ MM | YTD12 | YTD11 | ||||||||||||
| 263.5 | 208.9 | Net Operating Revenue | 794.6 | 618.4 | ||||||||||||
| 254.4 | 208.9 | Lubricant Sales | 767.4 | 616.9 | ||||||||||||
| 9.1 | - | Other Products and Services | 27.1 | 1.5 | ||||||||||||
The lubricants and specialties products business recorded revenue of R$263.5 million in 3Q12, an increase of 26.1% over 3Q11 (R$208.9 million). Lubricant sales were the main driver of this increase, whereas sales of base oil—raw material for lubricant manufacture—contributed to the 32.5% increase in the total volume sold. The volume of lubricants sold fell 8.8% compared to 2Q12 due to year-end seasonal factors.
As part of the strategy of growing its presence internationally, Cosan Lubrificantes and Especialidades celebrated on October 2011 the acquisition of lubricants distribution in Bolivia, Uruguay and Paraguay, becoming the exclusive distributor of Mobil branded products in these countries.
Lubricants
Volume (million liters) and Average Unit Price (R$/’000 liters)
24 of 39
Selling, General & Administrative Expenses
| Selling, General and Administrative Expenses | ||||||||||||||||
| 3Q12 | 3Q11 | Amounts in R$ MM | YTD12 | YTD11 | ||||||||||||
| (35.1 | ) | (29.2 | ) | Selling Expenses | (149.2 | ) | (80.3 | ) | ||||||||
| (50.9 | ) | (21.2 | ) | General and Administrative Expenses | (89.8 | ) | (53.7 | ) | ||||||||
In 3Q12, Other Business’ sales expenses were R$35.1 million, as compared with R$29.2 million in the same period of the previous quarter. This 20.2% increase is chiefly due to increased investments in marketing, as well as the increased sales volume of lubricants and base oils in the period.
General and administrative expenses in the quarter totaled R$50.9 million over the R$21.2 million posted in 3Q11. It should be noted that in 3Q11 this line reflected only the proportional allocation of administrative expenses of Cosan Lubrificantes e Especialidades related to that business. This year, in addition to these expenses, there are also expenses with Cosan’s corporate structure, which were previously primarily allocated under Cosan’s sugar and ethanol unit, now Raízen Energia.
EBITDA
| EBITDA | ||||||||||||||||
| 3Q12 | 3Q11 | Amounts in R$ MM | YTD12 | YTD11 | ||||||||||||
| 2.1 | 38.1 | EBITDA | 3,329.5 | 129.3 | ||||||||||||
| - | - | Effects from Joint Venture (Raízen) | (3,297.0 | ) | - | |||||||||||
| 2.1 | 38.1 | Adjusted EBITDA Margin | 32.6 | 129.3 | ||||||||||||
| 0.8 | % | 18.2 | % | Adjusted EBITDA Margin | 4.1 | % | 20.9 | % | ||||||||
Other Businesses recorded EBITDA of R$2.1 million in 3Q12 with a 0.8% margin, lower in the period due to the allocation of sales, general and administrative expenses from other business units that were accounted for under their respective units in previous periods, in addition to the impact of provisions for judicial demands for the businesses contributed to Raízen’s formation and which, under the agreement remains under Cosan’s responsibility.
25 of 39
B. Other Items in the Consolidated Result
Financial Result
| Financial Results | ||||||||||||||||
| 3Q12 | 3Q11 | Amounts in R$ MM | YTD12 | YTD11 | ||||||||||||
| (93.2 | ) | (134.0 | ) | Gross Debt Charges | (434.9 | ) | (413.6 | ) | ||||||||
| 28.0 | 22.2 | Income from Financial Investments | 100.5 | 85.4 | ||||||||||||
| (65.2 | ) | (111.8 | ) | (=) Subtotal: Interests and Income | (334.4 | ) | (328.2 | ) | ||||||||
| 1.6 | (17.7 | ) | Other Charges and Monetary Variation | (16.1 | ) | (43.2 | ) | |||||||||
| 10.7 | 59.3 | Exchange Rate Variation | (176.1 | ) | 214.8 | |||||||||||
| (7.0 | ) | (17.0 | ) | Gains (Losses) with Derivatives | 2.3 | 6.3 | ||||||||||
| (9.7 | ) | (2.3 | ) | Other | 72.4 | 16.7 | ||||||||||
| (69.6 | ) | (89.5 | ) | (=) Financial, Net | (452.0 | ) | (133.6 | ) | ||||||||
The net financial result for 3Q12 was a net expense of R$69.6 million, versus a net expense of R$89.5 million in the same period of the previous year.
During the quarter, the depreciation of the Brazilian real against the dollar reached nearly 1% (R$1.8758/US$ on December 31, 2011; and R$1.8544/US$ on September 30, 2011), whereas in 3Q11 the Brazilian real appreciated by nearly 2% against the dollar (R$1.6662/US$ on December 31, 2010; and R$1.6942/US$ on September 30, 2010). Therefore, we saw no significant impact on our quarterly results deriving from foreign exchange variations.
Financial charges over our gross debt declined approximately 30% compared to same quarter of last year, following a 28.3% reduction in the balance of our consolidated gross debt in the period, from R$7.1 billion on December 31, 2010 to R$5.1 billion on December 31, 2011. This decrease was due to a change in the debt profile in the consolidated result, considering the effects of the proportionate consolidation of Raízen’s debt starting in 1Q12, and also to the new profile of the company’s consolidated indebtedness, offset by an increase of nearly 5% in the CDI interest rate in the quarterly comparison.
Financial income from investments totaled R$28.0 million in the third quarter, up from R$22.2 million in the same period a year ago, mainly due to a 25% higher average balance of financial investments and the effects of a 5% increase in the CDI interest rate in the period.
The derivatives line included in the financial results reflects the gains and losses with derivatives not considered on the hedge accounting or the ineffective portion of such instruments. We recorded a loss of R$17 million with derivatives in 3Q11, a figure that fell to R$7.0 million in 3Q12.
Net Income
In 3Q12, Cosan recorded net income of R$93.8 million with a net margin of 1.5%, versus net income of R$38.7 million in 3Q11. This increase was basically driven by the R$89.4 million increase derived from operating and financial performance, as mentioned above, partially offset by increased income tax expenses and income attributed to minority shareholders.
26 of 39
C. Indebtedness
In 3Q12, Cosan’s consolidated gross debt amounted to R$4.8 billion, stable over 2Q12. Below you will find the breakdown of Raízen's debt, proportionately consolidated at 50% by Cosan, inaddition to the debt of the other business units of Cosan Group, which are fully consolidated in the result.
Raízen
Raízen’s combined gross debt amounted to R$5.9 billion in the period ended December 31, 2011, down 3.3% as compared to the balance recorded at September 30, 2011.
In the period, the Company raised R$227.7 million through the following facilities:
| (i) | R$101.0 million from the BNDES, and other debts to fund energy cogeneration and sugarcane harvesting mechanization projects, among others. |
| (ii) | R$86.7 million in foreign exchange contract advances; |
| (iii) | R$40.0 million in rural credit facilities. |
Amortization and service to the debt totaled R$566.3 million in the period.
It is important to note that Raízen has a receivable from Shell in the amount of US$1.1 billion, maturing on the 1st and 2nd anniversaries of its establishment (June 1, 2012 and June 1, 2013, respectively), resulting in better capacity and improved debt profile for this jointly controlled subsidiary. This receivable from Shell is proportionately consolidated by Cosan (50%), but it is not booked as a cash equivalent. For this reason, and for a better understanding of Cosan's leverage capacity, we report the “pro forma” net debt, which takes into account the cash equivalents and 50% of the Shell receivable for the purpose of calculating the net debt.
Cosan and Subsidiaries
Gross financial debt was R$1.9 billion in 3Q12, unchanged from 2Q12.
Additionally, subsidiary Rumo Logística raised R$42.3 million through the Finame facility in the third quarter to invest in railway assets and port terminals.
27 of 39
Cosan – Consolidated
Cash and equivalents closed 3Q12 at R$1.2 billion, down from R$1.5 billion in 2Q12, bringing the “pro forma” net indebtedness up to R$2.7 billion (equivalent to 1.2x LTM EBITDA) from R$2.5 billion in 2Q12 (0.9x LTM EBITDA).
| Debt by Type | ||||||||||||||||
| Amounts in R$ MM | 3Q12 | 2Q12 | % ST | Var. % | ||||||||||||
| Senior Notes 2014 | 679.9 | 656.7 | 3 | % | 3.5 | % | ||||||||||
| Expenses with Debt Placement | (7.4 | ) | (8.0 | ) | 39 | % | -7.8 | % | ||||||||
| BNDES | 1,488.4 | 1,412.0 | 11 | % | 5.4 | % | ||||||||||
| Working Capital | 855.5 | 846.5 | 1 | % | 1.1 | % | ||||||||||
| Prepaid Exports | 749.4 | 737.8 | 17 | % | 1.6 | % | ||||||||||
| Senior Notes 2017 | 772.1 | 750.3 | 3 | % | 2.9 | % | ||||||||||
| Advances on Exchange Contracts | 498.9 | 729.6 | 100 | % | -31.6 | % | ||||||||||
| Credit Notes | 351.4 | 349.3 | 86 | % | 0.6 | % | ||||||||||
| Finame | 220.8 | 236.9 | 31 | % | -6.8 | % | ||||||||||
| Finem | 219.0 | 229.1 | 21 | % | -4.4 | % | ||||||||||
| Rural Credit | 40.3 | 95.5 | 100 | % | -57.8 | % | ||||||||||
| PROINFA | 28.6 | 29.9 | 13 | % | -4.5 | % | ||||||||||
| CDCA | - | 31.5 | 0 | % | -100.0 | % | ||||||||||
| Expenses with Placement of Debt | (11.1 | ) | (11.6 | ) | 23 | % | -4.4 | % | ||||||||
| Total Raízen | 5,885.6 | 6,085.4 | 22 | % | -3.3 | % | ||||||||||
| Raízen Consolidation ( 50%) | 2,942.8 | 3,042.7 | 22 | % | -3.3 | % | ||||||||||
| Finame | 594.8 | 554.1 | 11 | % | 7.4 | % | ||||||||||
| Expenses with Placement of Debt | (1.1 | ) | (1.0 | ) | 22 | % | 16.6 | % | ||||||||
| Perpetual Bonds | 949.7 | 939.1 | 1 | % | 1.1 | % | ||||||||||
| Credit Notes | 328.5 | 322.7 | 0 | % | 1.8 | % | ||||||||||
| Expenses with Placement of Debt | (12.0 | ) | (12.6 | ) | 0 | % | -4.5 | % | ||||||||
| Total Cosan | 1,859.9 | 1,811.2 | 34 | % | 2.7 | % | ||||||||||
| Total Consolidated | 4,802.7 | 4,853.9 | 56 | % | -1.1 | % | ||||||||||
| Cash and Equivalents | 1,194.9 | 1,471.7 | 0 | % | -18.8 | % | ||||||||||
| Net Debt | 3,607.8 | 3,382.2 | 20 | % | 6.7 | % | ||||||||||
| Capital Subscription to be Paid from Shell to Raízen (50%) | 923.2 | 887.0 | - | - | ||||||||||||
| Adjusted Net Debt | 2,696.7 | 2,495.1 | - | - | ||||||||||||
28 of 39
D. Market Overview
According UNICA data, as of January 1, 2012, South-Central Brazil (CS region) crushed 492.23 million tonnes of sugarcane, down 11.4% over the same period of the previous harvest year. The decline in crushing is mainly the result of the lack of raw material, since the 2011/12 harvest was less productive than the previous harvest because of unexpected events such as drought, flowering and two frosts, the impacts of which were magnified by the age of the cane fields, for its part due to the lack of post-crisis investment. The production mix is still primarily focused on sugar with 48.3% of the crop allocated to the production of sugar, compared to 45% in the previous season. This increase can be explained by higher sugar prices in domestic and international markets. In the period, production totaled 31.17 million tonnes of sugar and 20.56 billion liters of ethanol, down 6.86% and 18.74%, respectively, compared with the 2010/11 harvest.
Sugar
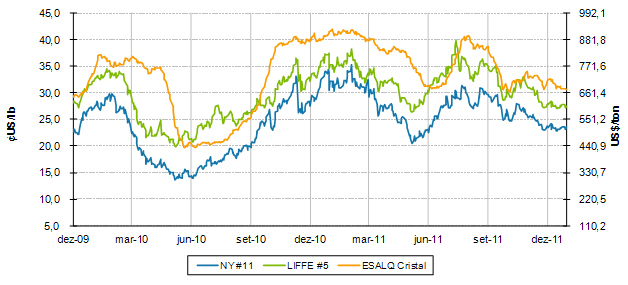
Sources: ESALQ, Bloomberg, Cosan
Trending against market expectations of expected lower prices due in function of the CS region harvest, domestic sugar prices reached R$70.00 per 50 kg sack. Such an uncommon movement caused consumers to react, anticipating purchases in fear of higher prices, reflected by significantly lower demand since mid-October. On the other hand, prices fell to approximately R$62.00 per 50 kg sack (with taxes) in December and early January, possibly the result of seasonality and producers’ liquidation of inventories to generate income, raising supply above the demand.
Exports from the 2010/2011 harvest year between April and December fell 9.2% year-on-year to a total export volume of 20.7 million tonnes. Exports are expected to remain below last year’s volume due to the problems with the CS harvest. Among the main destinations, China stood out as the major importer during the year. However, in this quarter, Egypt led imports at almost 750 thousand tonnes, followed by Algeria with around 500 thousand tonnes. These three countries account for about 30% of Brazil's exports in the quarter.
29 of 39
As expected, Western Europe’s beet sugar contributed to global production. Most of this increase came from Germany and France, which saw larger crops due to the increased area and good weather. Europe is expected to end the cycle with volumes up 18% over last year's, totaling 18.2 million tonnes of sugar.
The 2011/2012 Russian crop developed to the point of having produced 4.9 million tonnes of sugar by the first half of January, an increase driven by increased area and the good weather for beets. The country has exported refined sugar to its neighbors, though it should remain a major net importer. Following Russia’s example, Ukraine has also shown increasing growth, with production expected to grow by 51% during this harvest.
India has also shown strong development and, with the prospects for the 2011/2012 harvest, the country has already exported about 350 thousand tonnes in 2Q12 alone. However, the producer is currently facing some unexpected factors such as natural and climatic adversities, including the cyclone that hit Tamil Nadu.
Thailand is currently at its daily crushing peak and even with the recent floods, no major impacts on the production are expected, and production should reach 103 million tonnes. Due to the delay in the harvest, exports in December were lower than expected.
In China, sugarcane production is expected to rise 8% 2011/2012 over the previous harvest. The U.S. showed a drastic reduction of its shipping inventory due to the 600 thousand tonne reduction in exports from Mexico.
Gross sugar prices reached an average of ¢US$24.70/lb in 3Q’12, down 13.8% over 2Q’12, which saw a high of ¢US$31.34/lb, and 15% below the average price of ¢US$29.06/lb in 3Q’11.
Refined sugar in the international market reached an average price of US$646.18/tonne in the period, 14.3% lower than 2Q’12 and 11.6% lower than 3Q’11, with a premium on white sugar which sold at an average of US$101.7/tonne, over US$92/tonne in 3Q’11 and US$124.8/tonne in 2Q’12.
Based on the data provided by the Brazilian Central Bank, in 3Q’12 the real depreciated 9.7% against the dollar over the previous quarter to an average price of R$1.80/US$. In this period, the real reached R$1.89/US$, mainly a result of the continuing PIGS debt crisis in Europe, as well as U.S. economic instability. The real closed the period at R$1.88/US$, compared to R$ 1.66/US$ in December of 2010 and R$ 1.85/US$ in September of 2011.
In the domestic sugar market, the average ESALQ base price of refined sugar in 3Q’12 was R$63.39 per 50 kg sack, or ¢US$31.98/lb, down 13.3% over the previous quarter and up 18.5% year-over-year.
30 of 39
Ethanol
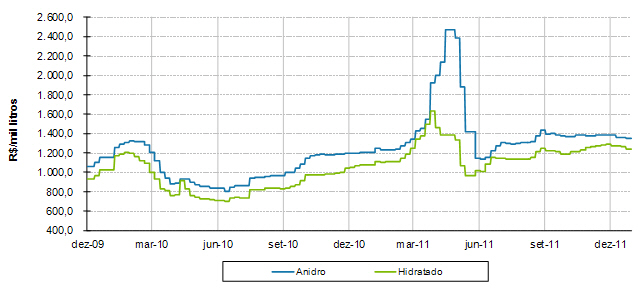
Sources: ESALQ, Bloomberg, Cosan
Ethanol demand fell slightly quarter-over-quarter, while year-over-year, hydrous ethanol fell more than 40%, mostly a result of prices making the fuel disadvantageous as compared to gasoline. With lower demand for hydrous ethanol, the share of anhydrous ethanol rose 10 p.p. over the previous harvest. Thus, plants focused on producing this type of ethanol, which has been blended at 20% with gasoline since October.
The average ESALQ base price for hydrous ethanol was R$1,251.6/m3 in 3Q’12, 23.3% higher than in the same quarter of previous year and 6.5% down over 2Q’12. The average price was R$1,373.2/m3, up 15.7% over 3Q’11 and 2.2% over the previous quarter.
According to the National Petroleum Agency (ANP), the average price parity of hydrous ethanol relative to gasoline in Brazil was approximately 74.7% at the end of 3Q’12. In the last week of 2011, no Brazilian state had price parity between ethanol and gasoline below 70%.
Fuels
According to ANFAVEA data, more than 740 thousand flex fuel cars were sold in the quarter, down 10.2% year-over-year.
According to SINDICOM, 11.2 billion liters of diesel fuel were sold in the quarter, 4.7% more than last year. On the other hand, ethanol sales volumes declined by 44.0% to 1.4 billion liters. In the same months, "C" gasoline sales reached 7.1 billion liters, up 20.3%, showing the continued migration of consumers from ethanol to gasoline as a function of the price dynamics.
31 of 39
E. Stock Performance
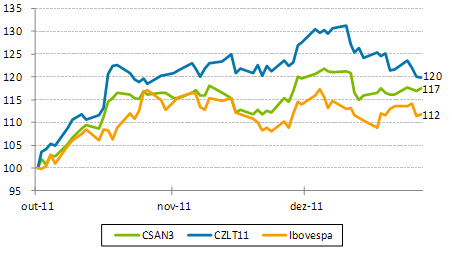
Cosan S.A.’s common shares have been listed on the BM&FBovespa since 2005, the year of its IPO on the Novo Mercado segment under the CSAN3 ticker symbol, and is included in the Ibovespa, IBrX, IBrX-50, IBrA, MLCX, ICO2, INDX, ICON, IVBX-2, IGC, IGCT and ITAG indexes.
The stock of Cosan Limited (Cosan's holding company) has been listed on the NYSE since its IPO in 2007 under the ticker symbol CZZ. The company also issued Brazilian Depositary Receipts (BDRs) on the BM&FBovespa under the ticker symbol CZLT11.
The graphs and charts below represent the companies’ stock performances:
| Quarter Summary | CSAN3 | CZLT11 | CZZ | |||||||
| Stock Type | Ordinary | BDR | Class A and B | |||||||
| Listed in | BM&F Bovespa | BM&F Bovespa | NYSE | |||||||
| Closing Price in 12/29/2011 | R$ | 27.00 | R$ | 20.36 | US$ | 10.96 | ||||
| Higher Price | R$ | 28.01 | R$ | 17.00 | US$ | 9.08 | ||||
| Average Price | R$ | 26.33 | R$ | 20.48 | US$ | 11.35 | ||||
| Lower Price | R$ | 23.00 | R$ | 22.30 | US$ | 12.39 | ||||
| Average Daily Traded Volume | R$ | 29.2 milhões | R$ | 1.3 milhões | US$ | 11.3 milhões | ||||
Evolution CSAN3 x CZLT11 x Ibovespa
(Base 100)
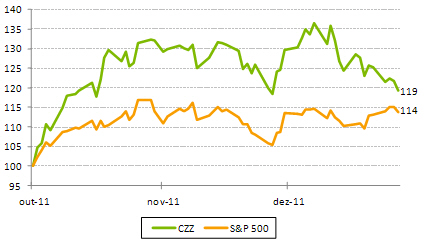
Evolution CZZ x S&P500
(Base 100)
32 of 39
F. Guidance
This section contains the guidance broken down by variation range for some key parameters in Cosan’s consolidated results for FY12 (beginning April 1, 2011 and closing March 31, 2012). The other sections of this Financial Letter may also contain projections. Such projections and guidance are only estimates and indications, and as such these do not represent any guarantee of future results.
This guidance refers to the operations currently held by the Cosan Group, which consists of Raízen Energia, Raízen Combustíveis, Rumo, Cosan Alimentos, and Other Businesses.
| FY2011 | FY2012 | 1st Revision 2012 FY | 2nd Revision 2012 FY | |||
Cosan Consolidated | Net Revenue (R$MM) | 18.063 | 25,000 ≤ ∆ ≤ 27,500 | 25,000 ≤ ∆ ≤ 27,500 | 25,000 ≤ ∆ ≤ 27,500 | |
| EBITDA (R$MM) | 2.671 | 1,800 ≤ ∆ ≤ 2,200 | 1,800 ≤ ∆ ≤ 2,200 | 1,800 ≤ ∆ ≤ 2,200 | ||
| Net income (R$MM) | 772 | - | - | - | ||
| CAPEX (R$MM) | 2.500 | 2,000 ≤ ∆ ≤ 2,300 | 2,000 ≤ ∆ ≤ 2,300 | 2,000 ≤ ∆ ≤ 2,300 | ||
| FY2011 | FY2012 | 1st Revision 2012 FY | 2nd Revision 2012 FY | |||
| Raízen Energia | Volume of crushed sugarcane (‘000 tons) | 54.238 | 56,000 ≤ ∆ ≤ 60,000 | 53,000 ≤ ∆ ≤ 56,000 | 53,000 ≤ ∆ ≤ 54,000 | |
| Volume of sugar sold (‘000 tons) | 4.291 | 4,200 ≤ ∆ ≤ 4,600 | 3,900 ≤ ∆ ≤ 4,300 | 3,900 ≤ ∆ ≤ 4,100 | ||
| Volume of ethanol sold (millions of liters) | 2.247 | 2,100 ≤ ∆ ≤ 2,300 | 2,000 ≤ ∆ ≤ 2,300 | 1,900 ≤ ∆ ≤ 2,000 | ||
| Volume of energy sold (‘000 MWh) | 1.254 | 1,400 ≤ ∆ ≤ 1,600 | 1,200 ≤ ∆ ≤ 1,400 | 1,200 ≤ ∆ ≤ 1,400 | ||
| EBITDA (R$MM) | 2.130 | 1,900 ≤ ∆ ≤ 2,300 | 1,900 ≤ ∆ ≤ 2,100 | 1,850 ≤ ∆ ≤ 2,050 | ||
| FY2011 | FY2012 | 1st Revision 2012 FY | 2nd Revision 2012 FY | |||
| Raízen Combustíveis | Volume of fuel sold (millions of liters) | - | 21,000 ≤ ∆ ≤ 23,000 | 21,000 ≤ ∆ ≤ 23,000 | 21,000 ≤ ∆ ≤ 22,000 | |
| EBITDA (R$MM) | - | 850 ≤ ∆ ≤ 1,050 | 900 ≤ ∆ ≤ 1,200 | 1,000 ≤ ∆ ≤ 1,200 | ||
| FY2011 | FY2012 | 1st Revision 2012 FY | 2nd Revision 2012 FY | |||
| Rumo | Volume of loading (‘000 tons) | 7.841 | 9,000 ≤ ∆ ≤ 11,000 | 9,000 ≤ ∆ ≤ 11,000 | 7,500 ≤ ∆ ≤ 9,500 | |
| Volume of transportation (‘000 tons) | - | 6,000 ≤ ∆ ≤ 8,000 | 6,000 ≤ ∆ ≤ 8,000 | 5,000 ≤ ∆ ≤ 7,000 | ||
| FY2011 | FY2012 | 1st Revision 2012 FY | 2nd Revision 2012 FY | |||
Cosan Alimentos | Volume of sugar sold (‘000 tons) | 550 ≤ ∆ ≤ 650 | 550 ≤ ∆ ≤ 650 | 550 ≤ ∆ ≤ 650 | ||
| EBITDA (R$MM) | 65 ≤ ∆ ≤ 85 | 65 ≤ ∆ ≤ 85 | 65 ≤ ∆ ≤ 85 | |||
| FY2011 | FY2012 | 1st Revision 2012 FY | 2nd Revision 2012 FY | |||
Other Business | Volume of lubricants sold (millions of liters) | 166 | 170 ≤ ∆ ≤ 190 | 170 ≤ ∆ ≤ 190 | 170 ≤ ∆ ≤ 190 | |
About Cosan
Cosan is one of the largest privately-held groups in Brazil and the only fully integrated company in the sugar and ethanol energy segment, with businesses in the energy, food, logistics, infrastructure and rural development and management industries. Through Raízen, a joint venture between Cosan and Shell, the Company produces sugar and ethanol and distributes fuels through a network of 4,500 Shell and Esso stations. In the sugar retail industry, Cosan operates with leading brands União and Da Barra. Cosan produces and distributes automotive and industrial lubricants under the Mobil brand. Rumo Logística is Cosan’s logistics business, and the world’s largest company specializing in transporting and loading sugar and grains.
Disclaimer
This document contains forward-looking statements and estimates. These forward-looking statements and estimates are solely forecasts and do not represent any guarantee of prospective results. All stakeholders should know that these statements and estimates are and will be, depending on the case, subject to risks, uncertainties and factors related to the operations and business environment of Cosan and its subsidiaries, and therefore the actual results of these companies may significantly differ from the estimated or implied prospective results contained in such forward-looking statements and estimates.
33 of 39
G. Cosan S.A.
Statement of Income
| Income Statement | Jun'10 | Sept'10 | Dec'10 | Mar'11 | Jun'11 | Set'11 | Dec'11 | ||
| (in R$ million) | 1Q11 | 2Q11 | 3Q11 | FY11 | 1Q12 | 2Q12 | 3Q12 | ||
| (=) | Net Operating Revenue | 3,999.6 | 4,716.1 | 4,738.4 | 18,063.5 | 5,188.0 | 6,804.3 | 6,310.7 | |
| (-) | Cost of Goods Sold and Services Rendered | (3,522.7) | (3,995.2) | (4,160.0) | (15,150.1) | (4,600.0) | (6,042.4) | (5,670.9) | |
| (=) | Gross Profit | 476.9 | 720.9 | 578.5 | 2,913.4 | 588.0 | 761.9 | 639.8 | |
| (-) | Operating Income (Expenses): | (339.0) | (442.6) | (407.9) | (1,600.8) | 2,925.9 | (468.3) | (399.8) | |
| (-) | Selling | (216.1) | (265.5) | (271.9) | (1,026.0) | (261.2) | (295.3) | (282.0) | |
| (-) | General and Administrative | (120.6) | (137.9) | (132.4) | (541.0) | (150.0) | (158.2) | (147.5) | |
| (±) | Other Operating Income (Expenses), Net | (2.3) | (39.1) | (3.6) | (33.8) | 22.0 | 3.2 | 29.6 | |
| (±) | Joint Venture formation income (expenses) | - | - | - | - | 3,315.1 | (18.2) | - | |
| (=) | Operating Income (Loss) | 137.9 | 278.3 | 170.5 | 1,312.6 | 3,513.9 | 293.6 | 240.0 | |
| (±) | Non-Operating Income (Expenses): | (124.7) | 88.8 | (81.5) | (121.5) | 13.2 | (394.9) | (69.4) | |
| (±) | Financial Income (Expenses), Net | (130.5) | 86.4 | (89.4) | (146.7) | 11.2 | (393.6) | (69.5) | |
| (±) | Earnings (Losses) on Equity Investments | 5.8 | 2.4 | 7.8 | 25.2 | 2.0 | (1.3) | 0.0 | |
| (=) | Income (Loss) Before taxes | 13.2 | 367.1 | 89.0 | 1,191.1 | 3,527.1 | (101.3) | 170.5 | |
| (±) | Income and Social Contribution Taxes | (11.0) | (126.2) | (42.3) | (414.5) | (1,224.6) | 188.2 | (63.8) | |
| (±) | Minority Interest | (1.7) | 10.7 | (8.0) | (5.0) | (3.1) | (23.7) | (13.0) | |
| (=) | Net Income | 0.4 | 251.6 | 38.7 | 771.6 | 2,299.3 | 63.2 | 93.8 | |
34 of 39
Balance Sheet
| Balance Sheet | Jun'10 | Sept'10 | Dec'10 | Mar'11 | Jun'11 | Set'11 | Dec'11 |
| (in R$ million) | 1Q11 | 2Q11 | 3Q11 | FY11 | 1Q12 | 2Q12 | 3Q12 |
| Cash and Cash Equivalents | 1,054.9 | 988.4 | 1,136.9 | 1,254.1 | 1,278.2 | 1,471.7 | 1,194.9 |
| Restricted Cash | 51.3 | 76.0 | 276.2 | 187.9 | 60.2 | 52.5 | 88.1 |
| Trade Accounts Receivable | 619.1 | 760.0 | 657.5 | 594.9 | 825.2 | 983.7 | 1,022.3 |
| Derivative Financial Instruments | 144.5 | 166.0 | 180.0 | 55.7 | 60.2 | 29.4 | 59.6 |
| Inventories | 1,066.3 | 1,626.8 | 1,642.7 | 670.3 | 1,002.0 | 1,361.8 | 1,354.4 |
| Advances to Suppliers | 323.5 | 293.9 | 268.6 | 229.3 | 172.2 | 141.9 | 110.2 |
| Related Parties | 50.5 | 21.8 | 20.8 | 14.7 | 680.3 | 599.7 | 655.8 |
| Recoverable Taxes | 355.4 | 396.4 | 401.1 | 375.0 | 411.7 | 416.0 | 325.0 |
| Other Assets | 46.7 | 51.3 | 81.8 | 80.4 | 98.9 | 108.1 | 115.9 |
| Current Assets | 3,712.2 | 4,380.5 | 4,665.5 | 3,462.3 | 4,588.9 | 5,164.9 | 4,926.3 |
| Deferred Income and Social Contribution Taxes | 680.0 | 744.3 | 823.5 | 715.3 | 1,026.4 | 959.7 | 1,108.2 |
| Advances to Suppliers | 52.5 | 65.1 | 85.5 | 46.0 | 27.5 | 39.6 | 49.7 |
| Related Parties | 79.6 | 77.8 | 76.0 | 92.0 | 1,215.4 | 1,176.6 | 1,195.8 |
| Recoverable Taxes | 38.8 | 36.6 | 36.0 | 55.1 | 124.5 | 123.6 | 122.2 |
| Judicial Deposits | 168.9 | 173.6 | 180.9 | 218.4 | 372.5 | 491.1 | 495.6 |
| Other financial assets | 367.3 | 378.2 | 392.3 | 420.4 | 290.3 | 418.6 | 415.5 |
| Other Assets | 459.6 | 464.5 | 498.4 | 443.8 | 1,103.6 | 966.5 | 966.2 |
| Investments | 267.4 | 287.5 | 294.7 | 304.1 | 333.9 | 358.1 | 368.6 |
| Biological Assets | 932.8 | 873.6 | 894.8 | 1,561.1 | 795.1 | 717.0 | 767.9 |
| Property, Plant and Equipment | 6,360.3 | 6,432.0 | 6,799.9 | 7,980.5 | 8,260.0 | 7,928.8 | 7,835.2 |
| Intangible | 3,379.2 | 3,370.0 | 3,355.7 | 3,445.7 | 4,125.3 | 4,531.1 | 4,593.8 |
| Non-current Assets | 12,786.4 | 12,903.4 | 13,437.6 | 15,282.4 | 17,674.4 | 17,710.7 | 17,918.7 |
| Total Assets | 16,498.6 | 17,283.8 | 18,103.2 | 18,744.7 | 22,263.4 | 22,875.6 | 22,845.0 |
| Loans and Financings | 854.3 | 1,052.5 | 1,124.0 | 916.4 | 627.1 | 758.7 | 725.7 |
| Derivatives Financial Instruments | 37.4 | 96.1 | 379.0 | 132.3 | 94.3 | 29.3 | 15.7 |
| Trade Accounts Payable | 716.3 | 832.1 | 754.4 | 558.8 | 621.6 | 757.5 | 765.4 |
| Salaries Payable | 219.9 | 225.5 | 175.6 | 183.6 | 183.3 | 191.5 | 158.2 |
| Taxes and Social Contributions Payable | 197.4 | 239.2 | 218.8 | 245.3 | 247.1 | 328.9 | 282.4 |
| Dividendos a pagar | 116.6 | 7.0 | 7.0 | 190.3 | 195.7 | 21.2 | 15.9 |
| Related Parties | 120.1 | 66.0 | 74.6 | 41.2 | 186.8 | 163.2 | 228.5 |
| Other Liabilities | 189.4 | 198.4 | 180.3 | 189.6 | 273.1 | 306.4 | 215.0 |
| Current Liabilities | 2,451.3 | 2,716.7 | 2,913.8 | 2,457.4 | 2,428.9 | 2,556.7 | 2,406.9 |
| Loans and Financing | 5,322.7 | 5,310.8 | 5,961.7 | 6,274.9 | 3,699.4 | 4,407.8 | 4,402.3 |
| Taxes and Social Contributions Payable | 597.3 | 605.8 | 618.2 | 639.1 | 1,123.0 | 1,180.0 | 1,184.8 |
| Provision for Legal Proceedings | 625.0 | 642.9 | 650.1 | 666.3 | 940.8 | 975.8 | 1,026.7 |
| Related Parties | - | - | - | 4.4 | 371.2 | 546.3 | 468.5 |
| Pension Fund | - | 2.1 | 12.2 | 24.4 | 25.9 | 27.4 | 28.9 |
| Deferred Income and Social Contribution Taxes | 1,123.6 | 1,215.6 | 1,250.9 | 1,511.0 | 3,546.4 | 3,159.1 | 3,116.5 |
| Other Liabilities | 374.5 | 377.7 | 378.7 | 382.9 | 814.4 | 752.1 | 777.1 |
| Non-current Assets | 8,043.0 | 8,155.0 | 8,871.7 | 9,502.9 | 10,521.0 | 11,048.4 | 11,004.8 |
| Common stock | 4,687.8 | 4,691.1 | 4,691.1 | 4,691.8 | 4,691.8 | 4,691.8 | 4,691.8 |
| Treasury stock | (4.2) | (4.2) | (19.4) | (19.4) | (19.4) | (66.3) | (67.7) |
| Capital Reserve | 511.3 | 564.8 | 439.3 | 537.5 | 637.8 | 609.9 | 661.3 |
| Profits Reserve | 374.2 | 290.8 | 290.8 | 1,249.0 | 1,249.0 | 1,232.2 | 1,232.2 |
| Accumulated profits (losses) | 370.3 | 621.8 | 660.5 | - | 2,299.3 | 2,362.5 | 2,456.3 |
| Shareholders' Equity | 5,939.4 | 6,164.4 | 6,062.4 | 6,458.9 | 8,858.6 | 8,830.2 | 8,973.9 |
| Minority Shareholders' Interest | 64.9 | 247.8 | 255.3 | 325.5 | 454.9 | 440.3 | 459.4 |
| Shareholders' Equity | 6,004.3 | 6,412.1 | 6,317.7 | 6,784.3 | 9,313.4 | 9,270.5 | 9,433.4 |
| Total Shareholders' Equity and Liabilities | 16,498.6 | 17,283.8 | 18,103.2 | 18,744.7 | 22,263.4 | 22,875.6 | 22,845.0 |
35 of 39
Statement of Cash Flow
| Statement of Cash Flows | Jun'10 | Sept'10 | Dec'10 | Mar'11 | Jun'11 | Set'11 | Dec'11 |
| (in R$ million) | 1Q'11 | 2Q'11 | 3Q'11 | FY'11 | 1Q'12 | 2Q'12 | 3Q'12 |
| Net Income | 0.4 | 251.5 | 38.7 | 771.6 | 2,299.3 | 63.2 | 93.8 |
| Non-cash Adjustments: | - | - | - | - | - | - | - |
| Depreciation & Amortization | 290.9 | 400.0 | 380.9 | 1,359.0 | 303.7 | 365.5 | 254.6 |
| Biological Assets | 42.2 | 28.7 | (21.2) | (381.9) | (20.9) | 38.8 | 20.0 |
| Stock option | - | - | - | - | - | - | 4.8 |
| Earnings (Losses) from Equity Investments | (5.8) | (2.4) | (7.8) | (25.2) | (2.0) | 1.3 | (0.0) |
| Losses (Gains) in Fixed Assets Disposals | 3.1 | (11.8) | 2.1 | (35.3) | 17.0 | (11.5) | (27.6) |
| Deferred Income and Social Contribution Taxes | (0.7) | 104.4 | 16.4 | 329.1 | 1,197.8 | (277.7) | 69.7 |
| Judicial demands' provision | 10.7 | 18.9 | (2.6) | 26.9 | 33.1 | (33.1) | 50.9 |
| Minority Shareholders' Interest | 1.7 | (10.7) | 8.0 | 5.0 | 3.1 | 23.7 | 13.0 |
| Interest, monetary and exchange variations, net | 167.0 | (62.2) | 53.2 | 238.5 | (33.7) | 562.3 | 126.6 |
| Joint Venture formation income (expenses) | - | - | - | - | (3,315.1) | 18.2 | - |
| Capital gains | - | (223.1) | - | - | - | - | - |
| Other Non-cash Items | 19.4 | 199.2 | (1.6) | 7.5 | 5.2 | (5.2) | - |
| Variation on Assets and Liabilities | - | - | - | - | - | - | - |
| Trade Accounts receivable | 153.3 | (153.4) | 135.5 | 164.7 | (123.3) | (105.6) | (38.6) |
| Restricted Cash | - | - | - | (143.0) | 113.5 | 7.7 | (35.5) |
| Inventory | (304.0) | (440.8) | (19.4) | 84.6 | (326.6) | (311.8) | (34.7) |
| Related Parties | - | - | - | (50.1) | (1,747.4) | 142.6 | (87.8) |
| Advances to Suppliers | (76.7) | 16.9 | 4.9 | 16.8 | (122.1) | 18.2 | 21.5 |
| Trade Accounts payable | 146.9 | 115.8 | (77.7) | (32.4) | 241.2 | 125.0 | 8.0 |
| Salaries payable | 78.3 | 5.6 | (49.9) | 36.2 | 110.9 | 5.1 | (33.3) |
| Derivative Financial Instruments | 70.7 | (214.6) | (108.4) | 13.3 | (79.8) | (62.1) | (4.4) |
| Taxes and Social Contributions Payable | (29.0) | 34.2 | (23.2) | - | 908.8 | 15.5 | (59.0) |
| Other assets and liabilities, net | 39.0 | (98.2) | (101.6) | (48.3) | 429.6 | (6.8) | (55.0) |
| Cash Flow from Operating Activities | 607.3 | (41.9) | 226.3 | 2,337.1 | (107.6) | 573.3 | 286.9 |
| Aquisitions, net of aquired cash and advances for | - | - | - | (157.3) | - | - | - |
| Contributed cash to Raízen's formation | - | - | - | - | (173.1) | - | - |
| Additions on Investments, Net of Cash Received | (3.7) | (12.7) | - | - | - | (99.1) | (0.9) |
| Additions on Property, Plant and Equipment | (513.9) | (312.6) | (533.0) | (2,291.6) | (491.5) | (243.3) | (346.3) |
| Biological Assets expenses | (194.6) | (198.1) | (174.8) | (745.6) | (217.2) | (117.9) | (107.0) |
| Cash Received on Sale of other Fixed Assets | 0.7 | 17.2 | 2.2 | 48.8 | - | 42.3 | 53.8 |
| Cash Flow from Investment Activities | (711.5) | (506.2) | (705.5) | (3,145.7) | (881.8) | (418.0) | (400.3) |
| Additions of Debt | 642.4 | 495.9 | 1,101.2 | 2,719.5 | 1,281.1 | 483.8 | 156.2 |
| Payments of Principal and Interest on Debt | (561.6) | (224.7) | (458.2) | (1,967.9) | (407.5) | (206.0) | (318.2) |
| Capital Increase | - | - | - | 4.0 | - | - | - |
| Capital Increase by noncontrolling interests | - | 403.3 | - | 400.0 | 139.9 | - | - |
| Treasury Stock | - | - | (15.2) | (15.2) | - | (46.9) | (1.4) |
| Dividends | - | (193.0) | - | (193.1) | - | (192.7) | - |
| Related Parties | - | - | - | 37.1 | - | - | - |
| Cash Flows from Financing Activities | 80.7 | 481.5 | 627.8 | 984.3 | 1,013.5 | 38.2 | (163.4) |
| Total Cash Flow | (23.5) | (66.5) | 148.5 | 175.7 | 24.1 | 193.5 | (276.8) |
| Cash & Equivalents, Beginning | 1,078.4 | 1,054.9 | 988.4 | 1,078.4 | 1,254.1 | 1,278.2 | 1,471.7 |
| Cash & Equivalents, Closing | 1,054.9 | 988.4 | 1,136.9 | 1,254.1 | 1,278.2 | 1,471.7 | 1,194.9 |
36 of 39
I. Cosan Limited
Statement of Income
| Income Statement | Jun'10 | Sept'10 | Dec'10 | Mar'11 | Jun'11 | Set'11 | Dec'11 | ||
| (in R$ million) | 1Q11 | 2Q11 | 3Q11 | FY11 | 1Q12 | 2Q12 | 3Q12 | ||
| (=) | Net Operating Revenue | 3,999.6 | 4,716.1 | 4,738.4 | 18,063.5 | 5,188.0 | 6,804.3 | 6,310.7 | |
| (-) | Cost of Goods Sold and Services Rendered | (3,522.7) | (3,995.2) | (4,160.0) | (15,150.1) | (4,600.0) | (6,042.4) | (5,670.9) | |
| (=) | Gross Profit | 476.9 | 720.9 | 578.5 | 2,913.4 | 588.0 | 761.9 | 639.8 | |
| (-) | Operating Income (Expenses): | (339.7) | (443.9) | (409.2) | (1,605.3) | 2,481.6 | (469.7) | (401.1) | |
| (-) | Selling | (216.1) | (265.5) | (271.9) | (1,026.0) | (261.2) | (295.3) | (270.4) | |
| (-) | General and Administrative | (121.3) | (139.3) | (133.7) | (545.5) | (150.5) | (159.5) | (160.3) | |
| (±) | Other Operating Income (Expenses), Net | (2.3) | (39.1) | (3.6) | (33.8) | 22.0 | 3.2 | 29.6 | |
| (±) | Joint Venture formation income (expenses) | - | - | - | - | 2,871.2 | (18.2) | - | |
| (=) | Operating Income (Loss) | 137.2 | 277.0 | 169.3 | 1,308.1 | 3,069.5 | 292.2 | 238.8 | |
| (±) | Non-Operating Income (Expenses): | (129.0) | 87.9 | (81.2) | (126.0) | 13.5 | (395.8) | (70.6) | |
| (±) | Financial Income (Expenses), Net | (134.8) | 85.6 | (89.0) | (151.1) | 11.6 | (394.5) | (70.6) | |
| (±) | Earnings (Losses) on Equity Investments | 5.8 | 2.4 | 7.8 | 25.2 | 2.0 | (1.3) | 0.0 | |
| (=) | Income (Loss) Before taxes | 8.2 | 364.9 | 88.1 | 1,182.2 | 3,083.1 | (103.6) | 168.1 | |
| (±) | Income and Social Contribution Taxes | (11.0) | (126.2) | (42.3) | (414.5) | (1,224.6) | 188.2 | (63.8) | |
| (±) | Minority Interest | (1.9) | (85.2) | (22.7) | (296.8) | (873.0) | (47.4) | (48.2) | |
| (=) | Net Income | (4.7) | 153.4 | 23.1 | 470.9 | 985.5 | 37.2 | 56.2 | |
37 of 39
Balance Sheet
| Balance Sheet | Jun'10 | Sept'10 | Dec'10 | Mar'11 | Jun'11 | Set'11 | Dec'11 |
| (in R$ million) | 1Q11 | 2Q11 | 3Q11 | FY11 | 1Q12 | 2Q12 | 3Q12 |
| Cash and Cash Equivalents | 1,083.4 | 1,009.0 | 1,155.6 | 1,271.8 | 1,295.3 | 1,482.9 | 1,283.4 |
| Restricted Cash | 51.3 | 76.0 | 276.2 | 187.9 | 60.2 | 52.5 | 88.1 |
| Trade Accounts Receivable | 619.1 | 760.0 | 657.5 | 594.9 | 825.2 | 983.7 | 1,022.3 |
| Derivative Financial Instruments | 144.5 | 166.0 | 180.0 | 55.7 | 60.2 | 29.4 | 59.6 |
| Inventories | 1,066.3 | 1,626.8 | 1,642.7 | 670.3 | 1,002.0 | 1,361.8 | 1,354.4 |
| Advances to Suppliers | 323.5 | 293.9 | 268.6 | 229.3 | 172.2 | 141.9 | 110.2 |
| Related Parties | 50.5 | 21.8 | 20.8 | 14.7 | 680.3 | 599.7 | 655.8 |
| Recoverable Taxes | 355.4 | 396.4 | 401.1 | 375.0 | 411.7 | 416.0 | 325.0 |
| Other Assets | 47.5 | 51.6 | 82.5 | 81.0 | 99.0 | 108.1 | 115.9 |
| Current Assets | 3,741.5 | 4,401.3 | 4,685.0 | 3,480.6 | 4,606.2 | 5,176.1 | 5,014.7 |
| Deferred Income and Social Contribution Taxes | 680.0 | 744.3 | 823.5 | 715.3 | 1,026.4 | 959.7 | 1,108.2 |
| Advances to Suppliers | 52.5 | 65.1 | 85.5 | 46.0 | 27.5 | 39.6 | 49.7 |
| Related Parties | 79.6 | 77.8 | 76.0 | 92.0 | 1,215.4 | 1,176.6 | 1,195.8 |
| Recoverable Taxes | 38.8 | 36.6 | 36.0 | 55.1 | 124.5 | 123.6 | 122.2 |
| Judicial Deposits | 168.9 | 173.6 | 180.9 | 218.4 | 372.5 | 491.1 | 495.6 |
| Other financial assets | 367.3 | 378.2 | 392.3 | 420.4 | 290.3 | 418.6 | 415.5 |
| Other Assets | 464.4 | 470.9 | 504.4 | 449.3 | 1,108.3 | 972.1 | 971.9 |
| Investments | 267.4 | 287.5 | 294.7 | 304.1 | 333.9 | 358.1 | 368.6 |
| Biological Assets | 932.8 | 873.6 | 894.8 | 1,561.1 | 795.1 | 717.0 | 767.9 |
| Property, Plant and Equipment | 6,360.3 | 6,432.0 | 6,799.9 | 7,980.5 | 8,260.0 | 7,928.8 | 7,835.2 |
| Intangible | 3,823.1 | 3,813.9 | 3,799.6 | 3,889.6 | 4,125.3 | 4,531.1 | 4,593.8 |
| Non-current Assets | 13,235.1 | 13,353.7 | 13,887.6 | 15,731.8 | 17,679.2 | 17,716.4 | 17,924.4 |
| Total Assets | 16,976.6 | 17,755.0 | 18,572.6 | 19,212.4 | 22,285.3 | 22,892.5 | 22,939.2 |
| Loans and Financings | 899.4 | 1,094.9 | 1,165.7 | 957.1 | 666.1 | 805.1 | 773.6 |
| Derivatives Financial Instruments | 37.4 | 96.1 | 379.0 | 132.3 | 94.3 | 29.3 | 15.7 |
| Trade Accounts Payable | 716.3 | 832.1 | 754.4 | 558.8 | 621.6 | 757.5 | 765.4 |
| Salaries Payable | 219.9 | 225.5 | 175.6 | 183.6 | 183.3 | 191.5 | 158.2 |
| Taxes and Social Contributions Payable | 197.4 | 239.2 | 218.8 | 245.3 | 247.1 | 328.9 | 282.4 |
| Dividendos a pagar | 44.0 | 2.2 | 2.0 | 72.2 | 82.9 | 9.1 | 8.7 |
| Related Parties | 120.1 | 66.0 | 74.6 | 41.2 | 186.8 | 163.2 | 228.5 |
| Other Liabilities | 190.0 | 199.2 | 181.1 | 190.4 | 273.8 | 307.3 | 215.9 |
| Current Liabilities | 2,424.4 | 2,755.1 | 2,951.2 | 2,380.8 | 2,355.9 | 2,591.8 | 2,448.5 |
| Loans and Financing | 5,322.7 | 5,310.8 | 5,961.7 | 6,274.9 | 3,699.4 | 4,407.8 | 4,589.9 |
| Taxes and Social Contributions Payable | 597.3 | 605.8 | 618.2 | 639.1 | 1,123.0 | 1,180.0 | 1,184.8 |
| Provision for Legal Proceedings | 625.0 | 642.9 | 650.1 | 666.3 | 940.8 | 975.8 | 1,026.7 |
| Earn-out provision | - | - | - | - | - | - | - |
| Related Parties | - | - | - | 4.4 | 371.2 | 546.3 | 468.5 |
| Pension Fund | 0.0 | 2.1 | 12.2 | 24.4 | 25.9 | 27.4 | 28.9 |
| Deferred Income and Social Contribution Taxes | 1,123.6 | 1,215.6 | 1,250.9 | 1,511.0 | 3,546.4 | 3,159.1 | 3,116.5 |
| Other Liabilities | 374.5 | 377.7 | 378.7 | 382.9 | 814.4 | 752.1 | 777.1 |
| Non-current Assets | 8,043.0 | 8,155.0 | 8,871.7 | 9,502.9 | 10,521.0 | 11,048.4 | 11,192.3 |
| Common stock | 5.3 | 5.3 | 5.3 | 5.3 | 5.3 | 5.3 | 5.3 |
| - | - | - | - | - | - | (109.4) | |
| Capital Reserve | 3,667.1 | 3,695.7 | 3,608.5 | 3,668.2 | 3,725.5 | 3,718.8 | 3,750.3 |
| Profits Reserve | - | - | - | - | 1,872.5 | 1,773.6 | (191.4) |
| Accumulated profits (losses) | 531.0 | 565.1 | 588.2 | 887.3 | - | - | 1,824.9 |
| Shareholders' Equity | 4,203.4 | 4,266.2 | 4,202.0 | 4,560.9 | 5,603.3 | 5,497.7 | 5,471.1 |
| Minority Shareholders' Interest | 2,305.9 | 2,578.7 | 2,547.7 | 2,767.8 | 3,805.0 | 3,754.5 | 3,827.2 |
| Shareholders' Equity | 6,509.3 | 6,844.9 | 6,749.7 | 7,328.7 | 9,408.4 | 9,252.2 | 9,298.3 |
| Total Shareholders' Equity and Liabilities | 16,976.6 | 17,755.0 | 18,572.6 | 19,212.4 | 22,285.3 | 22,892.5 | 22,939.2 |
38 of 39
Statement of Cash Flow
| Statement of Cash Flows | Jun'10 | Sept'10 | Dec'10 | Mar'11 | Jun'11 | Set'11 | Dec'11 |
| (in R$ million) | 1Q'11 | 2Q'11 | 3Q'11 | FY'11 | 1Q'12 | 2Q'12 | 3Q'12 |
| Net Income | (4.7) | 153.4 | 23.1 | 470.9 | 985.2 | 37.2 | 56.2 |
| Non-cash Adjustments: | - | - | - | - | - | - | - |
| Depreciation & Amortization | 290.9 | 400.0 | 380.9 | 1,359.0 | 303.7 | 365.5 | 254.7 |
| Biological Assets | 42.2 | 28.7 | (21.2) | (381.9) | (20.9) | 38.8 | 20.0 |
| Earnings (Losses) from Equity Investments | (5.8) | (2.4) | (7.8) | (25.2) | (1.9) | 1.3 | 0.0 |
| Stock option | - | - | - | - | - | - | 4.8 |
| Losses (Gains) in Fixed Assets Disposals | 3.1 | (11.8) | 2.1 | (35.3) | 17.0 | (11.5) | (27.6) |
| Goodwill write off aviation business | - | - | |||||
| Deferred Income and Social Contribution Taxes | (0.7) | 104.4 | 16.4 | 329.1 | 1,197.8 | (277.7) | 69.7 |
| Judicial demands' provision | 10.7 | 18.9 | (3.3) | 26.9 | 33.1 | (33.1) | 118.9 |
| Minority Shareholders' Interest | 1.9 | 85.2 | 22.7 | 296.8 | 872.9 | 47.4 | 48.2 |
| Interest, monetary and exchange variations, net | 167.5 | (64.9) | 52.5 | 238.5 | (27.6) | 569.6 | 136.4 |
| Joint Venture formation income (expenses) | - | - | - | - | (2,871.2) | 18.2 | - |
| Capital gains | - | (220.9) | - | - | - | - | - |
| Other Non-cash Items | 19.4 | 197.0 | (0.9) | 7.5 | 3.5 | 13.4 | (4.6) |
| Variation on Assets and Liabilities | - | - | - | - | - | - | - |
| Trade Accounts receivable | 153.3 | (153.4) | 135.5 | 164.7 | (123.3) | (105.6) | (38.6) |
| Restricted Cash | - | - | - | (143.0) | 113.5 | 7.7 | (35.5) |
| Judicial Deposits | - | - | - | - | (108.1) | 108.1 | - |
| Inventory | (304.0) | (440.8) | (19.4) | 84.6 | (326.6) | (311.8) | (34.7) |
| Taxes recoverable | - | - | - | - | - | - | (17.1) |
| Related Parties | - | - | - | - | (1,747.4) | 142.6 | (87.8) |
| Advances to Suppliers | (76.7) | 16.9 | 4.9 | 16.8 | (122.1) | 18.2 | 21.5 |
| Trade Accounts payable | 146.9 | 115.8 | (77.7) | (32.4) | 241.2 | 125.0 | 8.0 |
| Salaries payable | 78.3 | 5.6 | (49.9) | 36.2 | 110.9 | 5.1 | (33.3) |
| Derivative Financial Instruments | 70.7 | (214.6) | (108.4) | 13.3 | 908.8 | (1,050.0) | (4.4) |
| Taxes and Social Contributions Payable | (29.0) | 34.2 | (23.2) | (50.1) | (79.2) | 1,003.4 | (59.0) |
| Other assets and liabilities, net | 39.6 | (91.9) | (102.0) | (49.2) | 532.4 | (120.7) | (101.3) |
| - | - | ||||||
| Cash Flow from Operating Activities | 603.4 | (40.4) | 224.3 | 2,327.2 | (108.2) | 591.0 | 294.5 |
| - | |||||||
| - | - | ||||||
| Aquisitions, net of aquired cash and advances for future capital increases | - | - | - | (157.3) | - | - | - |
| Contributed cash to Raízen's formation | - | - | - | - | (173.1) | 0.0 | - |
| Dividends | - | - | - | - | - | 100.6 | (100.6) |
| Additions on Investments, Net of Cash Received | (3.7) | (12.7) | - | - | - | (99.1) | (0.9) |
| Additions on Property, Plant and Equipment | (513.9) | (312.6) | (533.0) | (2,291.6) | (491.5) | (243.3) | (346.3) |
| Sugarcane planting and growing costs | (194.6) | (198.1) | (174.8) | (745.6) | (217.2) | (117.9) | (107.0) |
| Cash Received on Sale of other Fixed Assets | 0.7 | 17.2 | 2.2 | 48.8 | - | 42.3 | 53.8 |
| Cash Flow from Investment Activities | (711.5) | (506.2) | (705.5) | (3,145.7) | (881.8) | (317.3) | (500.9) |
| - | - | ||||||
| - | - | ||||||
| Additions of Debt | 642.4 | 495.9 | 1,101.2 | 2,719.5 | 1,281.1 | 483.8 | 335.9 |
| Payments of Principal and Interest on Debt | (561.6) | (224.7) | (458.2) | (1,971.6) | (407.5) | (206.0) | (318.2) |
| Capital Increase | - | - | - | 2.8 | - | - | - |
| Capital Increase by noncontrolling interests | - | 403.3 | - | 400.0 | 139.9 | 0.0 | - |
| Treasury Stock | - | - | (15.2) | (15.2) | - | (54.4) | (101.2) |
| Dividends | - | (192.4) | - | (193.1) | - | (328.8) | 95.8 |
| Acquisition of shares of subsidiary | - | - | - | 37.1 | - | - | (4.6) |
| Exchange rate variation excluding Cash and Cash Equivalents | 0.0 | (9.9) | 0.2 | 19.3 | (0.4) | ||
| Cash Flows from Financing Activities | 80.8 | 472.2 | 627.9 | 979.5 | 1,013.5 | (86.2) | 7.2 |
| - | - | ||||||
| Total Cash Flow | (27.4) | (74.4) | 146.7 | 161.0 | 23.5 | 187.6 | (199.2) |
| - | - | ||||||
| Cash & Equivalents, Beginning | 1,110.8 | 1,083.4 | 1,009.0 | 1,110.8 | 1,271.8 | 1,295.3 | 1,482.9 |
| Cash & Equivalents, Closing | 1,083.4 | 1,009.0 | 1,155.6 | 1,271.8 | 1,295.3 | 1,482.9 | 1,283.4 |
39 of 39
SIGNATURES
Pursuant to the requirements of the Securities Exchange Act of 1934, the registrant has duly caused this report to be signed on its behalf by the undersigned, thereunto duly authorized.
| COSAN LIMITED | ||||||
| Date: | February 10, 2012 | By: | /s/ Marcelo Eduardo Martins | |||
| Name: | Marcelo Eduardo Martins | |||||
| Title: | Chief Financial Officer and Investor Relations Officer | |||||