FORM 6-K
SECURITIES AND EXCHANGE COMMISSION
Washington, D.C. 20549
Report of Foreign Issuer
Pursuant to Rule 13a-16 or 15d-16
of the Securities Exchange Act of 1934
For the month of June, 2012
Commission File Number: 1-33659
COSAN LIMITED
(Translation of registrant’s name into English)
Av. Juscelino Kubitschek, 1726 – 6th floor
São Paulo, SP 04543-000 Brazil
(Address of principal executive offices)
Indicate by check mark whether the registrant files or will file annual reports under cover of Form 20-F or Form 40-F:
| Form 20-F | X | Form 40-F |
Indicate by check mark if the registrant is submitting the Form 6-K in paper as permitted by Regulation S-T Rule 101(b)(1):
| Yes | No | X |
Indicate by check mark if the registrant is submitting the Form 6-K in paper as permitted by Regulation S-T Rule 101(b)(7):
| Yes | No | X |
COSAN LIMITED
Item | |
| 1. | Financial Letter for the 4th Quarter and Fiscal Year 2012 |
| 2. | Cosan Limited – Consolidated Financial Statements March 31, 2012 and 2011 |
| 3. | Cosan S.A. Indústria e Comércio – Consolidated Financial Statements March 31, 2012 and 2011 |
Item 1
Important transformations and
solid results marked FY12
São Paulo, May 30, 2012 – COSAN LIMITED (NYSE: CZZ; BM&FBovespa: CZLQ11) and COSAN S.A. INDÚSTRIA E COMÉRCIO (BM&FBovespa: CSAN3) announce today their results for the fourth quarter and fiscal year 2012 (4Q12 and FY12), ended March 31, 2012. The results for 4Q12 and FY12 are consolidated in accordance with the accounting practices adopted in Brazil (IFRS).
| Marcelo Martins CFO & IRO Guilherme Machado IR Manager Phillipe Casale IR Analyst ri@cosan.com.br www.cosan.com.br/ir | 4Q12 and FY12 Highlights | |||||||||
| ● | Consolidated revenue grows 33.4% to R$ 24.1 billion. | |||||||||
| ● | Raízen Combustíveis reaches EBITDA margin record of R$70.5/cbm in 4Q12 (excluding non-recurring effects) | |||||||||
| ● | Raízen Energia records EBITDA margin above 30% for the year | |||||||||
| ● | Growth of 27.7% in Rumo’s net revenue for FY12 | |||||||||
| ● | Cosan Lubrificantes e Especialidades continues internationalization process and acquires operation in the United Kingdom | |||||||||
| Summary of Financial Information – Cosan Consolidated | ||||||||||
| 4Q12 | 4Q11 | Amounts in R$ MM | FY12 | FY11 | ||||||
| 5,793.9 | 4,609.3 | Net Operating Revenue | 24,096.9 | 18,063.5 | ||||||
| 642.1 | 1,137.1 | Gross Profit | 2,631.9 | 2,913.4 | ||||||
Definitions: 4Q12 – quarter ended March 31, 2012 4Q11 – quarter ended March 31, 2011 FY12 – fiscal year beginning on April 1, 2011 and closing on March 31, 2012 FY11 – fiscal year beginning on April 1, 2010 and closing on March 31, 2011 | 11.1% | 24.7% | Gross Margin (%) | 10.9% | 16.1% | |||||
| 148.4 | 725.8 | Operating Profit | 4,195.9 | 1,312.6 | ||||||
| 367.4 | 1,029.5 | EBITDA | 5,338.7 | 2,672.3 | ||||||
| 6.3% | 22.3% | EBITDA Margin (%) | 22.2% | 14.8% | ||||||
| 467.8 | 1,029.5 | Adjusted EBITDA¹ | 2,142.1 | 2,672.3 | ||||||
| 8.1% | 22.3% | Adjusted EBITDA Margin (%) | 8.9% | 14.8% | ||||||
| 148.8 | 486.8 | Net Income before Minority Shareholders | 2,644.8 | 776.6 | ||||||
| 149.6 | 480.9 | Net Income | 2,605.8 | 771.6 | ||||||
| 2.6% | 10.4% | Net Margin (%) | 10.8% | 4.3% | ||||||
| 613.3 | 1,290.7 | CAPEX2 | 2,136.5 | 3,037.2 | ||||||
 | 3,081.7 | 5,262.7 | Net Debt | 3,081.7 | 5,262.7 | |||||
| 9,616.4 | 6,784.3 | Equity and Non-controlling Interests | 9,616.4 | 6,784.3 | ||||||
Note 1: Net of the effects of Raízen’s formation Note 2: Net of acquisition of interest in other companies and of cash received from disinvestment | ||||||||||

Message from the CEO
The fiscal year of 2011/2012 was transformational for Cosan in several aspects.
We achieved significant results and underwent major changes in our business profile which have made us more resilient to market adversities.
In June of 2011 we completed the formation of Raízen, our partnership with Shell. After 10 months of operations, Raízen has presented some impressive growth in its results.
In July of 2011 we transformed Cosan Alimentos into an independent company, shortly after we acquired that business from Raízen. Cosan Lubrificantes & Especialidades turned to international markets with the acquisition of operations in Bolivia, Uruguay and Paraguay in October of 2011 and, in March of 2012, it signed an agreement to acquire the UK based company Comma Oil and Chemicals Limited, a subsidiary of ExxonMobil.
Our strategy is to be a leading Brazilian group on the Energy and Infrastructure businesses. Towards this end, in February of 2012, we announced our intention to buy a stake in the controlling block of America Latina Logística – ALL and in May of 2012, we signed the final agreement for the acquisition of BG Group’s interest in Comgás. As part of our strategy of focusing on these core businesses, we entered into a partnership with Camil, where Cosan Alimentos will be merged with a company that seeks to become a leader in the Brazilian food industry. This partnership will create a powerhouse in the sugar, rice and canned fish businesses. We believe that we can contribute to Camil’s governance but the company’s management will remain under Camil’s current controlling group, which has an unquestionable track record in the food retail business.
Cosan believes three important factors could contribute to create value in all of its operations: (1) optimizing its operating efficiencies; (2) capturing opportunities to grow organically its businesses; and (3) maximizing investments by using its holdings in the companies in which it participates.
Through these recent strategic movements we reaffirm our commitment with value creation, as well as responsible growth. Our main focus is to balance return on invested capital with growth in dividend yields, which will grow for the third consecutive year.
With these new investment opportunities we will vigorously pursue a higher level of value creation for our investors.
Marcos Marinho Lutz
CEO
2
A. Business Units
As we did in previous quarters, we dedicate a specific section to each business unit with key production data and analysis of its results, from Net Revenue to EBITDA.
Our business units are as follows:
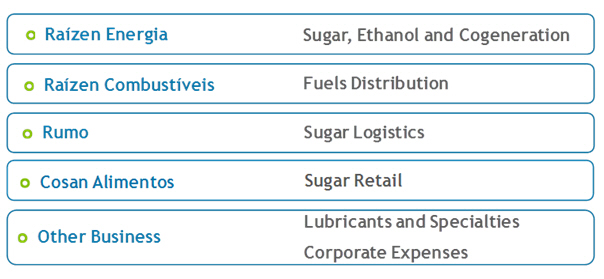
3
Below we present the results by business unit for the fourth quarter and crop year 2011/2012 for all Cosan Group’s business units, as mentioned above. All information reflects 100% of our business units’ financial performance, regardless of Cosan’s interest in them. Specifically for FY12, which represents April of 2011 to March of 2012, Raízen Combustíveis and Cosan Alimentos results are presented on a pro forma basis so as to allow for comparability.
Results by Business Unit Amounts in R$ MM | Raízen Energia | Raízen Combustíveis | 4Q12 Cosan Alimentos | Rumo | Other Business | |||||||||||||||
| Net Operating Revenue | 1,193.2 | 9,982.0 | 199.2 | 74.3 | 270.9 | |||||||||||||||
| Cost of Goods and Services | (757.1 | ) | (9,316.7 | ) | (182.6 | ) | (77.4 | ) | (193.0 | ) | ||||||||||
| Gross Profit | 436.1 | 665.3 | 16.6 | (3.1 | ) | 77.9 | ||||||||||||||
| Gross Margin (%) | 36.6 | % | 6.7 | % | 8.3 | % | -4.2 | % | 28.8 | % | ||||||||||
| Selling Expenses | (77.6 | ) | (390.8 | ) | (25.3 | ) | - | (38.3 | ) | |||||||||||
| General and Administrative Expenses | (136.6 | ) | (111.2 | ) | (3.5 | ) | (11.7 | ) | (43.0 | ) | ||||||||||
| Other Operating Revenues (Expenses) | 8.7 | 89.0 | 6.0 | 9.0 | 5.7 | |||||||||||||||
| Effects of Raízen's Formation | - | - | - | - | (100.3 | ) | ||||||||||||||
| Depreciation and Amortization | 258.0 | 98.6 | 0.5 | 26.5 | 13.8 | |||||||||||||||
| EBITDA | 488.7 | 350.9 | (5.7 | ) | 20.6 | (84.2 | ) | |||||||||||||
| EBITDA Margin (%) | 41.0 | % | 3.5 | % | -2.9 | % | 27.8 | % | -31.1 | % | ||||||||||
| EBITDA Margin (R$/cbm) | - | 67.6 | - | - | - | |||||||||||||||
| Adjusted EBITDA | 488.7 | 350.9 | (5.7 | ) | 20.6 | 16.1 | ||||||||||||||
| Adjusted EBITDA Margin (%) | 41.0 | % | 3.5 | % | -2.9 | % | 27.8 | % | 5.9 | % | ||||||||||
Results by Business Unit Amounts in R$ MM | Raízen Energia | Raízen Combustíveis (Pro forma) | FY12 Cosan Alimentos (Pro Forma) | Rumo | Other Business | |||||||||||||||
| Net Operating Revenue | 7,247.7 | 39,691.8 | 941.6 | 572.0 | 1,065.5 | |||||||||||||||
| Cost of Goods and Services | (5,578.3 | ) | (37,455.7 | ) | (752.5 | ) | (394.1 | ) | (732.9 | ) | ||||||||||
| Gross Profit | 1,669.4 | 2,236.1 | 189.1 | 177.9 | 332.6 | |||||||||||||||
| Gross Margin (%) | 23.0 | % | 5.6 | % | 20.1 | % | 31.1 | % | 31.2 | % | ||||||||||
| Selling Expenses | (511.4 | ) | (1,216.7 | ) | (110.6 | ) | - | (187.5 | ) | |||||||||||
| General and Administrative Expenses | (454.0 | ) | (405.7 | ) | (17.7 | ) | (41.6 | ) | (132.8 | ) | ||||||||||
| Other Operating Revenues (Expenses) | (18.2 | ) | 283.3 | 6.8 | 19.5 | (11.9 | ) | |||||||||||||
| Effects of Raízen's Formation | - | - | - | - | 3,196.6 | |||||||||||||||
| Depreciation and Amortization | 1,550.0 | 377.1 | 1.7 | 57.3 | 48.4 | |||||||||||||||
| EBITDA | 2,235.7 | 1,304.9 | 69.3 | 213.2 | 3,245.3 | |||||||||||||||
| EBITDA Margin (%) | 30.8 | % | 3.3 | % | 7.4 | % | 37.3 | % | 304.6 | % | ||||||||||
| EBITDA Margin (R$/cbm) | - | 62.4 | - | - | - | |||||||||||||||
| Adjusted EBITDA | 2,235.7 | 1,304.9 | 69.3 | 213.2 | 48.7 | |||||||||||||||
| Adjusted EBITDA Margin (%) | 30.8 | % | 3.3 | % | 7.4 | % | 37.3 | % | 4.6 | % | ||||||||||
4
B.1 Raízen Energia
The following are the results for Raízen Energia, whose core business is the production and sales of a variety of products derived from sugarcane, including raw sugar (Very High Polarization - VHP), anhydrous and hydrous ethanol, as well as activities related to energy cogeneration from sugarcane bagasse.
Production Figures
In 4Q12, Raízen Energia operated 24 sugar, ethanol and energy cogeneration mills, with a sugarcane crushing capacity of 65 million tonnes of sugarcane per crop year.
| Operational Figures | |||||||||||||||
| 4Q12 | 4Q11 | FY12 | FY11 | ||||||||||||
| - | 77 | Crushed Sugarcane | 52,958 | 54,238 | |||||||||||
| - | - | Own (‘000 tonnes) | 26,528 | 27,400 | |||||||||||
| - | 77 | Suppliers (‘000 tonnes) | 26,430 | 26,838 | |||||||||||
| - | 136.1 | Sugarcane TSR (kg/tonne) | 136.5 | 138.5 | |||||||||||
| - | - | Mechanization (%) | 85.9 | % | 79.5 | % | |||||||||
| Production | |||||||||||||||
| - | 3 | Sugar | 3,969 | 3,923 | |||||||||||
| - | 2 | Raw Sugar (‘000 tonnes) | 2,426 | 2,517 | |||||||||||
| - | 1 | White Sugar (‘000 tonnes) | 1,543 | 1,406 | |||||||||||
| - | 3 | Ethanol | 1,921 | 2,202 | |||||||||||
| - | - | Anhydrous Ethanol (‘000 cbm) | 688 | 686 | |||||||||||
| - | 3 | Hydrous Ethanol (‘000 cbm) | 1,233 | 1,516 | |||||||||||
The final balance of the 2011/2012 crop in Brazil’s Central-South region shows a crop disruption of 11.4% compared to 2010/2011, according to data from UNICA. Also, only 10 production units were still operating in the first fifteen days of January.
The 24 mills of Raízen Energia had already stopped operating by the end of November, and did not record crushing activities in 4Q12. In FY12, crushing totaled 53 million tonnes, a decrease of 2.4% compared to FY11, due to adverse weather conditions that severely affected the Central-South region in the period.
The level of harvesting mechanization for Raízen’s sugarcane reached 85.9% in FY12, reflecting the investments made to improve agricultural efficiency. Drought affected the sugarcane in the beginning and at the end of the harvest season in FY12, resulting in a sugarcane TSR level of 136.5 kg/ton, a decrease of 1.4% compared to FY11 (138.5 kg/ton).
For the second year in a row, Raízen Energia has renewed its sugarcane fields (own sugarcane) at a rate of more than 20%, lowering the average age of the sugarcane to 3.4 years. Raízen Energia reached a market share of 10.7% in the Central-South region, considering effective crushing at the end of the harvest. Raízen Energia’s production mix in FY12 was more concentrated in sugar, which account for approximately 56% of the sugarcane crushed in the period.
5
Net Revenue
| 4Q12 | 4Q11 | Net Revenue Breakdown Amounts in R$ MM | FY12 | FY11 | |||||||||||
| 1,193.2 | 1,674.0 | Net Operating Revenue | 7,247.7 | 6,389.2 | |||||||||||
| 665.6 | 985.1 | Sugar Sales | 3,912.8 | 3,853.4 | |||||||||||
| 258.8 | 372.0 | Domestic Market | 1,217.4 | 1,387.3 | |||||||||||
| 406.9 | 613.2 | Foreign Market | 2,695.4 | 2,466.2 | |||||||||||
| 501.5 | 666.7 | Ethanol Sales | 2,871.5 | 2,203.7 | |||||||||||
| 364.0 | 641.0 | Domestic Market | 2,245.1 | 1,958.9 | |||||||||||
| 137.5 | 25.8 | Foreign Market | 626.5 | 244.8 | |||||||||||
| 1.3 | 2.3 | Energy Cogeneration | 235.1 | 186.0 | |||||||||||
| 24.8 | 19.8 | Other Products and Services | 228.2 | 146.0 | |||||||||||
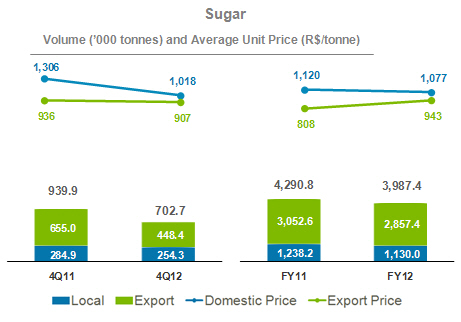
Raízen Energia recorded net revenue of R$1.2 billion in 4Q12, a decrease of 28.7% over the R$1.7 billion in 4Q11. This reduction is mainly explained by lower volumes of sugar and ethanol sold in 4Q12 (down 25.2% and 23.4% respectively) as compared to 4Q11.
Year-on-year, however, net revenue rose 13.4% from R$6.4 billion in FY11 to R$7.2 billion in FY12 as the result of increased revenue from all products and services due to well-designed strategies to anticipate market changes.
Sugar Sales
Revenue from sugar sales rose 1.5% in FY12 over FY11, totaling R$3,912.8 million, representing 54% of Raízen Energia’s total net revenue.
Quarter-on-quarter, net revenue from sugar sales dropped 32.4% as compared to the R$985.1 million in 4Q11 to R$665.6 million in 4Q12.
This R$319.5 million decrease in 4Q12 was due to the following factors:
| ● | A decrease of 25.2% in the total volume of sugar sold due to advanced sales to the foreign market in FY12, resulting in a total reduction of R$224.8 million, mostly concentrated in 4Q12. |
| ● | A decrease in the average sugar sales price, which was down 9.6% from R$1,048.1/tonne in 4Q11 to R$947.3/tonne in 4Q12, causing a R$94.7 million drop in total revenue. |
The sugar sales mix continued to be concentrated in exports in 4Q12 due to prices on foreign markets more attractive than on the local market, and exports represented 68.8% of total revenue from sugar sales in FY12.
6
Sugar Inventories
| Sugar Inventories | ||||||||
| 4Q12 | 4Q11 | |||||||
| ´000 tonne | 156.6 | 97.7 | ||||||
| R$'MM | 107.0 | 77.6 | ||||||
| R$/tonne | 682.9 | 794.3 | ||||||
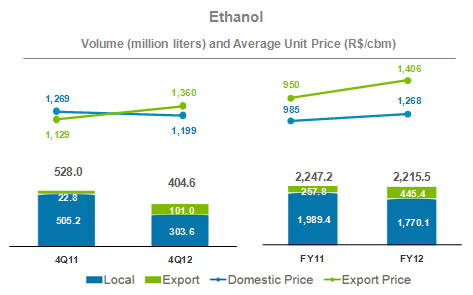
Ethanol Sales
Raízen Energia’s net revenue from ethanol sales totaled R$2.9 billion in FY12, up 30.3% over FY11 (R$2.2 billion), mostly driven by the 32.2% average price increase to R$1,296.1/cbm in FY12, as compared to R$980.6/cbm in FY11.
Quarter-on-quarter, net revenue dropped 24.8% from R$666.7 million in 4Q11 to R$501.5 million in 4Q12.
This R$165.2 million decrease is basically due to the following factors:
| ● | A 1.9% reduction in the average ethanol sales price from R$1,262.7/cbm in 4Q11 to R$1,239.2/cbm in 4Q12, representing a decrease of R$12.4 million in net revenue from ethanol sales. |
| ● | A 23.4% drop in the volume of ethanol sold in 4Q12 versus 4Q11, causing net revenue to fall R$152.9 million. |
This decrease in ethanol prices in 4Q12 was due to the greater supply of the product in the Brazilian market vis-à-vis the demand expected for the quarter, driven by higher imports than the necessary to supply the domestic market with anhydrous ethanol to be blended in gasoline (since October of 2011 this mix has been 20%).
7
Ethanol Inventories
| Ethanol Inventories | ||||||||
| 4Q12 | 4Q11 | |||||||
| ´000 cbm | 79.1 | 49.6 | ||||||
| R$'MM | 87.9 | 42.8 | ||||||
| R$/cbm | 1,111.3 | 862.9 | ||||||
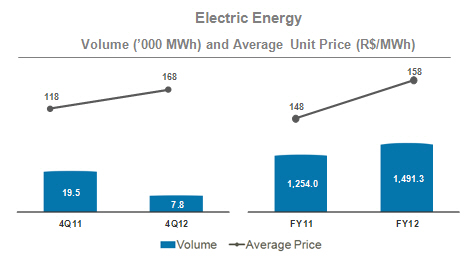
Energy Cogeneration
In FY12, net revenue from energy sales were R$235.1 million, representing an increase of 26.4% over FY11’s R$186 million. Volume sold reached 1,491.3 thousand MWh at an average price of R$157.7/MWh.
The price of energy sold grew from FY11 to FY12 and the volume of energy sold rose 18.9% in the period, chiefly due to the operational start-up of the cogeneration plants at the Jataí, Barra, Univalem and Ipaussu units that added 258 MW to Raízen Energia’s total capacity. Of Raízen Energia’s 24 mills, 11 sell energy from cogeneration.
8
Other Products and Services
Raízen Energia recorded revenue from other products and services of R$228.2 million in FY12, an increase of 56.3% over FY11, when revenue amounted to R$146.0 million. These revenues derive basically from the sale of steam, molasses, and raw materials to service providers in the agricultural industry.
Cost of Goods Sold
| 4Q12 | 4Q11 | COGS per Product Amounts in R$ MM | FY12 | FY11 | |||||||||||
| (757.1 | ) | (769.9 | ) | Cost of Goods Sold (COGS) | (5,578.3 | ) | (4,400.5 | ) | |||||||
| (430.9 | ) | (657.1 | ) | Sugar | (2,802.1 | ) | (2,609.1 | ) | |||||||
| (405.3 | ) | (523.7 | ) | Ethanol | (2,454.0 | ) | (2,016.1 | ) | |||||||
| (0.1 | ) | (1.4 | ) | Energy Cogeneration | (86.1 | ) | (102.3 | ) | |||||||
| 79.3 | 412.3 | Other | (236.0 | ) | 327.1 | ||||||||||
| Average Unitary Costs³ | |||||||||||||||
| (458.9 | ) | (593.8 | ) | Cash cost of sugar (R$/tonne) | (523.8 | ) | (496.2 | ) | |||||||
| (714.7 | ) | (717.9 | ) | Cash cost of ethanol (R$/’000 liters) | (783.9 | ) | (645.0 | ) | |||||||
Note 3: Average unit costs represent the cash cost, which is net of plantation and cultivation area depreciation and amortization, agricultural depreciation (machinery and equipment), industrial depreciation, and harvest off-season maintenance.
Raízen Energia's cost of goods sold is reported together with the average unit costs, net of the effects of depreciation and amortization (cash cost).
Cost of goods sold fell 1.7% from R$769.9 million in 4Q11 to R$757.1 million in 4Q12 due to the lower volumes of sugar and ethanol produced, which were down 24.4% in the period (sugar equivalent).
Cost of goods sold amounted to R$5.6 billion in FY12, an increase of 26.8% over FY11. This increase was mainly due to the rise in the average price of goods sold in the period, especially sugar and ethanol—up 5.6% and 21.5%, respectively.
The key factors that contributed to the rise in the cost of goods sold by Raízen Energia were:
| ● | A 24.8% increase in the TSR/kg cost, up from R$0.4022 in FY11 to R$0.5018 in FY12, directly impacting the cost of sugarcane from suppliers and the cost of land leases. |
| ● | An increase in the cost of proprietary sugarcane due to the rise in leasing costs—up from R$10.4 per tonne of sugarcane in FY11 to R$17 per tonne in FY12. |
| ● | A decrease in the TSR level to 136.5 kg/tonne in FY12, compared to 138.5 kg/ton in FY11. |
The improved productivity of the sugarcane fields—represented by a higher TCH level (tonne of cane per hectare), which was 76 in FY12, up from 73.8 in FY11—partially offset the effects mentioned above.
9
Gross Profit
| Gross Profit and Gross Margin per Product | |||||||||||||||
| 4Q12 | 4Q11 | Amounts in R$ MM | FY12 | FY11 | |||||||||||
| 436.1 | 904.1 | Gross Profit | 1,669.4 | 1,988.7 | |||||||||||
| 234.7 | 328.0 | Sugar | 1,110.7 | 1,244.3 | |||||||||||
| 35.3 | % | 33.3 | % | Sugar Gross Margin (%) | 28.4 | % | 32.3 | % | |||||||
| 51.6 | % | 43.3 | % | Sugar (Cash) Gross Margin (%) | 46.6 | % | 44.7 | % | |||||||
| 96.1 | 143.1 | Ethanol | 417.5 | 187.7 | |||||||||||
| 19.2 | % | 21.5 | % | Ethanol Gross Margin (%) | 14.5 | % | 8.5 | % | |||||||
| 42.3 | % | 43.1 | % | Ethanol (Cash) Gross Margin (%) | 39.5 | % | 34.2 | % | |||||||
| 1.2 | 0.9 | Energy Cogeneration | 149.0 | 83.6 | |||||||||||
| 104.1 | 432.1 | Other | (7.8 | ) | 473.1 | ||||||||||
In FY12, Raízen Energia recorded Gross Profit of R$1.7 billion, a decrease of 16.1% from the R$2 billion reported in FY11. Gross Profit decreased by 51.8% in the quarter.
As explained above, this reduction in Gross Profit in FY12 is due to a steeper rise in the cost of goods sold, which was up 26.8% while net income rose by only 13.4% in the period.
Gross cash margins for both sugar and ethanol were up in FY12 as compared to FY11, net of depreciation and amortization.
Selling, General & Administrative Expenses
| Selling, General and | |||||||||||||||
| 4Q12 | 4Q11 | Amounts in R$ MM | FY12 | FY11 | |||||||||||
| (77.6 | ) | (134.2 | ) | Selling Expenses | (511.4 | ) | (568.3 | ) | |||||||
| (136.6 | ) | (107.0 | ) | General and Administrative Expenses | (454.0 | ) | (393.0 | ) | |||||||
Raízen Energia’s selling expenses amounted to R$77.6 million in 4Q12, down 42.2% year-on-year. Selling expenses dropped 10% in FY12 in the year, due to savings with freight and commissions following the transfer of the sugar trading activities in the domestic retail market from to Cosan Alimentos.
General and administrative expenses were R$136.6 million in 4Q12, up 27.7% over 4Q11, and R$454 million in FY12, up 15.6% over FY11. This increase reflects the current corporate structure of Raízen Energia and expenses with services provided by the CSC.
EBITDA
| EBITDA | |||||||||||||||
| 4Q12 | 4Q11 | Amounts in R$ MM | FY12 | FY11 | |||||||||||
| 488.7 | 910.6 | EBITDA | 2,235.7 | 2,131.9 | |||||||||||
| 41.0 | % | 54.4 | % | EBITDA Margin (%) | 30.8 | % | 33.4 | % | |||||||
Raízen Energia recorded EBITDA of R$488.7 million in 4Q12 with EBITDA margin at 41%. EBITDA totaled R$2.2 billion in FY12, up 4.9% over FY11. EBITDA margin reached 30.8% in FY12, down 2.6 p.p. as compared to FY11.
10
Hedge
Volume positions and fixed sugar prices agreed with traders or through derivative financial instruments as of March 31, 2012, and foreign exchange derivatives contracted by Raízen Energia to hedge future cash flows, are as follows:
| Summary of Hedge Operations at March 31th , 2012 | ||||
| 2011 / 2012 | ||||
| Sugar | ||||
| NY #11 | ||||
| Volume (‘000 tonnes) | 1,163.7 | |||
| Average Price (¢US$/lb) | 24.5 | |||
| London #5 | ||||
| Volume (‘000 tonnes) | 1.3 | |||
| Average Price (US$/lb) | 653.0 | |||
| Exchange rate | ||||
| US$ | ||||
| Volume (US$ million) | 585.25 | |||
| Average Price (R$/US$) | 1.90 | |||
| Volume to be sold / Hedged (‘000 tonnes) | 2,864.6 | |||
| % Sale Protected Sugar / Fixed | 40.7 | % | ||
Impacts of Hedge Accounting
Raízen Energia has been using cash flow hedge accounting for certain derivative financial instruments to hedge against the price risk for sugar and against the foreign exchange risk for revenues from sugar exports.
The table below shows the expected transfer of gain/loss balances from shareholders’ equity as at March 31, 2012 to the net operating income of Raízen Energia4 in future years, broken down by coverage period for the following hedging instruments:
| Expiration Period - (R$MM) | ||||||||||||||
| Derivative | Market | Risk | 2011/12 | 2012/13 | Total | |||||||||
| Futures | OTC/NYBOT | NY#11 | 40.5 | 0.6 | 41.1 | |||||||||
| NDF | OTC/CETIP | USD | 1.7 | - | 1.7 | |||||||||
| (=) Hedge Accounting impact | 42.2 | 0.6 | 42.8 | |||||||||||
| (-) Deferred Income Tax | (14.4 | ) | (0.2 | ) | (14.5 | ) | ||||||||
| (=) Asset Valuation Adjustment | 27.9 | 0.4 | 28.2 | |||||||||||
Note 4: The table above shows 100% of the hedge accounting gains/losses reclassified to shareholders’ equity. As Cosan proportionately consolidates Raízen Energia, these effects will impact only 50% of the consolidated results.
11
Investments
| CAPEX | |||||||||||||||
| 4Q12 | 4Q11 | Amounts in R$ MM | FY12 | FY11 | |||||||||||
| 848.4 | 954.6 | Total CAPEX | 2,577.9 | 2,414.4 | |||||||||||
| 664.8 | 687.2 | Operating CAPEX | 1,835.7 | 1,711.4 | |||||||||||
| 222.7 | 177.5 | Biological assets | 942.7 | 745.0 | |||||||||||
| 321.0 | 336.0 | Inter-harvest Maintenance Costs | 605.5 | 514.2 | |||||||||||
| 70.2 | 97.6 | SSMA and Sustaining | 149.2 | 237.5 | |||||||||||
| 50.9 | 76.2 | Mechanization | 138.3 | 214.7 | |||||||||||
| 183.5 | 267.4 | Expasion CAPEX | 742.2 | 702.9 | |||||||||||
| 109.0 | 88.9 | Cogeneration Projects | 462.5 | 287.6 | |||||||||||
| 0.2 | 6.9 | Greenfield | 0.4 | 66.9 | |||||||||||
| - | 4.6 | Expasion | 99.4 | 87.2 | |||||||||||
| 74.3 | 166.9 | Others | 179.8 | 261.2 | |||||||||||
Raízen Energia recorded Capex of R$848.4 million in 4Q12, a decrease of 11.1% year-on-year (R$954.6 million in 4Q11). Capex totaled R$2.6 billion in FY12, up 6.8% from the R$2.4 billion reported in FY11.
Investments in biological assets totaled R$942.7 million in FY12 and are in line with Raízen Energia’s strategy of renewing at least 20% of its sugarcane fields for the 2011/2012 crop year and of expanding planted areas.
In 4Q12 we accelerated our HSE (health, safety and the environment) investment plan, totaling R$59.3 million, and advanced off-season maintenance investments by R$194 million. On the cogeneration front, we continued to invest in Barra, Univalem and Ipaussu units, totaling R$109 million.
We also recorded R$180 million in “other investments” in FY12, including the capitalization of loan interest for machinery and equipment, and property, plant and equipment under construction at the Ethanol Exports Terminal of Santos (TEAS) and other investments.
12
A.2 Raízen Combustíveis
Below you will find the results of Raízen Combustíveis, the business unit that distributes and trades fuels through a network of franchised Shell and Esso gas stations, in addition to supplying fuels to industrial clients and distributing aviation fuel.
Like in previous quarters, Raízen Combustíveis’ results are reported on pro forma and accounting basis to allow for comparability.
The major differences between both bases are as follows:
| ● | Accounting |
| o | 4Q12 – three months (January, February and March, 2012) of operations of Raízen Combustíveis |
| o | FY12 – ten months (June, 2011 to March, 2012) of operations of Raízen Combustíveis, and two months (April and May, 2011) of operations of the fuels business managed by Cosan (CCL minus the Lubricants business) |
| o | 4Q11 – three months (January, February and March, 2011) of operations of the fuels business managed by Cosan (CCL minus the Lubricants business) |
| o | FY11 – twelve months (April, 2010 to March, 2011) of operations of the fuels business managed by Cosan (CCL minus the Lubricants business) |
| ● | Pro Forma |
| o | FY12 – ten months (June, 2011 to March, 2012) of operations of Raízen Combustíveis, and two months (April and May, 2011) of the combined carve-out of fuel assets, both of CCL and of Shell. |
| o | 4Q11 – three months (January, February and March, 2011) of the combined carve-out of fuel assets, both of CCL and of Shell. |
| o | FY11 – twelve months (April, 2012 to March, 2011) of the combined carve-out of fuel assets, both of CCL and of Shell. |
The analysis that follows compares the results of 4Q12 (accounting) with 4Q11 (pro forma), and represents the whole of Raízen Combustíveis’s operations. In order to allow comparability, FY12 and FY11 will also be shown on a pro forma basis.
13
Net Revenue
Book 4Q12 | Pro forma 4Q11 | Pro forma FY12 | Pro forma FY11 | Net Revenue Breakdown Amounts in R$ MM | Book 4Q12 | Book 4Q11 | Book FY12 | Book FY11 | |||||||||||||||||||||||
| 9,982.0 | 8,885.0 | 39,691.8 | 35,526.4 | Net Operating Revenue | 9,982.0 | 2,701.2 | 35,096.1 | 10,966.2 | |||||||||||||||||||||||
| 9,982.0 | 8,865.6 | 39,669.9 | 35,468.5 | Fuel Sales | 9,982.0 | 2,681.8 | 35,079.1 | 10,908.3 | |||||||||||||||||||||||
| 544.6 | 702.6 | 2,337.7 | 2,908.7 | Ethanol | 544.6 | 203.1 | 2,117.9 | 814.6 | |||||||||||||||||||||||
| 4,179.3 | 3,619.3 | 16,623.1 | 13,241.1 | Gasoline | 4,179.3 | 1,265.9 | 14,674.4 | 4,656.9 | |||||||||||||||||||||||
| 3,875.5 | 3,516.8 | 15,730.2 | 15,383.4 | Diesel | 3,875.5 | 1,185.6 | 14,051.4 | 5,325.3 | |||||||||||||||||||||||
| 1,176.3 | 863.6 | 4,312.5 | 3,127.8 | Jet Fuel | 1,176.3 | - | 3,632.0 | - | |||||||||||||||||||||||
| 206.2 | 163.4 | 666.4 | 807.4 | Others | 206.2 | 27.2 | 603.3 | 111.5 | |||||||||||||||||||||||
| - | 19.3 | 21.9 | 57.9 | Other services | - | 19.3 | 16.9 | 57.9 | |||||||||||||||||||||||
Raízen Combustíveis recorded net revenue of R$10 billion in 4Q12, an increase of 12.3% over 4Q11. Compared to 3Q12, net revenue dropped 1% due to seasonal factors in the first months of the year (school vacation), and the lower number of selling days in the quarter.
In FY12 the volume of fuels sold reached 20.9 billion liters, generating revenue in the amount of R$39.7 billion, an increase of 11.7% from the R$35.5 billion reported in FY11.
Most of the growth in Raízen Combustíveis’s revenue is due to (1) the expansion in the service stations network, which totaled 4,545 sites in 2012, (2) increase in the sales volume following the conversion of nearly 47% of the 1,700 “Esso” stations into the “Shell” brand, (3) increase of 8.7% in the country’s fleet in FY12, (4) a sales mix more focused on gasoline, which has higher margins, and (5) increase of 19.1% and 5.5%, respectively, in the volume of gasoline and aviation kerosene in FY12.
In most of Brazil’s states and during almost the whole of the last fiscal year, the average parity between hydrous ethanol and gasoline prices, weighted by the fleet, was above 70%, making owners of flex fuel cars choose gasoline. This caused a reduction in the volume of ethanol sold and an increase in the volume of gasoline sold.

14
Inventories
| Fuels Inventories | Book | Pro forma | ||||||
| 4Q12 | 4Q11 | |||||||
| 000' cbm | 410.8 | 648.2 | ||||||
| R$'MM | 730.5 | 754.6 | ||||||
| R$/cbm | 1,778.0 | 1,164.1 | ||||||
Inventories fell 36.6% in 4Q12 compared to 4Q11 due to operational synergies between the Esso and Shell networks, causing the necessary inventory to be smaller for the current structure of Raízen Combustíveis. In selling days, inventories were at 8 days, as compared to 9 days in 4Q11.
Cost of Goods Sold
| Book | Pro forma | Pro forma | Pro forma | COGS | Book | Book | Book | Book | |||||||||||||||||||||||
| 4Q12 | 4Q11 | FY12 | FY11 | Amounts in R$ MM | 4Q12 | 4Q11 | FY12 | FY11 | |||||||||||||||||||||||
| (9,316.7 | ) | (8,419.3 | ) | (37,455.7 | ) | (33,659.8 | ) | Fuel Sales | (9,316.7 | ) | (2,580.8 | ) | (33,144.5 | ) | (10,499.3 | ) | |||||||||||||||
| Average Unit Cost (R$/cbm) | |||||||||||||||||||||||||||||||
| (1,793.7 | ) | (1,698.2 | ) | (1,790.9 | ) | (1,614.5 | ) | Fuel Sales | (1,793.7 | ) | (1,814.8 | ) | (1,789.0 | ) | (1,741.6 | ) | |||||||||||||||
Because gasoline and diesel—which have a higher unit cost than ethanol—prevailed in the sales mix, the cost of goods sold increased by 10.7% to R$9.3 billion in 4Q12. Compared to 3Q12, the cost of goods sold dropped 2.2% due to the lower volume sold in the period.
In FY12, the cost of goods sold reached R$37.5 billion and the average unit price was R$1,791/cbm, 10.9% higher than in FY11.
Gross Profit
| Book | Pro forma | Pro forma | Pro forma | Gross Profit | Book | Book | Book | Book | |||||||||||||||||||||||
| 4Q12 | 4Q11 | FY12 | FY11 | Amounts in R$ MM | 4Q12 | 4Q11 | FY12 | FY11 | |||||||||||||||||||||||
| 665.3 | 465.7 | 2,236.1 | 1,866.6 | Gross Profit | 665.3 | 120.3 | 1,951.6 | 466.9 | |||||||||||||||||||||||
| 6.7 | % | 5.3 | % | 5.6 | % | 5.3 | % | Gross Margin (%) | 6.7 | % | 4.5 | % | 5.6 | % | 4.3 | % | |||||||||||||||
| 128.1 | 93.9 | 106.9 | 89.5 | Gross margin (R$/cbm) | 128.1 | 84.6 | 105.3 | 77.4 | |||||||||||||||||||||||
Raízen Combustíveis recorded Gross Profit of R$665.3 million, up 42.9% over 4Q11. This improvement represented an increase of 1.4 p.p. in the gross margin, to 6.7% in 4Q12. Gross Profit amounted to R$2.2 billion in FY12, and the gross margin was 5.6% in the period.
Measured in R$ per cbm, the gross margin was R$128.1/cbm in 4Q12, an increase of 36.4% compared to the margin of R$93.9/cbm recorded in 4Q11. In FY12, the gross margin totaled R$106.9/cbm. The increase, both in the year and the quarter, reflect the synergies and also is due to the allocation of transfer freights in selling expenses line, previously recorded under costs.
15
Selling, General & Administrative Expenses
| Book | Pro forma | Pro forma | Pro forma | Selling, General and Administrative | Book | Book | Book | Book | |||||||||||||||||||||||
| 4Q12 | 4Q11 | FY12 | FY11 | Amounts in R$ MM | 4Q12 | 4Q11 | FY12 | FY11 | |||||||||||||||||||||||
| (397.9 | ) | (240.2 | ) | (1,216.7 | ) | (1,037.5 | ) | Selling Expenses | (397.9 | ) | (73.1 | ) | (1,095.6 | ) | (280.9 | ) | |||||||||||||||
| (111.2 | ) | (135.3 | ) | (405.7 | ) | (394.7 | ) | General and Administrative Expense | (111.2 | ) | (26.8 | ) | (349.8 | ) | (91.5 | ) | |||||||||||||||
Raízen Combustíveis recorded selling expenses of R$ 397.9 million in 4Q12, an increase of 65.7% over 4Q11. As reported in previous quarters, the key driver of this increase was the change in the classification of transfer freights, that since 2Q12 have been reported in selling expenses and before were included in cost of goods sold.. Additionally, the portion of the depreciation referring to the revaluation of assets contributed to the formation of Raízen Combustíveis has increased selling expenses by nearly R$52 million without impacting the company’s cash and EBITDA. For the year, selling expenses amounted to R$1.2 billion.
General and administrative expenses totaled R$111.2 million in 4Q12, a decrease of 17.8% compared to 4Q11, reflecting the current structure of Raízen Combustíveis. General and administrative expenses amounted to R$405.7 million in FY12.
During the quarter we recorded other operating revenues in the amount of R$89 million referring to merchandising fees, royalties from convenience stores, revenue from leases, fees from the sale of Shell lubricants at Raízen Combustíveis’ gas stations, and revenue from the sale of assets, among other revenues. After several quarters we consider that variations among the fiscal year quarters, is inherent to the nature of the business and no adjustments should be required.
Revenues from royalties received for the licensing of convenience stores are accounted for under “other operating revenues” and totaled R$29.1 million in FY12. These revenues were previously reported under net revenue in the “other services” line. At the close of fiscal year 2012, 647 convenience stores were in operation.
EBITDA
| Book | Pro forma | Pro forma | Pro forma | EBITDA | Book | Book | Book | Book | |||||||||||||||||||||||
| 4Q12 | 4Q11 | FY12 | FY11 | Amounts in R$ MM | 4Q12 | 4Q11 | FY12 | FY11 | |||||||||||||||||||||||
| 350.9 | 189.6 | 1,304.9 | 724.7 | EBITDA | 350.9 | 71.8 | 1,149.7 | 248.0 | |||||||||||||||||||||||
| 3.5 | % | 2.1 | % | 3.3 | % | 2.0 | % | EBITDA Margin (%) | 3.5 | % | 2.7 | % | 3.3 | % | 2.3 | % | |||||||||||||||
| 67.6 | 38.2 | 62.4 | 34.8 | EBITDA Margin (R$/cbm) | 67.6 | 50.5 | 62.1 | 41.1 | |||||||||||||||||||||||
Raízen Combustíveis’s EBITDA was R$350.9 million in 4Q12, with a margin of R$67.6/cbm, equivalent to 3.5% of net revenue. Adjusted for the non-recurring effects of additional annual bonus amount of R$15.0 million, the margin would have been at R$70.5/cbm.
Compared to 4Q11, EBITDA rose 85.1%, not only due to a better mix of products sold and volume growth but mostly because of the synergies captured in this first year of Raízen’s operations. Raízen Combustíveis’s EBITDA amounted to R$1.3 billion in FY12, up from R$724.7 million in FY11.
EBITDA margin reached R$62.4/cbm in FY12, much higher than the guidance disclosed to the market when Raízen was formed of R$43/cbm for the first year of operations.
16
Investments
| Book | Pro forma | Pro forma | Pro forma | CAPEX | Book | Book | Book | Book | |||||||||||||||||||||||
| 4Q12 | 4Q11 | FY12 | FY11 | Amounts in R$ MM | 4Q12 | 4Q11 | FY12 | FY11 | |||||||||||||||||||||||
| 196.2 | 117.6 | 499.3 | 365.6 | CAPEX | 196.2 | 102.0 | 491.7 | 191.6 | |||||||||||||||||||||||
Raízen Combustíveis’s CAPEX was R$196.2 million in 4Q12 and R$499.3 million in FY12. In 4Q12 and FY12, the company invested in new contracts and contract renewal with dealers, rebranding of “Esso” stations under the “Shell” brand, maintenance of the network of dealer stations, and in health, safety and the environment (HSE).
17
B.3 Rumo Logística
Below you will find the results of Rumo, Cosan’s logistics business responsible for providing integrated logistics services—including transportation, storage and port elevation of sugar and other agricultural commodities—both for Raízen and third parties.
Net Revenue
| Net Revenue Breakdown | |||||||||||||||
| 4Q12 | 4Q11 | Amounts in R$ MM | FY12 | FY11 | |||||||||||
| 74.3 | 84.4 | Net Operating Revenue | 572.0 | 448.0 | |||||||||||
| 53.6 | 56.3 | Transportation | 413.4 | 305.8 | |||||||||||
| 17.5 | 15.3 | Loading | 141.0 | 118.1 | |||||||||||
| 3.2 | 12.8 | Others | 17.6 | 24.1 | |||||||||||
Rumo’s net revenue totaled R$74.3 million in 4Q12, a decrease of 12% compared to the R$84.4 million recorded in 4Q11. This decrease is due to the disruption in 2011/2012 crop in Brazil’s Central-South region.
In FY12, however, net revenue rose 27.7% compared to FY11, reaching R$572 million. This result is mainly due to (1) the increase of 52.2% in the volume of sugar transported in FY12 compared to FY11, and (2) higher prices because of longer routes in the mix operated in FY12.
Net revenue from sugar transportation—including volumes originated by Rumo and ALL —amounted to R$413.4 million in FY12, an increase of 35.2% over the amount recorded in FY11 and accounting for 72.3% of Rumo’s overall net revenue. Of the total volume transported in FY12, 60% was originated from Raízen Energia.
Rumo’s elevation volume was 7,759 thousand tonnes in FY12, an increase of 3.7% compared to FY11. The effects of the sugarcane crop failure, which resulted in lower sugar than expected export volumes, were partially minimized by the elevation of other products such as soybeans and soybean meal in the off-season period (November of 2011 to March of 2012).
The average consolidated revenue per tonne elevated in FY12 was up 23.0% over FY11 to R$74.0/tonne.
According to UNICA, based on data from the Brazilian Foreign Trade Office (SECEX), the Port of Santos was responsible for 68.5% of the total volume of sugar exported by Brazil. Therefore, Rumo transported nearly 46% of the total volume of sugar exported from the Port of Santos, and 31% of the total sugar exported by the country in 2011/2012 crop season.
18
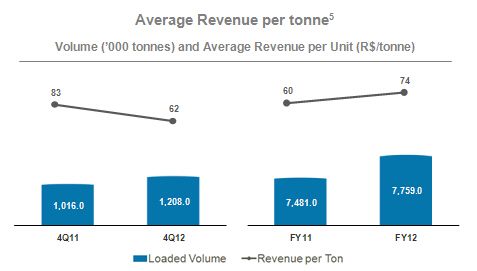
Note 5: Total net revenue divided by elevation volume
Cost of Services Provided
| 4Q12 | 4Q11 | Costs of Services Amounts in R$ MM | FY12 | FY11 | |||||||||||
| (77.4 | ) | (58.2 | ) | Cost of Services Provided | (394.1 | ) | (316.4 | ) | |||||||
Rumo’s cost of services provided includes railway and highway freight, port elevation, transshipment and storage costs in upstate São Paulo and at the Port of Santos.
Rumo’s cost of services provided amounted to R$77.4 million in 4Q12, an increase of 33% over 4Q11. In FY12, the cost of services provided reached R$394.1 million, up 24.6%. As a percentage of the net revenue, cost of services provided was 68.9% in FY12 (70.6% in FY11). This reduction of 1.7 p.p. was due to the higher volume of sugar transported in FY12, increasing cost dilution.
Gross Profit
| Gross (Loss) Profit and Margin | |||||||||||||||
| 4Q12 | 4Q11 | Amounts in R$ MM | FY12 | FY11 | |||||||||||
| (3.1 | ) | 26.2 | Gross (Loss) Profit | 177.9 | 131.6 | ||||||||||
| -4.2 | % | 31.0 | % | Gross Margin (%) | 31.1 | % | 29.4 | % | |||||||
Rumo recorded gross loss of R$3.1 million in 4Q12 due to amortization on intangible assets in railways amounting R$13.8 million recorded in 4Q12, with no impacts on EBITDA. Gross Profit totaled R$177.9 million in FY12, an increase of 35.2% over FY11. The gross margin increased by 1.7 p.p. to 31.1% in FY12, which shows operational improvement and a higher dilution of the operation’s fixed costs.
19
General and Administrative Expenses
| General and Administrative Expenses | Expenses | ||||||||||||||
| 4Q12 | 4Q11 | Amounts in R$ MM | FY12 | FY11 | |||||||||||
| (11.7 | ) | (8.3 | ) | General and Administrative Expenses | (41.6 | ) | (29.1 | ) | |||||||
General and administrative expenses totaled R$11.7 million in 4Q12, an increase of 41% compared to 4Q11. Compared to FY11, general and administrative expenses rose 43% to R$41.6 million in FY12. This increase in expenses is basically due to the reformulation of Rumo’s managerial staff in FY12 as well as expenses related to the Shared Services Center which in FY11 were not considered.
EBITDA
| EBITDA and Margin | |||||||||||||||
| 4Q12 | 4Q11 | Amounts in R$ MM | FY12 | FY11 | |||||||||||
| 20.6 | 28.3 | EBITDA | 213.2 | 146.2 | |||||||||||
| 27.8 | % | 33.5 | % | EBITDA Margin (%) | 37.3 | % | 32.6 | % | |||||||
Rumo’s EBITDA was R$213.2 million for FY12 with margin at 37.3%, an increase of 45.8% and 4.7 p.p., respectively, compared to FY11. This increase is in line with Rumo’s investment plan, announced in 2010.
Investments
| CAPEX | |||||||||||||||
| 4Q12 | 4Q11 | Amounts in R$ MM | FY12 | FY11 | |||||||||||
| 45.6 | 53.3 | CAPEX | 269.0 | 427.9 | |||||||||||
Rumo’s investments totaled R$269 million in FY12, a decrease of 37.1% compared to FY11. The lower amount invested in this crop year is due to delays in obtaining licenses from government authorities for the expansion and duplication of permanent ways. Some of these licenses were issued at the end of FY12, allowing Rumo to resume investments in FY13.
Of Rumo’s total investments, nearly R$500 million should be invested in FY13 (R$450 million) and FY14 (R$50 million). In line with Rumo’s investment plan, the acquisition of locomotives and freight cars has already been completed and other investments, like in permanent ways, construction and remodeling of dry terminals, as well as the remodeling of the port terminal in Santos, are underway.
20
B.4 Cosan Alimentos
Below we report the results of Cosan Alimentos, a company established in July of 2011 and in charge of purchasing, packing and distributing sugar in the Brazilian retail market.
For comparability purposes, Cosan Alimentos’s results are reported both on accounting and pro forma bases, as follows:
| ● | Accounting |
| o | 4Q12 – three months (January, February and March, 2012) of operations of Cosan Alimentos; |
| ● | Pro Forma |
| o | 4Q11 – three months (January, February and March,2011) of operations of Cosan Alimentos, ascertained on a managerial basis in line with the principles currently in effect; |
| o | FY11 – twelve months (April, 2010 to March, 2011) of operations of Cosan Alimentos, ascertained on a managerial basis in line with the principles currently in effect; |
| o | FY12 – twelve months (April, 2011 to March, 2012) of operations of Cosan Alimentos, ascertained on a managerial basis in line with the principles currently in effect; |
Net Revenue
| Book | Pro forma | Net Revenue Breakdown | Pro forma | Pro forma | |||||||||||
| 4Q12 | 4Q11 | Amounts in R$ MM | FY12 | FY11 | |||||||||||
| 199.2 | 228.6 | Net Operating Revenue | 941.6 | 877.8 | |||||||||||
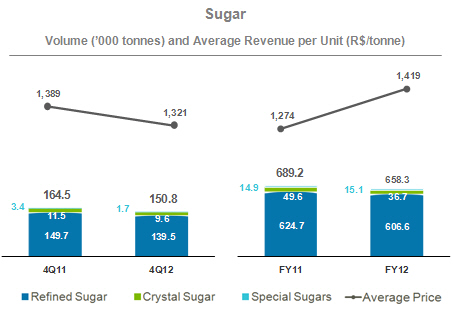
| 177.5 | 204.1 | Refined sugar sales | 843.6 | 786.2 | |||||||||||
| 11.9 | 15.8 | Cristal sugar sales | 50.6 | 55.4 | |||||||||||
| 9.8 | 8.6 | Special sugar sales | 47.4 | 36.2 | |||||||||||
Cosan Alimentos’s recorded net revenue of R$941.6 million in FY12, an increase of 7.3% compared to net revenue of R$877.8 million recorded in FY11. Refined sugar sales represented 89.5% of the total net revenue, and sales of special sugars, which include products like União Light, Organic, Premium, sachets and others, amounted to R$47.4 million in FY12, an increase of 30.9% in the year.
Even though Cosan Alimentos’s net revenue increased from FY11 to FY12, it dropped 12.9% to R$29.4 million in 4Q12 as compared to 4Q11. This reduction is mainly due to refined sugar inventories in the market, which started the off-season period (December of 2011) at high levels, and were sold with discounts during the 4Q12, pushing prices down.
21
Sugar Inventories
| Sugar Inventories | 4Q12 | |||
| ´000 ton | 20.0 | |||
| R$'MM | 23.8 | |||
| R$/ton | 1,189.2 |
Cost of Goods Sold
| Book | Pro forma | COGS | Pro forma | Pro forma | |||||||||||
| 4Q12 | 4Q11 | Amounts in R$ MM | FY12 | FY11 | |||||||||||
| (182.6 | ) | (183.9 | ) | Cost of Goods Sold (COGS) | (752.5 | ) | (670.9 | ) | |||||||
| (161.2 | ) | (163.0 | ) | Refined sugar | (669.9 | ) | (595.9 | ) | |||||||
| (12.1 | ) | (15.2 | ) | Cristal sugar | (46.7 | ) | (52.3 | ) | |||||||
| (9.3 | ) | (5.7 | ) | Special sugar | (36.0 | ) | (22.7 | ) | |||||||
In FY12 the cost of goods sold by Cosan Alimentos reached R$752.5 million, up 12.2% in the year. This increase is explained by the 26.1% rise in raw sugar prices (ESALQ VHP) on the foreign market—which is the calculation basis for Cosan Alimentos’s main raw material—up from R$700.9/tonne in FY11 to R$884.1/tonne in FY12.
As explained in previous quarters, most of Cosan Alimentos’s volumes are guaranteed through long-term contracts with the main supplier, Raízen Energia. The goal of this strategy is to ensure the supply of raw material throughout the crop year, thus avoiding spot purchases, with more volatile prices.
22
Gross Profit
| Book | Pro forma | Gross Profit and Margin | Pro forma | Pro forma | |||||||||||
| 4Q12 | 4Q11 | Amounts in R$ MM | FY12 | FY11 | |||||||||||
| 16.6 | 44.7 | Gross Profit | 189.1 | 206.9 | |||||||||||
| 8.3 | % | 19.6 | % | Gross Margin (%) | 20.1 | % | 23.6 | % | |||||||
Gross Profit dropped 8.6% to R$189.1 million in FY12, down from R$206.9 million in FY11. This decrease reflects the combination of the lower sales volume in FY12, together with the increase in raw material costs of Cosan Alimentos, which had the biggest impact on the 4Q12 results.
Selling, General & Administrative Expenses
| Book | Pro forma | Selling, General and Administrative | Pro forma | Pro forma | |||||||||||
| 4Q12 | 4Q11 | Amounts in R$ MM | FY12 | FY11 | |||||||||||
| (25.3 | ) | (29.4 | ) | Selling Expenses | (110.6 | ) | (115.1 | ) | |||||||
| (3.5 | ) | (3.4 | ) | General and Administrative Expenses | (17.7 | ) | (15.0 | ) | |||||||
Selling expenses reached R$110.6 million in FY12, a decrease of 3.9% compared to FY11, primarily due to the lower volume of sugar sold as most of these expenses are variable, like freight and commissions.
General and administrative expenses totaled R$17.7 million in FY12, an increase of 18% compared to FY11, due to the creation of a corporate structure to support Cosan Alimentos, generating expenses that had not been accounted for to date, including those related to the Shared Services Center.
EBITDA
| Book | Pro forma | EBITDA and Margin | Pro forma | Pro forma | |||||||||||
| 4Q12 | 4Q11 | Amounts in R$ MM | FY12 | FY11 | |||||||||||
| (5.7 | ) | 12.4 | EBITDA | 69.3 | 75.6 | ||||||||||
| -2.9 | % | 5.4 | % | EBITDA Margin (%) | 7.4 | % | 8.6 | % | |||||||
Cosan Alimentos recorded EBITDA of R$69.3 million in FY12, an decrease of 8.3% compared to FY11. The EBITDA margin was 7.4% in FY12. In 4Q12, EBITDA was negative R$5.7 million.
23
A.5 Other Businesses
Below we report the results for our Other Businesses, which consist of manufacturing, distribution and marketing activities for lubricants under Mobil brand and Base Oils, investments in rural properties and other investments, plus the corporate structure of Cosan Group business units, excluding for Raízen.
Net Revenue
| Net Revenue Breakdown | |||||||||||||||
| 4Q12 | 4Q11 | Amounts in R$ MM | FY12 | FY11 | |||||||||||
| 270.9 | 210.7 | Net Operating Revenue | 1,065.5 | 829.1 | |||||||||||
| 241.6 | 210.7 | Lubricant Sales | 1,018.8 | 827.6 | |||||||||||
| 29.3 | - | Other Products and Services | 46.7 | 1.5 | |||||||||||
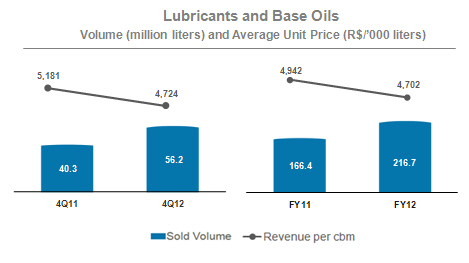
The lubricants and specialties business recorded net revenue of R$241.6 million in 4Q12, an increase of 14.7% compared to the R$210.7 million in 4Q11.
This increase is due to a larger volume of Premium lubricants sold and to the beginning of base oil distribution operation. Base oil which is one of the raw material for manufacturing lubricants was added to Cosan Lubrificantes e Especialidades’s portfolio in 1Q12. Also, the company started distributing lubricants in three more countries in January of 2012—Bolivia, Uruguay and Paraguay
The sales volume increased 39.5% in FY12 to 216.7 million leaders. In spite of the increase in the volume sold and product revenues, the addition of base oil to the mix contributed to the reduction in the average unit price, which was R$ 4,724/thousand liters in 4Q12, up from R$5,181/thousand liters in 4Q11.
For the year, the net revenue of Cosan Lubrificantes e Especialidades was R$1.0 billion, an increase of 23.1% compared to FY11 R$827.6 million. The volume sold was 30.2% higher in FY12, reaching 216.7 million liters.
Revenue from other products and services consists of land leased by Cosan to Raízen Energia, as well as revenues from the sale of base oils and amounted to R$56.7 million in FY12.
24
Selling, General & Administrative Expenses
| Selling, General and Administrative | |||||||||||||||
| 4Q12 | 4Q11 | Amounts in R$ MM | FY12 | FY11 | |||||||||||
| (38.3 | ) | (60.7 | ) | Selling Expenses | (187.5 | ) | (175.2 | ) | |||||||
| (43.0 | ) | (7.9 | ) | General and Administrative Expenses | (132.8 | ) | (27.3 | ) | |||||||
Selling expenses dropped 36.9% in 4Q12 compared to 4Q11 due to a dilution of marketing and promotional actions throughout FY12 as opposed to FY11, when expenses were more concentrated in the last quarter.
Selling expenses increased 7.0% in FY12, primarily due to an increase in volumes, leading to an increase in freight expenses and the collection of used oils as current legislation requires that these wastes be collected and disposed of correctly.
General and administrative expenses totaled R$43 million in 4Q12, up from R$7.9 million in 4Q11. However, general and administrative expenses were down 15.5% quarter-on-quarter. It is important to mention this item includes expenses with Cosan’s corporate structure, which was previously allocated to sugar, ethanol and cogeneration segment, currently Raízen Energia.
EBITDA
| EBITDA and Margin | |||||||||||||||
| 4Q12 | 4Q11 | Amounts in R$ MM | FY12 | FY11 | |||||||||||
| (84.2 | ) | 17.2 | EBITDA | 3,245.3 | 146.5 | ||||||||||
| (100.3 | ) | - | Effects of Raízen Formation | 3,196.6 | - | ||||||||||
| 16.1 | 17.2 | Adjusted EBITDA | 48.7 | 146.5 | |||||||||||
| 5.9 | % | 8.2 | % | Adjusted EBITDA Margin (%) | 4.6 | % | 17.7 | % | |||||||
Other Businesses recorded a negative EBITDA of R$ 84.2 million in 4Q12, lower in the period due to the allocation of general and administrative expenses from other business units that were accounted for under their respective units in previous periods. During fiscal year 2012, the result was also impacted by provision for legal contingencies from the businesses contributed to Raízen that, under the agreement, remain the responsibility of Cosan.
During the quarter, the company recognized a negative effect of R$100.3 million in the Other Businesses line due to Cosan’s and Shell’s finalization of the adjustments in the assets contributed to the formation of Raízen. With this, in FY12 the result of the formation of Raízen was R$3.2 million (non-cash effect), bringing Adjusted EBITDA of Other Businesses was R$48.7 million, with EBITDA margin at 4.6%.
25
B. Other Items in the Consolidated Result
Financial Result
| Financial Results | |||||||||||||||
| 4Q12 | 4Q11 | Amounts in R$ MM | FY12 | FY11 | |||||||||||
| (82.3 | ) | (109.5 | ) | Gross Debt Charges | (352.9 | ) | (523.1 | ) | |||||||
| 30.0 | 31.9 | Income from Financial Investments | 131.2 | 117.3 | |||||||||||
| (52.3 | ) | (77.6 | ) | (=) Subtotal: Gross Debt Interests | (221.7 | ) | (405.8 | ) | |||||||
| (14.2 | ) | (4.1 | ) | Other Charges and Monetary Variation | (125.5 | ) | (47.3 | ) | |||||||
| 85.6 | 67.9 | Exchange Rate Variation | (93.9 | ) | 282.7 | ||||||||||
| (18.4 | ) | 48.4 | Gains (Losses) with Derivatives | (4.4 | ) | 54.8 | |||||||||
| (22.8 | ) | (47.8 | ) | Others | (28.6 | ) | (31.1 | ) | |||||||
| (22.1 | ) | (13.2 | ) | (=) Financial, Net | (474.1 | ) | (146.7 | ) | |||||||
In 4Q12, we posted financial expenses of R$22.1 million, compared to expenses of R$13.2 million in the same period of the previous year.
Net financial result for FY12 was an expense of R$474.1 million, versus an expense of R$146.7 million in FY12, mainly due to a positive exchange variation in FY11 in the amount of R$282.7 million, as compared to a negative variation of R$93.9 million in FY12.
In FY12, charges on gross debt fell 32.5% as compared to the previous year, while the balance of consolidated debt fell approximately 30% from R$7.1 billion on March 31, 2011 to R$5.0 billion on March 31, 2012. This decrease was due to a change in the debt profile and the effects of the proportional consolidation of Raízen’s debt since 1Q12. In 4Q12, charges decreased about 25% quarter-on-quarter due to the same reasons mentioned above.
Gains from marketable securities totaled R$131.2 million in FY12, compared to R$117.3 million in FY11, mainly due to the 23.1% increase in the average balance of cash and cash equivalents, together with the impact of the 9.2% increase in the average rate of domestic interest – CDI in the period. In 4Q12, capital gains totaled R$ 30.0 million, compared to R$ 31.9 million in 4Q11, primarily the result of the 0.55% decline in the average cash and cash equivalents balance.
The Brazilian real depreciated nearly 12% against the U.S. dollar in FY12 from R$1.6287/US$ as of March 31, 2011 to R$1.8221/US$ as of March 31, 2012, whereas in FY11 the real appreciated nearly 9% against the dollar, from R$1.7810/US$ as of March 31, 2010 to R$1.6287/US$ as of March 31, 2011. In the quarter, the real depreciated 2.9% against the dollar. Therefore, the exchange variation had a material impact on assets and liabilities denominated in dollars, especially the dollar-denominated debt.
The derivatives line includes gains and losses with derivatives, except for those instruments used for hedge accounting purposes or the ineffective portion of such instruments and the fair value in the period of the Warrants of the affiliate Radar.
26
Income Tax and Social Contribution
| Income and Social Contribution Tax | |||||||||||||||
| 4Q12 | 4Q11 | Amounts in R$ MM | FY12 | FY11 | |||||||||||
| 158.7 | 721.8 | Income Before Income Tax | 3,755.0 | 1,191.1 | |||||||||||
| (10.0 | ) | (235.0 | ) | Total of Deferred and Current Income and Social Contribution Taxes | (1,110.2 | ) | (414.5 | ) | |||||||
| 6.3 | % | 32.6 | % | (-) Effective Rate (%) | 29.6 | % | 34.8 | % | |||||||
| 27.0 | (208.9 | ) | Deferred Income Taxes Expenses | (962.8 | ) | (329.1 | ) | ||||||||
| (37.0 | ) | (26.0 | ) | Current Income Taxes Expenses | (147.5 | ) | (85.4 | ) | |||||||
| 23.3 | % | 3.6 | % | Effective Rate - Current (%) | 3.9 | % | 7.2 | % | |||||||
Expenses with income tax and social contribution (“IT/SC”) represented 29.6% of our income before tax in FY12, as compared to an effective rate of 34.8% in FY11 and a nominal rate of 34%.
The expense with current income tax and social contribution represents the amount disbursed and to be disbursed, net of refunds, recovery and offsetting of taxes of the same type. In FY12, our current income tax rate was 3.9% over our pre-tax income, down from 7.2% in FY11. If we adjusted the income before IT/SC by the effects of Raízen’s formation in the amount of R$3.2 billion, which is mostly subject to effects of deferred IT/SC, our current effective rate would be 26.4%.
Compared to FY11, the main reason for the effective IT/SC rate being so low in FY12 at 7.2% is the effect of the exchange variation and gains/losses with derivatives, which are taxed using the cash basis and not the accrual basis. In FY11 we recorded income from exchange variation of R$282.7 million, and in FY12 we recorded an expense of R$93.9 million.
Net Income
In the fiscal year ended March 31, 2012, the Company recorded net income of R$2.6 billion, versus R$ 771.6 million in FY11. Excluding the effects of the formation of Raízen, adjusted net income would be R$ 421.9 million, a decrease of approximately 45.3% compared to FY11, mainly due to the negative impacts of the financial result. Adjusted for exchange variation since FY11 the net income adjusted would be approximately R$ 800,0 million.
27
C. Indebtedness
At the end of 4Q12, Cosan's consolidated gross debt reached R$4.7 billion, with no significant change over the closing balance of 3Q12, of R$4.8 billion. The components of Raízen’s debt, of which 50% is consolidated by Cosan, are presented below, together with the other components of Cosan Group’s debt.
Raízen
The combined gross debt of Raízen totaled R$5.6 billion at the end of 4Q12, a 4.7% decrease versus the balance recorded on December 31, 2011.
Throughout the quarter, we amortized principal and interest in the amount of R$639.2 million, and raised R$402.5 million through the following credit facilities:
| (i) | R$319.7 million in foreign exchange contract advances; |
| (ii) | R$82.8 referring to BNDES funding and other facilities for energy cogeneration and sugarcane harvest mechanization projects, among others. |
It is important to mention that Raízen has a receivable from its shareholder Shell, in the approximate amount of US$500 million, maturing in April of 2013, which resulted in an increase in liquidity and reduction of overall leverage. This receivable from Shell is also proportionately consolidated (50%) by Cosan, but it is not recorded as a cash. For this reason, and for a better understanding of Cosan's leverage capacity, we report the pro forma net debt, which takes into account the cash and cash equivalents and 50% of the Shell receivable for the purpose of calculating the net debt.
Cosan and Subsidiaries
Gross financial debt was R$1.9 billion in 4Q12, unchanged from 3Q12.
Also, subsidiary Rumo Logística raised approximately R$53.4 million through the Finame facility in the fourth quarter to invest in railway assets and port terminals.
Cash and cash equivalents reached R$1.6 billion at the end of 4Q12, up from R$1.2 billion in 3Q12, bringing the pro forma net indebtedness to R$2.6 billion, a 3.9% reduction when compared to the end of 3Q12, equivalent to 1.2 times the EBITDA in the last 12 months.
28
| Debt by type | ||||||||||||
| Amounts in R$ MM | 4Q12 | 3Q12 | % ST | |||||||||
| Senior Notes 2014 | 645.3 | 679.9 | 1.2 | % | ||||||||
| Expenses with Debt Placement | (6.5 | ) | (7.4 | ) | 42.9 | % | ||||||
| BNDES | 1,525.5 | 1,488.4 | 11.4 | % | ||||||||
| Working Capital | 830.8 | 855.5 | 0.5 | % | ||||||||
| Prepaid Exports | 1,014.9 | 749.4 | 18.3 | % | ||||||||
| Senior Notes 2017 | 737.2 | 772.1 | 1.1 | % | ||||||||
| Advances on Exchange Contracts | 276.7 | 498.9 | 100.0 | % | ||||||||
| Credit Notes | 105.8 | 351.4 | 100.0 | % | ||||||||
| Finame | 203.7 | 220.8 | 33.4 | % | ||||||||
| Finem | 222.3 | 219.0 | 19.8 | % | ||||||||
| Rural credit | 40.9 | 40.3 | 100.0 | % | ||||||||
| PROINFA | 27.2 | 28.6 | 14.2 | % | ||||||||
| Expenses with Placement of Debt | (12.2 | ) | (11.1 | ) | 22.0 | % | ||||||
| Total Raízen | 5,611.7 | 5,885.6 | 0.0 | % | ||||||||
| Raízen Consolidated ( 50% RAIZEN after 01-05) | 2,805.9 | 2,942.8 | 0.0 | % | ||||||||
| Finame | 632.8 | 594.8 | 10.9 | % | ||||||||
| Expenses with Placement of Debt | (1.1 | ) | (1.1 | ) | 22.4 | % | ||||||
| Perpetual Bonds | 930.1 | 958.0 | 1.2 | % | ||||||||
| Credit Notes | 341.2 | 332.2 | 0.0 | % | ||||||||
| Expenses with Placement of Debt | (11.0 | ) | (12.0 | ) | 19.0 | % | ||||||
| Total Cosan | 1,892.0 | 1,872.0 | ||||||||||
| Total Consolidated | 4,697.9 | 4,814.8 | ||||||||||
| Availabitity | 1,616.2 | 1,194.9 | ||||||||||
| Net Debt | 3,081.7 | 3,619.9 | ||||||||||
| Capital Subscription to be Paid from Shell to Raízen (50%) | 489.9 | 923.2 | ||||||||||
| Adjusted Net Debt | 2,591.9 | 2,696.7 | ||||||||||
29
D. Market Overview
According to data from UNICA, the Center-South (CS) region crushed 493.264 million tonnes of sugarcane in the 2011/2012 crop, a decrease of 11.4% over the same period in the previous crop year. The lower availability of sugarcane for this crop year is due to agricultural and climate factors, the latter including drought and two frosts. These facts and the lack of investments in sugarcane plantations due to the 2008 crisis resulted in a productivity of less than 70 t/ha in the Center-South.
Due to high prices in the international markets, the mix of sugar production increased from 44.71% to 48.43%, while mix of ethanol represented 51.57% in the 2011/2012 harvest. The production totaled 31.3 million tonnes of sugar, a decrease of 6.5% and 20.5 billion liters of ethanol, a reduction of 19.1% if compared to 2010/2011 harvest.
Sugar
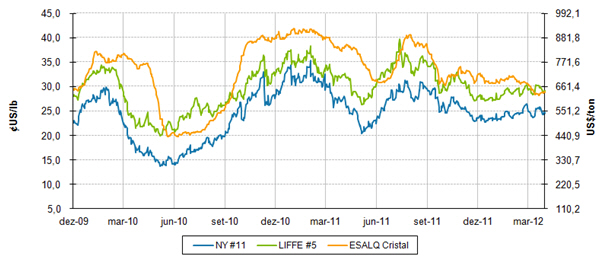
Source: ESALQ, Bloomberg, Cosan
The 2011/2012 crop year is the third consecutive year of growth in sugar production, mainly driven by higher prices. Considering historical data, global production grew by 31% in the decade ending with the 2011/2012 crop, and is expected to reach 178.1 million tonnes. The sugar production supply was the main driver of this higher growth rate.
Differently than anticipated sugar prices in the Brazilian domestic market were not affected by seasonal factors in the 2011/12 crop. During the peak of the CS crop, the price of the 50-kg sack reached R$70, when a decrease in prices was expected, whereas in the off-season (December and January) the price was approximately R$57. This unusual behavior caused a reaction in the market, with most industrial consumers advancing their purchases out of fear of a price increase, leading to a lower spot demand in the off-season. As a result, many mills had to liquidate their product inventories in order to generate cash, and supply was higher than demand.
Exports in the CS were 2.5 million tonnes lower than in the previous crop, totaling 21.5. The main drivers of this reduction were the decrease in production and in the international demand from some countries, which maintained their excess inventories. Out of total exports, raw sugar exports reached 18.4 million tonnes, and white sugar (granulated and
30
refined) exports reached only 3.06 million tonnes. The main destinations of raw sugar exports were China, Egypt, the European Union and Algeria. As for the white sugar market, the main importers were Yemen, Ghana and Colombia.
In Western Europe, Germany and France had record crops. French productivity recorded an increase of more than 50%, contributing to a 20% increase in sugar production, totaling 4.8 million tonnes. Production in Germany was 32% higher than in the previous year at 4.6 million tonnes. The availability of these countries caused European Union exports to reach the limit established by the WTO of 1.370 million tonnes, and the out-of-quota sugar (only targeted at exports, industrial consumers and the fuel industry) to be reallocated to the quota system (solely targeted at the domestic market).
The Russian crop saw record production, reflecting the region's expansion and the increase in agricultural productivity, supported by extremely favorable weather conditions. Sugar production in the country increased by 85%, from 2.9 to 5.5 million tonnes (raw value). Consumption in the country reached 5 million tonnes, which limited imports to less than 600,000 tonnes, versus a historical 1.8 million.
India exceeded initial expectations, with an estimated production of 27.8 million tonnes of sugar (raw value); For the second consecutive year, the country was an active participant in the international market of white sugar exports. The government provided incentives to sugarcane suppliers by increasing the minimum sugarcane price and the salary of sugarcane field workers. This action prevented artisanal sugar producers from competing against traditional mills, which led to an increase in production in the Uttar Pradesh region, for instance, which grew from 200,000 tonnes to 6.5 million tonnes. Despite the increase in production, the government continued to control local inventories through compulsory monthly sales and export licenses.
The 2011/2012 crop in Thailand has been increasing for the second consecutive year. With an industrial yield higher than last year’s, a 9.5% increase in production is expected, to 11.3 million tonnes of sugar. Throughout the 2011/2012 crop, the CS region of Brazil faced strong competition from Thai sugar, which had a greater competitive advantage in logistics for some regions of East Asia and the Middle East.
China, with a domestic deficit of approximately 3 million tonnes, maintained its position as the world's largest raw sugar importer. In 4Q11, China imported more than 600,000 tonnes of raw sugar, mainly from the Central-South region of Brazil. Sugarcane and beet crops ended the period with production lower than expected. The advanced celebration of the Chinese New Year (in January, instead of February), which caused the weekly crushing to decrease earlier than usual, and the reduction in industrial yield, were the main reasons for a decrease in production from 12.5 to 12.2 million tonnes.
The raw sugar price reached an average of ¢US$24.53/lb in 4Q12, 6.8% lower than in 3Q12, when the highest price, of ¢US$31.34/lb, was recorded. In 4Q12, the price was 19.7% lower than the average price of ¢US$30.54/lb recorded in 4Q11.
Refined sugar in the foreign market recorded an average price of US$639.83/tonne in the period, 9.8% lower than in 3Q12, and 14.8% lower than in 4Q11, with an average premium of US$99.00/tonne for white sugar, versus US$114.0/tonne in 4Q11 and US$101.7/tonne in 3Q12.
31
Based on data provided by the Central Bank, the Brazilian real appreciated against the dollar in 4Q12, reaching an average of R$1.77/US$, 1.6% lower than the average for the previous quarter. In the analyzed period, the exchange rate reached R$1.87/US$, due to the maintenance of a debt crisis scenario in Europe (Portugal, Italy, Greece and Spain), and also due to the unstable economic scenario in the United States. The closing rate in the period was R$1.82/US$, versus R$1.63/US$ in March of 2011 and R$1.87/US$ in December of 2011.
In the domestic sugar market, the average price of granulated sugar in 4Q12, as per ESALQ, was R$58.15 per 50-kg sack, or ¢US$30.67/lb, representing a 4.1% quarter-on-quarter reduction but 0.4% year-on-year increase.
Ethanol
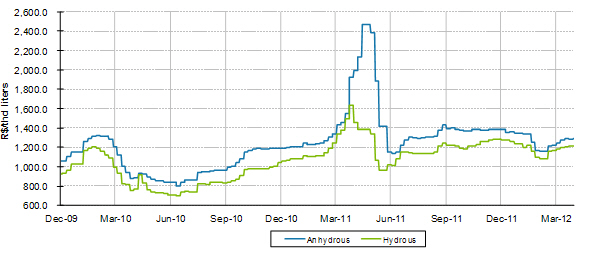
Source: ESALQ, Bloomberg, Cosan
The 2011/2012 ethanol crop was marked by significant concern by the Brazilian government in terms of ensuring the availability of ethanol during the off-season. Two measures stood out, one being the mandatory inventories of anhydrous ethanol at the mills and distributors, a measure that takes effect in the 2012/2013 crop. This mandatory volume took into account, among other aspects, the percentage of sales in the previous year. The other measure, which was immediate and implemented in October of 2011, was the reduction, from 25% to 20% of the mix of anhydrous ethanol in gasoline. This reduction measure enabled some mills to hydrate the anhydrous ethanol in order to sell it as hydrous, keeping more competitive prices for this product during the off-season.
With the ethanol/gasoline parity more focused on gasoline in most of the country, mills focused their production in anhydrous ethanol, increasing the share of this type of fuel by nearly 10 percentage points in the Center-South, when compared to the 2010/2011 crop.
According to UNICA, 7.4 billion liters of anhydrous ethanol and 13.1 billion liters of hydrous ethanol were produced, a volume 0.71% higher and 27.2% lower than the 2010/11 crop in the Center-South, respectively. Overall, ethanol production decreased by 6.5%.
The average price of hydrous ethanol, as per ESALQ, was R$1,169.0/m3 in 4Q12, 5.5% lower than in 4Q11, and 6.5% lower than in 3Q12. The average price of anhydrous ethanol was R$1,251.7/m3, showing a decrease of 8.0% from 4Q11, and 8.8% from 3Q11.
32
Based on data disclosed by the ANP (National Oil Agency), the average parity of the price of hydrous ethanol in relation to gas in Brazil was 73.1% in 4Q12.
In exports, the 2011/2012 crop had a strong flow of sugarcane ethanol exports and corn ethanol imports from the US. Exports were carried out based on the US's need to meet the mandatory demand of advanced fuels (established by the RFS), whereas the domestic market was supplied by a product that had a discount in relation to the product sold on the local market. In the CS region of Brazil, 1.6 billion liters of ethanol were exported, and approximately 950 million liters were imported.
Fuels
According to data from ANFAVEA, more than 2.8 million flex-fuel cars were sold in the period between April of 2011 and March of 2012. In March of 2012, the sale of flex vehicles accounted for 85.9% of total sales.
According to SINDICOM, the volume of Diesel sold in the quarter was 10.7 billion liters, 7.8% lower than in the previous year. On the other hand, ethanol sales fall 51.7% to 1.4 billion liters. In the same months, the sales volume of gasoline C reached 7.1 billion liters, an increase of 15.5%, showing that ethanol consumers continued to migrate to gasoline due to price dynamics.
33
E. Share Performance
The common shares issued by Cosan S.A. have been listed on BM&FBovespa since 2005, the year of its IPO on the “Novo Mercado” segment under the ticker symbol CSAN3, and are included in the portfolios of the Ibovespa, IBrX, IBrX-50, IBrA, MLCX, ICO2, INDX, ICON, IVBX-2, IGC, IGCT and ITAG indexes.
The shares issued by Cosan Limited, Cosan S.A.'s parent company, have been listed on NYSE since its IPO in 2007, under the ticker symbol CZZ. The company has also issued share deposit certificates (Brazilian Depositary Receipts - BDR) on the BM&FBovespa under the symbol CZLT11.
The tables and graphs below represent the performance of shares issued by the companies:
| Quarter Summary | CSAN3 | CZLT11 | CZZ | ||||
| Stock Type | Ordinary | BDR | Class A and B | ||||
| Listed in | BM&FBovespa | BM&FBovespa | NYSE | ||||
| Closing Price in 03/30/2012 | R$ | 33.96 | R$ | 27.30 | USD 14.85 | ||
| Higher Price | R$ | 34.70 | R$ | 27.90 | USD 15.11 | ||
| Average Price | R$ | 30.11 | R$ | 24.24 | USD 13.63 | ||
| Lower Price | R$ | 26.70 | R$ | 20.00 | USD 10. | ||
| Average Daily Traded Volume | R$ 35,4 mi | R$ 2,8 mi | USD 14,8 mi | ||||

34
F. Guidance
This section includes the guidance by variation range of some key parameters in the consolidated results of Cosan for the fiscal year of 2013, which began on April 1, 2012 and will end on March 31, 2013. In addition, other parts of this Financial Letter may contain forecasts. Such forecasts and guidance are simply estimates and indications, and do not provide any guarantee of prospective results.
This guidance takes into account the operations currently held by the Cosan group, which include Raízen Energia, Raízen Combustíveis, Rumo, and Other Businesses.
| FY11 | FY12 | FY 2013 | |||||
Cosan Consolidated | Net Revenue (R$MM) | 18,063 | 24,097 | 26,000 ≤ ∆ ≤ 29,000 | |||
| EBITDA (R$MM) | 2,671 | 2,142 | 2,200 ≤ ∆ ≤ 2,500 | ||||
| CAPEX (R$MM) | 2,500 | 2,137 | 2,100 ≤ ∆ ≤ 2,400 | ||||
| Volume of crushed sugarcane (‘000 tons) | 54,238 | 52,958 | 52,000 ≤ ∆ ≤ 55,000 | ||||
| Raízen Energia | Volume of sugar sold (‘000 tons) | 4,291 | 3,969 | 3,900 ≤ ∆ ≤ 4,200 | |||
| Volume of ethanol sold (millions of liters) | 2,247 | 1,921 | 1,850 ≤ ∆ ≤ 2,050 | ||||
| Volume of energy sold (‘000 MWh) | 1,254 | 1,233 | 1,650 ≤ ∆ ≤ 1,850 | ||||
| EBITDA (R$MM) | 2,130 | 2,235 | 2,200 ≤ ∆ ≤ 2,500 | ||||
| Raízen | Volume of fuel sold (millions of liters) | - | 20,914 | 21,000 ≤ ∆ ≤ 23,000 | |||
| Combustíveis | EBITDA (R$MM) | - | 1,305 | 1,300 ≤ ∆ ≤ 1,500 | |||
| Rumo | Volume of loading (‘000 tons) | 7,841 | 7,759 | 8,000 ≤ ∆ ≤ 10,000 | |||
| EBITDA (R$MM) | 146 | 213 | 260 ≤ ∆ ≤ 300 | ||||
Other Business | Volume of lubricants and base oil sold (millions of liters) | 166 | 205 | 220 ≤ ∆ ≤ 260 |
Disclaimer
This document contains forward-looking statements and estimates. These forward-looking statements and estimates are solely forecasts and do not represent any guarantee of prospective results. All stakeholders should know that these statements and estimates are and will be, depending on the case, subject to risks, uncertainties and factors related to the operations and business environment of Cosan and its subsidiaries, and therefore the actual results of these companies may significantly differ from the estimated or implied prospective results contained in forward-looking statements and estimates
35
G. Cosan S.A.
Income Statement
| Income Statement | Jun'10 | Sept'10 | Dec'10 | Mar'11 | Mar'10 | Jun'11 | Sept'11 | Dec'11 | Mar'12 | Mar'12 | ||||||||||||||||||||||||||||||
| (in R$ million) | 1Q11 | 2Q11 | 3Q11 | 4Q11 | FY11 | 1Q12 | 2Q12 | 3Q12 | 4Q12 | FY12 | ||||||||||||||||||||||||||||||
| Net Operating Revenue | 3,999.6 | 4,716.1 | 4,738.4 | 4,609.3 | 18,063.5 | 5,188.0 | 6,804.3 | 6,310.7 | 5,793.9 | 24,096.9 | ||||||||||||||||||||||||||||||
| Cost of Goods Sold and Services Rendered | (3,522.7 | ) | (3,995.2 | ) | (4,160.0 | ) | (3,472.2 | ) | (15,150.1 | ) | (4,600.0 | ) | (6,042.4 | ) | (5,670.9 | ) | (5,151.8 | ) | (21,465.0 | ) | ||||||||||||||||||||
| Gross Profit | 476.9 | 720.9 | 578.5 | 1,137.1 | 2,913.4 | 588.0 | 761.9 | 639.8 | 642.1 | 2,631.9 | ||||||||||||||||||||||||||||||
| Margin | 11.9 | % | 15.3 | % | 12.2 | % | -23.3 | % | 16.1 | % | 11.3 | % | 11.2 | % | 10.1 | % | -21.7 | % | 10.9 | % | ||||||||||||||||||||
| Operating Income (Expenses): | (339.0 | ) | (442.6 | ) | (407.9 | ) | (411.3 | ) | (1,600.8 | ) | 2,925.9 | (468.3 | ) | (399.8 | ) | (493.7 | ) | 1,564.0 | ||||||||||||||||||||||
| Selling | (216.1 | ) | (265.5 | ) | (271.9 | ) | (272.5 | ) | (1,026.0 | ) | (261.2 | ) | (295.3 | ) | (282.0 | ) | (297.9 | ) | (1,136.3 | ) | ||||||||||||||||||||
| General and Administrative | (120.6 | ) | (137.9 | ) | (132.4 | ) | (150.0 | ) | (541.0 | ) | (150.0 | ) | (158.2 | ) | (147.5 | ) | (186.2 | ) | (641.9 | ) | ||||||||||||||||||||
| Other Operating Income (Expenses), Net | (2.3 | ) | (39.1 | ) | (3.6 | ) | 11.3 | (33.8 | ) | 22.0 | 3.2 | 29.6 | 90.7 | 145.6 | ||||||||||||||||||||||||||
| Gain on tax recovery program | - | - | - | - | - | - | - | - | - | - | ||||||||||||||||||||||||||||||
| Effects of formation of JVs | - | - | - | - | - | 3,315.1 | (18.2 | ) | (100.3 | ) | 3,196.6 | |||||||||||||||||||||||||||||
| Operating Income | 137.9 | 278.3 | 170.5 | 725.8 | 1,312.6 | 3,513.9 | 293.6 | 240.0 | 148.4 | 4,195.9 | ||||||||||||||||||||||||||||||
| Non-Operating Income (Expenses): | (124.7 | ) | 88.8 | (81.5 | ) | (4.0 | ) | (121.5 | ) | 13.2 | (394.9 | ) | (69.4 | ) | 10.3 | (440.9 | ) | |||||||||||||||||||||||
| Financial results, net | (130.5 | ) | 86.4 | (89.4 | ) | (13.2 | ) | (146.7 | ) | 11.2 | (393.6 | ) | (69.5 | ) | (22.3 | ) | (474.1 | ) | ||||||||||||||||||||||
| Equity income of associates | 5.76 | 2.36 | 7.84 | 9.23 | 25.19 | 1.96 | (1.30 | ) | 0.01 | 32.60 | 33.27 | |||||||||||||||||||||||||||||
| Income (Loss) Before taxes | 13.2 | 367.1 | 89.0 | 721.8 | 1,191.1 | 3,527.1 | (101.3 | ) | 170.5 | 158.7 | 3,755.0 | |||||||||||||||||||||||||||||
| Margin | 0.3 | % | 7.8 | % | 1.9 | % | -3.4 | % | 6.6 | % | 68.0 | % | -1.5 | % | 2.7 | % | -53.6 | % | 15.6 | % | ||||||||||||||||||||
| Income and Social Contribution Taxes | (11.0 | ) | (126.2 | ) | (42.3 | ) | (235.0 | ) | (414.5 | ) | (1,224.6 | ) | 188.2 | (63.8 | ) | (10.0 | ) | (1,110.2 | ) | |||||||||||||||||||||
| Non-controlling interest | (1.75 | ) | 10.70 | (8.03 | ) | (5.92 | ) | (5.00 | ) | (3.11 | ) | (23.67 | ) | (12.97 | ) | 0.80 | (38.96 | ) | ||||||||||||||||||||||
| Net Income | 0.4 | 251.5 | 38.7 | 480.9 | 771.6 | 2,299.3 | 63.2 | 93.8 | 149.6 | 2,605.8 | ||||||||||||||||||||||||||||||
| Margin | 0.0 | % | 5.3 | % | 0.8 | % | -1.9 | % | 4.3 | % | 44.3 | % | 0.9 | % | 1.5 | % | -35.9 | % | 10.8 | % | ||||||||||||||||||||
36
Balance Sheet
| Balance Sheet | Jun'10 | Sept'10 | Dec'10 | Mar'10 | Jun'11 | Sept'11 | Dec'11 | Mar'12 | ||||||||||||||||||||||||
| (in R$ million) | 1Q11 | 2Q11 | 3Q11 | FY11 | 1Q12 | 2Q12 | 3Q12 | FY12 | ||||||||||||||||||||||||
| Cash and Cash Equivalents | 1,054.9 | 988.4 | 1,136.9 | 1,254.1 | 1,278.2 | 1,471.7 | 1,194.9 | 1,616.2 | ||||||||||||||||||||||||
| Restricted Cash | 51.3 | 76.0 | 276.2 | 187.9 | 60.2 | 52.5 | 88.1 | 94.3 | ||||||||||||||||||||||||
| Accounts receivable | 619.1 | 760.0 | 657.5 | 594.9 | 825.2 | 983.7 | 1,022.3 | 963.6 | ||||||||||||||||||||||||
| Derivatives | 144.5 | 166.0 | 180.0 | 55.7 | 60.2 | 29.4 | 59.6 | 19.6 | ||||||||||||||||||||||||
| Inventories | 1,066.3 | 1,626.8 | 1,642.7 | 670.3 | 1,002.0 | 1,361.8 | 1,354.4 | 748.2 | ||||||||||||||||||||||||
| Advances to Suppliers | 323.5 | 293.9 | 268.6 | 229.3 | 172.2 | 141.9 | 110.2 | - | ||||||||||||||||||||||||
| Related Parties | 50.5 | 21.8 | 20.8 | 14.7 | 680.3 | 599.7 | 655.8 | 678.4 | ||||||||||||||||||||||||
| Recoverable Taxes | 355.4 | 396.4 | 401.1 | 375.0 | 411.7 | 416.0 | 325.0 | 325.1 | ||||||||||||||||||||||||
| Other financial assets | - | - | - | - | - | - | - | 40.1 | ||||||||||||||||||||||||
| Other credits | 46.7 | 51.3 | 81.8 | 80.4 | 98.9 | 108.1 | 115.9 | 229.8 | ||||||||||||||||||||||||
| Current Assets | 3,712.2 | 4,380.5 | 4,665.5 | 3,462.3 | 4,588.9 | 5,164.9 | 4,926.3 | 4,715.1 | ||||||||||||||||||||||||
| Deferred Income tax and social contribution | 680.0 | 744.3 | 823.5 | 715.3 | 1,026.4 | 959.7 | 1,108.2 | 543.0 | ||||||||||||||||||||||||
| Advances to Suppliers | 52.5 | 65.1 | 85.5 | 46.0 | 27.5 | 39.6 | 49.7 | 21.9 | ||||||||||||||||||||||||
| Related Parties | 79.6 | 77.8 | 76.0 | 92.0 | 1,215.4 | 1,176.6 | 1,195.8 | 753.2 | ||||||||||||||||||||||||
| Recoverable Taxes | 38.8 | 36.6 | 36.0 | 55.1 | 124.5 | 123.6 | 122.2 | 111.9 | ||||||||||||||||||||||||
| Judicial Deposits | 168.9 | 173.6 | 180.9 | 218.4 | 372.5 | 491.1 | 495.6 | 509.2 | ||||||||||||||||||||||||
| Other financial assets | 367.3 | 378.2 | 392.3 | 420.4 | 290.3 | 418.6 | 415.5 | 790.4 | ||||||||||||||||||||||||
| Other non-current assets | 459.6 | 464.5 | 498.4 | 443.8 | 1,103.6 | 966.5 | 966.2 | 493.2 | ||||||||||||||||||||||||
| Investments | 267.4 | 287.5 | 294.7 | 304.1 | 333.9 | 358.1 | 368.6 | 419.0 | ||||||||||||||||||||||||
| Biological Assets | 932.8 | 873.6 | 894.8 | 1,561.1 | 795.1 | 717.0 | 767.9 | 968.0 | ||||||||||||||||||||||||
| Property, Plant and Equipment | 6,360.3 | 6,432.0 | 6,799.9 | 7,980.5 | 8,260.0 | 7,928.8 | 7,835.2 | 7,867.0 | ||||||||||||||||||||||||
| Intangible | 3,379.2 | 3,370.0 | 3,355.7 | 3,445.7 | 4,125.3 | 4,531.1 | 4,593.8 | 4,932.3 | ||||||||||||||||||||||||
| Non-current Assets | 12,786.4 | 12,903.4 | 13,437.6 | 15,282.4 | 17,674.4 | 17,710.7 | 17,918.7 | 17,409.0 | ||||||||||||||||||||||||
| Total Assets | 16,498.6 | 17,283.8 | 18,103.2 | 18,744.7 | 22,263.4 | 22,875.6 | 22,845.0 | 22,124.1 | ||||||||||||||||||||||||
| Current portion of long-term debt | 854.3 | 1,052.5 | 1,124.0 | 916.4 | 627.1 | 758.7 | 725.7 | 537.1 | ||||||||||||||||||||||||
| Derivatives | 37.4 | 96.1 | 379.0 | 132.3 | 94.3 | 29.3 | 15.7 | 9.6 | ||||||||||||||||||||||||
| Trade Accounts Payable | 716.3 | 832.1 | 754.4 | 558.8 | 621.6 | 757.5 | 765.4 | 606.0 | ||||||||||||||||||||||||
| Salaries Payable | 219.9 | 225.5 | 175.6 | 183.6 | 183.3 | 191.5 | 158.2 | 183.7 | ||||||||||||||||||||||||
| Taxes payable | 197.4 | 239.2 | 218.8 | 245.3 | 247.1 | 328.9 | 282.4 | 241.7 | ||||||||||||||||||||||||
| Dividends payable | 116.6 | 7.0 | 7.0 | 190.3 | 195.7 | 21.2 | 15.9 | 16.8 | ||||||||||||||||||||||||
| Related Parties | 120.1 | 66.0 | 74.6 | 41.2 | 186.8 | 163.2 | 228.5 | 175.0 | ||||||||||||||||||||||||
| Other Liabilities | 189.4 | 198.4 | 180.3 | 189.6 | 273.1 | 306.4 | 215.0 | 308.0 | ||||||||||||||||||||||||
| Current Liabilities | 2,451.3 | 2,716.7 | 2,913.8 | 2,457.4 | 2,428.9 | 2,556.7 | 2,406.9 | 2,077.9 | ||||||||||||||||||||||||
| Long-term debt | 5,322.7 | 5,310.8 | 5,961.7 | 6,274.9 | 3,699.4 | 4,407.8 | 4,402.3 | 4,476.9 | ||||||||||||||||||||||||
| Taxes payable | 597.3 | 605.8 | 618.2 | 639.1 | 1,123.0 | 1,180.0 | 1,184.8 | 1,202.6 | ||||||||||||||||||||||||
| Provision for judicial demands | 625.0 | 642.9 | 650.1 | 666.3 | 940.8 | 975.8 | 1,026.7 | 1,051.7 | ||||||||||||||||||||||||
| Related Parties | - | - | - | 4.4 | 371.2 | 546.3 | 468.5 | 389.7 | ||||||||||||||||||||||||
| Pension | - | 2.1 | 12.2 | 24.4 | 25.9 | 27.4 | 28.9 | 37.3 | ||||||||||||||||||||||||
| Deferred Income taxes | 1,123.6 | 1,215.6 | 1,250.9 | 1,511.0 | 3,546.4 | 3,159.1 | 3,116.5 | 2,443.4 | ||||||||||||||||||||||||
| Other non-current liabilities | 374.5 | 377.7 | 378.7 | 382.9 | 814.4 | 752.1 | 777.1 | 828.1 | ||||||||||||||||||||||||
| Non-current Assets | 8,043.0 | 8,155.0 | 8,871.7 | 9,502.9 | 10,521.0 | 11,048.4 | 11,004.8 | 10,429.8 | ||||||||||||||||||||||||
| Common stock | 4,687.8 | 4,691.1 | 4,691.1 | 4,691.8 | 4,691.8 | 4,691.8 | 4,691.8 | 4,691.8 | ||||||||||||||||||||||||
| Treasury shares | (4.2 | ) | (4.2 | ) | (19.4 | ) | (19.4 | ) | (19.4 | ) | (66.3 | ) | (67.7 | ) | (67.7 | ) | ||||||||||||||||
| Capital Reserve | 511.3 | 564.8 | 439.3 | 537.5 | 637.8 | 609.9 | 661.3 | 690.5 | ||||||||||||||||||||||||
| Profits Reserve | 374.2 | 290.8 | 290.8 | 1,249.0 | 1,249.0 | 1,232.2 | 1,232.2 | 3,837.1 | ||||||||||||||||||||||||
| Accumulated earnings | 370.3 | 621.8 | 660.5 | - | 2,299.3 | 2,362.5 | 2,456.3 | - | ||||||||||||||||||||||||
| Equity attributable to owners of the Company | 5,939.4 | 6,164.4 | 6,062.4 | 6,458.9 | 8,858.6 | 8,830.2 | 8,973.9 | 9,151.8 | ||||||||||||||||||||||||
| Equity attributable to non-controlling interests | 64.9 | 247.8 | 255.3 | 325.5 | 454.9 | 440.3 | 459.4 | 464.6 | ||||||||||||||||||||||||
| Total equity | 6,004.3 | 6,412.1 | 6,317.7 | 6,784.3 | 9,313.4 | 9,270.5 | 9,433.4 | 9,616.4 | ||||||||||||||||||||||||
| Total liabilities and equity | 16,498.6 | 17,283.8 | 18,103.1 | 18,744.7 | 22,263.4 | 22,875.6 | 22,845.0 | 22,124.1 | ||||||||||||||||||||||||
37
Statement of Cash Flow
| Statement of Cash Flows | Jun'10 | Sept'10 | Dec'10 | Mar'11 | Mar'11 | Jun'11 | Sept'11 | Dec'11 | Mar'12 | Mar'12 | ||||||||||||||||||||||||||||||
| (in R$ million) | 1Q11 | 2Q11 | 3Q11 | 4Q11 | FY11 | 1Q12 | 2Q12 | 3Q12 | 4Q12 | FY12 | ||||||||||||||||||||||||||||||
| Net Income | 0.4 | 251.5 | 38.7 | 480.9 | 771.6 | 2,299.3 | 63.2 | 93.8 | 149.6 | 2,605.8 | ||||||||||||||||||||||||||||||
| Non-cash Adjustments: | - | - | - | - | - | - | - | - | - | - | ||||||||||||||||||||||||||||||
| Depreciation and Amortization | 290.9 | 400.0 | 380.9 | 287.2 | 1,359.0 | 303.7 | 365.5 | 254.6 | 219.0 | 1,142.8 | ||||||||||||||||||||||||||||||
| Biological Assets | 42.2 | 28.7 | (21.2 | ) | (431.5 | ) | (381.9 | ) | (20.9 | ) | 38.8 | 20.0 | (97.9 | ) | (60.1 | ) | ||||||||||||||||||||||||
| Stock option | - | - | - | - | - | - | - | 4.8 | 6.0 | 10.8 | ||||||||||||||||||||||||||||||
| Equity income of associates | (5.76 | ) | (2.36 | ) | (7.84 | ) | (9.23 | ) | (25.19 | ) | (1.96 | ) | 1.31 | (0.01 | ) | (32.60 | ) | (33.27 | ) | |||||||||||||||||||||
| Losses (Gains) in Fixed Assets Disposals | 3.1 | (11.8 | ) | 2.1 | (28.7 | ) | (35.3 | ) | 17.0 | (11.5 | ) | (27.6 | ) | (71.8 | ) | (93.9 | ) | |||||||||||||||||||||||
| Deferred Income and Social Contribution Taxes | (0.7 | ) | 104.4 | 16.4 | 208.9 | 329.1 | 1,197.8 | (277.7 | ) | 69.7 | (27.0 | ) | 962.8 | |||||||||||||||||||||||||||
| Judicial demands' provision | - | - | - | - | - | - | - | - | - | - | ||||||||||||||||||||||||||||||
| Non-controlling interest | 1.74 | (10.70 | ) | 8.03 | 5.92 | 5.00 | 3.11 | 23.67 | 12.97 | (0.80 | ) | 38.96 | ||||||||||||||||||||||||||||
| Interest, monetary and exchange variations, net | 167.0 | (62.2 | ) | 53.2 | 80.6 | 238.5 | (33.7 | ) | 562.3 | 126.6 | (20.0 | ) | 635.1 | |||||||||||||||||||||||||||
| Effects of formation of JVs | - | - | - | - | - | (3,315.1 | ) | 18.2 | - | 198.5 | (3,098.5 | ) | ||||||||||||||||||||||||||||
| Capital gains | - | (223.1 | ) | - | 223.1 | - | - | - | - | - | - | |||||||||||||||||||||||||||||
| Other Non-cash Items | 19.4 | 199.2 | (1.6 | ) | (209.4 | ) | 7.5 | 5.2 | (5.2 | ) | - | (5.7 | ) | (5.7 | ) | |||||||||||||||||||||||||
| Variation on Assets and Liabilities | ||||||||||||||||||||||||||||||||||||||||
| Accounts receivable | 153.3 | (153.4 | ) | 135.5 | 29.3 | 164.7 | (123.3 | ) | (105.6 | ) | (38.6 | ) | (93.8 | ) | (361.1 | ) | ||||||||||||||||||||||||
| Restricted Cash | - | - | - | (143.0 | ) | (143.0 | ) | 113.5 | 7.7 | (35.5 | ) | (6.2 | ) | 79.5 | ||||||||||||||||||||||||||
| Inventories | (304.03 | ) | (440.84 | ) | (19.42 | ) | 848.86 | 84.58 | (326.63 | ) | (311.82 | ) | (34.70 | ) | 486.37 | (186.78 | ) | |||||||||||||||||||||||
| Related Parties | - | - | - | (50.1 | ) | (50.1 | ) | (1,033.6 | ) | 142.6 | (87.8 | ) | 227.2 | (751.7 | ) | |||||||||||||||||||||||||
| Advances to Suppliers | (76.7 | ) | 16.9 | 4.9 | 71.6 | 16.8 | (122.1 | ) | 18.2 | 21.5 | (20.9 | ) | (103.3 | ) | ||||||||||||||||||||||||||
| Accounts payable | 146.86 | 115.83 | (77.73 | ) | (217.32 | ) | (32.36 | ) | 241.24 | 124.96 | 7.99 | (153.98 | ) | 220.21 | ||||||||||||||||||||||||||
| Salaries payable | 78.3 | 5.6 | (49.9 | ) | 2.2 | 36.2 | 110.9 | 5.1 | (33.3 | ) | 25.5 | 108.2 | ||||||||||||||||||||||||||||
| Provision for judicial demands from legal proceedings | 10.7 | 18.9 | (2.6 | ) | (0.1 | ) | 26.9 | 33.1 | (33.1 | ) | 50.9 | 93.1 | 144.0 | |||||||||||||||||||||||||||
| Derivatives | 70.7 | (214.6 | ) | (108.4 | ) | 265.6 | 13.3 | (79.8 | ) | (62.1 | ) | (4.4 | ) | 34.0 | (112.3 | ) | ||||||||||||||||||||||||
| Taxes payable | (29.0 | ) | 34.2 | (23.2 | ) | 18.0 | - | 908.8 | 15.5 | (59.0 | ) | 21.0 | 886.3 | |||||||||||||||||||||||||||
| Recoverable taxes | - | - | - | - | - | - | - | - | (17.1 | ) | (17.1 | ) | ||||||||||||||||||||||||||||
| Other assets and liabilities, net | 39.0 | (98.2 | ) | (101.6 | ) | 112.5 | (48.3 | ) | 429.6 | (6.8 | ) | (55.0 | ) | (416.9 | ) | (49.1 | ) | |||||||||||||||||||||||
| Cash Flow from Operating Activities | 607.3 | (41.9 | ) | 226.3 | 1,545.4 | 2,337.1 | 606.1 | 573.3 | 286.9 | 495.2 | 1,961.5 | |||||||||||||||||||||||||||||
| Aquisitions, net of aquired cash and advances for future | - | - | - | (157.3 | ) | (157.3 | ) | - | - | - | (72.9 | ) | (72.9 | ) | ||||||||||||||||||||||||||
| Contributed cash to Raízen's formation | - | - | - | - | - | (173.1 | ) | - | - | - | (173.1 | ) | ||||||||||||||||||||||||||||
| Additions on Investments, Net of Cash Received | (3.7 | ) | (12.7 | ) | - | 16.5 | - | - | (99.1 | ) | (0.9 | ) | 57.6 | (42.3 | ) | |||||||||||||||||||||||||
| Additions on Property, Plant and Equipment | (513.9 | ) | (312.6 | ) | (533.0 | ) | (932.2 | ) | (2,291.6 | ) | (491.5 | ) | (243.3 | ) | (346.3 | ) | (503.4 | ) | (1,584.5 | ) | ||||||||||||||||||||
| Biological Assets expenses | (194.6 | ) | (198.1 | ) | (174.8 | ) | (178.2 | ) | (745.6 | ) | (217.2 | ) | (117.9 | ) | (107.0 | ) | (109.9 | ) | (552.0 | ) | ||||||||||||||||||||
| Cash Received on Sale of other Fixed Assets | 0.7 | 17.2 | 2.2 | 28.7 | 48.8 | - | 42.3 | 53.8 | 86.0 | 182.1 | ||||||||||||||||||||||||||||||
| Cash Flow from Investment Activities | (711.5 | ) | (506.2 | ) | (705.5 | ) | (1,222.5 | ) | (3,145.7 | ) | (881.8 | ) | (418.0 | ) | (400.3 | ) | (542.7 | ) | (2,242.8 | ) | ||||||||||||||||||||
| Additions of Debt | 642.4 | 495.9 | 1,101.2 | 480.0 | 2,719.5 | 1,281.1 | 483.8 | 156.2 | 245.7 | 2,166.7 | ||||||||||||||||||||||||||||||
| Payments of Principal and Interest on Debt | (561.6 | ) | (224.7 | ) | (458.2 | ) | (723.3 | ) | (1,967.9 | ) | (1,121.3 | ) | (206.0 | ) | (318.2 | ) | (197.9 | ) | (1,843.4 | ) | ||||||||||||||||||||
| Capital Increase | - | - | - | 4.0 | 4.0 | - | - | - | - | - | ||||||||||||||||||||||||||||||
| Capital Increase by noncontrolling interests | - | 403.3 | - | (3.3 | ) | 400.0 | 139.9 | - | - | 421.0 | 560.9 | |||||||||||||||||||||||||||||
| Treasury Shares | - | - | (15.2 | ) | - | (15.2 | ) | - | (46.9 | ) | (1.4 | ) | - | (48.3 | ) | |||||||||||||||||||||||||
| Dividends | - | (193.0 | ) | - | (0.1 | ) | (193.1 | ) | - | (192.7 | ) | - | - | (192.7 | ) | |||||||||||||||||||||||||
| Related Parties | - | - | - | 37.1 | 37.1 | - | - | - | - | - | ||||||||||||||||||||||||||||||
| Cash Flows from Financing Activities | 80.7 | 481.5 | 627.8 | (205.7 | ) | 984.3 | 299.8 | 38.2 | (163.4 | ) | 468.8 | 643.4 | ||||||||||||||||||||||||||||
| Total Cash Flow | (23.5 | ) | (66.5 | ) | 148.5 | 117.2 | 175.7 | 24.1 | 193.5 | (276.8 | ) | 421.3 | 362.1 | |||||||||||||||||||||||||||
| Cash & Equivalents, Beginning | 1,078.4 | 1,054.9 | 988.4 | (2,043.3 | ) | 1,078.4 | 1,254.1 | 1,278.2 | 1,471.7 | (2,749.8 | ) | 1,254.1 | ||||||||||||||||||||||||||||
| Cash & Equivalents, Closing | 1,054.9 | 988.4 | 1,136.9 | (1,926.1 | ) | 1,254.1 | 1,278.2 | 1,471.7 | 1,194.9 | (2,328.6 | ) | 1,616.2 | ||||||||||||||||||||||||||||
38
I. Cosan Limited
Income Statement
| Income Statement | Jun'10 | Sept'10 | Dec'10 | Mar'11 | Mar'10 | Jun'11 | Set'11 | Dec'11 | Mar'12 | Mar'12 | ||||||||||||||||||||||||||||||
| (in R$ million) | 1Q11 | 2Q11 | 3Q11 | 4Q11 | FY11 | 1Q12 | 2Q12 | 3Q12 | 4Q12 | FY12 | ||||||||||||||||||||||||||||||
| Net Operating Revenue | 3,999.6 | 4,716.1 | 4,738.4 | 4,609.3 | 18,063.5 | 5,188.0 | 6,804.3 | 6,310.7 | 5,793.9 | 24,096.9 | ||||||||||||||||||||||||||||||
| Cost of Goods Sold and Services Rendered | (3,522.7 | ) | (3,995.2 | ) | (4,160.0 | ) | (3,472.2 | ) | (15,150.1 | ) | (4,600.0 | ) | (6,042.4 | ) | (5,670.9 | ) | (5,151.8 | ) | (21,465.0 | ) | ||||||||||||||||||||
| Gross Profit | 476.9 | 720.9 | 578.5 | 1,137.1 | 2,913.4 | 588.0 | 761.9 | 639.8 | 642.1 | 2,631.9 | ||||||||||||||||||||||||||||||
| Margin | 11.9 | % | 15.3 | % | 12.2 | % | -23.3 | % | 16.1 | % | 11.3 | % | 11.2 | % | 10.1 | % | -21.7 | % | 10.9 | % | ||||||||||||||||||||
| Operating Income (Expenses): | (339.7 | ) | (443.9 | ) | (409.2 | ) | (412.4 | ) | (1,605.3 | ) | 2,481.6 | (469.7 | ) | (401.1 | ) | (494.9 | ) | 1,116.0 | ||||||||||||||||||||||
| Selling | (216.1 | ) | (265.5 | ) | (271.9 | ) | (272.5 | ) | (1,026.0 | ) | (261.2 | ) | (295.3 | ) | (270.4 | ) | (309.5 | ) | (1,136.3 | ) | ||||||||||||||||||||
| General and Administrative | (121.3 | ) | (139.3 | ) | (133.7 | ) | (151.1 | ) | (545.5 | ) | (150.5 | ) | (159.5 | ) | (160.3 | ) | (175.8 | ) | (646.0 | ) | ||||||||||||||||||||
| Other Operating Income (Expenses), Net | (2.3 | ) | (39.1 | ) | (3.6 | ) | 11.3 | (33.8 | ) | 22.0 | 3.2 | 29.6 | 90.7 | 145.6 | ||||||||||||||||||||||||||
| Effects of formation of JVs | - | - | - | - | - | 2,871.2 | (18.2 | ) | - | (100.3 | ) | 2,752.7 | ||||||||||||||||||||||||||||
| Operating Income | 137.2 | 277.0 | 169.3 | 724.7 | 1,308.1 | 3,069.5 | 292.2 | 238.8 | 147.3 | 3,747.8 | ||||||||||||||||||||||||||||||
| Financial results, net | (134.8 | ) | 85.6 | (89.0 | ) | (12.9 | ) | (151.1 | ) | 11.6 | (394.5 | ) | (70.6 | ) | (24.9 | ) | (478.5 | ) | ||||||||||||||||||||||
| Equity income of associates | 5.76 | 2.36 | 7.84 | 9.23 | 25.19 | 1.96 | (1.30 | ) | 0.01 | 32.60 | 33.27 | |||||||||||||||||||||||||||||
| Income (Loss) Before taxes | 8.2 | 364.9 | 88.1 | 721.0 | 1,182.2 | 3,083.1 | (103.6 | ) | 168.1 | 155.0 | 3,302.5 | |||||||||||||||||||||||||||||
| Margin | 0.2 | % | 7.7 | % | 1.9 | % | -3.3 | % | 6.5 | % | 59.4 | % | -1.5 | % | 2.7 | % | -46.9 | % | 13.7 | % | ||||||||||||||||||||
| Income and Social Contribution Taxes | (11.0 | ) | (126.2 | ) | (42.3 | ) | (235.0 | ) | (414.5 | ) | (1,224.6 | ) | 188.2 | (63.8 | ) | (10.0 | ) | (1,110.2 | ) | |||||||||||||||||||||
| Non-controlling interest | (1.89 | ) | (85.24 | ) | (22.66 | ) | (186.97 | ) | (296.75 | ) | (872.96 | ) | (47.42 | ) | (48.16 | ) | (42.45 | ) | (1,010.99 | ) | ||||||||||||||||||||
| Net Income | (4.7 | ) | 153.4 | 23.1 | 299.1 | 470.9 | 985.5 | 37.2 | 56.2 | 102.5 | 1,181.3 | |||||||||||||||||||||||||||||
| Margin | -0.1 | % | 3.3 | % | 0.5 | % | -1.0 | % | 2.6 | % | 19.0 | % | 0.5 | % | 0.9 | % | -15.5 | % | 4.9 | % | ||||||||||||||||||||
39
Balance Sheet
| Balance Sheet | Jun'10 | Sept'10 | Dec'10 | Mar'10 | Jun'11 | Set'11 | Dec'11 | Mar'12 | ||||||||||||||||||||||||
| (in R$ million) | 1Q11 | 2Q11 | 3Q11 | FY11 | 1Q12 | 2Q12 | 3Q12 | FY12 | ||||||||||||||||||||||||
| Cash and Cash Equivalents | 1,083.4 | 1,009.0 | 1,155.6 | 1,271.8 | 1,295.3 | 1,482.9 | 1,283.4 | 1,654.1 | ||||||||||||||||||||||||
| Restricted Cash | 51.3 | 76.0 | 276.2 | 187.9 | 60.2 | 52.5 | 88.1 | 94.3 | ||||||||||||||||||||||||
| Accounts receivable | 619.1 | 760.0 | 657.5 | 594.9 | 825.2 | 983.7 | 1,022.3 | 963.6 | ||||||||||||||||||||||||
| Derivatives | 144.5 | 166.0 | 180.0 | 55.7 | 60.2 | 29.4 | 59.6 | 19.6 | ||||||||||||||||||||||||
| Inventories | 1,066.3 | 1,626.8 | 1,642.7 | 670.3 | 1,002.0 | 1,361.8 | 1,354.4 | 748.2 | ||||||||||||||||||||||||
| Advances to Suppliers | 323.5 | 293.9 | 268.6 | 229.3 | 172.2 | 141.9 | 110.2 | - | ||||||||||||||||||||||||
| Related Parties | 50.5 | 21.8 | 20.8 | 14.7 | 680.3 | 599.7 | 655.8 | 678.4 | ||||||||||||||||||||||||
| Recoverable Taxes | 355.4 | 396.4 | 401.1 | 375.0 | 411.7 | 416.0 | 325.0 | 325.1 | ||||||||||||||||||||||||
| Other financial assets | - | - | - | - | - | - | - | 40.1 | ||||||||||||||||||||||||
| Other credits | 47.5 | 51.6 | 82.5 | 81.0 | 99.0 | 108.1 | 115.9 | 230.3 | ||||||||||||||||||||||||
| Current Assets | 3,741.5 | 4,401.3 | 4,685.0 | 3,480.6 | 4,606.2 | 5,176.1 | 5,014.7 | 4,753.6 | ||||||||||||||||||||||||
| Deferred Income tax and social contribution | 680.0 | 744.3 | 823.5 | 715.3 | 1,026.4 | 959.7 | 1,108.2 | 543.0 | ||||||||||||||||||||||||
| Advances to Suppliers | 52.5 | 65.1 | 85.5 | 46.0 | 27.5 | 39.6 | 49.7 | 21.9 | ||||||||||||||||||||||||
| Related Parties | 79.6 | 77.8 | 76.0 | 92.0 | 1,215.4 | 1,176.6 | 1,195.8 | 753.2 | ||||||||||||||||||||||||
| Recoverable Taxes | 38.8 | 36.6 | 36.0 | 55.1 | 124.5 | 123.6 | 122.2 | 111.9 | ||||||||||||||||||||||||
| Judicial Deposits | 168.9 | 173.6 | 180.9 | 218.4 | 372.5 | 491.1 | 495.6 | 509.2 | ||||||||||||||||||||||||
| Other financial assets | 367.3 | 378.2 | 392.3 | 420.4 | 290.3 | 418.6 | 415.5 | 790.4 | ||||||||||||||||||||||||
| Other non-current assets | 464.4 | 470.9 | 504.4 | 449.3 | 1,108.3 | 972.1 | 971.9 | 498.7 | ||||||||||||||||||||||||
| Investments | 267.4 | 287.5 | 294.7 | 304.1 | 333.9 | 358.1 | 368.6 | 419.0 | ||||||||||||||||||||||||
| Biological Assets | 932.8 | 873.6 | 894.8 | 1,561.1 | 795.1 | 717.0 | 767.9 | 968.0 | ||||||||||||||||||||||||
| Property, Plant and Equipment | 6,360.3 | 6,432.0 | 6,799.9 | 7,980.5 | 8,260.0 | 7,928.8 | 7,835.2 | 7,867.0 | ||||||||||||||||||||||||
| Intangible | 3,823.1 | 3,813.9 | 3,799.6 | 3,889.6 | 4,125.3 | 4,531.1 | 4,593.8 | 4,932.3 | ||||||||||||||||||||||||
| Non-current Assets | 13,235.1 | 13,353.7 | 13,887.6 | 15,731.8 | 17,679.2 | 17,716.4 | 17,924.4 | 17,414.5 | ||||||||||||||||||||||||
| Total Assets | 16,976.6 | 17,755.0 | 18,572.6 | 19,212.4 | 22,285.3 | 22,892.5 | 22,939.2 | 22,168.1 | ||||||||||||||||||||||||
| Current portion of long-term debt | 899.4 | 1,094.9 | 1,165.7 | 957.1 | 666.1 | 805.1 | 773.6 | 540.2 | ||||||||||||||||||||||||
| Derivatives | 37.4 | 96.1 | 379.0 | 132.3 | 94.3 | 29.3 | 15.7 | 9.6 | ||||||||||||||||||||||||
| Trade Accounts Payable | 716.3 | 832.1 | 754.4 | 558.8 | 621.6 | 757.5 | 765.4 | 606.0 | ||||||||||||||||||||||||
| Salaries Payable | 219.9 | 225.5 | 175.6 | 183.6 | 183.3 | 191.5 | 158.2 | 183.7 | ||||||||||||||||||||||||
| Taxes payable | 197.4 | 239.2 | 218.8 | 245.3 | 247.1 | 328.9 | 282.4 | 241.7 | ||||||||||||||||||||||||
| Dividends payable | 44.0 | 2.2 | 2.0 | 72.2 | 82.9 | 9.1 | 8.7 | 9.7 | ||||||||||||||||||||||||
| Related Parties | 120.1 | 66.0 | 74.6 | 41.2 | 186.8 | 163.2 | 228.5 | 175.5 | ||||||||||||||||||||||||
| Other Liabilities | 190.0 | 199.2 | 181.1 | 190.4 | 273.8 | 307.3 | 215.9 | 308.0 | ||||||||||||||||||||||||
| Current Liabilities | 2,424.4 | 2,755.1 | 2,951.2 | 2,380.8 | 2,355.9 | 2,591.8 | 2,448.5 | 2,074.5 | ||||||||||||||||||||||||
| Long-term debt | 5,322.7 | 5,310.8 | 5,961.7 | 6,274.9 | 3,699.4 | 4,407.8 | 4,589.9 | 4,659.2 | ||||||||||||||||||||||||
| Taxes payable | 597.3 | 605.8 | 618.2 | 639.1 | 1,123.0 | 1,180.0 | 1,184.8 | 1,202.6 | ||||||||||||||||||||||||
| Provision for judicial demands | 625.0 | 642.9 | 650.1 | 666.3 | 940.8 | 975.8 | 1,026.7 | 1,051.7 | ||||||||||||||||||||||||
| Related Parties | - | - | - | 4.4 | 371.2 | 546.3 | 468.5 | 389.7 | ||||||||||||||||||||||||
| Pension | 0.0 | 2.1 | 12.2 | 24.4 | 25.9 | 27.4 | 28.9 | 37.3 | ||||||||||||||||||||||||
| Deferred Income taxes | 1,123.6 | 1,215.6 | 1,250.9 | 1,511.0 | 3,546.4 | 3,159.1 | 3,116.5 | 2,443.4 | ||||||||||||||||||||||||
| Other non-current liabilities | 374.5 | 377.7 | 378.7 | 382.9 | 814.4 | 752.1 | 777.1 | 828.1 | ||||||||||||||||||||||||
| Non-current Assets | 8,043.0 | 8,155.0 | 8,871.7 | 9,502.9 | 10,521.0 | 11,048.4 | 11,192.3 | 10,612.0 | ||||||||||||||||||||||||
| Common stock | 5.3 | 5.3 | 5.3 | 5.3 | 5.3 | 5.3 | 5.3 | 5.3 | ||||||||||||||||||||||||
| Treasury shares | - | - | - | - | - | - | (109.4 | ) | - | |||||||||||||||||||||||
| Capital Reserve | 3,667.1 | 3,695.7 | 3,608.5 | 3,668.2 | 3,725.5 | 3,718.8 | 3,750.3 | 3,634.7 | ||||||||||||||||||||||||
| Profits Reserve | - | - | - | - | 1,872.5 | 1,773.6 | (191.4 | ) | - | |||||||||||||||||||||||
| Accumulated earnings | 531.0 | 565.1 | 588.2 | 887.3 | - | - | 1,824.9 | 1,937.3 | ||||||||||||||||||||||||
| Equity attributable to owners of the Company | 4,203.4 | 4,266.2 | 4,202.0 | 4,560.9 | 5,603.3 | 5,497.7 | 5,471.1 | 5,577.3 | ||||||||||||||||||||||||
| Equity attributable to non-controlling interests | 2,305.9 | 2,578.7 | 2,547.7 | 2,767.8 | 3,805.0 | 3,754.5 | 3,827.2 | 3,904.3 | ||||||||||||||||||||||||
| Total equity | 6,509.3 | 6,844.9 | 6,749.7 | 7,328.7 | 9,408.4 | 9,252.2 | 9,298.3 | 9,481.6 | ||||||||||||||||||||||||
| Total liabilities and equity | 16,976.6 | 17,755.0 | 18,572.6 | 19,212.4 | 22,285.3 | 22,892.5 | 22,939.2 | 22,168.1 | ||||||||||||||||||||||||
40
Statement of Cash Flow
| Statement of Cash Flows | Jun'10 | Sept'10 | Dec'10 | Mar'11 | Mar'10 | Jun'11 | Set'11 | Dec'11 | Mar'12 | Mar'12 | ||||||||||||||||||||||||||||||
| (in R$ million) | 1Q11 | 2Q11 | 3Q11 | 4Q11 | FY11 | 1Q12 | 2Q12 | 3Q12 | 4Q12 | FY12 | ||||||||||||||||||||||||||||||
| Net Income | (2.8 | ) | 238.6 | 45.8 | 486.1 | 767.7 | 1,858.1 | 84.6 | 104.3 | 145.3 | 2,192.3 | |||||||||||||||||||||||||||||
| Non-cash Adjustments: | - | - | - | - | - | - | - | - | - | - | ||||||||||||||||||||||||||||||
| Depreciation and Amortization | 290.9 | 400.0 | 380.9 | 287.2 | 1,359.0 | 303.7 | 365.5 | 254.7 | 218.8 | 1,142.8 | ||||||||||||||||||||||||||||||
| Biological Assets | 42.2 | 28.7 | (21.2 | ) | (431.5 | ) | (381.9 | ) | (20.9 | ) | 38.8 | 20.0 | (97.9 | ) | (60.1 | ) | ||||||||||||||||||||||||
| Equity income of associates | (5.8 | ) | (2.4 | ) | (7.8 | ) | (9.2 | ) | (25.2 | ) | (1.9 | ) | 1.3 | 0.0 | (32.6 | ) | (33.3 | ) | ||||||||||||||||||||||
| Stock option | - | - | - | - | - | - | - | 4.80 | 6.00 | 10.80 | ||||||||||||||||||||||||||||||
| Losses (Gains) in Fixed Assets Disposals | 3.1 | (11.8 | ) | 2.1 | (28.7 | ) | (35.3 | ) | 17.0 | (11.5 | ) | (27.6 | ) | (71.8 | ) | (93.9 | ) | |||||||||||||||||||||||
| Deferred Income and Social Contribution Taxes | (0.7 | ) | 104.4 | 16.4 | 208.9 | 329.1 | 1,197.8 | (277.7 | ) | 69.7 | (27.0 | ) | 962.8 | |||||||||||||||||||||||||||
| Interest, monetary and exchange variations, net | 167.5 | (64.9 | ) | 52.5 | 83.4 | 238.5 | (27.6 | ) | 569.6 | 136.4 | (31.9 | ) | 646.5 | |||||||||||||||||||||||||||
| Effects of formation of JVs | - | - | - | - | - | (2,871.2 | ) | 18.2 | - | 2.2 | (2,850.9 | ) | ||||||||||||||||||||||||||||
| Capital gains | - | (220.9 | ) | - | 220.9 | - | - | - | - | - | - | |||||||||||||||||||||||||||||
| Other Non-cash Items | 19.4 | 197.0 | (0.9 | ) | (207.9 | ) | 7.5 | 3.5 | 13.4 | (4.6 | ) | (18.0 | ) | (5.7 | ) | |||||||||||||||||||||||||
| Variation on Assets and Liabilities Accounts receivable | 153.3 | (153.4 | ) | 135.5 | 29.3 | 164.7 | (123.3 | ) | (105.6 | ) | (38.6 | ) | (93.8 | ) | (361.1 | ) | ||||||||||||||||||||||||
| Restricted Cash | - | - | - | (142.97 | ) | (142.97 | ) | 113.48 | 7.70 | (35.51 | ) | (6.22 | ) | 79.45 | ||||||||||||||||||||||||||
| Judicial Deposits | - | - | - | - | - | (108.1 | ) | 108.1 | - | - | - | |||||||||||||||||||||||||||||
| Inventories | (304.0 | ) | (440.8 | ) | (19.4 | ) | 848.9 | 84.6 | (326.6 | ) | (311.8 | ) | (34.7 | ) | 486.4 | (186.8 | ) | |||||||||||||||||||||||
| Taxes recoverable | - | - | - | - | - | - | - | (17.13 | ) | - | (17.13 | ) | ||||||||||||||||||||||||||||
| Related Parties | - | - | - | - | - | (1,033.6 | ) | 142.6 | (801.5 | ) | 940.9 | (751.7 | ) | |||||||||||||||||||||||||||
| Advances to Suppliers | (76.7 | ) | 16.9 | 4.9 | 71.6 | 16.8 | (122.1 | ) | 18.2 | 21.5 | (20.9 | ) | (103.3 | ) | ||||||||||||||||||||||||||
| Accounts payable | 146.9 | 115.8 | (77.7 | ) | (217.3 | ) | (32.4 | ) | 241.2 | 125.0 | 8.0 | (154.0 | ) | 220.2 | ||||||||||||||||||||||||||
| Salaries payable | 78.3 | 5.6 | (49.9 | ) | 2.2 | 36.2 | 110.9 | 5.1 | (33.3 | ) | 25.5 | 108.2 | ||||||||||||||||||||||||||||
| Provision for judicial demands from legal proceedings | 10.7 | 18.9 | (3.3 | ) | 0.6 | 26.9 | 33.1 | (33.1 | ) | 118.9 | 25.0 | 144.0 | ||||||||||||||||||||||||||||
| Derivatives | 70.7 | (214.6 | ) | (108.4 | ) | 265.6 | 13.3 | 908.8 | (1,050.0 | ) | (4.4 | ) | 33.3 | (112.3 | ) | |||||||||||||||||||||||||
| Taxes payable | (29.0 | ) | 34.2 | (23.2 | ) | (32.1 | ) | (50.1 | ) | (79.2 | ) | 1,003.4 | (59.0 | ) | 21.0 | 886.3 | ||||||||||||||||||||||||
| Other assets and liabilities, net | 39.6 | (91.9 | ) | (102.0 | ) | 105.1 | (49.2 | ) | 532.4 | (120.7 | ) | (101.3 | ) | (176.0 | ) | 134.5 | ||||||||||||||||||||||||
| - | - | - | - | |||||||||||||||||||||||||||||||||||||
| Cash Flow from Operating Activities | 603.4 | (40.4 | ) | 224.3 | 1,540.1 | 2,327.2 | 605.5 | 591.0 | (419.2 | ) | 1,174.3 | 1,951.6 | ||||||||||||||||||||||||||||
| Aquisitions, net of aquired cash and advances for future | - | - | - | (157.3 | ) | (157.3 | ) | - | - | - | (72.9 | ) | (72.9 | ) | ||||||||||||||||||||||||||
| capital increases | ||||||||||||||||||||||||||||||||||||||||
| Contributed cash to Raízen's formation | - | - | - | - | - | (173.1 | ) | 0.0 | - | - | (173.1 | ) | ||||||||||||||||||||||||||||
| Redemption of shares in subsidiary | - | - | - | - | - | - | - | - | (99.8 | ) | (99.8 | ) | ||||||||||||||||||||||||||||
| Received Dividends | - | - | - | - | - | - | - | - | 121.4 | 121.4 | ||||||||||||||||||||||||||||||
| Additions on Investments, Net of Cash Received | (3.7 | ) | (12.7 | ) | - | 16.5 | - | - | (99.1 | ) | (0.9 | ) | 57.6 | (42.3 | ) | |||||||||||||||||||||||||
| Additions on Property, Plant and Equipment | (513.9 | ) | (312.6 | ) | (533.0 | ) | (932.2 | ) | (2,291.6 | ) | (491.5 | ) | (243.3 | ) | (346.3 | ) | (503.4 | ) | (1,584.5 | ) | ||||||||||||||||||||
| Sugarcane planting and growing costs | (194.6 | ) | (198.1 | ) | (174.8 | ) | (178.2 | ) | (745.6 | ) | (217.2 | ) | (117.9 | ) | (107.0 | ) | (109.9 | ) | (552.0 | ) | ||||||||||||||||||||
| Cash Received on Sale of other Fixed Assets | 0.7 | 17.2 | 2.2 | 28.7 | 48.8 | - | 42.3 | 53.8 | 86.0 | 182.1 | ||||||||||||||||||||||||||||||
| Cash Flow from Investment Activities | (711.5 | ) | (506.2 | ) | (705.5 | ) | (1,222.5 | ) | (3,145.7 | ) | (881.8 | ) | (418.0 | ) | (400.3 | ) | (521.1 | ) | (2,221.1 | ) | ||||||||||||||||||||
| Additions of Debt | 642.4 | 495.9 | 1,101.2 | 480.0 | 2,719.5 | 1,281.1 | 483.8 | 335.9 | 245.7 | 2,346.4 | ||||||||||||||||||||||||||||||
| Payments of Principal and Interest on Debt | (561.6 | ) | (224.7 | ) | (458.2 | ) | (727.0 | ) | (1,971.6 | ) | (1,121.3 | ) | (206.0 | ) | 395.6 | (957.7 | ) | (1,889.4 | ) | |||||||||||||||||||||
| Capital Increase | - | - | - | 4.0 | 4.0 | - | - | - | - | - | ||||||||||||||||||||||||||||||
| Capital Increase by noncontrolling interests | - | 403.3 | - | (3.3 | ) | 400.0 | 139.9 | 0.0 | - | 421.0 | 560.9 | |||||||||||||||||||||||||||||
| Treasury Shares | - | - | (15.2 | ) | - | (15.2 | ) | - | (54.4 | ) | (101.2 | ) | 107.4 | (48.3 | ) | |||||||||||||||||||||||||
| Dividends | - | (192.4 | ) | - | (0.7 | ) | (193.1 | ) | - | (228.2 | ) | (4.8 | ) | (100.6 | ) | (333.7 | ) | |||||||||||||||||||||||
| Acquisition of shares of subsidiary | - | - | - | 37.1 | 37.1 | - | - | (4.6 | ) | 4.6 | - | |||||||||||||||||||||||||||||
| Related parties | - | - | - | - | - | - | - | - | - | - | ||||||||||||||||||||||||||||||
| Exchange rate variation excluding Cash and Cash | 0.0 | (9.9 | ) | 0.2 | 8.5 | (1.2 | ) | 19.3 | (0.4 | ) | (3.1 | ) | 15.8 | |||||||||||||||||||||||||||
| Cash Flows from Financing Activities | 80.8 | 472.2 | 627.9 | (201.4 | ) | 979.5 | 299.8 | 14.4 | 620.4 | (282.7 | ) | 651.9 | ||||||||||||||||||||||||||||
| - | - | 0 | - | |||||||||||||||||||||||||||||||||||||
| Total Cash Flow | (27.4 | ) | (74.4 | ) | 146.7 | 116.2 | 161.0 | 23.5 | 187.5 | (199.2 | ) | 370.529872 | 382.4 | |||||||||||||||||||||||||||
| - | - | 0 | - | |||||||||||||||||||||||||||||||||||||
| Cash & Equivalents, Beginning | 1,110.8 | 1,083.4 | 1,009.0 | (2,092.4 | ) | 1,110.8 | 1,271.8 | 1,295.3 | 1,482.9 | (2,778.1 | ) | 1,271.8 | ||||||||||||||||||||||||||||
| Cash & Equivalents, Closing | 1,083.4 | 1,009.0 | 1,155.6 | (1,976.2 | ) | 1,271.8 | 1,295.3 | 1,482.9 | 1,283.4 | (2,407.4 | ) | 1,654.1 | ||||||||||||||||||||||||||||
41
Item 2
Consolidated Financial Statements
Cosan Limited
March 31, 2012 and 2011
Cosan Limited
Consolidated financial statements
March 31, 2012,2011 and 2010
Contents
| Report of Independent Auditors | 1 |
| Consolidated statements of financial position | 3 |
| Consolidated income statements | 5 |
| Consolidated statements of changes in equity | 6 |
| Consolidated statements of comprehensive income | 7 |
| Consolidated statements of cash flows | 8 |
| Notes to the consolidated financial statements | 10 |
Report of Independent Auditors
The Board of Directors and Shareholders of
Cosan Limited
Bermuda
We have audited the accompanying consolidated financial statements of Cosan Limited, which comprise the consolidated statement of financial position as at March 31, 2012, and the consolidated income statement, consolidated statement of comprehensive income, consolidated statement of changes in equity and consolidated statement of cash flows for the year then ended, and a summary of significant accounting policies and other explanatory information.
Management’s responsibility for the consolidated financial statements
Management is responsible for the preparation and fair presentation of these consolidated financial statements in accordance with International Financial Reporting Standards (IFRS) as issued by the International Accounting Standards Board (IASB), and for the internal controls management determined as necessary to enable the preparation of consolidated financial statements free from material misstatement, regardless of whether due to fraud or error.
Independent auditors’ responsibility
Our responsibility is to express an opinion on these consolidated financial statements based on our audit. We conducted our audit in accordance with International Standards on Auditing. Those standards require that we comply with ethical requirements and plan and perform the audit to obtain reasonable assurance about whether the consolidated financial statements are free from material misstatement.
An audit involves performing procedures to obtain audit evidence about the amounts and disclosures in the consolidated financial statements. The procedures selected depend on the auditor’s judgment, including the assessment of the risks of material misstatement of the consolidated financial statements, whether due to fraud or error. In making those risk assessments, the auditor considers internal control relevant to the entity’s preparation and fair presentation of the consolidated financial statements in order to design audit procedures that are appropriate in the circumstances, but not for the purpose of expressing an opinion on the effectiveness of the entity’s internal control. An audit also includes evaluating the appropriateness of accounting policies used and the reasonableness of accounting estimates made by management, as well as evaluating the overall presentation of the consolidated financial statements.
We believe that the audit evidence we have obtained is sufficient and appropriate to provide a basis for our audit opinion.
1
Opinion
In our opinion, the consolidated financial statements referred to above present fairly, in all material respects, the consolidated financial position of Cosan Limited as at March 31, 2012, and the consolidated results of its operations and its cash flows for the year then ended in accordance with International Financial Reporting Standards (IFRS) as issued by the International Accounting Standards Board (IASB).
São Paulo, Brazil, May 30, 2012
ERNST & YOUNG TERCO
Auditores Independentes S.S.
Luiz Carlos Nannini
Partner
2
| Cosan Limited |
| Consolidated statements of financial position |
| March 31, 2012 and 2011 |
| (In thousands of Reais) |
| Note | 2012 | 2011 | |||||||||
| Asset | |||||||||||
| Current | |||||||||||
| Cash and cash equivalents | 3 | 1,654,146 | 1,271,780 | ||||||||
| Restricted cash | 4 | 94,268 | 187,944 | ||||||||
| Accounts receivable | 6 | 963,587 | 594,857 | ||||||||
| Derivatives | 26 | 19,590 | 55,682 | ||||||||
| Inventories | 7 | 748,150 | 670,331 | ||||||||
| Related parties | 9 | 678,374 | 14,669 | ||||||||
| Recoverable taxes | 8 | 325,096 | 374,991 | ||||||||
| Other financial assets | 5 | 40,080 | - | ||||||||
| Other credits | 230,289 | 310,348 | |||||||||
| 4,753,580 | 3,480,602 | ||||||||||
| Non-current | |||||||||||
| Deferred Income tax and social contribution | 17 | 543,024 | 116,985 | ||||||||
| Advances to suppliers | 21,865 | 46,037 | |||||||||
| Related parties | 9 | 753,153 | 91,954 | ||||||||
| Recoverable taxes | 8 | 111,856 | 55,066 | ||||||||
| Judicial deposits | 18 | 509,235 | 218,372 | ||||||||
| Other financial assets | 5 | 790,402 | 420,417 | ||||||||
| Other non-current assets | 498,734 | 449,284 | |||||||||
| Equity method investments | 11 | 419,029 | 304,142 | ||||||||
| Biological assets | 12 | 968,023 | 1,561,132 | ||||||||
| Property, plant and equipment | 13 | 7,866,963 | 7,980,524 | ||||||||
| Intangible assets | 14 | 4,932,255 | 3,889,575 | ||||||||
| 17,414,539 | 15,133,488 | ||||||||||
| Total assets | 22,168,119 | 18,614,090 | |||||||||
3
| Note | 2012 | 2011 | |||||||||
| Liabilities | |||||||||||
| Current | |||||||||||
| Current portion of long-term debt | 15 | 540,237 | 957,134 | ||||||||
| Derivatives | 26 | 9,611 | 132,289 | ||||||||
| Trade accounts payable | 606,029 | 558,766 | |||||||||
| Salaries payable | 183,660 | 183,560 | |||||||||
| Taxes payable | 16 | 241,719 | 245,284 | ||||||||
| Dividends payable | 9,725 | 72,229 | |||||||||
| Related parties | 9 | 175,488 | 41,163 | ||||||||
| Other current liabilities | 307,994 | 190,381 | |||||||||
| 2,074,463 | 2,380,806 | ||||||||||
| Non-current | |||||||||||
| Long-term debt | 15 | 4,659,152 | 6,274,895 | ||||||||
| Taxes payable | 16 | 1,202,624 | 639,071 | ||||||||
| Provision for judicial demands | 18 | 1,051,677 | 666,282 | ||||||||
| Related parties | 9 | 389,718 | 4,444 | ||||||||
| Pension | 27 | 37,312 | 24,380 | ||||||||
| Deferred Income taxes | 17 | 2,443,430 | 912,617 | ||||||||
| Other non-current liabilities | 828,120 | 382,898 | |||||||||
| 10,612,033 | 8,904,587 | ||||||||||
| Equity | 20 | ||||||||||
| Common Stock | 5,328 | 5,328 | |||||||||
| Capital reserve | 3,635,308 | 3,668,218 | |||||||||
| Accumulated earnings | 1,936,687 | 887,336 | |||||||||
| Equity attributable to owners of the Company | 5,577,323 | 4,560,882 | |||||||||
| Equity attributable to non-controlling interests | 3,904,300 | 2,767,815 | |||||||||
| Total equity | 9,481,623 | 7,328,697 | |||||||||
| Total liabilities and equity | 22,168,119 | 18,614,090 | |||||||||
See accompanying notes to consolidated financial statements.
4
Cosan Limited
Consolidated income statements
Years ended March 31, 2012, 2011 and 2010
(In thousands of Reais, except otherwise stated )
| Note | 2012 | 2011 | 2010 | ||||||||||||
| Net sales | 22 | 24,096,881 | 18,063,480 | 15,336,055 | |||||||||||
| Cost of goods sold | 23 | (21,465,009 | ) | (15,150,079 | ) | (13,271,331 | ) | ||||||||
| Gross profit | 2,631,872 | 2,913,401 | 2,064,724 | ||||||||||||
| Operational income /(expenses) | |||||||||||||||
| Selling | 23 | (1,136,285 | ) | (1,026,000 | ) | (862,726 | ) | ||||||||
| General and administrative | 23 | (646,041 | ) | (545,450 | ) | (501,676 | ) | ||||||||
| Other, net | 25 | 145,550 | (33,828 | ) | 37,523 | ||||||||||
| Gain on tax recovery program | 16 | - | - | 270,333 | |||||||||||
| Gain on the de-recognition of subsidiaries to form the JVs | 21 | 2,752,730 | - | - | |||||||||||
| 1,115,954 | (1,605,278 | ) | (1,056,546 | ) | |||||||||||
| Income before financial results, equity income of associates and income taxes | 3,747,826 | 1,308,123 | 1,008,178 | ||||||||||||
| Equity income of associates | 11 | 33,268 | 25,187 | 4,178 | |||||||||||
| Financial results, net | 24 | (478,549 | ) | (151,147 | ) | 493,441 | |||||||||
| (445,281 | ) | (125,960 | ) | 497,619 | |||||||||||
| Income before income tax | 3,302,545 | 1,182,164 | 1,505,797 | ||||||||||||
| Income taxes | |||||||||||||||
| Current | 17 | (147,455 | ) | (85,437 | ) | (78,381 | ) | ||||||||
| Deferred | 17 | (962,758 | ) | (329,071 | ) | (344,923 | ) | ||||||||
| Net income for the year | 2,192,332 | 767,656 | 1,082,493 | ||||||||||||
| Net income attributable to non-controlling interests | (1,010,990 | ) | (296,750 | ) | (376,399 | ) | |||||||||
| Net income attributable to owners of the Company | 1,181,342 | 470,906 | 706,094 | ||||||||||||
| Earnings per share attributable to owners of the Company – Basic and Diluted (In Reais) | 20 | $ | R 4.40 | $ | R 1.74 | $ | R 2.61 | ||||||||
See accompanying notes to consolidated financial statements
5
Cosan Limited
Consolidated statement of changes in equity
Years ended March 31, 2012, 2011 and 2010
(In Thousands of Reais)
| Capital reserve | ||||||||||||||||||||||||||||
Common stock | Additional paid in capital | Other components of equity | Accumulated earnings (losses) | Total | Non-controlling interests | Total equity | ||||||||||||||||||||||
| April 1, 2009 | 5,328 | 3,723,728 | (62,688 | ) | (170,370 | ) | 3,495,998 | 1,171,929 | 4,667,927 | |||||||||||||||||||
| Acquisition of Teaçu | - | 100,143 | - | - | 100,143 | 207,368 | 307,511 | |||||||||||||||||||||
| Issuance of subsidiary shares to non-controlling interest | - | 78,407 | - | - | 78,407 | 423,859 | 502,266 | |||||||||||||||||||||
| Acquisition of non-controlling interest subsidiary | - | (34,957 | ) | - | - | (34,957 | ) | (22,633 | ) | (57,590 | ) | |||||||||||||||||
| Exercise of stock option | - | (4,450 | ) | (20 | ) | - | (4,470 | ) | 10,472 | 6,002 | ||||||||||||||||||
| Exercise of common stock warrants | - | (43,641 | ) | 309 | - | (43,332 | ) | 138,416 | 95,084 | |||||||||||||||||||
| Acquisition of TEAS | - | - | - | - | - | 15,873 | 15,873 | |||||||||||||||||||||
| Cumulative translation adjustment - CTA | - | - | (133,575 | ) | - | (133,575 | ) | (1,111 | ) | (134,686 | ) | |||||||||||||||||
| Pension | - | - | 25,739 | - | 25,739 | 16,317 | 42,056 | |||||||||||||||||||||
| Share based compensation | - | 5,451 | - | - | 5,451 | 3,520 | 8,971 | |||||||||||||||||||||
| \Net income | - | - | - | 706,094 | 706,094 | 376,399 | 1,082,493 | |||||||||||||||||||||
| Dividends | - | - | - | - | - | (43,981 | ) | (43,981 | ) | |||||||||||||||||||
| March 31, 2010 | 5,328 | 3,824,681 | (170,235 | ) | 535,724 | 4,195,498 | 2,296,428 | 6,491,926 | ||||||||||||||||||||
Exercise of stock option | - | (1,018 | ) | (44 | ) | - | (1,062 | ) | 6,409 | 5,347 | ||||||||||||||||||
| Treasury shares | - | (9,465 | ) | - | - | (9,465 | ) | (5,754 | ) | (15,219 | ) | |||||||||||||||||
| Issuance of common stock by Rumo to non-controlling shareholders´ | - | 128,363 | - | - | 128,363 | 271,637 | 400,000 | |||||||||||||||||||||
| Acquisition of Logispot | - | - | - | - | 64,277 | 64,277 | ||||||||||||||||||||||
| Hedge accounting | - | - | (89,117 | ) | - | (89,117 | ) | (54,181 | ) | (143,298 | ) | |||||||||||||||||
| Cumulative translation adjustment - CTA | - | - | (4,180 | ) | - | (4,180 | ) | 131 | (4,049 | ) | ||||||||||||||||||
| Pension | - | - | (12,087 | ) | - | (12,087 | ) | (7,349 | ) | (19,436 | ) | |||||||||||||||||
| Adjustment from impact recorded directly in equity of subsidiary | - | (522 | ) | - | - | (522 | ) | (821 | ) | (1,343 | ) | |||||||||||||||||
| Share based compensation | - | 1,842 | - | - | 1,842 | 1,119 | 2,961 | |||||||||||||||||||||
| Net income | - | - | - | 470,906 | 470,906 | 296,750 | 767,656 | |||||||||||||||||||||
| Dividends | - | - | - | (119,294 | ) | (119,294 | ) | (100,831 | ) | (220,125 | ) | |||||||||||||||||
| March 31, 2011 | 5,328 | 3,943,881 | (275,663 | ) | 887,336 | 4,560,882 | 2,767,815 | 7,328,697 | ||||||||||||||||||||
Hedge accounting | - | - | 33,126 | 33,126 | 20,014 | 53,140 | ||||||||||||||||||||||
| Hedge accounting – reversal of OCI upon deconsolidation of subsidiaries and formation of the JVs | - | - | 64,961 | 64,961 | 39,311 | 104,272 | ||||||||||||||||||||||
| Cumulative translation adjustment - CTA | - | - | 15,790 | 15,790 | 4,934 | 20,724 | ||||||||||||||||||||||
| Pension | (14,758 | ) | (14,758 | ) | (8,931 | ) | (23,689 | ) | ||||||||||||||||||||
| Share based compensation | - | 6,728 | - | 6,728 | 4,072 | 10,800 | ||||||||||||||||||||||
| Capital contribution to Rumo by noncontrolling shareholders | - | - | (1,993 | ) | (1,993 | ) | 77,864 | 75,871 | ||||||||||||||||||||
| Other | - | 700 | 11,000 | 11,700 | (2,612 | ) | 9,088 | |||||||||||||||||||||
| Acquisition of treasury shares by subsidiaries | - | - | (30,065 | ) | (30,065 | ) | (18,193 | ) | (48,258 | ) | ||||||||||||||||||
| Non-controlling shareholder contribution to Raízen Combustíveis JV | - | - | - | - | 9,036 | 9,036 | ||||||||||||||||||||||
| Acquisition of treasury shares | - | (109,392 | ) | - | (109,392 | ) | - | (109,392 | ) | |||||||||||||||||||
| Net income | - | - | - | 1,181,342 | 1,181,342 | 1,010,990 | 2,192,332 | |||||||||||||||||||||
| Dividends | - | - | - | (140,998 | ) | (140,998 | ) | - | (140,998 | ) | ||||||||||||||||||
| March 31, 2012 | 5,328 | 3,841,917 | (206,609 | ) | 1,936,687 | 5,577,323 | 3,904,300 | 9,481,623 | ||||||||||||||||||||
6
Cosan Limited
Consolidated statement of comprehensive income
Years ended March 31, 2012, 2011 and 2010
(In Thousands of Reais)
| 2012 | 2011 | 2010 | ||||||||||
| Net Income | 2,192,332 | 767,656 | 1,082,493 | |||||||||
| Other comprehensive income (loss) | ||||||||||||
| Exchange differences on translation of foreign operations - CTA | 20,724 | (4,049 | ) | (134,685 | ) | |||||||
| Net movement on cash flow hedge | 238,503 | (217,117 | ) | - | ||||||||
| Actuarial gains and losses defined benefit plans | (35,892 | ) | (29,447 | ) | 63,721 | |||||||
| Income tax effects | (68,888 | ) | 83,830 | (21,665 | ) | |||||||
| 154,447 | (166,783 | ) | (92,629 | ) | ||||||||
| Other comprehensive income for the year, net of tax | ||||||||||||
| Total comprehensive Income for the year, net of tax | 2,346,779 | 600,873 | 989,864 | |||||||||
| Attributed to: | ||||||||||||
| Owners of the Company | 1,280,461 | 365,521 | 598,258 | |||||||||
| Non-controlling interests | 1,066,318 | 235,351 | 391,606 | |||||||||
See accompanying notes to consolidated financial statements.
7
Cosan Limited
Consolidated statements of cash flows
Years ended March 31, 2012, 2011 and 2010
(In Thousands of Reais)
| 2012 | 2011 | 2010 | ||||||||||
| Operating activities | ||||||||||||
| Net income | 2,192,332 | 767,656 | 1,082,493 | |||||||||
| Non-cash adjustments to reconcile net income to net cash flows from operating activities | ||||||||||||
| Depreciation and amortization | 1,142,780 | 1.359.000 | 1.127.960 | |||||||||
| Biological assets | (60,093 | ) | (381.894 | ) | (44.871 | ) | ||||||
| Equity income of associates | (33,268 | ) | (25,187 | ) | (4,178 | ) | ||||||
| Gain on disposal of property, plant and equipment | (93,892 | ) | (35,295 | ) | (80,466 | ) | ||||||
| Goodwill write off aviation business | - | - | 41,066 | |||||||||
| Share based compensation expenses | 10,800 | 2,961 | 8,971 | |||||||||
| Deferred income taxes | 962,758 | 329,071 | 344,923 | |||||||||
| Gain on tax recovery program | - | - | (270,333 | ) | ||||||||
| Gain on the de-recognition of subsidiaries operations to form the JVs | (2,850,868 | ) | - | - | ||||||||
| Interest, monetary and exchange variations, net | 646,527 | 238,482 | (185,280 | ) | ||||||||
| Other, net | (5,711 | ) | 4,584 | (26,858 | ) | |||||||
| 1,911,365 | 2,259,378 | 1,993,427 | ||||||||||
| Changes in Assets / Liabilities | ||||||||||||
| Accounts receivable | (361,147 | ) | 164,693 | 2,415 | ||||||||
| Restricted cash | 79,452 | (142,972 | ) | (33,215 | ) | |||||||
| Inventories | (186,775 | ) | 84,951 | 380,253 | ||||||||
| Taxes recoverable | (17,126 | ) | (50,068 | ) | (36,572 | ) | ||||||
| Advances to suppliers | (103,294 | ) | 16,779 | 66,542 | ||||||||
| Accounts payable | 220,213 | (32,361 | ) | (46,515 | ) | |||||||
| Provision for judicial demands from legal proceedings | 143,960 | 26,859 | 25,829 | |||||||||
| Salaries payable | 108,177 | 36,224 | 30,565 | |||||||||
| Derivatives | (112,281 | ) | 13,347 | (231,043 | ) | |||||||
| Taxes payable | 886,283 | 75,639 | 311,360 | |||||||||
| Related parties | (751,679 | ) | (5,536 | ) | 111,953 | |||||||
| Other assets and liabilities, net | 134,491 | (119,692 | ) | (399,172 | ) | |||||||
| Net Cash Flow from Operating Activities | 1,951,639 | 2,327,241 | 2,175,827 | |||||||||
8
Cosan Limited
Consolidated statements of cash flows (Continued)
Years ended March 31, 2012, 2011 and 2010
(In Thousands of Reais)
| 2012 | 2011 | 2010 | ||||||||||
| Investing Activities | ||||||||||||
| Acquisitions , net of cash acquired | (72,930 | ) | (157,345 | ) | (16,041 | ) | ||||||
| Cash contributed upon the formation of Raizen | (173,116 | ) | - | - | ||||||||
| Redemption of shares in subsidiary | (99,784 | ) | - | - | ||||||||
| Dividends received | 121,433 | - | - | |||||||||
| Additions to investments | (42,328 | ) | - | - | ||||||||
| Purchase of property, plant and equipment, software and intangible assets | (1,584,543 | ) | (2,291,647 | ) | (1,897,965 | ) | ||||||
| Sugar-cane planting and growing costs | (551,974 | ) | (745,572 | ) | (647,467 | ) | ||||||
| Proceeds from sale of aviation business | - | - | 115,601 | |||||||||
| Proceeds from sale of property, plant and equipment | 182,116 | 48,832 | 10,613 | |||||||||
| Net Cash Flow used Investing Activities | (2,221,126 | ) | (3,145,732 | ) | (2,435,259 | ) | ||||||
| Financing Activities | ||||||||||||
| Proceeds from long-term debt | 2,346,396 | 2,719,522 | 3,471,462 | |||||||||
| Repayment of long-term debt | (1,889,362 | ) | (1,971,579 | ) | (3,148,837 | ) | ||||||
| Capital increase | - | 3,996 | 147,697 | |||||||||
| Cash proceeds from non-controlling interests | 560,946 | 400,000 | - | |||||||||
| Treasury shares | (48,258 | ) | (15,219 | ) | - | |||||||
| Dividends paid | (333,659 | ) | (193,095 | ) | - | |||||||
| Related parties | - | 37,072 | (152,442 | ) | ||||||||
| Net cash flows from financing activities | 636,063 | 980,697 | 317,880 | |||||||||
| Impact of foreign currency exchange on cash and cash equivalent balances | 15,790 | (1,192 | ) | (125,618 | ) | |||||||
| Net increase in Cash and Cash Equivalents | 382,366 | 161,014 | (67,170 | ) | ||||||||
| Cash and cash equivalents at the beginning of the year | 1,271,780 | 1,110,766 | 1,177,936 | |||||||||
| Cash and cash equivalents at the end of the year | 1,654,146 | 1,271,780 | 1,110,766 | |||||||||
| Supplemental disclosure of cash flow information | ||||||||||||
| Financial interest expenses paid | 305,527 | 450,051 | 388,854 | |||||||||
| Income taxes paid | 179,655 | 38,844 | 62,337 | |||||||||
| Issuance of shares for acquisitions of Curupay | - | - | 624,192 | |||||||||
| Issuance of subsidiary shares (Rumo) for acquisition of Teaçu | - | - | 261,777 | |||||||||
See accompanying notes to consolidated financial statements
9
Cosan Limited
Notes to the consolidated financial statement
Years ended March 31, 2012, 2011 and 2010
(In thousands of Reais, except otherwise stated)
| 1. | Operations |
Cosan Limited (“Cosan” and “the Company”) was incorporated in Bermuda on April 30, 2007. Its shares are traded on the New York Stock Exchange (NYSE – CZZ) and in the São Paulo Stock Exchange (BM&F Bovespa – CZLT11). Mr. Rubens Ometto Silveira Mello is the ultimate controlling shareholder of the Company. Cosan Limited controls Cosan S.A. Indústria e Comércio and its subsidiaries (“Cosan S.A.”) with a 62.30 % interest.
Cosan S.A.’s, through its subsidiaries and jointly controlled entities, primary activities are in the following business segments: (i) Sugar & Ethanol: the production of sugar and ethanol, as well as the energy cogeneration produced from sugar cane bagasse, through its joint venture named Raízen Energia Participações S.A. (“Raízen Energia”); (ii) Fuel Distribution through its joint venture named Raízen Combustíveis S.A. (“Raízen Combustíveis”); (iii) Logistics services including transportation, port lifting and storage of sugar, through its subsidiary Novo Rumo Logística S.A. (Rumo); (iv) Production and distribution of lubricants licensed by Mobil trademark and, (v) since July 1, 2011, the activity of purchasing and selling of sugar in the retail segment, which is performed by Raízen Energia which was acquired by the Company, and assigned to a new segment named “Cosan Alimentos” (Note 10).
On June 1, 2011, the Company completed, jointly with Royal Dutch Shell ("Shell"), the formation of two entities under joint control ("joint ventures" or “JVs”): (i) Raizen Combustíveis, in the fuel distribution segment, and (ii) Raizen Energia, in the segment of production and trade of sugar, ethanol and energy cogeneration. Cosan S.A. and Shell share control of the two entities, with each company holding 50% of the economic and voting control. Cosan recorded its investments in the joint ventures through proportionate consolidation. Cosan contributed with its sugar, ethanol, cogeneration and fuel distribution business in the formation of the joint ventures. Shell contributed its fuel distribution business in Brazil and interests in two entities involved in activities related to research and development of second generation ethanol (Iogen and Codexis), the license to use the Shell brand in the amount of R$ 533 million and a cash contribution of approximately R$ 1.8 billion over a period of two years. The accounting effects arising from the formation of Raizen Combustíveis and Raizen Energia are presented in Note 21, which included the recording of the underlying net assets of the joint ventures’ net assets at their estimated fair value, and recording a large gain on the deconsolidation of the previous subsidiaries. Accordingly, the Company’s consolidated financial position and results of operations for periods subsequent to the joint venture formation are not necessarily comparable to pre-formation amounts.
The logistics of commodities and lubricants distribution business, together with the investment in Radar Propriedades Agrícolas S.A. ("Radar") were not contributed to the joint ventures.
10
Cosan Limited
Notes to the consolidated financial statement (Continued)
Years ended March 31, 2012, 2011 and 2010
(In thousands of Reais, except otherwise stated)
| 2. | Summary of significant accounting policies |
| 2.1. | Basis of Preparation |
The consolidated financial statements of Company have been prepared in accordance with International Financial Reporting Standards (IFRS) as issued by the International Accounting Standards Board (IASB).
These consolidated financial statements were authorized for issue by the Audit Committee on May 30, 2012.
| a) | Basis of preparation |
The consolidated financial statements have been prepared on a historical cost basis, except for derivative financial instruments and biological assets that have been measured at fair value.
| b) | Functional and presentation currency |
The consolidated financial statements are presented in Brazilian reais. However, the functional currency of Cosan is the U.S. dollar. The Brazilian real is the currency of the primary economic environment in which Cosan S.A. and its subsidiaries, located in Brazil, operate and generate and expend cash and is the functional currency, except for the foreign subsidiaries in which U.S. dollar is the functional currency.
The financial statements of each subsidiary included in the consolidation and equity method investments are prepared based on the functional currency of each company. Cosan, certain subsidiaries and equity method investments with a functional currency other than Brazilian reais, had their assets and liabilities converted into Brazilian reais at the exchange rate as of year end and their revenues and expenses were converted by applying the average monthly rates.
The exchange rate of the Brazilian real (R$) to the U.S. dollar (US$) was R$1.8221=US$1.00 at March 31, 2012, R$1.6287=US$1.00 at March 31, 2011 and R$1.7810=US$1.00 at March 31, 2010.
| c) | Significant accounting judgments, estimates and assumptions |
The preparation of the Company’s consolidated financial statements requires management to make judgments, estimates and assumptions that affect the reported amounts of revenues, expenses, assets and liabilities at the end of the reporting period. Such estimates and assumptions are reviewed on a continuous basis and changes are recognized in the period in which the estimates are revised and in any future periods affected.
11
Cosan Limited
Notes to the consolidated financial statement (Continued)
Years ended March 31, 2012, 2011 and 2010
(In thousands of Reais, except otherwise stated)
| 2. | Summary of significant accounting policies (Continued) |
| 2.1. | Basis of Preparation (Continued) |
| c) | Significant accounting judgments, estimates and assumptions (Continued) |
A significant change in the facts and circumstances on which judgments, estimates and assumptions are based, may cause a material impact on the results and financial condition of the Company. The significant judgments, estimates and assumptions are as follows:
Deferred income taxes and social contribution
Deferred tax assets are recognized for all unused tax losses to the extent that it is probable that taxable profit will be available against which the losses can be utilized. Significant management judgment is required to determine the amount of deferred tax assets that can be recognized, based upon the likely timing and the level of future taxable profits together with future tax planning strategies. For further detail on deferred income taxes see Note 17.
Biological assets
Biological assets are measured at fair value at each reporting date and the effects of changes in fair value between the periods are allocated directly to cost of goods sold. For further detail on the assumptions used see Note 12.
Intangible assets and property, plant and equipment (“P, P&E”)
The calculation of depreciation and amortization of intangible assets and P,P&E includes the estimation of the useful lives. Also, the determination of the acquisition date fair value of intangible assets and P,P&E acquired in business combinations or rising from the formation of a JV is a significant estimate.
The Company annually performs a review of impairment indicators for intangible assets and P,P&E. Also, an impairment test is undertaken for goodwill. An impairment exists when the carrying value of an asset or cash generating unit exceeds its recoverable amount, which is the higher of its fair value less costs to sell and its value in use. The key assumptions used to determine the recoverable amount for the different cash generating units for which goodwill is allocated are further explained in Note 14.
Share based payments
Cosan S.A. measures the cost of equity-settled transactions with employees by reference to the fair value of the equity instruments at the date at which they are granted. The estimation of fair value for share-based payment transactions requires determining the most appropriate valuation model, which is dependent on the terms and conditions of the grant. This estimate also requires determining the most appropriate inputs to the valuation model including the assumption of the expected life of the share option, volatility and dividend yield. The assumptions and models used for estimating fair value for share-based payment transactions are disclosed in Note 28.
12
Cosan Limited
Notes to the consolidated financial statement (Continued)
Years ended March 31, 2012, 2011 and 2010
(In thousands of Reais, except otherwise stated)
| 2. | Summary of significant accounting policies (Continued) |
| 2.1. | Basis of Preparation (Continued) |
Pension benefits
The cost of defined benefit pension plans and other post employment medical benefits and the present value of the pension obligation is determined using actuarial valuations. An actuarial valuation involves making various assumptions which may differ from actual results in the future. These include the determination of the discount rate, future salary increases, mortality rates and future pension increases. A defined benefit obligation is highly sensitive to changes in these assumptions. All assumptions are reviewed at each reporting date. Further details about the assumptions used are included in Note 27.
Fair value measurement of contingent consideration
Contingent consideration, resulting from business combinations, is valued at fair value at the acquisition date.
Fair value of financial instruments
When the fair value of financial assets and liabilities recorded in the statement of financial position cannot be derived from active markets, their fair value is determined using valuation techniques including the discounted cash flow model. The inputs to these models are taken from observable markets where possible, but where this is not feasible, a degree of judgment is required in establishing fair values. The judgments include considerations of inputs such as liquidity risk, credit risk and volatility. Changes in assumptions about these factors could affect the reported fair value of financial instruments. For further details on financial instruments refer to Note 26.
| (d) | Reclassifications and other adjustments |
Certain amounts in the prior year consolidated financial statements have been adjusted (reclassified) so as to conform with current year presentations. These adjustments include:
| · | Deferred tax asset and liability balances of R$598,348 related the same taxing jurisdiction have been offset in the March 31, 2011 consolidated balance sheet. |
| · | The starting point for the consolidated statement of cash flows is “net income” for all periods. In previous presentations, the Company had started its consolidated statement of cash flows with “net income attributable to owners of the Company” This change resulted in a reclassification from “non-controlling interests” and has no impact on cash flows from operating activities. Also, certain reclassifications have been made between depreciation and amortization and biological assets captions within operating activities to conform with current year presentation. |
13
Cosan Limited
Notes to the consolidated financial statement (Continued)
Years ended March 31, 2012, 2011 and 2010
(In thousands of Reais, except otherwise stated)
| 2. | Summary of significant accounting policies (Continued) |
| 2.2 | Basis of consolidation |
The consolidated financial statements include the accounts of Cosan, its subsidiaries and jointly controlled entities. The Subsidiaries and jointly controlled subsidiaries are listed below:
| 2012 | 2011 | 2010 | ||||||||||
| Direct interest subsidiary | ||||||||||||
| Cosan S.A. Indústria e Comercio | 62.30 | % | 62.20 | % | 62.30 | % | ||||||
Interest of Cosan S.A. Indústria e Comércio in its subsidiaries and jointly controlled entities:
| Subsidiaries | 2012 | 2011 | 2010 | |||||||||
| Administração de Participações Aguassanta Ltda. | 91,50 | % | 91.50 | % | 91.50 | % | ||||||
| Bioinvestments Negócios e Participações S.A. | 100 | % | 91.50 | % | 99.90 | % | ||||||
| Vale da Ponte Alta S.A. | 100 | % | 91.50 | % | 99.90 | % | ||||||
| Águas da Ponte Alta S.A. | 100 | % | 91.50 | % | 99.90 | % | ||||||
| Proud Participações S.A. | 100 | % | 99.90 | % | 99.90 | % | ||||||
| Cosan Distribuidora de Combustíveis Ltda. | - | 99.90 | % | 99.90 | % | |||||||
| Cosan Overseas Limited | 100 | % | 100 | % | - | |||||||
| Pasadena Empreendimentos e Participações S.A. | 100 | % | 100 | % | 100 | % | ||||||
| Cosan Cayman Finance Limited | 100 | % | 100 | % | - | |||||||
| Cosan Cayman II Limited | 100 | % | - | - | ||||||||
| Cosan Lubrificantes e Especialidades S.A. (former Cosan Combustíveis e Lubrificantes S.A.) | 100 | % | 100 | % | 100 | % | ||||||
| CCL Cayman Finance Limited | 100 | % | 100 | % | - | |||||||
| Copsapar Participações S.A. | 90 | % | 90 | % | 90 | % | ||||||
| Novo Rumo Logística S.A. | 92.90 | % | 92.90 | % | 92.90 | % | ||||||
| Rumo Logística S.A. | - | 69.70 | % | 90 | % | |||||||
| Handson Participações S.A. | 100 | % | - | - | ||||||||
| Docelar Alimentos e Bebidas S.A. | 99.90 | % | 99.90 | % | 99.90 | % | ||||||
| Cosan Operadora Portuária S.A. | 69.70 | % | 69.70 | % | 90 | % | ||||||
| Teaçú Armazéns Gerais S.A. | - | 69.70 | % | 90 | % | |||||||
| Logispot Armazéns Gerais S.A. | 35.50 | % | 35.50 | % | - | |||||||
| Stallion S.A. | 100 | % | ||||||||||
| Jointly-Controlled entities | ||||||||||||
| Raízen S.A. (1) | 50 | % | - | - | ||||||||
| Raízen Energia Participações S.A. (1) (2) | 50 | % | - | - | ||||||||
| Raízen Combustíveis S.A. (1) (2) | 50 | % | - | - | ||||||||
| IPUTI Empreendimentos e Participações S.A. (1) | 50 | % | - | - | ||||||||
| (1) | Company jointly-controlled with Shell. |
| (2) | Represents voting and economic interest. Cosan S.A. holds 51% of the outstanding shares of Raízen Energia, and 49% of the outstanding shares of Raízen Combustíveis. |
The subsidiaries are fully consolidated from the date of acquisition of control, and continue to be consolidated until the date that control ceases to exist. The jointly controlled entities are consolidated proportionally from the date of acquisition of joint control until the date that joint control ceases to exist.
The financial statement of subsidiaries and jointly controlled entities are prepared for the same disclosure period as that of the parent company, using consistent accounting policies. All balances held between the subsidiary companies and jointly controlled entities, income and expenses and unrealized gains and losses derived from intercompany transactions are eliminated.
14
Cosan Limited
Notes to the consolidated financial statement (Continued)
Years ended March 31, 2012, 2011 and 2010
(In thousands of Reais, except otherwise stated)
| 2. | Summary of significant accounting policies (Continued) |
| 2.2 | Basis of consolidation (Continued) |
Any change in the ownership interest of a subsidiary that does not result in loss of control is accounted for as an equity transaction.
The Company holds an interest in jointly controlled, in which entrepreneurs maintain contractual arrangement establishes joint control. The Company recognizes its interest in jointly controlled using the proportional consolidation in its consolidated financial statement.
The financial statements of jointly controlled are prepared for the same period the company's disclosure.
Adjustments are made where necessary to align with the accounting policies adopted by the Company.
| 2.3 | Summary of significant accounting practices |
The accounting policies listed below have been consistently applied to all years presented in these consolidated financial statements and have been applied consistently by the subsidiaries and jointly-controlled entities.
| a) | Revenue recognition |
Revenues from the sale of products or goods are recognized when the entity transfers to the buyer the significant risks and rewards incidental to ownership of the goods and merchandise, and when it is probable that the economic benefits associated with the transaction will flow to the Company. The sales prices are fixed based on purchase orders or contracts. Services or goods for which payment is made in advance are recorded as deferred revenue under the caption other liabilities and recorded as revenue upon delivery of goods or performance of services.
| b) | Foreign currency transactions |
Transactions in foreign currencies are initially recorded at the functional currency rates, prevailing at the date of the transaction. Monetary assets and liabilities denominated in foreign currencies are retranslated at the functional currency spot rate of exchange at the reporting date. Non-monetary items that are measured in terms of historical cost in a foreign currency are translated using the exchange rates as at the dates of the initial transactions.
15
Cosan Limited
Notes to the consolidated financial statement (Continued)
Years ended March 31, 2012, 2011 and 2010
(In thousands of Reais, except otherwise stated)
| 2. | Summary of significant accounting policies (Continued) |
| 2.3. | Summary of significant accounting practices (Continued) |
| c) | Financial instruments – Recognition initial and subsequent measurement |
| (i) | Financial assets |
Initial recognition and measurement
Financial assets are classified into the following categories: at fair value through profit or loss, held-to-maturity, available for sale and loans and receivables. The Company determines the classification of its financial assets upon initial recognition.
Financial assets are initially recognized at fair value, plus, in the case of investments not designated at fair value through profit or loss, transaction costs that are directly attributable to the acquisition of financial assets.
Financial assets include cash and cash equivalents, restricted cash, accounts receivable, other receivables and derivative financial instruments.
Subsequent measurement
The subsequent measurement of financial assets depends on their classification, which can be as follows:
Financial assets at fair value through profit or loss
Financial assets at fair value through profit or loss include financial assets held for trading and assets designated upon initial recognition at fair value through profit and loss. They are classified as held for trading if they were acquired with the purpose of selling or repurchasing in the short term. Derivatives are also measured at fair value through profit or loss, except those designated as hedging instruments. Interest, monetary and exchange variations and changes arising from the valuation at fair value are recognized in the income statement when incurred in the line of revenue or expense.
Loans and receivables
Loans and receivables are non-derivative financial assets with fixed or determinable payments that are not quoted in an active market. After initial measurement, such financial assets are subsequently measured at amortized cost using the effective interest rate method (EIR), less impairment. Amortized cost is calculated by taking into account any discount or premium on acquisition and fees or costs. Amortization is included in finance income in the income statement. The losses arising from impairment are recognized in the income statement in finance costs.
16
Cosan Limited
Notes to the consolidated financial statement (Continued)
Years ended March 31, 2012, 2011 and 2010
(In thousands of Reais, except otherwise stated)
| 2. | Summary of significant accounting policies (Continued) |
| 2.3. | Summary of significant accounting practices (Continued) |
| c) | Financial instruments – Recognition initial and subsequent measurement (Continued) |
(i) Financial assets (Continued)
Held-to-maturity
Non-derivative financial assets with fixed or determinable payments and fixed maturities are classified as held-to maturity when the Company has the positive intention and ability to hold them to maturity. Interest, monetary, exchange rate, less impairment losses, if any, are recognized in income when incurred in the line of financial income/expense.
Available-for-sale financial assets
Financial assets available for sale are those non-derivative financial assets that are not classified as (a) loans and receivables, (b) investments held to maturity or (c) financial assets at fair value through profit and loss.
Derecognition
A financial asset is derecognized when:
| · | The rights to receive cash flows from the asset have expired; and |
| · | The Company has transferred its rights to receive cash flows from the asset or has assumed an obligation to pay the cash flows received without material delay to a third party under a pass-through arrangement; and either (a) the Company has transferred substantially all the risks and rewards of the asset, or (b) the Company has neither transferred nor retained substantially all the risks and rewards of the asset, but has transferred control of the asset. |
Impairment of financial assets
The Company assesses at each reporting date whether there is any objective evidence that a financial asset or a group of financial assets is impaired. A financial asset or a group of financial assets is deemed to be impaired if, and only if, there is objective evidence of impairment as a result of one or more events that has occurred after the initial recognition of the asset (an incurred ‘loss event’) and that loss event has an impact on the estimated future cash flows of the financial asset or the group of financial assets that can be reliably estimated.
17
Cosan Limited
Notes to the consolidated financial statement (Continued)
Years ended March 31, 2012, 2011 and 2010
(In thousands of Reais, except otherwise stated)
| 2. | Summary of significant accounting policies (Continued) |
| 2.3. | Summary of significant accounting practices (Continued) |
| c) | Financial instruments – Recognition initial and subsequent measurement (Continued) |
(ii) Financial liabilities
Initial recognition and measurement
Financial liabilities are classified as financial liabilities at fair value through profit or loss, loans and borrowings, or as derivatives designated as hedging instruments in an effective hedge. The Company determines the classification of its financial liabilities at initial recognition.
All financial liabilities are recognized initially at fair value and in the case of loans and borrowings, carried at amortized cost.
The Company’s financial liabilities include payables to suppliers and other payables, loans and borrowings and derivative financial instruments.
Subsequent measurement
The measurement of financial liabilities depends on their classification as follows:
Financial liabilities at fair value through profit or loss
Financial liabilities at fair value through profit or loss include financial liabilities held for trading and financial liabilities designated upon initial recognition at fair value through profit or loss and derivatives, except those designated as hedging instruments. Interest, monetary and exchange variations and changes arising from the valuation at fair value, where applicable, are recognized in the income statement when incurred.
Loans and borrowings
After initial recognition, interest bearing loans and borrowings are subsequently measured at amortized cost using the effective interest rate method. Gains and losses are recognized in the income statement when the liabilities are amortized or derecognized.
Derecognition
A financial liability is derecognized when the obligation under the liability is discharged, cancelled or expires.
18
Cosan Limited
Notes to the consolidated financial statement (Continued)
Years ended March 31, 2012, 2011 and 2010
(In thousands of Reais, except otherwise stated)
| 2. | Summary of significant accounting policies (Continued) |
| 2.3. | Summary of significant accounting practices (Continued) |
| c) | Financial instruments – Recognition initial and subsequent measurement (Continued) |
(iii) Offsetting of financial instruments
Financial assets and financial liabilities are offset and the net amount reported in the consolidated statement of financial position if there is a currently enforceable legal right to offset the recognized amounts and there is an intention to settle on a net basis, or to realize the assets and settle the liabilities simultaneously.
(iv) Fair value of financial instruments
The fair value of financial instruments that are traded in active markets at each reporting date is determined by reference to quoted market prices or dealer price quotations, without any deduction for transaction costs.
The fair value of financial instruments for which there is no active market is determined using valuation techniques. These techniques can include using recent market transactions (interest free) reference to the current fair value of other similar instruments, analysis of discounted cash flows or other valuation models.
An analysis of fair values of financial instruments and further details as to how they are measured are provided in Note 26.
(v) Derivative financial instruments and hedge accounting
Initial recognition and subsequent measurement
The Company uses derivative financial instruments such as forward currency contracts, interest rate swaps and forward commodity contracts to hedge its foreign currency risks, interest rate risks and commodity price risks, respectively. Derivatives designated in hedge transactions are initially recognized at fair value on the date on which the derivative is acquired, and subsequently also revalued to fair value. Derivatives are presented as financial assets when the instrument's fair value is positive and as liabilities when fair value is negative.
Any gains or losses arising from changes in the fair value of derivatives are taken directly to the income statement, except for the effective portion of cash flow hedges, which is recognized in other comprehensive income.
19
Cosan Limited
Notes to the consolidated financial statement (Continued)
Years ended March 31, 2012, 2011 and 2010
(In thousands of Reais, except otherwise stated)
| 2. | Summary of significant accounting policies (Continued) |
| 2.3. | Summary of significant accounting practices (Continued) |
| c) | Financial instruments – Recognition initial and subsequent measurement (Continued) |
(v) Derivative financial instruments and hedge accounting (Continued)
For the purpose of hedge accounting, hedges are classified as:
| · | Fair value hedges when hedging the exposure to changes in the fair value of a recognized asset or liability or an unrecognized firm commitment; |
| · | Cash flow hedges when hedging exposure to variability in cash flows that is either attributable to a particular risk associated with a recognized asset or liability or a highly probable forecast transaction or the foreign currency risk in an unrecognized firm commitment; and |
| · | Hedges of a net investment in a foreign operation. |
At the inception of a hedge relationship, the Company formally designates and documents the hedge relationship to which the Company wishes to apply hedge accounting and the risk management objective and strategy for undertaking the hedge. The documentation includes identification of the hedging instrument, the hedged item or transaction, the nature of the risk being hedged and how the entity will assess the effectiveness of changes in the hedging instrument’s fair value in offsetting the exposure to changes in the hedged item’s fair value or cash flows attributable to the hedged risk. Such hedges are expected to be highly effective in achieving offsetting changes in fair value or cash flows and are assessed on an ongoing basis to determine that they actually have been highly effective throughout the financial reporting periods for which they were designated.
Hedges are expected to be highly effective in offsetting changes in fair value or cash flows, being continually assessed to determine whether they were actually highly effective over all the base periods for which they were intended.
Hedges which meet the strict criteria for hedge accounting are accounted for as follows:
Cash flow hedges
The effective portion of the gain or loss on the hedging instrument is recognized directly as other comprehensive income in the cash flow hedge reserve, while any ineffective portion is recognized immediately in the income statement in other operating expenses.
Amounts recognized as other comprehensive income are transferred to the income statement when the hedged transaction affects profit or loss, such as when the hedged financial income or financial expense is recognized or when a forecast sale occurs. Where the hedged item is the cost of a non-financial asset or non-financial liability, the amounts recognized as other comprehensive income are transferred to the initial carrying amount of the nonfinancial asset or liability.
20
Cosan Limited
Notes to the consolidated financial statement (Continued)
Years ended March 31, 2012, 2011 and 2010
(In thousands of Reais, except otherwise stated)
| 2. | Summary of significant accounting policies (Continued) |
| 2.3. | Summary of significant accounting practices (Continued) |
| c) | Financial instruments – Recognition initial and subsequent measurement (Continued) |
(v) Derivative financial instruments and hedge accounting (Continued)
Cash flow hedges (Continued)
If the forecast transaction or firm commitment is no longer expected to occur, the cumulative gain or loss previously recognized in equity is transferred to the income statement. If the hedging instrument expires or is sold, terminated or exercised without replacement or rollover, or if its designation as a hedge is revoked, any cumulative gain or loss previously recognized in other comprehensive income remains in other comprehensive income until the forecast transaction or firm commitment affects profit or loss.
The Company uses forward currency contracts as hedges of its exposure to foreign currency risk in forecasted transactions and firm commitments, as well as forward commodity contracts for its exposure to volatility in the commodity prices. Refer to Note 26 for more details.
Fair value hedge and hedges of a net investment
The Company does not hold derivative financial instruments designated in these types of operations.
| d) | Cash and cash equivalents and restricted cash |
Cash and cash equivalents include cash, bank deposits and other short-term investments of immediate liquidity, redeemable within 90 days from the date of issue, readily convertible into a known amount as cash and cash with insignificant risk of change in their value.
The restricted cash relates mainly to deposits of margin requirements made with brokers who trade commodity derivative instruments linked to Company’s derivatives instruments and financial transactions.
| e) | Accounts receivable |
Accounts receivable are receivables from customers and are reduced to their probable realizable value by a provision.
| f) | Inventories |
Inventories are recorded at average cost of acquisition or production, not to exceed the net realizable value. Provisions for slow-moving or obsolete inventories are recorded when deemed necessary by management.
21
Cosan Limited
Notes to the consolidated financial statement (Continued)
Years ended March 31, 2012, 2011 and 2010
(In thousands of Reais, except otherwise stated)
| 2. | Summary of significant accounting policies (Continued) |
| 2.3. | Summary of significant accounting practices (Continued) |
| g) | Equity method investments |
Entities over which the Company exercises significant influence are accounted for by the equity method. Based on the equity method, investments are recorded on the balance sheet at cost, plus the changes following the acquisition of shares and the Company’s share of equity income or loss of the associate.
The income statement reflects the share of operating results of associates associate based on the equity method. When a change is recognized directly in equity of the associate, the Company recognizes its share of the variations, where applicable, statement of changes in equity.
The financial statements of associates are prepared for the same period of presentation of the Company even if the fiscal year is not coincidental. Where necessary, adjustments are made to conform to the accounting practices of the Company.
After applying the equity method, the Company determines whether it is necessary to recognize additional loss of recoverable value on the Company's investment in its associate. The Company determines, at each year end, if there is objective evidence that investment in associate loss suffered by the impairment. If so, the Company calculates the amount of loss on the impairment as the difference between the recoverable value of the associate and the book value and the amount recognized in the income statement.
When there is loss of significant influence over the associate, the Company evaluates and recognizes the investment at fair value at that moment.
The unrealized gains and losses resulting from transactions between the Company and associates are eliminated in accordance with the participation held in the associate.
22
Cosan Limited
Notes to the consolidated financial statement (Continued)
Years ended March 31, 2012, 2011 and 2010
(In thousands of Reais, except otherwise stated)
| 2. | Summary of significant accounting policies (Continued) |
| 2.3. | Summary of significant accounting practices (Continued) |
| h) | Interest in joint ventures |
The Company has an interest in joint ventures, which are jointly controlled entities, whereby the venturers have a contractual arrangement that establishes joint control over the voting and economic activities of the entity. The agreement requires unanimous agreement for financial and operating decisions among the venturers. The Company recognizes its interest in the joint ventures using the proportionate consolidation method. The Company combines its proportionate share of each of the assets, liabilities, income and expenses of the joint ventures with similar items, line by line, in its consolidated financial statements. The financial statements of the joint ventures are prepared for the same reporting period as the Company.
Adjustments are made in the Company´s consolidated financial statements to eliminate the Company´s share of intercompany balances, transactions and unrealized gains and losses on such transactions between the Company and its joint ventures. Losses on transactions are recognized immediately if the loss provides evidence of a reduction in the net realisable value of current assets or an impairment loss. The joint venture is proportionately consolidated until the date on which the Company ceases to have joint control over the joint venture.
As discussed in Note 2.4, effective in the Company’s fiscal year ending March 31, 2014, the IFRS accounting for these proportionately consolidated entities will change and the Company will then be required to account for them retrospectively using the equity method of accounting.
| i) | Biological assets |
Biological assets refer to the sugarcane plantations and are recognized at fair value at each balance sheet date and the effects of changes in fair values between the periods are allocated to cost of goods sold. The sugarcane plantation is measured at fair value in accordance with the discounted cash flow method. The harvest of the Company begins generally in April each year and ends in the months of November and December.
The Company’s own land on which the biological asset is produced is accounted for in accordance with IAS 16 - Property, Plant and Equipment.
| j) | Property, plant and equipment (“P, P&E”) |
Items of P, P&E are measured at historical cost of acquisition or construction, less accumulated depreciation and impairment when applicable.
Cost includes expenditures that are directly attributable to the acquisition of an asset. The cost of assets constructed by the entity includes the cost of materials and direct labor, other costs to put the asset in location and condition necessary for them to be able to operate in the manner intended by management, and borrowing costs on qualifying assets. Borrowing costs relating to funds raised for work in progress are capitalized until these projects are completed.
23
Cosan Limited
Notes to the consolidated financial statement (Continued)
Years ended March 31, 2012, 2011 and 2010
(In thousands of Reais, except otherwise stated)
| 2. | Summary of significant accounting policies (Continued) |
| 2.3. | Summary of significant accounting practices (Continued) |
| j) | Property, plant and equipment (“P, P&E”) (Continued) |
The Company carries out the planned major maintenance and inspection activities at its plants on an annual basis in order to inspect and replace components. This occurs between January and March. The principal costs include maintenance costs for labor, material third party services and overhead allocated during the inter harvest period.
The estimated cost of a component of a piece of equipment that must be replaced each year is recorded as a component of cost of the equipment and depreciated over the following season. Costs of normal periodic maintenance are recorded as expenses when incurred since the components will not improve the production capacity or introduce improvements to equipment.
Depreciation is calculated on a straight line method based on useful life of each asset, following the annual depreciation rates shown below:
| Buildings and improvements | 4% |
| Machinery and equipment | 3% to 10% |
| Agricultural machinery | 10% |
| Industrial equipment and facilities | 10% |
| Furniture and fixtures | 10% |
| Computer equipment | 20% |
| Vehicles | 10% to 20% |
| Locomotives | 3.3% |
| Rail cars | 2.9% |
| Boats | 20% |
| Aircrafts | 10% |
| k) | Leases |
The determination of whether an arrangement is, or contains, a lease is based on the substance of the arrangement at the inception date.
Finance leases which transfer to the Company substantially all the risks and benefits incidental to ownership of the leased item, are capitalized at the commencement of the lease at the fair value of the leased property or, if lower, at the present value of the minimum lease payments. Lease payments are apportioned between finance charges and reduction of the lease liability so as to achieve a constant rate of interest on the remaining balance of the liability. Finance charges are recognized in finance costs in the income statement. A leased asset is depreciated over the useful life of the asset.
Operating lease payments are recognized as an operating expense in the income statement on a straight-line basis over the lease term.
24
Cosan Limited
Notes to the consolidated financial statement (Continued)
Years ended March 31, 2012, 2011 and 2010
(In thousands of Reais, except otherwise stated)
| 2. | Summary of significant accounting policies (Continued) |
| 2.3. | Summary of significant accounting practices (Continued) |
| l) | Intangibles |
(i) Goodwill
Goodwill is maintained at its cost, less any impairment losses. Goodwill is tested annually for impairment. In order to perform impairment tests goodwill is compared to the recoverable amount of the related cash generating unit to which it was originally allocated.
(ii) Intangible assets with finite lives
Intangible assets with finite lives are amortized over their useful economic lives and assessed for impairment whenever there is an indication that the intangible asset may be impaired.
| m) | Impairment |
The Company assesses annually whether there are indications of impairment in its long lived assets. If these indicators are identified, the Company estimates the recoverable amount of the assets. The recoverable amount of an asset or a group of assets is the greater of: (a) the fair value less estimated costs to sell it, and (b) its value in use. Value in use is the discounted cash flow (before taxes) from the continued use of the assets until the end of its useful life.
Regardless of the existence of indicators of loss of value, goodwill and intangible assets with indefinite useful lives are tested for impairment at least once a year.
When the book value of an asset exceeds its recoverable amount, the impairment loss is recognized as an operating expense in the income statement.
| n) | Borrowing costs |
Borrowing costs directly attributable to the acquisition, construction or production of an asset that necessarily takes a substantial period of time to get ready for its intended use or sale are capitalized as part of the cost of the respective assets. All other borrowing costs are expensed in the period they occur.
| o) | Provisions |
Provisions are recognized when the Company has a present obligation (legal or constructive) as a result of a past event, it is probable that an outflow of resources embodying economic benefits will be required to settle the obligation and a reliable estimate can be made of the amount of the obligation.
25
Cosan Limited
Notes to the consolidated financial statement (Continued)
Years ended March 31, 2012, 2011 and 2010
(In thousands of Reais, except otherwise stated)
| 2. | Summary of significant accounting policies (Continued) |
| 2.3. | Summary of significant accounting practices (Continued) |
| p) | Pension and other employment benefits |
i) Defined benefit pension plan
The Company, through its indirect subsidiary Cosan Lubrificantes Especialidades S.A. (“CLE”) is the sponsor of a defined benefit pension plan for part of its employees. The cost of providing benefits under the defined benefit plan is determined annually by independent actuaries using the projected unit credit method.
Actuarial gains and losses for the defined benefit plan are recognized in full in the period in which they occur in other comprehensive income. Such actuarial gains and losses are also immediately recognized in equity and are not reclassified to profit or loss in subsequent periods.
ii) Defined contribution pension plan
The Company, its subsidiaries and jointly-controlled entities sponsor a defined contribution plan, for all employees. The Company does not have a legal or constructive obligation to pay further contributions if the fund does not have sufficient assets to pay all benefits owed.
iii) Share-based payments
Employees (including senior executives) of Cosan S.A. receive regular compensation in the form of equity investments for services rendered (equity-settled transactions).
The cost of equity-settled transactions is recognized, together with a corresponding increase in equity, over the period in which the performance and/or service conditions are fulfilled. Cosan S.A. uses the binomial model to estimate the fair value of the options at the date of the grant.
| q) | Treasury shares |
The Company´s equity instruments which are reacquired (treasury shares) are recognized at cost and deducted from equity. No gain or loss is recognized in the income statement on the purchase, sale, issue or cancellation of the Company’s own equity instruments.
Represented by the shares acquired on the market and held in treasury in accordance with the Repurchase Plan previously approved.
Equity instruments which are reacquired (treasury shares) are recognized at cost and deducted from equity. No gain or loss is recognized in the income statement in the purchase, sale, issue or cancel of equity instruments of the Company. Any difference between book value and the consideration is recognized in capital reserve.
26
Cosan Limited
Notes to the consolidated financial statement (Continued)
Years ended March 31, 2012, 2011 and 2010
(In thousands of Reais, except otherwise stated)
| 2. | Summary of significant accounting policies (Continued) |
| 2.3. | Summary of significant accounting practices (Continued) |
| r) | Taxes |
(i) Income taxes
Income taxes are comprised of income tax and social contribution at a combined rate of 34%. Deferred income tax assets are recognized for all deductible temporary differences and unused tax losses, to the extent that it is probable that taxable profit will be available against which the deductible temporary differences, and unused tax losses can be utilized.
Deferred income tax assets and liabilities are presented as non-current assets or liabilities and measured at the tax rates that are expected to apply in the year when the asset is realized or the liability is settled, based on tax rates that have been enacted at the reporting date
(ii) Indirect taxes
Net revenues is recognized net of discounts and sales taxes (IPI, ICMS, PIS and COFINS).
| s) | Business combinations |
Business combinations are accounted for using the acquisition method and the assets and liabilities assumed are measured at fair value for purposes of goodwill calculation. Goodwill represents the excess of the acquisition cost in comparison the fair value of the acquired assets and liabilities. If there is an excess of the acquirer's interest in the fair value of assets and liabilities acquired over the cost, the difference is recognized immediately in the income statement.
| t) | Asset retirement obligations |
The retirement obligations of its jointly-controlled entities relate to the required obligation to remove underground fuel tanks upon retirement, the initial measurement of which is recognized as a liability discounted to present values and subsequently accreted through earnings. An asset retirement cost equal to the initial estimated liability is capitalized as part of the related asset’s carrying value and depreciated over the asset’s useful life.
| u) | Environmental matters |
The Company, its subsidiaries and its jointly-controlled entities production facilities and their plantation activities are both subject to environmental regulations. The Company diminishes the risks associated with environmental matters, through operating procedures and controls and investments in pollution control equipment and systems.
27
Cosan Limited
Notes to the consolidated financial statement (Continued)
Years ended March 31, 2012, 2011 and 2010
(In thousands of Reais, except otherwise stated)
| 2. | Summary of significant accounting policies (Continued) |
| 2.4 | New IFRS and IFRIC Interpretations Committee (Financial Reporting Interpretations of IASB) applicable to the consolidated financial statements |
New accounting pronouncements of the IASB and IFRIC interpretations have been published and or reviewed as presented below:
IFRS 9 Financial Instruments: Classification and Measurement
Classification and measurement - It reflects the first phase of the IASBs work on the replacement of IAS 39 Financial Instruments: Recognition and Measurement. IFRS 9 uses a simplified approach to determine whether a financial asset is measured at amortized cost or fair value, based on the manner in which an entity manages its financial instruments (business model) and the typical contractual cash flow of financial assets. The standard also requires the adoption of only one method for determining losses in recoverable value of assets. The standard is effective for annual periods beginning on or after January 1, 2013. Management is still evaluating the impact on its financial position or performance in relation to IFRS 9.
IFRS 10 Consolidated Financial Statements
IFRS 10 as issued establishes principles for the presentation and preparation of consolidated financial statements when an entity controls one or more other entities. IFRS 10 replaces the consolidation requirements in SIC-12 Consolidation—Special Purpose Entities and IAS 27 Consolidated and Separate Financial Statements and is effective for annual periods beginning on or after January 1, 2013. Early application is permitted. Management is still evaluating the impact on its financial position or performance from the adoption of IFRS 10.
IFRS 11 Joint Arrangements
IFRS 11 will significantly change the accounting for the Company’s joint arrangements. The new standard eliminates inconsistencies in the reporting of joint arrangements in current practice, by requiring a single method (the equity method of accounting) to account for interests in jointly controlled entities. It eliminates the option to proportionate consolidate these jointly controlled entities. It is effective for annual periods beginning on or after January 1, 2013. Early adoption is permitted.
With the adoption of IFRS 11, currently expected for the year ended March 31, 2014, the Company's joint ventures (Raízen Energia and Raízen Combustíveis) currently presented via proportionate consolidation, will be presented using the equity method of accounting in accordance with IAS 28R – Investment in Associates and Joint Ventures. These two joint ventures currently comprise a substantial component of the Company's assets and operations. Thus, while the Company is currently estimating the impacts of the adoption of IFRS 11, it is anticipated that it will be significant.
28
Cosan Limited
Notes to the consolidated financial statement (Continued)
Years ended March 31, 2012, 2011 and 2010
(In thousands of Reais, except otherwise stated)
| 2. | Summary of significant accounting policies (Continued) |
| 2.4 | New IFRS and IFRIC Interpretations Committee (Financial Reporting Interpretations of IASB) applicable to the consolidated financial statements (Continued) |
IFRS 11 Joint Arrangements (Continued)
The total assets of these joint ventures represented approximately 71% of consolidated totals at March 31, 2012. The revenues, operating income and cash flow from operating activities of these joint ventures accounted for approximately 80%, 67% and 93% of consolidated totals for the year ended March 31, 2012, respectively. A change from proportionate consolidation to equity method accounting would have no impact on the total equity or net income derived from these joint ventures, except that when using a proportional consolidation model net income would be lower in the year of joint venture formation as the transaction costs would be expensed as incurred. When applying the equity method of accounting those expenses would be considered a component of the equity method investment.
IFRS 12 Disclosure of Involvement with Other Entities
IFRS 12 is a new and comprehensive standard on disclosure requirements for all forms of interests in other entities, including subsidiaries, joint arrangements, associates and unconsolidated structured entities. IFRS 12 is effective for annual periods beginning on or after January 1, 2013. Earlier application is permitted. Management is still evaluating the impact on its financial position or performance from the adoption of IFRS 11.
IFRS 13 Fair Value Measurement
IFRS 13 establishes new requirements on how to measure fair value and the related disclosures for IFRS and US generally accepted accounting principles. The standard is effective for annual periods beginning on or after January 1, 2013. Earlier application is permitted. Management is still evaluating the impact on its financial position or performance from the adoption of IFRS 13.
IAS 28 Investments in Associates and Joint Ventures (revised in 2011)
As a consequence of the new IFRS 11 and IFRS 12, IAS 28 has been renamed IAS 28 Investments in Associates and Joint Ventures, and describes the application of the equity method to investments in joint ventures in addition to associates. The amendment becomes effective for annual periods beginning on or after January 1, 2013.
There are no other pronouncements issued and yet to be adopted that may have a significant impact in the Company´s operations and financial position
29
Cosan Limited
Notes to the consolidated financial statement (Continued)
Years ended March 31, 2012, 2011 and 2010
(In thousands of Reais, except otherwise stated)
| 3. | Cash and Cash Equivalent |
| 2012 | 2011 | |||||||
| Brazilian reais | ||||||||
| Cash | 654 | 289 | ||||||
| Bank accounts | 127,178 | 64,437 | ||||||
| Highly liquid Investments | 1,519,965 | 1,076,599 | ||||||
| US dollars | ||||||||
| Bank accounts | 6,349 | 78,353 | ||||||
| Highly liquid Investments | - | 52,102 | ||||||
| 1,654,146 | 1,271,780 | |||||||
On March 31, 2012, the Company had unused lines of credit with BNDES, in the amount of R$ 420,414 (R$1,064,930 in March 31,2011). The use of these lines of credit depends upon fulfillment of certain contractual conditions.
| 4. | Restricted Cash |
| 2012 | 2011 | |||||||
| Restricted financial investments | 48,292 | 61,072 | ||||||
| Deposits in connection with derivative transactions | 45,976 | 126,872 | ||||||
| 94,268 | 187,944 | |||||||
Deposits in connection with derivative transactions relate to margin calls by counterparties in derivative transactions.
| 5. | Other financial assets |
| 2012 | 2011 | |||||||
| Fair value of Radar option (1) | 140,820 | 162,961 | ||||||
| Brazilian Treasury certificates – CTN (2) | 149,438 | 257,456 | ||||||
| ExxonMobil financial asset - reimbursement (3) | 540,224 | - | ||||||
| 830,482 | 420,417 | |||||||
| Current | 40,080 | - | ||||||
| Non current | 790,402 | 420,417 | ||||||
| (1) | Cosan S.A. holds warrants on Radar, exercisable at any time up to maturity (August 2018). Such warrants will allow Cosan S.A. to purchase additional shares at R$41.67 per share adjusted for inflation (IPCA), equivalent to 20% of the total shares issued by Radar as of the date of exercise. The exercise of warrants will not change the classification of this investment as an equity investment. The fair value of these warrants was calculated based on observable market data. |
| (2) | Represented by bonds issued by the Brazilian National Treasury under the Special Program for Agricultural Securitization - "PESA" with original maturity of 20 years in connection with the long-term debt denominated PESA (note 15). These bonds yield inflation (IGPM) plus 12% p.a.. The value of these securities at maturity is expected to be equal to the amount due to the PESA at that date. If the PESA debt is paid in advance, the Company may still keep this investment until maturity |
| (3) | On June 28, 2011, the subsidiary Cosan Lubrificantes e Especialides S.A., successor entity of Esso Brasileira de Petróleio Ltda. (“Essobrás”), joined the Brazilian Government’s tax recovery program upon request of ExxonMobil Brasil Holdings B.V. (“ExxonMobil”). ExxonMobil is the entity that is legally responsible for the tax contingencies existing on the acquisition date of Essobras by the Company. The liability amounts to R$540,224 and is being refunded to the Company by ExxonMobil upon payment. As a result, the Company recorded a tax payable obligation and a corresponding accounts receivable from ExxonMobil, of which R$40,080 is short term and the remaining balance is long term. |
30
Cosan Limited
Notes to the consolidated financial statement (Continued)
Years ended March 31, 2012, 2011 and 2010
(In thousands of Reais, except otherwise stated)
| 6. | Accounts Receivable |
The balances of accounts receivables as of March 31, 2012 and 2011 are composed as follows:
| 2012 | 2011 | |||||||
| Domestic | 902,407 | 678,498 | ||||||
| Foreign | 164,681 | 7,556 | ||||||
| Allowance for doubtful accounts | (103,501 | ) | (91,197 | ) | ||||
| 963,587 | 594,857 | |||||||
The analysis of the maturity of the accounts receivable is as follows:
| 2012 | 2011 | |||||||
| Current | 764,827 | 555,826 | ||||||
| Over Due: | ||||||||
| Up to 30 days | 100,339 | 21,097 | ||||||
| From 31 to 60 days | 16,535 | 4,317 | ||||||
| From 61 to 90 days | 8,476 | 553 | ||||||
| More than 180 days | 73,410 | 13,064 | ||||||
| 963,587 | 594,857 | |||||||
Changes in the allowance for doubtful accounts are as follows:
| On April 1, 2009 | (102,985 | ) | ||
| Provision | (14,011 | ) | ||
| Reversal | 15,389 | |||
| Write-offs | 11,748 | |||
| Addition from business combination | (7,862 | ) | ||
| March 31, 2010 | (97,721 | ) | ||
| Provision | (16,573 | ) | ||
| Reversal | 18,238 | |||
| Write-offs | 6,130 | |||
| Addition from business combination | (1,271 | ) | ||
| March 31, 2011 | (91,197 | ) | ||
| Provision | (28,003 | ) | ||
| Reversal | 26,711 | |||
| Write-offs | 935 | |||
| Net addition from de-consolidation of subsidiaries and formation of the JVs (a) | (11,135 | ) | ||
| Addition from business combination | (812 | ) | ||
| March 31, 2012 | (103,501 | ) |
| (a) | The Company has reflected this roll-forward activity as a “net” adjustment. This net adjustment would actually represent the de-consolidation of 100% of the allowance for doubtful accounts of subsidiaries de-recognized, and the addition of 50% of the fair value of the allowance for doubtful accounts of the JV’s then proportionally consolidated. |
31
Cosan Limited
Notes to the consolidated financial statement (Continued)
Years ended March 31, 2012, 2011 and 2010
(In thousands of Reais, except otherwise stated)
7. | Inventories |
| 2012 | 2011 | |||||||
| Finished Goods: | ||||||||
| Sugar | 87,110 | 77,673 | ||||||
| Ethanol | 79,433 | 42,840 | ||||||
| Fuel | 276,867 | 231,891 | ||||||
| Lubrificants | 112,492 | 94,743 | ||||||
| Raw material | 52,586 | 51,598 | ||||||
| Spare parts and others | 144,204 | 191,153 | ||||||
| Provision for inventory realization and obsolescence | (4,542 | ) | (19,567 | ) | ||||
| 748,150 | 670,331 | |||||||
Change in the provision for inventory realization and obsolescence is as follows:
| On April 1, 2009 | (23,102 | ) | ||
| Addition | (14,528 | ) | ||
| Reversal | 12,370 | |||
| March 31, 2010 | (25,260 | ) | ||
| Provision | (13,483 | ) | ||
| Reversal | 19,176 | |||
| March 31, 2011 | (19,567 | ) | ||
| Provision | (1,697 | ) | ||
| Write off | 5,173 | |||
| Reversal | 4,815 | |||
| Net effect from de-consolidation of subsidiaries and formation of the JVs (a) | 6,734 | |||
| March 31, 2012 | (4,542 | ) |
| (a) | The Company has reflected this roll-forward activity as a “net” adjustment. This net adjustment would actually represent the de-consolidation of 100% of the inventory provision of subsidiaries de-recognized, and the addition of 50% of the fair value of the inventory provision of the JV’s then proportionally consolidated. |
| 8. | Recoverable Taxes |
| 2012 | 2011 | |||||||
| Income tax | 107,561 | 66,274 | ||||||
| COFINS | 63,727 | 121,474 | ||||||
| PIS | 18,614 | 27,338 | ||||||
| ICMS - State VAT | 194,818 | 151,161 | ||||||
| IPI | 43,039 | 47,741 | ||||||
| Others | 9,193 | 16,069 | ||||||
| 436,952 | 430,057 | |||||||
| Current | 325,096 | 374,991 | ||||||
| Non-Current | 111,856 | 55,066 | ||||||
32
Cosan Limited
Notes to the consolidated financial statement (Continued)
Years ended March 31, 2012, 2011 and 2010
(In thousands of Reais, except otherwise stated)
| 9. | Related Parties |
a) | Summarized balances and transactions with related parties: |
| 2012 | 2011 | |||||||
| Current Asset | ||||||||
| Shell (i) | 626,783 | - | ||||||
| Raízen Energia (ii) | 20,731 | - | ||||||
| Raízen Combustíveis (ii) | 14,242 | - | ||||||
| Grupo Rezende Barbosa (iii) | 9,469 | 7,298 | ||||||
| Vertical (iv) | 540 | 6,430 | ||||||
| Other | 6,609 | 941 | ||||||
| Total Current asset | 678,374 | 14,669 | ||||||
| Non Current Asset | ||||||||
| Shell (i) | 335,317 | - | ||||||
| Raízen Energia (ii) | 214,885 | - | ||||||
| Raízen Combustíveis (ii) | 87,811 | - | ||||||
| Grupo Rezende Barbosa (iii) | 105,751 | 91,954 | ||||||
| Other | 9,389 | - | ||||||
| Total Non-current asset | 753,153 | 91,954 | ||||||
| Total asset | 1,431,527 | 106,623 | ||||||
| Current liabilities | ||||||||
| Shell (i) | 83,064 | - | ||||||
| Raízen Energia (ii) | 76,257 | - | ||||||
| Raízen Combustíveis (ii) | 321 | - | ||||||
| Grupo Rezende Barbosa (iii) | 12,577 | 37,664 | ||||||
| Other | 3,269 | 3,499 | ||||||
| Total current liabilities | 175,488 | 41,163 | ||||||
| Non-current Liabilities | ||||||||
| Shell (i) | 379,626 | - | ||||||
| Raízen Energia (ii) | 6,387 | - | ||||||
| Other | 3,705 | 4,444 | ||||||
| Total Non-current liabilities | 389,718 | 4,444 | ||||||
| Total liabilities | 565,206 | 45,607 | ||||||
33
Cosan Limited
Notes to the consolidated financial statement (Continued)
Years ended March 31, 2012, 2011 and 2010
(In thousands of Reais, except otherwise stated)
| 9. | Related Parties (Continued) |
a) | Summarized balances and transactions with related parties: |
| Year ended at March 31, | ||||||||||||
| 2012 | 2011 | 2010 | ||||||||||
| Sales of products/services | ||||||||||||
| Vertical (iv) | 75,338 | 160,202 | 154,042 | |||||||||
| Aguassanta | - | 39,131 | 101,902 | |||||||||
| Other | 441 | 832 | - | |||||||||
| 75,779 | 200,165 | 255,944 | ||||||||||
| Purchase of goods/services | �� | |||||||||||
| Grupo Rezende Barbosa (iii) | 263,859 | 352,195 | 155,615 | |||||||||
| Vertical (iv) | 113,518 | - | - | |||||||||
| Other | 7,032 | |||||||||||
| 384,409 | 352,195 | 155,615 | ||||||||||
| Land lease | ||||||||||||
| Aguassanta (v) | 17,577 | 26,459 | (18,817 | ) | ||||||||
| Radar (vi) | 22,532 | 28,446 | (18,158 | ) | ||||||||
| 40,109 | 54,905 | (36,975 | ) | |||||||||
| Financial income / (expense) | ||||||||||||
| Grupo Rezende Barbosa (iii) | 2,502 | 233 | 18,045 | |||||||||
| Shell | 148,733 | - | - | |||||||||
| Other | 242 | 512 | (84 | ) | ||||||||
| 151,477 | 745 | 17,961 | ||||||||||
| (i) | Shell |
Shell Holdings B.V. and its subsidiaries ("Shell") are related parties of Raizen Energia and Raízen Combustíveis, therefore, the transactions between Shell and these entities were treated by the Company as related party transactions and all balances disclosed are 50% proportionally consolidated.
The short-term receivable is mainly comprised of (i) capital contribution receivable from Raízen Energia in the amount of R$ 489,856, (ii) and other receivables in the amount of R$ 136,927, represented by other reimbursements resulting from the formation of JVs.
The long-term receivables are represented mainly by (i) reimbursement of provisions existing at the legal entity contributed by Shell related to the contingencies in the amount of R$ 244,046, and (ii) a financial asset equivalent to the investment that Shell has in Iogen, valued at fair value, and that will be contributed to Raizen Energia in the amount of R$ 86,535.
The short term payable comprises mainly reimbursement tax credits of the legal entity contributed by Shell in the amount of R$ 77,631.
The long term payable refers to (i) reimbursement of judicial deposits in the legal entity contributed by Shell, which will be refunded when redeemed, in the amount of R$ 130,883, and (ii) reimbursement of tax credits of the legal entity contributed by Shell in the amount of R$ 248,743.
34
Cosan Limited
Notes to the consolidated financial statement (Continued)
Years ended March 31, 2012, 2011 and 2010
(In thousands of Reais, except otherwise stated)
| 9. | Related Parties (Continued) |
a) | Summarized balances and transactions with related parties: (Continued) |
(ii) Raízen Energia and Raízen Combustível
The balances with Raízen Energia and Raízen Combustível are consolidated proportionally at 50% considering the elimination of the portion related to the Company.
The balances in current assets in the amount of R$ 20,731 and R$ 14,242 in Raízen Energia and Raízen Combustíveis, respectively, represent receivables of (i) transportation and sugar elevation services provided by Rumo, (ii) sale of land by CLE and (iii) leased land.
Non-current assets receivable from Raízen Energia and Raízen Combustíveis represent, basically, tax credits which will be reimbursed to the Company when effectively realized by the JVs.
The balance of R$ 76,257 recorded as current liabilities in Raízen Energia represents, mainly, payables related sugar purchased by the Cosan Alimentos segment and other reimbursable obligations due to the formation of JVs.
(iii) Rezende Barbosa
The Company has receivables from Rezende Barbosa which are guaranteed by shares issued by Cosan.
The jointly-controlled entity "Raízen Energia" has long-term agreement with Group Rezende Barbosa to supply sugar-cane. The prices paid are based on the ATR prices published by CONSECANA.
(iv) Vertical UK LLP
The Company sells and buys ethanol from Vertical UK LLP (“Vertical”) in the normal course of business. Vertical is a trading company headquartered in Switzerland for which the Company has indirectly a 50% non-controlling interests.
(v) Aguassanta
The jointly-controlled entity Raízen Energia has land leased from entities controlled by Group Aguassanta (“Aguassanta”),a group of entities under common control, being Mr. Rubens Ometto de Silveira de Mello the ultimate controlling shareholder. The lease costs are paid considering the ATR price published by CONSECANA and contracts having terms expiring between 2026 and 2027.
35
Cosan Limited
Notes to the consolidated financial statement (Continued)
Years ended March 31, 2012, 2011 and 2010
(In thousands of Reais, except otherwise stated)
| 9. | Related Parties (Continued) |
a) | Summarized balances and transactions with related parties: (Continued) |
(vi) Radar
The jointly-controlled entity Raízen Energia has leased land from Radar Propriedades Agrícolas S.A. (“Radar”), an associate. These rental costs are paid considering the price published by the ATR CONSECANA and most contracts have terms that expire in 2027.
| b) | Officers and directors compensation |
Fixed and variable compensation of key people, including directors and board members are recorded, as follows:
| 2012 | 2011 | 2010 | ||||||||||
| Regular compensation | 24,994 | 7,894 | 6,589 | |||||||||
| Stock option expense | 10,800 | 2,961 | 8,971 | |||||||||
| Bonuses and other variable compensation | 33,075 | 23,791 | 6,325 | |||||||||
| Total compensation recorded as expense | 68,869 | 34,646 | 21,885 | |||||||||
At Cosan S.A.´s shareholder’ meeting held on July 29, 2011, a new stock compensation plan was approved, which until March 31, 2012 had granted 9,825,000 options (Note 28).
| 10. | Business combinations |
| a. | Sugar Retail Business |
The Company contributed its retail sugar business to Raizen Energia upon JV formation. On July 1, 2011, the Company re-acquired this business in exchange for R$145,860 in cash consideration, and R$22,568 in contingent consideration. The net assets of the retail sugar business approximate their carrying value prior to the formation of the JV.
36
Cosan Limited
Notes to the consolidated financial statement (Continued)
Years ended March 31, 2012, 2011 and 2010
(In thousands of Reais, except otherwise stated)
| 10. | Business combinations (Continued) |
| b. | Logispot Armazéns Gerais S.A. (“Logispot”) |
On March 14, 2011, Cosan, through its indirect subsidiary Rumo Logística S.A., purchased 874,226 common shares of Logispot, in exchange for a R$ 48,888 cash payment, which increased its participation in the common shares of Logispot from 14.28% to 51.00%.
Logispot is located in the city of Sumaré and is an important link between plants in the state of São Paulo and Santos Port. The terminal is accessed by all railroads that cross the state of São Paulo and is beside the Anhanguera, Bandeirantes and Dom Pedro highways.).
The fair value at the acquisition date of the consideration transferred totaled R$ 68,880, which consisted of the following:
| Cash | 48,888 | |||
Fair value of 14.28% of Cosan in Logispot immediately before the Business combination | 19,992 | |||
| Total | 68,880 |
The estimated fair value of assets acquired and liabilities assumed at the date of acquisition of Logispot were as follows:
| Description | ||||
| Trade accounts receivable | 1,297 | |||
| Others assets | 677 | |||
| Property, plant and equipment | 114,184 | |||
| Loans and financing | (13,391 | ) | ||
| Deferred income and social contribution taxes | (28,879 | ) | ||
| Others liabilities | (13,551 | ) | ||
| Non-controlling interest (1) | (30,120 | ) | ||
| Net assets acquired | 30,217 | |||
| Consideration transferred, net of cash acquired | 67,745 | |||
| Goodwill | 37,528 | |||
| (1) | Measured at their proportionate share of the value of net identifiable assets acquired |
The purchase price allocation was completed by the Management, and based on the fair value of assets acquired and liabilities assumed and goodwill of the operation was allocated the segment Rumo.
37
Cosan Limited
Notes to the consolidated financial statement (Continued)
Years ended March 31, 2012, 2011 and 2010
(In thousands of Reais, except otherwise stated)
| 10. | Business combinations (Continued) |
| b. | Logispot Armazéns Gerais S.A. (‘Logispot”) (Continued) |
The Company obtained an independent evaluation of its property, plant and equipment, intangible assets and interests of noncontrolling shareholders. The allocation of the initial purchase price was adjusted primarily as a result of refinement in the Company's assumptions related to fixed assets and intangibles. As a result of these changes, the goodwill, as described above, was modified as follows:
| Provisional goodwill | 2,370 | |||
| Adjustments on the fair value of the P,P&E | 104,454 | |||
| Deferred income taxes | (35,515 | ) | ||
| Interests of non-controlling shareholders | (33,781 | ) | ||
| Goodwill | 37,528 |
| c. | Cosan Araraquara Açúcar e Álcool Ltda. (“Usina Zanin”) |
On February 18, 2011, Cosan S.A. acquired 100% of the share capital of Usina Zanin, for R$90,000 cash. Usina Zanin is located in the city of Araraquara .
The estimated fair value of assets acquired and liabilities assumed at date of acquisition of Usina Zanin, was as follows:
| Description | ||||
| Inventories | 3,813 | |||
| Biological assets | 83,890 | |||
| Property, plant and equipment | 223,893 | |||
| Intangible assets | 10 | |||
| Loans and Long-term debt | (278,511 | ) | ||
| Provision for judicial demands | (23,008 | ) | ||
| Deferred income and social contribution taxes | 29,921 | |||
| Others liabilities | (49,081 | ) | ||
| Net assets acquired | (9,073 | ) | ||
| Consideration transferred, net of cash acquired | 88,927 | |||
| Goodwill | 98,000 | |||
The purchase price allocation was completed by the Management, and based on the fair value of assets acquired and liabilities assumed. Zanin was later contributed to Raízen Energia in the formation of JV.
The Company obtained an independent evaluation of its property, plant and equipment, and intangible assets. The allocation of the initial purchase price was adjusted primarily as a result of refinement in the Company's assumptions related to fixed assets and intangibles. As a result of these changes, the goodwill, as described above, was modified as follows:
| Provisional goodwill | 69,402 | |||
| Adjustments on the fair value of the P,P&E and biological assets | 36,805 | |||
| Other FV adjustments | 6,524 | |||
| Deferred income tax | (14,731 | ) | ||
| Goodwill | 98,000 |
Usina Zanin was contributed to Raízen Energia in the formation of JV.
38
Cosan Limited
Notes to the consolidated financial statement (Continued)
Years ended March 31, 2012, 2011 and 2010
(In thousands of Reais, except otherwise stated)
| 10. | Business combinations (Continued) |
| d. | TEAS Terminal Exportador de Álcool de Santos S.A. (“TEAS”) |
On November 24, 2009, Cosan S.A. acquired, for R$ 20,260 cash, an additional 26.7% interest, represented by 10,527,295 common shares, of TEAS from Crystalsev Comércio e Representação Ltda and Plínio Nastari Consultoria e Participações Ltda.. As a result of this transaction, Cosan S.A. increased its direct share ownership in TEAS from 40.0% to 66.7% and obtained control of TEAS. TEAS has a port concession and operates a dedicated terminal for export of ethanol.
The acquisition date fair value of the consideration transferred totaled R$ 39,911, which consisted of the following:
| Cash | 20,260 | |||
Fair value of share of 40% of Cosan S.A. in TEAS immediately before the combination | 19,651 | |||
| Total | 39,911 |
The following table summarizes the fair values of assets acquired and liabilities assumed at the acquisition date:
| Description | ||||
| Property, plant and equipment | 21,162 | |||
| Others assets and liabilities, net | 405 | |||
| Non-controlling interest | (6,258 | ) | ||
| Net assets acquired | 15,309 | |||
| Consideration transferred, net of cash acquired | 22,610 | |||
| Goodwill | 7,301 | |||
The goodwill has been allocated in the Raizen Energia segment.
| e. | Curupay S.A. Participações (“Curupay”) |
On June 18, 2009, Cosan S.A. acquired 100% of the outstanding shares of Curupay S.A. Participações from Rezende Barbosa S.A. Administração e Participações (“Rezende Barbosa”), through the issuance of 44,300,389 common shares valued at R$14.09 per share (fair value at the acquisition date) with a value of R$ 624,192. The assets acquired include the non-controlling interest in Novo Rumo representing 28.82% of its outstanding shares which were issued in the Teaçu Armazéns Gerais S.A. (Teaçu”) acquisition, and 100% of the outstanding shares of two operating companies, Nova América S.A. Trading and Cosan Alimentos (collectively referred to as “Nova América”).
With the acquisition of the noncontrolling interest of Novo Rumo, Cosan S.A. increased its share ownership in Novo Rumo to 92.88%. This transaction was a change in ownership interest without a loss of control and accounted for as a transaction in equity.
39
Cosan Limited
Notes to the consolidated financial statement (Continued)
Years ended March 31, 2012, 2011 and 2010
(In thousands of Reais, except otherwise stated)
| 10. | Business combinations (Continued) |
| e. | Curupay S.A. Participações (“Curupay”) (Continued) |
The following table summarizes the assets acquired and liabilities assumed in relation to Nova America:
| Description | ||||
| Inventories | 119,212 | |||
| Related parties | 67,741 | |||
| Property, plant and equipment | 885,786 | |||
| Intangible assets | 243,955 | |||
| Noncontrolling interest in Novo Rumo | 132,539 | |||
| Others assets | 340,776 | |||
| Loans and Long-term debt | (1,174,631 | ) | ||
| Taxes payables | (56,028 | ) | ||
| Deferred income and social contribution taxes | (47,354 | ) | ||
| Others liabilities | (303,651 | ) | ||
| Net assets acquired | 208,345 | |||
| Consideration transferred, net of cash acquired | 572,710 | |||
| Goodwill | 364,365 | |||
The goodwill of R$ 364,365 arising from the acquisition was assigned to the Raizen Energia segment.
The purchase price to acquire Curupay was allocated based on the fair value of assets acquired and liabilities assumed. Cosan S.A. obtained an independent valuation of property, plant and equipment, intangible assets, loans and long-term debt and internally determined the fair value of other assets and liabilities of the acquired business.
| f. | Teaçu Armazéns Gerais S.A. (“Teaçú”) |
On April 9, 2009, Cosan S.A., through its 90% owned subsidiary, Copsapar Participacoes SA, which owns 100% of the Novo Rumo, acquired 100% of the shares of Teaçu of Rezende Barbosa for R$ 121,131 and issue of 90,736,131 shares of Novo Rumo, equivalent to 28.82% of their capital. Teaçu holds a port concession and operates a dedicated terminal for export of sugar and other agricultural products.
As a result of this transaction, Cosan S.A. reduced its indirect participation in Novo Rumo to 64.06%.
The acquisition date fair value of the consideration transferred totaled R$ 382,908, which is formed by:
| Cash | 121,131 | |||
| Common stock at fair value | 261,777 | |||
| Total consideration transferred | 382,908 |
In the absence of a market price, the fair value of shares included in the consideration transferred was calculated using an income approach, using the present value of estimated future cash flows.
40
Cosan Limited
Notes to the consolidated financial statement (Continued)
Years ended March 31, 2012, 2011 and 2010
(In thousands of Reais, except otherwise stated)
| 10. | Business combinations (Continued) |
| f. | Teaçu Armazéns Gerais S.A. (“Teaçú”) (Continued) |
The table below shows the fair values of assets acquired and liabilities assumed at the date of acquisition.
| Description | ||||
| Property, plant and equipment | 101,711 | |||
| Intangible assets | 316,977 | |||
| Inventories | 2,768 | |||
| Others assets | 61,740 | |||
| Loans and Long-term debt | (43,355 | ) | ||
| Suppliers | (1,111 | ) | ||
| Provision for judicial demands | (7,532 | ) | ||
| Deferred income and social contribution taxes | (104,551 | ) | ||
| Others liabilities | (7,136 | ) | ||
| Net assets acquired | 319,511 | |||
| Consideration transferred, net of cash acquired | 382,432 | |||
| Goodwill | 62,921 | |||
The goodwill was assigned to Rumo operating segment.
The purchase price for the acquisition of Teaçu was allocated based on the fair value of assets acquired and liabilities assumed. Cosan S.A. obtained an independent valuation of property, plant and equipment, intangible assets, loans and Long-term debt and internally determined the fair value of other assets and liabilities of the acquiree.
| g. | Pro forma information |
If the entities acquired during 2012 had been included in the income statement since the beginning of the year the change to historical revenue and income would not be significantly different from the historical results presented.
11. | Equity method investments |
| Investments | Equity income in affiliate | |||||||||||||||||||
| Interest | 2012 | 2011 | 2012 | 2011 | ||||||||||||||||
| Radar Propriedades Agrícolas S.A. | 18.92 | % | 283,259 | 260,756 | 22,514 | 28,658 | ||||||||||||||
| Codexis Inc | 15.50 | % | 49,866 | - | (1,086 | ) | - | |||||||||||||
| Logum Logística S.A. ("Logum") | 20.00 | % | 25,731 | 18,300 | (4,796 | ) | - | |||||||||||||
| Other investments | 60,173 | 25,086 | 16,636 | (3,471 | ) | |||||||||||||||
| 419,029 | 304,142 | 33,268 | 25,187 | |||||||||||||||||
41
Cosan Limited
Notes to the consolidated financial statement (Continued)
Years ended March 31, 2012, 2011 and 2010
(In thousands of Reais, except otherwise stated)
11. | Equity method investments (Continued) |
Changes on Investments:
| Balances at April 1, 2009 | 323,077 | |||
| Equity income (loss) | 4,178 | |||
| Additions to investments | 48,805 | |||
| Change from associate to subsidiary | (119,051 | ) | ||
| Others | 3,805 | |||
| Balances at March 31, 2010 | 260,814 | |||
| Equity income (loss) | 25,187 | |||
| Additions to investments | 37,979 | |||
| Change from associate to subsidiary | (20,015 | ) | ||
| Others | 177 | |||
| March 31, 2011 | 304,142 | |||
| Equity income (loss) | 33,268 | |||
| Addition to investments | 42,328 | |||
| Net addition from de-consolidation of subsidiaries and formation of the JVs (a) | 38,114 | |||
| Others | 1,177 | |||
| March 31, 2012 | 419,029 |
| (a) | The Company has reflected this roll-forward activity as a “net” adjustment. This net adjustment would actually represent the de-consolidation of 100% of the equity method investments of subsidiaries de-recognized, and the addition of 50% of the fair value of the equity method investments then proportionally consolidated. |
Information on associates
| At March 31, 2012 | ||||||||||||||||
| Assets | Liabilities | Equity | Net income (loss) | |||||||||||||
| Radar Propriedades Agrícolas S.A. | 1,685,618 | 188,392 | 1,497,226 | 162,544 | ||||||||||||
| Codexis | 247,663 | 60,552 | 187,111 | (2,138 | ) | |||||||||||
| Logum | 741,782 | 484,471 | 257,311 | (28,670 | ) | |||||||||||
| At March 31, 2011 | ||||||||||||||||
| Assets | Liabilities | Equity | Net income (loss) | |||||||||||||
| Radar Propriedades Agrícolas S.A. | 1,804,609 | 426,355 | 1,378,254 | 151,421 | ||||||||||||
| Logum | 101,982 | 8,343 | 93,639 | (4,829 | ) | |||||||||||
42
Cosan Limited
Notes to the consolidated financial statement (Continued)
Years ended March 31, 2012, 2011 and 2010
(In thousands of Reais, except otherwise stated)
| 12. | Biological assets |
Changes in biological assets (sugarcane plants) are described below:
| Balances at April 1, 2009 | 754,231 | |||
| Change in fair value | 44,871 | |||
| Increase due to planting and growing costs | 647,467 | |||
| Harvested cane transferred to inventory | (483,325 | ) | ||
| Balances at March 31, 2010 | 963,244 | |||
| Change in fair value | 381,894 | |||
| Increase due to planting and growing costs | 745,572 | |||
| Harvested cane transferred to inventory | (616,693 | ) | ||
| Increase resulting from business combination | 87,115 | |||
| Balances at March 31, 2011 | 1,561,132 | |||
| Changes in fair value | 60,093 | |||
| Increase due to planting and growing costs | 551,974 | |||
| Harvested cane transferred to inventory | (401,592 | ) | ||
| Proportional consolidation impact due to the formation of JVs (50%) (a) | (803,584 | ) | ||
| Balances at March 31, 2012 | 968,023 |
| (a) | The Company has reflected this roll-forward activity as a “net” adjustment. This net adjustment would actually represent the de-consolidation of 100% of the biological assets of subsidiaries de-recognized, and the addition of 50% of the fair value of the biological assets of the JV’s then proportionally consolidated. |
| (*) | R$19,047 of this amount was allocated in sugar and ethanol inventory as of March 31, 2012. |
Sugarcane plants
Areas cultivated represent only sugarcane, without considering the land where these crops are found. The following assumptions were used to determine fair value using the discounted cash flow:
| 2012 | 2011 | |||||||
| Crop area (hectares) | 382,798 | 340,386 | ||||||
| Expect productivity (tons of cane per hectare) | 78,20 | 84,74 | ||||||
| Total amount of recoverable sugar – ATR (kg) | 137,27 | 138,54 | ||||||
| Price kg ATR projected average (R$/kg) | 0,4881 | 0,4228 | ||||||
Sugar production depends on the volume and sucrose content of sugarcane grown or supplied by farmers located near the plants. The yield of the crop and the sucrose content in sugarcane mainly depend on weather conditions such as rainfall rate and temperature, which may vary and fluctuate.
Historically, weather conditions have caused volatility in ethanol and sugar production, and consequently in operating results because it cause damage to the annual harvest. Future climate conditions may reduce the amount of sugar and sugarcane that the Company will obtain in a particular season or in the sucrose content of sugarcane. Additionally, the Company’s business is subject to seasonality according to the growth cycle of sugarcane in the south-central region of Brazil. The period of annual harvest of sugarcane in South-Central region of Brazil begins in April / May and ends in November / December. This creates variations in stock, usually high in November to cover sales between crop (i.e. from December to April) and a degree of seasonality in gross profit from sales of ethanol and sugar significantly lower in the last quarter of fiscal year. The seasonality and any reduction in the volume of sugar recovered could have a material adverse effect on our operating results and financial condition.
43
Cosan Limited
Notes to the consolidated financial statement (Continued)
Years ended March 31, 2012, 2011 and 2010
(In thousands of Reais, except otherwise stated)
| 13. | Property, plant and equipment |
| Cost: | March 31, 2011 | Additions | Write-offs | Transfers | De-consolidation and JVs formation, net (a) | Business combination | March 31, 2012 | |||||||||||||||||||||
| Land and Rural Properties | 1,263,240 | - | (40,011 | ) | 15,965 | 384,561 | (53,266 | ) | 1,570,489 | |||||||||||||||||||
| Buildings and Improvements | 1,122,256 | 4,764 | (24,559 | ) | 89,661 | (153,107 | ) | 30,899 | 1,069,914 | |||||||||||||||||||
| Machinery, Equipment and Facilities | 4,980,432 | 49,056 | (30,209 | ) | 330,325 | (69,256 | ) | 14,196 | 5,274,544 | |||||||||||||||||||
| Airplanes | 30,903 | 4,839 | (4,691 | ) | - | - | - | 31,051 | ||||||||||||||||||||
| Rail Car and Locomotives | 341,647 | - | - | 50,000 | - | - | 391,647 | |||||||||||||||||||||
| Vessels and Vehicles | 323,042 | 3,046 | (6,758 | ) | 10,312 | (26,703 | ) | 167 | 303,106 | |||||||||||||||||||
| Furniture and Fixtures and Computer Equipment | 137,206 | 520 | (21,012 | ) | 16,114 | (8,869 | ) | 1,308 | 125,267 | |||||||||||||||||||
| Construction in progress | 1,367,712 | 980,855 | (6,022 | ) | (782,762 | ) | (888,102 | ) | 3,319 | 675,000 | ||||||||||||||||||
| Major maintenance and inspections of machinery and equipment and parts | 1,043,342 | 362,511 | (747,891 | ) | - | (394,513 | ) | - | 263,449 | |||||||||||||||||||
| Others | 4,782 | 13,077 | (17,715 | ) | 796 | 156,568 | - | 157,508 | ||||||||||||||||||||
| Total | 10,614,562 | 1,418,668 | (898,868 | ) | (269,589 | ) | (999,421 | ) | (3,377 | ) | 9,861,975 | |||||||||||||||||
| Depreciation: | ||||||||||||||||||||||||||||
| Buildings and Improvements | (287,620 | ) | (43,716 | ) | 11,539 | - | 59,344 | (2,457 | ) | (262,910 | ) | |||||||||||||||||
| Machinery, Equipment and Facilities | (1,472,512 | ) | (288,990 | ) | 19,506 | 14,968 | 346,824 | (8,508 | ) | (1,388,712 | ) | |||||||||||||||||
| Airplanes | (15,195 | ) | (1,839 | ) | 860 | - | - | - | (16,174 | ) | ||||||||||||||||||
| Rail Car and Locomotives | (6,128 | ) | (12,269 | ) | - | - | - | - | (18,397 | ) | ||||||||||||||||||
| Vessels and Vehicles | (150,146 | ) | (24,667 | ) | 4,750 | - | 47,416 | (114 | ) | (122,761 | ) | |||||||||||||||||
| Furniture and Fixtures and Computer Equipment | (87,460 | ) | (11,297 | ) | 18,750 | - | (559 | ) | (735 | ) | (81,301 | ) | ||||||||||||||||
| Major maintenance and inspections of machinery and equipment and parts | (611,859 | ) | (303,082 | ) | 747,891 | - | 167,050 | - | - | |||||||||||||||||||
| Others | (3,118 | ) | (6,942 | ) | 9,297 | - | (103,994 | ) | - | (104,757 | ) | |||||||||||||||||
| Total | (2,634,038 | ) | (692,802 | ) | 812,593 | 14,968 | 516,081 | (11,814 | ) | (1,995,012 | ) | |||||||||||||||||
| 7,980,524 | 725,865 | (86,275 | ) | (254,621 | ) | (483,340 | ) | (15,192 | ) | 7,866,963 | ||||||||||||||||||
| (a) | The Company has reflected this roll-forward activity as a “net” adjustment. This net adjustment would actually represent the de-consolidation of 100% of the property, plant and equipment of subsidiaries de-recognized, and the addition of 50% of the property, plant and equipment of the JV’s then proportionally consolidated. |
Capitalization of borrowing costs
During the year ended March 31, 2012, borrowing costs capitalized amounted to R$ 71,661 (R$ 70,543 during the year ended March 31, 2011 and R$ 43,302 in 2010). The weighted average interest rate, used for capitalization of interest on the balance of construction in progress, was 8.60% per year at 2012 (9.13% per year during the year ended March 31, 2011and 6.47% in 2011).
44
Cosan Limited
Notes to the consolidated financial statement (Continued)
Years ended March 31, 2012, 2011 and 2010
(In thousands of Reais, except otherwise stated)
| 14. | Intangible assets |
| Cost | March 31, 2011 | Additions | Write-offs | Transfers | De-consolidation and JVs formation, net (a) | Business combination | March 31, 2012 | |||||||||||||||||||||
| Software license | 98,063 | 849 | (20 | ) | 14,954 | (6,992 | ) | 116 | 106,970 | |||||||||||||||||||
| Trademarks | 429,671 | - | (11,286 | ) | - | 190,026 | - | 608,411 | ||||||||||||||||||||
| Goodwill | 2,697,221 | - | (637,534 | ) | - | 836,601 | 35,966 | 2,932,254 | ||||||||||||||||||||
| Customer Base | 583,420 | 23,437 | - | 8,857 | 269,666 | - | 885,380 | |||||||||||||||||||||
| Leases | 155,505 | - | (232 | ) | - | (75,354 | ) | - | 79,919 | |||||||||||||||||||
| Distribution rights | 170,291 | 129,340 | - | 9,381 | 142,359 | - | 451,371 | |||||||||||||||||||||
| Railroad access rights | - | - | - | 236,397 | - | - | 236,397 | |||||||||||||||||||||
| Others | 43,263 | 12,249 | (8,649 | ) | - | 75,209 | - | 122,072 | ||||||||||||||||||||
| Total | 4,177,434 | 165,875 | (657,721 | ) | 269,589 | 1,431,515 | 36,082 | 5,422,774 | ||||||||||||||||||||
| Amortization | ||||||||||||||||||||||||||||
| Software license | (66,111 | ) | (8,508 | ) | 20 | - | (10,357 | ) | (100 | ) | (85,056 | ) | ||||||||||||||||
| Trademarks | (98,710 | ) | (44,579 | ) | - | - | 32,858 | - | (110,431 | ) | ||||||||||||||||||
| Customer base | (41,038 | ) | (46,904 | ) | - | - | 21,796 | - | (66,146 | ) | ||||||||||||||||||
| Leases | (15,118 | ) | (3,792 | ) | 232 | - | 6,026 | - | (12,652 | ) | ||||||||||||||||||
| Distribution rights | (62,387 | ) | (36,627 | ) | - | - | (34,641 | ) | - | (133,655 | ) | |||||||||||||||||
| improvement in public concessions | (14,968 | ) | - | - | (14,968 | ) | ||||||||||||||||||||||
| Others | (4,495 | ) | (13,945 | ) | (222 | ) | - | (48,949 | ) | - | (67,611 | ) | ||||||||||||||||
| Total | (287,859 | ) | (154,355 | ) | 30 | (14,968 | ) | (33,267 | ) | (99 | ) | (490,519 | ) | |||||||||||||||
| 3,889,575 | 11,520 | (657,691 | ) | 254,620 | 1,398,247 | 35,983 | 4,932,255 | |||||||||||||||||||||
| (a) | The Company has reflected this roll-forward activity as a “net” adjustment. This net adjustment would actually represent the de-consolidation of 100% of intangible assets of subsidiaries de-recognized, and the addition of 50% of the fair value of the intangible assets of the JV’s then proportionally consolidated. |
| Intangible asset (except goodwill) | Annual Amortization rate % | 2012 | 2011 | |||
| �� | ||||||
| Software | 20.00% | 21,915 | 31,952 | |||
| Trademarks Fuel Distributors (a) | 20.00% | 260,313 | 68,696 | |||
| Trademark Mobil (b) | 10.00% | 154,082 | 176,911 | |||
| Trademark União (c) | 2.00% | 83,585 | 85,354 | |||
| Customer base (d) | 3.45% | 535,405 | 247,907 | |||
| Operation license and customer base (e) | 3.70% | 283,829 | 294,475 | |||
| Favorable operating leases (f) | 5.56% | 67,267 | 140,387 | |||
| Distribution rights (g) | Straight line over contract term | 317,717 | 107,904 | |||
| Railroad access rights (h) | Over the life of the agreement | 221,429 | - | |||
| Others | 54,459 | 38,768 | ||||
| Total | 2,000,001 | 1,192,354 |
| (a) | Refers to the right to use the trademark of fuel distribution through its joint venture Raízen Combustíveis. |
| (b) | Refers to the right to use the trademark of Mobil lubricants. |
| (c) | Refers to the right to use the trademark sugar União arising from business combination. |
| (d) | Refers to the relationship between Raízen Combustívies and the gas station that maintain its flags and customer base acquired through business combination. |
| (e) | Refers to the customer base of Teacu acquired in its business combination |
| (f) | Refers to favorable lease contracts arising from the acquisition of Curupay |
| (g) | Intangible assets arising from exclusivity rights for fuel distribution. |
| (h) | Refers to railroad access rights in connection with cash contributed for improvements made on railroads operated by ALL (America Latina Logistica) based on a transportation agreement with Rumo entered into on December 24, 2009, expiring December 31, 2028. |
45
Cosan Limited
Notes to the consolidated financial statement (Continued)
Years ended March 31, 2012, 2011 and 2010
(In thousands of Reais, except otherwise stated)
| 14. | Intangible assets (Continued) |
Impairment testing of goodwill
For the purpose of impairment testing, goodwill is allocated to the operating segments of the Company, at which goodwill is monitored for purposes of internal administration, not above the Company's operating segments. Goodwill acquired through business combinations and those arising from the formation of the Joint Venture were allocated to four cash-generating units, which are also operating segments that provide information, as shown below:
| Carrying amount of goodwill | 2012 | 2011 | ||||||
| Cash-generating unit Raízen Energia | 1,405,407 | 1,877,833 | ||||||
| Cash-generating unit Raízen Combustíveis | 855,907 | 184,415 | ||||||
| Cash-generating unit Rumo | 98,970 | 63,814 | ||||||
| Cash-generating unit Cosan - Other Business | 571,970 | 571,159 | ||||||
| Total Goodwill | 2,932,254 | 2,697,221 | ||||||
As defined in the accounting policy described in note 2.3, the Company tests annually the recoverable amount of goodwill. Nonfinancial long term assets, not subject to amortization, are reviewed whenever there are indications that the carrying value is not recoverable.
The Company uses the value in use method to determine the recoverable amount of the asset. The value in use method is based on the projection of the expected cash flows of cash-generating units. In connection with the application of the value in use method, the key assumptions are sales prices of all commodities, operating costs, capital investment and discount rates.
Management determines its cash flows based on its annual budgets taking into account for each cash generating unit: (i) Raízen Energia: the expected long-term sales price of commodities, productivity of agricultural areas, the performance of total recoverable sugar (“ATR”), and related costs; (ii) Raízen Combustíveis: the expected growth in operations based on gross domestic product and other macroeconomic aspects; (iii) Rumo: expectations of the Brazilian sugar production destined designated mainly for export; (iv) Cosan other businesses, mainly in the expected growth in operations based on gross domestic product and other macroeconomic aspects, as well as expected sales price of commodities. All these cash flows are discounted at rates that reflect specific risks relating to assets relevant to each cash generating unit.
Management has not identified any impairments for its cash generating units. The determination of the recoverable amount depends on certain key assumptions as described above which are influenced by market conditions, technological and economic forces present at the time that the impairment test is undertaken and thus management cannot determine if impairment losses will occur in the future.
46
Cosan Limited
Notes to the consolidated financial statement (Continued)
Years ended March 31, 2012, 2011 and 2010
(In thousands of Reais, except otherwise stated)
15. | Loans and Long Term Debt |
| Description (1) | Index | Average annual interest rate (2) | 2012 | 2011 | Maturity date | |||||
| Senior Notes Due 2014 | Dollar (USD) | 9.5% | 322,654 | 576,814 | Jul-14 | |||||
| Senior Notes Due 2017 | Dollar (USD) | 7.0% | 368,601 | 658,954 | Feb-17 | |||||
| BNDES | URTJLP | 2.54% | 683,586 | 1,308,034 | Oct-25 | |||||
| Pre fixed | 4.5% | 185,568 | 242,508 | Jul-20 | ||||||
| UMBND | 6.59% | 18,365 | 38,947 | Jul-19 | ||||||
| Dollar (USD) | 6.94% | 11 | - | Nov-12 | ||||||
| Bank Credit Notes | CDCA | 0.55%+CDI | - | 31,378 | Dec-11 | |||||
| ACC | Dollar (USD) | 1.73% | 138,369 | 228,229 | Aug-12 | |||||
| Perpetual Notes | Dollar (USD) | 8.25% | 930,094 | 1,236,209 | ||||||
| Resolution 2471 (PESA) | IGP-M | 3.95% | 316,108 | 674,392 | Apr-23 | |||||
| Pre fixed | 3.0% | 53 | 114 | Oct-25 | ||||||
| Rural Credits | Pre fixed | 6.75% | 20,460 | 92,352 | Oct-12 | |||||
| Working capital | Dollar (USD) + Libor | 2.42% | 410,002 | - | Sep-16 | |||||
| IGP-M | 11% | 88 | - | Dec-12 | ||||||
| Pre fixed | 13.78% | 5,332 | - | Mar-15 | ||||||
| Pre Payments | Dollar (USD) + Libor | 4.27% | 507,454 | 736,472 | Feb-16 | |||||
| Credit Notes | 110% CDI | - | 341,226 | 303,719 | Feb-14 | |||||
| Dollar (USD) | 2.35% | 52,891 | 314,105 | Feb-13 | ||||||
| Pre-fixed | 6.25% | - | 10,142 | Oct-12 | ||||||
| Finame | Pre-fixed | 4.83% | 397,515 | 517,842 | Jul-20 | |||||
| URTJLP | 2.21% | 337,091 | 187,336 | Mar-21 | ||||||
| UMBND | 8.44% | 16 | - | Oct-12 | ||||||
| Other | Diverses | Diverses | 163,905 | 74,482 | Diverse | |||||
| 5,199,389 | 7,232,029 | |||||||||
| Current | 540,237 | 957,134 | ||||||||
| Non-Current | 4,659,152 | 6,274,895 |
| (1) | All loans and long-term debt are guaranteed by promissory notes and endorsements of the Company and its jointly-controlled subsidiaries and controlling shareholders, besides other guarantees, such as: i) Credit rights originated from energy contracts (BNDES); ii) CTN and land mortgages; and iii) underlying assets being financed (Finame). |
| (2) | Financial charges on March 31, 2012; |
Long-term debt has the following scheduled maturities:
| 2012 | 2011 | |||||||
| 13 to 24 months | 747,146 | 745,454 | ||||||
| 25 to 36 months | 1,085,917 | 762,649 | ||||||
| 37 to 48 months | 1,295,155 | 1,010,797 | ||||||
| 49 to 60 months | 591,534 | 777,963 | ||||||
| 61 to 72 months | 179,137 | 878,092 | ||||||
| 73 to 84 months | 300,921 | 222,289 | ||||||
| 85 to 96 months | 220,893 | 453,711 | ||||||
| Thereafter | 238,449 | 1,423,940 | ||||||
| 4,659,152 | 6,274,895 | |||||||
PESA - Resolution 2471- Special Agricultural Financing Program (Programa Especial de Saneamento de Ativos), or PESA
From 1998 to 2000, the Company and current the jointly-controlled Raízen Energia renegotiated their debts related to financing for agricultural costs with several financial institutions, reducing it to annual interest rates below 10%, ensuring the repayment of debt’s principal with assignment and transfer of Treasury Certificates, redeemable at the debt clearing, using the incentives promoted by Central Bank resolution No. 2471 of February 26, 1998. That debt is self-cleared by CTN, as mentioned in explanatory note 5.
47
Cosan Limited
Notes to the consolidated financial statement (Continued)
Years ended March 31, 2012, 2011 and 2010
(In thousands of Reais, except otherwise stated)
15. | Loans and Long Term Debt (Continued) |
Senior Notes Due 2014
On August 4, 2009, the indirect subsidiary CCL Finance Limited issued Senior Notes in the international market in accordance with “Regulation S” and “Rule 144A” in the amount of US$350 million, which are subject to interest of 9.5% per year, payable semiannually in February and August each year, beginning in February 2010.
Senior Notes Due 2017
On January 26, 2007, the wholly-owned indirect controlled Cosan Finance Limited issued Senior Notes in the international market in accordance with the “Regulation S” and “Rule 144A” in the amount of US$ 400 million, which are subject to interest at 7% per annum, payable semiannually in February and August of each year.
BNDES
Refers to the financing of cogeneration projects, greenfields (sugar and ethanol mills) and expansion of the logistics segment.
Perpetual Notes
On January 24 and February 10, 2006, Cosan S.A. issued perpetual notes which are listed on the Luxembourg Stock Exchange - EURO MTF. These notes bear interest at a rate of 8.25% per year, payable quarterly on May 15, August 15, November 15 and February 15 of each year, beginning May 15, 2006. Those notes were repaid in May 2011 in connection with the internal restructuring to form the JVs.
On November 5, 2010 and July 13, 2011 the subsidiary Cosan Overseas Limited issued $500,000 of perpetual notes in the foreign market, in accordance with “Regulation S”. These notes bear interest at a rate of 8.25% per year, payable quarterly
Advances on Foreign Exchange Contracts (“ACC”), Pre payments and Credit Notes
ACC contracts, pre payments and credit notes have been signed with several financial institutions and will be cleared through exports made from 2011 to 2014. These transactions are subject to interest rates ranging from 1.0% to 6.25% per annum payable semiannually and on maturity.
Bank Debt – working capital
On May 16, 2011, a bank debt of US$ 450 million was issued in favor of the jointly-controlled subsidiary Raízen Energia in order to replace (and repay) the perpetual notes issued in 2006. This bank debt matures in two years, its interest is payable quarterly and is subject to Libor + interest of 2.15% per annum.
48
Cosan Limited
Notes to the consolidated financial statement (Continued)
Years ended March 31, 2012, 2011 and 2010
(In thousands of Reais, except otherwise stated)
15. | Loans and Long Term Debt (Continued) |
Finame
Finame borrowings are financing related to financing of machinery and equipment. These loans are subject to interest payable monthly and are secured by underlying financed assets.
Covenants
The Company, its subsidiaries and jointly-controlled entities are subject to certain restrictive financial covenants set forth in existing loans and financing agreements. At March 31, 2012, Cosan, its subsidiaries and jointly-controlled entities were in compliance with its debt covenants.
| 16. | Tax Payable |
Cosan Limited is incorporated in Bermuda which has no income taxes. The following relates to Brazilian taxes of Cosan S.A., its subsidiaries and jointly-controlled entities.
| 2012 | 2011 | |||||||
| ICMS – State VAT | 66,601 | 72,265 | ||||||
| IPI | 4,631 | 30,661 | ||||||
| INSS | 13,029 | 25,309 | ||||||
| PIS | 5,003 | 7,229 | ||||||
| COFINS | 21,294 | 33,721 | ||||||
| Recovery program - Refis IV | 1,287,941 | 670,645 | ||||||
| Income Tax | 11,973 | 20,928 | ||||||
| Others | 33,871 | 23,597 | ||||||
| 1,444,343 | 884,355 | |||||||
| Current | 241,719 | 245,284 | ||||||
| Non – current | 1,202,624 | 639,071 | ||||||
Tax recovery program – Law 11.941/09 e Provisional Measure 470/09 (“Refis IV”)
On May 27, 2009 and October 13, 2009, Law 11.941 and MP 470 were approved by the Brazilian government creating a tax recovery program, permitting the taxpayer to settle its federal tax debts, previous recovery programs, and other federal taxes under court discussions with discounts on previously charged penalties and interest and in installments. Such discounts generated a gain of R$270,333, recorded in the 2009 income statement.
Additionally, it was permitted for the taxpayer to offset a portion of the penalties and interest due with its balance of income tax loss carry forwards. MP470 also allowed taxpayers to use tax losses to offset the principal balance related to IPI taxes.
On June 28, 2011 the subsidiary Cosan Lubrificantes e Especialides S.A., successor entity of Esso Brasileira de Petróleio Ltda. (“Essobrás”), joined the tax recovery program upon request of ExxonMobil Brasil Holdings B.V. (“ExxonMobil”) (See Note 5).
49
Cosan Limited
Notes to the consolidated financial statement (Continued)
Years ended March 31, 2012, 2011 and 2010
(In thousands of Reais, except otherwise stated)
| 16. | Tax Payable (Continued) |
Maturities of long-term taxes payable are as follows:
| 2012 | ||||
| 13 to 24 months | 99,083 | |||
| 25 to 36 months | 97,707 | |||
| 37 to 48 months | 97,254 | |||
| 49 to 60 months | 96,909 | |||
| 61 to 72 months | 96,270 | |||
| 73 to 84 months | 95,229 | |||
| 85 to 96 months | 95,229 | |||
| Thereafter | 524,943 | |||
| 1,202,624 | ||||
| 17. | Income taxes and social contribution |
Cosan is incorporated in Bermuda which has no income taxes. The following relates to Brazilian income taxes of Cosan S.A., its subsidiaries and jointly controlled entities.
| a) | Reconciliation of income and social contribution tax expenses: |
| 2012 | 2011 | 2010 | ||||||||||
| Pretax Income | 3,302,545 | 1,182,164 | 1,505,797 | |||||||||
| Income tax and social contribution at nominal rate (34%) | (1,122,865 | ) | (401,936 | ) | (511,971 | ) | ||||||
| Adjustments to determine the effective rate: | ||||||||||||
| Equity pick up | 11,311 | 8,563 | 1,421 | |||||||||
| Non deductable donations | (3,817 | ) | (9,131 | ) | (4,167 | ) | ||||||
| Non-taxable income of the Company | 406 | (3,026 | ) | 11,201 | ||||||||
| Tax effect due tax recovery program – REFIS IV | - | - | 59,038 | |||||||||
| Others | 4,752 | (8,978 | ) | 21,174 | ||||||||
| Income Tax and Social contribution Expense( current and deferred) | (1,110,213 | ) | (414,508 | ) | (423,304 | ) | ||||||
| Effective Rate | 33.62 | % | 35.06 | % | 28.12 | % | ||||||
| b) | Deferred income tax on assets and liabilities |
| 2012 | 2011 | |||||||||||||||||||
| Basis | IRPJ 25% | CSLL 9% | Total | Total | ||||||||||||||||
| Tax Losses: | ||||||||||||||||||||
| Tax Losses | 2,205,303 | 551,326 | - | 551,326 | 273,555 | |||||||||||||||
| Negative basis of social contribution | 2,198,476 | - | 197,863 | 197,863 | 99,609 | |||||||||||||||
| Temporary Differences: | ||||||||||||||||||||
| Monetary exchange | (109,962 | ) | (27,491 | ) | (9,897 | ) | (37,388 | ) | (274,189 | ) | ||||||||||
| Accelerated depreciation | (55,192 | ) | (13,798 | ) | - | (13,798 | ) | (4,596 | ) | |||||||||||
| Goodwill | (678,008 | ) | (169,502 | ) | (61,021 | ) | (230,523 | ) | (252,323 | ) | ||||||||||
| Business Combination | (1,585,714 | ) | (396,429 | ) | (142,714 | ) | (539,143 | ) | (626,913 | ) | ||||||||||
| Gain on the de-recognition of subsidiaries operations to form the JVs | (3,501,590 | ) | (875,397 | ) | (315,143 | ) | (1,190,540 | ) | - | |||||||||||
| FMV of PP&E and intangible assets on JVs | (2,618,000 | ) | (654,500 | ) | (235,620 | ) | (890,120 | ) | - | |||||||||||
| Deemed Cost | (366,151 | ) | (91,537 | ) | (32,954 | ) | (124,491 | ) | (124,490 | ) | ||||||||||
| Other effects | 1,107,081 | 276,770 | 99,638 | 376,408 | 113,715 | |||||||||||||||
| Total of deferred taxes | (1,400,558 | ) | (499,848 | ) | (1,900,406 | ) | (795,632 | ) | ||||||||||||
| Deferred Income Tax – Asset | 543,024 | 116,985 | ||||||||||||||||||
| Deferred Income Tax – Liabilities | (2,443,430 | ) | (912,617 | ) | ||||||||||||||||
50
Cosan Limited
Notes to the consolidated financial statement (Continued)
Years ended March 31, 2012, 2011 and 2010
(In thousands of Reais, except otherwise stated)
| 17. | Income taxes and social contribution (Continued) |
| b) | Deferred income tax on assets and liabilities (Continued) |
In assessing the deferred tax assets, management considers whether it is more likely than not that some portion or all of the deferred tax assets will not be realized. The ultimate realization of deferred tax assets is dependent upon the generation of future taxable income during the periods in which those temporary differences become deductible. Management considers the scheduled reversal of deferred tax liabilities and projected future taxable income in making this assessment. There is no expiration term for the net operating loss carry forwards. Based upon the level of historical taxable income and projections for future taxable income over the periods in which the deferred tax assets are deductible, management believes it is more likely than not that Cosan S.A. will realize the benefits of these deductible differences at March 31, 2012, as well as the net operating loss carry forwards. The amount of the deferred tax assets considered realizable, however, could be reduced in the near term if estimates of future taxable income during the carry forward period are reduced. Income tax losses carry forward and social contribution tax losses may be offset against a maximum of 30% of annual taxable income earned, with no statutory limitation period.
| 18. | Provision for judicial demands |
| 2012 | 2011 | |||||||
| Tax | 620,835 | 418,744 | ||||||
| Civil | 168,952 | 82,599 | ||||||
| Labor | 261,890 | 164,939 | ||||||
| 1,051,677 | 666,282 | |||||||
Judicial deposits on March 31, 2012 and 2011 are presented as follows:
| 2012 | 2011 | |||||||
| Tax | 411,619 | 167,547 | ||||||
| Civil | 26,970 | 15,385 | ||||||
| Labor | 65,142 | 31,887 | ||||||
| Other | 5,504 | 3,553 | ||||||
| 509,235 | 218,372 | |||||||
51
Cosan Limited
Notes to the consolidated financial statement (Continued)
Years ended March 31, 2012, 2011 and 2010
(In thousands of Reais, except otherwise stated)
| 18. | Provision for judicial demands (Continued) |
Changes in provision for judicial demands:
| Tax | Civil | Labor | Total | |||||||||||||
| Balance at March 31, 2010 | 397,051 | 66,556 | 148,376 | 611,983 | ||||||||||||
| Provision | 36,103 | 61,217 | 38,818 | 136,138 | ||||||||||||
| Settlements | (6,648 | ) | (11,278 | ) | (27,901 | ) | (45,827 | ) | ||||||||
| Write off | (45,094 | ) | (59,767 | ) | (4,418 | ) | (109,279 | ) | ||||||||
| Addition from acquisition | 14,722 | 3,404 | 4,882 | 23,008 | ||||||||||||
| Monetary variation | 22,610 | 22,467 | 5,182 | 50,259 | ||||||||||||
| Balance at March 31, 2011 | 418,744 | 82,599 | 164,939 | 666,282 | ||||||||||||
| Provisions of the period | 102,919 | 67,685 | 73,379 | 243,983 | ||||||||||||
| Settlements | (1,856 | ) | (20,772 | ) | (2,857 | ) | (25,485 | ) | ||||||||
| Write-off | (57,337 | ) | (42,591 | ) | (10,085 | ) | (110,013 | ) | ||||||||
| Net addition from de-consolidation of subsidiaries and formation of the JVs (a) | 128,206 | 65,165 | 18,910 | 212,281 | ||||||||||||
| Monetary variation | 30,159 | 16,866 | 17,604 | 64,629 | ||||||||||||
| Balance at March 31, 2012 | 620,835 | 168,952 | 261,890 | 1,051,677 | ||||||||||||
| (a) | The Company has reflected this roll-forward activity as a “net” adjustment. This net adjustment would actually represent the de-consolidation of 100% of the provisions of de-recognized, and the addition of 50% of the fair value of provisions of the JV’s then proportionally consolidated. |
Judicial demands deemed as probable loss
| (a) | Tax |
The major tax legal proceeding as of March 31, 2012 and 2011 are described as follows:
| Description | 2012 | 2011 | ||||||
| IPC – 89 (i) | 82,173 | 80,273 | ||||||
| Compensation with Finsocial (ii) | 195,421 | 183,706 | ||||||
| CIDE (iii) | 93,841 | - | ||||||
| ICMS credits (iv) | 97,552 | 56,880 | ||||||
| PIS and COFINS | 17,445 | 8,220 | ||||||
| IPI | 15,970 | 20,759 | ||||||
| IRPJ and CSLL | 2,110 | 2,093 | ||||||
| Other | 116,323 | 66,813 | ||||||
| 620,835 | 418,744 | |||||||
| (i) | Since 1993, the subsidiary Cosan Lubrificantes e Especialidades (“Cosan CLE”) filed a suit to challenge the balance sheet restatement index (IPC) established by the federal government in 1989, considering the such index did not reflect the actual inflation back then. The use of this index led the Company to supposedly overstate and overpay the income and social contribution taxes. Cosan CLE obtained a favorable preliminary court ruling that allowed it to recalculate the financial position, using indexes that accurately measured the inflation over the period. In doing so the company adjusted the amounts of income and social contribution taxes payable and identified that overpayments for both taxes were offset in subsequent years until 1997. Despite the favorable court rulings, tax authorities issued a notice of infringement to the Company challenging all tax offsets performed in 1993 and some offsets in 1994 and 1997, which led the Company to record a provision in relation to those court rulings. There are no judicial deposits in connection with this provision. |
| (ii) | During the period from October 2003 to November 2006 the subsidiary Cosan CL compensated FINSOCIAL with several other federal taxes, based on a final court decision in Set/2003 in the context of an action that was discussed the constitutionality of the FINSOCIAL. No judicial deposits related to these processes. |
52
Cosan Limited
Notes to the consolidated financial statement (Continued)
Years ended March 31, 2012, 2011 and 2010
(In thousands of Reais, except otherwise stated)
| 18. | Provision for judicial demands (Continued) |
Judicial demands deemed as probable loss (Continued)
| (a) | Tax (Continued) |
| (iv) | Prior the formation of the JV, Raízen Combustíveis, former Shell Brasil Ltda, recorded CIDE on services provided by operations. This contingency will be reimbursed by Shell if any payment is required , an equivalent amount is recorded as a receivable. Judicial deposits in connection with this provision amount to R$170,835. |
| (v) | The provision for ICMS credits is comprised of: (a) tax assessment received, in which, despite the defense filed at the administrative and judicial levels, the legal counsel of the Company understand it is more likely than not that a loss will occur, (b) recovery of credits and financial charges on issues in which Company´s management has a differing view from the tax authorities. Judicial deposits in connection with this provision amount to R$8,392. |
| (b) | Civil and Labor claims |
The Company, its subsidiaries and jointly-controlled entities are parties to a number of civil claims related to (i) indemnity for physical and moral damages; (ii) public civil claims related to sugarcane stubble burning; and (iii) environmental matters.
The Company, its subsidiaries and jointly-controlled entities are also parties to a number of labor claims filed by former employees and service providers challenging, among other factors, the payment of additional hours, night shift premium and risk premium, employment inclusion, reimbursement of discounts from payroll, such as social contribution, trade union charges, among others.
Judicial demands deemed as possible loss
| (a) | Tax claims |
The main tax claims for which the unfavorable outcome is deemed possible and, therefore, no provision for legal claims was recorded in the financial statement, are as follows:
| 2012 | 2011 | |||||||
| Withholding income taxes (i) | 204,249 | 194,498 | ||||||
| ICMS – State VAT (ii) | 1,705,220 | 490,896 | ||||||
| IPI – Federal VAT (iii) | 378,735 | 270,817 | ||||||
| Compensation with IPI – IN 67/98 (iv) | 188,479 | 181,292 | ||||||
| Contribution to IAA - Sugar & Ethanol Institute | 2,637 | - | ||||||
| INSS - social security and other (v) | 83,875 | 72,616 | ||||||
| PIS and COFINS (vi) | 529,257 | 163,129 | ||||||
| IR/CSLL (vii) | 532,131 | - | ||||||
| Others | 490,834 | 197,884 | ||||||
| 4,115,417 | 1,571,132 | |||||||
| (i) | Tax assessment – withholding income tax |
In September 2006 the Federal Revenue Service served another notice of infringement on the Company, this time for failure to withhold and pay income tax at source on capital gains derived from the acquisition of a subsidiary.
53
Cosan Limited
Notes to the consolidated financial statement (Continued)
Years ended March 31, 2012, 2011 and 2010
(In thousands of Reais, except otherwise stated)
| 18. | Provision for judicial demands (Continued) |
Judicial demands deemed as possible loss (Continued)
| (a) | Tax claims (Continued) |
| (ii) | ICMS |
Refers mainly to (i) tax assessment filed in view of the alleged lack of payment of ICMS and non-compliance with accessory obligation, in connection with the partnership and manufacturing upon demand, with Central Paulista Açúcar e Álcool Ltda., between May to December 2006 and May to December 2007; and (ii) ICMS levied on the remittances of crystallized sugar for export purposes. In accordance with the tax agent, such product is classified as semi-finished product and that, in accordance with the ICMS regulation, would be subject to taxation, (iii) ICMS levied on possible differences in terms of sugar and alcohol inventories, arising from magnetic tax files and Inventory Registry Books and (iv) ICMS concerning rate difference due to ethanol sales to companies located in other states, which, subsequently, had their registrations revoked and (v) disallowance of credit resulting from the acquisition of diesel used in the production process.
| (iii) | IPI – Federal VAT |
SRF Normative Instruction n° 67/98 approved industrial establishments to transfer certain products without payment of IPI tax. Sugarcane was for the period between July 6, 1995 and November 16, 1997 and refined sugar between January 14, 1992 and November 16, 1997. Such rule was challenged by the Federal Revenue Secretariat against the Company.
| (iv) | Offsets against IPI credits – IN 67/98 |
SRF Normative Instruction No. 67/98 made it possible to obtain refund of IPI tax payments for sales of refined sugar from January 14, 1992 through November 16, 1997. In view of this rule, the Company applied for offsetting amounts paid during the relevant periods against other tax liabilities. However, the Federal Revenue Service denied its application for both reimbursement and offsetting of such amounts. The Company challenged this ruling in an administrative proceeding.
Upon being notified to pay tax debts resulting from offset transactions in light of certain changes introduced by IN SRF No. 210/02, the Company filed a writ of mandamus and applied for a preliminary injunction seeking to stay enforceability of offset taxes, in an attempt to prevent the tax authorities from demanding the relevant tax debts in court. The preliminary injunction was granted by court.
| (v) | INSS |
Refers mainly to tax assessment received and defended by the legal counsel, concerning social security contribution on: (i) stock option plan and (ii) export sales and (iii) resale of materials for companies under common control and suppliers.
| (vi) | PIS and COFINS |
Refers, mainly, to the reversal of PIS and COFINS credits, provided by Laws 10.637/2002 and 10.833/2003, respectively. Those reversals arise from a differing interpretation of the laws by the Internal Revenue Service in regard to raw materials. Such discussions are still at the administrative level.
| (vii) | IR/CSLL – Assessment Notice |
In December 2011, the Company received notices of violation in the amount of R$ 400,318, drawn up by the Federal Revenue of Brazil charging of income tax and social calendar years 2006 to 2009, questioning: (i) deductibility of expenses for amortization of certain goodwill (ii) compensation for tax losses and negative social contribution calculation and (iii) tax on revaluation differences of the property included in fixed assets. The Company filed its defense in January 2012 and, together with its legal advisors, classified as remote loss amounted to R $ 207,078 as a possible loss and the amount of R$ 204,221. The remaining R$ 327,710 refers to various other claims in connection with income taxes and social contribution in several legal entities pertaining the subsidiaries and jointly controlled entities.
54
Cosan Limited
Notes to the consolidated financial statement (Continued)
Years ended March 31, 2012, 2011 and 2010
(In thousands of Reais, except otherwise stated)
| 18. | Provision for judicial demands (Continued) |
Judicial demands deemed as possible loss (Continued)
| (b) | Civil and labor |
The main civil and labor claims for which the unfavorable outcome is deemed possible are as follow:
| 2012 | 2011 | |||||||
| Civil | 869,954 | 377,608 | ||||||
| Labor | 1,200,573 | 302,289 | ||||||
| 2,070,527 | 679,897 | |||||||
| 19. | Commitments |
Sales
The jointly-controlled entity “Raízen Energia” is mainly engaged in the commodities market and sales are substantially performed at the price on the date of sale. However, Raizen Energia has several agreements in the sugar market, which undertake to sell volumes of those products in future harvests.
The commitments for the sale of sugar, in tons, as March 31, 2012 are as follows:
| 2012 | (*) | |||
| 2012-2013 harvest | 2,518,640 | |||
2013-2014 harvest | 1,714,101 | |||
| Total | 4,232,741 |
(*) Represents 100% of the commitments of Raízen Energia, of which the Company proportionately consolidates only 50%.
Purchases
Raízen Energia has several commitments for the purchase of sugarcane from third parties in order to secure part of its production in subsequent years. The amount of sugarcane to be acquired has been calculated based on an estimate of the quantity to be ground by area. The amount to be paid by the jointly-controlled is determined at the end of each harvest, according to prices published by CONSECANA.
Purchase commitments by harvest, in thousands of tons on March 31, 2012 are as follows:
| Fiscal Year | 2012 | (*) | ||
2012-2013 harvest | 25,130 | |||
2013-2014 harvest | 24,747 | |||
2014-2015 harvest | 22,096 | |||
2015-2016 harvest | 19,624 | |||
| After 2016 | 129,601 | |||
| Total | 221,198 |
55
Cosan Limited
Notes to the consolidated financial statement (Continued)
Years ended March 31, 2012, 2011 and 2010
(In thousands of Reais, except otherwise stated)
| 19. | Commitments (Continued) |
Purchases (Continued)
(*) Represents 100% of the commitments of Raízen Energia, of which the Company proportionately consolidates only 50%.
The jointly-controlled entity Raízen Energia has contracts to purchase industrial equipment intended for maintenance and expansion of the mills, as well as to meet the demand of the electric energy co-generation project, in the total amount of R$ 80,076 on March 31, 2012.
The Company through its subsidiary Rumo entered into a commitment to invest in rail track improvements aimed at the expansion of the logistics business, as follows:
| Fiscal Year | 2012 | |||
| 2012 | 489,794 | |||
| 2013 | 44,000 | |||
| 2014 | 2,000 | |||
| Total | 535,794 | |||
Lease Agreements
Operating Leases
Raizen Energia has operating lease contracts on land used for planting sugarcane, which will end within 20 years. The minimum payments related to these obligations are calculated on a straight-line basis over the term of the lease. The costs for these contracts during the year ended March 31, 2012, 2011 and 2010 consisted of the following:
| 2012 | (*) | 2011 | 2010 | |||||||||
| Minimum installment | 214,949 | 155,800 | 113,953 | |||||||||
| Variable installment | 280,930 | 186,484 | 112,990 | |||||||||
| Total | 495,879 | 342,284 | 226,943 |
(*) Represents 100% of the commitments of Raízen Energia, of which the Company proportionately consolidates only 50%
Future minimum lease payments under non-cancelable operating leases (with initial or remaining lease terms in excess of one year) as of March 31, 2012 are:
Raízen Energia (*) | Rumo | |||||||
| Within 1 year | 553,815 | 37,303 | ||||||
| Over 1 year, less than 5 years | 1,673,249 | 241,741 | ||||||
| More than 5 years | 1,676,005 | - | ||||||
| Total | 3,903,069 | 279,044 | ||||||
(*) Represents 100% of the commitments of Raízen Energia, of which the Company proportionately consolidates only 50%
56
Cosan Limited
Notes to the consolidated financial statement (Continued)
Years ended March 31, 2012, 2011 and 2010
(In thousands of Reais, except otherwise stated)
| 20. | Equity |
| a) | Common Stock |
As of March 31, 2012 and March 31, 2011 Cosan Limited’s share capital consists of:
Shareholder | Class A shares and/or BDRs | % | Class B 1 shares | % | ||||||||||||
| Queluz Holding Limited | 7,941,111 | 4,55 | 66,321,766 | 68,85 | ||||||||||||
| Usina Costa Pinto S.A. Açúcar e Álcool | - | - | 30,010,278 | 31,15 | ||||||||||||
| Gávea Funds | 39,445,393 | 22,62 | - | - | ||||||||||||
| Others | 126,968,837 | 72,83 | - | - | ||||||||||||
| Total | 174,355,341 | 100,00 | 96,332,044 | 100,00 | ||||||||||||
Class B1 shares entitle their holders to 10 votes per share and Class A shares entitle holders to 1 vote per share.
| b) | Repurchase of shares |
On September 16, 2011, the Board of Directors approved a stock repurchase plan for the purpose of maintenance in treasury, cancellation or disposal. The repurchase of shares is due to 365 days and the maximum amount of repurchase is US$100 million.
During the year ended March 31, 2012, the Company acquired 5,306,502 shares for R$ 109,392. The average value acquired during the period was R$ 20.52, and the maximum and minimum value were R$ 22.40 and R$ 17.58, respectively.
As of March 31, 2011, the Company has 5,306,502 treasury shares, which market value, at that date, was R$ 27.06.
| c) | Earnings per share |
The table below presents the reconciliation of the net income and the weighted average value per share used to the calculation of the basic and diluted earnings per share.
Cosan Limited does not have any dilutive potential shares outstanding, therefore the table below presents the calculation of basic and diluted earnings per share to exercise year ended March 31, 2012 and March 31, 2011:
| 2012 | 2011 | 2010 | ||||||||||
| Numerator: | ||||||||||||
| Net income – attributable to owners of the Company | 1,181,342 | 470,906 | 706,094 | |||||||||
| Denominator: | ||||||||||||
| Weighted average shares outstanding | 266,678,062 | 270,687,385 | 270,687,385 | |||||||||
| Basic and diluted earnings per share | R$ | 4.40 | R$ | 1.74 | R$ | 2.61 | ||||||
57
Cosan Limited
Notes to the consolidated financial statement (Continued)
Years ended March 31, 2012, 2011 and 2010
(In thousands of Reais, except otherwise stated)
| 21. | Gain on the de-recognition of subsidiaries operations to form the Joint Ventures (Raízen Energia e Raízen Combustíveis) |
As mentioned in note 1, on June 1, 2011, the Company concluded, together with Shell, the formation of two joint ventures: (1) Raízen Combustíveis, in the fuel distribution segment, and (ii) Raízen Energia, in the sugar and ethanol segment. The Company through its subsidiary Cosan S.A. and Shell share the control of the two entities, each one has 50% of the economic control.
The formation of Raízen Energia and Raízen Combustíveis has the objective to create one of the world’s largest producers of sugar, ethanol and bioenergy produced from sugarcane and one of the largest fuel distributors in the Brazilian market.
Due to the formation of Raízen Energia and Raízen Combustíveis, the Company contributed its sugar and ethanol businesses, deconsolidating the related assets and liabilities and recording the remaining interest at fair value.
The process of deconsolidating the contributed business, on June 1, 2011, and the recognition of the new interest at fair value produced a gain of R$2,752,730 recorded during the year and shown below:
| Fair value of the remaining interest in the joint ventures (a) | 8,105,546 | |||
| Book value of business (assets and liabilities) contributed | (4,257,640 | ) | ||
| Gain on derecognition of subsidiaries upon formation of JV | 3,847,906 | |||
| Other amounts directly attributable to de-recognition of subsidiaries: | ||||
| Write-off of recoverable taxes not realizable upon de-consolidation (b) | (83,465 | ) | ||
| Write-off of goodwill previously recorded by Cosan S.A. and Cosan Limited related to the contributed subsidiaries | (637,534 | ) | ||
Write-off of unrealized losses in relation to hedge accounting entered into by Cosan S.A. in relation to the operations of the de-consolidated subsidiaries | (157,988 | ) | ||
| Pre-existing commitments of the de-consolidated subsidiaries | (78,995 | ) | ||
| Other amounts (c) | (137,194 | ) | ||
| Gain de-recognition of subsidiaries upon formation of joint ventures | 2,752,730 |
| (a) | Based on appraisal report prepared by independent appraisers. |
| (b) | Recoverable taxes recorded by Cosan S.A., considered not realizable, and if received will be reimbursed to Raízen Energia. |
| (c) | Other amounts include transactional costs that were directly linked to the de-recognition of the subsidiary operations |
58
Cosan Limited
Notes to the consolidated financial statement (Continued)
Years ended March 31, 2012, 2011 and 2010
(In thousands of Reais, except otherwise stated)
| 21. | Gain on the de-recognition of subsidiaries operations to form the Joint Ventures (Raízen Energia e Raízen Combustíveis) (Continued) |
Considering that Cosan chose to consolidate proportionally the joint ventures, the fair value of the remaining interest was allocated to the 50% proportion of the fair value of the assets and liabilities of these entities with the purpose to determine the goodwill of the transaction, as show below:
Raízen Energia | Raízen Combustíveis | Total | ||||||||||
Fair value of assets and liabilities: | ||||||||||||
| Cash and cash equivalents | 358,457 | 273,359 | 631,816 | |||||||||
| Restricted cash | 61,655 | - | 61,655 | |||||||||
| Account Receivable | 385,651 | 1,026,274 | 1,411,925 | |||||||||
| Derivatives | 114,204 | - | 114,204 | |||||||||
| Inventories | 746,561 | 831,258 | 1,577,819 | |||||||||
| Receivable from Shell | 1,853,269 | - | 1,853,269 | |||||||||
| Other assets | 1,691,561 | 1,527,766 | 3,219,327 | |||||||||
| Investments | 120,764 | - | 120,764 | |||||||||
| Biological Assets | 1,607,170 | - | 1,607,170 | |||||||||
| Property,plant and equipment | 9,313,801 | 2,719,498 | 12,033,298 | |||||||||
| Intangible Assets | 253,152 | 1,826,224 | 2,079,376 | |||||||||
| Loan and financing | (5,579,218 | ) | (926,268 | ) | (6,505,486 | ) | ||||||
| Suppliers | (471,495 | ) | (557,912 | ) | (1,029,407 | ) | ||||||
| Taxes payable | (255,939 | ) | 35,550 | (220,389 | ) | |||||||
| Other Liabilities | (2,918,758 | ) | (2,296,137 | ) | (5,214,895 | ) | ||||||
| Non-controlling interests | (16,457 | ) | (35,527 | ) | (51,984 | ) | ||||||
Net assets at fair value: | 7,264,378 | 4,424,085 | 11,688,462 | |||||||||
| Cosan’s interest - 50% | 3,632,190 | 2,212,042 | 5,844,232 | |||||||||
| Goodwill allocated | 1,405,407 | 855,907 | 2,261,314 | |||||||||
| Fair value of the remaining interest in joint ventures | 5,037,597 | 3,067,949 | 8,105,546 | |||||||||
The goodwill of the transaction (R$2,261,314) was allocated to the segments Raízen Energia and Raízen Combustíveis in the proportion of net assets at fair value of each of these investments.
Additional Pro Forma Information
If the JVs formed during 2012 had been included in the income statement since the beginning of the year the revenue would be R$ 26,394,754 and net income would be R$2,264,333.
The Company´s share of the assets and liabilities as at March 31, 2012 and income and expenses of the jointly controlled entity for the year then ended, which is proportionally consolidated in the consolidated financial statements, are as presented in Note 29 – Segment Information. The contingent liabilities and capital commitments of the JVs are disclosed in Notes 18 and 19.
59
Cosan Limited
Notes to the consolidated financial statement (Continued)
Years ended March 31, 2012, 2011 and 2010
(In thousands of Reais, except otherwise stated)
| 22. | Gross Sales |
| 2012 | 2011 | 2010 | ||||||||||
| Gross revenue from sales of products and services | 25,917,922 | 19,783,250 | 16,685,884 | |||||||||
| Indirect taxes and deductions | (1,821,041 | ) | (1,719,770 | ) | (1,349,829 | ) | ||||||
| Net revenue | 24,096,881 | 18,063,480 | 15,336,055 | |||||||||
| 23. | Expenses by nature |
Reconciliation of expenses by nature
The expenses are presented in the consolidated results by function. The reconciliation of income by nature/purpose for the years ended March 31, 2012, 2011 and 2010 is detailed as follows:
| a) | Expenses by nature: |
| 2012 | 2011 | 2010 | ||||||||||
| Raw-material | (4,612,407 | ) | (3,657,462 | ) | (3,902,508 | ) | ||||||
| Resale fuels | (15,060,815 | ) | (10,084,103 | ) | (8,393,136 | ) | ||||||
| Payroll | (568,061 | ) | (905,510 | ) | (694,939 | ) | ||||||
| Commercial expenses | (535,439 | ) | (179,283 | ) | (221,332 | ) | ||||||
| Transportation and loading | (401,339 | ) | (545,212 | ) | (315,177 | ) | ||||||
| Depreciation and amortization | (1,142,780 | ) | (742,307 | ) | (644,635 | ) | ||||||
| Other expenses | (926,494 | ) | (607,652 | ) | (464,006 | ) | ||||||
| (23,247,335 | ) | (16,721,529 | ) | (14,635,733 | ) | |||||||
| b) | Segregated as: |
| 2012 | 2011 | 2010 | ||||||||||
| Cost of goods sold | (21,465,009 | ) | (15,150,079 | ) | (13,271,331 | ) | ||||||
| Selling | (1,136,285 | ) | (1,026,000 | ) | (862,726 | ) | ||||||
| General and Administrative | (646,041 | ) | (545,450 | ) | (501,676 | ) | ||||||
| (23,247,335 | ) | (16,721,529 | ) | (14,635,733 | ) | |||||||
| 24. | Financial results, net |
| 2012 | 2011 | 2010 | ||||||||||
| Financial Expense | ||||||||||||
| Interests | (546,850 | ) | (586,887 | ) | (556,466 | ) | ||||||
| Monetary variation | (15,624 | ) | (81,341 | ) | (64,395 | ) | ||||||
| Others | (25,615 | ) | (9,138 | ) | (1,527 | ) | ||||||
| (588,089 | ) | (677,366 | ) | (622,388 | ) | |||||||
| Financial Income | ||||||||||||
| Interests | 50,009 | 63,791 | 96,521 | |||||||||
| Monetary variation | 26,312 | 34,018 | 13,374 | |||||||||
| Investments | 131,115 | 90,345 | 52,530 | |||||||||
| Others | 372 | 603 | 39,606 | |||||||||
| 207,808 | 188,757 | 202,031 | ||||||||||
| Foreign exchange variation, net | (93,888 | ) | 282,706 | 558,977 | ||||||||
| Derivatives, net | ||||||||||||
| Commodities derivatives | 18,472 | 6,524 | (186,268 | ) | ||||||||
| Exchange rate and interest derivatives | (711 | ) | 34,984 | 517,216 | ||||||||
| Warrants in associates | (22,141 | ) | 13,248 | 23,873 | ||||||||
| (4,380 | ) | 54,756 | 354,821 | |||||||||
| (478,549 | ) | (151,147 | ) | 493,441 | ||||||||
60
Cosan Limited
Notes to the consolidated financial statement (Continued)
Years ended March 31, 2012, 2011 and 2010
(In thousands of Reais, except otherwise stated)
| 25. | Other Income (expense), net |
| 2012 | 2011 | 2010 | ||||||||||
| Other income | ||||||||||||
| Gain on sale of aviation fuel distribution business | - | - | 52,031 | |||||||||
| Gain on disposal of property, plant and equipment | 93,892 | 43,708 | - | |||||||||
| Revenue from the sale of scrap and waste | 2,862 | 6,950 | 6,417 | |||||||||
| Rental and leasing income | 57,197 | 4,111 | 6,215 | |||||||||
| Reversal of allowance for doubtful accounts with related party | 28,804 | - | - | |||||||||
| Revenue from Royalties | 19,739 | - | - | |||||||||
| Revenue from customer base | 14,827 | - | - | |||||||||
| Other Income | 44,075 | 8,908 | 11,536 | |||||||||
| 261,396 | 63,677 | 76,199 | ||||||||||
| Other expense | ||||||||||||
Provision for judicial demands | (80,835 | ) | (23,828 | ) | (25,829 | ) | ||||||
| Internal costs on Rumo transaction | (1,971 | ) | (20,319 | ) | - | |||||||
| Donations | - | (12,335 | ) | - | ||||||||
| Expenses of subsidiaries acquisition and start up | (9,497 | ) | (6,517 | ) | - | |||||||
| Other expense | (23,543 | ) | (34,506 | ) | (12,847 | ) | ||||||
| (115,846 | ) | (97,505 | ) | (38,676 | ) | |||||||
| 145,550 | (33,828 | ) | 37,523 | |||||||||
| 26. | Financial Instruments |
Financial risk management
| a) | Overview |
The Company is exposed to the following risk related to the use of financial instruments:
| · | Price risk |
| · | Foreign exchange rates |
| · | Interest rates |
| · | Credit risk |
| · | Liquidity risk |
This note presents information about the Company, its subsidiaries and jointly-controlled entities exposure for which risk above, the object of the Company’s risk management policies, the polices and processes for measurement, risk management and capital management.
| b) | Risk management structure |
The risks of each type of business markets are managed and monitored by the company and, where applicable, has risk committees to discuss and determine the hedge strategy of the company in accordance with its policies and guidelines.
There is, in Raízen Energia, a Risk Committee that meets weekly to analyze the behavior of commodity markets (mainly sugar), exchange rate and decide about coverage position and sugar pricing strategy to export, seeking to reduce the adverse effects of changes in prices and exchange rates, as well as monitor the liquidity risk and counterparty risk (credit).
61
Cosan Limited
Notes to the consolidated financial statement (Continued)
Years ended March 31, 2012, 2011 and 2010
(In thousands of Reais, except otherwise stated)
| 26. | Financial Instruments (Continued) |
| b) | Risk management structure (Continued) |
The Company, its subsidiaries and its jointly-controlled entities are exposed to market risks, mainly related to the volatility of sugar prices and foreign exchange rates. Management analyzes these risks and uses financial instruments to hedge a portion of the risk exposure.
At March 31, 2012 and 2011, fair values related to transactions involving derivative financial instruments with the purpose of hedge or other purposes were measured at market value (fair value) by observables factors such as quoted prices in active markets or discounted cash flows based on market curves and are presented below:
| Notional | Fair Value | |||||||||||||||||||
| March 31, 2012 | March 31, 2011 | March 31, 2012 | March 31, 2011 | P&L (*) | ||||||||||||||||
| Raízen Energia | ||||||||||||||||||||
| Price risk | ||||||||||||||||||||
| Commodity derivatives | ||||||||||||||||||||
| Future agreements | 1,194,225 | - | 24,377 | - | 24,377 | |||||||||||||||
| Option agreements | 8,954 | - | 782 | - | 38 | |||||||||||||||
| 25,159 | - | 24,415 | ||||||||||||||||||
| Price risk | ||||||||||||||||||||
| Exchange rate derivatives | ||||||||||||||||||||
| Future agreements | 490,949 | - | 1,682 | - | 1,431 | |||||||||||||||
| Option agreements | 258,690 | - | 1,773 | - | 1,773 | |||||||||||||||
| Price risk | 256,381 | - | 3,403 | - | 3,403 | |||||||||||||||
| 6,858 | - | 6,607 | ||||||||||||||||||
| Interest rate risk | ||||||||||||||||||||
| Derivative interest | 318,868 | - | (1,495 | ) | - | (1,495 | ) | |||||||||||||
| (1,495 | ) | - | (1,495 | ) | ||||||||||||||||
| Total Raízen Energia | 30,522 | - | 29,527 | |||||||||||||||||
| Consolidated Cosan (50% Raízen Energia) | 15,261 | - | 14,764 | |||||||||||||||||
| Derivatives in the Company and subsidiaries | ||||||||||||||||||||
| Price risk | ||||||||||||||||||||
| Commodity derivatives | ||||||||||||||||||||
| Future agreements | - | 1,308,033 | - | (68,906 | ) | - | ||||||||||||||
| Option agreements | - | 10,364 | - | (17,484 | ) | �� | - | |||||||||||||
| - | (86,390 | ) | - | |||||||||||||||||
| Price risk | ||||||||||||||||||||
| Exchange rate derivatives | ||||||||||||||||||||
| Future agreements | - | (114,204 | ) | - | (117 | ) | - | |||||||||||||
| Option agreements | 325,029 | 694,599 | (5,282 | ) | 9,900 | (5,282 | ) | |||||||||||||
| (5,282 | ) | 9,783 | (5,282 | ) | ||||||||||||||||
| Total Cosan (including 50% Raízen Energia) | 9,979 | (76,607 | ) | 9,482 | ||||||||||||||||
| Total of Assets | 19,590 | 55,682 | ||||||||||||||||||
| Total of Liabilities | (9,611 | ) | (132,289 | ) | ||||||||||||||||
(*) Values from the income statement calculated for the year ended March 31, 2012.
62
Cosan Limited
Notes to the consolidated financial statement (Continued)
Years ended March 31, 2012, 2011 and 2010
(In thousands of Reais, except otherwise stated)
| 26. | Financial Instruments (Continued) |
| c) | Price Risk |
This arises from the potential for fluctuations in the market prices of products sold by the Raizen Energia, mainly raw material sugar - VHP (sugar #11) and white sugar (LIFFE sugar #5). These fluctuations in prices can cause substantial changes in the revenues. To mitigate these risks, the Raizen Energia constantly monitors the markets, seeking to anticipate changes in prices. The positions of the consolidated derivative financial instruments to hedge the price risk of commodities are shown in the table below:
| Price Risk : derivatives of commodities open at March 31, 2012 | ||||||||||||||
| Derivatives | Purchased / Sold | Market | Contract | Maturity | Notional (units) | Notional (R$ thousand) | Fair Value (R$ thousand) | |||||||
Contracted financial Instruments by Raízen Energia | ||||||||||||||
| Composition of balances of derivative financial instruments designated in hedge accounting | ||||||||||||||
| Future | Sold | NYBOT | Sugar#11 | 1-May-12 | 129,241 T | 132,392 | 4.106 | |||||||
| Future | Sold | NYBOT | Sugar#11 | 1-Jul-12 | 440,050 T | 434,844 | 13,778 | |||||||
| Future | Sold | NYBOT | Sugar#11 | 1-Oct--12 | 551,358 T | 534,580 | 5,901 | |||||||
| Future | Sold | NYBOT | Sugar#11 | 1-Mar-13 | 110,851 T | 109,453 | 223 | |||||||
| Future | Sold | NYBOT | Sugar#11 | 1-Jul-13 | 204 T | 191 | (5) | |||||||
| Sub-total of future sugar sold | 1,231,704 T | 1,211,460 | 24,003 | |||||||||||
| Composition of balances of derivative financial instruments not- designated in hedge accounting | ||||||||||||||
| Future | Purchased | NYBOT | Sugar#11 | 1- May-12 | (25,808 T) | (25,589) | 28 | |||||||
| Future | Purchased | NYBOT | Sugar#11 | 1-Jul-12 | (10,160 T) | (9,562) | 160 | |||||||
| Future | Purchased | NYBOT | Sugar#11 | 1-Out-12 | (2,693 T) | (2,462) | 120 | |||||||
| Future | Purchased | NYBOT | Sugar#11 | 1-May-13 | (1,422 T) | (1,338) | 64 | |||||||
| Future | Purchased | NYBOT | Sugar#11 | 1-May-13 | (254 T) | (240) | 8 | |||||||
| Future | Purchased | NYBOT | Sugar#11 | 1-Jul-13 | (203 T) | (187) | 8 | |||||||
| Sub-total of future sugar purchased | (40,540 T) | (39,378) | 388 | |||||||||||
| Sub-total of future sugar | 1,191,164 T | 1,172,082 | 24,391 | |||||||||||
| Call | Purchased | NYBOT | Sugar#11 | 1-May-12 | (5,080 T) | (57) | 14 | |||||||
| Call | Purchased | NYBOT | Sugar#11 | 1-Jul-12 | (111,766 T) | (2,760) | 269 | |||||||
| Sub-total of call purchased | (116,846 T) | (2,817) | 283 | |||||||||||
| Call | Sold | NYBOT | Sugar#11 | 1-May-12 | 27,687 T | 2,751 | (11) | |||||||
| Call | Sold | NYBOT | Sugar#11 | 1-Jul-12 | 76,204 T | 4,500 | (184) | |||||||
| Call | Sold | NYBOT | Sugar#11 | 1-Jul-12 | 35,562 T | 1,820 | (86) | |||||||
| Sub-total of call sold | 139,453 T | 9,071 | (281) | |||||||||||
| Put | Purchased | NYBOT | Sugar#11 | 1-May-12 | 27,687 T | 2,699 | 779 | |||||||
| Sub-total de put purchased | 27,687 T | 2,699 | 779 | |||||||||||
| Sub-total of options of sugar | 8,953 | 781 | ||||||||||||
| Future | Sold | BMFBovespa | ETH | 30-Mar-12 | 16,560 m³ | 20,430 | 8 | |||||||
| Future | Sold | BMFBovespa | ETH | 30-Apr-12 | 18,210 m³ | 22,642 | (18) | |||||||
| Sub-total of future ethanol sold | 34,770 m³ | 43,072 | (10) | |||||||||||
| Future | Purchased | BMFBovespa | ETH | 30-Mar-12 | (5,910 m³) | (7,473) | (3) | |||||||
| Future | Purchased | BMFBovespa | ETH | 30-Mar-12 | (10,650 m³) | (13,456) | - | |||||||
| Sub-total of future ethanol purchased | (16,560 m³) | (20,929) | (3) | |||||||||||
| Sub-total of future ethanol | 18,210 m³ | 22,143 | (13) | |||||||||||
| Total of commodities | 1,203,178 | 25,159 | ||||||||||||
63
Cosan Limited
Notes to the consolidated financial statement (Continued)
Years ended March 31, 2012, 2011 and 2010
(In thousands of Reais, except otherwise stated)
| 26. | Financial Instruments (Continued) |
| Price risk: commodity derivatives outstanding on March 31, 2011 | ||||||||||||||
| Derivatives | Long/Short | Market | Agreement | Maturity | Notional | Notional | Fair value | |||||||
Composition of derivatives financial instruments designated in hedge accounting | ||||||||||||||
| Future | Short | NYBOT | #11 | 1-May-11 | 23,150 T | 26,442 | (392) | |||||||
| Future | Short | NYBOT | #11 | 1-May-11 | 208,239 T | 200,552 | (2,154) | |||||||
| Future | Short | NYBOT | #11 | 1-Jul-11 | 520,877 T | 424,617 | (43,705) | |||||||
| Future | Short | NYBOT | #11 | 1-Oct-11 | 513,460 T | 388,694 | (56,734) | |||||||
| Future | Short | NYBOT | #11 | 1-Mar-12 | 139,656 T | 121,973 | 2,827 | |||||||
| Sub-total of futures of Sugar Sold | 1,405,382 T | 1,162,278 | (100,159) | |||||||||||
Composition of derivatives financial instruments not designated in hedge accounting | ||||||||||||||
| Future | Long | NYBOT | #11 | 1-May-11 | (55,883 T) | (49,591) | 4,807 | |||||||
| Future | Long | NYBOT | #11 | 1-Jul-11 | (7,620 T) | (6,786) | 66 | |||||||
| Future | Long | NYBOT | #11 | 1-Oct-11 | (50,802 T) | (40,314) | 3,758 | |||||||
| Future | Long | NYBOT | #11 | 1-Mar-12 | (84,027 T) | (49,064) | 22,623 | |||||||
| Sub-total of futures of Sugar Purchased | (198,333 T) | (145,755) | 31,253 | |||||||||||
| Call | Short | NYBOT/OTC | #11 | 1-Oct-11 | 43,182 T | 985 | (6,559) | |||||||
| Call | Short | NYBOT | #11 | 1-Oct-11 | 55,883 T | 3,651 | (7,826) | |||||||
| Call | Short | NYBOT | #11 | 1-Jul-12 | 101,605 T | 1,177 | (4,597) | |||||||
| Sub-total of Call Sold | 200,669 T | 5,813 | (18,981) | |||||||||||
| Put | Long | NYBOT/OTC | #11 | 1-Oct-11 | 43,182 T | 985 | 574 | |||||||
| Put | Long | NYBOT/OTC | #11 | 1-Oct-11 | 55,883 T | 3,566 | 923 | |||||||
| Sub-total de Put Purchased | 99,065 T | 4,551 | 1,497 | |||||||||||
| Total de Commodities | 1,026,888 | (86,390) | ||||||||||||
The fair value of these derivatives was measured by observable factors, such as quoted prices in active markets and, in some cases, by means of models whose assumptions are observable in the market.
64
Cosan Limited
Notes to the consolidated financial statement (Continued)
Years ended March 31, 2012, 2011 and 2010
(In thousands of Reais, except otherwise stated)
| 26. | Financial Instruments (Continued) |
| d) | Foreign Exchange risk |
This arises from the possibility of fluctuations in the exchange rates of the foreign currencies used by its subsidiaries and jointly-controlled entities for the export revenues of products, imports, debt cash flow and other assets and liabilities denominated in a foreign currency. Its subsidiaries and jointly-controlled entities use derivative transactions to manage the risks of cash flow coming from the export revenues denominated in U.S. dollars, net of other cash flows denominated in foreign currency. The table below demonstrates the consolidated positions outstanding on March 31, 2012 of derivatives used to hedge exchange rates:
| Price Risk : derivatives of foreign currencies open in March 31, 2012 | |||||||||||||||||
| Derivatives | Purchased / Sold | Market | Contract | Maturity | Notional (USD) | Notional (R$ Thousand) | Fair Value (R$ Thousand) | ||||||||||
Financial instruments contracted by Raizen Energia | |||||||||||||||||
| Composition of balances of derivative financial instruments designated in hedge accounting | |||||||||||||||||
| Term | Sold | OTC/Cetip | NDF | 02-Apr-12 | 141,000 | 258,690 | 1,773 | ||||||||||
| Sub-total of term sold | 141,000 | 258,690 | 1,773 | ||||||||||||||
| Composition of balances of derivative financial instruments non-designated in hedge accounting | |||||||||||||||||
| Future | Sold | BMFBovespa | Commercial Dollar | 02-Apr-12 | 898,000 | 1,563,367 | 6,954 | ||||||||||
| Future | Sold | BMFBovespa | Commercial Dollar | 02-May-12 | 330,500 | 608,037 | 1,614 | ||||||||||
| Future | Sold | BMFBovespa | Commercial Dollar | 02-May-12 | 3,250 | 5,967 | (3 | ) | |||||||||
| Sub-total of future sold | 1,231,750 | 2,177,371 | 8,565 | ||||||||||||||
| Future | Purchased | BMFBovespa | Commercial Dollar | 02-Apr-12 | (922,000 | ) | (1,685,044 | ) | (6,882 | ) | |||||||
| Future | Purchased | BMFBovespa | Commercial Dollar | 02-May-12 | (750 | ) | (1,378 | ) | (1 | ) | |||||||
| Sub-total of future purchased | (922,750 | ) | (1,686,422 | ) | (6,883 | ) | |||||||||||
| Exchange lock | Sold | OTC | Exchange lock | 02-Jul-12 | 20,000 | 38,254 | 1,121 | ||||||||||
| Exchange lock | Sold | OTC | Exchange lock | 02-Jul-12 | 30,000 | 58,104 | 2,575 | ||||||||||
| Exchange lock | Sold | OTC | Exchange lock | 06-Set-12 | 20,000 | 36,044 | (1,445 | ) | |||||||||
| Exchange lock | Sold | OTC | Exchange lock | 13-Set-12 | 40,250 | 74,881 | (768 | ) | |||||||||
| Exchange lock | Sold | OTC | Exchange lock | 24-Set-12 | 25,000 | 49,098 | 1,920 | ||||||||||
| 135,250 | 256,381 | 3,403 | |||||||||||||||
| Total of Exchange rate derivatives (Raízen Energia) | 585,250 | 1,006,020 | 6,858 | ||||||||||||||
| Derivatives | Purchased / Sold | Market | Contract | Maturity | Number of Contracts | Strike | Middle Price | Fair Price | Notional (USD) | Notional (R$ mil) | Fair Value (R$ thousand) | ||||||||||||||||||||||
| Term | Purchased | OTC | NDF | 4-May-12 | 1 | - | 1.8944 | 1.8417 | (6,188 | ) | 11,722 | 348 | |||||||||||||||||||||
| Term | Purchased | OTC | NDF | 4-May-12 | 1 | - | 1.6789 | 1.8417 | (4,197 | ) | 7,047 | (660 | ) | ||||||||||||||||||||
| Term | Purchased | OTC | NDF | 3-Aug-12 | 1 | - | 1.9358 | 1.8771 | (4,197 | ) | 7,239 | (597 | ) | ||||||||||||||||||||
| Term | Purchased | OTC | NDF | 3-Aug-12 | 1 | - | 1.7247 | 1.8771 | (6,188 | ) | 11,978 | 389 | |||||||||||||||||||||
| Term | Purchased | OTC | NDF | 1-Nov-12 | 1 | - | 1.9780 | 1.9166 | (4,197 | ) | 7,390 | (563 | ) | ||||||||||||||||||||
| Term | Purchased | OTC | NDF | 1-Nov-12 | 1 | - | 1.7607 | 1.9166 | (6,188 | ) | 12,239 | 455 | |||||||||||||||||||||
| Term | Purchased | OTC | NDF | 4-Feb-13 | 1 | - | 2.0209 | 1.9508 | (4,197 | ) | 7,546 | (524 | ) | ||||||||||||||||||||
| Term | Purchased | OTC | NDF | 4-Feb-13 | 1 | - | 1.7978 | 1.9508 | (6,188 | ) | 12,504 | 525 | |||||||||||||||||||||
| Term | Purchased | OTC | NDF | 3-May-13 | 1 | - | 2.0589 | 1.9737 | (4,197 | ) | 7,696 | (472 | ) | ||||||||||||||||||||
| Term | Purchased | OTC | NDF | 3-May-13 | 1 | - | 1.8336 | 1.9737 | (6,188 | ) | 12,739 | 597 | |||||||||||||||||||||
| Term | Purchased | OTC | NDF | 2-Aug-13 | 1 | - | 2.1005 | 2.0103 | (4,197 | ) | 7,859 | (430 | ) | ||||||||||||||||||||
| Term | Purchased | OTC | NDF | 2-Aug-13 | 1 | - | 1.8724 | 2.0103 | (6,188 | ) | 12,997 | 653 | |||||||||||||||||||||
| Term | Purchased | OTC | NDF | 4-Nov-13 | 1 | - | 2.1424 | 2.0480 | (4,197 | ) | 8,032 | (386 | ) | ||||||||||||||||||||
| Term | Purchased | OTC | NDF | 4-Nov-13 | 1 | - | 1.9137 | 2.0480 | (6,188 | ) | 13,256 | 699 | |||||||||||||||||||||
| Term | Purchased | OTC | NDF | 4-Feb-14 | 1 | - | 2.1852 | 2.0850 | (4,197 | ) | 8,190 | (358 | ) | ||||||||||||||||||||
| Term | Purchased | OTC | NDF | 4-Feb-14 | 1 | - | 1.9513 | 2.0850 | (6,188 | ) | 13,521 | 747 | |||||||||||||||||||||
| Term | Purchased | OTC | NDF | 2-May-14 | 1 | - | 2.2211 | 2.1210 | (4,197 | ) | 8,340 | (329 | ) | ||||||||||||||||||||
| Term | Purchased | OTC | NDF | 2-May-14 | 1 | - | 1.9870 | 2.1210 | (6,188 | ) | 13,743 | 770 | |||||||||||||||||||||
| Term | Purchased | OTC | NDF | 4-Aug-14 | 1 | - | 2.2630 | 2.1610 | (4,197 | ) | 8,507 | (288 | ) | ||||||||||||||||||||
| Term | Purchased | OTC | NDF | 4-Aug-14 | 1 | - | 2.0268 | 2.1610 | (6,188 | ) | 14,002 | 820 | |||||||||||||||||||||
| Term | Purchased | OTC | NDF | 4-Nov-14 | 1 | - | 2.3048 | 2.2002 | (4,197 | ) | 8,666 | (250 | ) | ||||||||||||||||||||
| Term | Purchased | OTC | NDF | 4-Nov-14 | 1 | - | 2.0648 | 2.2002 | (6,188 | ) | 14,261 | 876 | |||||||||||||||||||||
| Term | Purchased | OTC | NDF | 4-Feb-15 | 1 | - | 2.3429 | 2.2394 | (4,197 | ) | 8,813 | (221 | ) | ||||||||||||||||||||
| Term | Purchased | OTC | NDF | 4-Feb-15 | 1 | - | 2.0997 | 2.2394 | (6,188 | ) | 14,497 | 915 | |||||||||||||||||||||
| Term | Purchased | OTC | NDF | 4-May-15 | 1 | - | 2.3800 | 2.2564 | (4,197 | ) | 8,942 | (201 | ) | ||||||||||||||||||||
| Term | Purchased | OTC | NDF | 4-May-15 | 1 | - | 2.1305 | 2.2564 | (6,188 | ) | 14,726 | 957 | |||||||||||||||||||||
| Term | Purchased | OTC | NDF | 4-Aug-15 | 1 | - | 2.4247 | 2.2564 | (4,197 | ) | 9,089 | (169 | ) | ||||||||||||||||||||
| Term | Purchased | OTC | NDF | 4-Aug-15 | 1 | - | 2.1656 | 2.2564 | (6,188 | ) | 15,003 | 1,032 | |||||||||||||||||||||
| Term | Purchased | OTC | NDF | 4-Nov-15 | 1 | - | 2.4653 | 2.2564 | (4,197 | ) | 9,231 | (140 | ) | ||||||||||||||||||||
| Term | Purchased | OTC | NDF | 4-Nov-15 | 1 | - | 2.1994 | 2.2564 | (6,188 | ) | 15,254 | 1,087 | |||||||||||||||||||||
| Total Exchange rate derivatives (Company and subsidiaries) | (155,775 | ) | 325,029 | 5,282 | |||||||||||||||||||||||||||||
65
Cosan Limited
Notes to the consolidated financial statement (Continued)
Years ended March 31, 2012, 2011 and 2010
(In thousands of Reais, except otherwise stated)
| 26. | Financial Instruments (Continued) |
| Exchange risk : exchange derivatives outstanding on March 31, 2011 | ||||||||||||||
| Derivatives | Long/Short | Market | Agreement | Maturity | Notional | Fair value | ||||||||
Composition of derivatives financial instruments designated in hedge accounting | ||||||||||||||
| Forward | Short | OTC/Cetip | NDF | 1-Apr-11 | 166,150 | 3,279 | ||||||||
| Forward | Short | OTC/Cetip | NDF | 31-May-11 | 117,782 | 2,094 | ||||||||
| Forward | Short | OTC/Cetip | NDF | 1-Jul-11 | 84,645 | 1,349 | ||||||||
| Forward | Short | OTC/Cetip | NDF | 1-Aug-11 | 85,300 | 1,422 | ||||||||
| Forward | Short | OTC/Cetip | NDF | 3-Oct-11 | 396,618 | 11,046 | ||||||||
| Forward | Short | OTC/Cetip | NDF | 2-Jan-12 | 91,075 | 3,744 | ||||||||
| Sub-total of Forward Sold | 941,570 | 22,932 | ||||||||||||
Composition of derivatives financial instruments not designated in hedge accounting | ||||||||||||||
| Future | Long | BMFBovespa | Commerc. U.S. dollar | 2-May-11 | (114,204) | (117 | ) | |||||||
| Sub-total of Future Purchased | (114,204 | ) | (117 | ) | ||||||||||
| Forward | Long | OTC | NDF (Offshore) | 4-May-11 | (10,780 | ) | (625 | ) | ||||||
| Forward | Long | OTC | NDF (Offshore) | 4-Aug-11 | (11,014 | ) | (619 | ) | ||||||
| Forward | Long | OTC | NDF (Offshore) | 4-Nov-11 | (11,246 | ) | (613 | ) | ||||||
| Forward | Long | OTC | NDF (Offshore) | 3-Feb-12 | (11,489 | ) | (604 | ) | ||||||
| Forward | Long | OTC | NDF (Offshore) | 4-May-12 | (11,722 | ) | (584 | ) | ||||||
| Forward | Long | OTC | NDF (Offshore) | 3-Aug-12 | (11,978 | ) | (586 | ) | ||||||
| Forward | Long | OTC | NDF (Offshore) | 1-Nov-12 | (12,239 | ) | (595 | ) | ||||||
| Forward | Long | OTC | NDF (Offshore) | 4-Feb-13 | (12,504 | ) | (595 | ) | ||||||
| Forward | Long | OTC | NDF (Offshore) | 3-May-13 | (12,739 | ) | (571 | ) | ||||||
| Forward | Long | OTC | NDF (Offshore) | 2-Aug-13 | (12,997 | ) | (534 | ) | ||||||
| Forward | Long | OTC | NDF (Offshore) | 4-Nov-13 | (13,256 | ) | (493 | ) | ||||||
| Forward | Long | OTC | NDF (Offshore) | 4-Feb-14 | (13,521 | ) | (462 | ) | ||||||
| Forward | Long | OTC | NDF (Offshore) | 2-May-14 | (13,743 | ) | (476 | ) | ||||||
| Forward | Long | OTC | NDF (Offshore) | 4-Aug-14 | (14,002 | ) | (617 | ) | ||||||
| Forward | Long | OTC | NDF (Offshore) | 4-Nov-14 | (14,261 | ) | (754 | ) | ||||||
| Forward | Long | OTC | NDF (Offshore) | 4-Feb-15 | (14,497 | ) | (872 | ) | ||||||
| Forward | Long | OTC | NDF (Offshore) | 4-May-15 | (14,726 | ) | (991 | ) | ||||||
| Forward | Long | OTC | NDF (Offshore) | 4-Aug-15 | (15,003 | ) | (1,152 | ) | ||||||
| Forward | Long | OTC | NDF (Offshore) | 4-Nov-15 | (15,254 | ) | (1,291 | ) | ||||||
| Sub-total of Forward Purchased | (246,970 | ) | (13,033 | ) | ||||||||||
| Total of exchange rate derivatives | 580,395 | 9,783 | ||||||||||||
66
Cosan Limited
Notes to the consolidated financial statement (Continued)
Years ended March 31, 2012, 2011 and 2010
(In thousands of Reais, except otherwise stated)
| 26. | Financial Instruments (Continued) |
On March 31, 2012 and 2011, the Company, its subsidiaries and its jointly-controlled entities had the following net exposure to the variation of U.S. dollar assets and liabilities denominated in U.S. dollars:
| 2012 | 2011 | |||||||||||||||
| R$ | US$ (in thousands) | R$ | US$ (in thousands) | |||||||||||||
| Bank accounts | 6,349 | 3,484 | 130,455 | 80,098 | ||||||||||||
| Restrict Cash | 45,976 | 25,232 | 126,872 | 77,898 | ||||||||||||
| Accounts receivable | 164,681 | 90,380 | 7,556 | 4,639 | ||||||||||||
| Related Parties (Shell) | 436.362 | 239,483 | - | - | ||||||||||||
| Loans | (2,915,388 | ) | (1,600,015 | ) | (3,791,517 | ) | (2,327,943 | ) | ||||||||
| Net foreign exchange exposure | (2,262,020 | ) | (1,241,436 | ) | (3,526,634 | ) | (2,165,308 | ) | ||||||||
| e) | Effect of Hedge Accounting |
The jointly-controlled entity Raízen Energia formally designated its transactions subject to hedge accounting for cash flow hedges from sugar VHP (raw material) export revenue, documenting: (i) the relationship of the hedge, (ii) the purpose for taking the hedge and its risk management strategy, (iii) identification of the financial instrument, (iv) the transaction or item covered, (v) the nature of the risk being hedged, (vi) a description of the hedging relationship (vii) the demonstration of correlation between the hedge and the object of coverage, and (viii) the prospective analysis of hedge effectiveness. The derivative financial instruments of Sugar # 11 (NYBOT or OTC) were designated to cover the risk of price and Non-Deliverable Forwards (NDF) to cover exchange rate risk, as demonstrated in topics (b) and (c) of this Note.
Raizen Energia records gains and losses deemed effective for purposes of hedge accounting to a specific account in equity (“other comprehensive income”), until the object of coverage (hedged item) affects the profit and loss. On March 31, 2012, the amounts recorded in other comprehensive income related to hedge accounting are as follows:
| Expected period to affect P&L | |||||||||||||||||
| Derivative | Market | Risk | 2012/2013 | 2013/2014 | Total | ||||||||||||
| Future | OTC / NYBOT | #11 | 40,543 | 564 | 41,107 | ||||||||||||
| NDF | OTC / CETIP | USD | 1,663 | - | 1,663 | ||||||||||||
| 42,206 | 564 | 42,770 | |||||||||||||||
| (-) Deferred income tax | (14,350 | ) | (192 | ) | (14,542 | ) | |||||||||||
| Effect on the Raizen Equity | 27,856 | 372 | 28,228 | ||||||||||||||
| Effect on equity of Cosan (50%) | 14,114 | ||||||||||||||||
67
Cosan Limited
Notes to the consolidated financial statement (Continued)
Years ended March 31, 2012, 2011 and 2010
(In thousands of Reais, except otherwise stated)
| 26. | Financial Instruments (Continued) |
| e) | Effect of Hedge Accounting |
The changes for the period of the effect of hedge accounting on other comprehensive income of Cosan S.A is shown below:
| Cash flow hedge | ||||
| Balance at March 31, 2010 | - | |||
| Gain/(losses) of cash flow hedges for the year: | ||||
| Commodities futures and swap contracts | (572,161 | ) | ||
| Currency forward contracts | 179,099 | |||
| Reclassification adjustments for losses included in the income statement | 175,945 | |||
| Total before tax effect | (217,117 | ) | ||
| Tax effect on gain/(losses) of cash flow hedges for the period – 34% | 73,819 | |||
| Balance at March 31, 2011 | (143,298 | ) | ||
| Gain/(losses) of cash flow hedges for the year: | ||||
Commodities futures and swap contracts | 5,414 | |||
Currency forward contracts | 38,286 | |||
| Reclassification adjustments for losses / gains included in the income statement | 36,815 | |||
| Write off of OCI due to the formation of JV | 157,989 | |||
| Tax effect on gain/(losses) of cash flow hedges for the period – 34% | (81,091 | ) | ||
Balance at March 31, 2012 | 14,114 | |||
| f) | Interest rate risk |
The Company, its subsidiaries and jointly-controlled entities monitors the fluctuations in variable interest rates in connection with certain debts, especially those related to the risk of Libor, and makes use of derivative instruments in order to minimize these risks. The table below shown the consolidated positions open on March 31, 2012 of derivatives used for interest rate (none in 2011):
| Price Risk : derivatives of interests open in March 31, 2012 | ||||||||||||
| Derivatives | Asset / Liabilities | Market | Maturity | Notional | Notional | Fail Value | ||||||
| (US$ Thousands) | (R$ Thousand) | (R$ Thousand) | ||||||||||
| Interest rate Swap | Libor 3M / pré | OTC | Jan-16 | 175,000 | 318,868 | (1,495) | ||||||
| Total | 175,000 | 318,868 | (1,495) | |||||||||
| g) | Credit risk |
A significant portion of sales made by the subsidiaries and jointly-controlled entities is to a select group of best-in-class counterparts (i.e. trading companies, fuel distribution companies and large supermarket chains).
Credit risk is managed through specific rules of client acceptance including credit ratings and limits for customer exposure, including the requirement of a letter of credit from major banks and obtaining actual warranties on given credit, when applicable. Management believes that the risk of credit is covered by the allowance for doubtful accounts.
68
Cosan Limited
Notes to the consolidated financial statement (Continued)
Years ended March 31, 2012, 2011 and 2010
(In thousands of Reais, except otherwise stated)
| 26. | Financial Instruments (Continued) |
| g) | Credit risk (Continued) |
The Company, its subsidiaries and jointly-controlled entities buy and sell commodity derivatives in futures and options markets on the New York Board of Trade (NYBOT) and the London International Financial Futures and Options Exchange (LIFFE), as well as in the over-the-counter (OTC) market with selected counterparties. The Company and its jointly-controlled entities buy and sell foreign exchange derivatives on BM&FBovespa and OTC contracts registered with CETIP (OTC clearing house) with banks Espirito Santo Investment do Brasil S.A., Deutsche Bank S.A. – Banco Alemão, Banco JP Morgan S.A. and Banco Standard de Investimentos S.A..
Guarantee margins – The Company’s derivative operations on commodity exchanges (NYBOT, LIFFE and BM&FBovespa) require an initial guarantee margin. The brokers with which the Company operates on these commodity exchanges offer credit limits for these margins. As of March 31, 2011, the total credit limit used as initial margin required by the NYBOT was R$62,247 (R$136,420 as of March 31, 2011). As a requirement to trade in BM&FBovespa, the Company posted on March 31, 2012, the amount of R$76,436 (R$50,000 as of March 31, 2011) as guarantee in the form of a settlement bond issued by a first-class banking institution.
| h) | Liquidity risk |
Liquidity risk is the risk that the Company, its subsidiaries and jointly-controlled entities will encounter difficulties in meeting the obligations associated with its derivative financial liabilities that are settled with cash payments or other financial assets. The approach of the Company, its subsidiaries and jointly-controlled entities liquidity management is to ensure, as much as possible, which always has sufficient liquidity to meet its obligations to win, under normal and stress, without causing unacceptable losses or risk damaging the reputation of the Company, its subsidiaries and jointly-controlled entities.
| i) | Fair value |
The fair value of financial assets and liabilities is included in the price at which the instrument could be exchanged in a current transaction between parties willing to negotiate, and not in a forced sale or liquidation. The following methods and assumptions were used to estimate the fair value.
Cash and cash equivalents, accounts receivable, accounts payable and other short-term obligations approximate their respective carrying values due largely to short-term maturity of these instruments.
The fair value of marketable securities and bonds is based on price quotations on the date of the financial statements. The fair value of non-negotiable instruments, bank loans and other debts, obligations under finance leases, as well as other non-current financial liabilities are estimated by the discounted future cash flows using rates currently available for debt or deadlines and similar instruments.
69
Cosan Limited
Notes to the consolidated financial statement (Continued)
Years ended March 31, 2012, 2011 and 2010
(In thousands of Reais, except otherwise stated)
| 26. | Financial Instruments (Continued) |
| i) | Fair value (Continued) |
The fair market value of Senior Notes due 2014 and 2017, described in note 16, at its market price are 115.5% and 106% respectively, of its face value at March 31, 2012.
The fair market value of Perpetual bonds, described in note 16, at its market price is 105.2%, respectively, of its face value at March 31, 2012.
In respect of other loans and financing, their fair market values substantially approximate the amounts recorded in the financial statements due to the fact that these financial instruments are subject to variable interest rates.
The fair value of financial assets available for sale is obtained through quoted market prices in active markets, if any.
The Company, its subsidiaries and jointly-controlled entities enter into derivative financial instruments with various counterparties, primarily financial institutions with credit ratings of investment grade. The derivatives valued using valuation techniques with observable market data relate mainly to interest rate swaps, foreign exchange contracts and term contracts for commodities futures. The valuation techniques applied more often include pricing models for fixed-term contracts and swaps, with a present value calculation. The models incorporate various data, including credit quality of counterparties, the rates of currency spot and forward, interest rate curves and forward rate curves of the commodity underlying.
Fair value hierarchy
The Company, its subsidiaries and jointly-controlled entities have the following hierarchy to determine and disclose the fair value of financial instruments by the technical evaluation:
| · | Level 1: quoted prices in a active market to identical assets and liabilities; |
| · | Level 2: other techniques for which all data that have significant effect on the fair value recorded are observable, directly or indirectly; |
| · | Level 3: techniques that use data that have significant effect on the fair value recorded that are not based on observable market data. |
| Assets and liabilities measured at fair value | Level 1 | Level 2 | Total | |||||||||
| March 31, 2012 | ||||||||||||
| Warrants Radar | - | 140,820 | 140,820 | |||||||||
| Derivative financial assets | 17,002 | 2,588 | 19,590 | |||||||||
| Derivative financial liabilities | (8,864 | ) | (748 | ) | (9,611 | ) | ||||||
| Total | 8,138 | 142,660 | 150,799 | |||||||||
| March 31, 2011 | ||||||||||||
| Warrants Radar | - | 162,961 | 162,961 | |||||||||
| Derivative financial assets | 35,577 | 20,105 | 55,682 | |||||||||
| Derivative financial liabilities | (122,084 | ) | (10,205 | ) | (132,289 | ) | ||||||
| Total | (86,507 | ) | 172,861 | 86,354 | ||||||||
70
Cosan Limited
Notes to the consolidated financial statement (Continued)
Years ended March 31, 2012, 2011 and 2010
(In thousands of Reais, except otherwise stated)
| 26. | Financial Instruments (Continued) |
| j) | Sensitivity analysis |
Following is the sensitivity analysis of the fair value of financial instruments, in accordance with the types of risks deemed to be significant by the Company and its joint-controlled entities:
Assumptions for sensitivity analysis
For the analysis, the Company, its subsidiaries and jointly-controlled entities adopted three scenarios, being one probable and two that may have effects from impairment of the fair value of the financial instruments. The probable scenario was defined based on the futures sugar and US dollar market curves as of March 31, 2012, the same which determines the fair value of the derivatives at that date. Possible and remote scenarios were defined based on adverse impacts of 25% and 50% over the sugar and dollar price curves, which served as basis for the probable scenario.
Sensitivity analysis
Following is the sensitivity analysis on the change in the fair value of the Company’s financial derivatives:
| Impacts on P&L (*) | |||||||||||||
| Risk factor | Probable Scenario | Possible Scenario (25%) | Remote Scenario (50%) | ||||||||||
| Price risk | |||||||||||||
| Commodity derivatives | |||||||||||||
| Future agreements: | |||||||||||||
| Selling agreements | Increase of the sugar price | 12,127 | (148,558 | ) | (296,990 | ) | |||||||
| Purchasing agreements | Decrease of the sugar price | 194 | (4,971 | ) | (9,941 | ) | |||||||
| Selling agreements | Increase of the Ethanol Hydrated price | (5 | ) | (5,518 | ) | (11,035 | ) | ||||||
| Purchasing agreements | Decrease of the Ethanol Hydrated price | (1 | ) | (3,998 | ) | (7,996 | ) | ||||||
| Option agreements: | |||||||||||||
| Calls Purchased | Decrease of the sugar price | 142 | (142 | ) | (142 | ) | |||||||
| Calls Sold | Increase of the sugar price | (140 | ) | (3,835 | ) | (15,945 | ) | ||||||
| Puts Purchased | Increase of the sugar price | 389 | (389 | ) | (389 | ) | |||||||
| Exchange rate risk | |||||||||||||
| Exchange rate derivatives | |||||||||||||
| Future agreements: | |||||||||||||
| Selling agreements | Increase of the exchange rate R$/US$ | 4,157 | (130,685 | ) | (260,079 | ) | |||||||
| Purchasing agreements | Decrease of the exchange rate R$/US$ | (3,441 | ) | (209,824 | ) | (420,339 | ) | ||||||
| Forward agreements: | |||||||||||||
| Selling agreements | Increase of the exchange rate R$/US$ | (4,395 | ) | (32,103 | ) | (64,206 | ) | ||||||
| Exchange lock: | |||||||||||||
| Selling agreements | Increase of the exchange rate R$/US$ | 1,701 | (30,592 | ) | (61,185 | ) | |||||||
| Option agreements: | |||||||||||||
| Interest rate risk | |||||||||||||
| Derivatives Interest | |||||||||||||
| Swap agreement | Decrease in Libor curve | (747 | ) | (1,100 | ) | (2,208 | ) | ||||||
(*) Results projected to occur within 12 months from March 31, 2012
71
Cosan Limited
Notes to the consolidated financial statement (Continued)
Years ended March 31, 2012, 2011 and 2010
(In thousands of Reais, except otherwise stated)
| 26. | Financial Instruments (Continued) |
| k) | Capital management |
The primary objective of the Company’s capital management is to ensure that it maintains a strong credit rating and healthy capital ratios in order to support its business and maximize shareholder value.
Occasionally, the Company purchases its own shares on the market, the timing of these purchases depends on market prices.
No changes were made in the objectives, policies or processes for managing capital during the years ended March 31, 2012 and 2011.
| 27. | Pension and other post-employment benefits plan |
| 2012 | 2011 | |||||||
| Futura | 34,725 | 24,380 | ||||||
| Other | 2,587 | - | ||||||
| Total | 37,312 | 24,380 | ||||||
| a) | Pension plan |
Defined benefit
The Company’s subsidiary Cosan Lubricantes e Especialidades S.A. has a noncontributory defined benefit pension plan (Futura -former- Previd Exxon)covering certain employees upon retirement. This plan was altered to allow its settlement and was approved by the relevant authority on May 5, 2011. The settlement is the process whereby the plan is closed to any new entrants, with the cessation of contributions, guaranteeing the participants a benefit that is in proportion to the rights they had accumulated in the plan up until March 31, 2011.
Defined contribution
Since June 1, 2011, the Company and its subsidiaries sponsor a variable contribution plan, for all employees (Futura II). The Company does not have a legal or constructive obligation to pay further contributions if the fund does not have sufficient assets to pay all benefits owed. During the year ended March 31, 2012 the amount of contributions totaled R$5,906.
Since June 1, 2011, the jointly-controlled entities sponsor a defined contribution plan, for all employees (Raiz Prev). The jointly-controlled entities does not have a legal or constructive obligation to pay further contributions if the fund does not have sufficient assets to pay all benefits owed. During the year ended March 31, 2012 the amount of contributions totaled R$8,887.
72
Cosan Limited
Notes to the consolidated financial statement (Continued)
Years ended March 31, 2012, 2011 and 2010
(In thousands of Reais, except otherwise stated)
| 27. | Pension and other post-employment benefits plan (Continued) |
| a) | Pension plan (Continued) |
Prior to the formation of Raiz Prev and Futura II, the Company, through its subsidiary Cosan Alimentos S.A. ("Cosan Alimentos") sponsored a defined contribution plan, for all employees of that subsidiary. During the years ended March 31, 2011 and 2010, the amount of contributions totaled R$4,701 and R$5,407 respectively.
| b) | Actuarial Liability |
The pension on Futura (former Previd Exxon) recorded in non-current liabilities at March 31, 2012 amounted to R$34,725 (R$24.380 in 2011).
A reconciliation of present value of defined benefit obligation and the fair value of plan assets, with assets and liabilities recognized on the balance sheet:
| 2012 | 2011 | |||||||
| Present value of actuarial obligation at beginning of year | (383,823 | ) | (325,534 | ) | ||||
| Interest costs | (38,345 | ) | (35,107 | ) | ||||
| Current service cost | (455 | ) | (4,445 | ) | ||||
| Benefits paid | 27,845 | 24,637 | ||||||
| Settlement / curtailment | 54,779 | - | ||||||
| Actuarial loss on obligation at beginning of year | (22,716 | ) | (43,374 | ) | ||||
| Present value of actuarial obligation at end of the year | (362,715 | ) | (383,823 | ) | ||||
| Fair value of plan assets at beginning of the year | 359,443 | 347,703 | ||||||
| Expected return on plan assets | 39,000 | 35,918 | ||||||
| Contributions received by the fund | 3,282 | 8,702 | ||||||
| Benefits Paid | (27,846 | ) | (24,637 | ) | ||||
| Effect of migration to defined contribution - Settlement | (32,226 | ) | - | |||||
| Loss in fair value of assets | (13,663 | ) | (8,243 | ) | ||||
| Fair value of plan assets at year-end | 327,990 | 359,443 | ||||||
| Present value of liabilities in excess fair value of assets – actuarial liability | (34,725 | ) | (24,380 | ) | ||||
Total expense recognized in profit or loss:
| Expense recognized in profit or loss: | 2012 | 2011 | 2010 | |||||||||
| Current service cost | (455 | ) | (4,445 | ) | (5,478 | ) | ||||||
| Interest on obligation | (38,345 | ) | (35,107 | ) | (32,583 | ) | ||||||
| Expected return on plan assets | 39,000 | 35,918 | 31,046 | |||||||||
| 200 | (3,634 | ) | (7,015 | ) | ||||||||
Total amount recognized as accumulated other comprehensive income:
| 2012 | 2011 | |||||||
| Amount accumulated at April 1 | (22,621 | ) | (42,056 | ) | ||||
| Unrecognized gains | 36,379 | 29,447 | ||||||
| Deferred Income Tax | (12,369 | ) | (10,012 | ) | ||||
| Amount accumulated at March 31st | 1,389 | (22,621 | ) | |||||
73
Cosan Limited
Notes to the consolidated financial statement (Continued)
Years ended March 31, 2012, 2011 and 2010
(In thousands of Reais, except otherwise stated)
| 27. | Pension and other post-employment benefits plan (Continued) |
| b) | Actuarial Liability (Continued) |
Plan assets include:
| 2012 | 2011 | |||||||||||||||
| Amount | Percentual | Amount | Percentual | |||||||||||||
| CDBs – Bank Deposits | 245,993 | 75 | % | 268,863 | 74.80 | % | ||||||||||
| Equity securities of Brazilian public entities | 81,997 | 25 | % | 90,580 | 25.20 | % | ||||||||||
| Total | 327,990 | 100 | % | 359,443 | 100 | % | ||||||||||
Plan assets are represented by financial assets with quoted prices in an active market and therefore are included as a Level 1 fair value type. The total expected rate of return on assets is calculated based on market expectations existing at that date applicable to the period over which the obligation should be liquidated. These expectations are reflected in the following main assumptions.
The main assumptions used to determine the pension benefit obligations of the Company are as follows:
| Defined benefit plan | 2012 | 2011 | |
| Actuarial valuation method | Projected unit credit | Projected unit credit | |
| Mortality table | AT 83 segregated by sex, decreased by 10% | AT 83 segregated by sex, decreased by 10% | |
| Discount rate for actuarial liability | Interest: 9.68% p.a. + inflation: 4.20% % p.a. | Interest: 10.77% p.a. + inflation: 4.50% p.a. | |
| Expected rate of return on plan assets | Interest: 11.30% p.a. + inflation: 4.20% p.a. | Interest: 11.20% p.a. + inflation: 4.50% p.a. | |
| Salary growth rate | N/A | 6.07% + inflation: 4.50% p.a. | |
| Increase rate of estimated benefits | 0.00% p.a. + inflation: 4.20% p.a. | 0.00% p.a. + inflation: 4.50% p.a. |
The Company expects contributions at the amount of R$ 3,037 to be paid in relation to its defined benefit and variable contribution plan in 2013.
| 28. | Share-Based Payments |
In the ordinary and extraordinary general meeting held on August 30, 2005, the guidelines for the outlining and structuring of a stock option plan for Cosan S.A. officers and employees were approved, thus authorizing the issue of up to 5% of shares comprising Cosan S.A. share capital. This stock option plan was outlined to attract and retain services rendered by officers and key employees, offering them the opportunity to become shareholders of Cosan S.A.. On September 22, 2005, Cosan S.A. board of directors approved the distribution of stock options corresponding to 4,302,780 common shares to be issued or treasury shares held by Cosan S.A. related to 3.25% of the share capital at the time, authorized by the annual/extraordinary meeting. The remaining 1.75% remained to be distributed. On September 22, 2005, the officers and key employees were informed regarding the key terms and conditions of the share-based compensation arrangement.
74
Cosan Limited
Notes to the consolidated financial statement (Continued)
Years ended March 31, 2012, 2011 and 2010
(In thousands of Reais, except otherwise stated)
| 28. | Share-Based Payments (Continued) |
On September 11, 2007, the board of directors approved an additional distribution of stock options, in connection with the stock option plan mentioned above, corresponding to 450,000 common shares to be issued or purchased by Cosan S.A. related to 0.24% of the share capital at September 22, 2005. The remaining 1.51% may still be distributed.
On August 7, 2009, the board of directors approved an additional distribution of stock options, in connection with the stock option plan mentioned above, corresponding to 165,657 common shares to be issued or purchased by Cosan S.A., due to changing in the management at that date.
According to the market value at the date of issuance, the exercise price is R$ 6.11 per share, without any discount. The exercise price was calculated before the valuation mentioned above based on an expected private equity agreement was not achieved. The options can be exercised after a waiting period of one year, considering a maximum percentage of 25% per annum of the total stock options offered by Cosan S.A. within a period of 5 years.
The exercise of options were settled only through issuance of new common shares or treasury shares.
The employees that leave Cosan S.A. before the vesting period will forfeit 100% of their rights. However, if the employment is terminated by Cosan S.A. without cause, the employees will have right to exercise 100% of their options of that particular year plus the right to exercise 50% of the options of the following year.
On March 31, 2011 all stock options related to that plan were exercised by issuance of new shares.
The number and weighted average exercise price of stock options are the following:
| Shares | Weighted average exercise price | |||||||
| Outstanding April 1, 2009 | 1,470,832 | 6.11 | ||||||
| Exercised (July 17, 2009) | (224,819 | ) | 6.11 | |||||
| Option granted (August 8, 2009) | 165,657 | 6.11 | ||||||
| Exercised (October 10, 2009) | (169,500 | ) | 6.11 | |||||
| Exercised (December 15, 2009) | (571,194 | ) | 6.11 | |||||
| Exercised (March 29, 2010) | (17,000 | ) | 6.11 | |||||
| Outstanding March 31, 2010 | 653,976 | 6.11 | ||||||
| Exercised (July 29, 2010) | (449,819 | ) | 6.11 | |||||
| Exercised (September 17, 2010) | (91,717 | ) | 6.11 | |||||
| Exercised (March 4, 2011) | (112,440 | ) | 6.11 | |||||
| Outstanding March 31, 2011 | - | - | ||||||
75
Cosan Limited
Notes to the consolidated financial statement (Continued)
Years ended March 31, 2012, 2011 and 2010
(In thousands of Reais, except otherwise stated)
| 28. | Share-Based Payments (Continued) |
The fair value of share-based awards was estimated using a binominal model with the following assumptions:
| Options granted on September 22, 2005 | Options granted on September 11, 2007 | Options granted on August 7, 2009 | ||||||||||
| Grant price | 6.11 | 6.11 | 6.11 | |||||||||
| Expected life (in years) | 7.5 | 7.5 | Immediate | |||||||||
| Interest rate | 14.52 | % | 9.34 | % | (1 | ) | ||||||
| Expected Volatility | 34.00 | % | 46.45 | % | (1 | ) | ||||||
| Expected Dividend yield | 1.25 | % | 1.47 | % | (1 | ) | ||||||
| Weighted-average fair value at grant date | 12.35 | 18.19 | (1 | ) | ||||||||
(1) The options were fully vested at the date of issuance so the fair value was the quoted market price as of the grant date
Expected Term – Cosan S.A. expected term represents the period that Cosan S.A. share-based awards are expected to be outstanding and was determined based on the assumption that the officers will exercise their options when the exercise period is over. Therefore, this term was calculated based on the average of 5 and 10 years. Cosan S.A. does not expect any forfeiture as those options are mainly for officers, whose turnover is low.
Expected Volatility – For the options granted on September 22, 2005 Cosan S.A. had its shares publicly-traded for less than 6 months as of April 30, 2006. Therefore, Cosan S.A. opted to substitute the historical volatility by an appropriate global industry sector index, based on the volatility of the share prices, and considering it as an assumption in its valuation model. Cosan S.A. has identified and compared similar public entities for which share or option price information is available to consider the historical, expected, or implied volatility of those entities’ share prices in estimating expected volatility based on global scenarios. For the options granted on September 11, 2007 Cosan S.A. used the volatility of its shares as an assumption in its valuation model since Cosan S.A. IPO in Brazil, in 2005.
Expected Dividends – As Cosan S.A. was a relatively new public entity, the expected dividend yield was calculated based on the current value of the stock at the grant date, adjusted by the average rate of the return to shareholders for the expected term, in relation of future book value of the shares.
Risk-Free Interest Rate – Cosan S.A. bases the risk-free interest rate used the SELIC - Special System Settlement Custody.
In the shareholder’s meeting held on July 29, 2011, the guidelines for the outlining and structuring of the stock option compensation plan for Cosan S.A.’s officers and employees were approved, authorizing the issuance of up to 5% of shares comprising Cosan S.A.’s total capital. This stock option plan was outlined to attract and retain officers and key employees, offering them the opportunity to become Cosan S.A.’s shareholders. On August 18, 2011, Cosan S.A.’s board of directors approved the total stock option grant corresponding up to 12,000,000 common shares to be issued or treasury shares held by Cosan S.A., corresponding 2.41% of the share capital at that time.
76
Cosan Limited
Notes to the consolidated financial statement (Continued)
Years ended March 31, 2012, 2011 and 2010
(In thousands of Reais, except otherwise stated)
| 28. | Share-Based Payments (Continued) |
On the same date the eligible executives were informed of the all terms and conditions of the stock-option plan.
According to the average market value of the shares on a 30 day period ending at issuance, the exercise price was defined to be R$22.80 per share, without any discount. The fair value of options granted was estimated using the binomial model in compliance with the terms and conditions of each granted option.
The stock options were divided into “Tranche A” and “Tranche B”. The vesting period is described below.
Tranche A - The options can be exercised after a waiting period of one year, considering a maximum percentage of 20% per annum of the total stock options offered by Cosan S.A. within a period of 5 years. Exercise period ends August 19, 2016.
Tranche B - The options can be exercised after a waiting period of one year, considering a maximum percentage of 10% per annum of the total stock options offered by Cosan S.A. within a period of 10 years. Exercise period ends August 19, 2021.
The options may be exercised with the issuance of new shares or treasury shares that the company may have. The employees that leave Cosan S.A. before the vesting period will forfeit 100% of their rights.
As of August 18, 2011, 9,825,000 options related the shared based compensation was granted.The fair value of share based payments was estimated adopting the binomial model with the following premise:
| Options granted on August 18, 2011 | Options granted on August 18, 2011 | |||||||
Tranche A | Tranche B | |||||||
Grant price - R$ | 22.8 | 22.8 | ||||||
| Expected life (in years) | 1 a 5 | 1 a 10 | ||||||
| Interest rate | 12.39 | % | 12.39 | % | ||||
| Expected Volatility | 31.44 | % | 30.32 | % | ||||
| Weighted average fair value at grant date - R$ | 6.80 | 8.15 | ||||||
Expected Term – the expected term considers that the executives will exercise their options after the vesting period of each grant.
Expected volatility – Due to the new capital structure and business model after the formation of the JVs, the company opted to use the historic volatility of their shares adjusted by volatility of competitors’ shares that operate in similar lines of business.
77
Cosan Limited
Notes to the consolidated financial statement (Continued)
Years ended March 31, 2012, 2011 and 2010
(In thousands of Reais, except otherwise stated)
| 28. | Share-Based Payments (Continued) |
Expected dividends – The dividends expected were calculated on the basis of the current market value on the grant’s date, adjusted by the average rate of return of capital to shareholders during the forecast period, and compared with to the book value shares.
Free risk Interest Rate – the company considered the prime rate as the free risk interest rate traded at BM&F Bovespa on the grant date and for the equivalent term of the option maturity.
As of March 31, 2012, no options have been exercised or forfeited. A total expense of R$ 10,800 has been recorded. As of March 31, 2011, the amount of R$35,354 related to the unrecognized compensation cost from the stock options plan is expected to be recognized.
| 29. | Segment information |
| a) | Segment information |
The following information about segments is based upon information used by Cosan’s senior management to assess the performance of operating segments and to decide on the allocation of resources.
Considering the formation of JVs Raízen Energia, Raízen Combustíveis and acquisition of the sugar retail business, Cosan has increased the presentation of its segments to five segments, as shown below.The information for prior periods have been reclassified to make them comparable with the information of this period.
| (i) | Raízen Energia: production and marketing of a variety of products derived from sugar cane, including raw sugar (VHP), anhydrous and hydrated ethanol, and activities related to energy cogeneration from sugarcane bagasse. In addition, this segment holds interest in companies of research and development in new technologies involved in this segment. |
| (ii) | Raízen Combustíveis: distribution and marketing of fuels and lubricants, mainly through franchised network of service stations under the brand “Shell” and "Esso" throughout Brazil. |
| (iii) | Rumo: logistics services for the transport, storage and port lifting of sugar for both Raizen Energia and third parties. |
| (iv) | Cosan Alimentos: sale of food, mainly, of sugar in the retail under the brands “União” and “Da Barra”. |
| (v) | Cosan other business: sale and distribution of lubricants, investments in agricultural land (through Radar) and other investments, in addition to the corporate activities of the Company. |
The following selected information result and segment assets that were measured in accordance with the accounting practices used in the preparation of consolidated information:
78
Cosan Limited
Notes to the consolidated financial statement (Continued)
Years ended March 31, 2012, 2011 and 2010
(In thousands of Reais, except otherwise stated)
| 29. | Segment information (Continued) |
| a) | Segment information (Continued) |
| 2012 | ||||||||||||||||||||||||||||||||
| Raízen Energia (*) | Raízen Combustiveis (*) | Cosan Alimentos | Rumo | Cosan other businesses | Elimination 50% of Raizen | Elimination | Consolidated | |||||||||||||||||||||||||
| Balance sheet | ||||||||||||||||||||||||||||||||
| Property, plant and equipment | 9,658,979 | 2,779,641 | 45,973 | 879,469 | 730,707 | (6,219,310 | ) | (8,496 | ) | 7,866,963 | ||||||||||||||||||||||
| Intangible | 2,996,846 | 3,928,900 | 83,597 | 604,963 | 780,822 | - | (3,462,873 | ) | 4,932,255 | |||||||||||||||||||||||
| Loans and financing, net of cash and cash equivalents | (4,404,761 | ) | (603,447 | ) | 29,834 | (217,575 | ) | (853,398 | ) | 2,504,104 | - | (3,545,243 | ) | |||||||||||||||||||
| Other Assets and Liabilities, net | 1,839,138 | 252,124 | 142,455 | (52,175 | ) | 9,462,380 | (1,045,631 | ) | (10,370,643 | ) | 227,648 | |||||||||||||||||||||
| Total Assets (net of liabilities) allocated by segment | 10,090,202 | 6,357,219 | 301,859 | 1,214,682 | 10,120,511 | (4,760,837 | ) | (13,842,013 | ) | 9,481,623 | ||||||||||||||||||||||
Total Assets | 19,979,070 | 11,559,239 | 408,966 | 2,029,954 | 16,038,721 | (15,769,155 | ) | (12,078,676 | ) | 22,168,119 | ||||||||||||||||||||||
| Profit (loss) for the year: | ||||||||||||||||||||||||||||||||
| Net Operating Income | 7,247,685 | 35,096,051 | 706,430 | 571,988 | 1,065,515 | (19,711,865 | ) | (878,923 | ) | 24,096,881 | ||||||||||||||||||||||
| Domestic Market | 3,925,829 | 35,096,051 | 706,430 | 567,265 | 1,065,515 | (18,166,987 | ) | (878,923 | ) | 22,315,180 | ||||||||||||||||||||||
| Foreign Market | 3,321,856 | - | - | 4,724 | - | (1,544,879 | ) | - | 1,781,701 | |||||||||||||||||||||||
| Gross profit | 1,668,941 | 1,951,593 | 129,072 | 177,922 | 332,646 | (1,628,302 | ) | - | 2,631,872 | |||||||||||||||||||||||
| Selling, general and administrative expenses | (965,440 | ) | (1,445,358 | ) | (96,001 | ) | (41,567 | ) | (324,489 | ) | 1,090,529 | - | (1,782,326 | ) | ||||||||||||||||||
| JV formation income | - | - | - | - | 2,752,730 | - | - | 2,752,730 | ||||||||||||||||||||||||
| Other operating income, net | (18,207 | ) | 270,736 | 23,114 | 19,493 | (12,035 | ) | (129,056 | ) | (8,495 | ) | 145,550 | ||||||||||||||||||||
| Financial result, net | (267,934 | ) | (82,203 | ) | 1,911 | 8,992 | (360,700 | ) | 221,385 | - | (478,549 | ) | ||||||||||||||||||||
| Income tax and social contribution | (27,250 | ) | (192,056 | ) | 6,156 | (55,035 | ) | (935,180 | ) | 93,152 | - | (1,110,212 | ) | |||||||||||||||||||
| Net income | 378,269 | 525,916 | 64,253 | 109,801 | 2,322,681 | (353,500 | ) | (855,088 | ) | 2,192,332 | ||||||||||||||||||||||
| Other selected information: | ||||||||||||||||||||||||||||||||
| Additions to PP&E, intangible assets and biological assets (cash) | 2,577,859 | 491,734 | 2,860 | 268,985 | 99,473 | (1,291,124 | ) | (13,270 | ) | 2,136,517 | ||||||||||||||||||||||
| Depreciation and amortization (including the effect of biological assets) | 1,549,993 | 365,603 | 1,716 | 57,323 | 48,329 | (880,183 | ) | - | 1,142,780 | |||||||||||||||||||||||
79
Cosan Limited
Notes to the consolidated financial statement (Continued)
Years ended March 31, 2012, 2011 and 2010
(In thousands of Reais, except otherwise stated)
| 29. | Segment information (Continued) |
| a) | Segment information (Continued) |
| 2011 | ||||||||||||||||||||||||
| Raizen Energia (*) | Raizen Combustiveis (*) | Rumo | Cosan other business | Elimination | Consolidated | |||||||||||||||||||
| Balance Sheet: | - | |||||||||||||||||||||||
| Property, plant and equipment | 5,962,230 | 862,185 | 931,997 | 224,112 | - | 7,980,524 | ||||||||||||||||||
| Intangible | 1,644,350 | 528,653 | 358,287 | 1,358,285 | - | 3,889,575 | ||||||||||||||||||
| Loans and financing, net of cash and cash equivalents | (4,723,833 | ) | (589,229 | ) | (99,829 | ) | (547,358 | ) | - | (5,960,249 | ) | |||||||||||||
| Other Assets and Liabilities, net | (1,826,735 | ) | (238,736 | ) | (173,826 | ) | 10,795,164 | (7,137,020 | ) | 1,418,847 | ||||||||||||||
| Total Assets (net of liabilities) allocated by segment | 1,056,012 | 562,873 | 1,016,629 | 11,830,203 | (7,137,020 | ) | 7,328,697 | |||||||||||||||||
| Total Assets | 8,567,722 | 1,777,299 | 1,713,112 | 13,919,170 | (7,363,213 | ) | 18,614,090 | |||||||||||||||||
| Profit (loss) for the year: | ||||||||||||||||||||||||
| Net Operating Income | 6,389,178 | 10,966,245 | 448,003 | 829,032 | (568,978 | ) | 18,063,480 | |||||||||||||||||
| Domestic Market | 3,678,207 | 10,966,245 | 448,003 | 829,032 | (568,978 | ) | 15,352,509 | |||||||||||||||||
| Foreign Market | 2,710,971 | - | - | - | - | 2,710,971 | ||||||||||||||||||
| Gross profit | 1,988,662 | 466,989 | 131,469 | 314,131 | 12,150 | 2,913,401 | ||||||||||||||||||
| Selling, general and administrative expenses | (961,407 | ) | (372,438 | ) | (28,951 | ) | (207,018 | ) | (1,636 | ) | (1,571,450 | ) | ||||||||||||
| Other operating income, net | (65,415 | ) | 33,754 | 9,936 | (1,977 | ) | (10,126 | ) | (33,828 | ) | ||||||||||||||
| Financial result, net | (101,755 | ) | (22,441 | ) | 13,047 | (39,998 | ) | - | (151,147 | ) | ||||||||||||||
| Income tax and social contribution | (305,977 | ) | (40,490 | ) | (42,865 | ) | (25,176 | ) | - | (414,508 | ) | |||||||||||||
| Net income | 833,343 | (126,368 | ) | 62,543 | 236,702 | (238,564 | ) | 767,656 | ||||||||||||||||
| Other selected information: | ||||||||||||||||||||||||
| Additions to PP&E, intangible assets and biological assets (cash) | 2,817,195 | 83,266 | 126,189 | 10,569 | - | 3,037,219 | ||||||||||||||||||
| Depreciation and amortization (including the effect of biological assets) | 1,266,142 | 35,798 | 20,157 | 36,903 | - | 1,359,000 | ||||||||||||||||||
80
Cosan Limited
Notes to the consolidated financial statement (Continued)
Years ended March 31, 2012, 2011 and 2010
(In thousands of Reais, except otherwise stated)
| 29. | Segment information (Continued) |
| a) | Segment information (Continued) |
| 2010 | ||||||||||||||||||||||||
| Raízen Energia (*) | Raízen Combustíveis(*) | Rumo | Cosan other business | Elimination | Consolidated | |||||||||||||||||||
| Financial position: | ||||||||||||||||||||||||
| Property, plant and equipment | 4,795,522 | 926,631 | 302,745 | 89,632 | - | 6,114,530 | ||||||||||||||||||
| Intangible | 2,207,198 | 629,931 | 363,135 | 625,103 | - | 3,825,367 | ||||||||||||||||||
| Loans, net of cash and cash equivalents | (4,345,015 | ) | (502,587 | ) | (107,199 | ) | 57,623 | 31,886 | (4,865,292 | ) | ||||||||||||||
| Other assets and liabilities, net | 3,611,383 | 151,461 | (92,671 | ) | (51,366 | ) | (2,201,486 | ) | 1,417,321 | |||||||||||||||
| Total asset (net of liabilities) allocated by segment | 6,269,088 | 1,205,436 | 466,010 | 720,992 | (2,169,600 | ) | 6,491,926 | |||||||||||||||||
| Total asset | 14,492,261 | 2,810,217 | 806,394 | 880,151 | (2,571,781 | ) | 16,417,242 | |||||||||||||||||
| Profit (loss) for the year: | ||||||||||||||||||||||||
| Net sales | 5,380,134 | 9,506,468 | 158,249 | 638,586 | (347,382 | ) | 15,336,055 | |||||||||||||||||
| Domestic market | 4,648,436 | 9,506,468 | 158,249 | 638,586 | (347,382 | ) | 14,604,357 | |||||||||||||||||
| External market | 731,698 | - | - | - | - | 731,698 | ||||||||||||||||||
| Gross profit | 1,341,599 | 481,424 | 30,393 | 211,308 | - | 2,064,724 | ||||||||||||||||||
| Selling general and administrative expenses | (846,306 | ) | (312,601 | ) | (18,111 | ) | (177,440 | ) | (9,944 | ) | (1,364,402 | ) | ||||||||||||
| Gain on tax recovery program | 270,333 | - | - | - | - | 270,333 | ||||||||||||||||||
| Other income (expense) | (24,237 | ) | (15,146 | ) | 4,962 | 117,339 | (45,395 | ) | 37,523 | |||||||||||||||
| Financial result, net | 433,293 | 53,317 | (1,057 | ) | (30,394 | ) | 38,282 | 493,441 | ||||||||||||||||
| Income tax and social contribution | (327,363 | ) | (75,219 | ) | (7,696 | ) | (13,026 | ) | - | (423,304 | ) | |||||||||||||
| Net income / (losses) | 1,111,283 | 131,775 | 11,917 | 22,197 | (194,679 | ) | 1,082,493 | |||||||||||||||||
| Other selected data: | ||||||||||||||||||||||||
| Additions to PP&E and biological assets (cash) | 2,240,909 | 114,321 | 147,943 | 42,259 | - | 2,545,432 | ||||||||||||||||||
| Depreciation and amortization (including biological assets noncash effect) | 1,040,532 | 73,261 | 14,167 | - | - | 1,127,960 | ||||||||||||||||||
(*) The information of Raízen Energia and Raízen Combustíveis represents 100% of the predecessor business, regardless of the fact that the Company lost full control of business June 1, 2011 when the formation of JVs occurred. The segment called Raízen Energia is basically the same information as in previous years for the segment called "CAA". The segment Raizen Combustíveis accounts presents the former CCL segment with the exception of the Lubricants business. From June 1, 2011 it includes the fuel distribution business contributed by Shell to the JV.
All non-current assets of the Company are located in Brazil except for certain equity interests.
81
Cosan Limited
Notes to the consolidated financial statement (Continued)
Years ended March 31, 2012, 2011 and 2010
(In thousands of Reais, except otherwise stated)
| 29. | Segment information (Continued) |
| a) | Segment information (Continued) |
Detailed net Sales per segment:
| 2012 | 2011 | 2010 | ||||||||||
| Raízen Energia | ||||||||||||
| Sugar | 3,912,824 | 3,853,404 | 3,377,832 | |||||||||
| Ethanol | 2,871,515 | 2,203,737 | 1,747,646 | |||||||||
| Cogeneration | 235,129 | 194,889 | 93,583 | |||||||||
| Other | 228,217 | 137,148 | 161,073 | |||||||||
| 7,247,685 | 6,389,178 | 5,380,134 | ||||||||||
| Raízen Combustíveis | ||||||||||||
| Fuel | 35,032,782 | 10,895,655 | 9,437,316 | |||||||||
| Other | 63,269 | 70,590 | 69,152 | |||||||||
| 35,096,051 | 10,966,245 | 9,506,468 | ||||||||||
| Alimentos | ||||||||||||
| Amorphous | 631,532 | - | - | |||||||||
| Crystal | 39,013 | - | - | |||||||||
| Other | 35,885 | - | - | |||||||||
| 706,430 | - | - | ||||||||||
| Rumo | ||||||||||||
| Elevation | 141,026 | 118,139 | 142,120 | |||||||||
| Transportation | 413,364 | 305,780 | 16,129 | |||||||||
| Other | 17,598 | 24,084 | - | |||||||||
| 571,988 | 448,003 | 158,249 | ||||||||||
| Cosan – other businesses | ||||||||||||
| Lubrificants | 1,018,801 | 829,032 | 634,045 | |||||||||
| Others | 46,714 | - | 4,541 | |||||||||
| 1,065,515 | 829,032 | 638,586 | ||||||||||
| Elimination | (20,590,788 | ) | (568,978 | ) | (347,382 | ) | ||||||
| Total | 24,096,881 | 18,063,480 | 15,336,055 | |||||||||
| b) | Net Sales per region |
The percentage of net sales of the Raízen Energia segment by geographic area for the years ended are as follows:
| 2012 | 2011 | 2010 | ||||||||||
| Brazil | 67.24 | % | 72.63 | % | 86.40 | % | ||||||
| Europe | 24.18 | % | 24.93 | % | 9.20 | % | ||||||
| Latin America (Except Brazil) | 3.52 | % | 0.20 | % | 2.80 | % | ||||||
| Middle East and Asia | 1.00 | % | 1.48 | % | 1.20 | % | ||||||
| North America | 2.94 | % | 0.74 | % | 0.30 | % | ||||||
| Other | 1.12 | % | 0.02 | % | 0.10 | % | ||||||
| Brazil | 100.00 | % | 100.00 | % | 100.00 | % | ||||||
The net sales from segments Raízen Combustíveis, Rumo and Cosan Alimentos are derived only from the domestic market (Brazil), with no revenue from foreign customers.
82
Cosan Limited
Notes to the consolidated financial statement (Continued)
Years ended March 31, 2012, 2011 and 2010
(In thousands of Reais, except otherwise stated)
| 29. | Segment information (Continued) |
| c) | Concentration of customers |
Raizen Energia
There are several clients in this segment, one of which represents more than 10% of the segment net sales during 2012, 2011 and 2010-- the SUCDEN Group (10%, 25% and 17%, respectively).
Raizen Combustíveis
In this segment there are no clients that represent more than 10% of the net sales in 2012 and 2011.
Rumo
In 2012, 55% of the segment net sales were generated from sales to the Raizen Energia segment (33% in 2011).
Cosan Other Businesses
No customers or specific groups represent 10% or more of sales in 2012, 2011 and 2010.
| 30. | Subsequent Events |
| a. | Companhia de Gas de Sao Paulo - Comgás |
On May 3, 2012, Cosan S.A. signed a memorandum of understanding with BG Group (British Gas) to acquire its interest of 60.1% on Companhia de Gas de Sao Paulo – Comgás for R$3.3 billion.
On May 28, 2012, Cosan S.A. signed the purchase and sale agreement in connection with this transaction. This acquisition will be effected upon regulatory approval.
| b. | Association with Camil Alimentos S.A. – Camil |
On May 28, 2012, Cosan S.A.signed an association agreement with Arfei Comercio e Participações S.A. (“Arfei”) and GIF Codajas Participações S.A. (“GIF Codajas”), an investment fund managed by Gávea Invetimentos Ltda. whereby Cosan S.A. will contribute its sugar retail business in exchange for R$345 million cash and a 11.72% interest in Camil, this transaction will be effected upon the fulfilling of certain contractual conditions.
83
Item 3
Consolidated Financial Statements
Cosan S.A. Indústria e Comércio
March 31, 2012 and 2011
COSAN S.A. INDÚSTRIA E COMÉRCIO
Consolidated financial statements
March 31, 2012 and 2011
Contents
| Report of Independent Auditors | 3 |
| Consolidated statements of financial position | 4 |
| Consolidated income statements | 6 |
| Consolidated statements of changes in equity | 7 |
| Consolidated statements of comprehensive income | 8 |
| Consolidated statements of cash flows | 9 |
| Consolidated statements of value added | 11 |
| Notes to the consolidated financial statements | 12 |
A free translation from Portuguese into English of Independent Auditor´s Report
REPORT OF INDEPENDENT AUDITORS ON THE CONSOLIDATED FINANCIAL STATEMENTS
The Board of Directors and Shareholders of
Cosan S.A. Indústria a Comércio
São Paulo – SP
We have audited the accompanying individual and consolidated financial statements of Cosan S.A. Indústria e Comércio, identified as Parent Company and Consolidated, which comprise the financial position as at March 31, 2012, and the income statement, statement of comprehensive income, statement of changes in equity and statement of cash flows for the year then ended, and a summary of significant accounting policies and other explanatory information.
Management’s responsibility for the consolidated financial statements
Management is responsible for the preparation and fair presentation of the individual financial statements in accordance with the accounting practices adopted in Brazil, and of the consolidated financial statements in accordance with International Financial Reporting Standards (IFRS) as issued
by the International Accounting Standards Board (IASB), and in accordance and with the accounting practices adopted in Brazil, as well as for the internal controls management determined as necessary to enable the preparation of these financial statements free from material misstatement, regardless of whether due to fraud or error.
Independent auditors’ responsibility
Our responsibility is to express an opinion on these financial statements based on our audit. We conducted our audit in accordance with the Brazilian and International Standards on Auditing. Those standards require that we comply with ethical requirements and plan and perform the audit to obtain reasonable assurance about whether the financial statements are free from material misstatement.
An audit involves performing procedures to obtain audit evidence about the amounts and disclosures in the financial statements. The procedures selected depend on the auditor’s judgment, including the assessment of the risks of material misstatement of the financial statements, whether due to fraud or error. In making those risk assessments, the auditor considers internal control relevant to the entity’s preparation and fair presentation of the financial statements in order to design audit procedures that are appropriate in the circumstances, but not for the purpose of expressing an opinion on the effectiveness of the entity’s internal control. An audit also includes evaluating the appropriateness of accounting policies used and the reasonableness of accounting estimates made by management, as well as evaluating the overall presentation of the financial statements.
We believe that the audit evidence we have obtained is sufficient and appropriate to provide a basis for our audit o
pinion.
1
Opinion on the individual financial statements
In our opinion, the individual financial statements referred to above present fairly, in all material respects, the consolidated financial position of Cosan S.A. Indústria e Comércio as at March 31, 2012, and the results of its operations and its cash flows for the year then ended in accordance with the accounting practices adopted in Brazil.
Opinion on the consolidated financial statements
In our opinion, the consolidated financial statements referred to above present fairly, in all material respects, the consolidated financial position of Cosan S.A. Indústria e Comércio as at March 31, 2012, and the consolidated results of its operations and its cash flows for the year then ended in accordance with International Financial Reporting Standards (IFRS) as issued by the International Accounting Standards Board (IASB) and the accounting practices adopted in Brazil.
Emphasis of matter
As described in Note 2, the individual financial statements were prepared in accordance with the accounting practices adopted in Brazil. In the case of Cosan S.A. Indústria e Comércio theses practices differ from IFRS, applicable to separate financial statements, only in relation to the valuation of investments in subsidiaries, associates and joint ventures under the equity method, while for IFRS purposes it would be cost of fair value. Our opinion is not modified due to this matter.
Other matters
Statements of valued added
We have also audited the individual and consolidated statements of value added for the year ended March 31, 2012, prepared under the responsibility of the Company´s management, and which presentation is required by the Brazilian Corporate Law for public companies, and as supplemental information by IFRS, which do not require the presentation of the statement of value added. These statements have been subject to the same audit procedures previously described and, in our opinion, are fairly presented, in all material respects, in relation to the financial statements as a whole.
São Paulo, Brazil, May 30, 2012
ERNST & YOUNG TERCO
Auditores Independentes S.S.
Luiz Carlos Nannini Accountant CRC 1SP171638/O-7 | Antonio C. M. Lage Accountant CRC 1MG077995/O-1-S-SP |
2
| COSAN S.A. INDÚSTRIA E COMÉRCIO |
| Statements of financial position |
| March 31, 2012 and 2011 |
| (In thousands of Reais) |
| Parent Company | Consolidated | ||||||||||||||||||
| Note | 2012 | 2011 | 2012 | 2011 | |||||||||||||||
| Asset | |||||||||||||||||||
| Current | |||||||||||||||||||
| Cash and cash equivalents | 3 | 316,539 | 372,318 | 1,616,169 | 1,254,070 | ||||||||||||||
| Restricted cash | 4 | 18,233 | 2,719 | 94,268 | 187,944 | ||||||||||||||
| Accounts receivable | 6 | - | 44,782 | 963,586 | 594,857 | ||||||||||||||
| Derivatives | 26 | - | - | 19,590 | 55,682 | ||||||||||||||
| Inventories | 7 | - | 92,571 | 748,150 | 670,331 | ||||||||||||||
| Related parties | 9 | 26,627 | 73,939 | 678,374 | 14,669 | ||||||||||||||
| Recoverable taxes | 8 | 33,777 | 105,134 | 325,096 | 374,991 | ||||||||||||||
| Other financial assets | 5 | - | - | 40,080 | - | ||||||||||||||
| Dividends | 243,790 | - | 861 | - | |||||||||||||||
| Other Credits | 25,795 | 74,001 | 228,961 | 309,710 | |||||||||||||||
| 664,761 | 765,464 | 4,715,135 | 3,462,254 | ||||||||||||||||
| Non-current | |||||||||||||||||||
| Deferred Income tax and social contribution | 17 | - | - | 543,024 | 116,986 | ||||||||||||||
| Advances to suppliers | - | 7,045 | 21,865 | 46,037 | |||||||||||||||
| Related parties | 9 | 712,276 | 71,233 | 753,153 | 91,954 | ||||||||||||||
| Recoverable Taxes | 8 | - | 4,622 | 111,856 | 55,066 | ||||||||||||||
| Judicial deposits | 18 | 206,633 | 17,574 | 509,235 | 218,371 | ||||||||||||||
| Other financial assets | 5 | 140,820 | 201,773 | 790,402 | 420,417 | ||||||||||||||
| Other non-current assets | 362,630 | 1,401 | 493,195 | 443,752 | |||||||||||||||
| Equity method investments | 11 | 11,660,289 | 8,290,188 | 419,029 | 304,142 | ||||||||||||||
| Biological Assets | 12 | - | 532,140 | 968,023 | 1,561,132 | ||||||||||||||
| Property, plant and equipment | 13 | 21,554 | 1,177,298 | 7,866,963 | 7,980,524 | ||||||||||||||
| Intangible | 14 | 83,667 | 366,471 | 4,932,255 | 3,445,674 | ||||||||||||||
| 13,187,869 | 10,669,745 | 17,409,000 | 14,684,055 | ||||||||||||||||
| Total Assets | 13,852,630 | 11,435,209 | 22,124,135 | 18,146,309 | |||||||||||||||
3
| Parent Company | Consolidated | ||||||||||||||||||
| Note | 2012 | 2011 | 2012 | 2011 | |||||||||||||||
| Current | |||||||||||||||||||
| Current portion of long-term debt | 15 | - | 110,526 | 537,135 | 916,400 | ||||||||||||||
| Derivatives | 26 | - | - | 9,611 | 132,289 | ||||||||||||||
| Trade accounts payable | 1,798 | 99,630 | 606,029 | 558,766 | |||||||||||||||
| Salaries Payable | 11,579 | 54,199 | 183,660 | 183,560 | |||||||||||||||
| Taxes Payable | 16 | 62,597 | 33,758 | 241,719 | 245,284 | ||||||||||||||
| Dividends Payable | 14,376 | 190,285 | 16,760 | 190,285 | |||||||||||||||
| Related parties | 9 | 113,783 | 29,001 | 175,030 | 41,163 | ||||||||||||||
| Other current liabilities | 62,727 | 44,183 | 307,994 | 189,629 | |||||||||||||||
| 266,860 | 561,582 | 2,077,938 | 2,457,376 | ||||||||||||||||
| Non-current | |||||||||||||||||||
| Long-term debt | 15 | 337,733 | 1,551,236 | 4,476,942 | 6,274,895 | ||||||||||||||
| Taxes payable | 16 | 670,463 | 88,717 | 1,202,624 | 639,071 | ||||||||||||||
| Provision for judicial demands | 18 | 356,259 | 78,142 | 1,051,677 | 666,282 | ||||||||||||||
| Related Parties | 9 | 1,906,539 | 2,401,518 | 389,718 | 4,444 | ||||||||||||||
| Pension | 27 | - | - | 37,312 | 24,380 | ||||||||||||||
| Deferred Income taxes | 17 | 1,076,506 | 247,351 | 2,443,430 | 912,618 | ||||||||||||||
| Other non-current liabilities | 86,477 | 47,802 | 828,120 | 382,897 | |||||||||||||||
| 4,433,977 | 4,414,766 | 10,429,823 | 8,904,587 | ||||||||||||||||
| Equity | 20 | ||||||||||||||||||
| Common Stock | 4,691,822 | 4,691,822 | 4,691,822 | 4,691,822 | |||||||||||||||
| Capital reserve | (67,663 | ) | (19,405 | ) | (67,663 | ) | (19,405 | ) | |||||||||||
| Accumulated Earnings | 690,530 | 537,468 | 690,530 | 537,468 | |||||||||||||||
| Equity attributable to owners of the Company | 3,837,104 | 1,248,976 | 3,837,104 | 1,248,976 | |||||||||||||||
| Equity attributable to non-controlling interests | 9,151,793 | 6,458,861 | 9,151,793 | 6,458,861 | |||||||||||||||
| Total Equity | - | - | 464,581 | 325,485 | |||||||||||||||
| Total Liabilities and equity | 9,151,793 | 6,458,861 | 9,616,374 | 6,784,346 | |||||||||||||||
| Equity | 13,852,630 | 11,435,209 | 22,124,135 | 18,146,309 | |||||||||||||||
See accompanying notes to consolidated financial statements.
4
| COSAN S.A. INDÚSTRIA E COMÉRCIO |
Income statement |
| Years ended March 31,2012 and 2011 |
| (In thousand of Reais) |
| Parent Company | Consolidated | ||||||||||||||||||
| Note | 2012 | 2011 | 2012 | 2011 | |||||||||||||||
| Net sales | 22 | 1,296 | 2,104,078 | 24,096,881 | 18,063,480 | ||||||||||||||
| Cost of goods sold | 23 | (2,410 | ) | (1,499,465 | ) | (21,465,009 | ) | (15,150,079 | ) | ||||||||||
| Gross Profit | (1,114 | ) | 604,613 | 2,631,872 | 2,913,401 | ||||||||||||||
| Operational income /(expenses) | |||||||||||||||||||
| Selling | 23 | - | (159,075 | ) | (1,136,286 | ) | (1,026,000 | ) | |||||||||||
| General and administrative | 23 | (99,560 | ) | (263,486 | ) | (641,894 | ) | (541,002 | ) | ||||||||||
| Other, net | 25 | (62,614 | ) | (47,943 | ) | 145,550 | (33,828 | ) | |||||||||||
| Gain of formation of the JVs | 21 | 22,661 | - | 3,196,632 | - | ||||||||||||||
| (139,513 | ) | (470,504 | ) | 1,564,002 | (1,600,830 | ) | |||||||||||||
Income before financial results, equity income of associates and income taxes | (140,627 | ) | 134,109 | 4,195,874 | 1,312,571 | ||||||||||||||
| Equity income of associates | 11 | 3,154,846 | 500,422 | 33,268 | 25,187 | ||||||||||||||
| Financial results, net | 24 | (619,378 | ) | 279,827 | (474,140 | ) | (146,688 | ) | |||||||||||
| 2,535,468 | 780,249 | (440,872 | ) | (121,501 | ) | ||||||||||||||
| Income before income tax | 2,394,841 | 914,358 | 3,755,002 | 1,191,070 | |||||||||||||||
| Income Taxes | |||||||||||||||||||
| Current | 17 | 2,429 | (2,429 | ) | (147,454 | ) | (85,437 | ) | |||||||||||
| Deferred | 17 | 208,564 | (140,364 | ) | (962,758 | ) | (329,071 | ) | |||||||||||
| Net income for the year | 2,605,834 | 771,565 | 2,644,790 | 776,562 | |||||||||||||||
| Net income attributable to non-controlling interests | - | - | (38,956 | ) | (4,997 | ) | |||||||||||||
| Net income attributable to Cosan | 2,605,834 | 771,565 | 2,605,834 | 771,565 | |||||||||||||||
| Earnings per share | 20 | ||||||||||||||||||
| Basic | 6,43 | 1,90 | 6,43 | 1,90 | |||||||||||||||
| Diluted | 6,34 | 1,90 | 6,34 | 1,90 | |||||||||||||||
| See accompanying notes to consolidated financial statements. |
5
| COSAN S.A. INDÚSTRIA E COMÉRCIO |
| Consolidated statement of changes in equity |
Years ended March 31, 2012, 2011 and 2010 (In Thousands of Reais) |
| Capital Reserve | Profit Reserve | |||||||||||||||||||||||||||||||||||||||||||
| Common Stock | Treasury share | Share based compensation | Other components of equity | Legal | Retained Earnings | Unrealized Earnings | Accumulated earning (losses) | Total | Non-controlling interest | Total Equity | ||||||||||||||||||||||||||||||||||
| March 31, 2011 | 4,691,822 | (19,405 | ) | 660,743 | (123,275 | ) | 63,119 | 1,185,857 | - | - | 6,458,861 | 325,485 | 6,784,346 | |||||||||||||||||||||||||||||||
| Hedge accounting | - | - | - | 53,140 | - | - | - | - | 53,140 | - | 53,140 | |||||||||||||||||||||||||||||||||
| Hedge accounting – reversal of OCI upon formation of the JVs | - | - | - | 104,272 | - | - | - | - | 104,272 | - | 104,272 | |||||||||||||||||||||||||||||||||
| Current translation adjustment - CTA | - | - | - | 7,415 | - | - | - | - | 7,415 | - | 7,415 | |||||||||||||||||||||||||||||||||
| Pension | - | - | - | (23,689 | ) | - | - | - | - | (23,689 | ) | - | (23,689 | ) | ||||||||||||||||||||||||||||||
| Reflection Effect (subsidiaries) | - | - | 4,323 | - | - | - | - | - | 4,323 | 6,885 | 11,208 | |||||||||||||||||||||||||||||||||
| Share based compensation | - | - | 10,800 | - | - | - | - | - | 10,800 | - | 10,800 | |||||||||||||||||||||||||||||||||
| Change in the non-controlling interest | - | - | - | - | - | - | - | - | - | 9,036 | 9,036 | |||||||||||||||||||||||||||||||||
| Treasury Shares | - | (48,258 | ) | - | - | - | - | - | - | (48,258 | ) | - | (48,258 | ) | ||||||||||||||||||||||||||||||
| Net Income | - | - | - | - | - | - | - | 2,605,834 | 2,605,834 | 38,956 | 2,644,790 | |||||||||||||||||||||||||||||||||
| Reflection effect of corporate restructuring in the group Rumo | - | - | (3,199 | ) | - | - | - | - | - | (3,199 | ) | 79,070 | 75,871 | |||||||||||||||||||||||||||||||
| Effect of dividends capitalization in subsidiaries | - | - | - | - | - | (958 | ) | - | - | (958 | ) | 6,195 | 5,237 | |||||||||||||||||||||||||||||||
| Dividends | - | - | - | - | - | (16,748 | ) | - | - | (16,748 | ) | (1,046 | ) | (17,794 | ) | |||||||||||||||||||||||||||||
| Establishment of Legal Reserve | - | - | - | - | 130,292 | - | - | (130,292 | ) | - | - | - | ||||||||||||||||||||||||||||||||
| Establishment of Reserves | - | - | - | - | - | - | 2,475,542 | (2,475,542 | ) | - | - | - | ||||||||||||||||||||||||||||||||
| March 31, 2012 | 4,691,822 | (67,663 | ) | 672,667 | 17,863 | 193,411 | 1,168,151 | 2,475,542 | - | 9,151,793 | 464,581 | 9,616,374 | ||||||||||||||||||||||||||||||||
| Capital Reserve | Profit Reserve | |||||||||||||||||||||||||||||||||||||||
| Common Stock | Treasury share | Share based compensation | Other components of equity | Legal | Retained Earnings | Accumulated earning (losses) | Total | Non-controlling interest | Total Equity | |||||||||||||||||||||||||||||||
| March 31, 2010 | 4,687,826 | (4,186 | ) | 452,217 | 39,112 | 24,541 | 719,548 | - | 5,919,058 | 63,119 | 5,982,177 | |||||||||||||||||||||||||||||
| Hedge accounting | - | - | - | (143,298 | ) | - | - | - | (143,298 | ) | - | (143,298 | ) | |||||||||||||||||||||||||||
| Current translation adjustment - CTA | - | - | - | 346 | - | - | - | 346 | - | 346 | ||||||||||||||||||||||||||||||
| Pension | - | - | - | (19,435 | ) | - | - | - | (19,435 | ) | - | (19,435 | ) | |||||||||||||||||||||||||||
| Capital increase resulting from the exercise of warrants | 1 | - | - | - | - | - | - | 1 | - | 1 | ||||||||||||||||||||||||||||||
| Exercise of stock option | 3,995 | - | - | - | - | - | - | 3,995 | - | 3,995 | ||||||||||||||||||||||||||||||
| Issuance of subsidiary shares to non-controlling interest | - | - | 206,404 | - | - | - | - | 206,404 | 193,596 | 400,000 | ||||||||||||||||||||||||||||||
| Logispot acquisition | - | - | - | - | - | - | - | - | 64,277 | 64,277 | ||||||||||||||||||||||||||||||
| Treasury Shares | - | (15,219 | ) | - | - | - | - | - | (15,219 | ) | - | (15,219 | ) | |||||||||||||||||||||||||||
Effect without placing shares in subsidiary | - | - | (839 | ) | - | - | - | - | (839 | ) | (504 | ) | (1,343 | ) | ||||||||||||||||||||||||||
| Share based compensation | - | - | 2,961 | - | - | - | - | 2,961 | - | 2,961 | ||||||||||||||||||||||||||||||
| Net Income | - | - | - | - | - | - | 771,565 | 771,565 | 4,997 | 776,562 | ||||||||||||||||||||||||||||||
| Dividends that exceed minimum mandatory | - | - | - | - | - | -83,431 | - | -83,431 | - | -83,431 | ||||||||||||||||||||||||||||||
| Dividends | - | - | - | - | - | - | -183,247 | -183,247 | - | -183,247 | ||||||||||||||||||||||||||||||
| Establishment of Legal Reserve | - | - | - | - | 38,578 | - | (38,578 | ) | - | - | - | |||||||||||||||||||||||||||||
| Establishment of Reserves | - | - | - | - | - | 549,740 | (549,740 | ) | - | - | - | |||||||||||||||||||||||||||||
| March 31, 2011 | 4,691,822 | (19,405 | ) | 660,743 | (123,275 | ) | 63,119 | 1,185,857 | - | 6,458,861 | 325,485 | 6,784,346 | ||||||||||||||||||||||||||||
6
| COSAN S.A. INDÚSTRIA E COMÉRCIO |
| Consolidated statement of comprehensive income |
| Years ended March 31, 2012, 2011 and 2010 |
| (In thousands of Reais) |
| 2012 | 2011 | |||||||
| Net Income | 2,644,790 | 776,562 | ||||||
| Other comprehensive income (loss) | ||||||||
| Exchange differences on translation of foreign operations - CTA | 7,415 | 346 | ||||||
| Net movement on cash flow hedge | 238,503 | (217,118 | ) | |||||
| Actuarial gains and losses defined benefit plans | (35,893 | ) | (29,447 | ) | ||||
| Income tax effects | (68,887 | ) | 83,832 | |||||
| 141,138 | (162,387 | ) | ||||||
| Other comprehensive income for the year, net of tax | ||||||||
| Total Comprehensive Income for the year, net of tax | 2,785,928 | 614,175 | ||||||
| Attributed to: | ||||||||
| Owners of the Company | 2,746,972 | 609,178 | ||||||
| Non-controlling interests | 38,956 | 4,997 | ||||||
See accompanying notes to consolidated financial statements.
7
COSAN S.A. INDÚSTRIA E COMÉRCIO
Notes to the consolidated financial statement
Years ended March 31, 2012 and 2011
(In thousands of Reais, except otherwise stated)
| Cosan S.A. Indústria e Comércio |
| Consolidated statements of cash flows |
| Years ended March 31, 2012, 2011 and 2010 |
| (In thousand of Reais) |
| Parent Company | Consolidated | |||||||||||||||
| 2012 | 2011 | 2012 | 2011 | |||||||||||||
| Operating activities | ||||||||||||||||
| Net income | 2,605,834 | 771,565 | 2,605,834 | 771,565 | ||||||||||||
| Non-cash adjustment to reconcile profit before tax to net cash flows from operating activities | ||||||||||||||||
| Depreciation and Amortization | 3,082 | 79,190 | 1,142,780 | 1.359.000 | ||||||||||||
| Biological asset | - | 92,497 | (60,093 | ) | (381.894 | ) | ||||||||||
| Equity income | (3,154,846 | ) | (500,422 | ) | (33,268 | ) | (25,187 | ) | ||||||||
| Gain on disposal of property, plant and equipment | 48 | (1,069 | ) | (93,892 | ) | (35,295 | ) | |||||||||
| Share based compensation expenses | 10,800 | 2,961 | 10,800 | 2,961 | ||||||||||||
| Deferred income taxes | (208,564 | ) | 140,364 | 962,758 | 329,071 | |||||||||||
| Non-controlling interests | - | - | 38,956 | 4,997 | ||||||||||||
| Income from the formation of the JVs | 69,476 | - | (3,098,494 | ) | - | |||||||||||
| Interest, monetary and exchange variations, net | 104,586 | (2,568 | ) | 635,133 | 238,482 | |||||||||||
| Others | (14,658 | ) | (20,855 | ) | (5,709 | ) | 4,584 | |||||||||
| (584,242 | ) | 561,663 | 2,104,805 | 2,268,284 | ||||||||||||
| Changes in Assets / Liabilities | ||||||||||||||||
| Accounts receivable | (4,058 | ) | 175,889 | (361,147 | ) | 164,693 | ||||||||||
| Restricted cash | (21,440 | ) | 42,253 | 79,452 | (142,972 | ) | ||||||||||
| Inventories | 628 | (35,138 | ) | (186,775 | ) | 84,581 | ||||||||||
| Taxes recoverable | 75,979 | 6,027 | (17,126 | ) | (50,068 | ) | ||||||||||
| Advances to Suppliers | (18,245 | ) | 24,634 | (103,294 | ) | 16,779 | ||||||||||
| Accounts payable | 14,442 | (16,733 | ) | 220,213 | (32,361 | ) | ||||||||||
| Tax Payable | 94,880 | (7,803 | ) | 886,283 | 75,639 | |||||||||||
| Provision for judicial demands Legal proceedings | 311,093 | 1,079 | 143,960 | 26,859 | ||||||||||||
| Salaries payable | 8,938 | 5,440 | 108,177 | 36,224 | ||||||||||||
| related parties | 658,825 | (74,224 | ) | (751,679 | ) | (39,778 | ) | |||||||||
| Derivatives | (274,364 | ) | 18,060 | (112,281 | ) | 13,347 | ||||||||||
| Other Assets and Liabilities, net | (9,681 | ) | (1,663 | ) | (49,132 | ) | (84,129 | ) | ||||||||
| 836,997 | 137,821 | (143,349 | ) | 68,814 | ||||||||||||
| Net Cash Flow from Operating Activities | 252,755 | 699,484 | 1,961,456 | 2,337,098 | ||||||||||||
8
COSAN S.A. INDÚSTRIA E COMÉRCIO
Notes to the consolidated financial statement
Years ended March 31, 2012 and 2011
(In thousands of Reais, except otherwise stated)
| Cosan S.A. Indústria e Comércio |
| Consolidated statements of cash flows |
| Years ended March 31, 2012, 2011 and 2010 |
| (In thousand of Reais) |
| Parent Company | Consolidated | |||||||||||||||
| 2012 | 2011 | 2012 | 2011 | |||||||||||||
| Investing Activities | ||||||||||||||||
| Acquisitions , net of cash acquired | (85,861 | ) | (75,985 | ) | (72,930 | ) | (157,345 | ) | ||||||||
| Acquisition of additional interest in subsidiary | (40,313 | ) | - | - | - | |||||||||||
| Cash contributed upon the formation of Raizen | - | - | (173,116 | ) | - | |||||||||||
| Received cash of incorporation the Cosan Fuel Distribution | 21,198 | - | - | - | ||||||||||||
| Received Dividends | 64,845 | 113,532 | - | - | ||||||||||||
| Additions to investments | (21,946 | ) | - | (42,328 | ) | - | ||||||||||
| Purchase of property, plant and equipment, software and other intangible assets | (5,538 | ) | (430,233 | ) | (1,584,542 | ) | (2,291,647 | ) | ||||||||
| Sugar-cane planting and growing costs | - | (253,535 | ) | (551,974 | ) | (745,572 | ) | |||||||||
| Proceeds from sale of property, plant and equipment | - | 27,209 | 182,115 | 48,832 | ||||||||||||
| Net Cash Flow used Investing Activities | (67,615 | ) | (619,012 | ) | (2,242,775 | ) | (3,145,732 | ) | ||||||||
| Financing Activities | ||||||||||||||||
| Proceeds from long-term debt | - | 744,860 | 2,166,743 | 2,719,522 | ||||||||||||
| Repayment of long-term debt | - | (1,333,722 | ) | 1,843,352 | (1,967,938 | ) | ||||||||||
| Capital increase | - | 3,996 | - | 3,996 | ||||||||||||
| Cash proceeds from non-controlling interests | - | - | 560,946 | 400,000 | ||||||||||||
| Treasury shares | (48,258 | ) | (15,219 | ) | (48,258 | ) | (15,219 | ) | ||||||||
| Dividends paid | (192,661 | ) | (193,095 | ) | (192,661 | ) | (193,095 | ) | ||||||||
| Related Parties | - | 799,101 | - | 37,072 | ||||||||||||
| Net cash flows (used in) from financing activities | (240,919 | ) | 5,921 | 643,418 | 984,338 | |||||||||||
| Net increase in Cash or Equivalent Cash | (55,779 | ) | 86,393 | 362,099 | 175,704 | |||||||||||
| Cash and equivalent cash in the beginning of the period | 372,318 | 285,925 | 1,254,070 | 1,078,366 | ||||||||||||
| Cash and equivalent cash in the end of the period | 316,539 | 372,318 | 1,616,169 | 1,254,070 | ||||||||||||
| Supplemental disclosure of cash flow information | ||||||||||||||||
| Income taxes paid | - | - | 179,655 | 38,844 | ||||||||||||
| Financial interest expenses paid | - | 153,536 | 304,611 | 450,051 | ||||||||||||
See accompanying notes to consolidated financial statements
9
COSAN S.A. INDÚSTRIA E COMÉRCIO
Notes to the consolidated financial statement
Years ended March 31, 2012 and 2011
(In thousands of Reais, except otherwise stated)
| Parent Company | Consolidated | |||||||||||||||
| 2012 | 2011 | 2012 | 2011 | |||||||||||||
| Revenues | ||||||||||||||||
| Sales of services and products, net | 1,341 | 2,245,101 | 25,351,658 | 19,783,250 | ||||||||||||
| Others operational revenues, net | 8,436 | 6,093 | 305,929 | 61,473 | ||||||||||||
| Gain of formation of joint venture | 22,661 | - | 3,196,632 | - | ||||||||||||
| Reversal (additions) of allowance for doubtful accounts | - | (202 | ) | (357 | ) | 7,795 | ||||||||||
| 32,438 | 2,250,992 | 28,853,862 | 19,852,518 | |||||||||||||
| Raw materials acquired from third parties | ||||||||||||||||
| Cost of goods sold and services rendered | (2,410 | ) | (1,074,071 | ) | (20,155,600 | ) | (13,578,664 | ) | ||||||||
| Materials, energy, third parties services, others | (118,422 | ) | (460,470 | ) | (1,264,302 | ) | (1,380,614 | ) | ||||||||
| (120,832 | ) | (1,534,541 | ) | (21,419,902 | ) | (14,959,278 | ) | |||||||||
| Gross value added | (88,394 | ) | 716,451 | 7,433,960 | 4,893,240 | |||||||||||
| Retention | ||||||||||||||||
| Depreciation and amortization | (1,897 | ) | (79,190 | ) | (1,142,780 | ) | (742,307 | ) | ||||||||
| Net value added | (90,291 | ) | 637,261 | 6,291,180 | 4,150,933 | |||||||||||
| Value added received in transfer | ||||||||||||||||
| Income from equity investments | 3,154,846 | 500,422 | 33,268 | 25,187 | ||||||||||||
| Financial revenue | 184,949 | 574,416 | 1,053,017 | 542,501 | ||||||||||||
| 3,339,795 | 1,074,838 | 1,086,285 | 567,688 | |||||||||||||
| Value added to be distributed | 3,249,504 | 1,712,099 | 7,377,465 | 4,718,621 | ||||||||||||
| Distribution of value added | ||||||||||||||||
| Salaries | 41,478 | 263,081 | 846,278 | 901,062 | ||||||||||||
| Taxes and contributions | (198,773 | ) | 283,816 | 2,208,137 | 2,134,280 | |||||||||||
| Financial expenses | 800,578 | 294,589 | 1,523,362 | 689,189 | ||||||||||||
10
COSAN S.A. INDÚSTRIA E COMÉRCIO
Notes to the consolidated financial statement
Years ended March 31, 2012 and 2011
(In thousands of Reais, except otherwise stated)
| 1. | Operations |
Cosan S.A. Indústria e Comércio (“Cosan” or “the Company”) is a Brazilian Company with its shares traded on the São Paulo Stock Exchange (Bovespa – CSAN 3). Its registered office is located in the city of São Paulo, Brazil. Cosan Limited is the controlling shareholder of Cosan, holding a 62.07% interest therein as of March 31, 2012.
Cosan S.A.’s, through its subsidiaries and jointly controlled entities, primary activities are in the following business segments: (i) Sugar & Ethanol: the production of sugar and ethanol, as well as the energy cogeneration produced from sugar cane bagasse, through its joint venture named Raízen Energia Participações S.A. (“Raízen Energia”); (ii) fuel distribution through its joint venture named Raízen Combustíveis S.A. (“Raízen Combustíveis”); (iii) Logistics services including transportation, port lifting and storage of sugar, through its subsidiary Novo Rumo Logística S.A. (Rumo); (iv) Production and distribution of lubricants licensed by Mobil trademark and, (v) since July 1, 2011, the activity of purchase and sale of sugar in the retail segment, which was performed by Raízen Energia was acquired by the Company and allocated to a new segment named “Cosan Alimentos”.
On June 1st 2011, the Company announced, jointly with Royal Dutch Shell ("Shell"), the formation of two entities under common control ("joint ventures" or “JVs”): (i) Raizen Combustíveis, in the fuel distribution segment, and (ii) Raizen Energia, in the segment of production and trade of sugar, ethanol and energy cogeneration. Cosan S.A. and Shell share control of the two entities, with each company holding 50% of the economic control. Cosan recorded its investments in the joint ventures through proportionate consolidation.
Cosan contributed with its sugar, ethanol, cogeneration and fuel distribution business in the formation of the joint ventures. Shell contributed its fuel distribution business in Brazil and interests in two entities involved in activities related to research and development of second generation ethanol (Iogen and Codexis), the license to use the Shell brand in the amount of R$ 533 million and a cash contribution of approximately R$ 1.8 billion over a period of 2 years. The accounting effects arising from the formation of Raizen Combustíveis and Raizen Energia are presented in Note 21, the financial position and the operational profits consolidated in the Company for subsequent periods of the JV’s formation are not necessarily comparable to pre-formation amounts.
The logistics of commodities and lubricants distribution business, together with the investment in Radar Propriedades Agrícolas S.A. ("Radar") were not contributed to the joint ventures.
| 2. | Summary of significant accounting policies |
| 2.1. | Basis of Preparation |
The consolidated financial statements were prepared and presented in accordance with the accounting policies adopted in Brazil, which include the rules of the Securities Commission (CVM) and the pronouncements of the Accounting Pronouncements Committee (CPC), which are in accordance with the international accounting standards issued by the IASB.
The financial statements have been prepared in accordance with accounting practices adopted in Brazil. These practices differ from IFRS, apply to separate financial statements, only in relation to the valuation of investments in subsidiaries, associates and jointly controlled by the equity method, whereas under IFRS would cost or fair value.
11
COSAN S.A. INDÚSTRIA E COMÉRCIO
Notes to the consolidated financial statement
Years ended March 31, 2012 and 2011
(In thousands of Reais, except otherwise stated)
These consolidated financial statements were authorized for issue by the Audit Committee on May 22, 2012.
In accordance with the presentation adopted in the current year, the comparative balance of deferred income taxes and social contribution as of March 31, 2011, totaling R$598,348, before presented separately in the consolidated financial statement, was reclassified to offset the balance of deferred income taxes and social contribution.
| a) | Basis of preparation |
These individual and consolidated financial statements were prepared on a historical cost basis, except for derivative financial instruments and biological assets that have been measured at fair value.
| b) | Functional and presentation currency |
There financial statements, consolidated and individual, are presented in Real, which is the Company´s functional currency. The financial statements of each subsidiary included in the consolidation of the Company and the ones used as the basis for valuation of investments by the equity method are prepared based pm the functional currency of each company. For subsidiaries located abroad, their assets and liabilities were converted to Real exchange rate by year-end and the results were calculated by the average monthly rate during exercise. The effects of conversion are recorded in shareholders’ equity of these subsidiaries.
The financial statements of each subsidiary included in the consolidation and equity method investments are prepared based on the functional currency of each company. Cosan, certain subsidiaries and equity method investments with a functional currency other than Brazilian reais, had their assets and liabilities converted into Brazilian reais at the exchange rate as of year end and their revenues and expenses were converted by applying the average monthly rates.
| c) | Significant accounting judgments, estimates and assumptions |
The preparation of the Company’s consolidated and individual financial statements requires management to make judgments, estimates and assumptions that affect the reported amounts of revenues, expenses, assets and liabilities at the end of the reporting period. Such estimates and assumptions are reviewed on a continuous basis and changes are recognized in the period in which the estimates are revised and in any future periods affected.
A significant change in the facts and circumstances on which judgments, estimates and assumptions are based, may cause a material impact on the results and financial condition of the Company, jointly-controlled and subsidiaries:
Deferred income taxes and social contribution
Deferred tax assets are recognized for all unused tax losses to the extent that it is probable that taxable profit will be available against which the losses can be utilized. Significant management judgment is required to determine the amount of deferred tax assets that can be recognized, based upon the likely timing and the level of future taxable profits together with future tax planning strategies. For further detail on deferred income taxes see Note 17.
12
COSAN S.A. INDÚSTRIA E COMÉRCIO
Notes to the consolidated financial statement
Years ended March 31, 2012 and 2011
(In thousands of Reais, except otherwise stated)
Biological assets
Biological assets are measured at fair value at each reporting date and the effects of changes in fair value between the periods are allocated directly to cost of goods sold. For further detail on the assumptions used see Note 12.
Intangible assets and property, plant and equipment (“P, P&E”) including goodwill
The accounting treatment of intangible assets and P P&E includes estimation to determine the useful life period for purposes to calculate the depreciation and amortization, as well as fair value at the date of acquisition, in particular for assets acquired in business combinations and the formation of JVs.
The company annually performs an analysis of recoverable value of cash-generating units in order to identify a possible devaluation in goodwill and, eventually, in property, plant and equipment.
The determination of the recoverable amount of the cash-generating unit which the goodwill are attributed, includes the use of assumptions and estimates and requires complex level of judgment. For more details about the assumptions used, see note 14
Share based payments
Cosan S.A. measures the cost of equity-settled transactions with employees by reference to the fair value of the equity instruments at the date at which they are granted. The estimation of fair value for share-based payment transactions requires determining the most appropriate valuation model, which is dependent on the terms and conditions of the grant. This estimate also requires determining the most appropriate inputs to the valuation model including the assumption of the expected life of the share option, volatility and dividend yield. The assumptions and models used for estimating fair value for share-based payment transactions are disclosed in Note 28.
Pension benefits
The cost of defined benefit pension plans and other post employment medical benefits and the present value of the pension obligation is determined using actuarial valuations. An actuarial valuation involves making various assumptions which may differ from actual results in the future. These include the determination of the discount rate, future salary increases, mortality rates and future pension increases. A defined benefit obligation is highly sensitive to changes in these assumptions. All assumptions are reviewed at each reporting date. Further details about the assumptions used are included in note 27.
Fair value measurement of contingent consideration
Contingent consideration, resulting from business combinations, is valued at fair value at the acquisition date.
Fair value of financial instruments
When the fair value of financial assets and liabilities recorded in the statement of financial position cannot be derived from active markets, their fair value is determined using valuation techniques
13
COSAN S.A. INDÚSTRIA E COMÉRCIO
Notes to the consolidated financial statement
Years ended March 31, 2012 and 2011
(In thousands of Reais, except otherwise stated)
including the discounted cash flow model. The inputs to these models are taken from observable markets where possible, but where this is not feasible, a degree of judgment is required in establishing fair values. The judgments include considerations of inputs such as liquidity risk, credit risk and volatility. Changes in assumptions about these factors could affect the reported fair value of financial instruments. For further details on financial instruments refer to Note 26.
| 2.2 | Basis of consolidation |
The consolidated financial statement includes information from Cosan, its subsidiaries and jointly controlled entities for 2012 and 2011. The Subsidiaries and jointly controlled subsidiaries are listed below:
| 2012 | 2011 | |||||||||||||||||||||||
| Direct | Indirect | Total | Direct | Indirect | Total | |||||||||||||||||||
| Subsidiaries | ||||||||||||||||||||||||
| Administração de Participações Aguassanta Ltda. | 91.50 | % | - | 91.50 | % | 91.50 | % | - | 91.50 | % | ||||||||||||||
| Bioinvestments Negócios e Participações S.A. | - | 100.00 | % | 100.00 | % | - | 91.50 | % | 91.50 | % | ||||||||||||||
| Vale da Ponte Alta S.A. | - | 100.00 | % | 100.00 | % | - | 91.50 | % | 91.50 | % | ||||||||||||||
| Águas da Ponte Alta S.A. | - | 100.00 | % | 100.00 | % | - | 91.50 | % | 91.50 | % | ||||||||||||||
| Proud Participações S.A. | 100.00 | % | - | 100.00 | % | 99.90 | % | - | 99.90 | % | ||||||||||||||
| Cosan Distribuidora de Combustíveis Ltda. | - | - | - | 99.90 | % | - | 99.90 | % | ||||||||||||||||
| Cosan Overseas Limited | 100.00 | % | - | 100.00 | % | 100.00 | % | - | 100.00 | % | ||||||||||||||
| Pasadena Empreendimentos e Participações S.A. | 100.00 | % | - | 100.00 | % | 100.00 | % | - | 100.00 | % | ||||||||||||||
| Cosan Cayman Finance Limited | 100.00 | % | - | 100.00 | % | 100.00 | % | - | 100.00 | % | ||||||||||||||
| Cosan Cayman II Limited | 100.00 | % | - | 100.00 | % | - | - | - | ||||||||||||||||
| Cosan Lubrificantes e Especialidades S.A. (anteriormente denominada Cosan Combustíveis e Lubrificantes S.A.) | 100.00 | % | - | 100.00 | % | 100.00 | % | - | 100.00 | % | ||||||||||||||
| CCL Cayman Finance Limited | - | 100.00 | % | 100.00 | % | - | 100.00 | % | 100.00 | % | ||||||||||||||
| Copsapar Participações S.A. | 90.00 | % | - | 90.00 | % | 90.00 | % | - | 90.00 | % | ||||||||||||||
| Novo Rumo Logística S.A. | 28.80 | % | 64.10 | % | 92.90 | % | 28.80 | % | 64.10 | % | 92.90 | % | ||||||||||||
| Rumo Logística S.A. | - | - | - | - | 69.70 | % | 69.70 | % | ||||||||||||||||
| Handson Participações S.A. | 100.00 | % | - | 100.00 | % | - | - | - | ||||||||||||||||
| Docelar Alimentos e Bebidas S.A. | 33.00 | % | 66.90 | % | 99.90 | % | 99.90 | % | - | 99.90 | % | |||||||||||||
| Cosan Operadora Portuária S.A. | - | 69.70 | % | 69.70 | % | - | 69.70 | % | 69.70 | % | ||||||||||||||
| Teaçú Armazéns Gerais S.A. | - | - | - | - | 69.70 | % | 69.70 | % | ||||||||||||||||
| Logispot Armazéns Gerais S.A. | - | 35.50 | % | 35.50 | % | - | 35.50 | % | 35.50 | % | ||||||||||||||
| Stallion S.A. | - | 100.00 | % | 100.00 | % | - | - | - | ||||||||||||||||
| Jointly-controlled | ||||||||||||||||||||||||
| Raízen S.A. (1) | 50.00 | % | - | 50.00 | % | - | - | - | ||||||||||||||||
| Raízen Energia Participações S.A. (1) | 50.00 | % | - | 50.00 | % | - | - | - | ||||||||||||||||
| Raízen Combustíveis S.A. (1) | 50.00 | % | - | 50.00 | % | - | - | - | ||||||||||||||||
| IPUTI Empreendimentos e Participações S.A. (1) | 50.00 | % | - | 50.00 | % | - | - | - | ||||||||||||||||
| (1) | Jointly-controlled with Shell |
| (2) | Represents voting and economic interest. Cosan S.A. holds 51% of the outstanding shares of Raízen Energia, and 49% of the outstanding shares of Raízen Combustíveis. |
The subsidiaries are fully consolidated from the date of acquisition of control, and continue to be consolidated until the date that control ceases to exist. The financial statements of subsidiaries are prepared for the same disclosure period as that of the parent company, using consistent accounting policies. All balances held between the subsidiary companies and jointly controlled entities, income
14
COSAN S.A. INDÚSTRIA E COMÉRCIO
Notes to the consolidated financial statement
Years ended March 31, 2012 and 2011
(In thousands of Reais, except otherwise stated)
and expenses and unrealized gains and losses derived from intercompany transactions are eliminated.
Any change in the ownership interest of a subsidiary that does not result in loss of control is accounted for as an equity transaction.
The Company holds an interest in jointly controlled, in which entrepreneurs maintain contractual arrangement establishes joint control. The Company recognizes its interest in jointly controlled using the proportional consolidation in its consolidated financial statement.
The financial statements of jointly controlled are prepared for the same period the company's disclosure.
Adjustments are made where necessary to align with the accounting policies adopted by the Company.
| 2.3 | Summary of significant accounting practices |
The accounting policies listed below have been consistently applied to all years presented in these consolidated financial statements and have been applied consistently by the subsidiaries and jointly-controlled entities.
| a) | Revenue recognition |
Revenues from the sale of products or goods are recognized when the entity transfers to the buyer the significant risks and rewards incidental to ownership of the goods and merchandise, and when it is probable that the economic benefits associated with the transaction will flow to the Company. The sales prices are fixed based on purchase orders or contracts. Goods or services paid in advance are recorded as deferred revenue in other liabilities group and recognized as revenue when the goods are delivered and the service provided.
| b) | Foreign currency transactions |
Transactions in foreign currencies are initially recorded at the functional currency rates, prevailing at the date of the transaction. Monetary assets and liabilities denominated in foreign currencies are retranslated at the functional currency spot rate of exchange at the reporting date. Non-monetary items that are measured in terms of historical cost in a foreign currency are translated using the exchange rates as at the dates of the initial transactions.
| c) | Financial instruments – Recognition initial and subsequent measurement |
(i) Financial assets
Initial recognition and measurement
Financial assets are classified into the following categories: at fair value through profit or loss, held-to-maturity, available for sale and loans and receivables. The Company determines the classification of its financial assets upon initial recognition.
15
COSAN S.A. INDÚSTRIA E COMÉRCIO
Notes to the consolidated financial statement
Years ended March 31, 2012 and 2011
(In thousands of Reais, except otherwise stated)
Financial assets are initially recognized at fair value, plus, in the case of investments not designated at fair value through profit or loss, transaction costs that are directly attributable to the acquisition of financial assets.
Financial assets include cash and cash equivalents, restricted cash, accounts receivable, other receivables and derivative financial instruments.
Subsequent measurement
The subsequent measurement of financial assets depends on their classification, which can be as follows:
Financial assets at fair value through profit or loss
Financial assets at fair value through profit or loss include financial assets held for trading and assets designated upon initial recognition at fair value through profit and loss. They are classified as held for trading if they were acquired with the purpose of selling or repurchasing in the short term. Derivatives are also measured at fair value through profit or loss, except those designated as hedging instruments. Interest, monetary and exchange variations and changes arising from the valuation at fair value are recognized in the income statement when incurred in the line of revenue or expense.
Loans and receivables
After initial measurement, such financial assets are subsequently measured at amortized cost using the effective interest rate method (EIR), less impairment. Amortized cost is calculated by taking into account any discount or premium on acquisition and fees or costs. Amortization is included in finance income in the income statement.
Held-to-maturity
Non-derivative financial assets with fixed or determinable payments and fixed maturities are classified as held-to maturity when the Company has the positive intention and ability to hold them to maturity. Interest, monetary, exchange rate, less impairment losses, if any, are recognized in income when incurred in the line of financial income/expense.
Financial assets available for sale
Financial assets available for sale are those non-derivative financial assets that are not classified as (a) loans and receivables, (b) investments held to maturity or (c) financial assets at fair value through profit and loss.
Derecognition
A financial asset is derecognized when:
| · | The rights to receive cash flows from the asset have expired; and |
| · | The Company has transferred its rights to receive cash flows from the asset or has assumed an obligation to pay the cash flows received without material delay to a third party under a pass-through arrangement; and either (a) the Company transfers substantially all the risks and rewards |
16
COSAN S.A. INDÚSTRIA E COMÉRCIO
Notes to the consolidated financial statement
Years ended March 31, 2012 and 2011
(In thousands of Reais, except otherwise stated)
of the asset, or (b) the Company neither transfers nor retained substantially all the risks and rewards of the asset, but transfers control of the asset.
Impairment of financial assets
The Company assesses at each reporting date whether there is any objective evidence that a financial asset or a group of financial assets is impaired. A financial asset or a group of financial assets is deemed to be impaired if, and only if, there is objective evidence of impairment as a result of one or more events that has occurred after the initial recognition of the asset (an incurred ‘loss event’) and that loss event has an impact on the estimated future cash flows of the financial asset or the group of financial assets that can be reliably estimated.
(ii) Financial liabilities
Initial recognition and measurement
Financial liabilities are classified as financial liabilities at fair value through profit or loss, loans and borrowings, or as derivatives designated as hedging instruments in an effective hedge. The Company determines the classification of its financial liabilities at initial recognition.
All financial liabilities are recognized initially at fair value and in the case of loans and borrowings, carried at amortized cost.
The Company’s financial liabilities include payables to suppliers and other payables, loans and borrowings and derivative financial instruments.
Subsequent measurement
The measurement of financial liabilities depends on their classification as follows:
Financial liabilities at fair value through profit or loss
Financial liabilities at fair value through profit or loss include financial liabilities held for trading and financial liabilities designated upon initial recognition at fair value through profit or loss and derivatives, except those designated as hedging instruments. Interest, monetary and exchange variations and changes arising from the valuation at fair value, where applicable, are recognized in the income statement when incurred.
Loans and borrowings
After initial recognition, loans and borrowings are subject to interest subsequently measured at amortized cost, using the method of effective interest rate. Gains and losses are recognized in the income statement at the moment of the liability write-off, as well as during the process of amortization by the method of effective interest rate.
Derecognition
A financial liability is derecognized when the obligation under the liability is discharged, cancelled or expires.
17
COSAN S.A. INDÚSTRIA E COMÉRCIO
Notes to the consolidated financial statement
Years ended March 31, 2012 and 2011
(In thousands of Reais, except otherwise stated)
(iii) Offsetting of financial instruments
Financial assets and financial liabilities are offset and the net amount reported in the consolidated statement of financial position if there is a currently enforceable legal right to offset the recognized amounts and there is an intention to settle on a net basis, or to realize the assets and settle the liabilities simultaneously.
(iv) Fair value of financial instruments
The fair value of financial instruments that are traded in active markets at each reporting date is determined by reference to quoted market prices or dealer price quotations, without any deduction for transaction costs.
The fair value of financial instruments for which there is no active market is determined using valuation techniques. These techniques can include using recent market transactions (interest free) reference to the current fair value of other similar instruments, analysis of discounted cash flows or other valuation models.
An analysis of fair values of financial instruments and further details as to how they are measured are provided in Note 26.
(v) Derivative financial instruments and hedge accounting
Initial recognition and subsequent measurement
The Company uses derivative financial instruments such as forward currency contracts, interest rate swaps and forward commodity contracts to hedge its foreign currency risks, interest rate risks and commodity price risks, respectively. Derivatives designated in hedge transactions are initially recognized at fair value on the date on which the derivative is acquired, and subsequently also revalued to fair value. Derivatives are presented as financial assets when the instrument's fair value is positive and as liabilities when fair value is negative.
Any gains or losses arising from changes in the fair value of derivatives are taken directly to the income statement, except for the effective portion of cash flow hedges, which is recognized in other comprehensive income.
For the purpose of hedge accounting, hedges are classified as:
| · | Fair value hedges when hedging the exposure to changes in the fair value of a recognized asset or liability or an unrecognized firm commitment or identified part of such asset, liability or firm commitment, that is attributable to a particular risk and could affecting the income; |
| · | Cash flow hedges when hedging exposure to variability in cash flows that is either attributable to a particular risk associated with a recognized asset or liability or a highly probable forecast transaction or the foreign currency risk in an unrecognized firm commitment; and |
| · | Hedges of a net investment in a foreign operation. |
18
COSAN S.A. INDÚSTRIA E COMÉRCIO
Notes to the consolidated financial statement
Years ended March 31, 2012 and 2011
(In thousands of Reais, except otherwise stated)
At the inception of a hedge relationship, the Company formally designates and documents the hedge relationship to which the Company wishes to apply hedge accounting and the risk management objective and strategy for undertaking the hedge.
The documentation includes identification of the hedging instrument, the hedged item or transaction, the nature of the risk being hedged and how the entity will assess the effectiveness of changes in the hedging instrument’s fair value in offsetting the exposure to changes in the hedged item’s fair value or cash flows attributable to the hedged risk. Such hedges are expected to be highly effective in achieving offsetting changes in fair value or cash flows and are assessed on an ongoing basis to determine that they actually have been highly effective throughout the financial reporting periods for which they were designated.
Hedges are expected to be highly effective in offsetting changes in fair value or cash flows, being continually assessed to determine whether they were actually highly effective over all the base periods for which they were intended.
Hedges which meet the strict criteria for hedge accounting are accounted for as follows:
Cash flow hedges
The effective portion of the gain or loss on the hedging instrument is recognized directly as other comprehensive income in the cash flow hedge reserve, while any ineffective portion is recognized immediately in the income statement in other operating expenses.
Amounts recognized as other comprehensive income are transferred to the income statement when the hedged transaction affects profit or loss, such as when the hedged financial income or financial expense is recognized or when a forecast sale occurs. Where the hedged item is the cost of a non-financial asset or non-financial liability, the amounts recognized as other comprehensive income are transferred to the initial carrying amount of the nonfinancial asset or liability.
If the forecast transaction or firm commitment is no longer expected to occur, the cumulative gain or loss previously recognized in equity is transferred to the income statement. If the hedging instrument expires or is sold, terminated or exercised without replacement or rollover, or if its designation as a hedge is revoked, any cumulative gain or loss previously recognized in other comprehensive income remains in other comprehensive income until the forecast transaction or firm commitment affects profit or loss.
The Company uses forward currency contracts as hedges of its exposure to foreign currency risk in forecasted transactions and firm commitments, as well as forward commodity contracts for its exposure to volatility in the commodity prices. Refer to Note 26 for more details.
Fair value hedge and hedges of a net investment
The Company does not hold derivative financial instruments designated in these types of operations.
19
COSAN S.A. INDÚSTRIA E COMÉRCIO
Notes to the consolidated financial statement
Years ended March 31, 2012 and 2011
(In thousands of Reais, except otherwise stated)
| d) | Cash and cash equivalents and restricted cash |
Cash and cash equivalents include cash, bank deposits and other short-term investments of immediate liquidity, redeemable within 90 days from the date of issue, readily convertible into a known amount as cash and cash with insignificant risk of change in their value.
The restricted cash relates mainly to deposits of margin requirements made with brokers who trade commodity derivative instruments linked to Company’s derivatives instruments and financial transactions.
| e) | Accounts receivable |
Refer to receivables from customers and are reduced, by provision, to their probable realizable value.
| f) | Inventories |
Inventories are recorded at average cost of acquisition or production, not to exceed the net realizable value.
| g) | Equity method investments |
Entities over which the Company exercises significant influence are accounted for by the equity method. Based on the equity method, investments are recorded on the balance sheet at cost, plus the changes following the acquisition of shares and the Company’s share of equity income or loss of the associate.
The income statement reflects the share of operating results of associates associate based on the equity method. When a change is recognized directly in equity of the associate, the Company recognizes its share of the variations, where applicable, statement of changes in equity.
The financial statements of associates are prepared for the same period of presentation of the Company even if the fiscal year is not coincidental. Where necessary, adjustments are made to conform to the accounting practices of the Company.
After applying the equity method, the Company determines whether it is necessary to recognize additional loss of recoverable value on the Company's investment in its associate. The Company determines, at each year end, if there is objective evidence that investment in associate loss suffered by the impairment. If so, the Company calculates the amount of loss on the impairment as the difference between the recoverable value of the associate and the book value and the amount recognized in the income statement.
When there is loss of significant influence over the associate, the Company evaluates and recognizes the investment at fair value at that moment.
The unrealized gains and losses resulting from transactions between the Company and associates are eliminated in accordance with the participation held in the associate.
20
COSAN S.A. INDÚSTRIA E COMÉRCIO
Notes to the consolidated financial statement
Years ended March 31, 2012 and 2011
(In thousands of Reais, except otherwise stated)
| h) | Interest in joint ventures |
The Company has an interest in joint ventures, which are a jointly controlled entities, whereby the venturers have a contractual arrangement that establishes joint control over the economic activities of the entity. The agreement requires unanimous agreement for financial and operating decisions among the venturers. The Company recognizes its interest in the joint ventures using the proportionate consolidation method. The Company combines its proportionate share of each of the assets, liabilities, income and expenses of the joint ventures with similar items, line by line, in its consolidated financial statements. The financial statements of the joint ventures are prepared for the same reporting period as the Company.
Adjustments are made in the Company´s consolidated financial statements to eliminate the Company´s share of intercompany balances, transactions and unrealized gains and losses on such transactions between the Company and its joint ventures. Losses on transactions are recognized immediately if the loss provides evidence of a reduction in the net realisable value of current assets or an impairment loss. The joint venture is proportionately consolidated until the date on which the Company ceases to have joint control over the joint venture.
As discussed in Note 2.4, effective in the Company’s fiscal year ending March 31, 2014, the IFRS accounting for these proportionately consolidated entities will change and the Company will then be required to account for them retrospectively using the equity method of accounting.
| i) | Biological assets |
Biological assets refer to the sugarcane plantations and are recognized at fair value at each balance sheet date and the effects of changes in fair values between the periods are allocated to cost of goods sold. The sugarcane plantation is measured at fair value in accordance with the discounted cash flow method. The harvest of the Company begins generally in April each year and ends in the months of November and December.
The Company’s own land on which the biological asset is produced is accounted for in accordance with IAS 16 - Property, Plant and Equipment.
| j) | Property, plant and equipment (“P, P&E”) |
Items of P, P&E are measured at historical cost of acquisition or construction, less accumulated depreciation and impairment when applicable.
Cost includes expenditures that are directly attributable to the acquisition of an asset. The cost of assets constructed by the entity includes the cost of materials and direct labor, other costs to put the asset in location and condition necessary for them to be able to operate in the manner intended by management, and borrowing costs on qualifying assets. Borrowing costs relating to funds raised for work in progress are capitalized until these projects are completed.
The Company carries out the planned major maintenance and inspection activities at its plants on an annual basis in order to inspect and replace components. This occurs between January and March. The principal costs include maintenance costs for labor, material third party services and overhead allocated during the inter harvest period.
21
COSAN S.A. INDÚSTRIA E COMÉRCIO
Notes to the consolidated financial statement
Years ended March 31, 2012 and 2011
(In thousands of Reais, except otherwise stated)
The estimated cost of a component of a piece of equipment that must be replaced each year is recorded as a component of cost of the equipment and depreciated over the following season. Costs of normal periodic maintenance are recorded as expenses when incurred since the components will not improve the production capacity or introduce improvements to equipment.
Depreciation is calculated on a straight line method based on useful life of each asset, following the annual depreciation rates shown below:
| Buildings and improvements | 4% | |
| Machinery and equipment | 3% to 10% | |
| Agricultural machinery | 10% | |
| Industrial equipment and facilities | 10% | |
| Furniture and fixtures | 10% | |
| Computer equipment | 20% | |
| Vehicles | 10% to 20% | |
| Locomotives | 3.3% | |
| Rail cars | 2.9% | |
| Boats | 20% | |
| Aircrafts | 10% |
k) | Leases |
The determination of whether an arrangement is, or contains, a lease is based on the substance of the arrangement at the inception date.
Finance leases which transfer to the Company substantially all the risks and benefits incidental to ownership of the leased item, are capitalized at the commencement of the lease at the fair value of the leased property or, if lower, at the present value of the minimum lease payments. Lease payments are apportioned between finance charges and reduction of the lease liability so as to achieve a constant rate of interest on the remaining balance of the liability. Finance charges are recognized in finance costs in the income statement. A leased asset is depreciated over the useful life of the asset.
Operating lease payments are recognized as an operating expense in the income statement on a straight-line basis over the lease term.
| l) | Intangibles |
| (i) | Goodwill |
The goodwill is maintained at its cost, net of any impairment losses, if applicable. Goodwill is tested annually for impairment losses. For testing purposes the recoverable amount, the acquired goodwill in a business combination is, from the acquisition date, allocated to each cash-generating units of the Company which are expected to be benefited by the combination, independently of other assets or liabilities of the acquiree to be assigned to those units.
| (ii) | Intangible assets with finite lives |
Intangible assets with defined useful lives are measured at cost, net of accumulated amortization and accumulated impairment losses.
22
COSAN S.A. INDÚSTRIA E COMÉRCIO
Notes to the consolidated financial statement
Years ended March 31, 2012 and 2011
(In thousands of Reais, except otherwise stated)
| m) | Impairment |
The Company assesses annually whether there are indications of impairment in its long lived assets. If these indicators are identified, the Company estimates the recoverable amount of the assets. The recoverable amount of an asset or a group of assets is the greater of: (a) the fair value less estimated costs to sell it, and (b) its value in use. Value in use is the discounted cash flow (before taxes) from the continued use of the assets until the end of its useful life.
Regardless of the existence of indicators of loss of value, goodwill and intangible assets with indefinite useful lives are tested for impairment at least once a year.
When the book value of an asset exceeds its recoverable amount, the impairment loss is recognized as an operating expense in the income statement.
| n) | Borrowing costs |
Borrowing costs related to the acquisition, construction or production of an asset that necessarily requires a substantial period of time to be concluded for its intended use or sale are capitalized as part of the cost of the respective assets. Borrowing costs include interest and other costs incurred by an entity on the loan.
| o) | Provisions |
Provisions are recognized when the Company has a present obligation (legal or constructive) as a result of a past event, it is probable that an outflow of resources embodying economic benefits will be required to settle the obligation and a reliable estimate can be made of the amount of the obligation.
| p) | Pension and other employment benefits |
| i) | Defined benefit pension plan |
The Company, through its indirect subsidiary Cosan Lubrificantes Especialidades S.A. (“CLE”) is the sponsor of a defined benefit pension plan for part of its employees. The cost of providing benefits under the defined benefit plan is determined annually by independent actuaries using the projected unit credit method.
Actuarial gains and losses for the defined benefit plan are recognized in full in the period in which they occur in other comprehensive income. Such actuarial gains and losses are also immediately recognized in equity and are not reclassified to profit or loss in subsequent periods.
| ii) | Defined contribution pension plan |
The Company, its subsidiaries and jointly-controlled entities sponsor a defined contribution plan, for all employees. The Company does not have a legal or constructive obligation to pay further contributions if the fund does not have sufficient assets to pay all benefits owed.
23
COSAN S.A. INDÚSTRIA E COMÉRCIO
Notes to the consolidated financial statement
Years ended March 31, 2012 and 2011
(In thousands of Reais, except otherwise stated)
| iii) | Share-based payments |
Employees (including senior executives) of Cosan S.A. receive regular compensation in the form of equity investments for services rendered (equity-settled transactions). The cost of equity-settled transactions is recognized, together with a corresponding increase in equity, over the period in which the performance and/or service conditions are fulfilled. A companhia uses the binomial model to estimate the fair value of the options at the date of the grant.
| q) | Treasury shares |
Represented by the own shares re-acquired on the market and held in treasury, in accordance with the Repurchase Plan previously approved.
Equity instruments which are reacquired (treasury shares) are recognized at cost and deducted from equity. No gain or loss is recognized in the income statement in the purchase, sale, issue or cancel of equity instruments of the Company. Any difference between book value and the consideration is recognized in capital reserve.
| r) | Taxes |
| (i) | Income taxes |
Taxation on income comprises the income tax and social contribution. Income tax is calculated on taxable income at a rate of 15%, plus an additional 10% for profits that exceed $ 240 in 12 months, while the social contribution is calculated at the rate of 9% on taxable income recognized on an accrual basis. Therefore the Company is subject to a theoretical rate of income tax equivalent to 34%.
Income taxes are comprised of income tax and social contribution at a combined rate of 34%.
Deferred Income and social contribution taxes on tax losses, negative basis of social contribution and temporary differences are presented in, noncurrent, assets and / or liabilities, calculated based on the rates set out upon its completion and reviewed annually. Deferred tax assets are recognized only to the extent that it is probable that there will be taxable for which the temporary differences can be utilized.
Anticipations or countervailable values are demonstrated as current and noncurrent, according to their expected realization.
| (ii) | Indirect taxes |
Net revenues is recognized net of discounts and sales taxes (IPI, ICMS, PIS and COFINS).
| s) | Business combinations |
Business combinations are accounted for using the acquisition method and the assets and liabilities assumed are measured at fair value for purposes of goodwill calculation. Goodwill represents the excess of the acquisition cost in comparison the fair value of the acquired assets and liabilities. If there
24
COSAN S.A. INDÚSTRIA E COMÉRCIO
Notes to the consolidated financial statement
Years ended March 31, 2012 and 2011
(In thousands of Reais, except otherwise stated)
is an excess of the acquirer's interest in the fair value of assets and liabilities acquired over the cost, the difference is recognized immediately in the income statement.
| t) | Asset retirement obligations |
The retirement obligations of its jointly-controlled entities relate to the required obligation to remove underground fuel tanks upon retirement.
The initial measurement of which is recognized as a liability discounted to present values and subsequently accreted through earnings. An asset retirement cost equal to the initial estimated liability is capitalized as part of the related asset’s carrying value and depreciated over the asset’s useful life.
| u) | Environmental matters |
The Company, its subsidiaries and its jointly-controlled entities production facilities and their plantation activities are both subject to environmental regulations. The Company diminishes the risks associated with environmental matters, through operating procedures and controls and investments in pollution control equipment and systems.
2.4 New IFRS and IFRIC Interpretations Committee (Financial Reporting Interpretations of IASB) applicable to the consolidated financial statements
New accounting pronouncements of the IASB and IFRIC interpretations have been published and / or reviewed as presented below:
IFRS 9 Financial Instruments: Classification and Measurement
Classification and measurement - It reflects the first phase of the IASBs work on the replacement of IAS 39 Financial Instruments: Recognition and Measurement. IFRS 9 uses a simplified approach to determine whether a financial asset is measured at amortized cost or fair value, based on the manner in which an entity manages its financial instruments (business model) and the typical contractual cash flow of financial assets. The standard also requires the adoption of only one method for determining losses in recoverable value of assets. The standard is effective for annual periods beginning on or after 1 January 2013. Management is still evaluating the impact on its financial position or performance in relation to IFRS 9.
IFRS 10 Consolidated Financial Statements
IFRS 10 as issued establishes principles for the presentation and preparation of consolidated financial statements when an entity controls one or more other entities. IFRS 10 replaces the consolidation requirements in SIC-12 Consolidation—Special Purpose Entities and IAS 27 Consolidated and Separate Financial Statements and is effective for annual periods beginning on or after January 1, 2013. Early application is permitted. Management is still evaluating the impact on its financial position or performance from the adoption of IFRS 10.
25
COSAN S.A. INDÚSTRIA E COMÉRCIO
Notes to the consolidated financial statement
Years ended March 31, 2012 and 2011
(In thousands of Reais, except otherwise stated)
IFRS 11 Joint Arrangements
IFRS 11 will significantly change the accounting for the Company’s joint arrangements. The new standard eliminates inconsistencies in the reporting of joint arrangements in current practice, by requiring a single method (the equity method of accounting) to account for interests in jointly controlled entities.
It eliminates the option to proportionate consolidate these jointly controlled entities. It is effective for annual periods beginning on or after January 1, 2013. Early adoption is permitted.
With the adoption of IFRS 11, currently expected for the year ended March 31, 2014, the Company's joint ventures (Raízen Energia and Raízen Combustíveis) currently presented via proportionate consolidation, will be presented using the equity method of accounting in accordance with IAS 28R – Investment in Associates and Joint Ventures. These two joint ventures currently comprise a substantial component of the Company's assets and operations. Thus, while the Company is currently estimating the impacts of the adoption of IFRS 11, it is anticipated that it will be significant.
The total assets of these joint ventures represented approximately 71% of consolidated totals at March 31, 2012. The revenues, operating income and cash flow from operating activities of these joint ventures accounted for approximately 80%, 67% and 93% of consolidated totals for the year ended March 31, 2012, respectively. A change from proportionate consolidation to equity method accounting would have no impact on the total equity or net income derived from these joint ventures, except that when using a proportional consolidation model net income would be lower in the year of joint venture formation as the transaction costs would be expensed as incurred. When applying the equity method of accounting those expenses would be considered a component of the equity method investment.
IFRS 12 Disclosure of Involvement with Other Entities
IFRS 12 is a new and comprehensive standard on disclosure requirements for all forms of interests in other entities, including subsidiaries, joint arrangements, associates and unconsolidated structured entities. IFRS 12 is effective for annual periods beginning on or after January 1, 2013. Earlier application is permitted. Management is still evaluating the impact on its financial position or performance from the adoption of IFRS 12.
IFRS 13 Fair Value Measurement
IFRS 13 establishes new requirements on how to measure fair value and the related disclosures for IFRS and US generally accepted accounting principles. The standard is effective for annual periods beginning on or after 1 January 2013. Earlier application is permitted. Management is still evaluating the impact on its financial position or performance from the adoption of IFRS 13.
IAS 28 Investments in Associates and Joint Ventures (revised in 2011)
As a consequence of the new IFRS 11 and IFRS 12, IAS 28 has been renamed IAS 28 Investments in Associates and Joint Ventures, and describes the application of the equity method to investments in joint ventures in addition to associates. The amendment becomes effective for annual periods beginning on or after 1 January 2013.
26
COSAN S.A. INDÚSTRIA E COMÉRCIO
Notes to the consolidated financial statement
Years ended March 31, 2012 and 2011
(In thousands of Reais, except otherwise stated)
There are no other pronouncements issued and yet to be adopted that may have a significant impact in the Company´s operations and financial position
| 3. | Cash and Equivalent Cash |
| Parent Company | Consolidated | |||||||||||||||
| 2012 | 2011 | 2012 | 2011 | |||||||||||||
| Cash | 177 | 146 | 3,027 | 289 | ||||||||||||
| Bank accounts | 13 | 11,971 | 124,804 | 64,437 | ||||||||||||
| Value awaiting for closing exchange | - | 5,952 | 11,477 | 78,353 | ||||||||||||
| Highly liquid Investments | 316,349 | 354,249 | 1,476,861 | 1,110,991 | ||||||||||||
| 316,539 | 372,318 | 1,616,169 | 1,254,070 | |||||||||||||
On March 31, 2012, the Company had unused lines of credit with BNDES, at the amount of R$ 420,414 (R$1,064,930 in March 31,2011). The use of these lines of credit depends upon fulfillment of certain contractual conditions.
| 4. | Restricted Cash |
| Parent Company | Consolidated | |||||||||||||||
| 2012 | 2011 | 2012 | 2011 | |||||||||||||
| Restricted financial investments | 18,233 | - | 48,292 | 61,072 | ||||||||||||
| Deposits in connection with derivative transactions | - | 2,719 | 45,976 | 126,872 | ||||||||||||
| 18,233 | 2,719 | 94,268 | 187,944 | |||||||||||||
Deposits in connection with derivative transactions relate to margin calls by counterparties in derivative transactions.
| 5. | Other financial assets |
| Parent Company | Consolidated | |||||||||||||||
| 2012 | 2011 | 2012 | 2011 | |||||||||||||
| Fair value of Radar option (1) | 140,820 | 162,961 | 140,820 | 162,961 | ||||||||||||
| Brazilian Treasury certificates – CTN (2) | - | 38,812 | 149,438 | 257,456 | ||||||||||||
| ExxonMobil financial asset - reimbursement (3) | - | - | 540,224 | - | ||||||||||||
| 140,820 | 201,773 | 830,482 | 420,417 | |||||||||||||
| Current | - | 40,080 | - | |||||||||||||
| Non current | 140,820 | 201,773 | 790,402 | 420,417 | ||||||||||||
| (1) | The Cosan S.A. holds warrants on Radar, exercisable at any time up to maturity (August 2018). Such warrants will allow Cosan S.A. to purchase additional shares at R$41.67 per share adjusted for inflation (IPCA), equivalent to 20% of the total shares issued by Radar as of the date of exercise. The exercise of warrants will not change the classification of this investment as an equity investment. The fair value of these warrants was calculated based on observable market data. |
| (2) | Represented by bonds issued by the Brazilian National Treasury under the Special Program for Agricultural Securitization - "PESA" with original maturity of 20 years in connection with the long-term debt denominated PESA (note 15). These bonds yield inflation (IGPM) plus 12% p.a.. The value of these securities at maturity is expected to be equal to the amount due to the PESA at that date. If the PESA debt is paid in advance, the Company may still keep this investment until maturity |
27
COSAN S.A. INDÚSTRIA E COMÉRCIO
Notes to the consolidated financial statement
Years ended March 31, 2012 and 2011
(In thousands of Reais, except otherwise stated)
| (3) | In June 28, 2011 the subsidiary Cosan Lubrificantes e Especialidades S.A., the successor entity Esso Brasileira de Petróleo Ltda. (“Essobrás”) proceeded with the consolidation of tax debts included in the tax recovery program ("Refis IV") the amount of R$ 540,224, as determined by ExxonMobil Brasil Holdings BV, the former owner is contractually responsible for these liabilities. Therefore the Company recognized an obligation to pay taxes and a corresponding to a financial asset from ExxonMobil Brasil Holdings BV. the same amount. |
| 6. | Accounts Receivable |
The balances of accounts receivables as of March 31, 2012 and 2011 are composed as follows:
| Parent Company | Consolidated | |||||||||||||||
| 2012 | 2011 | 2012 | 2011 | |||||||||||||
| Domestic | - | 45,790 | 902,407 | 678,498 | ||||||||||||
| Foreign | - | - | 164,681 | 7,556 | ||||||||||||
| Allowance for doubtful accounts | - | (1,008 | ) | (103,502 | ) | (91,197 | ) | |||||||||
| - | 44,782 | 963,586 | 594,857 | |||||||||||||
The analysis of the maturity of the accounts receivable is as follows:
| Parent Company | Consolidated | |||||||||||||||
| 2012 | 2011 | 2012 | 2011 | |||||||||||||
| Current | - | 44,048 | 764,826 | 555,826 | ||||||||||||
| Over Due: | ||||||||||||||||
| Up to 30 days | - | 48 | 100,339 | 21,097 | ||||||||||||
| From 31 to 60 days | - | 1 | 16,535 | 4,317 | ||||||||||||
| From 61 to 90 days | - | 229 | 8,476 | 553 | ||||||||||||
| More than 180 days | - | 456 | 73,410 | 13,064 | ||||||||||||
| - | 44,782 | 963,586 | 594,857 | |||||||||||||
Changes in the allowance for doubtful accounts are as follows:
| Parent Company | Consolidated | |||||||
| March 31, 2010 | (806 | ) | (97,721 | ) | ||||
| Provision | (308 | ) | (16,573 | ) | ||||
| Reversal | 106 | 18,238 | ||||||
| Write-offs | - | 6,130 | ||||||
| Addition from business combination | - | (1,271 | ) | |||||
| March 31, 2011 | (1,008 | ) | (91,197 | ) | ||||
| Addition | - | (28,003 | ) | |||||
| Reversal | - | 26,711 | ||||||
| Write-offs | - | 935 | ||||||
| Addition from the formation of the JVs | 1,008 | (11,135 | ) | |||||
| Addition from business combination | - | (813 | ) | |||||
| March 31, 2012 | - | (103,502 | ) | |||||
28
COSAN S.A. INDÚSTRIA E COMÉRCIO
Notes to the consolidated financial statement
Years ended March 31, 2012 and 2011
(In thousands of Reais, except otherwise stated)
| 7. | Inventories |
| Parent Company | Consolidated | |||||||||||||||
| 2012 | 2011 | 2012 | 2011 | |||||||||||||
| Finished Goods: | ||||||||||||||||
| Sugar | - | 9,559 | 87,110 | 77,673 | ||||||||||||
| Ethanol | - | 18,080 | 101,994 | 42,840 | ||||||||||||
| Fuel | - | - | 276,867 | 231,891 | ||||||||||||
| Lubrificants | - | - | 112,492 | 94,743 | ||||||||||||
| Raw material | - | 17,546 | 52,586 | 51,598 | ||||||||||||
| Goods in process | - | 1,121 | - | 5,121 | ||||||||||||
| Spare parts and others | - | 51,993 | 121,643 | 186,032 | ||||||||||||
| Provision for inventory realization obsolescence | - | (5,728 | ) | (4,542 | ) | (19,567 | ) | |||||||||
| - | 92,571 | 748,150 | 670,331 | |||||||||||||
Change in the provision for inventory realization and obsolescence is as follows:
Parent Company | Consolidated | |||||||
| March 31, 2010 | (6,783 | ) | (25,260 | ) | ||||
| Addition | (2,681 | ) | (13,483 | ) | ||||
| Reversal | 3,736 | 19,176 | ||||||
| March 31, 2011 | (5,728 | ) | (19,567 | ) | ||||
| Additions | - | (1,697 | ) | |||||
| Effective Loss | - | 5,173 | ||||||
| Reversion | - | 4,815 | ||||||
| Effect of the formation of JV | 5,728 | 6,734 | ||||||
| March 31, 2012 | - | (4,542 | ) | |||||
| 8. | Recoverable Taxes |
| Parent Company | Consolidated | |||||||||||||||
| 2012 | 2011 | 2012 | 2011 | |||||||||||||
| Income tax | 31,968 | 25,953 | 107,561 | 66,274 | ||||||||||||
| COFINS | - | 61,478 | 63,727 | 121,474 | ||||||||||||
| PIS | - | 13,426 | 18,614 | 27,338 | ||||||||||||
| ICMS - State VAT | - | 7,713 | 194,818 | 151,161 | ||||||||||||
| IPI | - | 976 | 43,039 | 47,741 | ||||||||||||
| Others | 1,809 | 210 | 9,193 | 16,069 | ||||||||||||
| 33,777 | 109,756 | 436,952 | 430,057 | |||||||||||||
| Current | 33,777 | 105,134 | 325,096 | 374,991 | ||||||||||||
| Non-current | - | 4,622 | 111,856 | 55,066 | ||||||||||||
29
COSAN S.A. INDÚSTRIA E COMÉRCIO
Notes to the consolidated financial statement
Years ended March 31, 2012 and 2011
(In thousands of Reais, except otherwise stated)
| 9. | Related Parties |
| a) | Summary of the main balances and transactions with related parties: |
| Consolidated | ||||||||
| 2012 | 2011 | |||||||
| Current Assets | ||||||||
| Shell (i) | 626,783 | - | ||||||
| Raízen Energia (ii) | 20,731 | - | ||||||
| Grupo Rezende Barbosa (iii) | 9,469 | 7,298 | ||||||
| Vertical UK LLP (iv) | 540 | 6,430 | ||||||
| Vertical UK LLP (iv) | 14,242 | - | ||||||
| Others | 6,609 | 941 | ||||||
| Total Current asset | 678,374 | 14,669 | ||||||
| Non Current Assets | ||||||||
| Shell (i) | 335,317 | - | ||||||
| Raízen Energia (ii) | 214,885 | - | ||||||
| Raízen Combustíveis (ii) | 87,811 | - | ||||||
| Group Rezende Barbosa (iii) | 105,751 | 91,954 | ||||||
| Others | 9,389 | - | ||||||
| Total Non-current asset | 753,153 | 91,954 | ||||||
| Non-Current Liabilities | ||||||||
| Raízen Energia (ii) | 76,257 | - | ||||||
| Group Rezende Barbosa (iii) | 12,577 | 37,664 | ||||||
| Shell (i) | 83,064 | - | ||||||
| Raízen Combustíveis (ii) | 321 | - | ||||||
| Others | 2,811 | 3,499 | ||||||
| Total current liabilities | 175,030 | 41,163 | ||||||
| Current Liabilities | ||||||||
| Shell (i) | 379,626 | - | ||||||
| Raízen Energia (ii) | 6,387 | - | ||||||
| Others | 3,705 | 4,444 | ||||||
| Total Non-current liabilities | 389,718 | 4,444 | ||||||
30
COSAN S.A. INDÚSTRIA E COMÉRCIO
Notes to the consolidated financial statement
Years ended March 31, 2012 and 2011
(In thousands of Reais, except otherwise stated)
| Sales of products/services | ||||||||
| Vertical UK LLP | 75,338 | 160,202 | ||||||
| Others | 441 | 39,963 | ||||||
| 75,779 | 200,165 | |||||||
| Purchase of goods/inputs | ||||||||
| Grupo Rezende Barbosa | 263,859 | 352,195 | ||||||
| Vertical UK LLP | 113,518 | - | ||||||
| Shell Western Supply and Trading | 7,032 | - | ||||||
| 384,409 | 352,195 | |||||||
| Land lease | ||||||||
| Aguassanta | 17,577 | 26,459 | ||||||
| Radar | 22,532 | 28,446 | ||||||
| 40,109 | 54,905 | |||||||
| Financial income / (expense) | ||||||||
| Grupo Rezende Barbosa | 2,502 | 233 | ||||||
| Shell Brasil Holding B.V. | 148,733 | - | ||||||
| Others | 242 | 512 | ||||||
| 151,477 | 745 | |||||||
| (i) | Shell |
Shell Holdings B.V. and its subsidiaries ("Shell") are related parties of Raizen Energia and Raízen Combustíveis, therefore, the transactions between Shell and these entities were treated by the Company as related party transactions and all balances disclosed are 50% proportionally consolidated.
The short-term receivable is mainly comprised of (i) capital contribution receivable from Raízen Energia amounting R$ 489,856, (ii) and other receivables totaling R$ 136,927, represented by other reimbursements resulting from the formation of JVs.
The long-term receivables are represented mainly by (i) reimbursement of provisions existing at the legal entity contributed by Shell related to the contingencies in the amount of R$ 244,046, and (ii) a financial asset equivalent to the investment that Shell has in Iogen, valued at fair value, and that will be contributed to Raizen Energia in the amount of R$ 86,535.
The short term payable comprises mainly reimbursement tax credits of the legal entity contributed by Shell in the amount of R$ 77,631.
The long term payable refers to (i) reimbursement of judicial deposits in the legal entity contributed by Shell, which will be refunded when redeemed, in the amount of R$ 130,883, and (ii) reimbursement of tax credits of the legal entity contributed by Shell in the amount of R$ 248,743.
| (ii) | Raízen Energia and Raízen Combustível |
The balances with Raízen Energia and Raízen Combustível are consolidated proportionally at 50% considering the elimination of the portion related to the Company.
31
COSAN S.A. INDÚSTRIA E COMÉRCIO
Notes to the consolidated financial statement
Years ended March 31, 2012 and 2011
(In thousands of Reais, except otherwise stated)
The balances in current assets in the amount of R$ 20,731 and R$ 14,242 in Raízen Energia and Raízen Combustíveis, respectively, represent receivables of (i) transportation and sugar elevation services provided by Rumo, (ii) sale of land by CLE and (iii) leased land.
Non-current assets receivable from Raízen Energia and Raízen Combustíveis represent, basically, tax credits which will be reimbursed to the Company when effectively realized by the JVs.
The balance of R$ 76,257 recorded as current liabilities in Raízen Energia represents, mainly, payables related sugar purchased by the Cosan Alimentos segment and other reimbursable obligations due to the formation of JVs.
| (iii) | Rezende Barbosa |
The Company has receivables from Rezende Barbosa which are guaranteed by shares issued by Cosan.
The jointly-controlled entity "Raízen Energia" has long-term agreement with Group Rezende Barbosa to supply sugar-cane. The prices paid are based on the ATR prices published by CONSECANA.
| (iv) | Vertical UK LLP |
The Company sells and buys ethanol from Vertical UK LLP (“Vertical”) in the normal course of business. Vertical is a Trading Company headquartered in Switzerland for which we have indirectly a 50% non-controlling interests.
| (v) | Aguassanta |
The jointly-controlled entity Raízen Energia has land leased from entities controlled by Group Aguassanta (“Aguassanta”),a group of entities under common control, being Mr. Rubens Ometto de Silveira de Mello the ultimate controlling shareholder. The lease costs are paid considering the ATR price published by CONSECANA and contracts having terms expiring between 2026 and 2027.
| (vi) | Radar |
The jointly-controlled entity Raízen Energia has leased land from Radar Propriedades Agrícolas S.A. (“Radar”), an associate. These rental costs are paid considering the price published by the ATR CONSECANA and most contracts have terms that expire in 2027.
| b) | Officers and directors compensation |
The fixed and variable compensation of key people, including directors and board members are recorded, as follows:
32
COSAN S.A. INDÚSTRIA E COMÉRCIO
Notes to the consolidated financial statement
Years ended March 31, 2012 and 2011
(In thousands of Reais, except otherwise stated)
| 2012(*) | 2011 | |||||||
| Regular compensation | 23,009 | 7,894 | ||||||
| Stock option expense | 10,800 | 2,961 | ||||||
| Bonuses and other variable compensation | 32,563 | 23,791 | ||||||
| Total compensation recorded as expense | 66,372 | 34,646 |
(*)Including the compensation of the key people of the jointly-controlled entities / JVs
At Cosan S.A.´s shareholder’ meeting held on July 29, 2011, a new stock compensation plan was approved, which until March 31, 2012 had granted 9,825,000 options (Note 28).
| 10. | Business combinations and acquisitions of non-controlling shareholders |
| a. | Sugar Retail Business |
The Company contributed its retail sugar business to Raizen Energia upon JV formation. On July 1, 2011, the Company re-acquired this business in exchange for R$145,860 in cash consideration, and R$22,568 in contingent consideration. The net assets of the retail sugar business approximate their carrying value prior to the formation of the JV.
| b. | Logispot Armazéns Gerais S.A. (‘Logispot”) |
On March 14, 2011, Cosan, through its indirect subsidiary Rumo Logística S.A., purchased 874,226 common shares of Logispot, totaling R$ 48,888 cash which increased its participation in the common shares of Logispot from 14.28% to 51.00%, With this acquisition, Rumo acquired the control of Logispot.
Logispot is located in the city of Sumaré and is an important link between plants in the state of São Paulo and Santos Port. The terminal is accessed by all railroads that cross the state of São Paulo and is beside the Anhanguera, Bandeirantes and Dom Pedro highways. The site has a static capacity of 400,000 tons, a structure to receive and send both through roads, as well as by rail, but the potential to carry a composition of 120 railcars of 90 tons per day (unaudited information).
The fair value at the acquisition date of the consideration transferred totaled R$ 68,880, which consisted of the following:
| Cash | 48,888 | |||
| Fair value of 14.28% of Cosan in Logispot immediately before the Business combination | 19,992 | |||
| Total | 68,880 |
The estimated fair value of assets acquired and liabilities assumed at the date of acquisition of Logispot were as follows:
33
COSAN S.A. INDÚSTRIA E COMÉRCIO
Notes to the consolidated financial statement
Years ended March 31, 2012 and 2011
(In thousands of Reais, except otherwise stated)
| Description | ||||
| Trade accounts receivable | 1,297 | |||
| Others assets | 677 | |||
| Property, plant and equipment | 114,184 | |||
| Loans and financing | (13,391 | ) | ||
| Deferred income and social contribution taxes | (28,879 | ) | ||
| Others liabilities | (13,551 | ) | ||
| Non-controlling interest (1) | (30,120 | ) | ||
| Net assets acquired | 30,217 | |||
| Consideration transferred, net of cash acquired | 67,745 | |||
| Goodwill | 37,528 | |||
The purchase price allocation was completed by the Management, and based on the fair value of assets acquired and liabilities assumed and goodwill of the operation was allocated the segment Rumo.
The Company obtained an independent evaluation of its fixed assets, intangible assets and interests of noncontrolling shareholders. The allocation of the initial purchase price was adjusted primarily as a result of improvements in the Company's assumptions related to fixed assets and intangible. As a result of these changes, the goodwill, as described above, was modified as follows:
| goodwill preliminary | 2,370 | |||
| Adjustments on the fair value of the P,P&E | 104,454 | |||
| Deferred income tax | (35,515) | |||
| Interests of non-controlling shareholders | (33,781) | |||
| Goodwill | 37,528 |
| c. | Cosan Araraquara Açúcar e Álcool Ltda. (“Usina Zanin”) |
On February 18, 2011, the jointly-controlled entity Raízen Energia (formerly known as Cosan AA) acquired 100% of the share capital of Usina Zanin for a total amount of $ 90,000.
The provisional allocation of the purchase price on March 31, 2011 appointed a goodwill of R$69,402. As the evaluation report of assets and liabilities performed by independent research company, issued in May 2012, the final goodwill determined in the acquisition totaled R $ 98,000 due to revision of gains from certain assets, property and equipment and the cancellation of the project greenfield (Usina da Prata).
The estimated fair value of assets acquired and liabilities assumed at date of acquisition of Usina Zanin, was as follows:
| Description | ||||
| Inventories | 3,813 | |||
| Biological assets | 83,890 | |||
| Property, plant and equipment | 223,893 | |||
| Intangible assets | 10 | |||
| Loans and Long-term debt | (278,511 | ) | ||
| Provision for judicial demands | (23,008 | ) | ||
| Deferred income and social contribution taxes | 29,921 | |||
| Others liabilities | (49,081 | ) | ||
| Net assets acquired | (9,073 | ) | ||
| Consideration transferred, net of cash acquired | 88,927 | |||
| Goodwill | 98,000 | |||
34
COSAN S.A. INDÚSTRIA E COMÉRCIO
Notes to the consolidated financial statement
Years ended March 31, 2012 and 2011
(In thousands of Reais, except otherwise stated)
The purchase price allocation was concluded by the Management, and based on the fair value of acquired assets and liabilities assumed. Zanin was subsequently contributed to Raizen Energia upon the formation of JV.
The Company obtained an independent evaluation of its fixed assets, intangible assets and interests of minority shareholders. The allocation of the initial purchase price was adjusted primarily as a result of improvements in the Company's assumptions relating to fixed and intangible assets. As a result of these changes, the goodwill, as described above, was modified as follows:
| Preliminary goodwill | 69,402 | |||
| Fair value adjustments of fixed assets and biological assets | 36,805 | |||
| Other fair value adjustments | 6,524 | |||
| Deferred income tax | (14,731 | ) | ||
| Goodwill | 98,000 |
The Usina Zanin was contributed to Raízen Energia in the formation of JV and the business combination is registered in that jointly controlled.
| d. | Additional information (unaudited) |
If the entity acquired during 2012 had been included in the income statement since the beginning of the year the impacts on the revenue would be irrelevant
35
COSAN S.A. INDÚSTRIA E COMÉRCIO
Notes to the consolidated financial statement
Years ended March 31, 2012 and 2011
(In thousands of Reais, except otherwise stated)
| 11. | Equity method investments |
| a) | Parent company |
| Investments | Equity income of associates | |||||||||||||||||||||||||||
| Subsidiaries and jointly-controlled entities | Number of shares of the invested | Number of shares / shares the investor | Percentage of interest | 2012 | 2011 | 2012 | 2011 | |||||||||||||||||||||
| Administração de Participações Aguassanta S.A. | 4 | 3 | 91.50 | % | 158,685 | 138,193 | 8,026 | 7,475 | ||||||||||||||||||||
| Copsapar Participações S.A. | 190,797,424 | 171,717,680 | 90.00 | % | 540,044 | 498,102 | 52,684 | 57,430 | ||||||||||||||||||||
| Cosan Cayman Limited | - | - | - | - | 376,311 | (18,159 | ) | (398 | ) | |||||||||||||||||||
| Cosan Cayman Finance Limited | 1 | 1 | 100.00 | % | 735,147 | 651,480 | 121,425 | (690 | ) | |||||||||||||||||||
| Cosan Cayman II Limited | 451 | 232 | 51.44 | % | 1,081 | - | 86,896 | - | ||||||||||||||||||||
| Cosan Distribuidora de Combustíveis S.A. | - | - | - | - | - | 2,247,978 | - | |||||||||||||||||||||
| Cosan Finance Limited | 1 | 1 | 100.00 | % | - | 17,489 | - | (4,171 | ) | |||||||||||||||||||
| Cosan International Universal Corporation | 2 | 2 | 100.00 | % | - | 1,304 | - | 761 | ||||||||||||||||||||
| Cosan Lubrificantes e Especialidades S.A. | 431,480 | 431,474 | 100.00 | % | 1,103,810 | 1,933,302 | 76,202 | 114,240 | ||||||||||||||||||||
| Handson Participações S.A | 85,860,500 | 85,860,500 | 100.00 | % | 150,108 | - | 64,247 | - | ||||||||||||||||||||
| Novo Rumo Logística S.A. | 278,336,920 | 198,120,217 | 28.82 | % | 242,670 | 223,006 | 24,494 | 25,836 | ||||||||||||||||||||
| Proud Participações S.A. | 53,236,531 | 53,236,528 | 100.00 | % | 210,683 | 53,236 | 8,600 | - | ||||||||||||||||||||
| Raízen Combustíveis S.A. | 3,009,400,941 | 1,504,700,471 | 50.00 | % | 4,666,904 | - | 141,653 | - | ||||||||||||||||||||
| Raízen Energia Participações S.A. | 1,068,073,826 | 534,036,913 | 50.00 | % | 3,522,684 | - | 59,266 | - | ||||||||||||||||||||
| Raízen Energia S.A. | - | - | - | - | 2,946,111 | 235,058 | 203,197 | |||||||||||||||||||||
| Raízen S.A. Bioenergia | - | - | - | - | 152,929 | - | 13,873 | |||||||||||||||||||||
| Raízen Tarumã S.A. | - | - | - | - | 959,665 | - | 77,091 | |||||||||||||||||||||
| TEAS - Terminal Exportador de Álcool de Santos S.A. | - | - | - | - | 40,088 | - | 967 | |||||||||||||||||||||
| Others | - | - | - | 24,271 | 8,872 | 14,345 | 8,872 | |||||||||||||||||||||
| Associated | ||||||||||||||||||||||||||||
| Radar Propriedades Agrícolas S.A. | 21,148,989 | 4,001,167 | 18.92 | % | 283,259 | 260,757 | 22,514 | 28,658 | ||||||||||||||||||||
| Other investments | - | - | - | 20,943 | 29,343 | 9,617 | (32,719 | ) | ||||||||||||||||||||
| 11,660,289 | 8,290,188 | 3,154,846 | 500,422 | |||||||||||||||||||||||||
| Changes in participation in direct and indirect subsidiaries | ||||||||||||||||||||||||||||
Changes on Investments:
| March 31, 2011 | 8,290,188 | |||
| Equity | 3,154,846 | |||
| Addition to investments | 43,147 | |||
| Addition from JVs formation | 463,296 | |||
| Dividends declared and interest on capital in subsidiary and jointly controlled entity (*) | (281,195 | ) | ||
| Others | (9,993 | ) | ||
| March 31, 2012 | 11,660,289 |
(*) There was a payment of R$64,845 million in this period.
36
COSAN S.A. INDÚSTRIA E COMÉRCIO
Notes to the consolidated financial statement
Years ended March 31, 2012 and 2011
(In thousands of Reais, except otherwise stated)
| b) | Consolidated |
| Investments | Equity | |||||||||||||||||||||||||||
| Number of shares of the invested | Number of shares / shares the investor | Percentage of interest | 2012 | 2011 | 2012 | 2011 | ||||||||||||||||||||||
| Radar Propriedades Agrícolas S.A. | 21,148,989 | 4,001,167 | 18.92 | % | 283,259 | 260,756 | 22,514 | 28,658 | ||||||||||||||||||||
| Codexis Inc | 35,965,000 | 5,573,000 | 15.50 | % | 49,866 | - | (1,086 | ) | - | |||||||||||||||||||
| Logum Logística S.A. ("Logum") | 430,556,443 | 86,111,288 | 20.00 | % | 25,731 | 18,300 | (4,796 | ) | - | |||||||||||||||||||
| Other Investments | 60,173 | 25,086 | 16,636 | (3,471 | ) | |||||||||||||||||||||||
| 419,029 | 304,142 | 33,268 | 25,187 | |||||||||||||||||||||||||
| Changes on Investments | ||||
| March 31, 2010 | 260,814 | |||
| Equity | 25,187 | |||
| Addition to investments | 37,929 | |||
| Change to subsidiary | (20,015 | ) | ||
| Other | 227 | |||
| March 31, 2011 | 304,142 | |||
| Equity | 33,268 | |||
| Income from the formation of JV | 38,114 | |||
| Addition to investments | 42,328 | |||
| Other | 1,177 | |||
| March 31, 2012 | 419,029 | |||
| March 31, 2012 | ||||||||||||||||
| Asset | Liabilities | Equity | Result | |||||||||||||
| Radar Propriedades Agrícolas S.A. | 1,685,618 | 188,392 | 1,497,226 | 162,544 | ||||||||||||
| Codexis | 247,663 | 60,552 | 187,111 | (2,138 | ) | |||||||||||
| Logum | 741,782 | 484,471 | 257,311 | (28,670 | ) | |||||||||||
| March 31, 2011 | ||||||||||||||||
| Asset | Liabilities | Equity | Result | |||||||||||||
| Radar Propriedades Agrícolas S.A. | 1,804,609 | 426,355 | 1,378,254 | 151,421 | ||||||||||||
| Logum | 101,982 | 8,343 | 93,639 | (4,829 | ) | |||||||||||
37
COSAN S.A. INDÚSTRIA E COMÉRCIO
Notes to the consolidated financial statement
Years ended March 31, 2012 and 2011
(In thousands of Reais, except otherwise stated)
| 12. | Biological assets |
Changes in biological assets (sugarcane plants) are described below:
| Balances at March 31, 2010 | 371,102 | 963,244 | ||||||
| Change in fair value | 145,428 | 381,894 | ||||||
| Increase due to planting and growing costs | 253,535 | 745,572 | ||||||
| Harvested cane transferred to inventory | 237,925 | (616,693 | ) | |||||
| Increase resulting from business combination | - | 87,115 | ||||||
| March 31, 2011 | 1,007,990 | 1,561,132 | ||||||
| Asset contribution from subsidiaries | 532.140 | - | ||||||
| Change in the fair value | (523.140 | ) | - | |||||
| Changes in fair value less estimated cost to sell | 60,093 | |||||||
| Increase due to planting and growing costs | 551,974 | |||||||
| Harvested cane transferred to inventory (a) | (401,592 | ) | ||||||
| Proportional consolidation impact due to the formation of JVs (50%) (b) | (803,584 | ) | ||||||
| March 31, 2012 | - | 968,023 |
| (a) | R$19,047 of this amount was allocated in sugar and ethanol inventory as of march, 31 2012. |
| (b) | The Company has reflected this rollforward activity as “net” adjustment. This net adjustment would actually represent the de-consolidation of 100% of the biological assets of subsidiaries de-recognized, and the addition of 50% of the fair value of the biological assets of the JV’s then proportionally consolidated. |
Sugarcane plants
Areas cultivated represent only sugarcane, without considering the land where these crops are found. The following assumptions were used to determine fair value using the discounted cash flow:
| 2012 | 2011 | |||||||
| Crop area (hectares) (1) | 382,798 | 340,386 | ||||||
| Expect productivity (tons of cane per hectare) | 78.20 | 84.74 | ||||||
| Total amount of recoverable sugar – ATR (kg) | 137.27 | 138.54 | ||||||
| Price kg ATR projected average (R$/kg) | 0.4881 | 0.4228 | ||||||
| (1) | The balances of biological assets are consolidated proportionally by 50% in the Company. |
Sugar production depends on the volume and sucrose content of sugarcane grown or supplied by farmers located near the plants. The yield of the crop and the sucrose content in sugarcane mainly depend on weather conditions such as rainfall rate and temperature, which may vary and fluctuate.
Historically, weather conditions have caused volatility in ethanol and sugar production, and consequently in our operating results because it cause damage to the annual harvest. Future climate conditions may reduce the amount of sugar and sugarcane that the Company will obtain in a particular season or in the sucrose content of sugarcane. Additionally, the Company’s business is subject to seasonality according to the growth cycle of sugarcane in the south-central region of Brazil. The period of annual harvest of sugarcane in South-Central region of Brazil begins in April / May and ends in November / December. This creates variations in stock, usually high in November to cover sales between crop (i.e. from December to April) and a degree of seasonality in gross profit from sales of
38
COSAN S.A. INDÚSTRIA E COMÉRCIO
Notes to the consolidated financial statement
Years ended March 31, 2012 and 2011
(In thousands of Reais, except otherwise stated)
ethanol and sugar significantly lower in the last quarter of fiscal year. The seasonality and any reduction in the volume of sugar recovered could have a material adverse effect on our operating results and financial condition.
39
COSAN S.A. INDÚSTRIA E COMÉRCIO
Notes to the consolidated financial statement
Years ended March 31, 2012 and 2011
(In thousands of Reais, except otherwise stated)
| 13. | Property, plant and equipment |
| Parent Company | ||||||||||||||||||||||||
| Costs: | March 31, 2011 | Additions | Write-offs | Transfers | Capital Addition on subsidiaries | March 31, 2012 | ||||||||||||||||||
| Land and Rural Properties | 240,330 | - | - | - | (239,104 | ) | 1,226 | |||||||||||||||||
| Buildings and Improvements | 181,081 | - | - | 898 | (172,902 | ) | 9,077 | |||||||||||||||||
| Machinery, Equipment and Facilities | 653,655 | 2 | - | 16,397 | (665,349 | ) | 4,705 | |||||||||||||||||
| Airplanes | 13,395 | - | - | - | - | 13,395 | ||||||||||||||||||
| Vessels and Vehicles | 110,966 | - | (206 | ) | - | (110,760 | ) | - | ||||||||||||||||
| Furniture and Fixtures and Computer Equipment | 40,008 | 15 | - | 2,478 | (39,764 | ) | 2,737 | |||||||||||||||||
| Construction in progress | 200,830 | 5,520 | - | (19,856 | ) | (180,992 | ) | 5,502 | ||||||||||||||||
| Other | 234,356 | - | - | - | (234,356 | ) | - | |||||||||||||||||
| Total | 1,674,621 | 5,537 | (206 | ) | (83 | ) | (1,643,227 | ) | 36,642 | |||||||||||||||
| Depreciation: | ||||||||||||||||||||||||
| Land and Rural Properties | (36,000 | ) | (328 | ) | - | - | 35,697 | (631 | ) | |||||||||||||||
| Buildings and Improvements | (315,771 | ) | (285 | ) | - | - | 315,142 | (914 | ) | |||||||||||||||
| Machinery, Equipment and Facilities | (13,395 | ) | - | - | - | - | (13,395 | ) | ||||||||||||||||
| Airplanes | (46,639 | ) | (7 | ) | 159 | - | 46,487 | - | ||||||||||||||||
| Vessels and Vehicles | (19,235 | ) | (49 | ) | - | - | 19,136 | (148 | ) | |||||||||||||||
| Other | (66,283 | ) | - | - | - | 66,283 | - | |||||||||||||||||
| Total | (497,323 | ) | (669 | ) | 159 | - | 482,745 | (15,088 | ) | |||||||||||||||
| 1,177,298 | 4,868 | (47 | ) | (83 | ) | (1,160,481 | ) | 21,554 | ||||||||||||||||
40
COSAN S.A. INDÚSTRIA E COMÉRCIO
Notes to the consolidated financial statement
Years ended March 31, 2012 and 2011
(In thousands of Reais, except otherwise stated)
| Consolidated | ||||||||||||||||||||||||||||
Costs: | March 31, 2011 | Additions | Write-offs | Transfers | De-consolidation and JVs formation, net (a) | Business Combination | March 31, 2012 | |||||||||||||||||||||
| Land and Rural Properties | 1,263,240 | - | (40,011 | ) | 15,965 | 384,561 | (53,266 | ) | 1,570,489 | |||||||||||||||||||
| Buildings and Improvements | 1,122,256 | 4,764 | (24,559 | ) | 89,661 | (153,107 | ) | 30,899 | 1,069,914 | |||||||||||||||||||
| Machinery, Equipment and Facilities | 4,980,432 | 49,056 | (30,209 | ) | 330,325 | (69,256 | ) | 14,197 | 5,274,545 | |||||||||||||||||||
| Airplanes | 30,903 | 4,839 | (4,691 | ) | - | - | - | 31,051 | ||||||||||||||||||||
| Wagons and locomotives | 341,647 | - | - | 50,000 | - | - | 391,647 | |||||||||||||||||||||
| Vessels and Vehicles | 323,042 | 3,046 | (6,758 | ) | 10,312 | (26,703 | ) | 167 | 303,106 | |||||||||||||||||||
| Furniture and Fixtures and Computer Equipment | 137,206 | 520 | (21,012 | ) | 16,114 | (8,869 | ) | 1,308 | 125,267 | |||||||||||||||||||
| Construction in progress | 1,367,712 | 980,855 | (6,022 | ) | (782,761 | ) | (888,103 | ) | 3,319 | 675,000 | ||||||||||||||||||
| Repair and maintenance in machine and equipment | 1,043,342 | 362,511 | (747,891 | ) | - | (394,513 | ) | - | 263,449 | |||||||||||||||||||
| Others | 4,782 | 13,077 | (17,715 | ) | 796 | 156,568 | - | 157,508 | ||||||||||||||||||||
| Total | 10,614,562 | 1,418,668 | (898,868 | ) | (269,588 | ) | (999,422 | ) | (3,376 | ) | 9,861,976 | |||||||||||||||||
| Depreciation: | ||||||||||||||||||||||||||||
| Buildings and Improvements | (287,620 | ) | (43,716 | ) | 11,539 | - | 59,344 | (2,457 | ) | (262,910 | ) | |||||||||||||||||
| Machinery, Equipment and Facilities | (1,472,512 | ) | (288,990 | ) | 19,506 | 14,968 | 346,824 | (8,508 | ) | (1,388,712 | ) | |||||||||||||||||
| Airplanes | (15,195 | ) | (1,839 | ) | 860 | - | - | - | (16,174 | ) | ||||||||||||||||||
| Wagons and locomotives | (6,128 | ) | (12,269 | ) | - | - | - | - | (18,397 | ) | ||||||||||||||||||
| Vessels and Vehicles | (150,146 | ) | (24,667 | ) | 4,750 | - | 47,416 | (114 | ) | (122,761 | ) | |||||||||||||||||
| Furniture and Fixtures and Computer Equipment | (87,460 | ) | (11,297 | ) | 18,750 | - | (559 | ) | (736 | ) | (81,302 | ) | ||||||||||||||||
| Repair and maintenance in machine and equipment | (611,859 | ) | (303,082 | ) | 747,891 | - | 167,050 | - | - | |||||||||||||||||||
| Others | (3,118 | ) | (6,942 | ) | 9,297 | - | (103,994 | ) | - | (104,757 | ) | |||||||||||||||||
| Total | (2,634,038 | ) | (692,802 | ) | 812,593 | 14,968 | 516,081 | (11,815 | ) | (1,995,013 | ) | |||||||||||||||||
| 7,980,524 | 725,866 | (86,275 | ) | (254,620 | ) | (483,341 | ) | (15,191 | ) | 7,866,963 | ||||||||||||||||||
| (a) | The Company has reflected this rollforward activity as “net” adjustment. This net adjustment would actually represent the de-consolidation of 100% of the P,P&E of subsidiaries de-recognized, and the addition of 50% of the P,P&E of the JV’s then proportionally consolidated. |
41
COSAN S.A. INDÚSTRIA E COMÉRCIO
Notes to the consolidated financial statement
Years ended March 31, 2012 and 2011
(In thousands of Reais, except otherwise stated)
Capitalization of borrowing costs
During the year ended March 31, 2012, borrowing costs capitalized amounted to R$ 71,661 (R$ 70,543 during the year ended March 31, 2011). The weighted average interest rate, used for capitalization of interest on the balance of construction in progress, was 8.60% per year at 2012 (9.13% per year during the year ended March 31, 2011).
42
COSAN S.A. INDÚSTRIA E COMÉRCIO
Notes to the consolidated financial statement
Years ended March 31, 2012 and 2011
(In thousands of Reais, except otherwise stated)
| 14. | Intangible assets |
| Parent Company | ||||||||||||||||||||||||
| Costs | March 31, 2011 | Additions | Write-off | Transfers | Capital Increase in Subsidiaries | March 31, 2012 | ||||||||||||||||||
| Software | 50,182 | - | - | 83 | (50,182 | ) | 83 | |||||||||||||||||
| Trademarks | - | - | - | - | 85,354 | 85,354 | ||||||||||||||||||
| Goodwill | 332,239 | - | (193,633 | ) | - | (138,606 | ) | - | ||||||||||||||||
Others | 17,603 | - | (17,603 | ) | - | |||||||||||||||||||
| Total | 400,024 | - | (193,633 | ) | 83 | (121,037 | ) | 85,437 | ||||||||||||||||
| Amortization | ||||||||||||||||||||||||
| Software | (32,809 | ) | (2 | ) | - | - | 32,809 | (2 | ) | |||||||||||||||
| Trademarks | (1,768 | ) | (1,768 | ) | ||||||||||||||||||||
Others | (744 | ) | (643 | ) | 1,387 | - | ||||||||||||||||||
| Total | (33,553 | ) | (2,413 | ) | - | - | 34,196 | (1,770 | ) | |||||||||||||||
| 366,471 | (2,413 | ) | (193,633 | ) | 83 | (86,841 | ) | 83,667 | ||||||||||||||||
Consolidated | ||||||||||||||||||||||||||||
| Costs | March 31, 2011 | Additions | Write-off | Transfers | De-consolidated and JV’s formation, net (a) | Business Combination | March 31, 2012 | |||||||||||||||||||||
| Software license | 98,063 | 849 | (20 | ) | 14,954 | (6,992 | ) | 116 | 106,970 | |||||||||||||||||||
| Trademarks | 429,671 | - | (11,286 | ) | - | 190,026 | - | 608,411 | ||||||||||||||||||||
| Goodwill | 2,253,320 | - | (193,633 | ) | - | 836,601 | 35,967 | 2,932,255 | ||||||||||||||||||||
| Customer base | 583,420 | 23,437 | - | 8,857 | 269,666 | - | 885,380 | |||||||||||||||||||||
| Leases | 155,505 | - | (232 | ) | - | (75,354 | ) | - | 79,919 | |||||||||||||||||||
Distribution rights (g) | 170,291 | 129,340 | - | 9,381 | 142,359 | - | 451,371 | |||||||||||||||||||||
| Improvement made in public concessions | - | - | - | 236,396 | - | - | 236,396 | |||||||||||||||||||||
| Others | 43,263 | 12,249 | (8,649 | ) | - | 75,208 | - | 122,071 | ||||||||||||||||||||
| Total | 3,733,533 | 165,875 | (213,820 | ) | 269,588 | 1,431,514 | 36,083 | 5,422,773 | ||||||||||||||||||||
| Amortization | ||||||||||||||||||||||||||||
| Software license | (66,111 | ) | (8,508 | ) | 20 | - | (10,357 | ) | (99 | ) | (85,055 | ) | ||||||||||||||||
| Trademarks | (98,710 | ) | (44,579 | ) | - | - | 32,858 | - | (110,431 | ) | ||||||||||||||||||
| Customer base | (41,038 | ) | (46,904 | ) | - | - | 21,796 | - | (66,146 | ) | ||||||||||||||||||
| Leases | (15,118 | ) | (3,792 | ) | 232 | - | 6,026 | - | (12,652 | ) | ||||||||||||||||||
Distribution rights (g) | (62,387 | ) | (36,627 | ) | - | - | (34,641 | ) | - | (133,655 | ) | |||||||||||||||||
| Improvement made in public concessions | - | - | - | (14,968 | ) | - | - | (14,968 | ) | |||||||||||||||||||
| Others | (4,495 | ) | (13,945 | ) | (222 | ) | - | (48,949 | ) | - | (67,611 | ) | ||||||||||||||||
| Total | (287,859 | ) | (154,355 | ) | 30 | (14,968 | ) | (33,267 | ) | (99 | ) | (490,518 | ) | |||||||||||||||
| 3,445,674 | 11,520 | (213,790 | ) | 254,620 | 1,398,247 | 35,984 | 4,932,255 | |||||||||||||||||||||
43
COSAN S.A. INDÚSTRIA E COMÉRCIO
Notes to the consolidated financial statement
Years ended March 31, 2012 and 2011
(In thousands of Reais, except otherwise stated)
| (a) | The Company has reflected this rollforward activity as “net” adjustment. This net adjustment would actually represent the de-consolidation of 100% of the intangibles assets of subsidiaries de-recognized, and the addition of 50% of the intangibles assets of the JV’s then proportionally consolidated. |
| Intangible asset (except goodwill) | Annual Amortization rate % | 2012 | 2011 | ||||||||
| Software | 20.00 | % | 21,915 | 31,952 | |||||||
| Trademarks Fuel Distributors (a) | 20.00 | % | 260,313 | 68,696 | |||||||
| Trademark Mobil (b) | 10.00 | % | 154,082 | 176,911 | |||||||
| Trademark União (c) | 2.00 | % | 83,585 | 85,354 | |||||||
| Customer base (d) | 3.00 | % | 535,405 | 247,907 | |||||||
| Operation license and customer base (e) | 4.00 | % | 283,829 | 294,475 | |||||||
| Favorable operating leases (f) | 6.00 | % | 67,267 | 140,387 | |||||||
| Distribution rights (g) | Straight line over contract term | 317,716 | 107,904 | ||||||||
| Improvement in public concessions (h) | 221,439 | - | |||||||||
Others | 54,460 | 38,768 | |||||||||
| Total | 2,000,000 | 1,192,354 | |||||||||
| (a) | Refers to the right to use the trademark of fuel distribution through its joint venture Raízen Combustíveis. |
| (b) | Refers to the right to use the trademark of Mobil lubricants. |
| (c) | Refers to the right to use the trademark sugar União arising from business combination. |
| (d) | Refers to the relationship between Raízen Combustíveis and the gas station that maintain its flags and customer base acquired through business combination. |
| (e) | Refers to the customer base of Teacu acquired in its business combination |
| (f) | Refers to favorable lease contracts arising from the acquisition of Curupay |
| (g) | Intangible assets related to contracts with customers exclusively supply products to brand loyalty. |
| (h) | Refers to the improvements made on railroads operated by ALL (America Latina Logistica) in connection with a transportation agreement with Rumo. |
Impairment testing of goodwill
For the purpose of impairment testing, goodwill is allocated to the operating segments of the Company, at which goodwill is monitored for purposes of internal administration, not above the Company's operating segments. Goodwill acquired through business combinations and those arising from the formation of the Joint Venture were allocated to four cash-generating units, which are also operating segments that provide information, as shown below:
| Consolidated | ||||||||
| Carrying amount of goodwill | 2012 | 2011 | ||||||
| Cash-generating unit Raízen Energia | 1,405,407 | 1,433,982 | ||||||
| Cash-generating unit Raízen Combustíveis | 855,907 | 184,415 | ||||||
| Cash-generating unit Rumo | 98,972 | 63,814 | ||||||
| Cash-generating unit Cosan - Other Business | 571,969 | 571,109 | ||||||
| Total Goodwill | 2,932,255 | 2,253,320 | ||||||
As defined in the accounting policy described in note 2.3, the Company tests annually the recoverable amount of goodwill.
44
COSAN S.A. INDÚSTRIA E COMÉRCIO
Notes to the consolidated financial statement
Years ended March 31, 2012 and 2011
(In thousands of Reais, except otherwise stated)
Nonfinancial long term assets, not subject to amortization, are reviewed whenever there are indications that the carrying value is not recoverable.
The Company uses the value in use method to determine the recoverable amount of the asset. The value in use method is based on the projection of the expected cash flows of cash-generating units. In connection with the application of the value in use method, the key assumptions are sales prices of all commodities, operating costs, capital investment and discount rates.
Management determines its cash flows based on its annual budgets taking into account for each cash generating unit: (i) Raízen Energia: the expected long-term sales price of commodities, productivity of agricultural areas, the performance of total recoverable sugar (“ATR”), and related costs; (ii) Raízen Combustíveis: the expected growth in operations based on gross domestic product and other macroeconomic aspects; (iii) Rumo: expectations of the Brazilian sugar production destined designated mainly for export; (iv) Cosan other businesses, mainly in the expected growth in operations based on gross domestic product and other macroeconomic aspects, as well as expected sales price of commodities. All these cash flows are discounted at rates that reflect specific risks relating to assets relevant to each cash generating unit.
Management has not identified any impairments for its cash generating units. The determination of the recoverable amount depends on certain key assumptions as described above which are influenced by market conditions, technological and economic forces present at the time that the impairment test is undertaken and thus management cannot determine if impairment losses will occur in the future.
45
COSAN S.A. INDÚSTRIA E COMÉRCIO
Notes to the consolidated financial statement
Years ended March 31, 2012 and 2011
(In thousands of Reais, except otherwise stated)
| 15. | Loans and Long Term Debts |
| Financial Charges(1) | Parent Company | Consolidated | |||||||||||||||||||||||
| Description (1) | Index | Average annual interest rate (2) | 03.31.2012 | 03.31.2011 | 03.31.2012 | 03.31.2011 | Maturity date | ||||||||||||||||||
| Senior Notes Due 2014 | Dólar (US) | 9.5 | % | - | - | 322,654 | 576,814 | jul/14 | |||||||||||||||||
| Senior Notes Due 2017 | Dólar (US) | 7.0 | % | - | - | 368,601 | 658,954 | feb/17 | |||||||||||||||||
| BNDES | URTJLP | 2.54 | % | - | - | 683,586 | 1,308,034 | oct/25 | |||||||||||||||||
| Pre-fixed | 4.5 | % | - | - | 185,568 | 242,508 | jul/20 | ||||||||||||||||||
| UMBND | 6.59 | % | - | - | 18,365 | 38,947 | jul/19 | ||||||||||||||||||
| Dólar (US) | 6.94 | % | - | - | 11 | - | nov/12 | ||||||||||||||||||
| Bank Credit Notes | CDCA | 0.55%+CDI | - | - | - | 31,378 | dec/11 | ||||||||||||||||||
| ACC | Dólar (US) | 1.73 | % | - | 65,215 | 138,369 | 228,229 | aug/12 | |||||||||||||||||
| Perpetual Notes | Dólar (US) | 8.25 | % | - | 741,553 | 930,094 | 1,236,209 | - | |||||||||||||||||
| Resolution 2471 (PESA) | IGP-M | 3.95 | % | - | 110,361 | 316,108 | 674,392 | apr/23 | |||||||||||||||||
| Pre-fixed | 3.0 | % | - | 114 | 53 | 114 | oct/25 | ||||||||||||||||||
| Rural Credits | Pre-fixed | 6.75 | % | - | 31,168 | 20,460 | 92,352 | oct/12 | |||||||||||||||||
| Bank Debit | Dólar (US) + Libor | 2.42 | % | - | - | 410,002 | - | apr/13 | |||||||||||||||||
| IGP-M | 11 | % | - | - | 88 | - | dec/12 | ||||||||||||||||||
| Pre-fixed | 13.78 | % | - | - | 5,332 | - | mar/15 | ||||||||||||||||||
| Pre Payments | Dólar (US) + Libor | 4.27 | % | - | 244,493 | 507,454 | 736,472 | feb/16 | |||||||||||||||||
| Credit Notes | 110% CDI | - | 341,227 | 303,028 | 341,226 | 303,719 | feb/14 | ||||||||||||||||||
| Dólar (US) | 2.35 | % | - | 167,196 | 52,891 | 314,105 | feb/13 | ||||||||||||||||||
| Pre-fixed | 6.25 | % | - | - | - | 10,142 | oct/12 | ||||||||||||||||||
| Finame | Pre-fixed | 4.83 | % | - | - | 397,515 | 517,842 | jul/20 | |||||||||||||||||
| URTJLP | 2.21 | % | - | - | 337,091 | 187,336 | mar/21 | ||||||||||||||||||
| UMBND | 8.44 | % | - | - | 16 | - | oct/12 | ||||||||||||||||||
| Others | Divers | Various | - | - | - | 62,294 | Various | ||||||||||||||||||
| Expenses with issuance of shares | (3.494 | ) | (1,366 | ) | (21,407 | ) | (28,546 | ) | |||||||||||||||||
| 337,733 | 1,661,762 | 5,014,077 | 7,191,295 | ||||||||||||||||||||||
| Current | - | (110,526 | ) | (537,135 | ) | (916,400 | ) | ||||||||||||||||||
| Non-Current | 337,733 | 1,551,236 | 4,476,942 | 6,274,895 | |||||||||||||||||||||
| (1) | All loans and long-term debt are guaranteed by promissory notes and endorsements of the Company and its jointly-controlled subsidiaries and controlling shareholders, besides other guarantees, such as: i) Credit rights originated from energy contracts (BNDES); ii) CTN and land mortgages; and iii) underlying assets being financed (Finame). |
| (2) | Financial charges on March 31, 2012; |
46
COSAN S.A. INDÚSTRIA E COMÉRCIO
Notes to the consolidated financial statement
Years ended March 31, 2012 and 2011
(In thousands of Reais, except otherwise stated)
Long-term debt has the following scheduled maturities:
| Parent Company | Consolidated | |||||||||||||||
| 2012 | 2011 | 2012 | 2011 | |||||||||||||
| 13 to 24 months | 337,733 | 223,578 | 1,046,326 | 745,454 | ||||||||||||
| 25 to 36 months | - | 363,953 | 702,633 | 762,649 | ||||||||||||
| 37 to 48 months | - | 60,926 | 1,249,602 | 1,010,797 | ||||||||||||
| 49 to 60 months | - | 60,992 | 545,982 | 777,963 | ||||||||||||
| 61 to 72 months | - | 8 | 179,137 | 878,092 | ||||||||||||
| 73 to 84 months | - | 8 | 300,921 | 222,289 | ||||||||||||
| 85 to 96 months | - | 19,443 | 220,893 | 453,711 | ||||||||||||
| Thereafter | - | 822,328 | 231,448 | 1,423,940 | ||||||||||||
| 337,733 | 1,551,236 | 4,476,942 | 6,274,895 | |||||||||||||
PESA - Resolution 2471- Special Agricultural Financing Program (Programa Especial de Saneamento de Ativos), or PESA
From 1998 to 2000, the Company and current the jointly-controlled Raízen Energia renegotiated their debts related to financing for agricultural costs with several financial institutions, reducing it to annual interest rates below 10%, ensuring the repayment of debt’s principal with assignment and transfer of Treasury Certificates, redeemable at the debt clearing, using the incentives promoted by Central Bank resolution No. 2471 of February 26, 1998. That debt is self-cleared by CTN, as mentioned in explanatory note 5.
Senior Notes Maturating on 2014
On August 4, 2009, the indirect subsidiary CCL Finance Limited issued Senior Notes in the international market in accordance with “Regulation S” and “Rule 144A” in the amount of US$350 million, which are subject to interest of 9.5% per year, payable semiannually in February and August each year, beginning in February 2010.
Senior Notes Maturating on 2017
On January 26, 2007, the wholly-owned indirect controlled Cosan Finance Limited issued Senior Notes in the international market in accordance with the “Regulation S” and “Rule 144A” in the amount of US$ 400 million, which are subject to interest at 7% per annum, payable semiannually in February and August of each year.
BNDES
Refers to the financing of cogeneration projects, greenfields (sugar and ethanol mills) and expansion of the logistics segment.
47
COSAN S.A. INDÚSTRIA E COMÉRCIO
Notes to the consolidated financial statement
Years ended March 31, 2012 and 2011
(In thousands of Reais, except otherwise stated)
Perpetual Notes
On January 24 and February 10, 2006, Cosan S.A. issued perpetual notes which are listed on the Luxembourg Stock Exchange - EURO MTF. These notes bear interest at a rate of 8.25% per year, payable quarterly on May 15, August 15, November 15 and February 15 of each year, beginning May 15, 2006. Those notes were repaid in May 2011 in connection with the internal restructuring to form the
On November 5, 2010 and July 13, 2011 the subsidiary Cosan Overseas Limited issued $500,000 of perpetual notes in the foreign market, in accordance with “Regulation S”. These notes bear interest at a rate of 8.25% per year, payable quarterly
Bank Debt
On May 16, 2011, a bank debt of US$ 450 million was issued in favor of the jointly-controlled subsidiary Raízen Energia in order to replace (and repay) the perpetual notes issued in 2006. This bank debt matures in two years, its interest is payable quarterly and is subject to Libor + interest of 2.15% per annum.
Advances on Foreign Exchange Contracts (“ACC”), Pre payments and Credit Notes
ACC contracts, pre payments and credit notes have been signed with several financial institutions and will be cleared through exports made from 2011 to 2014. These transactions are subject to interest rates ranging from 1.0% to 6.25% per annum payable semiannually and on maturity.
Finame
Finame borrowings are financing related to financing of machinery and equipment. These loans are subject to interest payable monthly and are secured by underlying financed assets.
Covenants
The Company, its subsidiaries and jointly-controlled entities are subject to certain restrictive financial covenants set forth in existing loans and financing agreements. At March 31, 2012, Cosan, its subsidiaries and jointly-controlled entities were in compliance with its debt covenants.
48
COSAN S.A. INDÚSTRIA E COMÉRCIO
Notes to the consolidated financial statement
Years ended March 31, 2012 and 2011
(In thousands of Reais, except otherwise stated)
| 16. | Tax Payable |
| Parent Company | Consolidated | |||||||||||||||
| 2012 | 2011 | 2012 | 2011 | |||||||||||||
| ICMS – State VAT | - | 7,268 | 66,601 | 72,265 | ||||||||||||
| IPI | - | 843 | 4,631 | 30,661 | ||||||||||||
| INSS | 47 | 5,828 | 13,029 | 25,309 | ||||||||||||
| PIS | 219 | - | 5,003 | 7,229 | ||||||||||||
| COFINS | 1,010 | - | 21,294 | 33,721 | ||||||||||||
| Recovery program - Refis IV | 731,414 | 100,768 | 1,287,941 | 670,645 | ||||||||||||
| Income Tax | - | - | 11,973 | 20,928 | ||||||||||||
| Others | 370 | 7,768 | 33,871 | 23,597 | ||||||||||||
| 733,060 | 122,475 | 1,444,343 | 884,355 | |||||||||||||
| Current | (62,597 | ) | (33,758 | ) | (241,719 | ) | (245,284 | ) | ||||||||
| Non – current | 670,463 | 88,717 | 1,202,624 | 639,071 | ||||||||||||
Tax recovery program – Law 11.941/09 e Provisional Measure 470/09 (“Refis IV”)
On May 27, 2009 and October 13, 2009, Law 11.941 and MP 470 were approved by the Brazilian government creating a tax recovery program, permitting the taxpayer to settle its federal tax debts, previous recovery programs, and other federal taxes under court discussions with discounts on previously charged penalties and interest and in installments. Such discounts generated a gain recorded in the income statement.
Additionally, it was permitted for the taxpayer to offset a portion of the penalties and interest due with its balance of income tax loss carry forwards. MP470 also allowed taxpayers to use tax losses to offset the principal balance related to IPI taxes.
On July 29, 2011 the subsidiary Cosan Lubrificantes e Especialides S.A., successor entity of Esso Brasileira de Petróleio Ltda. (“Essobrás”), joined the tax recovery program upon request of ExxonMobil Brasil Holdings B.V. (“ExxonMobil”). Further information was disclosed in Note 6.
Maturities of long-term taxes payable are as follows:
| Parent Company | Consolidated | |||||||||||||||
| 2012 | 2011 | 2012 | 2011 | |||||||||||||
| 13 to 24 months | 56,018 | 11,080 | 99,083 | 67,848 | ||||||||||||
| 25 to 36 months | 55,650 | 7,335 | 97,707 | 61,205 | ||||||||||||
| 37 to 48 months | 55,611 | 7,199 | 97,254 | 60,396 | ||||||||||||
| 49 to 60 months | 55,611 | 6,870 | 96,909 | 60,008 | ||||||||||||
| 61 to 72 months | 54,972 | 6,489 | 96,270 | 52,243 | ||||||||||||
| 73 to 84 months | 53,931 | 6,489 | 95,229 | 46,707 | ||||||||||||
| 85 to 96 months | 53,931 | 6,489 | 95,229 | 45,799 | ||||||||||||
| Thereafter | 284,739 | 36,766 | 524,943 | 244,865 | ||||||||||||
| 670,463 | 88,717 | 1,202,624 | 639,071 | |||||||||||||
49
COSAN S.A. INDÚSTRIA E COMÉRCIO
Notes to the consolidated financial statement
Years ended March 31, 2012 and 2011
(In thousands of Reais, except otherwise stated)
| 17. | Income taxes and social contribution |
Cosan is incorporated in Bermuda which has no income taxes. The following relates to Brazilian income taxes of Cosan S.A., its subsidiaries and jointly controlled entities.
| a) | Reconciliation of income and social contribution tax expenses: |
| Parent Company | Consolidated | |||||||||||||||
| 2012 | 2011 | 2012 | 2011 | |||||||||||||
| Pretax Income | 2,394,841 | 914,358 | 3,755,002 | 1,191,070 | ||||||||||||
| Income tax and social contribution at nominal rate (34%) | (814,246 | ) | (310,882 | ) | (1,276,701 | ) | (404,964 | ) | ||||||||
| Adjustments to determine the effective rate: | ||||||||||||||||
| Equity pick up | 1,072,648 | 170,143 | 11,311 | 8,593 | ||||||||||||
| Non deductable donations | (194 | ) | (5,513 | ) | (3,817 | ) | (9,130 | ) | ||||||||
| Interest on capital | (17,000 | ) | - | - | - | |||||||||||
| Non-taxable income(loss) from overseas companies | - | - | 103,781 | - | ||||||||||||
| Non-taxable income(loss) | - | - | 48,708 | - | ||||||||||||
| Others | (30,215 | ) | 3,457 | 6,506 | (8,978 | ) | ||||||||||
| Income Tax and Social contribution Expense( current and deferred) | 210,993 | (142,795 | ) | (1,110,212 | ) | (414,479 | ) | |||||||||
| Effective Rate | 8.81 | % | 15.62 | % | 29.57 | % | 34.80 | % | ||||||||
| b) | Deferred income tax on assets and liabilities |
| Parent Company | ||||||||||||||||||||
| 2012 | 2011 | |||||||||||||||||||
| Basis | IRPJ 25% | CSLL 9% | Total | Total | ||||||||||||||||
| Tax Losses: | ||||||||||||||||||||
| Tax Losses | 377,664 | 94,416 | - | 94,416 | 110,195 | |||||||||||||||
| Negative basis of social contribution | 377,767 | - | 33,999 | 33,999 | 39,679 | |||||||||||||||
| Temporary Differences: | ||||||||||||||||||||
| Monetary exchange | (99,662 | ) | (24,916 | ) | (8,970 | ) | (33,886 | ) | (233,102 | ) | ||||||||||
| Amortized Goodwill | (50,661 | ) | (12,665 | ) | (4,559 | ) | (17,224 | ) | (35,194 | ) | ||||||||||
| Effect of the formation of JVs | (3,100,229 | ) | (775,057 | ) | (279,021 | ) | (1,054,078 | ) | - | |||||||||||
| Other effects | (293,334 | ) | (73,333 | ) | (26,400 | ) | (99,733 | ) | (128,929 | ) | ||||||||||
| Total Deferred taxes | (791,555 | ) | (284,951 | ) | (1,076,506 | ) | (247,351 | ) | ||||||||||||
50
COSAN S.A. INDÚSTRIA E COMÉRCIO
Notes to the consolidated financial statement
Years ended March 31, 2012 and 2011
(In thousands of Reais, except otherwise stated)
| Consolidated | ||||||||||||||||||||
| 2012 | 2011 | |||||||||||||||||||
| Basis | IRPJ 25% | CSLL 9% | Total | Total | ||||||||||||||||
| Tax Losses: | ||||||||||||||||||||
| Tax Losses | 2,205,303 | 551,326 | - | 551,326 | 273,555 | |||||||||||||||
| Negative basis of social contribution | 2,198,476 | - | 197,863 | 197,863 | 99,609 | |||||||||||||||
| Temporary Differences: | ||||||||||||||||||||
| Monetary exchange | (109,962 | ) | (27,490 | ) | (9,897 | ) | (37,387 | ) | (274,189 | ) | ||||||||||
| Accelerated depreciation | (55,192 | ) | (13,798 | ) | (13,798 | ) | (4,596 | ) | ||||||||||||
| Amortized goodwill | (678,008 | ) | (169,502 | ) | (61,021 | ) | (230,523 | ) | (252,323 | ) | ||||||||||
| Business combination | (1,585,714 | ) | (396,428 | ) | (142,714 | ) | (539,142 | ) | (626,913 | ) | ||||||||||
| Effect of the formation of JVs | (3,501,590 | ) | (875,398 | ) | (315,143 | ) | (1,190,541 | ) | - | |||||||||||
| Fair value allocated on Raízen Assets | (2,618,000 | ) | (654,500 | ) | (235,620 | ) | (890,120 | ) | - | |||||||||||
Cost attributed - land | (366,151 | ) | (91,538 | ) | (32,953 | ) | (124,491 | ) | (124,491 | ) | ||||||||||
| Provisions for contingencies and other temporary differences | 1,107,081 | 276,770 | 99,637 | 376,407 | 113,716 | |||||||||||||||
| Total of deferred taxes | (1,400,558 | ) | (499,848 | ) | (1,900,406 | ) | (795,632 | ) | ||||||||||||
| Deferred Income Tax - Asset | 543,024 | 116,986 | ||||||||||||||||||
| Deferred Income Tax – Liabilities | (2,443,430 | ) | (912,618 | ) | ||||||||||||||||
| (1,900,406 | ) | (795,632 | ) | |||||||||||||||||
In assessing the deferred tax assets, management considers whether it is more likely than not that some portion or all of the deferred tax assets will not be realized. The ultimate realization of deferred tax assets is dependent upon the generation of future taxable income during the periods in which those temporary differences become deductible. Management considers the scheduled reversal of deferred tax liabilities and projected future taxable income in making this assessment. There is no expiration term for the net operating loss carry forwards. Based upon the level of historical taxable income and projections for future taxable income over the periods in which the deferred tax assets are deductible, management believes it is more likely than not that Cosan S.A. will realize the benefits of these deductible differences at March 31, 2012, as well as the net operating loss carry forwards. The amount of the deferred tax assets considered realizable, however, could be reduced in the near term if estimates of future taxable income during the carry forward period are reduced. Income tax losses carry forward and social contribution tax losses may be offset against a maximum of 30% of annual taxable income earned, with no statutory limitation period.
| 18. | Provision for judicial demands |
| Parent Company | Consolidated | |||||||||||||||
| 2012 | 2011 | 2012 | 2011 | |||||||||||||
| Tax | 148,097 | 39,774 | 620,835 | 418,744 | ||||||||||||
| Civil | 38,650 | 10,485 | 168,952 | 82,599 | ||||||||||||
| Labor | 169,512 | 27,883 | 261,890 | 164,939 | ||||||||||||
| 356,259 | 78,142 | 1,051,677 | 666,282 | |||||||||||||
51
COSAN S.A. INDÚSTRIA E COMÉRCIO
Notes to the consolidated financial statement
Years ended March 31, 2012 and 2011
(In thousands of Reais, except otherwise stated)
Judicial deposits on March 31, 2012 and 2011 are presented as follows:
| Parent Company | Consolidated | |||||||||||||||
| 2.012 | 2.011 | 2.012 | 2.011 | |||||||||||||
| Tax | 171,052 | 11,521 | 411,619 | 167,547 | ||||||||||||
| Civil | 8,201 | 3.243 | 32,474 | 18,937 | ||||||||||||
| Labor | 27,380 | 2,810 | 65,142 | 31,887 | ||||||||||||
| 206,633 | 17,574 | 509,235 | 218,371 | |||||||||||||
Changes in provision for judicial demands:
| Parent Company | ||||||||||||||||
| Tax | Civil | Labor | Total | |||||||||||||
| March 31, 2011 | 39,774 | 10,485 | 27,883 | 78,142 | ||||||||||||
| Provisions | 46,188 | 7,981 | 51,575 | 105,744 | ||||||||||||
| Settlements | (2,069 | ) | (2,672 | ) | (6,016 | ) | (10,756 | ) | ||||||||
| Write-offs | (15,548 | ) | (3,137 | ) | (22,530 | ) | (41,216 | ) | ||||||||
| Additions from the formation of JVs | 70,071 | 24,109 | 108,069 | 202,249 | ||||||||||||
| Monetary variation | 9,681 | 1,884 | 10,531 | 22,096 | ||||||||||||
| March 31, 2012 | 148,097 | 38,650 | 169,512 | 356,259 | ||||||||||||
| Consolidated | ||||||||||||||||
| Tax | Civil | Labor | Total | |||||||||||||
| March 31, 2011 | 418,744 | 82,599 | 164,939 | 666,282 | ||||||||||||
| Provisions | 79,510 | 67,685 | 73,379 | 220,574 | ||||||||||||
| Settlements | (3,566 | ) | (23,444 | ) | (8,873 | ) | (35,883 | ) | ||||||||
| Write-offs | (22,836 | ) | (65,774 | ) | (7,927 | ) | (96,537 | ) | ||||||||
| Additions from the formation of JVs | 118,824 | 91,020 | 22,768 | 232,612 | ||||||||||||
| Monetary variation | 30,159 | 16,866 | 17,604 | 64,629 | ||||||||||||
| March 31, 2012 | 620,835 | 168,952 | 261,890 | 1,051,677 | ||||||||||||
52
COSAN S.A. INDÚSTRIA E COMÉRCIO
Notes to the consolidated financial statement
Years ended March 31, 2012 and 2011
(In thousands of Reais, except otherwise stated)
Judicial demands deemed as probable loss
| (a) | Tax |
The major tax legal proceeding as of March 31, 2012 and 2011 are described as follows:
| Parent Company | Consolidated | |||||||||||||||
| Description | 2012 | 2011 | 2012 | 2011 | ||||||||||||
| IPC – 89 (i) | - | - | 82,173 | 80,273 | ||||||||||||
| Compensation with Finsocial (ii) | - | - | 195,421 | 183,706 | ||||||||||||
| CIDE (iii) | - | - | 93,841 | - | ||||||||||||
| ICMS credits (iv) | 71,343 | 7,205 | 97,552 | 56,880 | ||||||||||||
| PIS and COFINS | 8,277 | 2,718 | 17,445 | 8,220 | ||||||||||||
| IPI | 9,159 | 6,537 | 15,970 | 20,759 | ||||||||||||
| IRPJ and CSLL | 1,012 | 824 | 2,110 | 2,093 | ||||||||||||
| Other | 58,306 | 22,490 | 116,323 | 66,813 | ||||||||||||
| 148,097 | 39,774 | 620,835 | 418,744 | |||||||||||||
| (i) | Since 1993, the subsidiary Cosan Lubrificantes e Especialidades (“Cosan CLE”) filed a suit to challenge the balance sheet restatement index (IPC) established by the federal government in 1989, considering the such index did not reflect the actual inflation back then. The use of this index led the Company to supposedly overstate and overpay the income and social contribution taxes. Cosan CLE obtained a favorable preliminary court ruling that allowed it to recalculate the financial position, using indexes that accurately measured the inflation over the period. In doing so the company adjusted the amounts of income and social contribution taxes payable and identified that overpayments for both taxes were offset in subsequent years until 1997. Despite the favorable court rulings, tax authorities issued a notice of infringement to the Company challenging all tax offsets performed in 1993 and some offsets in 1994 and 1997, which led the Company to record a provision in relation to those court rulings. No judicial deposits related to these processes. |
| (ii) | During the period from October 2003 to November 2006 the subsidiary Cosan CL compensated FINSOCIAL with several other federal taxes, based on a final court decision in Set/2003 in the context of an action that was discussed the constitutionality of the FINSOCIAL. No judicial deposits related to these processes. |
| (iii) | Prior to the formation of the JV, Raízen Combustíveis, former Shell Brasil Ltda, recorded CIDE on services provided by operations. This contingency will be reimbursed by Shell if any payment is required, an equivalent amount is recorded as related parties. There are judicial deposits related to these processes, amounting R$170,835. |
| (iv) | The provision for ICMS credits is comprised of: (a) tax assessment received, in which, despite the defense filed at the administrative and judicial levels, the legal counsel of the Company understand it is more likely than not that a loss will occur, (b) recovery of credits and financial charges on issues in which Company´s management has a differing view from the tax authorities. There are judicial deposits related to these processes, amounting R$8,392. |
| (b) | Civil and Labor claims |
The Company, its subsidiaries and jointly-controlled entities are parties to a number of civil claims related to (i) indemnity for physical and moral damages; (ii) public civil claims related to sugarcane stubble burning; and (iii) environmental matters.
The Company, its subsidiaries and jointly-controlled entities are also parties to a number of labor claims filed by former employees and service providers challenging, among other factors, the payment of additional hours, night shift premium and risk premium, employment inclusion, reimbursement of discounts from payroll, such as social contribution, trade union charges, among others.
53
COSAN S.A. INDÚSTRIA E COMÉRCIO
Notes to the consolidated financial statement
Years ended March 31, 2012 and 2011
(In thousands of Reais, except otherwise stated)
Judicial demands deemed as possible loss
| (a) | Tax claims |
The main tax claims for which the unfavorable outcome is deemed possible and, therefore, no provision for legal claims was recorded in the financial statement, are as follows:
| Parent Company | Consolidated | |||||||||||||||
| 2012 | 2011 | 2012 | 2011 | |||||||||||||
| Withholding income taxes assessment(i) | 204,249 | 192,903 | 204,249 | 194,498 | ||||||||||||
| ICMS – State VAT (ii) | 698,672 | 116,865 | 1,705,220 | 490,896 | ||||||||||||
| IPI – Federal VAT (iii) | 280,680 | 10,944 | 378,735 | 270,817 | ||||||||||||
| Compensation with IPI – IN 67/98 (iv) | 188,479 | - | 188,479 | 181,292 | ||||||||||||
| INSS - social security and other (v) | 63,372 | 58,606 | 83,875 | 72,616 | ||||||||||||
| PIS and COFINS (vi) | 216,684 | 20,425 | 529,257 | 163,129 | ||||||||||||
| IR/CSLL (vii) | 423,529 | - | 532,131 | - | ||||||||||||
| Others | 159,233 | 59,991 | 493,471 | 197,884 | ||||||||||||
| 2,234,898 | 459,734 | 4,115,417 | 1,571,132 | |||||||||||||
| (i) | Tax assessment – withholding income tax |
In September 2006 the Federal Revenue Service served another notice of infringement on the Company, this time for failure to withhold and pay income tax at source on capital gains derived from the acquisition of a subsidiary.
| (ii) | ICMS |
Refers mainly to (i) Tax Assessment filed in view of the alleged lack of payment of ICMS and non-compliance with accessory obligation, in connection with the partnership and manufacturing upon demand, with Central Paulista Açúcar e Álcool Ltda., between May to December 2006 and May to December 2007; and (ii) ICMS levied on the remittances of crystallized sugar for export purposes. In accordance with the tax agent, such product is classified as semi-finished product and that, in accordance with the ICMS regulation, would be subject to taxation, (iii) ICMS levied on possible differences in terms of sugar and alcohol inventories, arising from magnetic tax files and Inventory Registry Books and (iv) ICMS concerning rate difference due to ethanol sales to companies located in other states, which, subsequently, had their registrations revoked and (v) disallowance of credit resulting from the acquisition of diesel used in the production process.
| (iii) | IPI – Federal VAT |
SRF Normative Instruction n° 67/98 approved the procedure adopted by the industrial establishments which performed remittances without registries and payment of the IPI rate, in regard to transfers of sugarcane carried out between July 6, 1995 and November 16, 1997 and refined sugar between January 14, 1992 and November 16, 1997. Such rule was considered in proceedings filed by the Federal Revenue Secretariat against the Company, the unfavorable outcome of which is deemed as possible, in accordance with the opinion of the Company’s legal advisors.
| (iv) | Offsets against IPI credits – IN 67/98 |
SRF Normative Instruction No. 67/98 made it possible to obtain refund of IPI tax payments for sales of refined sugar from January 14, 1992 through November 16, 1997. In view of this rule, the Company applied for offsetting amounts paid during the relevant periods against other tax liabilities. However, the Federal Revenue Service denied its application for both reimbursement and offsetting of such amounts. The Company challenged this ruling in an administrative proceeding.
Upon being notified to pay tax debts resulting from offset transactions in light of certain changes introduced by IN SRF No. 210/02, the Company filed a writ of mandamus and applied for a preliminary injunction seeking to stay enforceability of offset taxes, in an attempt to prevent the tax authorities from demanding the relevant tax debts in court. The preliminary injunction was granted by court.
54
COSAN S.A. INDÚSTRIA E COMÉRCIO
Notes to the consolidated financial statement
Years ended March 31, 2012 and 2011
(In thousands of Reais, except otherwise stated)
| (v) | INSS |
Refers mainly to tax assessment received and defended by the legal counsel, concerning social security contribution on: (i) stock option plan and (ii) export sales and (iii) resale of materials for companies under common control and suppliers.
| (vi) | PIS and COFINS |
Refers, mainly, to the reversal of PIS and COFINS credits, provided by Laws 10.637/2002 and 10.833/2003, respectively. Those reversals arise from a differing interpretation of the laws by the Internal Revenue Service in regard to raw materials. Such discussions are still at the administrative level.
| (vii) | IR/CSLL – Assessment Notice |
In December 2011, the Company received notices of violation in the amount of R$ 400,318, drawn up by the Federal Revenue of Brazil charging of income tax and social calendar years 2006 to 2009, questioning: (i) deductibility of expenses for amortization of certain goodwill (ii) compensation for tax losses and negative social contribution calculation and (iii) tax on revaluation differences of the property included in fixed assets. The Company filed its defense in January 2012 and, together with its legal advisors, classified as remote loss amounted to R$ 207,078 as a possible loss and the amount of R$ 204,221. The remaining R$ 327,710 refers to various other claims in connection with income taxes and social contribution in several legal entities pertaining the subsidiaries and jointly controlled entities.
| (b) | Civil and labor |
The main civil and labor claims for which the unfavorable outcome is deemed possible are as follow:
| Parent Company | Consolidated | |||||||||||||||
| 2012 | 2011 | 2012 | 2011 | |||||||||||||
| Civil | 309,234 | 59,036 | 869,954 | 377,608 | ||||||||||||
| Labor | 407,533 | 60,770 | 1,200,573 | 302,289 | ||||||||||||
| 716,767 | 119,806 | 2,070,527 | 679,897 | |||||||||||||
| 19. | Commitments |
Sales
The jointly-controlled entity “Raízen Energia” is mainly engaged in the commodities market and sales are substantially performed at the price on the date of sale. However, Raizen Energia has several agreements in the sugar market, which undertake to sell volumes of those products in future harvests.
The commitments for the sale of sugar, in tons, March 31, 2012 and 2011 are as follows (unaudited):
| Fiscal Year | 2012 | (*) | ||
| 2012 | 2,518,640 | |||
| 2013 | 1,714,101 | |||
| Total | 4,232,741 |
(*) Represents 100% of the commitments of Raízen Energia.(Raizen Energia is 50% proportionally consolidated).
Purchases
Raízen Energia has several commitments for the purchase of sugarcane from third parties in order to secure part of its production in subsequent years. The amount of sugarcane to be acquired has been calculated based on an estimate of the quantity to be ground by area. The amount to be paid by the jointly-controlled is determined at the end of each harvest, according to prices published by CONSECANA.
55
COSAN S.A. INDÚSTRIA E COMÉRCIO
Notes to the consolidated financial statement
Years ended March 31, 2012 and 2011
(In thousands of Reais, except otherwise stated)
Purchase commitments by harvest, in thousands of tons on March 31, 2012 and 2011 are as follows (unaudited):
| Fiscal Year | 2012 | (*) | ||
| 2013 | 24,747 | |||
| 2014 | 22,096 | |||
| 2015 | 19,624 | |||
| After 2015 | 129,601 | |||
| Total | 196,068 |
(*) Represent 100% of the commitments of Raízen Energia. (Raizen Energia is 50% proportionally consolidated).
At March 31, 2012 and 2011, the regular capacity of sugarcane crushing for the next harvest, considering all units, is approximately 63 million tons (unaudited).
The jointly-controlled entity Raízen Energia has contracts to purchase industrial equipment intended for maintenance and expansion of the mills, as well as to meet the demand of the electric energy co-generation project, in the total amount of R$80,076 on March 31, 2012.
The Company through its subsidiary Rumo entered into a commitment to purchase railcars, locomotives and invest in rail track improvements aimed at the expansion of the logistics business, as follows:
| Fiscal Year | 2012 | |||
| 2012 | 489,794 | |||
| 2013 | 44,000 | |||
| 2014 | 2,000 | |||
| Total | 535,794 | |||
Lease Agreements
Operating Leases
The Company, subsidiaries and jointly-controlled entities have operating lease contracts on land used for planting sugarcane and the concession contract to operate the port terminal, which will end within 20 years.
The minimum payments related to these obligations are calculated on a straight-line basis over the term of the lease. The costs for these contracts during the year ended March 31, 2012 and 2011 consisted of the following:
| 2012 | (*) | |||
| Minimum Installment | 214,949 | |||
| Variable Installment | 280,930 | |||
| Total | 495,879 |
(*) Represent 100% of the commitments of Raízen Energia. (Raizen Energia is 50% proportionally consolidated).
56
COSAN S.A. INDÚSTRIA E COMÉRCIO
Notes to the consolidated financial statement
Years ended March 31, 2012 and 2011
(In thousands of Reais, except otherwise stated)
Future minimum lease payments under non-cancelable operating leases (with initial or remaining lease terms in excess of one year) as of March 31, 2012 and 2011 are:
| Raízen Energia(*) | Rumo | |||||||
| Within 1 year | 553,815 | 37,303 | ||||||
| Over 1 year, less than 5 years | 1,673,249 | 241,741 | ||||||
| More than 5 years | 1,676,005 | - | ||||||
| Total | 3,903,069 | 279,044 | ||||||
(*) Represents 100% of the commitments of Raízen Energia.(Raizen Energia is 50% proportionally consolidated).
| 20. | Equity |
| a) | Common Stock |
The authorized common stock may be increased up to the limit of R$5,000,000, with no need of an amendment to the Company´s Bylaws, upon a decision of the Board of Directors. As of March 31, 2012, the Company’s capital is represented by 407,214,353 common shares.
As of March 31, 2012 and 2011, the Company’s capital is represented by 407,214,353 common shares, with no par value.
| b) | Realizable Profits Reserve: |
Realizable Profits Reserve will be the allocation of net income for what is contained therein: (i) incorporated with revenue arising from equity investment of the Joint Venture in subsidiary and / or other non-recurring event, (ii) performed by the amortization of fair value of net assets of the Joint Venture, limited by the existence of balance in retained earnings.
| Calculation of the realized portion of net income | ||||
| Net income | 2,605,834 | |||
| Equity income of associates | (3,154,846 | ) | ||
| Realized portion loss of the year | (549,012 | ) | ||
| Constitution of reserve for unrealized profits | ||||
| Net income | 2,605,834 | |||
| Legal reserve – 5% (art. 193) | (130,292 | ) | ||
| Reserve for unrealized profits | 2,475,542 | |||
(*) Contained in equity income of subsidiary
57
COSAN S.A. INDÚSTRIA E COMÉRCIO
Notes to the consolidated financial statement
Years ended March 31, 2012 and 2011
(In thousands of Reais, except otherwise stated)
| c) | Dividends |
By the meeting of May 22, 2012, the Board of Directors approved a proposal to be submitted to the General Shareholder’s Meeting to pay dividends accounted in Retained Earnings in the amount of R$ 250,000.
| d) | Repurchase of shares |
On November 22, 2010, the Board of Directors approved a stock repurchase plan for the purpose of maintenance in treasury, cancellation or disposal. The plan mentions that the Company may repurchase maximum of 6,640,091 of common shares, with no par value, in a specific period of 365 days. On November 03, 2011, repurchase of shares program was extended on 365 days.
During the exercise ended March 31, 2012, the Company acquired 1,972,500 shares for R$48,258 including expenses. The average unit stock value acquired during the period was R$ 24.46 being the minimum and maximum value R$ 23.02 and R$ 25.57, respectively, per share.
On March 31, 2012, the Company has 2,907,039 treasury shares (934,539 treasury shares as of March 31, 2011), which market value, that date, was R$ 32.86 (R$25.40 as of March 31, 2011).
| e) | Earnings per share |
Earnings per share are computed by dividing net income by the weighted average number of common shares outstanding during the year. Diluted earnings per share are calculated by adjusting average outstanding shares for the impact of conversion of all potentially dilutive options
The table below reflects the income and share date used in the basic and diluted earnings per share calculation for the six-month periods ended December 31, 2011 and 2010 (in thousands of Reais, except values per share):
Basic:
| 2012 | 2011 | |||||||
| Numerator: | ||||||||
| Net Income for Cosan | 2,605,834 | 771,565 | ||||||
| Denominator: | ||||||||
| Weighted average shares outstanding | 405,205,015 | 406,430,612 | ||||||
| Denominator for basic earnings per share | 405,205,015 | 406,430,612 | ||||||
| Basic earnings per share | R$ | 6.43 | R$ | 1.90 | ||||
Diluted:
| 2012 | 2011 | |||||||
| Numerator: | ||||||||
| Net income for Cosan | 2,605,834 | 771,565 | ||||||
| Denominator: | ||||||||
| Weighted average shares outstanding | 405,205,015 | 406,430,612 | ||||||
| Potential increase of common stock | 6,083,425 | 294,718 | ||||||
| Denominator for diluted earnings per share | 411,288,440 | 406,725,330 | ||||||
| Diluted earnings per share | R$ | 6.34 | R$ | 1.90 | ||||
58
COSAN S.A. INDÚSTRIA E COMÉRCIO
Notes to the consolidated financial statement
Years ended March 31, 2012 and 2011
(In thousands of Reais, except otherwise stated)
| 21. | Result of the formation of the Joint Ventures (Raízen Energia e Raízen Combustíveis) |
As mentioned in note 1, on June 1, 2011, the Company concluded, together with Shell, the formation of two joint ventures: (1) Raízen Combustíveis, in the fuel distribution segment, and (ii) Raízen Energia, in the sugar and ethanol segment. The Company through its subsidiary Cosan S.A.and Shell share the control of the two entities, each one has 50% of the economic control.
The formation of Raízen Energia and Raízen Combustíveis has the objective to create one of the world’s largest producers of sugar, ethanol and bioenergy produced from sugarcane and one of the largest fuel distributors in the Brazilian market.
Due to the formation of Raízen Energia and Raízen Combustíveis, the Company contributed its sugar and ethanol businesses, deconsolidating the related assets and liabilities and recording the remaining interest at fair value.
The process of deconsolidating do the contributed business, on June 1st, 2011, and the recognition of the new interest at fair value produced a gain of R$3,196,632 recorded during the year and shown below:
| Fair value of the remaining interest in the joint ventures (a) | 8,105,546 | |||
| Book value of business (assets and liabilities) contributed | (4,257,640 | ) | ||
| Gain on the de-consolidation of assets and liabilities contributed to the formation of the JV. | 3,847,906 | |||
| Other effects: | ||||
| Write-off of Recoverable taxes not realizable (b) | (83,465 | ) | ||
| Write-off of goodwill related to contributed subsidiaries | (193,633 | ) | ||
Write-off of other comprehensive income in relation to | ||||
| Hedge accounting, regarding contributed business’ | (157,988 | ) | ||
| Provisions in accordance with the JVs formation contract | (78,995 | ) | ||
| Other expenses and write-offs from the formation of Joint Ventures | (137,193 | ) | ||
| Income from formation of joint ventures | 3,196,632 |
| (a) | Based on appraisal report prepared by independent appraisers. |
| (b) | Recoverable taxes recorded by Cosan S.A., considered not realizable, and if received will be reimbursed to Raízen Energia. |
| (c) | Includes costs related to the transactions and other amounts related to the operation |
59
COSAN S.A. INDÚSTRIA E COMÉRCIO
Notes to the consolidated financial statement
Years ended March 31, 2012 and 2011
(In thousands of Reais, except otherwise stated)
Considering that Cosan chose to consolidate proportionally the joint ventures, the fair value of the remaining interest was allocated to the 50% proportion of the fair value of the assets and liabilities of these entities with the purpose to determine the goodwill of the transaction, as show below:
Raízen Energia | Raízen Combustíveis | Total | ||||||||||
Fair value of assets and liabilities (a): | ||||||||||||
| Cash and cash equivalents | 358,457 | 273,359 | 631,816 | |||||||||
| Restricted cash | 61,655 | - | 61,655 | |||||||||
| Account Receivable | 385,651 | 1,026,274 | 1,411,925 | |||||||||
| Derivatives | 114,204 | - | 114,204 | |||||||||
| Inventories | 746,561 | 831,258 | 1,577,819 | |||||||||
| Receivable from Shell | 1,853,269 | - | 1,853,269 | |||||||||
| Other assets | 1,691,561 | 1,527,766 | 3,219,327 | |||||||||
| Investments | 120,764 | - | 120,764 | |||||||||
| Biological Assets | 1,607,170 | - | 1,607,170 | |||||||||
| Property, plant and equipment | 9,313,801 | 2,719,498 | 12,033,299 | |||||||||
| Intangible Assets | 253,152 | 1,826,224 | 2,079,376 | |||||||||
| Loan and financing | (5,579,218 | ) | (926,268 | ) | (6,505,486 | ) | ||||||
| Suppliers | (471,495 | ) | (557,912 | ) | (1,029,407 | ) | ||||||
| Taxes payable | (255,939 | ) | 35,550 | (220,389 | ) | |||||||
| Other Liabilities | (2,918,758 | ) | (2,296,137 | ) | (5,214,895 | ) | ||||||
| Non-controlling interests | (16,457 | ) | (35,527 | ) | (51,984 | ) | ||||||
Net assets at fair value (a): | 7,264,378 | 4,424,085 | 11,688,463 | |||||||||
| Cosan’s interest - 50% | 3,632,190 | 2,212,042 | 5,844,232 | |||||||||
| Goodwill allocated (a) | 1,405,407 | 855,907 | 2,261,314 | |||||||||
| Fair value of the remaining interest in joint ventures | 5,037,597 | 3,067,949 | 8,105,546 | |||||||||
The goodwill of the transaction (R$2,261,314) was allocated to the segments Raízen Energia and Raízen Combustíveis in the proportion of net assets at fair value of each of these investments.
If it had been completed on 1 April 2011, and affected the income statement since the beginning of the exercise, the annual revenue would have been R$ 26,394,754 and the net income would have been R$ 2,264,333
The assets, liabilities, revenues and expenses of the jointly controlled in March 31, 2012, which were consolidated proportionately in the financial statements are presented in note 29.
The contingent liabilities of capital commitments of jointly controlled are disclosed in Notes 18 and 19.
60
COSAN S.A. INDÚSTRIA E COMÉRCIO
Notes to the consolidated financial statement
Years ended March 31, 2012 and 2011
(In thousands of Reais, except otherwise stated)
| 22. | Gross Sales |
| Parent Company | Consolidated | |||||||||||||||
| 2012 | 2011 | 2012 | 2011 | |||||||||||||
| Gross revenue from sales of products and services | 1,341 | 2,248,382 | 25,917,922 | 19,783,250 | ||||||||||||
| Indirect taxes and deductions | (45 | ) | (144,304 | ) | (1,821,041 | ) | (1,719,770 | ) | ||||||||
| Net revenue | 1,296 | 2,104,078 | 24,096,881 | 18,063,480 | ||||||||||||
| 23. | Expenses by nature |
Reconciliation of expenses by nature
The expenses are presented in the consolidated results by function. The reconciliation of income by nature/purpose for the years ended March 31, 2012, 2011 and 2010 is detailed as follows:
| a) | Expenses by nature: |
| Parent Company | Consolidated | |||||||||||||||
| 2012 | 2011 | 2012 | 2011 | |||||||||||||
| Raw-material | (628 | ) | (1,236,418 | ) | (4,612,407 | ) | (3,657,462 | ) | ||||||||
| Resale fuels | - | - | (15,060,815 | ) | (10,084,103 | ) | ||||||||||
| Payroll | (49,582 | ) | (263,081 | ) | (568,061 | ) | (901,062 | ) | ||||||||
| Commercial expenses | (1,365 | ) | (24,089 | ) | (535,439 | ) | (179,283 | ) | ||||||||
| Transportation and loading | - | - | (401,339 | ) | (545,212 | ) | ||||||||||
| Depreciation and amortization | (1,897 | ) | (79,190 | ) | (1,142,780 | ) | (742,307 | ) | ||||||||
| Other expenses | (48,498 | ) | (319,248 | ) | (922,348 | ) | (607,652 | ) | ||||||||
| (101,970 | ) | (1,922,026 | ) | (23,243,189 | ) | (16,717,081 | ) | |||||||||
| b) | Segregated as: |
| Parent Company | Consolidated | |||||||||||||||
| 2012 | 2011 | 2012 | 2011 | |||||||||||||
| Cost of goods sold | (2,410 | ) | (1,499,465 | ) | (21,465,009 | ) | (15,150,079 | ) | ||||||||
| Selling | - | (159,075 | ) | (1,136,286 | ) | (1,026,000 | ) | |||||||||
| General and administrative | (99,560 | ) | (263,486 | ) | (641,894 | ) | (541,002 | ) | ||||||||
| (101,970 | ) | (1,922,026 | ) | (23,243,189 | ) | (16,717,081 | ) | |||||||||
61
COSAN S.A. INDÚSTRIA E COMÉRCIO
Notes to the consolidated financial statement
Years ended March 31, 2012 and 2011
(In thousands of Reais, except otherwise stated)
| 24. | Financial results, net |
| Parent Company | Consolidated | |||||||||||||||
| 2012 | 2011 | 2012 | 2011 | |||||||||||||
| Financial Expense | ||||||||||||||||
| Interests | (311,776 | ) | (283,169 | ) | (542,322 | ) | (586,887 | ) | ||||||||
| Monetary Variation | - | (10,765 | ) | (10,961 | ) | (81,341 | ) | |||||||||
| Others | (19,344 | ) | (655 | ) | (28,952 | ) | (4,678 | ) | ||||||||
| (331,120 | ) | (294,589 | ) | (582,235 | ) | (672,906 | ) | |||||||||
| Financial Income | ||||||||||||||||
| Interests | 26,218 | 39,524 | 48,562 | 63,791 | ||||||||||||
| Monetary Variation | 9,453 | 3,609 | 26,312 | 34,018 | ||||||||||||
| Investments | 35,212 | 10,217 | 131,117 | 90,345 | ||||||||||||
| Others | 114 | 371 | 603 | |||||||||||||
| 70,883 | 53,464 | 206,362 | 188,757 | |||||||||||||
Foreign exchange variation, net (1) | (337,079 | ) | 235,467 | (93,887 | ) | 282,705 | ||||||||||
| Derivatives, net (2) | ||||||||||||||||
| Commodities derivatives | 277,734 | 18,472 | 6,524 | |||||||||||||
| Exchange rate and interest derivatives | 79 | (5,497 | ) | (711 | ) | 34,984 | ||||||||||
| Warranties in associates | (22,141 | ) | 13,248 | (22,141 | ) | 13,248 | ||||||||||
| (22,062 | ) | 285,485 | (4,380 | ) | 54,756 | |||||||||||
| (619,378 | ) | 279,827 | (474,140 | ) | (146,688 | ) | ||||||||||
| (1) | Includes gains (losses) of foreign exchange rate over assets and liabilities denominated in foreign currency; and |
| (2) | Includes realized results and unrealized results on operations in future market, options, swaps and NDFs, in addition to effects from non-designated instruments and from the ineffective portion of hedge accounting. |
| 25. | Other Income (expense), net |
| Parent Company | Consolidated | |||||||||||||||
| 2012 | 2011 | 2012 | 2011 | |||||||||||||
| Other income | ||||||||||||||||
| Gain on disposal of property, plant and equipment | (48 | ) | 1,038 | 93,892 | 43,708 | |||||||||||
| Revenue from the sale of scrap and waste | - | 2,310 | 2,862 | 6,950 | ||||||||||||
| Rental and leasing income | 800 | 2,745 | 57,197 | 4,111 | ||||||||||||
| Reversal of loss of receivables | 25,794 | - | 28,804 | - | ||||||||||||
| Revenue from royalties | - | - | 19,739 | - | ||||||||||||
| Revenue from customer base | - | - | 14,827 | - | ||||||||||||
| Other Income | 2,899 | - | 44,071 | 8,908 | ||||||||||||
| 29,445 | 6,093 | 261,392 | 63,677 | |||||||||||||
| Other expense | ||||||||||||||||
| Provision for judicial demands | (70,661 | ) | (1,079 | ) | (80,835 | ) | (23,828 | ) | ||||||||
| Internal costs on Rumo transaction | - | (18,758 | ) | (1,971 | ) | (20,319 | ) | |||||||||
| Donations | - | (9,105 | ) | - | (12,335 | ) | ||||||||||
| Expenses of subsidiaries acquisition and start up | - | (6,517 | ) | (9,497 | ) | (6,517 | ) | |||||||||
| Other expense | (21,398 | ) | (18,577 | ) | (23,539 | ) | (34,506 | ) | ||||||||
| (92,059 | ) | (54,036 | ) | (115,842 | ) | (97,505 | ) | |||||||||
| (62,614 | ) | (47,943 | ) | 145,550 | (33,828 | ) | ||||||||||
62
COSAN S.A. INDÚSTRIA E COMÉRCIO
Notes to the consolidated financial statement
Years ended March 31, 2012 and 2011
(In thousands of Reais, except otherwise stated)
| 26. | Financial Instruments |
Financial risk management
| a) | Overview |
The Company is exposed to the following risk related to the use of financial instruments:
| · | Price risk |
| · | Foreign exchange rates |
| · | Interest rates |
| · | Credit risk |
| · | Liquidity risk |
This note presents information about the Company, its subsidiaries and jointly-controlled entities exposure for which risk above, the object of the Company’s risk management policies, the polices and processes for measurement, risk management and capital management.
| b) | Risk management structure |
The risks of each type of business markets are managed and monitored by the company and, where applicable, has risk committees to discuss and determine the hedge strategy of the company in accordance with its policies and guidelines.
There is, in Raízen Energia, a Risk Committee that meets weekly to analyze the behavior of commodity markets (mainly sugar), exchange rate and decide about coverage position and sugar pricing strategy to export, seeking to reduce the adverse effects of changes in prices and exchange rates, as well as monitor the liquidity risk and counterparty risk (credit).
The Company, its subsidiaries and its jointly-controlled entities are exposed to market risks, mainly related to the volatility of sugar prices and foreign exchange rates. Management analyzes these risks and uses financial instruments to hedge a portion of the risk exposure.
On March 31, 2012 and 2011, fair values related to transactions involving derivative financial instruments with the purpose of hedge or other purposes were measured at market value (fair value) by observables factors such as quoted prices in active markets or discounted cash flows based on market curves and are presented below:
63
COSAN S.A. INDÚSTRIA E COMÉRCIO
Notes to the consolidated financial statement
Years ended March 31, 2012 and 2011
(In thousands of Reais, except otherwise stated)
| Notional | Fair Value | |||||||||||||||||||
| March 31, 2012 | March 31, 2011 | March 31, 2012 | March 31, 2011 | Result (*) | ||||||||||||||||
| RAÍZEN ENERGIA | ||||||||||||||||||||
| Price risk | ||||||||||||||||||||
| Commodity derivatives | ||||||||||||||||||||
| Future agreements | 1,194,225 | 24,377 | - | 24,377 | ||||||||||||||||
| Option agreements | 8,954 | 782 | - | 38 | ||||||||||||||||
| 25,159 | - | 24,415 | ||||||||||||||||||
| Price risk | ||||||||||||||||||||
| Commodity derivatives | ||||||||||||||||||||
| Future agreements | 490,949 | 1,682 | - | 1,431 | ||||||||||||||||
| Option agreements | 258,690 | 1,773 | - | 1,773 | ||||||||||||||||
| Price risk | 256,381 | 3,403 | - | 3,403 | ||||||||||||||||
| 6,858 | - | 6,607 | ||||||||||||||||||
| Interest rate risk | ||||||||||||||||||||
| Derivative interest | 318,868 | - | (1,495 | ) | - | (1,495 | ) | |||||||||||||
| (1,495 | ) | - | (1,495 | ) | ||||||||||||||||
| TOTAL Raízen Energia | 30,522 | - | 29,527 | |||||||||||||||||
| Consolidated Cosan (50% Raízen Energia) | 15,261 | - | 14,764 | |||||||||||||||||
| Derivatives in the Company and subsidiaries | ||||||||||||||||||||
| Price risk | ||||||||||||||||||||
| Commodity derivatives | ||||||||||||||||||||
| Future agreements | - | 1,308,033 | - | (68,906 | ) | - | ||||||||||||||
| Option agreements | - | 10,364 | - | (17,484 | ) | - | ||||||||||||||
| - | (86,390 | ) | - | |||||||||||||||||
| Price risk | ||||||||||||||||||||
| Commodity derivatives | ||||||||||||||||||||
| Future agreements | - | (114,204 | ) | - | (117 | ) | - | |||||||||||||
| Option agreements | 325,029 | 694,599 | (5,282 | ) | 9,900 | (5,282 | ) | |||||||||||||
| (5,282 | ) | 9,783 | (5,282 | ) | ||||||||||||||||
| Total Cosan (including 50% Raízen Energia – where applicable) | 9,979 | (76,607 | ) | 9,482 | ||||||||||||||||
| Total of Assets | 19,590 | 55,682 | ||||||||||||||||||
| Total of Liabilities | (9,611 | ) | (132,289 | ) | ||||||||||||||||
(*) Values from the income statement calculated for the year ended March 31, 2012, only to outstanding derivatives that date.
| c) | Price Risk |
This arises from the potential for fluctuations in the market prices of products sold by the Raizen Energia, mainly raw material sugar - VHP (sugar #11) and white sugar (LIFFE sugar #5). These fluctuations in prices can cause substantial changes in the revenues. To mitigate these risks, the Raizen Energia constantly monitors the markets, seeking to anticipate changes in prices. The positions of the consolidated derivative financial instruments to hedge the price risk of commodities are shown in the table below:
64
COSAN S.A. INDÚSTRIA E COMÉRCIO
Notes to the consolidated financial statement
Years ended March 31, 2012 and 2011
(In thousands of Reais, except otherwise stated)
| Price Risk : derivatives of commodities open in March 31, 2012 | |||||||||||||||||
| Derivatives | Purchased / Sold | Market | Contract | Maturity | Notional (units) | Notional (R$ thousand) | Fair Value (R$ thousand) | ||||||||||
| Contracted financial Instruments by Raízen Energia | |||||||||||||||||
| Composition of balances of derivative financial instruments designated in hedge accounting | |||||||||||||||||
| Future | Sold | NYBOT | Sugar#11 | 1-May-12 | 129,241 T | 132,392 | 4,106 | ||||||||||
| Future | Sold | NYBOT | Sugar#11 | 1-Jul-12 | 440,050 T | 434,844 | 13,778 | ||||||||||
| Future | Sold | NYBOT | Sugar#11 | 1-Oct--12 | 551,358 T | 534,580 | 5,901 | ||||||||||
| Future | Sold | NYBOT | Sugar#11 | 1-Mar-13 | 110,851 T | 109,453 | 223 | ||||||||||
| Future | Sold | NYBOT | Sugar#11 | 1-Jul-13 | 204 T | 191 | (5 | ) | |||||||||
| Sub-total of future sugar sold | 1,231,704 T | 1,211,460 | 24,003 | ||||||||||||||
| Composition of balances of derivative financial instruments non-designated in hedge accounting | |||||||||||||||||
| Future | Purchased | NYBOT | Sugar#11 | 1- May-12 | (25,808 T | ) | (25,589 | ) | 28 | ||||||||
| Future | Purchased | NYBOT | Sugar#11 | 1-Jul-12 | (10,160 T | ) | (9,562 | ) | 160 | ||||||||
| Future | Purchased | NYBOT | Sugar#11 | 1-Oct-12 | (2,693 T | ) | (2,462 | ) | 120 | ||||||||
| Future | Purchased | NYBOT | Sugar#11 | 1-May-13 | (1,422 T | ) | (1,338 | ) | 64 | ||||||||
| Future | Purchased | NYBOT | Sugar#11 | 1-May-13 | (254 T | ) | (240 | ) | 8 | ||||||||
| Future | Purchased | NYBOT | Sugar#11 | 1-Jul-13 | (203 T | ) | (187 | ) | 8 | ||||||||
| Sub-total of future sugar purchased | (40,540 T | ) | (39,378 | ) | 388 | ||||||||||||
| Sub-total of future sugar | 1,191,164 T | 1,172,082 | 24,391 | ||||||||||||||
| Call | Purchased | NYBOT | Sugar#11 | 1-May-12 | (5,080 T | ) | (57 | ) | 14 | ||||||||
| Call | Purchased | NYBOT | Sugar#11 | 1-Jul-12 | (111,766 T | ) | (2,760 | ) | 269 | ||||||||
| Sub-total of call purchased | (116,846 T | ) | (2,817 | ) | 283 | ||||||||||||
| Call | Sold | NYBOT | Sugar#11 | 1-May-12 | 27,687 T | 2,751 | (11 | ) | |||||||||
| Call | Sold | NYBOT | Sugar#11 | 1-Jul-12 | 76,204 T | 4,500 | (184 | ) | |||||||||
| Call | Sold | NYBOT | Sugar#11 | 1-Jul-12 | 35,562 T | 1,820 | (86 | ) | |||||||||
| Sub-total of call sold | 139,453 T | 9,071 | (281 | ) | |||||||||||||
| Put | Purchased | NYBOT | Sugar#11 | 1-May-12 | 27,687 T | 2,699 | 779 | ||||||||||
| Sub-total of put purchased | 27,687 T | 2,699 | 779 | ||||||||||||||
| Sub-total of options of sugar | 8,953 | 781 | |||||||||||||||
| Future | Sold | BMFBovespa | ETH | 30-Mar -12 | 16,560 m³ | 20,430 | 8 | ||||||||||
| Future | Sold | BMFBovespa | ETH | 30-Apr-12 | 18,210 m³ | 22,642 | (18 | ) | |||||||||
| Sub-total of future ethanol sold | 34,770 m³ | 43,072 | (10 | ) | |||||||||||||
| Future | Purchased | BMFBovespa | ETH | 30-Mar-12 | (5,910 m³ | ) | (7,473 | ) | (3 | ) | |||||||
| Future | Purchased | BMFBovespa | ETH | 30-Mar -12 | (10,650 m³ | ) | (13,456 | ) | - | ||||||||
| Sub-total of future ethanol purchased | (16,560 m³ | ) | (20,929 | ) | (3 | ) | |||||||||||
| Sub-total of future ethanol | 18,210 m³ | 22,143 | (13 | ) | |||||||||||||
| Total of commodities | 1,203,178 | 25,159 | |||||||||||||||
The fair value of these derivatives was measured by observable factors, such as quoted prices in active markets and, in some cases, by means of models whose assumptions are observable in the market.
65
COSAN S.A. INDÚSTRIA E COMÉRCIO
Notes to the consolidated financial statement
Years ended March 31, 2012 and 2011
(In thousands of Reais, except otherwise stated)
| d) | Foreign Exchange risk |
This arises from the possibility of fluctuations in the exchange rates of the foreign currencies used by its subsidiaries and jointly-controlled entities for the export revenues of products, imports, debt cash flow and other assets and liabilities denominated in a foreign currency. Its subsidiaries and jointly-controlled entities use derivative transactions to manage the risks of cash flow coming from the export revenues denominated in U.S. dollars, net of other cash flows denominated in foreign currency. The table below demonstrates the consolidated positions outstanding on March 31, 2012 of derivatives used to hedge exchange rates:
| Price Risk : derivatives of foreign currencies open in March 31, 2012 | |||||||||||||||||
| Derivatives | Purchased / Sold | Market | Contract | Maturity | Notional (USD) | Notional (R$ Thousand) | Fair Value (R$ Thousand) | ||||||||||
| Financial instruments contracted by Raizen Energia | |||||||||||||||||
| Composition of balances of derivative financial instruments designated in hedge accounting | |||||||||||||||||
| Term | Sold | OTC/Cetip | NDF | 02-Apr-12 | 141,000 | 258,690 | 1,773 | ||||||||||
| Sub-total of term sold | 141,000 | 258,690 | 1,773 | ||||||||||||||
| Composition of balances of derivative financial instruments non-designated in hedge accounting | |||||||||||||||||
| Future | Sold | BMFBovespa | Commercial Dollar | 02-Apr-12 | 898,000 | 1,563,367 | 6,954 | ||||||||||
| Future | Sold | BMFBovespa | Commercial Dollar | 02-May-12 | 330,500 | 608,037 | 1,614 | ||||||||||
| Future | Sold | BMFBovespa | Commercial Dollar | 02-May-12 | 3,250 | 5,967 | (3 | ) | |||||||||
| Sub-total of future sold | 1,231,750 | 2,177,371 | 8,565 | ||||||||||||||
| Future | Purchased | BMFBovespa | Commercial Dollar | 02-Apr-12 | (922,000 | ) | (1,685,044 | ) | (6,882 | ) | |||||||
| Future | Purchased | BMFBovespa | Commercial Dollar | 02-May-12 | (750 | ) | (1,378 | ) | (1 | ) | |||||||
| Sub-total of future purchased | (922,750 | ) | (1,686,422 | ) | (6,883 | ) | |||||||||||
| Exchange lock | Sold | OTC | Exchange lock | 02-Jul-12 | 20,000 | 38,254 | 1,121 | ||||||||||
| Exchange lock | Sold | OTC | Exchange lock | 02-Jul-12 | 30,000 | 58,104 | 2,575 | ||||||||||
| Exchange lock | Sold | OTC | Exchange lock | 06-Sep-12 | 20,000 | 36,044 | (1,445 | ) | |||||||||
| Exchange lock | Sold | OTC | Exchange lock | 13-Sep-12 | 40,250 | 74,881 | (768 | ) | |||||||||
| Exchange lock | Sold | OTC | Exchange lock | 24-Sep-12 | 25,000 | 49,098 | 1,920 | ||||||||||
| 135,250 | 256,381 | 3,403 | |||||||||||||||
| Total of exchange | 585,250 | 1,006,020 | 6,858 | ||||||||||||||
66
COSAN S.A. INDÚSTRIA E COMÉRCIO
Notes to the consolidated financial statement
Years ended March 31, 2012 and 2011
(In thousands of Reais, except otherwise stated)
| Derivatives | Purchased / Sold | Market | Contract | Maturity | Number of Contracts | Strike | Middle Price | Fair Price | Notional (USD) | Notional (R$ mil) | Fair Value (R$ thousand) | |||||||||||||||||||||||
| Term | Purchased | OTC | NDF | 4-May-12 | 1 | - | 1.8944 | 1.8417 | (6,188 | ) | 11,722 | 348 | ||||||||||||||||||||||
| Term | Purchased | OTC | NDF | 4-May-12 | 1 | - | 1.6789 | 1.8417 | (4,197 | ) | 7,047 | (660 | ) | |||||||||||||||||||||
| Term | Purchased | OTC | NDF | 3-Aug-12 | 1 | - | 1.9358 | 1.8771 | (4,197 | ) | 7,239 | (597 | ) | |||||||||||||||||||||
| Term | Purchased | OTC | NDF | 3-Aug-12 | 1 | - | 1.7247 | 1.8771 | (6,188 | ) | 11,978 | 389 | ||||||||||||||||||||||
| Term | Purchased | OTC | NDF | 1-Nov-12 | 1 | - | 1.9780 | 1.9166 | (4,197 | ) | 7,390 | (563 | ) | |||||||||||||||||||||
| Term | Purchased | OTC | NDF | 1-Nov-12 | 1 | - | 1.7607 | 1.9166 | (6,188 | ) | 12,239 | 455 | ||||||||||||||||||||||
| Term | Purchased | OTC | NDF | 4-Feb-13 | 1 | - | 2.0209 | 1.9508 | (4,197 | ) | 7,546 | (524 | ) | |||||||||||||||||||||
| Term | Purchased | OTC | NDF | 4-Feb-13 | 1 | - | 1.7978 | 1.9508 | (6,188 | ) | 12,504 | 525 | ||||||||||||||||||||||
| Term | Purchased | OTC | NDF | 3-May-13 | 1 | - | 2.0589 | 1.9737 | (4,197 | ) | 7,696 | (472 | ) | |||||||||||||||||||||
| Term | Purchased | OTC | NDF | 3-May-13 | 1 | - | 1.8336 | 1.9737 | (6,188 | ) | 12,739 | 597 | ||||||||||||||||||||||
| Term | Purchased | OTC | NDF | 2-Aug-13 | 1 | - | 2.1005 | 2.0103 | (4,197 | ) | 7,859 | (430 | ) | |||||||||||||||||||||
| Term | Purchased | OTC | NDF | 2-Aug-13 | 1 | - | 1.8724 | 2.0103 | (6,188 | ) | 12,997 | 653 | ||||||||||||||||||||||
| Term | Purchased | OTC | NDF | 4-Nov-13 | 1 | - | 2.1424 | 2.0480 | (4,197 | ) | 8,032 | (386 | ) | |||||||||||||||||||||
| Term | Purchased | OTC | NDF | 4-Nov-13 | 1 | - | 1.9137 | 2.0480 | (6,188 | ) | 13,256 | 699 | ||||||||||||||||||||||
| Term | Purchased | OTC | NDF | 4-Feb-14 | 1 | - | 2.1852 | 2.0850 | (4,197 | ) | 8,190 | (358 | ) | |||||||||||||||||||||
| Term | Purchased | OTC | NDF | 4-Feb-14 | 1 | - | 1.9513 | 2.0850 | (6,188 | ) | 13,521 | 747 | ||||||||||||||||||||||
| Term | Purchased | OTC | NDF | 2-May-14 | 1 | - | 2.2211 | 2.1210 | (4,197 | ) | 8,340 | (329 | ) | |||||||||||||||||||||
| Term | Purchased | OTC | NDF | 2-May-14 | 1 | - | 1.9870 | 2.1210 | (6,188 | ) | 13,743 | 770 | ||||||||||||||||||||||
| Term | Purchased | OTC | NDF | 4-Aug-14 | 1 | - | 2.2630 | 2.1610 | (4,197 | ) | 8,507 | (288 | ) | |||||||||||||||||||||
| Term | Purchased | OTC | NDF | 4-Aug-14 | 1 | - | 2.0268 | 2.1610 | (6,188 | ) | 14,002 | 820 | ||||||||||||||||||||||
| Term | Purchased | OTC | NDF | 4-Nov-14 | 1 | - | 2.3048 | 2.2002 | (4,197 | ) | 8,666 | (250 | ) | |||||||||||||||||||||
| Term | Purchased | OTC | NDF | 4-Nov-14 | 1 | - | 2.0648 | 2.2002 | (6,188 | ) | 14,261 | 876 | ||||||||||||||||||||||
| Term | Purchased | OTC | NDF | 4-Feb-15 | 1 | - | 2.3429 | 2.2394 | (4,197 | ) | 8,813 | (221 | ) | |||||||||||||||||||||
| Term | Purchased | OTC | NDF | 4-Feb-15 | 1 | - | 2.0997 | 2.2394 | (6,188 | ) | 14,497 | 915 | ||||||||||||||||||||||
| Term | Purchased | OTC | NDF | 4-May-15 | 1 | - | 2.3800 | 2.2564 | (4,197 | ) | 8,942 | (201 | ) | |||||||||||||||||||||
| Term | Purchased | OTC | NDF | 4-May-15 | 1 | - | 2.1305 | 2.2564 | (6,188 | ) | 14,726 | 957 | ||||||||||||||||||||||
| Term | Purchased | OTC | NDF | 4-Aug-15 | 1 | - | 2.4247 | 2.2564 | (4,197 | ) | 9,089 | (169 | ) | |||||||||||||||||||||
| Term | Purchased | OTC | NDF | 4-Aug-15 | 1 | - | 2.1656 | 2.2564 | (6,188 | ) | 15,003 | 1,032 | ||||||||||||||||||||||
| Term | Purchased | OTC | NDF | 4-Nov-15 | 1 | - | 2.4653 | 2.2564 | (4,197 | ) | 9,231 | (140 | ) | |||||||||||||||||||||
| Term | Purchased | OTC | NDF | 4-Nov-15 | 1 | - | 2.1994 | 2.2564 | (6,188 | ) | 15,254 | 1,087 | ||||||||||||||||||||||
| (155,775 | ) | 325,029 | 5,282 | |||||||||||||||||||||||||||||||
On March 31, 2012 and 2011, the Company, its subsidiaries and its jointly-controlled entities had the following net exposure to the variation of U.S. dollar assets and liabilities denominated in U.S. dollars:
| Consolidated | ||||||||||||||||||
| 2012 | 2011 | |||||||||||||||||
| R$ | US$ (in thousands) | R$ | US$ (in thousands) | |||||||||||||||
| Cash and Cash equivalent | 24,426 | 13,406 | 191,098 | 117,332 | ||||||||||||||
| Restrict Cash | 45,976 | 25,232 | 126,872 | 77,898 | ||||||||||||||
| Accounts receivable from abroad | 164,681 | 90,380 | 7,556 | 4,639 | ||||||||||||||
| Related Parties (Shell) | 436,362 | 239,483 | - | - | ||||||||||||||
| Debts | (2,730,076 | ) | (1,498,314 | ) | (3,750,783 | ) | (2,302,927 | ) | ||||||||||
| Net foreign currency Exchange | (2,058,631 | ) | (1,129,813 | ) | (3,425,257 | ) | (2,103,058 | ) | ||||||||||
67
COSAN S.A. INDÚSTRIA E COMÉRCIO
Notes to the consolidated financial statement
Years ended March 31, 2012 and 2011
(In thousands of Reais, except otherwise stated)
| e) | Effect of Hedge Accounting |
The jointly-controlled entity Raízen Energia formally designated its transactions subject to hedge accounting for cash flow hedges from sugar VHP (raw material) export revenue, documenting: (i) the relationship of the hedge, (ii) the purpose for taking the hedge and its risk management strategy, (iii) identification of the financial instrument, (iv) the transaction or item covered, (v) the nature of the risk being hedged, (vi) a description of the hedging relationship (vii) the demonstration of correlation between the hedge and the object of coverage, and (viii) the prospective analysis of hedge effectiveness. The derivative financial instruments of Sugar # 11 (NYBOT or OTC) were designated to cover the risk of price and Non-Deliverable Forwards (NDF) to cover exchange rate risk, as demonstrated in topics (b) and (c) of this Note.
Raizen Energia records gains and losses deemed effective for purposes of hedge accounting to a specific account in equity (“other comprehensive income”), until the object of coverage (hedged item) affects the profit and loss. On December 31, 2012, the amounts recorded in other comprehensive income related to hedge accounting are as follows:
| Expected period to affect P&L | |||||||||||||||||
| Derivative | Market | Risk | 2012/2013 | 2013/2014 | Total | ||||||||||||
| Future | OTC / NYBOT | #11 | 40,543 | 564 | 41,107 | ||||||||||||
| NDF | OTC / CETIP | USD | 1,663 | - | 1,663 | ||||||||||||
| 42,206 | 564 | 42,770 | |||||||||||||||
| (-) Deferred income tax | (14,350 | ) | (192 | ) | (14,542 | ) | |||||||||||
| Effect on the Raizen Equity | 27,856 | 372 | 28,228 | ||||||||||||||
| Effect on equity of Cosan (50%) | 14,114 | ||||||||||||||||
The changes for the period of the effect of hedge accounting on other comprehensive income of Cosan S.A. is shown below:
| Hedge Cash flow | 2012 | |||
| Balance at March 31, 2011 | (143,298 | ) | ||
Gain/(losses) of cash flow hedges for the period: | ||||
Commodities futures and swap contracts | 5,414 | |||
Currency forward contracts | 38,286 | |||
| Reclassification adjustments for losses / gains included in the income statement | 36,815 | |||
| Write off of OCI due to the formation of JV | 157,988 | |||
| Total before tax effect | 238,503 | |||
| Tax effect on gain/(losses) of cash flow hedges for the period – 34% | (81,091 | ) | ||
| Balance at March 31, 2012 | 14,114 | |||
| f) | Exchange rate risk |
The Company, its subsidiaries and jointly-controlled entities monitors the fluctuations in variable interest rates in connection with certain debts, especially those related to the risk of Libor, and makes
68
COSAN S.A. INDÚSTRIA E COMÉRCIO
Notes to the consolidated financial statement
Years ended March 31, 2012 and 2011
(In thousands of Reais, except otherwise stated)
use of derivative instruments in order to minimize these risks. The table below shown the consolidated positions open on March 31, 2012 of derivatives used for interest rate (none in 2011):
| Price Risk : derivatives of interests open in March 31, 2012 | ||||||||||||
| Derivatives | Asset / Liabilities | Market | Maturity | Notional | Notional | Fail Value | ||||||
| (US$ Thousands) | (R$ Thousand) | (R$ Thousand) | ||||||||||
| Interests rate Swap | Libor 3M / pré | OTC | Jan-16 | 175,000 | 318,868 | (1,495) | ||||||
| Total of interests | 175,000 | 318,868 | (1,495) | |||||||||
| g) | Credit risk |
A significant portion of sales made by the subsidiaries and jointly-controlled entities is to a select group of best-in-class counterparts (i.e. trading companies, fuel distribution companies and large supermarket chains).
Credit risk is managed through specific rules of client acceptance including credit ratings and limits for customer exposure, including the requirement of a letter of credit from major banks and obtaining actual warranties on given credit, when applicable. Management believes that the risk of credit is covered by the allowance for doubtful accounts.
The Company, its subsidiaries and jointly-controlled entities buy and sell commodity derivatives in futures and options markets on the New York Board of Trade (NYBOT) and the London International Financial Futures and Options Exchange (LIFFE), as well as in the over-the-counter (OTC) market with selected counterparties. The Company and its jointly-controlled entities buy and sell foreign exchange derivatives on BM&FBovespa and OTC contracts registered with CETIP (OTC clearing house) with banks Espirito Santo Investment do Brasil S.A., Deutsche Bank S.A. – Banco Alemão, Banco JP Morgan S.A. and Banco Standard de Investimentos S.A..
Guarantee margins – The Company’s derivative operations on commodity exchanges (NYBOT, LIFFE and BM&FBovespa) require an initial guarantee margin. The brokers with which the Company operates on these commodity exchanges offer credit limits for these margins. As of March 31, 2011, the total credit limit used as initial margin required by the NYBOT was R$62,247 (R$136,420 as of March 31, 2011). As a requirement to trade in BM&FBovespa, the Company posted on March 31, 2012, the amount of R$76,436 (R$50,000 as of March 31, 2011) as guarantee in the form of a settlement bond issued by a first-class banking institution.
| h) | Liquidity risk |
| Liquidity risk is the risk that the Company, its subsidiaries and jointly-controlled entities will encounter difficulties in meeting the obligations associated with its derivative financial liabilities that are settled with cash payments or other financial assets. The approach of the Company, its subsidiaries and jointly-controlled entities liquidity management is to ensure, as much as possible, which always has sufficient liquidity to meet its obligations to win, under normal and stress, without causing unacceptable losses or risk damaging the reputation of the Company, its subsidiaries and jointly-controlled entities. |
69
COSAN S.A. INDÚSTRIA E COMÉRCIO
Notes to the consolidated financial statement
Years ended March 31, 2012 and 2011
(In thousands of Reais, except otherwise stated)
| i) | Fair value |
The fair value of financial assets and liabilities is included in the price at which the instrument could be exchanged in a current transaction between parties willing to negotiate, and not in a forced sale or liquidation. The following methods and assumptions were used to estimate the fair value.
Cash and cash equivalents, accounts receivable, accounts payable and other short-term obligations approximate their respective carrying values due largely to short-term maturity of these instruments.
The fair value of marketable securities and bonds is based on price quotations on the date of the financial statements. The fair value of non-negotiable instruments, bank loans and other debts, obligations under finance leases, as well as other non-current financial liabilities are estimated by the discounted future cash flows using rates currently available for debt or deadlines and similar instruments.
The fair market value of Senior Notes due 2014 and 2017, described in note 16, at its market price are 115.5% and 106% respectively, of its face value at March 31, 2012.
The fair market value of Perpetual bonds, described in note 16, at its market price is 105.2%, respectively, of its face value at March 31, 2012.
In respect of other loans and financing, their fair market values substantially approximate the amounts recorded in the financial statements due to the fact that these financial instruments are subject to variable interest rates.
The fair value of financial assets available for sale is obtained through quoted market prices in active markets, if any.
The Company, its subsidiaries and jointly-controlled entities enter into derivative financial instruments with various counterparties, primarily financial institutions with credit ratings of investment grade. The derivatives valued using valuation techniques with observable market data relate mainly to interest rate swaps, foreign exchange contracts and term contracts for commodities futures. The valuation techniques applied more often include pricing models for fixed-term contracts and swaps, with a present value calculation. The models incorporate various data, including credit quality of counterparties, the rates of currency spot and forward, interest rate curves and forward rate curves of the commodity underlying.
Fair value hierarchy
The Company, its subsidiaries and jointly-controlled entities have the following hierarchy to determine and disclose the fair value of financial instruments by the technical evaluation:
| · | Level 1: quoted prices in a active market to identical assets and liabilities; |
| · | Level 2: other techniques for which all data that have significant effect on the fair value recorded are observable, directly or indirectly; |
| · | Level 3: techniques that use data that have significant effect on the fair value recorded that are not based on observable market data. |
70
COSAN S.A. INDÚSTRIA E COMÉRCIO
Notes to the consolidated financial statement
Years ended March 31, 2012 and 2011
(In thousands of Reais, except otherwise stated)
| Assets and liabilities measured at fair value | Level 1 | Level 2 | Total | |||||||||
| March 31, 2012 | ||||||||||||
Warrants Radar | - | 140,820 | 140,820 | |||||||||
| Derivative financial assets | 17,002 | 2,588 | 19,590 | |||||||||
| Derivative financial liabilities | (8,864 | ) | (748 | ) | (9,611 | ) | ||||||
| Total | 8,139 | 142,660 | 150,799 | |||||||||
| March 31, 2011 | ||||||||||||
| Warrants Radar, | - | 162,961 | 162,961 | |||||||||
| Derivative financial assets | 35,577 | 20,105 | 55,682 | |||||||||
| Derivative financial liabilities | (122,084 | ) | (10,205 | ) | (132,289 | ) | ||||||
| Total | (86,507 | ) | 172,861 | 86,354 | ||||||||
| j) | Sensitivity analysis |
Following is the sensitivity analysis of the fair value of financial instruments, in accordance with the types of risks deemed to be significant by the Company and its joint-controlled entities:
Assumptions for sensitivity analysis
For the analysis, the Company, its subsidiaries and jointly-controlled entities adopted three scenarios, being one probable and two that may have effects from impairment of the fair value of the financial instruments. The probable scenario was defined based on the futures sugar and US dollar market curves as of March 31, 2012, the same which determines the fair value of the derivatives at that date. Possible and remote scenarios were defined based on adverse impacts of 25% and 50% over the sugar and dollar price curves, which served as basis for the probable scenario.
Sensitivity exhibit
The sensitivity exhibit is shown below, disclosing the changes in the fair value of the derivative financial instruments in the probable, possible and remote scenarios:
71
COSAN S.A. INDÚSTRIA E COMÉRCIO
Notes to the consolidated financial statement
Years ended March 31, 2012 and 2011
(In thousands of Reais, except otherwise stated)
| Impacts on results (*) | |||||||||||||
| Risk factor | Probable Scenario | Possible Scenario (25%) | Remote Scenario (50%) | ||||||||||
| Price risk | |||||||||||||
| Commodity derivatives | |||||||||||||
| Future agreements | |||||||||||||
| Selling agreements | Increase of the sugar price | 12,001 | (148,432 | ) | (296,864 | ) | |||||||
| Purchasing agreements | Decrease of the sugar price | 194 | (4,971 | ) | (9,941 | ) | |||||||
| Selling agreements | Increase of the Ethanol Hydrated price | (5 | ) | (5,518 | ) | (11,035 | ) | ||||||
| Purchasing agreements | Decrease of the Ethanol Hydrated price | (1 | ) | (3,998 | ) | (7,996 | ) | ||||||
| Option agreements: | |||||||||||||
| Calls Purchased | Decrease of the sugar price | 142 | (142 | ) | (142 | ) | |||||||
| Calls Sold | Increase of the sugar price | (140 | ) | (3,835 | ) | (15,945 | ) | ||||||
| Puts Purchased | Increase of the sugar price | 389 | (389 | ) | (389 | ) | |||||||
| Exchange rate risk | |||||||||||||
| Exchange rate derivatives | |||||||||||||
| Future agreements: | |||||||||||||
| Selling agreements | Increase of the exchange rate R$/US$ | 4,157 | (130,685 | ) | (260,079 | ) | |||||||
| Purchasing agreements | Decrease of the exchange rate R$/US$ | (3,441 | ) | (209,824 | ) | (420,339 | ) | ||||||
| Forward agreements: | |||||||||||||
| Selling agreements | Increase of the exchange rate R$/US$ | (4,395 | ) | (32,103 | ) | (64,206 | ) | ||||||
| Exchange lock: | |||||||||||||
| Selling agreements | Increase of the exchange rate R$/US$ | 1,701 | (30,592 | ) | (61,185 | ) | |||||||
| Option agreements: | |||||||||||||
| Interest rate risk | |||||||||||||
| Derivatives Interest | |||||||||||||
| Swap agreement | Decrease in Libor curve | (747 | ) | (1,100 | ) | (2,208 | ) | ||||||
(*) Results projected to occur within 12 months from March 31, 2012
| k) | Capital management |
The primary objective of the Company’s capital management is to ensure that it maintains a strong credit rating and healthy capital ratios in order to support its business and maximize shareholder value.
Occasionally, the Company purchases its own shares on the market, the timing of these purchases depends on market prices.
No changes were made in the objectives, policies or processes for managing capital during the years ended March 31, 2012 and 2011.
72
COSAN S.A. INDÚSTRIA E COMÉRCIO
Notes to the consolidated financial statement
Years ended March 31, 2012 and 2011
(In thousands of Reais, except otherwise stated)
| 27. | Pension and other post-employment benefits plan |
| 2012 | 2011 | |||||||
| Futura | 34,725 | 24,380 | ||||||
| Other | 2,587 | - | ||||||
| Total | 37,312 | 24,380 | ||||||
| a) | Pension Plan |
Defined benefit
The Company’s subsidiary Cosan Lubricantes e Especialidades S.A. has a noncontributory defined benefit pension plan (Futura -former- Previd Exxon)covering certain employees upon retirement. This plan was altered to allow its settlement and was approved by the relevant authority on May 5, 2011. The settlement is the process whereby the plan is closed to any new entrants, with the cessation of contributions, guaranteeing the participants a benefit that is in proportion to the rights they had accumulated in the plan up until March 31, 2011.
Defined contribution
Since June 1, 2011, the Company and its subsidiaries sponsor a variable contribution plan, for all employees (Futura II). The Company does not have a legal or constructive obligation to pay further contributions if the fund does not have sufficient assets to pay all benefits owed. During the year ended March 31, 2012 the amount of contributions totaled R$5,906.
Since June 1, 2011, the jointly-controlled entities sponsor a defined contribution plan, for all employees (Raiz Prev). The jointly-controlled entities does not have a legal or constructive obligation to pay further contributions if the fund does not have sufficient assets to pay all benefits owed. During the year ended March 31, 2012 the amount of contributions totaled R$8,887.
| b) | Actuarial Liability |
The pension on Futura (former Previd Exxon) demonstrated in non-current liabilities at March 31, 2012 amounted to R$34,725 (R$24.380 in 2011).
Reconciliation of present value of defined benefit obligation and the fair value of plan assets, with assets and liabilities recognized on the balance sheet:
73
COSAN S.A. INDÚSTRIA E COMÉRCIO
Notes to the consolidated financial statement
Years ended March 31, 2012 and 2011
(In thousands of Reais, except otherwise stated)
| 2012 | 2011 | |||||||
| Present value of actuarial obligation at beginning of year | (383,823 | ) | (325,534 | ) | ||||
| Interest costs | (38,345 | ) | (35,107 | ) | ||||
| Current service cost | (455 | ) | (4,445 | ) | ||||
| Benefits paid | 27,845 | 24,637 | ||||||
| Settlement / curtailment | 54,779 | - | ||||||
| Actuarial loss on obligation at beginning of year | (22,716 | ) | (43,374 | ) | ||||
| Present value of actuarial obligation at end of the year | (362,715 | ) | (383,823 | ) | ||||
| Fair value of plan assets at beginning of the year | 359,443 | 347,703 | ||||||
| Expected return on plan assets | 39,000 | 35,918 | ||||||
| Contributions received by the fund | 3,282 | 8,702 | ||||||
| Benefits Paid | (27,846 | ) | (24,637 | ) | ||||
| Effect of migration to defined contribution - Settlement | (32,226 | ) | - | |||||
| Loss in fair value of assets | (13,663 | ) | (8,243 | ) | ||||
| Fair value of plan assets at year-end | 327,990 | 359,443 | ||||||
| Present value of liabilities in excess fair value of assets | (34,725 | ) | (24,380 | ) | ||||
Total expense recognized in profit or loss:
Expense recognized in profit or loss: | 2012 | 2011 | ||||||
| Current service cost | (455 | ) | (4,445 | ) | ||||
| Interest on obligation | (38,345 | ) | (35,107 | ) | ||||
| Expected return on plan assets | 39,000 | 35,918 | ||||||
| 200 | (3,634 | ) | ||||||
Total amount recognized as other comprehensive income:
| 2012 | 2011 | ||
| Amount accumulated at April 1 | (22,621) | (42,056) | |
| Unrecognized gains | 36,379 | 29,447 | |
| Deferred Income Tax | (12,369) | (10,012) | |
| Amount accumulated at March 31st | 1,389 | (22,621) |
Plan assets include:
| 2012 | 2011 | |||||||||||||||
| Amount | Percentage | Amount | Percentage | |||||||||||||
| CDBs – Bank Deposits | 245,993 | 75 | % | 268,863 | 74.80 | % | ||||||||||
| Equity securities of Brazilian public entities | 81,997 | 25 | % | 90,580 | 25.20 | % | ||||||||||
| Total | 327,990 | 100 | % | 359,443 | 100 | % | ||||||||||
Plan assets are represented by financial assets with quoted prices in an active market and therefore are included as a Level 1fair value type. The total expected rate of return on assets is calculated based on market expectations existing at that date applicable to the period over which the obligation should be liquidated. These expectations are reflected in the following main assumptions.
The main assumptions used to determine the pension benefit obligations of the Company are as follows:
74
COSAN S.A. INDÚSTRIA E COMÉRCIO
Notes to the consolidated financial statement
Years ended March 31, 2012 and 2011
(In thousands of Reais, except otherwise stated)
| Defined benefit plan | 2012 | 2011 | |
| Actuarial valuation method | Projected unit credit | Projected unit credit | |
| Mortality table | AT 83 segregated by sex, decreased by 10% | AT 83 segregated by sex, decreased by 10% | |
| Discount rate for actuarial liability | Interest: 9.68% p.a. + inflation: 4.20% % p.a. | Interest: 10.77% p.a. + inflation: 4.50% p.a. | |
| Expected rate of return on plan assets | Interest: 11.30% p.a. + inflation: 4.20% p.a. | Interest: 11.20% p.a. + inflation: 4.50% p.a. | |
| Salary growth rate | Non - Applicable | 6.07% + inflation: 4.50% p.a. | |
| Increase rate of estimated benefits | 0.00% p.a. + inflation: 4.20% p.a. | 0.00% p.a. + inflation: 4.50% p.a. |
The Company expects contributions at the amount of R$ 3,037 to be paid in relation to its defined benefit and variable contribution plan in 2013.
| 28. | Share-Based Payments |
In the shareholder’s meeting held on July 29, 2011, the guidelines for the outlining and structuring of the stock option compensation plan for Cosan S.A.’s officers and employees were approved, authorizing the issuance of up to 5% of shares comprising Cosan S.A.’s total capital. This stock option plan was outlined to attract and retain officers and key employees, offering them the opportunity to become Cosan S.A.’s shareholders. On August 18, 2011, Cosan S.A.’s board of directors approved the total stock option grant corresponding up to 12,000,000 common shares to be issued or treasury shares held by Cosan S.A., corresponding 2.41% of the share capital at that time.
On the same date the eligible executives were informed of the all terms and conditions of the stock-option plan.
Expected Term – Cosan S.A. expected term represents the period that Cosan S.A. share-based awards are expected to be outstanding and was determined based on the assumption that the officers will exercise their options when the exercise period is over. Therefore, this term was calculated based on the average of 5 and 10 years. Cosan S.A. does not expect any forfeiture as those options are mainly for officers, whose turnover is low.
Expected Volatility – For the options granted on September 22, 2005 Cosan S.A. had its shares publicly-traded for less than 6 months as of April 30, 2006. Therefore, Cosan S.A. opted to substitute the historical volatility by an appropriate global industry sector index, based on the volatility of the share prices, and considering it as an assumption in its valuation model. Cosan S.A. has identified and compared similar public entities for which share or option price information is available to consider the historical, expected, or implied volatility of those entities’ share prices in estimating expected volatility based on global scenarios. For the options granted on September 11, 2007 Cosan S.A. used the volatility of its shares as an assumption in its valuation model since Cosan S.A. IPO in Brazil, in 2005.
Expected Dividends – As Cosan S.A. was a relatively new public entity, the expected dividend yield was calculated based on the current value of the stock at the grant date, adjusted by the average rate of the return to shareholders for the expected term, in relation of future book value of the shares.
75
COSAN S.A. INDÚSTRIA E COMÉRCIO
Notes to the consolidated financial statement
Years ended March 31, 2012 and 2011
(In thousands of Reais, except otherwise stated)
Risk-Free Interest Rate – Cosan S.A. bases the risk-free interest rate used the SELIC - Special System Settlement Custody.
According to the average market value of the shares on a 30 day period ending at issuance, the exercise price was defined to be R$22.80 per share, without any discount. The fair value of options granted was estimated using the binomial model in compliance with the terms and conditions of each granted option.
The stock options were divided into “Tranche A” and “Tranche B”. The vesting period is described below.
Tranche A - The options can be exercised after a waiting period of one year, considering a maximum percentage of 20% per annum of the total stock options offered by Cosan S.A. within a period of 5 years. Exercise period ends August 19, 2016.
Tranche B - The options can be exercised after a waiting period of one year, considering a maximum percentage of 10% per annum of the total stock options offered by Cosan S.A. within a period of 10 years. Exercise period ends August 19, 2021.
The options may be exercised with the issuance of new shares or treasury shares that the company may have. The employees that leave Cosan S.A. before the vesting period will forfeit 100% of their rights.
As of August 19, 2011, 9,825,000 options related the shared based compensation was granted.The fair value of share based payments was estimated adopting the binomial model with the following premise:
Options granted on August 18, 2011 Tranche A | Options granted on August 18, 2011 Tranche B | ||
Grant price - R$ | 22.8 | 22.8 | |
| Expected life (in years) | 1 a 5 | 1 a 10 | |
| Interest rate | 12.39% | 12.39% | |
| Expected Volatility | 31.44% | 30.32% | |
| Weighted average fair value at grant date - R$ | 6.80 | 8.15 |
Expected Term – the expected term considers that the executives will exercise their options after the vesting period of each grant.
Expected volatility – Due to the new capital structure and business model after the formation of the JVs, the company opted to use the historic volatility of their shares adjusted by volatility of competitors’ shares that operate in similar lines of business.
Expected dividends – The dividends expected were calculated on the basis of the current market value on the grant’s date, adjusted by the average rate of return of capital to shareholders during the forecast period, and compared with to the book value shares.
Free risk Interest Rate – the company considered the prime rate as the free risk interest rate traded at BM&F Bovespa on the grant date and for the equivalent term of the option maturity.
76
COSAN S.A. INDÚSTRIA E COMÉRCIO
Notes to the consolidated financial statement
Years ended March 31, 2012 and 2011
(In thousands of Reais, except otherwise stated)
As of March 31, 2012, no options have been exercised or forfeited. A total expense of R$ 10,800 has been recorded. As of March 31, 2011, the amount of R$35,354 related to the unrecognized compensation cost from the stock options plan is expected to be recognized over a 10 year period.
| 29. | Segment information (consolidated) |
| a) | Segment information |
The following information about segments is based upon information used by Cosan’s senior management to assess the performance of operating segments and to decide on the allocation of resources.
Considering the formation of JVs Raízen Energia, Raízen Combustíveis and acquisition of the sugar retail business, Cosan has increased the presentation of its segments to five segments, as shown below.The information for prior periods have been reclassified to make them comparable with the information of this period.
| (i) | Raízen Energia: production and marketing of a variety of products derived from sugar cane, including raw sugar (VHP), anhydrous and hydrated ethanol, and activities related to energy cogeneration from sugarcane bagasse. In addition, this segment holds interest in companies of research and development in new technologies involved in this segment. |
| (ii) | Raízen Combustíveis: distribution and marketing of fuels and lubricants, mainly through franchised network of service stations under the brand “Shell” and "Esso" throughout Brazil. |
| (iii) | Rumo: logistics services for the transport, storage and port lifting of sugar for both Raizen Energia and third parties. |
| (iv) | Cosan Alimentos: sale of food, mainly, of sugar in the retail under the brands “União” and “Da Barra”. |
| (v) | Cosan other business: sale and distribution of lubricants, investments in agricultural land (through Radar) and other investments, in addition to the corporate activities of the Company. |
The following selected information result and segment assets that were measured in accordance with the accounting practices used in the preparation of consolidated information:
77
COSAN S.A. INDÚSTRIA E COMÉRCIO
Notes to the consolidated financial statement
Years ended March 31, 2012 and 2011
(In thousands of Reais, except otherwise stated)
| 2012 | |||||||||||||||||||||||||||||||||||||
| Balance Sheet: | Raizen Energia (*) | Raizen Combustiveis (*) | Cosan Alimentos | Rumo | Cosan other business | Eliminations 50% Raizen | Adjustments / Eliminations | Consolidated | |||||||||||||||||||||||||||||
| Property, plant and equipment | 9,658,979 | 2,779,641 | 45,973 | 879,469 | 730,707 | (6,219,310 | ) | (8,496 | ) | 7,866,963 | |||||||||||||||||||||||||||
| Intangible | 2,996,846 | 3,928,900 | 83,597 | 604,963 | 780,822 | - | (3,462,873 | ) | 4,932,255 | ||||||||||||||||||||||||||||
| Loans and Long term debt, net of cash and equivalent cash | (4,404,761 | ) | (603,447 | ) | 29,834 | (217,575 | ) | (706,063 | ) | 2,504,104 | - | (3,397,908 | ) | ||||||||||||||||||||||||
| Other assets and liabilities, net | 1,839,138 | 252,124 | 142,455 | (52,175 | ) | 9,449,796 | (1,045,631 | ) | (10,370,643 | ) | 215,063 | ||||||||||||||||||||||||||
| Total assets (net of liabilities) allocated by segment | 10,090,202 | 6,357,219 | 301,859 | 1,214,682 | 10,255,262 | (4,760,837 | ) | (13,842,013 | ) | 9,616,374 | |||||||||||||||||||||||||||
| Total asset | 19,979,070 | 11,559,239 | 408,966 | 2,029,954 | 15,994,737 | (15,769,155 | ) | (12,078,676 | ) | 22,124,135 | |||||||||||||||||||||||||||
| Profit (loss) for the year: | |||||||||||||||||||||||||||||||||||||
| Net Operating Income | 7,247,685 | 35,096,051 | 706,431 | 571,989 | 1,065,515 | (19,711,867 | ) | (878,923 | ) | 24,096,881 | |||||||||||||||||||||||||||
| Domestic Market | 3,925,829 | 35,096,051 | 706,431 | 567,265 | 1,065,515 | (18,166,988 | ) | (878,923 | ) | 22,315,180 | |||||||||||||||||||||||||||
| Foreign Market | 3,321,856 | - | - | 4,724 | - | (1,544,879 | ) | - | 1,781,701 | ||||||||||||||||||||||||||||
| Gross profit | 1,668,941 | 1,958,726 | 129,073 | 177,923 | 332,646 | (1,635,437 | ) | - | 2,631,872 | ||||||||||||||||||||||||||||
| Selling, general and administrative expenses | (965,440 | ) | (1,445,358 | ) | (96,001 | ) | (41,541 | ) | (320,343 | ) | 1,090,503 | - | (1,778,180 | ) | |||||||||||||||||||||||
| Other operating income, net | - | - | - | - | 3,196,632 | - | - | 3,196,632 | |||||||||||||||||||||||||||||
| Financial income, net | (18,207 | ) | 270,736 | 23,114 | 19,461 | (12,035 | ) | (129,023 | ) | (8,496 | ) | 145,550 | |||||||||||||||||||||||||
| Income tax and social contribution | (267,934 | ) | (82,203 | ) | 1,911 | 8,992 | (356,292 | ) | 221,386 | - | (474,140 | ) | |||||||||||||||||||||||||
| Net income | (27,250 | ) | (192,056 | ) | 6,156 | (55,035 | ) | (935,179 | ) | 93,152 | - | (1,110,212 | ) | ||||||||||||||||||||||||
| Profit (loss) for the year: | 378,269 | 525,916 | 64,253 | 109,801 | 2,775,139 | (353,500 | ) | (855,088 | ) | 2,644,790 | |||||||||||||||||||||||||||
| Other selected information: | |||||||||||||||||||||||||||||||||||||
| Additions to PP&E, intangible assets and biological assets (cash) | 2,577,859 | 491,734 | 2,860 | 268,985 | 99,473 | (1,291,124 | ) | (13,270 | ) | 2,136,517 | |||||||||||||||||||||||||||
| Depreciation and amortization (including the effect of biological assets) | 1,549,993 | 365,603 | 1,716 | 57,323 | 48,329 | (880,184 | ) | - | 1,142,780 | ||||||||||||||||||||||||||||
| 2011 | ||||||||||||||||||||||||
| Raizen Energia (*) | Raizen Combustiveis (*) | Rumo | Cosan other business | Adjustments / Eliminations | Consolidated | |||||||||||||||||||
| Balance Sheet: | ||||||||||||||||||||||||
| Property, plant and equipment | 5,962,230 | 862,185 | 931,997 | 224,112 | - | 7,980,524 | ||||||||||||||||||
| Intangible | 1,644,350 | 528,653 | 358,287 | 914,384 | - | 3,445,674 | ||||||||||||||||||
| Loans and Long term debt, net of cash and equivalent cash | (4,723,833 | ) | (589,229 | ) | (99,829 | ) | (524,334 | ) | - | (5,937,225 | ) | |||||||||||||
| Other assets and liabilities, net | (1,826,735 | ) | (238,736 | ) | (173,826 | ) | 6,655,159 | (3,120,489 | ) | 1,295,373 | ||||||||||||||
| Total assets (net of liabilities) allocated by segment | 1,056,012 | 562,873 | 1,016,629 | 7,269,321 | (3,120,489 | ) | 6,784,346 | |||||||||||||||||
| Total asset | 8,567,722 | 1,777,299 | 1,713,112 | 9,915,149 | (3,228,626 | ) | 18,744,656 | |||||||||||||||||
| Profit (loss) for the year: | ||||||||||||||||||||||||
| Net Operating Income | 6,389,178 | 10,966,245 | 448,003 | 829,032 | (568,978 | ) | 18,063,480 | |||||||||||||||||
| Domestic Market | 3,678,207 | 10,966,245 | 448,003 | 829,032 | (568,978 | ) | 15,352,509 | |||||||||||||||||
| Foreign Market | 2,710,971 | - | - | - | - | 2,710,971 | ||||||||||||||||||
| Gross profit | 1,988,662 | 466,989 | 131,469 | 314,131 | 12,150 | 2,913,401 | ||||||||||||||||||
| Selling, general and administrative expenses | (961,407 | ) | (372,438 | ) | (28,951 | ) | (202,570 | ) | (1,636 | ) | (1,567,002 | ) | ||||||||||||
| Other operating income, net | (65,415 | ) | 33,754 | 9,936 | (1,977 | ) | (10,126 | ) | (33,828 | ) | ||||||||||||||
| Financial income, net | (101,755 | ) | (22,441 | ) | 13,047 | (35,539 | ) | - | (146,688 | ) | ||||||||||||||
| Income tax and social contribution | (305,977 | ) | (40,490 | ) | (42,865 | ) | (25,176 | ) | - | (414,508 | ) | |||||||||||||
| Net income | 833,343 | (126,368 | ) | 62,543 | 240,611 | (238,564 | ) | 771,565 | ||||||||||||||||
| Other selected information: | ||||||||||||||||||||||||
| Additions to PP&E, intangible assets and biological assets (cash) | 2,817,195 | 83,266 | 126,189 | 10,569 | - | 3,037,219 | ||||||||||||||||||
| Depreciation and amortization (including the effect of biological assets) | 1,266,142 | 35,798 | 20,157 | 36,903 | - | 1,359,000 | ||||||||||||||||||
(*) The information of Raízen Energia and Raízen Combustíveis represents 100% of the business, regardless of whether the Company has lost full control of business June 1, 2011 when the formation of JVs occurred. The segment called Raízen Energia is basically the same information as in previous years for the segment called "CAA". The segment Raizen Combustíveis accounts for up to 31 May 2011 the business of the old fuel segment called CCL, except lubricants and since then also fuels business of Shell Brazil Ltda. have been contributed to the JV already mentioned.
78
COSAN S.A. INDÚSTRIA E COMÉRCIO
Notes to the consolidated financial statement
Years ended March 31, 2012 and 2011
(In thousands of Reais, except otherwise stated)
All non-current assets of the Company are located in Brazil except for certain equity interests.
Detailed net Sales per segment:
| 2012 | 2011 | |||||||
| Raízen Energia | ||||||||
| Sugar | 3,912,824 | 3,853,404 | ||||||
| Ethanol | 2,871,515 | 2,203,737 | ||||||
| Cogeneration | 235,129 | 194,889 | ||||||
| Other | 228,217 | 137,148 | ||||||
| 7,247,685 | 6,389,178 | |||||||
| Raízen Combustiveis | ||||||||
| Combustível | 35,032,782 | 10,895,655 | ||||||
| Other | 63,269 | 70,590 | ||||||
| 35,096,051 | 10,966,245 | |||||||
| Alimentos | ||||||||
| Amorphous | 631,532 | - | ||||||
| Crystal | 39,013 | - | ||||||
| Other | 35,885 | - | ||||||
| 706,430 | - | |||||||
| Rumo | ||||||||
| Elevation | 141,026 | 118,139 | ||||||
| Transports | 413,364 | 305,780 | ||||||
| Other | 17,598 | 24,084 | ||||||
| 571,988 | 448,003 | |||||||
| Cosan – other business | ||||||||
| Lubrificantes | 1,018,801 | 829,032 | ||||||
| Other | 46,714 | - | ||||||
| 1,065,515 | 829,032 | |||||||
| Adjustments / Eliminations | (20,590,788 | ) | (568,978 | ) | ||||
| Total | 24,096,881 | 18,063,480 | ||||||
| b) | Net Sales per region |
The percentage of net sales of the Raízen Energia segment by geographic area for the years ended are as follows:
| 2012 | 2011 | |||||||
| Brazil | 67.24 | % | 72.63 | % | ||||
| Europe | 24.18 | % | 24.93 | % | ||||
| Latin America (Except Brazil) | 3.52 | % | ||||||
| Middle East and Asia | 1.00 | % | 1.48 | % | ||||
| North America | 2.94 | % | 0.74 | % | ||||
| Other | 1.12 | % | 0.22 | % | ||||
| Total | 100.00 | % | 100.00 | % | ||||
The net sales from segments Raízen Combustíveis, Rumo and Cosan Alimentos are derived only from the domestic market (Brazil), with no revenue from foreign customers.
79
COSAN S.A. INDÚSTRIA E COMÉRCIO
Notes to the consolidated financial statement
Years ended March 31, 2012 and 2011
(In thousands of Reais, except otherwise stated)
| c) | Concentration of customers |
Raizen Energia
There are several clients in this segment, one of which represents more than 10% of the segment net sales during 2012 and 2011-- the SUCDEN Group (10% and 25%, respectively).
Raizen Combustíveis
In this segment there are no clients that represent more than 10% of the net sales.
Rumo
In 2012, 55% of the segment net sales were generated from sales to the Raizen Energia segment (33% in 2011).
Cosan Other businesses
No customers or specific groups represent 10% or more of sales in 2012 and 2011.
| 30. | Subsequent Events |
| a. | Companhia de Gas de Sao Paulo - Comgás |
On May 3, 2012, Cosan S.A. signed a memorandum of understanding with BG Group (British Gas) to acquire its interest of 60.1% on Companhia de Gas de Sao Paulo – Comgás for R$3.3 billion.
On May 28, 2012, Cosan S.A. signed the purchase and sale agreement in connection with this transaction. This acquisition will be effected upon regulatory approval.
| b. | Association with Camil Alimentos S.A. – Camil |
On May 28, 2012, Cosan S.A.signed an association agreement with Arfei Comercio e Participações S.A. (“Arfei”) and GIF Codajas Participações S.A. (“GIF Codajas”), an investment fund managed by Gávea Invetimentos Ltda. whereby Cosan S.A. will contribute its sugar retail business in exchange for R$345 million cash and a 11.72% interest in Camil, this transaction will be effected upon the fulfilling of certain contractual conditions.
80
SIGNATURES
Pursuant to the requirements of the Securities Exchange Act of 1934, the registrant has duly caused this report to be signed on its behalf by the undersigned, thereunto duly authorized.
COSAN LIMITED | |||||
| Date: | June 4, 2012 | By: | /s/ Marcelo Eduardo Martins | ||
| Name: | Marcelo Eduardo Martins | ||||
| Title: | Chief Financial Officer and Investor Relations Officer | ||||