UNITED STATES
SECURITIES AND EXCHANGE COMMISSION
Washington, D.C. 20549
FORM 10- K
(Mark One)
| T | ANNUAL REPORT PURSUANT TO SECTION 13 OR 15(d) OF THE SECURITIES EXCHANGE ACT OF 1934 |
For the fiscal ended December 31, 2007.
or
* | TRANSITION REPORT PURSUANT TO SECTION 13 OR 15(d) OF THE SECURITIES EXCHANGE ACT OF 1934 |
For the transition period from ______________ to ______________.
Commission file number: 000-52748
FIRST GUARANTY BANCSHARES, INC.
(Exact name of registrant as specified in its charter)
| Louisiana | 26-0513559 |
| (State or other jurisdiction | (I.R.S. Employer |
| incorporation or organization) | Identification Number) |
| | |
| 400 East Thomas Street | |
| Hammond, Louisiana | 70401 |
| (Address of principal executive offices) | (Zip Code) |
| |
| (985) 345-7685 |
| (Registrant’s telephone number, including area code) |
| |
| Not Applicable |
| (Former name or former address, if changed since last report) |
| |
| Securities registered pursuant to Section 12(b) of the Act: None |
| |
| Securities registered pursuant to Section 12(g) of the Act: |
| | |
| Title of each class | Name of each exchange on which registered |
| Common Stock, $1 par value per share | None |
Indicate by check mark if the registrant is a well-known seasoned issuer, as defined in Rule 405 of the Securities Act. YES * NO T
Indicate by check mark if the registrant is not required to file reports pursuant to Section 13 or Section 15(d) of the Act. YES * NO T
Indicate by check mark whether the Registrant (1) has filed all reports required to be filed by Section 13 or 15(d) of the Securities Exchange Act of 1934 during the preceding 12 months (or for such shorter period that the registrant was required to file such reports), and (2) has been subject to such filing requirements for the past 90 days. YES T NO *
Indicate by check mark if disclosure of delinquent filers pursuant to Item 405 of Regulation S-K (§229.405 of this chapter) is not contained herein, and will not be contained, to the best of registrant’s knowledge, in definitive proxy or information statements incorporated by reference in Part III of this Form 10-K or any amendment to this Form 10-K. *
Indicate by check mark whether the registrant is a large accelerated filer, an accelerated filer, a non-accelerated filer, or a smaller reporting company. See definitions of “large accelerated filer,” “accelerated filer” and “smaller reporting company” in Rule 12b-2 of the Exchange Act. (Check one):
Large accelerated filer * Accelerated filer * Non-accelerated filer * Smaller reporting company T
Indicate by check mark whether the registrant is a shell company (as defined in Rule 12b-2 of the Act). YES * NO T
The Company did not have public float at June 30, 2007. First Guaranty Bancshares, Inc. was formed on July 30, 2007. The common stock is not quoted or traded on an exchange. There is no established or liquid market for the common stock.
As of March 27, 2008, there were issued and outstanding 5,559,644 shares of the Registrant’s Common Stock.
DOCUMENTS INCORPORATED BY REFERENCE:
(1) Proxy Statement for the 2008 Annual Meeting of Stockholders of the Registrant (Part III).
| | | Page |
| Part I. | | |
| Item 1 | | 3 |
| Item 1A | | 11 |
| Item 1B | | 14 |
| Item 2 | | 15 |
| Item 3 | | 16 |
| Item 4 | | 16 |
| | | |
| Part II. | | |
| Item 5 | | |
| | | 16 |
| Item 6 | | 16 |
| Item 7 | | 18 |
| Item 7A | | 37 |
| Item 8 | | 39 |
| Item 9 | | 64 |
Item 9a(T) | | 64 |
| Item 9B | | 65 |
| | | |
| Part III. | | |
| Item 10 | | 65 |
| Item 11 | | 65 |
| Item 12 | | 65 |
| Item 13 | | 65 |
| Item 14 | | 65 |
| | | |
| Part IV. | | |
| Item 15 | | 66 |
(references to “our,” “we” or similar terms under this subheading refer to First Guaranty Bancshares, Inc.)
Background
First Guaranty Bancshares, Inc. (the “Company”) is a Louisiana corporation. On July 27, 2007, First Guaranty Bancshares, Inc. became the holding company for First Guaranty Bank pursuant to an Agreement and Plan of Exchange dated as of July 27, 2007 (the “Agreement”). Pursuant to the Agreement, on the Effective Date, each issued and outstanding share of the Bank’s common stock, par value $1.00 per share, automatically was converted into and exchanged for one share of the Company’s common stock, par value $1.00 per share. No stockholders exercised dissenters’ rights of appraisal. On the Effective Date, the Bank became a wholly owned subsidiary of the Company and the stockholders of the Bank became stockholders of the Company. No additional shares were offered or sold in connection with the Reorganization. The Company owns all of the outstanding shares of common stock of First Guaranty Bank. The Company’s executive office is located at 400 East Thomas Street, Hammond, Louisiana 70401. The telephone number is (985) 345-7685. The Company is subject to extensive regulation by the Federal Reserve Bank (“FRB”).
First Guaranty Bank (“Bank”) is a state chartered commercial bank with 18 full service banking facilities located in southeast, southwest and north Louisiana. The Bank was organized under Louisiana law under the name Guaranty Bank and Trust Company in 1934 and changed its name to First Guaranty Bank in 1971. Deposits are insured up to the maximum legal limits by the FDIC. The Bank is not a member of the Federal Reserve System. As of December 31, 2007, the Bank was the fifth largest Louisiana-based bank and the fourth largest Louisiana bank not headquartered in New Orleans, as measured by total assets.
Business Objective
The Company’s business objective is to be a bank holding company of a customer-driven financial institution focused on providing value to customers by delivering products and services matched to customer needs. We emphasize personal relationships and localized decision making. The Board of Directors and senior Management have extensive experience and contacts in our marketplace and are an important source of new business opportunities.
The Company’s business plan emphasizes both growth and profitability. From December 31, 2003 to December 31, 2007, assets have grown from $484.7 million to $807.3 million. During this period, the number of full-service banking center locations increased from 15 locations to 18 locations. As a result of our acquisition of Homestead Bancorp in July 2007, we acquired two branch offices. Upon completion of our acquisition of First Community Bank, we will acquire two new branches, one in Hammond, Louisiana and the other in Mandeville, Louisiana. The acquisition is subject to customary conditions, including the approval of the shareholders of First Community Holding Company and the approval of certain financial institution regulatory authorities.
Market Areas
Our focus is on the bedroom communities of metropolitan markets, small cities and rural areas in southeast, southwest and north Louisiana. In southeast Louisiana, eight branches are located in Tangipahoa Parish in the towns of Amite, Hammond (2), Independence, Kentwood and Ponchatoula (3). Two branches are located in Livingston Parish, one branch in Denham Springs and the other in Walker. In southwest Louisiana, we have branches in Abbeville in Vermillion Parish and in Jennings in Jefferson Davis Parish. The remaining six branches are located in north Louisiana, in Haynesville and Homer, which are both in Claiborne Parish; in Oil City and Vivian, both in Caddo Parish; in Dubach in Lincoln Parish and Benton, in Bossier Parish. Our core market remains in the home parish of Tangipahoa where approximately 51.0% of deposits and 50.6% of net loans were based in 2007.
Our southeast Louisiana market is strategically located near the intersection of Interstates 12 and 55, which places it at a crossroads of commercial activity for the southeastern United States. In addition, this market area is largely populated by the work force of several nearby petrochemical refineries and other industrial plants and is a bedroom community for the urban centers of New Orleans and Baton Rouge, which are approximately 45 miles and 60 miles, respectively, from Hammond, where the main office is located. Hammond is home to one of the largest medical centers in the state of Louisiana and the third largest state university in Louisiana.
Our southwest Louisiana market benefits from a profitable casino gaming industry and substantial tourism revenue derived from the Louisiana Acadian culture. It also has a concentration of oilfield and oilfield services activity and is a thriving agricultural center for rice, sugarcane and crawfish.
Timber cultivation and its related industries, including milling and logging, are key commercial activities in the north Louisiana market. It is also an agrarian center in which corn, cotton and soybeans are the primary crops. The poultry industry, including independent poultry grower farms that contract with national poultry processing companies, are also very important to the local economy.
Banking Products and Services
The Company offers personalized commercial banking services to businesses, professionals and individuals. We offer a variety of deposit products including personal and business checking and savings accounts, time deposits, money market accounts and NOW accounts. Other services provided include personal and commercial credit cards, remote deposit capture, safe deposit boxes, money orders, travelers’ checks and lockbox services. Also offered is 24-hour banking through internet banking, voice response and 25 automated teller machines. Although full trust powers have been granted, we do not actively operate or have any present intentions to activate a trust department.
Loans
The Bank is engaged in a diversity of lending activities to serve the credit needs of its customer base including commercial loans, commercial real estate loans, real estate construction loans, mortgage loans, agricultural loans, home equity lines of credit, equipment loans, inventory financing and student loans. In addition, the Bank provides consumer loans for a variety of reasons such as the purchase of automobiles, recreational vehicles or boats, investments or other consumer needs. The Bank issues MasterCard and Visa credit cards and provides merchant processing services to commercial customers. The loan portfolio is divided, for regulatory purposes, into four broad classifications: (i) real estate loans, which include all loans secured in whole or part by real estate; (ii) agricultural loans, comprised of all farm loans; (iii) commercial and industrial loans, which include all commercial and industrial loans that are not secured by real estate; and (iv) consumer loans.
Competition
The banking business in Louisiana is extremely competitive. We compete for deposits and loans with existing Louisiana and out-of-state financial institutions that have longer operating histories, larger capital reserves and more established customer bases. The competition includes large financial services companies and other entities in addition to traditional banking institutions such as savings and loan associations, savings banks, commercial banks and credit unions.
Many of our larger competitors have a greater ability to finance wide-ranging advertising campaigns through their greater capital resources. Marketing efforts depend heavily upon referrals from officers, directors and shareholders, selective advertising in local media and direct mail solicitations. We compete for business principally on the basis of personal service to customers, customer access to officers and directors and competitive interest rates and fees.
In the financial services industry, intense market demands, technological and regulatory changes and economic pressures have eroded industry classifications in recent years that were once clearly defined. Financial institutions have been forced to diversify their services, increase rates paid on deposits and become more cost effective, as a result of competition with one another and with new types of financial services companies, including non-banking competitors. Some of the results of these market dynamics in the financial services industry have been a number of new bank and non-bank competitors, increased merger activity, and increased customer awareness of product and service differences among competitors. These factors could affect business prospects.
Employees
At December 31, 2007, we had 204 full-time and 36 part-time employees. None of our employees are represented by a collective bargaining group. The Company has a good relationship with its employees.
Data Processing
Since November 2001, customer information has been housed on equipment owned by Financial Information Service Corporation or FISC. FISC is a cooperative jointly owned by a number of Louisiana and Mississippi state banks that are currently serviced by FISC. The 2007 annual cost of this service was $696,000. The current arrangements are adequate and are expected to be able to accommodate our needs for the foreseeable future.
Information Technology Infrastructure
Our wide area network links more than 25 remote sites using a fully meshed multiple protocol layered switch network with virtual private networking throughout to authenticate to a Novell-Citrix hybrid server ecosystem. We have over 350 embedded devices that can be remotely administered in a secure manner from any other location. The employees are not limited to their branch location, but instead can access the network and authenticate securely from any branch. We have a redundant back-up site located at the far northwestern corner of the state in Homer, Louisiana.
Subsidiaries
The Company is a one-bank holding company with First Guaranty Bank as its subsidiary. The Company also acquired a non-bank subsidiary during the Homestead Bank merger. See Note 3 to the Consolidated Financial Statements. Homestead Bancorp Trust I is a trust established for the sole purpose of issuing trust preferred securities and using the proceeds to purchase junior subordinated debentures issued by Homestead Bancorp. These securities were assumed by the Company in connection with the acquisition of Homestead Bancorp.
Regulatory Compliance
First Guaranty Bank is a Federal Deposit Insurance Corporation (“FDIC”) insured, non-member Louisiana state bank. Regulation of financial institutions is intended primarily to protect depositors, the deposit insurance funds of the FDIC and the banking system as a whole, and generally is not intended to protect stockholders or other investors.
The Bank is subject to regulation and supervision by both the Louisiana Office of Financial Institutions and the FDIC. In addition, the Bank is subject to various requirements and restrictions under federal and state law, including requirements to maintain reserves against deposits, restrictions on the types and amounts of loans that are made and the interest that is charged on those loans, and limitations on the types of investments that are made and the types of services that are offered. Various consumer laws and regulations also affect operations. See “Regulation and Supervision.”
Regulation and Supervision
Banking is a complex, highly regulated industry. Consequently, the growth and earnings performance of First Guaranty Bancshares, Inc. and its subsidiary bank can be affected not only by Management decisions and general and local economic conditions, but also by the statutes administered by, and the regulations and policies of, various governmental regulatory authorities. These authorities include, but are not limited to, the FRB, the FDIC, the Louisiana Office of Financial Institutions (“OFI”) the U.S. Internal Revenue Service and state taxing authorities. The effect of these statutes, regulations and policies and any changes to any of them can be significant and cannot be predicted.
The primary goals of the regulatory scheme are to maintain a safe and sound banking system and to facilitate the conduct of sound monetary policy. In furtherance of these goals, Congress has created several largely autonomous regulatory agencies and enacted numerous laws that govern banks, bank holding companies and the banking industry. The system of supervision and regulation applicable to First Guaranty Bancshares, Inc. establishes a comprehensive framework for their respective operations and is intended primarily for the protection of the FDIC’s deposit insurance funds, depositors and the public, rather than the shareholders and creditors. The following is an attempt to summarize some of the relevant laws, rules and regulations governing banks and bank holding companies, but does not purport to be a complete summary of all such applicable laws, rules and regulations. The descriptions are qualified in their entirety by reference to the specific statutes and regulations discussed.
First Guaranty Bancshares, Inc.
General. First Guaranty Bancshares, Inc. is a bank holding company registered with, and subject to regulation by, the FRB under the Bank Holding Company Act of 1956, as amended (the “Bank Holding Company Act”). The Bank Holding Company Act and other federal laws subject bank holding companies to particular restrictions on the types of activities in which they may engage, and to a range of supervisory requirements and activities, including regulatory enforcement actions for violations of laws and regulations.
In accordance with FRB policy, a bank holding company, such as First Guaranty Bancshares, Inc., is expected to act as a source of financial strength to its subsidiary banks and commit resources to support its banks. This support may be required under circumstances when we might not be inclined to do so absent this FRB policy.
Certain Acquisitions. Federal law requires every bank holding company to obtain the prior approval of the FRB before (i) acquiring more than five percent of the voting stock of any bank or other bank holding company, (ii) acquiring all or substantially all of the assets of any bank or bank holding company, or (iii) merging or consolidating with any other bank holding company.
Additionally, federal law provides that the FRB may not approve any of these transactions if it would result in or tend to create a monopoly or substantially lessen competition or otherwise function as a restraint of trade, unless the anti-competitive effects of the proposed transaction are clearly outweighed by the public interest in meeting the convenience and needs of the community to be served. The FRB is also required to consider the financial and managerial resources and future prospects of the bank holding companies and banks concerned and the convenience and needs of the community to be served. Further, the FRB is required to consider the record of a bank holding company and its subsidiary bank(s) in combating money laundering activities in its evaluation of bank holding company merger or acquisition transactions.
Under the Bank Holding Company Act, if adequately capitalized and adequately managed, any bank holding company located in Louisiana may purchase a bank located outside of Louisiana. However, as discussed below, restrictions currently exist on the acquisition of a bank that has only been in existence for a limited amount of time or will result in specified concentrations of deposits.
Change in Bank Control. The Bank Holding Company Act and the Change in Bank Control Act of 1978, as amended, generally require FRB approval prior to any person or company acquiring control of a bank holding company. Control is conclusively presumed to exist if an individual or company acquires 25% or more of any class of voting securities of the bank holding company. Control is rebuttably presumed to exist if a person or company acquires 10% or more, but less than 25%, of any class of voting securities.
Permitted Activities. Generally, bank holding companies are prohibited by federal law from engaging in or acquiring direct or indirect control of more than 5% of the voting shares of any company engaged in any activity other than (i) banking or managing or controlling banks or (ii) an activity that the FRB determines to be so closely related to banking as to be a proper incident to the business of banking.
Activities that the FRB has found to be so closely related to banking as to be a proper incident to the business of banking include:
| · | factoring accounts receivable; |
| · | making, acquiring, brokering or servicing loans and usual related activities; |
| · | leasing personal or real property; |
| · | operating a non-bank depository institution, such as a savings association; |
| · | trust company functions; |
| · | financial and investment advisory activities; |
| · | conducting discount securities brokerage activities; |
| · | underwriting and dealing in government obligations and money market instruments; |
| · | providing specified Management consulting and counseling activities; |
| · | performing selected data processing services and support services; |
| · | acting as agent or broker in selling credit life insurance and other types of insurance in connection with credit transactions; and |
| · | performing selected insurance underwriting activities. |
Despite prior approval, the FRB has the authority to require a bank holding company to terminate an activity or terminate control of or liquidate or divest certain subsidiaries or affiliates when the FRB believes the activity or the control of the subsidiary or affiliate constitutes a significant risk to the financial safety, soundness or stability of any of its banking subsidiaries. A bank holding company that qualifies and elects to become a financial holding company is permitted to engage in additional activities that are financial in nature or incidental or complementary to financial activity. The Bank Holding Company Act expressly lists the following activities as financial in nature:
| · | lending, exchanging, transferring, investing for others, or safeguarding money or securities; |
| · | insuring, guaranteeing or indemnifying against loss or harm, or providing and issuing annuities, and acting as principal, agent or broker for these purposes, in any state; |
| · | providing financial, investment or advisory services; |
| · | issuing or selling instruments representing interests in pools of assets permissible for a bank to hold directly; |
| · | underwriting, dealing in or making a market in securities; |
| · | other activities that the FRB may determine to be so closely related to banking or managing or controlling banks as to be a proper incident to managing or controlling banks; |
| · | foreign activities permitted outside of the United States if the FRB has determined them to be usual in connection with banking operations abroad; |
| · | merchant banking through securities or insurance affiliates; and |
| · | insurance company portfolio investments. |
To qualify to become a financial holding company, First Guaranty Bancshares, Inc. and its subsidiary bank must be well-capitalized and well managed and must have a Community Reinvestment Act rating of at least satisfactory. Additionally, First Guaranty Bancshares, Inc. would be required to file an election with the FRB to become a financial holding company and to provide the FRB with 30 days’ written notice prior to engaging in a permitted financial activity. A bank holding company that falls out of compliance with these requirements may be required to cease engaging in some of its activities. First Guaranty Bancshares, Inc. currently has no plans to make a financial holding company election.
Anti-tying Restrictions. Bank holding companies and affiliates are prohibited from tying the provision of services, such as extensions of credit, to other services offered by a holding company or its affiliates.
Deposit Insurance Assessments. Banks must pay assessments to the FDIC for federal deposit insurance protection. The FDIC has adopted a risk-based assessment system. Under this system, FDIC-insured depository institutions pay insurance premiums at rates based on their risk classification. Institutions assigned to higher risk classifications (that is, institutions that pose a higher risk of loss to their respective deposit insurance funds) pay assessments at higher rates than institutions that pose a lower risk. An institution’s risk classification is assigned based on its capital levels and the level of supervisory concern the institution poses to the regulators. In addition, the FDIC can impose special assessments in certain instances. The FDIC may terminate its insurance of deposits if it finds that the institution has engaged in unsafe and unsound practices, is in an unsafe or unsound condition to continue operations, or has violated any applicable law, regulation, rule, order, or condition imposed by the FDIC. A bank’s deposit insurance assessments may increase or decrease depending on the risk assessment classification to which we are assigned by the FDIC. Any increase in insurance assessments could have an adverse effect on First Guaranty’s earnings.
Other Regulations. Interest and other charges collected or contracted is subject to state usury laws and federal laws concerning interest rates. Loan operations are also subject to federal laws applicable to credit transactions, such as:
| · | the federal “Truth-In-Lending Act,” governing disclosures of credit terms to consumer borrowers; |
| · | the “Home Mortgage Disclosure Act of 1975,” requiring financial institutions to provide information to enable the public and public officials to determine whether a financial institution is fulfilling its obligation to help meet the housing needs of the community it serves; |
| · | the “Equal Credit Opportunity Act,” prohibiting discrimination on the basis of race, creed or other prohibited factors in extending credit; |
| · | the “Fair Credit Reporting Act of 1978,” governing the use and provision of information to credit reporting agencies; |
| · | the “Real Estate Settlement Procedures Act”; |
| · | the “Fair Debt Collection Act,” governing the manner in which consumer debts may be collected by collection agencies; and |
| · | the rules and regulations of the various federal agencies charged with the responsibility of implementing these federal laws. |
The deposit operations are subject to:
| · | the “Right to Financial Privacy Act,” which imposes a duty to maintain confidentiality of consumer financial records and prescribes procedures for complying with administrative subpoenas of financial records; |
| · | the “Electronic Funds Transfer Act” and Regulation E issued by the FRB to implement that act, which govern automatic deposits to and withdrawals from deposit accounts and customers’ rights and liabilities arising from the use of automated teller machines and other electronic banking services; |
| · | the “Truth-In Savings Act”; and |
| · | the “Expedited Funds Availability Act”. |
Dividends. The Company is a legal entity separate and distinct from its subsidiary, First Guaranty Bank. The majority of the Company’s revenue is from dividends paid to the Company by the Bank. First Guaranty Bank may not pay dividends or distribute capital assets if it is in default on any assessment due to the FDIC. The FRB has indicated generally that it may be an unsafe or unsound practice for a bank holding company to pay dividends unless the bank holding company’s net income over the preceding year is sufficient to fund the dividends and the expected rate of earnings retention is consistent with the organization’s capital needs, asset quality and overall financial condition.
First Guaranty Bank is also subject to regulations that impose minimum regulatory capital and minimum state law earnings requirements that affect the amount of cash available for distribution. In addition, under the Louisiana Banking Law, dividends may not be paid if it would reduce the unimpaired surplus below 50% of outstanding capital stock in any year. The Company does not expect that these laws, regulations or policies will materially affect the ability of the Bank to pay dividends.
Capital Adequacy. The FRB monitors the capital adequacy of bank holding companies, such as First Guaranty Bancshares, Inc., and the OFI and FDIC monitor the capital adequacy of First Guaranty Bank. The federal bank regulators use a combination of risk-based guidelines and leverage ratios to evaluate capital adequacy and consider these capital levels when taking action on various types of applications and when conducting supervisory activities related to safety and soundness. The risk-based guidelines apply on a consolidated basis to bank holding companies with consolidated assets of $500 million or more and, generally, on a bank-only basis for bank holding companies with less than $500 million in consolidated assets. Each insured depository subsidiary of a bank holding company with less than $500 million in consolidated assets is expected to be “well-capitalized.”
The risk-based capital standards are designed to make regulatory capital requirements more sensitive to differences in risk profiles among banks and their holding companies, to account for off-balance sheet exposure, and to minimize disincentives for holding liquid assets. Assets and off-balance sheet items, such as letters of credit and unfunded loan commitments, are assigned to broad risk categories, each with appropriate risk weights. The resulting capital ratios represent capital as a percentage of total risk-weighted assets and off-balance sheet items.
The minimum guideline for the ratio of total capital to risk-weighted assets is 8%. Total capital consists of two components, Tier 1 Capital and Tier 2 Capital. Tier 1 Capital generally consists of common stock, minority interests in the equity accounts of consolidated subsidiaries, noncumulative perpetual preferred stock and a limited amount of qualifying cumulative perpetual preferred stock, less goodwill and other specified intangible assets. Tier 1 Capital must equal at least 4% of risk-weighted assets. Tier 2 Capital generally consists of subordinated debt, preferred stock (other than that which is included in Tier I Capital), and a limited amount of loan loss reserves. The total amount of Tier 2 Capital is limited to 100% of Tier 1 Capital.
In addition, the FRB has established minimum leverage ratio guidelines for bank holding companies with assets of $500 million or more. These guidelines provide for a minimum ratio of Tier 1 Capital to average assets, less goodwill and other specified intangible assets, of 3% for bank holding companies that meet specified criteria, including having the highest regulatory rating and implementing the FRB’s risk-based capital measure for market risk. All other bank holding companies with assets of $500 million or more generally are required to maintain a leverage ratio of at least 4%. The guidelines also provide that bank holding companies of such size experiencing internal growth or making acquisitions will be expected to maintain strong capital positions substantially above the minimum supervisory levels without reliance on intangible assets. The FRB considers the leverage ratio and other indicators of capital strength in evaluating proposals for expansion or new activities. The FRB and the FDIC recently adopted amendments to their risk-based capital regulations to provide for the consideration of interest rate risk in the agencies’ determination of a banking institution’s capital adequacy.
Failure to meet capital guidelines could subject a bank or bank holding company to a variety of enforcement remedies, including issuance of a capital directive, the termination of federal deposit insurance, a prohibition on accepting brokered deposits and other restrictions on its business.
Concentrated Commercial Real Estate Lending Regulations. The FRB and FDIC have recently promulgated guidance governing financial institutions with concentrations in commercial real estate lending. The guidance provides that a company has a concentration in commercial real estate lending if (i) total reported loans for construction, land development, and other land represent 100% or more of total capital or (ii) total reported loans secured by multifamily and non-farm residential properties and loans for construction, land development, and other land represent 300% or more of total capital and the outstanding balance of such loans has increased 50% or more during the prior 36 months. If a concentration is present, Management must employ heightened risk Management practices including board and Management oversight and strategic planning, development of underwriting standards, risk assessment and monitoring through market analysis and stress testing, and increasing capital requirements. The Company is subject to these regulations.
Prompt Corrective Action Regulations. Under the prompt corrective action regulations, bank regulators are required and authorized to take supervisory actions against undercapitalized banks. For this purpose, a bank is placed in one of the following five categories based on its capital:
| · | well-capitalized (at least 5% leverage capital, 6% Tier 1 risk-based capital and 10% total risk-based capital); |
| · | adequately capitalized (at least 4% leverage capital, 4% Tier 1 risk-based capital and 8% total risk-based capital); |
| · | undercapitalized (less than 8% total risk-based capital, 4% Tier 1 risk-based capital or 3% leverage capital); |
| · | significantly undercapitalized (less than 6% total risk-based capital, 3% Tier 1 risk-based capital or 3% leverage capital); and |
| · | critically undercapitalized (less than 2% tangible capital). |
Federal banking regulators are required to take various mandatory supervisory actions and are authorized to take other discretionary actions with respect to institutions in the three undercapitalized categories. The severity of the action depends upon the capital category in which the institution is placed. Generally, subject to a narrow exception, banking regulators must appoint a receiver or conservator for an institution that is “critically undercapitalized.” The federal banking agencies have specified by regulation the relevant capital level for each category. An institution that is categorized as “undercapitalized”, “significantly undercapitalized” or “critically undercapitalized” is required to submit an acceptable capital restoration plan to its appropriate federal banking agency. A bank holding company must guarantee that a subsidiary depository institution meets its capital restoration plan, subject to various limitations. The controlling holding company’s obligation to fund a capital restoration plan is limited to the lesser of 5% of an “undercapitalized” subsidiary’s assets at the time it became “undercapitalized” or the amount required to meet regulatory capital requirements. An “undercapitalized” institution is also generally prohibited from increasing its average total assets, making acquisitions, establishing any branches or engaging in any new line of business, except under an accepted capital restoration plan or with regulatory approval. The regulations also establish procedures for downgrading an institution to a lower capital category based on supervisory factors other than capital.
Restrictions on Transactions with Affiliates and Loans to Insiders. First Guaranty Bank is subject to the provisions of Section 23A of the FRB Act and its implementing regulations. These provisions place limits on the amount of:
| · | First Guaranty Bank’s loans or extensions of credit to affiliates; |
| · | First Guaranty Bank’s investment in affiliates; |
| · | assets that First Guaranty Bank may purchase from affiliates, except for real and personal property exempted by the FRB; |
| · | the amount of loans or extensions of credit to third parties collateralized by the securities or obligations of affiliates; and |
| · | First Guaranty Bank’s guarantee, acceptance or letter of credit issued on behalf of an affiliate. |
The total amount of the above transactions is limited in amount, as to any one affiliate, to 10% of First Guaranty Bank’s capital and surplus and, as to all affiliates combined, to 20% of its capital and surplus. In addition to the limitation on the amount of these transactions, each of the above transactions must also meet specified collateral requirements.
First Guaranty Bank is also subject to the provisions of Section 23B of the FRB Act and its implementing regulations, which, among other things, prohibit First Guaranty Bank from engaging in any transaction with an affiliate, such as First Guaranty Bancshares, Inc., unless the transaction is on terms substantially the same, or at least as favorable to First Guaranty Bank as those prevailing at the time for comparable transactions with nonaffiliated companies.
First Guaranty Bank is also subject to restrictions on extensions of credit to its executive officers, directors, principal shareholders and their related interests. These types of extensions of credit must be made on substantially the same terms, including interest rates and collateral, as those prevailing at the time for comparable transactions with third parties and must not involve more than the normal risk of repayment or present other unfavorable features.
Anti-terrorism Legislation. Financial institutions are required to establish anti-money laundering programs. In 2001, the USA PATRIOT Act was enacted. The USA PATRIOT Act significantly enhanced the powers of the federal government and law enforcement organizations to combat terrorism, organized crime and money laundering. While the USA PATRIOT Act imposed additional anti-money laundering requirements, these additional requirements are not material to our operations.
Aside from the above, the USA PATRIOT Act also requires the federal banking regulators to assess the effectiveness of an institution’s anti-money laundering program in connection with merger and acquisition transactions. Failure to maintain an effective anti-money laundering program is grounds for the denial of merger or acquisition transactions.
Federal Securities Laws
First Guaranty Bancshares, Inc. common stock is registered with the Securities and Exchange Commission under the Securities Exchange Act of 1934. First Guaranty Bancshares, Inc. will continue to be subject to the information, proxy solicitation, insider trading restrictions and other requirements under the Securities Exchange Act of 1934.
Non-Banking Activities
The Gramm-Leach-Bliley Act of 1999 eliminated most of the barriers to affiliations among banks and securities firms, insurance companies and other financial companies previously imposed under federal banking laws if certain criteria are satisfied. The financial subsidiaries of “well capitalized” banks are generally permitted to engage in activities that are financial in nature including securities underwriting, dealing and market making; sponsoring mutual funds and investment companies; insurance brokerage and underwriting activities; merchant banking activities; and other activities that the Federal Reserve Board has determined to be closely related to banking.
Brokered Deposits and Pass-Through Insurance
An FDIC-insured depository institution cannot accept, rollover or renew brokered deposits unless it is well capitalized or adequately capitalized and receives a waiver from the FDIC. A depository institution that cannot receive brokered deposits also cannot offer “pass-through” insurance on certain employee benefit accounts. Whether or not it has obtained such a waiver, an adequately capitalized depository institution may not pay an interest rate on any deposits in excess of 75 basis points over certain prevailing market rates specified by regulation. As of December 31, 2007, the Bank did not have brokered deposits.
Interstate Branching
Effective June 1, 1997, the Riegle-Neal Interstate Banking and Branching Efficiency Act of 1994 permits state and national banks with different home states to operate branches across state lines with approval of the appropriate federal banking agency, unless the home state of a participating bank passed legislation “opting out” of interstate banking. This federal law allows branching through acquisition only, which means a bank must acquire another bank and merge the two institutions in order to operate across state lines. If a state opted out of interstate branching within a specified time period, no bank in any other state may establish a branch in the state which has opted out, whether through an acquisition or de novo. Louisiana did not opt out of this law. The Company currently has no branches located outside of Louisiana.
FDIC Deposit Insurance Assessments
The Bank is subject to FDIC deposit insurance assessments for deposit insurance under the Deposit Insurance Fund. The FDIC’s current risk-based system places a bank in a risk assessment category, principally on the basis of its capital level and an evaluation of the bank’s risk to the fund, and bases premiums on the probability of loss to the FDIC with respect to each individual bank.
As of December 2007, the Bank was a risk category I for assessment purposes. Total assessments paid to the FDIC amounted to $91,900 in 2007 and $167,900 in 2006.Under the provisions of the Federal Deposit Insurance Reform Act of 2005, the Bank received a one-time FDIC assessment credit of $245,000 to be used against deposit insurance assessments beginning January 1, 2007. This credit was used up completely to offset the FDIC assessment for 2007.
The FDIC may terminate the deposit insurance of any insured depository institution if it determines that the institution has engaged or is engaging in unsafe or unsound practices, is in an unsafe or unsound condition to continue operations or has violated any applicable law, regulation, order or any condition imposed by an agreement with the FDIC. If insurance of accounts is terminated, the accounts at the institution at the time of the termination, less subsequent withdrawals, continue to be insured for a period of six months to two years, as determined by the FDIC. The Bank is not aware of any existing circumstances which would result in the termination of deposit insurance.
Community Reinvestment Act
Under the Community Reinvestment Act, or CRA, a financial institution has a continuing and affirmative obligation, consistent with its safe and sound operation, to help meet the credit needs of its entire community, including low and moderate income neighborhoods. The FDIC assigns banks a CRA rating of “outstanding,” “satisfactory,” “needs to improve” or “substantial noncompliance,” and the bank must publicly disclose its rating. The FDIC rated the Bank as “satisfactory” in meeting community credit needs under the CRA at its most recent CRA performance examination.
Privacy Provisions
Under the Gramm-Leach-Bliley Act, federal banking regulators have adopted new rules requiring disclosure of privacy policies and information sharing practices to consumers. These rules prohibit depository institutions from sharing customer information with nonaffiliated parties without the customer’s consent, except in limited situations, and require disclosure of privacy policies to consumers and, in some circumstances, enable consumers to prevent disclosure of personal information to nonaffiliated third parties. In addition, the Fair and Accurate Credit Transactions Act of 2003 requires banks to notify their customers if they report negative information about them to a credit bureau or if they grant credit to them on terms less favorable than those generally available.
The Company has instituted risk Management systems to comply with all required privacy provisions and believes that the new disclosure requirements and implementation of the privacy laws will not materially increase operating expenses.
Check 21
The Check 21 Act facilitates check truncation and electronic check exchange by authorizing a new negotiable instrument called a “substitute check”. The Act provides that a properly prepared substitute check is the legal equivalent of the original check for all purposes. This law supercedes contradictory state laws (i.e., state laws that allow customers to demand the return of original checks).
Although the Check 21 Act does not require any bank to create substitute checks or to accept checks electronically, it does require banks to accept a legally equivalent substitute check in place of an original check after the Check 21 Act’s effective date of October 28, 2004.
Sarbanes-Oxley Act
The Company is also subject to the Sarbanes-Oxley Act of 2002, which has imposed corporate governance and accounting oversight restrictions and responsibilities on the board of directors, executive officers and independent auditors. The law has increased the time spent discharging responsibilities and costs for audit services. In 2007, Management is required to report on the effectiveness of internal controls and procedures.
Recent Developments
Definitive Agreement with First Community Holding Company. In November 2007, First Guaranty Bancshares, Inc., parent company of First Guaranty Bank, and First Community Holding Company, parent company of First Community Bank, entered into a definitive agreement under which First Community Holding Company will be acquired for approximately $19 million in cash.
Under the terms of the agreement, First Guaranty Bancshares, Inc. will acquire all of the issued and outstanding shares of common stock of First Community Holding Company for the cash purchase price of $34.06 per share. In addition, each outstanding and unexercised option to acquire a share of common stock of First Community Holding Company will be converted into the right to receive cash in an amount equal to $26.04. The transaction has been approved by the boards of directors of First Guaranty Bancshares, Inc. and First Community Holding Company. The acquisition is subject to customary conditions, including the approval of the shareholders of First Community Holding Company and the approval of certain financial institution regulatory authorities.
Various factors, such as general economic conditions in the U.S. and Louisiana, regulatory and legislative initiatives and increasing competition could impact our business. There are also several other risks, many beyond our control, which could adversely affect our business, results of operations and/or financial condition.
Risks Associated with our Business
We may not be able to successfully maintain and manage our growth.
Since December 31, 2002, assets have grown 85.6%, loan balances have grown 63.7% and deposits have grown 100.1%. Continued growth depends, in part, upon the ability to expand market presence, to successfully attract core deposits, and to identify attractive commercial lending opportunities.
Management cannot be certain as to its ability to manage increased levels of assets and liabilities. We may be required to make additional investments in equipment and personnel to manage higher asset levels and loans balances, which may adversely impact our efficiency ratio, earnings and shareholder returns.
In addition, franchise growth is anticipated through acquisitions and de novo branching. The ability to successfully integrate such acquisitions into our consolidated operations will have a direct impact on our financial condition and results of operations.
Our loan portfolio consists of a high percentage of loans secured by non-farm non-residential real estate. These loans are riskier than loans secured by one- to four-family properties.
At December 31, 2007, $236.5 million, or 41.1% of the loan portfolio consisted of non-farm non-residential real estate loans (primarily loans secured by commercial real estate such as office buildings, hotels and gaming facilities). Management intends to continue to emphasize the origination of these types of loans. These loans generally expose a lender to greater risk of nonpayment and loss than one- to four-family residential mortgage loans because repayment of the loans often depends on the successful operation and income stream of the borrowers. Such loans typically involve larger loan balances to single borrowers or groups of related borrowers compared to one- to four-family residential loans. Consequently, an adverse development with respect to one loan or one credit relationship can expose us to a significantly greater risk of loss compared to an adverse development with respect to a one- to four-family residential mortgage loan.
Emphasis on the origination of short-term loans could expose us to increased lending risks.
At December 31, 2007, $547.4 million, or 95.2% of our loan portfolio consisted of loans that mature within five years. These loans typically provide for payments based on a twenty-year amortization schedule. This results in our borrowers having significantly higher final payments due at maturity, known as a “balloon payment”. In the event our borrowers are unable to make their balloon payments when they are due, we may incur significant losses in our loan portfolio. Moreover, while the shorter maturities of our loan portfolio help us to manage our interest rate risk, they also increase the reinvestment risk associated with new loan originations. To mitigate this risk, we generally will originate loans to existing customers. There can be no assurance that during an economic slow-down we might not incur significant losses as our loan portfolio matures.
We may be unable to effectively integrate the future acquisition with and into our operations.
The future growth of First Guaranty Bank and First Guaranty Bancshares, Inc. will depend, in part, on the success of the merger of First Community Holding Company and its subsidiary with First Guaranty Bancshares, Inc. and its subsidiary. The success of this acquisition will, in turn, depend on a number of factors, including: First Guaranty Bank’s ability to integrate First Community Bank’s branches into the current operations of First Guaranty Bank; First Guaranty Bank’s and First Community Bank’s ability to limit the outflow of deposits; the ability to control the incremental noninterest expense from the merger; and the ability to retain and integrate the appropriate personnel of First Community Bank into our consolidated operations.
We could potentially recognize goodwill impairment charges post-merger.
The acquisition of First Community Holding Company and its subsidiary will be accounted for using the purchase method of accounting. In accordance with applicable accounting literature, we estimate that goodwill totaling $8.3 million will be recorded under Statement of Financial Accounting Standards No. 142., Goodwill and Other Intangible Assets (“SFAS No. 142”). As a result, goodwill is approximately 1.1% of $955.2 million of pro forma consolidated total assets at December 31, 2007. Pursuant to the provisions of SFAS No. 142, we will annually measure the fair value of our investment in our acquisitions to determine that such fair value equals or exceeds the carrying value of its investment, including goodwill. If the fair value of our investment in First Community Bank does not equal or exceed its carrying value, we will be required to record goodwill impairment charges which may adversely affect future earnings. The fair value of a banking franchise can fluctuate downward based on a number of factors that are beyond Management’s control, (e.g. adverse trends in interest rates and increased loan losses). There can be no assurance that our banking franchise value will not decline, thereby necessitating goodwill impairment charges to operations.
Hurricane Activity in Louisiana can have an adverse impact on our market area.
Our market area in Southeast Louisiana is close to New Orleans and the Gulf of Mexico, an area which is susceptible to hurricanes and tropical storms.
Hurricane Katrina hit the greater New Orleans area in August 2005. The hurricane caused widespread property damage, required the relocation of an unprecedented number of residents and business operations, and severely disrupted normal economic activity in the impacted areas. The hurricane affected our loan originations and impacted our deposit base. While Hurricane Katrina did not affect our operations as adversely as other areas of Southeast Louisiana, future hurricane activity may have a severe and adverse affect on our operations. More generally, our ability to compete effectively with financial institutions whose operations are not concentrated in areas affected by hurricanes or whose resources are greater than ours, will depend primarily on our ability to continue normal business operations following a hurricane. The severity and duration of the effects of hurricanes will depend on a variety of factors that are beyond our control, including the amount and timing of government, private and philanthropic investments including deposits in the region, the pace of rebuilding and economic recovery in the region and the extent to which a hurricane’s property damage is covered by insurance.
None of the effects described above can be accurately predicted or quantified at this time. As a result, significant uncertainty remains regarding the impact a hurricane may have on our business, financial condition and results or operations.
If the allowance for loan losses is not sufficient to cover actual loan losses, earnings could decrease.
Loan customers may not repay their loans according to the terms of their loans, and the collateral securing the payment of their loans may be insufficient to assure repayment. We may experience significant credit losses, which could have a material adverse effect on our operating results. Various assumptions and judgments about the collectability of the loan portfolio are made, including the creditworthiness of borrowers and the value of the real estate and other assets serving as collateral for the repayment of many loans. In determining the amount of the allowance for loan losses, Management reviews the loans and the loss and delinquency experience and evaluates economic conditions. If assumptions prove to be incorrect, the allowance for loan losses may not cover inherent losses in the loan portfolio at the date of the financial statements. Material additions to the allowance would materially decrease net income. At December 31, 2007, our allowance for loan losses totaled $6.2 million, representing 1.08% of loans, net of unearned income.
Management believes it has underwriting standards to manage normal lending risks, and at December 31, 2007, nonperforming loans consisted of $10.8 million, or 1.95% of loans, net of unearned income. We can give no assurance that the nonperforming loans will not increase or that nonperforming or delinquent loans will not adversely affect future performance.
In addition, federal and state regulators periodically review the allowance for loan losses and may require an increase in the allowance for loan losses or recognize further loan charge-offs. Any increase in our allowance for loan losses or loan charge-offs as required by these regulatory agencies could have a material adverse effect on the results of operations and financial condition.
Adverse events in Louisiana, where our business is concentrated, could adversely affect our results and future growth.
Our business, the location of our branches and the real estate used as collateral on our real estate loans are primarily concentrated in Louisiana. As a result, we are exposed to geographic risks. The occurrence of an economic downturn in Louisiana, or adverse changes in laws or regulations in Louisiana could impact the credit quality of our assets, the business of our customers and our ability to expand our business.
Our success significantly depends upon the growth in population, income levels, deposits and housing in our market area. If the communities in which we operate do not grow or if prevailing economic conditions locally or nationally are unfavorable, our business may be negatively affected. In addition, the economies of the communities in which we operate are substantially dependent on the growth of the economy in the state of Louisiana. To the extent that economic conditions in Louisiana are unfavorable or do not continue to grow as projected, the economy in our market area would be adversely affected. Moreover, we cannot give any assurance that we will benefit from any market growth or favorable economic conditions in our market area if they do occur.
In addition, the market value of the real estate securing loans as collateral could be adversely affected by unfavorable changes in market and economic conditions. As of December 31, 2007, approximately 79.1% of our total loans were secured by real estate. Adverse developments affecting commerce or real estate values in the local economies in our primary market areas could increase the credit risk associated with our loan portfolio. In addition, substantially all of our loans are to individuals and businesses in Louisiana. Our business customers may not have customer bases that are as diverse as businesses serving regional or national markets. Consequently, any decline in the economy of our market area could have an adverse impact on our revenues and financial condition. In particular, we may experience increased loan delinquencies, which could result in a higher provision for loan losses and increased charge-offs. Any sustained period of increased non-payment, delinquencies, foreclosures or losses caused by adverse market or economic conditions in our market area could adversely affect the value of our assets, revenues, results of operations and financial condition.
Our continued pace of growth, both internally and for our pending acquisition, may require us to raise additional capital in the future, but that capital may not be available when it is needed.
We are required by federal and state regulatory authorities to maintain adequate levels of capital to support our operations. We anticipate that our existing capital resources will satisfy our capital requirements for the foreseeable future. We may, at some point, need to raise additional capital to support continued growth, both internally and for our pending acquisition.
Our ability to raise additional capital, if needed, will depend on conditions in the capital markets at that time, which are outside of our control. Accordingly, we cannot assure you of our ability to raise additional capital if needed or that the terms acceptable to us will be available. If we cannot raise additional capital when needed, our ability to further expand our operations through internal growth and pending acquisition could be materially impaired.
We rely on our Management team for the successful implementation of our business strategy.
The success of First Guaranty Bancshares, Inc. and First Guaranty Bank has been largely due to the efforts of our executive Management team consisting of Michael R. Sharp, President and Chief Executive Officer, and Michele E. LoBianco, Chief Financial Officer. In addition, we substantially rely upon Marshall T. Reynolds, our Chairman of the Board of Directors. The loss of services of one or more of these individuals may have a material adverse effect on our ability to implement our business plan.
There is no assurance that we will be able to successfully compete with others for business.
The area in which we operate is considered attractive from an economic and demographic viewpoint, and is a highly competitive banking market. We compete for loans and deposits with numerous regional and national banks and other community banking institutions, as well as other kinds of financial institutions and enterprises, such as securities firms, insurance companies, savings associations, credit unions, mortgage brokers and private lenders. Many competitors have substantially greater resources than we do and operate under less stringent regulatory environments. The differences in resources and regulations may make it harder for us to compete profitably, reduce the rates that we can earn on loans and investments, increase the rates we must offer on deposits and other funds, and adversely affect our overall financial condition and earnings.
We depend primarily on net interest income for our earnings rather than noninterest income.
Net interest income is the most significant component of our operating income. We do not rely on traditional sources of fee income utilized by some community banks, such as fees from sales of insurance, securities or investment advisory products or services. For the years ended December 31, 2007 and 2006, our net interest income was $34.1 million and $31.7 million, respectively. The amount of our net interest income is influenced by the overall interest rate environment, competition, and the amount of interest-earning assets relative to the amount of interest-bearing liabilities. In the event that one or more of these factors were to result in a decrease in our net interest income, we do not have significant sources of fee income to make up for decreases in net interest income.
Fluctuations in interest rates could reduce our profitability.
We realize income primarily from the difference between the interest we earn on loans and investments and the interest we pay on deposits and borrowings. The interest rates on our assets and liabilities respond differently to changes in market interest rates, which means our interest-bearing liabilities may be more sensitive to changes in market interest rates than our interest-earning assets, or vice versa. In either event, if market interest rates change, this “gap” between the amount of interest-earning assets and interest-bearing liabilities that reprice in response to these interest rate changes may work against us, and our earnings may be negatively affected.
We are unable to predict fluctuations in market interest rates, which are affected by, among other factors, changes in the following:
| · | business activity levels; |
| · | domestic and foreign financial markets. |
The value of our investment portfolio and the composition of our deposit base are influenced by prevailing market conditions and interest rates. Our asset-liability Management strategy, which is designed to mitigate the risk to us from changes in market interest rates, may not prevent changes in interest rates or securities market downturns from reducing deposit outflow or from having a material adverse effect on our results of operations, our financial condition or the value of our investments.
We expect to incur additional expenses in connection with our compliance with Sarbanes-Oxley.
Under Section 404 of the Sarbanes-Oxley Act of 2002, we were required to conduct a comprehensive review and assessment of the adequacy of our existing financial systems and controls at December 31, 2007. Future reviews of our financial systems and controls may uncover deficiencies in existing systems and controls. If that is the case, we would have to take the necessary steps to correct any deficiencies, which may be costly and may strain our Management resources and negatively impact earnings. We also would be required to disclose any such deficiencies, which could adversely affect the market price of our common stock. At December 31, 2008, we will be required to obtain an attestation report from a registered public accounting firm on the effectiveness of our internal controls over financial reporting.
We operate in a highly regulated environment and may be adversely affected by changes in federal, state and local laws and regulations.
We are subject to extensive regulation, supervision and examination by federal and state banking authorities. Any change in applicable regulations or federal, state or local legislation could have a substantial impact on us and our operations. Additional legislation and regulations that could significantly affect our powers, authority and operations may be enacted or adopted in the future, which could have a material adverse effect on our financial condition and results of operations. Further, regulators have significant discretion and authority to prevent or remedy unsafe or unsound practices or violations of laws by banks and bank holding companies in the performance of their supervisory and enforcement duties. The exercise of regulatory authority may have a negative impact on our results of operations and financial condition.
Like other bank holding companies and financial institutions, we must comply with significant anti-money laundering and anti-terrorism laws. Under these laws, we are required, among other things, to enforce a customer identification program and file currency transaction and suspicious activity reports with the federal government. Government agencies have substantial discretion to impose significant monetary penalties on institutions which fail to comply with these laws or make required reports.
Risk Associated with an Investment in our Common Stock
The market price of our common stock is established between a buyer and seller.
First Guaranty Bank acts as the transfer agent for First Guaranty Bancshares, Inc. All shares traded are agreed upon by mutual buyers and sellers. First Guaranty Bancshares, Inc. is not traded on an exchange, therefore liquidation and/or purchases of stock may not be readily available.
Our Management controls a substantial percentage of our common stock and therefore have the ability to exercise substantial control over our affairs.
As of December 31, 2007, our directors and executive officers (and their affiliates) beneficially owned 1,894,735 shares or approximately 34.1% of our common stock. Because of the large percentage of common stock held by our directors and executive officers, such persons could significantly influence the outcome of any matter submitted to a vote of our shareholders even if other shareholders were in favor of a different result.
None.
The Company does not directly own any real estate, but it does own real estate indirectly through its subsidiaries. The Bank operates 18 retail-banking centers. The following table sets forth certain information relating to each office. The Bank also owns three additional properties which are currently not being used as banking facilities. One of the properties is a banking center location previously owned and operated by Homestead Bank but was closed at the time of the merger. The Bank’s intentions are to sell this property. In addition, the Bank owns two parcels of raw land which it intends to build de nevo banking center locations. The net book value of our properties at December 31, 2007 was $9.4 million.
Location | | Use of Facilities | | Year Facility Opened or Acquired | | Owned/ Leased |
First Guaranty Square 400 East Thomas Street Hammond, LA��70401 | | Bank’s Main Office | | 1975 | | Owned |
2111 West Thomas Street Hammond, LA 70401 | | Guaranty West Banking Center | | 1974 | | Owned |
100 East Oak Street Amite, LA 70422 | | Amite Banking Center | | 1970 | | Owned |
455 Railroad Avenue Independence, LA 70443 | | Independence Banking Center | | 1979 | | Owned |
301 Avenue F Kentwood, LA 70444 | | Kentwood Banking Center | | 1975 | | Owned |
170 West Hickory Ponchatoula, LA 70454 | | Ponchatoula Banking Center | | 1960 | | Owned |
196 Burt Blvd Benton, LA 71006 | | Benton Banking Center | | 1999 | | Owned |
126 South Hwy. 1 Oil City, LA 71061 | | Oil City Banking Center | | 1999 | | Owned |
401 North 2nd Street Homer, LA 71040 | | Homer Main Banking Center | | 1999 | | Owned |
10065 Hwy 79 Haynesville, LA 71038 | | Haynesville Banking Center | | 1999 | | Owned |
117 East Hico Street Dubach, LA 71235 | | Dubach Banking Center | | 1999 | | Owned |
102 East Louisiana Avenue Vivian, LA 71082 | | Vivian Banking Center | | 1999 | | Owned |
500 North Cary Jennings, LA 70546 | | Jennings Banking Center | | 1999 | | Owned |
799 West Summers Drive Abbeville, LA 70510 | | Abbeville Banking Center | | 1999 | | Owned |
105 Berryland Ponchatoula, LA 70454 | | Berryland Banking Center | | 2004 | | Leased |
2231 S. Range Avenue Denham Springs, LA 70726 | | Denham Springs Banking Center | | 2005 | | Owned |
North 6th Street Ponchatoula, LA 70454 | | Ponchatoula Banking Center | | 2007 | | Owned |
29815 Walker Rd S Walker, LA 70785 | | Walker Banking Center | | 2007 | | Owned |
The Company is subject to various legal proceedings in the normal course of its business. It is Management’s belief that the ultimate resolution of such claims will not have a material adverse effect on the financial position or results of operations. At December 31, 2007, we were not involved in any material legal proceedings
There were no matters submitted to a vote of security holders, through the solicitation of proxies or otherwise, during the fourth quarter of fiscal 2007.
PART II
Item 5 - Market for Registant’s Common Equity, Related Stockholder Matters and Issuer Purchases of Equity Securities There is no liquid or active market for our common stock. The Company’s shares of common stock are not traded on a stock exchange or in any established over-the-counter market. Trades occur primarily between individuals at a price mutually agreed upon by the buyer and seller. Trading in the Company’s common stock has been infrequent and such trades cannot be characterized as constituting an active trading market. Based on information recorded in the Bank’s Stock Transfer Agent records, Management believes that approximately 924,692 shares of the Company’s common stock were traded during 2007 of which 22,882 shares were traded in the fourth quarter of 2007. The purchasers in these transactions were, in most cases, either affiliates of the Company or their associates. No assurance can be given that an active trading market for the common stock will develop.
The following table sets forth the high and low bid quotations for First Guaranty Bancshares, Inc.’s (and First Guaranty Bank prior to July 27, 2007) common stock for the periods indicated. These quotations represent trades of which we are aware and do not include retail markups, markdowns, or commissions and do not necessarily reflect actual transactions. As of December 31, 2007, there were 5,559,644 shares of First Guaranty Bancshares, Inc. common stock issued and outstanding. At December 31, 2007, First Guaranty Bancshares, Inc. had approximately 1,293 shareholders of record.
| | 2007 | | 2006 |
| Quarter Ended: | High | Low | Dividend | | High | Low | Dividend |
| March | $ 24.30 | $ 23.42 | $ 0.15 | | $ 23.42 | $ 18.57 | $ 0.15 |
| June | 24.30 | 24.30 | 0.16 | | 23.42 | 23.42 | 0.15 |
| September | 24.30 | 24.30 | 0.16 | | 23.42 | 23.42 | 0.15 |
| December | 24.30 | 24.30 | 0.16 | | 23.42 | 23.42 | 0.15 |
Our stockholders are entitled to receive dividends when, and if declared by the board of directors, out of funds legally available for dividends. We have paid consecutive quarterly cash dividends on our common stock for each of the last ten years and the board of directors intends to continue to pay regular quarterly cash dividends. The ability to pay dividends in the future will depend on earnings and financial condition, liquidity and capital requirements, regulatory restrictions, the general economic and regulatory climate and ability to service any equity or debt obligations senior to common stock.
There are legal restrictions on the ability of First Guaranty Bank to pay cash dividends to First Guaranty Bancshares, Inc. Under federal and state law, we are required to maintain certain surplus and capital levels and may not distribute dividends in cash or in kind, if after such distribution we would fall below such levels. Specifically, an insured depository institution is prohibited from making any capital distribution to its shareholders, including by way of dividend, if after making such distribution, the depository institution fails to meet the required minimum level for any relevant capital measure including the risk-based capital adequacy and leverage standards.
Additionally, under the Louisiana Business Corporation Act, First Guaranty Bancshares, Inc. is prohibited from paying any cash dividends to shareholders if, after the payment of such dividend, if its total assets would be less than its total liabilities or where net assets are less than the liquidation value of shares that have a preferential right to participate in First Guaranty Bancshares, Inc.’s assets in the event First Guaranty Bancshares, Inc. were to be liquidated.
We have not repurchased any shares of our outstanding common stock during the past year.
Stock Performance Graph
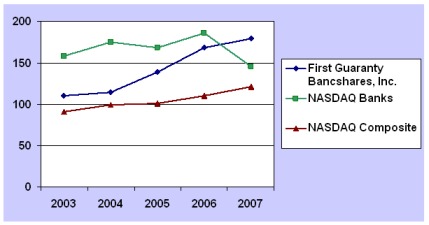
The line graph below compares the cumulative total return for the Company’s common stock with the cumulative total return of both the NASDAQ Stock Market Index for U.S. companies and the NASDAQ Index for bank stocks for the period December 31, 2002 through December 31, 2007. The total return assumes the reinvestment of all dividends and is based on a $100 investment on December 31, 1998. It also reflects the stock price on December 31st of each year shown, although this price reflects only a small number of transactions involving a small number of directors of the Company or affiliates or associates and cannot be taken as an accurate indicator of the market value of the Company’s common stock.
Performance Graph
Cummulative Total Return of First Guaranty Bancshares, Inc. Compared to NASDAQ Bank Index
and NASDAQ Composite Index
| | Total Returns for the Year |
| | 2003 | 2004 | 2005 | 2006 | 2007 | |
First Guaranty Bancshares, Inc. | $110 | $114 | $139 | $168 | $179 | |
NASDAQ Banks | $158 | $175 | $168 | $186 | $145 | |
| NASDAQ Composite | $ 91 | $ 99 | $101 | $110 | $121 | |
We have no equity based benefit plans.
The following selected financial data should be read in conjunction with the financial statements, including the related notes, and “Management’s Discussion and Analysis of Financial Condition and Results of Operations,” which are included elsewhere in this Form 10-K. Except for the data under “Performance Ratios,” “Capital Ratios” and “Asset Quality Ratios,” the income statement data and share and per share data for the years ended December 31, 2007, 2006 and 2005 and the balance sheet data as of December 31, 2007 and 2006 are derived from the audited financial statements and related notes which are included elsewhere in this Form 10-K, and the income statement data and share and per share data for the years ended December 31, 2004 and 2003 and the balance sheet data as of December 31, 2005, 2004 and 2003 are derived from the audited financial statements and related notes that are not included in this Form 10-K.
| | | At or For the Years Ended December 31, | |
| | | 2007 | | | 2006 | | | 2005 | | | 2004 | | | 2003 | |
| | | | | | | | | | | | | | | | |
| Year End Balance Sheet Data: | | | | | | | | | | | | | | | |
| (dollars in thousands) | | | | | | | | | | | | | | | |
| Securities | | $ | 142,068 | | | $ | 158,352 | | | $ | 175,200 | | | $ | 106,526 | | | $ | 59,454 | |
| Federal funds sold | | | 35,869 | | | | 6,793 | | | | 1,786 | | | | 552 | | | | 356 | |
| Loans, net of unearned income | | | 575,256 | | | | 507,195 | | | | 491,582 | | | | 456,104 | | | | 381,342 | |
| Allowance for loan losses | | | 6,193 | | | | 6,675 | | | | 7,597 | | | | 5,910 | | | | 4,942 | |
| Total assets | | | 807,331 | | | | 714,487 | | | | 713,544 | | | | 607,154 | | | | 484,715 | |
| Total deposits | | | 723,094 | | | | 626,293 | | | | 632,908 | | | | 481,358 | | | | 376,002 | |
| Borrowings | | | 13,494 | | | | 24,568 | | | | 22,132 | | | | 71,771 | | | | 60,396 | |
| Stockholders' equity | | | 66,533 | | | | 59,203 | | | | 53,923 | | | | 51,706 | | | | 45,798 | |
| | | | | | | | | | | | | | | | | | | | | |
| Average Balance Sheet Data: | | | | | | | | | | | | | | | | | | | | |
| (dollars in thousands) | | | | | | | | | | | | | | | | | | | | |
| Securities | | $ | 152,990 | | | $ | 178,419 | | | $ | 109,236 | | | $ | 87,232 | | | $ | 58,092 | |
| Federal funds sold | | | 8,083 | | | | 3,115 | | | | 6,028 | | | | 618 | | | | 128 | |
| Loans, net of unearned income | | | 543,946 | | | | 505,623 | | | | 476,144 | | | | 415,606 | | | | 366,034 | |
| Total earning assets | | | 712,212 | | | | 690,057 | | | | 595,141 | | | | 509,261 | | | | 431,432 | |
| Total assets | | | 751,237 | | | | 726,593 | | | | 631,554 | | | | 542,460 | | | | 464,633 | |
| Total deposits | | | 658,456 | | | | 622,869 | | | | 526,995 | | | | 438,214 | | | | 368,463 | |
| Borrowings | | | 23,450 | | | | 42,435 | | | | 45,732 | | | | 51,558 | | | | 48,398 | |
| Stockholders' equity | | | 63,564 | | | | 56,640 | | | | 54,901 | | | | 49,257 | | | | 43,744 | |
| | | | | | | | | | | | | | | | | | | | | |
| Performance Ratios: | | | | | | | | | | | | | | | | | | | | |
| Return on average assets | | | 1.37% | | | | 1.21% | | | | 0.95% | | | | 1.58% | | | | 1.51% | |
| Return on average equity | | | 16.15% | | | | 15.54% | | | | 10.97% | | | | 17.37% | | | | 16.04% | |
Return on average tangible assets(1) | | | 1.37% | | | | 1.21% | | | | 0.96% | | | | 1.58% | | | | 1.52% | |
Return on average tangible equity(2) | | | 16.47% | | | | 15.73% | | | | 11.24% | | | | 18.08% | | | | 17.03% | |
| Net interest margin | | | 4.79% | | | | 4.60% | | | | 4.71% | | | | 5.09% | | | | 5.08% | |
| Average loans to average deposits | | | 82.61% | | | | 81.18% | | | | 90.35% | | | | 94.84% | | | | 99.34% | |
| Efficiency ratio | | | 54.50% | | | | 50.90% | | | | 55.44% | | | | 52.47% | | | | 55.84% | |
| Efficiency ratio (excluding amortization of | | | | | | | | | | | | | | | | | |
| intangibles and securities transactions) | | | 53.32% | | | | 49.12% | | | | 53.55% | | | | 50.33% | | | | 53.45% | |
| Full time equivalent employees (year end) | | | 222 | | | | 196 | | | | 189 | | | | 181 | | | | 169 | |
| | | | | | | | | | | | | | | | | | | | | |
__________________________________
(1) Average tangible assets represent average assets less average core deposit intangibles.
(2) Average tangible equity represents average equity less average core deposit intangibles.
| | | At or For the Years Ended December 31, | |
| | | 2007 | | | 2006 | | | 2005 | | | 2004 | | | 2003 | |
| | | | | | | | | | | | | | | | |
| Capital Ratios: | | | | | | | | | | | | | | | |
| Average stockholders' equity to average assets | | | 8.46% | | | | 7.80% | | | | 8.69% | | | | 9.08% | | | | 9.41% | |
Average tangible equity to average tangible assets(1),(2) | | | 8.31% | | | | 7.71% | | | | 8.51% | | | | 8.76% | | | | 8.91% | |
| Stockholders' equity to total assets | | | 8.24% | | | | 8.29% | | | | 7.56% | | | | 8.52% | | | | 9.45% | |
| Tier 1 leverage capital | | | 7.38% | | | | 8.16% | | | | 7.67% | | | | 8.53% | | | | 9.00% | |
| Tier 1 capital | | | 10.13% | | | | 9.92% | | | | 8.80% | | | | 9.50% | | | | 10.92% | |
| Total risk-based capital | | | 11.09% | | | | 11.03% | | | | 10.05% | | | | 10.62% | | | | 12.16% | |
| | | | | | | | | | | | | | | | | | | | | |
| Income Data: | | | | | | | | | | | | | | | | | | | | |
| (dollars in thousands) | | | | | | | | | | | | | | | | | | | | |
| Interest income | | $ | 55,480 | | | $ | 50,937 | | | $ | 40,329 | | | $ | 33,835 | | | $ | 28,716 | |
| Interest expense | | | 21,398 | | | | 19,206 | | | | 12,367 | | | | 8,057 | | | | 6,781 | |
| Net interest income | | | 34,082 | | | | 31,731 | | | | 27,962 | | | | 25,778 | | | | 21,935 | |
| Provision for loan losses | | | 1,918 | | | | 4,419 | | | | 5,621 | | | | 1,670 | | | | 1,258 | |
| Noninterest income (excluding securities transactions) | | | 5,176 | | | | 4,601 | | | | 5,221 | | | | 5,082 | | | | 5,006 | |
| Securities (losses) gains | | | (478 | ) | | | (234 | ) | | | 7 | | | | (56 | ) | | | (23 | ) |
| Noninterest expense | | | 21,133 | | | | 18,373 | | | | 18,399 | | | | 16,162 | | | | 15,030 | |
| Earnings before income taxes | | | 15,729 | | | | 13,306 | | | | 9,170 | | | | 12,972 | | | | 10,630 | |
| Net income | | | 10,263 | | | | 8,802 | | | | 6,024 | | | | 8,556 | | | | 7,016 | |
| | | | | | | | | | | | | | | | | | | | | |
Per Common Share Data:(3) | | | | | | | | | | | | | | | | | | | | |
| Net earnings | | $ | 1.85 | | | $ | 1.58 | | | $ | 1.08 | | | $ | 1.54 | | | $ | 1.26 | |
| Cash dividends paid | | | 0.63 | | | | 0.60 | | | | 0.57 | | | | 0.50 | | | | 0.38 | |
| Book value | | | 11.97 | | | | 10.65 | | | | 9.70 | | | | 9.30 | | | | 8.24 | |
| Dividend payout ratio | | | 34.13% | | | | 37.89% | | | | 52.67% | | | | 32.16% | | | | 29.73% | |
| Weighted average number of shares outstanding | | | 5,559,644 | | | | 5,559,644 | | | | 5,559,644 | | | | 5,559,644 | | | | 5,559,644 | |
| Number of share outstanding (year end) | | | 5,559,644 | | | | 5,559,644 | | | | 5,559,644 | | | | 5,559,644 | | | | 5,559,644 | |
| Market data: | | | | | | | | | | | | | | | | | | | | |
| High | | $ | 24.30 | | | $ | 23.42 | | | $ | 20.00 | | | $ | 15.27 | | | $ | 15.27 | |
| Low | | $ | 23.42 | | | $ | 18.57 | | | $ | 15.27 | | | $ | 15.12 | | | $ | 15.27 | |
| Trading Volume | | | 924,692 | | | | 535,264 | | | | 279,503 | | | | 104,835 | | | | 110,836 | |
| Stockholders of record | | | 1,293 | | | | 1,181 | | | | 1,141 | | | | 1,148 | | | | 1,247 | |
| | | | | | | | | | | | | | | | | | | | | |
| Asset Quality Ratios: | | | | | | | | | | | | | | | | | | | | |
| Nonperforming assets to total assets | | | 1.39% | | | | 1.81% | | | | 3.05% | | | | 1.18% | | | | 1.46% | |
| Nonperforming assets to loans | �� | | 1.95% | | | | 2.55% | | | | 4.43% | | | | 1.57% | | | | 1.85% | |
| Loan loss reserve to nonperforming assets | | | 55.26% | | | | 51.53% | | | | 34.92% | | | | 82.59% | | | | 70.00% | |
| Net charge-offs to average loans | | | 0.50% | | | | 1.06% | | | | 0.83% | | | | 0.17% | | | | 0.19% | |
| Provision for loan loss to average loans | | | 0.35% | | | | 0.87% | | | | 1.18% | | | | 0.40% | | | | 0.34% | |
| Allowance for loan loss to total loans | | | 1.08% | | | | 1.32% | | | | 1.55% | | | | 1.30% | | | | 1.30% | |
__________________________________
(1) Average tangible assets represents average assets less average core deposit intangibles.
(2) Average tangible equity represents average equity less average core deposit intangibles.
(3) For the years ended 2003, 2004 and 2005 amounts have been restated to reflect a stock dividend of one-third of a share of $1 par value common stock for each share of $1 and $5
par value common stock outstanding, accounted for as a four-for-three stock split, effective and payable to stockholders of record as of October 20, 2005.
First Guaranty Bancshares, Inc. became the holding company for First Guaranty Bank on July 27, 2007 in a corporate reorganization (see “Recent Developments”). In addition, First Guaranty Bancshares, Inc. completed its acquisition of Homestead Bancorp on July 30, 2007. Information at or for the year ended December 31, 2006, and any prior periods, reflects the operations of First Guaranty Bank on a stand-alone basis. Prior to becoming the holding company of First Guaranty Bank, First Guaranty Bancshares, Inc. had no assets, liabilities or operations.
This discussion and analysis reflects our financial statements and other relevant statistical data, and is intended to enhance your understanding of our financial condition and results of operations. Reference should be made to those financial statements of this Form 10-K and the selected financial data (above) presented in this report in order to obtain a better understanding of the commentary which follows.
For the years ended 2005, 2004, and 2003 all per share data in this discussion has been adjusted to reflect the stock dividend of one-third of a share of the $1 par value common stock for each share of the $1 and $5 par value common stock outstanding, accounted for as a four-for-three stock split, effective and payable to stockholders of record as of October 20, 2005. Fractional shares were settled for cash.
Special Note Regarding Forward-Looking Statements
Congress passed the Private Securities Litigation Act of 1995 in an effort to encourage corporations to provide information about a company’s anticipated future financial performance. This act provides a safe harbor for such disclosure, which protects us from unwarranted litigation, if actual results are different from Management expectations. This discussion and analysis contains forward-looking statements and reflects Management’s current views and estimates of future economic circumstances, industry conditions, company performance and financial results. The words “may,” “should,” “expect,” “anticipate,” “intend,” “plan,” “continue,” “believe,” “seek,” “estimate” and similar expressions are intended to identify forward-looking statements. These forward-looking statements are subject to a number of factors and uncertainties, which could cause our actual results and experience to differ from the anticipated results and expectations, expressed in such forward-looking statements.
Application of Critical Accounting Policies
The accounting and reporting policies of the Company conform to generally accepted accounting principles in the United States of America and to predominant accounting practices within the banking industry. Certain critical accounting policies require judgment and estimates which are used in the preparation of the financial statements.
Allowance for Loan Losses. The Company’s most critical accounting policy relates to its allowance for loan losses. The allowance for loan losses is established through a provision for loan losses charged to expense. Loans are charged against the allowance for loan losses when Management believes that the collectability of the principal is unlikely. The allowance, which is based on the evaluation of the collectability of loans and prior loan loss experience, is an amount Management believes will be adequate to reflect the risks inherent in the existing loan portfolio and that exist at the reporting date. The evaluations take into consideration a number of subjective factors including changes in the nature and volume of the loan portfolio, overall portfolio quality, review of specific problem loans, current economic conditions that may affect a borrower’s ability to pay, adequacy of loan collateral and other relevant factors.
Changes in such estimates may have a significant impact on the financial statements. For further discussion of the allowance for loan losses, see the “Allowance for Loan Losses” section of this analysis and Note 1 to the Consolidated Financial Statements.
Valuation of Goodwill, Intangible Assets and Other Purchase Accounting Adjustments. The Company accounts for acquisitions in accordance with Statement of Financial Accounting Standards (“SFAS”) No. 141, “Business Combinations,” which requires the use of the purchase method of accounting. For purchase acquisitions, the Company is required to record the assets acquired, including identified intangible assets and liabilities assumed, at their fair value, which in many instances involves estimates based on third party valuations, such as appraisals, or internal valuations based on discounted cash flow analyses or other valuation techniques. The determination of the useful lives of intangible assets is subjective as is the appropriate amortization period for such intangible assets. In addition, purchase acquisitions typically result in recording goodwill. The Company performs a goodwill valuation at least annually. Impairment testing of goodwill is a two step process that first compares the fair value of goodwill with its carrying amount, and second measures impairment loss by comparing the implied fair value of goodwill with the carrying amount of that goodwill. Based on Management’s goodwill impairment tests, there was no impairment of goodwill at December 31, 2007. For additional information on goodwill and intangible assets, see Notes 1 and 8 to the Consolidated Financial Statements.
Recent Developments
During 2007, the Company engaged in the following transactions:
Formation of Holding Company; Share Exchange
On July 27, 2007, (the “Effective Date”), First Guaranty Bancshares, Inc., a Louisiana corporation (the “Company”) became the holding company for First Guaranty Bank (the “Reorganization”), a Louisiana chartered bank (the “Bank”), pursuant to an Agreement and Plan of Exchange dated as of July 27, 2007 (the “Agreement”). Pursuant to the Agreement, on the Effective Date, each issued and outstanding share of the Bank’s common stock, par value $1.00 per share, automatically was converted into and exchanged for one share of the Company’s common stock, par value $1.00 per share. On the Effective Date, the Bank became a wholly owned subsidiary of the Company and the stockholders of the Bank became stockholders of the Company.
Prior to the Effective Date of the Reorganization, the Bank’s common stock was registered under Section 12(g) of the Securities Exchange Act of 1934, as amended (the “Exchange Act”), as administered by the FDIC.
Homestead Bancorp, Inc. Merger – July 30, 2007
The Company completed its acquisition of Homestead Bancorp, Inc for cash totaling $12.1 million. The transaction resulted in $1.9 million of goodwill and $2.1 million of core deposit intangibles. At acquisition, Homestead had total assets of $125.6 million, including loans of $74.4 million and deposits were $67.4 million (see Note 3).
Pending Acquisitions - First Community Holding Company – November 2, 2007
On November 2, 2007, First Guaranty Bancshares, Inc. and First Community Holding Company (“BHC”), a Louisiana corporation and holding company for First Community Bank, entered into an Agreement and Plan of Reorganization (the “Merger Agreement”) pursuant to which, among other things, the Company will acquire all of the issued and outstanding shares of capital stock of First Community BHC and all of the outstanding and unexercised options of First Community BHC.
Under the terms and subject to the conditions of the Merger Agreement, which has been approved by the Boards of Directors of First Guaranty BHC and First Community BHC, all of the outstanding common stock of First Community BHC will be cancelled in exchange for $34.06 per share. All of the outstanding and unexercised options to acquire shares of common stock of First Community BHC will be cancelled in exchange for an amount in cash per outstanding and unexercised option equal to $26.06. The Company will acquire First Community BHC for approximately $19 million in cash. The Company anticipates using cash and proceeds from the issuance of perpetual preferred stock.
Consummation of the Interim Merger is subject to various conditions, including (i) requisite approvals of the holders of First Community BHC common stock and (ii) receipt of regulatory approvals. The acquisition is subject to customary conditions, including the approval of the shareholders of First Community Holding Company and the approval of certain financial institution regulatory authorities (see Note 3).
For more information on the Company’s acquisitions, see Note 3 to the Consolidated Financial Statements.
Financial Condition
Assets. Total assets at December 31, 2007 were $807.3 million, an increase of $92.8 million, or 13.0%, from $714.5 million at December 31, 2006. Assets acquired from the Homestead Bank acquisition totaled $129.6 million, however $44.5 million of the acquired securities and $34.3 million of the acquired loans were sold in 2007 (see Note 3). An increase of $68.5 million in net loans was offset by a $16.3 million decrease in securities. Total deposits increased by $96.8 million or 15.5% from 2006 to 2007. At December 31, 2007, long-term borrowings were $3.1 million, a decrease of $14.9 million or 82.8%, from $18.0 million at December 31, 2006.
Investment Securities. The securities portfolio totaled $142.1 million at December 31, 2007, representing a decrease of $16.3 million from December 31, 2006. Securities sales, calls and repayments reduced the securities portfolio and primarily funded the increase in the loan portfolio. The primary changes in the portfolio consisted of $575.5 million in purchases, $45.0 million in securities acquired in the Homestead Bank merger, sales of $65.2 million, calls totaling $23.0 million and maturities of $548.8 million. The portfolio provides a relatively stable source of income and has lower interest rate and credit risk compared to loans.
At December 31, 2007 approximately 34.6% of the securities portfolio (excluding Federal Home Loan Bank stock) mature in less than one year while securities with maturity dates over 10 years totaled 47.0% of the portfolio. At December 31, 2007, the average maturity of the securities portfolio was 3.3 years, compared to the average maturity at December 31, 2006 of 7.3 years.
At December 31, 2007, securities totaling $105.6 million were classified as available for sale and $36.5 million were classified as held to maturity as compared to $111.4 million and $47.0 million, respectively at December 31, 2006.
The book yields on securities available for sale ranged from 3.3% to 8.5% at December 31, 2007, exclusive of the effect of changes in fair value reflected as a component of stockholders’ equity. The book yields on held to maturity securities ranged from 3.7% to 6.1%.
Average securities as a percentage of average interest-earning assets were 21.5% and 25.9% at December 31, 2007 and 2006, respectively. Most securities held at December 31, 2007 and 2006 qualified as securities pledgeable to collateralize repurchase agreements and public funds. At December 31, 2007 and 2006, $131.6 million and $147.3 million in securities were pledged, respectively.
Loans. At December 31, 2007, the loan portfolio (loans, net of unearned income) totaled $575.3 million, an increase of approximately $68.1 million, or 13.4%, from the December 31, 2006 level of $507.2 million. The Company acquired $40.4 million in loans from the merger with Homestead Bank (see Note 3).
Loans represented 79.6% of deposits at December 31, 2007, compared to 81.0% of deposits at December 31, 2006. The majority of the loan increases continued to be in the real estate loan segments of the portfolio. Real estate and related loans comprised 79.1% of the portfolio in 2007 as compared to 81.5% in 2006. Loan charge-offs taken during 2007 totaled $3.9 million, compared to charge-offs of $5.9 million in 2006. Of the loan charge-offs in 2007, approximately $3.0 million were loans secured by real estate of which $2.2 million were commercial real estate and approximately $0.8 million were residential properties. In 2007, recoveries of $1.2 million were recognized on loans previously charged off as compared to $547,000 in 2006. Of the loan charge-offs in 2006, $4.6 million related to home mortgages, as discussed below. In 2006, recoveries of $547,000 were recognized on these loan charge-offs and other loans previously charged off as compared to $228,000 in 2005.
In 2005, we discovered mortgage loans and commitments originated in one branch involved irregularities suggesting that many of these mortgage loans had been made against overvalued collateral on the basis of misleading loan applications. As of December 31, 2007, the aggregate principal balance on these loans was approximately $0.8 million. The allowance for loan losses to provide for any potential future losses relating to these two remaining home mortgage loans totaled $178,000. For the year ended December 31, 2007, we charged off approximately $363,000 as a result of these mortgage loans. As of December 31, 2006, the aggregate principal balance on these loans was approximately $2.5 million. The allowance for loan losses to provide for any potential future losses relating to these 11 remaining home mortgage loans totaled $206,000. For the year ended December 31, 2006, we charged off approximately $4.6 million as a result of these mortgage loans.
In 2007, excluding the merger with Homestead Bank (see Note 3), loan growth was geographically dispersed between north and south Louisiana (throughout our market area). Increased loan volume from larger commercial real estate customers outpaced loan demand from consumer clients in this period.
Nonperforming Assets. Nonperforming assets were $11.2 million, or 1.4% of total assets at December 31, 2007, compared to $13.3 million, or 1.9% of total assets at December 31, 2006. The decrease resulted from a $2.2 million, or 85.3%, decrease in other real estate to $373,000 at December 31, 2007 from $2.5 million at December 31, 2006. The decrease in other real estate was primarily the result of a reduction in properties foreclosed on the home mortgage loans and commitments from prior years which involved irregularities (see Note 6).
Deposits. From December 31, 2006 to December 31, 2007, total deposits increased by $96.8 million or 15.5%, to $723.1 million at December 31, 2007 from $626.3 million at December 31, 2006. In 2007, noninterest-bearing demand deposits decreased $1.8 million, or 1.5%. Interest-bearing demand deposits increased $37.8 million, savings deposits increased $3.9 million and time deposits increased $56.9 million. The increased deposits include the merger with Homestead Bank (see Note 3). The increase in deposits was due to a $62.8 million increase in individual and business deposits while public fund deposits decreased by $34.0 million. The increase in core deposits (comprised of interest-bearing demand deposits, noninterest-bearing demand deposits and savings accounts) resulted from $67.4 million acquired in the merger with Homestead Bank, a series of marketing campaigns launched in 2007 and a continued effort to obtain deposit relationships with new and existing loan customers.
Borrowings. Short-term borrowings increased $3.8 million in 2007 to $10.4 million at December 31, 2007 from $6.6 million at December 31, 2006. Short-term borrowings are used to manage liquidity on a daily or otherwise short-term basis. The short-term borrowings at December 31, 2007 and 2006 respectively was comprised of repurchase agreements. Long-term borrowings decreased $14.9 million, or 82.8%, to $3.1 million at December 31, 2007, compared to $18.0 million at December 31, 2006. At December 31, 2007, long-term borrowings consisted of subordinated debt (see Note 10). At December 31, 2006, long-term borrowings consisted of advances from the Federal Home Loan Bank, all of which were paid during 2007.
Equity. Total equity increased $7.3 million or 12.4% to $66.5 million at December 31, 2007 from $59.2 million at December 31, 2006. The increase in stockholders’ equity reflected consolidated net income of $10.3 million during 2007, partially offset by dividends paid of $3.5 million.
Loan Portfolio Composition. The following table sets forth the composition of our loan portfolio, excluding loans held for sale, by type of loan at the dates indicated.
| | | December 31, | |
| | | 2007 | | | 2006 | | | 2005 | |
| | | | | | As % of | | | | | | As % of | | | | | | As % of | |
| | | Balance | | | Category | | | Balance | | | Category | | | Balance | | | Category | |
| | | (dollars in thousands) | |
| Real estate | | | | | | | | | | | | | | | | | | |
| Construction & land development | | $ | 98,127 | | | | 17.0% | | | $ | 49,837 | | | | 9.9% | | | $ | 67,099 | | | | 13.6% | |
| Farmland | | | 23,065 | | | | 4.0% | | | | 25,582 | | | | 5.0% | | | | 24,903 | | | | 5.1% | |
| 1-4 Family | | | 84,640 | | | | 14.7% | | | | 67,022 | | | | 13.2% | | | | 78,789 | | | | 16.0% | |
| Multifamily | | | 13,061 | | | | 2.3% | | | | 14,702 | | | | 2.9% | | | | 11,125 | | | | 2.3% | |
| Non-farm non-residential | | | 236,474 | | | | 41.1% | | | | 256,176 | | | | 50.5% | | | | 223,622 | | | | 45.5% | |
| Total real estate | | | 455,367 | | | | 79.1% | | | | 413,319 | | | | 81.5% | | | | 405,538 | | | | 82.5% | |
| | | | | | | | | | | | | | | | | | | | | | | | | |
| Agricultural | | | 16,816 | | | | 2.9% | | | | 16,359 | | | | 3.2% | | | | 11,490 | | | | 2.3% | |
| Commercial and industrial | | | 81,073 | | | | 14.1% | | | | 59,072 | | | | 11.6% | | | | 54,740 | | | | 11.1% | |
| Consumer and other | | | 22,517 | | | | 3.9% | | | | 18,880 | | | | 3.7% | | | | 20,078 | | | | 4.1% | |
| Total loans before unearned income | | | 575,773 | | | | 100.0% | | | | 507,630 | | | | 100.0% | | | | 491,846 | | | | 100.0% | |
| Less: unearned income | | | (517 | ) | | | | | | | (435 | ) | | | | | | | (264 | ) | | | | |
| Total loans after unearned income | | $ | 575,256 | | | | | | | $ | 507,195 | | | | | | | $ | 491,582 | | | | | |
| | | | | | | | | | | | | | | | | | | | | | | | | |
| | | | | | | | | | | | | | | | | | | | | | | | | |
| | | December 31, | | | | | | | | | |
| | | 2004 | | | 2003 | | | | | | | | | |
| | | | | | | As % of | | | | | | | As % of | | | | | | | | | |
| | | Balance | | | Category | | | Balance | | | Category | | | | | | | | | |
| | | (dollars in thousands) | | | | | | | | | |
| Real estate | | | | | | | | | | | | | | | | | | | | | | | | |
| Construction & land development | | $ | 72,063 | | | | 15.8% | | | $ | 36,808 | | | | 9.6% | | | | | | | | | |
| Farmland | | | 18,303 | | | | 4.0% | | | | 19,807 | | | | 5.2% | | | | | | | | | |
| 1-4 Family | | | 86,162 | | | | 18.9% | | | | 62,023 | | | | 16.3% | | | | | | | | | |
| Multifamily | | | 7,601 | | | | 1.7% | | | | 6,865 | | | | 1.8% | | | | | | | | | |
| Non-farm non-residential | | | 178,090 | | | | 39.0% | | | | 163,771 | | | | 42.9% | | | | | | | | | |
| Total real estate | | | 362,219 | | | | 79.4% | | | | 289,274 | | | | 75.8% | | | | | | | | | |
| | | | | | | | | | | | | | | | | | | | | | | | | |
| Agricultural | | | 9,546 | | | | 2.1% | | | | 7,641 | | | | 2.0% | | | | | | | | | |
| Commercial and industrial | | | 59,135 | | | | 12.9% | | | | 61,184 | | | | 16.0% | | | | | | | | | |
| Consumer and other | | | 25,495 | | | | 5.6% | | | | 23,506 | | | | 6.2% | | | | | | | | | |
| Total loans before unearned income | | | 456,395 | | | | 100.0% | | | | 381,605 | | | | 100.0% | | | | | | | | | |
| Less: unearned income | | | (291 | ) | | | | | | | (263 | ) | | | | | | | | | | | | |
| Total loans after unearned income | | $ | 456,104 | | | | | | | $ | 381,342 | | | | | | | | | | | | | |
| | | | | | | | | | | | | | | | | | | | | | | | | |
Loan Maturities by Type. The following table summarizes the scheduled repayments of our loan portfolio at December 31, 2007. Loans having no stated repayment schedule or maturity and overdraft loans are reported as being due in one year or less. Maturities are based on the final contractual payment date and do not reflect the effect of prepayments and scheduled principal amortization.
| | | One Year | | | One Through | | | After | | | | |
| | | or Less | | | Five Years | | | Five Years | | | Total | |
| | | (in thousands) | |
| Real estate: | | | | | | | | | | | | |
| Construction & land development | | $ | 95,441 | | | $ | 2,566 | | | $ | 120 | | | $ | 98,127 | |
| Farmland | | | 21,438 | | | | 1,163 | | | | 464 | | | | 23,065 | |
| 1-4 Family | | | 41,966 | | | | 25,560 | | | | 17,114 | | | | 84,640 | |
| Multifamily | | | 12,897 | | | | 77 | | | | 87 | | | | 13,061 | |
| Non-farm non-residential | | | 194,754 | | | | 37,263 | | | | 3,940 | | | | 235,957 | |
| Total real estate | | | 366,496 | | | | 66,629 | | | | 21,725 | | | | 454,850 | |
| | | | | | | | | | | | | | | | | |
| Agricultural | | | 13,658 | | | | 3,158 | | | | - | | | | 16,816 | |
| Commercial and industrial | | | 64,141 | | | | 16,771 | | | | 161 | | | | 81,073 | |
| Consumer and other | | | 10,987 | | | | 11,317 | | | | 213 | | | | 22,517 | |
| Total loans | | $ | 455,282 | | | $ | 97,875 | | | $ | 22,099 | | | $ | 575,256 | |
| | | | | | | | | | | | | | | | | |
The following table sets forth the scheduled contractual maturities at December 31, 2007 of fixed- and floating-rate loans excluding non-accrual loans.
| | | December 31, 2007 | |
| | | Fixed | | | Floating | | | Total | |
| | | (in thousands) | |
| | | | | | | | | | |
| One year or less | | $ | 98,095 | | | $ | 339,955 | | | $ | 438,050 | |
| One to five years | | | 97,198 | | | | 1,867 | | | | 99,065 | |
| Five to 15 years | | | 8,179 | | | | 144 | | | | 8,323 | |
| Over 15 years | | | 19,530 | | | | - | | | | 19,530 | |
| Subtotal | | | 223,002 | | | | 341,966 | | | | 564,968 | |
| Nonaccrual loans | | | | | | | | | | | 10,288 | |
| Total loans after unearned income | | $ | 223,002 | | | $ | 341,966 | | | $ | 575,256 | |
| | | | | | | | | | | | | |
Non-Performing Assets. The table below sets forth the amounts and categories of our non-performing assets at the dates indicated.
| | | At December 31, | |
| | | 2007 | | | 2006 | | | 2005 | | | 2004 | | | 2003 | |
| | | (in thousands) | |
| Non-accrual loans: | | | | | | | | | | | | | | | |
| Real estate loans: | | | | | | | | | | | | | | | |
| Construction and land development | | $ | 1,841 | | | $ | 2,676 | | | $ | 16,376 | | | $ | 206 | | | $ | 100 | |
| Farmland | | | 419 | | | | 33 | | | | - | | | | - | | | | - | |
| One- to four- family residential | | | 1,819 | | | | 3,202 | | | | 3,548 | | | | 1,059 | | | | 678 | |
| Multifamily | | | 2 | | | | - | | | | - | | | | - | | | | - | |
| Non-farm non-residential | | | 4,950 | | | | 3,882 | | | | 153 | | | | 1,232 | | | | 756 | |
| Non-real estate loans: | | | | | | | | | | | | | | | | | | | | |
| Agricultural | | | - | | | | - | | | | - | | | | - | | | | - | |
| Commercial and industrial | | | 978 | | | | 267 | | | | 358 | | | | 514 | | | | 78 | |
| Consumer and other | | | 279 | | | | 302 | | | | 655 | | | | 450 | | | | 640 | |
| Total non-accrual loans | | | 10,288 | | | | 10,362 | | | | 21,090 | | | | 3,461 | | | | 2,252 | |
| | | | | | | | | | | | | | | | | | | | | |
| Loans 90 days and greater delinquent | | | | | | | | | | | | | | | | | | | | |
| and still accruing: | | | | | | | | | | | | | | | | | | | | |
| Real estate loans: | | | | | | | | | | | | | | | | | | | | |
| Construction and land development | | | - | | | | - | | | | - | | | | - | | | | - | |
| Farmland | | | - | | | | - | | | | - | | | | - | | | | - | |
| One- to four- family residential | | | 544 | | | | 334 | | | | 248 | | | | 370 | | | | 529 | |
| Multifamily | | | - | | | | - | | | | - | | | | - | | | | - | |
| Non-farm non-residential | | | - | | | | - | | | | - | | | | - | | | | - | |
| Non-real estate loans: | | | | | | | | | | | | | | | | | | | | |
| Agricultural | | | - | | | | - | | | | - | | | | - | | | | - | |
| Commercial and industrial | | | - | | | | - | | | | - | | | | 28 | | | | 50 | |
| Consumer and other | | | 3 | | | | - | | | | - | | | | 11 | | | | 3 | |
| Total loans 90 days greater | | | | | | | | | | | | | | | | | | | | |
| delinquent and still accruing | | | 547 | | | | 334 | | | | 248 | | | | 409 | | | | 582 | |
| | | | | | | | | | | | | | | | | | | | | |
| Restructured loans | | | - | | | | 51 | | | | 121 | | | | 134 | | | | 226 | |
| | | | | | | | | | | | | | | | | | | | | |
| Total non-performing loans | | | 10,835 | | | | 10,747 | | | | 21,459 | | | | 4,004 | | | | 3,060 | |
| | | | | | | | | | | | | | | | | | | | | |
| Real estate owned: | | | | | | | | | | | | | | | | | | | | |
| Construction and land development | | | 84 | | | | 2,217 | | | | - | | | | - | | | | - | |
| Farmland | | | - | | | | - | | | | 144 | | | | 133 | | | | 92 | |
| One- to four- family residential | | | 170 | | | | 78 | | | | 81 | | | | 554 | | | | 720 | |
| Multifamily | | | - | | | | - | | | | - | | | | - | | | | - | |
| Non-farm non-residential | | | 119 | | | | 245 | | | | 321 | | | | 3,018 | | | | 3,782 | |
| Non-real estate loans: | | | | | | | | | | | | | | | | | | | | |
| Agricultural | | | - | | | | - | | | | - | | | | - | | | | - | |
| Commercial and industrial | | | - | | | | - | | | | - | | | | - | | | | - | |
| Consumer and other | | | - | | | | - | | | | - | | | | - | | | | - | |
| Total real estate owned | | | 373 | | | | 2,540 | | | | 546 | | | | 3,705 | | | | 4,594 | |
| | | | | | | | | | | | | | | | | | | | | |
| Total non-performing assets | | $ | 11,208 | | | $ | 13,287 | | | $ | 22,005 | | | $ | 7,709 | | | $ | 7,654 | |
| | | | | | | | | | | | | | | | | | | | | |
| Ratios: | | | | | | | | | | | | | | | | | | | | |
| Non-performing assets to total loans | | | 1.95% | | | | 2.62% | | | | 4.48% | | | | 1.69% | | | | 2.01% | |
| Non-performing assets to total assets | | | 1.39% | | | | 1.86% | | | | 3.08% | | | | 1.27% | | | | 1.58% | |
For the years ended December 31, 2007 and 2006, gross interest income that would have been recorded had our non-accruing loans been current in accordance with their original terms was $0.6 million and $1.4 million, respectively.
Allowance for Loan Losses. The allowance for loan losses is maintained at a level considered sufficient to absorb potential losses embedded in the loan portfolio. The allowance is increased by the provision for anticipated loan losses as well as recoveries of previously charged-off loans and is decreased by loan charge-offs. The provision is the necessary charge to current expense to provide for current loan losses and to maintain the allowance at an adequate level commensurate with Management’s evaluation of the risks inherent in the loan portfolio. Various factors are taken into consideration when determining the amount of the provision and the adequacy of the allowance. These factors include but are not limited to:
| · | past due and nonperforming assets; |
| · | specific internal analysis of loans requiring special attention; |
| · | the current level of regulatory classified and criticized assets and the associated risk factors with each; |
| · | changes in underwriting standards or lending procedures and policies; |
| · | charge-off and recovery practices; |
| · | national and local economic and business conditions; |
| · | nature and volume of loans; |
| · | overall portfolio quality; |
| · | adequacy of loan collateral; |
| · | quality of loan review system and degree of oversight by its Board of Directors; |
| · | competition and legal and regulatory requirements on borrowers; |
| · | examinations and review by our internal loan review department, independent accountants and third-party independent loan review personnel; and |
| · | examinations of the loan portfolio by federal and state regulatory agencies. |
The data collected from all sources in determining the adequacy of the allowance is evaluated on a regular basis by Management with regard to current national and local economic trends, prior loss history, underlying collateral values, credit concentrations and industry risks. An estimate of potential loss on specific loans is developed in conjunction with an overall risk evaluation of the total loan portfolio. This evaluation is inherently subjective as it requires estimates that are susceptible to significant revision as new information becomes available.
The allowance consists of specific, general and unallocated components. The specific component relates to loans that are classified as doubtful, substandard or special mention. For such loans that are also classified as impaired, an allowance is established when the discounted cash flows (or collateral value or observable market price) of the impaired loan is lower than the carrying value of that loan. The general component covers non-classified loans and is based on historical loss experience adjusted for qualitative factors. An unallocated component is maintained to cover uncertainties that could affect the estimate of probable losses. The unallocated component of the allowance reflects the margin of imprecision inherent in the underlying assumptions used in the methodologies for estimating specific and general losses in the portfolio.
Allocation of Allowance for Loan Losses. The Company is not able to accurately and efficiently provide the allocation of the allowance for loan losses for a five-year historical period. The following table sets forth activity in our allowance for loan losses for the periods indicated.
| | | At or For the Years Ended December 31, | |
| | | 2007 | | | 2006 | | | 2005 | | | 2004 | | | 2003 | |
| | | (dollars in thousands) | |
| | | | | | | | | | | | | | | | |
| Balance at beginning of period | | $ | 6,675 | | | $ | 7,597 | | | $ | 5,910 | | | $ | 4,942 | | | $ | 4,378 | |
| | | | | | | | | | | | | | | | | | | | | |
| Charge-offs: | | | | | | | | | | | | | | | | | | | | |
| Real estate loans: | | | | | | | | | | | | | | | | | | | | |
| Construction and land development | | | (386 | ) | | | (5,008 | ) | | | - | | | | - | | | | (18 | ) |
| Farmland | | | (123 | ) | | | - | | | | - | | | | - | | | | (18 | ) |
| One- to four- family residential | | | (639 | ) | | | (59 | ) | | | (2,001 | ) | | | (208 | ) | | | (90 | ) |
| Multifamily | | | - | | | | - | | | | - | | | | - | | | | - | |
| Non-farm non-residential | | | (1,901 | ) | | | (208 | ) | | | - | | | | - | | | | (201 | ) |
| Commercial and industrial loans | | | (273 | ) | | | (301 | ) | | | (1,649 | ) | | | (313 | ) | | | (284 | ) |
| Consumer and other | | | (563 | ) | | | (312 | ) | | | (512 | ) | | | (405 | ) | | | (250 | ) |
| Total charge-offs | | | (3,885 | ) | | | (5,888 | ) | | | (4,162 | ) | | | (926 | ) | | | (861 | ) |
| | | | | | | | | | | | | | | | | | | | | |
| Recoveries: | | | | | | | | | | | | | | | | | | | | |
| Real estate loans: | | | | | | | | | | | | | | | | | | | | |
| Construction and land development | | | 779 | | | | 39 | | | | - | | | | - | | | | - | |
| Farmland | | | 14 | | | | - | | | | - | | | | - | | | | - | |
| One- to four- family residential | | | 14 | | | | 25 | | | | 5 | | | | 20 | | | | 1 | |
| Multifamily | | | - | | | | - | | | | - | | | | - | | | | - | |
| Non-farm non-residential | | | 4 | | | | 40 | | | | - | | | | - | | | | - | |
| Commercial and industrial loans | | | 148 | | | | 304 | | | | 86 | | | | 152 | | | | 104 | |
| Consumer and other | | | 201 | | | | 139 | | | | 137 | | | | 52 | | | | 62 | |
| Total recoveries | | | 1,160 | | | | 547 | | | | 228 | | | | 224 | | | | 167 | |
| | | | | | | | | | | | | | | | | | | | | |
| Net charge-offs | | | (2,725 | ) | | | (5,341 | ) | | | (3,934 | ) | | | (702 | ) | | | (694 | ) |
| Provision for loan losses | | | 1,918 | | | | 4,419 | | | | 5,621 | | | | 1,670 | | | | 1,258 | |
| Additional provision from acquisition | | | 325 | | | | - | | | | - | | | | - | | | | - | |
| | | | | | | | | | | | | | | | | | | | | |
| Balance at end of period | | $ | 6,193 | | | $ | 6,675 | | | $ | 7,597 | | | $ | 5,910 | | | $ | 4,942 | |
| | | | | | | | | | | | | | | | | | | | | |
| Ratios: | | | | | | | | | | | | | | | | | | | | |
| Net loan charge-offs to average loans | | | 0.50% | | | | 1.06% | | | | 0.83% | | | | 0.17% | | | | 0.19% | |
| Net loan charge-offs to loans at end of period | | | 0.47% | | | | 1.05% | | | | 0.80% | | | | 0.15% | | | | 0.18% | |
| Allowance for loan losses to loans at end of period | | | 1.08% | | | | 1.32% | | | | 1.55% | | | | 1.30% | | | | 1.30% | |
| Net loan charge-offs to allowance for loan losses | | | 44.00% | | | | 80.01% | | | | 51.78% | | | | 11.88% | | | | 14.04% | |
| Net loan charge-offs to provision charged to expense | | | 142.04% | | | | 120.86% | | | | 69.99% | | | | 42.04% | | | | 55.17% | |
| | | | | | | | | | | | | | | | | | | | | |
Investment Securities Portfolio. The securities portfolio totaled $142.1 million at December 31, 2007 and consisted principally of U.S. Government agency securities, mortgage-backed obligations, asset-backed securities, corporate debt securities and mutual funds or other equity securities. The portfolio provides us with a relatively stable source of income and provides a balance to interest rate and credit risks as compared to other categories of the balance sheet.
At December 31, 2007, $49.2 million or 34.6% of our securities (excluding Federal Home Loan Bank of Dallas stock) were scheduled to mature in less than one year. This includes $48.9 million in discount notes that are being used solely for pledging purposes. When excluding these securities, only 1.0% of our securities mature in less than one year. Securities with maturity dates over 15 years totaled 5.0% of the total portfolio or 7.6% of the portfolio after deducting the discount notes for pledging. The average maturity of the securities portfolio was 3.3 years.
At December 31, 2007, securities totaling $105.6 million were classified as available for sale and $36.5 million were classified as held to maturity, compared to $111.4 million classified as available for sale and $47.0 million classified as held to maturity at December 31, 2006. Management periodically assesses the quality of our investment holdings using procedures similar to those used in assessing the credit risks inherent in the loan portfolio. At December 31, 2007, it is Management’s opinion that we held no investment securities which bear a greater than the normal amount of credit risk as compared to similar investments and that no securities had an amortized cost greater than their recoverable value.
Average securities as a percentage of average interest-earning assets were 21.5% for the year December 31, 2007 and 25.9% for the year ended December 31, 2006. All securities held at December 31, 2007 qualified as pledgeable securities, except $5.8 million of debt securities and $3.3 million of equity securities. Securities pledged at December 31, 2007 totaled $131.6 million.
The following tables set forth the composition of our investment securities portfolio (excluding Federal Home Loan Bank of Dallas stock) at the dates indicated.
| | | December 31, 2007 | | | December 31, 2006 | | | December 31, 2005 | |
| | | | | | Gross | | | Gross | | | | | | | | | Gross | | | Gross | | | | | | | | | Gross | | | Gross | | | | |
| | | Amortized | | | Unrealized | | | Unrealized | | | Fair | | | Amortized | | | Unrealized | | | Unrealized | | | Fair | | | Amortized | | | Unrealized | | | Unrealized | | | Fair | |
| | | Cost | | | Gains | | | Losses | | | Value | | | Cost | | | Gains | | | Losses | | | Value | | | Cost | | | Gains | | | Losses | | | Value | |
| | | (in thousands) | |
| Available-for-sale: | | | | | | | | | | | | | | | | | | | | | | | | | | | | | | | | | | | | |
| U.S. Government Agencies | | $ | 92,962 | | | $ | 26 | | | $ | (25 | ) | | $ | 92,963 | | | $ | 98,369 | | | $ | - | | | $ | (1,226 | ) | | $ | 97,143 | | | $ | 95,880 | | | $ | 20 | | | $ | (805 | ) | | $ | 95,095 | |
| Mortgage-backed obligations | | | 2,016 | | | | 43 | | | | (23 | ) | | | 2,036 | | | | 4,077 | | | | 39 | | | | (103 | ) | | | 4,013 | | | | 2,712 | | | | 3 | | | | (101 | ) | | | 2,614 | |
| Asset-backed securities | | | 1,340 | | | | - | | | | (95 | ) | | | 1,245 | | | | 1,385 | | | | 1 | | | | (1 | ) | | | 1,385 | | | | 426 | | | | - | | | | (2 | ) | | | 424 | |
| Corporate debt securities | | | 5,954 | | | | 50 | | | | (214 | ) | | | 5,790 | | | | 7,394 | | | | 31 | | | | (61 | ) | | | 7,364 | | | | 8,157 | | | | 36 | | | | (111 | ) | | | 8,082 | |
| Mutual funds or other equity securities | | | 3,805 | | | | 22 | | | | (291 | ) | | | 3,536 | | | | 1,500 | | | | - | | | | (52 | ) | | | 1,448 | | | | 1,500 | | | | - | | | | (130 | ) | | | 1,370 | |
| Total securities | | $ | 106,077 | | | $ | 141 | | | $ | (648 | ) | | $ | 105,570 | | | $ | 112,725 | | | $ | 71 | | | $ | (1,443 | ) | | $ | 111,353 | | | $ | 108,675 | | | $ | 59 | | | $ | (1,149 | ) | | $ | 107,585 | |
| | | | | | | | | | | | | | | | | | | | | | | | | | | | | | | | | | | | | | | | | | | | | | | | | |
| | | | | | | | | | | | | | | | | | | | | | | | | | | | | | | | | | | | | | | | | | | | | | | | | |
| Held-to-maturity: | | | | | | | | | | | | | | | | | | | | | | | | | | | | | | | | | | | | | | | | | | | | | | | | |
| U.S. Government Agencies | | $ | 33,984 | | | $ | 24 | | | $ | (281 | ) | | $ | 33,727 | | | $ | 43,976 | | | $ | - | | | $ | (1,280 | ) | | $ | 42,696 | | | $ | 63,968 | | | $ | - | | | $ | (1,000 | ) | | $ | 62,968 | |
| Mortgage-backed obligations | | | 2,514 | | | | - | | | | (35 | ) | | | 2,479 | | | | 3,023 | | | | - | | | | (105 | ) | | | 2,918 | | | | 3,647 | | | | - | | | | (122 | ) | | | 3,525 | |
| Total securities | | $ | 36,498 | | | $ | 24 | | | $ | (316 | ) | | $ | 36,206 | | | $ | 46,999 | | | $ | - | | | $ | (1,385 | ) | | $ | 45,614 | | | $ | 67,615 | | | $ | - | | | $ | (1,122 | ) | | $ | 66,493 | |
| | | | | | | | | | | | | | | | | | | | | | | | | | | | | | | | | | | | | | | | | | | | | | | | | |
Portfolio Maturities and Yields. The composition and maturities of the investment securities portfolio at December 31, 2007 are summarized in the following table. Maturities are based on the final contractual payment dates, and do not reflect the impact of prepayments or early redemptions that may occur.
| | | | | | | | | More than One Year | | | More than Five Years | | | | | | | |
| | | One Year or Less | | | through Five Years | | | through Ten Years | | | More than Ten Years | |
| | | | | | Weighted | | | | | | Weighted | | | | | | Weighted | | | | | | Weighted | |
| | | Amortized | | | Average | | | Amortized | | | Average | | | Amortized | | | Average | | | Amortized | | | Average | |
| | | Cost | | | Yield | | | Cost | | | Yield | | | Cost | | | Yield | | | Cost | | | Yield | |
| | | (dollars in thousands) |
| Investment securities held to maturity: | | | | | | | | | | | | | | | | | | | | | | | | |
| U.S. Government agencies | | $ | - | | | | - | | | $ | 999 | | | | 4.15% | | | $ | 9,469 | | | | 4.57% | | | $ | 23,516 | | | | 5.49% | |
| Mortgage-backed obligations | | | - | | | | - | | | | - | | | | - | | | | 365 | | | | 3.66% | | | | 2,149 | | | | 4.70% | |
| Total securities held to maturity | | $ | - | | | | - | | | $ | 999 | | | | 4.15% | | | $ | 9,834 | | | | 4.53% | | | $ | 25,665 | | | | 5.42% | |
| | | | | | | | | | | | | | | | | | | | | | | | | | | | | | | | | |
| Investment securities available for sale: | | | | | | | | | | | | | | | | | | | | | | | | | | | | | | | | |
| U.S. Government agencies | | $ | 48,817 | | | | 4.12% | | | $ | 7,900 | | | | 5.00% | | | $ | 3,805 | | | | 5.24% | | | $ | 32,440 | | | | 5.88% | |
| Mortgage-backed obligations | | | - | | | | - | | | | - | | | | - | | | | - | | | | - | | | | 2,016 | | | | 5.43% | |
| Asset-backed securities | | | - | | | | - | | | | 90 | | | | 5.92% | | | | - | | | | - | | | | 1,250 | | | | 8.16% | |
| Corporate debt securities | | | 365 | | | | 6.00% | | | | 2,683 | | | | 5.48% | | | | 763 | | | | 5.91% | | | | 2,143 | | | | 6.99% | |
| Mutual funds or other equity securities | | | - | | | | - | | | | - | | | | - | | | | - | | | | - | | | | 3,805 | | | | 6.47% | |
| Total securities available for sale | | $ | 49,182 | | | | 4.13 | % | | $ | 10,673 | | | | 5.13% | | | $ | 4,568 | | | | 5.35% | | | $ | 41,654 | | | | 6.04% | |
| | | | | | | | | | | | | | | | | | | | | | | | | | | | | | | | | |
| | | | | | | | | | | | | | | | | | | | | | | | | | | | | | | | | |
| | | Total Securities | | | | | | | | | | | | | | | | | | | | | |
| | | | | | | | | | | Weighted | | | | | | | | | | | | | | | | | | | | | |
| | | Amortized | | | | | | | Average | | | | | | | | | | | | | | | | | | | | | |
| | | Cost | | | Fair Value | | | Yield | | | | | | | | | | | | | | | | | | | | | |
| | | (dollars in thousands) | | | | | | | | | | | | | | | | | | | | | |
| Investment securities held to maturity: | | | | | | | | | | | | | | | | | | | | | | | | | | | | | | | | |
| U.S. Government agencies | | $ | 33,984 | | | $ | 33,727 | | | | 5.19% | | | | | | | | | | | | | | | | | | | | | |
| Mortgage-backed obligations | | | 2,514 | | | | 2,479 | | | | 4.55% | | | | | | | | | | | | | | | | | | | | | |
| Total securities held to maturity | | $ | 36,498 | | | $ | 36,206 | | | | 5.15% | | | | | | | | | | | | | | | | | | | | | |
| | | | | | | | | | | | | | | | | | | | | | | | | | | | | | | | | |
| Investment securities available for sale: | | | | | | | | | | | | | | | | | | | | | | | | | | | | | | | | |
| U.S. Government agencies | | $ | 92,962 | | | $ | 92,963 | | | | 4.85% | | | | | | | | | | | | | | | | | | | | | |
| Mortgage-backed obligations | | | 2,016 | | | | 2,036 | | | | 5.43% | | | | | | | | | | | | | | | | | | | | | |
| Asset-backed securities | | | 1,340 | | | | 1,245 | | | | 8.01% | | | | | | | | | | | | | | | | | | | | | |
| Corporate debt securities | | | 5,954 | | | | 5,790 | | | | 6.22% | | | | | | | | | | | | | | | | | | | | | |
| Mutual funds or other equity securities | | | 3,805 | | | | 3,536 | | | | 6.47% | | | | | | | | | | | | | | | | | | | | | |
| Total securities available for sale | | $ | 106,077 | | | $ | 105,570 | | | | 5.04% | | | | | | | | | | | | | | | | | | | | | |
| | | | | | | | | | | | | | | | | | | | | | | | | | | | | | | | | |
Deposits. The following table sets forth the distribution of our average total deposit accounts, by account type, for the periods indicated.
| | | December 31, |
| | | 2007 | | 2006 | | 2005 |
| | | (dollars in thousands) |
| | | | | | | | | | | | | | | | | | | | | | | | | | | | |
| | | Balance | | | As % of Total | | Wtd Avg Rate | | Balance | | | As % of Total | | Wtd Avg Rate | | Balance | | | As % of Total | | Wtd Avg Rate |
| Noninterest-bearing demand | | $ | 120,740 | | | | 16.7 | % | | | 0.0 | % | | $ | 122,540 | | | | 19.5 | % | | | 0.0 | % | | $ | 129,827 | | | | 20.5 | % | | | 0.0 | % |
| Interest-bearing demand | | | 223,142 | | | | 30.9 | % | | | 3.1 | % | | | 185,308 | | | | 29.6 | % | | | 3.1 | % | | | 161,958 | | | | 25.6 | % | | | 1.8 | % |
| Savings | | | 45,044 | | | | 6.2 | % | | | 0.5 | % | | | 41,161 | | | | 6.6 | % | | | 0.4 | % | | | 42,633 | | | | 6.7 | % | | | 0.3 | % |
| Time | | | 334,168 | | | | 46.2 | % | | | 4.6 | % | | | 277,284 | | | | 44.3 | % | | | 4.2 | % | | | 298,490 | | | | 47.2 | % | | | 3.2 | % |
| Total deposits | | $ | 723,094 | | | | 100.0 | % | | | | | | $ | 626,293 | | | | 100.0 | % | | | | | | $ | 632,908 | | | | 100.0 | % | | | | |
| | | | | | | | | | | | | | | | | | | | | | | | | | | | | | | | | | | | | |
As of December 31, 2007, the aggregate amount of outstanding certificates of deposit in amounts greater than or equal to $100,000 was approximately $167.3 million. The following table sets forth the maturity of those certificates as of December 31, 2007, 2006 and 2005.
| | | December 31, | |
| | | 2007 | | | 2006 | | | 2005 | |
| | | | | | Weighted | | | | | | Weighted | | | | | | Weighted | |
| | | | | | Average | | | | | | Average | | | | | | Average | |
| | | Balance | | | Rate | | | Balance | | | Rate | | | Balance | | | Rate | |
| | | (dollars in thousands) | |
| | | | | | | | | | | | | | | | | | | |
| Due in one year or less | | $ | 140,052 | | | | 4.43% | | | $ | 114,793 | | | | 4.88% | | | $ | 141,964 | | | | 3.77% | |
| Due after one year through three years | | | 20,207 | | | | 4.39% | | | | 15,228 | | | | 4.27% | | | | 25,938 | | | | 4.19% | |
| Due after three years | | | 7,083 | | | | 5.14% | | | | 12,526 | | | | 5.07% | | | | 12,656 | | | | 4.82% | |
| Total | | $ | 167,342 | | | | 4.46% | | | $ | 142,547 | | | | 4.83% | | | $ | 180,558 | | | | 3.90% | |
| | | | | | | | | | | | | | | | | | | | | | | | | |
Borrowings. The following table sets forth information concerning balances and interest rates on all of our short-term borrowings at the dates and for the periods indicated.
| | | December 31, | |
| | | 2007 | | | 2006 | | | 2005 | |
| | | (dollars in thousands) | |
| | | | | | | | | | |
| Outstanding at year end | | $ | 10,401 | | | $ | 6,584 | | | $ | 8,981 | |
| Maximum month-end outstanding | | | 45,766 | | | | 37,353 | | | | 32,348 | |
| Average daily outstanding | | | 16,655 | | | | 23,731 | | | | 17,381 | |
| Weighted average rate during the year | | | 5.18% | | | | 5.19% | | | | 3.14% | |
| Average rate at year end | | | 3.50% | | | | 4.41% | | | | 3.56% | |
Long-term borrowings consist of junior subordinated debentures totaling $3.1 million. These debentures were issued in August 2003 for a 30 year period, callable after 5 years. The rate is LIBOR plus 300bp with quarterly interest payments. It is currently the Company’s intent to redeem these debentures in August 2008 (see Note 10).
Shareholders’ Equity and Return on Equity and Assets. Shareholders’ equity provides a source of permanent funding, allows for future growth and the ability to absorb unforeseen adverse developments. At December 31, 2007, shareholders’ equity totaled $66.5 million compared to $59.2 million at December 31, 2006.
Information regarding performance and equity ratios is as follows:
| | December 31, |
| | 2007 | 2006 | 2005 |
| | | | |
| Return on average assets | 1.37% | 1.21% | 0.95% |
| Return on average equity | 16.15% | 15.54% | 10.97% |
| Dividend payout ratio | 34.13% | 37.89% | 52.67% |
Results of Operations for the Years Ended December 31, 2007 and 2006
Net Income. Net income for the year ended December 31, 2007 was $10.3 million, an increase of $1.5 million or 16.6%, from $8.8 million for the year ended December 31, 2006. The increase in income was due primarily to an increase in net interest income, and a decrease in the provision for loan losses partially offset by increases in salaries and employee benefits. Net interest income increased $2.4 million in 2007 due to an increase in average balances and the net yield on interest-earning assets. $1.9 million was charged against the provision for loan losses during the year ended December 31, 2007, a decrease of $2.5 million as compared to $4.4 million for the year ended December 31, 2006. Salaries and employee benefits increased by $1.7 million in connection with the additional staff acquired from the Homestead Bank merger (see Note 3) and increased support staff.
Earnings per share for the year ended December 31, 2007 was $1.85 per share, an increase of 16.6% or $0.26 per share from $1.58 per share for the year ended December 31, 2006.
Net Interest Income. Net interest income is the largest component of our earnings. It is calculated by subtracting the cost of interest-bearing liabilities from the income earned on interest-earning assets and represents the earnings from our primary business of gathering deposits and making loans and investments. Our long-term objective is to manage this income to provide the largest possible amount of income while balancing interest rate, credit and liquidity risks.
A financial institution’s asset and liability structure is substantially different from that of an industrial company, in that virtually all assets and liabilities are monetary in nature. Accordingly, changes in interest rates, which are generally impacted by inflation rates, may have a significant impact on a financial institution’s performance. The impact of interest rate changes depends on the sensitivity to change of our interest-earning assets and interest-bearing liabilities. The effects of the changing interest rate environment in recent years and our interest sensitivity position are discussed below.
Net interest income in 2007 was $34.1 million, an increase of $2.4 million or 7.4%, as compared to $31.8 million in 2006. The increase in interest income was due principally to increases in the average balances of loans. Also during those same periods, yields on investment securities and loans enhanced interest income. An increase in interest income was partially offset by the increase in interest expense from 2006 to 2007, which was attributable to the increased volume of interest-bearing liabilities and increased cost of funds.
Comparing 2007 to 2006, the average yield on interest-earning assets increased by 40 basis points and the average rate paid on interest-bearing liabilities increased by 20 basis points. The net yield on interest-earning assets was 4.8% for the year ended December 31, 2007, compared to 4.6% for 2006.
The net interest income yield shown below in the average balance sheet is calculated by dividing net interest income by average interest-earning assets and is a measure of the efficiency of the earnings from balance sheet activities. It is affected by changes in the difference between interest on interest-earning assets and interest-bearing liabilities and the percentage of interest-earning assets funded by interest-bearing liabilities (leverage). The leverage for the year ending December 31, 2007 and 2006 was 78.6% and 77.5%, respectively.
The following tables set forth average balance sheets, average yields and costs, and certain other information for the periods indicated. No tax-equivalent yield adjustments were made, as the effect thereof was not material. All average balances are daily average balances. Non-accrual loans were included in the computation of average balances, but have been reflected in the table as loans carrying a zero yield. The yields set forth below include the effect of deferred fees, discounts and premiums that are amortized or accreted to interest income or expense.
| | | Years Ended December 31, |
| | | 2007 | | 2006 | | 2005 |
| | | Average | | | | | | Yield/ | | Average | | | | | | Yield/ | | | Average | | | | | | Yield/ | |
| | | Balance | | | Interest | | | Rate | | Balance | | | Interest | | | Rate | | | Balance | | | Interest | | | Rate | |
| | | | | | | | | | | (dollars in thousands) | | | | | | | |
| Assets | | | | | | | | | | | | | | | | | | | | | | | | | | | |
| Interest-earning assets: | | | | | | | | | | | | | | | | | | | | | | |
| Interest-bearing deposits with banks | | $ | 1,977 | | | $ | 87 | | | | 4.4 | % | | $ | 2,323 | | | $ | 95 | | | | 4.1 | % | | $ | 2,509 | | | $ | 96 | | | | 3.8 | % |
| Securities (including FHLB stock) | | | 152,990 | | | | 8,381 | | | | 5.5 | % | | | 178,419 | | | | 9,654 | | | | 5.4 | % | | | 109,236 | | | | 5,637 | | | | 5.2 | % |
| Federal funds sold | | | 8,083 | | | | 400 | | | | 4.9 | % | | | 3,115 | | | | 159 | | | | 5.1 | % | | | 6,028 | | | | 229 | | | | 3.8 | % |
| Loans held for sale | | | 5,216 | | | | 142 | | | | 2.7 | % | | | 577 | | | | 27 | | | | 4.7 | % | | | 1,224 | | | | 87 | | | | 7.1 | % |
| Loans, net of unearned income | | | 543,946 | | | | 46,470 | | | | 8.5 | % | | | 505,623 | | | | 41,002 | | | | 8.1 | % | | | 476,144 | | | | 34,280 | | | | 7.2 | % |
| Total interest-earning assets | | | 712,212 | | | | 55,480 | | | | 7.8 | % | | | 690,057 | | | | 50,937 | | | | 7.4 | % | | | 595,141 | | | | 40,329 | | | | 6.8 | % |
| | | | | | | | | | | | | | | | | | | | | | | | | | | | | | | | | | | | | |
| Noninterest-earning assets: | | | | | | | | | | | | | | | | | | | | | | | | | |
| Cash and due from banks | | | 19,569 | | | | | | | | | | | | 20,415 | | | | | | | | | | | | 22,047 | | | | | | | | | |
| Premises and equipment, net | | | 14,812 | | | | | | | | | | | | 12,442 | | | | | | | | | | | | 11,413 | | | | | | | | | |
| Other assets | | | 4,644 | | | | | | | | | | | | 3,679 | | | | | | | | | | | | 2,953 | | | | | | | | | |
| Total | | $ | 751,237 | | | $ | 55,480 | | | | | | | $ | 726,593 | | | $ | 50,937 | | | | | | | $ | 631,554 | | | $ | 40,329 | | | | | |
| | | | | | | | | | | | | | | | | | | | | | | | | | | | | | | | | | | | | |
| Liabilities and Stockholders' Equity | | | | | | | | | | | | | | | | | | | | | |
| Interest-bearing liabilities: | | | | | | | | | | | | | | | | | | | | | | | | | | | | | |
| Demand deposits | | $ | 196,805 | | | $ | 6,152 | | | | 3.1 | % | | $ | 180,384 | | | $ | 5,657 | | | | 3.1 | % | | $ | 124,757 | | | $ | 2,289 | | | | 1.8 | % |
| Savings deposits | | | 42,564 | | | | 228 | | | | 0.5 | % | | | 42,727 | | | | 174 | | | | 0.4 | % | | | 35,969 | | | | 117 | | | | 0.3 | % |
| Time deposits | | | 297,193 | | | | 13,673 | | | | 4.6 | % | | | 269,016 | | | | 11,224 | | | | 4.2 | % | | | 263,720 | | | | 8,468 | | | | 3.2 | % |
| Borrowings | | | 23,450 | | | | 1,345 | | | | 5.7 | % | | | 42,435 | | | | 2,151 | | | | 5.1 | % | | | 45,732 | | | | 1,493 | | | | 3.3 | % |
| Total interest-bearing liabilities | | | 560,012 | | | | 21,398 | | | | 3.8 | % | | | 534,562 | | | | 19,206 | | | | 3.6 | % | | | 470,178 | | | | 12,367 | | | | 2.6 | % |
| | | | | | | | | | | | | | | | | | | | | | | | | | | | | | | | | | | | | |
| Noninterest-bearing liabilities: | | | | | | | | | | | | | | | | | | | | | | | | |
| Demand deposits | | | 121,894 | | | | | | | | | | | | 130,742 | | | | | | | | | | | | 102,549 | | | | | | | | | |
| Other | | | 5,767 | | | | | | | | | | | | 4,649 | | | | | | | | | | | | 3,926 | | | | | | | | | |
| Total liabilities | | | 687,673 | | | | 21,398 | | | | | | | | 669,953 | | | | 19,206 | | | | | | | | 576,653 | | | | 12,367 | | | | | |
| Stockholders' equity | | | 63,564 | | | | | | | | | | | | 56,640 | | | | | | | | | | | | 54,901 | | | | | | | | | |
| Total | | $ | 751,237 | | | | 21,398 | | | | | | | $ | 726,593 | | | | 19,206 | | | | | | | $ | 631,554 | | | | 12,367 | | | | | |
| Net interest income | | | $ | 34,082 | | | | | | | | | | | $ | 31,731 | | | | | | | | | | | $ | 27,962 | | | | | |
Net interest rate spread (1) | | | | 4.0 | % | | | | | | | | | | | 3.8 | % | | | | | | | | | | | 4.1 | % |
Net interest-earning assets (2) | | $ | 152,200 | | | | | | | | | | | $ | 155,495 | | | | | | | | | | | $ | 124,963 | | | | | | | | | |
Net interest margin (3) | | | | 4.8 | % | | | | | | | | | | | 4.6 | % | | | | | | | | | | | 4.7 | % |
| | | | | | | | | | | | | | | | | | | | | | | | | | | | | | | | | | | | | |
| Average interest-earning assets to | | | | | | | | | | | | | | | | | | | | | |
| interest-bearing liabilities | | | | 127.2 | % | | | | | | | | | | | 129.1 | % | | | | | | | | | | | 126.6 | % |
__________________________________
(1) Net interest rate spread represents the difference between the yield on average interest-earning assets and the cost of average interest-bearing liabilities.
(2) Net interest-earning assets represents total interest-earning assets less total interest-bearing liabilities.
(3) Net interest margin represents net interest income divided by average total interest-earning assets.
Rate/Volume Analysis. The following table presents the dollar amount of changes in interest income and interest expense for major components of interest-earning assets and interest-bearing liabilities for the periods indicated. The table distinguishes between (i) changes attributable to rate (change in rate multiplied by the prior period’s volume), (ii) changes attributable to volume (changes in volume multiplied by the prior period’s rate), (iii) mixed changes (changes that are not attributable to either rate of volume) and (iv) total increase (decrease) (the sum of the previous columns).
| | | Years Ended December 31, | |
| | | 2007 Compared to 2006 | | | 2006 Compared to 2005 | |
| | | Increase (Decrease) Due To | | | Increase (Decrease) Due To | |
| | | | | | | | | Rate/ | | | Increase/ | | | | | | | | | Rate/ | | | Increase/ | |
| | | Volume | | | Rate | | | Volume | | | Decrease | | | Volume | | | Rate | | | Volume | | | Decrease | |
| | | (in thousands) | |
| Interest earned on: | | | | | | | | | | | | | | | | | | | | | | | | |
| Interest-bearing deposits with banks | | $ | (14 | ) | | $ | 7 | | | $ | (1 | ) | | $ | (8 | ) | | $ | (7 | ) | | $ | 6 | | | $ | - | | | $ | (1 | ) |
| Securities (including FHLB stock) | | | (1,376 | ) | | | 120 | | | | (17 | ) | | | (1,273 | ) | | | 3,570 | | | | 273 | | | | 174 | | | | 4,017 | |
| Federal funds sold | | | 254 | | | | (5 | ) | | | (8 | ) | | | 241 | | | | (111 | ) | | | 79 | | | | (38 | ) | | | (70 | ) |
| Loans held for sale | | | 217 | | | | (11 | ) | | | (91 | ) | | | 115 | | | | (46 | ) | | | (30 | ) | | | 16 | | | | (60 | ) |
| Loans, net of unearned income | | | 3,108 | | | | 2,194 | | | | 166 | | | | 5,468 | | | | 2,122 | | | | 4,332 | | | | 268 | | | | 6,722 | |
| Total interest income | | | 2,189 | | | | 2,305 | | | | 49 | | | | 4,543 | | | | 5,528 | | | | 4,660 | | | | 420 | | | | 10,608 | |
| | | | | | | | | | | | | | | | | | | | | | | | | | | | | | | | | |
| Interest paid on: | | | | | | | | | | | | | | | | | | | | | | | | | | | | | | | | |
| Demand deposits | | | 515 | | | | (18 | ) | | | (2 | ) | | | 495 | | | | 1,021 | | | | 1,623 | | | | 724 | | | | 3,368 | |
| Savings deposits | | | (1 | ) | | | 55 | | | | - | | | | 54 | | | | 22 | | | | 29 | | | | 6 | | | | 57 | |
| Time deposits | | | 1,176 | | | | 1,153 | | | | 120 | | | | 2,449 | | | | 170 | | | | 2,535 | | | | 51 | | | | 2,756 | |
| Borrowings | | | (962 | ) | | | 283 | | | | (127 | ) | | | (806 | ) | | | (108 | ) | | | 825 | | | | (59 | ) | | | 658 | |
| Total interest expense | | | 728 | | | | 1,473 | | | | (9 | ) | | | 2,192 | | | | 1,105 | | | | 5,012 | | | | 722 | | | | 6,839 | |
| Change in net interest income | | $ | 1,461 | | | $ | 832 | | | $ | 58 | | | $ | 2,351 | | | $ | 4,423 | | | $ | (352 | ) | | $ | (302 | ) | | $ | 3,769 | |
| | | | | | | | | | | | | | | | | | | | | | | | | | | | | | | | | |
Provision for Loan Losses. The provision for loan losses was $1.9 million and $4.4 million in 2007 and 2006, respectively. The decreased 2007 provisions were attributable to $2.7 million in net loan charge-offs during 2007 compared to $5.3 million in net loan charge-offs during 2006. Of the loan charge-offs in 2007, approximately $3.0 million were loan secured by real estate of which $2.2 million were commercial real estate and approximately $0.8 million were residential properties. In 2007, recoveries of $1.2 million were recognized on loans previously charged off as compared to $547,000 in 2006. Of the loan charge-offs during 2006, and the consequent increase in the provision, $4.8 million related specifically to home mortgages. The allowance for loan losses at December 31, 2007 was $6.2 million, compared to $6.7 million at December 31, 2006, and comprised 1.08% and 1.32% of total loans, respectively. Management believes that the current level of the allowance is adequate to cover losses in the loan portfolio given the current economic conditions, expected net charge-offs and nonperforming asset levels.
In July 2007, the Company signed a Final Release and Settlement Agreement with BankInsurance, Inc., the Company’s insurance company, for a claim made by the Company under the Financial Institution Bond for the suspected fraudulent mortgage loans (see Note 6 to the Consolidated Financial Statements). Under this Release and Agreement, the Company received $1.1 million. After attorney fees and expenses, the Company recorded a loan recovery totaling $723,000 in 2007.
Noninterest Income. Noninterest income totaled $4.7 million in 2007, a decrease of $331,000, compared to $4.4 million in 2006. Service charges, commissions and fees totaled $3.8 million and $3.6 million for the years ended December 31, 2007 and 2006, respectively. Net securities losses were $478,000 in 2007, compared to $234,000 in 2006. As a result of increases in staff and mortgage loan volume, gains on sale of loans were $272,000 in 2007, up $201,000 when compared to $71,000 gains in 2006. Other noninterest income increased $156,000 to $1.1 million in 2007 from $926,000 in 2006 primarily from increases in bankcard fees and credit card fee income.
Noninterest Expense. Noninterest expense totaled $21.1 million in 2007 and $18.4 million in 2006. Salaries and benefits increased $1.7 million in 2007 to $9.7 million from $7.9 million in 2006. The increase in salaries was primarily related the Homestead Bank merger (see Note 3) and to staffing several operational departments, including, credit and audit, to accommodate increased activities. At December 31, 2007, 240 employees represented 222 full-time equivalent staff members as compared to 196 full-time equivalent staff members in 2006. Occupancy and equipment expense totaled $2.6 million in 2007 and $2.3 million in 2006. The net cost of other real estate and repossessions increased $119,000 million in 2007 to $396,000 from $277,000 in 2006 due to increases in costs incurred in connection with owning, maintaining and the sale and disposition of other real estate owned. Other noninterest expense totaled $8.5 million in 2007, compared to $7.8 million in 2006, an increase of $673,000 or 8.6%. The increase in other noninterest expense was primarily attributable to increased legal and professional fees, operating supplies, data processing expenses, travel and lodging, sales tax and tax on capital expenses offset by the reduction in amortization of core deposits.
The following is a summary of the significant components of other noninterest expense:
| | | Years Ended December 31, | |
| | | 2007 | | | 2006 | | | 2005 | |
| | | (in thousands) | |
| Other noninterest expense: | | | | | | | | | |
| Legal and professional fees | | $ | 1,610 | | | $ | 1,390 | | | $ | 1,201 | |
| Operating supplies | | | 615 | | | | 545 | | | | 514 | |
| Marketing and public relations | | | 842 | | | | 823 | | | | 564 | |
| Data processing | | | 955 | | | | 904 | | | | 736 | |
| Travel and lodging | | | 439 | | | | 280 | | | | 280 | |
| Taxes - sales and capital | | | 628 | | | | 582 | | | | 684 | |
| Telephone | | | 211 | | | | 244 | | | | 421 | |
| Amortization of core deposit intangibles | | | 203 | | | | 525 | | | | 630 | |
| Other | | | 2,999 | | | | 2,535 | | | | 2,410 | |
| Total other expense | | $ | 8,502 | | | $ | 7,828 | | | $ | 7,440 | |
| | | | | | | | | | | | | |
Income Taxes. The provision for income taxes for the years ended December 31, 2007 and 2006 was $5.5 million and $4.5 million respectively. The higher provision for income taxes in 2007 reflected higher income during 2007 as compared to 2006 resulting from increases in net interest income, reductions in the provision for loan losses offset by increases in noninterest expense. The Company’s effective tax rate amounted to 34.8% and 33.8% during 2007 and 2006, respectively. The difference between the effective tax rate and the statutory tax rate primarily relates to variances in items that are non-taxable or non-deductible and various tax credits.
Results of Operations for the Years Ended December 31, 2006 and 2005
Net Income. Net income for the year ended December 31, 2006 was $8.8 million, an increase of $2.8 million or 46.1%, from $6.0 million for the year ended December 31, 2005. The increase in income was due primarily to an increase in net interest income, a decrease in the provision for loan losses and a decrease in the net cost of other real estate and repossessions. Net interest income increased $3.8 million in 2006 due to an increase in average balances and yields of both securities and loans. To primarily provide for current year charge-offs, $4.4 million was charged to the loan loss provision for the year ended December 31, 2006, a decrease of $1.2 million as compared to $5.6 million for the year ended December 31, 2005. The net cost of other real estate and repossessions decreased by $1.2 million due to a reduction in costs incurred in connection with owning, maintaining and the sale and disposition of other real estate owned.
Earnings per share for the year ended December 31, 2006 was $1.58 per share, an increase of 46.1% or $0.50 per share from $1.08 per share for the year ended December 31, 2005.
Net Interest Income. Net interest income in 2006 was $31.7 million, an increase of $3.8 million or 13.5%, as compared to $28.0 million in 2005. The increase in interest income was due principally to increases in the average balances of investment securities and loans. Also during those same periods, yields on investment securities and loans enhanced interest income. An increase in interest income was partially offset by the increase in interest expense from 2005 to 2006, which was attributable to the increased volume of interest-bearing liabilities and increased cost of funds.
The net yield on interest-earning assets is calculated by dividing net interest income by our average interest-earning assets and is a measure of the efficiency of the earnings from balance sheet activities. It is affected by changes in the difference between interest on interest-earning assets and interest-bearing liabilities and the percentage of interest-earning assets funded by interest-bearing liabilities.
Comparing 2006 to 2005, the average yield on interest-earning assets increased by 60 basis points and the average rate paid on interest-bearing liabilities increased by 100 basis points. The net yield on interest-earning assets was 4.6% for the year ended December 31, 2006, compared to 4.7% for 2005.
Noninterest Income. Noninterest income totaled $4.4 million in 2006, a decrease of $861,000, compared to $5.2 million in 2005. Service charges, commissions and fees totaled $3.6 million and $3.5 million for the years ended December 31, 2006 and 2005, respectively. Net securities losses were $234,000 in 2006, compared to gains of $7,000 in 2005. As a result of staff and mortgage loan volume reductions, gains on sale of loans were $71,000 in 2006, down $252,000 when compared to $323,000 gains in 2005. Other noninterest income decreased $466,000 to $926,000 in 2006 from $1.4 million in 2005 primarily from the sale of Pulse stock (ATM software vendor) in 2005 resulting from the merger of Pulse with Discover.
Provision for Loan Losses. The provision for loan losses was $4.4 million and $5.6 million in 2006 and 2005, respectively. The increased 2006 provisions were attributable to $3.9 million in net loan charge-offs during 2005 and $5.3 million in net loan charge-offs during 2006. Of the loan charge-offs during 2006, and the consequent increase in the provision, $4.8 million related specifically to home mortgages. Of the loans charged-off during 2005, $1.6 million related to seven distinct commercial credits. In addition, $145,000 related to home mortgages and $1.3 million were storm-related credits in 2005. The allowance for loan losses at December 31, 2006 was $6.7 million, compared to $7.6 million at December 31, 2005, and comprised 1.32% and 1.55% of total loans, respectively.
Noninterest Expense. Noninterest expense totaled $18.4 million in 2006 and remained relatively flat compared to 2005. Salaries and benefits increased $699,000 in 2006 to $7.9 million from $7.2 million in 2005. The increase in salaries was primarily related to staffing several operational departments, including loan review, credit and audit, to accommodate increased activities. At December 31, 2006, 214 employees represented 196 full-time equivalent staff members as compared to 189 full-time equivalent staff members in 2005. Occupancy and equipment expense totaled $2.3 million in 2006 and $2.2 million in 2005. The net cost of other real estate and repossessions decreased $1.2 million in 2006 to $277,000 from $1.5 million in 2005 due to a reduction in costs incurred in connection with owning, maintaining and the sale and disposition of other real estate owned. Other noninterest expense totaled $7.8 million in 2006, compared to $7.4 million in 2005, an increase of $388,000 or 5.2%. The increase in other noninterest expense was primarily attributable to legal and professional fees, data processing expenses and marketing and public relations expenses.
Income Taxes. Our provision for income taxes for the years ended December 31, 2006 and 2005 was $4.5 million and $3.1 million respectively. The higher provision for income taxes in 2006 resulted from higher income during 2006 as compared to 2005. The Company’s effective tax rate amounted to 33.8% and 34.3% during 2006 and 2005, respectively. The difference between the effective tax rate and the statutory tax rate primarily relates to variances in items that are non-taxable or non-deductible and various tax credits.
Asset/Liability Management and Market Risk
Asset/LiabilityManagement. Our asset/liability Management (ALM) process consists of quantifying, analyzing and controlling interest rate risk (IRR) to maintain reasonably stable net interest income levels under various interest rate environments. The principal objective of ALM is to maximize net interest income while operating within acceptable limits established for interest rate risk and maintain adequate levels of liquidity.
The majority of our assets and liabilities are monetary in nature. Consequently, one of our most significant forms of market risk is interest rate risk. Our assets, consisting primarily of loans secured by real estate, have longer maturities than our liabilities, consisting primarily of deposits. As a result, a principal part of our business strategy is to manage interest rate risk and reduce the exposure of our net interest income to changes in market interest rates. Accordingly, our Board of Directors has established an Asset/Liability Committee which is responsible for evaluating the interest rate risk inherent in our assets and liabilities, for determining the level of risk that is appropriate given our business strategy, operating environment, capital, liquidity and performance objectives, and for managing this risk consistent with the guidelines approved by the Board of Directors. Senior Management monitors the level of interest rate risk on a regular basis and the Asset/Liability Committee, which consists of executive Management and other bank personnel operating under a policy adopted by the Board of Directors, meets as needed to review our asset/liability policies and interest rate risk position.
The interest spread and liability funding discussed below are directly related to changes in asset and liability mixes, volumes, maturities and repricing opportunities for interest-earning assets and interest-bearing liabilities. Interest-sensitive assets and liabilities are those which are subject to being repriced in the near term, including both floating or adjustable rate instruments and instruments approaching maturity. The interest sensitivity gap is the difference between total interest-sensitive assets and total interest-sensitive liabilities. Interest rates on our various asset and liability categories do not respond uniformly to changing market conditions. Interest rate risk is the degree to which interest rate fluctuations in the marketplace can affect net interest income.
To maximize our margin, we attempt to be somewhat more asset sensitive during periods of rising rates and more liability sensitive during periods of falling rates. The need for interest sensitivity gap Management is most critical in times of rapid changes in overall interest rates. We generally seek to limit our exposure to interest rate fluctuations by maintaining a relatively balanced mix of rate sensitive assets and liabilities on a one-year time horizon. The mix is relatively difficult to manage. Because of the significant impact on net interest margin from mismatches in repricing opportunities, the asset-liability mix is monitored periodically depending upon Management’s assessment of current business conditions and the interest rate outlook. Exposure to interest rate fluctuations is maintained within prudent levels by the use of varying investment strategies.
We monitor interest rate risk using an interest sensitivity analysis set forth on the following table. This analysis, which we prepare monthly, reflects the maturity and repricing characteristics of assets and liabilities over various time periods. The gap indicates whether more assets or liabilities are subject to repricing over a given time period. The interest sensitivity analysis at December 31, 2007 reflects an asset-sensitive position with a positive cumulative gap on a one-year basis.
INTEREST SENSITIVITY AT DECEMBER 31, 2007
| | | Interest Sensitivity Within | |
| | | 3 Months | | | Over 3 Months | | | Total | | | Over | | | | |
| | | Or Less | | | thru 12 Months | | | One Year | | | One Year | | | Total | |
| | | (dollars in thousands) | |
| Earning Assets: | | | | | | | | | | | | | | | |
| Loans (including loans held for sale) | | $ | 377,276 | | | $ | 84,769 | | | $ | 462,045 | | | $ | 117,170 | | | $ | 579,215 | |
| Securities (including FHLB stock) | | | 49,795 | | | | 375 | | | | 50,170 | | | | 92,853 | | | | 143,023 | |
| Federal Funds Sold | | | 35,869 | | | | - | | | | 35,869 | | | | - | | | | 35,869 | |
| Other earning assets | | | 2,218 | | | | - | | | | 2,218 | | | | - | | | | 2,218 | |
| Total earning assets | | | 465,158 | | | | 85,144 | | | | 550,302 | | | | 210,023 | | | $ | 760,325 | |
| | | | | | | | | | | | | | | | | | | | | |
| Source of Funds: | | | | | | | | | | | | | | | | | | | | |
| Interest-bearing accounts: | | | | | | | | | | | | | | | | | | | | |
| Demand deposits | | | 165,552 | | | | - | | | | 165,552 | | | | 57,590 | | | | 223,142 | |
| Savings deposits | | | 11,261 | | | | - | | | | 11,261 | | | | 33,783 | | | | 45,044 | |
| Time deposits | | | 128,734 | | | | 139,033 | | | | 267,767 | | | | 66,401 | | | | 334,168 | |
| Short-term borrowings | | | 10,401 | | | | - | | | | 10,401 | | | | - | | | | 10,401 | |
| Long-term borrowings | | | - | | | | 3,093 | | | | 3,093 | | | | - | | | | 3,093 | |
| Noninterest-bearing, net | | | - | | | | | | | | - | | | | 144,477 | | | | 144,477 | |
| Total source of funds | | | 315,948 | | | | 142,126 | | | | 458,074 | | | | 302,251 | | | $ | 760,325 | |
| Period gap | | | 149,210 | | | | (56,982 | ) | | | 92,228 | | | | (92,228 | ) | | | | |
| Cumulative gap | | $ | 149,210 | | | $ | 92,228 | | | $ | 92,228 | | | $ | - | | | | | |
| | | | | | | | | | | | | | | | | | | | | |
| Cumulative gap as a | | | | | | | | | | | | | | | | | | | | |
| percent of earning assets | | | 19.62% | | | | 12.13% | | | | 12.13% | | | | | | | | | |
| | | | | | | | | | | | | | | | | | | | | |
Net Interest Income at Risk. Net interest income (NII) at risk measures the risk of a decline in earnings due to changes in interest rates. The table below presents an analysis of our interest rate risk as measured by the estimated changes in net interest income resulting from an instantaneous and sustained parallel shift in the yield curve at December 31, 2007. Shifts are measured in 100 basis point increments (+ 200 through - 200 basis points,) from base case. Base case encompasses key assumptions for asset/liability mix, loan and deposit growth, pricing, prepayment speeds, deposit decay rates, securities portfolio cash flows and reinvestment strategy and the market value of certain assets under the various interest rate scenarios. The base case scenario assumes that the current interest rate environment is held constant throughout the forecast period; the instantaneous shocks are performed against that yield curve.
| Change in | | Estimated Increase |
| Interest | | (Decrease) in NII |
| Rates | | December 31, 2007 |
| (basis points) | | |
| | | |
| -200 | | -22.37% |
| -100 | | -10.70% |
| Stable | | 0.00% |
| +100 | | 10.63% |
| +200 | | 19.26% |
The increasing rate scenarios shows higher levels of net interest income while the decreasing scenarios show higher levels of volatility and subsequently lower levels of NII. These scenarios are instantaneous shocks that assume balance sheet Management will mirror base case. Should the yield curve begin to rise or fall, Management has several strategies available to maximize earnings opportunities or offset the negative impact to earnings. For example, in a falling rate environment, deposit pricing strategies could be adjusted to further sway customer behavior to non-contractual or short-term (less than 12 months) contractual deposit products which would reset downward with the changes in the yield curve and prevailing market rates. Another opportunity at the start of such a cycle would be reinvesting the securities portfolio cash flows into longer term, non-callable bonds that would lock in higher yields.
Even if interest rates change in the designated amounts, there can be no assurance that our assets and liabilities would perform as anticipated. Additionally, a change in the U.S. Treasury rates in the designated amounts accompanied by a change in the shape of the U.S. Treasury yield curve would cause significantly different changes to NII than indicated above. Strategic Management of our balance sheet and earnings would be adjusted to accommodate these movements. As with any method of measuring IRR, certain shortcomings are inherent in the methods of analysis presented above. For example, although certain assets and liabilities may have similar maturities or periods to repricing, they may react in different degrees to changes in market interest rates. Also, the interest rates on certain types of assets and liabilities may fluctuate in advance of changes in market interest rates, while interest rates on other types may lag behind changes in market rates. Also, the ability of many borrowers to service their debt may decrease in the event of an interest rate increase. We consider all of these factors in monitoring its exposure to interest rate risk.
Liquidity and Capital Resources
Liquidity and Capital Resources. Liquidity refers to the ability or flexibility to manage future cash flows to meet the needs of depositors and borrowers and fund operations. Maintaining appropriate levels of liquidity allows us to have sufficient funds available to meet customer demand for loans, withdrawal of deposit balances and maturities of deposits and other liabilities. Liquid assets include cash and due from banks, interest-earning demand deposits with banks, federal funds sold and available for sale investment securities. Including securities pledged to collateralize public fund deposits, these assets represent 20.3%, 19.1% and 19.1% of the total liquidity base at December 31, 2007, 2006 and 2005, respectively. In addition, we maintained borrowing availability with the Federal Home Loan Bank, or FHLB, approximating $54.7 million and $6.9 million at December 31, 2007 and December 31, 2006, respectively. We also maintain federal funds lines of credit totaling $59.7 million at three other correspondent banks, of which $59.7 was available at December 31, 2007, and $54.0 million was available at December 31, 2006. Management believes there is sufficient liquidity to satisfy current operating needs.
Stockholders’ equity at December 31, 2007 was $66.5 million, an increase of $7.3 million, or 12.4%, from $59.2 million at December 31, 2006. At December 31, 2006, stockholders’ equity was $59.2 million, an increase of $5.3 million, or 9.8%, from $53.9 million on December 31, 2005. The increase in stockholders’ equity primarily reflected net income for the years ended December 31, 2007 and 2006, offset by quarterly dividend payments.
Regulatory Capital. Risk-based capital regulations adopted by the FDIC require banks to achieve and maintain specified ratios of capital to risk-weighted assets. Similar capital regulations apply to bank holding companies. The risk-based capital rules are designed to measure “Tier 1” capital (consisting of common equity, retained earnings and a limited amount of qualifying perpetual preferred stock and trust preferred securities, net of goodwill and other intangible assets and accumulated other comprehensive income) and total capital in relation to the credit risk of both on and off balance sheet items. Under the guidelines, one of its risk weights is applied to the different on balance sheet items. Off-balance sheet items, such as loan commitments, are also subject to risk weighting. All bank holding companies and banks must maintain a minimum total capital to total risk weighted assets ratio of 8.00%, at least half of which must be in the form of core or Tier 1 capital. These guidelines also specify that bank holding companies that are experiencing internal growth or making acquisitions will be expected to maintain capital positions substantially above the minimum supervisory levels.
At December 31, 2007, we satisfied the minimum regulatory capital requirements and were “well capitalized” within the meaning of federal regulatory requirements.
Off-Balance Sheet Arrangements
We had $105.0 million, $45.0 million and $80.0 million in letters of credit issued by the Federal Home Loan Bank at December 31, 2007, 2006, and 2005, respectively, which was used as collateral for public fund deposits. The changes in the arrangements parallel the changes in our public fund deposits.
Contractual Obligations
The following table summarizes our significant fixed and determinable contractual obligations and other funding needs by payment date at December 31, 2007. The payment amounts represent those amounts due to the recipient and do not include any unamortized premiums or discounts or other similar carrying amount adjustments.
At December 31, 2007, our contractual obligations were as follows:
| | | Payments Due by Period | |
| | | One Year | | | One Through | | | Over Three | | | | |
| | | or Less | | | Three Years | | | Years | | | Total | |
| | | (in thousands) | |
| | | | | | | | | | | | | |
| Operating leases | | $ | 10 | | | $ | 21 | | | $ | 95 | | | $ | 126 | |
| Time deposits | | | 267,850 | | | | 49,848 | | | | 16,470 | | | | 334,168 | |
| Short-term borrowings | | | 10,401 | | | | - | | | | - | | | | 10,401 | |
Long-term borrowings (1) | | | 3,093 | | | | - | | | | - | | | | 3,093 | |
| Total | | $ | 281,354 | | | $ | 49,869 | | | $ | 16,565 | | | $ | 347,788 | |
| | | | | | | | | | | | | | | | | |
__________________________________
(1) This represents the call date of the subordinated debentures. The stated maturity is 2033.
Impact of Inflation and Changing Prices
The consolidated financial statements and related financial data presented herein have been prepared in accordance with generally accepted accounting principles, which generally require the measurement of financial position and operating results in terms of historical dollars, without considering changes in relative purchasing power over time due to inflation. Unlike most industrial companies, the majority of the Company’s assets and liabilities are monetary in nature. As a result, interest rates generally have a more significant impact on the Company’s performance than does the effect of inflation. Although fluctuations in interest rates are neither completely predictable or controllable, the Company regularly monitors its interest rate position and oversees its financial risk Management by establishing policies and operating limits (see “Asset/Liability Management and Market Risk” section). Interest rates do not necessarily move in the same direction or in the same magnitude as the prices of goods and services, since such prices are affected by inflation to a larger extent than interest rates. Although not as critical to the banking industry as to other industries, inflationary factors may have some impact on the Company’s growth, earnings, total assets and capital levels. Management does not expect inflation to be a significant factor in 2008.
For discussion on this matter, see the “Asset/Liability Management and Market Risk” section of this analysis.
Report of Castaing, Hussey & Lolan, LLC
Independent Registered Accounting Firm
To the Stockholders and Board of Directors
First Guaranty Bancshares, Inc.
We have audited the accompanying consolidated balance sheets of First Guaranty Bancshares, Inc. as of December 31, 2007 and 2006, and the related consolidated statements of income, changes in stockholders’ equity and cash flows for each of the years in the three-year period ended December 31, 2007. These financial statements are the responsibility of the Company's management. Our responsibility is to express an opinion on these financial statements based on our audits.
We conducted our audits in accordance with the standards of the Public Company Accounting Oversight Board (United States). Those standards require that we plan and perform the audit to obtain reasonable assurance about whether the financial statements are free of material misstatement. The Company is not required to have, nor were we engaged to perform, an audit of its internal control over financial reporting. Our audit included consideration of internal control over financial reporting as a basis for designing audit procedures that are apropriate in the circumstances, but not for the purpose of expressing an opinion on the effectiveness of the Company's internal control over financial reporting. Accordingly, we express no such opinion. An audit includes examining, on a test basis, evidence supporting the amounts and disclosures in the financial statements. An audit also includes assessing the accounting principles used and significant estimates made by management, as well as evaluating the overall financial statement presentation. We believe that our audits provide a reasonable basis for our opinion.
In our opinion, the financial statements referred to above present fairly, in all material respects, the consolidated financial position of First Guaranty Bancshares, Inc. as of December 31, 2007 and 2006, and the consolidated results of its operations and its cash flows for each of the years in the three-year period ended December 31, 2007 in conformity with accounting principles generally accepted in the United States of America.
Castaing, Hussey & Lolan, LLC
New Iberia, Louisiana
March 28, 2008
| FIRST GUARANTY BANCSHARES, INC. AND SUBSIDIARY |
| CONSOLIDATED BALANCE SHEETS |
| (dollars in thousands, except share data) |
| | | | | | | |
| | | | | | | |
| | | December 31, | |
| | | 2007 | | | 2006 | |
| Assets | | | | | | |
| Cash and cash equivalents: |
| Cash and due from banks | | $ | 22,778 | | | $ | 17,893 | |
| Interest-earning demand deposits with banks | | | 30 | | | | 131 | |
| Federal funds sold | | | 35,869 | | | | 6,793 | |
| Cash and cash equivalents | | | 58,677 | | | | 24,817 | |
| | | | | | | | | |
| Interest-earning time deposits with banks | | | 2,188 | | | | 2,188 | |
| | | | | | | | | |
| Investment securities: | |
| Available for sale, at fair value | | | 105,570 | | | | 111,353 | |
| Held to maturity, at cost (estimated fair value of |
| $36,206 and $45,614, respectively) | | | 36,498 | | | | 46,999 | |
| Investment securities | | | 142,068 | | | | 158,352 | |
| | | | | | | | | |
| Federal Home Loan Bank stock, at cost | | | 955 | | | | 2,264 | |
| Loans held for sale | | | 3,959 | | | | 1,049 | |
| | | | | | | | | |
| Loans, net of unearned income | | | 575,256 | | | | 507,195 | |
| Less: allowance for loan losses | | | 6,193 | | | | 6,675 | |
| Net loans | | | 569,063 | | | | 500,520 | |
| | | | | | | | | |
| Premises and equipment, net | | | 16,240 | | | | 13,593 | |
| Goodwill | �� | | 1,911 | | | | - | |
| Intangible assets, net | | | 2,383 | | | | 456 | |
| Other real estate, net | | | 373 | | | | 2,540 | |
| Accrued interest receivable | | | 5,126 | | | | 5,378 | |
| Other assets | | | 4,388 | | | | 3,330 | |
| Total Assets | | $ | 807,331 | | | $ | 714,487 | |
| | | | | | | | | |
| Liabilities and Stockholders' Equity |
| Deposits: | | | | | | | | |
| Noninterest-bearing demand | | $ | 120,740 | | | $ | 122,540 | |
| Interest-bearing demand | | | 223,142 | | | | 185,308 | |
| Savings | | | 45,044 | | | | 41,161 | |
| Time | | | 334,168 | | | | 277,284 | |
| Total deposits | | | 723,094 | | | | 626,293 | |
| | | | | | | | | |
| Short-term borrowings | | | 10,401 | | | | 6,584 | |
| Accrued interest payable | | | 2,956 | | | | 3,070 | |
| Long-term borrowings | | | 3,093 | | | | 17,984 | |
| Other liabilities | | | 1,254 | | | | 1,353 | |
| Total Liabilities | | | 740,798 | | | | 655,284 | |
| | | | | | | | | |
| Stockholders' Equity | | | | |
| Common stock: | | | | | | | | |
| $1 par value - authorized 100,000,000 shares; issued and |
| outstanding 5,559,644 shares | | | 5,560 | | | | 5,560 | |
| Surplus | | | 26,459 | | | | 26,459 | |
| Retained earnings | | | 34,849 | | | | 28,089 | |
| Accumulated other comprehensive loss | | | (335 | ) | | | (905 | ) |
| Total Stockholders' Equity | | | 66,533 | | | | 59,203 | |
| Total Liabilities and Stockholders' Equity | | $ | 807,331 | | | $ | 714,487 | |
| | | | | | | | | |
See Notes to Consolidated Financial Statements.
| FIRST GUARANTY BANCSHARES, INC. AND SUBSIDIARY | |
| CONSOLIDATED STATEMENTS OF INCOME | |
| (dollars in thousands, except share data) | |
| | | | | | | | | | |
| | | Years Ended December 31, | |
| | | 2007 | | | 2006 | | | 2005 | |
| Interest Income: | | | | | | | | | |
| Loans (including fees) | | $ | 46,470 | | | $ | 41,002 | | | $ | 34,280 | |
| Loans held for sale | | | 142 | | | | 27 | | | | 87 | |
| Deposits with other banks | | | 87 | | | | 95 | | | | 96 | |
| Securities (including FHLB stock) | | | 8,381 | | | | 9,654 | | | | 5,637 | |
| Federal funds sold | | | 400 | | | | 159 | | | | 229 | |
| Total Interest Income | | | 55,480 | | | | 50,937 | | | | 40,329 | |
| | | | | | | | | | | | | |
| Interest Expense: | | | | | | | | | | | | |
| Demand deposits | | | 6,152 | | | | 5,657 | | | | 2,289 | |
| Savings deposits | | | 228 | | | | 174 | | | | 117 | |
| Time deposits | | | 13,673 | | | | 11,224 | | | | 8,468 | |
| Borrowings | | | 1,345 | | | | 2,151 | | | | 1,493 | |
| Total Interest Expense | | | 21,398 | | | | 19,206 | | | | 12,367 | |
| | | | | | | | | | | | | |
| Net Interest Income | | | 34,082 | | | | 31,731 | | | | 27,962 | |
| Provision for loan losses | | | 1,918 | | | | 4,419 | | | | 5,621 | |
| Net Interest Income after Provision for Loan Losses | | | 32,164 | | | | 27,312 | | | | 22,341 | |
| | | | | | | | | | | | | |
| Noninterest Income: | | | | | | | | | |
| Service charges, commissions and fees | | | 3,822 | | | | 3,604 | | | | 3,506 | |
| Net (losses) gains on sale of securities | | | (478 | ) | | | (234 | ) | | | 7 | |
| Net gains on sale of loans | | | 272 | | | | 71 | | | | 323 | |
| Other | | | 1,082 | | | | 926 | | | | 1,392 | |
| Total Noninterest Income | | | 4,698 | | | | 4,367 | | | | 5,228 | |
| | | | | | | | | | | | | |
| Noninterest Expense: | | | | | | | | | |
| Salaries and employee benefits | | | 9,662 | | | | 7,926 | | | | 7,227 | |
| Occupancy and equipment expense | | | 2,573 | | | | 2,342 | | | | 2,219 | |
| Net cost of other real estate and repossessions | | | 396 | | | | 277 | | | | 1,513 | |
| Other | | | 8,502 | | | | 7,828 | | | | 7,440 | |
| Total Noninterest Expense | | | 21,133 | | | | 18,373 | | | | 18,399 | |
| | | | | | | | | | | | | |
| Income Before Income Taxes | | | 15,729 | | | | 13,306 | | | | 9,170 | |
| Provision for income taxes | | | 5,466 | | | | 4,504 | | | | 3,146 | |
| Net Income | | $ | 10,263 | | | $ | 8,802 | | | $ | 6,024 | |
| | | | | | | | | | | | | |
| Per Common Share: | | | | | | | | | | | | |
| Earnings | | $ | 1.85 | | | $ | 1.58 | | | $ | 1.08 | |
| Cash dividends paid | | $ | 0.63 | | | $ | 0.60 | | | $ | 0.57 | |
| | | | | | | | | | | | | |
| Average Common Shares Outstanding | | | 5,559,644 | | | | 5,559,644 | | | | 5,559,644 | |
| | | | | | | | | | | | | |
See Notes to Consolidated Financial Statements.
| FIRST GUARANTY BANCSHARES, INC. AND SUBSIDIARY | |
| CONSOLIDATED STATEMENTS OF CHANGES IN STOCKHOLDERS' EQUITY | |
| (dollars in thousands) | |
| | | | | | | | | | | | | | | | | | | |
| | | | | | | | | | | | | | | Accumulated | | | | |
| | | Common | | | Common | | | | | | | | | Other | | | | |
| | | Stock | | | Stock | | | | | | Retained | | | Comprehensive | | | | |
| | | $1 Par | | | $5 Par | | | Surplus | | | Earnings | | | Loss | | | Total | |
| | | | | | | | | | | | | | | | | | | |
| Balance December 31, 2004 | | $ | 5,076 | | | $ | 2,416 | | | $ | 24,527 | | | $ | 19,771 | | | $ | (84 | ) | | $ | 51,706 | |
| Net income | | | - | | | | - | | | | - | | | | 6,024 | | | | - | | | | 6,024 | |
| Change in unrealized loss on | | | | | | | | | | | | | | | | | | | | | | | | |
| available for sale securities, | | | | | | | | | | | | | | | | | | | | | | | | |
| net of reclassification adjustments, and taxes | | | - | | | | - | | | | - | | | | - | | | | (634 | ) | | | (634 | ) |
| Comprehensive income | | | | | | | | | | | | | | | | | | | | | | | 5,390 | |
| Cash dividends on common stock ($0.57 per share) | | | - | | | | - | | | | - | | | | (3,173 | ) | | | - | | | | (3,173 | ) |
| Balance December 31, 2005 | | | 5,076 | | | | 2,416 | | | | 24,527 | | | | 22,622 | | | | (718 | ) | | | 53,923 | |
| Net income | | | - | | | | - | | | | - | | | | 8,802 | | | | - | | | | 8,802 | |
| Reclassification of $5 par value into $1 par value | | | 484 | | | | (2,416 | ) | | | 1,932 | | | | | | | | | | | | - | |
| Change in unrealized loss on | | | | | | | | | | | | | | | | | | | | | | | | |
| available for sale securities, | | | | | | | | | | | | | | | | | | | | | | | | |
| net of reclassification adjustments, and taxes | | | - | | | | - | | | | - | | | | - | | | | (187 | ) | | | (187 | ) |
| Comprehensive income | | | | | | | | | | | | | | | | | | | | | | | 8,615 | |
| Cash dividends on common stock ($0.60 per share) | | | - | | | | - | | | | - | | | | (3,335 | ) | | | - | | | | (3,335 | ) |
| Balance December 31, 2006 | | | 5,560 | | | | - | | | | 26,459 | | | | 28,089 | | | | (905 | ) | | | 59,203 | |
| Net income | | | - | | | | - | | | | - | | | | 10,263 | | | | - | | | | 10,263 | |
| Change in unrealized loss on | | | | | | | | | | | | | | | | | | | | | | | | |
| available for sale securities, | | | | | | | | | | | | | | | | | | | | | | | | |
| net of reclassification adjustments, and taxes | | | - | | | | - | | | | - | | | | - | | | | 570 | | | | 570 | |
| Comprehensive income | | | | | | | | | | | | | | | | | | | | | | | 10,833 | |
| Cash dividends on common stock ($0.63 per share) | | | - | | | | - | | | | - | | | | (3,503 | ) | | | - | | | | (3,503 | ) |
| Balance December 31, 2007 | | $ | 5,560 | | | $ | - | | | $ | 26,459 | | | $ | 34,849 | | | $ | (335 | ) | | $ | 66,533 | |
| | | | | | | | | | | | | | | | | | | | | | | | | |
See Notes to Consolidated Financial Statements.
| FIRST GUARANTY BANCSHARES, INC. AND SUBSIDIARY | |
| CONSOLIDATED STATEMENTS OF CASH FLOWS | |
| (dollars in thousands) | |
| | | | | | | | | | |
| | | | | | | | | | |
| | | Years Ended December 31, | |
| | | 2007 | | | 2006 | | | 2005 | |
| Cash Flows From Operating Activities | | | | | | | | | |
| Net income | | $ | 10,263 | | | $ | 8,802 | | | $ | 6,024 | |
| Adjustments to reconcile net income to net cash | | | | | | | | | | | | |
| provided by operating activities: | | | | | | | | | | | | |
| Provision for loan losses | | | 1,918 | | | | 4,419 | | | | 5,621 | |
| Depreciation and amortization | | | 1,238 | | | | 1,438 | | | | 1,411 | |
| Amortization of premium/discount on investments | | | (1,011 | ) | | | 66 | | | | (74 | ) |
| Loss (Gain) on sale of securities | | | 477 | | | | 234 | | | | (7 | ) |
| Gain on sale of assets | | | (272 | ) | | | (81 | ) | | | (315 | ) |
| ORE writedowns and loss/(gain) on disposition | | | 180 | | | | (365 | ) | | | 1,101 | |
| FHLB stock dividends | | | (134 | ) | | | (134 | ) | | | (121 | ) |
| Net decrease (increase) in loans held for sale | | | 31,090 | | | | (1,049 | ) | | | 2,638 | |
| Change in other assets and liabilities, net | | | (1,269 | ) | | | (106 | ) | | | 794 | |
| Net Cash Provided By Operating Activities | | | 42,480 | | | | 13,224 | | | | 17,072 | |
| | | | | | | | | | | | | |
| Cash Flows From Investing Activities | | | | | | | | | | | | |
| Proceeds from maturities and calls of HTM securities | | | 10,493 | | | | 20,604 | | | | 1,215 | |
| Proceeds from maturities, calls and sales of AFS securities | | | 627,001 | | | | 26,770 | | | | 225,215 | |
| Funds invested in HTM securities | | | - | | | | - | | | | (30,000 | ) |
| Funds invested in AFS securities | | | (575,534 | ) | | | (31,108 | ) | | | (265,984 | ) |
| Proceeds from sale of Federal Home Loan Bank stock | | | 4,175 | | | | 1,797 | | | | 3,029 | |
| Funds invested in Federal Home Loan Bank stock | | | (639 | ) | | | (2,346 | ) | | | (238 | ) |
| Net increase in loans | | | (31,222 | ) | | | (29,492 | ) | | | (40,226 | ) |
| Proceeds from sale of Mortgage Servicing Rights | | | 583 | | | | - | | | | - | |
| Purchase of premises and equipment | | | (801 | ) | | | (2,478 | ) | | | (2,465 | ) |
| Proceeds from sales of other real estate owned | | | 3,103 | | | | 6,909 | | | | 2,731 | |
| Cash paid in excess of cash received in acquisition | | | (10,646 | ) | | | - | | | | - | |
| Net Cash Provided By (Used In) Investing Activities | | | 26,513 | | | | (9,344 | ) | | | (106,723 | ) |
| | | | | | | | | | | | | |
| Cash Flows From Financing Activities | | | | | | | | | | | | |
| Net increase (decrease) in deposits | | | 29,355 | | | | (6,615 | ) | | | 151,550 | |
| Net increase (decrease) in federal funds purchased and short-term borrowings | | | 3,817 | | | | (2,397 | ) | | | (22,437 | ) |
| Proceeds from long-term borrowings | | | - | | | | 30,000 | | | | 75 | |
| Repayment of long-term borrowings | | | (64,802 | ) | | | (25,167 | ) | | | (27,277 | ) |
| Dividends paid | | | (3,503 | ) | | | (3,335 | ) | | | (3,173 | ) |
| Net Cash (Used In) Provided By Financing Activities | | | (35,133 | ) | | | (7,514 | ) | | | 98,738 | |
| | | | | | | | | | | | | |
| Net Increase (Decrease) In Cash and Cash Equivalents | | | 33,860 | | | | (3,634 | ) | | | 9,087 | |
| Cash and Cash Equivalents at the Beginning of the Period | | | 24,817 | | | | 28,451 | | | | 19,364 | |
| Cash and Cash Equivalents at the End of the Period | | $ | 58,677 | | | $ | 24,817 | | | $ | 28,451 | |
| | | | | | | | | | | | | |
| Noncash Activities: | | | | | | | | | | | | |
| Loans transferred to foreclosed assets | | $ | 1,118 | | | $ | 8,538 | | | $ | 814 | |
| 1,389,761 shares of $1 par value issued as stock dividend | | $ | - | | | $ | - | | | $ | 1,390 | |
| Cash paid during the year: | | | | | | | | | | | | |
| Interest on deposits and borrowed funds | | $ | 21,512 | | | $ | 18,241 | | | $ | 11,715 | |
| Income taxes | | $ | 6,015 | | | $ | 5,590 | | | $ | 1,925 | |
| | | | | | | | | | | | | |
See Notes to Consolidated Financial Statements.
NOTES TO CONSOLIDATED FINANCIAL STATEMENTS
Note 1. Business and Summary of Significant Accounting Policies
Business
First Guaranty Bancshares, Inc. (the “Company”) is a Louisiana corporation. On July 27, 2007 the Company became the parent of First Guaranty Bank as described in Note 2. The Company owns all of the outstanding shares of common stock of First Guaranty Bank. First Guaranty Bank (the “Bank”) is a Louisiana state-chartered commercial bank that provides a diversified range of financial services to consumers and businesses in the communities in which it operates. These services include consumer and commercial lending, mortgage loan origination, the issuance of credit cards and retail banking services. The Bank has 18 banking offices and 25 automated teller machines (ATMs) in northern and southern of Louisiana.
Summary of significant accounting policies
First Guaranty Bancshares, Inc. completed its acquisition of Homestead Bancorp on July 30, 2007. Information for the year ended December 31, 2006 and any prior period reflects the operations of First Guaranty Bank on a stand-alone basis. Prior to becoming the holding company of First Guaranty Bank, First Guaranty Bancshares, Inc. had no assets, liabilities or operations.
The accounting and reporting policies of the Company conform to generally accepted accounting principles and to predominant accounting practices within the banking industry. The more significant accounting and reporting policies are as follows:
Consolidation
The consolidated financial statements include the accounts of First Guaranty Bancshares, Inc. (the “Company”), and its wholly owned subsidiary, First Guaranty Bank (the “Bank”). All significant intercompany balances and transactions have been eliminated in consolidation.
Use of estimates
The preparation of financial statements in conformity with generally accepted accounting principles requires Management to make estimates and assumptions that affect the reported amounts of assets and liabilities and disclosure of contingent assets and liabilities at the dates of the financial statements and the reported amounts of revenue and expense during the reporting periods. Actual results could differ from those estimates.
Material estimates that are particularly susceptible to significant change in the near-term economic environment and market conditions relate to the determination of the allowance for loan losses and the valuation of real estate acquired in connection with foreclosures or in satisfaction of loans. In connection with the determination of the allowance for loan losses and real estate owned, the Company obtains independent appraisals for significant properties.
Cash and cash equivalents
For purposes of reporting cash flows, cash and cash equivalents are defined as cash, due from banks, interest-bearing demand deposits with banks and federal funds sold with maturities of three months or less.
Securities
The Company reviews its financial position, liquidity and future plans in evaluating the criteria for classifying investment securities. At December 31, 2007, the securities portfolio contained two classifications of securities - held to maturity and available for sale. At December 31, 2007, $105.6 million were classified as available for sale and $36.5 million were classified as held to maturity.
Debt securities that Management has the ability and intent to hold to maturity are classified as held to maturity and carried at cost, adjusted for amortization of premiums and accretion of discounts using methods approximating the interest method. Securities available for sale are stated at fair value. The unrealized difference, if any, between amortized cost and fair value of these securities is excluded from income and is reported, net of deferred taxes, as a component of stockholders' equity. Realized gains and losses on securities are computed based on the specific identification method and are reported as a separate component of other income.
Management evaluates securities for other-than-temporary impairment at least quarterly and more frequently when economic or market conditions warrant such evaluation. Consideration is given to (1) the length of time and the extent to which the fair value has been less than cost, (2) the financial condition and near-term prospects of the issuer and (3) the intent and ability of the Company to retain its investment in the issuer for a period of time sufficient to allow for any anticipated recovery in fair value.
The Company has a required investment in Federal Home Loan Bank stock that is carried at cost that approximates fair value. This stock must be maintained by the Company.
Loans held for sale
Mortgage loans originated and intended for sale in the secondary market are carried at the lower of cost or estimated fair value in the aggregate. Net unrealized losses, if any, are recognized through a valuation allowance by charges to income. Loans held for sale have primarily been fixed rate single-family residential mortgage loans under contract to be sold in the secondary market. In most cases, loans in this category are sold within thirty days. Buyers generally have recourse to return a purchased loan under limited circumstances. Recourse conditions may include early payment default, breach of representations or warranties and documentation deficiencies.
Mortgage loans held for sale are generally sold with the mortgage servicing rights released. Gains or losses on sales of mortgage loans are recognized based on the differences between the selling price and the carrying value of the related mortgage loans sold.
Loans
Loans are stated at the principal amounts outstanding, net of unearned income and deferred loan fees. In addition to loans issued in the normal course of business, overdrafts on customer deposit accounts are considered to be loans and reclassified as such. At December 31, 2007 and 2006, $461,000 and $226,000, respectively, in overdrafts have been reclassified to loans. Interest income on all classifications of loans is calculated using the simple interest method on daily balances of the principal amount outstanding.
Accrual of interest is discontinued on a loan when Management believes, after considering economic and business conditions and collection efforts, the borrower’s financial condition is such that reasonable doubt exists as to the full and timely collection of principal and interest. This evaluation is made for all loans that are 90 days or more contractually past due. When a loan is placed in non-accrual status, all interest previously accrued but not collected is reversed against current period interest income. Income on such loans is then recognized only to the extent that cash is received and where the future collection of interest and principal is probable. Loans are returned to accrual status when, in the judgment of Management, all principal and interest amounts contractually due are reasonably assured of repayment within a reasonable time frame and when the borrower has demonstrated payment performance of cash or cash equivalents for a minimum of six months.
Loan fees and costs
Nonrefundable loan origination and commitment fees and direct costs associated with originating loans are deferred and recognized over the lives of the related loans as an adjustment to the loans' yield using the level yield method.
Allowance for loan losses
The allowance for loan losses is established through a provision for loan losses charged to expense. Loans are charged against the allowance for loan losses when Management believes that the collectability of the principal is unlikely. The allowance, which is based on evaluation of the collectability of loans and prior loan loss experience, is an amount that Management believes will be adequate to reflect the risks inherent in the existing loan portfolio and exist at the reporting date. The evaluations take into consideration a number of subjective factors including changes in the nature and volume of the loan portfolio, overall portfolio quality, review of specific problem loans, current economic conditions that may affect a borrower’s ability to pay, adequacy of loan collateral and other relevant factors. In addition, regulatory agencies, as an integral part of their examination process, periodically review the estimated losses on loans. Such agencies may require additional recognition of losses based on their judgments about information available to them at the time of their examination.
Although Management uses available information to recognize losses on loans, because of uncertainties associated with local economic conditions, collateral values and future cash flows on impaired loans, it is reasonably possible that a material change could occur in the allowance for loan losses in the near term. However, the amount of the change that is reasonably possible cannot be estimated.
The evaluation of the adequacy of loan collateral is often based upon estimates and appraisals. Because of changing economic conditions, the valuations determined from such estimates and appraisals may also change. Accordingly, the Company may ultimately incur losses that vary from Management's current estimates. Adjustments to the allowance for loan losses will be reported in the period such adjustments become known or can be reasonably estimated. All loan losses are charged to the allowance for loan losses when the loss actually occurs or when Management believes that the collectability of the principal is unlikely. Recoveries are credited to the allowance at the time of recovery.
The allowance consists of specific, general and unallocated components. The specific component relates to loans that are classified as doubtful, substandard or special mention. For such loans that are also classified as impaired, an allowance is established when the discounted cash flows (or collateral value or observable market price) of the impaired loan is lower than the carrying value of that loan. The general component covers non-classified loans and is based on historical loss experience adjusted for qualitative factors. An unallocated component is maintained to cover uncertainties that could affect Management’s estimate of probable losses. The unallocated component of the allowance reflects the margin of imprecision inherent in the underlying assumptions used in the methodologies for estimating specific and general losses in the portfolio.
A loan is considered impaired when, based on current information and events, it is probable that the Company will be unable to collect the scheduled payments of principal or interest when due according to the contractual terms of the loan agreement. Factors considered by Management in determining impairment include payment status, collateral value and the probability of collecting scheduled principal and interest payments when due. Loans that experience insignificant payment delays and payment shortfalls generally are not classified as impaired. Management determines the significance of payment delays and payment shortfalls on a case-by-case basis, taking into consideration all of the circumstances surrounding the loan and the borrower, including the length of the delay, the reasons for the delay, the borrower’s prior payment record and the amount of the shortfall in relation to the principal and interest owed. Impairment is measured on a loan-by-loan basis for commercial and construction loans by either the present value of expected future cash flows discounted at the loan’s effective interest rate, the loan’s obtainable market price or the fair value of the collateral if the loan is collateral dependent.
Large groups of smaller balance homogeneous loans are collectively evaluated for impairment. Accordingly, individual consumer and residential loans are not separately identified for impairment disclosures, unless such loans are the subject of a restructuring agreement.
Goodwill and Intangible assets
Intangible assets are comprised of goodwill and core deposit intangibles. Goodwill is accounted for in accordance with SFAS No. 142, Goodwill and Other Intangible Assets, and accordingly is not amortized but is evaluated at least annually for impairment. Core deposit intangibles are amortized on a straight-line basis over terms ranging from seven to 15 years. Management periodically evaluates whether events or circumstances have occurred that would result in impairment of value.
Premises and equipment
Premises and equipment are stated at cost, less accumulated depreciation. Depreciation is computed for financial reporting purposes using the straight-line method over the estimated useful lives of the respective assets as follows:
Buildings and improvements 10-40 years
Equipment, fixtures and automobiles 3-10 years
Expenditures for renewals and betterments are capitalized and depreciated over their estimated useful lives. Repairs, maintenance and minor improvements are charged to operating expense as incurred. Gains or losses on disposition, if any, are recorded in the Statements of Income.
Other real estate
Other real estate includes properties acquired through foreclosure or acceptance of deeds in lieu of foreclosure. These properties are recorded at the lower of the recorded investment in the property or its fair value less the estimated cost of disposition. Any valuation adjustments required prior to foreclosure are charged to the allowance for loan losses. Subsequent to foreclosure, losses on the periodic revaluation of the property are charged to current period earnings as other real estate expense. Costs of operating and maintaining the properties are charged to other real estate expense as incurred. Any subsequent gains or losses on dispositions are credited or charged to income in the period of disposition.
Off-balance sheet financial instruments
The Company accounts for its guarantees in accordance with the provisions of Financial Accounting Standards Board (“FASB”) Interpretation No. 45, Guarantor’s Accounting and Disclosure Requirements for Guarantees, (“FIN 45”). In the ordinary course of business, the Company has entered into commitments to extend credit, including commitments under credit card arrangements, commitments to fund commercial real estate, construction and land development loans secured by real estate, and performance standby letters of credit. Such financial instruments are recorded when they are funded.
Income taxes
The Company and all subsidiaries file a consolidated federal income tax return on a calendar year basis. In lieu of Louisiana state income tax, the Bank is subject to the Louisiana bank shares tax, which is included in noninterest expense in the Company's consolidated financial statements. With few exceptions, the Company is no longer subject to U.S. federal, state or local income tax examinations for years before 2003.
Deferred tax assets and liabilities are recognized for the future tax consequences attributable to differences between the financial statement carrying amounts of existing assets and liabilities and their respective tax basis. Deferred tax assets and liabilities are measured using enacted tax rates expected to apply to taxable income in the years in which the deferred tax assets or liabilities are expected to be settled or realized. Valuation allowances are established when necessary to reduce deferred tax assets to the amount expected to be utilized.
Comprehensive income
Accounting principles generally require that recognized revenue, expenses, gains and losses be included in net income. Although certain changes in assets and liabilities, such as unrealized gains and losses on available for sale securities, are reported as a separate component of the equity section of the balance sheet, such items along with net income, are components of comprehensive income. The components of other comprehensive income and related tax effects are presented in the Statements of Changes in Stockholders’ Equity and Note 18 of the Consolidated Notes to the Financial Statements.
Earnings per common share
Earnings per share is computed and presented in accordance with SFAS No. 128 “Earnings Per Share”. No convertible shares or other agreements to issue common stock are outstanding. The $1 par value common stock outstanding has the same privileges, restrictions and rights, including voting and dividend rights. In 2006, all $5 par value stock was converted into $1 par value.
Transfers of Financial Assets
Transfers of financial assets are accounted for as sales, when control over the assets has been surrendered. Control over transferred assets is deemed to be surrendered when (i) the assets have been isolated from the Company, (ii) the transferee obtains the right (free of conditions that constrain it from taking advantage of that right) to pledge or exchange the transferred assets, and (iii) the Company does not maintain effective control over the transferred assets through an agreement to repurchase them before their maturity.
Recent Accounting Pronouncements
In December 2007, the Financial Accounting Standards Board (“FASB”) issued SFAS 160, Non-controlling Interests in Consolidated Financial Statements, an Amendment of ARB 51. SFAS 160 establishes new accounting and reporting standards for non-controlling interests in a subsidiary. SFAS 160 will require entities to classify non-controlling interests as a component of stockholders’ equity and will require subsequent changes in ownership interests in a subsidiary to be accounted for as an equity transaction. SFAS 160 will also require entities to recognize a gain or loss upon the loss of control of a subsidiary and to remeasure any ownership interest retained at fair value on that date. This statement also requires expanded disclosures that clearly identify and distinguish between the interests of the parent and the interests of the non-controlling owners. SFAS 160 is effective on a prospective basis for fiscal years, and interim periods within those fiscal years, beginning on or after December 15, 2008, except for the presentation and disclosure requirements, which are required to be applied retrospectively. We anticipate the adoption of SFAS No. 160 will not have a significant impact to the Company’s financial condition or results of operations
In December 2007, FASB issued SFAS No. 141R, Business Combinations (“SFAS No. 141R”) which applies to all business combinations. The statement requires most identifiable assets, liabilities, non-controlling interests, and goodwill acquired in a business combination to be recorded at “full fair value.” All business combinations will be accounted for by applying the acquisition method (previously referred to as the purchase method). Companies will have to identify the acquirer; determine the acquisition date and purchase price; recognize at their acquisition-date fair values the identifiable assets acquired, liabilities assumed, and any non-controlling interests in the acquiree, and recognize goodwill or, in the case of a bargain purchase, a gain. SFAS No. 141R is effective for periods beginning on or after December 15, 2008, and early adoption is prohibited. It will be applied to business combinations occurring after the effective date. We anticipate the adoption of SFAS No. 141R will not have a significant impact to the Company’s financial condition or results of operations.
In November 2007, the SEC issued Staff Accounting Bulletin No. 109, Written Loan Commitments Recorded at Fair Value Through Earnings (“SAB No. 109”). SAB No. 109 rescinds SAB No. 105’s prohibition on inclusion of expected net future cash flows related to loan servicing activities in the fair value measurement of a written loan commitment. SAB No. 109 applies to any loan commitments for which fair value accounting is elected under SFAS No. 159. SAB No. 109 is effective prospectively for derivative loan commitments issued or modified in fiscal quarters beginning after December 15, 2007. We anticipate the adoption of SAB No. 109 will not have a significant impact to the Company’s financial condition or results of operations.
In June 2007, the FASB ratified Emerging Issues Task Force (“EITF”) Issue No. 06-11, Accounting for Income Tax Benefits of Dividends on Share-Based Payment Award. The objective of this issue is to determine the accounting for the income tax benefits of dividend or dividend equivalents when the dividends or dividend equivalents are: (a) linked to equity-classified non-vested shares or share units or equity-classified outstanding share options and (b) charged to retained earnings under SFAS Statement No. 123 (Revised 2004), Share-Based Payment. The Task Force reached a consensus that EITF No. 06-11 should be applied prospectively to the income tax benefits of dividends on equity-classified employee share-based payment awards that are declared in fiscal years beginning after September 15, 2007. We anticipate the adoption of the provisions of EITF No. 06-11 will not have a significant impact to the Company’s financial condition or results of operations.
In March 2007, the FASB ratified EITF No. 06-10, Accounting for Collateral Assignment Split-Dollar Life Insurance Arrangements. One objective of EITF No. 06-10 is to determine whether a liability for future benefits under a collateral assignment split-dollar life insurance arrangement that provides a benefit to an employee that extends into postretirement periods should be recognized in accordance with SFAS No. 106 or APB Opinion 12, as appropriate, based on the substantive agreement with the employee. Another objective of EITF No. 06-10 is to determine how the asset arising from a collateral assignment split-dollar life insurance arrangement should be recognized and measured. EITF No. 06-10 is effective for fiscal years beginning after December 15, 2007. We anticipate the adoption of the provisions of EITF No. 06-10 will not have a significant impact to the Company’s financial condition or results of operations.
In February 2007, the FASB issued SFAS No. 159, The Fair Value Option for Financial Assets and Financial Liabilities. SFAS No. 159 provides the Company with an option to report selected financial assets and liabilities at fair value and establishes presentation and disclosure requirements to facilitate reporting between companies. The fair value option established by this Statement permits the Company to choose to measure eligible items at fair value at specified election dates. The Company shall then report unrealized gains and losses on items for which the fair value option has been elected in earnings at each reporting date subsequent to implementation. The Statement is effective for financial statements issued for fiscal years beginning after November 15, 2007, and interim periods within those fiscal years. We anticipate the adoption of SFAS No. 159 will not have a significant impact to the Company’s financial condition or results of operations.
In September 2006, the FASB issued SFAS No. 157, Fair Value Measurements. This Statement defines fair value, established a framework for measuring fair value in generally accepted accounting principles (GAAP) and expands disclosures about fair value measurement. The Statement is effective for the financial statements issued for fiscal years beginning after November 15, 2007 and interim periods within those fiscal years. The Bank anticipates that the adoption of SFAS No. 157 will not have a material impact on the Bank’s financial position or results of operations.
Reclassifications
Certain reclassifications have been made to prior year financial statements in order to conform to the classification adopted for reporting in 2007.
All share and per share data has been restated to reflect a stock dividend of one-third of a share of $1 par value common stock for each share of $1 and $5 par value common stock outstanding, accounted for as a four-for-three stock split, effective and payable to stockholders of record as of October 20, 2005 for each of the periods presented.
Note 2. Reorganization
On July 27, 2007, First Guaranty Bancshares, Inc. became the holding company for First Guaranty Bank pursuant to an Agreement and Plan of Exchange dated as of July 27, 2007 (the “Agreement”). Pursuant to the Agreement, on the Effective Date, each issued and outstanding share of the Bank’s common stock, par value $1.00 per share, automatically was converted into and exchanged for one share of the Company’s common stock, par value $1.00 per share. No stockholders exercised dissenters’ rights of appraisal. On the Effective Date, the Bank became a wholly owned subsidiary of the Company and the stockholders of the Bank became stockholders of the Company. No additional shares were offered or sold in connection with the Reorganization.
Note 3. Acquisition Activity
On July 30, 2007, the Company acquired all of the outstanding stock of Homestead Bancorp, Inc., the holding company for Homestead Bank located in Ponchatoula, Louisiana, for approximately $12.1 million in cash. Homestead Bank and First Guaranty Bank were also merged on July 30, 2007. This transaction was recorded using the purchase accounting method. The Company received the following:
b
| | | (in thousands) | |
| Cash and cash equivalents | | $ | 1,494 | |
| Securities | | | 45,000 | |
| Loans, net, including loans held for sale | | | 74,357 | |
| Premises and equipment, net | | | 2,780 | |
| Goodwill | | | 1,911 | |
| Core deposit and other intangibles | | | 2,836 | |
| Other assets | | | 1,228 | |
| Deposits | | | (67,446 | ) |
| Borrowings | | | (49,911 | ) |
| Other liabilities | | | (109 | ) |
| Total purchase price | | $ | 12,140 | |
The acquisition resulted in $4.7 million of intangible assets which includes $1.9 million of goodwill, $2.1 million of core deposit intangibles and $729,000 in mortgage servicing rights. The goodwill acquired is not tax deductible. The core deposit intangible is being amortized over the estimated useful life of 11.4 years using the straight line method.
The results of operations of the acquired company subsequent to the acquisition date are included in the Company's consolidated statements of income.
The merger increased the branch franchise from 16 locations to 18 locations and extended the Company’s presence to Walker, Louisiana.
The Company borrowed $12.1 million to acquire Homestead Bancorp, Inc. and Homestead Bank. The Company repaid the debt with cash received from the sale of Homestead Bank securities. The Company sold $46.4 million of securities owned by Homestead Bank, which comprised of $40.6 million in mortgage-backed securities and $5.8 million in mutual funds. In addition, $46.9 million in Homestead Bank short- and long-term FHLB advances matured or were prepaid by the Company in 2007.
On July 31, 2007, First Guaranty Bancshares, Inc., a Louisiana corporation, and Douglass Bancorp, Inc., a Kansas corporation, Douglass National Bank, a national bank headquartered in Kansas, and Fannie Mae, a Congressionally chartered federal instrumentality that is deemed a citizen of the District of Columbia entered into a Stock Purchase Agreement pursuant to which, among other things, First Guaranty Bancshares, Inc. would acquire all of the issued and outstanding shares of capital stock of Douglass National Bank and all of the outstanding and unexercised options of Douglass National Bank.
Under the terms and subject to the conditions of the Stock Purchase Agreement, all of the outstanding common stock of Douglass National Bank would be cancelled in exchange for an amount of cash without interest equal to the adjusted book value of Douglass National Bank immediately prior to the closing.
On October 5, 2007, the Company advised Douglass Bancorp, Inc. and Fannie Mae of its intent to terminate the Stock Purchase Agreement by and among the Company, Douglass Bancorp, Inc., Douglass National Bank and Fannie Mae dated July 31, 2007. The Company did not incur any material early termination penalties as a result of this transaction.
On November 2, 2007, the Company and First Community Holding Company, a Louisiana corporation and holding company for First Community Bank, a Louisiana state banking corporation (“First Community BHC”), entered into an Agreement and Plan of Reorganization (the “Merger Agreement”) pursuant to which, among other things, the Company will acquire all of the issued and outstanding shares of capital stock of First Community BHC and all of the outstanding and unexercised options of First Community BHC by virtue of the merger of a wholly-owned subsidiary of the Company with and into First Community BHC, with First Community BHC as the surviving corporation (the “Interim Merger”), followed by the merger of First Community BHC with and into the Company.
Under the terms and subject to the conditions of the Merger Agreement, which has been approved by the Boards of Directors of the Company and First Community BHC, at the effective time of the Interim Merger (the “Effective Time”), all of the outstanding common stock of First Community BHC will be cancelled in exchange for $34.06 per share. All of the outstanding and unexercised options to acquire shares of common stock of First Community BHC will be cancelled at the Effective Time in exchange for an amount in cash per outstanding and unexercised option equal to $26.06. Immediately following the Merger, First Community Bank will merge with and into First Guaranty Bank, with First Guaranty Bank as the sole surviving bank subsidiary of the Company.
Consummation of the Interim Merger is subject to various conditions, including (i) requisite approvals of the holders of First Community BHC common stock and (ii) receipt of regulatory approvals. In addition, each party’s obligation to consummate the Interim Merger is subject to certain other conditions, including (i) the other party’s representations and warranties in the Merger Agreement being true and correct at the Effective Time, subject to the materiality standards contained in the Merger Agreement, (ii) material compliance of the other party with its covenants and (iii) the absence of any law or order prohibiting the consummation of the Interim Merger.
Note 4. Cash and Due From Banks
Certain reserves are required to be maintained at the Federal Reserve Bank. The requirement as of December 31, 2007 and 2006 totaled $750,000. The Company has accounts at various correspondent banks, excluding the Federal Reserve Bank, which exceed the FDIC insured limit of $100,000 by $14.2 million at December 31, 2007. This balance includes $12.2 million at JPMorgan Chase, the correspondent bank which is used to clear cash letters.
Note 5. Securities
A summary comparison of securities by type at December 31, 2007 and 2006 is shown below.
| | | December 31, 2007 | | | December 31, 2006 | |
| | | | | | Gross | | | Gross | | | | | | | | | Gross | | | Gross | | | | |
| | | Amortized | | | Unrealized | | | Unrealized | | | Fair | | | Amortized | | | Unrealized | | | Unrealized | | | Fair | |
| | | Cost | | | Gains | | | Losses | | | Value | | | Cost | | | Gains | | | Losses | | | Value | |
| | | (in thousands) | |
| Available-for-sale: | | | | | | | | | | | | | | | | | | | | | | | | |
| U.S. Government Agencies | | $ | 92,962 | | | $ | 26 | | | $ | (25 | ) | | $ | 92,963 | | | $ | 98,369 | | | $ | - | | | $ | (1,226 | ) | | $ | 97,143 | |
| Mortgage-backed obligations | | | 2,016 | | | | 43 | | | | (23 | ) | | | 2,036 | | | | 4,077 | | | | 39 | | | | (103 | ) | | | 4,013 | |
| Asset-backed securities | | | 1,340 | | | | - | | | | (95 | ) | | | 1,245 | | | | 1,385 | | | | 1 | | | | (1 | ) | | | 1,385 | |
| Corporate debt securities | | | 5,954 | | | | 50 | | | | (214 | ) | | | 5,790 | | | | 7,394 | | | | 31 | | | | (61 | ) | | | 7,364 | |
| Mutual funds or other equity securities | | | 3,805 | | | | 22 | | | | (291 | ) | | | 3,536 | | | | 1,500 | | | | - | | | | (52 | ) | | | 1,448 | |
| Total securities | | $ | 106,077 | | | $ | 141 | | | $ | (648 | ) | | $ | 105,570 | | | $ | 112,725 | | | $ | 71 | | | $ | (1,443 | ) | | $ | 111,353 | |
| | | | | | | | | | | | | | | | | | | | | | | | | | | | | | | | | |
| | | | | | | | | | | | | | | | | | | | | | | | | | | | | | | | | |
| Held-to-maturity: | | | | | | | | | | | | | | | | | | | | | | | | | | | | | | | | |
| U.S. Government Agencies | | $ | 33,984 | | | $ | 24 | | | $ | (281 | ) | | $ | 33,727 | | | $ | 43,976 | | | $ | - | | | $ | (1,280 | ) | | $ | 42,696 | |
| Mortgage-backed obligations | | | 2,514 | | | | - | | | | (35 | ) | | | 2,479 | | | | 3,023 | | | | - | | | | (105 | ) | | $ | 2,918 | |
| Total securities | | $ | 36,498 | | | $ | 24 | | | $ | (316 | ) | | $ | 36,206 | | | $ | 46,999 | | | $ | - | | | $ | (1,385 | ) | | $ | 45,614 | |
| | | | | | | | | | | | | | | | | | | | | | | | | | | | | | | | | |
The scheduled maturities of securities at December 31, 2007, by contractual maturity, are shown below. Expected maturities may differ from contractual maturities because borrowers may have the right to call or prepay obligations with or without call or prepayment penalties.
| | | December 31, 2007 | |
| | | Amortized | | | Fair | | | Weighted | |
| | | Cost | | | Value | | | Avg Yield | |
| | | (dollars in thousands) | |
| Available For Sale: | | | | | | | | | |
| Due in one year or less | | $ | 49,182 | | | $ | 49,179 | | | | 4.14% | |
| Due after one year through five years | | | 10,673 | | | | 10,673 | | | | 5.13% | |
| Due after five years through 10 years | | | 4,568 | | | | 4,575 | | | | 5.35% | |
| Over 10 years | | | 41,654 | | | | 41,143 | | | | 5.98% | |
| Total | | $ | 106,077 | | | $ | 105,570 | | | | 5.00% | |
| | | | | | | | | | | | | |
| Held to Maturity: | | | | | | | | | | | | |
| Due in one year or less | | $ | - | | | $ | - | | | | 0.00% | |
| Due after one year through five years | | | 999 | | | | 992 | | | | 4.15% | |
| Due after five years through 10 years | | | 9,834 | | | | 9,673 | | | | 4.53% | |
| Over 10 years | �� | | 25,665 | | | | 25,541 | | | | 5.42% | |
| Total | | $ | 36,498 | | | $ | 36,206 | | | | 5.15% | |
| | | | | | | | | | | | | |
At December 31, 2007 and 2006, approximately $131.6 million and $147.3 million, respectively, in securities were pledged to secure public fund deposits, and for other purposes required or permitted by law. Gross realized gains were $0, $0 and $7,000 for the years ended December 31, 2007, 2006 and 2005, respectively. Gross realized losses were $478,000, $234,000 and $0 for the years ended December 31, 2007, 2006 and 2005. The tax (benefit) provision applicable to these realized net (losses)/gains amounted to $(163,000), $(80,000), and $2,000, respectively. Proceeds from sales of securities classified as available for sale amounted to $65.2 million, $6.8 million and $0 for the years ended December 31, 2007, 2006 and 2005, respectively.
The following is a summary of the fair value of securities with gross unrealized losses and an aging of those gross unrealized losses at December 31, 2007.
| | | Less Than 12 Months | | | 12 Months or More | | | Total | |
| | | | | | Gross | | | | | | Gross | | | | | | Gross | |
| | | | | | Unrealized | | | | | | Unrealized | | | | | | Unrealized | |
| | | Fair Value | | | Losses | | | Fair Value | | | Losses | | | Fair Value | | | Losses | |
| | | (in thousands) | |
| Available for sale: | | | | | | | | | | | | | | | | | | |
| U.S. Treasury and U.S. | | | | | | | | | | | | | | | | | | |
| Government Agencies | | $ | - | | | $ | - | | | $ | 3,779 | | | $ | 25 | | | $ | 3,779 | | | $ | 25 | |
| Mortgage-backed obligations | | | - | | | | - | | | | 510 | | | | 23 | | | | 510 | | | | 23 | |
| Asset-backed securities | | | 1,155 | | | | 94 | | | | 90 | | | | 1 | | | | 1,245 | | | | 95 | |
| Corporate debt securities | | | 1,710 | | | | 147 | | | | 858 | | | | 67 | | | | 2,568 | | | | 214 | |
| Mutual funds or other equity securites | | | 1,227 | | | | 47 | | | | 1,256 | | | | 244 | | | | 2,483 | | | | 291 | |
| Total securities | | $ | 4,092 | | | $ | 288 | | | $ | 6,493 | | | $ | 360 | | | $ | 10,585 | | | $ | 648 | |
| | | | | | | | | | | | | | | | | | | | | | | | | |
| | | | | | | | | | | | | | | | | | | | | | | | | |
| Held to maturity: | | | | | | | | | | | | | | | | | | | | | | | | |
| U.S. Treasury and U.S. | | | | | | | | | | | | | | | | | | | | | | | | |
| Government Agencies | | $ | - | | | $ | - | | | $ | 27,780 | | | $ | 281 | | | $ | 27,780 | | | $ | 281 | |
| Mortgage-backed obligations | | | - | | | | - | | | | 2,479 | | | | 35 | | | | 2,479 | | | | 35 | |
| Total securities | | $ | - | | | $ | - | | | $ | 30,259 | | | $ | 316 | | | $ | 30,259 | | | $ | 316 | |
| | | | | | | | | | | | | | | | | | | | | | | | | |
The Company considers the impairment on securities that have been in a gross unrealized loss position for less than 12 months to be temporary. The gross unrealized losses in the portfolio resulted from increases in market interest rates and not from deterioration in the creditworthiness of the issuer. The Company believes that it will collect all amounts contractually due and has the intent and the ability to hold these securities until the fair value is at least equal to the carrying value. As of December 31, 2007, the Company had 19 debt securities and two equity securities that had gross unrealized losses for less than 12 months.
At December 31, 2007, twelve U.S. Government Agency securities, ten of which are classified as held to maturity and two classified as available for sale, have been in a continuous unrealized loss position for twelve months or longer. Six mortgage-backed fixed rate securities, five classified as held to maturity and one classified as available for sale, have also been in a continuous unrealized loss position for twelve months or longer. Also, six corporate debt securities, one asset-backed security, one mutual fund and one equity security, all classified as available for sale, have been in a continuous unrealized loss position for twelve months or longer. These securities with unrealized losses resulted from increases in interest rates and not from deterioration in the creditworthiness of the issuer. There were no adverse changes to the portfolio subsequent to December 31, 2007.
Management evaluates securities for other-than-temporary impairment at least quarterly and more frequently when economic or market conditions warrant such evaluation. Consideration is given to (i) the length of time and the extent to which the fair value has been less than cost, (ii) the financial condition and near-term prospects of the issuer and (iii) the intent and ability of the Company to retain its investment in the issuer for a period of time sufficient to allow for any anticipated recovery in fair value. In analyzing an issuer’s financial condition, Management considers whether the securities are issued by the federal government or its agencies, whether downgrades by bond rating agencies have occurred and industry reports. As of December 31, 2007, Management’s assessment concluded that no unrealized losses are deemed to be other-than-temporary.
At December 31, 2007, the Company’s exposure to three investment security issuers exceeded 10% of stockholders’ equity as follows:
| | | Amortized | | | Fair | |
| | | Cost | | | Value | |
| | | (in thousands) | |
| | | | | | | |
| Federal Home Loan Bank (FHLB) | | $ | 75,770 | | | $ | 75,614 | |
| Federal Home Loan Mortgage Corporation (Freddie Mac) | | | 18,026 | | | | 18,060 | |
| Federal National Mortgage Association (Fannie Mae) | | | 40,333 | | | | 39,963 | |
| Total | | $ | 134,129 | | | $ | 133,637 | |
| | | | | | | | | |
Note 6. Loans and Allowance for Loan Losses
The following table summarizes the components of the Company's loan portfolio as of December 31, 2007 and 2006:
| | | December 31, | |
| | | 2007 | | | 2006 | |
| | | | | | As % of | | | | | | As % of | |
| | | Balance | | | Category | | | Balance | | | Category | |
| | | (dollars in thousands) | |
| Real estate | | | | | | | | | | | | |
| Construction & land development | | $ | 98,127 | | | | 17.0% | | | $ | 49,837 | | | | 9.9% | |
| Farmland | | | 23,065 | | | | 4.0% | | | | 25,582 | | | | 5.0% | |
| 1-4 Family | | | 84,640 | | | | 14.7% | | | | 67,022 | | | | 13.2% | |
| Multifamily | | | 13,061 | | | | 2.3% | | | | 14,702 | | | | 2.9% | |
| Non-farm non-residential | | | 236,474 | | | | 41.1% | | | | 256,176 | | | | 50.5% | |
| Total real estate | | | 455,367 | | | | 79.1% | | | | 413,319 | | | | 81.5% | |
| | | | | | | | | | | | | | | | | |
| Agricultural | | | 16,816 | | | | 2.9% | | | | 16,359 | | | | 3.2% | |
| Commercial and industrial | | | 81,073 | | | | 14.1% | | | | 59,072 | | | | 11.6% | |
| Consumer and other | | | 22,517 | | | | 3.9% | | | | 18,880 | | | | 3.7% | |
| Total loans before unearned income | | | 575,773 | | | | 100.0% | | | | 507,630 | | | | 100.0% | |
| Less: unearned income | | | (517 | ) | | | | | | | (435 | ) | | | | |
| Total loans after unearned income | | $ | 575,256 | | | | | | | $ | 507,195 | | | | | |
| | | | | | | | | | | | | | | | | |
The following table summarizes fixed and floating rate loans by maturity and repricing frequencies as of December 31, 2007:
| | | December 31, 2007 | |
| | | Fixed | | | Floating | | | Total | |
| | | (in thousands) | |
| | | | | | | | | | |
| One year or less | | $ | 98,095 | | | $ | 339,955 | | | $ | 438,050 | |
| One to five years | | | 97,198 | | | | 1,867 | | | | 99,065 | |
| Five to 15 years | | | 8,179 | | | | 144 | | | | 8,323 | |
| Over 15 years | | | 19,530 | | | | - | | | | 19,530 | |
| Subtotal | | | 223,002 | | | | 341,966 | | | | 564,968 | |
| Nonaccrual loans | | | | | | | | | | | 10,288 | |
| Total loans after unearned income | | $ | 223,002 | | | $ | 341,966 | | | $ | 575,256 | |
| | | | | | | | | | | | | |
Changes in the allowance for loan losses are as follows:
| | | Years Ended December 31, | |
| | | 2007 | | | 2006 | | | 2005 | |
| | | (in thousands) | |
| | | | | | | | | | |
| Balance, beginning of year | | $ | 6,675 | | | $ | 7,597 | | | $ | 5,910 | |
| Additional provision from acquisition | | | 325 | | | | - | | | | - | |
| Provision charged to expense | | | 1,918 | | | | 4,419 | | | | 5,621 | |
| Loans charged off | | | (3,885 | ) | | | (5,888 | ) | | | (4,162 | ) |
| Recoveries | | | 1,160 | | | | 547 | | | | 228 | |
| Balance, end of year | | $ | 6,193 | | | $ | 6,675 | | | $ | 7,597 | |
| | | | | | | | | | | | | |
The allowance for loan losses is reviewed by Management on a monthly basis and additions thereto are recorded in order to maintain the allowance at an adequate level. In assessing the adequacy of the allowance, Management considers a variety of internal and external factors that might impact the performance of individual loans. These factors include, but are not limited to, economic conditions and their impact upon borrowers' ability to repay loans, respective industry trends, borrower estimates and independent appraisals. Periodic changes in these factors impact Management's assessment of each loan and its overall impact on the adequacy of the allowance for loan losses.
As of December 31, 2007, 2006 and 2005, the Company had loans totaling $10.3 million, $10.4 million and $21.1 million, respectively, on which the accrual of interest had been discontinued. Non-accrual loans remained relatively flat from December 31, 2006 to 2007. The decrease in non-accrual loans from December 2005 to 2006 is primarily the result of foreclosing on several of the 156 home mortgage loans that involved irregularities found in 2005 that suggest that many of these mortgage loans had been made against overvalued collateral on the basis of misleading loan information. As of December 31, 2007, 2006 and 2005, the Company had loans past due 90 days or more and still accruing interest totaling $547,000, $334,000 and $248,000, respectively.
The average amount of non-accrual loans in 2007 was $10.3 million compared to $17.1 million in 2006. Had these loans performed in accordance with their original terms, the Company's interest income would have been increased by approximately $0.6 million and $1.4 million for the years ended December 31, 2007 and 2006, respectively. Impaired loans at December 31, 2007 and 2006, including non-accrual loans, amounted to $10.1 million and $13.3 million, respectively. The portion of the allowance for loan losses allocated to all impaired loans amounted to $0.9 million and $2.4 million at December 31, 2007 and 2006, respectively. As of December 31, 2007, the Company has no outstanding commitments to advance additional funds in connection with impaired loans.
The following is a summary of information pertaining to impaired loans as of December 31:
| | | 2007 | | | 2006 | |
| | | (in thousands) | |
| | | | | | | |
| Impaired loans without a valuation allowance | | $ | 2,559 | | | $ | - | |
| Impaired loans with a valuation allowance | | | 7,523 | | | | 13,264 | |
| Total impaired loans | | $ | 10,082 | | | $ | 13,264 | |
| | | | | | | | | |
| Valuation allowance related to impaired loans | | $ | 879 | | | $ | 2,420 | |
| Total Nonaccrual Loans | | $ | 10,288 | | | $ | 10,362 | |
| Total loans past due ninety days and still accruing | | $ | 547 | | | $ | 334 | |
| | | 2007 | | | 2006 | | | 2005 | |
| | | (in thousands) | |
| | | | | | | | | | |
| Average investment in impaired loans | | $ | 7,571 | | | $ | 17,128 | | | $ | 14,680 | |
| Interest income recognized on impaired loans | | $ | 764 | | | $ | 1,946 | | | $ | 475 | |
| Interest income recognized on a cash basis on impaired loans | | $ | 182 | | | $ | 1,636 | | | $ | 526 | |
Note 7. Premises and Equipment
The major categories comprising premises and equipment at December 31, 2007 and 2006 are as follows:
| | | December 31, | |
| | | 2007 | | | 2006 | |
| | | (in thousands) | |
| | | | | | | |
| Land | | $ | 4,301 | | | $ | 3,137 | |
| Bank premises | | | 15,135 | | | | 13,662 | |
| Furniture and equipment | | | 13,431 | | | | 12,486 | |
| Acquired value | | | 32,867 | | | | 29,285 | |
| Less: accumulated depreciation | | | 16,627 | | | | 15,692 | |
| Net book value | | $ | 16,240 | | | $ | 13,593 | |
| | | | | | | | | |
Note 8. Goodwill and Other Intangible Assets
The Company accounts for goodwill and intangible assets in accordance with SFAS No. 142, “Goodwill and Other Intangible Assets”. Under SFAS No. 142, goodwill and intangible assets deemed to have indefinite lives are no longer amortized, but are subject to annual impairment tests in accordance with the provision of SFAS No. 142. Other intangible assets continue to be amortized over their useful lives. Goodwill for the year ended December 31, 2007 was $1.9 million, all of which was acquired in the Homestead acquisition (see Note 3). No impairment charges were recognized during 2007. No goodwill was recorded for the years ended December 31, 2006 or 2005.
Mortgage servicing rights totaled $24,000 at December 31, 2007. No mortgage servicing rights were recorded at December 31, 2006 or 2005.
Other intangible assets recorded include core deposit intangibles, which are subject to amortization. The core deposits reflect the value of deposit relationships, including the beneficial rates, which arose from the purchase of other financial institutions and the purchase of various banking center locations from one single financial institution. The following table summarizes the Company’s purchased accounting intangible assets subject to amortization. See Note 3 to the Consolidated Financial Statements for additional information on intangible assets as a result of the Homestead Bancorp, Inc merger.
| | | December 31, | |
| | | 2007 | | | 2006 | |
| | | Gross Carrying | | | Accumulated | | | Net Carrying | | | Gross Carrying | | | Accumulated | | | Net Carrying | |
| | | Amount | | | Amortization | | | Amount | | | Amount | | | Amortization | | | Amount | |
| | | (in thousands) | |
| | | | | | | | | | | | | | | | | | | |
| Core deposit intangibles | | $ | 7,997 | | | $ | 5,638 | | | $ | 2,359 | | | $ | 5,891 | | | $ | 5,435 | | | $ | 456 | |
| Mortgage Servicing Rights | | | 24 | | | | - | | | | 24 | | | | - | | | | - | | | | - | |
| Total | | $ | 8,021 | | | $ | 5,638 | | | $ | 2,383 | | | $ | 5,891 | | | $ | 5,435 | | | $ | 456 | |
| | | | | | | | | | | | | | | | | | | | | | | | | |
Amortization expense relating to purchase accounting intangibles totaled $203,000, $525,000, and $630,000 for the year ended December 31, 2007, 2006, and 2005, respectively. The weighted average amortization period of these assets is 8.7 years. Estimated future amortization expense is as follows:
For the Years Ended | | Estimated |
| December 31, | | Amortization Expense |
| (in thousands) |
| 2008 | | $311 |
| 2009 | | 292 |
| 2010 | | 218 |
| 2011 | | 218 |
| 2012 | | 216 |
These estimates do not assume the addition of any new intangible assets that may be acquired in the future nor any write-downs resulting from impairment.
Note 9. Deposits
The aggregate amount of jumbo time deposits, each with a minimum denomination of $100,000, was approximately $167.3 million and $142.5 million at December 31, 2007 and 2006, respectively.
At December 31, 2007, the scheduled maturities of time deposits are as follows:
| | | December 31, 2007 | |
| | | (in thousands) | |
| | | | |
| Due in one year or less | | $ | 267,850 | |
| Due after one year through three years | | | 49,848 | |
| Due after three years | | | 16,470 | |
| Total | | $ | 334,168 | |
| | | | | |
Note 10. Borrowings:
Short-term borrowings are summarized as follows:
| | | December 31, | |
| | | 2007 | | | 2006 | |
| | | (in thousands) | |
| Federal Home Loan Bank advances | | $ | - | | | $ | - | |
| Securities sold under agreements to repurchase | | | 10,401 | | | | 6,584 | |
| Total short-term borrowings | | $ | 10,401 | | | $ | 6,584 | |
| | | | | | | | | |
Securities sold under agreements to repurchase, which are classified as secured borrowings, generally mature daily. Interest rates on repurchase agreements are set by Management and are generally based on the 91-day Treasury bill rate.
The Company’s available lines of credit with correspondent banks, including the Federal Home Loan Bank, totaled $111.4 million at December 31, 2007 and $60.9 million at December 31, 2006. In April 2007, the FHLB reinstated “blanket lien” status which is secured primarily by commercial real estate loans not in custody by the FHLB. Management chose to retain some of its loans at the FHLB in “custody status” enabling higher credit availability. In 2006, due to a high level of nonperforming assets, FHLB borrowings were based on “custody” status rather than “blanket lien” status. FHLB advances in 2006 were collateralized primarily by commercial real estate loans in the FHLB’s custody. With the exception of the FHLB, no other lines were outstanding with any other correspondent bank at December 31, 2007 or December 31, 2006.
The following schedule provides certain information about the Company’s short-term borrowings during 2007 and 2006:
| | | December 31, | |
| | | 2007 | | | 2006 | | | 2005 | |
| | | (dollars in thousands) | |
| | | | | | | | | | |
| Outstanding at year end | | $ | 10,401 | | | $ | 6,584 | | | $ | 8,981 | |
| Maximum month-end outstanding | | | 45,766 | | | | 37,353 | | | | 32,348 | |
| Average daily outstanding | | | 16,655 | | | | 23,731 | | | | 17,381 | |
| Weighted average rate during the year | | | 5.18% | | | | 5.19% | | | | 3.14% | |
| Average rate at year end | | | 3.50% | | | | 4.41% | | | | 3.56% | |
At December 31, 2007, no long-term debt at the FHLB was outstanding.
At December 31, 2007, letters of credit issued by the FHLB totaling $105.0 were outstanding and carried as off-balance sheet items, all of which expire in 2008. At December 31, 2006, the Company had $45.0 million in letters of credit issued by the FHLB which all expired in 2007 and were carried as off-balance sheet items. The letters of credit are solely used for pledging towards public fund deposits. See Note 20 to Notes to the Financial Statements for additional information.
In 2007, the Company assumed $3.1 million in subordinated debentures in the Homestead acquisition. The debentures were issued in 2003 by the Homestead Bancorp Trust I, a statutory trust. The interest rate on the debentures is LIBOR plus 300bp, resets quarterly and was 7.91% at December 31, 2007. The securities have a term of 30 years, callable after 5 years, with interest payments due on a quarterly basis. The Company may redeem the debentures on or after August 8, 2008, with regulatory approval, at face value. It is the Company’s intent to redeem these debentures in August 2008.
Note 11. Preferred Stock
The number of authorized shares of preferred stock is 100,000 shares of $1,000 par value. There is no preferred stock outstanding.
Note 12. Minimum Capital Requirements
The Company and the Bank are subject to various regulatory capital requirements administered by the federal and state banking agencies. Failure to meet minimum capital requirements can initiate certain mandatory and possibly additional discretionary actions by regulators that, if undertaken, could have a direct material effect on the Company’s financial statements. Under capital adequacy guidelines and the regulatory framework for prompt corrective action, the Company and the Bank must meet specific capital guidelines that involve quantitative measures of their assets, liabilities and certain off-balance sheet items as calculated under regulatory accounting practices. The capital amounts and classification are also subject to qualitative judgments by the regulators about components, risk weightings and other factors. Prompt corrective action provisions are not applicable to bank holding companies.
Quantitative measures established by regulation to ensure capital adequacy require the Company and the Bank to maintain minimum amounts and ratios of total and Tier 1 capital to risk-weighted assets and of Tier 1 capital to average assets. Management believes, as of December 31, 2007 and 2006, that the Company and the Bank met all capital adequacy requirements to which they were subject.
As of December 31, 2007, the most recent notification from the Federal Deposit Insurance Corporation categorized the Bank as well capitalized under the regulatory framework for prompt corrective action. To be categorized as well capitalized, an institution must maintain minimum total risk-based, Tier 1 risk-based and Tier 1 leverage ratios as set forth in the following table. There are no conditions or events since the notification that Management believes have changed the Bank's category. The Company’s and the Bank's actual capital amounts and ratios as of December 31, 2007 and 2006 are presented in the following table.
| | | | | | | | | | | | | | | Minimum | |
| | | | | | | | | | | | | | | To Be Well | |
| | | | | | | | | | | | | | | Capitalized Under | |
| | | | | | | | | Minimum Capital | | | Prompt Corrective | |
| | | Actual | | | Requirements | | | Action Provisions | |
| | | Amount | | | Ratio | | | Amount | | | Ratio | | | Amount | | | Ratio | |
| | | (in thousands, except for percentages) | |
| December 31, 2007 | | | | | | | | | | | | | | | | | | |
| Total risk-based capital: | | | | | | | | | | | | | | | | | | |
| First Guaranty Bancshares, Inc. | | $ | 71,556 | | | | 11.09% | | | $ | 51,600 | | | | 8.00% | | | | N/A | | | | N/A | |
| First Guaranty Bank | | | 71,006 | | | | 11.02% | | | | 51,558 | | | | 8.00% | | | | 64,447 | | | | 10.00% | |
| Tier 1 capital: | | | | | | | | | | | | | | | | | | | | | | | | |
| First Guaranty Bancshares, Inc. | | | 65,364 | | | | 10.13% | | | | 25,800 | | | | 4.00% | | | | N/A | | | | N/A | |
| First Guaranty Bank | | | 64,813 | | | | 10.06% | | | | 25,779 | | | | 4.00% | | | | 38,668 | | | | 6.00% | |
| Tier 1 leverage capital: | | | | | | | | | | | | | | | | | | | | | | | | |
| First Guaranty Bancshares, Inc. | | | 65,364 | | | | 7.38% | | | | 35,414 | | | | 4.00% | | | | N/A | | | | N/A | |
| First Guaranty Bank | | | 64,813 | | | | 8.22% | | | | 31,556 | | | | 4.00% | | | | 39,444 | | | | 5.00% | |
| | | | | | | | | | | | | | | | | | | | | | | | | |
| | | | | | | | | | | | | | | | | | | | | | | | | |
| December 31, 2006 | | | | | | | | | | | | | | | | | | | | | | | | |
| Total risk-based capital | | | | | | | | | | | | | | | | | | | | | | | | |
| First Guaranty Bank | | $ | 66,292 | | | | 11.03% | | | $ | 48,073 | | | | 8.00% | | | $ | 60,091 | | | | 10.00% | |
| Tier 1 capital | | | | | | | | | | | | | | | | | | | | | | | | |
| First Guaranty Bank | | | 59,617 | | | | 9.92% | | | | 24,037 | | | | 4.00% | | | | 36,055 | | | | 6.00% | |
| Tier 1 leverage capital | | | | | | | | | | | | | | | | | | | | | | | | |
| First Guaranty Bank | | | 59,617 | | | | 8.16% | | | | 29,207 | | | | 4.00% | | | | 36,509 | | | | 5.00% | |
Note 13. Restrictions on Dividends and Loans
The FRB has stated that generally, a bank holding company, should not maintain a rate of distributions to shareholders unless its available net income has been sufficient to fully fund the distributions, and the prospective rate of earnings retention appears consistent with the bank holding company’s capital needs, asset quality and overall financial condition. As a Louisiana corporation, we are restricted under the Louisiana corporate law from paying dividends under certain conditions.
First Guaranty Bank may not pay dividends or distribute capital assets if it is in default on any assessment due to the FDIC. First Guaranty Bank is also subject to regulations that impose minimum regulatory capital and minimum state law earnings requirements that affect the amount of cash available for distribution. In addition, under the Louisiana Banking Law, dividends may not be paid if it would reduce the unimpaired surplus below 50% of outstanding capital stock in any year.
Note 14. Related Party Transactions
In the normal course of business, the Company has loans, deposits and other transactions with its executive officers, directors and certain business organizations and individuals with which such persons are associated. An analysis of the activity of loans made to such borrowers during the year ended December 31, 2007 follows:
| | | December 31, 2007 | |
| | | (in thousands) | |
| | | | |
| Balance, beginning of year | | $ | 19,989 | |
| New loans | | | 12,850 | |
| Repayments | | | (13,719 | ) |
| Balance, end of year | | $ | 19,120 | |
| | | | | |
Unfunded commtments to the Company's directors and executive officers totaled $16.9 million at December 31, 2007. Additionally, included in the Company’s loan portfolio are participations in loans totaling $0.8 million at December 31, 2007, which were purchased from affiliated financial institutions. Participations sold to affiliated financial institutions totaled $10.3 million at December 31, 2007.
During the year ended 2007, the Company paid approximately $715,000 for printing services and supplies and office furniture and equipment to Champion Graphic Communications (or subsidiary companies of Champion Industries, Inc.), of which Mr. Marshall T. Reynolds, the Chairman of the Company’s Board of Directors, is President, Chief Executive Officer, Chairman of the Board of Directors and holder of 41.5% of the capital stock; approximately $1.1 million to participate in the Champion Industries, Inc. employee medical benefit plan; and approximately $245,000 to Sabre Transportation, Inc. for travel expenses of the Chairman and other directors. These expenses include, but are not limited to, the utilization of an aircraft, fuel, air crew, ramp fees and other expenses attendant to the Company’s use. The Harrah and Reynolds Corporation, of which Mr. Reynolds is President and Chief Executive Officer and sole shareholder, has a 99% ownership interest in Sabre Transportation, Inc.
During the year ended 2007, the Company engaged the services of Cashe, Lewis, Coudrain and Sandage, attorneys-at-law, of which Mr. Alton Lewis, a director of the Company, is a partner, to represent the Company with certain legal matters. Mr. Lewis has a 25% ownership interest in the law firm. The fees paid for these legal services totaled $178,000.
Note 15. Employee Benefit Plans
The Company has an employee savings plan to which employees, who meet certain service requirements, may defer one to 20 percent of their base salaries, six percent of which may be matched up to 100%, at its sole discretion. Contributions to the savings plan were $115,000, $101,000 and $93,000 in 2007, 2006 and 2005, respectively.
An Employee Stock Ownership Plan (“ESOP”) benefits all eligible employees. Full-time employees who have been credited with at least 1,000 hours of service during a 12 consecutive month period and who have attained age 21 are eligible to participate in the ESOP. The plan document has been approved by the Internal Revenue Service. Contributions to the ESOP are at the sole discretion of the Company.
Voluntary contributions of $100,000 to the ESOP were made in 2007, 2006, and 2005 for the purchase of shares from third parties at market value. At December 31, 2007, the ESOP had acquired 3,843 shares of $1 par value common stock at a cost of $90,003 for the 2007 contribution, bringing the total shares allocated to 18,353 shares.
In 2006 the ESOP acquired 3,820 shares of $1 par value common stock for a cost of $89,464. In 2005 the ESOP acquired 4,738 shares of $1 par value common stock for a cost of $87,997. An analysis of ESOP shares allocated is presented below:
| | | 2007 | | | 2006 | | | 2005 | |
| | | | | | | | | | |
| Shares allocated, beginning of year | | | 14,510 | | | | 10,690 | | | | 5,952 | |
| Shares allocated, during the year | | | 3,843 | | | | 3,820 | | | | 4,738 | |
| Allocated shares held by ESOP, end of year | | | 18,353 | | | | 14,510 | | | | 10,690 | |
| | | | | | | | | | | | | |
Note 16. Other Expense
The following is a summary of the significant components of other noninterest expense:
| | | Years Ended December 31, | |
| | | 2007 | | | 2006 | | | 2005 | |
| | | (in thousands) | |
| Other noninterest expense: | | | | | | | | | |
| Legal and professional fees | | $ | 1,610 | | | $ | 1,390 | | | $ | 1,201 | |
| Operating supplies | | | 615 | | | | 545 | | | | 514 | |
| Marketing and public relations | | | 842 | | | | 823 | | | | 564 | |
| Data processing | | | 955 | | | | 904 | | | | 736 | |
| Travel and lodging | | | 439 | | | | 280 | | | | 280 | |
| Taxes - sales and capital | | | 628 | | | | 582 | | | | 684 | |
| Telephone | | | 211 | | | | 244 | | | | 421 | |
| Amortization of core deposit intangibles | | | 203 | | | | 525 | | | | 630 | |
| Other | | | 2,999 | | | | 2,535 | | | | 2,410 | |
| Total other expense | | $ | 8,502 | | | $ | 7,828 | | | $ | 7,440 | |
| | | | | | | | | | | | | |
Note 17. Income Taxes
The following is a summary of the provision for income taxes included in the Statements of Income:
| | | Years Ended December 31, | |
| | | 2007 | | | 2006 | | | 2005 | |
| | | (in thousands) | |
| | | | | | | | | | |
| Current | | $ | 4,632 | | | $ | 4,046 | | | $ | 3,822 | |
| Deferred | | | 213 | | | | 617 | | | | (618 | ) |
| Tax credits | | | (81 | ) | | | (135 | ) | | | (34 | ) |
| Tax benefits attributable to items charged to goodwill | | | 726 | | | | - | | | | - | |
| Benefit of operating loss carryforward | | | (24 | ) | | | (24 | ) | | | (24 | ) |
| Total | | $ | 5,466 | | | $ | 4,504 | | | $ | 3,146 | |
| | | | | | | | | | | | | |
The difference between income taxes computed by applying the statutory federal income tax rate and the provision for income taxes in the financial statements is reconciled as follows:
| | | Years Ended December 31, | |
| | | 2007 | | | 2006 | | | 2005 | |
| | | (in thousands, except for percentages) | |
| | | | | | | | | | |
| Statutory tax rate | | | 34.2% | | | | 34.2% | | | | 34.1% | |
| Federal income taxes at statutory rate | | $ | 5,379 | | | $ | 4,551 | | | $ | 3,127 | |
| Tax credits | | | (81 | ) | | | (135 | ) | | | (34 | ) |
| Other | | | 168 | | | | 88 | | | | 53 | |
| Total | | $ | 5,466 | | | $ | 4,504 | | | $ | 3,146 | |
| | | | | | | | | | | | | |
Deferred taxes are recorded based upon differences between the financial statement and tax basis of assets and liabilities, and available tax credit carryforwards. Temporary differences between the financial statement and tax values of assets and liabilities give rise to deferred tax assets (liabilities). The significant components of deferred tax assets and liabilities at December 31, 2007 and 2006 are as follows:
| | | Years Ended December 31, | |
| | | 2007 | | | 2006 | |
| | | (in thousands) | |
| Deferred tax assets: | | | | | | |
| Allowance for loan losses | | $ | 2,023 | | | $ | 2,270 | |
| Net operating loss carryforwards | | | - | | | | 24 | |
| Other real estate owned | | | 85 | | | | 128 | |
| Depreciation and amortization | | | - | | | | 302 | |
| Unrealized loss on available for sale securities | | | 172 | | | | 466 | |
| Other | | | 84 | | | | - | |
| Gross deferred tax assets | | $ | 2,364 | | | $ | 3,190 | |
| | | | | | | | | |
| Deferred tax liabilities: | | | | | | | | |
| Depreciation and amortization | | | (1,095 | ) | | | - | |
| Other | | | (1,424 | ) | | | (1,188 | ) |
| Gross deferred tax liabilities | | | (2,519 | ) | | | (1,188 | ) |
| Net deferred tax (liabilities) assets | | $ | (155 | ) | | $ | 2,002 | |
| | | | | | | | | |
As of December 31, 2007, there were no net operating loss carry forwards for income tax purposes. As of December 31, 2006, the Company had a net operating loss carry forward of $69,000, which was available to offset future taxable income.
On January 1, 2007, the Company adopted the provisions of FASB Interpretation No. 48, Accounting for Uncertainty in Income Taxes ("FIN 48"). FIN 48 clarifies the accounting for uncertainty in income taxes recognized in financial statements in accordance with Statement of Financial Accounting Standards ("SFAS") No. 109, Accounting for Income Taxes. The Company does not believe it has any unrecognized tax benefits included in its consolidated financial statements. The Company has not had any settlements in the current period with taxing authorities, nor has it recognized tax benefits as a result of a lapse of the applicable statute of limitations.
The Company recognizes interest and penalties accrued related to unrecognized tax benefits, if applicable, in noninterest expense. During the years ended December 31, 2007, 2006 and 2005, the Company did not recognize any interest or penalties in its consolidated financial statements, nor has it recorded an accrued liability for interest or penalty payments.
Note 18. Comprehensive Income
The following is a summary of the components of other comprehensive income as presented in the Statements of Changes in Stockholders’ Equity:
| | | December 31, | |
| | | 2007 | | | 2006 | | | 2005 | |
| | | (in thousands) | |
| | | | | | | | | | |
| Unrealized gain (loss) on available for sale securities, net | | $ | 387 | | | $ | (517 | ) | | $ | (954 | ) |
| Reclassification adjustments for net losses (gains), realized net income | | | 478 | | | | 234 | | | | (7 | ) |
| Other comprehensive income (loss) | | | 865 | | | | (283 | ) | | | (961 | ) |
| Income tax (provision) benefit related to other comprehensive income | | | (295 | ) | | | 96 | | | | 327 | |
| Other comprehensive income (loss), net of income taxes | | $ | 570 | | | $ | (187 | ) | | $ | (634 | ) |
| | | | | | | | | | | | | |
Note 19. Financial Instruments
The Company is a party to financial instruments with off-balance sheet risk in the normal course of business to meet the financing needs of its customers and to reduce its own exposure to fluctuations in interest rates. These financial instruments include commitments to extend credit and standby and commercial letters of credit. Those instruments involve, to varying degrees, elements of credit and interest rate risk in excess of the amount recognized in the Consolidated Balance Sheets. The contract or notional amounts of those instruments reflect the extent of the involvement in particular classes of financial instruments.
The exposure to credit loss in the event of nonperformance by the other party to the financial instrument for commitments to extend credit and standby and commercial letters of credit is represented by the contractual notional amount of those instruments. The same credit policies are used in making commitments and conditional obligations as it does for on-balance sheet instruments.
Unless otherwise noted, collateral or other security is not required to support financial instruments with credit risk.
Commitments to extend credit are agreements to lend to a customer as long as there is no violation of any condition established in the contract. Commitments generally have fixed expiration dates or other termination clauses and may require payment of a fee. Since commitments may expire without being drawn upon, the total commitment amounts do not necessarily represent future cash requirements. Each customer's creditworthiness is evaluated on a case-by-case basis. The amount of collateral obtained, if deemed necessary upon extension of credit, is based on Management's credit evaluation of the counterpart. Collateral requirements vary but may include accounts receivable, inventory, property, plant and equipment, residential real estate and commercial properties.
Standby and commercial letters of credit are conditional commitments to guarantee the performance of a customer to a third party. These guarantees are primarily issued to support public and private borrowing arrangements, including commercial paper, bond financing and similar transactions. The majority of these guarantees are short-term, one year or less; however, some guarantees extend for up to three years. The credit risk involved in issuing letters of credit is essentially the same as that involved in extending loan facilities to customers. Collateral requirements are the same as on-balance sheet instruments and commitments to extend credit.
There were no losses incurred on any commitments in 2007, while a $7,000 loss on one commitment was incurred in 2006.
Fair value estimates are generally subjective in nature and are dependent upon a number of significant assumptions associated with each instrument or group of similar instruments, including estimates of discount rates, risks associated with specific financial instruments, estimates of future cash flows and relevant available market information. Fair value information is intended to represent an estimate of an amount at which a financial instrument could be exchanged in a current transaction between a willing buyer and seller engaging in an exchange transaction. However, since there are no established trading markets for a significant portion of our financial instruments, we may not be able to immediately settle financial instruments; as such, the fair values are not necessarily indicative of the amounts that could be realized through immediate settlement. In addition, the majority of the financial instruments, such as loans and deposits, are held to maturity and are realized or paid according to the contractual agreement with the customer.
Quoted market prices are used to estimate fair values when available. However, due to the nature of the financial instruments, in many instances quoted market prices are not available. Accordingly, estimated fair values have been estimated based on other valuation techniques, such as discounting estimated future cash flows using a rate commensurate with the risks involved or other acceptable methods. Fair values are estimated without regard to any premium or discount that may result from concentrations of ownership of financial instruments, possible income tax ramifications or estimated transaction costs. The fair value estimates are subjective in nature and involve matters of significant judgment and, therefore, cannot be determined with precision. Fair values are also estimated at a specific point in time and are based on interest rates and other assumptions at that date. As events change the assumptions underlying these estimates, the fair values of financial instruments will change.
Disclosure of fair values is not required for certain items such as lease financing, investments accounted for under the equity method of accounting, obligations of pension and other postretirement benefits, premises and equipment, other real estate, prepaid expenses, the value of long-term relationships with depositors (core deposit intangibles) and other customer relationships, other intangible assets and income tax assets and liabilities. Fair value estimates are presented for existing on- and off-balance sheet financial instruments without attempting to estimate the value of anticipated future business and the value of assets and liabilities that are not considered financial instruments. In addition, the tax ramifications related to the realization of the unrealized gains and losses have not been considered in the estimates. Accordingly, the aggregate fair value amounts presented do not purport to represent and should not be considered representative of the underlying market or franchise value of the Company.
Because the standard permits many alternative calculation techniques and because numerous assumptions have been used to estimate the fair values, reasonable comparison of the fair value information with other financial institutions' fair value information cannot necessarily be made.
The methods and assumptions used to estimate the fair values of each class of financial instruments are as follows:
Cash and due from banks, interest-bearing deposits with banks, federal funds sold and federal funds purchased. These items are generally short-term in nature and,
accordingly, the carrying amounts reported in the Statements of Condition are reasonable approximations of their fair values.
Interest-bearing time deposits with banks. Time deposits are purchased from other financial institutions for investment purposes. Time deposits with banks do not have a
balance greater than $100,000. Interest earned is paid monthly and not reinvested as principal. The carrying amount of interest-bearing time deposits with banks approximates
its fair value.
Securities. Fair values are principally based on quoted market prices. If quoted market prices are not available, fair values are based on quoted market prices of comparable
instruments.
Loans Held for Sale. Fair values of mortgage loans held for sale are based on commitments on hand from investors or prevailing market prices.
Loans, net. The fair value of loans is estimated for segments of the loan portfolio with similar financial characteristics. For variable rate loans that re-price frequently with no
significant change in credit risk, the carrying amounts reported in the Statements of Condition are reasonable approximations of their fair values. The fair values of other types of
loans are estimated by discounting the future cash flows using interest rates that consider the credit and interest rate risks inherent in the loans, and current economic and
lending conditions.
The fair value of non-accrual loans is either estimated by discounting Management's estimate of future cash flows using a rate commensurate with the risks involved or
based upon recent internal or external appraisals.
Accrued interest receivable. The carrying amount of accrued interest receivable approximates its fair value.
Deposits. The fair values of deposits subject to immediate withdrawal such as interest and noninterest-bearing demand deposits and savings deposits are equal to their carrying
amounts. The carrying amounts for variable-rate time deposits and other time deposits approximate their fair values at the reporting date. Fair values for fixed-rate time deposits
are estimated by discounting future cash flows using interest rates currently offered on time deposits with similar remaining maturities.
Accrued interest payable. The carrying amount of accrued interest payable approximates its fair value.
Borrowings. The carrying amount of federal funds purchased and other short-term borrowings approximate their fair values. The fair value of the Company’s long-term
borrowings are estimated using discounted cash flow analysis based on the Company’s current incremental borrowing rates for similar types of borrowing arrangements.
Other unrecognized financial instruments. The fair value of commitments to extend credit is estimated using the fees charged to enter into similar legally binding agreements,
taking into account the remaining terms of the agreements and customers' credit ratings. For fixed-rate loan commitments, fair value also considers the difference between current
levels of interest rates and the committed rates. The fair values of letters of credit are based on fees charged for similar agreements or on estimated cost to terminate them or
otherwise settle the obligations with the counterparties at the reporting date. At December 31, 2007 and 2006 the fair value of guarantees under commercial and standby letters of
credit was immaterial.
The estimated fair values and carrying values of the financial instruments at December 31, 2007 and 2006 are presented in the following table:
| | | December 31, | |
| | | 2007 | | | 2006 | |
| | | | | | Estimated | | | | | | Estimated | |
| | | Carrying | | | Fair | | | Carrying | | | Fair | |
| | | Value | | | Value | | | Value | | | Value | |
| | | (in thousands) | |
| Assets | | | | | | | | | | | | |
| Cash and cash equivalents | | $ | 58,677 | | | $ | 58,677 | | | $ | 24,817 | | | $ | 24,817 | |
| Interest-bearing time deposits with banks | | | 2,188 | | | | 2,188 | | | | 2,188 | | | | 2,168 | |
| Securities, available for sale | | | 105,570 | | | | 105,570 | | | | 111,353 | | | | 111,353 | |
| Securities, held to maturity | | | 36,498 | | | | 36,206 | | | | 46,999 | | | | 45,614 | |
| Federal Home Loan Bank stock | | | 955 | | | | 955 | | | | 2,264 | | | | 2,264 | |
| Loans held for sale | | | 3,959 | | | | 3,959 | | | | 1,049 | | | | 1,049 | |
| Loans, net | | | 569,063 | | | | 566,616 | | | | 500,520 | | | | 478,719 | |
| Accrued interest receivable | | | 5,126 | | | | 5,126 | | | | 5,378 | | | | 5,378 | |
| | | | | | | | | | | | | | | | | |
| Liabilities | | | | | | | | | | | | | | | | |
| Deposits | | $ | 723,094 | | | $ | 720,744 | | | $ | 626,293 | | | $ | 626,139 | |
| Borrowings | | | 13,494 | | | | 13,491 | | | | 24,568 | | | | 24,587 | |
| Accrued interest payable | | | 2,956 | | | | 2,956 | | | | 3,070 | | | | 3,070 | |
A summary of the notional amounts of the financial instruments with off-balance sheet risk at December 31, 2007 and 2006 follows:
| | | December 31, | |
| | | 2007 | | | 2006 | |
| | | (in thousands) | |
| Financial instruments whose contract | | | | | | |
| amounts represent credit risk: | | | | | | |
| Commitments to extend credit | | $ | 92,342 | | | $ | 87,355 | |
| Commitments to grant loans | | | 56,998 | | | | 47,110 | |
| Standby letters of credit | | | 6,035 | | | | 2,515 | |
There is no material difference between the contract amount and the estimated fair value of off-balance sheet items that are primarily comprised of short-term unfunded loan commitments that are generally priced at market.
Note 20. Concentrations of Credit and Other Risks
Personal, commercial and residential loans are granted to customers, most of who reside in northern and southern areas of Louisiana. Although we have a diversified loan portfolio, significant portions of the loans are collateralized by real estate located in Tangipahoa Parish and surrounding parishes in southeast Louisiana. Declines in the Louisiana economy could result in lower real estate values which could, under certain circumstances, result in losses to the Company.
The distribution of commitments to extend credit approximates the distribution of loans outstanding. Commercial and standby letters of credit were granted primarily to commercial borrowers. Generally, credit is not extended in excess of $8.0 million to any single borrower or group of related borrowers.
A significant portion of the Company’s deposits (approximately 28.8%) is derived from local governmental agencies. These governmental depositing authorities are generally long-term customers. A number of the depositing authorities are under contractual obligation to maintain their operating funds exclusively with us. In most cases, we are required to pledge securities or letters of credit issued by the Federal Home Loan Bank to the depositing authorities to collateralize their deposits. Under certain circumstances, the withdrawal of all of, or a significant portion of, the deposits of one or more of the depositing authorities may result in a temporary reduction in liquidity, depending primarily on the maturities and/or classifications of the securities pledged against such deposits and the ability to replace such deposits with either new deposits or other borrowings.
Note 21. Litigation
The Company is subject to various legal proceedings in the normal course of its business. It is Management’s belief that the ultimate resolution of such claims will not have a material adverse effect on the Company’s financial position or results of operations.
Note 22. Commitments and Contingencies
In the ordinary course of business, various outstanding commitments and contingent liabilities arise that are not reflected in the accompanying financial statements. Included among these contingent liabilities are certain provisions in agreements, entered into with outside third parties, to sell loans that we that may require us to repurchase a loan if it becomes delinquent within a specified period of time.
Note 23. Condensed Parent Company Information
The following condensed financial information reflects the accounts and transactions of First Guaranty Bancshares, Inc. (parent company only) for the dates indicated:
| First Guaranty Bancshares, Inc. | |
| Condensed Balance Sheet | |
| (in thousands) | |
| | | | |
| | | December 31, | |
| | | 2007 | |
| Assets | | | |
| Cash | | $ | 49 | |
| Investment in bank subsidiary | | | 69,008 | |
| Other assets | | | 623 | |
| Total Assets | | $ | 69,680 | |
| | | | | |
| Liabilities and Stockholders' Equity | | | | |
| Junior subordinated debentures | | $ | 3,093 | |
| Other liabilities | | | 54 | |
| Stockholders' Equity | | | 66,533 | |
| Total liabilities and stockholders' equity | | $ | 69,680 | |
| | | | | |
| First Guaranty Bancshares, Inc. | |
| Condensed Statement of Income | |
| (in thousands) | |
| | | | |
| | | For the Period Ended | |
| | | December 31, 2007 | |
| Operating Income | | | |
| Dividends received from bank subsidiaries | | $ | 19,630 | |
| Other income | | | 4 | |
| Total operating income | | | 19,634 | |
| | | | | |
| Operating Expenses | | | | |
| Interest expense | | | 233 | |
| Other expenses | | | 448 | |
| Total operating expenses | | | 681 | |
| | | | | |
| Income before income tax expense and increase in equity in undistributed | | | | |
| earnings of subsidiaries | | | 18,953 | |
| Income tax benefit | | | 220 | |
| Income before increase in equity in undistributed earnings of subdisiaries | | | 19,173 | |
| Decrease in equity in undistributed earnings of subsidiaries | | | (15,222 | ) |
| Net Income | | $ | 3,951 | |
| | | | | |
| First Guaranty Bancshares, Inc. | |
| Condensed Statement of Cash Flows | |
| (in thousands) | |
| | | Year Ended | |
| | | December 31, 2007 | |
| Cash Flows From Operating Activities | | | |
| Net income | | $ | 3,951 | |
| Adjustments to reconcile net income to net cash | | | | |
| provided by operating activities: | | | | |
| Equity in undistributed (earnings) losses of subsidiaries | | | 15,222 | |
| Net change in other liabilities | | | (17 | ) |
| Net change in other assets | | | (49 | ) |
| Net Cash Provided By Operating Activities | | | 19,107 | |
| | | | | |
| Cash Flows From Investing Activities | | | | |
| Payments for investments in and advances to subsidiaries | | | (5,489 | ) |
| Cash paid in excess of cash received in acquisition | | | (11,790 | ) |
| Net Cash Used in Investing Activities | | | (17,279 | ) |
| | | | | |
| Cash Flows From Financing Activities | | | | |
| Proceeds from purchased funds and other short-term borrowings | | | 17,640 | |
| Repayments of purchased funds and other short-term borrowings | | | (17,640 | ) |
| Dividends paid | | | (1,779 | ) |
| Net Cash Used In Financing Activities | | | (1,779 | ) |
| | | | | |
| Net Increase In Cash and Cash Equivalents | | | 49 | |
| Cash and Cash Equivalents at the Beginning of the Period | | | - | |
| Cash and Cash Equivalents at the End of the Period | | $ | 49 | |
| | | | | |
Item 9 - Changes in and Disagreements with Accountants on Accounting and Financial Disclosure There were no changes in or disagreements with accountants on accounting and financial disclosures for the year ended December 31, 2007
Evaluation of Disclosure Controls and Procedures
As defined by the Securities and Exchange Commission in Exchange Act Rules 13a-14(c) and 15d-14(c), a company’s “disclosure controls and procedures” means controls and other procedures of an issuer that are designed to ensure that information required to be disclosed by the issuer in the reports that it files or submits under the Exchange Act is recorded, processed, summarized and reported, within time periods specified in the Commission’s rules and forms. The Company maintains such controls designed to ensure this material information is communicated to Management, including the Chief Executive officer (“CEO”) and Chief Financial Officer (“CFO”), as appropriate, to allow timely decision regarding required disclosure.
Management, with the participation of the CEO and CFO, have evaluated the effectiveness of our disclosure controls and procedures as of the end of the period covered by this annual report on Form 10-K. Based on that evaluation, the CEO and CFO have concluded that the disclosure controls and procedures as of the end of the period covered by this annual report are effective. There were no changes in the Company’s internal control over financial reporting during the last fiscal quarter in the period covered by this annual report that have materially affected, or are reasonably likely to materially affect, the Company’s internal control over financial reporting.
This annual report does not include a report of management's assessment regarding internal control over financial reporting or an attestation report of the company's registered public accounting firm due to a transition period established by rules of the Securities and Exchange Commission for newly public companies. First Guaranty Bancshares, Inc. first registered its common stock with the Securities and Exhange Commission under the Securities Exchange Act of 1934, as amended on July 27, 2007.
None
Part III
Pursuant to General Instruction G (3), information on directors and executive officers of the Registrant will be incorporated by reference from the Company’s 2008 Definitive Proxy Statement.
Pursuant to General Instruction G (3), information on directors and executive officers of the Registrant will be incorporated by reference from the Company’s 2008 Definitive Proxy Statement.
Pursuant to General Instruction G (3), information on directors and executive officers of the Registrant will be incorporated by reference from the Company’s 2008 Definitive Proxy Statement.
Pursuant to General Instruction G (3), information on directors and executive officers of the Registrant will be incorporated by reference from the Company’s 2008 Definitive Proxy Statement.
Pursuant to General Instruction G (3), information on directors and executive officers of the Registrant will be incorporated by reference from the Company’s 2008 Definitive Proxy Statement.
Part IV
| (a) | 1 | Consolidated Financial Statements | |
| | | | |
| | | Item | Page |
| | | First Guaranty Bancshares, Inc. and Subsidiary | |
| | | Report of Independent Registered Accounting Firm | 38 |
| | | Consolidated Balance Sheets - December 31, 2007 and 2006 | 39 |
| | | Consolidated Statements of Income - Years Ended December 31, 2007, 2006 and 2005 | 40 |
| | | Consolidated Statements of Changes in Stockholders’ Equity - December 31, 2007, 2006 and 2005 | 41 |
| | | Consolidated Statements of Cash Flows - Years Ended December 31, 2007, 2006 and 2005 | 42 |
| | | Notes to Consolidated Financial Statements | 43 |
| | | | |
| | 2. | Consolidated Financial Statement Schedules | |
| | | All schedules to the consolidated financial statements of First Guaranty Bancshares, Inc. and its subsidiaries have been omitted because they are not required under the related instructions or are inapplicable, or because the required information has been provided in the consolidated financial statements or the notes thereto. | |
| | | | |
| | 3 | Exhibits | |
| | | | |
| | | The exhibits required by Regulation S-K are set forth in the following list and are filed either by incorporation by reference from previous filings with the Securities and Exchange Commission or by attachment to this Annual Report on Form 10-K as indicated below. | |
Exhibit Number | | Exhibit | |
| | | | |
| 2 | | Agreement and Plan of Reorganization between First Guaranty Bancshares, Inc. and First Community Holding Company dated November 2, 2007 (filed as Exhibit 2.1 on the Company’s Form 8-K dated November 8, 2007 and incorporated herein by reference). | |
| 2.1 | | Agreement and Plan of Exchange dated July 27, 2007 between First Guaranty Bancshares, Inc and First Guaranty Bank (filed as Exhibit 2 on Form 8-K12G3 dated August 2, 2007 and incorporated herein by reference). | |
| 3.1 | | Restatement of Articles of Incorporation of First Guaranty Bancshares, Inc. dated July 27, 2007 (filed as Exhibit 3.1 on Form 8-K12G3 dated August 2, 2007 and incorporated herein by reference). | |
| 3.2 | | Bylaws of First Guaranty Bancshares, Inc. dated January 4, 2007 (filed as Exhibit 3.2 on Form 8-K12G3 dated August 2, 2007 and incorporated herein by reference). | |
| 3.3 | | Amendment to Bylaws of First Guaranty Bancshares, Inc. dated May 17, 2007 (filed as Exhibit 3.3 on Form 8-K12G3 dated August 2, 2007 and incorporated herein by reference). | |
| 4 | | Specimen stock certificate for common stock off First Guaranty Bancshares, Inc. (filed as Exhibit 3.3 on Form 8-K12G3 dated August 2, 2007 and incorporated herein by reference). | |
| 10.1 | | First Guaranty Bank Employee Stock Ownership Plan (effective January 1, 2003) (filed as Exhibit 10.1 on Form 8-K12G3 dated August 2, 2007 and incorporated herein by reference). | |
| 10.2 | | Amendment Number One to the First Guaranty Bank Employee Stock Ownership Plan (effective January 1, 2003) (filed as Exhibit 10.2 on Form 8-K12G3 dated August 2, 2007 and incorporated herein by reference). | |
| 10.3 | | Amendment Number Two to the First Guaranty Bank Employee Stock Ownership Plan (effective January 1, 2003) (filed as Exhibit 10.3 on Form 8-K12G3 dated August 2, 2007 and incorporated herein by reference). | |
| 10.4 | | Amendment Number Three to the First Guaranty Bank Employee Stock Ownership Plan (effective January 1, 2003) (filed as Exhibit 10.3 on Form 8-K12G3 dated August 2, 2007 and incorporated herein by reference). | |
| 10.5 | | Employment Agreement and Ancillary Confidentiality and Non-Competition Agreement by and between Reggie H. Harper and First Guaranty Bank, and Employment Agreement and Ancillary Confidentiality and Non-Competition Agreement by and between Cordell H. White and First Guaranty Bank dated November 2, 2007 (filed as Exhibit 10.1 on the Company’s Form 8-K dated November 8, 2007 and incorporated herein by reference). | |
| 11 | | Statement Regarding Computation of Earnings Per Share | |
| 12 | | Statement Regarding Computation of Ratios | |
| 14.1 | | First Guaranty Bancshares, Inc. and Subsidiary Code Of Conduct And Ethics For Employees, Officers And Directors dated January 25, 2008 (filed as Exhibit 14.1 on the Company’s Form 8-K dated January 31, 2008 and incorporated herein by reference). | |
| 14.2 | | First Guaranty Bancshares, Inc. Code Of Ethics For Senior Financial Officers dated January 25, 2008 (filed as Exhibit 14.2 on the Company’s Form 8-K dated January 31, 2008 and incorporated herein by reference). | |
| 21 | | Subsidiaries of the First Guaranty Bancshares, Inc. (filed as Exhibit 21 on the Company’s Form 8-K dated November 8, 2007 and incorporated herein by reference). | |
| 31 | | Section 906 Certification of the Sarbanes-Oxley Act | |
| 32 | | Section 302 Certification of the Sarbanes-Oxley Act | |
| | | |
| (c) | There are no other financial statements and financial statement schedules which were excluded from Item 8, which are required to be included herein. | |
SIGNATURES
Pursuant to the requirements of Section 13 or 15(d) of the Securities Exchange Act of 1934, the Bank has duly caused this report to be signed on its behalf by the undersigned, thereunto duly authorized.
FIRST GUARANTY BANCSHARES, INC.
Dated: March 31, 2008
Pursuant to the requirements of the Securities and Exchange Act of 1934, this report has been signed below by the following persons on behalf of the Company and in the capacities and on the dates indicated.
/s/ Michael R. Sharp Michael R. Sharp | President and Chief Executive Officer | March 31, 2008 |
| | | |
| | | |
/s/ Michele E. LoBianco Michele E. LoBianco | Chief Financial Officer, Secretary and Treasurer | March 31, 2008 |
| | | |
| | | |
/s/Marshall T. Reynolds Marshall T. Reynolds | Chairman of the Board | March 31, 2008 | |
| | | |
| | | |
/s/ William K. Hood William K. Hood | Director | March 31, 2008 |
| | | |
| | | | |
/s/ Alton B. Lewis Alton B. Lewis | Director | March 31, 2008 | |
| | | | |