UNITED STATES
SECURITIES AND EXCHANGE COMMISSION
Washington, D.C. 20549
FORM N-CSR
CERTIFIED SHAREHOLDER REPORT OF
REGISTERED MANAGEMENT INVESTMENT COMPANIES
| Investment Company Act file number: | 811-22132 |
| Exact name of registrant as specified in charter: | Aberdeen Funds |
| Address of principal executive offices: | 1900 Market Street, Suite 200 |
| Philadelphia, PA 19103 | |
| Name and address of agent for service: | Ms. Andrea Melia |
| abrdn Inc. | |
| 1900 Market Street, Suite 200 | |
| Philadelphia, PA 19103 | |
| Registrant’s telephone number, including area code: | 866-667-9231 |
| Date of fiscal year end: | October 31 |
| Date of reporting period: | October 31, 2021 |
Item 1. Reports to Shareholders.
Aberdeen Funds
Equity Series
Annual Report
October 31, 2021
Aberdeen China A Share Equity Fund
Class A – GOPAX ■ Class C – GOPCX ■ Class R – GOPRX ■ Institutional Class – GOPIX ■ Institutional Service Class – GOPSX
Aberdeen Dynamic Dividend Fund
Class A – ADAVX ■ Institutional Class – ADVDX
Aberdeen Emerging Markets Fund
Class A – GEGAX ■ Class C – GEGCX ■ Class R – GEMRX ■ Institutional Class – ABEMX ■ Institutional Service Class – AEMSX
Aberdeen Emerging Markets Sustainable Leaders Fund (formerly, Aberdeen International Equity Fund)
Class A – GIGAX ■ Class C – GIGCX ■ Class R – GIRRX ■ Institutional Class – GIGIX ■ Institutional Service Class – GIGSX
Aberdeen Global Equity Fund
Class A – GLLAX ■ Class C – GLLCX ■ Class R – GWLRX ■ Institutional Class – GWLIX ■ Institutional Service Class – GLLSX
Aberdeen Global Infrastructure Fund
Class A – AIAFX ■ Institutional Class – AIFRX
Aberdeen International Real Estate Equity Fund
Class A – EGALX ■ Institutional Class – EGLRX
Aberdeen International Small Cap Fund
Class A – WVCCX ■ Class C – CPVCX ■ Class R – WPVAX ■ Institutional Class – ABNIX
Aberdeen Realty Income & Growth Fund
Class A – AIAGX ■ Institutional Class – AIGYX
Aberdeen U.S. Small Cap Equity Fund
Class A – GSXAX ■ Class C – GSXCX ■ Class R – GNSRX ■ Institutional Class – GSCIX ■ Institutional Service Class – GSXIX
Aberdeen U.S. Sustainable Leaders Fund (formerly, Aberdeen U.S. Multi-Cap Equity Fund)
Class A – GXXAX ■ Class C – GXXCX ■ Institutional Class – GGLIX ■ Institutional Service Class – GXXIX
Aberdeen U.S. Sustainable Leaders Smaller Companies Fund (formerly, Aberdeen Focused U.S. Equity Fund)
Class A – MLSAX ■ Class C – MLSCX ■ Class R – GLSRX ■ Institutional Class – GGUIX ■ Institutional Service Class – AELSX

Table of Contents
| Market Review | Page 1 |
| Aberdeen China A Share Equity Fund | Page 3 |
| Aberdeen Dynamic Dividend Fund | Page 9 |
| Aberdeen Emerging Markets Fund | Page 16 |
| Aberdeen Emerging Markets Sustainable Leaders Fund | Page 22 |
| Aberdeen Global Equity Fund | Page 29 |
| Aberdeen Global Infrastructure Fund | Page 35 |
| Aberdeen International Real Estate Equity Fund | Page 41 |
| Aberdeen International Small Cap Fund | Page 47 |
| Aberdeen Realty Income & Growth Fund | Page 53 |
| Aberdeen U.S. Small Cap Equity Fund | Page 58 |
| Aberdeen U.S. Sustainable Leaders Fund | Page 64 |
| Aberdeen U.S. Sustainable Leaders Smaller Companies Fund | Page 70 |
| Financial Statements | Page 76 |
| Notes to Financial Statements | Page 121 |
| Report of Independent Registered Public Accounting Firm | Page 144 |
| Other Tax Information | Page 145 |
| Shareholder Expense Examples | Page 147 |
| Supplemental Information | Page 149 |
| Liquidity Risk Management Program | Page 152 |
| Management of the Funds | Page 153 |
Investors should carefully consider a fund's investment objectives, risks, fees, charges and expenses before investing any money. To obtain this and other fund information, please call 866-667-9231 to request a prospectus, or download a prospectus at https://www.abrdn.com/en-us/us/investor/fund-centre#literature. Please read it carefully before investing any money.
Investing in mutual funds involves risk, including possible loss of principal.
Aberdeen Funds is distributed by Aberdeen Fund Distributors LLC, Member FINRA, 1900 Market Street, Suite 200, Philadelphia, PA 19103.
Aberdeen Standard Investments Inc. (ASII) has been registered as an investment adviser under the Investment Advisers Act of 1940 since August 23, 1995.
The complete schedule of portfolio holdings for each fund of Aberdeen Funds (each a "Fund" and collectively, the "Funds") is included in the Funds' semi-annual and annual reports to shareholders. Aberdeen Funds also files complete schedules of portfolio holdings for each Fund with the Securities and Exchange Commission (the "Commission") for the first and third quarters of each fiscal year as an exhibit to its reports on Form N-PORT. The Funds' Form N-PORT filings are available on the Commission's website at http://www.sec.gov and the Funds make the information on the exhibit to Form N-PORT available to shareholders upon request without charge by calling 1-866-667-9231.
Statement Regarding Availability of Proxy Voting Record.
Information regarding the policies and procedures that the Funds use to determine how to vote proxies relating to portfolio securities is available without charge, upon request, by calling 1-866-667-9231. The information is also included in the Funds' Statement of Additional Information, which is available on the Funds' website at https://www.abrdn.com/en-us/us/investor/fund-centre#literature and on the Commission's website at www.sec.gov.
Information relating to how each Fund voted proxies relating to portfolio securities held during the most recent twelve months ended June 30 is available by August 30 of the relevant year: (i) upon request and without charge by calling 1-866-667-9231; and (ii) on the Commission's website at www.sec.gov.
abrdn
abrdn plc, formerly known as Standard Life Aberdeen plc, was renamed on September 27, 2021. In connection with this re-branding, the entities within abrdn plc group, including investment advisory entities, have been or will be renamed in the near future. In addition, the fund names are anticipated to be re-branded over the next year.
Market Review
Global financial markets mainly recorded positive returns despite bouts of significant volatility over the 12-month reporting period ended October 31, 2021. Global developed-market equities, as represented by the MSCI AC World Index,1 returned 37.3% for the period. Supportive monetary and fiscal policies were prevalent over the period. The U.S. Federal Reserve (Fed) maintained the federal funds rate at near 0% throughout the reporting period, while providing support through its bond-buying program. Elsewhere, the European Central Bank ramped up its original €1.35 trillion (US$1.57 trillion) stimulus plan to €1.85 trillion (US$2.15 trillion) in December 2020. The U.S. Congress passed two additional stimulus packages during the reporting period, with a cumulative total of roughly $2.8 trillion. In August 2021, the U.S. Senate passed the $1 trillion infrastructure deal.
At the beginning of the reporting period in November 2020, news of three major COVID-19 vaccines buoyed investor sentiment. This persisted through to the end of 2020 due to the launch of vaccination programs, the approval of stimulus packages, and the UK and the European Union reaching a Brexit trade deal.
Momentum stalled in January and February 2021, as global bond markets experienced a significant selloff, spurring worries that this could impact the fragile global recovery. The downturn in bond markets also had a negative impact on equities. However, stock markets resumed their upward momentum, driven by economic optimism, vaccine rollouts, central banks' continued accommodative monetary policies, and a strong corporate earnings reporting season. The MSCI AC World Index reached a record high in August 2021, but sold off in September amid investors' growing concerns over inflation and possible interest-rate hikes from central banks. Uneasiness about the global economy led to a selloff across most equity markets across the globe. In October 2021, upbeat company results, along with comments that demand remained strong, eased investors' concerns about stagflation,* supply-chain pressures, spiraling energy prices and higher interest rates.
Emerging-market (EM) equities posted notable gains over the reporting period, with the exception of China. The MSCI Emerging Markets Index2 returned 17.0% for the period. Stock prices initially rallied on investors' optimism regarding the COVID-19 vaccine rollout, which allowed the reopening of economies worldwide. Upbeat corporate earnings, driven by an e-commerce boom, a multi-year technology upgrading cycle and pent-up infrastructure demand also bolstered investor sentiment. Increasing adoption of climate-change goals by governments globally also fueled interest in clean-energy themes. These positive factors outweighed investors' concerns over supply-chain disruptions caused by a shortage of semiconductors, shipping gridlocks, and an energy crunch. However, the spread of the more contagious Delta variant of coronavirus capped the stock market gains in some EM economies due to their relatively slower vaccine rollouts.
In the global fixed-income markets, government bond prices moved lower during the reporting period, with the ICE bank of America (BofA) Global Government Index3 returning –2.5%. Lockdown restrictions heightened investors' fears of a deep recession, with the
"risk-off" environment boosting government bond prices as investors fled to their perceived safety. However, rising optimism about vaccines and concerns that an economic recovery would fuel sharp rises in inflation led to a drop in government bond prices. Bond prices continued to decline later in the reporting period as expectations of a withdrawal of support from central banks globally, along with inflation fears, triggered a selloff. Corporate bonds, as measured by the ICE BofA Corporate Index, returned 2.1% for the reporting period as government monetary and fiscal stimuli measures and rising investor optimism helped bolster the corporate fixed-income markets. However, corporate bond prices subsequently fell modestly as investors' fears of forthcoming central bank action increased. The global high-yield fixed income market, as represented by the ICE BofA Global High Yield Constrained Index,4 performed well over the reporting period, returning 8.9%, as the COVID-19 vaccine rollout and resulting economic reopening and reflation narrative bolstered risk assets throughout the first half of 2021. However, the high-yield market's performance was tempered towards the end of the summer of 2021, as it became increasingly evident that supply-side pressures were building, perhaps unsurprisingly after entire economies and industries had been shut down and were reopening.
The global real estate market performed relatively well during the reporting period. The Financial Times Stock Exchange European Public Real Estate Association/National Association of Real Estate Investment Trusts (FTSE EPRA/NAREIT) Global ex U.S. Index5 and the FTSE EPRA NAREIT U.S. Index6 returned 23.4% and 53.5%, respectively, over the period. Real estate investment trusts (REITs) typically are more resistant to inflationary pressures due to the ability to raise rents, offset the impact of rising interest rates. While the overall performance of the REIT market was very robust during the reporting period, there was a wide disparity in returns. Those sectors that had materially underperformed in 2020 because their tenants were at the epicenter of the COVID-19-induced lockdowns (i.e., retail and urban apartments), posted extremely strong gains as economic activity rebounded and investors sought value-oriented sectors exposed to the reopening. Meanwhile, those "safe-haven" sectors where cash flows held up during the pandemic but were trading at elevated price/earnings multiples,7 such as data centers and cell towers, underperformed as investors rotated into more value-oriented sectors. Additionally, as the reporting period progressed, the industrial and storage sectors, which had garnered accelerating earnings growth and true pricing power in the form of rising rents, also were strong outperformers.
Outlook
When bond yields rally, investors tend to take profits and sell highly valued companies. Time will tell whether this proves shortsighted this time around. From our conversations with various industry participants, it appears that some of the supply bottlenecks emanating from manufacturing hubs such as Vietnam, Thailand and Malaysia are now easing. Some raw material costs, noticeably metals, are also decreasing. This is due to a mix of government price caps and a slowdown in demand. It is worth noting that China's manufacturing
2021 Annual Report 1
Market Review (concluded)
purchasing managers' index for September recorded a reading of 49.6, a marginal contraction from the previous month.
From our perspective, the most recent corporate earnings reports generally were positive, indicating that most companies have been successful in passing through higher costs. While this is a positive factor for fixed-income securities in the short term, we think that it is emblematic of the inflationary environment that currently exists. Over the longer term, if inflation remains high, central banks globally most likely will need to act more decisively, risking a slowdown in global economic growth. Therefore, we think that the market may be especially sensitive to economic data over the next several months as investors look to divine the direction of inflation and growth, while simultaneously gauging the reaction function of central bankers. Overall, we believe that the credit fundamentals of the market are solid, and we anticipate that companies will be well-positioned to weather modestly slower growth, keeping default rates relatively low.
In the U.S. and Western Europe, we are waiting to see the effect of the withdrawal of government support schemes on labor participation. These factors suggest that, as we head towards the end of the year, pressure on the supply chain could start to moderate. Overall, we think that the performance of equity markets may be tempered by gradual monetary policy normalisation and the potential impact of increased taxation.
COVID-19
Beginning in the first quarter of 2020, the illness caused by a novel coronavirus, COVID-19, has resulted in a global pandemic and major disruption to economies and markets around the world, including the United States. Financial markets have experienced extreme volatility and severe losses. Some sectors of the economy and individual issuers have experienced particularly large losses. These circumstances may continue for an extended period of time, and as a result may affect adversely the value and liquidity of the Fund's investments. The rapid
development and fluidity of this situation precludes any prediction as to the ultimate adverse impact of COVID-19 on economic and market conditions, and, as a result, present uncertainty and risk with respect to the Fund and the performance of its investments and ability to pay distributions. The full extent of the impact and effects of COVID-19 will depend on future developments, including, among other factors, the duration and spread of the outbreak, along with related travel advisories, quarantines and restrictions, the recovery time of the disrupted supply chains and industries, the impact of labor market interruptions, the impact of government interventions, and uncertainty with respect to the duration of the global economic slowdown.
abrdn
| 1 | The MSCI AC World Index is an unmanaged index considered representative of stock markets of developed and emerging markets. Indexes are unmanaged and have been provided for comparison purposes only. No fees or expenses are reflected. You cannot invest directly in an index. |
| 2 | The MSCI Emerging Markets Index is an unmanaged index considered representative of stocks of developing countries. |
| 3 | The ICE BofA Global Government Index tracks the performance of investment-grade sovereign debt publicly issued and denominated in the issuer's own domestic market and currency. |
| 4 | The ICE BofA Global High Yield Constrained Index tracks the performance of U.S. dollar-, Canadian dollar-, British pound- and euro-denominated below-investment-grade corporate debt publicly issued in the major domestic or eurobond markets. |
| 5 | The FTSE EPRA/NAREIT Global ex U.S. Index is an unmanaged index considered representative of real estate companies and REITs outside the U.S. |
| 6 | The FTSE EPRA NAREIT U.S. Index is a free-float adjusted, market capitalization-weighted index of U.S. equity REITs. |
| 7 | A price/earnings multiple is calculated by dividing the current market price of a stock by the earnings per share. Price/earnings multiples often are used to compare companies in the same industry, or to assess the historical performance of an individual company. |
2 2021 Annual Report
Aberdeen China A Share Equity Fund (Unaudited)
Aberdeen China A Share Equity Fund (Institutional Class shares net of fees) returned 13.33% for the 12-month reporting period ended October 31, 2021, versus the 16.66% return of its benchmark, the Morgan Stanley Capital International (MSCI) China A Onshore Index (net dividends), over the same period.
Market/Economic Review
Chinese equities posted gains over the 12-month period ended October 31, 2021. Healthy economic data and the rapid recovery of corporate earnings in the market initially supported share prices. Investors cheered the COVID-19 vaccine rollout globally and drove a rotation out of higher-quality stocks, which had performed well amid the pandemic, into cyclical and undervalued sectors. However, as the reporting period progressed, expectations of tighter monetary policy to control inflation and excessive debt, new government regulations and a potential debt default by property developer China Evergrande Group (which the Fund did not hold as of the end of the reporting period) weighed on China's equity markets.
Throughout the reporting period, China's central bank, the People's Bank of China, maintained its accommodative monetary policy and prioritized its focus on consumer spending and investment over rising inflation. However, the tougher regulatory environment capped gains as the Chinese government stepped up scrutiny of the country's internet and education sector, alongside the tightening of regulations for the real estate and banking sectors. The Chinese Communist Party marked the centennial of its founding on July 1, 2021, with President Xi Jinping warning that China would not tolerate any sovereignty infringements. U.S.-China relations remained tense, reflecting continuing issues around trade, competition in the technology space, as well as their respective geopolitical interests.
In mid-2021, China's equity markets became turbulent, characterized by frenetic and unexpected regulatory intervention focusing on the technology sector. This later spread to other areas, including media and entertainment, with threats of further regulatory action at one point decreasing the market value of Chinese stocks by up to US$500 billion. This occurred as part of a broader government crackdown and determination to regain control of the economy and reduce the wealth gap in an effort to create "common prosperity." In September 2021, the volatility and uncertainty triggered investors' concerns about debt-ridden China Evergrande Group, one of China's largest property developers. Swift action by the People's Bank of China averted a collapse of the company on fears that it would miss a scheduled debt repayment. Chinese A-share equity prices rebounded at the end of the reporting period in October 2021 despite new outbreaks of COVID-19, which led to the government reimposing lockdowns in several regions of the country.
Fund Performance Review
The Fund's underperformance relative to its benchmark, the MSCI China A Onshore Index, over the 12-month reporting period was
attributable to negative overall asset allocation. Conversely, stock selection had a positive impact on Fund performance.
Overweight allocations versus the benchmark to the consumer staples and industrials sectors weighed on Fund performance for the reporting period. The largest individual stock detractor was pharmaceutical company Jiangsu Hengrui Medicine Co., Ltd.
The Fund's underweight positioning in the materials sector was the primary detractor from the relative performance for the reporting period. However, the Fund's holding in Yunnan Energy New Material Co. Ltd., a manufacturer of lithium-ion battery separators, contributed positively to performance. The company benefited from a supply shortage and raised its earnings expectations for the second quarter of its 2021 fiscal year, due to an increase in demand, continued capacity growth and operational efficiency.
An underweight allocation to the financials sector hampered Fund performance during the reporting period. The position in Ping An Insurance hampered Fund performance as the insurance company's stock price moved lower due to concerns within the life insurance industry and about the firm's exposure to China's real estate sector. The Fund's holding in electrical appliance manufacturer Midea Group Co. Ltd. also detracted from performance after its shares declined amid a tighter credit stance and weaker-than-expected retail data.
Overweight positions in the healthcare and consumer discretionary sectors bolstered the Fund's relative performance over the reporting period. Specifically, the shares of China Tourism Group Duty Free Corporation Ltd., which sells duty-free goods,* moved higher doing the reporting period due the Chinese government's favorable tax-policy changes.
In the healthcare sector, Chinese companies' increasing research and development spending in drug research benefited the Fund's holding in contract research organization Hangzhou Tigermed Consulting Co. Ltd. Aier Eye Hospital Group Co. Ltd. posted rapid earnings growth over the reporting period amid greater demand for eyecare due to work-from-home lifestyles, while its hospital network expanded to more cities in China.
The holding in Nari Technology Co. Ltd., which develops and manufactures power-grid automation and industrial control products, benefited from an upgrade of a massive electricity grid covering about 90% of the country by its state-owned parent, State Grid Corp. of China. We like Nari Technology's leading position in secondary power equipment and software given China's ambitions in renewable energy. We believe that its growth areas include charging infrastructure for new energy vehicles, power trading and global energy internet.
During the reporting period, we initiated several holdings in companies that we believe are positioned to benefit from China's drive for carbon neutrality, including solar wafer manufacturer Longi Green Energy Technology Co. and lithium-ion battery maker Contemporary Amperex Technology Co., Ltd. We also established new positions in pharmaceutical company Jiangsu Hengrui Medicine Co., Ltd., Apple AirPods assembler Luxshare Precision Industry Co. Ltd. and
* Consumers are able to purchase duty-free goods in particular circumstances without paying import, sales, value-added, or other taxes.
2021 Annual Report 3
Aberdeen China A Share Equity Fund (Unaudited) (concluded)
China International Capital Corp. Ltd., China's largest investment bank.
Additionally, we initiated holdings in enterprise software company Yonyou Network Co. Ltd., Hundsun Technologies Inc, a provider of software products and services and financial data for financial institutions, and By-health Co. Ltd., a distributor of nutrition supplements. In our view, these companies have clear competitive advantages, which we believe will enable them to defend their market leadership over the long term. We also purchased shares of Shenzhen Inovance Technology Co. Ltd., and Sungrow Power Supply Co. Ltd. over the reporting period. Shenzhen Inovance is a leader in China's industrial automation sector with a strong track record, competitive products, diversified revenue streams and cost advantage underpinned by effective supply-chain management. We believe that Sungrow Power Supply is well-positioned to benefit from multi-year growth in demand for solar energy, as the company is a leading producer of solar inverters and a solar energy performance certificate farm operator, as well as energy storage.
During the reporting period, we exited the Fund's positions in Hangzhou Hikvision Digital Technology Co. Ltd., a provider of video surveillance systems, pharmaceutical firm China Resources Sanjiu Medical & Pharmaceutical Co. Ltd.; electrical appliances manufacturers Hangzhou Robam Appliances Company Ltd. and Haier Smart Home Co. Ltd.; financial services companies China Construction Bank Corp. and Industrial and Commercial Bank of China; supermarket chain operator Yonghui Superstores Co. Ltd.; airport operator Shenzhen Airport Co. Ltd.; and China Life Insurance Co. Ltd.
Outlook
The Chinese government's imposition of regulatory measures on numerous segments of the economy – including education, technology, real estate and gaming – came as a surprise to investors. However, we don't think that this is the end of capitalism in China; we believe that these changes should be seen in the context of a fast-changing technology landscape. Regulators are trying to keep pace with innovation, but in our view, a heavy-handed clamp down on all private new-economy sectors is unlikely. The new economy is a vital component of China's vision for a modern consumption-led economy. Furthermore, the private sector retains a critical role in ensuring that the Chinese economy continues to innovate and prosper, and that the government reaches its goal of being a moderately prosperous nation by 2035. We think that China still needs well-functioning capital markets to help propel growth.
We feel that investors overreacted to the regulatory measures and that the indiscriminate selling will create investment opportunities. In our view, companies that can adapt to changing regulatory frameworks and align with policy objectives such as digital innovation, green technology, access to affordable healthcare and improved welfare, have a bright outlook. Moreover, we think that investors are likely to refocus on company-specific factors in the
upcoming corporate earnings-reporting seasons, which we believe should benefit the Fund's high-quality company holdings.
Portfolio Management:
Asian Equity Team
PAST PERFORMANCE DOES NOT GUARANTEE FUTURE RESULTS.
The performance data quoted represents past performance and current returns may be lower or higher. Class A Shares have up to a 5.75% front-end sales charge and a 0.25% 12b-1 fee. The investment return and principal value will fluctuate so that an investor's shares, when redeemed, may be worth more or less than the original cost. To obtain performance information current to the most recent month-end, which may be higher or lower than the performance shown above, please call 866-667-9231 or go to https://www.abrdn.com/en-us/us/investor/fund-centre.
Investing in mutual funds involves risk, including the possible loss of principal.
Indexes are unmanaged and have been provided for comparison purposes only. No fees or expenses are reflected. You cannot invest directly in an index.
Risk Considerations
Deteriorating market conditions might cause a general weakness in the market that reduces the prices, or yield, of securities in those markets in which the Fund invests.
The value of a security may decline for reasons directly related to the issuer, such as management performance, financial leverage and reduced demand for the issuer's goods or services.
The stock or other security of a company may not perform as well as expected, and may decrease in value, because of factors related to the company, to the industry in which the company is engaged, or to the market as a whole.
The Fund is subject to the risk that the Adviser or Subadviser may make poor security selections.
Foreign securities are more volatile, harder to price and less liquid than U.S. securities. They are subject to different accounting and regulatory standards, and currency exchange rate, political and economic risks. The Fund focuses its investments in China and Hong Kong, which may subject the Fund to more volatility and greater risk of loss than geographically diverse mutual funds. Additional risks associated with investments in China and Hong Kong include exposure to currency fluctuations, less liquidity, expropriation, confiscatory taxation, nationalization, exchange control regulations (including currency blockage), trading halts, imposition of tariffs, limitations on repatriation and differing legal standards. Trading in China A Shares through Stock Connect and the QFII Programs involves additional risks.
The risks that apply to foreign investments are greater for securities of companies in emerging market countries because the countries may have less stable governments, more volatile currencies and less established markets.
Please read the prospectus for more detailed information regarding these and other risks.
4 2021 Annual Report
Aberdeen China A Share Equity Fund (Unaudited)
| Average Annual Total Return1 (For periods ended October 31, 2021) | 1 Yr. | 5 Yr. | 10 Yr. | |||
| Class A | w/o SC | 12.95% | 17.24% | 8.64% | ||
| w/SC2 | 6.45% | 15.85% | 8.00% | |||
| Class C | w/o SC | 12.23% | 16.46% | 7.88% | ||
| w/SC3 | 11.23% | 16.46% | 7.88% | |||
| Class R4 | w/o SC | 12.60% | 16.86% | 8.27% | ||
| Institutional Service Class4 | w/o SC | 13.21% | 17.52% | 8.90% | ||
| Institutional Class4 | w/o SC | 13.33% | 17.63% | 8.96% | ||
All figures showing the effect of a sales charge (SC) reflect the maximum charge possible because it has the most significant effect on performance data. The total returns shown above do not include the impact of financial statement rounding of the net asset value (NAV) per share and/or financial statement adjustments.
| 1 | The Fund changed its investment strategies effective June 13, 2019. Performance information for periods prior to June 13, 2019 does not reflect the current investment strategy. In connection with the change in investment strategy, the Fund changed its name from Aberdeen China Opportunities Fund to Aberdeen China A Share Equity Fund. Please consult the Fund's prospectus for more detail. |
| 2 | A 5.75% front-end sales charge was deducted. |
| 3 | A 1.00% contingent deferred sales charge (CDSC) was deducted from the one year return because it is charged when Class C shares are sold within the first year after purchase. |
| 4 | Not subject to any sales charges. |
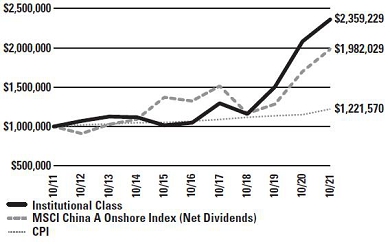
Performance of a $1,000,000 Investment* (as of October 31, 2021)
* Minimum Initial Investment
Performance of $1,000,000 invested in Institutional Class shares of the Aberdeen China A Share Equity Fund, MSCI China A (Onshore) Index (Net Dividends) and the Consumer Price Index (CPI) over a 10-year period ended October 31, 2021. Unlike the Fund, the returns for these unmanaged indexes do not reflect any fees, expenses, or sales charges. Investors cannot invest directly in market indexes.
The MSCI China A (Onshore) Index captures large and mid cap representation across China securities listed on the Shanghai and Shenzhen exchanges
The CPI is a measure of the average change over time in the prices paid by urban consumers for a market basket of consumer goods and services.
Investment return and principal value will fluctuate, and when redeemed, shares may be worth more or less than original cost. Past performance is no guarantee of future results. The Average Annual Total Return table and Performance graph do not reflect the deduction of taxes that a shareholder would pay on fund distributions or the redemption of fund shares. Investing in mutual funds involves market risk, including loss of principal. Performance returns assume the reinvestment of all distributions. Total returns reflect waivers and reimbursements in effect, without which returns would have been lower.
| 2021 Annual Report | 5 |
Aberdeen China A Share Equity Fund (Unaudited)
Portfolio Summary (as a percentage of net assets)
October 31, 2021 (Unaudited)
| Asset Allocation | ||
| Common Stocks | 95.9% | |
| Short-Term Investment | 2.3% | |
| Exchange-Traded Funds | 2.0% | |
| Liabilities in Excess of Other Assets | (0.2%) | |
| 100.0% | ||
The following table summarizes the composition of the Fund's portfolio, in S&P Global Industry Classification Standard (GICS) sectors, expressed as a percentage of net assets as of October 31, 2021.
| Top Sectors | ||
| Consumer Staples | 18.9% | |
| Industrials | 18.0% | |
| Information Technology | 15.2% | |
| Financials | 12.9% | |
| Consumer Discretionary | 12.4% | |
| Health Care | 11.3% | |
| Materials | 5.6% | |
| Real Estate | 1.6% | |
| Energy | –% | |
| Other | 4.1% | |
| 100.0% | ||
Amounts listed as "–" are 0% or round to 0%.
| Top Holdings* | ||
| China Tourism Group Duty Free Corp. Ltd., A Shares (Stock Connect) | 7.2% | |
| Kweichow Moutai Co. Ltd., A Shares (Stock Connect) | 7.1% | |
| China Merchants Bank Co. Ltd., A Shares | 5.2% | |
| Contemporary Amperex Technology Co. Ltd., A Shares | 5.1% | |
| LONGi Green Energy Technology Co. Ltd., A Shares | 3.9% | |
| Shenzhen Mindray Bio-Medical Electronics Co. Ltd., A Shares | 3.3% | |
| Wuliangye Yibin Co. Ltd., A Shares | 3.2% | |
| NARI Technology Co. Ltd., A Shares (Stock Connect) | 3.1% | |
| Glodon Co. Ltd., A Shares | 3.0% | |
| Centre Testing International Group Co. Ltd., A Shares (Stock Connect) | 2.8% | |
| Other | 56.1% | |
| 100.0% | ||
* For the purpose of listing top holdings, Short-Term Investments are included as part of Other.
| Top Countries | ||
| China | 95.9% | |
| United States | 4.3% | |
| Other | (0.2%) | |
| 100.0% | ||
| 6 | 2021 Annual Report |
Statement of Investments
October 31, 2021
Aberdeen China A Share Equity Fund
| Shares or Principal Amount | Value | ||||
| COMMON STOCKS (95.9%) | |||||
| CHINA (95.9%) | |||||
| Consumer Discretionary (12.4%) | |||||
| China Tourism Group Duty Free Corp. Ltd., A Shares (Stock Connect) (a) | 151,695 | $ | 6,345,130 | ||
| Fuyao Glass Industry Group Co. Ltd., A Shares (a) | 293,841 | 2,266,841 | |||
| Midea Group Co. Ltd., A Shares (Stock Connect) (a) | 219,842 | 2,355,086 | |||
| 10,967,057 | |||||
| Consumer Staples (18.9%) | |||||
| By-health Co. Ltd., A Shares (a) | 345,688 | 1,374,293 | |||
| Chacha Food Co. Ltd., A Shares (a) | 174,000 | 1,547,823 | |||
| Foshan Haitian Flavouring & Food Co. Ltd., A Shares (a) | 130,412 | 2,384,892 | |||
| Inner Mongolia Yili Industrial Group Co. Ltd., A Shares (a) | 199,500 | 1,335,742 | |||
| Kweichow Moutai Co. Ltd., A Shares (Stock Connect) (a) | 21,863 | 6,230,669 | |||
| Proya Cosmetics Co. Ltd., A Shares (a) | 31,300 | 981,113 | |||
| Wuliangye Yibin Co. Ltd., A Shares (a) | 82,237 | 2,775,282 | |||
| 16,629,814 | |||||
| Energy (0.0%) | |||||
| G3 Exploration Ltd. (b)(c)(d) | 53,000 | – | |||
| Financials (12.9%) | |||||
| Bank of Ningbo Co. Ltd., A Shares (a) | 357,015 | 2,125,608 | |||
| China International Capital Corp. Ltd., H Shares (e) | 359,600 | 890,286 | |||
| China Merchants Bank Co. Ltd., A Shares (a) | 547,532 | 4,605,939 | |||
| Ping An Bank Co. Ltd., A Shares (a) | 603,300 | 1,835,267 | |||
| Ping An Insurance Group Co. of China Ltd., A Shares (a) | 249,737 | 1,926,580 | |||
| 11,383,680 | |||||
| Health Care (11.3%) | |||||
| Aier Eye Hospital Group Co. Ltd., A Shares (a) | 310,358 | 2,344,103 | |||
| Hangzhou Tigermed Consulting Co. Ltd., A Shares (a) | 82,767 | 2,200,470 | |||
| Hangzhou Tigermed Consulting Co. Ltd., H Shares (e) | 29,400 | 573,407 | |||
| Jiangsu Hengrui Medicine Co. Ltd., A Shares (a) | 252,095 | 1,934,069 | |||
| Shenzhen Mindray Bio-Medical Electronics Co. Ltd., A Shares (a) | 49,610 | 2,903,238 | |||
| 9,955,287 | |||||
| Industrials (18.0%) | |||||
| Centre Testing International Group Co. Ltd., A Shares (Stock Connect) (a) | 564,388 | 2,429,712 | |||
| Contemporary Amperex Technology Co. Ltd., A Shares (a) | 45,079 | 4,509,771 | |||
| Guangzhou Baiyun International Airport Co. Ltd., A Shares (a) | 315,200 | 582,420 | |||
| Shares or Principal Amount | Value | ||||
| NARI Technology Co. Ltd., A Shares (Stock Connect) (a) | 449,560 | $ | 2,733,769 | ||
| Shanghai International Airport Co. Ltd., A Shares (Stock Connect) (a)(b) | 101,910 | 841,615 | |||
| Shanghai M&G Stationery, Inc., A Shares (a) | 167,680 | 1,659,838 | |||
| Shenzhen Inovance Technology Co. Ltd., A Shares (a) | 136,789 | 1,391,901 | |||
| Sungrow Power Supply Co. Ltd., A Shares (Stock Connect) (a) | 65,278 | 1,675,689 | |||
| 15,824,715 | |||||
| Information Technology (15.2%) | |||||
| Beijing Sinnet Technology Co. Ltd., A Shares (a) | 287,489 | 592,642 | |||
| Glodon Co. Ltd., A Shares (a) | 230,989 | 2,677,938 | |||
| Hundsun Technologies, Inc., A Shares (a) | 159,850 | 1,567,405 | |||
| LONGi Green Energy Technology Co. Ltd., A Shares (a) | 227,920 | 3,470,561 | |||
| Luxshare Precision Industry Co. Ltd., A Shares (a) | 386,870 | 2,336,539 | |||
| Venustech Group, Inc., A Shares (a) | 427,100 | 1,699,176 | |||
| Yonyou Network Technology Co. Ltd., A Shares (a) | 202,800 | 1,005,312 | |||
| 13,349,573 | |||||
| Materials (5.6%) | |||||
| Anhui Conch Cement Co. Ltd., A Shares (a) | 187,756 | 1,112,325 | |||
| Wanhua Chemical Group Co. Ltd., A Shares (a) | 109,017 | 1,799,092 | |||
| Yunnan Energy New Material Co. Ltd., A Shares (Stock Connect) (a) | 45,220 | 2,059,616 | |||
| 4,971,033 | |||||
| Real Estate (1.6%) | |||||
| China Vanke Co. Ltd., A Shares (a) | 497,273 | 1,412,031 | |||
| 84,493,190 | |||||
| Total Common Stocks | 84,493,190 | ||||
| EXCHANGE-TRADED FUNDS (2.0%) | |||||
| UNITED STATES (2.0%) | |||||
| KraneShares Bosera MSCI China A Shares ETF | 37,077 | 1,725,564 | |||
| Total Exchange-Traded Funds | 1,725,564 | ||||
| SHORT-TERM INVESTMENT (2.3%) | |||||
| UNITED STATES (2.3%) | |||||
| State Street Institutional U.S. Government Money Market Fund, Premier Class, 0.03% (f) | 1,993,668 | 1,993,668 | |||
| Total Short-Term Investment | 1,993,668 | ||||
| Total Investments (Cost $88,051,584) (g)—100.2% | 88,212,422 | ||||
| Liabilities in Excess of Other Assets—(0.2)% | (138,964) | ||||
| Net Assets—100.0% | $ | 88,073,458 | |||
See accompanying Notes to Financial Statements.
| 2021 Annual Report | 7 |
Statement of Investments (concluded)
October 31, 2021
Aberdeen China A Share Equity Fund
| (a) | China A Shares. These shares are issued in local currency, traded in the local stock markets and are held through either a Qualified Foreign Institutional Investor (QFII) license or the Shanghai or Shenzhen Hong-Kong Stock Connect program. |
| (b) | Non-income producing security. |
| (c) | Illiquid security. |
| (d) | Delisted. Fair Value is determined pursuant to procedures approved by the Fund's Board of Trustees. See Note 2(a) of the accompanying Notes to Financial Statements. |
| (e) | Denotes a security issued under Regulation S or Rule 144A. |
| (f) | Registered investment company advised by State Street Global Advisors. The rate shown is the 7 day yield as of October 31, 2021. |
| (g) | See accompanying Notes to Financial Statements for tax unrealized appreciation/(depreciation) of securities. |
| ETF | Exchange-Traded Fund |
See accompanying Notes to Financial Statements.
| 8 | 2021 Annual Report |
Aberdeen Dynamic Dividend Fund (Unaudited)
Aberdeen Dynamic Dividend Fund (Institutional Class shares net of fees) returned 35.36% for the 12-month reporting period ended October 31, 2021, versus the 37.28% return of its benchmark, the Morgan Stanley Capital International (MSCI) All Country (AC) World Index (Net Dividends), during the same period.
Major global equity market indices moved sharply higher despite bouts of significant market volatility over the 12-month period ended October 31, 2021. Supportive monetary and fiscal policies were prevalent over the period. The U.S. Federal Reserve (Fed) maintained the federal funds rate at near 0% throughout the reporting period, while providing support through its bond-buying program. Elsewhere, the European Central Bank ramped up its original €1.35 trillion (US$1.57 trillion) stimulus plan to €1.85 trillion (US$2.15 trillion) in December 2020. The U.S. Congress passed two additional stimulus packages during the reporting period, with a cumulative total of roughly $2.8 trillion. In August 2021, the U.S. Senate passed the $1 trillion infrastructure deal.
At the beginning of the reporting period in November 2020, news of three major COVID-19 vaccines buoyed investor sentiment. This persisted through to the end of 2020 due to the launch of vaccination programs, the approval of stimulus packages, and the UK and the European Union reaching a Brexit trade deal.
Momentum stalled in January and February 2021, as global bond markets experienced a significant selloff, spurring worries that this could impact the fragile global recovery. The downturn in bond markets also had a negative impact on equities. However, stock markets resumed their upward momentum, driven by economic optimism, vaccine rollouts, central banks' continued accommodative monetary policies, and a strong corporate earnings reporting season. The MSCI AC World Index reached a record high in August 2021, but sold off in September amid investors' growing concerns over inflation and possible interest-rate hikes from central banks. Uneasiness about the global economy led to a selloff across most equity markets across the globe. In October, upbeat company results, along with comments that demand remained strong, eased investors' concerns about stagflation,* supply-chain pressures, spiraling energy prices and higher interest rates.
The Fund's underperformance relative to the benchmark for the reporting period was attributable mainly to stock selection in the industrials and real estate sectors. At the individual stock level, key detractors from performance included holdings in Canada-based gold and copper mining company Barrick Gold Corp. and multi-lines insurer Ping An Insurance Group of China Ltd., as well as the absence of a position in electric vehicle (EV) manufacturer and renewable energy company Tesla Inc.
Barrick Gold Corp. reported solid results early in the reporting period, but this was offset by 2021 financial guidance that was slightly disappointing in terms of production and costs. The market has been disappointed that the company's earnings growth has lagged that of its peers. Furthermore, the price of gold declined over the reporting
period. Shares of Ping An Insurance moved lower over the reporting period due to investors' concerns regarding the life insurance industry and about the firm's property exposure in China. As of the date of this report, the Fund does not hold Tesla as the company does not pay a dividend.
Conversely, stock selection in the consumer discretionary, communication services and healthcare sectors bolstered the Fund's relative performance over the reporting period. The largest contributors to performance were the lack of exposure to Chinese e-commerce giant Alibaba Group Holding Ltd., along with positons in two U.S.-based companies: alternative asset manager Blackstone Inc. and diversified financial services company Goldman Sachs Group Inc.
The absence of a holding in Alibaba Group benefited Fund performance over the reporting period as its shares declined after Chinese regulators opened an anti-trust investigation into the company. Blackstone Inc. consistently reported strong quarterly results during the reporting period. The alternative asset manager benefited from both good financial performance and strong fund inflows.
The company is profiting from its investments in retail and is raising a significant amount of capital in its Blackstone Real Estate Income Trust (BREIT) and Blackstone Private Credit (BCRED) funds. In addition, Blackstone continues to grow its asset management business for insurance clients, as the company recently reached an agreement to manage assets for AIG (which the Fund did not hold as of the end of the reporting period). Diversified financial services company Goldman Sachs Group saw healthy year-over-year revenue growth over the reporting period, buoyed mainly by notable strength in its Asset Management, Investment Banking and Global Markets units. Investors viewed this as evidence that the new management team is on the path to improving shareholder returns over the medium term through various revenue and expense initiatives.
Regarding the use of derivatives, we continued to hedge a portion of the Fund's currency exposure to the euro during the reporting period.
The Fund earns income through a combination of investing in companies that pay dividends and implementing a dividend-capture strategy. In a dividend-capture trade, the Fund sells a stock on or shortly after the stock's ex-dividend date and reinvests the sales proceeds into one or more other stocks that are expected to pay dividends before the next dividend payment on the stock that it is selling. While employing this strategy, the Fund purchases companies that pay regular and/or special dividends. Over the 12-month period ended October 31, 2021, the Fund issued total distributions of $x.xx per share.
When bond yields rally, investors tend to take profits and sell highly valued companies. Time will tell whether this proves shortsighted this time around. As we move through the upcoming corporate earnings season, we maintain our preference for what we believe are well-run companies with a clear competitive advantage.
| * | Stagflation refers to an economic environment of stagnant activity and accelerating inflation. |
| 2021 Annual Report | 9 |
Aberdeen Dynamic Dividend Fund (Unaudited) (concluded)
From our conversations with various industry participants, it appears that some of the supply bottlenecks emanating from manufacturing hubs such as Vietnam, Thailand and Malaysia are now easing. Some raw material costs, noticeably metals, are also decreasing. This is due to a mix of government price caps and a slowdown in demand. It is worth noting that China's manufacturing purchasing managers' index for September recorded a reading of 49.6, a marginal contraction from the previous month.
In the U.S. and Western Europe, we are waiting to see the effect of the withdrawal of government support schemes on labor participation. These factors suggest that, as we head towards the end of the year, pressure on the supply chain could start to moderate. Overall, we think that the performance of equity markets may be tempered by gradual monetary policy normalization and the potential impact of increased taxation.
We remain committed to our fundamental analysis-based stock-picking strategies. This is supported by our proprietary research platform staffed by an experienced team that has successfully navigated past crises. Therefore, we continue to seek what we believe are attractively valued companies with resilient, well-run businesses that adapt well to the changing landscape, and also are poised for a recovery in economic growth. We are actively engaging with management in an effort to ensure robust corporate governance and environmental sustainability standards.
Portfolio Management:
Global Equity Team
PAST PERFORMANCE DOES NOT GUARANTEE FUTURE RESULTS.
The performance data quoted represents past performance and current returns may be lower or higher. Class A Shares have up to a 5.75% front-end sales charge and a 0.25% 12b-1 fee. The investment return and principal value will fluctuate so that an investor's shares, when redeemed, may be worth more or less than the original cost. To obtain performance information current to the most recent month-end, which may be higher or lower than the performance shown above, please call 866-667-9231 or go to https://www.abrdn.com/en-us/us/investor/fund-centre.
Investing in mutual funds involves risk, including possible loss of principal.
Indexes are unmanaged and have been provided for comparison purposes only. No fees or expenses are reflected. You cannot invest directly in an index.
Risk Considerations
Deteriorating market conditions might cause a general weakness in the market that reduces the prices, or yield, of securities in those markets in which the Fund invests.
The value of a security may decline for reasons directly related to the issuer, such as management performance, financial leverage and reduced demand for the issuer's goods or services.
The stock or other security of a company may not perform as well as expected, and may decrease in value, because of factors related to the company, to the industry in which the company is engaged, or to the market as a whole.
The Fund is subject to the risk that the Adviser or Subadviser may make poor security selections.
The Fund's emphasis on dividend paying stocks could cause the Fund to underperform similar funds that invest without consideration of a company's track record of paying dividends or ability to pay dividends in the future. Dividend-paying stocks may not participate in a broad market advance to the same degree as other stocks, and a sharp rise in interest rates or economic downturn could cause a company to unexpectedly reduce or eliminate its dividend.
Foreign securities are more volatile, harder to price and less liquid than U.S. securities. They are subject to different accounting and regulatory standards, and currency exchange rate, political and economic risks.
The value of foreign currencies relative to the U.S. Dollar fluctuates in response to market, economic, political, regulatory, geopolitical or other conditions. Fluctuations in currency exchange rates may impact a Fund's returns more greatly to the extent the Fund does not hedge currency exposure or hedging techniques are unsuccessful.
Please read the prospectus for more detailed information regarding these and other risks.
| 10 | 2021 Annual Report |
Aberdeen Dynamic Dividend Fund (Unaudited)
| Average Annual Total Return1 (For periods ended October 31, 2021) | 1 Yr. | 5 Yr. | 10 Yr. | ||||||
| Class A | w/o SC | 35.40% | 12.57% | N.A. | |||||
| w/SC2 | 27.77% | 11.27% | N.A. | ||||||
| Institutional Class3 | w/o SC | 35.36% | 12.85% | 9.64% |
All figures showing the effect of a sales charge (SC) reflect the maximum charge possible because it has the most significant effect on performance data. The total returns shown above do not include the impact of financial statement rounding of the net asset value (NAV) per share and/or financial statement adjustments.
| 1 | Returns prior to May 7, 2018 reflect the performance of a predecessor fund (the "Predecessor Fund"). Returns of the Predecessor Fund have not been adjusted to reflect the expenses applicable to the respective classes. The Fund and the Predecessor Fund have substantially similar investment objectives and strategies. Please consult the Fund's prospectus for more detail. |
| 2 | A 5.75% front-end sales charge was deducted. |
| 3 | Not subject to any sales charges. |
Performance of a $1,000,000 Investment* (as of October 31, 2021)

* Minimum Initial Investment
Comparative performance of $1,000,000 invested in Institutional Class shares of the Aberdeen Dynamic Dividend Fund, Morgan Stanley Capital International All Country World Index (MSCI ACWI) (Net
Dividends) and the Consumer Price Index (CPI) over a 10-year period ended October 31, 2021. Unlike the Fund, the returns for these unmanaged indexes do not reflect any fees, expenses or sales charges. Investors cannot invest directly in market indexes.
The MSCI ACWI captures large and mid cap representation across 23 Developed Markets (DM) and 27 Emerging Markets (EM) countries. With 2,986 constituents, the index covers approximately 85% of the global investable equity opportunity set. DM countries in the Index are: Australia, Austria, Belgium, Canada, Denmark, Finland, France, Germany, Hong Kong, Ireland, Israel, Italy, Japan, Netherlands, New Zealand, Norway, Portugal, Singapore, Spain, Sweden, Switzerland, the UK and the US. EM countries in the Index are: Argentina, Brazil, Chile, China, Colombia, Czech Republic, Egypt, Greece, Hungary, India, Indonesia, Korea, Kuwait, Malaysia, Mexico, Pakistan, Peru, Philippines, Poland, Russia, Qatar, Saudi Arabia, South Africa, Taiwan, Thailand, Turkey and United Arab Emirates.
The CPI is a measure of the average change over time in the prices paid by urban consumers for a market basket of consumer goods and services.
Investment return and principal value will fluctuate, and when redeemed, shares may be worth more or less than original cost. Past performance is no guarantee of future results. The Average Annual Total Return table and Performance graph do not reflect the deduction of taxes that a shareholder would pay on fund distributions or the redemption of fund shares. Investing in mutual funds involves market risk, including loss of principal. Performance returns assume the reinvestment of all distributions. Total returns reflect waivers and reimbursements in effect, without which returns would have been lower.
| 2021 Annual Report | 11 |
Aberdeen Dynamic Dividend Fund (Unaudited)
Portfolio Summary (as a percentage of net assets)
October 31, 2021 (Unaudited)
| Asset Allocation | |||
| Common Stocks | 96.8% | ||
| Short-Term Investment | 1.9% | ||
| Preferred Stocks | 1.4% | ||
| Liabilities in Excess of Other Assets | (0.1%) | ||
| 100.0% | |||
The following table summarizes the composition of the Fund's portfolio, in S&P Global Industry Classification Standard (GICS) sectors, expressed as a percentage of net assets as of October 31, 2021.
| Top Sectors | |||
| Information Technology | 17.3% | ||
| Financials | 16.2% | ||
| Health Care | 12.5% | ||
| Consumer Discretionary | 9.6% | ||
| Industrials | 9.1% | ||
| Consumer Staples | 8.5% | ||
| Communication Services | 6.7% | ||
| Utilities | 5.1% | ||
| Materials | 4.9% | ||
| Real Estate | 4.3% | ||
| Other | 5.8% | ||
| 100.0% | |||
| Top Holdings* | |||
| Apple, Inc. | 3.1% | ||
| Microsoft Corp. | 2.5% | ||
| Alphabet, Inc., Class C | 2.3% | ||
| Broadcom, Inc. | 1.7% | ||
| Bank of America Corp. | 1.7% | ||
| Tryg A/S | 1.5% | ||
| AbbVie, Inc. | 1.5% | ||
| Target Corp. | 1.5% | ||
| Lowe's Cos., Inc. | 1.5% | ||
| Enbridge, Inc. | 1.4% | ||
| Other | 81.3% | ||
| 100.0% | |||
| * | For the purpose of listing top holdings, Short-Term Investments are included as part of Other. |
| Top Countries | |||
| United States | 54.5% | ||
| France | 5.9% | ||
| United Kingdom | 5.2% | ||
| Germany | 4.7% | ||
| Switzerland | 3.3% | ||
| China | 3.0% | ||
| Canada | 2.4% | ||
| South Korea | 2.4% | ||
| Netherlands | 2.3% | ||
| Brazil | 2.2% | ||
| Other | 14.1% | ||
| 100.0% | |||
| 12 | 2021 Annual Report |
Statement of Investments
October 31, 2021
Aberdeen Dynamic Dividend Fund
| Shares or Principal Amount | Value | |||||||
| COMMON STOCKS (96.8%) | ||||||||
| AUSTRALIA (0.9%) | ||||||||
| Materials (0.9%) | ||||||||
| Rio Tinto PLC, ADR | 18,158 | $ | 1,148,857 | |||||
| BRAZIL (2.2%) | ||||||||
| Industrials (1.4%) | ||||||||
| CCR SA | 873,100 | 1,768,229 | ||||||
| Materials (0.8%) | ||||||||
| Vale SA, ADR | 78,700 | 1,001,851 | ||||||
| 2,770,080 | ||||||||
| CANADA (2.4%) | ||||||||
| Energy (1.4%) | ||||||||
| Enbridge, Inc. | 43,500 | 1,820,910 | ||||||
| Materials (1.0%) | ||||||||
| Barrick Gold Corp. | 70,800 | 1,300,596 | ||||||
| 3,121,506 | ||||||||
| CHINA (3.0%) | ||||||||
| Communication Services (1.1%) | ||||||||
| Tencent Holdings Ltd. | 22,500 | 1,368,670 | ||||||
| Financials (1.0%) | ||||||||
Ping An Insurance Group Co. of China Ltd., H Shares | 184,000 | 1,317,942 | ||||||
| Real Estate (0.9%) | ||||||||
| China Vanke Co. Ltd., H Shares | 472,000 | 1,102,795 | ||||||
| 3,789,407 | ||||||||
| DENMARK (1.5%) | ||||||||
| Financials (1.5%) | ||||||||
| Tryg A/S | 83,333 | 1,977,751 | ||||||
| FINLAND (2.1%) | ||||||||
| Financials (1.1%) | ||||||||
| Nordea Bank Abp | 121,400 | 1,486,763 | ||||||
| Information Technology (1.0%) | ||||||||
| Nokia OYJ (a) | 214,500 | 1,231,124 | ||||||
| 2,717,887 | ||||||||
| FRANCE (5.9%) | ||||||||
| Consumer Discretionary (1.2%) | ||||||||
| LVMH Moet Hennessy Louis Vuitton SE | 1,900 | 1,489,831 | ||||||
| Consumer Staples (1.1%) | ||||||||
| Danone SA | 21,700 | 1,414,531 | ||||||
| Energy (1.3%) | ||||||||
| TOTAL SE, ADR | 34,200 | 1,713,762 | ||||||
| Health Care (1.2%) | ||||||||
| Sanofi | 15,100 | 1,516,706 | ||||||
| Shares or Principal Amount | Value | |||||||
| Industrials (1.1%) | ||||||||
| Alstom SA | 38,322 | $ | 1,365,711 | |||||
| 7,500,541 | ||||||||
| GERMANY (4.7%) | ||||||||
| Financials (1.0%) | ||||||||
| Deutsche Boerse AG | 8,000 | 1,328,057 | ||||||
| Information Technology (1.2%) | ||||||||
| Infineon Technologies AG | 33,900 | 1,587,582 | ||||||
| Materials (1.2%) | ||||||||
| Linde PLC | 4,700 | 1,512,161 | ||||||
| Utilities (1.3%) | ||||||||
| RWE AG | 41,900 | 1,612,800 | ||||||
| 6,040,600 | ||||||||
| HONG KONG (0.9%) | ||||||||
| Financials (0.9%) | ||||||||
| Hong Kong Exchanges & Clearing Ltd. | 18,700 | 1,126,520 | ||||||
| INDONESIA (1.2%) | ||||||||
| Communication Services (1.2%) | ||||||||
| Telkom Indonesia Persero Tbk PT | 5,575,800 | 1,490,331 | ||||||
| ITALY (1.0%) | ||||||||
| Utilities (1.0%) | ||||||||
| Enel SpA | 155,000 | 1,297,626 | ||||||
| JAPAN (2.0%) | ||||||||
| Financials (1.1%) | ||||||||
| Mitsubishi UFJ Financial Group, Inc. | 263,900 | 1,447,094 | ||||||
| Real Estate (0.9%) | ||||||||
| GLP J-REIT | 700 | 1,141,742 | ||||||
| 2,588,836 | ||||||||
| NETHERLANDS (2.3%) | ||||||||
| Consumer Staples (1.3%) | ||||||||
| Heineken NV | 14,600 | 1,616,060 | ||||||
| Information Technology (1.0%) | ||||||||
| ASML Holding NV | 1,600 | 1,300,639 | ||||||
| 2,916,699 | ||||||||
| NORWAY (0.9%) | ||||||||
| Communication Services (0.9%) | ||||||||
| Telenor ASA | 76,700 | 1,211,899 | ||||||
| SINGAPORE (1.2%) | ||||||||
| Financials (1.2%) | ||||||||
| Oversea-Chinese Banking Corp. Ltd. | 168,155 | 1,469,982 | ||||||
| SOUTH KOREA (1.0%) | ||||||||
| Materials (1.0%) | ||||||||
| LG Chem Ltd. | 1,840 | 1,320,301 | ||||||
See accompanying Notes to Financial Statements.
| 2021 Annual Report | 13 |
Statement of Investments (continued)
October 31, 2021
Aberdeen Dynamic Dividend Fund
| Shares or Principal Amount | Value | |||||||
| COMMON STOCKS (continued) | ||||||||
| SPAIN (1.3%) | ||||||||
| Industrials (1.3%) | ||||||||
| Ferrovial SA | 53,626 | $ | 1,692,868 | |||||
| SWITZERLAND (3.3%) | ||||||||
| Consumer Staples (1.1%) | ||||||||
| Nestle SA | 10,300 | 1,358,644 | ||||||
| Financials (1.0%) | ||||||||
| Zurich Insurance Group AG | 2,900 | 1,285,339 | ||||||
| Health Care (1.2%) | ||||||||
| Roche Holding AG | 4,000 | 1,549,576 | ||||||
| 4,193,559 | ||||||||
| TAIWAN (1.2%) | ||||||||
| Information Technology (1.2%) | ||||||||
| Taiwan Semiconductor Manufacturing Co. Ltd., ADR | 13,700 | 1,557,690 | ||||||
| UNITED KINGDOM (5.2%) | ||||||||
| Communication Services (1.2%) | ||||||||
| Vodafone Group PLC, ADR | 103,300 | 1,544,335 | ||||||
| Consumer Staples (0.8%) | ||||||||
| Unilever PLC | 19,600 | 1,049,273 | ||||||
| Health Care (2.3%) | ||||||||
| AstraZeneca PLC, ADR | 28,000 | 1,746,640 | ||||||
| Dechra Pharmaceuticals PLC | 17,500 | 1,226,222 | ||||||
| 2,972,862 | ||||||||
| Industrials (0.9%) | ||||||||
| Melrose Industries PLC | 532,326 | 1,148,517 | ||||||
| 6,714,987 | ||||||||
| UNITED STATES (52.6%) | ||||||||
| Communication Services (2.3%) | ||||||||
| Alphabet, Inc., Class C (a) | 1,000 | 2,965,410 | ||||||
| Consumer Discretionary (8.4%) | ||||||||
| Aptiv PLC (a) | 9,300 | 1,607,877 | ||||||
| Genuine Parts Co. | 13,000 | 1,704,430 | ||||||
| Hanesbrands, Inc. | 60,600 | 1,032,624 | ||||||
| Las Vegas Sands Corp. (a) | 32,600 | 1,265,206 | ||||||
| Lowe's Cos., Inc. | 8,100 | 1,893,942 | ||||||
| Target Corp. | 7,400 | 1,921,188 | ||||||
| TJX Cos., Inc. (The) | 19,900 | 1,303,251 | ||||||
| 10,728,518 | ||||||||
| Consumer Staples (4.2%) | ||||||||
| Coca-Cola Co. (The) | 24,900 | 1,403,613 | ||||||
| Kraft Heinz Co. (The) | 32,300 | 1,159,247 | ||||||
| Mondelez International, Inc., Class A | 25,600 | 1,554,944 | ||||||
| PepsiCo, Inc. | 8,200 | 1,325,120 | ||||||
| 5,442,924 | ||||||||
| Shares or Principal Amount | Value | |||||||
| Energy (1.3%) | ||||||||
| Williams Cos., Inc. (The) | 57,900 | $ | 1,626,411 | |||||
| Financials (7.4%) | ||||||||
| Bank of America Corp. | 44,500 | 2,126,210 | ||||||
| Blackstone, Inc., Class A | 9,500 | 1,314,990 | ||||||
| Goldman Sachs Group, Inc. (The) | 3,800 | 1,570,730 | ||||||
| Huntington Bancshares, Inc. | 90,900 | 1,430,766 | ||||||
| Intercontinental Exchange, Inc. | 11,600 | 1,606,136 | ||||||
| JPMorgan Chase & Co. | 8,500 | 1,444,065 | ||||||
| 9,492,897 | ||||||||
| Health Care (7.8%) | ||||||||
| AbbVie, Inc. | 17,103 | 1,961,201 | ||||||
| Baxter International, Inc. | 17,400 | 1,373,904 | ||||||
| Bristol-Myers Squibb Co. | 28,300 | 1,652,720 | ||||||
| Eli Lilly & Co. | 6,000 | 1,528,560 | ||||||
| Medtronic PLC | 13,600 | 1,630,096 | ||||||
| UnitedHealth Group, Inc. | 3,900 | 1,795,833 | ||||||
| 9,942,314 | ||||||||
| Industrials (4.4%) | ||||||||
| FedEx Corp. | 6,300 | 1,483,839 | ||||||
| Lockheed Martin Corp. | 2,700 | 897,264 | ||||||
| Norfolk Southern Corp. | 5,600 | 1,641,080 | ||||||
| Schneider Electric SE | 9,400 | 1,620,730 | ||||||
| 5,642,913 | ||||||||
| Information Technology (11.5%) | ||||||||
| Analog Devices, Inc. | 7,600 | 1,318,524 | ||||||
| Apple, Inc. | 26,800 | 4,014,640 | ||||||
| Avast PLC (b) | 174,100 | 1,333,329 | ||||||
| Broadcom, Inc. | 4,000 | 2,126,680 | ||||||
| Cisco Systems, Inc. | 26,800 | 1,499,996 | ||||||
| Fidelity National Information Services, Inc. | 11,500 | 1,273,510 | ||||||
| Microsoft Corp. | 9,700 | 3,216,714 | ||||||
| 14,783,393 | ||||||||
| Real Estate (2.5%) | ||||||||
| American Tower Corp., REIT | 4,600 | 1,297,062 | ||||||
| Digital Realty Trust, Inc. | 4,100 | 647,021 | ||||||
| Gaming and Leisure Properties, Inc., REIT | 26,000 | 1,260,740 | ||||||
| 3,204,823 | ||||||||
| Utilities (2.8%) | ||||||||
| CMS Energy Corp. | 11,300 | 681,955 | ||||||
| FirstEnergy Corp. | 31,100 | 1,198,283 | ||||||
| NextEra Energy, Inc. | 19,500 | 1,663,935 | ||||||
| 3,544,173 | ||||||||
| 67,373,776 | ||||||||
| Total Common Stocks | 124,021,703 | |||||||
See accompanying Notes to Financial Statements.
| 14 | 2021 Annual Report |
Statement of Investments (concluded)
October 31, 2021
Aberdeen Dynamic Dividend Fund
| Shares or Principal Amount | Value | |||||||
| PREFERRED STOCKS (1.4%) | ||||||||
| SOUTH KOREA (1.4%) | ||||||||
| Information Technology (1.4%) | ||||||||
| Samsung Electronics Co. Ltd. | 32,000 | $ | 1,757,952 | |||||
| Total Preferred Stocks | 1,757,952 | |||||||
| SHORT-TERM INVESTMENT (1.9%) | ||||||||
| UNITED STATES (1.9%) | ||||||||
| State Street Institutional U.S. Government Money Market Fund, Premier Class, 0.03% (c) | 2,493,808 | 2,493,808 | ||||||
| Total Short-Term Investment | 2,493,808 | |||||||
| Total Investments (Cost $94,646,611) (d)—100.1% | 128,273,463 | |||||||
| Liabilities in Excess of Other Assets—(0.1)% | (121,436 | ) | ||||||
| Net Assets—100.0% | $ | 128,152,027 | ||||||
| (a) | Non-income producing security. |
| (b) | Denotes a security issued under Regulation S or Rule 144A. |
| (c) | Registered investment company advised by State Street Global Advisors. The rate shown is the 7 day yield as of October 31, 2021. |
| (d) | See accompanying Notes to Financial Statements for tax unrealized appreciation/(depreciation) of securities. |
| ADR | American Depositary Receipt |
| PLC | Public Limited Company |
| REIT | Real Estate Investment Trust |
At October 31, 2021, the Fund's open forward foreign currency exchange contracts were as follows:
| Sale Contracts Settlement Date | Counterparty | Amount Purchased | Amount Sold | Fair Value | Unrealized Depreciation | |||||||||
United States Dollar/Euro | ||||||||||||||
| 01/13/2022 | Royal Bank of Canada (UK) | USD 3,009,305 | EUR 2,600,000 | $3,011,319 | $(2,014 | ) | ||||||||
See accompanying Notes to Financial Statements.
| 2021 Annual Report | 15 |
Aberdeen Emerging Markets Fund (Unaudited)
Aberdeen Emerging Markets Fund (Institutional Class shares net of fees) returned 21.45% for the 12-monh reporting period ended October 31, 2021, versus the 16.96% return of its benchmark, the Morgan Stanley Capital International (MSCI) Emerging Markets Index, during the same period.
Emerging-market (EM) equities posted notable gains over the reporting period, with the exception of China. Stock prices initially rallied on investors' optimism regarding the COVID-19 vaccine rollout, which allowed the reopening of economies worldwide. Upbeat corporate earnings, driven by an e-commerce boom, a multi-year technology upgrading cycle and pent-up infrastructure demand also bolstered investor sentiment. Increasing adoption of climate-change goals by governments globally also fueled interest in clean-energy themes. These positive factors outweighed investors' concerns over supply-chain disruptions caused by a shortage of semiconductors, shipping gridlocks, and an energy crunch. However, the spread of the more contagious Delta variant of COVID-19 capped the stock market gains in some EM economies due to their relatively slower vaccine rollouts.
In China, the government's efforts to promote "common prosperity" led to a tougher regulatory environment for some business models. Stock prices fell as the government increased its focus on sustainable development issues, including: excessive real estate debt, the high cost of living, education, gaming, worker welfare, technology giants' antitrust issues, data-privacy practices and climate change.
Elsewhere in Asia, Indian equities scaled all-time highs despite the country's struggles against a deadly wave of COVID-19 cases in the first half of the reporting period. The Indian government's pro-business policies exceeded the market's expectations and buoyed investor sentiment. Share prices also were lifted by the Indian government's decision not to implement a nationwide lockdown, as this sustained the corporate earnings recovery. The Taiwanese and South Korean markets performed well over the reporting period because of their dominance in the electronics supply chain.
The markets in Latin America and Russia benefited over the reporting period from bullish commodity prices and hopes that massive fiscal stimulus in the U.S. would further boost their exports. Central banks in Brazil, Mexico and Russia began to raise their respective benchmark interest rates in an effort to control inflationary pressures.
The Fund's outperformance relative to its benchmark, the MSCI Emerging Markets Index, for the reporting period was attributable mainly to strong stock selection in the information technology and consumer discretionary sectors. Conversely, the exposure to travel-related stocks, as well as the transportation and automobiles and components subsectors, weighed on Fund performance. Within the regional markets, the Fund's holdings in China were key contributors to performance, while positions in the Netherlands, South Korea, Latin America and Russia also had a positive impact. Conversely, stock selection in South Africa and an underweight allocation to Taiwan detracted from Fund performance for the reporting period.
Given the global chip shortage, demand for foundry operations boosted shares of leading semiconductor companies during the reporting period, including three Fund holdings: multinational technology company Samsung Electronics Co. Ltd., Dutch chip-maker ASML Holding NV, and Taiwan Semiconductor Manufacturing Co. (TSMC). In China, the holdings in power-grid company Nari Technology Co. Ltd., and solar energy company Longi Green Energy Technology Co. enhanced Fund performance due to their alignment to national clean energy objectives. In Russia, natural gas producer and distributor Novatek PJSC benefited from its exposure to soaring spot energy prices and expectations for better valuation of liquefied natural gas (LNG) projects, which form the bedrock of the company's future growth. The Fund's position in Brazilian mining company Vale SA also performed well amid surging iron ore prices.
Conversely, the Fund's education and gaming holdings – New Oriental Education & Technology Group Inc. and Sands China Ltd. – detracted from Fund performance for the reporting period, as both companies were in the crosshairs of the Chinese government's policy tightening.
Regarding key portfolio activity over the reporting period, we initiated holdings in sporting goods maker Li Ning Co. Ltd.; clean energy company Sungrow Power Supply Co. Ltd.; and Yunnan Energy New Material Co. Ltd., a supplier of film, packaging and printing products. We also initiated positions in platinum producer Anglo American Platinum Ltd. (Amplats); electronics manufacturer Hon Hai Precision Industry Co., Ltd.; and conglomerate Grupo Mexico SAB de C.V. Additionally, we initiated a holding in clean energy company Xinjiang Goldwind Science & Technology Co., Ltd., and subsequently exited the position later in the reporting period.
Chinese government regulation in the education sector impaired the investment case for New Oriental Education & Technology to such an extent that we sold the Fund's holding in the company. We exited the Fund's position in Shanghai International Airport Co. Ltd., as its stock price performed poorly due to revisions to its duty-free contract. We also sold the Fund's shares in Ping An Insurance Co. of China Ltd.; online auto retailer Autohome Inc; China Merchants Bank; hotel-chain operator Huazhu Group Ltd.; and Petobras, Brazil's state-owned oil company. Furthermore, the Fund no longer holds global internet company Naspers Ltd. following a recent corporate action in which the majority of the position was exchanged for shares of Prosus NV. We believe that Prosus offers a more attractive valuation opportunity to access the portfolio of technology businesses owned by the company, including internet and technology company Tencent Holdings Ltd.
We initiated more holdings that we believe will benefit from various structural trends, such as the accelerating adoption of 5G, cloud computing, artificial intelligence and the Internet of Things.1 In the hardware segment, we initiated a holding in ASM International NV, a semiconductor wafer equipment maker, and Delta Electronics, a diversified global supplier of electronics components. We established new positions in several software companies, including Globant SA, a
1 The Internet of Things refers to a system of interrelated, internet-connected objects that are able to collect and transfer data over a wireless network without human intervention.
| 16 | 2021 Annual Report |
Aberdeen Emerging Markets Fund (Unaudited) (concluded)
software and user-experience consultancy which we believe has an upbeat growth outlook as more companies adopt digital solutions. In China, we initiated a holding in GDS Holdings Ltd., one of the largest providers of high-performance internet data centers, as we believe that the company is well-placed to benefit from policies supporting cloud adoption in that country. We also established new positions in several internet-oriented companies, including Kakao Corp., South Korea's top online platform, and Sea Ltd., which operates e-commerce, gaming and fintech platforms that benefit from accelerating digital penetration trends. We also initiated a holding in Russian fintech company TCS Group Holding PLC. Furthermore, we established several new Fund positions outside of the technology sector over the reporting period. In our view, sock exchange operator B3 SA offers attractive exposure to Brazil's rising capital markets penetration. We think that Rumo, Brazil's largest independent railroad operator, has an appealing growth profile. Maruti Suzuki India Ltd., India's largest passenger-vehicle manufacturer, has a dominant market share in the four-wheeler market and, in our view, an unparalleled distribution network. We believe that Zhongsheng Group Holdings Ltd., a major Chinese automotive dealer, benefits from a strong portfolio of premium car brands, recurring cash flows from its after-sales business, and scale2 advantage with its ability to make accretive acquisitions.
Despite China's regulatory agenda related to social equality, data security and environmental sustainability, we believe that the government remains pro-innovation and, in the long term, a greater focus on social equality should put the economy on a more sustainable footing. It is a similar story with the shift in the country's growth model to have less reliance on the property sector. We also feel that the global economic recovery is supported by accelerating COVID-19 vaccination rates that allow an easing of mobility restrictions. In our view, this should mitigate the pockets of inflationary pressure in parts of EMs tied to rising energy prices and near-term supply-chain disruptions. With central banks across EMs on the front foot and external balances3 mostly in good shape, we view the risks associated with the U.S. Federal Reserve's tapering as manageable for most of the EM equities asset class.
We think that valuations in EMs are now looking more supportive and, as stock-pickers, we remain focused on what we believe are attractively valued companies with pricing power and sustainable economic moats4 that drive long-term returns. In our view, EM stocks remain attractive due to the diversity of high-quality companies underpinned by structural growth drivers, including healthy demographics, a growing middle class, and reasonable valuations. We believe that, by maintaining our disciplined, bottom-up investment
approach, the Fund's holdings should deliver sustainable returns to shareholders over the longer term.
Portfolio Management:
Global Emerging Markets Equity Team
PAST PERFORMANCE DOES NOT GUARANTEE FUTURE RESULTS.
The performance data quoted represents past performance and current returns may be lower or higher. Class A Shares have up to a 5.75% front-end sales charge and a 0.25% 12b-1 fee. The investment return and principal value will fluctuate so that an investor's shares, when redeemed, may be worth more or less than the original cost. To obtain performance information current to the most recent month-end, which may be higher or lower than the performance shown above, please call 866-667-9231 or go to https://www.abrdn.com/en-us/us/investor/fund-centre.
Investing in mutual funds involves risk, including the possible loss of principal.
Indexes are unmanaged and have been provided for comparison purposes only. No fees or expenses are reflected. You cannot invest directly in an index.
Risk Considerations
Deteriorating market conditions might cause a general weakness in the market that reduces the prices, or yield, of securities in those markets in which the Fund invests.
The value of a security may decline for reasons directly related to the issuer, such as management performance, financial leverage and reduced demand for the issuer's goods or services.
The stock or other security of a company may not perform as well as expected, and may decrease in value, because of factors related to the company, to the industry in which the company is engaged, or to the market as a whole.
The Fund is subject to the risk that the Adviser or Subadviser may make poor security selections.
The risks that apply to foreign investments are greater for securities of companies in emerging market countries because the countries may have less stable governments, more volatile currencies and less established markets.
The value of foreign currencies relative to the U.S. Dollar fluctuates in response to market, economic, political, regulatory, geopolitical or other conditions. Fluctuations in currency exchange rates may impact a Fund's returns more greatly to the extent the Fund does not hedge currency exposure or hedging techniques are unsuccessful.
Please read the prospectus for more detailed information regarding these and other risks.
2 Companies with scale are able to handle increasing amounts of work or sales in a capable, cost-effective manner.
3 External balance occurs when the money a country brings in from exports is roughly equal to the money it spends on imports.
4 A moat is a competitive advantage that a company has over its peers in the same industry.
| 2021 Annual Report | 17 |
Aberdeen Emerging Markets Fund (Unaudited)
| Average Annual Total Return1 (For periods ended October 31, 2021) | 1 Yr. | 5 Yr. | 10 Yr. | ||||||||||||
| Class A | w/o SC | 20.87 | % | 9.41 | % | 5.59 | % | ||||||||
| w/SC2 | 13.94 | % | 8.11 | % | 4.96 | % | |||||||||
| Class C | w/o SC | 20.16 | % | 8.83 | % | 5.00 | % | ||||||||
| w/SC3 | 19.16 | % | 8.83 | % | 5.00 | % | |||||||||
| Class R4 | w/o SC | 20.68 | % | 9.23 | % | 5.35 | % | ||||||||
| Institutional Service Class4 | w/o SC | 21.29 | % | 9.79 | % | 5.81 | % | ||||||||
| Institutional Class4 | w/o SC | 21.45 | % | 9.93 | % | 6.00 | % | ||||||||
All figures showing the effect of a sales charge (SC) reflect the maximum charge possible because it has the most significant effect on performance data. The total returns shown above do not include the impact of financial statement rounding of the net asset value (NAV) per share and/or financial statement adjustments.
| 1 | Returns before the first offering of Class A, Class C and Class R (May 21, 2012) are based on the previous performance of the Institutional Class. Excluding the effect of any fee waivers or reimbursements, this performance is substantially similar to what Class A, Class C and Class R would have produced because all classes invest in the same portfolio of securities. Returns would only differ to the extent of the differences in expenses of the classes. |
| 2 | A 5.75% front-end sales charge was deducted. |
| 3 | A 1.00% contingent deferred sales charge (CDSC) was deducted from the one year return because it is charged when Class C shares are sold within the first year after purchase. |
| 4 | Not subject to any sales charges. |
Performance of a $1,000,000* Investment (as of October 31, 2021)

* Minimum Initial Investment
Comparative performance of $1,000,000 invested in Institutional Class shares of the Aberdeen Emerging Markets Fund, Morgan Stanley
Capital International (MSCI) Emerging Markets Index (Net Dividends) and the Consumer Price Index (CPI) over a 10-year period ended October 31, 2021. Unlike the Fund, the returns for these unmanaged indexes do not reflect any fees, expenses, or sales charges. Investors cannot invest directly in market indexes.
The MSCI Emerging Markets Index captures large and mid cap representation across 27 Emerging Markets (EM) countries. With 1,421 constituents, the index covers approximately 85% of the free float-adjusted market capitalization in each country. EM countries in the Index are: Argentina, Brazil, Chile, China, Colombia, Czech Republic, Egypt, Greece, Hungary, India, Indonesia, Korea, Malaysia, Mexico, Pakistan, Peru, Philippines, Poland, Qatar, Russia, Saudi Arabia, South Africa, Taiwan, Thailand, Turkey and United Arab Emirates.
The CPI is a measure of the average change over time in the prices paid by urban consumers for a market basket of consumer goods and services.
Investment return and principal value will fluctuate, and when redeemed, shares may be worth more or less than original cost. Past performance is no guarantee of future results. The Average Annual Total Return table and Performance graph do not reflect the deduction of taxes that a shareholder would pay on fund distributions or the redemption of fund shares. Investing in mutual funds involves market risk, including loss of principal. Performance returns assume the reinvestment of all distributions. Total returns reflect waivers and reimbursements in effect, without which returns would have been lower.
| 18 | 2021 Annual Report |
Aberdeen Emerging Markets Fund (Unaudited)
Portfolio Summary (as a percentage of net assets)
October 31, 2021 (Unaudited)
| Asset Allocation | ||||
| Common Stocks | 91.2 | % | ||
| Preferred Stocks | 9.3 | % | ||
| Short-Term Investment | 0.1 | % | ||
| Liabilities in Excess of Other Assets | (0.6 | %) | ||
| 100.0 | % |
The following table summarizes the composition of the Fund's portfolio, in S&P Global Industry Classification Standard (GICS) sectors, expressed as a percentage of net assets as of October 31, 2021.
| Top Sectors | ||||
| Information Technology | 29.2 | %* | ||
| Financials | 19.6 | % | ||
| Consumer Discretionary | 15.8 | % | ||
| Materials | 9.4 | % | ||
| Communication Services | 7.0 | % | ||
| Industrials | 5.9 | % | ||
| Consumer Staples | 5.0 | % | ||
| Energy | 3.7 | % | ||
| Health Care | 2.8 | % | ||
| Real Estate | 1.1 | % | ||
| Other | 0.5 | % | ||
| 100.0 | % |
| * | As of October 31, 2021, the Fund's holdings in the Information Technology sector were allocated to four industries: Semiconductors & Semiconductor Equipment (14.3%), Technology Hardware, Storage & Peripherals (8.1%), Electronic Equipment Instruments & Components (3.7%) and Information Technology Services (3.1%). |
| Top Holdings* | ||||
| Taiwan Semiconductor Manufacturing Co. Ltd. | 8.9 | % | ||
| Samsung Electronics Co. Ltd. | 8.0 | % | ||
| Alibaba Group Holding Ltd. | 4.2 | % | ||
| Tencent Holdings Ltd. | 4.2 | % | ||
| Housing Development Finance Corp. Ltd. | 2.9 | % | ||
| Prosus NV | 2.5 | % | ||
| LONGi Green Energy Technology Co. Ltd., A Shares | 2.4 | % | ||
| LG Chem Ltd. | 2.2 | % | ||
| ASML Holding NV | 2.1 | % | ||
| Tata Consultancy Services Ltd. | 2.1 | % | ||
| Other | 60.5 | % | ||
| 100.0 | % |
| * | For the purpose of listing top holdings, Short-Term Investments are included as part of Other. |
| Top Countries | ||||
| China | 32.9 | % | ||
| Taiwan | 12.4 | % | ||
| India | 12.3 | % | ||
| South Korea | 12.2 | % | ||
| Russia | 6.9 | % | ||
| Brazil | 5.0 | % | ||
| Mexico | 4.6 | % | ||
| Hong Kong | 4.1 | % | ||
| Netherlands | 3.1 | % | ||
| Indonesia | 2.2 | % | ||
| Other | 4.3 | % | ||
| 100.0 | % |
| 2021 Annual Report | 19 |
Statement of Investments
October 31, 2021
Aberdeen Emerging Markets Fund
| Shares or Principal Amount | Value | |||||||
| COMMON STOCKS (91.2%) | ||||||||
| ARGENTINA (0.4%) | ||||||||
| Information Technology (0.4%) | ||||||||
| Globant SA (a) | 58,402 | $ | 18,641,334 | |||||
| AUSTRIA (1.5%) | ||||||||
| Materials (1.5%) | ||||||||
| Mondi PLC | 2,992,503 | 74,614,016 | ||||||
| BRAZIL (3.7%) | ||||||||
| Consumer Discretionary (1.0%) | ||||||||
| MercadoLibre, Inc. (a) | 33,211 | 49,186,155 | ||||||
| Financials (0.5%) | ||||||||
| B3 SA – Brasil Bolsa Balcao | 11,891,911 | 25,095,266 | ||||||
| Industrials (1.1%) | ||||||||
| Rumo SA (a) | 9,973,057 | 28,255,640 | ||||||
| WEG SA | 4,341,526 | 28,462,465 | ||||||
| 56,718,105 | ||||||||
| Materials (1.1%) | ||||||||
| Vale SA, ADR | 4,225,709 | 53,793,276 | ||||||
| 184,792,802 | ||||||||
| CHINA (32.9%) | ||||||||
| Communication Services (4.2%) | ||||||||
| Tencent Holdings Ltd. | 3,392,100 | 206,340,740 | ||||||
| Consumer Discretionary (13.1%) | ||||||||
| Alibaba Group Holding Ltd. (a) | 10,172,600 | 209,175,694 | ||||||
| China Tourism Group Duty Free Corp. Ltd., A Shares (Stock Connect) (b) | 1,657,603 | 69,425,036 | ||||||
| Li Ning Co. Ltd. | 4,212,500 | 46,485,175 | ||||||
| Meituan, B Shares (a)(c) | 1,560,400 | 53,098,243 | ||||||
| Midea Group Co. Ltd., A Shares (Stock Connect) (b) | 5,054,316 | 54,215,661 | ||||||
| Prosus NV (a) | 1,383,961 | 121,903,409 | ||||||
| Shenzhou International Group Holdings Ltd. | 3,357,800 | 72,341,115 | ||||||
| Zhongsheng Group Holdings Ltd. | 2,097,000 | 18,907,279 | ||||||
| 645,551,612 | ||||||||
| Consumer Staples (0.7%) | ||||||||
| Kweichow Moutai Co. Ltd., A Shares (Stock Connect) (b) | 121,415 | 34,646,836 | ||||||
| Financials (1.9%) | ||||||||
| China Merchants Bank Co. Ltd., H Shares | 11,030,000 | 92,432,927 | ||||||
| Health Care (2.8%) | ||||||||
| Hangzhou Tigermed Consulting Co. Ltd., A Shares (b) | 1,234,495 | 32,863,511 | ||||||
| Hangzhou Tigermed Consulting Co. Ltd., H Shares (c) | 200,700 | 3,914,377 | ||||||
| Wuxi Biologics Cayman, Inc. (a)(c) | 6,660,000 | 100,878,700 | ||||||
| 137,656,588 | ||||||||
| Shares or Principal Amount | Value | |||||||
| Industrials (4.2%) | ||||||||
| China Conch Venture Holdings Ltd. | 7,463,500 | $ | 36,267,726 | |||||
| NARI Technology Co. Ltd., A Shares (Stock Connect) (b) | 16,865,176 | 102,690,750 | ||||||
| Sungrow Power Supply Co. Ltd., A Shares (Stock Connect) (b) | 2,761,878 | 70,990,036 | ||||||
| 209,948,512 | ||||||||
| Information Technology (3.0%) | ||||||||
| GDS Holdings Ltd. Class A (a) | 4,125,300 | 30,981,161 | ||||||
| LONGi Green Energy Technology Co. Ltd., A Shares (b) | 7,626,898 | 116,287,088 | ||||||
| 147,268,249 | ||||||||
| Materials (0.9%) | ||||||||
| Yunnan Energy New Material Co. Ltd., A Shares (Stock Connect) (b) | 947,675 | 43,219,667 | ||||||
| Real Estate (1.1%) | ||||||||
| China Resources Land Ltd. | 13,826,000 | 53,720,483 | ||||||
| Utilities (1.0%) | ||||||||
| China Resources Gas Group Ltd. | 9,370,000 | 50,339,438 | ||||||
| 1,621,125,052 | ||||||||
| HONG KONG (4.1%) | ||||||||
| Consumer Staples (1.0%) | ||||||||
| Budweiser Brewing Co. APAC Ltd. (c) | 16,750,100 | 45,942,204 | ||||||
| Financials (3.1%) | ||||||||
| AIA Group Ltd. | 7,557,000 | 84,691,365 | ||||||
| Hong Kong Exchanges & Clearing Ltd. | 1,147,565 | 69,131,273 | ||||||
| 153,822,638 | ||||||||
| 199,764,842 | ||||||||
| INDIA (12.3%) | ||||||||
| Consumer Discretionary (0.5%) | ||||||||
| Maruti Suzuki India Ltd. | 247,800 | 24,724,265 | ||||||
| Consumer Staples (1.9%) | ||||||||
| Hindustan Unilever Ltd. | 1,466,819 | 46,867,226 | ||||||
| ITC Ltd. | 14,941,054 | 44,660,455 | ||||||
| 91,527,681 | ||||||||
| Financials (6.3%) | ||||||||
| Housing Development Finance Corp. Ltd. | 3,763,682 | 143,335,217 | ||||||
| Kotak Mahindra Bank Ltd. | 3,341,178 | 91,372,165 | ||||||
| SBI Life Insurance Co. Ltd. (c) | 4,894,446 | 74,965,581 | ||||||
| 309,672,963 | ||||||||
| Information Technology (2.1%) | ||||||||
| Tata Consultancy Services Ltd. | 2,273,033 | 103,509,614 | ||||||
| Materials (1.5%) | ||||||||
| UltraTech Cement Ltd. | 748,488 | 76,552,052 | ||||||
| 605,986,575 | ||||||||
See accompanying Notes to Financial Statements.
| 20 | 2021 Annual Report |
Statement of Investments (concluded)
October 31, 2021
Aberdeen Emerging Markets Fund
| Shares or Principal Amount | Value | |||||||
| COMMON STOCKS (continued) | ||||||||
| INDONESIA (2.2%) | ||||||||
| Financials (2.2%) | ||||||||
| Bank Central Asia Tbk PT | 111,265,000 | $ | 58,834,407 | |||||
| Bank Rakyat Indonesia Persero Tbk PT | 165,219,844 | 49,596,294 | ||||||
| 108,430,701 | ||||||||
| MACAO (0.6%) | ||||||||
| Consumer Discretionary (0.6%) | ||||||||
| Sands China Ltd. (a) | 12,240,800 | 27,898,914 | ||||||
| MEXICO (4.6%) | ||||||||
| Consumer Staples (1.4%) | ||||||||
| Fomento Economico Mexicano SAB de CV, ADR | 822,096 | 67,568,070 | ||||||
| Financials (1.5%) | ||||||||
| Grupo Financiero Banorte SAB de CV, Class O | 11,847,619 | 74,890,671 | ||||||
| Industrials (0.6%) | ||||||||
| Grupo Aeroportuario del Sureste SAB de CV, Class B | 1,574,556 | 31,806,980 | ||||||
| Materials (1.1%) | ||||||||
| Grupo Mexico SAB de CV, Class B | 12,420,764 | 54,429,829 | ||||||
| 228,695,550 | ||||||||
| NETHERLANDS (3.1%) | ||||||||
| Information Technology (3.1%) | ||||||||
| ASM International NV | 100,160 | 45,330,872 | ||||||
| ASML Holding NV | 129,188 | 105,016,874 | ||||||
| 150,347,746 | ||||||||
| PHILIPPINES (0.5%) | ||||||||
| Financials (0.5%) | ||||||||
| Bank of the Philippine Islands | 13,044,794 | 22,500,393 | ||||||
| POLAND (0.6%) | ||||||||
| Consumer Discretionary (0.6%) | ||||||||
| Allegro.eu SA (a)(c) | 2,562,219 | 28,976,808 | ||||||
| RUSSIA (6.9%) | ||||||||
| Communication Services (0.9%) | ||||||||
| Yandex N.V., Class A (a) | 557,273 | 46,164,495 | ||||||
| Energy (3.7%) | ||||||||
| LUKOIL PJSC, ADR | 819,012 | 83,563,794 | ||||||
| Novatek PJSC | 3,856,599 | 98,218,528 | ||||||
| 181,782,322 | ||||||||
| Financials (2.3%) | ||||||||
| Sberbank of Russia PJSC | 13,275,138 | 66,651,294 | ||||||
| TCS Group Holding PLC, GDR | 448,574 | 46,057,081 | ||||||
| 112,708,375 | ||||||||
| 340,655,192 | ||||||||
| SOUTH AFRICA (1.2%) | ||||||||
| Materials (1.2%) | ||||||||
| Anglo American Platinum Ltd. | 602,684 | 60,895,744 | ||||||
| Shares or Principal Amount | Value | |||||||
| SOUTH KOREA (4.2%) | ||||||||
| Communication Services (0.5%) | ||||||||
| Kakao Corp. | 210,570 | $ | 22,654,046 | |||||
| Information Technology (1.6%) | ||||||||
| Samsung SDI Co. Ltd. | 124,148 | 78,328,427 | ||||||
| Materials (2.1%) | ||||||||
| LG Chem Ltd. | 147,632 | 105,934,068 | ||||||
| 206,916,541 | ||||||||
| TAIWAN (12.4%) | ||||||||
| Communication Services (1.4%) | ||||||||
| Sea Ltd., ADR (a) | 194,151 | 66,704,459 | ||||||
| Information Technology (11.0%) | ||||||||
| Delta Electronics, Inc. | 5,651,000 | 49,883,492 | ||||||
| Hon Hai Precision Industry Co. Ltd. | 14,107,000 | 54,457,789 | ||||||
| Taiwan Semiconductor Manufacturing Co. Ltd. | 20,602,017 | 437,180,772 | ||||||
| 541,522,053 | ||||||||
| 608,226,512 | ||||||||
| Total Common Stocks | 4,488,468,722 | |||||||
| PREFERRED STOCKS (9.3%) | ||||||||
| BRAZIL (1.3%) | ||||||||
| Financials (1.3%) | ||||||||
| Banco Bradesco SA, ADR, Preferred Shares, 1.94% | 17,179,279 | 60,127,477 | ||||||
| SOUTH KOREA (8.0%) | ||||||||
| Information Technology (8.0%) | ||||||||
| Samsung Electronics Co. Ltd. | 7,172,484 | 394,027,539 | ||||||
| Total Preferred Stocks | 454,155,016 | |||||||
| SHORT-TERM INVESTMENT (0.1%) | ||||||||
| UNITED STATES (0.1%) | ||||||||
| State Street Institutional U.S. Government Money Market Fund, Premier Class, 0.03% (d) | 6,077,284 | 6,077,284 | ||||||
| Total Short-Term Investment | 6,077,284 | |||||||
| Total Investments (Cost $3,710,230,800) (e)—100.6% | 4,948,701,022 | |||||||
| Liabilities in Excess of Other Assets—(0.6)% | (27,248,103 | ) | ||||||
| Net Assets—100.0% | $ | 4,921,452,919 | ||||||
| (a) | Non-income producing security. | |
| (b) | China A Shares. These shares are issued in local currency, traded in the local stock markets and are held through either a Qualified Foreign Institutional Investor (QFII) license or the Shanghai or Shenzhen Hong-Kong Stock Connect program. | |
| (c) | Denotes a security issued under Regulation S or Rule 144A. | |
| (d) | Registered investment company advised by State Street Global Advisors. The rate shown is the 7 day yield as of October 31, 2021. | |
| (e) | See accompanying Notes to Financial Statements for tax unrealized appreciation/(depreciation) of securities. |
| ADR | American Depositary Receipt | |
| GDR | Global Depositary Receipt | |
| PLC | Public Limited Company |
See accompanying Notes to Financial Statements.
| 2021 Annual Report | 21 |
Aberdeen Emerging Markets Sustainable Leaders Fund (Unaudited)
The Aberdeen Emerging Markets Sustainable Leaders Fund (Institutional Class shares net of fees) returned 20.06% for the 12-month reporting period ended October 31, 2021, versus the 16.96% return of its benchmark, the MSCI Emerging Markets Index (net dividends).
Emerging-market (EM) equities posted notable gains over the reporting period, with the exception of China. Stock prices initially rallied on investors' optimism regarding the COVID-19 vaccine rollout, which allowed the reopening of economies worldwide. Upbeat corporate earnings, driven by an e-commerce boom, a multi-year technology upgrading cycle and pent-up infrastructure demand also bolstered investor sentiment. Increasing adoption of climate-change goals by governments globally also fueled interest in clean-energy themes. These positive factors outweighed investors' concerns over supply-chain disruptions caused by a shortage of semiconductors, shipping gridlocks, and an energy crunch. However, the spread of the more contagious Delta variant of COVID-19 capped the stock market gains in some EM economies due to their relatively slower vaccine rollouts.
In China, the government's efforts to promote "common prosperity" led to a tougher regulatory environment for some business models. Stock prices fell as the government increased its focus on sustainable development issues, including: excessive real estate debt, the high cost of living, education, gaming, worker welfare, technology giants' antitrust issues, data-privacy practices and climate change.
Elsewhere in Asia, Indian equities scaled all-time highs despite the country's struggles against a deadly wave of COVID-19 cases in the first half of the reporting period. The Indian government's pro-business policies exceeded the market's expectations and buoyed investor sentiment. Share prices also were lifted by the Indian government's decision not to implement a nationwide lockdown, as this sustained the corporate earnings recovery. The Taiwanese and South Korean markets performed well over the reporting period because of their dominance in the electronics supply chain.
The markets in Latin America and Russia benefited over the reporting period from bullish commodity prices and hopes that massive fiscal stimulus in the U.S. would further boost their exports. Central banks in Brazil, Mexico and Russia began to raise their respective benchmark interest rates in an effort to control inflationary pressures.
The Fund's outperformance relative to its benchmark, the MSCI Emerging Markets Index, for the reporting period was attributable mainly to strong stock selection in the information technology, consumer discretionary, industrials and financials sectors. Conversely, underweight exposure to the energy sector weighed on Fund performance. The holdings in China were the main contributors to Fund performance for the reporting period, and positions in the Netherlands and Kazakhstan, which are not constituents of the benchmark MSCI Emerging Markets Index, also had a positive impact. Conversely, positions in the UK, Brazil and South Africa, as well as the underweight to Taiwan, hampered Fund performance for the reporting period.
Given the global chip shortage, demand for foundry operations boosted shares of the Fund's holdings in semiconductor manufacturers ASML Holding NV, ASM International NV, and Taiwan Semiconductor Manufacturing Co. (TSMC).
In China, the Fund's holdings in power grid company Nari Technology Co. Ltd., and solar energy company Longi Green Energy Technology Co. enhanced performance for the reporting period due to their alignment to national clean energy objectives. Conversely, the Fund's holding in property developer China Vanke Co. Ltd. detracted from performance due to the Chinese government's regulatory crackdown on excessive debt in the property sector.
In Russia, financial stocks recovered over the reporting period after declining earlier in the COVID-19 pandemic on investors' concerns that the heightened credit risk amid a low-interest-rate environment would hurt lenders' profits. The Fund's holding in Sberbank of Russia PJSC contributed to performance, and its outlook was further boosted when the Central Bank of the Russian Federation began to raise interest rates. Conversely, the absence of a position in state-owned oil and gas company Gazprom PJSC weighed on Fund performance amid the strong run-up in oil prices during the reporting period. Finally, the Fund's holding in Kazakhstan-based fintech firm Kaspi also contributed positively to performance for the reporting period.
In Poland, shares of the Fund's holding in online retailer Allegro pl moved lower over the reporting period on investors' worries about increasing competition. Southeast Asia-based Shopee pl (which the Fund does not hold) made its debut in Europe via Poland in October 2021, while U.S.-based online retailing giant Amazon.com Inc. launched its Prime service in the country in March 2021. Nonetheless, we believe that Allegro is positioned well to resist further competition in Polish e-commerce. Parcel delivery company InPost SA's June 2021 quarterly results fell short of the company's forecasts. While some investors worried about the impact of Amazon and Shopee into Poland on competitive dynamics, we view InPost as being aligned to the growth of these two e-commerce companies and Allegro.
In the first half of the reporting period, with a shift in the Fund's focus towards EM companies, we exited positions in companies that no longer fit the mandate and reinvested the proceeds into EM holdings, including TSMC; speciality chemicals producer LG Chem Ltd.; and Samsung Electronics Co. Ltd., a manufacturer of consumer electronics. These companies have a record of delivering strong stock-price returns and, in our view, meet the Fund's high environmental, social and governance (ESG) standards. Other new holdings included InPost; paints and coatings maker Asian Paints Ltd.; environmental protection solutions China Conch Venture Holdings Ltd.; Mondi plc, a provider of sustainable packaging and paper solutions; enterprise resource planning software company Logo Yazilim Sanayi Ve Ticaret AS; ASM International NV, a semiconductor wafer equipment maker; fintech company Kaspi KZ JSC; electronics manufacturer Hon Hai Precision Industry Co., Ltd; Centre Testing International Group Co. Ltd., a provider of testing and inspecting services for industrial
| 22 | 2021 Annual Report |
Aberdeen Emerging Markets Sustainable Leaders Fund (Unaudited) (continued)
products and consumer products.; clean energy company Sungrow Power Supply Co. Ltd.; Zhongsheng Group Holdings Ltd., a major Chinese automotive dealer; and financial services company Santander Chile Holding SA.., We exited the Fund's positions in robotics company Headhunter Ltd.; e-commerce company Baozun Inc.; Brazilian stock exchange operator B3 SA; enterprise software company Kingdee International Software Group Ltd.; and property developer China Resources Land Ltd.
In the second half of the reporting period, we exited the Fund's position in education services provider New Oriental Education & Technology Group Inc. before news of the government's overhaul of China's private education sector hampered the company's business model. We sold the Fund's shares in online food-delivery service Delivery Hero SE as we felt that, even after our meeting with management regarding labor risk in the gig economy across the markets in which it operates, the company was not taking a leadership position on the issue. Similarly, we exited the Fund's position in online delivery service provider Meituan in light of our higher expectations for social and governance responsibilities around gig economy workers in China. We sold the holding in Grupo Aeroportuario Centro Norte (OMA) as our engagement with the airport operator raised our concerns that the company was not sufficiently proactive in its management of climate risks inherent in its business. We also exited the Fund's position in Ping An Insurance Co. of China Ltd. and online auto retailer Autohome Inc. Additionally, as of the end of the reporting period, the Fund no longer had a position in global internet company Naspers Ltd. following a recent corporate action in which the majority of the position was exchanged for Prosus NV. We believe that Prosus offers a more attractive valuation opportunity to access the portfolio of technology businesses owned by the group, including internet and technology company Tencent Holdings Ltd.
In the second half of the reporting period, we initiated holdings in Vitasoy International Holdings Ltd.; Nanjing Estun Automation Co., Ltd.; Contemporary Amperex Technology Co. Ltd,; Kakao Corp., Sea Ltd.; Aegis Logistics Ltd.; and Renew Energy Global plc.
In our view, China-based Vitasoy International has a high-quality branded consumer business. The company has expanded its business as the Chinese market has seen increased adoption of branded soy products and a preference for domestic brands. Nanjing Estun Automation is a leading Chinese robotics manufacturer which, in our view, is poised to benefit from a multi-year domestic automation growth trend. Contemporary Amperex Technology is a Chinese battery manufacturer with exposure to growing demand for electric vehicles and storage solutions within the renewable energy industry. In our opinion, South Korea's Kakao Corp. provides high-quality exposure to diversified technology businesses, and has demonstrated effective management of ESG risks. Elsewhere, Sea Ltd. operates e-commerce, gaming and fintech platforms that are benefiting from robust digital penetration growth trends. We feel that India-based Aegis Logistics provides the Fund with good-quality exposure to gas
businesses supportive of climate transition challenges in the country. In our view, Renew Energy Global is an attractive renewables developer benefiting from the increased focus on renewables investment.
Despite China's regulatory agenda related to social equality, data security and environmental sustainability, we believe that the government remains pro-innovation and, in the long term, a greater focus on social equality should put the economy on a more sustainable footing. It is a similar story with the shift in the country's growth model to have less reliance on the property sector. We also feel that the global economic recovery is supported by accelerating COVID-19 vaccination rates that allow an easing of mobility restrictions. In our view, this should mitigate the pockets of inflationary pressure in parts of EMs tied to rising energy prices and near-term supply-chain disruptions. With central banks across EMs on the front foot and external balances1 mostly in good shape, we view the risks associated with the U.S. Federal Reserve's tapering as manageable for most of the EM equities asset class.
We think that valuations in EMs are now looking more supportive and, as stock-pickers, we remain focused on what we believe are attractively valued companies with pricing power and sustainable economic moats2 that drive long-term returns. In our view, EM stocks remain attractive due to the diversity of high-quality companies underpinned by structural growth drivers, including healthy demographics, a growing middle class, and reasonable valuations. We believe that, by maintaining our disciplined, bottom-up investment approach, the Fund's holdings should deliver sustainable returns to shareholders over the longer term.
Effective December 1, 2020, the Aberdeen International Equity Fund changed its name to Aberdeen Emerging Markets Sustainable Leaders Fund and changed its principal investment strategies. The Fund seeks to achieve its investment objective of long-term capital appreciation by investing in equity securities of emerging market companies that the Adviser deems to have sound or improving prospects and which demonstrate that they are current or emerging sustainable leaders through their management of environmental, social and governance (ESG) risks and opportunities in accordance with the Adviser's criteria.
Portfolio Management:
Global Emerging Markets Equity Team
PAST PERFORMANCE DOES NOT GUARANTEE FUTURE RESULTS.
The performance data quoted represents past performance and current returns may be lower or higher. Class A Shares have up to a 5.75% front-end sales charge and a 0.25% 12b-1 fee. The investment return and principal value will fluctuate so that an investor's shares, when redeemed, may be worth more or less than the original cost. To obtain performance information current to the most recent month-end, which may be higher or lower than the performance shown above, please call 866-667-9231 or go to https://www.abrdn.com/en-us/us/investor/fund-centre.
Investing in mutual funds involves risk, including the possible loss of principal.
Indexes are unmanaged and have been provided for comparison purposes only. No fees or expenses are reflected. You cannot invest directly in an index.
1 External balance occurs when the money a country brings in from exports is roughly equal to the money it spends on imports.
2 A moat is a competitive advantage that a company has over its peers in the same industry.
| 2021 Annual Report | 23 |
Aberdeen Emerging Markets Sustainable Leaders Fund (Unaudited) (concluded)
Risk Considerations
Deteriorating market conditions might cause a general weakness in the market that reduces the prices, or yield, of securities in those markets in which the Fund invests.
The value of a security may decline for reasons directly related to the issuer, such as management performance, financial leverage and reduced demand for the issuer's goods or services.
The stock or other security of a company may not perform as well as expected, and may decrease in value, because of factors related to the company, to the industry in which the company is engaged, or to the market as a whole.
The Fund is subject to the risk that the Adviser or Subadviser may make poor security selections.
The Fund's "Sustainable Leaders" strategy could cause it to perform differently compared to funds that do not have such strategy. ESG considerations may be linked to long-term rather than short-term
returns. The criteria related to the Fund's Sustainable Leaders strategy, including the exclusion of securities of companies that engage in certain business activities, may result in the Fund forgoing opportunities to buy certain securities when it might otherwise be advantageous to do so, or selling securities for ESG reasons when it might be otherwise disadvantageous for it to do so.
The risks that apply to foreign investments are greater for securities of companies in emerging market countries because the countries may have less stable governments, more volatile currencies and less established markets.
The value of foreign currencies relative to the U.S. Dollar fluctuates in response to market, economic, political, regulatory, geopolitical or other conditions. Fluctuations in currency exchange rates may impact a Fund's returns more greatly to the extent the Fund does not hedge currency exposure or hedging techniques are unsuccessful.
Please read the prospectus for more detailed information regarding these and other risks.
| 24 | 2021 Annual Report |
Aberdeen Emerging Markets Sustainable Leaders Fund (Unaudited)
| Average Annual Total Return1 (For periods ended October 31, 2021) | 1 Yr. | 5 Yr. | 10 Yr. | ||||||||||||
| Class A | w/o SC | 19.65 | % | 9.39 | % | 5.38 | % | ||||||||
| w/ SC2 | 12.77 | % | 8.11 | % | 4.76 | % | |||||||||
| Class C | w/o SC | 18.86 | % | 8.69 | % | 4.67 | % | ||||||||
| w/SC3 | 17.86 | % | 8.69 | % | 4.67 | % | |||||||||
| Class R4 | w/o SC | 19.29 | % | 9.10 | % | 5.09 | % | ||||||||
| Institutional Service Class4 | w/o SC | 20.02 | % | 9.76 | % | 5.65 | % | ||||||||
| Institutional Class4 | w/o SC | 20.06 | % | 9.80 | % | 5.74 | % | ||||||||
All figures showing the effect of a sales charge (SC) reflect the maximum charge possible because it has the most significant effect on performance data. The total returns shown above do not include the impact of financial statement rounding of the net asset value (NAV) per share and/or financial statement adjustments.
| 1 | The Fund changed its investment strategies effective December 1, 2020. Performance information for periods prior to December 1, 2020 does not reflect the current investment strategy. In connection with the change in investment strategy, the Fund changed its name from Aberdeen International Equity Fund to Aberdeen Emerging Markets Sustainable Leaders Fund. Please consult the Fund's prospectus for more detail. | |
| 2 | A 5.75% front-end sales charge was deducted. | |
| 3 | A 1.00% contingent deferred sales charge (CDSC) was deducted from the one year return because it is charged when Class C shares are sold within the first year after purchase. | |
| 4 | Not subject to any sales charges. |
Performance of a $10,000 Investment (as of October 31, 2021)

Comparative performance of $10,000 invested in Class A shares of the Aberdeen Emerging Markets Sustainable Leaders Fund, the Morgan Stanley Capital International (MSCI) Emerging Markets Index (Net Dividends), the MSCI All Country World ex-US Index (Net Dividends) and the Consumer Price Index (CPI) over a 10-year period ending October 31, 2021. Effective December 1, 2020, the MSCI Emerging Markets Index (Net Dividends) replaced the MSCI All Country Word ex U.S. Index (Net Dividends) as the Fund's primary benchmark in connection with the Fund's change in investment strategy. Unlike the Fund, the returns for these unmanaged indexes do
not reflect any fees, expenses, or sales charges. Investors cannot invest directly in market indexes.
The MSCI Emerging Markets Index captures large and mid cap representation across 27 Emerging Markets (EM) countries. With 1,424 constituents, the index covers approximately 85% of the free float-adjusted market capitalization in each country. EM countries in the Index are: Argentina, Brazil, Chile, China, Colombia, Czech Republic, Egypt, Greece, Hungary, India, Indonesia, Korea, Kuwait, Malaysia, Mexico, Pakistan, Peru, Philippines, Poland, Qatar, Russia, Saudi Arabia, South Africa, Taiwan, Thailand, Turkey and United Arab Emirates.
The MSCI ACWI ex US Index captures large and mid cap representation across 22 of 23 Developed Markets (DM) countries (excluding the US) and 27 Emerging Markets (EM) countries. With 2,359 constituents, the index covers approximately 85% of the global equity opportunity set outside the US. DM countries include: Australia, Austria, Belgium, Canada, Denmark, Finland, France, Germany, Hong Kong, Ireland, Israel, Italy, Japan, Netherlands, New Zealand, Norway, Portugal, Singapore, Spain, Sweden, Switzerland and the UK. EM countries include: Argentina, Brazil, Chile, China, Colombia, Czech Republic, Egypt, Greece, Hungary, India, Indonesia, Korea, Kuwait, Malaysia, Mexico, Pakistan, Peru, Philippines, Poland, Qatar, Russia, Saudi Arabia, South Africa, Taiwan, Thailand, Turkey and United Arab Emirates.
The CPI is a measure of the average change over time in the prices paid by urban consumers for a market basket of consumer goods and services.
Investment return and principal value will fluctuate, and when redeemed, shares may be worth more or less than original cost. Past performance is no guarantee of future results. The Average Annual Total Return table and Performance graph do not reflect the deduction of taxes that a shareholder would pay on fund distributions or the redemption of fund shares. Investing in mutual funds involves market risk, including loss of principal. Performance returns assume the reinvestment of all distributions. Total returns reflect waivers and reimbursements in effect, without which returns would have been lower.
| 2021 Annual Report | 25 |
Aberdeen Emerging Markets Sustainable Leaders Fund (Unaudited)
Portfolio Summary (as a percentage of net assets)
October 31, 2021 (Unaudited)
| Asset Allocation | |
| Common Stocks | 90.1% |
| Preferred Stocks | 9.0% |
| Short-Term Investment | 0.4% |
| Other Assets in Excess of Liabilities | 0.5% |
| 100.0% | |
The following table summarizes the composition of the Fund's portfolio, in S&P Global Industry Classification Standard (GICS) sectors, expressed as a percentage of net assets as of October 31, 2021.
| Top Sectors | |
| Information Technology | 30.9%* |
| Financials | 19.8% |
| Consumer Discretionary | 11.9% |
| Industrials | 10.0% |
| Communication Services | 6.7% |
| Consumer Staples | 5.2% |
| Materials | 4.8% |
| Health Care | 4.1% |
| Real Estate | 2.9% |
| Utilities | 2.2% |
| Other | 1.5% |
| 100.0% | |
| * | As of October 31, 2021, the Fund's holdings in the Information Technology sector were allocated to Five industries: Semiconductors & Semiconductor Equipment (13.6%), Technology Hardware, Storage & Peripherals (7.7%), Electronic Equipment Instruments & Components (4.2%), Information Technology Services (3.3%) and Software (2.1%). |
| Top Holdings* | |
| Taiwan Semiconductor Manufacturing Co. Ltd. | 8.7% |
| Samsung Electronics Co. Ltd. | 7.8% |
| Alibaba Group Holding Ltd. | 4.8% |
| Tencent Holdings Ltd. | 4.5% |
| Sberbank of Russia PJSC, ADR | 3.5% |
| Housing Development Finance Corp. Ltd. | 2.9% |
| LONGi Green Energy Technology Co. Ltd., A Shares | 2.3% |
| Grupo Financiero Banorte SAB de CV, Class O | 2.3% |
| Tata Consultancy Services Ltd. | 2.2% |
| LG Chem Ltd. | 2.1% |
| Other | 58.9% |
| 100.0% | |
| * | For the purpose of listing top holdings, Short-Term Investments are included as part of Other. |
| Top Countries | |
| China | 31.5% |
| Taiwan | 12.8% |
| South Korea | 12.3% |
| India | 12.3% |
| Brazil | 5.6% |
| Russia | 4.8% |
| Mexico | 3.9% |
| Hong Kong | 3.8% |
| Netherlands | 2.6% |
| Indonesia | 2.1% |
| Other | 8.3% |
| 100.0% | |
| 26 | 2021 Annual Report |
Statement of Investments
October 31, 2021
Aberdeen Emerging Markets Sustainable Leaders Fund
| Shares or Principal Amount | Value | |
| COMMON STOCKS (90.1%) | ||
| AUSTRIA (1.6%) | ||
| Materials (1.6%) | ||
| Mondi PLC | 136,695 | $ 3,408,305 |
| BRAZIL (4.4%) | ||
| Consumer Discretionary (1.1%) | ||
| MercadoLibre, Inc. (a) | 1,673 | 2,477,746 |
| Health Care (0.4%) | ||
| Notre Dame Intermedica Participacoes SA | 78,800 | 896,096 |
| Industrials (2.0%) | ||
| Rumo SA (a) | 747,900 | 2,118,948 |
| WEG SA | 335,080 | 2,196,740 |
| 4,315,688 | ||
| Real Estate (0.9%) | ||
| Multiplan Empreendimentos Imobiliarios SA | 571,932 | 1,876,782 |
| 9,566,312 | ||
| CHILE (0.5%) | ||
| Financials (0.5%) | ||
| Banco Santander Chile, ADR | 65,300 | 1,157,116 |
| CHINA (31.5%) | ||
| Communication Services (4.4%) | ||
| Tencent Holdings Ltd. | 158,700 | 9,653,688 |
| Consumer Discretionary (9.4%) | ||
| Alibaba Group Holding Ltd. (a) | 503,700 | 10,357,411 |
| Midea Group Co. Ltd., A Shares (Stock Connect) (b) | 266,329 | 2,856,806 |
| Prosus NV (a) | 48,719 | 4,291,315 |
| Zhongsheng Group Holdings Ltd. | 313,000 | 2,822,116 |
| 20,327,648 | ||
| Financials (2.0%) | ||
| China Merchants Bank Co. Ltd., H Shares | 509,000 | 4,265,490 |
| Health Care (2.9%) | ||
| Hangzhou Tigermed Consulting Co. Ltd., H Shares (c) | 105,500 | 2,057,632 |
| Wuxi Biologics Cayman, Inc. (a)(c) | 284,000 | 4,301,735 |
| 6,359,367 | ||
| Industrials (7.4%) | ||
| Centre Testing International Group Co. Ltd., A Shares (Stock Connect) (b) | 494,580 | 2,131,964 |
| China Conch Venture Holdings Ltd. | 726,500 | 3,530,315 |
| Contemporary Amperex Technology Co. Ltd., A Shares (b) | 19,800 | 1,983,406 |
| Estun Automation Co. Ltd., A Shares (b) | 516,000 | 2,136,429 |
| Sungrow Power Supply Co. Ltd., A Shares (Stock Connect) (b) | 148,542 | 3,818,055 |
| Xinjiang Goldwind Science & Technology Co. Ltd., H Shares | 1,052,800 | 2,354,370 |
| 15,954,539 | ||
| Shares or Principal Amount | Value | |
| Information Technology (4.6%) | ||
| GDS Holdings Ltd. Class A (a) | 213,800 | $ 1,605,646 |
| GDS Holdings Ltd., ADR (a) | 12,700 | 754,380 |
| Glodon Co. Ltd., A Shares (b) | 219,840 | 2,552,009 |
| LONGi Green Energy Technology Co. Ltd., A Shares (b) | 330,305 | 5,036,151 |
| 9,948,186 | ||
| Real Estate (0.8%) | ||
| China Vanke Co. Ltd., H Shares | 705,700 | 1,648,818 |
| 68,157,736 | ||
| HONG KONG (3.8%) | ||
| Consumer Staples (1.0%) | ||
| Vitasoy International Holdings Ltd. | 872,000 | 2,101,926 |
| Financials (2.8%) | ||
| AIA Group Ltd. | 258,300 | 2,894,770 |
| Hong Kong Exchanges & Clearing Ltd. | 54,800 | 3,301,246 |
| 6,196,016 | ||
| 8,297,942 | ||
| INDIA (12.3%) | ||
| Consumer Staples (1.3%) | ||
| Hindustan Unilever Ltd. | 87,451 | 2,794,200 |
| Energy (0.6%) | ||
| Aegis Logistics Ltd. | 492,000 | 1,392,604 |
| Financials (4.2%) | ||
| Housing Development Finance Corp. Ltd. | 165,857 | 6,316,461 |
| Kotak Mahindra Bank Ltd. | 102,574 | 2,805,121 |
| 9,121,582 | ||
| Health Care (0.8%) | ||
| Syngene International Ltd. (a)(c) | 231,219 | 1,678,112 |
| Information Technology (2.2%) | ||
| Tata Consultancy Services Ltd. | 103,337 | 4,705,771 |
| Materials (1.0%) | ||
| Asian Paints Ltd. | 49,547 | 2,058,625 |
| Utilities (2.2%) | ||
| Power Grid Corp. of India Ltd. | 1,413,503 | 3,513,590 |
| ReNew Energy Global PLC, Class A (a)(d) | 125,900 | 1,252,705 |
| 4,766,295 | ||
| 26,517,189 | ||
| INDONESIA (2.1%) | ||
| Consumer Discretionary (0.8%) | ||
| Ace Hardware Indonesia Tbk PT | 16,492,300 | 1,643,565 |
| Financials (1.3%) | ||
| Bank Central Asia Tbk PT | 5,317,500 | 2,811,774 |
| 4,455,339 | ||
See accompanying Notes to Financial Statements.
| 2021 Annual Report | 27 |
Statement of Investments (concluded)
October 31, 2021
Aberdeen Emerging Markets Sustainable Leaders Fund
| Shares or Principal Amount | Value | |
| COMMON STOCKS (continued) | ||
| KAZAKHSTAN (2.0%) | ||
| Financials (2.0%) | ||
| Kaspi.KZ JSC., GDR (c)(e) | 30,177 | $ 4,375,665 |
| MEXICO (3.9%) | ||
| Consumer Staples (1.6%) | ||
| Arca Continental SAB de CV | 587,300 | 3,574,634 |
| Financials (2.3%) | ||
| Grupo Financiero Banorte SAB de CV, Class O | 784,966 | 4,961,894 |
| 8,536,528 | ||
| NETHERLANDS (2.6%) | ||
| Information Technology (2.6%) | ||
| ASM International NV | 5,740 | 2,597,835 |
| ASML Holding NV | 3,699 | 3,006,916 |
| 5,604,751 | ||
| PHILIPPINES (1.2%) | ||
| Real Estate (1.2%) | ||
| Ayala Land, Inc. | 3,592,100 | 2,501,145 |
| POLAND (1.2%) | ||
| Consumer Discretionary (0.6%) | ||
| Allegro.eu SA (a)(c) | 108,570 | 1,227,847 |
| Industrials (0.6%) | ||
| InPost SA (a) | 100,445 | 1,434,132 |
| 2,661,979 | ||
| RUSSIA (4.8%) | ||
| Consumer Staples (1.3%) | ||
| X5 Retail Group NV, GDR | 76,300 | 2,597,252 |
| X5 Retail Group NV, GDR | 7,580 | 258,220 |
| 2,855,472 | ||
| Financials (3.5%) | ||
| Sberbank of Russia PJSC, ADR | 375,935 | 7,547,352 |
| 10,402,824 | ||
| SOUTH KOREA (4.5%) | ||
| Communication Services (0.8%) | ||
| Kakao Corp. | 16,300 | 1,753,626 |
| Information Technology (1.5%) | ||
| Samsung SDI Co. Ltd. | 5,233 | 3,301,645 |
| Materials (2.2%) | ||
| LG Chem Ltd. | 6,504 | 4,666,977 |
| 9,722,248 | ||
| TAIWAN (12.8%) | ||
| Communication Services (1.5%) | ||
| Sea Ltd., ADR (a) | 9,040 | 3,105,873 |
| Shares or Principal Amount | Value | |
| Information Technology (11.3%) | ||
| Chroma ATE, Inc. | 391,000 | $ 2,553,375 |
| Hon Hai Precision Industry Co. Ltd. | 825,000 | 3,184,779 |
| Taiwan Semiconductor Manufacturing Co. Ltd. | 885,000 | 18,779,956 |
| 24,518,110 | ||
| 27,623,983 | ||
| TURKEY (0.9%) | ||
| Information Technology (0.9%) | ||
| Logo Yazilim Sanayi Ve Ticaret AS | 455,000 | 2,011,390 |
| Total Common Stocks | 195,000,452 | |
| PREFERRED STOCKS (9.0%) | ||
| BRAZIL (1.2%) | ||
| Financials (1.2%) | ||
| Banco Bradesco SA, ADR, Preferred Shares, 1.94% | 764,401 | 2,675,404 |
| SOUTH KOREA (7.8%) | ||
| Information Technology (7.8%) | ||
| Samsung Electronics Co. Ltd. | 305,862 | 16,802,833 |
| Total Preferred Stocks | 19,478,237 | |
| SHORT-TERM INVESTMENT (0.4%) | ||
| UNITED STATES (0.4%) | ||
| State Street Institutional U.S. Government Money Market Fund, Premier Class, 0.03% (f) | 924,957 | 924,957 |
| Total Short-Term Investment | 924,957 | |
| Total Investments (Cost $201,540,886) (g)—99.5% | 215,403,646 | |
| Other Assets in Excess of Liabilities—0.5% | 995,987 | |
| Net Assets—100.0% | $216,399,633 | |
| (a) | Non-income producing security. |
| (b) | China A Shares. These shares are issued in local currency, traded in the local stock markets and are held through either a Qualified Foreign Institutional Investor (QFII) license or the Shanghai or Shenzhen Hong-Kong Stock Connect program. |
| (c) | Denotes a security issued under Regulation S or Rule 144A. |
| (d) | All or a portion of the securities are on loan. The total value of all securities on loan is $99,000. The amount of securities on loan indicated may not correspond with the securities on loan identified because securities with pending sales are in the process of recall from the brokers. See Note 2(j) of the accompanying Notes to Financial Statements. |
| (e) | Illiquid security. |
| (f) | Registered investment company advised by State Street Global Advisors. The rate shown is the 7 day yield as of October 31, 2021. |
| (g) | See accompanying Notes to Financial Statements for tax unrealized appreciation/(depreciation) of securities. |
| ADR | American Depositary Receipt |
| GDR | Global Depositary Receipt |
| PLC | Public Limited Company |
See accompanying Notes to Financial Statements.
| 28 | 2021 Annual Report |
Aberdeen Global Equity Fund (Unaudited)
Aberdeen Global Equity Fund (Institutional Class shares net of fees) returned 37.99% for the 12-month reporting period ended October 31, 2021, versus the 37.28% return of its benchmark, the MSCI AC World Index (net dividends), during the same period.
Major global equity market indices moved sharply higher despite bouts of significant market volatility over the 12-month period ended October 31, 2021. Supportive monetary and fiscal policies were prevalent over the period. The U.S. Federal Reserve (Fed) maintained the federal funds rate at near 0% throughout the reporting period, while providing support through its bond-buying program. Elsewhere, the European Central Bank ramped up its original €1.35 trillion (US$1.57 trillion) stimulus plan to €1.85 trillion (US$2.15 trillion) in December 2020. The U.S. Congress passed two additional stimulus packages during the reporting period, with a cumulative total of roughly $2.8 trillion. In August 2021, the U.S. Senate passed the $1 trillion infrastructure deal.
At the beginning of the reporting period in November 2020, news of three major COVID-19 vaccines buoyed investor sentiment. This persisted through to the end of 2020 due to the launch of vaccination programs, the approval of stimulus packages, and the UK and the European Union reaching a Brexit trade deal.
Momentum stalled in January and February 2021, as global bond markets experienced a significant selloff, spurring worries that this could impact the fragile global recovery. The downturn in bond markets also had a negative impact on equities. However, stock markets resumed their upward momentum, driven by economic optimism, vaccine rollouts, central banks' continued accommodative monetary policies, and a strong corporate earnings reporting season. The MSCI AC World Index reached a record high in August 2021, but sold off in September amid investors' growing concerns over inflation and possible interest-rate hikes from central banks. Uneasiness about the global economy led to a selloff across most equity markets across the globe. In October 2021, upbeat company results, along with comments that demand remained strong, eased investors' concerns about stagflation,* supply-chain pressures, spiraling energy prices and higher interest rates.
The Fund's performance relative to the benchmark MSCI AC World Index for the reporting period benefited from the position in ASML Holding NV. The Dutch semiconductor equipment manufacturer's stock price advanced after it posted better-than-expected results on good demand as microchip makers ramped up their production capacities. Shares of Deere & Co., a U.S.-based heavy machinery manufacturer, also moved higher as the company posted generally better-than-expected earnings over the reporting period. Deere & Co. is seeing rising demand for farm and construction machines, which prompted management to increase its earnings forecasts. We subsequently exited the Fund's position in the company in June 2021 following a period of strong share-price performance. The lack of exposure to Alibaba Group Holding Ltd. also enhanced Fund performance. Shares of the Chinese e-commerce giant lagged the
broader market after the Chinese government announced a crackdown on internet- and technology-related companies.
The Fund's position in Tencent Holdings Ltd. weighed on Fund performance for the reporting period. Shares of the China-based online gaming company declined due to the Chinese government's regulatory crackdown amid ongoing antitrust probes into the country's major technology companies. However, we believe that the company should remain relatively intact through these regulatory changes and strong demand from its mobile gaming business should cushion any potential revenue shortfall. Shares of the Fund's holding in payment services provider Fidelity National Information Services Inc. moved lower after the company disappointed investors with its profit outlook for the medium term. Finally, the absence of a position in Tesla Inc. detracted from Fund performance as the electric vehicle (EV) manufacturer and renewable energy company announced record-high earnings for the second and third quarters of its 2021 fiscal year.
New positions that we initiated in the Fund during the reporting period included Raia Drogasil SA; AbbVie Inc.; Las Vegas Sands Corp.; Zurich Insurance Co. Ltd.; Novo Nordisk A/S; Goodman Group; Dechra Pharmaceuticals PLC; and Genus plc.
Raia Drogasil is a Brazil-based retail pharmacy with solid brand recognition. AbbVie is a U.S. biopharmaceutical company which, in our view, has taken positive steps to reduce the adverse effect of the patent expiry on Humira, its hugely successful, rheumatoid arthritis treatment drug. We believe that casino operator Las Vegas Sands should offer a long-term growth opportunity when consumer spending and travel normalize after the COVID-19 pandemic ends. Zurich Insurance has delivered on financial and operational improvements ahead of schedule. Denmark-based pharmaceutical firm Novo Nordisk is a leader in diabetes treatments. We think that Goodman Group, an industrial-property developer, should benefit from attractive long-term structural growth opportunities. In our view, Dechra Pharmaceuticals is well positioned in the animal healthcare market. Genus is a world-leading animal genetics company that we believe should benefit from rising demand for sustainably sourced protein.
During the reporting period, we exited several positions as we focused on what we believed were better opportunities elsewhere. We also sold the Fund's shares in holdings that we felt had limited valuation upside or had performed particularly well. These included healthcare services provider Sysmex Corp; First Republic Bank; financial information services provider Experian Corp.; contract research organization PRA Health Sciences Inc.; and online travel services company Booking Holdings Inc.
From our conversations with various industry participants, it appears that some of the supply bottlenecks emanating from manufacturing hubs in Asia are now easing. Some raw material costs, noticeably metals, are also lessening due to a mix of government price caps and demand slowdown.
* Stagflation refers to an economic environment of stagnant activity and accelerating inflation.
| 2021 Annual Report | 29 |
Aberdeen Global Equity Fund (Unaudited) (concluded)
In the U.S. and Western Europe, we await the effect of the withdrawal of government support programs on labor participation. We feel that these factors suggest that, as we head towards the end of 2021, pressure on the supply chain could begin to moderate. Overall, we believe that equity market performance may be tempered by gradual monetary policy normalization from central banks and the potential impact of increased taxation.
Portfolio Management:
Global Equity Team
PAST PERFORMANCE DOES NOT GUARANTEE FUTURE RESULTS.
The performance data quoted represents past performance and current returns may be lower or higher. Class A Shares have up to a 5.75% front-end sales charge and a 0.25% 12b-1 fee. The investment return and principal value will fluctuate so that an investor's shares, when redeemed, may be worth more or less than the original cost. To obtain performance information current to the most recent month-end, which may be higher or lower than the performance shown above, please call 866-667-9231 or go to https://www.abrdn.com/en-us/us/investor/fund-centre.
Investing in mutual funds involves risk, including the possible loss of principal.
Indexes are unmanaged and have been provided for comparison purposes only. No fees or expenses are reflected. You cannot invest directly in an index.
Risk Considerations
Deteriorating market conditions might cause a general weakness in the market that reduces the prices, or yield, of securities in those markets in which the Fund invests.
The value of a security may decline for reasons directly related to the issuer, such as management performance, financial leverage and reduced demand for the issuer's goods or services.
The stock or other security of a company may not perform as well as expected, and may decrease in value, because of factors related to the company, to the industry in which the company is engaged, or to the market as a whole.
The Fund is subject to the risk that the Adviser or Subadviser may make poor security selections.
Foreign securities are more volatile, harder to price and less liquid than U.S. securities. They are subject to different accounting and regulatory standards, and currency exchange rate, political and economic risks.
Please read the prospectus for more detailed information regarding these and other risks.
| 30 | 2021 Annual Report |
Aberdeen Global Equity Fund (Unaudited)
| Average Annual Total Return (For periods ended October 31, 2021) | 1 Yr. | 5 Yr. | 10 Yr. | ||||||||||||
| Class A | w/o SC | 37.55 | % | 12.82 | % | 8.20 | % | ||||||||
| w/ SC1 | 29.60 | % | 11.50 | % | 7.56 | % | |||||||||
| Class C | w/o SC | 36.67 | % | 12.10 | % | 7.50 | % | ||||||||
| w/ SC2 | 35.67 | % | 12.10 | % | 7.50 | % | |||||||||
| Class R3 | w/o SC | 37.08 | % | 12.40 | % | 7.85 | % | ||||||||
| Institutional Service Class3,4 | w/o SC | 37.88 | % | 13.13 | % | 8.54 | % | ||||||||
| Institutional Class3 | w/o SC | 37.99 | % | 13.17 | % | 8.56 | % | ||||||||
All figures showing the effect of a sales charge (SC) reflect the maximum charge possible because it has the most significant effect on performance data. The total returns shown above do not include the impact of financial statement rounding of the net asset value (NAV) per share and/or financial statement adjustments.
| 1 | A 5.75% front-end sales charge was deducted. |
| 2 | A 1.00% contingent deferred sales charge (CDSC) was deducted from the one year return because it is charged when Class C shares are sold within the first year after purchase. |
| 3 | Not subject to any sales charges. |
| 4 | Returns before the first offering of the Institutional Service Class (December 19, 2011) are based on the previous performance of the Fund's Class A shares. Excluding the effect of any fee waivers or reimbursements, this performance is substantially similar to what the Institutional Service Class would have produced because both classes invest in the same portfolio of securities. Returns would only differ to the extent of the differences in expenses of the classes. |
Performance of a $10,000 Investment (as of October 31, 2021)

Comparative performance of $10,000 invested in Class A shares of the Aberdeen Global Equity Fund, Morgan Stanley Capital International (MSCI) All Country World Index (ACWI) (Net Dividends)
and the Consumer Price Index (CPI) over a 10-year period ended October 31, 2021. Unlike the Fund, the returns for these unmanaged indexes do not reflect any fees, expenses or sales charges. Investors cannot invest directly in market indexes.
The MSCI ACWI captures large and mid cap representation across 23 Developed Markets (DM) and 25 Emerging Markets (EM) countries. With 2,900 constituents, the index covers approximately 85% of the global investable equity opportunity set. DM countries in the Index are: Australia, Austria, Belgium, Canada, Denmark, Finland, France, Germany, Hong Kong, Ireland, Israel, Italy, Japan, Netherlands, New Zealand, Norway, Portugal, Singapore, Spain, Sweden, Switzerland, the UK and the US. EM countries in the Index are: Brazil, Chile, China, Colombia, Czech Republic, Egypt, Greece, Hungary, India, Indonesia, Korea, Kuwait, Malaysia, Mexico, Peru, Philippines, Poland, Russia, Qatar, Saudi Arabia, South Africa, Taiwan, Thailand, Turkey and United Arab Emirates.
The CPI is a measure of the average change over time in the prices paid by urban consumers for a market basket of consumer goods and services.
Investment return and principal value will fluctuate, and when redeemed, shares may be worth more or less than original cost. Past performance is no guarantee of future results. The Average Annual Total Return table and Performance graph do not reflect the deduction of taxes that a shareholder would pay on fund distributions or the redemption of fund shares. Investing in mutual funds involves market risk, including loss of principal. Performance returns assume the reinvestment of all distributions. Total returns reflect waivers and reimbursements in effect, without which returns would have been lower.
2021 Annual Report 31
Aberdeen Global Equity Fund (Unaudited)
Portfolio Summary (as a percentage of net assets)
October 31, 2021 (Unaudited)
| Asset Allocation | ||
| Common Stocks | 97.2% | |
| Short-Term Investment | 3.4% | |
| Liabilities in Excess of Other Assets | (0.6%) | |
| 100.0% |
The following table summarizes the composition of the Fund's portfolio, in S&P Global Industry Classification Standard (GICS) sectors, expressed as a percentage of net assets as of October 31, 2021.
| Top Sectors | ||
| Consumer Staples | 18.6% | |
| Information Technology | 18.5% | |
| Health Care | 16.3% | |
| Financials | 14.2% | |
| Consumer Discretionary | 12.5% | |
| Communication Services | 6.3% | |
| Materials | 5.1% | |
| Industrials | 4.5% | |
| Real Estate | 1.2% | |
| Other | 2.8% | |
| 100.0% |
| Top Holdings* | ||
| Microsoft Corp. | 4.2% | |
| Alphabet, Inc., Class A | 3.5% | |
| AIA Group Ltd. | 3.4% | |
| Nestle SA | 3.3% | |
| Keyence Corp. | 3.1% | |
| Intercontinental Exchange, Inc. | 3.1% | |
| NIKE, Inc., Class B | 3.1% | |
| Diageo PLC | 3.0% | |
| Visa, Inc., Class A | 3.0% | |
| AstraZeneca PLC | 3.0% | |
| Other | 67.3% | |
| 100.0% |
| * | For the purpose of listing top holdings, Short-Term Investments are included as part of Other. |
| Top Countries | ||
| United States | 48.2% | |
| United Kingdom | 11.7% | |
| Switzerland | 6.5% | |
| Netherlands | 5.2% | |
| Japan | 4.6% | |
| Hong Kong | 3.4% | |
| Denmark | 3.4% | |
| Taiwan | 2.8% | |
| China | 2.8% | |
| France | 2.8% | |
| Other | 8.6% | |
| 100.0% |
32 2021 Annual Report
Statement of Investments
October 31, 2021
Aberdeen Global Equity Fund
| Shares or Principal Amount | Value | |||
| COMMON STOCKS (97.2%) | ||||
| AUSTRALIA (2.2%) | ||||
| Health Care (1.0%) | ||||
| CSL Ltd. | 1,390 | $ | 316,281 | |
| Real Estate (1.2%) | ||||
| Goodman Group, REIT | 21,200 | 351,006 | ||
| 667,287 | ||||
| BRAZIL (1.0%) | ||||
| Consumer Staples (1.0%) | ||||
| Raia Drogasil SA | 74,500 | 306,907 | ||
| CHINA (2.8%) | ||||
| Communication Services (2.8%) | ||||
| Tencent Holdings Ltd. | 14,200 | 863,783 | ||
| DENMARK (3.4%) | ||||
| Health Care (3.4%) | ||||
| Genmab AS (a) | 1,000 | 449,252 | ||
| Novo Nordisk AS, Class B | 5,400 | 592,136 | ||
| 1,041,388 | ||||
| FRANCE (2.8%) | ||||
| Consumer Discretionary (2.8%) | ||||
| LVMH Moet Hennessy Louis Vuitton SE | 1,100 | 862,534 | ||
| HONG KONG (3.4%) | ||||
| Financials (3.4%) | ||||
| AIA Group Ltd. | 93,900 | 1,052,338 | ||
| INDIA (2.2%) | ||||
| Financials (2.2%) | ||||
| Housing Development Finance Corp. Ltd. | 17,700 | 674,083 | ||
| JAPAN (4.6%) | ||||
| Information Technology (3.1%) | ||||
| Keyence Corp. | 1,600 | 965,783 | ||
| Materials (1.5%) | ||||
| Shin-Etsu Chemical Co. Ltd. | 2,600 | 463,666 | ||
| 1,429,449 | ||||
| NETHERLANDS (5.2%) | ||||
| Consumer Staples (2.5%) | ||||
| Heineken NV | 7,000 | 774,823 | ||
| Information Technology (2.7%) | ||||
| ASML Holding NV | 1,020 | 829,158 | ||
| 1,603,981 | ||||
| SINGAPORE (1.8%) | ||||
| Financials (1.8%) | ||||
| Oversea-Chinese Banking Corp. Ltd. | 65,117 | 569,241 | ||
| SWEDEN (2.0%) | ||||
| Industrials (2.0%) | ||||
| Atlas Copco AB, A Shares | 9,400 | 605,348 | ||
| Shares or Principal Amount | Value | |||
| SWITZERLAND (6.5%) | ||||
| Consumer Staples (3.3%) | ||||
| Nestle SA | 7,700 | $ | 1,015,685 | |
| Financials (1.7%) | ||||
| Zurich Insurance Group AG | 1,150 | 509,703 | ||
| Health Care (1.5%) | ||||
| Roche Holding AG | 1,220 | 472,621 | ||
| 1,998,009 | ||||
| TAIWAN (2.8%) | ||||
| Information Technology (2.8%) | ||||
| Taiwan Semiconductor Manufacturing Co. Ltd., ADR | 7,600 | 864,120 | ||
| UNITED KINGDOM (11.7%) | ||||
| Consumer Staples (3.0%) | ||||
| Diageo PLC | 18,800 | 935,332 | ||
| Health Care (6.6%) | ||||
| Abcam PLC (a) | 20,900 | 473,089 | ||
| AstraZeneca PLC | 7,400 | 925,750 | ||
| Dechra Pharmaceuticals PLC | 4,500 | 315,314 | ||
| Genus PLC | 4,300 | 326,076 | ||
| 2,040,229 | ||||
| Materials (2.1%) | ||||
| Croda International PLC | 4,940 | 639,387 | ||
| 3,614,948 | ||||
| UNITED STATES (44.8%) | ||||
| Communication Services (3.5%) | ||||
| Alphabet, Inc., Class A (a) | 360 | 1,065,931 | ||
| Consumer Discretionary (9.7%) | ||||
| Amazon.com, Inc. (a) | 270 | 910,556 | ||
| Las Vegas Sands Corp. (a) | 11,000 | 426,910 | ||
| NIKE, Inc., Class B | 5,700 | 953,553 | ||
| TJX Cos., Inc. (The) | 10,800 | 707,292 | ||
| 2,998,311 | ||||
| Consumer Staples (8.8%) | ||||
| Costco Wholesale Corp. | 1,260 | 619,341 | ||
| Estee Lauder Cos., Inc. (The), Class A | 2,300 | 745,959 | ||
| PepsiCo, Inc. | 4,750 | 767,600 | ||
| Procter & Gamble Co. (The) | 4,100 | 586,259 | ||
| 2,719,159 | ||||
| Financials (5.1%) | ||||
| CME Group, Inc. | 2,800 | 617,540 | ||
| Intercontinental Exchange, Inc. | 6,900 | 955,374 | ||
| 1,572,914 | ||||
| Health Care (3.8%) | ||||
| AbbVie, Inc. | 3,700 | 424,279 | ||
| Boston Scientific Corp. (a) | 17,400 | 750,462 | ||
| 1,174,741 | ||||
See accompanying Notes to Financial Statements.
2021 Annual Report 33
Statement of Investments (concluded)
October 31, 2021
Aberdeen Global Equity Fund
| Shares or Principal Amount | Value | ||
| COMMON STOCKS (continued) | |||
| UNITED STATES (continued) | |||
| Industrials (2.5%) | |||
| Schneider Electric SE | 4,490 | $ 774,157 | |
| Information Technology (9.9%) | |||
| Autodesk, Inc. (a) | 1,800 | 571,698 | |
| Fidelity National Information Services, Inc. | 2,400 | 265,776 | |
| Microsoft Corp. | 3,900 | 1,293,318 | |
| Visa, Inc., Class A | 4,400 | 931,788 | |
| 3,062,580 | |||
| Materials (1.5%) | |||
| Linde PLC | 1,400 | 446,880 | |
| 13,814,673 | |||
| Total Common Stocks | 29,968,089 | ||
| Shares or Principal Amount | Value | ||
| SHORT-TERM INVESTMENT (3.4%) | |||
| UNITED STATES (3.4%) | |||
| State Street Institutional U.S. Government Money Market Fund, Premier Class, 0.03% (b) | 1,051,627 | $ 1,051,627 | |
| Total Short-Term Investment | 1,051,627 | ||
Total Investments (Cost $20,544,185) (c)—100.6% | 31,019,716 | ||
| Liabilities in Excess of Other Assets—(0.6)% | (181,718) | ||
| Net Assets—100.0% | $30,837,998 | ||
| (a) | Non-income producing security. |
| (b) | Registered investment company advised by State Street Global Advisors. The rate shown is the 7 day yield as of October 31, 2021. |
| (c) | See accompanying Notes to Financial Statements for tax unrealized appreciation/(depreciation) of securities. |
| ADR | American Depositary Receipt |
| PLC | Public Limited Company |
| REIT | Real Estate Investment Trust |
See accompanying Notes to Financial Statements.
34 2021 Annual Report
Aberdeen Global Infrastructure Fund (Unaudited)
Aberdeen Global Infrastructure Fund (Institutional Class shares net of fees) returned 31.43% for the 12-month reporting period ended October 31, 2021, versus the 37.28% return of its primary benchmark, the MSCI All Country (AC) World Index (net dividends), and the 27.93% return of its secondary benchmark, the S&P Global Infrastructure Index (net dividends), during the same period.
Major global equity market indices moved sharply higher despite bouts of significant volatility over the 12-month period ended October 31, 2021. Supportive monetary and fiscal policies from governments around the globe were prevalent over the period. The U.S. Federal Reserve maintained the federal funds rate at near 0% throughout the reporting period, while providing support through its bond-buying program. Elsewhere, the European Central Bank ramped up its original €1.35 trillion (US$1.57 trillion) stimulus plan to €1.85 trillion (US$2.15 trillion) in December 2020. The U.S. Congress passed two additional stimulus packages during the reporting period, with a cumulative total of roughly $2.8 trillion. In August 2021, the U.S. Senate passed the $1 trillion infrastructure deal.
At the beginning of the reporting period in November 2020, news of three major COVID-19 vaccines buoyed investor sentiment. This persisted through to the end of 2020 due to the launch of vaccination programs, the approval of stimulus packages, and the UK and the European Union reaching a Brexit trade deal.
Momentum stalled in January and February 2021, as global bond markets experienced a significant selloff, spurring worries that this could impact the fragile global recovery. The downturn in bond markets also had a negative impact on equities. However, stock markets resumed their upward momentum, driven by economic optimism, vaccine rollouts, central banks' continued accommodative monetary policies, and a strong corporate earnings reporting season. The MSCI AC World Index reached a record high in August 2021, but sold off in September amid investors' growing concerns over inflation and possible interest-rate hikes from central banks. Uneasiness about the global economy led to a selloff across most equity markets across the globe. In October, upbeat company results, along with comments that demand remained strong, eased investors' concerns about stagflation,1 supply-chain pressures, spiraling energy prices and higher interest rates.
The Fund's performance relative to its secondary benchmark, the S&P Global Infrastructure Index, for the reporting period was bolstered by overall positioning in the utilities sector and stock selection in the industrials sector. The main individual stock contributors to performance were the holding in Tower Bersama Infrastructure Tbk, an Indonesian provider of telecommunications towers, as well as the lack of exposure to benchmark constituents Transurban Group, an operator of toll roads in the U.S., Canada and Australia, and regional utility company Dominion Energy Inc.
Tower Bersama Infrastructure is one of the largest telecommunication tower providers in Indonesia. The company is benefiting from favorable trends in the industry, including tower densification and tower acquisitions. Telecommunication companies continue to invest in their networks, which benefits tower providers. Tower Bersama also completed its IBST tower deal, resulting in the addition of 4,400 tenants. Transurban Group has a large weighting in the S&P Global Infrastructure Index; the company's stock price moved lower as traffic remained weak in Australia due to COVID-19-related lockdowns. Shares of Dominion Energy fell during the reporting period as the company cut its dividend by 33% in November 2020.
Conversely, an underweight allocation to the energy sector weighed on the Fund's relative performance for the reporting period. The largest individual stock detractors from performance included the absence of positions in benchmark constituents Oneok Inc., Cheniere Energy Inc., and Targa Resources Corp.
Oneok, Inc. is a U.S.-based midstream oil service provider. The company benefited from rising oil prices and its shares rallied along with the overall midstream energy market over the reporting period. Furthermore, Oneok's management is focusing on deleveraging the company's balance sheet. Cheniere Energy Inc., exports liquid natural gas. The stock price rallied throughout the year as more liquefied natural gas (LNG) terminals2 came online. We believe that this should lead to a decrease in capital spending and higher free cash flow. Cheniere Energy also benefited from wide international gas price spreads. Targa Resources is a midstream3 company that has assets in the Permian basin. The company recently completed a large expansion project and has started to reduce debt.
When bond yields rally, investors tend to take profits and sell highly valued companies. Time will tell whether this proves shortsighted this time around. As we move through the upcoming corporate earnings season, we maintain our preference for what we believe are well-run companies with a clear competitive advantage.
From our conversations with various industry participants, it appears that some of the supply bottlenecks emanating from manufacturing hubs such as Vietnam, Thailand and Malaysia are now easing. Some raw material costs, noticeably metals, are also decreasing. This is due to a mix of government price caps and a slowdown in demand. It is worth noting that China's Purchasing Managers' index of manufacturing activity for September 2021 recorded a reading of 49.6,4 a marginal contraction from the previous month.
In the U.S. and Western Europe, we are waiting to see the effect of the withdrawal of government support schemes on labor participation. These factors suggest that, as we head towards the end of the year, pressure on the supply chain could start to moderate. Overall, we think that the performance of equity markets may be tempered by gradual monetary policy normalization and the potential impact of increased taxation.
| 1 | Stagflation refers to an economic environment of stagnant activity and accelerating inflation. . |
| 2 | A LNG terminal is a facility for managing the import and/or export of liquefied natural gas. |
| 3 | Midstream refers to one of the three major stages of oil and gas industry operations. Midstream activities include the processing, storing, transporting and marketing of oil, natural gas, and natural gas liquids. |
| 4 | Source: National Bureau of Statistics of China, October 2021 |
2021 Annual Report 35
Aberdeen Global Infrastructure Fund (Unaudited) (concluded)
We remain committed to our fundamental analysis-based stock-picking strategies. This is supported by our proprietary research platform staffed by an experienced team that has successfully navigated past crises. Therefore, we continue to seek what we believe are attractively valued companies with resilient, well-run businesses that adapt well to the changing landscape, and also are poised for a recovery in economic growth. We are actively engaging with management in an effort to ensure robust corporate governance and environmental sustainability standards.
Looking ahead, we anticipate that infrastructure spending in the U.S. will increase under the administration of President Biden. We believe that the Biden administration's policies will be supportive of infrastructure companies, as there are both direct and indirect beneficiaries in the Fund's investment universe. Additionally, we think that investor sentiment for renewables could remain supported by government stimulus programs globally. For example, the European Union (EU) announced a new initiative, "Fit for 55%," that calls for the reduction of greenhouse gas emissions by 55% (versus 1990 levels) by 2030. This was an increase from the previous reduction target of 40%.While "Fit for 55%" is just in the proposal stage and likely will be modified before the EU Parliament and member states approve it, we feel that it could have a meaningful impact on infrastructure spending. Furthermore, following the 26th Conference of the Parties (COP 26) global climate summit in Glasgow, Scotland, in November 2021, focus is turning to the implementation of the 2015 Paris Agreement. The long-term ambition of that agreement is to limit global warming to well within two degrees Celsius when compared to pre-industrial levels in an effort to address climate change.
Portfolio Management:
Global Equity Team
PAST PERFORMANCE DOES NOT GUARANTEE FUTURE RESULTS.
The performance data quoted represents past performance and current returns may be lower or higher. Class A Shares have up to a 5.75% front-end sales charge and a 0.25% 12b-1 fee. The investment return and principal value will fluctuate so that an investor's shares, when redeemed, may be worth more or less than the original cost. To obtain performance information current to the most recent month-end, which may be higher or lower than the performance shown above, please call 866-667-9231 or go to https://www.abrdn.com/en-us/us/investor/fund-centre.
Investing in mutual funds involves risk, including possible loss of principal.
Indexes are unmanaged and have been provided for comparison purposes only. No fees or expenses are reflected. You cannot invest directly in an index.
Risk Considerations
Deteriorating market conditions might cause a general weakness in the market that reduces the prices, or yield, of securities in those markets in which the Fund invests.
The value of a security may decline for reasons directly related to the issuer, such as management performance, financial leverage and reduced demand for the issuer's goods or services.
The stock or other security of a company may not perform as well as expected, and may decrease in value, because of factors related to the company, to the industry in which the company is engaged, or to the market as a whole.
The Fund is subject to the risk that the Adviser or Subadviser may make poor security selections.
The Fund is subject to the risk of concentrating investments in infrastructure-related companies, which makes it more susceptible to factors adversely affecting issuers within that industry than would a fund investing in a more diversified portfolio of securities. These risks include high interest costs in connection with capital construction programs and the costs associated with environmental and other regulations.
Foreign securities are more volatile, harder to price and less liquid than U.S. securities. They are subject to different accounting and regulatory standards, and currency exchange rate, political and economic risks.
The value of foreign currencies relative to the U.S. Dollar fluctuates in response to market, economic, political, regulatory, geopolitical or other conditions. Fluctuations in currency exchange rates may impact a Fund's returns more greatly to the extent the Fund does not hedge currency exposure or hedging techniques are unsuccessful.
Please read the prospectus for more detailed information regarding these and other risks.
36 2021 Annual Report
Aberdeen Global Infrastructure Fund (Unaudited)
| Average Annual Total Return1 (For periods ended October 31, 2021) | 1 Yr. | 5 Yr. | 10 Yr. | |
| Class A | w/o SC | 31.09% | 10.54% | N.A. |
| w/SC2 | 23.56% | 9.24% | N.A. | |
| Institutional Class3 | w/o SC | 31.43% | 10.82% | 9.92% |
All figures showing the effect of a sales charge (SC) reflect the maximum charge possible because it has the most significant effect on performance data. The total returns shown above do not include the impact of financial statement rounding of the net asset value (NAV) per share and/or financial statement adjustments.
| 1 | Returns prior to May 7, 2018 reflect the performance of a predecessor fund (the "Predecessor Fund"). Returns of the Predecessor Fund have not been adjusted to reflect the expenses applicable to the respective classes. The Fund and the Predecessor Fund have substantially similar investment objectives and strategies. Please consult the Fund's prospectus for more detail. |
| 2 | A 5.75% front-end sales charge was deducted. |
| 3 | Not subject to any sales charges. |
Performance of a $1,000,000 Investment* (as of October 31, 2021)

* Minimum Initial Investment
Comparative performance of $1,000,000 invested in Institutional Class shares of the Aberdeen Global Infrastructure Fund, Morgan Stanley Capital International All Country World Index (MSCI ACWI) (Net Dividends), S&P Global Infrastructure Index (Net Dividends) and the Consumer Price Index (CPI) over a 10-year period ended October 31, 2021. Unlike the Fund, the returns for these unmanaged indexes do not reflect any fees, expenses or sales charges. Investors cannot invest directly in market indexes.
The MSCI ACWI captures large and mid cap representation across 23 Developed Markets (DM) and 25 Emerging Markets (EM) countries. With 2,900 constituents, the index covers approximately 85% of the global investable equity opportunity set. DM countries in the Index are: Australia, Austria, Belgium, Canada, Denmark, Finland, France, Germany, Hong Kong, Ireland, Israel, Italy, Japan, Netherlands, New Zealand, Norway, Portugal, Singapore, Spain, Sweden, Switzerland, the UK and the US. EM countries in the Index are: Brazil, Chile, China, Colombia, Czech Republic, Egypt, Greece, Hungary, India, Indonesia, Korea, Kuwait, Malaysia, Mexico, Peru, Philippines, Poland, Russia, Qatar, Saudi Arabia, South Africa, Taiwan, Thailand, Turkey and United Arab Emirates.
The S&P Global Infrastructure Index is a total return index that is designed to track 75 companies from around the world chosen to represent the listed infrastructure industry while maintaining liquidity and tradability. To create diversified exposure, the index includes three distinct infrastructure clusters: energy, transportation, and utilities. Net Total Return (NTR) indexes include reinvestments of all dividends minus taxes.
The CPI is a measure of the average change over time in the prices paid by urban consumers for a market basket of consumer goods and services.
Investment return and principal value will fluctuate, and when redeemed, shares may be worth more or less than original cost. Past performance is no guarantee of future results. The Average Annual Total Return table and Performance graph do not reflect the deduction of taxes that a shareholder would pay on fund distributions or the redemption of fund shares. Investing in mutual funds involves market risk, including loss of principal. Performance returns assume the reinvestment of all distributions. Total returns reflect waivers and reimbursements in effect, without which returns would have been lower.
2021 Annual Report 37
Aberdeen Global Infrastructure Fund (Unaudited)
Portfolio Summary (as a percentage of net assets)
October 31, 2021 (Unaudited)
| Asset Allocation | ||
| Common Stocks | 98.0% | |
| Short-Term Investment | 2.1% | |
| Liabilities in Excess of Other Assets | (0.1%) | |
| 100.0% |
The following table summarizes the composition of the Fund's portfolio, in S&P Global Industry Classification Standard (GICS) sectors, expressed as a percentage of net assets as of October 31, 2021.
| Top Sectors | ||
| Industrials | 36.8%* | |
| Utilities | 29.0%* | |
| Communication Services | 15.1% | |
| Energy | 8.3% | |
| Real Estate | 5.1% | |
| Materials | 1.9% | |
| Consumer Discretionary | 1.1% | |
| Information Technology | 0.7% | |
| Other | 2.0% | |
| 100.0% |
| * | As of October 31, 2021, the Fund's holdings in the Industrials sector were allocated to four industries: Transportation Infrastructure (17.1%), Road & Rail (9.8%) ,Construction & Engineering (8.1%) and Commercial Services & Supplies (1.8%). As of October 31, 2021, the Fund's holdings in the Utilities sector were allocated to four industries: Multi-Utilities (11.6%), Independent Power & Renewable Electricity Producers (8.8%), Electric Utilities (7.8%) and Water Utilities (0.8%). |
| Top Holdings* | ||
| Ferrovial SA | 3.0% | |
| Enbridge, Inc. | 3.0% | |
| Cellnex Telecom SA | 2.9% | |
| Williams Cos., Inc. (The) | 2.8% | |
| EDP Renovaveis SA | 2.6% | |
| CCR SA | 2.6% | |
| RWE AG | 2.5% | |
| Kinder Morgan, Inc. | 2.5% | |
| American Tower Corp., REIT | 2.5% | |
| Crown Castle International Corp., REIT | 2.4% | |
| Other | 73.2% | |
| 100.0% |
| * | For the purpose of listing top holdings, Short-Term Investments are included as part of Other. |
| Top Countries | ||
| United States | 36.3% | |
| Spain | 12.0% | |
| France | 8.9% | |
| Italy | 5.9% | |
| Brazil | 5.9% | |
| Germany | 5.1% | |
| Canada | 4.6% | |
| United Kingdom | 4.3% | |
| China | 3.7% | |
| Philippines | 2.3% | |
| Other | 11.0% | |
| 100.0% |
38 2021 Annual Report
Statement of Investments
October 31, 2021
Aberdeen Global Infrastructure Fund
| Shares or Principal Amount | Value | |||||||
| COMMON STOCKS (98.0%) | ||||||||
| ARGENTINA (1.8%) | ||||||||
| Industrials (1.0%) | ||||||||
| Corp. America Airports SA (a) | 102,600 | $ | 578,664 | |||||
| Materials (0.8%) | ||||||||
| Loma Negra Cia Industrial Argentina SA, ADR (a) | 65,300 | 442,734 | ||||||
| 1,021,398 | ||||||||
| BRAZIL (5.9%) | ||||||||
| Communication Services (1.0%) | ||||||||
| Telefonica Brasil SA, ADR | 71,000 | 570,130 | ||||||
| Industrials (3.8%) | ||||||||
| CCR SA | 736,100 | 1,490,773 | ||||||
| Rumo SA (a) | 260,300 | 737,481 | ||||||
| 2,228,254 | ||||||||
| Utilities (1.1%) | ||||||||
| Omega Geracao SA (a) | 105,300 | 610,665 | ||||||
| 3,409,049 | ||||||||
| CANADA (4.6%) | ||||||||
| Energy (3.0%) | ||||||||
| Enbridge, Inc. | 41,200 | 1,725,766 | ||||||
| Industrials (1.6%) | ||||||||
| Canadian Pacific Railway Ltd. | 12,300 | 952,020 | ||||||
| 2,677,786 | ||||||||
| CHINA (3.7%) | ||||||||
| Industrials (2.2%) | ||||||||
| COSCO SHIPPING Ports Ltd. | 881,775 | 733,977 | ||||||
| Zhejiang Expressway Co. Ltd., Class H | 626,100 | 556,051 | ||||||
| 1,290,028 | ||||||||
| Information Technology (0.7%) | ||||||||
| GDS Holdings Ltd., ADR (a) | 7,100 | 421,740 | ||||||
| Utilities (0.8%) | ||||||||
| Beijing Enterprises Water Group Ltd. | 1,154,000 | 441,098 | ||||||
| 2,152,866 | ||||||||
| FRANCE (8.9%) | ||||||||
| Industrials (5.3%) | ||||||||
| Eiffage SA | 9,400 | 967,496 | ||||||
| Getlink SE | 47,800 | 735,696 | ||||||
| Vinci SA | 13,200 | 1,411,215 | ||||||
| 3,114,407 | ||||||||
| Utilities (3.6%) | ||||||||
| Engie SA | 64,900 | 923,212 | ||||||
| Veolia Environnement SA | 35,800 | 1,169,191 | ||||||
| 2,092,403 | ||||||||
| 5,206,810 | ||||||||
| Shares or Principal Amount | Value | |||||||
| GERMANY (5.1%) | ||||||||
| Communication Services (1.3%) | ||||||||
| Vantage Towers AG | 21,845 | $ | 751,019 | |||||
| Industrials (1.3%) | ||||||||
| Fraport AG Frankfurt Airport Services Worldwide (a) | 10,900 | 780,129 | ||||||
| Utilities (2.5%) | ||||||||
| RWE AG | 38,100 | 1,466,532 | ||||||
| 2,997,680 | ||||||||
| INDONESIA (2.1%) | ||||||||
| Communication Services (2.1%) | ||||||||
| Sarana Menara Nusantara Tbk PT | 8,320,100 | 681,949 | ||||||
| Tower Bersama Infrastructure Tbk PT | 2,660,200 | 552,564 | ||||||
| 1,234,513 | ||||||||
| ITALY (5.9%) | ||||||||
| Communication Services (1.2%) | ||||||||
| Infrastrutture Wireless Italiane SpA (b) | 63,300 | 699,345 | ||||||
| Industrials (1.6%) | ||||||||
| Atlantia SpA (a) | 49,900 | 964,486 | ||||||
| Materials (1.1%) | ||||||||
| Buzzi Unicem SpA | 27,100 | 632,065 | ||||||
| Utilities (2.0%) | ||||||||
| Enel SpA | 136,500 | 1,142,748 | ||||||
| 3,438,644 | ||||||||
| JAPAN (0.7%) | ||||||||
| Industrials (0.7%) | ||||||||
| East Japan Railway Co. | 6,100 | 379,947 | ||||||
| LUXEMBOURG (1.4%) | ||||||||
| Communication Services (1.4%) | ||||||||
| SES SA, ADR | 92,700 | 832,558 | ||||||
| MALAYSIA (1.5%) | ||||||||
| Industrials (1.5%) | ||||||||
| Malaysia Airports Holdings Bhd (a) | 550,100 | 860,350 | ||||||
| MEXICO (1.6%) | ||||||||
| Industrials (1.6%) | ||||||||
| Promotora y Operadora de Infraestructura SAB de CV | 129,400 | 953,153 | ||||||
| NETHERLANDS (0.9%) | ||||||||
| Communication Services (0.9%) | ||||||||
| Koninklijke KPN NV | 182,900 | 546,493 | ||||||
| NORWAY (1.1%) | ||||||||
| Communication Services (1.1%) | ||||||||
| Telenor ASA | 39,100 | 617,800 | ||||||
| PHILIPPINES (2.3%) | ||||||||
| Industrials (2.3%) | ||||||||
| International Container Terminal Services, Inc. | 370,000 | 1,321,166 | ||||||
See accompanying Notes to Financial Statements.
2021 Annual Report 39
Statement of Investments (concluded)
October 31, 2021
Aberdeen Global Infrastructure Fund
| Shares or Principal Amount | Value | |||||||
| COMMON STOCKS (continued) | ||||||||
| SPAIN (12.0%) | ||||||||
| Communication Services (2.9%) | ||||||||
| Cellnex Telecom SA (b) | 27,900 | $ | 1,715,841 | |||||
| Industrials (4.8%) | ||||||||
| Aena SME SA (a)(b) | 6,100 | 1,001,842 | ||||||
| Ferrovial SA | 56,146 | 1,772,420 | ||||||
| 2,774,262 | ||||||||
| Utilities (4.3%) | ||||||||
| Atlantica Sustainable Infrastructure PLC | 25,400 | 999,490 | ||||||
| EDP Renovaveis SA | 54,200 | 1,509,990 | ||||||
| 2,509,480 | ||||||||
| 6,999,583 | ||||||||
| UNITED KINGDOM (4.3%) | ||||||||
| Communication Services (1.3%) | ||||||||
| Vodafone Group PLC | 502,900 | 741,200 | ||||||
| Utilities (3.0%) | ||||||||
| National Grid PLC, ADR | 17,700 | 1,134,216 | ||||||
| SSE PLC | 28,900 | 650,816 | ||||||
| 1,785,032 | ||||||||
| 2,526,232 | ||||||||
| UNITED STATES (34.2%) | ||||||||
| Communication Services (1.9%) | ||||||||
| DISH Network Corp., Class A (a) | 15,200 | 624,264 | ||||||
| T-Mobile US, Inc. (a) | 4,300 | 494,629 | ||||||
| 1,118,893 | ||||||||
| Consumer Discretionary (1.1%) | ||||||||
| TravelCenters of America, Inc. (a) | 11,300 | 609,183 | ||||||
| Energy (5.3%) | ||||||||
| Kinder Morgan, Inc. | 86,300 | 1,445,525 | ||||||
| Williams Cos., Inc. (The) | 58,700 | 1,648,883 | ||||||
| 3,094,408 | ||||||||
| Industrials (9.1%) | ||||||||
| CoreCivic, Inc., REIT (a) | 31,000 | 266,910 | ||||||
| Dycom Industries, Inc. (a) | 7,600 | 603,592 | ||||||
| Kansas City Southern | 4,400 | 1,365,100 | ||||||
| Norfolk Southern Corp. | 4,200 | 1,230,810 | ||||||
| Union Pacific Corp. | 4,400 | 1,062,160 | ||||||
| Waste Connections, Inc. | 5,700 | 775,257 | ||||||
| 5,303,829 | ||||||||
| Shares or Principal Amount | Value | |||||||
| Real Estate (5.1%) | ||||||||
| American Tower Corp., REIT | 5,100 | $ | 1,438,047 | |||||
| Crown Castle International Corp., REIT | 7,900 | 1,424,370 | ||||||
| GEO Group, Inc. (The), REIT | 13,600 | 111,248 | ||||||
| 2,973,665 | ||||||||
| Utilities (11.7%) | ||||||||
| American Electric Power Co., Inc. (c) | 7,900 | 669,209 | ||||||
| CenterPoint Energy, Inc. | 34,400 | 895,776 | ||||||
| Clearway Energy, Inc., Class C | 24,500 | 869,260 | ||||||
| CMS Energy Corp. | 19,100 | 1,152,685 | ||||||
| FirstEnergy Corp. | 26,400 | 1,017,192 | ||||||
| NextEra Energy, Inc. | 12,800 | 1,092,224 | ||||||
| Vistra Corp. | 57,700 | 1,130,343 | ||||||
| 6,826,689 | ||||||||
| 19,926,667 | ||||||||
| Total Common Stocks | 57,102,695 | |||||||
| SHORT-TERM INVESTMENT (2.1%) | ||||||||
| UNITED STATES (2.1%) | ||||||||
| State Street Institutional U.S. Government Money Market Fund, Premier Class, 0.03% (d) | 1,243,937 | 1,243,937 | ||||||
| Total Short-Term Investment | 1,243,937 | |||||||
| Total Investments (Cost $46,310,022) (e)—100.1% | 58,346,632 | |||||||
| Liabilities in Excess of Other Assets—(0.1)% | (43,154 | ) | ||||||
| Net Assets—100.0% | $ | 58,303,478 | ||||||
| (a) | Non-income producing security. |
| (b) | Denotes a security issued under Regulation S or Rule 144A. |
| (c) | All or a portion of the security has been designated as collateral for unrealized depreciation on forward foreign currency contracts. |
| (d) | Registered investment company advised by State Street Global Advisors. The rate shown is the 7 day yield as of October 31, 2021. |
| (e) | See accompanying Notes to Financial Statements for tax unrealized appreciation/(depreciation) of securities. |
| ADR | American Depositary Receipt |
| PLC | Public Limited Company |
| REIT | Real Estate Investment Trust |
At October 31, 2021, the Fund's open forward foreign currency exchange contracts were as follows:
| Sale Contracts Settlement Date | Counterparty | Amount Purchased | Amount Sold | Fair Value | Unrealized Depreciation | |||||||||||
| United States Dollar/Hong Kong Dollar | ||||||||||||||||
| 01/13/2022 | Citibank N.A. | USD 1,798,413 | HKD 14,000,000 | $1,799,692 | $(1,279 | ) | ||||||||||
See accompanying Notes to Financial Statements.
40 2021 Annual Report
Aberdeen International Real Estate Equity Fund (Unaudited)
Aberdeen International Real Estate Equity Fund returned 18.28% for the 12-month reporting period ended October 31, 2021, versus the 34.18% return of its primary benchmark, the Morgan Stanley Capital International (MSCI) EAFE Index (net dividends), and the 23.36% return of its secondary benchmark, the Financial Times Stock Exchange European Public Real Estate Association/National Association of Real Estate Investment Trusts (FTSE EPRA/NAREIT) Global ex U.S. Index (net dividends) during the same period.
Market/Economic Review
For international real estate equities, the 12-month period ended October 31, 2021 has been a tale of two worlds. The U.S. and Europe saw strong share price recovery, as these regions gradually resumed economic reopenings. In contrast, the major Asia-Pacific region economies remained hindered by lockdowns, as governments maintained low-tolerance policies toward COVID-19. For example, Japan spent much of the third quarter of 2021 in various degrees of lockdown and recently announced that gross domestic product (GDP) in the third quarter contracted 3% on an annualized basis. Australia is expecting a 3% contraction in third-quarter GDP as well. Meanwhile, the U.S., Eurozone and the U.K. have seen robust economic growth since the second quarter of 2021. Performance of listed real estate stocks reflected the disparity in economic recovery. Share-price movements were highly correlated until the second quarter, when stocks in the U.S., Europe and U.K. began to show significant outperformance against their Asian counterparts. As an illustration of the performance disparity, the FTSE EPRA NAREIT U.S. Index1 returned 53.5% over the reporting period, while the FTSE EPRA NAREIT Developed Europe Index2 returned 34.6%, followed by the FTSE EPRA NAREIT Developed Asia Index,3 which returned 24.8%.
In Europe, the strongest-performing sectors within the FTSE EPRA/NAREIT Global ex U.S. Index for the reporting period were logistics and self-storage, while hotels and German residential were laggards. In Asia, positive index performance was driven by a few stock specific stories, notably in the asset managers (Capitaland Investment) and Hong Kong office (Hong Kong Land) sectors. In contrast, Brazil, Chile and China were, by far, the largest detractors at both country and sector levels for the index. Brazil's central bank continued to push through sharp rate hikes in its attempt to bring inflation in check, and has flagged for further increases to come. This triggered a market sell-off across all real estate sectors, with the homebuilders feeling the most pain. Chile is undergoing similar dynamics, albeit at lower magnitude, but has nonetheless driven a sell-off in listed real estate. Chinese developers sold off amid an industry meltdown brought about by several developers missing interest payments on offshore bonds. The meltdown has since spread, triggering defaults by several listed developers and a buyer's strike that has forced developers into a discount war in order to recover cash.
Fund Performance
The Fund underperformed its secondary benchmark, the FTSE EPRA/NAREIT Global ex U.S. Index (net dividends), over the 12-month period ended October 31, 2021. The largest detractors from performance were the Fund's holdings in Chinese developers Shimao and Logan. These are private-sector developers with, in our view, good balance sheets. Nevertheless, investors fled the sector, sometimes in favor of state-owned developers, which saw smaller levels of underperformance. It is worth noting that the Fund was underweight to Chinese developers and continued to reduce exposure through the period. This underweight positioning in Chinese developers, on the whole, contributed strongly to performance. Vonovia, a German residential giant, was the next-largest detractor over the period. The German residential sector struggled due to concerns over regulatory headwinds (rent caps), especially against the backdrop of potential leadership change at the national elections that took place in September 2021. The idea of rent caps was more damaging in the context of rising inflation, which became a global concern in the second half of 2021. Additionally, Vonovia attempted two major corporate acquisitions in the period, with Deutsche Wohnen (which was not completed) and Adler Group (an ongoing discussion), both of which created share-price volatility, driven by concerns of potential capital-raising.
On the positive side, the Fund's overweight to the logistics sector was the largest contributor to performance. This primarily comprised a position in U.S.-based Prologis Inc., which is not a constituent of the benchmark FTSE EPRA/NAREIT Global ex U.S. Index, and Segro plc in the UK. The logistics sector is experiencing some of the strongest fundamentals in recent history, with robust market rent growth and cap-rate compression. The Fund's underweight positions in China Evergrande Group, Country Garden Holdings Ltd. and Longfor Group Holdings Ltd., three of the largest property developers in China, bolstered performance for the reporting period. The holding in Capitaland Investment Ltd. was also a notable contributor to Fund performance. Capitaland Investment was spun off in the restructuring of the Capitaland Group and is intended to be an asset manager of the Capitaland stable of REITs and private funds. Investors appear to have reservations about Capitaland's ability to transition into an asset manager given that it is a sovereign-owned real estate developer at heart. Nevertheless, the stock initially was listed at a cheap valuation relative to its asset management peers and, in our view, has an above-average growth trajectory over the medium term. Consequently, the stock price moved sharply higher in the month following its listing in late September 2021.
While the Fund was already underweight to Europe relative to the benchmark, we further decreased exposure to the region during the reporting period. We achieved this primarily by exiting the position in office REIT Alstria following a surge in its share price after the stock
| 1 | The FTSE EPRA NAREIT U.S. Index is a free-float adjusted, market capitalization-weighted index of U.S. equity REITs. Indexes are unmanaged and have been provided for comparison purposes only. No fees or expenses are reflected. You cannot invest directly in an index. |
| 2 | The FTSE EPRA NAREIT Developed Europe Index is a free-float adjusted, market capitalization-weighted index of European equity REITs. |
| 3 | The FTSE EPRA NAREIT Developed Asia Index is a free-float adjusted, market capitalization-weighted index of Asian equity REITs. |
2021 Annual Report 41
Aberdeen International Real Estate Equity Fund (Unaudited) (concluded)
received a bid from Canada-based investment company Brookfield Asset Management Inc. (which the Fund did not hold as of the end of the reporting period). Going forward, we are likely to remain selective in the Fund's holdings in Europe given the robust valuations and modest growth prospects. In term of emerging markets, we expect to maintain the Fund's underweight in the near term, given policy and fundamental headwinds for real estate stocks in China, as well as acute inflationary pressures driving interest-rate hikes in countries such as Brazil and Chile.
Market Outlook
In the coming year, we believe that parts of the Asia-Pacific region, including Japan, Australia and Singapore, could benefit from a delayed reopening as high vaccination rates and low rates of hospitalizations from COVID-19 lay a good foundation for accelerations of economic activity. Importantly, the governments of these nations are pivoting toward wanting to reintegrate with the rest of the world, rather than persist with a low-tolerance policy toward COVID-19 infections. Consequently, we will seek to take advantage of select reopening opportunities within these countries that have stock-specific catalysts. The Fund will look to retain a certain level of exposure to the U.S., given outsized potential for earnings and capital-value growth, driven by robust fundamentals in sectors such as logistics and self-storage. The U.S. also enables the Fund to gain exposure to what we believe are investment-worthy asset classes that are not available in other regions, including data centers and telecommunication towers.
Portfolio Management:
Global Real Estate team
PAST PERFORMANCE DOES NOT GUARANTEE FUTURE RESULTS.
The performance data quoted represents past performance and current returns may be lower or higher. Class A Shares have up to a 5.75% front-end sales charge and a 0.25% 12b-1 fee. The investment return and principal value will fluctuate so that an investor's shares, when redeemed, may be worth more or less than the original cost. To obtain performance information current to the most recent month-end, which may be higher or lower than the performance shown above, please call 866-667-9231 or go to https://www.abrdn.com/en-us/us/investor/fund-centre.
Investing in mutual funds involves risk, including possible loss of principal.
Indexes are unmanaged and have been provided for comparison purposes only. No fees or expenses are reflected. You cannot invest directly in an index.
Risk Considerations
Deteriorating market conditions might cause a general weakness in the market that reduces the prices, or yield, of securities in those markets in which the Fund invests.
The value of a security may decline for reasons directly related to the issuer, such as management performance, financial leverage and reduced demand for the issuer's goods or services.
The stock or other security of a company may not perform as well as expected, and may decrease in value, because of factors related to the company, to the industry in which the company is engaged, or to the market as a whole.
The Fund is subject to the risk that the Adviser or Subadviser may make poor security selections.
Investments in REITs and real estate securities may involve greater risk and volatility including greater exposure to economic downturns and changes in real estate values, rents, property taxes, interest rates, tax and other laws.
The Fund's strategy of concentrating in companies in a specific industry means that its performance will be closely tied to the performance of a particular market segment, which may present more risks than if it were broadly diversified over numerous industries and sectors of the economy.
Foreign securities are more volatile, harder to price and less liquid than U.S. securities. They are subject to different accounting and regulatory standards, and currency exchange rate, political and economic risks.
The value of foreign currencies relative to the U.S. Dollar fluctuates in response to market, economic, political, regulatory, geopolitical or other conditions. Fluctuations in currency exchange rates may impact a Fund's returns more greatly to the extent the Fund does not hedge currency exposure or hedging techniques are unsuccessful.
Please read the prospectus for more detailed information regarding these and other risks.
42 2021 Annual Report
Aberdeen International Real Estate Equity Fund (Unaudited)
| Average Annual Total Return1 (For periods ended October 31, 2021) | 1 Yr. | 5 Yr. | 10 Yr. | |||||
| Class A | w/o SC | 18.04% | 5.21% | N.A. | ||||
| w/ SC2 | 11.23% | 3.97% | N.A. | |||||
| Institutional Class3 | w/o SC | 18.28% | 5.45% | 3.24% |
All figures showing the effect of a sales charge (SC) reflect the maximum charge possible because it has the most significant effect on performance data. The total returns shown above do not include the impact of financial statement rounding of the net asset value (NAV) per share and/or financial statement adjustments.
| 1 | Returns prior to May 7, 2018 reflect the performance of a predecessor fund (the "Predecessor Fund"). Returns of the Predecessor Fund have not been adjusted to reflect the expenses applicable to the respective classes. The Fund and the Predecessor Fund have substantially similar investment objectives and strategies. Please consult the Fund's prospectus for more detail. |
| 2 | A 5.75% front-end sales charge was deducted. |
| 3 | Not subject to any sales charges. |
Performance of a $1,000,000 Investment* (as of October 31, 2021)
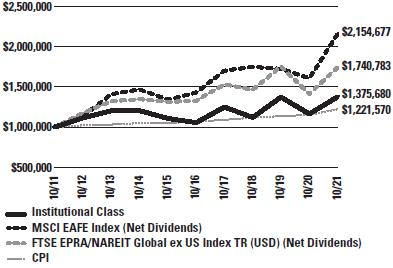
* Minimum Initial Investment
Comparative performance of $1,000,000 invested in Institutional Class shares of the Aberdeen International Real Estate Equity Fund, the Morgan Stanley Capital International (MSCI) EAFE Index (Net
Dividends), FTSE EPRA/NAREIT Global ex US Index (Net Dividends) and the Consumer Price Index (CPI) over a 10-year period ended October 31, 2021. Unlike the Fund, the returns for these unmanaged indexes do not reflect any fees, expenses or sales charges. Investors cannot invest directly in market indexes.
The MSCI EAFE Index is an equity index which captures large and mid cap representation across 21 Developed Markets countries around the world, excluding the US and Canada. With 841 constituents, the index covers approximately 85% of the free float adjusted market capitalization in each country. Developed Markets countries in the MSCI EAFE Index include: Australia, Austria, Belgium, Denmark, Finland, France, Germany, Hong Kong, Ireland, Israel, Italy, Japan, the Netherlands, New Zealand, Norway, Portugal, Singapore, Spain, Sweden, Switzerland and the UK.
The FTSE EPRA/NAREIT Global ex-U.S. Index is a total return index that is designed to represent general trends in eligible real estate equities outside the United States.
The CPI is a measure of the average change over time in the prices paid by urban consumers for a market basket of consumer goods and services.
Investment return and principal value will fluctuate, and when redeemed, shares may be worth more or less than original cost. Past performance is no guarantee of future results. The Average Annual Total Return table and Performance graph do not reflect the deduction of taxes that a shareholder would pay on fund distributions or the redemption of fund shares. Investing in mutual funds involves market risk, including loss of principal. Performance returns assume the reinvestment of all distributions. Total returns reflect waivers and reimbursements in effect, without which returns would have been lower.
2021 Annual Report 43
Aberdeen International Real Estate Equity Fund (Unaudited)
Portfolio Summary (as a percentage of net assets)
October 31, 2021 (Unaudited)
| Asset Allocation | ||
| Common Stocks | 95.8% | |
| Short-Term Investment | 3.3% | |
| Other Assets in Excess of Liabilities | 0.9% | |
| 100.0% |
The following table summarizes the composition of the Fund's portfolio, in S&P Global Industry Classification Standard (GICS) sectors, expressed as a percentage of net assets as of October 31, 2021.
| Sub-Industries | ||
| Diversified Real Estate Activities | 16.5% | |
| Office REITs | 16.3% | |
| Industrial REITs | 14.8% | |
| Real Estate Operating Companies | 14.2% | |
| Real Estate Development | 10.1% | |
| Diversified REITs | 8.4% | |
| Specialized REITs | 6.3% | |
| Retail REITs | 5.6% | |
| Residential REITs | 1.8% | |
| Health Care REITs | 1.0% | |
| Other | 5.0% | |
| 100% | ||
| Top Holdings* | ||
| Mitsui Fudosan Co. Ltd., REIT | 5.0% | |
| Sun Hung Kai Properties Ltd. | 4.2% | |
| Segro PLC | 4.1% | |
| Vonovia SE | 3.9% | |
| Nippon Building Fund, Inc., REIT | 3.3% | |
| Prologis, Inc., REIT | 3.3% | |
| Instone Real Estate Group SE | 3.1% | |
| Tokyu Fudosan Holdings Corp. | 2.5% | |
| Link REIT | 2.5% | |
| CRE Logistics REIT, Inc. | 2.5% | |
| Other | 65.6% | |
| 100.0% |
| * | For the purpose of listing top holdings, Short-Term Investments are included as part of Other. |
| Top Countries | ||
| Japan | 22.7% | |
| United States | 13.3% | |
| Germany | 11.4% | |
| Hong Kong | 8.5% | |
| United Kingdom | 7.8% | |
| Australia | 6.6% | |
| China | 6.1% | |
| Singapore | 4.5% | |
| Canada | 3.4% | |
| Belgium | 3.0% | |
| Other | 12.7% | |
| 100.0% |
44 2021 Annual Report
Statement of Investments
October 31, 2021
Aberdeen International Real Estate Equity Fund
| Shares or Principal Amount | Value | |||||||
| COMMON STOCKS (95.8%) | ||||||||
| AUSTRALIA (6.6%) | ||||||||
| Real Estate (6.6%) | ||||||||
| Charter Hall Group | 24,067 | $ | 315,757 | |||||
| Dexus, REIT | 41,456 | 340,055 | ||||||
| Goodman Group, REIT | 12,759 | 211,249 | ||||||
| Lendlease Corp., Ltd. | 15,856 | 125,615 | ||||||
| Mirvac Group, REIT | 193,131 | 412,173 | ||||||
| 1,404,849 | ||||||||
| BELGIUM (3.0%) | ||||||||
| Real Estate (3.0%) | ||||||||
| Aedifica SA, REIT | 1,560 | 208,026 | ||||||
| Cofinimmo SA, REIT | 1,323 | 213,445 | ||||||
| Warehouses De Pauw CVA, REIT | 4,751 | 216,344 | ||||||
| 637,815 | ||||||||
| BRAZIL (0.3%) | ||||||||
| Consumer Discretionary (0.3%) | ||||||||
| Cyrela Brazil Realty SA Empreendimentos e Participacoes | 25,048 | 62,533 | ||||||
| CANADA (3.4%) | ||||||||
| Real Estate (3.4%) | ||||||||
| Allied Properties Real Estate Investment Trust | 9,578 | 331,004 | ||||||
| Canadian Apartment Properties, REIT | 8,056 | 393,362 | ||||||
| 724,366 | ||||||||
| CHINA (6.1%) | ||||||||
| Real Estate (6.1%) | ||||||||
| China Overseas Land & Investment Ltd. | 58,000 | 127,922 | ||||||
| China Resources Land Ltd. | 89,971 | 349,580 | ||||||
| ESR Cayman Ltd. (a)(b)(c) | 84,349 | 272,942 | ||||||
| Logan Group Co., Ltd. | 289,273 | 289,765 | ||||||
| Shimao Group Holdings Ltd. | 161,704 | 253,662 | ||||||
| 1,293,871 | ||||||||
| FRANCE (0.7%) | ||||||||
| Real Estate (0.7%) | ||||||||
| Unibail-Rodamco-Westfield (b) | 2,214 | 158,090 | ||||||
| GERMANY (11.4%) | ||||||||
| Real Estate (11.4%) | ||||||||
| alstria office REIT-AG | 14,527 | 271,536 | ||||||
| Instone Real Estate Group SE (a) | 24,875 | 655,625 | ||||||
| LEG Immobilien SE | 2,087 | 310,427 | ||||||
| TAG Immobilien AG | 11,839 | 359,682 | ||||||
| Vonovia SE | 13,645 | 827,744 | ||||||
| 2,425,014 | ||||||||
| HONG KONG (8.5%) | ||||||||
| Real Estate (8.5%) | ||||||||
| Link REIT | 60,461 | 535,650 | ||||||
| Sino Land Co. Ltd. | 298,000 | 391,687 | ||||||
| Sun Hung Kai Properties Ltd. | 66,311 | 879,173 | ||||||
| 1,806,510 | ||||||||
| Shares or Principal Amount | Value | |||||||
| JAPAN (22.7%) | ||||||||
| Real Estate (22.7%) | ||||||||
| Canadian Solar Infrastructure Fund, Inc., UNIT | 137 | $ | 149,892 | |||||
| CRE Logistics REIT, Inc. | 269 | 523,350 | ||||||
| Hulic Co. Ltd. | 24,800 | 238,464 | ||||||
| Japan Excellent, Inc. | 233 | 281,331 | ||||||
| Kenedix Retail REIT Corp. | 90 | 229,639 | ||||||
| LaSalle Logiport REIT | 185 | 307,752 | ||||||
| Mirai Corp., REIT | 726 | 335,180 | ||||||
| Mitsui Fudosan Co. Ltd., REIT | 46,550 | 1,064,311 | ||||||
| Mori Hills REIT Investment Corp., REIT | 92 | 124,737 | ||||||
| Nippon Building Fund, Inc., REIT | 108 | 701,670 | ||||||
| Sankei Real Estate, Inc., REIT | 292 | 320,422 | ||||||
| Tokyu Fudosan Holdings Corp. | 92,600 | 536,563 | ||||||
| 4,813,311 | ||||||||
| MEXICO (2.3%) | ||||||||
| Real Estate (2.3%) | ||||||||
| Corp Inmobiliaria Vesta SAB de CV, REIT | 111,276 | 193,711 | ||||||
| Prologis Property Mexico SA de CV, REIT | 124,330 | 287,273 | ||||||
| 480,984 | ||||||||
| NETHERLANDS (1.2%) | ||||||||
| Real Estate (1.2%) | ||||||||
| CTP NV (a) | 12,455 | 264,494 | ||||||
| PHILIPPINES (1.2%) | ||||||||
| Real Estate (1.2%) | ||||||||
| Ayala Land, Inc. | 279,392 | 194,538 | ||||||
| Megaworld Corp. | 1,019,705 | 62,125 | ||||||
| 256,663 | ||||||||
| SINGAPORE (4.5%) | ||||||||
| Real Estate (4.5%) | ||||||||
| Ascendas India Trust, UNIT | 226,500 | 234,008 | ||||||
| Capitaland Investment Ltd. (b) | 173,600 | 442,851 | ||||||
| Lendlease Global Commercial REIT | 418,400 | 271,670 | ||||||
| 948,529 | ||||||||
| SOUTH KOREA (0.8%) | ||||||||
| Real Estate (0.8%) | ||||||||
| ESR Kendall Square REIT Co. Ltd. | 27,246 | 159,046 | ||||||
| SPAIN (2.5%) | ||||||||
| Real Estate (2.5%) | ||||||||
| Inmobiliaria Colonial Socimi SA, REIT | 38,748 | 376,707 | ||||||
| Merlin Properties Socimi SA | 13,161 | 142,529 | ||||||
| 519,236 | ||||||||
| SWEDEN (2.8%) | ||||||||
| Real Estate (2.8%) | ||||||||
| Castellum AB | 4,074 | 108,587 | ||||||
| Catena AB | 2,557 | 155,718 | ||||||
| Fabege AB | 18,878 | 319,539 | ||||||
| 583,844 | ||||||||
See accompanying Notes to Financial Statements.
| 2021 Annual Report | 45 |
Statement of Investments (concluded)
October 31, 2021
Aberdeen International Real Estate Equity Fund
| Shares or Principal Amount | Value | |||||||
| COMMON STOCKS (continued) | ||||||||
| UNITED KINGDOM (7.8%) | ||||||||
| Consumer Discretionary (0.5%) | ||||||||
| Bellway PLC | 2,386 | $ | 108,262 | |||||
| Real Estate (7.3%) | ||||||||
| Land Securities Group PLC | 24,390 | 229,134 | ||||||
| LondonMetric Property PLC, REIT | 92,414 | 330,523 | ||||||
| Safestore Holdings PLC, REIT | 7,149 | 117,601 | ||||||
| Segro PLC | 48,743 | 861,510 | ||||||
| South Asian Real Estate Pvt. Ltd. (a)(b)(c)(d) | 2,000,000 | – | ||||||
| 1,538,768 | ||||||||
| 1,647,030 | ||||||||
| UNITED STATES (10.0%) | ||||||||
| Real Estate (10.0%) | ||||||||
| Alexandria Real Estate Equities, Inc. | 1,775 | 362,348 | ||||||
| American Tower Corp., REIT | 1,554 | 438,181 | ||||||
| Digital Realty Trust, Inc. | 1,395 | 220,145 | ||||||
| Equinix, Inc., REIT | 472 | 395,097 | ||||||
| Prologis, Inc., REIT | 4,834 | 700,737 | ||||||
| 2,116,508 | ||||||||
| Total Common Stocks | 20,302,693 | |||||||
| Shares or Principal Amount | Value | |||||||
| SHORT-TERM INVESTMENT (3.3%) | ||||||||
| UNITED STATES (3.3%) | ||||||||
| State Street Institutional U.S. Government Money Market Fund, Premier Class, 0.03% (e) | 705,270 | $ | 705,270 | |||||
| Total Short-Term Investment | 705,270 | |||||||
| Total Investments (Cost $31,425,556) (f)—99.1% | 21,007,963 | |||||||
| Other Assets in Excess of Liabilities—0.9% | 191,099 | |||||||
| Net Assets—100.0% | $ | 21,199,062 | ||||||
| (a) | Denotes a security issued under Regulation S or Rule 144A. |
| (b) | Non-income producing security. |
| (c) | Illiquid security. |
| (d) | Fair Value is determined pursuant to procedures approved by the Fund's Board of Trustees. See Note 2(a) of the accompanying Notes to Financial Statements for inputs used. |
| (e) | Registered investment company advised by State Street Global Advisors. The rate shown is the 7 day yield as of October 31, 2021. |
| (f) | See accompanying Notes to Financial Statements for tax unrealized appreciation/(depreciation) of securities. |
| CVA | Dutch Certificate |
| PLC | Public Limited Company |
| REIT | Real Estate Investment Trust |
See accompanying Notes to Financial Statements.
| 46 | 2021 Annual Report |
Aberdeen International Small Cap Fund (Unaudited)
Aberdeen International Small Cap Fund (Institutional Class I shares net of fees) returned 42.11% for the 12-month reporting period ended October 31, 2021, versus the 38.83% return of its benchmark, the MSCI AC World (ex-USA) Small Cap Index (net dividends), during the same period.
Major global equity market indices moved sharply higher despite bouts of significant market volatility over the 12-month period ended October 31, 2021. Supportive monetary and fiscal policies were prevalent over the period. The U.S. Federal Reserve (Fed) maintained the federal funds rate at near 0% throughout the reporting period, while providing support through its bond-buying program. Elsewhere, the European Central Bank ramped up its original €1.35 trillion (US$1.57 trillion) stimulus plan to €1.85 trillion (US$2.15 trillion) in December 2020. The U.S. Congress passed two additional stimulus packages during the reporting period, with a cumulative total of roughly $2.8 trillion. In August 2021, the U.S. Senate passed the $1 trillion infrastructure deal.
At the beginning of the reporting period in November 2020, news of three major COVID-19 vaccines buoyed investor sentiment. This persisted through to the end of 2020 due to the launch of vaccination programs, the approval of stimulus packages, and the UK and the European Union reaching a Brexit trade deal.
Momentum stalled in January and February 2021, as global bond markets experienced a significant selloff, spurring worries that this could impact the fragile global recovery. The downturn in bond markets also had a negative impact on equities. However, stock markets resumed their upward momentum, driven by economic optimism, vaccine rollouts, central banks' continued accommodative monetary policies, and a strong corporate earnings reporting season. The MSCI AC World Index reached a record high in August 2021, but sold off in September amid investors' growing concerns over inflation and possible interest-rate hikes from central banks. Uneasiness about the global economy led to a selloff across most equity markets across the globe. In October 2021, upbeat company results, along with comments that demand remained strong, eased investors' concerns about stagflation,* supply-chain pressures, spiraling energy prices and higher interest rates.
The Fund outperformed its benchmark, the MSCI AC World (ex-USA) Small Cap Index, for the reporting period.
The holding in InMode Ltd. contributed positively to Fund performance for the reporting period. The Israel-based medical technologies company's stock price moved higher due to increased adoption of its products, continued strength in the U.S., a growing global footprint, and new product launches. Moreover, InMode benefited from its diversified revenue base and high- margin business model. The company's stock price moved higher on news of new client wins and partnerships. Kornit Digital Ltd., a manufacturer of digital textile printers, reported relatively strong results over the reporting period, boosted by healthy revenue growth. The company continued to innovate and expand into new areas, thereby opening up fresh opportunities. Kornit's latest product is witnessing decent order
momentum. It is a tool that serves to improve efficiencies between apparel brands and retailers and the fulfilment channel. Shares of the Fund's holding in Endava plc performed well over the reporting period as the software developer's results consistently exceeded the market's expectations. Additionally, late in the reporting period, management raised its earnings guidance for the company's 2022 fiscal year
In contrast, as with other e-commerce companies in China, the Fund's holding in Baozun Inc. has seen its stock price sell off during the government's crackdown on the internet sector. Shares of Afya Ltd. moved lower as the Brazilian medical education company's results over the reporting period generally did not meet the market's expectations Finally, Nabtesco Corp., a Japanese engineering company that makes gearboxes and precision drives, declined during the reporting period. Nabtesco's business was hampered by economic weakness in China, which is the company's largest export market.
During the reporting period, we initiated a holding in Taiwan-based Voltronic Power Technology Corp. as we believe that it has a dominant position within the niche uninterruptible power supply systems (UPS) market. We established a new position in Baozun Inc. as we feel that it has a strong position in China's e-commerce sector. We initiated a holding in InMode as we feel that it has distinctive intellectual properties in a growing healthcare niche. We purchased shares of UK-based software developer Endava, as we believe that it has robust long-term drivers for its business. We initiated a position in Taiwan's Chroma ATE Inc., a global leader in power electronics test and measurement instrumentation. We also initiated a holding in Affle India Ltd. given its leading digital advertising business in India. We established a new position in China Education Group Holdings Ltd., a leading provider of higher education in mainland China. We purchased shares of TechnoPro Holdings NPV, the largest research and development engineering outsourcing firm in Japan. Additionally, we invested in Swedish financial services firm Nordnet AB, as we like its digital platform offering for loans, savings, mortgages and investments focused on Scandinavia. We initiated a holding in UK-listed Games Workshop Group plc, a maker of tabletop fantasy and futuristic battle-games, given the durability of the stock's performance and growth from the company's brand strength and, in our view, its exceptional management and international potential. We established a new position in biotechnology firm PolyPeptide Group AG, a leading peptide manufacturer with opportunities in oligonucleotides. Finally, we purchased shares of Hemnet Group AB, a Swedish residential online property information platform.
We exited numerous positions during the reporting period, including Chilean Coca-Cola bottler Embotelladora Andina SA; Taiwanese semiconductor components maker GlobalWafers Co. Ltd,; Thailand-based hypermarket operator Tesco Lotus Retail; Tesco Lotus Retail Growth Freehold and Leasehold Property Fund; Chilean property company Parque Arauco; New Zealand-based Auckland Airport International Ltd.; UK-based defense contractor Ultra Electronics Holdings plc; Australian software developer Altium Ltd.; Kerry Logistics Network Ltd. a provider of supply-chain solutions from integrated logistics; UK-based pump manufacturer Rotork plc;
* Stagflation refers to an economic environment of stagnant activity and accelerating inflation
| 2021 Annual Report | 47 |
Aberdeen International Small Cap Fund (Unaudited) (concluded)
Japanese medical device maker Asahi Intecc Co. Ltd.; and Indonesian property developer Pakuwon Jati Tbk PT.
From our conversations with various industry participants, it appears that some of the supply bottlenecks emanating from manufacturing hubs in Asia are now easing. Some raw material costs, noticeably metals, are also lessening due to a mix of government price caps and demand slowdown.
In the U.S. and Western Europe, we await the effect of the withdrawal of government support programs on labor participation. We feel that these factors suggest that, as we head towards the end of 2021, pressure on the supply chain could begin to moderate. Overall, we believe that equity market performance may be tempered by gradual monetary policy normalization from central banks and the potential impact of increased taxation.
Portfolio Management:
Global Equity Team
PAST PERFORMANCE DOES NOT GUARANTEE FUTURE RESULTS.
The performance data quoted represents past performance and current returns may be lower or higher. Class A Shares have up to a 5.75% front-end sales charge and a 0.25% 12b-1 fee. The investment return and principal value will fluctuate so that an investor's shares, when redeemed, may be worth more or less than the original cost. To obtain performance information current to the most recent month-end, which may be higher or lower than the performance shown above, please call 866-667-9231 or go to https://www.abrdn.com/en-us/us/investor/fund-centre.
Investing in mutual funds involves risk, including the possible loss of principal.
Indexes are unmanaged and have been provided for comparison purposes only. No fees or expenses are reflected. You cannot invest directly in an index.
Risk Considerations
Deteriorating market conditions might cause a general weakness in the market that reduces the prices, or yield, of securities in those markets in which the Fund invests.
The value of a security may decline for reasons directly related to the issuer, such as management performance, financial leverage and reduced demand for the issuer's goods or services.
The stock or other security of a company may not perform as well as expected, and may decrease in value, because of factors related to the company, to the industry in which the company is engaged, or to the market as a whole.
The Fund is subject to the risk that the Adviser or Subadviser may make poor security selections.
Foreign securities are more volatile, harder to price and less liquid than U.S. securities. They are subject to different accounting and regulatory standards, and currency exchange rate, political and economic risks.
The value of foreign currencies relative to the U.S. Dollar fluctuates in response to market, economic, political, regulatory, geopolitical or other conditions. Fluctuations in currency exchange rates may impact a Fund's returns more greatly to the extent the Fund does not hedge currency exposure or hedging techniques are unsuccessful.
Securities of smaller companies are usually less stable in price and less liquid than those of larger, more established companies. Therefore, they generally involve greater risk.
Please read the prospectus for more detailed information regarding these and other risks.
| 48 | 2021 Annual Report |
Aberdeen International Small Cap Fund (Unaudited)
| Average Annual Total Return1 (For periods ended October 31, 2021) | 1 Yr. | 5 Yr. | 10 Yr. | ||||||||||||
| Class A | w/o SC | 41.62 | % | 16.43 | % | 12.32 | % | ||||||||
| w/ SC2 | 33.48 | % | 15.07 | % | 11.65 | % | |||||||||
| Class C | w/o SC | 40.72 | % | 15.66 | % | 11.56 | % | ||||||||
| w/ SC3 | 39.72 | % | 15.66 | % | 11.56 | % | |||||||||
| Class R4 | w/o SC | 41.19 | % | 16.06 | % | 11.98 | % | ||||||||
| Institutional Class4 | w/o SC | 42.11 | % | 16.83 | % | 12.69 | % | ||||||||
All figures showing the effect of a sales charge (SC) reflect the maximum charge possible because it has the most significant effect on performance data. The total returns shown above do not include the impact of financial statement rounding of the net asset value (NAV) per share and/or financial statement adjustments.
| 1 | The Fund changed its investment strategy effective February 29, 2016. Performance information for periods prior to February 29, 2016 does not reflect the current investment strategy. Please consult the Fund's prospectus for more detail. |
| 2 | A 5.75% front-end sales charge was deducted. |
| 3 | A 1.00% contingent deferred sales charge (CDSC) was deducted from the one year return because it is charged when Class C shares are sold within the first year after purchase. |
| 4 | Not subject to any sales charges. |
Performance of a $10,000 Investment (as of October 31, 2021)

Comparative performance of $10,000 invested in Class A shares of the Aberdeen International Small Cap Fund, Morgan Stanley Capital Index (MSCI) All Country World (ACWI) ex-USA Small Cap Index (Net Dividends) and the Consumer Price Index (CPI) over a 10-year period
ended October 31, 2021. Unlike the Fund, the returns for these unmanaged indexes do not reflect any fees, expenses, or sales charges. Investors cannot invest directly in market indexes.
The MSCI ACWI ex-USA Small Cap Index captures small cap representation across 22 of 23 Developed Markets (DM) countries (excluding the US) and 27 Emerging Markets (EM) countries. With 4,372 constituents, the index covers approximately 14% of the global equity opportunity set outside the US. DM countries include: Australia, Austria, Belgium, Canada, Denmark, Finland, France, Germany, Hong Kong, Ireland, Israel, Italy, Japan, Netherlands, New Zealand, Norway, Portugal, Singapore, Spain, Sweden, Switzerland and the UK. EM countries include: Argentina, Brazil, Chile, China, Colombia, Czech Republic, Egypt, Greece, Hungary, India, Indonesia, Korea, Kuwait, Malaysia, Mexico, Pakistan, Peru, Philippines, Poland, Qatar, Russia, Saudi Arabia, South Africa, Taiwan, Thailand, Turkey and United Arab Emirates.
The CPI is a measure of the average change over time in the prices paid by urban consumers for a market basket of consumer goods and services.
Investment return and principal value will fluctuate, and when redeemed, shares may be worth more or less than original cost. Past performance is no guarantee of future results. The Average Annual Total Return table and Performance graph do not reflect the deduction of taxes that a shareholder would pay on fund distributions or the redemption of fund shares. Investing in mutual funds involves market risk, including loss of principal. Performance returns assume the reinvestment of all distributions. Total returns reflect waivers and reimbursements in effect, without which returns would have been lower.
| 2021 Annual Report | 49 |
Aberdeen International Small Cap Fund (Unaudited)
Portfolio Summary (as a percentage of net assets)
October 31, 2021 (Unaudited)
| Asset Allocation | |||
| Common Stocks | 96.4% | ||
| Short-Term Investment | 5.8% | ||
| Liabilities in Excess of Other Assets | (2.2%) | ||
| 100.0% | |||
The following table summarizes the composition of the Fund's portfolio, in S&P Global Industry Classification Standard (GICS) sectors, expressed as a percentage of net assets as of October 31, 2021.
| Top Sectors | |||
| Industrials | 19.9% | ||
| Health Care | 19.5% | ||
| Consumer Discretionary | 18.0% | ||
| Information Technology | 14.2% | ||
| Consumer Staples | 8.6% | ||
| Communication Services | 6.0% | ||
| Materials | 5.4% | ||
| Financials | 4.8% | ||
| Other | 3.6% | ||
| 100.0% | |||
| Top Holdings* | |||
| Kornit Digital Ltd. | 4.0% | ||
| CyberArk Software Ltd. | 3.6% | ||
| Dechra Pharmaceuticals PLC | 3.5% | ||
| Interparfums SA | 3.5% | ||
| Genus PLC | 3.3% | ||
| Endava PLC, ADR | 3.3% | ||
| Dino Polska SA | 3.2% | ||
| Nova Ltd. | 3.2% | ||
| Hansol Chemical Co. Ltd. | 3.0% | ||
| Voltronic Power Technology Corp. | 3.0% | ||
| Other | 66.4% | ||
| 100.0% | |||
| * | For the purpose of listing top holdings, Short-Term Investments are included as part of Other. |
| Top Countries | |||
| Israel | 13.4% | ||
| United States | 10.4% | ||
| United Kingdom | 10.0% | ||
| India | 6.9% | ||
| Japan | 6.6% | ||
| South Korea | 5.4% | ||
| Taiwan | 4.9% | ||
| Germany | 4.6% | ||
| Canada | 4.3% | ||
| China | 4.0% | ||
| Other | 29.5% | ||
| 100.0% | |||
| 50 | 2021 Annual Report |
Statement of Investments
October 31, 2021
Aberdeen International Small Cap Fund
| Shares or Principal Amount | Value | |||||
| COMMON STOCKS (96.4%) | ||||||
| AUSTRALIA (1.5%) | ||||||
| Consumer Discretionary (1.5%) | ||||||
| ARB Corp. Ltd. | 124,710 | $ | 4,593,174 | |||
| BRAZIL (3.1%) | ||||||
| Consumer Discretionary (3.1%) | ||||||
| Afya Ltd., Class A (a) | 310,400 | 5,416,480 | ||||
| Arezzo Industria e Comercio SA | 304,600 | 3,988,437 | ||||
| 9,404,917 | ||||||
| CANADA (4.3%) | ||||||
| Consumer Staples (1.9%) | ||||||
| Jamieson Wellness, Inc. (b) | 189,700 | 5,841,522 | ||||
| Industrials (2.4%) | ||||||
| Ritchie Bros Auctioneers, Inc. | 107,800 | 7,368,133 | ||||
| 13,209,655 | ||||||
| CHINA (4.0%) | ||||||
| Consumer Discretionary (4.0%) | ||||||
| Baozun, Inc., Class A (a) | 863,200 | 4,982,406 | ||||
| China Education Group Holdings Ltd. | 4,214,000 | 7,203,144 | ||||
| 12,185,550 | ||||||
| DENMARK (2.2%) | ||||||
| Information Technology (2.2%) | ||||||
| SimCorp A/S | 56,128 | 6,796,779 | ||||
| FRANCE (3.5%) | ||||||
| Consumer Staples (3.5%) | ||||||
| Interparfums SA | 133,689 | 10,816,092 | ||||
| GERMANY (4.6%) | ||||||
| Communication Services (1.8%) | ||||||
| CTS Eventim AG & Co. KGaA (a) | 76,300 | 5,549,340 | ||||
| Financials (2.8%) | ||||||
| Hypoport SE (a) | 14,000 | 8,618,861 | ||||
| 14,168,201 | ||||||
| HONG KONG (2.9%) | ||||||
| Industrials (2.9%) | ||||||
| Pacific Basin Shipping Ltd. | 18,994,800 | 8,766,223 | ||||
| INDIA (6.9%) | ||||||
| Communication Services (2.3%) | ||||||
| Affle India Ltd. (a) | 494,380 | 7,040,472 | ||||
| Health Care (4.6%) | ||||||
| Sanofi India Ltd. | 65,400 | 7,274,074 | ||||
| Syngene International Ltd. (a)(b) | 925,500 | 6,716,977 | ||||
| 13,991,051 | ||||||
| 21,031,523 | ||||||
| Shares or Principal Amount | Value | |||||
| INDONESIA (1.6%) | ||||||
| Consumer Discretionary (1.6%) | ||||||
| Ace Hardware Indonesia Tbk PT | 48,025,800 | $ | 4,786,084 | |||
| ISRAEL (13.4%) | ||||||
| Consumer Discretionary (2.7%) | ||||||
| Maytronics Ltd. | 351,803 | 8,315,998 | ||||
| Industrials (4.0%) | ||||||
| Kornit Digital Ltd. (a) | 73,100 | 12,228,168 | ||||
| Information Technology (6.7%) | ||||||
| CyberArk Software Ltd. (a) | 61,300 | 11,040,743 | ||||
| Nova Ltd. (a) | 88,900 | 9,656,318 | ||||
| 20,697,061 | ||||||
| 41,241,227 | ||||||
| ITALY (2.9%) | ||||||
| Consumer Discretionary (2.9%) | ||||||
| Brunello Cucinelli SpA (a) | 147,375 | 8,941,265 | ||||
| JAPAN (6.6%) | ||||||
| Industrials (6.6%) | ||||||
| Nabtesco Corp. | 224,600 | 7,289,074 | ||||
| Nihon M&A Center Holdings, Inc. | 175,200 | 5,379,408 | ||||
| TechnoPro Holdings, Inc. | 236,000 | 7,542,384 | ||||
| 20,210,866 | ||||||
| MEXICO (1.1%) | ||||||
| Industrials (1.1%) | ||||||
| Grupo Aeroportuario del Sureste SAB de CV, | ||||||
| Class B | 164,400 | 3,320,979 | ||||
| POLAND (3.2%) | ||||||
| Consumer Staples (3.2%) | ||||||
| Dino Polska SA (a)(b) | 111,100 | 9,924,690 | ||||
| ROMANIA (3.3%) | ||||||
| Information Technology (3.3%) | ||||||
| Endava PLC, ADR (a) | 63,021 | 9,986,308 | ||||
| SOUTH KOREA (5.4%) | ||||||
| Materials (5.4%) | ||||||
| Chunbo Co. Ltd. | 30,400 | 7,391,751 | ||||
| Hansol Chemical Co. Ltd. | 32,500 | 9,171,777 | ||||
| 16,563,528 | ||||||
| SWEDEN (3.9%) | ||||||
| Communication Services (1.9%) | ||||||
| Hemnet Group AB (a) | 297,200 | 5,947,114 | ||||
| Financials (2.0%) | ||||||
| Nordnet AB publ | 311,400 | 5,968,891 | ||||
| 11,916,005 | ||||||
See accompanying Notes to Financial Statements.
| 2021 Annual Report | 51 |
Statement of Investments (concluded)
October 31, 2021
Aberdeen International Small Cap Fund
| Shares or Principal Amount | Value | |||||
| COMMON STOCKS (continued) | ||||||
| SWITZERLAND (2.5%) | ||||||
| Health Care (2.5%) | ||||||
| Tecan Group AG | 12,617 | $ | 7,730,463 | |||
| TAIWAN (4.9%) | ||||||
| Industrials (2.9%) | ||||||
| Voltronic Power Technology Corp. | 155,000 | 9,077,554 | ||||
| Information Technology (2.0%) | ||||||
| Chroma ATE, Inc. | 930,000 | 6,073,245 | ||||
| 15,150,799 | ||||||
| UNITED KINGDOM (10.0%) | ||||||
| Consumer Discretionary (2.2%) | ||||||
| Games Workshop Group PLC | 50,400 | 6,652,634 | ||||
| Health Care (7.8%) | ||||||
| Abcam PLC (a) | 127,800 | 2,892,859 | ||||
| Dechra Pharmaceuticals PLC | 154,926 | 10,855,633 | ||||
| Genus PLC | 134,657 | 10,211,278 | ||||
| 23,959,770 | ||||||
| 30,612,404 | ||||||
| UNITED STATES (4.6%) | ||||||
| Health Care (4.6%) | ||||||
| Inmode Ltd. (a) | 90,300 | 8,555,022 | ||||
| PolyPeptide Group AG (a)(b) | 44,700 | 5,720,777 | ||||
| 14,275,799 | ||||||
| Total Common Stocks | 295,632,531 | |||||
| Shares or Principal Amount | Value | |||||
| SHORT-TERM INVESTMENT (5.8%) | ||||||
| UNITED STATES (5.8%) | ||||||
| State Street Institutional U.S. Government | ||||||
| Money Market Fund, Premier Class, 0.03% (c) | 17,948,165 | $ | 17,948,165 | |||
| Total Short-Term Investment | 17,948,165 | |||||
| Total Investments | ||||||
| (Cost $239,527,026) (d)—102.2% | 313,580,696 | |||||
| Liabilities in Excess of Other Assets—(2.2)% | (6,833,551 | ) | ||||
| Net Assets—100.0% | $ | 306,747,145 | ||||
| (a) | Non-income producing security. |
| (b) | Denotes a security issued under Regulation S or Rule 144A. |
| (c) | Registered investment company advised by State Street Global Advisors. The rate shown is the 7 day yield as of October 31, 2021. |
| (d) | See accompanying Notes to Financial Statements for tax unrealized appreciation/(depreciation) of securities. |
| ADR | American Depositary Receipt |
| PLC | Public Limited Company |
See accompanying Notes to Financial Statements.
| 52 | 2021 Annual Report |
Aberdeen Realty Income & Growth Fund (Unaudited)
Aberdeen Realty Income & Growth Fund (Institutional Share Class net of fees) returned 44.41% for the 12-month reporting period ended October 31, 2021, versus the 42.91% return of its primary benchmark, the U.S. broader-market S&P 500 Index, and the 51.70% return of the Morgan Stanley Capital International (MSCI) US REIT Index during the same period.
The U.S. real estate investment trust (REIT) market, as measured by the MSCI US REIT Index, significantly outperformed both the global real estate market, as represented by the Financial Times Stock Exchange European Public Real Estate Association/National Association of Real Estate Investment Trusts (FTSE EPRA/NAREIT) Global-ex US Real Estate Index,1 and the broader equity market, as measured by the S&P 500 Index, during the reporting period.
The performance of global equity markets over the 12-month period ended October 31, 2021, was dominated by the introduction of COVID-19 vaccines and subsequent recovery in the global economy as the world began to reopen following the initial stages of the pandemic. REITs also benefited from these same trends and saw a sharp rebound in performance beginning in mid-November 2020 with the announcement of the successful introduction of the Pfizer and Moderna vaccines. The sharp rebound in stock prices was led by those sectors that were hardest hit by the economic shutdowns – retail and lodging. These trends continued through much of the year as vaccine distribution accelerated, monetary policy and fiscal stimulus remained accommodative, consumer and business confidence improved, and tenants paid rents and also began to think about the need for additional space in the future, providing support for rental increases in select sectors. Consequently, despite some fluctuations in the pace of economic reopenings in various regions as surges in coronavirus cases ebbed and flowed throughout the year, the REIT sector posted strong gains through mid-2021.
Inflation fears, stemming from both supply-chain disruptions and fiscal and monetary policy decisions, began to grip the broader market late in the reporting period. However, REITs, which typically are more resistant to inflationary pressures due to the ability to raise rents, offset the impact of rising interest rates. While the overall performance of the REIT market was very robust during the reporting period, there was a wide disparity in returns. Those sectors that had materially underperformed in 2020 because their tenants were at the epicenter of the COVID-19-induced lockdowns (i.e., retail and urban apartments), posted extremely strong gains as economic activity rebounded and investors sought value-oriented sectors exposed to the reopening. Meanwhile, those "safe-haven" sectors where cash flows held up during the pandemic but were trading at elevated price/earnings multiples,2 such as data centers and cell towers, underperformed as investors rotated into more value-oriented sectors. Additionally, as the reporting period progressed, the industrial
and storage sectors, which had garnered accelerating earnings growth and true pricing power in the form of rising rents, also were strong outperformers.
An underweight allocation relative to the benchmark MSCI US REIT Index to the healthcare sector, along with strong stock selection within this sector, benefited the Fund's relative performance over the reporting period. The Fund had no positions in the relatively slower-growing segments of the healthcare REIT universe, such as medical office buildings, which rely on external acquisitions for earnings growth due to an unfavorable cost of capital. Alternatively, the Fund had an overweight position in REITs with a greater exposure to senior housing, such as Welltower Inc., which experienced significant occupancy gains as vaccines were rolled out nationwide. The Fund also benefited from strong stock selection in the industrial sector, bolstered by overweight positions in Prologis, Inc. and Duke Realty Corp., both large industrial REITs that benefited from strong demand for space stemming from the growth of e-commerce. The Fund has long held this allocation in the industrials sector due to our belief that the growth of e-commerce and a need to redesign the global supply chain would drive demand for warehouse space, far outstripping new supply, thereby resulting in strong rental rate and cash-flow growth. The largest individual contributor to Fund performance was an overweight position in shopping center REIT Brixmor Property Group Inc. The sharp rally in the stock price over the reporting period reflected the discounted valuation that existed prior to the emergence of the COVID-19 vaccines, and the strong rebound in that occurred as the economy reopened and retail tenants indicated that they were planning to open more stores to take advantage of the post-pandemic economic recovery. The Fund's holding in self-storage REIT Life Storage Inc. also contributed to performance as the company benefited from a record-high occupancy rate, which allowed it to push significant price increases through, driving better-than-expected earnings growth throughout the reporting period.
Conversely, an overweight allocation to the data center sector, particularly early in the reporting period, was a drag on Fund performance as investors rotated out of the sector and into segments with greater near-term earnings recovery potential once the vaccine rollout began. Additionally, Fund performance was hampered by an underweight position in the apartment sector, which outperformed the overall market during the reporting period. Occupancy recovered more quickly than we had anticipated in dense urban locations, allowing landlords to reduce concessions3 and increase rents. Finally, stock selection in the triple net lease4 sector also weighed on Fund performance for the reporting period. Our investment in larger REITs with greater exposure to investment grade tenants, such as Realty Income and Agree Realty, lagged smaller more nimble peers whose cash flows had more room to recover as their tenants repaid rents that were deferred during the pandemic.
| 1 | The FTSE EPRA/NAREIT Global-ex US Real Estate Index is an unmanaged index considered representative of real estate companies and REITs outside the U.S. Indexes are unmanaged and have been provided for comparison purposes only. No fees or expenses are reflected. You cannot invest directly in an index. |
| 2 | A price/earnings multiple is calculated by dividing the current market price of a stock by the earnings per share. Price/earnings multiples often are used to compare companies in the same industry, or to assess the historical performance of an individual company. |
| 3 | A concession is a reduction in price, rent or other benefit that a landlord provides to a tenant or buyer as an inducement to buy or lease a property. |
| 4 | A triple net lease is a lease agreement on a property in which a tenant or lessee promises to pay all the expenses of the property, including real estate taxes, building insurance, and maintenance. |
| 2021 Annual Report | 53 |
Aberdeen Realty Income & Growth Fund (Unaudited) (concluded)
In our view, the underlying economic fundamentals for real estate continue to support earnings and performance momentum as the global economy continues its recovery. In particular, we believe the structural changes we are witnessing across the real estate sectors, including the rise of non-traditional and new real estate segments (e.g., digital infrastructure, single-family rentals), as well as tailwinds supporting logistics and industrial properties, continue to drive longer-term returns. At the same time, we are mindful of the potential effects that increased inflation might have on the consumer behavior and broader business investment levels. While investors are likely to focus on potential interest-rate increases, we think that REITs' generally growing dividends may appeal to investors in an environment of very low real interest rates. We believe that taking a barbell approach – combining a focus on companies with strong balance sheets, high-quality portfolios and attractive sector exposures that possess pricing power that will allow them to increase rents with those companies that trade at attractive valuations – can weather the uncertainty and will serve investors best going forward.
Portfolio Management:
Global Real Estate Team
PAST PERFORMANCE DOES NOT GUARANTEE FUTURE RESULTS.
The performance data quoted represents past performance and current returns may be lower or higher. Class A Shares have up to a 5.75% front-end sales charge and a 0.25% 12b-1 fee. The investment return and principal value will fluctuate so that an investor's shares, when redeemed, may be worth more or less than the original cost. To obtain performance information current to the most recent month-end, which may be higher or lower than the performance shown above, please call 866-667-9231 or go to https://www.abrdn.com/en-us/us/investor/fund-centre.
Investing in mutual funds involves risk, including possible loss of principal.
Indexes are unmanaged and have been provided for comparison purposes only.
No fees or expenses are reflected. You cannot invest directly in an index.
Risk Considerations
Deteriorating market conditions might cause a general weakness in the market that reduces the prices, or yield, of securities in those markets in which the Fund invests.
The value of a security may decline for reasons directly related to the issuer, such as management performance, financial leverage and reduced demand for the issuer's goods or services.
The stock or other security of a company may not perform as well as expected, and may decrease in value, because of factors related to the company, to the industry in which the company is engaged, or to the market as a whole.
The Fund is subject to the risk that the Adviser or Subadviser may make poor security selections.
Investments in REITs and real estate securities may involve greater risk and volatility including greater exposure to economic downturns and changes in real estate values, rents, property taxes, interest rates, tax and other laws.
The Fund's strategy of concentrating in companies in a specific industry means that its performance will be closely tied to the performance of a particular market segment, which may present more risks than if it were broadly diversified over numerous industries and sectors of the economy.
Please read the prospectus for more detailed information regarding these and other risks.
| 54 | 2021 Annual Report |
Aberdeen Realty Income & Growth Fund (Unaudited)
| Average Annual Total Return1 (For periods ended October 31, 2021) | 1 Yr. | 5 Yr. | 10 Yr. | |||||||||||
| Class A | w/o SC | 44.07 | % | 9.84 | % | N.A. | ||||||||
| w/SC2 | 35.75 | % | 8.55 | % | N.A. | |||||||||
| Institutional Class3 | w/o SC | 44.41 | % | 10.13 | % | 10.92% | ||||||||
All figures showing the effect of a sales charge (SC) reflect the maximum charge possible because it has the most significant effect on performance data. The total returns shown above do not include the impact of financial statement rounding of the net asset value (NAV) per share and/or financial statement adjustments.
| 1 | Returns prior to May 7, 2018 reflect the performance of a predecessor fund (the "Predecessor Fund"). Returns of the Predecessor Fund have not been adjusted to reflect the expenses applicable to the respective classes. The Fund and the Predecessor Fund have substantially similar investment objectives and strategies. Please consult the Fund's prospectus for more detail. |
| 2 | A 5.75% front-end sales charge was deducted. |
| 3 | Not subject to any sales charges. |
Performance of a $1,000,000 Investment* (as of October 31, 2021)
* Minimum Initial Investment Comparative performance of $1,000,000 invested in Institutional Class shares of the Aberdeen Realty Income and Growth Fund, the Morgan Stanley Capital International (MSCI) US REIT Index, the S&P 500® Index and the Consumer Price Index (CPI) over a 10-year period ended October 31, 2021. Unlike the Fund, the returns for these | unmanaged indexes do not reflect any fees, expenses or sales charges. Investors cannot invest directly in market indexes.
The MSCI US REIT Index is a free float-adjusted market capitalization weighted index that is comprised of equity Real Estate Investment Trusts (REITs). The index is based on the MSCI USA Investable Market Index (IMI), its parent index, which captures the large, mid and small cap segments of the USA market. With 135 constituents, it represents about 99% of the US REIT universe and securities are classified under the Equity REITs Industry (under the Real Estate Sector) according to the Global Industry Classification Standard (GICS®), have core real estate exposure (i.e., only selected Specialized REITs are eligible) and carry REIT tax status. This index reinvests as much as possible of a company's dividend distributions. The reinvested amount is equal to the total dividend amount distributed to persons residing in the country of the dividend-paying company. Gross total return indexes do not, however, include any tax credits.
The S&P 500® Index represents large-cap U.S. equities. The index includes 500 leading companies and captures approximately 80% coverage of available U.S. market capitalization.
The CPI is a measure of the average change over time in the prices paid by urban consumers for a market basket of consumer goods and services. |

Investment return and principal value will fluctuate, and when redeemed, shares may be worth more or less than original cost. Past performance is no guarantee of future results. The Average Annual Total Return table and Performance graph do not reflect the deduction of taxes that a shareholder would pay on fund distributions or the redemption of fund shares. Investing in mutual funds involves market risk, including loss of principal. Performance returns assume the reinvestment of all distributions. Total returns reflect waivers and reimbursements in effect, without which returns would have been lower.
| 2021 Annual Report | 55 |
Aberdeen Realty Income & Growth Fund (Unaudited)
Portfolio Summary (as a percentage of net assets)
October 31, 2021 (Unaudited)
| Asset Allocation | ||||
| Common Stocks | 99.8 | % | ||
| Short-Term Investment | – | % | ||
| Other Assets in Excess of Liabilities | 0.2 | % | ||
| 100.0 | % | |||
Amounts listed as "–" are 0% or round to 0%.
The following table summarizes the composition of the Fund's portfolio, in S&P Global Industry Classification Standard (GICS) sectors, expressed as a percentage of net assets as of October 31, 2021.
| Sub-Industries | ||||
| Specialized REITs | 25.4 | % | ||
| Residential REITs | 21.2 | % | ||
| Retail REITs | 16.9 | % | ||
| Industrial REITs | 15.4 | % | ||
| Office REIT | 7.7 | % | ||
| Health Care REITs | 6.3 | % | ||
| Hotel & Resort REITs | 5.7 | % | ||
| Diversified REITs | 1.2 | % | ||
| Other | 0.2 | % | ||
| 100.0 | % | |||
| Top Holdings* | ||||
| Prologis, Inc., REIT | 10.9 | % | ||
| Equinix, Inc., REIT | 7.5 | % | ||
| Public Storage | 4.5 | % | ||
| Simon Property Group, Inc., REIT | 4.2 | % | ||
| Equity Residential, REIT | 3.9 | % | ||
| Realty Income Corp., REIT | 3.8 | % | ||
| AvalonBay Communities, Inc. | 3.6 | % | ||
| Invitation Homes, Inc. | 3.5 | % | ||
| Welltower, Inc. | 3.5 | % | ||
| Digital Realty Trust, Inc., REIT | 3.3 | % | ||
| Other | 51.3 | % | ||
| 100.0 | % | |||
| * | For the purpose of listing top holdings, Short-Term Investments are included as part of Other. |
| Top Countries | ||||
| United States | 99.8 | % | ||
| Other | 0.2 | % | ||
| 100.0 | % | |||
| 56 | 2021 Annual Report |
Statement of Investments
October 31, 2021
Aberdeen Realty Income & Growth Fund
| Shares or Principal Amount | Value | ||||||
| COMMON STOCKS (99.8%) | |||||||
| UNITED STATES (99.8%) | |||||||
| Diversified REITs (1.2%) | |||||||
| STORE Capital Corp. | 20,827 | $ | 714,991 | ||||
| Health Care REITs (6.3%) | |||||||
| Omega Healthcare Investors, Inc. | 16,821 | 493,864 | |||||
| Ventas, Inc. | 21,353 | 1,139,610 | |||||
| Welltower, Inc. | 25,158 | 2,022,703 | |||||
| 3,656,177 | |||||||
| Hotel & Resort REITs (5.7%) | |||||||
| DiamondRock Hospitality Co. (a) | 66,633 | 602,362 | |||||
| Host Hotels & Resorts, Inc. (a) | 64,040 | 1,077,793 | |||||
| MGM Growth Properties LLC | 29,797 | 1,173,406 | |||||
| Sunstone Hotel Investors, Inc. (a) | 34,297 | 423,225 | |||||
| 3,276,786 | |||||||
| Industrial REITs (15.4%) | |||||||
| Duke Realty Corp. | 24,129 | 1,357,015 | |||||
| Prologis, Inc. | 43,384 | 6,288,945 | |||||
| STAG Industrial, Inc. | 27,652 | 1,203,691 | |||||
| 8,849,651 | |||||||
| Office REITs (7.7%) | |||||||
| Alexandria Real Estate Equities, Inc. | 7,730 | 1,578,002 | |||||
| Boston Properties, Inc. | 9,897 | 1,124,695 | |||||
| Cousins Properties, Inc. | 24,224 | 959,513 | |||||
| Highwoods Properties, Inc. | 17,738 | 795,372 | |||||
| 4,457,582 | |||||||
| Residential REITs (21.2%) | |||||||
| American Homes 4 Rent | 25,656 | 1,041,634 | |||||
| AvalonBay Communities, Inc. | 8,736 | 2,067,637 | |||||
| Camden Property Trust | 7,448 | 1,214,769 | |||||
| Equity LifeStyle Properties, Inc. | 3,895 | 329,166 | |||||
| Equity Residential | 25,936 | 2,240,870 | |||||
| Invitation Homes, Inc. | 49,197 | 2,029,376 | |||||
| Mid-America Apartment Communities, Inc. | 7,461 | 1,523,611 | |||||
| Sun Communities, Inc. | 9,194 | 1,801,840 | |||||
| 12,248,903 | |||||||
| Shares or Principal Amount | Value | ||||||
| Retail REITs (16.9%) | |||||||
| Agree Realty Corp. | 5,974 | $ | 424,512 | ||||
| Brixmor Property Group, Inc. | 40,026 | 938,210 | |||||
| Kimco Realty Corp. | 47,525 | 1,074,065 | |||||
| National Retail Properties, Inc. | 23,095 | 1,047,589 | |||||
| Realty Income Corp. | 30,775 | 2,198,258 | |||||
| Simon Property Group, Inc. | 16,643 | 2,439,531 | |||||
| SITE Centers Corp. | 46,723 | 742,429 | |||||
| Spirit Realty Capital, Inc. | 17,610 | 861,657 | |||||
| 9,726,251 | |||||||
| Specialized REITs (25.4%) | |||||||
| American Tower Corp. | 2,238 | 631,049 | |||||
| Digital Realty Trust, Inc. | 12,071 | 1,904,925 | |||||
| Equinix, Inc., REIT | 5,164 | 4,322,629 | |||||
| Extra Space Storage, Inc. | 8,897 | 1,756,001 | |||||
| Gaming and Leisure Properties, Inc. | 27,012 | 1,309,812 | |||||
| Life Storage, Inc. | 8,855 | 1,184,888 | |||||
| Public Storage | 7,791 | 2,588,014 | |||||
| Sabra Health Care REIT, Inc. | 26,860 | 380,069 | |||||
| SBA Communications Corp. | 1,619 | 559,089 | |||||
| 14,636,476 | |||||||
| 57,566,817 | |||||||
| Total Common Stocks | 57,566,817 | ||||||
| SHORT-TERM INVESTMENT (0.0%) | |||||||
| United States (0.0%) | |||||||
| State Street Institutional U.S. Government Money Market Fund, Premier Class, 0.03% (b) | 13,882 | 13,882 | |||||
| Total Short-Term Investment | 13,882 | ||||||
| Total Investments (Cost $37,078,093) (c)—99.8% | 57,580,699 | ||||||
| Other Assets in Excess of Liabilities—0.2% | 102,719 | ||||||
| Net Assets—100.0% | $ | 57,683,418 | |||||
| (a) | Non-income producing security. |
| (b) | Registered investment company advised by State Street Global Advisors. The rate shown is the 7 day yield as of October 31, 2021. |
| (c) | See accompanying Notes to Financial Statements for tax unrealized appreciation/(depreciation) of securities. |
| REIT | Real Estate Investment Trust |
See accompanying Notes to Financial Statements.
| 2021 Annual Report | 57 |
Aberdeen U.S. Small Cap Equity Fund (Unaudited)
Aberdeen U.S. Small Cap Equity Fund (Institutional Class shares net of fees) returned 57.48% for the 12-month reporting period ended October 31, 2021, versus the 50.80% return of its benchmark, the Russell 2000 Index, during the same period.
Major U.S. equity market indices moved sharply higher amid periods of volatility over the 12-month period ended October 31, 2021, buoyed largely by investors' ongoing optimism regarding the distribution of COVID-19 vaccines and generally positive economic reports. There was a sharp downturn in the U.S. equity market in September 2021, attributable to investors' concerns surrounding inflation, supply-chain challenges, and peak earnings growth. The rising number of COVID-19 cases drove increasing risk-off market sentiment and investors' rotation out of equities. However, the market rallied at the end of the reporting period in October 2021. Upbeat company results, along with comments that demand remained strong, eased investors' concerns about stagflation,1 supply-chain pressures, spiraling energy prices and higher interest rates.
Shares of U.S. small-cap companies, as represented by the Russell 2000 Index, returned 50.80% for the reporting period, outperforming the 42.91% return of their large-cap counterparts, as measured by the U.S. broader-market S&P 500 Index.2 There was sharp divergence in the performance of small-cap value and growth stocks. Shares of U.S. small-cap value companies, as measured by the Russell 2000 Value Index,3 returned 64.30% for the reporting period, significantly outperforming the 38.45% return of small-cap growth stocks, as represented by the Russell 2000 Growth Index.4 All 11 sectors within the Russell 2000 Index garnered double-digit returns during the reporting period, led by the triple-digit gain of the energy sector. The communication services and materials sectors also significantly outperformed the overall market. Conversely, the healthcare, utilities and consumer staples sectors were the primary market laggards for the reporting period.
The U.S. Federal Reserve (Fed) maintained its benchmark interest rate in a range of 0.0-0.25% over the 12-month reporting period. However, the Fed noted in its statement following its September 2021 meeting that "[t]he path of the economy continues to depend on the course of the coronavirus. Progress on vaccinations will likely continue to reduce the effects of the public health crisis on the economy, but risks to the economic outlook remain." The Fed also indicated that a reduction in its monthly purchases of US Treasury and agency mortgage-backed securities "may soon be warranted."
U.S. economic news was generally positive during the 12-month reporting period. According to the Department of Labor, U.S. payrolls | expanded by 5.8 million amid the ongoing reopening of the economy over the period, and the unemployment rate fell 2.3 percentage points to 4.6%. As expected, the leisure and hospitality industry, which experienced the most significant decline in employment due to the COVID-19-related lockdowns in the first half of 2020, saw the largest job gains for the period. U.S. gross domestic product (GDP) was up 2.0% in the third quarter of 2021, down significantly from the 6.7% increase for the second quarter. The relatively lower growth rate was attributable to a downturn in consumer spending. Amid the global supply-chain issues and rising energy costs, the U.S. Consumer Price Index (CPI)5 rose 0.9% in October 2021, reaching a 31-year high of 6.2% over the previous 12 months.6 Energy prices posted a year-over-year increase of 30% due mainly to substantially higher costs for fuel oil and gasoline. The index for all items less food and energy rose 4.6% over the previous year.
Overall positioning in the healthcare, information technology and industrials sectors bolstered the Fund's relative performance for the reporting period. The most notable contributors to Fund performance among individual holdings included medical device manufacturer InMode Ltd.; IT services provider Perficient Inc.; and niche electrical products manufacturer Atkore Inc.
InMode, which specializes in products targeted at the aesthetics market, benefited over the reporting period from long-term tailwinds behind its market, as well as its platform of proprietary and IP-protected technologies. The company's recent results have exceeded the market's expectations. We established a new position in InMode during the reporting period as the company has delivered strong revenue growth on the back of a differentiated, proprietary technology that has enabled the company to expand market share. IT services provider Perficient Inc. delivered strong results over the reporting period highlighted by accelerating revenue growth and expanding operating margins. The company has benefited from its clients' increasing digital transformation activities, while the company's decision to push delivery to more offshore locations has led to higher margins. Atkore's stock price moved higher over the reporting period as the company has benefited from recovery in its key end-markets and a differentiated strategy which thrives in an environment of increasing supply constraints. Sales and earnings growth have exceeded the market expectations, leading to a healthy re-rating of the company's valuation multiple.7 We initiated a holding in Atkore during the reporting period as we have a positive view on the company's ability to expand its market-leading position in electrical equipment, selling the broadest portfolio of products among its peers while managing prices and costs to expand margins. |
| 1 | Stagflation refers to an economic environment of stagnant activity and accelerating inflation. |
| 2 | The S&P 500 Index is an unmanaged index considered representative of the broader U.S. stock market. Indexes are unmanaged and have been provided for comparison purposes only. No fees or expenses are reflected. You cannot invest directly in an index. |
| 3 | The Russell 2000 Value Index is an unmanaged index considered representative of small-cap value stocks. |
| 4 | The Russell 2000 Growth Index is an unmanaged index considered representative of small-cap growth stocks. |
| 5 | The Consumer Price Index is a measure of the average change over time in the prices that consumers pay for a basket of consumer goods and services. |
| 6 | Source: U.S. Department of Labor, November 2021 |
| 7 | A valuation multiple is a ratio that reflects the valuation of a target company in relation to a specific financial metric to facilitate the comparison of two different companies. |
| 58 | 2021 Annual Report |
Aberdeen U.S. Small Cap Equity Fund (Unaudited) (concluded)
Fund performance over the reporting period was hampered mainly by stock selection in the financials sector, the lack of exposure to energy, and overall positioning in the consumer discretionary sector. The largest individual stock detractors from Fund performance were Mercury Systems, a manufacturer of electronic components for aerospace and defense applications; Envestnet Inc., a provider of software and analytics to wealth management and financial technology firms; and home healthcare services provider Addus HomeCare Corp.
Shares of Mercury Systems moved lower over the reporting period due to a mix of program delays and COVID-19-related challenges which have weighed on its organic revenue growth and profitability. Customers have extended timelines for delivery on certain platforms for several reasons, most significantly pandemic-related productivity. We were originally attracted to the dominant position of Envestnet in a growing market, which enabled the company to generate low-double-digit organic revenue growth while expanding margins. However, growth slowed in early 2021, leading Envestnet to undertake an aggressive investment program in an effort to enhance its product offering. We subsequently exited the Fund's position in the company as we were increasingly concerned that the fruits of these investments were uncertain, and we found what we believed were better investment opportunities elsewhere. Addus HomeCare reported results for the first quarter of its 2021 fiscal year that came in below the market's expectations due to pandemic- and weather-related factors in its personal care business. Additionally, there was share-price weakness across several home healthcare and hospice providers over the reporting period, which in our view was attributable primarily to fears of wage pressure or increased competition for deals.
There was relatively high portfolio activity in the Fund over the 12-month reporting period due to the market's strong performance and a significant change in the economic environment in the U.S. Additionally, the market capitalizations of several companies grew to exceed the Fund's small-cap range: industrial equipment auction company Ritchie Bros. Auctioneers; Manhattan Associates Inc., a developer of supply-chain and logistics software; semiconductor designer Lattice Semiconductor Corp.; Globus Medical Inc., a developer and manufacturer of spine implant devices; SiteOne Landscape Supply Inc.; engineering and consulting firm Tetra Tech Inc.; Fox Factory Holding Corp., a manufacturer of shocks/suspension systems for bicycles and a variety of motorized vehicles; Montana-based regional bank Glacier Bancorp Inc.; and Rapid7 Inc., a developer of cyber security software products and services.
U.S. companies that reported third-quarter earnings as of the end of October 2021 generally indicated that they have seen continued strong demand (with many highlighting the concept of unmet demand due to supply-chain issues) and aggressive pricing increases to offset elevated labor and input costs. Companies currently are making it a top priority to tackling the supply-chain issues in their near-term plans. The CEOs of the three largest U.S. banks commented alongside their respective companies' results that they are seeing increased use of corporate credit lines to invest in inventory and capital expenditures in an effort to address supply-chain issues. Combined with more positive news surrounding reopening of economies in several Southeast Asia countries where many corporations have manufacturing operations, | this supports companies' views that inflation and supply chain are temporary problems – albeit with a range of views on how long these conditions may persist.
Progress in consumer sentiment remains muted, although it remains healthy compared to pre-pandemic levels. This appears to be driven by the impact of the Delta variant in more severely affected states – encouragingly, October saw COVID-19-related hospitalizations and daily cases continue to improve. Overall, the financial health of U.S. consumers remains robust following a prolonged period of household debt reduction and increased savings through the pandemic.
Beyond this phase (which has brought investors' focus to the very near term given the rapid fluctuations in supply chains), we believe that the market will shift its focus towards the sustainability of growth as the cycle normalizes. Within this context, we continue to strive to create value for the Fund's shareholders by investing with conviction in companies that in our view have strong, sustainable business models and long runways for growth.
Portfolio Management: North American Equity Team
PAST PERFORMANCE DOES NOT GUARANTEE FUTURE RESULTS.
The performance data quoted represents past performance and current returns may be lower or higher. Class A Shares have up to a 5.75% front-end sales charge and a 0.25% 12b-1 fee. The investment return and principal value will fluctuate so that an investor's shares, when redeemed, may be worth more or less than the original cost. To obtain performance information current to the most recent month-end, which may be higher or lower than the performance shown above, please call 866-667-9231 or go to https://www.abrdn.com/en-us/us/investor/fund-centre.
Investing in mutual funds involves risk, including the possible loss of principal.
Indexes are unmanaged and have been provided for comparison purposes only. No fees or expenses are reflected. You cannot invest directly in an index.
Risk Considerations
Deteriorating market conditions might cause a general weakness in the market that reduces the prices, or yield, of securities in those markets in which the Fund invests.
The value of a security may decline for reasons directly related to the issuer, such as management performance, financial leverage and reduced demand for the issuer's goods or services.
The stock or other security of a company may not perform as well as expected, and may decrease in value, because of factors related to the company, to the industry in which the company is engaged, or to the market as a whole.
The Fund is subject to the risk that the Adviser or Subadviser may make poor security selections.
Securities of smaller companies are usually less stable in price and less liquid than those of larger, more established companies. Therefore, they generally involve greater risk.
Please read the prospectus for more detailed information regarding these and other risks. |
| 2021 Annual Report | 59 |
Aberdeen U.S. Small Cap Equity Fund (Unaudited)
| Average Annual Total Return (For periods ended October 31, 2021) | 1 Yr. | 5 Yr. | 10 Yr. | |||||
| Class A | w/o SC | 56.92% | 17.70% | 16.52% | ||||
| w/SC1 | 47.88% | 16.31% | 15.83% | |||||
| Class C | w/o SC | 55.93% | 16.90% | 15.72% | ||||
| w/SC2 | 54.93% | 16.90% | 15.72% | |||||
| Class R3 | w/o SC | 56.50% | 17.31% | 16.19% | ||||
| Institutional Service Class3 | w/o SC | 57.33% | 18.01% | 16.84% | ||||
| Institutional Class3 | w/o SC | 57.48% | 18.07% | 16.89% |
All figures showing the effect of a sales charge (SC) reflect the maximum charge possible because it has the most significant effect on performance data. The total returns shown above do not include the impact of financial statement rounding of the net asset value (NAV) per share and/or financial statement adjustments.
| 1 | A 5.75% front-end sales charge was deducted. | |
| 2 | A 1.00% contingent deferred sales charge (CDSC) was deducted from the one year return because it is charged when Class C shares are sold within the first year after purchase. | |
| 3 | Not subject to any sales charges. |
Performance of a $10,000 Investment (as of October 31, 2021)

Comparative performance of $10,000 invested in Institutional Class shares of the Aberdeen U.S. Small Cap Equity Fund, the Russell 2000® Index and the Consumer Price Index (CPI) over a 10-year period ended
October 31, 2021. Unlike the Fund, the returns for these unmanaged indexes do not reflect any fees, expenses, or sales charges. Investors cannot invest directly in market indexes.
The Russell 2000® Index measures performance of the small-cap segment of the U.S. equity universe. It is a subset of the Russell 3000® Index and it represents approximately 8% of the U.S. market. It includes approximately 2000 of the smallest securities based on a combination of their market cap and current index membership. The Russell 2000® Index is constructed to provide a comprehensive and unbiased barometer for the small-cap segment and is completely reconstituted annually to ensure larger stocks do not distort the performance and characteristics of the true small-cap opportunity set.
The CPI is a measure of the average change over time in the prices paid by urban consumers for a market basket of consumer goods and services.
Investment return and principal value will fluctuate, and when redeemed, shares may be worth more or less than original cost. Past performance is no guarantee of future results. The Average Annual Total Return table and Performance graph do not reflect the deduction of taxes that a shareholder would pay on fund distributions or the redemption of fund shares. Investing in mutual funds involves market risk, including loss of principal. Performance returns assume the reinvestment of all distributions. Total returns reflect waivers and reimbursements in effect, without which returns would have been lower.
| 60 | 2021 Annual Report |
Aberdeen U.S. Small Cap Equity Fund (Unaudited)
Portfolio Summary (as a percentage of net assets)
October 31, 2021 (Unaudited)
| Asset Allocation | ||
| Common Stocks | 95.7% | |
| Short-Term Investment | 3.9% | |
| Other Assets in Excess of Liabilities | 0.4% | |
| 100.0% | ||
The following table summarizes the composition of the Fund's portfolio, in S&P Global Industry Classification Standard (GICS) sectors, expressed as a percentage of net assets as of October 31, 2021.
| Top Sectors | ||
| Industrials | 22.0% | |
| Information Technology | 19.0% | |
| Financials | 15.9% | |
| Health Care | 13.6% | |
| Consumer Discretionary | 11.8% | |
| Materials | 5.8% | |
| Consumer Staples | 4.6% | |
| Communication Services | 1.7% | |
| Real Estate | 1.3% | |
| Other | 4.3% | |
| 100.0% | ||
| Top Holdings* | ||
| Casella Waste Systems, Inc., Class A | 2.5% | |
| CyberArk Software Ltd. | 2.5% | |
| First Interstate BancSystem, Inc., Class A | 2.4% | |
| WNS Holdings Ltd., ADR | 2.3% | |
| PJT Partners, Inc., Class A | 2.3% | |
| Hannon Armstrong Sustainable Infrastructure Capital, Inc. | 2.3% | |
| LCI Industries | 2.3% | |
| CI Financial Corp. | 2.2% | |
| Workiva, Inc. | 2.1% | |
| Dorman Products, Inc. | 2.1% | |
| Other | 77.0% | |
| 100.0% | ||
| * | For the purpose of listing top holdings, Short-Term Investments are included as part of Other. |
| Top Countries | ||
| United States | 88.0% | |
| Canada | 6.1% | |
| Israel | 2.4% | |
| India | 2.3% | |
| Singapore | 0.8% | |
| Other | 0.4% | |
| 100.0% | ||
| 2021 Annual Report | 61 |
Statement of Investments
October 31, 2021
Aberdeen U.S. Small Cap Equity Fund
| Shares or Principal Amount | Value | ||||
| COMMON STOCKS (95.7%) | |||||
| CANADA (6.1%) | |||||
| Consumer Discretionary (1.3%) | |||||
| Aritzia, Inc. (a) | 390,861 | $ | 15,393,152 | ||
| Consumer Staples (1.7%) | |||||
| Jamieson Wellness, Inc. (b) | 662,015 | 20,385,740 | |||
| Financials (3.1%) | |||||
| CI Financial Corp. | 1,177,693 | 26,853,989 | |||
| TMX Group Ltd. | 96,798 | 10,479,932 | |||
| 37,333,921 | |||||
| 73,112,813 | |||||
| INDIA (2.3%) | |||||
| Information Technology (2.3%) | |||||
| WNS Holdings Ltd., ADR (a) | 310,382 | 27,565,025 | |||
| ISRAEL (2.4%) | |||||
| Information Technology (2.4%) | |||||
| CyberArk Software Ltd. (a) | 162,713 | 29,306,238 | |||
| SINGAPORE (0.8%) | |||||
| Information Technology (0.8%) | |||||
| Kulicke & Soffa Industries, Inc. | 163,064 | 9,294,648 | |||
| UNITED STATES (84.1%) | |||||
| Communication Services (1.7%) | |||||
| Cogent Communications Holdings, Inc. | 263,567 | 20,186,597 | |||
| Consumer Discretionary (10.5%) | |||||
| Dorman Products, Inc. (a) | 242,979 | 25,362,148 | |||
| GrowGeneration Corp. (a) | 381,382 | 8,039,533 | |||
| LCI Industries | 194,419 | 27,148,669 | |||
| LGI Homes, Inc. (a) | 128,275 | 19,151,458 | |||
| National Vision Holdings, Inc. (a) | 347,852 | 21,441,597 | |||
| Stride, Inc. (a) | 693,269 | 24,611,049 | |||
| 125,754,454 | |||||
| Consumer Staples (2.9%) | |||||
| BJ's Wholesale Club Holdings, Inc. (a) | 296,874 | 17,349,317 | |||
| elf Beauty, Inc. (a) | 529,401 | 17,104,946 | |||
| 34,454,263 | |||||
| Financials (12.8%) | |||||
| Donnelley Financial Solutions, Inc. (a) | 228,028 | 8,738,033 | |||
| First Interstate BancSystem, Inc., Class A | 687,795 | 28,591,638 | |||
| Hannon Armstrong Sustainable Infrastructure Capital, Inc. | 449,766 | 27,165,866 | |||
| Live Oak Bancshares, Inc. | 242,711 | 21,644,967 | |||
| PJT Partners, Inc., Class A | 335,309 | 27,424,923 | |||
| PRA Group, Inc. (a) | 476,477 | 20,431,334 | |||
| Wintrust Financial Corp. | 221,708 | 19,621,158 | |||
| 153,617,919 | |||||
| Shares or Principal Amount | Value | ||||
| Health Care (13.6%) | |||||
| Addus HomeCare Corp. (a) | 158,835 | $ | 14,851,072 | ||
| AMN Healthcare Services, Inc. (a) | 128,210 | 12,654,327 | |||
| CONMED Corp. | 133,761 | 19,566,559 | |||
| Health Catalyst, Inc. (a) | 459,654 | 24,196,187 | |||
| Heska Corp. (a) | 102,910 | 23,003,472 | |||
| Inmode Ltd. (a) | 139,590 | 13,224,757 | |||
| Integer Holdings Corp. (a) | 260,122 | 23,416,182 | |||
| Ligand Pharmaceuticals, Inc. (a) | 153,749 | 22,438,129 | |||
| US Physical Therapy, Inc. | 80,451 | 8,677,445 | |||
| 162,028,130 | |||||
| Industrials (22.0%) | |||||
| Ameresco, Inc., Class A (a) | 246,847 | 20,273,544 | |||
| ASGN, Inc. (a) | 187,376 | 22,421,412 | |||
| Atkore, Inc. (a) | 251,047 | 23,731,473 | |||
| Casella Waste Systems, Inc., Class A (a) | 340,161 | 29,498,762 | |||
| Gibraltar Industries, Inc. (a) | 286,205 | 18,649,118 | |||
| Helios Technologies, Inc. | 208,955 | 19,025,353 | |||
| Hub Group, Inc., Class A (a) | 303,305 | 23,830,674 | |||
| Mercury Systems, Inc. (a) | 368,694 | 19,002,489 | |||
| RBC Bearings, Inc. (a) | 85,618 | 20,028,619 | |||
| Saia, Inc. (a) | 57,263 | 17,902,704 | |||
| Shyft Group, Inc. | 576,249 | 23,747,221 | |||
| Werner Enterprises, Inc. | 537,482 | 24,358,684 | |||
| 262,470,053 | |||||
| Information Technology (13.5%) | |||||
| Cohu, Inc. (a) | 406,512 | 13,024,644 | |||
| Domo, Inc.,Class B (a) | 214,845 | 18,981,556 | |||
| Grid Dynamics Holdings, Inc. (a) | 688,747 | 19,801,476 | |||
| Model N, Inc. (a) | 415,500 | 13,466,355 | |||
| Onto Innovation, Inc. (a) | 316,914 | 25,102,758 | |||
| Perficient, Inc. (a) | 175,386 | 21,677,710 | |||
| Verint Systems, Inc. (a) | 515,180 | 24,007,388 | |||
| Workiva, Inc. (a) | 171,455 | 25,641,095 | |||
| 161,702,982 | |||||
| Materials (5.8%) | |||||
| Graphic Packaging Holding Co. | 1,140,575 | 22,731,660 | |||
| Kaiser Aluminum Corp. | 192,089 | 18,659,526 | |||
| Materion Corp. | 325,924 | 23,525,194 | |||
| Ranpak Holdings Corp. (a) | 125,638 | 4,329,485 | |||
| 69,245,865 | |||||
| Real Estate (1.3%) | |||||
| Terreno Realty Corp., REIT | 218,005 | 15,942,706 | |||
| 1,005,402,969 | |||||
| Total Common Stocks | 1,144,681,693 | ||||
See accompanying Notes to Financial Statements.
| 62 | 2021 Annual Report |
Statement of Investments (concluded)
October 31, 2021
Aberdeen U.S. Small Cap Equity Fund
| Shares or Principal Amount | Value | |||
| SHORT-TERM INVESTMENT (3.9%) | ||||
| UNITED STATES (3.9%) | ||||
| State Street Institutional U.S. Government Money Market Fund, Premier Class, 0.03% (c) | 46,804,726 | $ | 46,804,726 | |
| Total Short-Term Investment | 46,804,726 | |||
| Total Investments (Cost $963,527,501) (d)—99.6% | 1,191,486,419 | |||
| Other Assets in Excess of Liabilities—0.4% | 4,360,673 | |||
| Net Assets—100.0% | $ | 1,195,847,092 | ||
| (a) | Non-income producing security. | |
| (b) | Denotes a security issued under Regulation S or Rule 144A. | |
| (c) | Registered investment company advised by State Street Global Advisors. The rate shown is the 7 day yield as of October 31, 2021. | |
| (d) | See accompanying Notes to Financial Statements for tax unrealized appreciation/(depreciation) of securities. |
| ADR | American Depositary Receipt | |
| REIT | Real Estate Investment Trust |
See accompanying Notes to Financial Statements.
| 2021 Annual Report | 63 |
Aberdeen U.S. Sustainable Leaders Fund (Unaudited)
Aberdeen U.S. Sustainable Leaders Fund (Institutional Class shares net of fees) returned 41.77% for the 12-month reporting period ended October 31, 2021, versus the 43.90% return of its benchmark, the Russell 3000 Index, during the same period.
Major U.S. equity market indices moved sharply higher amid periods of volatility over the 12-month period ended October 31, 2021, buoyed largely by investors' ongoing optimism regarding the distribution of COVID-19 vaccines and generally positive economic reports. There was sharp downturn in the U.S. equity market in September 2021, attributable to investors' concerns surrounding inflation, supply-chain challenges, and peak earnings growth. The rising number of COVID-19 cases drove increasing risk-off market sentiment and investors' rotation out of equities. However, the market rallied at the end of the reporting period in October 2021. Upbeat company results, along with comments that demand remained strong, eased investors' concerns about stagflation,1 supply-chain pressures, spiraling energy prices and higher interest rates.
U.S. stocks, as represented by the broader-market Russell 3000 Index, returned 43.90% for the reporting period. Shares of U.S. large-cap companies, as represented by the S&P 500 Index,2 returned 42.91% for the reporting period, underperforming the 45.40% and 50.80% returns of their mid- and small-cap counterparts, as measured by the Russell Midcap Index3 and Russell 2000 Index,4 respectively. All 11 sectors within the Russell 3000 Index garnered double-digit returns during the reporting period, led by the triple-digit gain of the energy sector. The financials and real estate sectors also outperformed the overall market. Conversely, the utilities, consumer staples and healthcare sectors were the primary market laggards for the reporting period.
The U.S. Federal Reserve (Fed) maintained its benchmark interest rate in a range of 0.0-0.25% over the 12-month reporting period. However, the Fed noted in its statement following its September 2021 meeting that "[t]he path of the economy continues to depend on the course of the coronavirus. Progress on vaccinations will likely continue to reduce the effects of the public health crisis on the economy, but risks to the economic outlook remain." The Fed also indicated that a reduction in its monthly purchases of US Treasury and agency mortgage-backed securities "may soon be warranted."
U.S. economic news was generally positive during the 12-month reporting period. According to the Department of Labor, U.S. payrolls expanded by 5.8 million amid the ongoing reopening of the economy over the period, and the unemployment rate fell 2.3 percentage points to 4.6%. As expected, the leisure and hospitality industry,
which experienced the most significant decline in employment due to the COVID-19-related lockdowns in the first half of 2020, saw the largest job gains for the period. U.S. gross domestic product (GDP) was up 2.0% in the third quarter of 2021, down significantly from the 6.7% increase for the second quarter. The relatively lower growth rate was attributable to a downturn in consumer spending. Amid the global supply-chain issues and rising energy costs, the U.S. Consumer Price Index (CPI)5 rose 0.9% in October 2021, reaching a 31-year high of 6.2% over the previous 12 months.6 Energy prices posted a year-over-year increase of 30% due mainly to substantially higher costs for fuel oil and gasoline. The index for all items less food and energy rose 4.6% over the previous year.
The Fund's performance relative to its benchmark, the Russell 3000 Index, for the reporting period was hampered primarily by stock selection in the information technology and communication services sectors. The main individual stock detractors from performance were holdings in diversified telecommunications company Cable One Inc. and payment-processing services provider Mastercard Inc., as well as the lack of exposure to electric vehicle (EV) manufacturer and renewable energy company Tesla Inc.
Shares of Cable One lagged the overall market for the reporting period despite the company's continued strong execution in driving both organic growth and finding strategic acquisitions. In our view, this most likely was attributable to investors' preference for cyclical growth stocks and companies benefiting from the reopening of the U.S. economy. Investors also are increasingly concerned about the overbuilding of fiber-optic infrastructure, which has a lesser impact on Cable One's rural footprint relative to its larger peers. MasterCard's highly profitable cross-border business has remained significantly hindered by waves of COVID-19-induced travel restrictions even as overall credit transaction volumes already are well above pre-pandemic levels. The company expects newly announced border reopenings to drive cross-border volumes, along with pent-up consumer demand to boost its business back to historically normal levels by the end of 2022.7 As of the end of the reporting period, the Fund did not hold Tesla as we have reservations about the company's corporate governance and have a difficult time justifying the stock's valuation.
Stock selection in the industrials and consumer discretionary sectors had a positive impact on Fund performance for the reporting period. The largest contributors to performance among individual holdings included diversified financial services companies SVB Financial Group and American Express Company; and engineering and consulting firm Tetra Tech Inc.
| 1 | Stagflation refers to an economic environment of stagnant activity and accelerating inflation. |
| 2 | The S&P 500 Index is an unmanaged index considered representative of the broader U.S. stock market. Indexes are unmanaged and have been provided for comparison purposes only. No fees or expenses are reflected. You cannot invest directly in an index. |
| 3 | The Russell Midcap Index is an unmanaged index considered representative of U.S. mid-cap stocks. |
| 4 | The Russell 2000 Index is an unmanaged index considered representative of U.S. small-cap stocks. |
| 5 | The Consumer Price Index is a measure of the average change over time in the prices that consumers pay for a basket of consumer goods and services. |
| 6 | Source: U.S. Department of Labor, November 2021 |
| 7 | Forecasts and estimates are offered as opinion and are not reflective of potential performance, are not guaranteed and actual events or results may differ materially. |
| 64 | 2021 Annual Report |
Aberdeen U.S. Sustainable Leaders Fund (Unaudited) (continued)
SVB Financial Group saw healthy year-over-year net income growth over the reporting period. The company benefited mainly from a significant increase in net interest income as well as positive contributions from its acquisition of Boston Private Financial Holdings on July 1, 2021. American Express garnered positive results over the reporting period. Strength in the company's Global Consumer Services Group, Global Commercial Services, and Global Merchant and Network Services businesses offset ongoing weakness in its Corporate and Other segment. Tetra Tech posted notable increases in revenue during the reporting period attributable mainly to strong demand for its water and environmental services.
Early in the reporting period, we made numerous changes to the portfolio in accordance with the Fund's new investment objective and name change, which became effective on December 1, 2020. We initiated holdings in consumer products maker Colgate-Palmolive Co.; alternative energy company SolarEdge Technologies Inc.; Jamieson Wellness Inc., a Canada-based distributor of natural health products; regional bank Huntington Bancshares Inc.; Atkore International Group Inc., a manufacturer of electrical raceway products; Chart Industries Inc., a global manufacturer of highly engineered equipment servicing for the clean energy and industrial gas markets; data infrastructure company Marvell Technology Inc.; asset manager CI Financial Corp.; biopharmaceutical firm Horizon Therapeutics plc; communications services provider RingCentral Inc.; New Fortress Energy Inc., a global provider of natural gas-fueled energy solutions; electronic components manufacturer Helios Technologies Inc.; and investment advisory services provider LPL Financial Holdings Inc. We also established a new position in freight railroad operator Kansas City Southern, which we subsequently exited later in the reporting period.
In addition to Kansas City Southern, we exited the Fund's positions in membership warehouse operator BJ's Wholesale Club Holdings Inc.; customer relationship management (CRM) software company Salesforce.com Inc.; freight railroad operator Canadian National Railway Co.; energy and water resource management services provider Itron Inc.; financial services company First Republic Bank; diversified industrial manufacturing company Trane Technologies plc; data services provider IHS Markit Ltd.; biopharmaceutical firm Bristol-Myers Squibb Co.; and Canada-based securities and derivatives exchange operator TMX Group Ltd.
U.S. companies that reported third-quarter earnings as of the end of October 2021 generally indicated that they have seen continued strong demand (with many highlighting the concept of unmet demand due to supply-chain issues) and aggressive pricing increases to offset elevated labor and input costs. Companies currently are making it a top priority to tackle the supply-chain issues in their near-term plans. The CEOs of the three largest U.S. banks commented alongside their respective companies' results that they are seeing increased use of corporate credit lines to invest in inventory and capital expenditures in an effort to address supply-chain issues. Combined with more positive news surrounding reopening of economies in several Southeast Asia countries where many corporations have manufacturing operations, this supports
companies' views that inflation and supply chain are temporary problems – albeit with a range of views on how long these conditions may persist.
Progress in consumer sentiment remains muted, although it remains healthy compared to pre-pandemic levels. This appears to be driven by the impact of the Delta variant in more severely affected states – encouragingly, October saw COVID-19-related hospitalizations and daily cases continue to improve. Overall, the financial health of U.S. consumers remains robust following a prolonged period of household debt reduction and increased savings through the pandemic.
Beyond this phase (which has brought investors' focus to the very near term given the rapid fluctuations in supply chains), we believe that the market will shift its focus towards the sustainability of growth as the cycle normalizes. Within this context, we continue to strive to create value for the Fund's shareholders by investing with conviction in companies that in our view have strong, sustainable business models and long runways for growth.
Effective December 1, 2020, the Aberdeen Focused U.S. Equity Fund changed its name to Aberdeen U.S. Sustainable Leaders Fund and changed its principal investment strategies. The Fund seeks to achieve its investment objective of long-term capital appreciation by investing in equity securities of smaller (small- and mid-capitalization) U.S. companies that the Adviser deems to have sound or improving prospects and which demonstrate that they are current or emerging sustainable leaders through their management of environmental, social and governance ("ESG") risks and opportunities in accordance with the Adviser's criteria.
Portfolio Management:
North American Equity Team
PAST PERFORMANCE DOES NOT GUARANTEE FUTURE RESULTS.
The performance data quoted represents past performance and current returns may be lower or higher. Class A Shares have up to a 5.75% front-end sales charge and a 0.25% 12b-1 fee. The investment return and principal value will fluctuate so that an investor's shares, when redeemed, may be worth more or less than the original cost. To obtain performance information current to the most recent month-end, which may be higher or lower than the performance shown above, please call 866-667-9231 or go to https://www.abrdn.com/en-us/us/investor/fund-centre.
Investing in mutual funds involves risk, including the possible loss of principal.
Indexes are unmanaged and have been provided for comparison purposes only. No fees or expenses are reflected. You cannot invest directly in an index.
Risk Considerations
Deteriorating market conditions might cause a general weakness in the market that reduces the prices, or yield, of securities in those markets in which the Fund invests.
The value of a security may decline for reasons directly related to the issuer, such as management performance, financial leverage and reduced demand for the issuer's goods or services.
| 2021 Annual Report | 65 |
Aberdeen U.S. Sustainable Leaders Fund (Unaudited) (concluded)
The stock or other security of a company may not perform as well as expected, and may decrease in value, because of factors related to the company, to the industry in which the company is engaged, or to the market as a whole.
The Fund is subject to the risk that the Adviser or Subadviser may make poor security selections.
The Fund's "Sustainable Leaders" strategy could cause it to perform differently compared to funds that do not have such strategy. ESG considerations may be linked to long-term rather than short-term
returns. The criteria related to the Fund's Sustainable Leaders strategy, including the exclusion of securities of companies that engage in certain business activities, may result in the Fund forgoing opportunities to buy certain securities when it might otherwise be advantageous to do so, or selling securities for ESG reasons when it might be otherwise disadvantageous for it to do so.
Please read the prospectus for more detailed information regarding these and other risks.
| 66 | 2021 Annual Report |
Aberdeen U.S. Sustainable Leaders Fund (Unaudited)
| Average Annual Total Return1 (For periods ended October 31, 2021) | 1 Yr. | 5 Yr. | 10 Yr. | |
| Class A | w/o SC | 41.35% | 20.33% | 14.78% |
| w/SC2 | 33.23% | 18.91% | 14.11% | |
| Class C | w/o SC | 40.20% | 19.46% | 13.95% |
| w/SC3 | 39.20% | 19.46% | 13.95% | |
| Institutional Service Class4 | w/o SC | 41.61% | 20.58% | 15.03% |
| Institutional Class4 | w/o SC | 41.77% | 20.69% | 15.13% |
All figures showing the effect of a sales charge (SC) reflect the maximum charge possible because it has the most significant effect on performance data. The total returns shown above do not include the impact of financial statement rounding of the net asset value (NAV) per share and/or financial statement adjustments.
| 1 | The Fund changed its investment strategies effective December 1, 2020. Performance information for periods prior to December 1, 2020 does not reflect the current investment strategy. In connection with the change in investment strategy, the Fund changed its name from Aberdeen U.S. Multi-Cap Equity Fund to Aberdeen U.S. Sustainable Leaders Fund. Returns prior to October 9, 2011 reflect the performance of a predecessor fund (the "Predecessor Fund"). Returns of the Predecessor Fund have not been adjusted to reflect the expenses applicable to the respective classes. Please consult the Fund's prospectus for more detail. |
| 2 | A 5.75% front-end sales charge was deducted. |
| 3 | A 1.00% contingent deferred sales charge (CDSC) was deducted from the one year return because it is charged when Class C shares are sold within the first year after purchase. |
| 4 | Not subject to any sales charges. |
Performance of a $10,000 Investment (as of October 31, 2021)
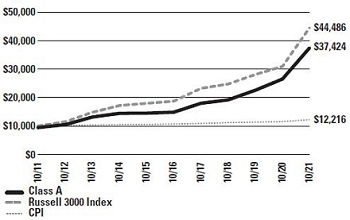
Comparative performance of $10,000 invested in Class A shares of the Aberdeen U.S. Sustainable Leaders Fund, Russell 3000® Index and the Consumer Price Index (CPI) over a 10-year period ended October 31, 2021. Unlike the Fund, the returns for these unmanaged indexes do not reflect any fees, expenses, or sales charges. Investors cannot invest directly in market indexes.
The Russell 3000® Index measures the performance of the largest 3,000 U.S. companies representing approximately 98% of the investable U.S. equity market. The Russell 3000® Index is constructed to provide a comprehensive, unbiased, and stable barometer of the broad market and is completely reconstituted annually to ensure new and growing equities are reflected.
The CPI is a measure of the average change over time in the prices paid by urban consumers for a market basket of consumer goods and services.
Investment return and principal value will fluctuate, and when redeemed, shares may be worth more or less than original cost. Past performance is no guarantee of future results. The Average Annual Total Return table and Performance graph do not reflect the deduction of taxes that a shareholder would pay on fund distributions or the redemption of fund shares. Investing in mutual funds involves market risk, including loss of principal. Performance returns assume the reinvestment of all distributions. Total returns reflect waivers and reimbursements in effect, without which returns would have been lower.
| 2021 Annual Report | 67 |
Aberdeen U.S. Sustainable Leaders Fund (Unaudited)
Portfolio Summary (as a percentage of net assets)
October 31, 2021 (Unaudited)
| Asset Allocation | ||
| Common Stocks | 97.5% | |
| Short-Term Investment | 2.6% | |
| Liabilities in Excess of Other Assets | (0.1%) | |
| 100.0% |
The following table summarizes the composition of the Fund's portfolio, in S&P Global Industry Classification Standard (GICS) sectors, expressed as a percentage of net assets as of October 31, 2021.
| Top Sectors | ||
| Information Technology | 32.3%* | |
| Industrials | 18.0% | |
| Financials | 13.2% | |
| Health Care | 9.3% | |
| Consumer Discretionary | 5.7% | |
| Real Estate | 4.5% | |
| Consumer Staples | 4.4% | |
| Utilities | 3.7% | |
| Materials | 2.5% | |
| Communication Services | 2.2% | |
| Other | 4.2% | |
| 100.0% |
| * | As of October 31, 2021, the Fund's holdings in the Information Technology sector were allocated to three industries: Software (20.0%), Information Technology Services (6.8%) and Semiconductors & Semiconductor Equipment (5.5%). |
| Top Holdings* | ||
| Microsoft Corp. | 9.4% | |
| Tetra Tech, Inc. | 4.6% | |
| ICON PLC | 4.5% | |
| NICE Ltd., ADR | 4.4% | |
| Mastercard, Inc., Class A | 3.7% | |
| RingCentral, Inc., Class A | 3.4% | |
| Burlington Stores, Inc. | 3.1% | |
| Akamai Technologies, Inc. | 3.0% | |
| American Express Co. | 3.0% | |
| SolarEdge Technologies, Inc. | 2.9% | |
| Other | 58.0% | |
| 100.0% |
| * | For the purpose of listing top holdings, Short-Term Investments are included as part of Other. |
| Top Countries | ||
| United States | 85.7% | |
| Canada | 5.5% | |
| Ireland | 4.5% | |
| Israel | 4.4% | |
| Other | (0.1%) | |
| 100.0% |
| 68 | 2021 Annual Report |
Statement of Investments
October 31, 2021
Aberdeen U.S. Sustainable Leaders Fund
| Shares or Principal Amount | Value | |||
| COMMON STOCKS (97.5%) | ||||
| CANADA (5.5%) | ||||
| Consumer Staples (2.7%) | ||||
| Jamieson Wellness, Inc. (a) | 455,519 | $ | 14,027,011 | |
| Financials (2.8%) | ||||
| CI Financial Corp. | 642,811 | 14,657,504 | ||
| 28,684,515 | ||||
| IRELAND (4.5%) | ||||
| Health Care (4.5%) | ||||
| ICON PLC (b) | 81,557 | 23,388,101 | ||
| ISRAEL (4.4%) | ||||
| Information Technology (4.4%) | ||||
| NICE Ltd., ADR (b) | 80,622 | 22,817,638 | ||
| UNITED STATES (83.1%) | ||||
| Communication Services (2.2%) | ||||
| Cable One, Inc. | 6,614 | 11,317,943 | ||
| Consumer Discretionary (5.7%) | ||||
| Burlington Stores, Inc. (b) | 57,863 | 15,986,968 | ||
| Pool Corp. | 26,829 | 13,821,228 | ||
| 29,808,196 | ||||
| Consumer Staples (1.7%) | ||||
| Colgate-Palmolive Co. | 117,674 | 8,965,582 | ||
| Energy (1.7%) | ||||
| New Fortress Energy, Inc. | 292,624 | 8,778,720 | ||
| Financials (10.4%) | ||||
| American Express Co. | 88,237 | 15,333,826 | ||
| Hannon Armstrong Sustainable Infrastructure Capital, Inc. | 134,422 | 8,119,089 | ||
| Huntington Bancshares, Inc. | 841,780 | 13,249,617 | ||
| LPL Financial Holdings, Inc. | 44,300 | 7,266,086 | ||
| SVB Financial Group (b) | 13,870 | 9,950,338 | ||
| 53,918,956 | ||||
| Health Care (4.8%) | ||||
| Horizon Therapeutics PLC (b) | 125,971 | 15,105,183 | ||
| Integer Holdings Corp. (b) | 106,622 | 9,598,112 | ||
| 24,703,295 | ||||
| Industrials (18.0%) | ||||
| Atkore, Inc. (b) | 142,590 | 13,479,033 | ||
| Chart Industries, Inc. (b) | 71,383 | 12,671,910 | ||
| Helios Technologies, Inc. | 153,082 | 13,938,116 | ||
| Tetra Tech, Inc. | 137,415 | 24,138,319 | ||
| Trex Co., Inc. (b) | 138,575 | 14,744,380 | ||
| Waste Management, Inc. | 91,633 | 14,682,356 | ||
| 93,654,114 | ||||
| Shares or Principal Amount | Value | |||
| Information Technology (27.9%) | ||||
| Akamai Technologies, Inc. (b) | 147,645 | $ | 15,570,642 | |
| Autodesk, Inc. (b) | 46,745 | 14,846,679 | ||
| Marvell Technology, Inc. | 193,523 | 13,256,325 | ||
| Mastercard, Inc., Class A | 57,957 | 19,445,733 | ||
| Microsoft Corp. | 147,702 | 48,980,937 | ||
| RingCentral, Inc., Class A (b) | 71,492 | 17,428,320 | ||
| SolarEdge Technologies, Inc. (b) | 42,675 | 15,135,969 | ||
| 144,664,605 | ||||
| Materials (2.5%) | ||||
| Ecolab, Inc. | 58,727 | 13,050,314 | ||
| Real Estate (4.5%) | ||||
| Alexandria Real Estate Equities, Inc. | 50,661 | 10,341,937 | ||
| American Tower Corp., REIT | 46,553 | 13,126,549 | ||
| 23,468,486 | ||||
| Utilities (3.7%) | ||||
| American Water Works Co., Inc. | 58,114 | 10,122,296 | ||
| NextEra Energy, Inc. | 107,393 | 9,163,845 | ||
| 19,286,141 | ||||
| 431,616,352 | ||||
| Total Common Stocks | 506,506,606 | |||
| SHORT-TERM INVESTMENT (2.6%) | ||||
| UNITED STATES (2.6%) | ||||
| State Street Institutional U.S. Government Money Market Fund, Premier Class, 0.03% (c) | 13,728,502 | 13,728,502 | ||
| Total Short-Term Investment | 13,728,502 | |||
| Total Investments (Cost $403,202,146) (d)—100.1% | 520,235,108 | |||
| Liabilities in Excess of Other Assets—(0.1)% | (734,503) | |||
| Net Assets—100.0% | $ | 519,500,605 | ||
| (a) | Denotes a security issued under Regulation S or Rule 144A. |
| (b) | Non-income producing security. |
| (c) | Registered investment company advised by State Street Global Advisors. The rate shown is the 7 day yield as of October 31, 2021. |
| (d) | See accompanying Notes to Financial Statements for tax unrealized appreciation/(depreciation) of securities. |
| ADR | American Depositary Receipt |
| PLC | Public Limited Company |
| REIT | Real Estate Investment Trust |
See accompanying Notes to Financial Statements.
| 2021 Annual Report | 69 |
Aberdeen U.S. Sustainable Leaders Smaller Companies Fund (Unaudited)
Aberdeen U.S. Sustainable Leaders Smaller Companies Fund (Institutional Class shares net of fees) returned 53.85% for the 12-month reporting period ended October 31, 2021, versus the 49.43% return of its benchmark, the Russell 2500 Index, during the same period.
Major U.S. equity market indices moved sharply higher amid periods of volatility over the 12-month period ended October 31, 2021, buoyed largely by investors' ongoing optimism regarding the distribution of COVID-19 vaccines and generally positive economic reports. There was sharp downturn in the U.S. equity market in September 2021, attributable to investors' concerns surrounding inflation, supply-chain challenges, and peak earnings growth. The rising number of COVID-19 cases drove increasing risk-off market sentiment and investors' rotation out of equities. However, the market rallied at the end of the reporting period in October 2021. Upbeat company results, along with comments that demand remained strong, eased investors' concerns about stagflation,1 supply-chain pressures, spiraling energy prices and higher interest rates.
U.S. stocks, as measured by the broader-market Russell 3000 Index, returned 43.90% for the reporting period. Shares of U.S. large-cap companies, as represented by the S&P 500 Index,2 returned 42.91% for the reporting period, underperforming the 45.40% and 50.80% returns of their mid- and small-cap counterparts, as measured by the Russell Midcap Index3 and Russell 2000 Index,4 respectively. All 11 sectors within the Russell 2500 Index, the Fund's benchmark, garnered double-digit returns during the reporting period, led by the triple-digit gain of the energy sector. The financials and industrials sectors also outperformed the overall market. Conversely, the utilities, consumer staples and healthcare sectors were the primary market laggards for the reporting period.
The U.S. Federal Reserve (Fed) maintained its benchmark interest rate in a range of 0.0-0.25% over the 12-month reporting period. However, the Fed noted in its statement following its September 2021 meeting that "[t]he path of the economy continues to depend on the course of the coronavirus. Progress on vaccinations will likely continue to reduce the effects of the public health crisis on the economy, but risks to the economic outlook remain." The Fed also indicated that a reduction in its monthly purchases of US Treasury and agency mortgage-backed securities "may soon be warranted."
U.S. economic news was generally positive during the 12-month reporting period. According to the Department of Labor, U.S. payrolls
expanded by 5.8 million amid the ongoing reopening of the economy over the period, and the unemployment rate fell 2.3 percentage points to 4.6%. As expected, the leisure and hospitality industry, which experienced the most significant decline in employment due to the COVID-19-related lockdowns in the first half of 2020, saw the largest job gains for the period. U.S. gross domestic product (GDP) was up 2.0% in the third quarter of 2021, down significantly from the 6.7% increase for the second quarter. The relatively lower growth rate was attributable to a downturn in consumer spending. Amid the global supply-chain issues and rising energy costs, the U.S. Consumer Price Index (CPI)5 rose 0.9% in October 2021, reaching a 31-year high of 6.2% over the previous 12 months.6 Energy prices posted a year-over-year increase of 30% due mainly to substantially higher costs for fuel oil and gasoline. The index for all items less food and energy rose 4.6% over the previous year.
The Fund's outperformance relative to its benchmark, the Russell 2500 Index, for the reporting period was attributable mainly to strong stock selection in the healthcare, industrials and information technology sectors. The largest individual stock contributors to performance were biopharmaceutical firm Ligand Pharmaceuticals Inc.; Atkore International Group Inc., a manufacturer of electrical raceway products; and Kulicke & Soffa Industries Inc., a manufacturer of semiconductor assembly solutions.
In our view, Ligand Pharmaceuticals likely was a beneficiary of a "short squeeze"7 following retail investor interest in heavily shorted stocks in the first quarter of 2021. Despite the run-up in the share price, we feel that the company has an attractive long-term runway of sales and earnings growth due to the company's differentiated technologies and broad product pipeline. Atkore International Group's stock price moved higher over the reporting period as the company has benefited from recovery in its key end-markets and a differentiated strategy which thrives in an environment of increasing supply constraints. Sales and earnings growth have exceeded the market expectations, leading to a healthy re-rating of the company's valuation multiple.8 Kulicke & Soffa benefited from a favorable environment for semiconductors and broad-based demand across a variety of industries. We subsequently exited the Fund's position in the company following a period of share-price strength.
An underweight allocation to the energy sector and stock selection in the financials sector weighed on Fund performance over the reporting period. The primary detractors from performance among individual holdings included customer relationship management (CRM) software company Pegasystems Inc., as well as the lack of exposure to
| 1 | Stagflation refers to an economic environment of stagnant activity and accelerating inflation. . |
| 2 | The S&P 500 Index is an unmanaged index considered representative of the broader U.S. stock market. Indexes are unmanaged and have been provided for comparison purposes only. No fees or expenses are reflected. You cannot invest directly in an index. |
| 3 | The Russell Midcap Index is an unmanaged index considered representative of U.S. mid-cap stocks. |
| 4 | The Russell 2000 Index is an unmanaged index considered representative of U.S. small-cap stocks. |
| 5 | The Consumer Price Index is a measure of the average change over time in the prices that consumers pay for a basket of consumer goods and services. |
| 6 | Source: U.S. Department of Labor, November 2021 |
| 7 | A "short squeeze" occurs when a security has an unusually large amount of short sellers holding positions in it. The short squeeze begins when the price unexpectedly moves higher. |
| 8 | A valuation multiple is a ratio that reflects the valuation of a target company in relation to a specific financial metric to facilitate the comparison of two different companies. |
| 70 | 2021 Annual Report |
Aberdeen U.S. Sustainable Leaders Smaller Companies Fund (Unaudited) (continued)
industrial equipment auction company Ritchie Bros. Auctioneers Inc., and human resources services provider Paylocity Holding Corp.
Pegasystems is a technology leader in business process management (BPM), and its specific CRM niche has enabled the company to develop a large and sticky9 enterprise customer base. Like many software companies, Pegasystems is transitioning to a recurring revenue model, which has had a negative impact on revenue growth and margins over the past few years, but it appears that the company is now through the trough. Revenue growth is accelerating and margins are expanding. We believe that these factors should drive attractive free cash flow for our expected investment time horizon. Shares of Ritchie Bros. Auctioneers performed well over the reporting period as the company saw year-over-year increases in service and inventory revenue, which offset higher expenses. We subsequently sold the Fund's shares in Ritchie Bros. Auctioneers following their strong performance. The absence of a position in Paylocity Holding Corp. for the last four months of the reporting hampered Fund performance. The company garnered generally positive results over the period, benefiting from healthy year-over-year revenue growth across its business segments. We exited the Fund's positon in June 2021, following a period of share-price strength.
Early in the reporting period, we made numerous changes to the Fund's portfolio in accordance with the Fund's new investment objective and name change, which became effective on December 1, 2020. We initiated holdings in alternative energy company SolarEdge Technologies Inc.; Atkore International Group Inc., a manufacturer of electrical raceway products; regional bank Huntington Bancshares Inc.; Chart Industries Inc., a global manufacturer of highly engineered equipment servicing for the clean energy and industrial gas markets; Graphic Packaging International, a provider of paper-based packaging solutions; energy services company Ameresco Inc.; Onto Innovation Inc., a supplier of semiconductor capital equipment; Conmed Corp., a manufacturer of a broad range of niche medical devices; semiconductor and electronic components manufacturer Vertiv Holdings Co.; CI Financial Corp., a Canada-based asset and wealth management firm; medical device manufacturer InMode Ltd.; Health Catalyst Inc., a developer of cloud-based software for hospital systems; IT services provider Perficient Inc.; biopharmaceutical firm Horizon Therapeutics plc; cloud-based business communications services provider RingCentral Inc.; clean energy company New Fortress Energy Inc.; Axon Enterprise Inc., a provider of law enforcement technology solutions; LPL Financial Holdings Inc., a provider of investment and business solutions for independent financial advisors; and Ranpak Holdings Corp., a provider of eco-friendly packaging technologies.
In addition to Kulicke & Soffa and Paylocity as previously noted, we exited the Fund's positions in SiteOne Landscape Supply Inc.; energy and water resource management services provider Itron Inc.; Envestnet Inc., a provider of software and analytics to wealth
management and financial technology firms; financial services company SVB Financial Group; in-home healthcare services provider Addus Homecare Corp.; freight railroad operator Kansas City Southern; Fox Factory Holding Corp., a manufacturer of shocks/suspension systems for bicycles and a variety of motorized vehicles; data center-focused real estate investment trust (REIT) QTS Realty Trust Inc.; pharmaceutical firm Bristol-Myers Squibb Co.; and industrial equipment auction company Ritchie Bros. Auctioneers Inc.
U.S. companies that reported third-quarter earnings as of the end of October 2021 generally indicated that they have seen continued strong demand (with many highlighting the concept of unmet demand due to supply-chain issues) and aggressive pricing increases to offset elevated labor and input costs. Companies currently are making it a top priority to tackling the supply-chain issues in their near-term plans. The CEOs of the three largest U.S. banks commented alongside their respective companies' results that they are seeing increased use of corporate credit lines to invest in inventory and capital expenditures in an effort to address supply-chain issues. Combined with more positive news surrounding reopening of economies in several Southeast Asia countries where many corporations have manufacturing operations, this supports companies' views that inflation and supply chain are temporary problems – albeit with a range of views on how long these conditions may persist.
Progress in consumer sentiment remains muted, although it remains healthy compared to pre-pandemic levels. This appears to be driven by the impact of the Delta variant in more severely affected states – encouragingly, October saw COVID-19-related hospitalizations and daily cases continue to improve. Overall, the financial health of U.S. consumers remains robust following a prolonged period of household debt reduction and increased savings through the pandemic.
Beyond this phase (which has brought investors' focus to the very near term given the rapid fluctuations in supply chains), we believe that the market will shift its focus towards the sustainability of growth as the cycle normalizes. Within this context, we continue to strive to create value for the Fund's shareholders by investing with conviction in companies that in our view have strong, sustainable business models and long runways for growth.
Effective December 1, 2020, the Aberdeen Focused U.S. Equity Fund changed its name to Aberdeen U.S. Sustainable Leaders Smaller Companies Fund and changed its principal investment strategies. The Fund seeks to achieve its investment objective of long-term capital appreciation by investing in equity securities of smaller (small- and mid-capitalization) U.S. companies that the Adviser deems to have sound or improving prospects and which demonstrate that they are current or emerging sustainable leaders through their management of environmental, social and governance ("ESG") risks and opportunities in accordance with the Adviser's criteria.
| 9 | "Sticky" refers to the tendency of customers to repurchase a product or service, or use it more frequently. |
| 2021 Annual Report | 71 |
Aberdeen U.S. Sustainable Leaders Smaller Companies Fund (Unaudited) (concluded)
Portfolio Management:
North American Equity Team
PAST PERFORMANCE DOES NOT GUARANTEE FUTURE RESULTS.
The performance data quoted represents past performance and current returns may be lower or higher. Class A Shares have up to a 5.75% front-end sales charge and a 0.25% 12b-1 fee. The investment return and principal value will fluctuate so that an investor's shares, when redeemed, may be worth more or less than the original cost. To obtain performance information current to the most recent month-end, which may be higher or lower than the performance shown above, please call 866-667-9231 or go to https://www.abrdn.com/en-us/us/investor/fund-centre.
Investing in mutual funds involves risk, including possible loss of principal.
Indexes are unmanaged and have been provided for comparison purposes only. No fees or expenses are reflected. You cannot invest directly in an index.
Risk Considerations
Deteriorating market conditions might cause a general weakness in the market that reduces the prices, or yield, of securities in those markets in which the Fund invests.
The value of a security may decline for reasons directly related to the issuer, such as management performance, financial leverage and reduced demand for the issuer's goods or services.
The stock or other security of a company may not perform as well as expected, and may decrease in value, because of factors related to the company, to the industry in which the company is engaged, or to the market as a whole.
The Fund is subject to the risk that the Adviser or Subadviser may make poor security selections.
The Fund's "Sustainable Leaders" strategy could cause it to perform differently compared to funds that do not have such strategy. ESG considerations may be linked to long-term rather than short-term returns. The criteria related to the Fund's Sustainable Leaders strategy, including the exclusion of securities of companies that engage in certain business activities, may result in the Fund forgoing opportunities to buy certain securities when it might otherwise be advantageous to do so, or selling securities for ESG reasons when it might be otherwise disadvantageous for it to do so.
Securities of smaller companies are usually less stable in price and less liquid than those of larger, more established companies. Therefore, they generally involve greater risk.
Please read the prospectus for more detailed information regarding these and other risks.
| 72 | 2021 Annual Report |
Aberdeen U.S. Sustainable Leaders Smaller Companies Fund (Unaudited)
Average Annual Total Return1
(For periods ended October 31, 2021) | 1 Yr. | 5 Yr. | 10 Yr. | ||||||
| Class A | w/o SC | 53.27% | 19.31% | 10.61% | |||||
| w/SC2 | 44.51% | 17.90% | 9.96% | ||||||
| Class C | w/o SC | 51.76% | 18.41% | 9.82% | |||||
| w/SC3 | 50.94% | 18.41% | 9.82% | ||||||
| Class R4 | w/o SC | 52.76% | 18.94% | 10.22% | |||||
| Institutional Service Class4 | w/o SC | 53.56% | 19.54% | 10.76% | |||||
| Institutional Class4 | w/o SC | 53.85% | 19.73% | 10.98% |
All figures showing the effect of a sales charge (SC) reflect the maximum charge possible because it has the most significant effect on performance data. The total returns shown above do not include the impact of financial statement rounding of the net asset value (NAV) per share and/or financial statement adjustments.
| 1 | The Fund changed its investment strategies effective December 1, 2020. Performance information for periods prior to December 1, 2020 does not reflect the current investment strategy. In connection with the change in investment strategy, the Fund changed its name from Aberdeen Focused U.S. Equity Fund to Aberdeen U.S. Sustainable Leaders Smaller Companies Fund. The Fund changed its investment strategies effective November 15, 2017. Performance information for periods prior to November 15, 2017 does not reflect the current investment strategy. Please consult the Fund's prospectus for more detail. |
| 2 | A 5.75% front-end sales charge was deducted. |
| 3 | A 1.00% contingent deferred sales charge (CDSC) was deducted from the one year return because it is charged when Class C shares are sold within the first year after purchase. |
| 4 | Not subject to any sales charges. |
Performance of a $10,000 Investment (as of October 31, 2021)

Comparative performance of $10,000 invested in Class A shares of the Aberdeen U.S. Sustainable Leaders Smaller Companies Fund, the
S&P 500® Index, the Russell 2500® Index, and the Consumer Price Index (CPI) over a 10-year period ended October 31, 2021. Effective December 1, 2020, the Russell 2500® Index replaced the S&P 500® Index as the Fund's primary benchmark in connection with the Fund's change in investment strategy. Unlike the Fund, the returns for these unmanaged indexes do not reflect any fees, expenses, or sales charges. Investors cannot invest directly in market indexes.
The Russell 2500® Index measures the performance of the small to midcap segment of the US equity universe, commonly referred to as "smid" cap. The Russell 2500® Index is a subset of the Russell 3000® Index. It includes approximately 2,500 of the smallest securities based on a combination of their market cap and current index membership.
The S&P 500® Index represents large-cap U.S. equities. The index includes 500 leading companies and captures approximately 80% coverage of available U.S. market capitalization.
The CPI is a measure of the average change over time in the prices paid by urban consumers for a market basket of consumer goods and services.
Investment return and principal value will fluctuate, and when redeemed, shares may be worth more or less than original cost. Past performance is no guarantee of future results. The Average Annual Total Return table and Performance graph do not reflect the deduction of taxes that a shareholder would pay on fund distributions or the redemption of fund shares. Investing in mutual funds involves market risk, including loss of principal. Performance returns assume the reinvestment of all distributions. Total returns reflect waivers and reimbursements in effect, without which returns would have been lower.
| 2021 Annual Report | 73 |
Aberdeen U.S. Sustainable Leaders Smaller Companies Fund (Unaudited)
Portfolio Summary (as a percentage of net assets)
October 31, 2021 (Unaudited)
| Asset Allocation | |||
| Common Stocks | 97.7 | % | |
| Short-Term Investment | 2.2 | % | |
| Other Assets in Excess of Liabilities | 0.1 | % | |
| 100.0 | % | ||
The following table summarizes the composition of the Fund's portfolio, in S&P Global Industry Classification Standard (GICS) sectors, expressed as a percentage of net assets as of October 31, 2021.
| Top Sectors | |||
| Information Technology | 23.0 | % | |
| Industrials | 21.5 | % | |
| Financials | 18.2 | % | |
| Health Care | 13.9 | % | |
| Consumer Discretionary | 6.1 | % | |
| Materials | 4.2 | % | |
| Communication Services | 3.9 | % | |
| Consumer Staples | 2.9 | % | |
| Utilities | 2.4 | % | |
| Energy | 1.6 | % | |
| Other | 2.3 | % | |
| 100.0 | % | ||
| Top Holdings* | |||
| Trex Co., Inc. | 3.7 | % | |
| NICE Ltd., ADR | 3.2 | % | |
| Tetra Tech, Inc. | 3.1 | % | |
| CI Financial Corp. | 3.0 | % | |
| SolarEdge Technologies, Inc. | 3.0 | % | |
| ICON PLC | 3.0 | % | |
| Jamieson Wellness, Inc. | 2.9 | % | |
| CyberArk Software Ltd. | 2.9 | % | |
| Huntington Bancshares, Inc. | 2.9 | % | |
| Pegasystems, Inc. | 2.8 | % | |
| Other | 69.5 | % | |
| 100.0 | % | ||
| * | For the purpose of listing top holdings, Short-Term Investments are included as part of Other. |
| Top Countries | |||
| United States | 83.7 | % | |
| Canada | 7.1 | % | |
| Israel | 6.1 | % | |
| Ireland | 3.0 | % | |
| Other | 0.1 | % | |
| 100.0 | % | ||
| 74 | 2021 Annual Report |
Statement of Investments
October 31, 2021
Aberdeen U.S. Sustainable Leaders Smaller Companies Fund
| Shares or Principal Amount | Value | |||||||
| COMMON STOCKS (97.7%) | ||||||||
| Communication Services (3.9%) | ||||||||
| Cable One, Inc. | 211 | $ | 361,065 | |||||
| Cogent Communications Holdings, Inc. | 5,115 | 391,758 | ||||||
| 752,823 | ||||||||
| Consumer Discretionary (6.1%) | ||||||||
| Burlington Stores, Inc. (a) | 1,701 | 469,970 | ||||||
| LGI Homes, Inc. (a) | 2,784 | 415,651 | ||||||
| Pool Corp. | 563 | 290,035 | ||||||
| 1,175,656 | ||||||||
| Consumer Staples (2.9%) | ||||||||
| Jamieson Wellness, Inc. (b) | 18,530 | 570,603 | ||||||
| Energy (1.6%) | ||||||||
| New Fortress Energy, Inc. | 10,607 | 318,210 | ||||||
| Financials (18.2%) | ||||||||
| CI Financial Corp. | 25,758 | 587,339 | ||||||
| First Interstate BancSystem, Inc., Class A | 8,971 | 372,925 | ||||||
| Hannon Armstrong Sustainable Infrastructure Capital, Inc. | 8,821 | 532,788 | ||||||
| Huntington Bancshares, Inc. | 35,640 | 560,974 | ||||||
| Live Oak Bancshares, Inc. | 5,152 | 459,455 | ||||||
| LPL Financial Holdings, Inc. | 1,622 | 266,040 | ||||||
| PJT Partners, Inc., Class A | 6,439 | 526,646 | ||||||
| TMX Group Ltd. | 2,196 | 237,752 | ||||||
| 3,543,919 | ||||||||
| Health Care (13.9%) | ||||||||
| AMN Healthcare Services, Inc. (a) | 2,982 | 294,323 | ||||||
| CONMED Corp. | 2,589 | 378,719 | ||||||
| Health Catalyst, Inc. (a) | 7,316 | 385,114 | ||||||
| ICON PLC (a) | 2,017 | 578,415 | ||||||
| Inmode Ltd. (a) | 2,229 | 211,176 | ||||||
| Integer Holdings Corp. (a) | 4,994 | 449,560 | ||||||
| Ligand Pharmaceuticals, Inc. (a) | 2,700 | 394,038 | ||||||
| 2,691,345 | ||||||||
| Industrials (21.5%) | ||||||||
| Ameresco, Inc., Class A (a) | 6,351 | 521,608 | ||||||
| Atkore, Inc. (a) | 3,893 | 368,005 | ||||||
| Axon Enterprise, Inc. (a) | 1,580 | 284,337 | ||||||
| Chart Industries, Inc. (a) | 2,532 | 449,481 | ||||||
| Helios Technologies, Inc. | 3,450 | 314,123 | ||||||
| JB Hunt Transport Services, Inc. | 1,974 | 389,253 | ||||||
| Tetra Tech, Inc. | 3,388 | 595,136 | ||||||
| Trex Co., Inc. (a) | 6,780 | 721,392 | ||||||
| Vertiv Holdings Co. | 20,505 | 526,568 | ||||||
| 4,169,903 | ||||||||
| Information Technology (23.0%) | ||||||||
| Akamai Technologies, Inc. (a) | 4,141 | 436,710 | ||||||
| CyberArk Software Ltd. (a) | 3,147 | 566,806 | ||||||
| NICE Ltd., ADR (a) | 2,217 | 627,455 | ||||||
| Onto Innovation, Inc. (a) | 5,972 | 473,042 | ||||||
| Pegasystems, Inc. | 4,541 | 539,108 | ||||||
| Shares or Principal Amount | Value | |||||||
| Perficient, Inc. (a) | 2,876 | $ | 355,474 | |||||
| Rapid7, Inc. (a) | 2,898 | 373,117 | ||||||
| SolarEdge Technologies, Inc. (a) | 1,651 | 585,577 | ||||||
| Wolfspeed, Inc. (a) | 4,203 | 504,822 | ||||||
| 4,462,111 | ||||||||
| Materials (4.2%) | ||||||||
| Graphic Packaging Holding Co. | 17,620 | 351,166 | ||||||
| Ranpak Holdings Corp. (a) | 13,721 | 472,826 | ||||||
| 823,992 | ||||||||
| Utilities (2.4%) | ||||||||
| Essential Utilities, Inc. | 9,852 | 463,734 | ||||||
| Total Common Stocks | 18,972,296 | |||||||
| SHORT-TERM INVESTMENT (2.2%) | ||||||||
| State Street Institutional U.S. Government Money Market Fund, Premier Class, 0.03% (c) | 428,743 | 428,743 | ||||||
| Total Short-Term Investment | 428,743 | |||||||
| Total Investments (Cost $16,070,182) (d)—99.9% | 19,401,039 | |||||||
| Other Assets in Excess of Liabilities—0.1% | 24,819 | |||||||
| Net Assets—100.0% | $ | 19,425,858 | ||||||
| (a) | Non-income producing security. | |
| (b) | Denotes a security issued under Regulation S or Rule 144A. | |
| (c) | Registered investment company advised by State Street Global Advisors. The rate shown is the 7 day yield as of October 31, 2021. | |
| (d) | See accompanying Notes to Financial Statements for tax unrealized appreciation/(depreciation) of securities. | |
| ADR | American Depositary Receipt | |
| PLC | Public Limited Company |
See accompanying Notes to Financial Statements.
| 2021 Annual Report | 75 |
Statements of Assets and Liabilities
October 31, 2021
| Aberdeen China A Share Equity Fund | Aberdeen Dynamic Dividend Fund | Aberdeen Emerging Markets Fund | Aberdeen Emerging Markets Sustainable Leaders Fund | Aberdeen Global Equity Fund | ||||||||||||||||
| Assets: | ||||||||||||||||||||
| Investments, at value | $ | 86,218,754 | $ | 125,779,655 | $ | 4,942,623,738 | $ | 214,478,689 | $ | 29,968,089 | ||||||||||
| Short-term investments, at value | 1,993,668 | 2,493,808 | 6,077,284 | 924,957 | 1,051,627 | |||||||||||||||
| Foreign currency, at value | 1,561 | – | 1,959,526 | 1,123,964 | 3,396 | |||||||||||||||
| Receivable for investments sold | – | 318,166 | 25,037,227 | 327,419 | – | |||||||||||||||
| Interest and dividends receivable | 19 | 121,694 | 3,571,482 | 118,178 | 15,837 | |||||||||||||||
| Receivable for capital shares issued | 36,049 | 2,122 | 1,464,119 | 15,063 | 40,269 | |||||||||||||||
| Receivable from Adviser | 44,175 | 36,012 | 159,654 | 8,777 | 22,287 | |||||||||||||||
| Tax reclaim receivable | – | 284,121 | – | 276,993 | 25,651 | |||||||||||||||
| Securities lending income receivable | – | – | – | 24,615 | – | |||||||||||||||
| Prepaid expenses | 42,269 | – | 243,470 | 37,520 | 30,998 | |||||||||||||||
| Total assets | 88,336,495 | 129,035,578 | 4,981,136,500 | 217,336,175 | 31,158,154 | |||||||||||||||
| Liabilities: | ||||||||||||||||||||
| Payable for investments purchased | – | 347,560 | 24,025,109 | – | 141,345 | |||||||||||||||
| Unrealized depreciation on forward foreign currency exchange contracts | – | 2,014 | – | – | – | |||||||||||||||
| Payable for capital shares redeemed | 93,949 | 284,706 | 3,201,971 | 118,746 | 51,476 | |||||||||||||||
| Accrued foreign capital gains tax | – | – | 24,636,258 | 477,211 | 10,042 | |||||||||||||||
| Accrued expenses and other payables: | ||||||||||||||||||||
| Investment advisory fees | 62,186 | 107,556 | 3,903,140 | 146,574 | 22,995 | |||||||||||||||
| Custodian fees | 26,839 | 57,212 | 2,020,776 | 56,895 | 24,742 | |||||||||||||||
| Sub-transfer agent and administrative services fees | 10,803 | 7,396 | 607,921 | 16,784 | 1,760 | |||||||||||||||
| Interest expense on line of credit | – | – | – | – | 110 | |||||||||||||||
| Printing fees | 10,428 | – | 358,257 | 17,287 | 4,483 | |||||||||||||||
| Administration fees | 5,853 | 7,877 | 346,946 | 14,657 | 2,044 | |||||||||||||||
| Fund accounting fees | 3,365 | 6,509 | 262,315 | 11,952 | 1,536 | |||||||||||||||
| Distribution fees | 8,865 | 849 | 90,461 | 8,626 | 6,300 | |||||||||||||||
| Transfer agent fees | 6,956 | 6,452 | 68,430 | 18,878 | 8,809 | |||||||||||||||
| Audit fees | 8,230 | 8,370 | 8,230 | 8,230 | 8,230 | |||||||||||||||
| Legal fees | 352 | 552 | 24,085 | 888 | 138 | |||||||||||||||
| Other accrued expenses | 25,211 | 46,498 | 129,682 | 39,814 | 36,146 | |||||||||||||||
| Total liabilities | 263,037 | 883,551 | 59,683,581 | 936,542 | 320,156 | |||||||||||||||
| Net Assets | $ | 88,073,458 | $ | 128,152,027 | $ | 4,921,452,919 | $ | 216,399,633 | $ | 30,837,998 | ||||||||||
| Cost: | ||||||||||||||||||||
| Investments | $ | 86,057,916 | $ | 92,152,803 | $ | 3,704,153,516 | $ | 200,615,929 | $ | 19,492,558 | ||||||||||
| Short-term investment | 1,993,668 | 2,493,808 | 6,077,284 | 924,957 | 1,051,627 | |||||||||||||||
| Foreign currency | 484 | – | 1,971,703 | 1,123,647 | 3,424 | |||||||||||||||
| Represented by: | ||||||||||||||||||||
| Capital | $ | 85,762,688 | $ | 94,630,409 | $ | 3,265,885,293 | $ | 163,335,028 | $ | 21,076,735 | ||||||||||
| Distributable earnings | 2,310,770 | 33,521,618 | 1,655,567,626 | 53,064,605 | 9,761,263 | |||||||||||||||
| Net Assets | $ | 88,073,458 | $ | 128,152,027 | $ | 4,921,452,919 | $ | 216,399,633 | $ | 30,837,998 | ||||||||||
| Net Assets: | ||||||||||||||||||||
| Class A Shares | $ | 18,475,872 | $ | 4,986,131 | $ | 116,267,710 | $ | 23,898,254 | $ | 27,814,314 | ||||||||||
| Class C Shares | 3,781,649 | – | 10,661,878 | 1,159,233 | 194,902 | |||||||||||||||
| Class R Shares | 4,557,361 | – | 133,696,058 | 6,125,935 | 903,101 | |||||||||||||||
| Institutional Service Class Shares | 958,912 | – | 476,046,165 | 94,132,297 | 342,615 | |||||||||||||||
| Institutional Class Shares | 60,299,664 | 123,165,896 | 4,184,781,108 | 91,083,914 | 1,583,066 | |||||||||||||||
| Total | $ | 88,073,458 | $ | 128,152,027 | $ | 4,921,452,919 | $ | 216,399,633 | $ | 30,837,998 | ||||||||||
Amounts listed as "–" are $0 or round to $0.
See accompanying Notes to Financial Statements.
| 76 | 2021 Annual Report |
Statements of Assets and Liabilities (concluded)
October 31, 2021
| Aberdeen China A Share Equity Fund | Aberdeen Dynamic Dividend Fund | Aberdeen Emerging Markets Fund | Aberdeen Emerging Markets Sustainable Leaders Fund | Aberdeen Global Equity Fund | ||||||||||||||||
| Shares Outstanding (unlimited number of shares authorized): | ||||||||||||||||||||
| Class A Shares | 489,310 | 1,052,354 | 5,770,025 | 1,269,428 | 1,530,707 | |||||||||||||||
| Class C Shares (a) | 106,280 | – | 535,687 | 65,953 | 11,625 | |||||||||||||||
| Class R Shares | 124,156 | – | 6,722,971 | 342,747 | 52,531 | |||||||||||||||
| Institutional Service Class Shares | 25,199 | – | 23,497,687 | 4,890,694 | 18,530 | |||||||||||||||
| Institutional Class Shares | 1,576,697 | 25,981,699 | 205,766,985 | 4,709,732 | 86,646 | |||||||||||||||
| Total | 2,321,642 | 27,034,053 | 242,293,355 | 11,278,554 | 1,700,039 | |||||||||||||||
| Net Asset Value and Redemption Price Per Share (Net assets by class divided by shares outstanding by class, respectively): | ||||||||||||||||||||
| Class A Shares | $ | 37.76 | $ | 4.74 | $ | 20.15 | $ | 18.83 | $ | 18.17 | ||||||||||
| Class C Shares (a) | $ | 35.58 | $ | – | $ | 19.90 | $ | 17.58 | $ | 16.77 | ||||||||||
| Class R Shares | $ | 36.71 | $ | – | $ | 19.89 | $ | 17.87 | $ | 17.19 | ||||||||||
| Institutional Service Class Shares | $ | 38.05 | $ | – | $ | 20.26 | $ | 19.25 | $ | 18.49 | ||||||||||
| Institutional Class Shares | $ | 38.24 | $ | 4.74 | $ | 20.34 | $ | 19.34 | $ | 18.27 | ||||||||||
| Maximum Offering Price Per Share (100%/(100% – maximum sales charge) of net asset value adjusted to the nearest cent): | ||||||||||||||||||||
| Class A Shares | $ | 40.06 | $ | 5.03 | $ | 21.38 | $ | 19.98 | $ | 19.28 | ||||||||||
| Maximum Sales Charge: | ||||||||||||||||||||
| Class A Shares | 5.75 | % | 5.75 | % | 5.75 | % | 5.75 | % | 5.75 | % | ||||||||||
(a) For Class C Shares, the redemption price per share is reduced by 1.00% for shares held less than one year.
Amounts listed as "–" are $0 or round to $0.
See accompanying Notes to Financial Statements.
| 2021 Annual Report | 77 |
Statements of Assets and Liabilities
October 31, 2021
| Aberdeen Global Infrastructure Fund | Aberdeen International Real Estate Equity Fund | Aberdeen International Small Cap Fund | Aberdeen Realty Income & Growth Fund | Aberdeen U.S. Small Cap Equity Fund | ||||||||||||||||
| Assets: | ||||||||||||||||||||
| Investments, at value | $ | 57,102,695 | $ | 20,302,693 | $ | 295,632,531 | $ | 57,566,817 | $ | 1,144,681,693 | ||||||||||
| Short-term investments, at value | 1,243,937 | 705,270 | 17,948,165 | 13,882 | 46,804,726 | |||||||||||||||
| Foreign currency, at value | – | 154,582 | – | – | – | |||||||||||||||
| Receivable for investments sold | – | 70,528 | – | 194,133 | 9,461,715 | |||||||||||||||
| Receivable for capital shares issued | 7,073 | – | 778,958 | 1,100 | 1,178,594 | |||||||||||||||
| Interest and dividends receivable | 38,494 | 87,430 | 93,832 | 16,938 | 138,903 | |||||||||||||||
| Receivable from Adviser | 30,645 | 14,944 | 37,431 | 22,539 | 74,857 | |||||||||||||||
| Tax reclaim receivable | 18,966 | 19,079 | 57,590 | – | – | |||||||||||||||
| Securities lending income receivable | 82 | – | – | – | – | |||||||||||||||
| Prepaid expenses | – | – | 39,770 | – | 67,951 | |||||||||||||||
| Total assets | 58,441,892 | 21,354,526 | 314,588,277 | 57,815,409 | 1,202,408,439 | |||||||||||||||
| Liabilities: | ||||||||||||||||||||
| Payable for investments purchased | – | 31,094 | 7,177,767 | – | 4,440,524 | |||||||||||||||
| Unrealized depreciation on forward foreign currency exchange contracts | 1,279 | – | – | – | – | |||||||||||||||
| Payable for capital shares redeemed | 4,866 | 20 | 102,693 | 17,689 | 761,854 | |||||||||||||||
| Accrued foreign capital gains tax | – | – | 124,945 | – | – | |||||||||||||||
| Accrued expenses and other payables: | ||||||||||||||||||||
| Investment advisory fees | 41,676 | 17,938 | 196,689 | 47,746 | 797,952 | |||||||||||||||
| Custodian fees | 26,771 | 45,013 | 70,085 | 16,480 | 39,992 | |||||||||||||||
| Printing fees | – | – | 25,405 | – | 144,128 | |||||||||||||||
| Interest expense on line of credit | – | 96 | – | 11,067 | – | |||||||||||||||
| Sub-transfer agent and administrative services fees | 4,015 | 2,399 | 21,323 | 3,495 | 98,477 | |||||||||||||||
| Administration fees | 3,562 | 857 | 20,074 | 3,119 | 78,521 | |||||||||||||||
| Distribution fees | 1,775 | 154 | 24,956 | 1,210 | 74,271 | |||||||||||||||
| Fund accounting fees | 3,119 | 1,278 | 10,437 | 2,808 | 50,940 | |||||||||||||||
| Transfer agent fees | 3,693 | 3,107 | 14,553 | 3,568 | 28,552 | |||||||||||||||
| Audit fees | 8,620 | 9,150 | 8,230 | 9,150 | 8,230 | |||||||||||||||
| Legal fees | 250 | 93 | 1,528 | 249 | 5,397 | |||||||||||||||
| Other accrued expenses | 38,788 | 44,265 | 42,447 | 15,410 | 32,509 | |||||||||||||||
| Total liabilities | 138,414 | 155,464 | 7,841,132 | 131,991 | 6,561,347 | |||||||||||||||
| Net Assets | $ | 58,303,478 | $ | 21,199,062 | $ | 306,747,145 | $ | 57,683,418 | $ | 1,195,847,092 | ||||||||||
| Cost: | ||||||||||||||||||||
| Investments | $ | 45,066,085 | $ | 30,720,286 | $ | 221,578,861 | $ | 37,064,211 | $ | 916,722,775 | ||||||||||
| Short-term investment | 1,243,937 | 705,270 | 17,948,165 | 13,882 | 46,804,726 | |||||||||||||||
| Foreign currency | – | 154,469 | – | – | – | |||||||||||||||
| Represented by: | ||||||||||||||||||||
| Capital | $ | 45,758,268 | $ | 104,004,157 | $ | 211,093,335 | $ | 30,060,103 | $ | 749,272,326 | ||||||||||
| Distributable earnings (accumulated loss) | 12,545,210 | (82,805,095 | ) | 95,653,810 | 27,623,315 | 446,574,766 | ||||||||||||||
| Net Assets | $ | 58,303,478 | $ | 21,199,062 | $ | 306,747,145 | $ | 57,683,418 | $ | 1,195,847,092 | ||||||||||
| Net Assets: | ||||||||||||||||||||
| Class A Shares | $ | 13,227,244 | $ | 39,107 | $ | 112,408,367 | $ | 1,090,112 | $ | 172,962,715 | ||||||||||
| Class C Shares | – | – | 560,665 | – | 44,294,838 | |||||||||||||||
| Class R Shares | – | – | 2,534,549 | – | 5,407,694 | |||||||||||||||
| Institutional Service Class Shares | – | – | – | – | 41,568,062 | |||||||||||||||
| Institutional Class Shares | 45,076,234 | 21,159,955 | 191,243,564 | 56,593,306 | 931,613,783 | |||||||||||||||
| Total | $ | 58,303,478 | $ | 21,199,062 | $ | 306,747,145 | $ | 57,683,418 | $ | 1,195,847,092 | ||||||||||
Amounts listed as "–" are $0 or round to $0.
See accompanying Notes to Financial Statements.
| 78 | 2021 Annual Report |
Statements of Assets and Liabilities (concluded)
October 31, 2021
| Aberdeen Global Infrastructure Fund | Aberdeen International Real Estate Equity Fund | Aberdeen International Small Cap Fund | Aberdeen Realty Income & Growth Fund | Aberdeen U.S. Small Cap Equity Fund | ||||||||||||||||
| Shares Outstanding (unlimited number of shares authorized): | ||||||||||||||||||||
| Class A Shares | 547,080 | 1,897 | 2,630,372 | 69,529 | 3,489,182 | |||||||||||||||
| Class C Shares (a) | – | – | 14,673 | – | 1,113,129 | |||||||||||||||
| Class R Shares | – | – | 63,413 | – | 122,710 | |||||||||||||||
| Institutional Service Class Shares | – | – | – | – | 774,770 | |||||||||||||||
| Institutional Class Shares | 1,861,201 | 1,032,535 | 4,431,985 | 3,595,916 | 17,331,734 | |||||||||||||||
| Total | 2,408,281 | 1,034,432 | 7,140,443 | 3,665,445 | 22,831,525 | |||||||||||||||
| Net Asset Value and Redemption Price Per Share (Net assets by class divided by shares outstanding by class, respectively): | ||||||||||||||||||||
| Class A Shares | $ | 24.18 | $ | 20.62 | $ | 42.73 | $ | 15.68 | $ | 49.57 | ||||||||||
| Class C Shares (a) | $ | – | $ | – | $ | 38.21 | $ | – | $ | 39.79 | ||||||||||
| Class R Shares | $ | – | $ | – | $ | 39.97 | $ | – | $ | 44.07 | ||||||||||
| Institutional Service Class Shares | $ | – | $ | – | $ | – | $ | – | $ | 53.65 | ||||||||||
| Institutional Class Shares | $ | 24.22 | $ | 20.49 | $ | 43.15 | $ | 15.74 | $ | 53.75 | ||||||||||
| Maximum Offering Price Per Share (100%/(100% – maximum sales charge) of net asset value adjusted to the nearest cent): | ||||||||||||||||||||
| Class A Shares | $ | 25.66 | $ | 21.88 | $ | 45.34 | $ | 16.64 | $ | 52.59 | ||||||||||
| Maximum Sales Charge: | ||||||||||||||||||||
| Class A Shares | 5.75 | % | 5.75 | % | 5.75 | % | 5.75 | % | 5.75 | % | ||||||||||
(a) For Class C Shares, the redemption price per share is reduced by 1.00% for shares held less than one year.
Amounts listed as "–" are $0 or round to $0.
See accompanying Notes to Financial Statements.
| 2021 Annual Report | 79 |
Statements of Assets and Liabilities
October 31, 2021
| Aberdeen U.S. Sustainable Leaders Fund | Aberdeen U.S. Sustainable Leaders Smaller Companies Fund | |||||||
| Assets: | ||||||||
| Investments, at value | $ | 506,506,606 | $ | 18,972,296 | ||||
| Short-term investments, at value | 13,728,502 | 428,743 | ||||||
| Interest and dividends receivable | 116,669 | 8 | ||||||
| Receivable for capital shares issued | 880 | 64,251 | ||||||
| Receivable from Adviser | 12,249 | 23,485 | ||||||
| Prepaid expenses | 50,704 | 23,100 | ||||||
| Total assets | 520,415,610 | 19,511,883 | ||||||
| Liabilities: | ||||||||
| Payable for capital shares redeemed | 343,605 | 15,796 | ||||||
| Accrued expenses and other payables: | ||||||||
| Investment advisory fees | 320,716 | 11,649 | ||||||
| Distribution fees | 71,331 | 3,747 | ||||||
| Custodian fees | 24,904 | 16,289 | ||||||
| Administration fees | 34,241 | 1,243 | ||||||
| Transfer agent fees | 28,379 | 5,679 | ||||||
| Fund accounting fees | 24,069 | 860 | ||||||
| Sub-transfer agent and administrative services fees | 22,074 | 1,322 | ||||||
| Audit fees | 8,230 | 8,230 | ||||||
| Printing fees | 10,461 | 1,854 | ||||||
| Legal fees | 2,366 | 90 | ||||||
| Other accrued expenses | 24,629 | 19,266 | ||||||
| Total liabilities | 915,005 | 86,025 | ||||||
| Net Assets | $ | 519,500,605 | $ | 19,425,858 | ||||
| Cost: | ||||||||
| Investments | $ | 389,473,644 | $ | 15,641,439 | ||||
| Short-term investment | 13,728,502 | 428,743 | ||||||
| Represented by: | ||||||||
| Capital | $ | 275,985,809 | $ | 10,879,042 | ||||
| Distributable earnings | 243,514,796 | 8,546,816 | ||||||
| Net Assets | $ | 519,500,605 | $ | 19,425,858 | ||||
| Net Assets: | ||||||||
| Class A Shares | $ | 345,638,060 | $ | 10,031,866 | ||||
| Class C Shares | 328,784 | 633,100 | ||||||
| Class R Shares | – | 3,070,981 | ||||||
| Institutional Service Class Shares | 158,580,827 | 159,126 | ||||||
| Institutional Class Shares | 14,952,934 | 5,530,785 | ||||||
| Total | $ | 519,500,605 | $ | 19,425,858 | ||||
Amounts listed as "–" are $0 or round to $0.
See accompanying Notes to Financial Statements.
| 80 | 2021 Annual Report |
Statements of Assets and Liabilities (concluded)
October 31, 2021
| Aberdeen U.S. Sustainable Leaders Fund | Aberdeen U.S. Sustainable Leaders Smaller Companies Fund | |||||||
| Shares Outstanding (unlimited number of shares authorized): | ||||||||
| Class A Shares | 19,953,173 | 904,661 | ||||||
| Class C Shares | 23,880 | 418,688 | ||||||
| Class R Shares | – | 321,785 | ||||||
| Institutional Service Class Shares | 8,384,228 | 13,618 | ||||||
| Institutional Class Shares | 785,927 | 453,049 | ||||||
| Total | 29,147,208 | 2,111,801 | ||||||
| Net Asset Value and Redemption Price Per Share (Net assets by class divided by shares outstanding by class, respectively): | ||||||||
| Class A Shares | $ | 17.32 | $ | 11.09 | ||||
| Class C Shares (a) | $ | 13.77 | $ | 1.51 | ||||
| Class R Shares | $ | – | $ | 9.54 | ||||
| Institutional Service Class Shares | $ | 18.91 | $ | 11.68 | ||||
| Institutional Class Shares | $ | 19.03 | $ | 12.21 | ||||
| Maximum Offering Price Per Share (100%/(100% – maximum sales charge) of net asset value adjusted to the nearest cent): | ||||||||
| Class A Shares | $ | 18.38 | $ | 11.77 | ||||
| Maximum Sales Charge: | ||||||||
| Class A Shares | 5.75 | % | 5.75 | % | ||||
(a) For Class C Shares, the redemption price per share is reduced by 1.00% for shares held less than one year.
Amounts listed as "–" are $0 or round to $0.
See accompanying Notes to Financial Statements.
| 2021 Annual Report | 81 |
Statements of Operations
For the Year Ended October 31, 2021
| Aberdeen China A Share Equity Fund | Aberdeen Dynamic Dividend Fund | Aberdeen Emerging Markets Fund | Aberdeen Emerging Markets Sustainable Leaders Fund | Aberdeen Global Equity Fund | ||||||||||||||||
| INVESTMENT INCOME: | ||||||||||||||||||||
| Dividend income | $ | 1,027,991 | $ | 8,610,273 | $ | 105,766,931 | $ | 4,004,274 | $ | 369,067 | ||||||||||
| Interest income | 918 | 368 | 28,641 | 524 | 99 | |||||||||||||||
| Securities lending income, net | 35,044 | – | 1,468 | 47,266 | – | |||||||||||||||
| Foreign tax withholding | (103,759 | ) | (428,375 | ) | (12,292,736 | ) | (524,383 | ) | (19,798 | ) | ||||||||||
| Total Income | 960,194 | 8,182,266 | 93,504,304 | 3,527,681 | 349,368 | |||||||||||||||
| EXPENSES: | ||||||||||||||||||||
| Investment advisory fees | 667,889 | 1,256,000 | 47,131,314 | 1,799,302 | 267,569 | |||||||||||||||
| Trustee fees | 4,950 | 8,554 | 355,924 | 15,373 | 2,028 | |||||||||||||||
| Administration fees | 62,860 | 100,480 | 4,189,450 | 179,930 | 23,784 | |||||||||||||||
| Legal fees | 6,088 | 8,233 | 362,853 | 14,601 | 2,295 | |||||||||||||||
| Audit fees | 37,749 | 47,055 | 39,846 | 40,749 | 37,749 | |||||||||||||||
| Printing fees | 20,348 | 22,247 | 448,482 | 52,005 | 15,008 | |||||||||||||||
| Custodian fees | 26,108 | 76,833 | 1,518,401 | 54,407 | 31,372 | |||||||||||||||
| Transfer agent fees | 37,250 | 47,743 | 679,271 | 144,545 | 58,650 | |||||||||||||||
| Distribution fees Class A | 44,222 | 12,339 | 309,172 | 62,086 | 66,819 | |||||||||||||||
| Distribution fees Class C | 33,392 | – | 128,574 | 20,695 | 2,069 | |||||||||||||||
| Distribution fees Class R | 25,395 | – | 673,744 | 25,853 | 4,710 | |||||||||||||||
| Sub-transfer agent and administrative service fees Institutional Class | 39,961 | 77,869 | 3,555,804 | 51,599 | 762 | |||||||||||||||
| Sub-transfer agent and administrative service fees Class A | 14,567 | 3,732 | 309,172 | 30,069 | 23,335 | |||||||||||||||
| Sub-transfer agent and administrative service fees Class C | 2,733 | – | 8,986 | 2,342 | 420 | |||||||||||||||
| Sub-transfer agent and administrative service fees Class R | 7,862 | – | 216,385 | 7,336 | 1,717 | |||||||||||||||
| Sub-transfer agent and administrative service fees Institutional Service Class | 826 | – | 682,335 | 63,077 | 312 | |||||||||||||||
| Fund accounting fees | 3,143 | 5,024 | 209,473 | 8,996 | 1,189 | |||||||||||||||
| Registration and filing fees | 80,122 | 33,321 | 145,910 | 67,337 | 64,720 | |||||||||||||||
| Other | 33,592 | 65,372 | 483,548 | 79,545 | 39,984 | |||||||||||||||
| Total expenses before reimbursed/waived expenses | 1,149,057 | 1,764,802 | 61,448,644 | 2,719,847 | 644,492 | |||||||||||||||
| Interest expense (Note 9) | 1,119 | – | 16,807 | 2,491 | – | |||||||||||||||
| Total operating expenses before reimbursed/waived expenses | 1,150,176 | 1,764,802 | 61,465,451 | 2,722,338 | 644,492 | |||||||||||||||
| Expenses reimbursed | (244,894 | ) | (180,278 | ) | (1,800,053 | ) | (38,869 | ) | (191,740 | ) | ||||||||||
| Net expenses | 905,282 | 1,584,524 | 59,665,398 | 2,683,469 | 452,752 | |||||||||||||||
| Net Investment Income/(Loss) | 54,912 | 6,597,742 | 33,838,906 | 844,212 | (103,384 | ) | ||||||||||||||
| REALIZED/UNREALIZED GAIN/(LOSS) FROM INVESTMENTS: | ||||||||||||||||||||
| Realized gain on investment transactions | 2,216,311 | 5,234,828 | 546,209,421 | 72,946,886 | 4,490,544 | |||||||||||||||
| Realized gain/(loss) on forward foreign currency exchange contracts | – | 58,319 | – | – | – | |||||||||||||||
| Realized gain/(loss) on foreign currency transactions | (12,010 | ) | 32,103 | (2,039,099 | ) | (768,291 | ) | (2,265 | ) | |||||||||||
| Net realized gain from investments and foreign currency transactions | 2,204,301 | 5,325,250 | 544,170,322 | 72,178,595 | 4,488,279 | |||||||||||||||
| Net change in unrealized appreciation/(depreciation) on investment transactions (including $0, $0, $15,226,145, $477,211, $10,042 change in deferred capital gains tax, respectively) | (3,859,461 | ) | 24,052,604 | 252,694,941 | (33,781,884 | ) | 4,730,374 | |||||||||||||
| Net change in unrealized appreciation/(depreciation) on forward foreign currency exchange rate contracts | – | (24,588 | ) | – | – | – | ||||||||||||||
| Net change in unrealized appreciation/(depreciation) on translation of assets and liabilities denominated in foreign currencies | 951 | (15,099 | ) | (31,153 | ) | (15,789 | ) | (1,741 | ) | |||||||||||
| Net change in unrealized appreciation/(depreciation) from investments and translation of assets and liabilities denominated in foreign currencies | (3,858,510 | ) | 24,012,917 | 252,663,788 | (33,797,673 | ) | 4,728,633 | |||||||||||||
| Net realized/unrealized gain/(loss) from investments and foreign currency transactions | (1,654,209 | ) | 29,338,167 | 796,834,110 | 38,380,922 | 9,216,912 | ||||||||||||||
| CHANGE IN NET ASSETS RESULTING FROM OPERATIONS | $ | (1,599,297 | ) | $ | 35,935,909 | $ | 830,673,016 | $ | 39,225,134 | $ | 9,113,528 | |||||||||
Amounts listed as "–" are $0 or round to $0.
See accompanying Notes to Financial Statements.
| 82 | 2021 Annual Report |
Statements of Operations (continued)
For the Year Ended October 31, 2021
| Aberdeen Global Infrastructure Fund | Aberdeen International Real Estate Equity Fund | Aberdeen International Small Cap Fund | Aberdeen Realty Income & Growth Fund | Aberdeen U.S. Small Cap Equity Fund | ||||||||||||||||
| INVESTMENT INCOME: | ||||||||||||||||||||
| Dividend income | $ | 1,789,610 | $ | 775,878 | $ | 2,005,794 | $ | 1,071,135 | $ | 8,112,531 | ||||||||||
| Interest income | 322 | 126 | 1,289 | 45 | 7,094 | |||||||||||||||
| Securities lending income, net | 2,635 | – | – | 31 | 25,111 | |||||||||||||||
| Foreign tax withholding | (92,412 | ) | (28,894 | ) | (224,756 | ) | – | (126,533 | ) | |||||||||||
| Total Income | 1,700,155 | 747,110 | 1,782,327 | 1,071,211 | 8,018,203 | |||||||||||||||
| EXPENSES: | ||||||||||||||||||||
| Investment advisory fees | 447,783 | 222,476 | 1,727,393 | 530,610 | 8,327,634 | |||||||||||||||
| Trustee fees | 3,562 | 1,724 | 14,519 | 3,656 | 68,976 | |||||||||||||||
| Administration fees | 42,144 | 17,798 | 173,588 | 42,449 | 817,763 | |||||||||||||||
| Legal fees | 2,939 | 2,213 | 15,631 | 8,891 | 71,587 | |||||||||||||||
| Audit fees | 41,510 | 40,410 | 39,840 | 39,380 | 37,749 | |||||||||||||||
| Printing fees | 16,486 | 9,113 | 41,061 | 8,926 | 169,778 | |||||||||||||||
| Custodian fees | 40,181 | 47,480 | 65,873 | 18,038 | 38,932 | |||||||||||||||
| Transfer agent fees | 26,917 | 23,959 | 103,040 | 27,209 | 199,782 | |||||||||||||||
| Distribution fees Class A | 29,284 | 83 | 249,169 | 2,711 | 393,338 | |||||||||||||||
| Distribution fees Class C | – | – | 6,261 | – | 430,598 | |||||||||||||||
| Distribution fees Class R | – | – | 11,002 | – | 22,495 | |||||||||||||||
| Sub-transfer agent and administrative service fees Institutional Class | 32,680 | 27,333 | 104,268 | 36,926 | 693,608 | |||||||||||||||
| Sub-transfer agent and administrative service fees Class A | 8,605 | 83 | 101,944 | 717 | 196,754 | |||||||||||||||
| Sub-transfer agent and administrative service fees Class C | – | – | 707 | – | 38,021 | |||||||||||||||
| Sub-transfer agent and administrative service fees Class R | – | – | 2,959 | – | 7,209 | |||||||||||||||
| Sub-transfer agent and administrative service fees Institutional Service Class | – | – | – | – | 50,126 | |||||||||||||||
| Fund accounting fees | 2,107 | 890 | 8,679 | 2,123 | 40,888 | |||||||||||||||
| Registration and filing fees | 31,789 | 34,186 | 59,982 | 31,885 | 85,400 | |||||||||||||||
| Other | 32,366 | 33,430 | 55,592 | 25,270 | 103,309 | |||||||||||||||
| Interest expense (Note 9) | – | 267 | 178 | 2,239 | – | |||||||||||||||
| Total operating expenses before reimbursed/waived expenses | 758,353 | 461,445 | 2,781,686 | 781,030 | 11,793,947 | |||||||||||||||
| Expenses reimbursed | (207,420 | ) | (156,298 | ) | (261,986 | ) | (245,459 | ) | (604,829 | ) | ||||||||||
| Net expenses | 550,933 | 305,147 | 2,519,700 | 535,571 | 11,189,118 | |||||||||||||||
| Net Investment Income/(Loss) | 1,149,222 | 441,963 | (737,373 | ) | 535,640 | (3,107,915 | ) | |||||||||||||
| REALIZED/UNREALIZED GAIN/(LOSS) FROM INVESTMENTS: | ||||||||||||||||||||
| Realized gain on investment transactions | 2,323,746 | 1,192,675 | 24,042,060 | 7,737,328 | 254,304,793 | |||||||||||||||
| Realized gain/(loss) on forward foreign currency exchange contracts | 8,290 | (4,293 | ) | – | – | – | ||||||||||||||
| Realized gain/(loss) on foreign currency transactions | (16,047 | ) | (113 | ) | 11,631 | – | 55,094 | |||||||||||||
| Net realized gain from investments and foreign currency transactions | 2,315,989 | 1,188,269 | 24,053,691 | 7,737,328 | 254,359,887 | |||||||||||||||
| Net change in unrealized appreciation/(depreciation) on investment transactions (including $0, $0, $102,739, $0 and $0 change in deferred capital gains tax, respectively) | 9,547,025 | 2,065,110 | 45,447,484 | 10,847,684 | 172,319,750 | |||||||||||||||
| Net change in unrealized appreciation/(depreciation) on forward foreign currency exchange rate contracts | (1,121 | ) | – | – | – | – | ||||||||||||||
| Net change in unrealized appreciation/(depreciation) on translation of assets and liabilities denominated in foreign currencies | 1,220 | (313 | ) | (3,432 | ) | – | 335 | |||||||||||||
| Net change in unrealized appreciation/(depreciation) from investments and translation of assets and liabilities denominated in foreign currencies | 9,547,124 | 2,064,797 | 45,444,052 | 10,847,684 | 172,320,085 | |||||||||||||||
| Net realized/unrealized gain from investments and foreign currency transactions | 11,863,113 | 3,253,066 | 69,497,743 | 18,585,012 | 426,679,972 | |||||||||||||||
| CHANGE IN NET ASSETS RESULTING FROM OPERATIONS | $ | 13,012,335 | $ | 3,695,029 | $ | 68,760,370 | $ | 19,120,652 | $ | 423,509,057 | ||||||||||
Amounts listed as "–" are $0 or round to $0.
See accompanying Notes to Financial Statements.
| 2021 Annual Report | 83 |
Statements of Operations (concluded)
For the Year Ended October 31, 2021
| Aberdeen U.S. Sustainable Leaders Fund | Aberdeen U.S. Sustainable Leaders Smaller Companies Fund | |||||||
| INVESTMENT INCOME: | ||||||||
| Dividend income | $ | 4,081,529 | $ | 129,006 | ||||
| Interest income | 1,489 | 90 | ||||||
| Securities lending income, net | 649 | 74 | ||||||
| Foreign tax withholding | (104,340 | ) | (3,708 | ) | ||||
| Total Income | 3,979,327 | 125,462 | ||||||
| EXPENSES: | ||||||||
| Investment advisory fees | 3,487,972 | 122,196 | ||||||
| Trustee fees | 31,525 | 1,133 | ||||||
| Administration fees | 372,121 | 13,034 | ||||||
| Legal fees | 34,016 | 1,220 | ||||||
| Audit fees | 39,704 | 43,886 | ||||||
| Printing fees | 53,514 | 23,751 | ||||||
| Custodian fees | 23,091 | 20,402 | ||||||
| Transfer agent fees | 222,289 | 30,613 | ||||||
| Distribution fees Class A | 771,755 | 21,991 | ||||||
| Distribution fees Class C | 7,257 | 5,279 | ||||||
| Distribution fees Class R | – | 12,455 | ||||||
| Sub-transfer agent and administrative service fees Class A | 121,351 | 5,874 | ||||||
| Sub-transfer agent and administrative service fees Institutional Class | 7,560 | 5,604 | ||||||
| Sub-transfer agent and administrative service fees Class C | 912 | 300 | ||||||
| Sub-transfer agent and administrative service fees Class R | – | 3,715 | ||||||
| Sub-transfer agent and administrative service fees Institutional Service Class | 94,063 | 328 | ||||||
| Fund accounting fees | 18,606 | 652 | ||||||
| Registration and filing fees | 55,307 | 65,517 | ||||||
| Other | 56,786 | 20,926 | ||||||
| Interest expense (Note 9) | – | 8 | ||||||
| Total operating expenses before reimbursed/waived expenses | 5,397,829 | 398,884 | ||||||
| Expenses reimbursed | (216,967 | ) | (202,597 | ) | ||||
| Net expenses | 5,180,862 | 196,287 | ||||||
| Net Investment Loss | (1,201,535 | ) | (70,825 | ) | ||||
| REALIZED/UNREALIZED GAIN/(LOSS) FROM INVESTMENTS: | ||||||||
| Realized gain on investment transactions | 131,981,514 | 6,100,031 | ||||||
| Realized gain/(loss) on foreign currency transactions | (56,200 | ) | 1,880 | |||||
| Net realized gain from investments and foreign currency transactions | 131,925,314 | 6,101,911 | ||||||
| Net change in unrealized appreciation/(depreciation) on investment transactions | 27,391,542 | 813,341 | ||||||
| Net change in unrealized appreciation/(depreciation) from investments and translation of assets and liabilities denominated in foreign currencies | 27,391,542 | 813,341 | ||||||
| Net realized/unrealized gain from investments and foreign currency transactions | 159,316,856 | 6,915,252 | ||||||
| CHANGE IN NET ASSETS RESULTING FROM OPERATIONS | $ | 158,115,321 | $ | 6,844,427 | ||||
Amounts listed as "–" are $0 or round to $0.
See accompanying Notes to Financial Statements.
| 84 | 2021 Annual Report |
Statements of Changes in Net Assets
| Aberdeen China A Share Equity Fund | Aberdeen Dynamic Dividend Fund | Aberdeen Emerging Markets Fund | ||||||||||||||||||||||
| Year Ended October 31, 2021 | Year Ended October 31, 2020 | Year Ended October 31, 2021 | Year Ended October 31, 2020 | Year Ended October 31, 2021 | Year Ended October 31, 2020 | |||||||||||||||||||
| FROM INVESTMENT ACTIVITIES: | ||||||||||||||||||||||||
| Operations: | ||||||||||||||||||||||||
| Net investment income | $ | 54,912 | $ | 24,580 | $ | 6,597,742 | $ | 6,149,688 | $ | 33,838,906 | $ | 23,274,353 | ||||||||||||
| Net realized gain/(loss) from investments and foreign currency transactions | 2,204,301 | 384,145 | 5,325,250 | (2,337,283 | ) | 544,170,322 | 50,486,945 | |||||||||||||||||
| Net change in unrealized appreciation/ (depreciation) on investments and translation of assets and liabilities denominated in foreign currencies | (3,858,510 | ) | 3,899,201 | 24,012,917 | (5,975,683 | ) | 252,663,788 | 220,304,236 | ||||||||||||||||
| Changes in net assets resulting from operations | (1,599,297 | ) | 4,307,926 | 35,935,909 | (2,163,278 | ) | 830,673,016 | 294,065,534 | ||||||||||||||||
| Distributions to Shareholders From: | ||||||||||||||||||||||||
| Distributable earnings: | ||||||||||||||||||||||||
| Class A | (187,758 | ) | (365,061 | ) | (246,233 | ) | (254,850 | ) | (840,787 | ) | (1,951,827 | ) | ||||||||||||
| Class C | (30,331 | ) | (36,488 | ) | – | – | (95,512 | ) | (124,024 | ) | ||||||||||||||
| Class R | (60,627 | ) | (117,596 | ) | – | – | (929,422 | ) | (1,539,762 | ) | ||||||||||||||
| Institutional Service Class | (10,077 | ) | (23,077 | ) | – | – | (3,669,233 | ) | (5,613,349 | ) | ||||||||||||||
| Institutional Class | (227,834 | ) | (187,398 | ) | (6,307,092 | ) | (6,902,794 | ) | (36,648,250 | ) | (84,695,780 | ) | ||||||||||||
| Change in net assets from shareholder distributions | (516,627 | ) | (729,620 | ) | (6,553,325 | ) | (7,157,644 | ) | (42,183,204 | ) | (93,924,742 | ) | ||||||||||||
| Change in net assets from capital transactions | 69,942,065 | 2,582,964 | (5,465,206 | ) | (13,040,733 | ) | 123,609,123 | (1,167,570,408 | ) | |||||||||||||||
| Change in net assets | 67,826,141 | 6,161,270 | 23,917,378 | (22,361,655 | ) | 912,098,935 | (967,429,616 | ) | ||||||||||||||||
| Net Assets: | ||||||||||||||||||||||||
| Beginning of year | 20,247,317 | 14,086,047 | 104,234,649 | 126,596,304 | 4,009,353,984 | 4,976,783,600 | ||||||||||||||||||
| End of year | $ | 88,073,458 | $ | 20,247,317 | $ | 128,152,027 | $ | 104,234,649 | $ | 4,921,452,919 | $ | 4,009,353,984 | ||||||||||||
Amounts listed as "–" are $0 or round to $0.
See accompanying Notes to Financial Statements.
| 2021 Annual Report | 85 |
Statements of Changes in Net Assets (continued)
| Aberdeen China A Share Equity Fund | Aberdeen Dynamic Dividend Fund | Aberdeen Emerging Markets Fund | ||||||||||||||||||||||
| Year Ended October 31, 2021 | Year Ended October 31, 2020 | Year Ended October 31, 2021 | Year Ended October 31, 2020 | Year Ended October 31, 2021 | Year Ended October 31, 2020 | |||||||||||||||||||
| CAPITAL TRANSACTIONS: | ||||||||||||||||||||||||
| Class A Shares | ||||||||||||||||||||||||
| Proceeds from shares issued | $ | 13,943,316 | $ | 2,357,438 | $ | 533,059 | $ | 1,102,207 | $ | 44,072,988 | $ | 28,076,891 | ||||||||||||
| Dividends reinvested | 148,240 | 281,529 | 173,000 | 184,731 | 582,889 | 1,470,556 | ||||||||||||||||||
| Cost of shares redeemed | (7,236,721 | ) | (2,901,024 | ) | (731,898 | ) | (1,351,440 | ) | (57,713,958 | ) | (62,257,358 | ) | ||||||||||||
| Total Class A | 6,854,835 | (262,057 | ) | (25,839 | ) | (64,502 | ) | (13,058,081 | ) | (32,709,911 | ) | |||||||||||||
| Class C Shares | ||||||||||||||||||||||||
| Proceeds from shares issued | 4,436,043 | 338,722 | – | – | 1,441,890 | 1,701,259 | ||||||||||||||||||
| Dividends reinvested | 29,772 | 28,425 | – | – | 77,269 | 93,528 | ||||||||||||||||||
| Cost of shares redeemed | (1,132,154 | ) | (769,429 | ) | – | – | (4,997,733 | ) | (6,398,572 | ) | ||||||||||||||
| Total Class C | 3,333,661 | (402,282 | ) | – | – | (3,478,574 | ) | (4,603,785 | ) | |||||||||||||||
| Class R Shares | ||||||||||||||||||||||||
| Proceeds from shares issued | 4,143,882 | 2,291,996 | – | – | 11,577,172 | 8,471,911 | ||||||||||||||||||
| Dividends reinvested | 60,456 | 115,553 | – | – | 926,091 | 1,516,758 | ||||||||||||||||||
| Cost of shares redeemed | (3,125,168 | ) | (2,457,975 | ) | – | – | (15,143,748 | ) | (15,309,881 | ) | ||||||||||||||
| Total Class R | 1,079,170 | (50,426 | ) | – | – | (2,640,485 | ) | (5,321,212 | ) | |||||||||||||||
| Institutional Service Class Shares | ||||||||||||||||||||||||
| Proceeds from shares issued | 343,114 | 7,204 | – | – | 70,197,666 | 244,923,207 | ||||||||||||||||||
| Dividends reinvested | 10,017 | 22,310 | – | – | 3,668,031 | 5,612,010 | ||||||||||||||||||
| Cost of shares redeemed | (93,518 | ) | (88,301 | ) | – | – | (32,891,462 | ) | (213,562,876 | ) | ||||||||||||||
| Total Institutional Service Class | 259,613 | (58,787 | ) | – | – | 40,974,235 | 36,972,341 | |||||||||||||||||
| Institutional Class Shares | ||||||||||||||||||||||||
| Proceeds from shares issued | 91,638,132 | 8,980,315 | 5,950,144 | 4,802,370 | 1,310,442,243 | 549,097,142 | ||||||||||||||||||
| Dividends reinvested | 226,673 | 186,013 | 5,323,147 | 5,669,817 | 27,712,844 | 63,089,194 | ||||||||||||||||||
| Cost of shares redeemed | (33,450,019 | ) | (5,809,812 | ) | (16,712,658 | ) | (23,448,418 | ) | (1,236,343,059 | ) | (1,774,094,177 | ) | ||||||||||||
| Total Institutional Class | 58,414,786 | 3,356,516 | (5,439,367 | ) | (12,976,231 | ) | 101,812,028 | (1,161,907,841 | ) | |||||||||||||||
| Change in net assets from capital transactions: | $ | 69,942,065 | $ | 2,582,964 | $ | (5,465,206 | ) | $ | (13,040,733 | ) | $ | 123,609,123 | $ | (1,167,570,408 | ) | |||||||||
Amounts listed as "–" are $0 or round to $0.
See accompanying Notes to Financial Statements.
| 86 | 2021 Annual Report |
Statements of Changes in Net Assets (concluded)
| Aberdeen China A Share Equity Fund | Aberdeen Dynamic Dividend Fund | Aberdeen Emerging Markets Fund | ||||||||||||||||||||||
| Year Ended October 31, 2021 | Year Ended October 31, 2020 | Year Ended October 31, 2021 | Year Ended October 31, 2020 | Year Ended October 31, 2021 | Year Ended October 31, 2020 | |||||||||||||||||||
| SHARE TRANSACTIONS: | ||||||||||||||||||||||||
| Class A Shares | ||||||||||||||||||||||||
| Issued | 355,589 | 82,454 | 119,625 | 280,952 | 2,135,263 | 1,950,715 | ||||||||||||||||||
| Reinvested | 3,997 | 11,176 | 37,880 | 48,510 | 29,999 | 92,430 | ||||||||||||||||||
| Redeemed | (191,423 | ) | (111,590 | ) | (159,465 | ) | (376,261 | ) | (2,802,093 | ) | (4,417,229 | ) | ||||||||||||
| Total Class A Shares | 168,163 | (17,960 | ) | (1,960 | ) | (46,799 | ) | (636,831 | ) | (2,374,084 | ) | |||||||||||||
| Class C Shares | ||||||||||||||||||||||||
| Issued | 119,782 | 11,921 | – | – | 69,251 | 107,678 | ||||||||||||||||||
| Reinvested | 847 | 1,182 | – | – | 4,008 | 5,893 | ||||||||||||||||||
| Redeemed | (32,587 | ) | (29,096 | ) | – | – | (244,367 | ) | (435,106 | ) | ||||||||||||||
| Total Class C Shares | 88,042 | (15,993 | ) | – | – | (171,108 | ) | (321,535 | ) | |||||||||||||||
| Class R Shares | ||||||||||||||||||||||||
| Issued | 111,825 | 78,882 | – | – | 570,983 | 603,346 | ||||||||||||||||||
| Reinvested | 1,672 | 4,690 | – | – | 48,234 | 96,302 | ||||||||||||||||||
| Redeemed | (86,546 | ) | (93,279 | ) | – | – | (746,651 | ) | (1,014,731 | ) | ||||||||||||||
| Total Class R Shares | 26,951 | (9,707 | ) | – | – | (127,434 | ) | (315,083 | ) | |||||||||||||||
| Institutional Service Class Shares | ||||||||||||||||||||||||
| Issued | 8,659 | 240 | – | – | 3,428,774 | 18,091,619 | ||||||||||||||||||
| Reinvested | 268 | 882 | – | – | 188,297 | 352,513 | ||||||||||||||||||
| Redeemed | (2,452 | ) | (3,489 | ) | – | – | (1,616,390 | ) | (16,305,879 | ) | ||||||||||||||
| Total Institutional Service Class Shares | 6,475 | (2,367 | ) | – | – | 2,000,681 | 2,138,253 | |||||||||||||||||
| Institutional Class Shares | ||||||||||||||||||||||||
| Issued | 2,343,579 | 335,208 | 1,290,323 | 1,259,907 | 62,992,325 | 38,370,060 | ||||||||||||||||||
| Reinvested | 6,051 | 7,329 | 1,164,900 | 1,485,417 | 1,418,989 | 3,955,435 | ||||||||||||||||||
| Redeemed | (916,518 | ) | (250,650 | ) | (3,696,031 | ) | (6,098,779 | ) | (60,646,610 | ) | (127,492,592 | ) | ||||||||||||
| Total Institutional Class Shares | 1,433,112 | 91,887 | (1,240,808 | ) | (3,353,455 | ) | 3,764,704 | (85,167,097 | ) | |||||||||||||||
| Total change in shares: | 1,722,743 | 45,860 | (1,242,768 | ) | (3,400,254 | ) | 4,830,012 | (86,039,546 | ) | |||||||||||||||
Amounts listed as "–" are $0 or round to $0.
See accompanying Notes to Financial Statements.
| 2021 Annual Report | 87 |
Statements of Changes in Net Assets
| Aberdeen Emerging Markets Sustainable Leaders Fund | Aberdeen Global Equity Fund | Aberdeen Global Infrastructure Fund | ||||||||||||||||||||||
| Year Ended October 31, 2021 | Year Ended October 31, 2020 | Year Ended October 31, 2021 | Year Ended October 31, 2020 | Year Ended October 31, 2021 | Year Ended October 31, 2020 | |||||||||||||||||||
| FROM INVESTMENT ACTIVITIES: | ||||||||||||||||||||||||
| Operations: | ||||||||||||||||||||||||
| Net investment income/(loss) | $ | 844,212 | $ | 694,787 | $ | (103,384 | ) | $ | (17,817 | ) | $ | 1,149,222 | $ | 2,420,686 | ||||||||||
| Net realized gain/(loss) from investments and foreign currency transactions | 72,178,595 | (735,983 | ) | 4,488,279 | (96,034 | ) | 2,315,989 | (633,944 | ) | |||||||||||||||
| Net change in unrealized appreciation/ (depreciation) on investments and translation of assets and liabilities denominated in foreign currencies | (33,797,673 | ) | 17,504,289 | 4,728,633 | 1,508,899 | 9,547,124 | (9,646,398 | ) | ||||||||||||||||
| Changes in net assets resulting from operations | 39,225,134 | 17,463,093 | 9,113,528 | 1,395,048 | 13,012,335 | (7,859,656 | ) | |||||||||||||||||
| Distributions to Shareholders From: | ||||||||||||||||||||||||
| Distributable earnings: | ||||||||||||||||||||||||
| Class A | (3,298 | ) | (234,561 | ) | – | (868,962 | ) | (357,482 | ) | (378,080 | ) | |||||||||||||
| Class C | – | (2,997 | ) | – | (16,881 | ) | – | – | ||||||||||||||||
| Class R | – | (27,395 | ) | – | (41,507 | ) | – | – | ||||||||||||||||
| Institutional Service Class | (243,818 | ) | (1,139,978 | ) | – | (9,300 | ) | – | – | |||||||||||||||
| Institutional Class | (207,630 | ) | (1,343,116 | ) | – | (48,762 | ) | (1,335,765 | ) | (2,878,797 | ) | |||||||||||||
| Tax return of capital: | ||||||||||||||||||||||||
| Class A | – | – | – | – | – | (76,914 | ) | |||||||||||||||||
| Institutional Class | – | – | – | – | – | (529,317 | ) | |||||||||||||||||
| Change in net assets from shareholder distributions | (454,746 | ) | (2,748,047 | ) | – | (985,412 | ) | (1,693,247 | ) | (3,863,108 | ) | |||||||||||||
| Change in net assets from capital transactions | (39,743,964 | ) | (15,793,228 | ) | (3,492,261 | ) | (5,758,382 | ) | 5,138,930 | (46,649,052 | ) | |||||||||||||
| Change in net assets | (973,576 | ) | (1,078,182 | ) | 5,621,267 | (5,348,746 | ) | 16,458,018 | (58,371,816 | ) | ||||||||||||||
| Net Assets: | ||||||||||||||||||||||||
| Beginning of year | 217,373,209 | 218,451,391 | 25,216,731 | 30,565,477 | 41,845,460 | 100,217,276 | ||||||||||||||||||
| End of year | $ | 216,399,633 | $ | 217,373,209 | $ | 30,837,998 | $ | 25,216,731 | $ | 58,303,478 | $ | 41,845,460 | ||||||||||||
Amounts listed as "–" are $0 or round to $0.
See accompanying Notes to Financial Statements.
| 88 | 2021 Annual Report |
Statements of Changes in Net Assets (continued)
| Aberdeen Emerging Markets Sustainable Leaders Fund | Aberdeen Global Equity Fund | Aberdeen Global Infrastructure Fund | ||||||||||||||||||||||
| Year Ended October 31, 2021 | Year Ended October 31, 2020 | Year Ended October 31, 2021 | Year Ended October 31, 2020 | Year Ended October 31, 2021 | Year Ended October 31, 2020 | |||||||||||||||||||
| CAPITAL TRANSACTIONS: | ||||||||||||||||||||||||
| Class A Shares | ||||||||||||||||||||||||
| Proceeds from shares issued | $ | 3,287,050 | $ | 1,898,121 | $ | 420,868 | $ | 710,053 | $ | 3,399,084 | $ | 575,513 | ||||||||||||
| Dividends reinvested | 2,916 | 203,648 | – | 778,955 | 291,973 | 371,684 | ||||||||||||||||||
| Cost of shares redeemed | (5,020,426 | ) | (6,865,084 | ) | (3,223,417 | ) | (6,114,296 | ) | (2,176,253 | ) | (2,849,843 | ) | ||||||||||||
| Total Class A | (1,730,460 | ) | (4,763,315 | ) | (2,802,549 | ) | (4,625,288 | ) | 1,514,804 | (1,902,646 | ) | |||||||||||||
| Class C Shares | ||||||||||||||||||||||||
| Proceeds from shares issued | 79,312 | 140,962 | 200 | 8,871 | – | – | ||||||||||||||||||
| Dividends reinvested | – | 2,522 | – | 10,950 | – | – | ||||||||||||||||||
| Cost of shares redeemed | (1,871,902 | ) | (2,249,490 | ) | (76,825 | ) | (449,273 | ) | – | – | ||||||||||||||
| Total Class C | (1,792,590 | ) | (2,106,006 | ) | (76,625 | ) | (429,452 | ) | – | – | ||||||||||||||
| Class R Shares | ||||||||||||||||||||||||
| Proceeds from shares issued | 3,183,934 | 225,464 | 178,224 | 126,197 | – | – | ||||||||||||||||||
| Dividends reinvested | – | 23,945 | – | 27,447 | – | – | ||||||||||||||||||
| Cost of shares redeemed | (854,393 | ) | (1,231,526 | ) | (466,581 | ) | (832,866 | ) | – | – | ||||||||||||||
| Total Class R | 2,329,541 | (982,117 | ) | (288,357 | ) | (679,222 | ) | – | – | |||||||||||||||
| Institutional Service Class Shares | ||||||||||||||||||||||||
| Proceeds from shares issued | 4,136,896 | 1,498,932 | 30 | 5,350 | – | – | ||||||||||||||||||
| Dividends reinvested | 230,323 | 1,083,091 | – | 9,300 | – | – | ||||||||||||||||||
| Cost of shares redeemed | (9,685,115 | ) | (11,008,743 | ) | (1,527 | ) | (37,522 | ) | – | – | ||||||||||||||
| Total Institutional Service Class | (5,317,896 | ) | (8,426,720 | ) | (1,497 | ) | (22,872 | ) | – | – | ||||||||||||||
| Institutional Class Shares | ||||||||||||||||||||||||
| Proceeds from shares issued | 56,283,383 | 9,234,936 | 382,098 | 390,387 | 9,837,291 | 3,078,861 | ||||||||||||||||||
| Dividends reinvested | 206,400 | 1,336,975 | – | 46,409 | 1,312,012 | 1,682,504 | ||||||||||||||||||
| Cost of shares redeemed | (89,722,342 | ) | (10,086,981 | ) | (705,331 | ) | (438,344 | ) | (7,525,177 | ) | (49,507,771 | ) | ||||||||||||
| Total Institutional Class | (33,232,559 | ) | 484,930 | (323,233 | ) | (1,548 | ) | 3,624,126 | (44,746,406 | ) | ||||||||||||||
| Change in net assets from capital transactions: | $ | (39,743,964 | ) | $ | (15,793,228 | ) | $ | (3,492,261 | ) | $ | (5,758,382 | ) | $ | 5,138,930 | $ | (46,649,052 | ) | |||||||
Amounts listed as "–" are $0 or round to $0.
See accompanying Notes to Financial Statements.
| 2021 Annual Report | 89 |
Statements of Changes in Net Assets (concluded)
| Aberdeen Emerging Markets Sustainable Leaders Fund | Aberdeen Global Equity Fund | Aberdeen Global Infrastructure Fund | ||||||||||||||||||||||
| Year Ended October 31, 2021 | Year Ended October 31, 2020 | Year Ended October 31, 2021 | Year Ended October 31, 2020 | Year Ended October 31, 2021 | Year Ended October 31, 2020 | |||||||||||||||||||
| SHARE TRANSACTIONS: | ||||||||||||||||||||||||
| Class A Shares | ||||||||||||||||||||||||
| Issued | 171,270 | 127,940 | 25,756 | 54,833 | 143,830 | 27,759 | ||||||||||||||||||
| Reinvested | 161 | 13,284 | – | 58,392 | 12,790 | 18,598 | ||||||||||||||||||
| Redeemed | (262,985 | ) | (463,845 | ) | (194,582 | ) | (490,494 | ) | (93,312 | ) | (145,137 | ) | ||||||||||||
| Total Class A Shares | (91,554 | ) | (322,621 | ) | (168,826 | ) | (377,269 | ) | 63,308 | (98,780 | ) | |||||||||||||
| Class C Shares | ||||||||||||||||||||||||
| Issued | 4,498 | 9,880 | 13 | 742 | – | – | ||||||||||||||||||
| Reinvested | – | 174 | – | 878 | – | – | ||||||||||||||||||
| Redeemed | (103,046 | ) | (160,311 | ) | (5,132 | ) | (38,162 | ) | – | – | ||||||||||||||
| Total Class C Shares | (98,548 | ) | (150,257 | ) | (5,119 | ) | (36,542 | ) | – | – | ||||||||||||||
| Class R Shares | ||||||||||||||||||||||||
| Issued | 173,550 | 15,925 | 11,483 | 10,421 | – | – | ||||||||||||||||||
| Reinvested | – | 1,638 | – | 2,159 | – | – | ||||||||||||||||||
| Redeemed | (47,386 | ) | (86,681 | ) | (30,516 | ) | (68,244 | ) | – | – | ||||||||||||||
| Total Class R Shares | 126,164 | (69,118 | ) | (19,033 | ) | (55,664 | ) | – | – | |||||||||||||||
| Institutional Service Class Shares | ||||||||||||||||||||||||
| Issued | 207,050 | 100,099 | 1 | 400 | – | – | ||||||||||||||||||
| Reinvested | 12,443 | 69,340 | – | 688 | – | – | ||||||||||||||||||
| Redeemed | (498,200 | ) | (729,057 | ) | (94 | ) | (2,735 | ) | – | – | ||||||||||||||
| Total Institutional Service Class Shares | (278,707 | ) | (559,618 | ) | (93 | ) | (1,647 | ) | – | – | ||||||||||||||
| Institutional Class Shares | ||||||||||||||||||||||||
| Issued | 2,828,408 | 607,377 | 23,033 | 30,957 | 417,957 | 149,493 | ||||||||||||||||||
| Reinvested | 11,097 | 85,266 | – | 3,482 | 57,376 | 84,247 | ||||||||||||||||||
| Redeemed | (4,765,341 | ) | (663,191 | ) | (42,843 | ) | (35,898 | ) | (327,354 | ) | (2,500,768 | ) | ||||||||||||
| Total Institutional Class Shares | (1,925,836 | ) | 29,452 | (19,810 | ) | (1,459 | ) | 147,979 | (2,267,028 | ) | ||||||||||||||
| Total change in shares: | (2,268,481 | ) | (1,072,162 | ) | (212,881 | ) | (472,581 | ) | 211,287 | (2,365,808 | ) | |||||||||||||
Amounts listed as "–" are $0 or round to $0.
See accompanying Notes to Financial Statements.
| 90 | 2021 Annual Report |
Statements of Changes in Net Assets
| Aberdeen International Real Estate Equity Fund | Aberdeen International Small Cap Fund | Aberdeen Realty Income & Growth Fund | ||||||||||||||||||||||
| Year Ended October 31, 2021 | Year Ended October 31, 2020 | Year Ended October 31, 2021 | Year Ended October 31, 2020 (a) | Year Ended October 31, 2021 | Year Ended October 31, 2020 | |||||||||||||||||||
| FROM INVESTMENT ACTIVITIES: | ||||||||||||||||||||||||
| Operations: | ||||||||||||||||||||||||
| Net investment income/(loss) | $ | 441,963 | $ | 706,225 | $ | (737,373 | ) | $ | (272,690 | ) | $ | 535,640 | $ | 1,203,062 | ||||||||||
| Net realized gain/(loss) from investments and foreign currency transactions | 1,188,269 | 449,431 | 24,053,691 | (1,298,863 | ) | 7,737,328 | 7,265,239 | |||||||||||||||||
| Net change in unrealized appreciation/ (depreciation) on investments and translation of assets and liabilities denominated in foreign currencies | 2,064,797 | (7,020,109 | ) | 45,444,052 | 16,867,212 | 10,847,684 | (21,294,723 | ) | ||||||||||||||||
| Changes in net assets resulting from operations | 3,695,029 | (5,864,453 | ) | 68,760,370 | 15,295,659 | 19,120,652 | (12,826,422 | ) | ||||||||||||||||
| Distributions to Shareholders From: | ||||||||||||||||||||||||
| Distributable earnings: | ||||||||||||||||||||||||
| Class A | (447 | ) | (19,990 | ) | – | (4,124,107 | ) | (132,211 | ) | (356,849 | ) | |||||||||||||
| Class C | – | – | – | (37,679 | ) | – | – | |||||||||||||||||
| Class R | – | – | – | (106,923 | ) | – | – | |||||||||||||||||
| Institutional Service Class | – | – | – | (2,247 | ) | – | – | |||||||||||||||||
| Institutional Class | (772,267 | ) | (6,392,314 | ) | – | (1,888,315 | ) | (6,158,978 | ) | (10,781,178 | ) | |||||||||||||
| Change in net assets from shareholder distributions | (772,714 | ) | (6,412,304 | ) | – | (6,159,271 | ) | (6,291,189 | ) | (11,138,027 | ) | |||||||||||||
| Change in net assets from capital transactions | (2,314,278 | ) | (23,819,904 | ) | 98,893,077 | 16,139,945 | (3,351,392 | ) | (5,403,350 | ) | ||||||||||||||
| Change in net assets | 608,037 | (36,096,661 | ) | 167,653,447 | 25,276,333 | 9,478,071 | (29,367,799 | ) | ||||||||||||||||
| Net Assets: | ||||||||||||||||||||||||
| Beginning of year | 20,591,025 | 56,687,686 | 139,093,698 | 113,817,365 | 48,205,347 | 77,573,146 | ||||||||||||||||||
| End of year | $ | 21,199,062 | $ | 20,591,025 | $ | 306,747,145 | $ | 139,093,698 | $ | 57,683,418 | $ | 48,205,347 | ||||||||||||
| (a) | Effective February 28, 2020, the Institutional Service Class had zero assets. On February 28, 2020, the Aberdeen International Small Cap Fund ceased offering Institutional Service Class Shares. |
Amounts listed as "–" are $0 or round to $0.
See accompanying Notes to Financial Statements.
| 2021 Annual Report | 91 |
Statements of Changes in Net Assets (continued)
| Aberdeen International Real Estate Equity Fund | Aberdeen International Small Cap Fund | Aberdeen Realty Income & Growth Fund | ||||||||||||||||||||||
| Year Ended October 31, 2021 | Year Ended October 31, 2020 | Year Ended October 31, 2021 | Year Ended October 31, 2020 (a) | Year Ended October 31, 2021 | Year Ended October 31, 2020 | |||||||||||||||||||
| CAPITAL TRANSACTIONS: | ||||||||||||||||||||||||
| Class A Shares | ||||||||||||||||||||||||
| Proceeds from shares issued | $ | 17,982 | $ | 17,400 | $ | 35,856,728 | $ | 22,475,177 | $ | 242,415 | $ | 600,041 | ||||||||||||
| Dividends reinvested | 259 | 1,728 | – | 4,009,366 | 118,055 | 267,327 | ||||||||||||||||||
| Cost of shares redeemed | (3,899 | ) | (139,211 | ) | (49,254,721 | ) | (17,795,163 | ) | (1,560,020 | ) | (453,190 | ) | ||||||||||||
| Total Class A | 14,342 | (120,083 | ) | (13,397,993 | ) | 8,689,380 | (1,199,550 | ) | 414,178 | |||||||||||||||
| Class C Shares | ||||||||||||||||||||||||
| Proceeds from shares issued | – | – | 161,335 | 44,253 | – | – | ||||||||||||||||||
| Dividends reinvested | – | – | – | 37,679 | – | – | ||||||||||||||||||
| Cost of shares redeemed | – | – | (356,629 | ) | (371,746 | ) | – | – | ||||||||||||||||
| Total Class C | – | – | (195,294 | ) | (289,814 | ) | – | – | ||||||||||||||||
| Class R Shares | ||||||||||||||||||||||||
| Proceeds from shares issued | – | – | 726,609 | 756,991 | – | – | ||||||||||||||||||
| Dividends reinvested | – | – | – | 104,980 | – | – | ||||||||||||||||||
| Cost of shares redeemed | – | – | (548,023 | ) | (1,322,375 | ) | – | – | ||||||||||||||||
| Total Class R | – | – | 178,586 | (460,404 | ) | – | – | |||||||||||||||||
| Institutional Service Class Shares | ||||||||||||||||||||||||
| Proceeds from shares issued | – | – | – | 1,597 | – | – | ||||||||||||||||||
| Dividends reinvested | – | – | – | 2,247 | – | – | ||||||||||||||||||
| Cost of shares redeemed | – | – | – | (41,337 | ) | – | – | |||||||||||||||||
| Total Institutional Service Class | – | – | – | (37,493 | ) | – | – | |||||||||||||||||
| Institutional Class Shares | ||||||||||||||||||||||||
| Proceeds from shares issued | 103,706 | 220,196 | 132,013,360 | 22,918,036 | 1,558,600 | 1,740,144 | ||||||||||||||||||
| Dividends reinvested | 750,678 | 3,228,360 | – | 1,887,586 | 5,990,413 | 10,093,031 | ||||||||||||||||||
| Cost of shares redeemed | (3,183,004 | ) | (27,148,377 | ) | (19,705,582 | ) | (16,567,346 | ) | (9,700,855 | ) | (17,650,703 | ) | ||||||||||||
| Total Institutional Class | (2,328,620 | ) | (23,699,821 | ) | 112,307,778 | 8,238,276 | (2,151,842 | ) | (5,817,528 | ) | ||||||||||||||
| Change in net assets from capital transactions: | $ | (2,314,278 | ) | $ | (23,819,904 | ) | $ | 98,893,077 | $ | 16,139,945 | $ | (3,351,392 | ) | $ | (5,403,350 | ) | ||||||||
| (a) | Effective February 28, 2020, the Institutional Service Class had zero assets. On February 28, 2020, the Aberdeen International Small Cap Fund ceased offering Institutional Service Class Shares. |
Amounts listed as "–" are $0 or round to $0.
See accompanying Notes to Financial Statements.
| 92 | 2021 Annual Report |
Statements of Changes in Net Assets (concluded)
| Aberdeen International Real Estate Equity Fund | Aberdeen International Small Cap Fund | Aberdeen Realty Income & Growth Fund | ||||||||||||||||||||||
| Year Ended October 31, 2021 | Year Ended October 31, 2020 | Year Ended October 31, 2021 | Year Ended October 31, 2020 (a) | Year Ended October 31, 2021 | Year Ended October 31, 2020 | |||||||||||||||||||
| SHARE TRANSACTIONS: | ||||||||||||||||||||||||
| Class A Shares | ||||||||||||||||||||||||
| Issued | 883 | 944 | 973,407 | 853,368 | 17,991 | 44,651 | ||||||||||||||||||
| Reinvested | 13 | 81 | – | 143,243 | 9,766 | 18,007 | ||||||||||||||||||
| Redeemed | (195 | ) | (7,307 | ) | (1,343,639 | ) | (690,453 | ) | (117,101 | ) | (34,005 | ) | ||||||||||||
| Total Class A Shares | 701 | (6,282 | ) | (370,232 | ) | 306,158 | (89,344 | ) | 28,653 | |||||||||||||||
| Class C Shares | ||||||||||||||||||||||||
| Issued | – | – | 4,708 | 1,695 | – | – | ||||||||||||||||||
| Reinvested | – | – | – | 1,488 | – | – | ||||||||||||||||||
| Redeemed | – | – | (10,448 | ) | (15,376 | ) | – | – | ||||||||||||||||
| Total Class C Shares | – | – | (5,740 | ) | (12,193 | ) | – | – | ||||||||||||||||
| Class R Shares | ||||||||||||||||||||||||
| Issued | – | – | 20,419 | 31,007 | – | – | ||||||||||||||||||
| Reinvested | – | – | – | 3,989 | – | – | ||||||||||||||||||
| Redeemed | – | – | (15,252 | ) | (50,260 | ) | – | – | ||||||||||||||||
| Total Class R Shares | – | – | 5,167 | (15,264 | ) | – | – | |||||||||||||||||
| Institutional Service Class Shares | ||||||||||||||||||||||||
| Issued | – | – | – | 56 | – | – | ||||||||||||||||||
| Reinvested | – | – | – | 80 | – | – | ||||||||||||||||||
| Redeemed | – | – | – | (1,607 | ) | – | – | |||||||||||||||||
| Total Institutional Service Class Shares | – | – | – | (1,471 | ) | – | – | |||||||||||||||||
| Institutional Class Shares | ||||||||||||||||||||||||
| Issued | 5,034 | 11,184 | 3,426,460 | 859,355 | 112,658 | 122,029 | ||||||||||||||||||
| Reinvested | 39,077 | 149,877 | – | 67,222 | 492,542 | 688,954 | ||||||||||||||||||
| Redeemed | (157,574 | ) | (1,382,002 | ) | (520,211 | ) | (648,619 | ) | (726,895 | ) | (1,267,890 | ) | ||||||||||||
| Total Institutional Class Shares | (113,463 | ) | (1,220,941 | ) | 2,906,249 | 277,958 | (121,695 | ) | (456,907 | ) | ||||||||||||||
| Total change in shares: | (112,762 | ) | (1,227,223 | ) | 2,535,444 | 555,188 | (211,039 | ) | (428,254 | ) | ||||||||||||||
(a) Effective February 28, 2020, the Institutional Service Class had zero assets. On February 28, 2020, the Aberdeen International Small Cap Fund ceased offering Institutional Service Class Shares.
Amounts listed as "–" are $0 or round to $0.
See accompanying Notes to Financial Statements.
| 2021 Annual Report | 93 |
Statements of Changes in Net Assets
| Aberdeen U.S. Small Cap Equity Fund | Aberdeen U.S. Sustainable Leaders Fund | Aberdeen U.S. Sustainable Leaders Smaller Companies Fund | ||||||||||||||||||||||
| Year Ended October 31, 2021 | Year Ended October 31, 2020 | Year Ended October 31, 2021 | Year Ended October 31, 2020 (a) | Year Ended October 31, 2021 | Year Ended October 31, 2020 | |||||||||||||||||||
| FROM INVESTMENT ACTIVITIES: | ||||||||||||||||||||||||
| Operations: | ||||||||||||||||||||||||
| Net investment loss | $ | (3,107,915 | ) | $ | (2,939,644 | ) | $ | (1,201,535 | ) | $ | (627,102 | ) | $ | (70,825 | ) | $ | (45,591 | ) | ||||||
| Net realized gain from investments and foreign currency transactions | 254,359,887 | 60,922,317 | 131,925,314 | 48,986,120 | 6,101,911 | 3,119,651 | ||||||||||||||||||
| Net change in unrealized appreciation/(depreciation) on investments and translation of assets and liabilities denominated in foreign currencies | 172,320,085 | (4,343,412 | ) | 27,391,542 | 13,838,958 | 813,341 | (994,426 | ) | ||||||||||||||||
| Changes in net assets resulting from operations | 423,509,057 | 53,639,261 | 158,115,321 | 62,197,976 | 6,844,427 | 2,079,634 | ||||||||||||||||||
| Distributions to Shareholders From: | ||||||||||||||||||||||||
| Distributable earnings: | ||||||||||||||||||||||||
| Class A | (8,820,880 | ) | (11,473,361 | ) | (32,838,262 | ) | (24,589,062 | ) | (901,851 | ) | (516,902 | ) | ||||||||||||
| Class C | (3,106,149 | ) | (4,244,876 | ) | (162,943 | ) | (156,405 | ) | (230,092 | ) | (1,046,758 | ) | ||||||||||||
| Class R | (263,620 | ) | (421,143 | ) | – | (1,083 | ) | (271,918 | ) | (128,715 | ) | |||||||||||||
| Institutional Service Class | (2,057,615 | ) | (2,799,098 | ) | (13,939,695 | ) | (10,744,381 | ) | (32,120 | ) | (28,367 | ) | ||||||||||||
| Institutional Class | (35,151,160 | ) | (42,054,120 | ) | (1,285,641 | ) | (818,661 | ) | (382,181 | ) | (203,205 | ) | ||||||||||||
| Change in net assets from shareholder distributions | (49,399,424 | ) | (60,992,598 | ) | (48,226,541 | ) | (36,309,592 | ) | (1,818,162 | ) | (1,923,947 | ) | ||||||||||||
| Change in net assets from capital transactions | 88,369,619 | (119,902,008 | ) | 10,897,865 | 1,017,750 | 509,577 | (6,463,943 | ) | ||||||||||||||||
| Change in net assets | 462,479,252 | (127,255,345 | ) | 120,786,645 | 26,906,134 | 5,535,842 | (6,308,256 | ) | ||||||||||||||||
| Net Assets: | ||||||||||||||||||||||||
| Beginning of year | 733,367,840 | 860,623,185 | 398,713,960 | 371,807,826 | 13,890,016 | 20,198,272 | ||||||||||||||||||
| End of year | $ | 1,195,847,092 | $ | 733,367,840 | $ | 519,500,605 | $ | 398,713,960 | $ | 19,425,858 | $ | 13,890,016 | ||||||||||||
(a) Effective March 31, 2020, the Class R had zero assets. On April 7, 2020, the Aberdeen U.S. Sustainable Leaders Fund ceased offering Class R Shares.
Amounts listed as "–" are $0 or round to $0.
See accompanying Notes to Financial Statements.
| 94 | 2021 Annual Report |
Statements of Changes in Net Assets (continued)
| Aberdeen U.S. Small Cap Equity Fund | Aberdeen U.S. Sustainable Leaders Fund | Aberdeen U.S. Sustainable Leaders Smaller Companies Fund | ||||||||||||||||||||||
| Year Ended October 31, 2021 | Year Ended October 31, 2020 | Year Ended October 31, 2021 | Year Ended October 31, 2020 (a) | Year Ended October 31, 2021 | Year Ended October 31, 2020 | |||||||||||||||||||
| CAPITAL TRANSACTIONS: | ||||||||||||||||||||||||
| Class A Shares | ||||||||||||||||||||||||
| Proceeds from shares issued | $ | 23,006,316 | $ | 16,227,633 | $ | 3,192,815 | $ | 2,958,841 | $ | 810,347 | $ | 1,202,461 | ||||||||||||
| Dividends reinvested | 7,112,684 | 9,715,490 | 29,872,297 | 22,321,664 | 763,859 | 388,246 | ||||||||||||||||||
| Cost of shares redeemed | (40,856,034 | ) | (58,094,309 | ) | (24,314,645 | ) | (25,099,337 | ) | (1,960,220 | ) | (2,708,909 | ) | ||||||||||||
| Total Class A | (10,737,034 | ) | (32,151,186 | ) | 8,750,467 | 181,168 | (386,014 | ) | (1,118,202 | ) | ||||||||||||||
| Class C Shares | ||||||||||||||||||||||||
| Proceeds from shares issued | 3,386,802 | 2,708,476 | 19,828 | 148,630 | 92,440 | 89,627 | ||||||||||||||||||
| Dividends reinvested | 2,630,798 | 3,470,356 | 157,978 | 120,441 | 227,027 | 1,034,134 | ||||||||||||||||||
| Cost of shares redeemed | (13,933,885 | ) | (16,088,725 | ) | (1,113,057 | ) | (600,552 | ) | (210,112 | ) | (4,863,444 | ) | ||||||||||||
| Total Class C | (7,916,285 | ) | (9,909,893 | ) | (935,251 | ) | (331,481 | ) | 109,355 | (3,739,683 | ) | |||||||||||||
| Class R Shares | ||||||||||||||||||||||||
| Proceeds from shares issued | 1,023,812 | 803,669 | – | 1,786 | 563,910 | 276,677 | ||||||||||||||||||
| Dividends reinvested | 246,182 | 276,258 | – | – | 271,918 | 128,715 | ||||||||||||||||||
| Cost of shares redeemed | (1,069,593 | ) | (2,713,095 | ) | – | (13,850 | ) | (465,547 | ) | (472,535 | ) | |||||||||||||
| Total Class R | 200,401 | (1,633,168 | ) | – | (12,064 | ) | 370,281 | (67,143 | ) | |||||||||||||||
| Institutional Service Class Shares | ||||||||||||||||||||||||
| Proceeds from shares issued | 6,191,761 | 7,326,377 | 1,380,446 | 674,167 | 85,854 | 3,000 | ||||||||||||||||||
| Dividends reinvested | 1,986,418 | 2,719,643 | 13,645,836 | 10,474,284 | 32,120 | 28,367 | ||||||||||||||||||
| Cost of shares redeemed | (12,716,020 | ) | (19,150,853 | ) | (12,669,731 | ) | (11,541,725 | ) | (367,340 | ) | (192,119 | ) | ||||||||||||
| Total Institutional Service Class | (4,537,841 | ) | (9,104,833 | ) | 2,356,551 | (393,274 | ) | (249,366 | ) | (160,752 | ) | |||||||||||||
| Institutional Class Shares | ||||||||||||||||||||||||
| Proceeds from shares issued | 291,313,162 | 167,070,278 | 2,316,376 | 3,061,512 | 1,040,176 | 340,696 | ||||||||||||||||||
| Dividends reinvested | 29,290,180 | 35,496,582 | 1,257,892 | 796,937 | 369,548 | 197,284 | ||||||||||||||||||
| Cost of shares redeemed | (209,242,964 | ) | (269,669,788 | ) | (2,848,170 | ) | (2,285,048 | ) | (744,403 | ) | (1,916,143 | ) | ||||||||||||
| Total Institutional Class | 111,360,378 | (67,102,928 | ) | 726,098 | 1,573,401 | 665,321 | (1,378,163 | ) | ||||||||||||||||
| Change in net assets from capital transactions: | $ | 88,369,619 | $ | (119,902,008 | ) | $ | 10,897,865 | $ | 1,017,750 | $ | 509,577 | $ | (6,463,943 | ) | ||||||||||
(a) Effective March 31, 2020, the Class R had zero assets. On April 7, 2020, the Aberdeen U.S. Sustainable Leaders Fund ceased offering Class R Shares.
Amounts listed as "–" are $0 or round to $0.
See accompanying Notes to Financial Statements.
| 2021 Annual Report | 95 |
Statements of Changes in Net Assets (concluded)
| Aberdeen U.S. Small Cap Equity Fund | Aberdeen U.S. Sustainable Leaders Fund | Aberdeen U.S. Sustainable Leaders Smaller Companies Fund | ||||||||||||||||||||||
| Year Ended October 31, 2021 | Year Ended October 31, 2020 | Year Ended October 31, 2021 | Year Ended October 31, 2020 (a) | Year Ended October 31, 2021 | Year Ended October 31, 2020 | |||||||||||||||||||
| SHARE TRANSACTIONS: | ||||||||||||||||||||||||
| Class A Shares | ||||||||||||||||||||||||
| Issued | 538,007 | 507,911 | 213,509 | 230,734 | 81,901 | 155,754 | ||||||||||||||||||
| Reinvested | 185,082 | 301,069 | 2,159,963 | 1,777,203 | 88,205 | 51,018 | ||||||||||||||||||
| Redeemed | (950,207 | ) | (1,895,512 | ) | (1,629,190 | ) | (1,950,163 | ) | (208,896 | ) | (380,378 | ) | ||||||||||||
| Total Class A Shares | (227,118 | ) | (1,086,532 | ) | 744,282 | 57,774 | (38,790 | ) | (173,606 | ) | ||||||||||||||
| Class C Shares | ||||||||||||||||||||||||
| Issued | 100,138 | 104,097 | 1,518 | 13,302 | 66,551 | 58,896 | ||||||||||||||||||
| Reinvested | 84,809 | 130,563 | 14,271 | 11,570 | 190,779 | 590,934 | ||||||||||||||||||
| Redeemed | (404,364 | ) | (643,327 | ) | (92,517 | ) | (54,864 | ) | (126,431 | ) | (2,637,390 | ) | ||||||||||||
| Total Class C Shares | (219,417 | ) | (408,667 | ) | (76,728 | ) | (29,992 | ) | 130,899 | (1,987,560 | ) | |||||||||||||
| Class R Shares | ||||||||||||||||||||||||
| Issued | 26,643 | 28,406 | – | 154 | 66,118 | 40,328 | ||||||||||||||||||
| Reinvested | 7,188 | 9,503 | – | – | 36,401 | 19,240 | ||||||||||||||||||
| Redeemed | (29,099 | ) | (94,848 | ) | – | (1,329 | ) | (56,150 | ) | (70,135 | ) | |||||||||||||
| Total Class R Shares | 4,732 | (56,939 | ) | – | (1,175 | ) | 46,369 | (10,567 | ) | |||||||||||||||
| Institutional Service Class Shares | ||||||||||||||||||||||||
| Issued | 131,919 | 230,034 | 87,358 | 50,790 | 8,071 | 344 | ||||||||||||||||||
| Reinvested | 47,854 | 78,557 | 905,497 | 774,153 | 3,526 | 3,564 | ||||||||||||||||||
| Redeemed | (279,784 | ) | (576,967 | ) | (775,538 | ) | (845,170 | ) | (38,207 | ) | (24,322 | ) | ||||||||||||
| Total Institutional Service Class Shares | (100,011 | ) | (268,376 | ) | 217,317 | (20,227 | ) | (26,610 | ) | (20,414 | ) | |||||||||||||
| Institutional Class Shares | ||||||||||||||||||||||||
| Issued | 6,279,695 | 5,167,805 | 139,481 | 210,706 | 93,140 | 41,379 | ||||||||||||||||||
| Reinvested | 704,938 | 1,025,616 | 83,029 | 58,641 | 38,859 | 23,913 | ||||||||||||||||||
| Redeemed | (4,532,758 | ) | (8,464,657 | ) | (170,668 | ) | (169,900 | ) | (72,045 | ) | (231,032 | ) | ||||||||||||
| Total Institutional Class Shares | 2,451,875 | (2,271,236 | ) | 51,842 | 99,447 | 59,954 | (165,740 | ) | ||||||||||||||||
| Total change in shares: | 1,910,061 | (4,091,750 | ) | 936,713 | 105,827 | 171,822 | (2,357,887 | ) | ||||||||||||||||
(a) Effective March 31, 2020, the Class R had zero assets. On April 7, 2020, the Aberdeen U.S. Sustainable Leaders Fund ceased offering Class R Shares.
Amounts listed as "–" are $0 or round to $0.
See accompanying Notes to Financial Statements.
| 96 | 2021 Annual Report |
Financial Highlights
Selected Data for Each Share of Capital Outstanding Throughout the Periods Indicated
Aberdeen China A Share Equity Fund
| Investment Activities | Distributions | |||||||||||||||||||||||
| Net Asset Value, Beginning of Period | Net Net Investment Income (Loss) (a) | Realized and Unrealized Gains (Losses) on Investments | Total from Investment Activities | Net Investment Income | Net Realized Gains | Total Distributions | Net Asset Value, End of Period | |||||||||||||||||
| Class A Shares | ||||||||||||||||||||||||
| Year Ended October 31, 2021 | $ 33.90 | $ (0.11 | ) | $ 4.50 | $ 4.39 | $ – | $ (0.53 | ) | $ (0.53 | ) | $ 37.76 | |||||||||||||
| Year Ended October 31, 2020 | 25.61 | 0.08 | 9.29 | 9.37 | – | (f) | (1.08 | ) | (1.08 | ) | 33.90 | |||||||||||||
| Year Ended October 31, 2019 | 19.86 | 0.07 | 5.72 | 5.79 | (0.04 | ) | – | (0.04 | ) | 25.61 | ||||||||||||||
| Year Ended October 31, 2018 | 22.48 | 0.06 | (2.45 | ) | (2.39 | ) | (0.23 | ) | – | (0.23 | ) | 19.86 | ||||||||||||
| Year Ended October 31, 2017 | 18.46 | 0.20 | 4.02 | 4.22 | (0.20 | ) | – | (0.20 | ) | 22.48 | ||||||||||||||
| Class C Shares | ||||||||||||||||||||||||
| Year Ended October 31, 2021 | 32.18 | (0.31 | ) | 4.24 | 3.93 | – | (0.53 | ) | (0.53 | ) | 35.58 | |||||||||||||
| Year Ended October 31, 2020 | 24.52 | (0.09 | ) | 8.83 | 8.74 | – | (1.08 | ) | (1.08 | ) | 32.18 | |||||||||||||
| Year Ended October 31, 2019 | 19.12 | (0.21 | ) | 5.61 | 5.40 | – | – | – | 24.52 | |||||||||||||||
| Year Ended October 31, 2018 | 21.59 | (0.09 | ) | (2.35 | ) | (2.44 | ) | (0.03 | ) | – | (0.03 | ) | 19.12 | |||||||||||
| Year Ended October 31, 2017 | 17.64 | 0.03 | 3.92 | 3.95 | – | – | – | 21.59 | ||||||||||||||||
| Class R Shares | ||||||||||||||||||||||||
| Year Ended October 31, 2021 | 33.07 | (0.23 | ) | 4.40 | 4.17 | – | (0.53 | ) | (0.53 | ) | 36.71 | |||||||||||||
| Year Ended October 31, 2020 | 25.08 | (0.06 | ) | 9.13 | 9.07 | – | (1.08 | ) | (1.08 | ) | 33.07 | |||||||||||||
| Year Ended October 31, 2019 | 19.48 | 0.02 | 5.58 | 5.60 | – | – | – | 25.08 | ||||||||||||||||
| Year Ended October 31, 2018 | 22.07 | 0.04 | (2.46 | ) | (2.42 | ) | (0.17 | ) | – | (0.17 | ) | 19.48 | ||||||||||||
| Year Ended October 31, 2017 | 18.13 | 0.15 | 3.94 | 4.09 | (0.15 | ) | – | (0.15 | ) | 22.07 | ||||||||||||||
| Institutional Service Class Shares | ||||||||||||||||||||||||
| Year Ended October 31, 2021 | 34.11 | (0.04 | ) | 4.53 | 4.49 | (0.02 | ) | (0.53 | ) | (0.55 | ) | 38.05 | ||||||||||||
| Year Ended October 31, 2020 | 25.75 | 0.15 | 9.34 | 9.49 | (0.05 | ) | (1.08 | ) | (1.13 | ) | 34.11 | |||||||||||||
| Year Ended October 31, 2019 | 19.98 | 0.11 | 5.76 | 5.87 | (0.10 | ) | – | (0.10 | ) | 25.75 | ||||||||||||||
| Year Ended October 31, 2018 | 22.62 | 0.11 | (2.46 | ) | (2.35 | ) | (0.29 | ) | – | (0.29 | ) | 19.98 | ||||||||||||
| Year Ended October 31, 2017 | 18.55 | 0.22 | 4.08 | 4.30 | (0.23 | ) | – | (0.23 | ) | 22.62 | ||||||||||||||
| Institutional Class Shares | ||||||||||||||||||||||||
| Year Ended October 31, 2021 | 34.26 | 0.12 | 4.43 | 4.55 | (0.04 | ) | (0.53 | ) | (0.57 | ) | 38.24 | |||||||||||||
| Year Ended October 31, 2020 | 25.85 | 0.05 | 9.51 | 9.56 | (0.07 | ) | (1.08 | ) | (1.15 | ) | 34.26 | |||||||||||||
| Year Ended October 31, 2019 | 20.03 | 0.26 | 5.64 | 5.90 | (0.08 | ) | – | (0.08 | ) | 25.85 | ||||||||||||||
| Year Ended October 31, 2018 | 22.65 | 0.05 | (2.38 | ) | (2.33 | ) | (0.29 | ) | – | (0.29 | ) | 20.03 | ||||||||||||
| Year Ended October 31, 2017 | 18.58 | 0.19 | 4.13 | 4.32 | (0.25 | ) | – | (0.25 | ) | 22.65 | ||||||||||||||
| (a) | Net investment income/(loss) is based on average shares outstanding during the period. |
| (b) | Excludes sales charge. |
| (c) | During the period, certain fees were waived and/or reimbursed. If such waivers/reimbursements had not occurred, the ratios would have been as indicated. |
Amounts listed as "–" are $0 or round to $0.
See accompanying Notes to Financial Statements.
| 2021 Annual Report | 97 |
Financial Highlights (continued)
Selected Data for Each Share of Capital Outstanding Throughout the Periods Indicated
Aberdeen China A Share Equity Fund (concluded)
| Ratios/Supplemental Data | ||||||||||||||||||
| Total Return (b) | Net Assets at End of Period (000's) | Ratio of Expenses (Net of Reimbursements/ Waivers) to Average Net Assets | Ratio of Expenses (Prior to Reimbursements) to Average Net Assets (c) | Ratio of Net Investment Income (Loss) to Average Net Assets | Portfolio Turnover (d) | |||||||||||||
| 12.98%(g) | $18,476 | 1.32%(e) | 1.58%(e) | (0.28%) | 45.21% | |||||||||||||
| 38.06%(g) | 10,888 | 1.32%(e) | 2.55%(e) | 0.28% | 56.48% | |||||||||||||
| 29.21% | 8,685 | 1.60%(e) | 3.19%(e) | 0.30% | 115.09% | |||||||||||||
| (10.76%) | 5,978 | 1.95%(e) | 3.01%(e) | 0.27% | 26.13% | |||||||||||||
| 23.15% | 7,492 | 1.97%(e) | 3.04%(e) | 0.98% | 23.58% | |||||||||||||
| 12.23% | 3,782 | 1.99%(e) | 2.33%(e) | (0.86%) | 45.21% | |||||||||||||
| 37.13% | 587 | 1.99%(e) | 3.37%(e) | (0.37%) | 56.48% | |||||||||||||
| 28.24% | 839 | 2.38%(e) | 3.99%(e) | (0.96%) | 115.09% | |||||||||||||
| (11.32%) | 1,568 | 2.62%(e) | 3.81%(e) | (0.42%) | 26.13% | |||||||||||||
| 22.39% | 2,437 | 2.62%(e) | 3.83%(e) | 0.14% | 23.58% | |||||||||||||
| 12.63%(g) | 4,557 | 1.64%(e) | 1.90%(e) | (0.62%) | 45.21% | |||||||||||||
| 37.63%(g) | 3,215 | 1.62%(e) | 2.85%(e) | (0.23%) | 56.48% | |||||||||||||
| 28.75% | 2,682 | 1.92%(e) | 3.52%(e) | 0.07% | 115.09% | |||||||||||||
| (11.07%) | 1,664 | 2.27%(e) | 3.33%(e) | 0.18% | 26.13% | |||||||||||||
| 22.77% | 1,851 | 2.31%(e) | 3.38%(e) | 0.74% | 23.58% | |||||||||||||
| 13.21% | 959 | 1.08%(e) | 1.34%(e) | (0.10%) | 45.21% | |||||||||||||
| 38.37% | 639 | 1.09%(e) | 2.32%(e) | 0.55% | 56.48% | |||||||||||||
| 29.52% | 543 | 1.40%(e) | 2.96%(e) | 0.45% | 115.09% | |||||||||||||
| (10.57%) | 532 | 1.72%(e) | 2.78%(e) | 0.49% | 26.13% | |||||||||||||
| 23.54% | 620 | 1.71%(e) | 2.78%(e) | 1.12% | 23.58% | |||||||||||||
| 13.33% | 60,300 | 0.99%(e) | 1.33%(e) | 0.32% | 45.21% | |||||||||||||
| 38.55% | 4,919 | 0.99%(e) | 2.34%(e) | 0.20% | 56.48% | |||||||||||||
| 29.59% | 1,336 | 1.16%(e) | 2.97%(e) | 1.09% | 115.09% | |||||||||||||
| (10.46%) | 299 | 1.62%(e) | 2.78%(e) | 0.21% | 26.13% | |||||||||||||
| 23.62% | 927 | 1.62%(e) | 2.78%(e) | 0.94% | 23.58% | |||||||||||||
| (d) | Portfolio turnover is calculated on the basis of the Fund as a whole without distinguishing among the classes of shares. |
| (e) | Includes interest expense that amounts to less than 0.01% |
| (f) | Less than $0.005 per share. |
| (g) | The total return shown above includes the impact of financial statement rounding of the NAV per share and/or financial statement adjustments. |
| 98 | 2021 Annual Report |
Financial Highlights (continued)
Selected Data for Each Share of Capital Outstanding Throughout the Periods Indicated
Aberdeen Dynamic Dividend Fund
| Investment Activities | Distributions | |||||||||||||||||||||||||||||||||||
| Net Asset Value, Beginning of Period | Net Investment Income | Net Realized and Unrealized Gains (Losses) on Investments | Total from Invest- ment Activities | Net Invest- ment Income | Tax Return of Capital | Total Distri- butions | Redemp- tion Fees | Net Asset Value, End of Period | ||||||||||||||||||||||||||||
| Class A Shares | ||||||||||||||||||||||||||||||||||||
| Year Ended October 31, 2021 | $ 3.68 | $ 0.23 | (d) | $ 1.06 | $ 1.29 | $ (0.23 | ) | $ – | $ (0.23 | ) | $ – | $ 4.74 | ||||||||||||||||||||||||
| Year Ended October 31, 2020 | 3.99 | 0.20 | (d) | (0.28 | ) | (0.08 | ) | (0.23 | ) | – | (0.23 | ) | – | 3.68 | ||||||||||||||||||||||
| Year Ended October 31, 2019 | 3.85 | 0.23 | (d) | 0.14 | 0.37 | (0.23 | ) | – | (0.23 | ) | – | 3.99 | ||||||||||||||||||||||||
| Year Ended October 31, 2018(f) | 4.04 | 0.17 | (d) | (0.13 | ) | 0.04 | (0.23 | ) | 0.00 | (g) | (0.23 | ) | 0.00 | (g) | 3.85 | |||||||||||||||||||||
| Year Ended October 31, 2017 | 3.49 | 0.22 | 0.56 | 0.78 | (0.22 | ) | (0.01 | ) | (0.23 | ) | 0.00 | (g) | 4.04 | |||||||||||||||||||||||
| Institutional Class Shares | ||||||||||||||||||||||||||||||||||||
| Year Ended October 31, 2021 | 3.69 | 0.24 | (d) | 1.05 | 1.29 | (0.24 | ) | – | (0.24 | ) | – | 4.74 | ||||||||||||||||||||||||
| Year Ended October 31, 2020 | 4.00 | 0.21 | (d) | (0.28 | ) | (0.07 | ) | (0.24 | ) | – | (0.24 | ) | – | 3.69 | ||||||||||||||||||||||
| Year Ended October 31, 2019 | 3.85 | 0.24 | (d) | 0.15 | 0.39 | (0.24 | ) | – | (0.24 | ) | – | 4.00 | ||||||||||||||||||||||||
| Year Ended October 31, 2018(f) | 4.04 | 0.18 | (d) | (0.13 | ) | 0.05 | (0.24 | ) | 0.00 | (g) | (0.24 | ) | 0.00 | (g) | 3.85 | |||||||||||||||||||||
| Year Ended October 31, 2017 | 3.49 | 0.22 | 0.57 | 0.79 | (0.23 | ) | (0.01 | ) | (0.24 | ) | 0.00 | (g) | 4.04 | |||||||||||||||||||||||
| (a) | Excludes sales charge. |
| (b) | During the period, certain fees were waived and/or reimbursed. If such waivers/reimbursements had not occurred, the ratios would have been as indicated. |
| (c) | Portfolio turnover is calculated on the basis of the Fund as a whole without distinguishing among the classes of shares. |
Amounts listed as "–" are $0 or round to $0.
See accompanying Notes to Financial Statements.
| 2021 Annual Report | 99 |
Financial Highlights (continued)
Selected Data for Each Share of Capital Outstanding Throughout the Periods Indicated
Aberdeen Dynamic Dividend Fund (concluded)
| Ratios/Supplemental Data | |||||||||||||||||
| Total Return (a) | Net Assets at End of Period (000's) | Ratio of Expenses (Net of Reimbursements/ Waivers) to Average Net Assets | Ratio of Expenses (Prior to Reimbursements) to Average Net Assets (b) | Ratio of Net Investment Income to Average Net Assets | Portfolio Turnover (c) | ||||||||||||
| 35.40% | $ 4,986 | 1.50% | 1.66% | 5.03% | 59.28% | ||||||||||||
| (2.04%)(e) | 3,885 | 1.50% | 1.60% | 5.20% | 85.01% | ||||||||||||
| 10.02%(e) | 4,399 | 1.50% | 1.61% | 6.00% | 105.70% | ||||||||||||
| 0.79% | 4,505 | 1.52%(h) | 1.60%(h) | 4.17% | 66.16% | ||||||||||||
| 22.92% | 3,379 | 1.54%(h) | 1.58%(h) | 6.14% | 82.00% | ||||||||||||
| 35.36% | 123,166 | 1.25% | 1.39% | 5.26% | 59.28% | ||||||||||||
| (1.77%) | 100,350 | 1.25% | 1.35% | 5.37% | 85.01% | ||||||||||||
| 10.60% | 122,197 | 1.25% | 1.33% | 6.21% | 105.70% | ||||||||||||
| 1.02% | 135,262 | 1.28%(h) | 1.35%(h) | 4.44% | 66.16% | ||||||||||||
| 23.22% | 160,696 | 1.29%(h) | 1.33%(h) | 5.95% | 82.00% | ||||||||||||
| (d) | Net investment income/(loss) is based on average shares outstanding during the period. |
| (e) | The total return shown above includes the impact of financial statement rounding of the NAV per share and/or financial statement adjustments. |
| (f) | Beginning with the year ended October 31, 2018, the Fund has been audited by KPMG LLP. Previous years were audited by different independent registered public accounting firms. |
| (g) | Less than $0.005 per share. |
| (h) | Includes interest expense that amounts to 0.03%, and 0.04% for Class A and Institutional Class for the years ended October 31, 2018 and October 31, 2017 respectively. |
| 100 | 2021 Annual Report |
Financial Highlights (continued)
Selected Data for Each Share of Capital Outstanding Throughout the Periods Indicated
Aberdeen Emerging Markets Fund
| Investment Activities | Distributions | |||||||||||||||
| Net Asset Value, Beginning of Period | Net Investment Income (Loss) (a) | Net Realized and Unrealized Gains (Losses) on Investments | Total from Investment Activities | Net Investment Income | Net Realized Gains | Total Distributions | Net Asset Value, End of Period | |||||||||
| Class A Shares | ||||||||||||||||
| Year Ended October 31, 2021 | $ 16.79 | $ 0.04 | $ 3.46 | $ 3.50 | $ – | $ (0.14 | ) | $ (0.14 | ) | $ 20.15 | ||||||
| Year Ended October 31, 2020 | 15.30 | 0.01 | 1.71 | 1.72 | (0.22 | ) | (0.01 | ) | (0.23 | ) | 16.79 | |||||
| Year Ended October 31, 2019 | 13.12 | 0.07 | 2.26 | 2.33 | (0.13 | ) | (0.02 | ) | (0.15 | ) | 15.30 | |||||
| Year Ended October 31, 2018 | 15.74 | 0.07 | (2.53 | ) | (2.46 | ) | (0.16 | ) | – | (0.16 | ) | 13.12 | ||||
| Year Ended October 31, 2017 | 13.53 | 0.10 | 2.22 | 2.32 | (0.11 | ) | – | (0.11 | ) | 15.74 | ||||||
| Class C Shares | ||||||||||||||||
| Year Ended October 31, 2021 | 16.68 | (0.08 | ) | 3.44 | 3.36 | – | (0.14 | ) | (0.14 | ) | 19.90 | |||||
| Year Ended October 31, 2020 | 15.18 | (0.06 | ) | 1.69 | 1.63 | (0.12 | ) | (0.01 | ) | (0.13 | ) | 16.68 | ||||
| Year Ended October 31, 2019 | 12.97 | – | (f) | 2.24 | 2.24 | (0.01 | ) | (0.02 | ) | (0.03 | ) | 15.18 | ||||
| Year Ended October 31, 2018 | 15.55 | – | (f) | (2.51 | ) | (2.51 | ) | (0.07 | ) | – | (0.07 | ) | 12.97 | |||
| Year Ended October 31, 2017 | 13.35 | 0.02 | 2.21 | 2.23 | (0.03 | ) | – | (0.03 | ) | 15.55 | ||||||
| Class R Shares | ||||||||||||||||
| Year Ended October 31, 2021 | 16.60 | 0.01 | 3.42 | 3.43 | – | (0.14 | ) | (0.14 | ) | 19.89 | ||||||
| Year Ended October 31, 2020 | 15.14 | – | (f) | 1.68 | 1.68 | (0.21 | ) | (0.01 | ) | (0.22 | ) | 16.60 | ||||
| Year Ended October 31, 2019 | 13.00 | 0.07 | 2.21 | 2.28 | (0.12 | ) | (0.02 | ) | (0.14 | ) | 15.14 | |||||
| Year Ended October 31, 2018 | 15.61 | 0.06 | (2.52 | ) | (2.46 | ) | (0.15 | ) | – | (0.15 | ) | 13.00 | ||||
| Year Ended October 31, 2017 | 13.43 | 0.08 | 2.19 | 2.27 | (0.09 | ) | – | (0.09 | ) | 15.61 | ||||||
| Institutional Service Class Shares | ||||||||||||||||
| Year Ended October 31, 2021 | 16.85 | 0.12 | 3.46 | 3.58 | (0.03 | ) | (0.14 | ) | (0.17 | ) | 20.26 | |||||
| Year Ended October 31, 2020 | 15.37 | 0.07 | 1.70 | 1.77 | (0.28 | ) | (0.01 | ) | (0.29 | ) | 16.85 | |||||
| Year Ended October 31, 2019 | 13.19 | 0.23 | 2.16 | 2.39 | (0.19 | ) | (0.02 | ) | (0.21 | ) | 15.37 | |||||
| Year Ended October 31, 2018 | 15.78 | 0.14 | (2.55 | ) | (2.41 | ) | (0.18 | ) | – | (0.18 | ) | 13.19 | ||||
| Year Ended October 31, 2017 | 13.55 | 0.14 | 2.23 | 2.37 | (0.14 | ) | – | (0.14 | ) | 15.78 | ||||||
| Institutional Class Shares | ||||||||||||||||
| Year Ended October 31, 2021 | 16.90 | 0.14 | 3.48 | 3.62 | (0.04 | ) | (0.14 | ) | (0.18 | ) | 20.34 | |||||
| Year Ended October 31, 2020 | 15.39 | 0.09 | 1.72 | 1.81 | (0.29 | ) | (0.01 | ) | (0.30 | ) | 16.90 | |||||
| Year Ended October 31, 2019 | 13.20 | 0.13 | 2.27 | 2.40 | (0.19 | ) | (0.02 | ) | (0.21 | ) | 15.39 | |||||
| Year Ended October 31, 2018 | 15.81 | 0.15 | (2.55 | ) | (2.40 | ) | (0.21 | ) | – | (0.21 | ) | 13.20 | ||||
| Year Ended October 31, 2017 | 13.58 | 0.17 | 2.22 | 2.39 | (0.16 | ) | – | (0.16 | ) | 15.81 | ||||||
| (a) | Net investment income/(loss) is based on average shares outstanding during the period. | |
| (b) | Excludes sales charge. | |
| (c) | During the period, certain fees were waived and/or reimbursed. If such waivers/reimbursements had not occurred, the ratios would have been as indicated. |
Amounts listed as "–" are $0 or round to $0.
See accompanying Notes to Financial Statements.
| 2021 Annual Report | 101 |
Financial Highlights (continued)
Selected Data for Each Share of Capital Outstanding Throughout the Periods Indicated
Aberdeen Emerging Markets Fund (concluded)
| Ratios/Supplemental Data | |||||||||||||||||||||
| Total Return (b) | Net Assets at End of Period (000's) | Ratio of Expenses (Net of Reimbursements/ Waivers) to Average Net Assets | Ratio of Expenses (Prior to Reimbursements) to Average Net Assets (c) | Ratio of Net Investment Income (Loss) to Average Net Assets | Portfolio Turnover (d) | ||||||||||||||||
| 20.87 | % | $ 116,268 | 1.56 | %(e) | 1.56 | %(e) | 0.20% | 37.26 | % | ||||||||||||
| 11.31 | % | 107,572 | 1.59 | %(e) | 1.59 | %(e) | 0.09% | 26.13 | % | ||||||||||||
| 17.89 | % | 134,382 | 1.59 | %(e) | 1.59 | %(e) | 0.46% | 14.86 | % | ||||||||||||
| (15.80 | %) | 143,297 | 1.59 | %(e) | 1.59 | %(e) | 0.49% | 20.39 | % | ||||||||||||
| 17.39 | % | 208,084 | 1.56 | % | 1.56 | % | 0.70% | 16.55 | % | ||||||||||||
| 20.16 | % | 10,662 | 2.10 | %(e) | 2.13 | %(e) | (0.38% | ) | 37.26 | % | |||||||||||
| 10.74 | % | 11,786 | 2.10 | %(e) | 2.19 | %(e) | (0.40% | ) | 26.13 | % | |||||||||||
| 17.26 | % | 15,611 | 2.10 | %(e) | 2.20 | %(e) | (0.03% | ) | 14.86 | % | |||||||||||
| (16.20 | %) | 15,886 | 2.10 | %(e) | 2.21 | %(e) | – | (g) | 20.39 | % | |||||||||||
| 16.75 | % | 28,618 | 2.10 | % | 2.28 | % | 0.16% | 16.55 | % | ||||||||||||
| 20.68 | % | 133,696 | 1.72 | %(e) | 1.72 | %(e) | 0.04% | 37.26 | % | ||||||||||||
| 11.13 | % | 113,707 | 1.73 | %(e) | 1.73 | %(e) | 0.01% | 26.13 | % | ||||||||||||
| 17.72 | % | 108,487 | 1.75 | %(e) | 1.75 | %(e) | 0.48% | 14.86 | % | ||||||||||||
| (15.93 | %) | 89,874 | 1.75 | %(e) | 1.75 | %(e) | 0.40% | 20.39 | % | ||||||||||||
| 17.13 | % | 79,767 | 1.78 | % | 1.78 | % | 0.55% | 16.55 | % | ||||||||||||
| 21.29 | % | 476,046 | 1.21 | %(e) | 1.21 | %(e) | 0.56% | 37.26 | % | ||||||||||||
| 11.64 | %(h) | 362,229 | 1.24 | %(e) | 1.24 | %(e) | 0.50% | 26.13 | % | ||||||||||||
| 18.38 | %(h) | 297,466 | 1.24 | %(e) | 1.24 | %(e) | 1.55% | 14.86 | % | ||||||||||||
| (15.48 | %) | 118,917 | 1.16 | %(e) | 1.16 | %(e) | 0.89% | 20.39 | % | ||||||||||||
| 17.75 | % | 205,880 | 1.28 | % | 1.28 | % | 0.96% | 16.55 | % | ||||||||||||
| 21.45 | % | 4,184,781 | 1.10 | %(e) | 1.14 | %(e) | 0.69% | 37.26 | % | ||||||||||||
| 11.86 | % | 3,414,059 | 1.10 | %(e) | 1.18 | %(e) | 0.59% | 26.13 | % | ||||||||||||
| 18.45 | % | 4,420,838 | 1.10 | %(e) | 1.16 | %(e) | 0.91% | 14.86 | % | ||||||||||||
| (15.38 | %) | 5,511,182 | 1.10 | %(e) | 1.14 | %(e) | 1.00% | 20.39 | % | ||||||||||||
| 17.89 | % | 8,179,870 | 1.10 | % | 1.13 | % | 1.17% | 16.55 | % | ||||||||||||
| (d) | Portfolio turnover is calculated on the basis of the Fund as a whole without distinguishing among the classes of shares. | |
| (e) | Includes interest expense that amounts to less than 0.01%. | |
| (f) | Less than $0.005 per share. | |
| (g) | Amount is less than 0.005%. | |
| (h) | The total return shown above includes the impact of financial statement rounding of the NAV per share and/or financial statement adjustments. |
| 102 | 2021 Annual Report |
Financial Highlights (continued)
Selected Data for Each Share of Capital Outstanding Throughout the Periods Indicated
Aberdeen Emerging Markets Sustainable Leaders Fund
| Investment Activities | Distributions | ||||||||||||||||||
| Net Asset Value, Beginning of Period | Net Investment Income (Loss) (a) | Net Realized and Unrealized Gains (Losses) on Investments | Total from Investment Activities | Net Investment Income | Total Distributions | Net Asset Value, End of Period | |||||||||||||
| Class A Shares | |||||||||||||||||||
| Year Ended October 31, 2021 | $15.74 | $0.02 | $ 3.07 | $ 3.09 | $ – | (e) | $ – | (e) | $18.83 | ||||||||||
| Year Ended October 31, 2020 | 14.68 | – | (e) | 1.21 | 1.21 | (0.15 | ) | (0.15 | ) | 15.74 | |||||||||
| Year Ended October 31, 2019 | 13.28 | 0.12 | 1.57 | 1.69 | (0.29 | ) | (0.29 | ) | 14.68 | ||||||||||
| Year Ended October 31, 2018 | 15.04 | 0.15 | (1.78 | ) | (1.63 | ) | (0.13 | ) | (0.13 | ) | 13.28 | ||||||||
| Year Ended October 31, 2017 | 12.70 | 0.15 | 2.36 | 2.51 | (0.17 | ) | (0.17 | ) | 15.04 | ||||||||||
| Class C Shares | |||||||||||||||||||
| Year Ended October 31, 2021 | 14.79 | (0.11 | ) | 2.90 | 2.79 | – | – | 17.58 | |||||||||||
| Year Ended October 31, 2020 | 13.76 | (0.08 | ) | 1.12 | 1.04 | (0.01 | ) | (0.01 | ) | 14.79 | |||||||||
| Year Ended October 31, 2019 | 12.44 | 0.03 | 1.48 | 1.51 | (0.19 | ) | (0.19 | ) | 13.76 | ||||||||||
| Year Ended October 31, 2018 | 14.09 | 0.04 | (1.66 | ) | (1.62 | ) | (0.03 | ) | (0.03 | ) | 12.44 | ||||||||
| Year Ended October 31, 2017 | 11.89 | 0.04 | 2.23 | 2.27 | (0.07 | ) | (0.07 | ) | 14.09 | ||||||||||
| Class R Shares | |||||||||||||||||||
| Year Ended October 31, 2021 | 14.98 | (0.02 | ) | 2.91 | 2.89 | – | – | 17.87 | |||||||||||
| Year Ended October 31, 2020 | 13.97 | (0.03 | ) | 1.14 | 1.11 | (0.10 | ) | (0.10 | ) | 14.98 | |||||||||
| Year Ended October 31, 2019 | 12.65 | 0.08 | 1.50 | 1.58 | (0.26 | ) | (0.26 | ) | 13.97 | ||||||||||
| Year Ended October 31, 2018 | 14.33 | 0.10 | (1.68 | ) | (1.58 | ) | (0.10 | ) | (0.10 | ) | 12.65 | ||||||||
| Year Ended October 31, 2017 | 12.11 | 0.10 | 2.25 | 2.35 | (0.13 | ) | (0.13 | ) | 14.33 | ||||||||||
| Institutional Service Class Shares | |||||||||||||||||||
| Year Ended October 31, 2021 | 16.08 | 0.08 | 3.14 | 3.22 | (0.05 | ) | (0.05 | ) | 19.25 | ||||||||||
| Year Ended October 31, 2020 | 15.00 | 0.06 | 1.22 | 1.28 | (0.20 | ) | (0.20 | ) | 16.08 | ||||||||||
| Year Ended October 31, 2019 | 13.58 | 0.17 | 1.60 | 1.77 | (0.35 | ) | (0.35 | ) | 15.00 | ||||||||||
| Year Ended October 31, 2018 | 15.37 | 0.20 | (1.80 | ) | (1.60 | ) | (0.19 | ) | (0.19 | ) | 13.58 | ||||||||
| Year Ended October 31, 2017 | 12.98 | 0.19 | 2.41 | 2.60 | (0.21 | ) | (0.21 | ) | 15.37 | ||||||||||
| Institutional Class Shares | |||||||||||||||||||
| Year Ended October 31, 2021 | 16.15 | 0.09 | 3.15 | 3.24 | (0.05 | ) | (0.05 | ) | 19.34 | ||||||||||
| Year Ended October 31, 2020 | 15.06 | 0.06 | 1.23 | 1.29 | (0.20 | ) | (0.20 | ) | 16.15 | ||||||||||
| Year Ended October 31, 2019 | 13.63 | 0.17 | 1.61 | 1.78 | (0.35 | ) | (0.35 | ) | 15.06 | ||||||||||
| Year Ended October 31, 2018 | 15.43 | 0.21 | (1.82 | ) | (1.61 | ) | (0.19 | ) | (0.19 | ) | 13.63 | ||||||||
| Year Ended October 31, 2017 | 13.04 | 0.20 | 2.42 | 2.62 | (0.23 | ) | (0.23 | ) | 15.43 | ||||||||||
| (a) | Net investment income/(loss) is based on average shares outstanding during the period. | |
| (b) | Excludes sales charge. | |
| (c) | During the period, certain fees were waived and/or reimbursed. If such waivers/reimbursements had not occurred, the ratios would have been as indicated. |
Amounts listed as "–" are $0 or round to $0.
See accompanying Notes to Financial Statements.
| 2021 Annual Report | 103 |
Financial Highlights (continued)
Selected Data for Each Share of Capital Outstanding Throughout the Periods Indicated
Aberdeen Emerging Markets Sustainable Leaders Fund (concluded)
| Ratios/Supplemental Data | ||||||||||||||||
| Total Return (b) | Net Assets at End of Period (000's) | Ratio of Expenses (Net of Reimbursements/ Waivers) to Average Net Assets | Ratio of Expenses (Prior to Reimbursements) to Average Net Assets (c) | Ratio of Net Investment Income (Loss) to Average Net Assets | Portfolio Turnover (d) | |||||||||||
| 19.65 | % | $23,898 | 1.46 | %(f) | 1.46 | %(f) | 0.11 | % | 120.50 | % | ||||||
| 8.24 | % | 21,418 | 1.49 | %(f) | 1.49 | %(f) | 0.02 | % | 37.50 | % | ||||||
| 13.13 | % | 24,719 | 1.52 | %(g) | 1.52 | %(g) | 0.89 | % | 28.30 | % | ||||||
| (10.93 | %) | 24,957 | 1.38 | % | 1.38 | % | 0.99 | % | 20.75 | % | ||||||
| 20.05 | % | 39,619 | 1.39 | % | 1.39 | % | 1.09 | % | 13.11 | % | ||||||
| 18.86 | % | 1,159 | 2.11 | %(f) | 2.21 | %(f) | (0.59 | %) | 120.50 | % | ||||||
| 7.56 | %(h) | 2,432 | 2.10 | %(f) | 2.20 | %(f) | (0.55 | %) | 37.50 | % | ||||||
| 12.43 | %(h) | 4,330 | 2.12 | %(g) | 2.24 | %(g) | 0.21 | % | 28.30 | % | ||||||
| (11.54 | %) | 8,074 | 2.10 | % | 2.10 | % | 0.27 | % | 20.75 | % | ||||||
| 19.27 | % | 12,375 | 2.10 | % | 2.18 | % | 0.35 | % | 13.11 | % | ||||||
| 19.29 | % | 6,126 | 1.74 | %(f) | 1.74 | %(f) | (0.10 | %) | 120.50 | % | ||||||
| 7.97 | % | 3,244 | 1.74 | %(f) | 1.74 | %(f) | (0.22 | %) | 37.50 | % | ||||||
| 12.80 | % | 3,992 | 1.79 | %(g) | 1.79 | %(g) | 0.58 | % | 28.30 | % | ||||||
| (11.14 | %) | 5,041 | 1.64 | % | 1.64 | % | 0.74 | % | 20.75 | % | ||||||
| 19.70 | % | 7,335 | 1.70 | % | 1.70 | % | 0.75 | % | 13.11 | % | ||||||
| 20.02 | % | 94,132 | 1.16 | %(f) | 1.16 | %(f) | 0.41 | % | 120.50 | % | ||||||
| 8.58 | %(h) | 83,121 | 1.15 | %(f) | 1.15 | %(f) | 0.36 | % | 37.50 | % | ||||||
| 13.49 | %(h) | 85,934 | 1.16 | %(g) | 1.16 | %(g) | 1.23 | % | 28.30 | % | ||||||
| (10.58 | %) | 84,902 | 1.06 | % | 1.06 | % | 1.31 | % | 20.75 | % | ||||||
| 20.46 | % | 106,424 | 1.08 | % | 1.08 | % | 1.35 | % | 13.11 | % | ||||||
| 20.06 | % | 91,084 | 1.11 | %(f) | 1.15 | %(f) | 0.45 | % | 120.50 | % | ||||||
| 8.63 | %(h) | 107,158 | 1.10 | %(f) | 1.13 | %(f) | 0.41 | % | 37.50 | % | ||||||
| 13.55 | %(h) | 99,475 | 1.12 | %(g) | 1.13 | %(g) | 1.21 | % | 28.30 | % | ||||||
| (10.56 | %) | 272,152 | 1.02 | % | 1.02 | % | 1.37 | % | 20.75 | % | ||||||
| 20.47 | % | 367,341 | 1.02 | % | 1.02 | % | 1.43 | % | 13.11 | % | ||||||
| (d) | Portfolio turnover is calculated on the basis of the Fund as a whole without distinguishing among the classes of shares. | |
| (e) | Less than $0.005 per share. | |
| (f) | Includes interest expense that amounts to less than 0.01%. | |
| (g) | Includes interest expense that amounts to 0.02% for Class C and Institutional class. Includes interest expense that amounts to 0.01% for Class A, Class R and Institutional Service Class. | |
| (h) | The total return shown above includes the impact of financial statement rounding of the NAV per share and/or financial statement adjustments. |
| 104 | 2021 Annual Report |
Financial Highlights (continued)
Selected Data for Each Share of Capital Outstanding Throughout the Periods Indicated
Aberdeen Global Equity Fund
| Investment Activities | Distributions | ||||||||||||||||||||||||
| Net Asset Value, Beginning of Period | Net Investment Income (Loss) (a) | Net Realized and Unrealized Gains (Losses) on Investments | Total from Investment Activities | Net Investment Income | Net Realized Gains | Total Distributions | Net Asset Value, End of Period | ||||||||||||||||||
| Class A Shares | |||||||||||||||||||||||||
| Year Ended October 31, 2021 | $13.21 | $(0.06 | ) | $ 5.02 | $ 4.96 | $ – | $ – | $ – | $18.17 | ||||||||||||||||
| Year Ended October 31, 2020 | 12.87 | (0.01 | ) | 0.77 | 0.76 | (0.08 | ) | (0.34 | ) | (0.42 | ) | 13.21 | |||||||||||||
| Year Ended October 31, 2019 | 12.75 | 0.08 | 1.08 | 1.16 | (0.09 | ) | (0.95 | ) | (1.04 | ) | 12.87 | ||||||||||||||
| Year Ended October 31, 2018 | 14.66 | 0.09 | (0.72 | ) | (0.63 | ) | (0.10 | ) | (1.18 | ) | (1.28 | ) | 12.75 | ||||||||||||
| Year Ended October 31, 2017 | 12.35 | 0.10 | 2.30 | 2.40 | (0.09 | ) | – | (0.09 | ) | 14.66 | |||||||||||||||
| Class C Shares | |||||||||||||||||||||||||
| Year Ended October 31, 2021 | 12.27 | (0.15 | ) | 4.65 | 4.50 | – | – | – | 16.77 | ||||||||||||||||
| Year Ended October 31, 2020 | 11.98 | (0.08 | ) | 0.71 | 0.63 | – | (0.34 | ) | (0.34 | ) | 12.27 | ||||||||||||||
| Year Ended October 31, 2019 | 11.93 | 0.01 | 0.99 | 1.00 | – | (0.95 | ) | (0.95 | ) | 11.98 | |||||||||||||||
| Year Ended October 31, 2018 | 13.78 | – | (g) | (0.67 | ) | (0.67 | ) | – | (1.18 | ) | (1.18 | ) | 11.93 | ||||||||||||
| Year Ended October 31, 2017 | 11.65 | 0.01 | 2.18 | 2.19 | (0.06 | ) | – | (0.06 | ) | 13.78 | |||||||||||||||
| Class R Shares | �� | ||||||||||||||||||||||||
| Year Ended October 31, 2021 | 12.54 | (0.11 | ) | 4.76 | 4.65 | – | – | – | 17.19 | ||||||||||||||||
| Year Ended October 31, 2020 | 12.21 | (0.05 | ) | 0.73 | 0.68 | (0.01 | ) | (0.34 | ) | (0.35 | ) | 12.54 | |||||||||||||
| Year Ended October 31, 2019 | 12.15 | 0.03 | 1.01 | 1.04 | (0.03 | ) | (0.95 | ) | (0.98 | ) | 12.21 | ||||||||||||||
| Year Ended October 31, 2018 | 14.04 | 0.03 | (0.68 | ) | (0.65 | ) | (0.06 | ) | (1.18 | ) | (1.24 | ) | 12.15 | ||||||||||||
| Year Ended October 31, 2017 | 11.88 | 0.04 | 2.22 | 2.26 | (0.10 | ) | – | (0.10 | ) | 14.04 | |||||||||||||||
| Institutional Service Class Shares | |||||||||||||||||||||||||
| Year Ended October 31, 2021 | 13.41 | (0.02 | ) | 5.10 | 5.08 | – | – | – | 18.49 | ||||||||||||||||
| Year Ended October 31, 2020 | 13.05 | 0.02 | 0.80 | 0.82 | (0.12 | ) | (0.34 | ) | (0.46 | ) | 13.41 | ||||||||||||||
| Year Ended October 31, 2019 | 12.94 | 0.11 | 1.08 | 1.19 | (0.13 | ) | (0.95 | ) | (1.08 | ) | 13.05 | ||||||||||||||
| Year Ended October 31, 2018 | 14.87 | 0.13 | (0.73 | ) | (0.60 | ) | (0.15 | ) | (1.18 | ) | (1.33 | ) | 12.94 | ||||||||||||
| Year Ended October 31, 2017 | 12.53 | 0.13 | 2.34 | 2.47 | (0.13 | ) | – | (0.13 | ) | 14.87 | |||||||||||||||
| Institutional Class Shares | |||||||||||||||||||||||||
| Year Ended October 31, 2021 | 13.24 | – | (g) | 5.03 | 5.03 | – | – | – | 18.27 | ||||||||||||||||
| Year Ended October 31, 2020 | 12.88 | 0.03 | 0.79 | 0.82 | (0.12 | ) | (0.34 | ) | (0.46 | ) | 13.24 | ||||||||||||||
| Year Ended October 31, 2019 | 12.77 | 0.13 | 1.06 | 1.19 | (0.13 | ) | (0.95 | ) | (1.08 | ) | 12.88 | ||||||||||||||
| Year Ended October 31, 2018 | 14.69 | 0.14 | (0.73 | ) | (0.59 | ) | (0.15 | ) | (1.18 | ) | (1.33 | ) | 12.77 | ||||||||||||
| Year Ended October 31, 2017 | 12.40 | 0.16 | 2.26 | 2.42 | (0.13 | ) | – | (0.13 | ) | 14.69 | |||||||||||||||
| (a) | Net investment income/(loss) is based on average shares outstanding during the period. | |
| (b) | Excludes sales charge. | |
| (c) | During the period, certain fees were waived and/or reimbursed. If such waivers/reimbursements had not occurred, the ratios would have been as indicated. |
Amounts listed as "–" are $0 or round to $0.
See accompanying Notes to Financial Statements.
| 2021 Annual Report | 105 |
Financial Highlights (continued)
Selected Data for Each Share of Capital Outstanding Throughout the Periods Indicated
Aberdeen Global Equity Fund (concluded)
| Ratios/Supplemental Data | |||||||||||||||||
| Total Return (b) | Net Assets at End of Period (000's) | Ratio of Expenses (Net of Reimbursements/ Waivers) to Average Net Assets | Ratio of Expenses (Prior to Reimbursements) to Average Net Assets (c) | Ratio of Net Investment Income (Loss) to Average Net Assets | Portfolio Turnover (d) | ||||||||||||
| 37.55 | % | $ 27,814 | 1.53 | % | 2.17 | % | (0.35 | %) | 21.98 | % | |||||||
| 5.93 | %(e) | 22,455 | 1.53 | %(f) | 2.17 | %(f) | (0.06 | %) | 29.04 | % | |||||||
| 10.40 | %(e) | 26,719 | 1.53 | %(f) | 2.07 | %(f) | 0.66 | % | 32.68 | % | |||||||
| (4.97 | %) | 27,530 | 1.53 | % | 1.92 | % | 0.67 | % | 22.06 | % | |||||||
| 19.58 | % | 34,296 | 1.56 | %(f) | 1.68 | %(f) | 0.71 | % | 24.98 | % | |||||||
| 36.67 | % | 195 | 2.19 | % | 3.03 | % | (1.01 | %) | 21.98 | % | |||||||
| 5.24 | % | 205 | 2.19 | %(f) | 3.04 | %(f) | (0.68 | %) | 29.04 | % | |||||||
| 9.62 | % | 638 | 2.19 | %(f) | 2.95 | %(f) | 0.05 | % | 32.68 | % | |||||||
| (5.53 | %) | 1,713 | 2.19 | % | 2.77 | % | 0.02 | % | 22.06 | % | |||||||
| 18.85 | % | 2,181 | 2.19 | %(f) | 2.51 | %(f) | 0.06 | % | 24.98 | % | |||||||
| 37.08 | % | 903 | 1.87 | % | 2.51 | % | (0.69 | %) | 21.98 | % | |||||||
| 5.58 | % | 898 | 1.91 | %(f) | 2.55 | %(f) | (0.42 | %) | 29.04 | % | |||||||
| 9.83 | % | 1,554 | 1.94 | %(f) | 2.48 | %(f) | 0.26 | % | 32.68 | % | |||||||
| (5.27 | %) | 2,120 | 1.94 | % | 2.33 | % | 0.26 | % | 22.06 | % | |||||||
| 19.15 | % | 3,107 | 1.90 | %(f) | 2.02 | %(f) | 0.31 | % | 24.98 | % | |||||||
| 37.88 | % | 343 | 1.29 | % | 1.93 | % | (0.12 | %) | 21.98 | % | |||||||
| 6.25 | % | 250 | 1.29 | %(f) | 1.93 | %(f) | 0.18 | % | 29.04 | % | |||||||
| 10.56 | % | 265 | 1.29 | %(f) | 1.83 | %(f) | 0.88 | % | 32.68 | % | |||||||
| (4.65 | %) | 460 | 1.26 | % | 1.65 | % | 0.94 | % | 22.06 | % | |||||||
| 19.97 | % | 570 | 1.29 | %(f) | 1.41 | %(f) | 0.94 | % | 24.98 | % | |||||||
| 37.99 | % | 1,583 | 1.19 | % | 1.88 | % | (0.02 | %) | 21.98 | % | |||||||
| 6.39 | % | 1,409 | 1.19 | %(f) | 1.88 | %(f) | 0.27 | % | 29.04 | % | |||||||
| 10.71 | % | 1,390 | 1.19 | %(f) | 1.77 | %(f) | 1.01 | % | 32.68 | % | |||||||
| (4.63 | %) | 2,104 | 1.19 | % | 1.62 | % | 1.01 | % | 22.06 | % | |||||||
| 19.75 | % | 2,699 | 1.19 | %(f) | 1.32 | %(f) | 1.21 | % | 24.98 | % | |||||||
| (d) | Portfolio turnover is calculated on the basis of the Fund as a whole without distinguishing among the classes of shares. | |
| (e) | The total return shown above includes the impact of financial statement rounding of the NAV per share and/or financial statement adjustments. | |
| (f) | Includes interest expense that amounts to less than 0.01%. | |
| (g) | Less than $0.005 per share. |
| 106 | 2021 Annual Report |
Financial Highlights (continued)
Selected Data for Each Share of Capital Outstanding Throughout the Periods Indicated
Aberdeen Global Infrastructure Fund
| Investment Activities | Distributions | |||||||||||||||||||
| Net Asset Value, Beginning of Period | Net Investment Income | Net Realized and Unrealized Gains (Losses) on Investments | Total from Invest- ment Activities | Net Invest- ment Income | Net Realized Gains | Tax Return of Capital | Total Distri- butions | Redemp- tion Fees | Net Asset Value, End of Period | |||||||||||
| Class A Shares | ||||||||||||||||||||
| Year Ended October 31, 2021 | $19.03 | $0.45 | (d) | $5.41 | $5.86 | $(0.71 | ) | $ – | $ – | $(0.71 | ) | $ – | $24.18 | |||||||
| Year Ended October 31, 2020 | 21.93 | 0.53 | (d) | (2.59 | ) | (2.06 | ) | (0.56 | ) | (0.14 | ) | (0.14 | ) | (0.84 | ) | – | 19.03 | |||
| Year Ended October 31, 2019 | 18.82 | 0.30 | (d) | 3.48 | 3.78 | (0.64 | ) | (0.03 | ) | – | (0.67 | ) | – | 21.93 | ||||||
| Year Ended October 31, 2018(e) | 20.65 | 0.46 | (d) | (1.54 | ) | (1.08 | ) | (0.71 | ) | (0.04 | ) | – | (0.75 | ) | 0.00 | (f) | 18.82 | |||
| Year Ended October 31, 2017 | 17.55 | 0.66 | 3.15 | 3.81 | (0.71 | ) | – | – | (0.71 | ) | 0.00 | (f) | 20.65 | |||||||
| Institutional Class Shares | ||||||||||||||||||||
| Year Ended October 31, 2021 | 19.05 | 0.52 | (d) | 5.41 | 5.93 | (0.76 | ) | – | – | (0.76 | ) | – | 24.22 | |||||||
| Year Ended October 31, 2020 | 21.97 | 0.58 | (d) | (2.60 | ) | (2.02 | ) | (0.62 | ) | (0.14 | ) | (0.14 | ) | (0.90 | ) | – | 19.05 | |||
| Year Ended October 31, 2019 | 18.85 | 0.34 | (d) | 3.50 | 3.84 | (0.69 | ) | (0.03 | ) | – | (0.72 | ) | – | 21.97 | ||||||
| Year Ended October 31, 2018(e) | 20.68 | 0.54 | (d) | (1.57 | ) | (1.03 | ) | (0.76 | ) | (0.04 | ) | – | (0.80 | ) | 0.00 | (f) | 18.85 | |||
| Year Ended October 31, 2017 | 17.58 | 0.70 | 3.16 | 3.86 | (0.76 | ) | – | – | (0.76 | ) | 0.00 | (f) | 20.68 | |||||||
| (a) | Excludes sales charge. |
| (b) | During the period, certain fees were waived and/or reimbursed. If such waivers/reimbursements had not occurred, the ratios would have been as indicated. |
| (c) | Portfolio turnover is calculated on the basis of the Fund as a whole without distinguishing among the classes of shares. |
| (d) | Net investment income/(loss) is based on average shares outstanding during the period. |
Amounts listed as "–" are $0 or round to $0.
See accompanying notes to financial statements.
| 2021 Annual Report | 107 |
Financial Highlights (continued)
Selected Data for Each Share of Capital Outstanding Throughout the Periods Indicated
Aberdeen Global Infrastructure Fund (concluded)
| Ratios/Supplemental Data | |||||||||||||||
| Total Return (a) | Net Assets at End of Period (000's) | Ratio of Expenses (Net of Reimbursements/ Waivers) to Average Net Assets | Ratio of Expenses (Prior to Reimbursements) to Average Net Assets (b) | Ratio of Net Investment Income to Average Net Assets | Portfolio Turnover (c) | ||||||||||
| 31.09 | % | $ 13,227 | 1.24 | % | 1.63 | % | 1.95 | % | 30.75 | % | |||||
| (9.49 | %) | 9,206 | 1.33 | % | 1.55 | % | 2.61 | % | 23.76 | % | |||||
| 20.41 | % | 12,776 | 1.45 | % | 1.59 | % | 1.46 | % | 31.62 | % | |||||
| (5.39 | %) | 12,310 | 1.45 | % | 1.58 | % | 2.29 | % | 48.54 | % | |||||
| 22.13 | % | 20,132 | 1.46 | %(g) | 1.58 | %(g) | 3.48 | % | 77.00 | % | |||||
| 31.43 | % | 45,076 | 0.99 | % | 1.38 | % | 2.25 | % | 30.75 | % | |||||
| (9.30 | %) | 32,640 | 1.08 | % | 1.27 | % | 2.90 | % | 23.76 | % | |||||
| 20.73 | % | 87,441 | 1.20 | % | 1.31 | % | 1.68 | % | 31.62 | % | |||||
| (5.13 | %) | 95,025 | 1.20 | % | 1.32 | % | 2.70 | % | 48.54 | % | |||||
| 22.39 | % | 115,567 | 1.21 | %(g) | 1.33 | %(g) | 3.56 | % | 77.00 | % | |||||
| (e) | Beginning with the year ended October 31, 2018, the Fund has been audited by KPMG LLP. Previous years were audited by different independent registered public accounting firms. |
| (f) | Less than $0.005 per share. |
| (g) | Includes interest expense that amounts to less than 0.01% for Class A and Institutional Class for the year ended October 31, 2017. |
| 108 | 2021 Annual Report |
Financial Highlights (continued)
Selected Data for Each Share of Capital Outstanding Throughout the Periods Indicated
Aberdeen International Real Estate Equity Fund
| Investment Activities | Distributions | |||||||||||||||||||||
| Net Asset Value, Beginning of Period | Net Investment Income | Net Realized and Unrealized Gains (Losses) on Investments | Total from Investment Activities | Net Investment Income | Total Distributions | Redemption Fees | Net Asset Value, End of Period | |||||||||||||||
| Class A Shares | ||||||||||||||||||||||
| Year Ended October 31, 2021 | $17.80 | $0.47 | (d) | $2.72 | $3.19 | $(0.37 | ) | $(0.37 | ) | $ – | $20.62 | |||||||||||
| Year Ended October 31, 2020 | 23.71 | 0.30 | (d) | (3.52 | ) | (3.22 | ) | (2.69 | ) | (2.69 | ) | – | 17.80 | |||||||||
| Year Ended October 31, 2019 | 20.02 | 0.33 | (d) | 3.99 | 4.32 | (0.63 | ) | (0.63 | ) | – | 23.71 | |||||||||||
| Year Ended October 31, 2018(f) | 22.82 | 0.14 | (d) | (2.46 | ) | (2.32 | ) | (0.48 | ) | (0.48 | ) | 0.00 | (g) | 20.02 | ||||||||
| Year Ended October 31, 2017 | 19.33 | 0.02 | 3.47 | 3.49 | – | – | 0.00 | (g) | 22.82 | |||||||||||||
| Institutional Class Shares | ||||||||||||||||||||||
| Year Ended October 31, 2021 | 17.95 | 0.41 | (d) | 2.82 | 3.23 | (0.69 | ) | (0.69 | ) | — | 20.49 | |||||||||||
| Year Ended October 31, 2020 | 23.87 | 0.35 | (d) | (3.53 | ) | (3.18 | ) | (2.74 | ) | (2.74 | ) | — | 17.95 | |||||||||
| Year Ended October 31, 2019 | 20.17 | 0.38 | (d) | 4.01 | 4.39 | (0.69 | ) | (0.69 | ) | — | 23.87 | |||||||||||
| Year Ended October 31, 2018(f) | 22.99 | 0.21 | (d) | (2.49 | ) | (2.28 | ) | (0.54 | ) | (0.54 | ) | 0.00 | (g) | 20.17 | ||||||||
| Year Ended October 31, 2017 | 19.46 | 0.20 | 3.36 | 3.56 | (0.03 | ) | (0.03 | ) | 0.00 | (g) | 22.99 | |||||||||||
(a) Excludes sales charge.
(b) During the period, certain fees were waived and/or reimbursed. If such waivers/reimbursements had not occurred, the ratios would have been as indicated.
(c) Portfolio turnover is calculated on the basis of the Fund as a whole without distinguishing among the classes of shares.
(d) Net investment income/(loss) is based on average shares outstanding during the period.
Amounts listed as "–" are $0 or round to $0.
See accompanying Notes to Financial Statements.
| 2021 Annual Report | 109 |
Financial Highlights (continued)
Selected Data for Each Share of Capital Outstanding Throughout the Periods Indicated
Aberdeen International Real Estate Equity Fund (concluded)
| Ratios/Supplemental Data | |||||||||||||||
| Total Return (a) | Net Assets at End of Period (000's) | Ratio of Expenses (Net of Reimbursements/ Waivers) to Average Net Assets | Ratio of Expenses (Prior to Reimbursements) to Average Net Assets (b) | Ratio of Net Investment Income to Average Net Assets | Portfolio Turnover (c) | ||||||||||
| 18.04 | % | $ 39 | 1.62 | %(e) | 2.45 | %(e) | 2.26 | % | 63.68 | % | |||||
| (15.48 | %) | 21 | 1.65 | %(e) | 1.98 | %(e) | 1.58 | % | 57.05 | % | |||||
| 22.29 | % | 177 | 1.62 | %(e) | 1.65 | %(e) | 1.51 | % | 60.73 | % | |||||
| (10.52 | %) | 135 | 1.63 | %(e) | 1.67 | %(e) | 0.62 | % | 89.59 | % | |||||
| 18.05 | % | 176 | 1.61 | %(e) | 1.62 | %(e) | 0.75 | % | 60.00 | % | |||||
| 18.28 | % | 21,160 | 1.37 | %(e) | 2.07 | %(e) | 1.99 | % | 63.68 | % | |||||
| (15.27 | %) | 20,570 | 1.40 | %(e) | 1.73 | %(e) | 1.74 | % | 57.05 | % | |||||
| 22.57 | %(h) | 56,510 | 1.37 | %(e) | 1.40 | %(e) | 1.74 | % | 60.73 | % | |||||
| (10.35 | %) | 97,453 | 1.38 | %(e) | 1.39 | %(e) | 0.89 | % | 89.59 | % | |||||
| 18.36 | % | 117,484 | 1.35 | %(e) | 1.37 | %(e) | 0.94 | % | 60.00 | % | |||||
| (e) | Includes interest expense that amounts to less than 0.01%, 0.02%, 0.01%, 0.02% and less than 0.01% for Class A and Institutional Class for the years ended October 31, 2021, October 31, 2020, October 31, 2019, October 31, 2018, and October 31, 2017, respectively. |
| (f) | Beginning with the year ended October 31, 2018, the Fund has been audited by KPMG LLP. Previous years were audited by different independent registered public accounting firms. |
| (g) | Less than $0.005 per share. |
| (h) | The total return shown above includes the impact of financial statement rounding of the NAV per share and/or financial statement adjustments. |
| 110 | 2021 Annual Report |
Financial Highlights (continued)
Selected Data for Each Share of Capital Outstanding Throughout the Periods Indicated
Aberdeen International Small Cap Fund
| Investment Activities | Distributions | |||||||||||||||||||||||||||||||
| Net Asset Value, Beginning of Period | Net Investment Income (Loss) (a) | Net Realized and Unrealized Gains (Losses) on Investments | Total from Investment Activities | Net Investment Income | Net Realized Gains | Total Distributions | Net Asset Value, End of Period | |||||||||||||||||||||||||
| Class A Shares | ||||||||||||||||||||||||||||||||
| Year Ended October 31, 2021 | $ 30.18 | $(0.20 | ) | $12.75 | $12.55 | $ – | $ – | $ – | $ 42.73 | |||||||||||||||||||||||
| Year Ended October 31, 2020 | 28.11 | (0.09 | ) | 3.63 | 3.54 | (0.34 | ) | (1.13 | ) | (1.47 | ) | 30.18 | ||||||||||||||||||||
| Year Ended October 31, 2019 | 29.23 | 0.23 | 3.03 | 3.26 | (0.65 | ) | (3.73 | ) | (4.38 | ) | 28.11 | |||||||||||||||||||||
| Year Ended October 31, 2018 | 31.35 | 0.47 | (1.56 | ) | (1.09 | ) | (0.17 | ) | (0.86 | ) | (1.03 | ) | 29.23 | |||||||||||||||||||
| Year Ended October 31, 2017 | 25.97 | 0.11 | 5.49 | 5.60 | (0.14 | ) | (0.08 | ) | (0.22 | ) | 31.35 | |||||||||||||||||||||
| Class C Shares | ||||||||||||||||||||||||||||||||
| Year Ended October 31, 2021 | 27.16 | (0.39 | ) | 11.44 | 11.05 | – | – | – | 38.21 | |||||||||||||||||||||||
| Year Ended October 31, 2020 | 25.43 | (0.25 | ) | 3.27 | 3.02 | (0.16 | ) | (1.13 | ) | (1.29 | ) | 27.16 | ||||||||||||||||||||
| Year Ended October 31, 2019 | 26.73 | (0.04 | ) | 2.84 | 2.80 | (0.37 | ) | (3.73 | ) | (4.10 | ) | 25.43 | ||||||||||||||||||||
| Year Ended October 31, 2018 | 28.78 | 0.20 | (1.39 | ) | (1.19 | ) | – | (0.86 | ) | (0.86 | ) | 26.73 | ||||||||||||||||||||
| Year Ended October 31, 2017 | 23.88 | (0.04 | ) | 5.02 | 4.98 | – | (0.08 | ) | (0.08 | ) | 28.78 | |||||||||||||||||||||
| Class R Shares | ||||||||||||||||||||||||||||||||
| Year Ended October 31, 2021 | 28.31 | (0.28 | ) | 11.94 | 11.66 | – | – | – | 39.97 | |||||||||||||||||||||||
| Year Ended October 31, 2020 | 26.46 | (0.15 | ) | 3.40 | 3.25 | (0.27 | ) | (1.13 | ) | (1.40 | ) | 28.31 | ||||||||||||||||||||
| Year Ended October 31, 2019 | 27.74 | 0.12 | 2.88 | 3.00 | (0.55 | ) | (3.73 | ) | (4.28 | ) | 26.46 | |||||||||||||||||||||
| Year Ended October 31, 2018 | 29.82 | 0.30 | (1.43 | ) | (1.13 | ) | (0.09 | ) | (0.86 | ) | (0.95 | ) | 27.74 | |||||||||||||||||||
| Year Ended October 31, 2017 | 24.77 | 0.04 | 5.20 | 5.24 | (0.11 | ) | (0.08 | ) | (0.19 | ) | 29.82 | |||||||||||||||||||||
| Institutional Class Shares | ||||||||||||||||||||||||||||||||
| Year Ended October 31, 2021 | 30.37 | (0.06 | ) | 12.84 | 12.78 | – | – | – | 43.15 | |||||||||||||||||||||||
| Year Ended October 31, 2020 | 28.25 | 0.01 | 3.65 | 3.66 | (0.41 | ) | (1.13 | ) | (1.54 | ) | 30.37 | |||||||||||||||||||||
| Year Ended October 31, 2019 | 29.33 | 0.27 | 3.11 | 3.38 | (0.73 | ) | (3.73 | ) | (4.46 | ) | 28.25 | |||||||||||||||||||||
| Year Ended October 31, 2018 | 31.43 | 0.58 | (1.57 | ) | (0.99 | ) | (0.25 | ) | (0.86 | ) | (1.11 | ) | 29.33 | |||||||||||||||||||
| Year Ended October 31, 2017 | 26.04 | 0.19 | 5.49 | 5.68 | (0.21 | ) | (0.08 | ) | (0.29 | ) | 31.43 | |||||||||||||||||||||
(a) Net investment income/(loss) is based on average shares outstanding during the period.
(b) Excludes sales charge.
(c) During the period, certain fees were waived and/or reimbursed. If such waivers/reimbursements had not occurred, the ratios would have been as indicated.
Amounts listed as "–" are $0 or round to $0.
See accompanying Notes to Financial Statements.
| 2021 Annual Report | 111 |
Financial Highlights (continued)
Selected Data for Each Share of Capital Outstanding Throughout the Periods Indicated
Aberdeen International Small Cap Fund (concluded)
| Ratios/Supplemental Data | ||||||||||
| Total Return (b) | Net Assets at End of Period (000's) | Ratio of Expenses (Net of Reimbursements/ Waivers) to Average Net Assets | Ratio of Expenses (Prior to Reimbursements) to Average Net Assets (c) | Ratio of Net Investment Income (Loss) to Average Net Assets | Portfolio Turnover (d) | |||||
| 41.58%(e) | $112,408 | 1.34%(f) | 1.42%(f) | (0.54%) | 42.63% | |||||
| 13.02% | 90,560 | 1.40% | 1.61% | (0.33%) | 29.65% | |||||
| 13.93% | 75,754 | 1.49%(f) | 1.82%(f) | 0.86% | 35.37% | |||||
| (3.68%) | 49,391 | 1.53%(f) | 1.88%(f) | 1.48% | 18.07% | |||||
| 21.79% | 59,477 | 1.63%(f) | 2.07%(f) | 0.40% | 20.60% | |||||
| 40.68%(e) | 561 | 1.99%(f) | 2.18%(f) | (1.15%) | 42.63% | |||||
| 12.27% | 554 | 2.05% | 2.38% | (1.02%) | 29.65% | |||||
| 13.21% | 829 | 2.15%(f) | 2.59%(f) | (0.17%) | 35.37% | |||||
| (4.31%) | 565 | 2.22%(f) | 2.65%(f) | 0.69% | 18.07% | |||||
| 20.94% | 1,591 | 2.30%(f) | 2.84%(f) | (0.17%) | 20.60% | |||||
| 41.19% | 2,535 | 1.62%(f) | 1.70%(f) | (0.80%) | 42.63% | |||||
| 12.68% | 1,649 | 1.69% | 1.90% | (0.61%) | 29.65% | |||||
| 13.62% | 1,945 | 1.80%(f) | 2.13%(f) | 0.47% | 35.37% | |||||
| (3.98%) | 2,309 | 1.84%(f) | 2.19%(f) | 1.02% | 18.07% | |||||
| 21.34% | 1,707 | 1.99%(f) | 2.43%(f) | 0.14% | 20.60% | |||||
| 42.08%(e) | 191,244 | 0.99%(f) | 1.15%(f) | (0.15%) | 42.63% | |||||
| 13.41% | 46,330 | 1.04% | 1.35% | 0.03% | 29.65% | |||||
| 14.39% | 35,248 | 1.15%(f) | 1.57%(f) | 1.01% | 35.37% | |||||
| (3.34%) | 12,418 | 1.20%(f) | 1.61%(f) | 1.84% | 18.07% | |||||
| 22.14% | 17,141 | 1.30%(f) | 1.79%(f) | 0.69% | 20.60% | |||||
(d) Portfolio turnover is calculated on the basis of the Fund as a whole without distinguishing among the classes of shares.
(e) The total return shown above includes the impact of financial statement rounding of the NAV per share and/or financial statement adjustments.
(f) Includes interest expense that amounts to less than 0.01%.
| 112 | 2021 Annual Report |
Financial Highlights (continued)
Selected Data for Each Share of Capital Outstanding Throughout the Periods Indicated
Aberdeen Realty Income & Growth Fund
| Investment Activities | Distributions | |||||||||||||||||||||||||||||||||||
| Net Asset Value, Beginning of Period | Net Investment Income (Loss) | Net Realized and Unrealized Gains (Losses) on Invest- ments | Total from Invest- ment Activities | Net Invest- ment Income | Net Realized Gains | Total Distri- butions | Redemp- tion Fees | Net Asset Value, End of Period | ||||||||||||||||||||||||||||
| Class A Shares | ||||||||||||||||||||||||||||||||||||
| Year Ended October 31, 2021 | $12.40 | $ 0.11 | (d) | $ 4.84 | $ 4.95 | $(0.13 | ) | $(1.54 | ) | $(1.67 | ) | $ – | $15.68 | |||||||||||||||||||||||
| Year Ended October 31, 2020 | 17.98 | 0.25 | (d) | (3.17 | ) | (2.92 | ) | (0.60 | ) | (2.06 | ) | (2.66 | ) | – | 12.40 | |||||||||||||||||||||
| Year Ended October 31, 2019 | 21.38 | 0.32 | (d) | 3.28 | 3.60 | (0.52 | ) | (6.48 | ) | (7.00 | ) | – | 17.98 | |||||||||||||||||||||||
| Year Ended October 31, 2018(f) | 22.93 | 0.47 | (d) | (0.74 | ) | (0.27 | ) | (0.69 | ) | (0.59 | ) | (1.28 | ) | 0.00 | (g) | 21.38 | ||||||||||||||||||||
| Year Ended October 31, 2017 | 22.09 | (0.41 | ) | 2.42 | 2.01 | (0.70 | ) | (0.47 | ) | (1.17 | ) | 0.00 | (g) | 22.93 | ||||||||||||||||||||||
| Institutional Class Shares | ||||||||||||||||||||||||||||||||||||
| Year Ended October 31, 2021 | 12.44 | 0.14 | (d) | 4.86 | 5.00 | (0.16 | ) | (1.54 | ) | (1.70 | ) | – | 15.74 | |||||||||||||||||||||||
| Year Ended October 31, 2020 | 18.02 | 0.28 | (d) | (3.16 | ) | (2.88 | ) | (0.64 | ) | (2.06 | ) | (2.70 | ) | – | 12.44 | |||||||||||||||||||||
| Year Ended October 31, 2019 | 21.41 | 0.36 | (d) | 3.29 | 3.65 | (0.56 | ) | (6.48 | ) | (7.04 | ) | – | 18.02 | |||||||||||||||||||||||
| Year Ended October 31, 2018(f) | 22.97 | 0.54 | (d) | (0.76 | ) | (0.22 | ) | (0.75 | ) | (0.59 | ) | (1.34 | ) | 0.00 | (g) | 21.41 | ||||||||||||||||||||
| Year Ended October 31, 2017 | 22.11 | 0.20 | 1.88 | 2.08 | (0.75 | ) | (0.47 | ) | (1.22 | ) | 0.00 | (g) | 22.97 | |||||||||||||||||||||||
| (a) | Excludes sales charge. |
| (b) | During the period, certain fees were waived and/or reimbursed. If such waivers/reimbursements had not occurred, the ratios would have been as indicated. |
| (c) | Portfolio turnover is calculated on the basis of the Fund as a whole without distinguishing among the classes of shares. |
| (d) | Net investment income/(loss) is based on average shares outstanding during the period. |
Amounts listed as "–" are $0 or round to $0.
See accompanying Notes to Financial Statements.
| 2021 Annual Report | 113 |
Financial Highlights (continued)
Selected Data for Each Share of Capital Outstanding Throughout the Periods Indicated
Aberdeen Realty Income & Growth Fund (concluded)
| Ratios/Supplemental Data | ||||||||||
| Total Return (a) | Net Assets at End of Period (000's) | Ratio of Expenses (Net of Reimbursements/ Waivers) to Average Net Assets | Ratio of Expenses (Prior to Reimbursements) to Average Net Assets (b) | Ratio of Net Investment Income to Average Net Assets | Portfolio Turnover (c) | |||||
| 44.07% | $ 1,090 | 1.26%(e) | 1.72%(e) | 0.80% | 32.52% | |||||
| (18.12%) | 1,971 | 1.30%(e) | 1.71%(e) | 1.84% | 22.61% | |||||
| 25.65% | 2,341 | 1.28%(e) | 1.71%(e) | 1.83% | 20.70% | |||||
| (1.35%) | 1,751 | 1.34%(e) | 1.71%(e) | 2.16% | 42.71% | |||||
| 9.37% | 1,565 | 1.46%(e) | 1.65%(e) | 0.66% | 7.00% | |||||
| 44.41% | 56,593 | 1.01%(e) | 1.47%(e) | 1.01% | 32.52% | |||||
| (17.85%) | 46,235 | 1.05%(e) | 1.48%(e) | 2.05% | 22.61% | |||||
| 25.97% | 75,232 | 1.03%(e) | 1.39%(e) | 2.10% | 20.70% | |||||
| (1.15%) | 83,573 | 1.10%(e) | 1.45%(e) | 2.46% | 42.71% | |||||
| 9.65% | 107,042 | 1.21%(e) | 1.40%(e) | 0.92% | 7.00% | |||||
| (e) | Includes interest expense that amounts to 0.01%, 0.05%, 0.03%, 0.10%, and 0.10% for Class A and Institutional Class for the years ended October 31, 2021, October 31, 2020, October 31, 2019, October 31, 2018, and October 31, 2017, respectively. |
| (f) | Beginning with the year ended October 31, 2018, the Fund has been audited by KPMG LLP. Previous years were audited by different independent registered public accounting firms. |
| (g) | Less than $0.005 per share. |
| 114 | 2021 Annual Report |
Financial Highlights (continued)
Selected Data for Each Share of Capital Outstanding Throughout the Periods Indicated
Aberdeen U.S. Small Cap Equity Fund
| Investment Activities | Distributions | ||||||||||||||||||||||||||||
| Net Asset Value, Beginning of Period | Net Investment Income (Loss) (a) | Net Realized and Unrealized Gains (Losses) on Investments | Total from Investment Activities | Net Investment Income | Net Realized Gains | Total Distributions | Net Asset Value, End of Period | ||||||||||||||||||||||
| Class A Shares | |||||||||||||||||||||||||||||
| Year Ended October 31, 2021 | $33.55 | $(0.24 | ) | $18.64 | $18.40 | $ – | $(2.38 | ) | $(2.38 | ) | $49.57 | ||||||||||||||||||
| Year Ended October 31, 2020 | 33.19 | (0.20 | ) | 3.08 | 2.88 | – | (2.52 | ) | (2.52 | ) | 33.55 | ||||||||||||||||||
| Year Ended October 31, 2019 | 35.39 | (0.10 | ) | 1.78 | 1.68 | – | (f) | (3.88 | ) | (3.88 | ) | 33.19 | |||||||||||||||||
| Year Ended October 31, 2018 | 35.61 | (0.08 | ) | (0.14 | ) | (0.22 | ) | – | – | – | 35.39 | ||||||||||||||||||
| Year Ended October 31, 2017 | 28.71 | (0.11 | ) | 7.01 | 6.90 | – | – | – | 35.61 | ||||||||||||||||||||
| Class C Shares | |||||||||||||||||||||||||||||
| Year Ended October 31, 2021 | 27.48 | (0.42 | ) | 15.11 | 14.69 | – | (2.38 | ) | (2.38 | ) | 39.79 | ||||||||||||||||||
| Year Ended October 31, 2020 | 27.79 | (0.33 | ) | 2.54 | 2.21 | – | (2.52 | ) | (2.52 | ) | 27.48 | ||||||||||||||||||
| Year Ended October 31, 2019 | 30.53 | (0.27 | ) | 1.41 | 1.14 | – | (3.88 | ) | (3.88 | ) | 27.79 | ||||||||||||||||||
| Year Ended October 31, 2018 | 30.94 | (0.30 | ) | (0.11 | ) | (0.41 | ) | – | – | – | 30.53 | ||||||||||||||||||
| Year Ended October 31, 2017 | 25.12 | (0.30 | ) | 6.12 | 5.82 | – | – | – | 30.94 | ||||||||||||||||||||
| Class R Shares | |||||||||||||||||||||||||||||
| Year Ended October 31, 2021 | 30.12 | (0.32 | ) | 16.65 | 16.33 | – | (2.38 | ) | (2.38 | ) | 44.07 | ||||||||||||||||||
| Year Ended October 31, 2020 | 30.14 | (0.27 | ) | 2.77 | 2.50 | – | (2.52 | ) | (2.52 | ) | 30.12 | ||||||||||||||||||
| Year Ended October 31, 2019 | 32.64 | (0.19 | ) | 1.57 | 1.38 | – | (3.88 | ) | (3.88 | ) | 30.14 | ||||||||||||||||||
| Year Ended October 31, 2018 | 32.97 | (0.18 | ) | (0.15 | ) | (0.33 | ) | – | – | – | 32.64 | ||||||||||||||||||
| Year Ended October 31, 2017 | 26.67 | (0.21 | ) | 6.51 | 6.30 | – | – | – | 32.97 | ||||||||||||||||||||
| Institutional Service Class Shares | |||||||||||||||||||||||||||||
| Year Ended October 31, 2021 | 36.06 | (0.15 | ) | 20.12 | 19.97 | – | (2.38 | ) | (2.38 | ) | 53.65 | ||||||||||||||||||
| Year Ended October 31, 2020 | 35.41 | (0.12 | ) | 3.29 | 3.17 | – | (2.52 | ) | (2.52 | ) | 36.06 | ||||||||||||||||||
| Year Ended October 31, 2019 | 37.39 | (0.01 | ) | 1.93 | 1.92 | (0.02 | ) | (3.88 | ) | (3.90 | ) | 35.41 | |||||||||||||||||
| Year Ended October 31, 2018 | 37.51 | 0.01 | (0.13 | ) | (0.12 | ) | – | – | – | 37.39 | |||||||||||||||||||
| Year Ended October 31, 2017 | 30.17 | (0.03 | ) | 7.37 | 7.34 | – | – | – | 37.51 | ||||||||||||||||||||
| Institutional Class Shares | |||||||||||||||||||||||||||||
| Year Ended October 31, 2021 | 36.09 | (0.10 | ) | 20.14 | 20.04 | – | (2.38 | ) | (2.38 | ) | 53.75 | ||||||||||||||||||
| Year Ended October 31, 2020 | 35.40 | (0.09 | ) | 3.30 | 3.21 | – | (2.52 | ) | (2.52 | ) | 36.09 | ||||||||||||||||||
| Year Ended October 31, 2019 | 37.37 | 0.01 | 1.92 | 1.93 | (0.02 | ) | (3.88 | ) | (3.90 | ) | 35.40 | ||||||||||||||||||
| Year Ended October 31, 2018 | 37.49 | 0.02 | (0.14 | ) | (0.12 | ) | – | – | – | 37.37 | |||||||||||||||||||
| Year Ended October 31, 2017 | 30.14 | (0.02 | ) | 7.37 | 7.35 | – | – | – | 37.49 | ||||||||||||||||||||
(a) Net investment income/(loss) is based on average shares outstanding during the period.
(b) Excludes sales charge.
(c) During the period, certain fees were waived and/or reimbursed. If such waivers/reimbursements had not occurred, the ratios would have been as indicated.
(d) Portfolio turnover is calculated on the basis of the Fund as a whole without distinguishing among the classes of shares.
Amounts listed as "–" are $0 or round to $0.
See accompanying Notes to Financial Statements.
| 2021 Annual Report | 115 |
Financial Highlights (continued)
Selected Data for Each Share of Capital Outstanding Throughout the Periods Indicated
Aberdeen U.S. Small Cap Equity Fund (concluded)
| Ratios/Supplemental Data | ||||||||||||||||
| Total Return (b) | Net Assets at End of Period (000's) | Ratio of Expenses (Net of Reimbursements/ Waivers) to Average Net Assets | Ratio of Expenses (Prior to Reimbursements) to Average Net Assets (c) | Ratio of Net Investment Income (Loss) to Average Net Assets | Portfolio Turnover (d) | |||||||||||
| 56.92 | % | $172,963 | 1.35 | % | 1.35 | % | (0.56 | %) | 78.38 | % | ||||||
| 8.97 | % | 124,673 | 1.40 | %(e) | 1.40 | %(e) | (0.62 | %) | 60.67 | % | ||||||
| 7.15 | % | 159,391 | 1.41 | %(e) | 1.41 | %(e) | (0.33 | %) | 55.00 | % | ||||||
| (0.62 | %) | 224,804 | 1.35 | %(e) | 1.35 | %(e) | (0.23 | %) | 38.28 | % | ||||||
| 24.03 | % | 316,766 | 1.38 | % | 1.38 | % | (0.33 | %) | 42.71 | % | ||||||
| 55.93 | % | 44,295 | 1.99 | % | 2.06 | % | (1.20 | %) | 78.38 | % | ||||||
| 8.25 | % | 36,621 | 2.05 | %(e) | 2.10 | %(e) | (1.26 | %) | 60.67 | % | ||||||
| 6.41 | % | 48,382 | 2.10 | %(e) | 2.10 | %(e) | (0.99 | %) | 55.00 | % | ||||||
| (1.33 | %) | 75,913 | 2.06 | %(e) | 2.06 | %(e) | (0.95 | %) | 38.28 | % | ||||||
| 23.17 | % | 95,913 | 2.10 | % | 2.10 | % | (1.05 | %) | 42.71 | % | ||||||
| 56.50 | % | 5,408 | 1.63 | % | 1.63 | % | (0.84 | %) | 78.38 | % | ||||||
| 8.59 | % | 3,554 | 1.75 | %(e) | 1.75 | %(e) | (0.96 | %) | 60.67 | % | ||||||
| 6.78 | % | 5,272 | 1.75 | %(e) | 1.75 | %(e) | (0.65 | %) | 55.00 | % | ||||||
| (1.00 | %) | 8,430 | 1.72 | %(e) | 1.72 | %(e) | (0.55 | %) | 38.28 | % | ||||||
| 23.62 | %(g) | 20,595 | 1.72 | % | 1.72 | % | (0.67 | %) | 42.71 | % | ||||||
| 57.33 | % | 41,568 | 1.11 | % | 1.11 | % | (0.31 | %) | 78.38 | % | ||||||
| 9.24 | % | 31,548 | 1.13 | %(e) | 1.13 | %(e) | (0.35 | %) | 60.67 | % | ||||||
| 7.44 | % | 40,476 | 1.12 | %(e) | 1.12 | %(e) | (0.04 | %) | 55.00 | % | ||||||
| (0.32 | %) | 50,163 | 1.08 | %(e) | 1.08 | %(e) | 0.03 | % | 38.28 | % | ||||||
| 24.33 | %(g) | 61,897 | 1.13 | % | 1.13 | % | (0.08 | %) | 42.71 | % | ||||||
| 57.48 | % | 931,614 | 0.99 | % | 1.06 | % | (0.21 | %) | 78.38 | % | ||||||
| 9.37 | % | 536,973 | 1.04 | %(e) | 1.10 | %(e) | (0.27 | %) | 60.67 | % | ||||||
| 7.48 | % | 607,103 | 1.11 | %(e) | 1.11 | %(e) | 0.03 | % | 55.00 | % | ||||||
| (0.32 | %) | 1,263,907 | 1.07 | %(e) | 1.07 | %(e) | 0.04 | % | 38.28 | % | ||||||
| 24.39 | % | 1,467,787 | 1.10 | % | 1.10 | % | (0.06 | %) | 42.71 | % | ||||||
(e) Includes interest expense that amounts to less than 0.01%.
(f) Less than $0.005 per share.
(g) The total return shown above includes the impact of financial statement rounding of the NAV per share and/or financial statement adjustments.
| 116 | 2021 Annual Report |
Financial Highlights (continued)
Selected Data for Each Share of Capital Outstanding Throughout the Periods Indicated
Aberdeen U.S. Sustainable Leaders Fund
| Investment Activities | Distributions | |||||||||||||||||||||||||||||||
| Net Asset Value, Beginning of Period | Net Investment Income (Loss) (a) | Net Realized and Unrealized Gains (Losses) on Investments | Total from Investment Activities | Net Investment Income | Net Realized Gains | Total Distributions | Net Asset Value, End of Period | |||||||||||||||||||||||||
| Class A Shares | ||||||||||||||||||||||||||||||||
| Year Ended October 31, 2021 | $ 13.79 | $ (0.05 | ) | $ 5.31 | $ 5.26 | $ – | $ (1.73 | ) | $ | (1.73 | ) | $ 17.32 | ||||||||||||||||||||
| Year Ended October 31, 2020 | 12.95 | (0.03 | ) | 2.17 | 2.14 | (0.01 | ) | (1.29 | ) | (1.30 | ) | 13.79 | ||||||||||||||||||||
| Year Ended October 31, 2019 | 12.53 | 0.01 | 1.79 | 1.80 | (0.02 | ) | (1.36 | ) | (1.38 | ) | 12.95 | |||||||||||||||||||||
| Year Ended October 31, 2018 | 13.05 | 0.02 | 0.83 | 0.85 | (0.04 | ) | (1.33 | ) | (1.37 | ) | 12.53 | |||||||||||||||||||||
| Year Ended October 31, 2017 | 12.13 | 0.04 | 2.34 | 2.38 | (0.02 | ) | (1.44 | ) | (1.46 | ) | 13.05 | |||||||||||||||||||||
| Class C Shares | ||||||||||||||||||||||||||||||||
| Year Ended October 31, 2021 | 11.36 | (0.12 | ) | 4.26 | 4.14 | – | (1.73 | ) | (1.73 | ) | 13.77 | |||||||||||||||||||||
| Year Ended October 31, 2020 | 10.94 | (0.10 | ) | 1.81 | 1.71 | – | (1.29 | ) | (1.29 | ) | 11.36 | |||||||||||||||||||||
| Year Ended October 31, 2019 | 10.87 | (0.06 | ) | 1.49 | 1.43 | – | (1.36 | ) | (1.36 | ) | 10.94 | |||||||||||||||||||||
| Year Ended October 31, 2018 | 11.53 | (0.06 | ) | 0.73 | 0.67 | – | (1.33 | ) | (1.33 | ) | 10.87 | |||||||||||||||||||||
| Year Ended October 31, 2017 | 10.93 | (0.04 | ) | 2.08 | 2.04 | – | (1.44 | ) | (1.44 | ) | 11.53 | |||||||||||||||||||||
| Institutional Service Class Shares | ||||||||||||||||||||||||||||||||
| Year Ended October 31, 2021 | 14.89 | (0.02 | ) | 5.77 | 5.75 | – | (1.73 | ) | (1.73 | ) | 18.91 | |||||||||||||||||||||
| Year Ended October 31, 2020 | 13.88 | – | (f) | 2.34 | 2.34 | (0.04 | ) | (1.29 | ) | (1.33 | ) | 14.89 | ||||||||||||||||||||
| Year Ended October 31, 2019 | 13.33 | 0.04 | 1.92 | 1.96 | (0.05 | ) | (1.36 | ) | (1.41 | ) | 13.88 | |||||||||||||||||||||
| Year Ended October 31, 2018 | 13.79 | 0.05 | 0.88 | 0.93 | (0.06 | ) | (1.33 | ) | (1.39 | ) | 13.33 | |||||||||||||||||||||
| Year Ended October 31, 2017 | 12.74 | 0.06 | 2.46 | 2.52 | (.03 | ) | (1.44 | ) | (1.47 | ) | 13.79 | |||||||||||||||||||||
| Institutional Class Shares | ||||||||||||||||||||||||||||||||
| Year Ended October 31, 2021 | 14.96 | (0.01 | ) | 5.81 | 5.80 | – | (1.73 | ) | (1.73 | ) | 19.03 | |||||||||||||||||||||
| Year Ended October 31, 2020 | 13.93 | 0.01 | 2.35 | 2.36 | (0.04 | ) | (1.29 | ) | (1.33 | ) | 14.96 | |||||||||||||||||||||
| Year Ended October 31, 2019 | 13.37 | 0.04 | 1.93 | 1.97 | (0.05 | ) | (1.36 | ) | (1.41 | ) | 13.93 | |||||||||||||||||||||
| Year Ended October 31, 2018 | 13.82 | 0.06 | 0.89 | 0.95 | (0.07 | ) | (1.33 | ) | (1.40 | ) | 13.37 | |||||||||||||||||||||
| Year Ended October 31, 2017 | 12.76 | 0.08 | 2.46 | 2.54 | (0.04 | ) | (1.44 | ) | (1.48 | ) | 13.82 | |||||||||||||||||||||
| (a) | Net investment income/(loss) is based on average shares outstanding during the period. | |
| (b) | Excludes sales charge. | |
| (c) | During the period, certain fees were waived and/or reimbursed. If such waivers/reimbursements had not occurred, the ratios would have been as indicated. | |
| (d) | Portfolio turnover is calculated on the basis of the Fund as a whole without distinguishing among the classes of shares. |
Amounts listed as "–" are $0 or round to $0.
See accompanying Notes to Financial Statements.
| 2021 Annual Report | 117 |
Financial Highlights (continued)
Selected Data for Each Share of Capital Outstanding Throughout the Periods Indicated
Aberdeen U.S. Sustainable Leaders Fund (concluded)
| Ratios/Supplemental Data | ||||||||||||
| Total Return (b) | Net Assets at End of Period (000's) | Ratio of Expenses (Net of Reimbursements/ Waivers) to Average Net Assets | Ratio of Expenses (Prior to Reimbursements) to Average Net Assets (c) | Ratio of Net Investment Income (Loss) to Average Net Assets | Portfolio Turnover (d) | |||||||
| 41.35% | $ 345,638 | 1.19% | 1.23% | (0.33%) | 111.07% | |||||||
| 17.50% | 264,977 | 1.19% | 1.26% | (0.24%) | 49.68% | |||||||
| 17.60% | 247,926 | 1.19% | 1.27% | 0.06% | 47.13% | |||||||
| 6.63% | 233,717 | 1.19%(e) | 1.25%(e) | 0.14% | 38.68% | |||||||
| 21.13% | 242,085 | 1.19%(e) | 1.26%(e) | 0.29% | 33.79% | |||||||
| 40.20% | 329 | 1.90% | 2.07% | (1.01%) | 111.07% | |||||||
| 16.71% | 1,143 | 1.90% | 2.08% | (0.94%) | 49.68% | |||||||
| 16.75% | 1,428 | 1.90% | 2.11% | (0.58%) | 47.13% | |||||||
| 5.88% | 2,963 | 1.90%(e) | 2.07%(e) | (0.56%) | 38.68% | |||||||
| 20.26% | 3,544 | 1.90%(e) | 2.09%(e) | (0.40%) | 33.79% | |||||||
| 41.61% | 158,581 | 0.97% | 1.01% | (0.11%) | 111.07% | |||||||
| 17.79% | 121,611 | 0.97% | 1.04% | (0.01%) | 49.68% | |||||||
| 17.84% | 113,600 | 0.97% | 1.05% | 0.29% | 47.13% | |||||||
| 6.90% | 106,337 | 0.97%(e) | 1.03%(e) | 0.36% | 38.68% | |||||||
| 21.33% | 109,418 | 0.98%(e) | 1.05%(e) | 0.49% | 33.79% | |||||||
| 41.77% | 14,953 | 0.90% | 1.00% | (0.05%) | 111.07% | |||||||
| 17.89% | 10,982 | 0.90% | 1.01% | 0.05% | 49.68% | |||||||
| 17.90% | 8,839 | 0.90% | 1.03% | 0.34% | 47.13% | |||||||
| 6.99% | 6,801 | 0.90%(e) | 1.01%(e) | 0.43% | 38.68% | |||||||
| 21.45% | 6,507 | 0.90%(e) | 1.01%(e) | 0.59% | 33.79% | |||||||
| (e) | Includes interest expense that amounts to less than 0.01%. | |
| (f) | Less than $0.005 per share. |
| 118 | 2021 Annual Report |
Financial Highlights (continued)
Selected Data for Each Share of Capital Outstanding Throughout the Periods Indicated
Aberdeen U.S. Sustainable Leaders Smaller Companies Fund
| Investment Activities | Distributions | |||||||||||||||||||||||||||||||
| Net Asset Value, Beginning of Period | Net Investment Income (Loss) (a) | Net Realized and Unrealized Gains on Investments | Total from Investment Activities | Net Investment Income | Net Realized Gains | Total Distributions | Net Asset Value, End of Period | |||||||||||||||||||||||||
| Class A Shares | ||||||||||||||||||||||||||||||||
| Year Ended October 31, 2021 | $ 8.08 | $ (0.04 | ) | $ 4.06 | $ 4.02 | $ – | $ (1.01 | ) | $ (1.01 | ) | $ 11.09 | |||||||||||||||||||||
| Year Ended October 31, 2020 | 7.59 | (0.01 | ) | 0.96 | 0.95 | – | (h) | (0.46 | ) | (0.46 | ) | 8.08 | ||||||||||||||||||||
| Year Ended October 31, 2019 | 6.85 | 0.01 | 1.09 | 1.10 | – | (0.36 | ) | (0.36 | ) | 7.59 | ||||||||||||||||||||||
| Year Ended October 31, 2018 | 8.52 | 0.02 | 0.62 | 0.64 | – | (2.31 | ) | (2.31 | ) | 6.85 | ||||||||||||||||||||||
| Year Ended October 31, 2017 | 8.81 | (0.12 | ) | 0.90 | 0.78 | – | (1.07 | ) | (1.07 | ) | 8.52 | |||||||||||||||||||||
| Class C Shares | ||||||||||||||||||||||||||||||||
| Year Ended October 31, 2021 | 1.84 | (0.02 | ) | 0.70 | 0.68 | – | (1.01 | ) | (1.01 | ) | 1.51 | |||||||||||||||||||||
| Year Ended October 31, 2020 | 2.08 | (0.02 | ) | 0.25 | 0.23 | (0.01 | ) | (0.46 | ) | (0.47 | ) | 1.84 | ||||||||||||||||||||
| Year Ended October 31, 2019 | 2.17 | (0.01 | ) | 0.28 | 0.27 | – | (0.36 | ) | (0.36 | ) | 2.08 | |||||||||||||||||||||
| Year Ended October 31, 2018 | 4.22 | (0.01 | ) | 0.27 | 0.26 | – | (2.31 | ) | (2.31 | ) | 2.17 | |||||||||||||||||||||
| Year Ended October 31, 2017 | 4.92 | (0.09 | ) | 0.46 | 0.37 | – | (1.07 | ) | (1.07 | ) | 4.22 | |||||||||||||||||||||
| Class R Shares | ||||||||||||||||||||||||||||||||
| Year Ended October 31, 2021 | 7.09 | (0.06 | ) | 3.52 | 3.46 | – | (1.01 | ) | (1.01 | ) | 9.54 | |||||||||||||||||||||
| Year Ended October 31, 2020 | 6.73 | (0.03 | ) | 0.85 | 0.82 | – | (0.46 | ) | (0.46 | ) | 7.09 | |||||||||||||||||||||
| Year Ended October 31, 2019 | 6.13 | (0.01 | ) | 0.97 | 0.96 | – | (0.36 | ) | (0.36 | ) | 6.73 | |||||||||||||||||||||
| Year Ended October 31, 2018 | 7.88 | – | (h) | 0.56 | 0.56 | – | (2.31 | ) | (2.31 | ) | 6.13 | |||||||||||||||||||||
| Year Ended October 31, 2017 | 8.25 | (0.13 | ) | 0.83 | 0.70 | – | (1.07 | ) | (1.07 | ) | 7.88 | |||||||||||||||||||||
| Institutional Service Class Shares | ||||||||||||||||||||||||||||||||
| Year Ended October 31, 2021 | 8.45 | (0.03 | ) | 4.27 | 4.24 | – | (1.01 | ) | (1.01 | ) | 11.68 | |||||||||||||||||||||
| Year Ended October 31, 2020 | 7.92 | – | (h) | 1.00 | 1.00 | (0.01 | ) | (0.46 | ) | (0.47 | ) | 8.45 | ||||||||||||||||||||
| Year Ended October 31, 2019 | 7.11 | 0.03 | 1.14 | 1.17 | – | (0.36 | ) | (0.36 | ) | 7.92 | ||||||||||||||||||||||
| Year Ended October 31, 2018 | 8.75 | 0.04 | 0.63 | 0.67 | – | (2.31 | ) | (2.31 | ) | 7.11 | ||||||||||||||||||||||
| Year Ended October 31, 2017 | 9.00 | (0.10 | ) | 0.92 | 0.82 | – | (1.07 | ) | (1.07 | ) | 8.75 | |||||||||||||||||||||
| Institutional Class Shares | ||||||||||||||||||||||||||||||||
| Year Ended October 31, 2021 | 8.78 | (0.01 | ) | 4.45 | 4.44 | – | (1.01 | ) | (1.01 | ) | 12.21 | |||||||||||||||||||||
| Year Ended October 31, 2020 | 8.20 | 0.01 | 1.04 | 1.05 | (0.01 | ) | (0.46 | ) | (0.47 | ) | 8.78 | |||||||||||||||||||||
| Year Ended October 31, 2019 | 7.34 | 0.04 | 1.18 | 1.22 | – | (0.36 | ) | (0.36 | ) | 8.20 | ||||||||||||||||||||||
| Year Ended October 31, 2018 | 8.95 | 0.05 | 0.65 | 0.70 | – | (2.31 | ) | (2.31 | ) | 7.34 | ||||||||||||||||||||||
| Year Ended October 31, 2017 | 9.17 | (0.10 | ) | 0.95 | 0.85 | – | (1.07 | ) | (1.07 | ) | 8.95 | |||||||||||||||||||||
| (a) | Net investment income/(loss) is based on average shares outstanding during the period. | |
| (b) | Excludes sales charge. | |
| (c) | During the period, certain fees were waived and/or reimbursed. If such waivers/reimbursements had not occurred, the ratios would have been as indicated. | |
| (d) | Indicates the dividend expense charged for the period to average net assets. |
Amounts listed as "–" are $0 or round to $0.
See accompanying Notes to Financial Statements.
| 2021 Annual Report | 119 |
Financial Highlights (concluded)
Selected Data for Each Share of Capital Outstanding Throughout the Periods Indicated
Aberdeen U.S. Sustainable Leaders Smaller Companies Fund (concluded)
| Ratios/Supplemental Data | ||||||||||||||
| Total Return (b) | Net Assets at End of Period (000's) | Ratio of Expenses (Net of Reimbursements/ Waivers) to Average Net Assets | Ratio of Expenses (Prior to Reimbursements) to Average Net Assets (c) | Ratio of Net Investment Income (Loss) to Average Net Assets | Dividend Expense (d)(e) | Portfolio Turnover (f) | ||||||||
| 53.27% | $ 10,032 | 1.22%(g) | 2.42%(g) | (0.45%) | – | 157.35% | ||||||||
| 12.88% | 7,618 | 1.24%(g) | 2.13%(g) | (0.17%) | – | 45.98% | ||||||||
| 17.62% | 8,481 | 1.25% | 2.09% | 0.20% | – | 54.04% | ||||||||
| 8.32% | 7,466 | 1.32%(g) | 2.03%(g) | 0.34% | 0.04% | 112.97% | ||||||||
| 9.69% | 9,479 | 2.80%(g) | 3.22%(g) | (1.39%) | 1.18% | 35.38% | ||||||||
| 51.76% | 633 | 1.90%(g) | 3.16%(g) | (1.14%) | – | 157.35% | ||||||||
| 11.83% | 528 | 1.90%(g) | 2.84%(g) | (0.85%) | – | 45.98% | ||||||||
| 17.22% | 4,734 | 1.90% | 2.83% | (0.48%) | – | 54.04% | ||||||||
| 7.45% | 1,345 | 1.97%(g) | 2.77%(g) | (0.32%) | 0.04% | 112.97% | ||||||||
| 8.89% | 1,837 | 3.47%(g) | 4.09%(g) | (2.05%) | 1.21% | 35.38% | ||||||||
| 52.76% | 3,071 | 1.55%(g) | 2.75%(g) | (0.78%) | – | 157.35% | ||||||||
| 12.54% | 1,952 | 1.43%(g) | 2.32%(g) | (0.37%) | – | 45.98% | ||||||||
| 17.39% | 1,924 | 1.55% | 2.39% | (0.09%) | – | 54.04% | ||||||||
| 7.89% | 1,895 | 1.69%(g) | 2.40%(g) | (0.04%) | 0.04% | 112.97% | ||||||||
| 9.35% | 2,269 | 3.14%(g) | 3.56%(g) | (1.72%) | 1.18% | 35.38% | ||||||||
| 53.56% | 159 | 1.05%(g) | 2.25%(g) | (0.33%) | – | 157.35% | ||||||||
| 12.96% | 340 | 1.04%(g) | 1.93%(g) | 0.02% | – | 45.98% | ||||||||
| 17.96% | 480 | 1.05% | 1.89% | 0.45% | – | 54.04% | ||||||||
| 8.50% | 679 | 1.07%(g) | 1.79%(g) | 0.55% | 0.04% | 112.97% | ||||||||
| 9.96% | 840 | 2.62%(g) | 3.04%(g) | (1.21%) | 1.17% | 35.38% | ||||||||
| 53.85% | 5,531 | 0.90%(g) | 2.24%(g) | (0.12%) | – | 157.35% | ||||||||
| 13.14% | 3,451 | 0.90%(g) | 1.94%(g) | 0.17% | – | 45.98% | ||||||||
| 18.10% | 4,580 | 0.90% | 1.89% | 0.58% | – | 54.04% | ||||||||
| 8.69% | 5,583 | 0.98%(g) | 1.83%(g) | 0.63% | 0.06% | 112.97% | ||||||||
| 10.12% | 12,413 | 2.56%(g) | 3.07%(g) | (1.13%) | 1.30% | 35.38% | ||||||||
| (e) | Dividend expense ratio includes broker related expenses for securities sold short. | |
| (f) | Portfolio turnover is calculated on the basis of the Fund as a whole without distinguishing among the classes of shares. | |
| (g) | Includes interest expense that amounts to less than 0.01% for Class A, Class C, Class R, Institutional Service Class and Institutional Class for the years ended October 31, 2021, October 31, 2020 and October 31, 2018. Includes interest expense that amounts to 0.01% for Class A, Class C, Class R, Institutional Service Class and Institutional Class for the year ended October 31, 2017. | |
| (h) | Less than $0.005 per share. |
| 120 | 2021 Annual Report |
Notes to Financial Statements
October 31, 2021
| 1. | Organization |
Aberdeen Funds (the "Trust") was organized as a statutory trust under the laws of the state of Delaware by a Certificate of Trust filed on September 27, 2007 and is registered under the Investment Company Act of 1940, as amended (the "1940 Act"), as an open-end management investment company. As of October 31, 2021, the Trust had authorized an unlimited number of shares of beneficial interest ("shares") without par value. As of October 31, 2021, the Trust operated seventeen (17) separate series, or mutual funds, each with its own investment objective(s) and strategies. This report contains the financial statements and financial highlights of the twelve (12) funds listed below (each a "Fund"; collectively, the "Funds"):
| – | Aberdeen China A Share Equity Fund ("China A Share Equity Fund") | |
| – | Aberdeen Dynamic Dividend Fund ("Dynamic Dividend Fund") | |
| – | Aberdeen Emerging Markets Fund ("Emerging Markets Fund") | |
| – | Aberdeen Emerging Markets Sustainable Leaders Fund (formerly, Aberdeen International Equity Fund) ("Emerging Markets Sustainable Leaders Fund") | |
| – | Aberdeen Global Equity Fund ("Global Equity Fund") | |
| – | Aberdeen Global Infrastructure Fund ("Global Infrastructure Fund") | |
| – | Aberdeen International Real Estate Equity Fund ("International Real Estate Equity Fund") | |
| – | Aberdeen International Small Cap Fund ("International Small Cap Fund") | |
| – | Aberdeen Realty Income & Growth Fund ("Realty Income & Growth Fund") | |
| – | Aberdeen U.S. Small Cap Equity Fund ("U.S. Small Cap Equity Fund") | |
| – | Aberdeen U.S. Sustainable Leaders Fund (formerly, Aberdeen U.S. Multi-Cap Equity Fund) ("U.S. Sustainable Leaders Fund") | |
| – | Aberdeen U.S. Sustainable Leaders Smaller Companies Fund (formerly, Aberdeen Focused U.S. Equity Fund) ("U.S. Sustainable Leaders Smaller Companies Fund") |
| 2. | Summary of Significant Accounting Policies |
The Trust is an investment company and accordingly follows the investment company accounting and reporting guidance of the Financial Accounting Standards Board ("FASB") Accounting Standard Codification Topic 946 Financial Services-Investment Companies. The following is a summary of significant accounting policies followed by the Funds in the preparation of their financial statements. The policies conform to generally accepted accounting principles in the United States of America ("GAAP"). The preparation of financial statements requires management to make estimates and assumptions that affect the reported amounts of assets and liabilities, disclosure of contingent assets and liabilities at the date of the financial statements, and the reported amounts of income and expenses for the period. Actual results could differ from those estimates. The accounting records of the Funds are maintained in U.S. Dollars.
| a. | Security Valuation |
The Funds value their securities at current market value or fair value, consistent with regulatory requirements. "Fair value" is defined in the Funds' Valuation and Liquidity Procedures as the price that could be received to sell an asset or paid to transfer a liability in an orderly transaction between willing market participants without a compulsion to transact at the measurement date.
Equity securities that are traded on an exchange are valued at the last quoted sale price on the principal exchange on which the security is traded at the "Valuation Time" subject to application, when appropriate, of the valuation factors described in the paragraph below. Under normal circumstances, the Valuation Time is as of the close of regular trading on the New York Stock Exchange (usually 4:00 p.m. Eastern Time). In the absence of a sale price, the security is valued at the mean of the bid/ask price quoted at the close on the principal exchange on which the security is traded. Securities traded on NASDAQ are valued at the NASDAQ official closing price.
In accordance with the authoritative guidance on fair value measurements and disclosures under generally accepted accounting principles in the United States of America, the Funds disclose the fair value of their investments using a three-level hierarchy that classifies the inputs to valuation techniques used to measure the fair value. The hierarchy assigns Level 1, the highest level, measurements to valuations based upon unadjusted quoted prices in active markets for identical assets, Level 2 measurements to valuations based upon other significant observable inputs, including adjusted quoted prices in active markets for similar assets, and Level 3, the lowest level, measurements to valuations based upon unobservable inputs that are significant to the valuation. Inputs refer broadly to the assumptions that market participants would use in pricing the asset or liability, including assumptions about risk, for example, the risk inherent in a particular valuation technique used to measure fair value including a pricing model and/or the risk inherent in the inputs to the valuation technique. Inputs may be observable or unobservable. Observable inputs are inputs that reflect the assumptions market participants would use in pricing the asset or liability, which are based on market data obtained from sources independent of the reporting entity. Unobservable inputs are inputs that reflect the reporting entity's own assumptions about the assumptions market participants would use in pricing the asset or liability developed based on the best
| 2021 Annual Report | 121 |
Notes to Financial Statements (continued)
October 31, 2021
information available in the circumstances. A financial instrument's level within the fair value hierarchy is based upon the lowest level of any input that is significant to the fair value measurement. Open-end mutual funds are valued at the respective net asset value ("NAV") as reported by such company. The prospectuses for the registered open-end management investment companies in which a Fund invests explain the circumstances under which those companies will use fair value pricing and the effects of using fair value pricing. Closed-end funds and exchange-traded funds ("ETFs") are valued at the market price of the security at the Valuation Time. A security using any of these pricing methodologies is determined to be a Level 1 investment.
Foreign equity securities that are traded on foreign exchanges that close prior to the Valuation Time are valued by applying valuation factors to the last sale price or the mean price as noted above. Valuation factors are provided by an independent pricing service provider approved by the Board. These valuation factors are used when pricing a Fund's portfolio holdings to estimate market movements between the time foreign markets close and the time a Fund values such foreign securities. These valuation factors are based on inputs such as depositary receipts, indices, futures, sector indices/ETFs, exchange rates, and local exchange opening and closing prices of each security. When prices with the application of valuation factors are utilized, the value assigned to the foreign securities may not be the same as quoted or published prices of the securities on their primary markets. A security that applies a valuation factor is determined to be a Level 2 investment because the exchange-traded price has been adjusted. Valuation factors are not utilized if the independent pricing service provider is unable to provide a valuation factor or if the valuation factor falls below a predetermined threshold; in such case, the security is determined to be a Level 1 investment.
Long-term debt and other fixed-income securities are valued at the last quoted or evaluated bid price on the valuation date provided by an independent pricing service provider approved by the Board of Trustees of the Trust (the "Board"). If there are no current day bids, the security is valued at the previously applied bid. Pricing services generally price debt securities assuming orderly transactions of an institutional "round lot" size, and the strategies employed by Aberdeen Standard Investments, Inc. ("Aberdeen", the "Adviser" or "ASII") (to be known as abrdn Inc. effective January 1, 2022) generally trade in round lot sizes. In certain circumstances, fixed income securities may be held or transactions may be conducted in smaller, "odd lot" sizes. Odd lots may trade at lower or, occasionally, higher prices than institutional round lot trades. Short-term debt securities (such as commercial paper and U.S. treasury bills) having a remaining maturity of 60 days or less are valued at the last quoted or evaluated bid price on the valuation date provided by an independent pricing service, or on the basis of amortized cost if it represents the best approximation for fair value. Debt and other fixed-income securities are generally determined to be Level 2 investments.
Short-term investments are comprised of cash and cash equivalents invested in short-term investment funds which are redeemable daily. Each Fund sweeps available cash into the State Street Institutional U.S. Government Money Market Fund, which has elected to qualify as a "government money market fund" pursuant to Rule 2a-7 under the 1940 Act, and has an objective, which is not guaranteed, to maintain a $1.00 NAV. Generally, these investment types are categorized as Level 1 investments.
Forward foreign currency contracts are generally valued based on the bid price of the forward rates and the current spot rate. Forward exchange rate quotations are available for scheduled settlement dates, such as 1-, 3-, 6-, 9- and 12-month periods. An interpolated valuation is derived based on the actual settlement dates of the forward contracts held. Futures contracts are valued at the settlement price or at the last bid price if no settlement price is available. Interest rate swaps agreements are generally valued by an approved pricing agent based on the terms of the swap agreement (including future cash flows).
In the event that a security's market quotations are not readily available or are deemed unreliable (for reasons other than because the foreign exchange on which it trades closed before the Valuation Time), the security is valued at fair value as determined by the Funds' Pricing Committee (the "Pricing Committee"), taking into account the relevant factors and surrounding circumstances using Valuation and Liquidity Procedures approved by the Board. A security that has been fair valued by the Pricing Committee may be classified as Level 2 or Level 3 depending on the nature of the inputs.
The three-level hierarchy of inputs is summarized below:
• Level 1 – quoted prices in active markets for identical investments;
• Level 2 – other significant observable inputs (including quoted prices for similar securities, interest rates, prepayment speeds, and credit risk); or
• Level 3 – significant unobservable inputs (including a Fund's own assumptions in determining the fair value of investments).
A summary of standard inputs is listed below:
| Security Type | Standard Inputs | |
| Foreign equities utilizing a fair value factor | Depositary receipts, indices, futures, sector indices/ETFs, exchange rates, and local exchange opening and closing prices of each security. |
| 122 | 2021 Annual Report |
Notes to Financial Statements (continued)
October 31, 2021
The following is a summary of the inputs used as of October 31, 2021 in valuing the Funds' investments at fair value. The inputs or methodologies used for valuing securities are not necessarily an indication of the risk associated with investing in those securities.
Please refer to the Statements of Investments for a detailed breakout of the security types:
| Investments, at Value | LEVEL 1 – Quoted Prices ($) | LEVEL 2 – Other Significant Observable Inputs ($) | LEVEL 3 – Significant Unobservable Inputs ($) | Total ($) | ||||||||||||
| China A Share Equity Fund | ||||||||||||||||
| Investments in Securities | ||||||||||||||||
| Common Stocks | 0 | 84,493,190 | 0 | 84,493,190 | ||||||||||||
| Exchange-Traded Funds | 1,725,564 | – | – | 1,725,564 | ||||||||||||
| Short-Term Investment | 1,993,668 | – | – | 1,993,668 | ||||||||||||
| 3,719,232 | 84,493,190 | 0 | 88,212,422 | |||||||||||||
| Dynamic Dividend Fund | ||||||||||||||||
| Investments in Securities | ||||||||||||||||
| Common Stocks | 82,773,153 | 41,248,550 | – | 124,021,703 | ||||||||||||
| Preferred Stocks | – | 1,757,952 | – | 1,757,952 | ||||||||||||
| Short-Term Investment | 2,493,808 | – | – | 2,493,808 | ||||||||||||
| Other Financial Instruments | ||||||||||||||||
| Liabilities | ||||||||||||||||
Forward Foreign Currency Exchange Contracts | – | (2,014 | ) | – | (2,014 | ) | ||||||||||
| 85,266,961 | 43,004,488 | – | 128,271,449 | |||||||||||||
| Emerging Markets Fund | ||||||||||||||||
| Investments in Securities | ||||||||||||||||
| Common Stocks | 791,274,817 | 3,697,193,905 | – | 4,488,468,722 | ||||||||||||
| Preferred Stocks | 60,127,477 | 394,027,539 | – | 454,155,016 | ||||||||||||
| Short-Term Investment | 6,077,284 | – | – | 6,077,284 | ||||||||||||
| 857,479,578 | 4,091,221,444 | – | 4,948,701,022 | |||||||||||||
| Emerging Markets Sustainable Leaders Fund | ||||||||||||||||
| Investments in Securities | ||||||||||||||||
| Common Stocks | 43,491,732 | 151,508,720 | – | 195,000,452 | ||||||||||||
| Preferred Stocks | 2,675,404 | 16,802,833 | – | 19,478,237 | ||||||||||||
| Short-Term Investment | 924,957 | – | – | 924,957 | ||||||||||||
| 47,092,093 | 168,311,553 | – | 215,403,646 | |||||||||||||
| Global Equity Fund | ||||||||||||||||
| Investments in Securities | ||||||||||||||||
| Common Stocks | 14,999,946 | 14,968,143 | – | 29,968,089 | ||||||||||||
| Short-Term Investment | 1,051,627 | – | – | 1,051,627 | ||||||||||||
| 16,051,573 | 14,968,143 | – | 31,019,716 | |||||||||||||
| 2021 Annual Report | 123 |
Notes to Financial Statements (continued)
October 31, 2021
| Investments, at Value | LEVEL 1 – Quoted Prices ($) | LEVEL 2 – Other Significant Observable Inputs ($) | LEVEL 3 – Significant Unobservable Inputs ($) | Total ($) | ||||||||||||
| Global Infrastructure Fund | ||||||||||||||||
| Investments in Securities | ||||||||||||||||
| Common Stocks | 34,681,725 | 22,420,970 | – | 57,102,695 | ||||||||||||
| Short-Term Investment | 1,243,937 | – | – | 1,243,937 | ||||||||||||
| Other Financial Instruments | ||||||||||||||||
| Liabilities | ||||||||||||||||
| Forward Foreign Currency Exchange Contracts | – | (1,279 | ) | – | (1,279 | ) | ||||||||||
| 35,925,662 | 22,419,691 | – | 58,345,353 | |||||||||||||
| International Real Estate Equity Fund | ||||||||||||||||
| Investments in Securities | ||||||||||||||||
| Common Stocks | 5,785,075 | 14,517,618 | 0 | 20,302,693 | ||||||||||||
| Short-Term Investment | 705,270 | – | – | 705,270 | ||||||||||||
| 6,490,345 | 14,517,618 | 0 | 21,007,963 | |||||||||||||
| International Small Cap Fund | ||||||||||||||||
| Investments in Securities | ||||||||||||||||
| Common Stocks | 113,675,040 | 181,957,491 | – | 295,632,531 | ||||||||||||
| Short-Term Investment | 17,948,165 | – | – | 17,948,165 | ||||||||||||
| 131,623,205 | 181,957,491 | – | 313,580,696 | |||||||||||||
| Realty Income & Growth Fund | ||||||||||||||||
| Investments in Securities | ||||||||||||||||
| Common Stocks | 57,566,817 | – | – | 57,566,817 | ||||||||||||
| Short-Term Investment | 13,882 | – | – | 13,882 | ||||||||||||
| 57,580,699 | – | – | 57,580,699 | |||||||||||||
| U.S. Small Cap Equity Fund | ||||||||||||||||
| Investments in Securities | ||||||||||||||||
| Common Stocks | 1,144,681,693 | – | – | 1,144,681,693 | ||||||||||||
| Short-Term Investment | 46,804,726 | – | – | 46,804,726 | ||||||||||||
| 1,191,486,419 | – | – | 1,191,486,419 | |||||||||||||
| U.S. Sustainable Leaders Fund | ||||||||||||||||
| Investments in Securities | ||||||||||||||||
| Common Stocks | 506,506,606 | – | – | 506,506,606 | ||||||||||||
| Short-Term Investment | 13,728,502 | – | – | 13,728,502 | ||||||||||||
| 520,235,108 | – | – | 520,235,108 | |||||||||||||
| U.S. Sustainable Leaders Smaller Companies Fund | ||||||||||||||||
| Investments in Securities | ||||||||||||||||
| Common Stocks | 18,972,296 | – | – | 18,972,296 | ||||||||||||
| Short-Term Investment | 428,743 | – | – | 428,743 | ||||||||||||
| 19,401,039 | – | – | 19,401,039 | |||||||||||||
Amounts listed as "–" are $0 or round to $0.
| 124 | 2021 Annual Report |
Notes to Financial Statements (continued)
October 31, 2021
For the fiscal year ended October 31, 2021, there were no significant changes to the fair valuation methodologies. Level 3 investments held during and at the end of the fiscal year in relation to net assets, of the Fund, were not significant (0.0% of total net assets) and accordingly, a reconciliation of Level 3 assets for the fiscal year ended October 31, 2021 is not presented. The valuation technique used at October 31, 2021 was fair valuation at zero pursuant to procedures approved by the Fund's Board of Trustees.
b. Restricted Securities
Restricted securities are privately-placed securities whose resale is restricted under U.S. securities laws. The Funds may invest in restricted securities, including unregistered securities eligible for resale without registration pursuant to Rule 144A and privately-placed securities of U.S. and non-U.S. issuers offered outside the U.S. without registration pursuant to Regulation S under the Securities Act of 1933, as amended (the "1933 Act"). Rule 144A securities may be freely traded among certain qualified institutional investors, such as the Funds, but resale of such securities in the U.S. is permitted only in limited circumstances.
c. Foreign Currency Translation
Foreign securities, currencies and other assets and liabilities denominated in foreign currencies are translated into U.S. dollars at the exchange rate of said currencies against the U.S. dollar, as of the Valuation Time, as provided by an independent pricing service. Purchases and sales of securities, and income and expenses are translated at the prevailing rate of exchange on the respective date of these transactions. The Funds do not isolate that portion of the results of operations resulting from changes in foreign exchange rates on investments from fluctuations arising from changes in market prices of securities held. These fluctuations are included with the net realized and unrealized gain or loss from investments and foreign currencies within the Statements of Operations.
d. Rights Issues and Warrants
Rights issues give the right, normally to existing shareholders, to buy a proportional number of additional securities at a given price (generally at a discount) within a fixed period (generally a short-term period) and are offered at the company's discretion. Warrants are securities that give the holder the right to buy common stock at a specified price for a specified period of time. Rights issues and warrants are speculative and have no value if they are not exercised before the expiration date. Rights issues and warrants are valued at the last sale price on the exchange on which they are traded.
e. Derivative Financial Instruments
Certain Funds are authorized to use derivatives to manage currency risk, credit risk, and interest rate risk and to replicate, or use as a substitute for, physical securities. Losses may arise due to changes in the value of the contract or if the counterparty does not perform under the contract. The use of derivative instruments involves, to varying degrees, elements of market risk in excess of the amount recognized in the Statements of Assets and Liabilities (See Note 10).
Forward Foreign Currency Exchange Contracts
A forward foreign currency exchange contract ("forward contract") involves an obligation to purchase and sell a specific currency at a future date, which may be any fixed number of days from the date of the contract agreed upon by the parties, at a price set at the time of the contract. Forward contracts are used to manage a Fund's currency exposure in an efficient manner. They are used to sell unwanted currency exposure that comes with holding securities in a market, or to buy currency exposure where the exposure from holding securities is insufficient to give the desired currency exposure either in absolute terms or relative to the benchmark. The use of forward contracts allows the separation of decision-making between markets and their currencies. The forward contract is marked-to market daily and the change in market value is recorded by a Fund as unrealized appreciation/(depreciation). Forward contracts' prices are received daily from an independent pricing provider. When the forward contract is closed, a Fund records a realized gain or loss equal to the difference between the value at the time it was opened and the value at the time it was closed. These realized and unrealized gains and losses are reported on the Statements of Operations. During the year, the Funds used forward contracts for the purposes of efficient portfolio management and managing active currency risk relative to the benchmark, the latter of which involves both hedging currency risk and adding currency risk in excess of underlying bond positions.
While a Fund may enter into forward contracts to seek to reduce currency exchange rate risks, transactions in such contracts involve certain risks. A Fund could be exposed to risks if the counterparties to the contracts are unable to meet the terms of their contracts and from unanticipated movements in exchange rates. Thus, while a Fund may benefit from such transactions, unanticipated changes in currency prices may result in a poorer overall performance for a Fund than if it had not engaged in any such transactions. Moreover, there may be an imperfect correlation between a Fund's portfolio holdings or securities quoted or denominated in a particular currency and forward contracts entered into by the Fund. Such imperfect correlation may prevent a Fund from achieving a complete hedge, which will expose the Fund to the risk of foreign exchange loss.
| 2021 Annual Report | 125 |
Notes to Financial Statements (continued)
October 31, 2021
Forward contracts are subject to the risk that the counterparties to such contracts may default on their obligations. Since a forward foreign currency exchange contract is not guaranteed by an exchange or clearing house, a default on the contract would deprive a Fund of unrealized profits, transaction costs or the benefits of a currency hedge or force a Fund to cover its purchase or sale commitments, if any, at the market price at the time of the default.
Summary of Derivative Instruments
Certain Funds may use derivatives for various purposes as noted above. The following is a summary of the location of fair value amounts of derivatives, not accounted for as hedging instruments, as of October 31, 2021:
| Location on the Statement of Assets and Liabilities | ||||
| Derivative Instrument Risk Type | Asset Derivatives | Liability Derivatives | ||
| Foreign Exchange Risk | Unrealized appreciation on forward foreign currency exchange contracts | Unrealized depreciation on forward foreign currency exchange contracts | ||
The following is a summary of the fair value of derivative instruments, not accounted for as hedging instruments, as of October 31, 2021:
| Liabilities Derivatives | ||||||||||||||||||
| Funds | Total Value at October 31, 2021 | Written Options, at value (Equity Risk) | Centrally Cleared Credit Default Swaps (Credit Risk) | Centrally Cleared Interest Rate Swaps (Interest Rate Risk) | Forward Foreign Exchange Contracts (Foreign Exchange Risk) | Futures Contracts (Interest Rate Risk) | ||||||||||||
| Dynamic Dividend Fund | $2,014 | $– | $– | $– | $2,014 | $– | ||||||||||||
| Global Infrastructure Fund | 1,279 | – | – | – | 1,279 | – | ||||||||||||
Certain funds have transactions that may be subject to enforceable master netting arrangements. A reconciliation of the gross amounts on the Statements of Assets and Liabilities as of October 31, 2021 to the net amounts by broker and derivative type, including any collateral received or pledged, is included in the following tables:
| Gross Amounts Not Offset in Statement of Assets & Liabilities | Gross Amounts Not Offset in Statement of Assets and Liabilities | |||||||||||||||
| Gross Amounts of Assets Presented in Statement of Assets & Liabilities | Financial Instruments | Collateral Received(1) | Net Amount(3) | Gross Amounts of Liabilities Presented in Statement of Assets & Liabilities | Financial Instruments | Collateral Pledged(1) | Net Amount(3) | |||||||||
| Description | Assets | Liabilities | ||||||||||||||
| Dynamic Dividend Fund | ||||||||||||||||
| Forward foreign currency(2) Royal Bank of Canada (UK) | $– | $– | $– | $– | $2,014 | $– | $– | $2,014 | ||||||||
| 1. | In some instances, the actual collateral received and/or pledged may be more than the amount shown here due to overcollateralization. |
| 2. | Includes financial instrument which are not subject to a master netting arrangement across funds, or another similar arrangement. |
| 3. | Net amounts represent the net receivables/(payable) that would be due from/to the counterparty in the event of default. Exposure from financial derivative instruments can only be netted across transactions governed under the same master netting agreement with the same legal entity. |
| 126 | 2021 Annual Report |
Notes to Financial Statements (continued)
October 31, 2021
| Gross Amounts Not Offset in Statement of Assets & Liabilities | Gross Amounts Not Offset in Statement of Assets and Liabilities | |||||||||||||||||||||||||||||||
| Gross Amounts of Assets Presented in Statement of Assets & Liabilities | Financial Instruments | Collateral Received(1) | Net Amount(3) | Gross Amounts of Liabilities Presented in Statement of Assets & Liabilities | Financial Instruments | Collateral Pledged(1) | Net Amount(3) | |||||||||||||||||||||||||
| Description | Assets | Liabilities | ||||||||||||||||||||||||||||||
| Global Infrastructure Fund | ||||||||||||||||||||||||||||||||
| Forward foreign currency(2) Citibank N.A. | $– | $– | $– | $– | $1,279 | $– | $– | $1,279 | ||||||||||||||||||||||||
| 1. | In some instances, the actual collateral received and/or pledged may be more than the amount shown here due to overcollateralization. |
| 2. | Includes financial instrument which are not subject to a master netting arrangement across funds, or another similar arrangement. |
| 3. | Net amounts represent the net receivables/(payable) that would be due from/to the counterparty in the event of default. Exposure from financial derivative instruments can only be netted across transactions governed under the same master netting agreement with the same legal entity. |
The following is a summary of the location of realized gain/(loss) and net change in unrealized appreciation/(depreciation) on derivatives in the Statement of Operations for the fiscal year ended October 31, 2021:
| Derivative Instrument Risk Type | Location on the Statement of Operations |
| Foreign Exchange Risk | Realized gain/(loss) on forward foreign currency exchange contracts/ Net change in unrealized appreciation/(depreciation) on forward foreign currency exchange contracts |
The following is a summary of the effect of derivative instruments on the Statement of Operations for the fiscal year ended October 31, 2021:
| Realized Gain or (Loss) on Derivatives Recognized in the Statement of Operations | ||||||||||||||||||||||||||||
| Funds | Total | Investment Transactions (Equity Risk) | Written Options (Equity Risk) | Credit Default Swaps (Credit Risk) | Interest Rate Swaps (Interest Rate Risk) | Forward Foreign Exchange Contracts (Foreign Exchange Risk) | Futures Contracts (Interest Rate Risk) | |||||||||||||||||||||
| Dynamic Dividend Fund | $58,319 | $– | $– | $– | $– | $58,319 | $– | |||||||||||||||||||||
| Global Infrastructure Fund | 8,290 | – | – | – | – | 8,290 | – | |||||||||||||||||||||
| International Real Estate Equity Fund | (4,293 | ) | – | – | – | – | (4,293 | ) | – | |||||||||||||||||||
| Change in Unrealized Appreciation/(Depreciation) on Derivatives Recognized in the Statement of Operations | ||||||||||||||||||||||||||||
| Funds | Total | Investment Transactions (Equity Risk) | Written Options (Equity Risk) | Credit Default Swaps (Credit Risk) | Interest Rate Swaps (Interest Rate Risk)(2) | Forward Foreign Exchange Contracts (Foreign Exchange Risk) | Futures Contracts (Interest Rate Risk) | |||||||||||||||||||||
| Dynamic Dividend Fund | $(24,588 | ) | $– | $– | $– | $– | $(24,588 | ) | $– | |||||||||||||||||||
| Global Infrastructure Fund | (1,121 | ) | – | – | – | – | (1,121 | ) | – | |||||||||||||||||||
| 2021 Annual Report | 127 |
Notes to Financial Statements (continued)
October 31, 2021
Information about derivatives reflected as of the date of this report is generally indicative of the type of activity for the fiscal year ended October 31, 2021. The table below summarizes the weighted average values of derivatives holdings by the Funds during the fiscal year ended October 31, 2021.
| Fund | Purchase Forward Foreign Currency Contracts (Average Notional Value) | Sale Forward Foreign Currency Contracts (Average Notional Value) | ||||||
| Dynamic Dividend Fund | $ – | $3,347,538 | ||||||
| Global Infrastructure Fund | 2,923,493 | 2,598,070 | ||||||
| International Real Estate Equity Fund | – | 61,785 | ||||||
| f. | Security Transactions, Investment Income and Expenses |
Security transactions are recorded on the trade date. Realized and unrealized gains/(losses) from security and currency transactions are calculated on the identified cost basis. Dividend income and corporate actions are recorded generally on the ex-date, except for certain dividends and corporate actions which may be recorded after the ex-date, as soon as a Fund acquires information regarding such dividends or corporate actions.
Interest income and expenses are recorded on an accrual basis. Expenses directly attributable to a Fund are charged to that Fund. Expenses not directly attributable to a Fund are allocated proportionately among the relevant Funds based on net assets of each Fund as of month-end. For each of the Funds, the method for allocating income, fund level expenses, and realized and unrealized gains or losses to a class is based on the average net asset value of that class' shares in proportion to the average net assets of the relevant Fund when incurred. Expenses specific to a class (such as Rule 12b-1 and administrative services fees) are charged to that class.
| g. | Distributions |
Distributions from net investment income, if any, are declared and paid annually for all Funds except the Dynamic Dividend Fund, which declares and pays monthly, and the Global Infrastructure Fund and Realty Income & Growth Fund, which declare and pay quarterly. The Funds will also declare and pay distributions at least annually from net realized gains on investment transactions and net realized foreign exchange gains, if any. Dividends and distributions to shareholders are recorded on the ex-dividend date. The Funds will also declare and pay distributions at least annually from net realized gains on investment transactions and net realized foreign exchange gains, if any.
Dividends and distributions to shareholders are determined in accordance with federal income tax regulations, which may differ from GAAP. These differences are primarily due to differing treatments for foreign currencies and loss deferrals.
| h. | Federal Income Taxes |
Each Fund intends to continue to qualify as a "regulated investment company" by complying with the provisions available to certain investment companies, as defined in Subchapter M of the Internal Revenue Code of 1986, as amended, and to make distributions of net investment income and net realized capital gains sufficient to relieve the Funds from all federal income taxes. Therefore, no federal income tax provision is required. Management of the Funds has concluded that there are no significant uncertain tax positions that would require recognition in the financial statements. Since tax authorities can examine previously filed tax returns, the Funds' U.S. federal and state tax returns for each of the most recent four fiscal years up to the most recent fiscal year ended October 31, 2021 are subject to such review.
| i. | Foreign Withholding Tax |
Dividend and interest income from non-U.S. sources received by the Fund are generally subject to non-U.S. withholding taxes and are recorded on the Statement of Operations. The Funds file for tax reclaims for the refund of such withholdings taxes according to tax treaties. Tax reclaims that are deemed collectible are booked as tax reclaim receivable on the Statement of Assets and Liabilities. Foreign tax authorities can examine previously filed withholding tax reclaims for various periods of time, depending on the statute of limitations in each foreign jurisdiction. In some cases, amounts that have been refunded by foreign tax authorities and received by the Funds are still subject to such review.
The Dynamic Dividend Fund has received requests from the German Federal Tax Office for additional documents and information relating to withholding tax refunds that the Fund has previously received and recorded. The tax refunds previously received amount to approximately 0.74% of the Dynamic Dividend Fund's net assets as of October 31, 2021. The Dynamic Dividend Fund may be required to return certain amounts or pay a settlement in connection with this request. The amount of such potential repayment or settlement is uncertain and management cannot make an estimate at this time, and as such, has not recorded any amount in the financial statements. The Dynamic
| 128 | 2021 Annual Report |
Notes to Financial Statements (continued)
October 31, 2021
Dividend Fund's net asset value and performance may be materially adversely affected if such repayment or settlement is determined at a future date.
In addition, the Funds may be subject to capital gains tax in certain countries in which they invest. The above taxes may be reduced or eliminated under the terms of applicable U.S. income tax treaties with some of these countries. The Funds accrue such taxes when the related income is earned.
In addition, when the Funds sell securities within certain countries in which they invest, the capital gains realized may be subject to tax. Based on these market requirements and as required under GAAP, the Funds accrue deferred capital gains tax on securities currently held that have unrealized appreciation within these countries. The amount of deferred capital gains tax accrued is reported on the Statement of Operations as part of the Net Change in Unrealized Appreciation/Depreciation on Investments.
| j. | Securities Lending |
Through an agreement with BNP Paribas as the Lending Agent and State Street Bank and Trust Company (the Funds' custodian), the Funds may lend their portfolio securities to brokers, dealers and other financial institutions that pay a negotiated fee in order to generate additional income. The Funds receive non-cash collateral in the form of U.S. Government Securities, with respect to each loan of U.S. securities, typically equal to at least 102% of the value of the portfolio securities loaned, and, with respect to each loan of non-U.S. securities, typically equal to at least 105% of the value of the portfolio securities loaned, and at all times thereafter require the borrower to mark to market such collateral on a daily basis so that the market value of such collateral does not fall below 100% of the market value of the portfolio securities so loaned.
Income generated from securities lending includes the difference between (i) the sum of income received from the investment of collateral received from the borrowers that are counterparties to loans, loan fees received from loans, and fees paid by borrower on loans collateralized with collateral other than cash collateral; and ii) any rebate paid to a borrower, and any other allocable fees and expenses in connection with loans of securities. All income is accrued daily and is apportioned 90% to the Funds and 10% to the Lending Agent.
The Funds continue to own the loaned securities and continue to recognize unrealized gains and losses on the securities on loan. However, securities lending involves certain risks including the event of default or insolvency of the borrower and possible delays or restrictions upon a Fund's ability to recover the loaned securities or dispose of the collateral for the loan. Securities on loan are noted within the Statement of Investments. Non-cash securities lending collateral held by the Lending Agent on behalf of the Funds cannot be sold or repledged by the Funds and, therefore, this amount is not presented on the Funds' Statements of Investments.
At October 31, 2021, the market value of loaned securities and collateral received were as follows:
| Fund | Value of Securities Loaned | Value of Cash Collateral | Value of Non-cash Collateral | |||||||||
| Emerging Markets Sustainable Leaders Fund | $99,000 | $– | $270,272 | |||||||||
3. Agreements and Transactions with Affiliates
| a. | Investment Adviser |
Under the Investment Advisory Agreement with the Trust, Aberdeen manages the Funds in accordance with the policies and procedures established by the Board.
For services provided under the terms of the current Investment Advisory Agreement, each Fund pays the Adviser an annual management fee (as a percentage of its average daily net assets) paid monthly according to the following schedule:
| Fund | Fee Schedule | ||||||
| China A Share Equity Fund | Up to $500 million | 0.85 | % | ||||
| $500 million up to $2 billion | 0.80 | % | |||||
| On $2 billion and more | 0.75 | % | |||||
| Dynamic Dividend Fund | Up to $250 million | 1.00 | % | ||||
| On $250 million and more | 0.95 | % | |||||
| Emerging Markets Fund | On all assets | 0.90 | % | ||||
| Emerging Markets Sustainable Leaders Fund | On all assets | 0.80 | % | ||||
| Global Equity Fund | Up to $500 million | 0.90 | % | ||||
| $500 million up to $2 billion | 0.85 | % | |||||
| On $2 billion and more | 0.80 | % | |||||
| 2021 Annual Report | 129 |
Notes to Financial Statements (continued)
October 31, 2021
| Fund | Fee Schedule | ||||||
| Global Infrastructure Fund | Up to $250 million | 0.85 | % | ||||
| $250 million up to $750 million | 0.80 | % | |||||
| $750 million to $1 billion | 0.75 | % | |||||
| On $1 billion and more | 0.65 | % | |||||
| International Real Estate Equity Fund | On all assets | 1.00 | % | ||||
| International Small Cap Fund | Up to $100 million | 0.85 | % | ||||
| On $100 million and more | 0.75 | % | |||||
| Realty Income & Growth Fund | Up to $250 million | 1.00 | % | ||||
| $250 million up to $750 million | 0.95 | % | |||||
| $750 million up to $1 billion | 0.90 | % | |||||
| On $1 billion and more | 0.80 | % | |||||
| U.S. Small Cap Equity Fund | Up to $100 million | 0.95 | % | ||||
| On $100 million and more | 0.80 | % | |||||
| U.S. Sustainable Leaders Fund | Up to $500 million | 0.75 | % | ||||
| $500 million up to $2 billion | 0.70 | % | |||||
| On $2 billion and more | 0.65 | % | |||||
| U.S. Sustainable Leaders Smaller Companies Fund | Up to $500 million | 0.75 | % | ||||
| $500 million up to $2 billion | 0.70 | % | |||||
| On $2 billion and more | 0.65 | % | |||||
The Adviser has engaged the services of affiliates abrdn Asia Limited (formerly, Aberdeen Standard Investments (Asia) Limited) and Aberdeen Asset Managers Limited ("AAML") as subadvisers (the "Subadvisers") pursuant to subadvisory agreements. The Subadvisers manage a portion of certain Funds' investments and have the responsibility for making all investment decisions for the portion of a Fund's assets they manage. Pursuant to the subadvisory agreements, the Adviser pays fees to the Subadvisers.
The Trust and Aberdeen have entered into written contracts ("Expense Limitation Agreements") limiting operating expenses for all classes of the Funds from exceeding the amounts listed in the tables below. For each Fund this contractual limitation may not be terminated before February 28, 2022 without the approval of the Trustees who are not "interested persons" of the Trust, as such term is defined by the 1940 Act (the "Independent Trustees"). For each Fund except the Dynamic Dividend Fund and Global Infrastructure Fund, this limit excludes certain expenses, including any taxes, interest, brokerage fees, short-sale dividend expenses, acquired fund fees and expenses, Rule 12b-1 fees, administrative services fees, transfer agent out-of-pocket expenses for Class A shares, Class R shares, and Institutional Service Class shares and extraordinary expenses. The Expense Limitation Agreement with respect to the Dynamic Dividend Fund and Global Infrastructure Fund excludes certain expenses, including any interest, brokerage commissions, acquired fund fees and expenses, and extraordinary expenses.
| Fund | Limit | ||||
| China A Share Equity Fund | 0.99 | % | |||
| Emerging Markets Fund | 1.10 | % | |||
| Emerging Markets Sustainable Leaders Fund | 1.10 | % | |||
| Global Equity Fund | 1.19 | % | |||
| International Small Cap Fund | 0.99 | % | |||
| U.S. Small Cap Equity Fund | 0.99 | % | |||
| U.S. Sustainable Leaders Fund | 0.90 | % | |||
| U.S. Sustainable Leaders Smaller Companies Fund | 0.90 | % | |||
| Fund | Class A Limit | Institutional Class Limit | |||||
| Dynamic Dividend Fund | 1.50 | % | 1.25% | ||||
| Global Infrastructure Fund | 1.24 | % | 0.99% | ||||
| International Real Estate Equity Fund | 1.62 | % | 1.37% | ||||
| Realty Income & Growth Fund | 1.25 | % | 1.00% | ||||
| 130 | 2021 Annual Report |
Notes to Financial Statements (continued)
October 31, 2021
Aberdeen may request and receive reimbursement from a Fund of the advisory fees waived and other expenses reimbursed pursuant to the Expense Limitation Agreements as of a date not more than three years after the date when the Adviser limited the fees or reimbursed the expenses; provided that the following requirements are met: the reimbursements do not cause a class to exceed the lesser of the applicable expense limitation in the contract at the time the fees were limited or expenses are paid or the applicable expense limitation in effect at the time the expenses are being recouped by the Adviser, and the payment of such reimbursement is approved by the Board on a quarterly basis (the "Reimbursement Requirements"). Except as provided for in the Expense Limitation Agreements, reimbursement of amounts previously waived or assumed by Aberdeen is not permitted.
As of October 31, 2021, to the extent the Reimbursement Requirements are met, the cumulative potential reimbursements to Aberdeen for each Fund, based on expenses reimbursed by Aberdeen, including adjustments described above, would be:
| Fund | Amount Fiscal Year 2019 (Expires 10/31/22) | Amount Fiscal Year 2020 (Expires 10/31/23) | Amount Fiscal Year 2021 (Expires 10/31/24) | Total* | ||||||||||||
| China A Share Equity Fund | $ 185,225 | $ 194,764 | $ 244,894 | $ 624,883 | ||||||||||||
| Dynamic Dividend Fund | 110,958 | 114,147 | 180,278 | 405,383 | ||||||||||||
| Emerging Markets Fund | 2,912,999 | 2,887,668 | 1,800,053 | 7,600,720 | ||||||||||||
| Emerging Markets Sustainable Leaders Fund | 25,257 | 32,170 | 38,869 | 96,296 | ||||||||||||
| Global Equity Fund | 177,160 | 173,186 | 191,740 | 542,086 | ||||||||||||
| Global Infrastructure Fund | 115,230 | 162,223 | 207,420 | 484,873 | ||||||||||||
| International Real Estate Equity Fund | 30,943 | 134,634 | 156,298 | 321,875 | ||||||||||||
| International Small Cap Fund | 302,551 | 291,518 | 261,986 | 856,055 | ||||||||||||
| Realty Income & Growth Fund | 282,123 | 254,885 | 245,459 | 782,467 | ||||||||||||
| U.S. Small Cap Equity Fund | – | 327,286 | 604,829 | 932,115 | ||||||||||||
| U.S. Sustainable Leaders Fund | 284,126 | 257,392 | 216,967 | 758,485 | ||||||||||||
| U.S. Sustainable Leaders Smaller Companies Fund | 175,904 | 164,571 | 202,597 | 543,072 | ||||||||||||
* Amounts reported are due to expire throughout the respective 3-year expiration period presented above.
Amounts listed as "–" are $0 or round to $0.
| b. | Fund Administration |
Under the terms of the Fund Administration Agreement, Aberdeen provides various administrative and accounting services, including daily valuation of the Funds' shares, preparation of financial statements, tax returns, regulatory reports, and presentation of quarterly reports to the Board. For services provided pursuant to the Fund Administration Agreement, the Trust pays Aberdeen an annual fee of 0.08% based on the Trust's average daily net assets. The fee is then allocated proportionately among all funds within the Trust (including the Funds) in relation to the average daily net assets of each fund. This asset-based fee is subject to an annual minimum fee based on the number of funds served. Pursuant to a sub-administration agreement with Aberdeen, State Street Bank and Trust Company ("State Street") provides sub-administration services with respect to the Funds. Aberdeen pays State Street for providing such services.
| c. | Distributor and Shareholder Servicing |
The Trust and Aberdeen Fund Distributors, LLC (the "Distributor") are parties to the current Underwriting Agreement (the "Underwriting Agreement") whereby the Distributor acts as principal underwriter for the Trust's shares.
The Trust has adopted a Distribution Plan (the "Plan") pursuant to Rule 12b-1 under the 1940 Act with respect to certain classes of shares. The Plan permits the Funds to compensate the Distributor, for expenses associated with the distribution-related and/or shareholder services provided by such entities. These fees are paid to the Distributor and are either kept or paid to shareholders' financial advisors or other intermediaries for distribution and shareholder services. Although actual distribution expenses may be more or less, under the Plan, the Funds pay the Distributor an annual fee of the following amounts, based on the total net assets of each, respective class:
| Fund | Class A Shares | Class C Shares (a) | Class R Shares (a) | ||||||||
| China A Share Equity Fund | 0.25% | 1.00% | 0.50% | ||||||||
| Dynamic Dividend Fund | 0.25% | – | – | ||||||||
| Emerging Markets Fund | 0.25% | 1.00% | 0.50% | ||||||||
| 2021 Annual Report | 131 |
Notes to Financial Statements (continued)
October 31, 2021
| Class A | Class C | Class R | |
| Fund | Shares | Shares (a) | Shares (a) |
| Emerging Markets Sustainable Leaders Fund | 0.25% | 1.00% | 0.50% |
| Global Equity Fund | 0.25% | 1.00% | 0.50% |
| Global Infrastructure Fund | 0.25% | – | – |
| International Real Estate Equity Fund | 0.25% | – | – |
| International Small Cap Fund | 0.25% | 1.00% | 0.50% |
| Realty Income & Growth Fund | 0.25% | – | – |
| U.S. Small Cap Equity Fund | 0.25% | 1.00% | 0.50% |
| U.S. Sustainable Leaders Fund | 0.25% | 1.00% | – |
| U.S. Sustainable Leaders Smaller Companies Fund | 0.25% | 1.00% | 0.50% |
(a) 0.25% of which is service fees.
The Adviser or an affiliate of the Adviser may pay additional amounts from its own resources to dealers or other financial intermediaries, for aid in distribution or for aid in providing administrative services to shareholders.
Pursuant to the current Underwriting Agreement, the Distributor will also receive the proceeds of contingent deferred sales charges ("CDSCs") of 1.00% imposed on certain redemptions of Class C (and up to 1.00% for certain Class A) shares.
In addition, the Distributor will re-allow to dealers 5.00% of sales charges on Class A shares of the Funds, which have a maximum front-end sales charge of 5.75% and the Distributor or the Adviser may compensate broker dealers or financial intermediaries from its own resources at the rate of 1.00% on sales of Class C shares of the Funds, which have a maximum CDSC of 1.00% (the CDSC assessed on sales within one year of purchase). The amount the Distributor retained for commissions from front-end sales charges and CDSC fees for the fiscal year ended October 31, 2021 was as follows:
| Fund | Commissions retained from front-end sales charges of Class A shares | Commissions retained from CDSC fees of Class C (and certain Class A) shares | ||
| China A Share Equity Fund | $ 128,573 | $ 4,870 | ||
| Dynamic Dividend Fund | 6,600 | – | ||
| Emerging Markets Fund | 34,057 | 120 | ||
| Emerging Markets Sustainable Leaders Fund | 202 | – | ||
| Global Equity Fund | 1,276 | – | ||
| Global Infrastructure Fund | 34,522 | – | ||
| International Small Cap Fund | 15,093 | 27 | ||
| Realty Income & Growth Fund | 2,670 | – | ||
| U.S. Small Cap Equity Fund | 44,238 | 894 | ||
| U.S. Sustainable Leaders Fund | 13,281 | 16 | ||
| U.S. Sustainable Leaders Smaller Companies Fund | 3,727 | 54 | ||
| Total Retained | $284,239 | $5,981 |
| d. | Administrative Services Fees/Transfer Agent Out-of-Pocket Expenses |
The Funds may pay and/or reimburse administrative services fees/sub-transfer agent expenses to certain broker-dealers and financial intermediaries who provide administrative support services to beneficial shareholders on behalf of the Funds (sometimes referred to as "sub-transfer agency fees"), subject to certain limitations approved by the Board. These fees may be in addition to Rule 12b-1 fees. Sub-transfer agency fees generally include, but are not limited to, costs associated with recordkeeping, networking, sub-transfer agency or other administrative or shareholder services.
| 132 | 2021 Annual Report |
Notes to Financial Statements (continued)
October 31, 2021
Class A, Class R and Institutional Service Class shares of the Funds pay for such services pursuant to an Administrative Services Plan adopted by the Board. Under the Administrative Services Plan, a Fund may pay a broker-dealer or other intermediary a maximum annual administrative services fee of 0.25% for Class A, Class R and Institutional Service Class shares. Under an amendment to the Administrative Services Plan that is in effect until at least February 28, 2022, the administrative service fee for a Fund is limited to a maximum of 0.15% for contracts with fees that are calculated as a percentage of Fund assets and a maximum of $16 per account for contracts with fees that are calculated on a dollar per account basis; however, many intermediaries do not charge the maximum permitted fee or even a portion thereof. Class C and Institutional Class shares may also pay for the services described above directly and not pursuant to an Administrative Services Plan.
The aggregate amount of sub-transfer agent and administrative service fees paid during the fiscal year ended October 31, 2021 was as follows:
| Fund | Class A | Class C | Class R | Institutional Service | Institutional | ||||||
| China A Share Equity Fund | $ 14,567 | $ 2,733 | $ 7,862 | $ 826 | $ 39,961 | ||||||
| Dynamic Dividend Fund | 3,732 | – | – | – | 77,869 | ||||||
| Emerging Markets Fund | 309,172 | 8,986 | 216,385 | 682,335 | 3,555,804 | ||||||
| Emerging Markets Sustainable Leaders Fund | 30,069 | 2,342 | 7,336 | 63,077 | 51,599 | ||||||
| Global Equity Fund | 23,335 | 420 | 1,717 | 312 | 762 | ||||||
| Global Infrastructure Fund | 8,605 | – | – | – | 32,680 | ||||||
| International Real Estate Equity Fund | 83 | – | – | – | 27,333 | ||||||
| International Small Cap Fund | 101,944 | 707 | 2,959 | – | 104,268 | ||||||
| Realty Income & Growth Fund | 717 | – | – | – | 36,926 | ||||||
| U.S. Small Cap Equity Fund | 196,754 | 38,021 | 7,209 | 50,126 | 693,608 | ||||||
| U.S. Sustainable Leaders Fund | 121,351 | 912 | – | 94,063 | 7,560 | ||||||
| U.S. Sustainable Leaders Smaller Companies Fund | 5,874 | 300 | 3,715 | 328 | 5,604 |
| e. | Purchase/Sale Transactions Between Affiliates |
The Funds are permitted to buy or sell securities with funds that have a common investment adviser (or investment advisers which are affiliates) under specific procedures which have been approved by the Board. The procedures are designed to satisfy the requirements of Rule 17a-7 of the Investment Company Act of 1940 ("Rule 17a-7"). During the fiscal year ended October 31, 2021, the Funds did not engage in any of these trades.
| 4. | Investment Transactions |
Purchases and sales of securities (excluding short-term securities) for the fiscal year ended October 31, 2021, were as follows:
| Fund | Purchases | Sales | |||
| China A Share Equity Fund | $ 102,741,896 | $ 33,122,578 | |||
| Dynamic Dividend Fund | 72,293,308 | 78,749,853 | |||
| Emerging Markets Fund | 2,029,380,326 | 1,874,373,956 | |||
| Emerging Markets Sustainable Leaders Fund | 263,093,707 | 304,100,476 | |||
| Global Equity Fund | 6,364,668 | 10,598,811 | |||
| Global Infrastructure Fund | 20,024,910 | 15,576,345 | |||
| International Real Estate Equity Fund | 13,654,648 | 17,004,246 | |||
| International Small Cap Fund | 178,061,258 | 88,718,318 | |||
| Realty Income & Growth Fund | 17,088,548 | 25,705,720 | |||
| U.S. Small Cap Equity Fund | 768,426,064 | 773,129,783 | |||
| U.S. Sustainable Leaders Fund | 501,150,954 | 540,288,791 | |||
| U.S. Sustainable Leaders Smaller Companies Fund | 24,991,244 | 26,811,101 |
| 2021 Annual Report | 133 |
Notes to Financial Statements (continued)
October 31, 2021
5. Portfolio Investment Risks
| a. | Concentration Risk |
The Global Infrastructure Fund, International Real Estate Equity Fund and Realty Income & Growth Fund are subject to concentration risk. Each Fund's strategy of concentrating in companies in a specific industry means that its performance will be closely tied to the performance of a particular market segment. Each Fund's concentration in these companies may present more risks than if it were broadly diversified over numerous industries and sectors of the economy. A downturn in these companies would have a larger impact on each Fund than on a mutual fund that does not concentrate in such companies. At times, the performance of these companies will lag the performance of other industries or the broader market as a whole.
| b. | Cybersecurity Risk |
Cybersecurity incidents may allow an unauthorized party to gain access to Fund assets, customer data (including private shareholder information), or proprietary information, or cause each Fund, the Adviser and/or their service providers (including, but not limited to, Fund accountants, custodians, sub-custodians, transfer agents and financial intermediaries) to suffer data breaches, data corruption or lose operational functionality.
| c. | Dividend Strategy Risk |
The Dynamic Dividend Fund and Realty Income & Growth Fund are subject to dividend strategy risk. There is no guarantee that the issuers of the stocks held by the Fund will declare dividends in the future or that, if dividends are declared, they will remain at their current levels or increase over time. The Fund's emphasis on dividend paying stocks could cause the Fund to underperform similar funds that invest without consideration of a company's track record of paying dividends or ability to pay dividends in the future. Dividend-paying stocks may not participate in a broad market advance to the same degree as other stocks, and a sharp rise in interest rates or economic downturn could cause a company to unexpectedly reduce or eliminate its dividend. The Fund may hold securities for short periods of time related to the dividend payment periods and may experience loss during these periods.
| d. | Emerging Markets Risk |
The risks of investing in emerging market countries are a magnification of the risks that apply to foreign investments. These risks are greater for securities of companies in emerging market countries because the countries may have less stable governments, more volatile currencies and less established markets (see "Foreign Securities Risk" below).
| e. | Equity-Linked Notes |
The China A Share Equity Fund may invest in equity-linked notes, which are generally subject to the same risks as the foreign equity securities or the basket of foreign securities they are linked to. If the linked security(ies) declines in value, the note may return a lower amount at maturity. The trading price of an equity-linked note also depends on the value of the linked security(ies).
| f. | Equity Securities Risk |
The stock or other security of a company may not perform as well as expected, and may decrease in value, because of factors related to the company (such as poorer than expected earnings or certain management decisions), to the industry in which the company is engaged (such as a reduction in the demand for products or services in a particular industry), or to the market as a whole (such as periods of market volatility or instability, or general and prolonged periods of economic decline).
| g. | Exchange-Traded Fund Risk |
To the extent that the China A Share Equity Fund invests in ETFs, the Fund may be subject to, among other risks, tracking error risk and passive and, in some cases, active management investment risk. An active secondary market in ETF shares may not develop or be maintained and may be halted or interrupted due to actions by its listing exchange, unusual market conditions or other reasons. There can be no assurance that an ETF's shares will continue to be listed on an active exchange. In addition, Fund shareholders bear both their proportionate share of the Fund's expenses and similar expenses incurred through the Fund's ownership of the ETF.
| h. | Foreign Currency Exposure Risk |
The value of foreign currencies relative to the U.S. Dollar fluctuates in response to market, economic, political, regulatory, geopolitical or other conditions. A decline in the value of a foreign currency versus the U.S. Dollar reduces the value in U.S. Dollars of investments denominated in that foreign currency. This risk may impact a Fund more greatly to the extent the Fund does not hedge its currency risk, or hedging techniques used by the Adviser are unsuccessful.
| 134 | 2021 Annual Report |
Notes to Financial Statements (continued)
October 31, 2021
| i. | Foreign Securities Risk |
Foreign countries in which a Fund may invest may have markets that are less liquid, less regulated and more volatile than U.S. markets. The value of a Fund's investments may decline because of factors such as unfavorable or unsuccessful government actions, reduction of government or central bank support and political or financial instability. To the extent the Fund focuses its investments in a single country or only a few countries in a particular geographic region, economic, political, regulatory or other conditions affecting such country or region may have a greater impact on Fund performance relative to a more geographically diversified fund.
Asian Risk. Parts of the Asian region may be subject to a greater degree of economic, political and social instability than is the case in the United States and Europe. Some Asian countries can be characterized as emerging markets or newly industrialized and may experience more volatile economic cycles than developed countries. The developing nature of securities markets in many countries in the Asian region may lead to a lack of liquidity while some countries have restricted the flow of money in and out of the country. Some countries in Asia have historically experienced political uncertainty, corruption, military intervention and social unrest. To the extent a Fund invests heavily in Asian issuers, the Fund may be more volatile than a fund which is broadly diversified geographically.
China Risk. Concentrating investments in China and Hong Kong subjects the China A Shares Equity Fund to additional risks, and may make it significantly more volatile than geographically diverse mutual funds. Additional risks associated with investments in China and Hong Kong include exposure to currency fluctuations, less liquidity, expropriation, confiscatory taxation, nationalization, exchange control regulations (including currency blockage), trading halts, imposition of tariffs, limitations on repatriation and differing legal standards. Any spread of an infectious illness, public health threat or similar issue could reduce consumer demand or economic output, result in market closures, travel restrictions or quarantines, and generally have a significant impact on the Chinese economy, which in turn could adversely affect the Fund's investments.
China A Shares Risk. Trading in China A Shares through Stock Connect and the QFII Programs involves additional risks. Stock Connect is subject to a daily quota (the "Daily Quota"), which limits the maximum net purchases under Stock Connect each day and, as such, buy orders for China A Shares would be rejected once the Daily Quota is exceeded (although the Fund will be permitted to sell China A Shares regardless of the Daily Quota balance). Further, Stock Connect, which relies on the connectivity of the Shanghai or Shenzhen markets with Hong Kong, is subject to operational risk, regulations that are relatively untested and are subject to change, and extended market closures for holidays or otherwise. During an extended market closure, the Fund's ability to trade in China A Shares will be impacted which may affect the Fund's performance. The QFII Programs are subject to the risk that the Adviser may have its QFII Programs license revoked or restricted with respect to the Fund or the Fund may be impacted by the rules, restrictions and quota limitations connected to reliance on a QFII Programs license.
| j. | Illiquid Securities Risk |
Illiquid securities are assets that a Fund reasonably expects cannot be sold or disposed of in current market conditions in seven calendar days or less without the sale or disposition significantly changing the market value of the asset. An inability to sell a portfolio position can adversely affect a Fund's value or prevent the Fund from being able to take advantage of other investment opportunities. Illiquid securities and relatively less liquid securities may also be difficult to value.
The Adviser employs procedures and tests using third-party and internal data inputs that seek to assess and manage the liquidity of a Fund's portfolio holdings. These procedures and tests take into account a Fund's investment strategy and liquidity of portfolio investments during both normal and foreseeable stressed conditions, cash-flow projections during both normal and reasonable foreseeable stressed conditions, relevant market, trading and other factors, and monitor whether liquidity should be adjusted based on changed market conditions. These procedures and tests are designed to assist a Fund in determining its ability to meet redemption requests in various market conditions. In light of the dynamic nature of markets, there can be no assurance that these procedures and tests will enable a Fund to ensure that it has sufficient liquidity to meet redemption requests.
| k. | Impact of Large Redemptions and Purchases of Fund Shares |
Occasionally, shareholders may make large redemptions or purchases of Fund shares, which may cause a Fund to have to sell securities or invest additional cash. These transactions may adversely affect the Fund's performance and increase transaction costs. In addition, large redemption requests may exceed the cash balance of a Fund and result in credit line borrowing fees and/or overdraft charges to the Fund until the sales of portfolio securities necessary to cover the redemption request settle.
| l. | Infrastructure-Related Investment Risk |
Because the Global Infrastructure Fund concentrates its investments in infrastructure-related entities, the Fund has greater exposure to the potential adverse economic, regulatory, political and other changes affecting such entities. Infrastructure related entities are subject to a variety of factors that may adversely affect their business or operations, including high interest costs in connection with capital construction programs, costs associated with environmental and other regulations, the effects of economic slowdown and surplus capacity, increased
| 2021 Annual Report | 135 |
Notes to Financial Statements (continued)
October 31, 2021
competition from other providers of services, uncertainties concerning the availability of fuel at reasonable prices, the effects of energy conservation policies and other factors. Additionally, infrastructure-related entities may be subject to regulation by various governmental authorities and may also be affected by governmental regulation of rates charged to customers, service interruption due to environmental, operational or other mishaps and the imposition of special tariffs and changes in tax laws, regulatory policies and accounting standards.
| m. | Issuer Risk |
The value of a security may decline for reasons directly related to the issuer, such as management performance, financial leverage and reduced demand for the issuer's goods or services.
| n. | LIBOR Risk |
A Fund may invest in certain debt securities, derivatives or other financial instruments that utilize the London Interbank Offered Rate ("LIBOR") as a "benchmark" or "reference rate" for various interest rate calculations. In July 2017, the United Kingdom Financial Conduct Authority ("FCA"), which regulates LIBOR, announced a desire to phase out the use of LIBOR by the end of 2021. However, subsequent announcements by the FCA, the LIBOR administrator and other regulators indicate that it is possible that the most widely used LIBOR rates may continue until mid-2023. It is anticipated that LIBOR ultimately will be discontinued or the regulator will announce that it is no longer sufficiently robust to be representative of its underlying market around that time. Although financial regulators and industry working groups have suggested alternative reference rates, such as European Interbank Offered Rate ("EURIBOR"), Sterling Overnight Interbank Average Rate ("SONIA") and Secured Overnight Financing Rate ("SOFR"), global consensus on alternative rates is lacking and the process for amending existing contracts or instruments to transition away from LIBOR remains unclear. The elimination of LIBOR or changes to other reference rates or any other changes or reforms to the determination or supervision of reference rates could have an adverse impact on the market for, or value of, any securities or payments linked to those reference rates, which may adversely affect a Fund's performance and/or net asset value. Uncertainty and risk also remain regarding the willingness and ability of issuers and lenders to include revised provisions in new and existing contracts or instruments. Consequently, the transition away from LIBOR to other reference rates may lead to increased volatility and illiquidity in markets that are tied to LIBOR, fluctuations in values of LIBOR-related investments or investments in issuers that utilize LIBOR, increased difficulty in borrowing or refinancing and diminished effectiveness of hedging strategies, adversely affecting a Fund's performance. Furthermore, the risks associated with the expected discontinuation of LIBOR and transition may be exacerbated if the work necessary to effect an orderly transition to an alternative reference rate is not completed in a timely manner. Because the usefulness of LIBOR as a benchmark could deteriorate during the transition period, these effects could occur prior to the end of 2021.
| o. | Management Risk |
Each Fund is subject to the risk that the Adviser or Subadviser (as applicable) may make poor security selections. The Adviser, Subadviser and their portfolio managers apply their own investment techniques and risk analyses in making investment decisions for a Fund and there can be no guarantee that these decisions will achieve the desired results for the Fund. In addition, the Adviser or Subadviser may select securities that underperform the relevant market of other funds with similar investment objectives and strategies.
| p. | Market Risk |
Markets are affected by numerous factors, including interest rates, the outlook for corporate profits, the health of the national and world economies, the fluctuation of other stock markets around the world, and financial, economic and other global market developments and disruptions, such as those arising from war, terrorism, market manipulation, government interventions, defaults and shutdowns, political changes or diplomatic developments, public health emergencies and natural/environmental disasters. Such events can negatively impact the securities markets and cause a Fund to lose value.
One such event is the COVID-19 pandemic, which has caused major disruptions to economies and markets around the world, including the markets in which the Funds invest, and which has and may continue to negatively impact the value of certain Fund investments. Although vaccines for COVID-19 and variants thereof are becoming more widely available, the COVID-19 pandemic and impacts thereof may continue for an extended period of time and may vary from market to market. To the extent the impacts of COVID-19 continue, a Fund may experience negative impacts to its business that could exacerbate other risks to which the Fund is subject. Policy and legislative changes in countries around the world are affecting many aspects of financial regulation, and governmental and quasi-governmental authorities and regulators throughout the world have previously responded to serious economic disruptions with a variety of significant fiscal and monetary policy changes.
In addition, economies and financial markets throughout the world are becoming increasingly interconnected. As a result, whether or not a Fund invests in securities of issuers located in or with significant exposure to countries experiencing economic and financial difficulties, the value and liquidity of the Fund's investments may be negatively affected by such events.
| 136 | 2021 Annual Report |
Notes to Financial Statements (continued)
October 31, 2021
For example, whether or not a Fund invests in securities of issuers located in Europe (whether the EU, Eurozone or UK) or with significant exposure to European, EU, Eurozone or UK issuers or countries, the unavoidable uncertainties and events related to the UK's departure from the EU ("Brexit") could negatively affect the value and liquidity of a Fund's investments, increase taxes and costs of business and cause volatility in currency exchange rates and interest rates. Brexit could adversely affect the performance of contracts in existence at the date of Brexit and European, UK or worldwide political, regulatory, economic or market conditions and could contribute to instability in political institutions, regulatory agencies and financial markets. Brexit could also lead to legal uncertainty and politically divergent national laws and regulations as a new relationship between the UK and EU is defined and as the UK determines which EU laws to replace or replicate. Any of these effects of Brexit, and others that cannot be anticipated, could adversely affect the Fund's business, results of operations and financial condition.
The impact of these changes on the markets, and the practical implications for market participants, may not be fully known for some time.
| q. | Mid-Cap Securities Risk |
Securities of medium-sized companies tend to be more volatile and less liquid than securities of larger companies.
| r. | Non-Diversified Fund Risk |
The Realty Income & Growth Fund's performance may be more volatile than a diversified fund because it may invest a greater percentage of its total assets in the securities of a single issuer.
| s. | Non-U.S. Taxation Risk |
Income, proceeds and gains received by a Fund from sources within foreign countries may be subject to withholding and other taxes imposed by such countries, which will reduce the return on those investments. Tax treaties between certain countries and the United States may reduce or eliminate such taxes.
If, at the close of its taxable year, more than 50% of the value of a Fund's total assets consists of securities of foreign corporations, including for this purpose foreign governments, the Fund will be permitted to make an election under the Code that will allow shareholders a deduction or credit for foreign taxes paid by the Fund. In such a case, shareholders will include in gross income from foreign sources their pro rata shares of such taxes. A shareholder's ability to claim an offsetting foreign tax credit or deduction in respect of such foreign taxes is subject to certain limitations imposed by the Code, which may result in the shareholder's not receiving a full credit or deduction (if any) for the amount of such taxes. Shareholders who do not itemize on their U.S. federal income tax returns may claim a credit (but not a deduction) for such foreign taxes. If a Fund does not qualify for or chooses not to make such an election, shareholders will not be entitled separately to claim a credit or deduction for U.S. federal income tax purposes with respect to foreign taxes paid by the Fund; in that case the foreign tax will nonetheless reduce the Fund's taxable income. Even if a Fund elects to pass through to its shareholders foreign tax credits or deductions, tax-exempt shareholders and those who invest in the Fund through tax-advantaged accounts such as IRAs will not benefit from any such tax credit or deduction.
| t. | Passive Foreign Investment Company Tax Risk |
Equity investments by a Fund in certain "passive foreign investment companies" ("PFICs") could subject the Fund to a U.S. federal income tax (including interest charges) on distributions received from the PFIC or on proceeds received from the disposition of shares in the PFIC. A Fund may be able to elect to treat a PFIC as a "qualified electing fund" (i.e., make a "QEF election"), in which case the Fund will be required to include its share of the company's income and net capital gains annually. A Fund may make an election to mark the gains (and to a limited extent losses) in such holdings "to the market" as though it had sold and repurchased its holdings in those PFICs on the last day of the Fund's taxable year. Such gains and losses are treated as ordinary income and loss. Because it is not always possible to identify a foreign corporation as a PFIC, a Fund may incur the tax and interest charges described above in some instances.
| u. | Portfolio Turnover Risk |
The Dynamic Dividend Fund may engage in active and frequent trading of portfolio securities to achieve its investment objective. High portfolio turnover may result in greater transaction costs which may reduce Fund performance. The sale of Fund portfolio securities may also result in greater realization and/or distribution to shareholders of gains or losses as compared to a Fund with less active trading, which may include short-term gains taxable at ordinary income tax rates.
| v. | Qualified Dividend Income Tax Risk |
With respect to the Dynamic Dividend Fund, no assurance can be given as to what percentage of the distributions paid on shares, if any, will consist of tax-advantaged qualified dividend income or long-term capital gains or what the tax rates on various types of income will be in future years. The favorable U.S. federal tax treatment may be adversely affected, changed or repealed by future changes in tax laws at any time. In addition, it may be difficult to obtain information regarding whether distributions by non-U.S. entities in which a Fund invests should
| 2021 Annual Report | 137 |
Notes to Financial Statements (continued)
October 31, 2021
be regarded as qualified dividend income. Furthermore, to receive qualified dividend income treatment, a Fund must meet holding period and other requirements with respect to the dividend paying securities in its portfolio, and the shareholder must meet holding period and other requirements with respect to the common shares of a Fund.
| w. | REIT and Real Estate Risk |
Investment in real estate investment trusts ("REITs") and real estate involves the risks that are associated with direct ownership of real estate and with the real estate industry in general. These risks include: declines in the value of real estate; risks related to local economic conditions, overbuilding and increased competition; increases in property taxes and operating expenses; changes in zoning laws; casualty or condemnation losses; variations in rental income, neighborhood values or the appeal of properties to tenants; changes in interest rates and changes in general economic and market conditions. REITs' share prices may decline because of adverse developments affecting the real estate industry including changes in interest rates. The returns from REITs may trail returns from the overall market. Additionally, there is always a risk that a given REIT will fail to qualify for favorable tax treatment. REITs may be leveraged, which increases risk. Certain REITs charge management fees, which may result in layering the management fee paid by the fund.
| x. | Sector Risk |
To the extent that a Fund has a significant portion of its assets invested in securities of companies conducting business in a broadly related group of industries within an economic sector, the Fund may be more vulnerable to unfavorable developments in that economic sector than funds that invest more broadly.
Industrials Sector Risk. To the extent that the industrial sector represents a significant portion of a Fund's holdings, the Fund will be sensitive to changes in, and its performance may be adversely impacted by issues impacting this sector. The value of securities issued by companies in the industrials sector may be adversely affected by supply and demand related to their specific products or services and industrials sector products in general. The products of manufacturing companies may face obsolescence due to rapid technological developments and frequent new product introduction. Government regulations, world events, economic conditions and exchange rates may adversely affect the performance of companies in the industrials sector. Companies in the industrials sector may be adversely affected by liability for environmental damage and product liability claims. The industrials sector may also be adversely affected by changes or trends in commodity prices, which may be influenced by unpredictable factors. Companies in the industrials sector, particularly aerospace and defense companies, may also be adversely affected by government spending policies because companies involved in this sector rely to a significant extent on government demand for their products and services.
Information Technology Sector Risk. To the extent that the information technology sector represents a significant portion of a Fund, the Fund will be sensitive to changes in, and its performance may depend to a greater extent on, factors impacting this sector. Information technology companies face intense competition, both domestically and internationally, which may have an adverse effect on their profit margins. Like other technology companies, information technology companies may have limited product lines, markets, financial resources or personnel. The products of information technology companies may face obsolescence due to rapid technological developments, frequent new product introduction, unpredictable changes in growth rates and competition for the services of qualified personnel. Companies in the information technology sector are heavily dependent on patent and intellectual property rights. The loss or impairment of these rights may adversely affect the profitability of these companies.
| y. | Small-Cap Securities Risk |
Securities of smaller companies are usually less stable in price and less liquid than those of larger, more established companies. Therefore, they generally involve greater risk.
| z. | Sustainable Investing Risk |
A Fund's "Sustainable Leaders" strategy could cause it to perform differently compared to funds that do not have such strategy. ESG considerations may be linked to long-term rather than short-term returns. The criteria related to a Fund's Sustainable Leaders strategy, including the exclusion of securities of companies that engage in certain business activities, may result in the Fund forgoing opportunities to buy certain securities when it might otherwise be advantageous to do so, or selling securities for ESG reasons when it might be otherwise disadvantageous for it to do so. In addition, there is a risk that the companies identified as sustainable leaders by the Adviser do not operate as expected when addressing ESG issues. There are significant differences in interpretations of what it means for a company to have positive ESG characteristics. While the Adviser believes its definitions are reasonable, the portfolio decisions it makes may differ with other investors' or advisers' views.
| 138 | 2021 Annual Report |
Notes to Financial Statements (continued)
October 31, 2021
| aa. | Valuation Risk |
The price that a Fund could receive upon the sale of any particular portfolio investment may differ from the Fund's valuation of the investment, particularly for securities that trade in thin or volatile markets or that are valued using a fair valuation methodology or a price provided by an independent pricing service. As a result, the price received upon the sale of an investment may be less than the value ascribed by a Fund, and the Fund could realize a greater than expected loss or lesser than expected gain upon the sale of the investment. A Fund's ability to value its investments may also be impacted by technological issues and/or errors by pricing services or other third-party service providers.
Please read the Funds' prospectus for more detailed information regarding these and other risks.
6. Contingencies
In the normal course of business, the Funds may provide general indemnifications pursuant to certain contracts and organizational documents. The Funds' maximum exposure under these arrangements is dependent on future claims that may be made against the Funds, and therefore, cannot be estimated; however, the Funds expect the risk of loss from such claims to be remote.
7. Tax Information
As of October 31, 2021, the tax cost of securities and the breakdown of unrealized appreciation/(depreciation) for each Fund were as follows:
| Tax Cost of Securities | Unrealized Appreciation | Unrealized Depreciation | Net Unrealized Appreciation/ (Depreciation) | |||||
| China A Share Equity Fund | $ 88,156,397 | $ 7,633,007 | $ (7,576,982 | ) | $ 56,025 | |||
| Dynamic Dividend Fund | 95,329,956 | 37,504,460 | (4,560,953 | ) | 32,943,507 | |||
| Emerging Markets Fund | 3,756,298,023 | 1,497,211,124 | (304,808,125 | ) | 1,192,402,999 | |||
| Emerging Markets Sustainable Leaders Fund | 201,643,485 | 29,917,281 | (16,157,120 | ) | 13,760,161 | |||
| Global Equity Fund | 20,550,530 | 10,591,113 | (121,927 | ) | 10,469,186 | |||
| Global Infrastructure Fund | 46,433,400 | 13,937,380 | (2,024,148 | ) | 11,913,232 | |||
| International Real Estate Equity Fund | 31,608,460 | 2,608,744 | (13,209,241 | ) | (10,600,497 | ) | ||
| International Small Cap Fund | 239,667,806 | 83,442,539 | (9,529,649 | ) | 73,912,890 | |||
| Realty Income & Growth Fund | 37,145,321 | 20,659,522 | (224,144 | ) | 20,435,378 | |||
| U.S. Small Cap Equity Fund | 967,921,874 | 241,563,624 | (17,999,079 | ) | 223,564,545 | |||
| U.S. Sustainable Leaders Fund | 403,202,147 | 122,076,761 | (5,043,800 | ) | 117,032,961 | |||
| U.S. Sustainable Leaders Smaller Companies Fund | 16,094,427 | 3,408,218 | (101,606 | ) | 3,306,612 |
The tax character of distributions paid during the fiscal year ended October 31, 2021 was as follows (total distributions paid may differ from the Statements of Changes in Net Assets because for tax purposes dividends are recognized when actually paid):
| Distributions Paid From | |||||||||||||
| Fund | Ordinary Income* | Net Long Term Capital Gains* | Total Taxable Distributions | Tax Exempt Distributions | Return of Capital | Total Distributions Paid | |||||||
| China A Share Equity Fund | $ 53,382 | $ 463,245 | $ 516,627 | $– | $– | $ 516,627 | |||||||
| Dynamic Dividend Fund | 6,553,325 | – | 6,553,325 | – | – | 6,553,325 | |||||||
| Emerging Markets Fund | 8,787,598 | 33,395,606 | 42,183,204 | – | – | 42,183,204 | |||||||
| Emerging Markets Sustainable Leaders Fund | 454,746 | – | 454,746 | – | – | 454,746 | |||||||
| Global Equity Fund | – | – | – | – | – | – | |||||||
| Global Infrastructure Fund | 1,653,806 | 39,441 | 1,693,247 | – | – | 1,693,247 | |||||||
| International Real Estate Equity Fund | 772,714 | – | 772,714 | – | – | 772,714 | |||||||
| International Small Cap Fund | – | – | – | – | – | – | |||||||
| 2021 Annual Report | 139 |
Notes to Financial Statements (continued)
October 31, 2021
| Distributions Paid From | |||||||||||||
| Fund | Ordinary Income* | Net Long Term Capital Gains* | Total Taxable Distributions | Tax Exempt Distributions | Return of Capital | Total Distributions Paid | |||||||
| Realty Income & Growth Fund | $ 614,019 | $ 5,677,170 | $ 6,291,189 | $– | $– | $ 6,291,189 | |||||||
| U.S. Small Cap Equity Fund | 7,615,912 | 41,783,512 | 49,399,424 | – | – | 49,399,424 | |||||||
| U.S. Sustainable Leaders Fund | 11,862,382 | 36,364,159 | 48,226,541 | – | – | 48,226,541 | |||||||
| U.S. Sustainable Leaders Smaller Companies Fund | 169,299 | 1,648,863 | 1,818,162 | – | – | 1,818,162 | |||||||
Amounts listed as "–" are $0 or round to $0.
The tax character of distributions paid during the fiscal year ended October 31, 2020 was as follows (total distributions paid may differ from the Statements of Changes in Net Assets because for tax purposes dividends are recognized when actually paid):
| Distributions Paid From | |||||||||||||
| Fund | Ordinary Income* | Net Long Term Capital Gains* | Total Taxable Distributions | Tax Exempt Distributions | Return of Capital | Total Distributions Paid | |||||||
| China A Share Equity Fund | $ 14,078 | $ 715,542 | $ 729,620 | $– | $ – | $ 729,620 | |||||||
| Dynamic Dividend Fund | 7,157,644 | – | 7,157,644 | – | – | 7,157,644 | |||||||
| Emerging Markets Fund | 91,341,000 | 2,583,742 | 93,924,742 | – | – | 93,924,742 | |||||||
| Emerging Markets Sustainable Leaders Fund | 2,748,047 | – | 2,748,047 | – | – | 2,748,047 | |||||||
| Global Equity Fund | 186,711 | 798,701 | 985,412 | – | – | 985,412 | |||||||
| Global Infrastructure Fund | 2,807,721 | 449,156 | 3,256,877 | – | 606,231 | 3,863,108 | |||||||
| International Real Estate Equity Fund | 6,412,304 | – | 6,412,304 | – | – | 6,412,304 | |||||||
| International Small Cap Fund | 1,686,730 | 4,472,541 | 6,159,271 | – | – | 6,159,271 | |||||||
| Realty Income & Growth Fund | 1,259,953 | 9,878,074 | 11,138,027 | – | – | 11,138,027 | |||||||
| U.S. Small Cap Equity Fund | 1,296,552 | 59,696,046 | 60,992,598 | – | – | 60,992,598 | |||||||
| U.S. Sustainable Leaders Fund | 2,144,740 | 34,164,852 | 36,309,592 | – | – | 36,309,592 | |||||||
| U.S. Sustainable Leaders Smaller Companies Fund | 289,373 | 1,634,574 | 1,923,947 | – | – | 1,923,947 | |||||||
As of October 31, 2021, the components of accumulated earnings/(deficit) on a tax basis were as follows:
| Fund | Undistributed Tax Exempt Income | Undistributed Ordinary Income | Undistributed Long-Term Capital Gains | Accumulated Earnings | Distributions Payable | Late Year Ordinary and Post-October Capital Loss Deferrals | Other Temporary Differences | Unrealized Appreciation/ (Depreciation)* | Accumulated Capital and Other Losses** | Total Accumulated Earnings/ (Deficit) | ||||||||||
| China A Share Equity Fund | $– | $ 42,895 | $ 2,210,773 | $– | $– | $– | $– | $ 57,102 | $ – | $ 2,310,770 | ||||||||||
| Dynamic Dividend Fund | – | 330,507 | 242,902 | – | – | – | – | 32,948,209 | – | 33,521,618 | ||||||||||
| Emerging Markets Fund | – | 72,825,019 | 390,351,786 | – | – | – | – | 1,192,390,821 | – | 1,655,567,626 | ||||||||||
| Emerging Markets Sustainable Leaders Fund | – | 8,771,688 | 31,005,272 | – | – | – | – | 13,287,645 | – | 53,064,605 | ||||||||||
| Global Equity Fund | – | – | 3,260,750 | – | – | – | – | 10,459,636 | (3,959,123 | ) | 9,761,263 | |||||||||
| Global Infrastructure Fund | – | – | 633,034 | – | – | – | – | 11,912,176 | – | 12,545,210 | ||||||||||
| International Real Estate Equity Fund | – | 797,672 | – | – | – | – | – | (10,600,384 | ) | (73,002,383 | ) | (82,805,095 | ) | |||||||
| International Small Cap Fund | – | 3,632,353 | 18,234,244 | – | – | – | – | 73,787,213 | – | 95,653,810 | ||||||||||
| Realty Income & Growth Fund | – | 780,011 | 6,407,926 | – | – | – | – | 20,435,378 | – | 27,623,315 |
| 140 | 2021 Annual Report |
Notes to Financial Statements (continued)
October 31, 2021
| Fund | Undistributed Tax Exempt Income | Undistributed Ordinary Income | Undistributed Long-Term Capital Gains | Accumulated Earnings | Distributions Payable | Late Year Ordinary and Post-October Capital Loss Deferrals | Other Temporary Differences | Unrealized Appreciation/ (Depreciation)* | Accumulated Capital and Other Losses** | Total Accumulated Earnings/ (Deficit) | |||||||||||
| U.S. Small Cap Equity Fund | $– | $92,788,176 | $130,222,045 | $– | $– | $– | $– | $223,564,545 | $ – | $446,574,766 | |||||||||||
| U.S. Sustainable Leaders Fund | – | 46,901,064 | 79,580,771 | – | – | – | – | 117,032,961 | – | 243,514,796 | |||||||||||
| U.S. Sustainable Leaders Smaller Companies Fund | – | 2,800,282 | 2,439,921 | – | – | – | – | 3,306,613 | – | 8,546,816 |
| * | The difference between the book-basis and tax-basis unrealized appreciation/(depreciation) is attributable primarily to passive foreign investment companies and tax deferral of losses on wash sales. |
| ** | As of October 31, 2021, for Federal income tax purposes, these Funds have capital loss carryforwards available to offset capital gains, if any, to the extent provided by the Treasury regulations, with no expiration. |
As of October 31, 2021, for Federal income tax purposes, the following Funds have capital loss carryforwards available to offset capital gains, if any, to the extent provided by the Treasury regulations.
| Fund | Amount | Expires | |||
| Global Equity Fund | $3,959,123 | Unlimited (Long-Term) | |||
| International Real Estate Equity Fund | 6,001,423 | Unlimited (Short-Term) | |||
| International Real Estate Equity Fund | 67,000,960 | Unlimited (Long-Term) |
GAAP requires that certain components of net assets be adjusted to reflect permanent differences between financial and tax reporting. Accordingly, the table below details the necessary reclassifications, which are a result of permanent differences primarily attributable to use of equalization, and REIT investments. These reclassifications have no effect on net assets or NAVs per share.
| Fund | Paid-in Capital | Distributable Earnings/ (Accumulated Loss) | ||
| China A Share Equity Fund | $ – | $ – | ||
| Dynamic Dividend Fund | (169,518 | ) | 169,518 | |
| Emerging Markets Fund | 68,347,960 | (68,347,960 | ) | |
| Emerging Markets Sustainable Leaders Fund | 4,075,094 | (4,075,094 | ) | |
| Global Equity Fund | 41,286 | (41,286 | ) | |
| Global Infrastructure Fund | (484,512 | ) | 484,512 | |
| Realty Income & Growth Fund | 471,689 | (471,689 | ) | |
| U.S. Small Cap Equity Fund | 24,076,006 | (24,076,006 | ) | |
| U.S. Sustainable Leaders Fund | 4,158,492 | (4,158,492 | ) | |
| U.S. Sustainable Leaders Smaller Companies Fund | 808,801 | (808,801 | ) |
8. Significant Shareholders
As of October 31, 2021, the Funds had shareholders with the percentage ownership indicated, which are considered significant shareholders (holdings greater than 5.0%) for financial reporting purposes:
| Record | Number of | ||
| Fund | Ownership % | Account Owners | |
| China A Share Equity Fund | 54.9% | 2 | |
| Dynamic Dividend Fund | 48.6 | 4 | |
| Emerging Markets Fund | 62.7 | 4 | |
| Emerging Markets Sustainable Leaders Fund | 39.8 | 3 | |
| Global Equity Fund | 19.4 | 1 |
| 2021 Annual Report | 141 |
Notes to Financial Statements (continued)
October 31, 2021
| Record | Number of | ||
| Fund | Ownership % | Account Owners | |
| Global Infrastructure Fund | 59.2% | 4 | |
| International Real Estate Equity Fund | 61.8 | 4 | |
| International Small Cap Fund | 57.7 | 2 | |
| Realty Income & Growth Fund | 53.4 | 3 | |
| U.S. Small Cap Equity Fund | 45.6 | 5 | |
| U.S. Sustainable Leaders Fund | 12.2 | 1 | |
| U.S. Sustainable Leaders Smaller Companies Fund | 28.8 | 4 |
9. Line of Credit
The Trust, on behalf of each of the funds of the Trust (including the Funds) (the "Borrowers"), has entered into an agreement (the "Agreement") with State Street Bank and Trust Company (the "Bank"), subject to annual renewal. The Agreement provides for a revolving credit facility (the "Credit Facility") in the amount of $150,000,000 to be utilized for temporary or emergency purposes to fund shareholder redemptions or other short-term liquidity purposes.
Principal on each outstanding loan made under the Agreement bears interest at a variable rate per annum equal to the higher of (a) the Federal Funds Rate as in effect on such day or (b) the Overnight Bank Funding Rate on such date, plus, in each case, 10 basis points, plus one and one quarter of one percent (1.25%). In addition, the Borrowers shall pay to the Bank a commitment fee at the rate of 0.25% per annum on the daily unused portion of the Credit Facility, as applicable, which is allocated among the Borrowers in such manner as is determined by the Board to be reasonable. For each Fund that borrowed under the Credit Facility during the fiscal year ended October 31, 2021, the following table shows the average outstanding daily balance of the days the Fund utilized the Credit Facility and the average weighted interest rate paid by the Fund during the fiscal year ended October 31, 2021.
| Average Outstanding Daily Balance | Average Weighted Interest Rate | Days Utilized | ||||||||||
| China A Share Equity Fund | 1,918,656 | 1.44 | % | 14 | ||||||||
| Dynamic Dividend Fund | 330,112 | 1.38 | % | 44 | ||||||||
| Emerging Markets Fund | 80,672,702 | 1.43 | % | 5 | ||||||||
| Emerging Markets Sustainable Leaders Fund | 4,982,906 | 1.40 | % | 12 | ||||||||
| Global Infrastructure Fund | 120,346 | 1.39 | % | 21 | ||||||||
| International Real Estate Equity Fund | 239,557 | 1.38 | % | 27 | ||||||||
| International Small Cap Fund | 1,425,000 | 1.40 | % | 3 | ||||||||
| Realty Income & Growth Fund | 485,241 | 1.43 | % | 136 | ||||||||
| U.S. Sustainable Leaders Smaller Companies Fund | 200,000 | 1.38 | % | 1 | ||||||||
10. Recent Rulemaking
In October 2020, the SEC adopted new regulations governing the use of derivatives by registered investment companies. Rule 18f-4 will impose limits on the amount of derivatives a fund could enter into, eliminate the asset segregation framework currently used by funds to comply with Section 18 of the 1940 Act, and require funds whose use of derivatives is more than a limited specified exposure to establish and maintain a derivatives risk management program and appoint a derivatives risk manager. While the new rule became effective February 19, 2021, funds will not be required to fully comply with the new rule until August 19, 2022. It is not currently clear what impact, if any, the new rule will have on the availability, liquidity or performance of derivatives. Management is assessing the impact of Rule 18f-4 on the Funds.
In December 2020, the Securities and Exchange Commission ("SEC") adopted Rule 2a-5 under the 1940 Act, which establishes requirements for determining fair value in good faith for purposes of the 1940 Act, including related oversight and reporting requirements. The rule also defines when market quotations are "readily available" for purposes of the 1940 Act, the threshold for determining whether a fund must fair value a security. The SEC also adopted new Rule 31a-4 under the 1940 Act, which sets forth the recordkeeping requirements associated with fair value determinations. Finally, the SEC is rescinding previously issued guidance on related issues, including the role of a board in determining fair value
| 142 | 2021 Annual Report |
Notes to Financial Statements (concluded)
October 31, 2021
and the accounting and auditing of fund investments. Rule 2a-5 and Rule 31a-4 became effective on March 8, 2021, with a compliance date of September 8, 2022. Management is currently evaluating this guidance.
11. Subsequent Events
Management has evaluated the need for disclosures and/or adjustments resulting from subsequent events through the date the financial statements were issued. Based on this evaluation, no disclosures and/or adjustments were required to the financial statements as of October 31, 2021.
On June 21, 2021, at a meeting of the Board of Trustees (the "Board") of Aberdeen Investment Funds (the "AIF Trust"), the Board considered and unanimously approved an agreement and plan of reorganization with respect to each Fund within the AIF Trust ("AIF Predecessor Fund") whereby each AIF Predecessor Fund would participate in a reorganization that would allow it to continue to operate as a corresponding new series of Aberdeen Funds, a Delaware statutory trust (the "Acquiring Funds"). Aberdeen Standard Investments Inc. would serve as the investment adviser and Aberdeen Asset Managers Limited would serve as the subadviser to the Global Equity Impact and International Sustainable Leaders Funds. Following approval by shareholders, each Predecessor Fund transferred all of its assets and liabilities to the corresponding Acquiring Fund, as listed in the table below, as of the close of business December 3, 2021. The Acquiring Funds and corresponding Predecessor Funds are shown in the chart below.
| Fund | Corresponding AIF Predecessor Fund | |
| Aberdeen Global Equity Impact Fund | Aberdeen Global Equity Impact Fund, a series of Aberdeen Investment Funds | |
| Aberdeen Global High Income Fund | Aberdeen Global High Income Fund, a series of Aberdeen Investment Funds | |
| Aberdeen International Sustainable Leaders Fund | Aberdeen International Sustainable Leaders Fund, a series of Aberdeen Investment Funds |
On December 15, 2021, the Board of Trustees of the Trust approved a change in the name, 80% policy, benchmark index and expense limitation for the Aberdeen Global Equity Fund (the "Fund"). Effective February 28, 2022: (i) the Fund will change its name from the Aberdeen Global Equity Fund to the Aberdeen Emerging Markets ex-China Fund; (ii) the Fund's 80% policy will change from a policy where the Fund will invest at least 80% of the value of its net assets, plus any borrowings for investment purposes, in equity securities issued by companies located throughout the world (including the U.S.) to a policy where the Fund will invest at least 80% of the value of its net assets, plus any borrowings for investment purposes, in equity securities of emerging market (excluding China) companies; (iii) the MSCI Emerging Markets ex-China Index (Net Dividends) will replace the MSCI All Country World Index (Net Dividends) as the Fund's primary benchmark; (iv) the Fund's expense limitation (subject to certain exclusions) will be lowered from 1.19% to 1.10%; and (v) the Fund's portfolio management team will change from the Global Equity Team to the Global Emerging Markets Team.
| 2021 Annual Report | 143 |
Report of Independent Registered Public Accounting Firm
To the Shareholders and Board of Trustees
Aberdeen Funds:
Opinion on the Financial Statements
We have audited the accompanying statements of assets and liabilities of Aberdeen China A Share Equity Fund, Aberdeen Dynamic Dividend Fund, Aberdeen Emerging Markets Fund, Aberdeen Emerging Markets Sustainable Leaders Fund (formerly, Aberdeen International Equity Fund), Aberdeen Global Equity Fund, Aberdeen Global Infrastructure Fund, Aberdeen International Real Estate Equity Fund, Aberdeen International Small Cap Fund, Aberdeen Realty Income & Growth Fund, Aberdeen U.S. Small Cap Equity Fund, Aberdeen U.S. Sustainable Leaders Fund (formerly, Aberdeen U.S. Multi-Cap Equity Fund), and Aberdeen U.S. Sustainable Leaders Smaller Companies Fund (formerly, Aberdeen Focused U.S. Equity Fund), twelve of the funds comprising Aberdeen Funds (each, a Fund and collectively, the Funds), including the statements of investments, as of October 31, 2021, the related statements of operations for the year then ended, the statements of changes in net assets for each of the years in the two-year period then ended, and the related notes (collectively, the financial statements) and the financial highlights for each of the years in the five-year period then ended except for the Aberdeen Dynamic Dividend Fund, Aberdeen Global Infrastructure Fund, Aberdeen International Real Estate Equity Fund, and Aberdeen Realty Income & Growth Fund, for which the period is the four-year period then ended. In our opinion, the financial statements and financial highlights present fairly, in all material respects, the financial position of the Funds as of October 31, 2021, the results of their operations for the year then ended, the changes in their net assets for each of the years in the two-year period then ended, and the financial highlights for each of the years or periods in the five-year period then ended except for the Aberdeen Dynamic Dividend Fund, Aberdeen Global Infrastructure Fund, Aberdeen International Real Estate Equity Fund, and Aberdeen Realty Income & Growth Fund, for which the period is the four-year period then ended, in conformity with U.S. generally accepted accounting principles. The financial highlights for the one-year period ended October 31, 2017 for Aberdeen Dynamic Dividend Fund, Aberdeen Global Infrastructure Fund, Aberdeen International Real Estate Equity Fund, and Aberdeen Realty Income & Growth Fund were audited by other independent registered public accountants whose reports, dated December 22, 2017, expressed an unqualified opinion on the financial highlights.
Basis for Opinion
These financial statements and financial highlights are the responsibility of the Funds' management. Our responsibility is to express an opinion on these financial statements and financial highlights based on our audits. We are a public accounting firm registered with the Public Company Accounting Oversight Board (United States) (PCAOB) and are required to be independent with respect to the Funds in accordance with the U.S. federal securities laws and the applicable rules and regulations of the Securities and Exchange Commission and the PCAOB.
We conducted our audits in accordance with the standards of the PCAOB. Those standards require that we plan and perform the audit to obtain reasonable assurance about whether the financial statements and financial highlights are free of material misstatement, whether due to error or fraud. Our audits included performing procedures to assess the risks of material misstatement of the financial statements and financial highlights, whether due to error or fraud, and performing procedures that respond to those risks. Such procedures included examining, on a test basis, evidence regarding the amounts and disclosures in the financial statements and financial highlights. Such procedures also included confirmation of securities owned as of October 31, 2021, by correspondence with the custodian, brokers, or by other appropriate auditing procedures when replies from brokers were not received. Our audits also included evaluating the accounting principles used and significant estimates made by management, as well as evaluating the overall presentation of the financial statements and financial highlights. We believe that our audits provide a reasonable basis for our opinion.

We have served as the auditor of one or more Aberdeen investment companies since 2009.
Philadelphia, Pennsylvania
December 28, 2021
| 144 | 2021 Annual Report |
Other Tax Information (Unaudited)
For the year ended October 31, 2021, certain dividends paid by the Funds may be subject to a maximum tax rate of 15% or 20% (depending upon income levels) as qualified dividend income. The Funds intend to designate the maximum amount allowable as taxed at a maximum rate of 15%. Complete information will be reported in conjunction with your 2021 Form 1099-DIV.
| Fund | Qualified Dividend Income | ||||
| China A Share Equity Fund | 100.00 | % | |||
| Dynamic Dividend Fund | 83.94 | % | |||
| Emerging Markets Fund | 83.64 | % | |||
| Emerging Markets Sustainable Leaders Fund | 46.50 | % | |||
| Global Infrastructure Fund | 79.31 | % | |||
| International Real Estate Equity Fund | 26.31 | % | |||
| International Small Cap Fund | 37.71 | % | |||
| U.S. Small Cap Equity Fund | 35.42 | % | |||
| U.S. Sustainable Leaders Fund | 27.34 | % | |||
| U.S. Sustainable Leaders Smaller Companies Fund | 19.48 | % | |||
For the taxable year ended October 31, 2021, the following percentage of income dividends paid by the Funds qualify for the dividends received deduction available to corporate shareholders:
| Fund | Dividends Received Deduction | ||||
| China A Share Equity Fund | 0.40 | % | |||
| Dynamic Dividend Fund | 33.55 | % | |||
| Global Infrastructure Fund | 32.49 | % | |||
| International Real Estate Equity Fund | 0.06 | % | |||
| U.S Small Cap Equity Fund | 31.30 | % | |||
| U.S. Sustainable Leaders Fund | 22.88 | % | |||
| U.S. Sustainable Leaders Smaller Companies Fund | 18.41 | % | |||
The Funds intend to elect to pass through to their shareholders the credit for taxes paid in foreign countries during its fiscal year ended October 31, 2021. In accordance with the current tax laws, the foreign income and foreign tax per share (for a share outstanding as of October 31, 2021) were as follows:
| Fund | Foreign Tax | ||
| China A Share Equity Fund | $0.0447 | ||
| Emerging Markets Fund | $0.0746 | ||
| Emerging Markets Sustainable leaders Fund | $0.0489 | ||
| Global Infrastructure Fund | $0.0384 | ||
| International Real Estate Equity Fund | $0.0194 | ||
| International Small Cap Fund | $0.0315 |
| 2021 Annual Report | 145 |
Other Tax Information (Unaudited) (concluded)
During the year ended October 31, 2021, the following Funds designated dividends as long-term capital gains:
| Fund | Amount | |||
| China A Share Equity Fund | $ | 463,245 | ||
| Emerging Markets Fund | $ | 88,815,176 | ||
| Emerging Markets Sustainable Leaders Fund | $ | 3,133,014 | ||
| Global Equity Fund | $ | 153,792 | ||
| Global Infrastructure Fund | $ | 39,441 | ||
| Realty Income & Growth Fund | $ | 6,065,183 | ||
| U.S. Small Cap Equity Fund | $ | 55,839,945 | ||
| U.S. Sustainable Leaders Fund | $ | 38,980,628 | ||
| U.S. Sustainable Leaders Smaller Companies Fund | $ | 2,025,446 | ||
| 146 | 2021 Annual Report |
Shareholder Expense Examples (Unaudited)
As a shareholder of the Aberdeen Funds, you incur two types of costs: (1) transaction costs, including sales charges (loads) paid on purchase payments and (2) ongoing costs, including investment advisory fees, administration fees, transfer agent out-of-pocket expenses, distribution fees and other Fund expenses. The examples below are intended to help you understand your ongoing costs (in dollars) of investing in the Aberdeen Funds and to compare these costs with the ongoing costs of investing in other mutual funds.
The examples assume that you had a $1,000 investment in the Class at the beginning of the reporting period, May 1, 2021 and continued to hold your shares at the end of the reporting period, October 31, 2021.
Actual Expenses
The table below provides information about actual account values and actual expenses. You may use the information together with the amount you invested, to estimate the expenses that you paid over the period. Simply divide your account value by $1,000 (for example, an $8,600 account value divided by $1,000 = 8.6), then multiply the result by the number under the heading entitled "Actual Expenses Paid During Period" for the class of a Fund that you own to estimate the expenses you paid on your account during the period.
Hypothetical Example for Comparison Purposes
The table below provides information about hypothetical account values and hypothetical expenses based on the Class' actual expense ratio and an assumed rate of return of 5% per year before expenses, which is not the Class' actual return. The hypothetical account values and expenses may not be used to estimate the actual ending account balance or expenses you paid for the period. You may use this information to compare the ongoing costs of investing in the Class of a Fund and other funds. To do so, compare the 5% hypothetical example with the 5% hypothetical examples that appear in the shareholder reports of the other funds.
Please note that the expenses shown in the table are meant to highlight your ongoing costs only and do not reflect any transaction costs, such as sales charges (loads). Therefore, the information for each Class in the table is useful in comparing ongoing costs only, and will not help you determine the relative total costs of owning different funds. In addition, if these transaction costs were included, your costs would have been higher. The examples also assume all dividends and distributions have been reinvested.
| Beginning Account Value, May 1, 2021 | Actual Ending Account Value, October 31, 2021 | Hypothetical Ending Account Value | Actual Expenses Paid During Period1 | Hypothetical Expenses Paid During Period12 | Annualized Expense Ratio** | |||||||
| China A Share Equity Fund | Class A | $1,000.00 | $ 964.00 | $1,018.45 | $ 6.63 | $ 6.82 | 1.34% | |||||
| Class C | $1,000.00 | $ 960.60 | $1,015.17 | $ 9.83 | $10.11 | 1.99% | ||||||
| Class R | $1,000.00 | $ 962.30 | $1,016.64 | $ 8.41 | $ 8.64 | 1.70% | ||||||
| Institutional Service Class | $1,000.00 | $ 965.00 | $1,019.71 | $ 5.40 | $ 5.55 | 1.09% | ||||||
| Institutional Class | $1,000.00 | $ 965.40 | $1,020.22 | $ 4.90 | $ 5.04 | 0.99% | ||||||
| Dynamic Dividend Fund | Class A | $1,000.00 | $1,033.10 | $1,017.64 | $ 7.69 | $ 7.63 | 1.50% | |||||
| Institutional Class | $1,000.00 | $1,032.20 | $1,018.90 | $ 6.40 | $ 6.36 | 1.25% | ||||||
| Emerging Markets Fund | Class A | $1,000.00 | $ 972.50 | $1,017.34 | $ 7.76 | $ 7.93 | 1.56% | |||||
| Class C | $1,000.00 | $ 969.30 | $1,014.62 | $10.42 | $10.66 | 2.10% | ||||||
| Class R | $1,000.00 | $ 971.70 | $1,016.38 | $ 8.70 | $ 8.89 | 1.75% | ||||||
| Institutional Service Class | $1,000.00 | $ 974.00 | $1,019.11 | $ 6.02 | $ 6.16 | 1.21% | ||||||
| Institutional Class | $1,000.00 | $ 974.60 | $1,019.66 | $ 5.47 | $ 5.60 | 1.10% | ||||||
| Emerging Markets Sustainable Leaders Fund | Class A | $1,000.00 | $ 976.20 | $1,017.95 | $ 7.17 | $ 7.32 | 1.44% | |||||
| Class C | $1,000.00 | $ 972.90 | $1,014.57 | $10.49 | $10.71 | 2.11% | ||||||
| Class R | $1,000.00 | $ 974.40 | $1,016.43 | $ 8.66 | $ 8.84 | 1.74% | ||||||
| Institutional Service Class | $1,000.00 | $ 977.70 | $1,019.41 | $ 5.73 | $ 5.85 | 1.15% | ||||||
| Institutional Class | $1,000.00 | $ 977.80 | $1,019.66 | $ 5.48 | $ 5.60 | 1.10% | ||||||
| Global Equity Fund | Class A | $1,000.00 | $1,082.20 | $1,017.49 | $ 8.03 | $ 7.78 | 1.53% | |||||
| Class C | $1,000.00 | $1,079.20 | $1,014.17 | $11.48 | $11.12 | 2.19% | ||||||
| Class R | $1,000.00 | $1,080.50 | $1,015.63 | $ 9.96 | $ 9.65 | 1.90% | ||||||
| Institutional Service Class | $1,000.00 | $1,083.80 | $1,018.70 | $ 6.78 | $ 6.56 | 1.29% | ||||||
| Institutional Class | $1,000.00 | $1,084.30 | $1,019.21 | $ 6.25 | $ 6.06 | 1.19% | ||||||
| Global Infrastructure Fund | Class A | $1,000.00 | $1,036.40 | $1,018.96 | $ 6.36 | $ 6.31 | 1.24% | |||||
| Institutional Class | $1,000.00 | $1,037.40 | $1,020.22 | $ 5.08 | $ 5.04 | 0.99% | ||||||
| International Real Estate Equity Fund | Class A | $1,000.00 | $ 992.80 | $1,017.04 | $ 8.14 | $ 8.24 | 1.62% | |||||
| Institutional Class | $1,000.00 | $ 993.70 | $1,018.30 | $ 6.88 | $ 6.97 | 1.37% |
| 2021 Annual Report | 147 |
Shareholder Expense Examples (Unaudited) (concluded)
| Beginning Account Value, May 1, 2021 | Actual Ending Account Value, October 31, 2021 | Hypothetical Ending Account Value | Actual Expenses Paid During Period1 | Hypothetical Expenses Paid During Period12 | Annualized Expense Ratio** | |||||||
| International Small Cap Fund | Class A | $1,000.00 | $1,134.90 | $1,018.45 | $ 7.21 | $ 6.82 | 1.34% | |||||
| Class C | $1,000.00 | $1,131.10 | $1,015.17 | $10.69 | $10.11 | 1.99% | ||||||
| Class R | $1,000.00 | $1,133.30 | $1,017.09 | $ 8.66 | $ 8.19 | 1.61% | ||||||
| Institutional Class | $1,000.00 | $1,137.00 | $1,020.22 | $ 5.33 | $ 5.04 | 0.99% | ||||||
| Realty Income & Growth Fund | Class A | $1,000.00 | $1,120.90 | $1,018.90 | $ 6.68 | $ 6.36 | 1.25% | |||||
| Institutional Class | $1,000.00 | $1,122.60 | $1,020.16 | $ 5.35 | $ 5.09 | 1.00% | ||||||
| U.S. Small Cap Equity Fund | Class A | $1,000.00 | $1,123.80 | $1,018.45 | $ 7.17 | $ 6.82 | 1.34% | |||||
| Class C | $1,000.00 | $1,119.90 | $1,015.17 | $10.63 | $10.11 | 1.99% | ||||||
| Class R | $1,000.00 | $1,121.90 | $1,016.84 | $ 8.88 | $ 8.44 | 1.66% | ||||||
| Institutional Service Class | $1,000.00 | $1,125.00 | $1,019.61 | $ 5.95 | $ 5.65 | 1.11% | ||||||
| Institutional Class | $1,000.00 | $1,125.70 | $1,020.22 | $ 5.30 | $ 5.04 | 0.99% | ||||||
| U.S. Sustainable Leaders Fund | Class A | $1,000.00 | $1,132.00 | $1,019.21 | $ 6.39 | $ 6.06 | 1.19% | |||||
| Class C | $1,000.00 | $1,126.80 | $1,015.53 | $10.29 | $ 9.75 | 1.92% | ||||||
| Institutional Service Class | $1,000.00 | $1,133.00 | $1,020.37 | $ 5.16 | $ 4.89 | 0.96% | ||||||
| Institutional Class | $1,000.00 | $1,134.10 | $1,020.67 | $ 4.84 | $ 4.58 | 0.90% | ||||||
| U.S. Sustainable Leaders Smaller Companies Fund | Class A | $1,000.00 | $1,149.20 | $1,019.11 | $ 6.55 | $ 6.16 | 1.21% | |||||
| Class C | $1,000.00 | $1,143.90 | $1,015.63 | $10.27 | $ 9.65 | 1.90% | ||||||
| Class R | $1,000.00 | $1,146.60 | $1,017.34 | $ 8.44 | $ 7.93 | 1.56% | ||||||
| Institutional Service Class | $1,000.00 | $1,149.60 | $1,019.86 | $ 5.74 | $ 5.40 | 1.06% | ||||||
| Institutional Class | $1,000.00 | $1,150.80 | $1,020.67 | $ 4.88 | $ 4.58 | 0.90% |
| ** | The expense ratio presented represents a six-month, annualized ratio. |
| 1 | Expenses are equal to the Fund's annualized expense ratio multiplied by the average account value over the period multiplied by 184/365 (to reflect the one-half year period). |
| 2 | Represents the hypothetical 5% return before expenses. |
| 148 | 2021 Annual Report |
Supplemental Information (Unaudited)
Board of Trustees' Consideration of Advisory and Sub-Advisory Agreements
At a regularly scheduled quarterly meeting (the "Quarterly Meeting") of the Board of Trustees (the "Board or the "Trustees") of the Aberdeen Funds (the "Trust") held on June 16, 2021, the Board, including a majority of the Trustees who are not considered to be "interested persons" of the Trust (the "Independent Trustees") under the Investment Company Act of 1940, as amended (the "1940 Act"), approved for an annual period the continuation of the Trust's advisory agreement (the "Advisory Agreement") with Aberdeen Standard Investments Inc. (formerly, Aberdeen Asset Management Inc.) ("ASII") and the applicable sub-advisory agreements (each a "Sub-Advisory Agreement," and collectively with the Advisory Agreement, the "Agreements") between: (i) ASII and Aberdeen Standard Investments (Asia) Limited (formerly, Aberdeen Asset Management Asia Limited) ("ASIAL") and (ii) ASII and Aberdeen Asset Managers Limited ("AAML") (each a "Sub-Adviser," and collectively, the "Sub-Advisers") for each of the following series of the Trust: Aberdeen China A Share Equity Fund, Aberdeen Dynamic Dividend Fund, Aberdeen Emerging Markets Fund, Aberdeen U.S. Sustainable Leaders Smaller Companies Fund (formerly, Aberdeen Focused U.S. Equity Fund), Aberdeen Global Equity Fund, Aberdeen Global Infrastructure Fund, Aberdeen Emerging Markets Sustainable Leaders Fund (formerly, Aberdeen International Equity Fund), Aberdeen International Small Cap Fund, Aberdeen International Real Estate Equity Fund, Aberdeen Realty Income & Growth Fund, Aberdeen U.S. Sustainable Leaders Fund (formerly, Aberdeen U.S. Multi-Cap Equity Fund), and Aberdeen U.S. Small Cap Equity Fund (each a "Fund," and collectively the "Funds"). Pursuant to relief granted by the U.S. Securities and Exchange Commission (the "SEC") in light of the COVID-19 pandemic (the "Order") and a determination by the Board that reliance on the Order was appropriate due to circumstances related to the current or potential effects of COVID-19, the Quarterly Meeting was held via videoconference. In addition, the Independent Trustees held a separate telephonic meeting on June 9, 2021 (together with the Quarterly Meeting held on June 16, 2021, the "Meetings") to review the materials provided and the relevant legal considerations. ASIAL and AAML are affiliates of ASII. ASII and the Sub-Advisers are sometimes referred to collectively as the "Advisers."
In connection with their consideration of whether to approve the continuation of the Agreements, the Board members received and reviewed a variety of information provided by the Advisers relating to the Funds, the Agreements and the Advisers, including comparative performance, fee and expense information and other information regarding the nature, extent and quality of services provided by the Advisers under their respective Agreements. The materials provided to the Board generally included, among other items: (i) information on the Funds' advisory fees and other expenses, including information comparing each Fund's expenses to those of a peer group of funds and information about any applicable expense limitations and fee "breakpoints"; (ii) a report prepared by the Advisers in response to a request submitted by the Independent Trustees' independent legal counsel on behalf of such Trustees; (iii) information on the investment performance of the Funds and the performance of peer groups of funds and the Funds' performance benchmarks; (iv) information about the profitability of the Agreements to the Advisers; and (v) a memorandum from the Independent Trustees' independent legal counsel on the responsibilities of the Board in considering for approval the investment advisory and investment sub-advisory arrangements under the 1940 Act and Delaware law.
The Board, including the Independent Trustees, also considered other matters such as: (i) each Fund's investment objective and strategies; (ii) the procedures employed to determine the value of the Funds' assets; (iii) the Advisers' investment personnel and operations; (iv) the Advisers' financial results and financial condition; (v) arrangements relating to the distribution of the Funds' shares and the related costs; (v) the resources devoted to, and the record of compliance with, the Funds' investment policies and restrictions, policies on personal securities transactions and other compliance policies; (vii) the allocation of the Funds' brokerage, if any, including, if applicable, allocations to brokers affiliated with the Advisers and the use, if any, of "soft" commission dollars to pay Fund expenses and to pay for research and other similar services; and (viii) possible conflicts of interest. The Board also considered the nature, extent and quality of the services provided to the Funds by ASII's affiliates. Throughout the process, the Trustees were afforded the opportunity to ask questions of and request additional information from ASII and the Sub-Advisers.
In addition to the materials requested by the Trustees in connection with their annual consideration of the continuation of the Agreements, the Trustees received and reviewed materials in advance of each regular quarterly meeting of the Board that contained information relating to the services provided by the Advisers, including detailed information about each Fund's investment performance. This information generally included, among other things, third-party performance rankings for various periods (including, as applicable, periods prior to the Advisers' management of the Funds) comparing each Fund against its respective peer group, total return information for the Funds for various periods, and details of sales and redemptions of Fund shares for the period. The Board also received periodic presentations from the portfolio management teams in connection with the performance of the Funds.
The Independent Trustees were advised by separate independent legal counsel throughout the process. The Independent Trustees also consulted in executive sessions with their independent legal counsel regarding consideration of the continuation of the Agreements. In considering whether to approve the continuation of the Agreements, the Board of Trustees, including the Independent Trustees, did not identify any single factor as determinative. Individual Trustees may have evaluated the information presented differently from one another, giving different weights to various factors. Matters considered by the Trustees, including the Independent Trustees, in connection with their approval of the continuation of the Agreements included the factors listed below.
The nature, extent and quality of the services provided to the Funds under the Agreements. The Trustees considered the nature, extent and quality of the services provided by ASII and the Sub-Advisers, as applicable, to the Funds and the resources dedicated to the Funds by ASII and its affiliates. The Board considered the Advisers' risk management processes. The Board also considered the background and experience of the Advisers' senior
| 2021 Annual Report | 149 |
Supplemental Information (Unaudited) (continued)
management personnel and the qualifications, background and responsibilities of the portfolio managers that are primarily responsible for the day-to-day portfolio management services for the Funds. ASII's role in coordinating the activities of the Trust's other service providers was also considered. The Board also considered the allocation of responsibilities among the Advisers. The Trustees considered not only the advisory services provided by ASII to the Funds, but also the administrative services provided by ASII to the Funds under a separate administration agreement. The Trustees also took into account the Advisers' investment experience. The Board also considered that it receives information on a regular basis from the Trust's Chief Compliance Officer regarding the Advisers' compliance policies and procedures. The Board was also mindful of the Advisers' focus on the monitoring of the performance of the Funds and in addressing performance matters. The Trustees also considered the benefits to shareholders of investing in a mutual fund that is part of a family of funds that offers shareholders the right to exchange shares of one type of fund for shares of another type of fund, and provides a variety of fund and shareholder services. The Board also took into account its knowledge of management and the quality of the performance of management's duties through Board meetings, discussion and reports during the preceding year.
After reviewing these and related factors, the Board concluded that the nature, extent and quality of the services provided supported the continuation of the Agreements.
Investment performance of the Funds and the Advisers. The Trustees received and reviewed with management, among other performance data, information about the performance of the Funds over various time periods, including information that compared the performance of the Funds to the performance of peer groups of funds and each Fund's performance benchmark. The Trustees also considered the performance of the Funds compared to the performance of comparable funds or accounts managed by ASII and its affiliates to the extent available. The Trustees reviewed and considered the Funds that had changed their investment strategies during the year and that certain of the Funds had changed their respective performance benchmarks to better reflect the respective Fund's investment strategy. In addition, the Trustees also reviewed data prepared by an independent third party that analyzed the performance of the Funds using a variety of performance metrics.
The Trustees also considered ASII's and the Sub-Advisers' performance and reputation generally, the performance of the fund family generally, the historical responsiveness of ASII to Trustee concerns about performance, and the willingness of ASII and the Sub-Advisers to take steps intended to improve performance. The Trustees also considered, as applicable, the performance of the Advisers since they commenced management of the Funds.
Based on these factors, the Board determined that the Advisers are appropriate investment advisers for the Funds.
The Board noted that it would continue to monitor the Funds' performance and any actions taken by ASII and its affiliates relating to performance.
The costs of the services provided and profits realized by the Advisers and their affiliates from their relationships with the Funds. The Trustees considered the fees charged to the Funds for advisory services as well as the total expense levels of the Funds. This information included comparisons (provided by an independent third party) of each Fund's net management fee and total expense level to those of its expense peer group and information about the advisory fees charged by ASII to any separately managed accounts with a similar strategy. In reviewing the comparison of each Fund's net management fee to that of comparable funds, the Board noted that the fee for the Funds includes both advisory and administrative fees. In evaluating the Funds' advisory fees, the Trustees considered the demands, complexity and quality of the investment management of the Funds. In considering the fees charged by ASII to any comparable accounts, the Trustees also considered, among other things, management's discussion of the different investment restrictions, objectives or policies that may be involved in managing accounts of different types.
The Trustees also noted that the sub-advisory fees, as applicable, for the Funds would not be paid by the Funds, but would be paid by ASII out of its advisory fee. The Board also considered that ASII had entered into or renewed expense limitation agreements with each of the Funds, pursuant to which ASII agreed to waive a portion of its advisory fee and/or reimburse certain expenses as a means of limiting each Fund's total annual operating expenses for a period of time. The Trustees also noted that ASII had agreed to reduce the advisory fees payable by certain Funds during the year.
The Trustees also considered the compensation ASII and its affiliates received, directly and indirectly, from their relationships with the Funds. The Trustees reviewed information provided by management as to the profitability of ASII and its affiliates' relationships with the Funds, including the engagement of affiliates of ASII to provide administrative and distribution services to the Funds. The Trustees also considered information about the allocation of expenses used to calculate profitability. When reviewing profitability, the Trustees also considered information about the expense levels of the Funds, the performance of the Funds, court cases regarding adviser profitability, and whether ASII had implemented breakpoints and expense limitations with respect to the Funds. The Trustees also examined the profitability of ASII and its affiliates on a Fund-by-Fund basis.
After reviewing these and related factors, including taking into account management's discussion regarding Fund expenses, the Board concluded that the advisory fees, and as applicable, the sub-advisory fees, were fair and reasonable, and that the costs of these services generally and the related profitability of ASII and its affiliates from their relationships with the Funds were reasonable and supported the continuation of the Agreements.
Economies of Scale. The Trustees considered the existence of any economies of scale in the provision of services by ASII and the Sub-Advisers and whether those economies would be shared with the Funds through breakpoints in the investment advisory fees or other means, such as expense
| 150 | 2021 Annual Report | 151 |
Supplemental Information (Unaudited) (concluded)
waivers or limitations. The Trustees noted that each of the Funds was subject to a contractual expense limitation agreement and considered that certain Funds were subject to breakpoints in their investment advisory fees. The Board noted management's discussion of the Funds' advisory fee structure. The Board also considered how the Funds' potential future growth and increased size would have an effect on fees, noting that if a Fund's assets increase over time, the Fund may realize other economies of scale if assets increase at a proportionally higher rate than the increase in certain expenses. The Trustees also took note of the costs of the services provided and the profitability to ASII and its affiliates from their relationships with the Funds, as discussed above.
After reviewing these and related factors, the Board concluded that the advisory fees, and as applicable, sub-advisory fees were reasonable and supported the continuation of the Agreements.
The Trustees also considered other factors, which included but were not limited to the following:
| • | whether the Funds have operated in accordance with their investment objectives as well as the Funds' record of compliance with their investment restrictions, and the compliance programs of the Trust and ASII. The Trustees also considered the compliance-related resources ASII and its affiliates were providing to the Funds. |
| • | so-called "fallout benefits" to ASII, such as the benefits of research made available to ASII by reason of brokerage commissions generated by the Funds' securities transactions or reputational and other indirect benefits. The Trustees considered any possible conflicts of interest associated with these fallout and other benefits, and the reporting, disclosure and other processes in place to disclose and monitor such possible conflicts of interest. |
| • | the nature, quality, cost and extent of administrative services performed by ASII under the Advisory Agreement and under a separate agreement covering administrative services. |
| • | the effect of any market and economic volatility on the performance, asset levels and expense ratios of the Funds. |
* * *
Based on their evaluation of all factors that they deemed to be material, including those factors described above, and assisted by the advice of independent counsel, the Trustees, including the Independent Trustees, concluded that renewal of the Agreements would be in the best interest of each of the Funds and its shareholders. Accordingly, the Board, and the Independent Trustees voting separately, approved the Agreements for an additional one-year period. Pursuant to the SEC Order, the Board determined that the Trustees, including the Independent Trustees, voting separately, would ratify their approval at the next in-person Board meeting.
| 2021 Annual Report | 151 |
Liquidity Risk Management Program (Unaudited)
The Funds have adopted and implemented a liquidity risk management program (the "Liquidity Program") consistent with the requirements of Rule 22e-4 under the 1940 Act (the "Liquidity Rule"). "Liquidity Risk" is defined as the risk that a fund could not meet redemption requests "without significant dilution of remaining investors' interests in the fund." Aberdeen Standard Investments Inc., the investment adviser and administrator to the Funds, has been approved and designated by the Board of Trustees (the "Board") as the administrator of the Liquidity Program (the "Administrator") and has retained a third party to perform certain functions, including liquidity analytics and providing market data. The Administrator has formed a Liquidity Risk Management Committee (the "Committee") to help implement and carry out the day-to-day operations of the Liquidity Program.
As required by the Liquidity Rule, at a meeting on March 17, 2021, the Board received a written annual report on the operation and effectiveness of the Liquidity Program for the period from February 1, 2020 to January 31, 2021 (the "Reporting Period"). The annual report provided, among other items, an overview of the Liquidity Program including:
| • | information regarding the Committee and the monthly discussions by the Committee of various items including, but not limited to, the following: |
| º | Review and analysis of appropriate liquidity categories for portfolio investments |
| º | Review of highly liquid investment minimum ("HLIM") and reasonably anticipated trading sizes ("RATS") |
| º | Review of current and upcoming market events, such as market closures, that may impact liquidity |
| º | Review of large shareholder concentrations that may impact liquidity in the event of redemption monthly liquidity reports being provided to portfolio managers |
| • | the monitoring and classification of portfolio holdings in four liquidity categories (including the operation of the HLIM and any breaches); and |
| • | enhancements to the Liquidity Program during the Reporting Period, which included: |
| º | evaluation and change in the HLIM of Aberdeen Emerging Market Debt fund and the Global High Income Fund due to the nature of the portfolios strategy |
The annual report concluded that the Liquidity Program was reasonably designed to assess and manage the Funds' Liquidity Risk pursuant to the Liquidity Rule.
There can be no assurance that the Liquidity Program will achieve its objectives under all circumstances in the future. Please refer to your Fund's Prospectus and Statement of Additional Information for more information regarding the risks of investing in a Fund, including a Fund's exposure to liquidity risk and other risks to which the Funds may be subject.
| 152 | 2021 Annual Report |
Management of the Funds (Unaudited)
As of October 31, 2021
The names, years of birth and business addresses of the trustees and officers of the Funds as of October 31, 2021, their principal occupations during the past five years, the number of portfolios each Trustee oversees and other directorships they hold are provided in the tables below. Trustees that are deemed "interested persons" (as that term is defined in Section 2(a)(19) of the Investment Company Act of 1940, as amended) of the Funds or the Funds' investment advisers are included in the table below under the heading "Interested Trustees." Trustees who are not interested persons, as described above, are referred to in the table below under the heading "Independent Trustees." Aberdeen Standard Investments, Inc. ("ASII"), its parent company abrdn plc, and its advisory affiliates are collectively referred to as "abrdn" in the tables below.
| Name, Address, and Year of Birth | Position(s) Held, Length of Time Served and Term of Office* | Principal Occupation During Past 5 Years | Number of Portfolios in Fund Complex Overseen by Trustee** | Other Directorships Held by Trustee During Past 5 Years*** | ||||
| Independent Trustees | ||||||||
| Radhika Ajmera**** Year of Birth: 1964 | Trustee since 2020 | Ms. Ajmera was appointed Chair of Aberdeen Japan Equity Fund Inc in 2017, having served as a director since 2014. She has been an independent non-executive director of Aberdeen Asia-Pacific Income Investment Co Ltd since 2015. She is also an independent non-executive director of Aberdeen Funds since 2020 and Aberdeen Global Income Fund Inc, Aberdeen Asia-Pacific Income Fund Inc and Aberdeen Australia Equity Fund Inc since 2021. She has over 20 years' experience in fund management, predominantly in emerging markets. She has also held a number of UK closed end fund non-executive directorships. Ms Ajmera is a graduate of the London School of Economics. | 21 | None. | ||||
| P. Gerald Malone**** Year of Birth: 1950 | Trustee since 2007 Chairman of the Board | Mr. Malone is, by profession, a lawyer of over 40 years. Currently, he is a non-executive director of a number of U.S. companies, including Medality Medical (medical technology company) and Bionik Laboratories Corp. (US healthcare company) since 2018. He is also Chairman of many of the open and closed end funds in the Fund Complex. He previously served as Independent Chairman of UK companies Crescent OTC Ltd (pharmaceutical services) until February 2018; and fluidOil Ltd. (oil services) until June 2018; U.S. company Rejuvenan llc (wellbeing services) until September 2017 and as chairman of UK company Ultrasis plc (healthcare software services company) until October 2014. Mr. Malone was previously a Member of Parliament in the U.K. from 1983 to 1997 and served as Minister of State for Health in the U.K. government from 1994 to 1997 | 26 | Director of Bionik Laboratories Corporation (U.S. healthcare company) since 2018. | ||||
| Neville J. Miles**** Year of Birth: 1946 | Trustee since 2011 | Mr. Miles is a non-executive director of a number of Australian and overseas companies and serves as Chairman of Ballyshaw Pty. Ltd. (share trading, real estate development and investment). | 20 | None. | ||||
| Rahn K. Porter**** Year of Birth: 1954 | Trustee since 2016 | Mr. Porter is the Principal at RPSS Enterprises (consulting) since 2019. He was the Chief Financial and Administrative Officer of The Colorado Health Foundation from 2013 to 2019. | 19 | Director of CenturyLink Investment Management Company since 2006, Director of BlackRidge Financial Inc. from 2004 to 2019. | ||||
| 2021 Annual Report | 153 |
Management of the Funds (Unaudited) (continued)
As of October 31, 2021
| Name, Address, and Year of Birth | Position(s) Held, Length of Time Served and Term of Office* | Principal Occupation During Past 5 Years | Number of Portfolios in Fund Complex Overseen by Trustee** | Other Directorships Held by Trustee During Past 5 Years*** | ||||
| Steven N. Rappaport**** Year of Birth: 1948 | Trustee since 2016 | Mr. Rappaport has been a Partner of Lehigh Court, LLC (private investment firm) and RZ Capital LLC (private investment firm) since 2004. | 18 | Director of iCAD, Inc. (a surgical and Medical instruments and apparatus company) from 2006 to 2018; Director of Credit Suisse Funds (9) since 1999; Director of Credit Suisse Asset Management Income Fund, Inc. since 2005; and Director of Credit Suisse NEXT Fund since 2013; and Director of Credit Suisse Park View Fund until 2016. | ||||
| Warren C. Smith**** Year of Birth: 1955 | Trustee since 2007 | Mr. Smith has been a founding partner of MRB Partners Inc. (independent investment research and consultancy firm) since 2010. He has been a Director of Aberdeen Asia-Pacific Income Investment Company Limited (Canadian investment fund) since 1993 | 17 | None. | ||||
| Interested Trustees | ||||||||
| Stephen Bird Year of Birth: 1967 | Trustee since 2021 | Mr. Bird joined the Board of SLA plc in July 2020 as Chief Executive-Designate, and was formally appointed Chief Executive Officer in September 2020. Previously, Mr. Bird served as chief executive officer of global consumer banking at Citigroup from 2015, retiring from the role in November 2019. His responsibilities encompassed all consumer and commercial banking businesses in 19 countries, including retail banking and wealth management, credit cards, mortgages, and operations and technology supporting these businesses. Prior to this, Mr. Bird was chief executive for all of Citigroup's Asia Pacific business lines across 17 markets in the region, including India and China. Mr. Bird joined Citigroup in 1998, and during his 21 years with the company he held a number of leadership roles in banking, operations and technology across its Asian and Latin American businesses. Before this, he held management positions in the UK at GE Capital – where he was director of UK operations from 1996 to 1998 – and at British Steel | 26 | 10 | ||||
| * | Each Trustee holds office for an indefinite term until his successor is elected and qualified. | |
| ** | As of October 31, 2021, the Fund Complex consists of: Aberdeen Income Credit Strategies Fund, Aberdeen Asia-Pacific Income Fund, Inc., Aberdeen Global Income Fund, Inc., Aberdeen Australia Equity Fund, Inc., Aberdeen Emerging Markets Equity Income Fund, Inc., Aberdeen Japan Equity Fund, Inc., The India Fund, Inc., Aberdeen Global Dynamic Dividend Fund, Aberdeen Total Dynamic Dividend Fund, Aberdeen Global Premier Properties Fund, Aberdeen Standard Global Infrastructure Income Fund, Aberdeen Investment Funds (which consists of 3 portfolios), Aberdeen Funds (which consists of 17 portfolios) and abdrn ETFs (which consists of 3 portfolios).. | |
| *** | Directorships (excluding Fund Complex) held in (1) any other investment companies registered under the 1940 Act, (2) any company with a class of securities registered pursuant to Section 12 of the Securities Exchange Act of 1934, as amended (the "Exchange Act") or (3) any company subject to the requirements of Section 15(d) of the Exchange Act.. | |
| **** | Each Trustee may be contacted by writing to the Trustee c/o Aberdeen Standard Investments Inc., 1900 Market Street, Suite 200, Philadelphia, Pennsylvania 19103, Attn: Alan Goodson. | |
| † | Mr. Bird is considered to be an "interested person" of the Trust as defined in the 1940 Act because of his affiliation with the Adviser. |
| 154 | 2021 Annual Report |
Management of the Funds (Unaudited) (continued)
As of October 31, 2021
Officers of the Trust
| Name, Address, and Year of Birth | Position(s) Held, Length of Time Served and Term of Office* | Principal Occupation During Past 5 Years | ||
| Bev Hendry** Aberdeen Standard Investments Inc. 1900 Market Street Suite 200 Philadelphia, PA 19103 Year of Birth: 1953 | President and Chief Executive Officer (Since September 2014) | Currently Chairman (2018-present), Mr. Hendry was Chief Executive Officer – Americas for Aberdeen Asset Management PLC (2014-2018). | ||
| Joseph Andolina** Aberdeen Standard Investments Inc. 1900 Market Street Suite 200 Philadelphia, PA 19103 Year of Birth: 1978 | Vice President and Chief Compliance Officer (Since March 2017) | Currently, Chief Risk Officer – Americas and serves as the Chief Compliance Officer for ASII. Prior to joining the Risk and Compliance Department, he was a member of ASII's Legal Department, where he served as U.S. Counsel since 2012. | ||
| Andrea Melia** Aberdeen Standard Investments Inc. 1900 Market Street Suite 200 Philadelphia, PA 19103 Year of Birth: 1969 | Treasurer, Chief Financial Officer, and Principal Accounting Officer (Since September 2009) | Currently, Vice President and Director, Product Management for ASII. Ms. Melia joined ASII in September 2009. | ||
| Megan Kennedy** Aberdeen Standard Investments Inc. 1900 Market Street Suite 200 Philadelphia, PA 19103 Year of Birth: 1974 | Secretary and Vice President (Since September 2009) | Currently, Director, Product Governance for ASII. Ms. Kennedy joined ASII in 2005. | ||
| Lucia Sitar** Aberdeen Standard Investments Inc. 1900 Market Street Suite 200 Philadelphia, PA 19103 Year of Birth: 1971 | Vice President (Since December 2008) | Currently, Vice President and Head of Product Management and Governance for ASII since 2020. Previously, Ms. Sitar was Managing U.S. Counsel for ASII. She joined ASII as U.S. Counsel in July 2007. | ||
| Alan Goodson** Aberdeen Standard Investments Inc. 1900 Market Street Suite 200 Philadelphia, PA 19103 Year of Birth: 1974 | Vice President (Since March 2009) | Currently, Director, Vice President and Head of Product & Client Solutions – Americas for ASII, overseeing Product Management & Governance , Product Development and Client Solutions for registered and unregistered investment companies in the U.S., Brazil and Canada. Mr. Goodson is Director and Vice President of ASII and joined ASI in 2000. | ||
| Hugh Young** abrdn Asia Limited 21 Church Street #01-01 Capital Square Two Singapore 049480 Year of Birth: 1958 | Vice President (Since June 2011) | Currently, Chairman of abrdn Asia Limited (since 1991). Mr. Young joined abrdn in 1991. |
| 2021 Annual Report | 155 |
Management of the Funds (Unaudited) (continued)
As of October 31, 2021
| Name, Address, and Year of Birth | Position(s) Held, Length of Time Served and Term of Office* | Principal Occupation During Past 5 Years | ||
| Devan Kaloo** Aberdeen Asset Managers Limited Bow Bells House 1 Bread Street London EC4M 9HH Year of Birth: 1972 | Vice President (Since March 2019) | Currently, Global Head of Public Markets, Equities for abrdn. Mr. Kaloo joined abrdn in 2000 as part of the Asian equities team in Singapore. | ||
| Joanne Irvine** Aberdeen Asset Managers Limited Bow Bells House 1 Bread Street London EC4M 9HH Year of Birth: 1968 | Vice President (Since March 2019) | Currently, Deputy Head of Global Emerging Markets Equity Team at abrdn. Ms. Irvine joined the company in 1996 in a group development role. | ||
| Josh Duitz** Aberdeen Standard Investments Inc. 1900 Market Street Suite 200 Philadelphia, PA 19103 Year of Birth: 1970 | Vice President (Since March 2019) | Currently, Deputy Head of the Global Equities Team, Mr. Duitz is responsible for managing Aberdeen Global Infrastructure Fund, Aberdeen Standard Global Infrastructure Income Fund, Aberdeen Total Dynamic Dividend Fund, Aberdeen Global Dynamic Dividend Fund and the Aberdeen Dynamic Dividend Fund (AIFRX, ASGI, AOD,AGD and ADVDX). He joined ASII in 2018 from Alpine Woods Capital Investors LLC where he was a Portfolio Manager. Previously, Mr. Duitz worked for Bear Stearns where he was a Managing Director, Principal and traded international equities. Prior to that, he worked for Arthur Andersen where he was a senior auditor. | ||
| Svitlana Gubriy** abrdn 6 St Andrew Square Edinburgh EH2 2BD Year of Birth: 1972 | Vice President (Since March 2019) | Currently, Head of Listed Funds – Real Estate Global Investment Strategy at abrdn. Ms. Gubriy joined abrdn in 2005. | ||
| Ben Moser** Aberdeen Standard Investments Inc. 1900 Market Street Suite 200 Philadelphia, PA 19103 Year of Birth: 1979 | Vice President (Since September 2018) | Currently, Head of Investor Services – US. Mr. Moser joined ASII in July 2008. | ||
| Chris Demetriou** Aberdeen Standard Investments Inc. 1900 Market Street Suite 200 Philadelphia, PA 19103 Year of Birth: 1983 | Vice President (Since December 2020) | Currently, Chief Executive Officer – UK, EMEA and Americas, Mr. Demetriou joined ASII in 2013, as a result of the acquisition of SVG, a FTSE 250 private equity investor based in London. |
| 156 | 2021 Annual Report |
Management of the Funds (Unaudited) (concluded)
As of October 31, 2021
| Name, Address, and Year of Birth | Position(s) Held, Length of Time Served and Term of Office* | Principal Occupation During Past 5 Years | ||
| Jim O'Connor** Aberdeen Standard Investments Inc. 1900 Market Street Suite 200 Philadelphia, PA 19103 Year of Birth: 1976 | Vice President (Since December 2020) | Currently, Chief Operating Officer – Americas for ASII. Mr. O'Connor joined ASII as US Counsel in 2010 as U.S. Counsel | ||
| Andrew Kim** Aberdeen Standard Investments Inc. 1900 Market Street Suite 200 Philadelphia, PA 19103 Year of Birth: 1983 | Assistant Secretary (Since March 2017) | Currently, Senior Product Manager. Mr. Kim joined ASII in August 2013. |
| * | Each officer holds office for an indefinite term at the pleasure of the Board of Trustees and until his or her successor is elected and qualified. | |
| ** | As of October 31, 2021, Mr. Hendry, Ms. Melia, Ms. Kennedy, Mr. Goodson, Mr. Young, Ms. Sitar, Mr. Andolina, Mr. Kaloo, Ms. Irvine, Mr. Duitz, Ms. Gubriy, Mr. Moser, Mr. Demetriou, Mr. O'Connor and Mr. Kim hold officer position(s) in one or more funds which are part of the Fund Complex. |
During the year the Independent Trustees of the Trust engaged Mr. Martin Gilbert as an advisory consultant to provide ongoing insight into the asset management industry given his long standing experience in both this sector and the closed end funds arena. The position was not remunerated, although travel and expenses were reimbursed across all the funds related to the consultancy. Effective December 15, 2021 the consultant agreement was terminated by mutual agreement of the parties.
Further information about the Fund's Trustees and Officers is available in the Trust's Statement of Additional Information, which can be obtained without charge by calling (800) 522-5465.
| 2021 Annual Report | 157 |
Management Information
Trustees
Radhika Ajmera
Stephen Bird
P. Gerald Malone, Chairman
Neville J. Miles
Rahn K. Porter
Steven N. Rappaport
Warren C. Smith
Investment Adviser
Aberdeen Standard Investments Inc.
1900 Market Street, Suite 200
Philadelphia, PA 19103
Fund Administrator
Aberdeen Standard Investments Inc.
1900 Market Street, Suite 200
Philadelphia, PA 19103
Transfer Agent
DST Asset Manager Solutions, Inc.
430 W. 7th Street, Ste. 219534
Kansas City, MO 64105-1407
Distributor
Aberdeen Fund Distributors LLC
1900 Market Street, Suite 200
Philadelphia, PA 19103
Sub-Administrator, Custodian & Fund Accountant
State Street Bank and Trust Company
1 Lincoln Street
Boston, MA 02111
Independent Registered Public Accounting Firm
KPMG LLP
1601 Market Street
Philadelphia, PA 19103
Fund Counsel
Dechert LLP
1900 K Street N.W.
Washington, D.C. 20006
Aberdeen Standard Investments Inc. 1900 Market Street, Suite 200 Philadelphia, PA 19103 aberdeen-asset.us
AOE-0140-AR |  |
Aberdeen Funds
Fixed Income and Multi-Asset Series
Annual Report
October 31, 2021
Fixed Income Funds
Aberdeen Emerging Markets Debt Fund
Class A – AKFAX ◼ Class C – AKFCX ◼ Class R – AKFRX ◼ Institutional Class – AKFIX ◼ Institutional Service Class – AKFSX
Aberdeen Intermediate Municipal Income Fund
Class A – NTFAX ◼ Class C – GTICX ◼ Institutional Class – ABEIX ◼ Institutional Service Class – ABESX
Aberdeen Short Duration High Yield Municipal Fund
Class A – AAHMX ◼ Class C – ACHMX ◼ Institutional Class – AHYMX
Aberdeen Ultra Short Municipal Income Fund
Class A – ATOAX ◼ Class A1 – ATOBX ◼ Institutional Class – ATOIX
Multi-Asset Funds
Aberdeen Global Absolute Return Strategies Fund
Class A – CUGAX ◼ Class C – CGBCX ◼ Institutional Class – AGCIX ◼ Institutional Service Class – CGFIX

Table of Contents
| Market Review | Page 1 |
| Aberdeen Emerging Markets Debt Fund | Page 3 |
| Aberdeen Global Absolute Return Strategies Fund | Page 12 |
| Aberdeen Intermediate Municipal Income Fund | Page 27 |
| Aberdeen Short Duration High Yield Municipal Fund | Page 34 |
| Aberdeen Ultra Short Municipal Income Fund | Page 49 |
| Financial Statements | Page 58 |
| Notes to Financial Statements | Page 76 |
| Report of Independent Registered Public Accounting Firm | Page 99 |
| Other Tax Information | Page 100 |
| Shareholder Expense Examples | Page 101 |
| Supplemental Information | Page 102 |
| Liquidity Risk Management Program | Page 105 |
| Management of the Funds | Page 106 |
Investors should carefully consider a fund's investment objectives, risks, fees, charges and expenses before investing any money. To obtain this and other fund information, please call 866-667-9231 to request a prospectus, or download a prospectus at https://www.abrdn.com/en-us/us/investor/fund-centre#literature. Please read it carefully before investing any money.
Investing in mutual funds involves risk, including possible loss of principal.
Aberdeen Funds is distributed by Aberdeen Fund Distributors LLC, Member FINRA, 1900 Market Street, Suite 200, Philadelphia, PA 19103.
Aberdeen Standard Investments Inc. (ASII) has been registered as an investment adviser under the Investment Advisers Act of 1940 since August 23, 1995.
The complete schedule of portfolio holdings for each fund of Aberdeen Funds (each a "Fund" and collectively, the "Funds") is included in the Funds' semi-annual and annual reports to shareholders. Aberdeen Funds also files complete schedules of portfolio holdings for each Fund with the Securities and Exchange Commission (the "Commission") for the first and third quarters of each fiscal year as an exhibit to its reports on Form N-PORT. The Funds' Form N-PORT filings are available on the Commission's website at http://www.sec.gov and the Funds make the information on the exhibit to Form N-PORT available to shareholders on upon request without charge by calling 1-866-667-9231.
Statement Regarding Availability of Proxy Voting Record.
Information regarding the policies and procedures that the Funds use to determine how to vote proxies relating to portfolio securities is available without charge, upon request, by calling 1-866-667-9231. The information is also included in the Funds' Statement of Additional Information, which is available on the Funds' website at https://www.abrdn.com/en-us/us/investor/fund-centre#literature and on the Commission's website at www.sec.gov.
Information relating to how each Fund voted proxies relating to portfolio securities held during the most recent twelve months ended June 30 is available by August 30 of the relevant year: (i) upon request and without charge by calling 1-866-667-9231; and (ii) on the Commission's website at www.sec.gov.
abrdn
abrdn plc, formerly known as Standard Life Aberdeen plc, was renamed on September 27, 2021. In connection with this re-branding, the entities within abrdn plc group, including investment advisory entities, have been or will be renamed in the near future. In addition, the fund names are anticipated to be re-branded over the next year.
Market Review
Global financial markets mainly recorded positive returns despite bouts of significant volatility over the 12-month period ended October 31, 2021. Global developed-market equities, as represented by the MSCI AC World Index,1 returned 37.3% for the period. Supportive monetary and fiscal policies were prevalent over the period. The U.S. Federal Reserve (Fed) maintained the federal funds rate at near 0% throughout the reporting period, while providing support through its bond-buying program. Elsewhere, the European Central Bank ramped up its original €1.35 trillion (US$1.57 trillion) stimulus plan to €1.85 trillion (US$2.15 trillion) in December 2020. The U.S. Congress passed two additional stimulus packages during the reporting period, with a cumulative total of roughly $2.8 trillion. In August 2021, the U.S. Senate passed the $1 trillion infrastructure deal.
At the beginning of the reporting period in November 2020, news of three major COVID-19 vaccines buoyed investor sentiment. This persisted through to the end of 2020 due to the launch of vaccination programs, the approval of stimulus packages, and the UK and the European Union reaching a Brexit trade deal.
Momentum stalled in January and February 2021, as global bond markets experienced a significant selloff, spurring worries that this could impact the fragile global recovery. The downturn in bond markets also had a negative impact on equities. However, stock markets resumed their upward momentum, driven by economic optimism, vaccine rollouts, central banks' continued accommodative monetary policies, and a strong corporate earnings reporting season. The MSCI AC World Index reached a record high in August 2021, but sold off in September amid investors' growing concerns over inflation and possible interest-rate hikes from central banks. Uneasiness about the global economy led to a selloff across most equity markets across the globe. In October 2021, upbeat company results, along with comments that demand remained strong, eased investors' concerns about stagflation,* supply-chain pressures, spiraling energy prices and higher interest rates.
Emerging-market (EM) equities posted notable gains over the reporting period, with the exception of China. The MSCI Emerging Markets Index2 returned 17.0% for the period. Stock prices initially rallied on investors' optimism regarding the COVID-19 vaccine rollout, which allowed the reopening of economies worldwide. Upbeat corporate earnings, driven by an e-commerce boom, a multi-year technology upgrading cycle and pent-up infrastructure demand also bolstered investor sentiment. Increasing adoption of climate-change goals by governments globally also fueled interest in clean-energy themes. These positive factors outweighed investors' concerns over supply-chain disruptions caused by a shortage of semiconductors, shipping gridlocks, and an energy crunch. However, the spread of the more contagious Delta variant of coronavirus capped the stock market gains in some EM economies due to their relatively slower vaccine rollouts.
In the global fixed-income markets, government bond prices moved lower during the reporting period, with the ICE bank of America (BofA) Global Government Index3 returning –2.5%. Lockdown restrictions heightened investors' fears of a deep recession, with the "risk-off" environment boosting government bond prices as investors
fled to their perceived safety. However, rising optimism about vaccines and concerns that an economic recovery would fuel sharp rises in inflation led to a drop in government bond prices. Bond prices continued to decline later in the reporting period as expectations of a withdrawal of support from central banks globally, along with inflation fears, triggered a selloff. Corporate bonds, as measured by the ICE BofA Corporate Index, returned 2.1% for the reporting period as government monetary and fiscal stimuli measures and rising investor optimism helped bolster the corporate fixed-income markets. However, corporate bond prices subsequently fell modestly as investors' fears of forthcoming central bank action increased. The global high-yield fixed income market, as represented by the ICE BofA Global High Yield Constrained Index,4 performed well over the reporting period, returning 8.9%, as the COVID-19 vaccine rollout and resulting economic reopening and reflation narrative bolstered risk assets throughout the first half of 2021. However, the high-yield market's performance was tempered towards the end of the summer of 2021, as it became increasingly evident that supply-side pressures were building, perhaps unsurprisingly after entire economies and industries had been shut down and were reopening.
The global real estate market performed relatively well during the reporting period. The Financial Times Stock Exchange European Public Real Estate Association/National Association of Real Estate Investment Trusts (FTSE EPRA/NAREIT) Global ex U.S. Index5 and the FTSE EPRA NAREIT U.S. Index6 returned 23.4% and 53.5%, respectively, over the period. Real estate investment trusts (REITs) typically are more resistant to inflationary pressures due to the ability to raise rents, offset the impact of rising interest rates. While the overall performance of the REIT market was very robust during the reporting period, there was a wide disparity in returns. Those sectors that had materially underperformed in 2020 because their tenants were at the epicenter of the COVID-19-induced lockdowns (i.e., retail and urban apartments), posted extremely strong gains as economic activity rebounded and investors sought value-oriented sectors exposed to the reopening. Meanwhile, those "safe-haven" sectors where cash flows held up during the pandemic but were trading at elevated price/earnings multiples,7 such as data centers and cell towers, underperformed as investors rotated into more value-oriented sectors. Additionally, as the reporting period progressed, the industrial and storage sectors, which had garnered accelerating earnings growth and true pricing power in the form of rising rents, also were strong outperformers.
Outlook
When bond yields rally, investors tend to take profits and sell highly valued companies. Time will tell whether this proves shortsighted this time around. From our conversations with various industry participants, it appears that some of the supply bottlenecks emanating from manufacturing hubs such as Vietnam, Thailand and Malaysia are now easing. Some raw material costs, noticeably metals, are also decreasing. This is due to a mix of government price caps and a slowdown in demand. It is worth noting that China's manufacturing
| 2021 Annual Report | 1 |
Market Review (concluded)
purchasing managers' index for September recorded a reading of 49.6, a marginal contraction from the previous month.
From our perspective, the most recent corporate earnings reports generally were positive, indicating that most companies have been successful in passing through higher costs. While this is a positive factor for fixed-income securities in the short term, we think that it is emblematic of the inflationary environment that currently exists. Over the longer term, if inflation remains high, central banks globally most likely will need to act more decisively, risking a slowdown in global economic growth. Therefore, we think that the market may be especially sensitive to economic data over the next several months as investors look to divine the direction of inflation and growth, while simultaneously gauging the reaction function of central bankers. Overall, we believe that the credit fundamentals of the market are solid, and we anticipate that companies will be well-positioned to weather modestly slower growth, keeping default rates relatively low.
In the U.S. and Western Europe, we are waiting to see the effect of the withdrawal of government support schemes on labor participation. These factors suggest that, as we head towards the end of the year, pressure on the supply chain could start to moderate. Overall, we think that the performance of equity markets may be tempered by gradual monetary policy normalization and the potential impact of increased taxation.
abrdn
| 1 | The MSCI AC World Index is an unmanaged index considered representative of stock markets of developed and emerging markets. Indexes are unmanaged and have been provided for comparison purposes only. No fees or expenses are reflected. You cannot invest directly in an index. |
| 2 | The MSCI Emerging Markets Index is an unmanaged index considered representative of stocks of developing countries. |
| 3 | The ICE BofA Global Government Index tracks the performance of investment-grade sovereign debt publicly issued and denominated in the issuer's own domestic market and currency. |
| 4 | The ICE BofA Global High Yield Constrained Index tracks the performance of U.S. dollar-, Canadian dollar-, British pound- and euro-denominated below-investment-grade corporate debt publicly issued in the major domestic or eurobond markets. |
| 5 | The FTSE EPRA/NAREIT Global ex U.S. Index is an unmanaged index considered representative of real estate companies and REITs outside the U.S. |
| 6 | The FTSE EPRA NAREIT U.S. Index is a free-float adjusted, market capitalization-weighted index of U.S. equity REITs. |
| 7 | A price/earnings multiple is calculated by dividing the current market price of a stock by the earnings per share. Price/earnings multiples often are used to compare companies in the same industry, or to assess the historical performance of an individual company. |
COVID-19
Beginning in the first quarter of 2020, the illness caused by a novel coronavirus, COVID-19, has resulted in a global pandemic and major disruption to economies and markets around the world, including the United States. Financial markets have experienced extreme volatility and severe losses. Some sectors of the economy and individual issuers have experienced particularly large losses. These circumstances may continue for an extended period of time, and as a result may affect adversely the value and liquidity of the Fund's investments. The rapid development and fluidity of this situation precludes any prediction as to the ultimate adverse impact of COVID-19 on economic and market conditions, and, as a result, present uncertainty and risk with respect to the Fund and the performance of its investments and ability to pay distributions. The full extent of the impact and effects of COVID-19 will depend on future developments, including, among other factors, the duration and spread of the outbreak, along with related travel advisories, quarantines and restrictions, the recovery time of the disrupted supply chains and industries, the impact of labor market interruptions, the impact of government interventions, and uncertainty with respect to the duration of the global economic slowdown.
| 2 | 2021 Annual Report |
Aberdeen Emerging Markets Debt Fund (Unaudited)
Aberdeen Emerging Markets Debt Fund (Institutional Class shares net of fees) returned 4.32% for the 12-month reporting period ended October 31, 2021, versus the 4.41% return of its benchmark, the J.P. Morgan Emerging Markets Bond (EMBI) Global Diversified Index, during the same period.
Emerging-market (EM) debt garnered positive returns the reporting period, but with considerable divergence by country. On a global basis, hard-currency bonds outperformed local-currency issues due primarily to idiosyncratic currency weakness in certain EM countries.
Although the market saw increased volatility at the beginning of the reporting period, momentum quickly turned positive on news of multiple successful COVID-19 vaccine trials and the enactment of a new $900 billion stimulus bill in the U.S. These factors supported EMs, even as a second wave of COVID-19 infections continued to surge and many countries reinstated lockdown measures. This strong momentum fizzled out at the beginning of 2021 amid increased economic uncertainty and vaccine rollout challenges. However, risk asset prices began to climb again in February 2021, driven by higher commodity prices, stronger inflation prospects, positive investor sentiment regarding the vaccines, and the enactment of a US$1.9 trillion COVID-19 fiscal relief package.
Despite the spread of the more transmissible Delta variant of COVID-19, investor risk sentiment continued to improve in the second half of the reporting period, as strong vaccination progress – particularly in developed countries – led to economic reopenings and increased optimism for a global economic recovery. In the final four months of the period, U.S. Treasury yields experienced volatility due to reduced U.S. Treasury issuance and tapering comments from U.S. Federal Reserve (Fed) Chair Jerome Powell. In September 2021, the Fed announced it would begin to slow the pace of its purchases of U.S. agency mortgage-backed securities (MBS) and U.S. Treasury securities, which it projected to end in mid-2022. In October 2021, higher inflation expectations led the market to price in a faster onset of monetary tightening, with the 10-year U.S. Treasury note yield ending the period at 1.55% – up 67 basis points from the same period-end in 2020. Oil prices also were volatile, with the Brent crude oil price rising 125% over the reporting period, ending the period at US$84.38 per barrel. Investors' optimism regarding the vaccines, widespread supply disruption and falling inventories combined to support the higher oil price.
The Fund modestly underperformed its benchmark, the J.P. Morgan EMBI Global Diversified Index, over the reporting period. Overall, currency exposure and sector allocation detracted from Fund performance, while country and credit allocation were positive contributors. Security selection had no significant impact on Fund performance.
The largest detractor from Fund performance for the reporting period was the overweight position, sector allocation and currency exposure
in Brazil. Other notable detractors included the exposure to the euro and an underweight position and currency exposure in Turkey. An underweight position in Oman, the lack of exposure to Sri Lanka, an overweight position in Argentina, sector allocation in Mexico and Russia, and credit allocation in China also weighed on performance.
The Fund also employed foreign exchange forwards2 during the reporting period to hedge its exposure to changes in the value of its holdings due to movements in currency exchange rates. Due to the depreciation of several EM currencies versus the U.S. dollar, including the Brazilian real, Mexican peso, Turkish lira and South African rand, the Fund recorded a loss on its forward currency contracts over the reporting period.
Conversely, the exposure to Africa, overweight allocations to Angola, Ivory Coast and Tunisia, and a position in Benin, which is not a constituent of the benchmark index, bolstered Fund performance for the reporting period. Security selection in South Africa and sector allocations to South Africa, Ivory Coast and Egypt also enhanced Fund performance. Other contributors to performance included an underweight position in Colombia and exposure to the Colombian peso and Russian ruble, along with sector allocation in Uruguay. Finally, Fund performance benefited from underweight positions in Panama and Peru, overweight allocations to Ukraine and Iraq, a holding in the Bahamas, which is not represented in the benchmark index, and a lack of exposure to the Philippines.
In the first half of the reporting period, we initiated holdings in eurobonds in Ivory Coast, Iraq and Belarus, and Turkish hard-currency U.S. dollar-denominated bonds. We also participated in a new issue from Uzbekistan, which we funded by selling the Fund's holdings in Indonesian bonds, and a euro-denominated new issue from Benin, with positions in both tranches 2032 and 2052, as well as hard-currency new issues from the Dominican Republic, Oman and Ghana. We increased the Fund's overweight allocation to Iraq and added positions in Senegal and Gabon. We increased the Fund's risk in Belarus and added to the position in the Dominican Republic following a selloff in that market. We reduced the Fund's exposure to Mexico, Mozambique, El Salvador and Qatar, sold the Eurobond position in Albania, and switched into longer-dated bonds in Romania. We also reduced the positions in Belarus, Ghana, Argentina, Ivory Coast and Pakistan. Elsewhere, we trimmed the Fund's exposure to Ecuador to neutral relative to the benchmark given the increased election risks in that country.
During the second half of the reporting period, we took part in several new issues, including Georgia, which we funded by selling the Fund's holdings in a Barbados 2029 bond, a 10-year bond from Rwanda, and a shorter-duration1 position in Nigeria. We increased the Fund's positions in Angola, Jordan, Guatemala and Romania, and added exposure to Pakistan, Ivory Coast, Bahrain, Qatar, Uzbekistan and Tunisia as we believed that these countries had improving
| 1 | Duration is an estimate of bond price sensitivity to changes in interest rates. The higher the duration, the greater the change (i.e., higher risk) in relation to interest-rate movements. |
| 2 | A foreign exchange forward is a binding contract in the foreign exchange market that locks in the exchange rate for the purchase or sale of a currency on a future date. |
| 2021 Annual Report | 3 |
Aberdeen Emerging Markets Debt Fund (Unaudited) (concluded)
macroeconomic outlooks. We decreased the Fund's exposure to Paraguay, Belize and El Salvador, carried out several sales to cover fund outflows, including positions in South Africa and Egypt, and took profits from the Fund's position in long-dated Argentine bonds
In the local currency space, we increased the Fund's holdings in Brazilian bonds and reduced the position in Indonesia due to our fiscal concerns. We had anticipated that the Indonesian rupiah would depreciate, given the likelihood of limited central bank intervention at that stage. We also added to the Fund's exposure to Uruguayan local currency bonds and unhedged the exposure to the Brazilian real. We reduced the Fund's positions in Colombia, increased the exposure to South Africa, and shortened the duration in Russia. In the second half of the reporting period, we reduced the Fund's duration by switching from Brazilian 2031 bonds to 2027 bonds, took part in what we felt was an attractively priced new issue from Uruguay, and reduced the exposure to the South African rand.
In the corporate space, we took part in several new issues, including state-owned oil company Petroleos del Peru; Chinese real estate developers Country Garden Holdings Co. Ltd., and Shimao; and OQ SAOC (OQ), the national petroleum investment company of Oman. We also took part in a quasi-sovereign issue from Georgian Railway (GRAIL) after we tendered an older GRAIL bond, and reduced the Fund's position in Colombia's state-owned oil company, Ecopetrol SA, on a relative value basis. We also added to the Fund's position in Pemex, Mexico's state-owned oil company, and carried out an extension trade in oil company Tengizchevroil LLP in Kazakhstan, as we believed that the yield curve in that market looked fairly steep. Toward the end of the reporting period, we exited the Fund's position in Country Garden Holdings to reduce risk and raised cash by selling positions in Investment Corporation of Dubai, OQ and GRAIL.
Despite growth trajectories being dampened by a slowdown in Chinese economic growth and softer-than-expected global growth in the second half of 2021, real GDP in many EMs surprised to the upside this year. This helped fuel inflation pressures, mainly across Europe and Latin America, where economic reopenings gathered pace, with central banks starting to reduce monetary stimulus more than developed-market policymakers. As we approach the end of 2021, we expect EMs to continue to benefit from the persistence of accommodative fiscal policy, while financing needs should remain contained as better-than-expected growth in the first half of the year has led to robust revenue growth; the recent International Monetary Fund (IMF) Special Drawing Rights allocation has also boosted reserves.
As we move into 2022, we believe that tighter fiscal and monetary policies will result in a slowdown in economic activity compared to 2021, while local management of the COVID-19 pandemic and
political developments will prove to be differentiating factors. Growth in Asia is expected to accelerate compared to 2021, as COVID-19 headwinds have kept the region closed to international travel and also resulted in global supply-chain disruptions. We believe that the risks to our outlook remain a hawkish Fed leading to rising U.S. Treasury yields and sustained U.S.-dollar strength, while a more pronounced economic slowdown in China – potentially driven by worsening conditions in the property sector – would weigh on commodity prices and weaken investor sentiment. Finally, vaccine inefficacy against new COVID-19 variants, which affects economic reopenings and engenders social unrest, also remains a risk to our outlook.
Portfolio Management:
Emerging Markets Debt Team
PAST PERFORMANCE DOES NOT GUARANTEE FUTURE RESULTS.
The performance data quoted represents past performance and current returns may be lower or higher. Class A Shares have up to a 3.00% front-end sales charge and a 0.25% 12b-1 fee. The investment return and principal value will fluctuate so that an investor's shares, when redeemed, may be worth more or less than the original cost. To obtain performance information current to the most recent month-end, which may be higher or lower than the performance shown above, please call 866-667-9231 or go to https://www.abrdn.com/en-us/us/investor/fund-centre.
Investing in mutual funds involves risk, including the possible loss of principal.
Indexes are unmanaged and have been provided for comparison purposes only. No fees or expenses are reflected. You cannot invest directly in an index.
Risk Considerations
Deteriorating market conditions might cause a general weakness in the market that reduces the prices, or yield, of securities in those markets in which the Fund invests.
The value of a security may decline for reasons directly related to the issuer, such as management performance, financial leverage and reduced demand for the issuer's goods or services.
Fixed income securities are subject to, among other risks, credit risk, extension risk, issuer risk, interest rate risk, market risk and prepayment risk.
The Fund is subject to the risk that the Adviser or Subadviser may make poor security selections.
The risks that apply to foreign investments are greater for securities of companies in emerging market countries because the countries may have less stable governments, more volatile currencies and less established markets.
Please read the prospectus for more detailed information regarding these and other risks.
| 4 | 2021 Annual Report |
Aberdeen Emerging Markets Debt Fund (Unaudited)
Average Annual Total Return
(For periods ended October 31, 2021) | 1 Yr. | 5Yr. | Inception1 | ||||||
| Class A | w/o SC | 3.96% | 2.85% | 2.70% | |||||
| w/SC2 | 0.80% | 2.23% | 2.35% | ||||||
| Class C | w/o SC | 3.54% | 2.25% | 2.03% | |||||
| w/SC3 | 2.54% | 2.25% | 2.03% | ||||||
| Class R4 | w/o SC | 3.74% | 2.58% | 2.44% | |||||
| Institutional Service Class4 | w/o SC | 4.25% | 3.21% | 3.02% | |||||
| Institutional Class4 | w/o SC | 4.32% | 3.23% | 3.02% |
All figures showing the effect of a sales charge (SC) reflect the maximum charge possible because it has the most significant effect on performance data. The total returns shown above do not include the impact of financial statement rounding of the net asset value (NAV) per share and/or financial statement adjustments.
| 1 | The Fund commenced operations on November 1, 2012. |
| 2 | A 3.00% front-end sales charge was deducted. Prior to February 28, 2019 the front-end sales charge was 4.25%. |
| 3 | A 1.00% contingent deferred sales charge (CDSC) was deducted from the one year return because it is charged when Class C shares are sold within the first year after purchase. |
| 4 | Not subject to any sales charges. |
Performance of a $1,000,000* Investment (as of October 31, 2021)
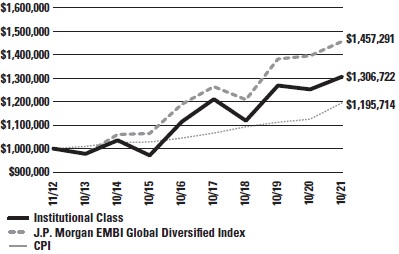
* Minimum Initial Investment
Comparative performance of $1,000,000 invested in Institutional Class shares of the Aberdeen Emerging Markets Debt Fund, the J.P. Morgan Emerging Markets Bond Index (EMBI) Global Diversified Index and the Consumer Price Index (CPI) since inception. Unlike the Fund, the returns for these unmanaged indexes do not reflect any fees, expenses, or sales charges. Investors cannot invest directly in market indexes.
The J.P. Morgan EMBI Global Diversified Index is an alternatively weighted index that assigns a larger weight to less liquid issues from countries with smaller debt stocks and limits the weights of those index countries with larger debt stocks by only including a specified portion of these countries' eligible current face amounts of debt outstanding. The index consists of U.S. dollar-denominated Brady bonds, Eurobonds, and traded loans issued by sovereign and quasi-sovereign entities issued in emerging markets countries.
The CPI is a measure of the average change over time in the prices paid by urban consumers for a market basket of consumer goods and services.
Investment return and principal value will fluctuate, and when redeemed, shares may be worth more or less than original cost. Past performance is no guarantee of future results. The Average Annual Total Return table and Performance graph do not reflect the deduction of taxes that a shareholder would pay on fund distributions or the redemption of fund shares. Investing in mutual funds involves market risk, including loss of principal. Performance returns assume the reinvestment of all distributions. Total returns reflect waivers and reimbursements in effect, without which returns would have been lower.
| 2021 Annual Report | 5 |
Aberdeen Emerging Markets Debt Fund (Unaudited)
Portfolio Summary (as a percentage of net assets)
October 31, 2021 (Unaudited)
| Asset Allocation | ||
| Government Bonds | 73.7% | |
| Corporate Bonds | 21.2% | |
| Short-Term Investment | 5.1% | |
| Warrants | –% | |
| Liabilities in Excess of Other Assets | –% | |
| 100.0% | ||
Amounts listed as "–" are 0% or round to 0%.
The following chart summarizes the composition of the Fund's portfolio, expressed as a percentage of net assets. The industries listed below may include more than one industry group. As of October 31, 2021, the Fund did not have more than 25% of its assets invested in any industry group.
| Top Industries | ||
| Oil, Gas & Consumable Fuels | 5.5% | |
| Electric Utilities | 2.6% | |
| Commercial Banks | 2.3% | |
| Real Estate | 1.7% | |
| Transportation | 1.3% | |
| Chemicals | 1.3% | |
| Energy Equipment & Services | 1.2% | |
| Diversified Financial Services | 0.8% | |
| Diversified Telecommunication Services | 0.7% | |
| Real Estate Investment Trust (REIT) Funds | 0.6% | |
| Other | 82.0% | |
| 100.0% | ||
| Top Holdings* | ||
| Russian Federal Bond – OFZ 09/16/2026 | 3.3% | |
| Qatar Government International Bond 03/14/2049 | 2.9% | |
| Brazil Notas do Tesouro Nacional Series F 01/01/2027 | 2.5% | |
| Saudi Government International Bond 04/17/2049 | 2.4% | |
| Brazil Notas do Tesouro Nacional, Series B 08/15/2024 | 2.3% | |
| Ukraine Government International Bond 05/31/2040 | 2.0% | |
| Perusahaan Perseroan Persero PT Perusahaan Listrik Negara 01/25/2049 | 1.8% | |
| Bahamas Government International Bond 11/21/2028 | 1.7% | |
| Dominican Republic International Bond 01/27/2045 | 1.7% | |
| Argentine Republic Government International Bond, VRN 07/09/2030 | 1.6% | |
| Other | 77.8% | |
| 100.0% | ||
| * | For the purpose of listing top holdings, Short-Term Investments are included as part of Other. |
| Top Countries | ||
| Qatar | 6.0% | |
| Brazil | 5.4% | |
| United States | 5.1% | |
| Mexico | 4.9% | |
| Egypt | 4.3% | |
| Ukraine | 4.1% | |
| United Arab Emirates | 3.3% | |
| Russia | 3.3% | |
| Dominican Republic | 3.2% | |
| Indonesia | 3.2% | |
| Other | 57.2% | |
| 100.0% | ||
| 6 | 2021 Annual Report |
Statement of Investments
October 31, 2021
Aberdeen Emerging Markets Debt Fund
| Shares or Principal Amount | Value (US$) | ||||
| CORPORATE BONDS (21.2%) | |||||
| CHINA (1.7%) | |||||
| Investment Companies (0.5%) | |||||
| Huarong Finance 2019 Co. Ltd. (USD), 2.13%, 09/30/2023 (a) | $ 215,000 | $ 201,969 | |||
| Real Estate (1.2%) | |||||
| Agile Group Holdings Ltd. (USD), 5.50%, 05/17/2026 (a) | 200,000 | 154,881 | |||
| Shimao Group Holdings Ltd. (USD), 6.13%, 02/21/2024 (a) | 200,000 | 189,250 | |||
| Sunac China Holdings Ltd. (USD), 6.50%, 01/26/2026 (a) | 200,000 | 141,970 | |||
| 486,101 | |||||
| 688,070 | |||||
| COLOMBIA (0.5%) | |||||
| Commercial Banks (0.5%) | |||||
| Bancolombia SA, (fixed rate to 10/18/2022, variable rate thereafter) (USD), 4.88%, 10/18/2027 | 200,000 | 202,002 | |||
| GEORGIA (1.3%) | |||||
| Transportation (1.3%) | |||||
| Georgian Railway JSC (USD), 4.00%, 06/17/2028 (a) | 520,000 | 525,200 | |||
| INDIA (0.7%) | |||||
| Commercial Banks (0.7%) | |||||
| HDFC Bank Ltd. (INR), 8.10%, 03/22/2025 (a) | 20,000,000 | 276,091 | |||
| INDONESIA (3.2%) | |||||
| Electric Utilities (1.8%) | |||||
| Perusahaan Perseroan Persero PT Perusahaan Listrik Negara (USD), 6.25%, 01/25/2049 (a) | 587,000 | 735,218 | |||
| Oil, Gas & Consumable Fuels (0.6%) | |||||
| Pertamina Persero PT (USD), 5.63%, 05/20/2043 (a) | 200,000 | 238,601 | |||
| Sovereign Agency (0.8%) | |||||
| Lembaga Pembiayaan Ekspor Indonesia (USD), 3.88%, 04/06/2024 (a) | 290,000 | 305,950 | |||
| 1,279,769 | |||||
| KAZAKHSTAN (0.5%) | |||||
| Oil, Gas & Consumable Fuels (0.5%) | |||||
| Tengizchevroil Finance Co. International Ltd. (USD), 3.25%, 08/15/2030 (a) | 214,000 | 214,565 | |||
| KUWAIT (0.7%) | |||||
| Chemicals (0.7%) | |||||
| MEGlobal Canada ULC (USD), 5.00%, 05/18/2025 (a) | 250,000 | 273,709 | |||
| Shares or Principal Amount | Value (US$) | ||||
| MEXICO (4.9%) | |||||
| Commercial Banks (0.6%) | |||||
| BBVA Bancomer SA., (fixed rate to 09/13/2029, variable rate thereafter) (USD), 5.88%, 09/13/2034 (a) | $ 230,000 | $ 250,125 | |||
| Oil, Gas & Consumable Fuels (3.7%) | |||||
| Petroleos Mexicanos | |||||
| (USD), 6.50%, 03/13/2027 | 121,000 | 128,986 | |||
| (USD), 6.84%, 01/23/2030 | 115,000 | 120,221 | |||
| (USD), 6.50%, 06/02/2041 | 330,000 | 298,617 | |||
| (USD), 6.75%, 09/21/2047 | 324,000 | 286,578 | |||
| (USD), 6.35%, 02/12/2048 | 340,000 | 289,850 | |||
| (USD), 6.95%, 01/28/2060 | 420,000 | 372,523 | |||
| 1,496,775 | |||||
| Real Estate Investment Trust (REIT) Funds (0.6%) | |||||
| Trust Fibra Uno (USD), 6.39%, 01/15/2050 (a) | 220,000 | 256,577 | |||
| 2,003,477 | |||||
| MOROCCO (0.6%) | |||||
| Chemicals (0.6%) | |||||
| OCP SA (USD), 6.88%, 04/25/2044 (a) | 200,000 | 239,456 | |||
| NIGERIA (0.5%) | |||||
| Engineering & Construction (0.5%) | |||||
| IHS Netherlands Holdco BV (USD), 8.00%, 09/18/2027 (a) | 200,000 | 212,250 | |||
| PANAMA (0.5%) | |||||
| Commercial Banks (0.5%) | |||||
| Global Bank Corp., (fixed rate to 04/16/2028, variable rate thereafter) (USD), 5.25%, 04/16/2029 (a) | 198,000 | 207,158 | |||
| PERU (1.0%) | |||||
| Metals & Mining (0.5%) | |||||
| Nexa Resources SA (USD), 5.38%, 05/04/2027 (a) | 200,000 | 212,502 | |||
| Oil, Gas & Consumable Fuels (0.5%) | |||||
| Petroleos del Peru SA (USD), 5.63%, 06/19/2047 (a) | 200,000 | 203,000 | |||
| 415,502 | |||||
| SOUTH AFRICA (1.5%) | |||||
| Diversified Telecommunication Services (0.7%) | |||||
| MTN Mauritius Investments Ltd. (USD), 6.50%, 10/13/2026 (a) | 250,000 | 283,125 | |||
| Electric Utilities (0.8%) | |||||
| Eskom Holdings SOC Ltd. (USD), 7.13%, 02/11/2025 (a) | 330,000 | 343,200 | |||
| 626,325 | |||||
| UKRAINE (0.6%) | |||||
| Iron/Steel (0.6%) | |||||
| Metinvest BV (USD), 8.50%, 04/23/2026 (a) | 200,000 | 224,668 | |||
See accompanying Notes to Financial Statements.
| 2021 Annual Report | 7 |
Statement of Investments (continued)
October 31, 2021
Aberdeen Emerging Markets Debt Fund
| Shares or Principal Amount | Value (US$) | ||||
| CORPORATE BONDS (continued) | |||||
| UNITED ARAB EMIRATES (2.8%) | |||||
| Airlines (0.3%) | |||||
| Zahidi Ltd. (USD), 4.50%, 03/22/2028 (a)(b) | $ 123,162 | $ 126,347 | |||
| Diversified Financial Services (0.8%) | |||||
| ICD Sukuk Co. Ltd. (USD), 5.00%, 02/01/2027 (a) | 300,000 | 328,090 | |||
| Energy Equipment & Services (1.2%) | |||||
| Abu Dhabi Crude Oil Pipeline LLC (USD), 4.60%, 11/02/2047 (a)(b) | 200,000 | 232,168 | |||
| Galaxy Pipeline Assets Bidco Ltd. (USD), 2.63%, 03/31/2036 (a)(b) | 264,000 | 257,193 | |||
| 489,361 | |||||
| Real Estate (0.5%) | |||||
| MAF Global Securities Ltd., (fixed rate to 09/07/2022, variable rate thereafter) (USD), 5.50%, 09/07/2022 (a)(c) | 200,000 | 202,040 | |||
| 1,145,838 | |||||
| VENEZUELA (0.2%) | |||||
| Oil, Gas & Consumable Fuels (0.2%) | |||||
| Petroleos de Venezuela SA | |||||
| (USD), 6.00%, 05/16/2024 (a)(b)(d)(e) | 1,140,000 | 57,000 | |||
| (USD), 6.00%, 11/15/2026 (a)(b)(d)(e) | 525,236 | 26,262 | |||
| 83,262 | |||||
| Total Corporate Bonds | 8,617,342 | ||||
| GOVERNMENT BONDS (73.7%) | |||||
| ANGOLA (1.6%) | |||||
| Angolan Government International Bond (USD), 9.38%, 05/08/2048 (a) | 675,000 | 669,802 | |||
| ARGENTINA (2.6%) | |||||
| Argentine Republic Government International Bond | |||||
| (USD), 1.00%, 07/09/2029 | 174,073 | 63,103 | |||
| VRN (USD), 0.50%, 07/09/2030 (f) | 1,912,000 | 652,183 | |||
| VRN (USD), 1.13%, 07/09/2035 (f) | 1,068,403 | 329,613 | |||
| (USD), 0.00%, 12/15/2035 | 533,627 | 2,935 | |||
| 1,047,834 | |||||
| ARMENIA (0.6%) | |||||
| Republic of Armenia International Bond (USD), 3.95%, 09/26/2029 (a) | 260,000 | 252,850 | |||
| BAHAMAS (1.7%) | |||||
| Bahamas Government International Bond (USD), 6.00%, 11/21/2028 (a) | 770,000 | 695,510 | |||
| BAHRAIN (0.5%) | |||||
| Bahrain Government International Bond (USD), 7.00%, 01/26/2026 (a) | 200,000 | 221,420 | |||
| BARBADOS (0.3%) | |||||
| Barbados Government International Bond (USD), 6.50%, 10/01/2029 (a)(b) | 123,400 | 123,709 | |||
| Shares or Principal Amount | Value (US$) | ||||
| BELARUS (2.0%) | |||||
| Republic of Belarus International Bond (USD), 6.88%, 02/28/2023 (a) | $ 215,000 | $ 217,300 | |||
| Republic of Belarus Ministry of Finance (USD), 5.88%, 02/24/2026 (a) | 650,000 | 597,961 | |||
| 815,261 | |||||
| BELIZE (0.4%) | |||||
| Belize Government International Bond (USD), 4.94%, 02/20/2034 (a)(b)(g) | 299,139 | 154,805 | |||
| BENIN (1.3%) | |||||
| Benin Government International Bond | |||||
| (EUR), 4.88%, 01/19/2032 (a)(b) | 350,000 | 394,485 | |||
| (EUR), 6.88%, 01/19/2052 (a)(b) | 100,000 | 115,787 | |||
| 510,272 | |||||
| BRAZIL (5.4%) | |||||
| Brazil Notas do Tesouro Nacional | |||||
| Series B (BRL), 6.00%, 08/15/2024 (h) | 1,400,000 | 926,654 | |||
| Series F (BRL), 10.00%, 01/01/2029 | 899,000 | 143,375 | |||
| Series F (BRL), 10.00%, 01/01/2031 | 637,000 | 100,179 | |||
| Brazil Notas do Tesouro Nacional Series F (BRL), 10.00%, 01/01/2027 | 6,300,000 | 1,029,159 | |||
| 2,199,367 | |||||
| CAMEROON (0.6%) | |||||
| Republic of Cameroon International Bond (EUR), 5.95%, 07/07/2032 (a)(b) | 200,000 | 225,055 | |||
| CHILE (1.2%) | |||||
| Bonos de la Tesoreria de la Republica en pesos (CLP), 4.70%, 09/01/2030 (a) | 435,000,000 | 488,770 | |||
| COLOMBIA (1.3%) | |||||
| Colombia Government International Bond | |||||
| (USD), 5.20%, 05/15/2049 | 220,000 | 221,388 | |||
| (USD), 4.13%, 05/15/2051 | 370,000 | 323,306 | |||
| 544,694 | |||||
| CZECH REPUBLIC (1.0%) | |||||
| Czech Republic Government Bond (CZK), 1.00%, 06/26/2026 (a) | 9,460,000 | 392,141 | |||
| DOMINICAN REPUBLIC (3.2%) | |||||
| Dominican Republic International Bond | |||||
| (USD), 5.95%, 01/25/2027 (a) | 260,000 | 289,903 | |||
| (USD), 6.85%, 01/27/2045 (a) | 600,000 | 669,006 | |||
| (USD), 5.88%, 01/30/2060 (a) | 360,000 | 352,800 | |||
| 1,311,709 | |||||
| ECUADOR (1.4%) | |||||
| Ecuador Government International Bond | |||||
| VRN (USD), 5.00%, 07/31/2030 (a)(b)(f) | 646,240 | 536,379 | |||
| VRN (USD), 1.00%, 07/31/2035 (a)(b)(f) | 79,589 | 52,430 | |||
| 588,809 | |||||
See accompanying Notes to Financial Statements.
| 8 | 2021 Annual Report |
Statement of Investments (continued)
October 31, 2021
Aberdeen Emerging Markets Debt Fund
| Shares or Principal Amount | Value (US$) | ||||
| GOVERNMENT BONDS (continued) | |||||
| EGYPT (4.3%) | |||||
| Egypt Government International Bond | |||||
| (USD), 7.60%, 03/01/2029 (a) | $ 320,000 | $ 321,600 | |||
| (EUR), 5.63%, 04/16/2030 (a) | 160,000 | 170,011 | |||
| (EUR), 5.63%, 04/16/2030 (a) | 10,000 | 10,626 | |||
| (USD), 7.90%, 02/21/2048 (a) | 625,000 | 549,725 | |||
| (USD), 8.70%, 03/01/2049 (a) | 400,000 | 373,032 | |||
| (USD), 8.88%, 05/29/2050 (a) | 340,000 | 320,236 | |||
| 1,745,230 | |||||
| EL SALVADOR (0.8%) | |||||
| El Salvador Government International Bond | |||||
| (USD), 5.88%, 01/30/2025 (a) | 249,000 | 197,955 | |||
| (USD), 8.63%, 02/28/2029 (a) | 160,000 | 127,680 | |||
| 325,635 | |||||
| GHANA (2.2%) | |||||
| Ghana Government International Bond (USD), 7.75%, 04/07/2029 (a)(b) | 336,000 | 298,665 | |||
| Ghana Government International Bond | |||||
| (USD), 8.63%, 04/07/2034 (a)(b) | 246,000 | 217,656 | |||
| (USD), 7.88%, 02/11/2035 (a)(b) | 223,000 | 189,406 | |||
| (USD), 8.95%, 03/26/2051 (a)(b) | 200,000 | 170,894 | |||
| 876,621 | |||||
| GUATEMALA (0.8%) | |||||
| Guatemala Government Bond (USD), 6.13%, 06/01/2050 (a) | 270,000 | 316,710 | |||
| HONDURAS (0.4%) | |||||
| Honduras Government International Bond (USD), 5.63%, 06/24/2030 (a) | 150,000 | 149,250 | |||
| IRAQ (1.4%) | |||||
| Iraq International Bond | |||||
| (USD), 6.75%, 03/09/2023 (a) | 360,000 | 367,308 | |||
| (USD), 5.80%, 01/15/2028 (a) | 203,125 | 197,450 | |||
| 564,758 | |||||
| IVORY COAST (1.3%) | |||||
| Ivory Coast Government International Bond | |||||
| (EUR), 5.88%, 10/17/2031 (a)(b) | 160,000 | 191,822 | |||
| (EUR), 6.88%, 10/17/2040 (a)(b) | 100,000 | 121,204 | |||
| (EUR), 6.63%, 03/22/2048 (a)(b) | 203,000 | 233,429 | |||
| 546,455 | |||||
| JORDAN (1.2%) | |||||
| Jordan Government International Bond | |||||
| (USD), 4.95%, 07/07/2025 (a) | 210,000 | 218,917 | |||
| (USD), 7.38%, 10/10/2047 (a) | 270,000 | 278,829 | |||
| 497,746 | |||||
| KENYA (1.1%) | |||||
| Republic of Kenya Government International Bond (USD), 7.00%, 05/22/2027 (a)(b) | 410,000 | 434,183 | |||
| MOROCCO (0.5%) | |||||
| Morocco Government International Bond (EUR), 1.50%, 11/27/2031 (a) | 210,000 | 222,397 | |||
| Shares or Principal Amount | Value (US$) | ||||
| NIGERIA (2.3%) | |||||
| Nigeria Government International Bond | |||||
| (USD), 7.63%, 11/21/2025 (a) | $ 253,000 | $ 275,302 | |||
| (USD), 6.50%, 11/28/2027 (a) | 260,000 | 265,424 | |||
| (USD), 6.13%, 09/28/2028 (a) | 400,000 | 396,632 | |||
| 937,358 | |||||
| OMAN (0.5%) | |||||
| Oman Government International Bond (USD), 6.25%, 01/25/2031 (a) | 200,000 | 216,250 | |||
| PAKISTAN (2.6%) | |||||
| Pakistan Government International Bond | |||||
| (USD), 6.88%, 12/05/2027 (a) | 461,000 | 470,880 | |||
| (USD), 7.38%, 04/08/2031 (a) | 587,000 | 595,793 | |||
| 1,066,673 | |||||
| PERU (0.8%) | |||||
| Peruvian Government International Bond (USD), 2.78%, 01/23/2031 | 320,000 | 318,240 | |||
| QATAR (6.0%) | |||||
| Qatar Government International Bond | |||||
| (USD), 4.00%, 03/14/2029 (a) | 250,000 | 281,560 | |||
| (USD), 5.10%, 04/23/2048 (a) | 400,000 | 530,685 | |||
| (USD), 4.82%, 03/14/2049 (a) | 925,000 | 1,189,180 | |||
| (USD), 4.40%, 04/16/2050 (a) | 356,000 | 433,889 | |||
| 2,435,314 | |||||
| ROMANIA (1.1%) | |||||
| Romanian Government International Bond | |||||
| (EUR), 2.00%, 01/28/2032 (a) | 160,000 | 176,366 | |||
| (EUR), 2.75%, 04/14/2041 (a) | 160,000 | 169,956 | |||
| (EUR), 3.38%, 01/28/2050 (a) | 76,000 | 85,330 | |||
| 431,652 | |||||
| RUSSIA (3.3%) | |||||
| Russian Federal Bond – OFZ (RUB), 7.75%, 09/16/2026 | 97,822,000 | 1,355,483 | |||
| RWANDA (1.1%) | |||||
| Rwanda International Government Bond (USD), 5.50%, 08/09/2031 (a) | 440,000 | 447,806 | |||
| SAUDI ARABIA (3.1%) | |||||
| Saudi Government International Bond | |||||
| (USD), 5.00%, 04/17/2049 (a) | 770,000 | 959,680 | |||
| (USD), 3.75%, 01/21/2055 (a) | 302,000 | 315,693 | |||
| 1,275,373 | |||||
| SENEGAL (0.7%) | |||||
| Senegal Government International Bond (USD), 6.25%, 05/23/2033 (a)(b) | 260,000 | 268,005 | |||
| SERBIA (1.3%) | |||||
| Serbia International Bond (EUR), 3.13%, 05/15/2027 (a) | 410,000 | 514,114 | |||
See accompanying Notes to Financial Statements.
| 2021 Annual Report | 9 |
Statement of Investments (continued)
October 31, 2021
Aberdeen Emerging Markets Debt Fund
| Shares or Principal Amount | Value (US$) | ||||
| GOVERNMENT BONDS (continued) | |||||
| SOUTH AFRICA (0.5%) | |||||
| Republic of South Africa Government International Bond (USD), 6.25%, 03/08/2041 | $ 200,000 | $ 208,820 | |||
| TUNISIA (1.5%) | |||||
| Banque Centrale de Tunisie International Bond | |||||
| (EUR), 6.75%, 10/31/2023 (a) | 200,000 | 196,277 | |||
| (EUR), 5.63%, 02/17/2024 (a) | 438,000 | 412,354 | |||
| 608,631 | |||||
| TURKEY (2.5%) | |||||
| Turkey Government International Bond | |||||
| (USD), 6.13%, 10/24/2028 | 560,000 | 548,520 | |||
| (USD), 7.63%, 04/26/2029 | 201,000 | 211,337 | |||
| (USD), 5.95%, 01/15/2031 | 264,000 | 246,697 | |||
| 1,006,554 | |||||
| UKRAINE (3.5%) | |||||
| Ukraine Government International Bond | |||||
| (EUR), 6.75%, 06/20/2026 (a) | 310,000 | 385,237 | |||
| (USD), 6.88%, 05/21/2029 (a) | 200,000 | 203,716 | |||
| (USD), 0.00%, 05/31/2040 (a)(i) | 789,000 | 830,454 | |||
| 1,419,407 | |||||
| UNITED ARAB EMIRATES (0.5%) | |||||
| Finance Department Government of Sharjah (USD), 4.00%, 07/28/2050 (a) | 233,000 | 209,991 | |||
| URUGUAY (1.5%) | |||||
| Uruguay Government International Bond | |||||
| (UYU), 4.38%, 12/15/2028 (b)(h) | 21,268,917 | 566,674 | |||
| (UYU), 8.25%, 05/21/2031 | 999,000 | 22,443 | |||
| 589,117 | |||||
| UZBEKISTAN (1.8%) | |||||
| Republic of Uzbekistan International Bond | |||||
| (USD), 4.75%, 02/20/2024 (a) | 300,000 | 313,980 | |||
| (USD), 3.70%, 11/25/2030 (a) | 212,000 | 204,936 | |||
| (USD), 3.90%, 10/19/2031 (a) | 220,000 | 214,500 | |||
| 733,416 | |||||
| VENEZUELA (0.0%) | |||||
| Venezuela Government International Bond (USD), 9.25%, 05/07/2028 (a)(d)(e) | 165,000 | 15,890 | |||
| Total Government Bonds | 29,979,087 | ||||
| WARRANTS (0.0%) | |||||
| BRAZIL (0.0%) | |||||
| OAS S.A. (d)(j)(k) | 29,232 | — | |||
| UNITED STATES (0.0%) | |||||
| CANADACO, Series A (d)(j)(k) | 92,840 | — | |||
| Total Warrants | 0 | ||||
| Shares or Principal Amount | Value (US$) | ||||
| SHORT-TERM INVESTMENT (5.1%) | |||||
| UNITED STATES (5.1%) | |||||
| State Street Institutional U.S. Government Money Market Fund, Premier Class, 0.03% (l) | $ 2,090,253 | $ 2,090,253 | |||
| Total Short-Term Investment | 2,090,253 | ||||
| Total Investments (Cost $43,543,236) (m)—100.0% | 40,686,682 | ||||
| Liabilities in Excess of Other Assets—(0.0%) | (3,095 | ) | |||
| Net Assets—100.0% | $40,683,587 | ||||
| (a) | Denotes a security issued under Regulation S or Rule 144A. |
| (b) | Sinkable security. |
| (c) | Perpetual bond. This is a bond that has no maturity date, is redeemable and pays a steady stream of interest indefinitely. The maturity date presented for these instruments represents the next call/put date. |
| (d) | Illiquid security. |
| (e) | Security is in default. |
| (f) | Indicates a stepped coupon bond. This bond was issued with a low coupon that gradually increases over the life of the bond. |
| (g) | Payment-in-kind. This is a type of bond that pays interest in additional bonds rather than in cash. |
| (h) | Inflation linked security. |
| (i) | Variable Rate Instrument. The rate shown is based on the latest available information as of October 31, 2021. Certain variable rate securities are not based on a published reference rate and spread but are determined by the issuer or agent and are based on current market conditions. These securities do not indicate a reference rate and spread in their description. |
| (j) | Level 3 security. See Note 2(a) of the accompanying Notes to Financial Statements. |
| (k) | Non-Income Producing Security. |
| (l) | Registered investment company advised by State Street Global Advisors. The rate shown is the 7 day yield as of October 31, 2021. |
| (m) | See accompanying Notes to Financial Statements for tax unrealized appreciation/depreciation of securities. |
| BRL | Brazilian Real |
| CLP | Chilean Peso |
| CZK | Czech Koruna |
| EUR | Euro Currency |
| IDR | Indonesian Rupiah |
| INR | Indian Rupee |
| MXN | Mexican Peso |
| PLC | Public Limited Company |
| PLN | Polish Zloty |
| RUB | Russian Ruble |
| USD | U.S. Dollar |
| UYU | Uruguayan Peso |
See accompanying Notes to Financial Statements.
| 10 | 2021 Annual Report |
Statement of Investments (concluded)
October 31, 2021
Aberdeen Emerging Markets Debt Fund
At October 31, 2021, the Fund's open forward foreign currency exchange contracts were as follows:
| Purchase Contracts Settlement Date* | Counterparty | Amount Purchased | Amount Sold | Fair Value | Unrealized Appreciation/ (Depreciation) | |||
| Brazilian Real/United States Dollar | ||||||||
| 11/24/2021 | Deutsche Bank AG | BRL | 780,000 | USD | 144,444 | $ 137,635 | $ (6,809 | ) |
| Euro/United States Dollar | ||||||||
| 01/13/2022 | Barclays Bank plc | EUR | 210,000 | USD | 243,395 | 243,213 | (182 | ) |
| Indian Rupee/United States Dollar | ||||||||
| 11/24/2021 | UBS AG | INR | 42,578,000 | USD | 566,875 | 566,659 | (216 | ) |
| Indonesian Rupiah/United States Dollar | ||||||||
| 11/24/2021 | Barclays Bank plc | IDR | 6,714,121,000 | USD | 461,470 | 471,008 | 9,538 | |
| Mexican Peso/United States Dollar | ||||||||
| 01/13/2022 | Citibank N.A. | MXN | 17,603,000 | USD | 836,235 | 845,707 | 9,472 | |
| New Russian Ruble/United States Dollar | ||||||||
| 11/24/2021 | Barclays Bank plc | RUB | 34,524,000 | USD | 471,092 | 485,645 | 14,553 | |
| 11/24/2021 | UBS AG | RUB | 28,239,000 | USD | 398,881 | 397,235 | (1,646 | ) |
| $3,147,102 | $24,710 | |||||||
| Sale Contracts Settlement Date* | Counterparty | Amount Purchased | Amount Sold | Fair Value | Unrealized Appreciation/ (Depreciation) | |||
| United States Dollar/Brazilian Real | ||||||||
| 11/24/2021 | Deutsche Bank AG | USD | 257,685 | BRL | 1,343,000 | $ 236,980 | $ 20,705 | |
| 11/24/2021 | Royal Bank of Canada | USD | 1,609,921 | BRL | 8,567,000 | 1,511,694 | 98,227 | |
| United States Dollar/Chilean Peso | ||||||||
| 11/24/2021 | Royal Bank of Canada | USD | 534,089 | CLP | 421,789,000 | 517,231 | 16,858 | |
| United States Dollar/Euro | ||||||||
| 01/13/2022 | Deutsche Bank AG | USD | 3,620,249 | EUR | 3,129,000 | 3,623,871 | (3,622 | ) |
| United States Dollar/Indonesian Rupiah | ||||||||
| 11/24/2021 | Deutsche Bank AG | USD | 472,759 | IDR | 6,714,121,000 | 471,008 | 1,751 | |
| United States Dollar/New Russian Ruble | ||||||||
| 11/24/2021 | UBS AG | USD | 1,018,458 | RUB | 76,102,000 | 1,070,518 | (52,060 | ) |
| 01/13/2022 | UBS AG | USD | 396,077 | RUB | 28,262,000 | 392,804 | 3,273 | |
| United States Dollar/Polish Zloty | ||||||||
| 01/13/2022 | Deutsche Bank AG | USD | 453,074 | PLN | 1,803,000 | 451,205 | 1,869 | |
| $8,275,311 | $ 87,001 | |||||||
| Unrealized appreciation on forward foreign currency exchange contracts | $176,246 | |||||||
| Unrealized depreciation on forward foreign currency exchange contracts | (64,535 | ) | ||||||
* Certain contracts with different trade dates and like characteristics have been shown net.
See accompanying Notes to Financial Statements.
| 2021 Annual Report | 11 |
Aberdeen Global Absolute Return Strategies Fund (Unaudited)
Aberdeen Global Absolute Return Strategies Fund (Institutional Class shares net of fees) returned 0.46% for the 12-month reporting period ended October 31, 2021, versus the 0.09% return of its benchmark, the ICE Bank of America 3-Month U.S. Treasury Bill Index, for the same period.
Global equities, as measured by the Morgan Stanley Capital International (MSCI) All Country (AC) World Index (net dividends),1 returned 37.28% over the 12-month period ended October 31, 2021. The UK, U.S. and Europe all performed well during the period. However, China's stock market posted a negative return and was one of the weakest performers globally. Following the COVID-19 outbreak and the subsequent lockdown restrictions and slowdown of economic activity, global stock markets began to recover as investors hoped that economies would return to some kind of normality.
Global equity markets surged after Joe Biden won the U.S. presidential election in November 2020. The U.S. stock market, as represented by the S&P 500 Index,2 then surpassed all-time highs at the end of 2020, driven by the approval of the COVID-19 fiscal relief package by the U.S. Congress. Positive results from vaccine trials then led to the rollout of vaccination programs. Accelerating vaccine rollouts and the easing of restrictions on social mobility helped boost investors' hopes of a global economic rebound. However, investors grew worried that the global spread of the Delta variant of COVID-19, alongside global supply-chain issues and shortages, would hamper the economic recovery.
In the global fixed-income markets, government bond prices fell during the reporting period. Lockdown restrictions heightened investors' fears of a deep recession, with the "risk-off" environment boosting government bond prices as investors fled to their perceived safety. However, rising optimism about vaccines and concerns that an economic recovery would fuel sharp rises in inflation led to a drop in government bond prices later in the period. Bond prices continued to decline later in the reporting period as expectations of a withdrawal of support from central banks globally, along with inflation fears, triggered a selloff. Corporate bonds performed well over the reporting period as government monetary policy and fiscal stimulus measures and rising investor optimism helped bolster the fixed-income markets. However, corporate bond prices subsequently fell modestly as investors' fears of forthcoming central bank action increased.
The Fund recorded a modest positive return for the reporting period, which was dominated by the COVID-19 crisis. News of effective
vaccines and their subsequent rollout, the U.S. presidential election result, and a late-stage Brexit deal brought relief to markets in November 2020. Despite concerns about an uptick in COVID-19 cases and inflationary pressures, the reporting period ended on an upbeat note amid accelerating vaccination progress and generally positive corporate results.
The Fund's corporate bond positions performed relatively well during the reporting period, especially high-yield bonds and contingent capital bonds (also known as contingent convertible bonds or "CoCos"), boosted by supportive central bank and government actions. The Fund's themed equity strategies also delivered positive returns, particularly the global strategies, with industrial automation, cyclical value, future mobility and sustainable staples among the top contributors. However, the U.S. equity energy versus utilities, U.S. equity regional banks versus the S&P 500 Index, and UK versus European equities strategies detracted from performance.
The Fund's interest-rate strategies saw mixed performance over the reporting period. The U.S. versus German interest-rate strategy was a positive contributor. However, the short U.S. real interest-rate position, as well as the Canadian, Australian and recently added Mexican interest-rate strategies weighed on Fund performance. The Fund's European yield-curve steepener3 strategy lost ground as the interest-rate curve flattened towards the end of the reporting period. Rising inflation expectations from the prospect of a strong post-COVID economic recovery supported the Fund's European inflation strategy. However, the short UK inflation position delivered a negative return for the period. The currency positions also weighed on Fund performance, particularly the relative value position in emerging-market currencies and the position favoring the Korean won over the Australian dollar.
We employed derivatives in the Fund throughout the reporting period. We used currency swaps4 to implement our investment views and hedge any unintended currency risk at the Fund level. Within the Fund's fixed-income segment, we employed bond futures, credit default swaps,5 interest-rate swaps,6 interest-rate swaptions,7 inflation swaps8 and currency swaps to implement our investment views and to manage currency and interest-rate exposure. We used equity futures, options and total return swaps9 to implement and manage the Fund's equity exposure. The derivatives positions detracted 3.75% from the Fund's absolute return for the reporting period.
| 1 | The MSCI AC World Index tracks the performance of stocks in developed and emerging markets. |
| 2 | The S&P 500 Index is an unmanaged index considered representative of the broader U.S. stock market. Indexes are unmanaged and have been provided for comparison purposes only. No fees or expenses are reflected. You cannot invest directly in an index. |
| 3 | A yield-curve steepener is a strategy that seeks to take advantage of an anticipated widening yield spread between short and long maturities. |
| 4 | A currency swap is the exchange of interest – and sometimes principal – in one currency for the same in another currency. |
| 5 | A credit default swap is a contract that transfers the credit exposure of fixed-income products between two or more parties. |
| 6 | An interest-rate swap is an agreement between two parties in which one stream of future interest payments is exchanged for another based on a specified principal amount. |
| 7 | An interest-rate swaption refers to an option to enter into an interest rate swap or some other type of swap. In exchange for an options premium, the buyer gains the right but not the obligation to enter into a specified swap agreement with the issuer on a specified future date. |
| 8 | An inflation swap is a contract used to transfer inflation risk from one party to another through an exchange of fixed cash flows. In an inflation swap, one party pays a fixed-rate cash flow on a principal amount while the other party pays a floating rate linked to an inflation index. |
| 9 | A total return swap comprises an agreement in which one party makes payments based on a set rate, either fixed or variable, while the other party makes payments based on the return of an underlying asset, which includes both the income it generates and any capital gains. |
| 12 | 2021 Annual Report |
Aberdeen Global Absolute Return Strategies Fund (Unaudited) (concluded)
We are positioning the Fund based on our expectation that economic growth will remain strong, inflation will subside towards 2022, and central banks globally will gradually tighten monetary policy. We remain guided by our conviction that inflation rates at or above global central bank targets should be relatively short-lived. We are also conscious that several market scenarios could play out. In one scenario, we believe it is possible that the U.S. Federal Reserve (Fed) could tolerate higher-than-expected inflation, pushing real yields lower and strongly promoting cyclical risk assets. However, in our view, it is also possible that global central banks (particularly the Fed) could start removing monetary stimulus earlier than expected, which in turn could provoke fears of a downward shock to risk-asset markets. In this environment, we have been focused on seeking higher-yielding assets across the Fund's equity, bond, currency and volatility strategies.
Portfolio Management:
Multi-Asset Team
PAST PERFORMANCE DOES NOT GUARANTEE FUTURE RESULTS.
The performance data quoted represents past performance and current returns may be lower or higher. Class A Shares have up to a 3.00% front-end sales charge and a 0.25% 12b-1 fee. The investment return and principal value will fluctuate so that an investor's shares, when redeemed, may be worth more or less than the original cost. To obtain performance information current to the most recent month-end, which may be higher or lower than the performance shown above, please call 866-667-9231 or go to https://www.abrdn.com/en-us/us/investor/fund-centre.
Investing in mutual funds involves risk, including the possible loss of principal.
Indexes are unmanaged and have been provided for comparison purposes only. No fees or expenses are reflected. You cannot invest directly in an index.
Risk Considerations
Absolute return funds employ certain techniques that are intended to reduce risk and volatility in the portfolio and provide protection against a decline in the fund's assets. They are not designed to outperform stocks and bonds in strong markets and there is no guarantee of positive returns or that the Fund's objective will be achieved.
Deteriorating market conditions might cause a general weakness in the market that reduces the prices, or yield, of securities in those markets in which the Fund invests.
Derivatives are speculative and may hurt the Fund's performance. The potential benefits to be derived from the Fund's options, futures and derivatives strategy are dependent upon the portfolio managers' ability to discern pricing inefficiencies and predict trends in these markets, which decisions could prove to be inaccurate.
The Fund is subject to the risk that the Adviser or Subadviser may make poor security selections.
Please read the prospectus for more detailed information regarding these and other risks.
| 2021 Annual Report | 13 |
Aberdeen Global Absolute Return Strategies Fund (Unaudited)
| Average Annual Total Return1 (For periods ended October 31, 2021) | 1 Yr. | 5 Yr. | 10 Yr. | |||||||||||
| Class A | w/o SC | 0.18% | 2.39% | 1.46% | ||||||||||
| w/SC2 | -2.84% | 1.77% | 1.16% | |||||||||||
| Class C | w/o SC | -0.54% | 1.67% | 0.74% | ||||||||||
| w/SC3 | -1.53% | 1.67% | 0.74% | |||||||||||
| Institutional Service Class4 | w/o SC | 0.43% | 2.57% | 1.61% | ||||||||||
| Institutional Class4 | w/o SC | 0.46% | 2.65% | 1.74% | ||||||||||
All figures showing the effect of a sales charge (SC) reflect the maximum charge possible because it has the most significant effect on performance data. The total returns shown above do not include the impact of financial statement rounding of the net asset value (NAV) per share and/or financial statement adjustments.
| 1 | The Fund changed its investment objective and principal investment strategies, including its 80% investment policy, effective November 15, 2019. The Fund also previously changed its investment objective and strategies effective August 15, 2016. Performance information for periods prior to November 15, 2019 does not reflect the current investment strategy. Please consult the Fund's prospectus for more detail. |
| 2 | A 3.00% front-end sales charge was deducted. Prior to February 28, 2019 the front-end sales charge was 4.25%. |
| 3 | A 1.00% contingent deferred sales charge (CDSC) was deducted from the one year return because it is charged when Class C shares are sold within the first year after purchase. |
| 4 | Not subject to any sales charges. |
Performance of a $1,000,000 Investment* (as of October 31, 2021)
 | Comparative performance of $1,000,000 invested in Institutional Service Class shares of the Aberdeen Global Absolute Return Strategies Fund, the ICE BofA Merrill Lynch 3-Month U.S. Treasury Note Index and the Consumer Price Index (CPI) over a 10-year period ended October 31, 2021. Unlike the Fund, the returns for these unmanaged indexes do not reflect any fees, expenses, or sales charges. Investors cannot invest directly in market indexes. The ICE BofA Merrill Lynch 3-Month U.S. Treasury Note Index is an unmanaged index tracking 3-month U.S. Treasury securities. The CPI is a measure of the average change over time in the prices paid by urban consumers for a market basket of consumer goods and services. |
* Minimum Initial Investment
Investment return and principal value will fluctuate, and when redeemed, shares may be worth more or less than original cost. Past performance is no guarantee of future results. The Average Annual Total Return table and Performance graph do not reflect the deduction of taxes that a shareholder would pay on fund distributions or the redemption of fund shares. Investing in mutual funds involves market risk, including loss of principal. Performance returns assume the reinvestment of all distributions. Total returns reflect waivers and reimbursements in effect, without which returns would have been lower.
| 14 | 2021 Annual Report |
Aberdeen Global Absolute Return Strategies Fund (Unaudited)
Portfolio Summary (as a percentage of net assets)
October 31, 2021 (Unaudited)
| Asset Allocation | ||||
| Money Market Funds | 42.9% | |||
| Certificates of Deposit | 25.9% | |||
| Government Bonds | 21.0% | |||
| U.S. Treasuries | 9.2% | |||
| Other Assets in Excess of Liabilities | 1.0% | |||
| 100.0% |
| Top Holdings* | ||||
| Bundesrepublik Deutschland Bundesanleihe 07/04/2022 | 16.4% | |||
| Republic of South Africa Government Bond | 4.6% | |||
| Other | 79.0% | |||
| 100.0% |
| * | For the purpose of listing top holdings, Short-Term Investments are included as part of Other. |
| Top Countries | ||||
| United States | 52.1% | |||
| Germany | 16.4% | |||
| France | 13.0% | |||
| Netherlands | 8.6% | |||
| South Africa | 4.6% | |||
| Canada | 4.3% | |||
| Other | 1.0% | |||
| 100.0% |
| 2021 Annual Report | 15 |
Statement of Investments
October 31, 2021
Aberdeen Global Absolute Return Strategies Fund
| Shares or Principal Amount | Value (US$) | ||||
| GOVERNMENT BONDS (21.0%) | |||||
| GERMANY (16.4%) | |||||
| Bundesrepublik Deutschland Bundesanleihe (EUR), 1.75%, 07/04/2022 (a)(b) | $ 12,844,600 | $ 15,090,651 | |||
| SOUTH AFRICA (4.6%) | |||||
| Republic of South Africa Government Bond | |||||
| Series R186 (ZAR), 10.50%, 12/21/2026 | 18,999,300 | 1,362,601 | |||
| Series 2030 (ZAR), 8.00%, 01/31/2030 | 23,355,800 | 1,387,434 | |||
| Series 2032 (ZAR), 8.25%, 03/31/2032 | 24,584,500 | 1,410,697 | |||
| 4,160,732 | |||||
| Total Government Bonds | 19,251,383 | ||||
| Total Purchased Options (see detail below) | 33,750 | ||||
| SHORT-TERM INVESTMENT (78.0%) | |||||
| CERTIFICATES OF DEPOSIT (25.9%) | |||||
| CANADA (4.3%) | |||||
| Bank of Montreal (USD), 0.01%, 11/01/2021 | 3,957,328 | 3,957,328 | |||
| FRANCE (13.0%) | |||||
| BNP Paribas SA (USD), 0.03%, 11/01/2021 | 3,959,219 | 3,959,219 | |||
| Credit Agricole SA (USD), 0.02%, 11/01/2021 | 3,954,204 | 3,954,204 | |||
| Societe Generale SA (USD), 0.04%, 11/01/2021 | 4,000,675 | 4,000,675 | |||
| 11,914,098 | |||||
| NETHERLANDS (8.6%) | |||||
| ING Bank NV (USD), 0.01%, 11/01/2021 | 3,953,674 | 3,953,674 | |||
| Rabobank Nederland NV (USD), 0.01%, 11/01/2021 | 3,958,243 | 3,958,243 | |||
| 7,911,917 | |||||
| Total Certificates of Deposit | 23,783,343 | ||||
| MONEY MARKET FUNDS (42.9%) | |||||
| UNITED STATES (42.9%) | |||||
| State Street Institutional U.S. Government Money Market Fund, Premier Class, 0.03% (c) | 39,448,913 | 39,448,913 | |||
| Total Money Market Funds | 39,448,913 |
| Shares or Principal Amount | Value (US$) | ||||
| U.S. TREASURIES (9.2%) | |||||
| U.S. Treasury Bill | |||||
| (USD), 0.02%, 11/04/2021 (d) | $ 1,500,000 | $ 1,499,995 | |||
| (USD), 0.05%, 12/09/2021 (d) | 2,000,000 | 1,999,861 | |||
| (USD), 0.05%, 01/06/2022 (d) | 2,000,000 | 1,999,752 | |||
| (USD), 0.03%, 02/03/2022 (d) | 1,000,000 | 999,853 | |||
| (USD), 0.05%, 03/03/2022 (d) | 1,000,000 | 999,797 | |||
| (USD), 0.06%, 04/21/2022 (d) | 1,000,000 | 999,703 | |||
| 8,498,961 | |||||
| Total U.S. Treasuries | 8,498,961 | ||||
| Total Short-Term Investment | 71,731,217 | ||||
| Total Investments (Cost $91,295,633) (e)—99.0% | 91,016,350 | ||||
| Other Assets in Excess of Liabilities—1.0% | 920,672 | ||||
| Net Assets—100.0% | $91,937,022 |
| (a) | Denotes a security issued under Regulation S or Rule 144A. |
| (b) | All or a portion of the security has been designated as collateral for forward foreign currency exchange contracts and swap contracts. |
| (c) | Registered investment company advised by State Street Global Advisors. The rate shown is the 7 day yield as of October 31, 2021. |
| (d) | The rate shown is the discount yield at the time of purchase. |
| (e) | See accompanying Notes to Financial Statements for tax unrealized appreciation/(depreciation) of securities. |
| AUD | Australian Dollar |
| BRL | Brazilian Real |
| CAD | Canadian Dollar |
| CHF | Swiss Franc |
| CNY | Chinese Yuan Renminbi |
| COP | Colombian Peso |
| CZK | Czech Koruna |
| EUR | Euro Currency |
| GBP | British Pound Sterling |
| HKD | Hong Kong Dollar |
| HUF | Hungarian Forint |
| IDR | Indonesian Rupiah |
| INR | Indian Rupee |
See accompanying Notes to Financial Statements.
| 16 | 2021 Annual Report |
Statement of Investments (continued)
October 31, 2021
Aberdeen Global Absolute Return Strategies Fund
| JPY | Japanese Yen |
| KRW | South Korean Won |
| MXN | Mexican Peso |
| MYR | Malaysian Ringgit |
| NOK | Norwegian Krone |
| NZD | New Zealand Dollar |
| PEN | Peruvian Sol |
| PLC | Public Limited Company |
| PLN | Polish Zloty |
| RON | Romanian Leu |
| RUB | Russian Ruble |
| SEK | Swedish Krona |
| THB | Thai Baht |
| TWD | New Taiwan Dollar |
| USD | U.S. Dollar |
| ZAR | South African Rand |
At October 31, 2021, the Fund held the following futures contracts:
| Futures Contracts | Number of Contracts Long/(Short) | Expiration Date | Notional Amount | Market Value | Unrealized Appreciation/ (Depreciation) | |||||||||||||
| LONG CONTRACT POSITIONS | ||||||||||||||||||
| Euro STOXX 50 Future | 55 | 12/17/2021 | $ 2,612,824 | $ 2,693,884 | $ 81,060 | |||||||||||||
| S&P 500 (E-Mini) Future | 55 | 12/17/2021 | 12,101,138 | 12,641,750 | 540,612 | |||||||||||||
| TOPIX Index Future | 15 | 12/09/2021 | 2,640,549 | 2,622,286 | (18,263 | ) | ||||||||||||
| $603,409 | ||||||||||||||||||
At October 31, 2021, the Fund's open forward foreign currency exchange contracts were as follows:
| Purchase Contracts Settlement Date* | Counterparty | Amount Purchased | Amount Sold | Fair Value | Unrealized Appreciation/ (Depreciation) | ||||||||||
| Australian Dollar/United States Dollar | |||||||||||||||
| 11/10/2021 | Citibank N.A. | AUD | 13,842 | USD | 10,078 | $ 10,413 | $ 335 | ||||||||
| 11/10/2021 | Royal Bank of Canada | AUD | 48,523 | USD | 34,906 | 36,502 | 1,596 | ||||||||
| Brazilian Real/United States Dollar | |||||||||||||||
| 01/20/2022 | Citibank N.A. | BRL | 4,800,000 | USD | 853,937 | 835,933 | (18,004 | ) | |||||||
| 01/20/2022 | Goldman Sachs & Co. | BRL | 1,267,000 | USD | 226,315 | 220,652 | (5,663 | ) | |||||||
| British Pound/United States Dollar | |||||||||||||||
| 11/10/2021 | Citibank N.A. | GBP | 1,428 | USD | 1,974 | 1,955 | (19 | ) | |||||||
| 11/10/2021 | JPMorgan Chase Bank N.A. | GBP | 26,613 | USD | 36,627 | 36,421 | (206 | ) | |||||||
| 11/10/2021 | Royal Bank of Canada | GBP | 81,956 | USD | 112,339 | 112,160 | (179 | ) | |||||||
| 11/12/2021 | Barclays Bank plc | GBP | 1,323,000 | USD | 1,824,386 | 1,810,576 | (13,810 | ) | |||||||
| 12/10/2021 | Citibank N.A. | GBP | 42,000 | USD | 57,191 | 57,483 | 292 | ||||||||
| 12/10/2021 | Goldman Sachs & Co. | GBP | 430,000 | USD | 593,711 | 588,520 | (5,191 | ) | |||||||
| 12/10/2021 | HSBC Bank plc | GBP | 65,000 | USD | 89,870 | 88,962 | (908 | ) | |||||||
| 12/10/2021 | JPMorgan Chase Bank N.A. | GBP | 48,000 | USD | 66,346 | 65,695 | (651 | ) | |||||||
| Canadian Dollar/United States Dollar | |||||||||||||||
| 11/10/2021 | Citibank N.A. | CAD | 56,570 | USD | 44,946 | 45,710 | 764 | ||||||||
| 11/10/2021 | JPMorgan Chase Bank N.A. | CAD | 233,175 | USD | 185,159 | 188,409 | 3,250 | ||||||||
| 11/12/2021 | Citibank N.A. | CAD | 363,000 | USD | 285,223 | 293,310 | 8,087 | ||||||||
| 11/12/2021 | Goldman Sachs & Co. | CAD | 1,330,000 | USD | 1,066,997 | 1,074,660 | 7,663 | ||||||||
| 12/14/2021 | Citibank N.A. | CAD | 1,330,000 | USD | 1,077,416 | 1,074,739 | (2,677 | ) | |||||||
| Chinese Renminbi/United States Dollar | |||||||||||||||
| 12/01/2021 | HSBC Bank plc | CNY | 2,426,137 | USD | 373,206 | 377,756 | 4,550 | ||||||||
| 12/06/2021 | HSBC Bank plc | CNY | 2,438,700 | USD | 375,000 | 379,547 | 4,547 | ||||||||
| 12/08/2021 | Barclays Bank plc | CNY | 27,600,000 | USD | 4,257,945 | 4,294,833 | 36,888 | ||||||||
| 12/08/2021 | HSBC Bank plc | CNY | 2,525,163 | USD | 388,235 | 392,940 | 4,705 | ||||||||
| Colombian Peso/United States Dollar | |||||||||||||||
| 01/20/2022 | JPMorgan Chase Bank N.A. | COP | 2,589,000,000 | USD | 685,950 | 683,901 | (2,049 | ) | |||||||
See accompanying Notes to Financial Statements.
| 2021 Annual Report | 17 |
Statement of Investments (continued)
October 31, 2021
Aberdeen Global Absolute Return Strategies Fund
| Purchase Contracts Settlement Date* | Counterparty | Amount Purchased | Amount Sold | Fair Value | Unrealized Appreciation/ (Depreciation) | ||||||||||
| Czech Koruna/United States Dollar | |||||||||||||||
| 01/18/2022 | Goldman Sachs & Co. | CZK | 1,285,000 | USD | 58,192 | $ 57,724 | $ (468 | ) | |||||||
| 01/18/2022 | JPMorgan Chase Bank N.A. | CZK | 4,820,000 | USD | 218,665 | 216,521 | (2,144 | ) | |||||||
| Euro/United States Dollar | |||||||||||||||
| 11/10/2021 | Barclays Bank plc | EUR | 76,409 | USD | 88,377 | 88,342 | (35 | ) | |||||||
| 11/10/2021 | Goldman Sachs & Co. | EUR | 299,803 | USD | 355,723 | 346,624 | (9,099 | ) | |||||||
| 11/10/2021 | Royal Bank of Canada | EUR | 529,386 | USD | 615,053 | 612,061 | (2,992 | ) | |||||||
| 12/10/2021 | Barclays Bank plc | EUR | 48,000 | USD | 56,364 | 55,535 | (829 | ) | |||||||
| 12/10/2021 | JPMorgan Chase Bank N.A. | EUR | 910,000 | USD | 1,059,145 | 1,052,854 | (6,291 | ) | |||||||
| 12/10/2021 | Royal Bank of Canada | EUR | 452,000 | USD | 524,865 | 522,956 | (1,909 | ) | |||||||
| 01/18/2022 | JPMorgan Chase Bank N.A. | EUR | 680,545 | USD | 794,000 | 788,255 | (5,745 | ) | |||||||
| Hong Kong Dollar/United States Dollar | |||||||||||||||
| 11/10/2021 | Barclays Bank plc | HKD | 345,342 | USD | 44,408 | 44,387 | (21 | ) | |||||||
| 11/10/2021 | Citibank N.A. | HKD | 376,542 | USD | 48,350 | 48,397 | 47 | ||||||||
| 11/10/2021 | Goldman Sachs & Co. | HKD | 189,958 | USD | 24,422 | 24,415 | (7 | ) | |||||||
| 11/10/2021 | HSBC Bank plc | HKD | 93,352 | USD | 12,008 | 11,999 | (9 | ) | |||||||
| 11/10/2021 | Royal Bank of Canada | HKD | 359,048 | USD | 46,122 | 46,148 | 26 | ||||||||
| Hungarian Forint/United States Dollar | |||||||||||||||
| 12/14/2021 | Barclays Bank plc | HUF | 247,000,000 | USD | 796,934 | 792,226 | (4,708 | ) | |||||||
| 01/18/2022 | Citibank N.A. | HUF | 165,200,000 | USD | 527,666 | 529,121 | 1,455 | ||||||||
| Indian Rupee/United States Dollar | |||||||||||||||
| 11/03/2021 | HSBC Bank plc | INR | 21,350,000 | USD | 285,093 | 285,043 | (50 | ) | |||||||
| 11/24/2021 | HSBC Bank plc | INR | 20,496,000 | USD | 273,233 | 272,776 | (457 | ) | |||||||
| 12/01/2021 | Citibank N.A. | INR | 10,871,078 | USD | 145,042 | 144,574 | (468 | ) | |||||||
| 12/08/2021 | HSBC Bank plc | INR | 10,034,842 | USD | 133,789 | 133,337 | (452 | ) | |||||||
| 12/09/2021 | Citibank N.A. | INR | 323,000,000 | USD | 4,256,519 | 4,291,304 | 34,785 | ||||||||
| 12/09/2021 | Goldman Sachs & Co. | INR | 22,648,080 | USD | 307,034 | 300,897 | (6,137 | ) | |||||||
| 12/14/2021 | Goldman Sachs & Co. | INR | 79,700,000 | USD | 1,059,235 | 1,058,208 | (1,027 | ) | |||||||
| 12/20/2021 | Citibank N.A. | INR | 33,780,000 | USD | 455,482 | 448,171 | (7,311 | ) | |||||||
| 12/20/2021 | JPMorgan Chase Bank N.A. | INR | 87,000,000 | USD | 1,144,783 | 1,154,260 | 9,477 | ||||||||
| 01/14/2022 | Citibank N.A. | INR | 7,380,000 | USD | 98,495 | 97,607 | (888 | ) | |||||||
| 01/14/2022 | Goldman Sachs & Co. | INR | 27,300,000 | USD | 358,080 | 361,066 | 2,986 | ||||||||
| 01/20/2022 | Goldman Sachs & Co. | INR | 91,500,000 | USD | 1,207,044 | 1,209,262 | 2,218 | ||||||||
| 01/21/2022 | Goldman Sachs & Co. | INR | 91,500,000 | USD | 1,206,885 | 1,209,112 | 2,227 | ||||||||
| 02/03/2022 | Citibank N.A. | INR | 21,350,000 | USD | 281,243 | 281,665 | 422 | ||||||||
| Indonesian Rupiah/United States Dollar | |||||||||||||||
| 12/14/2021 | HSBC Bank plc | IDR | 5,290,000,000 | USD | 370,905 | 370,302 | (603 | ) | |||||||
| 12/20/2021 | HSBC Bank plc | IDR | 22,890,000,000 | USD | 1,600,567 | 1,601,322 | 755 | ||||||||
| 01/20/2022 | Citibank N.A. | IDR | 18,100,000,000 | USD | 1,261,695 | 1,262,010 | 315 | ||||||||
| 01/26/2022 | Barclays Bank plc | IDR | 17,250,000,000 | USD | 1,211,717 | 1,201,940 | (9,777 | ) | |||||||
| 01/28/2022 | Barclays Bank plc | IDR | 17,250,000,000 | USD | 1,211,376 | 1,201,672 | (9,704 | ) | |||||||
| Japanese Yen/United States Dollar | |||||||||||||||
| 11/10/2021 | Barclays Bank plc | JPY | 127,807,866 | USD | 1,124,373 | 1,121,456 | (2,917 | ) | |||||||
| 11/10/2021 | JPMorgan Chase Bank N.A. | JPY | 14,064,025 | USD | 125,027 | 123,406 | (1,621 | ) | |||||||
| 11/10/2021 | Royal Bank of Canada | JPY | 25,893,925 | USD | 236,829 | 227,208 | (9,621 | ) | |||||||
| 11/12/2021 | Citibank N.A. | JPY | 42,629,000 | USD | 383,665 | 374,055 | (9,610 | ) | |||||||
| 11/12/2021 | HSBC Bank plc | JPY | 163,000,000 | USD | 1,435,401 | 1,430,269 | (5,132 | ) | |||||||
| 12/20/2021 | Barclays Bank plc | JPY | 17,100,000 | USD | 156,440 | 150,122 | (6,318 | ) | |||||||
| Malaysian Ringgit/United States Dollar | |||||||||||||||
| 01/14/2022 | Barclays Bank plc | MYR | 324,000 | USD | 77,331 | 78,011 | 680 | ||||||||
| 01/14/2022 | Goldman Sachs & Co. | MYR | 1,190,000 | USD | 284,919 | 286,521 | 1,602 | ||||||||
See accompanying Notes to Financial Statements.
| 18 | 2021 Annual Report |
Statement of Investments (continued)
October 31, 2021
Aberdeen Global Absolute Return Strategies Fund
| Purchase Contracts Settlement Date* | Counterparty | Amount Purchased | Amount Sold | Fair Value | Unrealized Appreciation/ (Depreciation) | ||||||||||
| Mexican Peso/United States Dollar | |||||||||||||||
| 12/10/2021 | JPMorgan Chase Bank N.A. | MXN | 1,300,000 | USD | 63,558 | $ 62,786 | $ (772 | ) | |||||||
| 01/18/2022 | Citibank N.A. | MXN | 18,000,000 | USD | 852,173 | 864,051 | 11,878 | ||||||||
| 01/18/2022 | Goldman Sachs & Co. | MXN | 4,720,000 | USD | 225,587 | 226,574 | 987 | ||||||||
| New Russian Ruble/United States Dollar | |||||||||||||||
| 12/10/2021 | JPMorgan Chase Bank N.A. | RUB | 1,000,000 | USD | 13,423 | 14,023 | 600 | ||||||||
| 12/20/2021 | HSBC Bank plc | RUB | 115,480,000 | USD | 1,578,750 | 1,615,058 | 36,308 | ||||||||
| 01/20/2022 | Goldman Sachs & Co. | RUB | 32,900,000 | USD | 449,151 | 456,577 | 7,426 | ||||||||
| 01/20/2022 | HSBC Bank plc | RUB | 9,500,000 | USD | 129,421 | 131,838 | 2,417 | ||||||||
| 01/25/2022 | HSBC Bank plc | RUB | 84,000,000 | USD | 1,186,405 | 1,164,476 | (21,929 | ) | |||||||
| 01/27/2022 | HSBC Bank plc | RUB | 84,000,000 | USD | 1,185,920 | 1,163,976 | (21,944 | ) | |||||||
| New Taiwan Dollar/United States Dollar | |||||||||||||||
| 12/01/2021 | Goldman Sachs & Co. | TWD | 10,407,110 | USD | 375,207 | 374,525 | (682 | ) | |||||||
| 12/06/2021 | Goldman Sachs & Co. | TWD | 10,461,000 | USD | 377,285 | 376,574 | (711 | ) | |||||||
| 12/08/2021 | Goldman Sachs & Co. | TWD | 131,831,890 | USD | 4,755,154 | 4,746,241 | (8,913 | ) | |||||||
| 12/20/2021 | HSBC Bank plc | TWD | 4,400,000 | USD | 159,302 | 158,523 | (779 | ) | |||||||
| Norwegian Krone/United States Dollar | |||||||||||||||
| 11/12/2021 | Barclays Bank plc | NOK | 11,580,000 | USD | 1,348,384 | 1,370,714 | 22,330 | ||||||||
| Peruvian Nouveau Sol/United States Dollar | |||||||||||||||
| 01/20/2022 | Citibank N.A. | PEN | 262,000 | USD | 63,789 | 65,460 | 1,671 | ||||||||
| 01/20/2022 | JPMorgan Chase Bank N.A. | PEN | 1,050,000 | USD | 256,649 | 262,341 | 5,692 | ||||||||
| Romanian Leu/United States Dollar | |||||||||||||||
| 01/18/2022 | Barclays Bank plc | RON | 1,480,000 | USD | 342,879 | 343,855 | 976 | ||||||||
| 01/18/2022 | JPMorgan Chase Bank N.A. | RON | 382,000 | USD | 88,672 | 88,752 | 80 | ||||||||
| South African Rand/United States Dollar | |||||||||||||||
| 12/14/2021 | Barclays Bank plc | ZAR | 16,500,000 | USD | 1,079,222 | 1,074,609 | (4,613 | ) | |||||||
| 01/18/2022 | Citibank N.A. | ZAR | 9,790,000 | USD | 645,964 | 634,666 | (11,298 | ) | |||||||
| 01/18/2022 | JPMorgan Chase Bank N.A. | ZAR | 2,540,000 | USD | 168,118 | 164,663 | (3,455 | ) | |||||||
| South Korean Won/United States Dollar | |||||||||||||||
| 11/10/2021 | Barclays Bank plc | KRW | 106,067,879 | USD | 89,629 | 90,316 | 687 | ||||||||
| Swedish Krona/United States Dollar | |||||||||||||||
| 11/12/2021 | Citibank N.A. | SEK | 11,870,000 | USD | 1,388,304 | 1,382,299 | (6,005 | ) | |||||||
| Swiss Franc/United States Dollar | |||||||||||||||
| 11/10/2021 | Barclays Bank plc | CHF | 63,603 | USD | 68,002 | 69,481 | 1,479 | ||||||||
| 11/10/2021 | Citibank N.A. | CHF | 84,494 | USD | 91,196 | 92,302 | 1,106 | ||||||||
| 11/10/2021 | Goldman Sachs & Co. | CHF | 146,960 | USD | 159,947 | 160,540 | 593 | ||||||||
| 11/10/2021 | JPMorgan Chase Bank N.A. | CHF | 27,129 | USD | 30,021 | 29,636 | (385 | ) | |||||||
| 11/12/2021 | Barclays Bank plc | CHF | 1,676,000 | USD | 1,840,068 | 1,830,978 | (9,090 | ) | |||||||
| 12/20/2021 | Goldman Sachs & Co. | CHF | 135,000 | USD | 146,314 | 147,668 | 1,354 | ||||||||
| Thai Baht/United States Dollar | |||||||||||||||
| 01/18/2022 | Goldman Sachs & Co. | THB | 24,330,000 | USD | 726,867 | 732,928 | 6,061 | ||||||||
| $ 58,480,648 | $ (14,966 | ) | |||||||||||||
See accompanying Notes to Financial Statements.
| 2021 Annual Report | 19 |
Statement of Investments (continued)
October 31, 2021
Aberdeen Global Absolute Return Strategies Fund
| Sale Contracts Settlement Date* | Counterparty | Amount Purchased | Amount Sold | Fair Value | Unrealized Appreciation/ (Depreciation) | ||||||||||
| United States Dollar/Australian Dollar | |||||||||||||||
| 11/10/2021 | Citibank N.A. | USD | 76 | AUD | 105 | $ 79 | $ (3 | ) | |||||||
| 11/10/2021 | Goldman Sachs & Co. | USD | 14,516 | AUD | 19,990 | 15,038 | (522 | ) | |||||||
| 11/10/2021 | JPMorgan Chase Bank N.A. | USD | 31,305 | AUD | 42,269 | 31,798 | (493 | ) | |||||||
| 12/14/2021 | Barclays Bank plc | USD | 437,011 | AUD | 580,000 | 436,371 | 640 | ||||||||
| United States Dollar/Brazilian Real | |||||||||||||||
| 12/14/2021 | Citibank N.A. | USD | 433,621 | BRL | 2,470,000 | 433,950 | (329 | ) | |||||||
| 01/20/2022 | Royal Bank of Canada | USD | 75,187 | BRL | 436,000 | 75,931 | (744 | ) | |||||||
| United States Dollar/British Pound | |||||||||||||||
| 11/10/2021 | Barclays Bank plc | USD | 3,658 | GBP | 2,665 | 3,648 | 10 | ||||||||
| 11/10/2021 | Royal Bank of Canada | USD | 149,371 | GBP | 107,314 | 146,864 | 2,507 | ||||||||
| 11/12/2021 | Citibank N.A. | USD | 1,796,188 | GBP | 1,323,000 | 1,810,576 | (14,388 | ) | |||||||
| 12/10/2021 | Citibank N.A. | USD | 72,539 | GBP | 54,000 | 73,907 | (1,368 | ) | |||||||
| 12/10/2021 | JPMorgan Chase Bank N.A. | USD | 104,661 | GBP | 77,000 | 105,386 | (725 | ) | |||||||
| United States Dollar/Canadian Dollar | |||||||||||||||
| 11/10/2021 | Goldman Sachs & Co. | USD | 222,475 | CAD | 278,117 | 224,723 | (2,248 | ) | |||||||
| 11/10/2021 | JPMorgan Chase Bank N.A. | USD | 9,268 | CAD | 11,626 | 9,394 | (126 | ) | |||||||
| 11/12/2021 | Citibank N.A. | USD | 1,371,524 | CAD | 1,693,000 | 1,367,970 | 3,554 | ||||||||
| United States Dollar/Chinese Renminbi | |||||||||||||||
| 12/01/2021 | Goldman Sachs & Co. | USD | 379,001 | CNY | 2,426,137 | 377,756 | 1,245 | ||||||||
| 12/06/2021 | Goldman Sachs & Co. | USD | 380,791 | CNY | 2,438,700 | 379,547 | 1,244 | ||||||||
| 12/08/2021 | Goldman Sachs & Co. | USD | 4,703,162 | CNY | 30,125,163 | 4,687,773 | 15,389 | ||||||||
| 12/10/2021 | Barclays Bank plc | USD | 2,342,689 | CNY | 15,000,000 | 2,333,770 | 8,919 | ||||||||
| 12/10/2021 | Royal Bank of Canada | USD | 677,779 | CNY | 4,400,000 | 684,572 | (6,793 | ) | |||||||
| United States Dollar/Colombian Peso | |||||||||||||||
| 01/20/2022 | JPMorgan Chase Bank N.A. | USD | 60,264 | COP | 229,000,000 | 60,492 | (228 | ) | |||||||
| United States Dollar/Czech Koruna | |||||||||||||||
| 12/14/2021 | Barclays Bank plc | USD | 435,923 | CZK | 9,640,000 | 433,482 | 2,441 | ||||||||
| 01/18/2022 | HSBC Bank plc | USD | 24,490 | CZK | 542,000 | 24,347 | 143 | ||||||||
| United States Dollar/Euro | |||||||||||||||
| 11/10/2021 | Goldman Sachs & Co. | USD | 2,271,194 | EUR | 1,914,159 | 2,213,096 | 58,098 | ||||||||
| 11/10/2021 | JPMorgan Chase Bank N.A. | USD | 959,698 | EUR | 813,187 | 940,183 | 19,515 | ||||||||
| 11/10/2021 | Royal Bank of Canada | USD | 11,952,423 | EUR | 10,283,270 | 11,889,223 | 63,200 | ||||||||
| 12/10/2021 | Barclays Bank plc | USD | 1,788,237 | EUR | 1,503,062 | 1,739,017 | 49,220 | ||||||||
| 12/10/2021 | Citibank N.A. | USD | 93,921 | EUR | 79,000 | 91,402 | 2,519 | ||||||||
| 12/10/2021 | Goldman Sachs & Co. | USD | 1,390,342 | EUR | 1,200,000 | 1,388,379 | 1,963 | ||||||||
| 12/14/2021 | Barclays Bank plc | USD | 437,224 | EUR | 375,000 | 433,927 | 3,297 | ||||||||
| 01/12/2022 | Citigroup Global Markets Limited | USD | 1,800,000 | EUR | 1,550,189 | 1,795,325 | 4,675 | ||||||||
| 01/12/2022 | Goldman Sachs & Co. | USD | 6,890,000 | EUR | 5,956,511 | 6,898,434 | (8,434 | ) | |||||||
| 01/18/2022 | Goldman Sachs & Co. | USD | 6,850,000 | EUR | 5,921,020 | 6,858,148 | (8,148 | ) | |||||||
| 01/18/2022 | Royal Bank of Canada | USD | 1,841,025 | EUR | 1,589,028 | 1,840,525 | 500 | ||||||||
| United States Dollar/Hong Kong Dollar | |||||||||||||||
| 11/10/2021 | Citibank N.A. | USD | 143,099 | HKD | 1,112,488 | 142,988 | 111 | ||||||||
| 11/10/2021 | Royal Bank of Canada | USD | 32,407 | HKD | 251,854 | 32,371 | 36 | ||||||||
| United States Dollar/Hungarian Forint | |||||||||||||||
| 01/18/2022 | Barclays Bank plc | USD | 47,155 | HUF | 14,800,000 | 47,403 | (248 | ) | |||||||
| United States Dollar/Indian Rupee | |||||||||||||||
| 11/03/2021 | Citibank N.A. | USD | 284,420 | INR | 21,350,000 | 285,043 | (623 | ) | |||||||
| 12/20/2021 | Barclays Bank plc | USD | 157,254 | INR | 11,700,000 | 155,228 | 2,026 | ||||||||
| 01/14/2022 | Citibank N.A. | USD | 45,333 | INR | 3,420,000 | 45,232 | 101 | ||||||||
See accompanying Notes to Financial Statements.
| 20 | 2021 Annual Report |
Statement of Investments (continued)
October 31, 2021
Aberdeen Global Absolute Return Strategies Fund
| Sale Contracts Settlement Date* | Counterparty | Amount Purchased | Amount Sold | Fair Value | Unrealized Appreciation/ (Depreciation) | ||||||||||
| United States Dollar/Indonesian Rupiah | |||||||||||||||
| 12/20/2021 | HSBC Bank plc | USD | 161,257 | IDR | 2,320,000,000 | $ 162,301 | $ (1,044 | ) | |||||||
| 01/20/2022 | HSBC Bank plc | USD | 116,932 | IDR | 1,670,000,000 | 116,440 | 492 | ||||||||
| United States Dollar/Japanese Yen | |||||||||||||||
| 11/10/2021 | Barclays Bank plc | USD | 59,888 | JPY | 6,552,118 | 57,492 | 2,396 | ||||||||
| 11/10/2021 | Citibank N.A. | USD | 14,342 | JPY | 1,575,839 | 13,827 | 515 | ||||||||
| 11/10/2021 | HSBC Bank plc | USD | 682,523 | JPY | 77,410,188 | 679,239 | 3,284 | ||||||||
| 11/10/2021 | JPMorgan Chase Bank N.A. | USD | 429,366 | JPY | 46,845,266 | 411,046 | 18,320 | ||||||||
| 11/10/2021 | Royal Bank of Canada | USD | 291,244 | JPY | 32,021,516 | 280,974 | 10,270 | ||||||||
| 11/12/2021 | JPMorgan Chase Bank N.A. | USD | 1,806,154 | JPY | 205,629,000 | 1,804,324 | 1,830 | ||||||||
| 12/20/2021 | Goldman Sachs & Co. | USD | 1,154,109 | JPY | 131,000,000 | 1,150,058 | 4,051 | ||||||||
| 12/20/2021 | HSBC Bank plc | USD | 455,013 | JPY | 50,000,000 | 438,953 | 16,060 | ||||||||
| 01/26/2022 | Barclays Bank plc | USD | 2,441,166 | JPY | 278,000,000 | 2,441,875 | (709 | ) | |||||||
| United States Dollar/Malaysian Ringgit | |||||||||||||||
| 01/14/2022 | Goldman Sachs & Co. | USD | 32,590 | MYR | 136,000 | 32,745 | (155 | ) | |||||||
| United States Dollar/Mexican Peso | |||||||||||||||
| 12/14/2021 | Goldman Sachs & Co. | USD | 434,542 | MXN | 8,950,000 | 432,000 | 2,542 | ||||||||
| 01/18/2022 | HSBC Bank plc | USD | 124,725 | MXN | 2,560,000 | 122,887 | 1,838 | ||||||||
| United States Dollar/New Russian Ruble | |||||||||||||||
| 12/10/2021 | Goldman Sachs & Co. | USD | 13,516 | RUB | 1,000,000 | 14,023 | (507 | ) | |||||||
| 12/20/2021 | JPMorgan Chase Bank N.A. | USD | 153,054 | RUB | 11,400,000 | 159,436 | (6,382 | ) | |||||||
| 01/20/2022 | Goldman Sachs & Co. | USD | 60,283 | RUB | 4,340,000 | 60,229 | 54 | ||||||||
| United States Dollar/New Taiwan Dollar | |||||||||||||||
| 11/05/2021 | Citibank N.A. | USD | 293,258 | TWD | 8,100,000 | 291,226 | 2,032 | ||||||||
| 11/24/2021 | HSBC Bank plc | USD | 280,337 | TWD | 7,776,000 | 279,734 | 603 | ||||||||
| 12/01/2021 | HSBC Bank plc | USD | 524,552 | TWD | 14,531,501 | 522,951 | 1,601 | ||||||||
| 12/06/2021 | HSBC Bank plc | USD | 378,552 | TWD | 10,461,000 | 376,574 | 1,978 | ||||||||
| 12/08/2021 | HSBC Bank plc | USD | 528,762 | TWD | 14,639,019 | 527,037 | 1,725 | ||||||||
| 12/08/2021 | Royal Bank of Canada | USD | 4,302,369 | TWD | 121,000,000 | 4,356,269 | (53,900 | ) | |||||||
| 12/09/2021 | Goldman Sachs & Co. | USD | 311,683 | TWD | 8,592,480 | 309,367 | 2,316 | ||||||||
| 12/09/2021 | Royal Bank of Canada | USD | 4,266,936 | TWD | 120,000,000 | 4,320,524 | (53,588 | ) | |||||||
| 12/20/2021 | Citibank N.A. | USD | 1,616,488 | TWD | 45,120,000 | 1,625,584 | (9,096 | ) | |||||||
| 01/20/2022 | Goldman Sachs & Co. | USD | 1,222,733 | TWD | 33,800,000 | 1,220,304 | 2,429 | ||||||||
| 01/24/2022 | Goldman Sachs & Co. | USD | 1,223,042 | TWD | 33,800,000 | 1,220,666 | 2,376 | ||||||||
| United States Dollar/New Zealand Dollar | |||||||||||||||
| 12/14/2021 | Barclays Bank plc | USD | 436,190 | NZD | 609,000 | 436,124 | 66 | ||||||||
| United States Dollar/Norwegian Krone | |||||||||||||||
| 11/12/2021 | Citibank N.A. | USD | 1,376,916 | NOK | 11,580,000 | 1,370,714 | 6,202 | ||||||||
| United States Dollar/Peruvian Nouveau Sol | |||||||||||||||
| 01/20/2022 | JPMorgan Chase Bank N.A. | USD | 39,693 | PEN | 158,000 | 39,476 | 217 | ||||||||
| United States Dollar/Polish Zloty | |||||||||||||||
| 12/14/2021 | Citibank N.A. | USD | 798,190 | PLN | 3,170,000 | 793,870 | 4,320 | ||||||||
| United States Dollar/Romanian Leu | |||||||||||||||
| 01/18/2022 | HSBC Bank plc | USD | 43,024 | RON | 184,000 | 42,750 | 274 | ||||||||
| United States Dollar/South African Rand | |||||||||||||||
| 11/10/2021 | Goldman Sachs & Co. | USD | 3,487,670 | ZAR | 52,066,461 | 3,405,657 | 82,013 | ||||||||
| 11/10/2021 | HSBC Bank plc | USD | 940,612 | ZAR | 13,692,277 | 895,609 | 45,003 | ||||||||
| 01/12/2022 | Barclays Bank plc | USD | 1,022,165 | ZAR | 15,400,000 | 999,155 | 23,010 | ||||||||
| 01/12/2022 | Goldman Sachs & Co. | USD | 274,049 | ZAR | 4,194,600 | 272,146 | 1,903 | ||||||||
| 01/18/2022 | Goldman Sachs & Co. | USD | 91,991 | ZAR | 1,360,000 | 88,166 | 3,825 | ||||||||
See accompanying Notes to Financial Statements.
| 2021 Annual Report | 21 |
Statement of Investments (continued)
October 31, 2021
Aberdeen Global Absolute Return Strategies Fund
| Sale Contracts Settlement Date* | Counterparty | Amount Purchased | Amount Sold | Fair Value | Unrealized Appreciation/ (Depreciation) | ||||||||||
| United States Dollar/South Korean Won | |||||||||||||||
| 11/10/2021 | HSBC Bank plc | USD | 92,089 | KRW | 106,375,751 | $ 90,579 | $ 1,510 | ||||||||
| 12/14/2021 | Goldman Sachs & Co. | USD | 435,940 | KRW | 511,000,000 | 434,873 | 1,067 | ||||||||
| United States Dollar/Swedish Krona | |||||||||||||||
| 11/12/2021 | Barclays Bank plc | USD | 1,354,305 | SEK | 11,870,000 | 1,382,299 | (27,994 | ) | |||||||
| United States Dollar/Swiss Franc | |||||||||||||||
| 11/10/2021 | HSBC Bank plc | USD | 150,520 | CHF | 139,451 | 152,337 | (1,817 | ) | |||||||
| 11/10/2021 | JPMorgan Chase Bank N.A. | USD | 200,593 | CHF | 181,042 | 197,772 | 2,821 | ||||||||
| 11/10/2021 | Royal Bank of Canada | USD | 1,781 | CHF | 1,629 | 1,780 | 1 | ||||||||
| 11/12/2021 | Citibank N.A. | USD | 382,192 | CHF | 356,000 | 388,919 | (6,727 | ) | |||||||
| 11/12/2021 | Goldman Sachs & Co. | USD | 1,420,115 | CHF | 1,320,000 | 1,442,059 | (21,944 | ) | |||||||
| 12/20/2021 | Goldman Sachs & Co. | USD | 1,604,170 | CHF | 1,483,100 | 1,622,274 | (18,104 | ) | |||||||
| 01/25/2022 | Goldman Sachs & Co. | USD | 2,413,384 | CHF | 2,220,000 | 2,431,038 | (17,654 | ) | |||||||
| United States Dollar/Thai Baht | |||||||||||||||
| 12/14/2021 | Goldman Sachs & Co. | USD | 532,330 | THB | 17,700,000 | 533,273 | (943 | ) | |||||||
| 01/18/2022 | Goldman Sachs & Co. | USD | 67,106 | THB | 2,240,000 | 67,479 | (373 | ) | |||||||
| $91,029,732 | $ 223,940 | ||||||||||||||
At October 31, 2021, the Fund's open forward foreign cross currency contracts were as follows:
| Purchase / Sale Settlement Date | Counterparty | Amount Purchased | Amount Sold | Contract Value | Fair Value | Unrealized Appreciation/ (Depreciation) | ||||||||||||
| Australian Dollar / New Zealand Dollar | ||||||||||||||||||
| 12/06/2021 | JPMorgan Chase Bank N.A. | AUD | 762,093 | NZD | 793,800 | $ 561,357 | $ 566,162 | $ 4,805 | ||||||||||
| 12/06/2021 | Goldman Sachs & Co. | AUD | 13,141,175 | NZD | 13,920,000 | 9,635,324 | 9,551,944 | (83,380 | ) | |||||||||
| 12/01/2021 | JPMorgan Chase Bank N.A. | AUD | 793,271 | NZD | 826,200 | 584,323 | 589,315 | 4,992 | ||||||||||
| $10,707,421 | $ (73,583 | ) | ||||||||||||||||
| Unrealized appreciation on forward foreign currency exchange contracts | $ 731,411 | |||||||||||||||||
| Unrealized depreciation on forward foreign currency exchange contracts | $(596,020 | ) | ||||||||||||||||
* Certain contracts with different trade dates and like characteristics have been shown net.
At October 31, 2021, the Fund held the following centrally cleared credit default swaps:
| Expiration Date | Notional Amount | Credit Index | Fixed Rate | Implied Credit Spread* | Frequency of Payments Made | Premiums Paid (Received) | Value | Unrealized Appreciation/ (Depreciation) | ||||||||||||||||
| Buy Protection: | ||||||||||||||||||||||||
| 12/20/2026 | 3,900,000 | iTraxx Europe Crossover | Equal to (5.00)% | N/A | Quarterly | $ (517,572 | ) | $ (531,138 | ) | $(13,566 | ) | |||||||||||||
| 12/20/2026 | 3,900,000 | iTraxx Europe Crossover | Equal to (5.00)% | N/A | Quarterly | (510,690 | ) | (531,138 | ) | (20,448 | ) | |||||||||||||
| $(1,028,262 | ) | $(1,062,276 | ) | $(34,014 | ) | |||||||||||||||||||
See accompanying Notes to Financial Statements.
| 22 | 2021 Annual Report |
Statement of Investments (continued)
October 31, 2021
Aberdeen Global Absolute Return Strategies Fund
| Expiration Date | Notional Amount | Credit Index | Fixed Rate | Implied Credit Spread* | Frequency of Payments Made | Premiums Paid (Received) | Value | Unrealized Appreciation/ (Depreciation) | ||||||||||||
| Sell Protection: | ||||||||||||||||||||
| 12/20/2026 | 1,641,210 | CDX.NA.HY | Equal to 5.00% | 3.04% | Quarterly | $ 159,058 | $ 157,053 | $ (2,005 | ) | |||||||||||
| 12/20/2026 | 5,960,000 | CDX.NA.HY | Equal to 5.00% | 3.04% | Quarterly | 511,958 | 570,333 | 58,375 | ||||||||||||
| 12/20/2026 | 2,304,000 | iTraxx Europe Crossover | Equal to 5.00% | 2.62% | Quarterly | 323,574 | 313,780 | (9,794 | ) | |||||||||||
| 12/20/2026 | 8,990,000 | iTraxx Europe Crossover | Equal to 5.00% | 2.62% | Quarterly | 1,112,294 | 1,224,340 | 112,046 | ||||||||||||
| 12/20/2026 | 652,000 | iTraxx Europe Sub Financials | Equal to 1.00% | 1.13% | Quarterly | (4,970 | ) | (4,067 | ) | 903 | ||||||||||
| 12/20/2026 | 2,640,000 | iTraxx Europe Sub Financials | Equal to 1.00% | 1.13% | Quarterly | (26,819 | ) | (16,468 | ) | 10,351 | ||||||||||
| $2,075,095 | $2,244,971 | $169,876 | ||||||||||||||||||
| * | Implied credit spreads, represented in absolute terms, are utilized in determining the market value of credit default swaps agreements on corporate issues or sovereign issues and serve as an indicator of the current status of the payment/performance risk and represent the likelihood or risk of default for the credit derivative. The implied credit spread of particular referenced entity reflects the cost of buying/selling protection and may include upfront payments required to be made prior to entering into the agreement. For credit default swap with asset-backed securities or credit indices as the underlying assets, the quoted market prices and resulting market values serve as an indicator of the current status of the payment/performance risk. Wider credit spreads and increasing market values, in absolute terms when compared to the notional amount of the swap, represent a deterioration of the reference entity's credit soundness and a greater likelihood or risk of default or other credit event occurring as defined under the terms of the agreement. |
At October 31, 2021, the Fund held the following centrally cleared interest rate swaps:
| Currency | Notional Amount | Expiration Date | Receive (Pay) Floating Rate | Floating Rate Index | Fixed Rate | Frequency of Payments Made | Premiums Paid (Received) | Value | Unrealized Appreciation/ (Depreciation) | |||||||||||||
| GBP | 636,000 | 01/15/2026 | Receive | 12-month UK RPI | 3.35% | Annually | $ 66,583 | $ 74,701 | $ 8,118 | |||||||||||||
| GBP | 186,500 | 01/15/2026 | Receive | 12-month UK RPI | 3.35% | Annually | 21,415 | 22,027 | 612 | |||||||||||||
| GBP | 31,700 | 01/15/2026 | Receive | 12-month UK RPI | 3.35% | Annually | 3,619 | 3,723 | 104 | |||||||||||||
| GBP | 284,750 | 01/15/2026 | Receive | 12-month UK RPI | 3.35% | Annually | 19,021 | 33,445 | 14,424 | |||||||||||||
| GBP | 140,250 | 01/15/2026 | Receive | 12-month UK RPI | 3.35% | Annually | 9,861 | 16,473 | 6,612 | |||||||||||||
| GBP | 487,000 | 01/15/2026 | Receive | 12-month UK RPI | 3.35% | Annually | 45,640 | 57,201 | 11,561 | |||||||||||||
| EUR | 492,184 | 03/15/2026 | Receive | 12-month Euro CPI | 1.33% | Annually | – | 30,270 | 30,270 | |||||||||||||
| EUR | 268,604 | 03/15/2026 | Receive | 12-month Euro CPI | 1.44% | Annually | – | 14,742 | 14,742 | |||||||||||||
| EUR | 492,185 | 03/15/2026 | Receive | 12-month Euro CPI | 1.37% | Annually | – | 28,984 | 28,984 | |||||||||||||
| EUR | 492,184 | 03/15/2026 | Receive | 12-month Euro CPI | 1.38% | Annually | – | 28,682 | 28,682 | |||||||||||||
| EUR | 492,185 | 03/15/2026 | Receive | 12-month Euro CPI | 1.38% | Annually | – | 28,757 | 28,757 | |||||||||||||
| EUR | 492,184 | 03/15/2026 | Receive | 12-month Euro CPI | 1.39% | Annually | – | 28,530 | 28,530 | |||||||||||||
| EUR | 402,906 | 03/15/2026 | Receive | 12-month Euro CPI | 1.41% | Annually | – | 22,797 | 22,797 | |||||||||||||
| EUR | 402,906 | 03/15/2026 | Receive | 12-month Euro CPI | 1.41% | Annually | – | 22,734 | 22,734 | |||||||||||||
| EUR | 402,905 | 03/15/2026 | Receive | 12-month Euro CPI | 1.44% | Annually | – | 22,175 | 22,175 | |||||||||||||
| EUR | 268,604 | 03/15/2026 | Receive | 12-month Euro CPI | 1.44% | Annually | – | 14,784 | 14,784 | |||||||||||||
| EUR | 268,603 | 03/15/2026 | Receive | 12-month Euro CPI | 1.43% | Annually | – | 14,825 | 14,825 | |||||||||||||
| EUR | 436,250 | 03/15/2026 | Receive | 12-month Euro CPI | 1.47% | Annually | – | 23,068 | 23,068 | |||||||||||||
| EUR | 17,100,000 | 10/15/2026 | Receive | 12-month Euro CPI | 1.97% | Annually | – | 43,986 | 43,986 | |||||||||||||
| GBP | 724,000 | 10/15/2026 | Receive | 12-month UK RPI | 4.38% | Annually | 12,107 | 14,655 | 2,548 | |||||||||||||
| GBP | 602,000 | 11/15/2029 | Receive | 12-month UK RPI | 3.47% | Annually | 55,303 | 64,961 | 9,658 | |||||||||||||
| GBP | 126,060 | 11/15/2029 | Receive | 12-month UK RPI | 3.47% | Annually | 5,814 | 13,603 | 7,789 | |||||||||||||
| GBP | 127,970 | 11/15/2029 | Receive | 12-month UK RPI | 3.47% | Annually | 6,487 | 13,808 | 7,321 |
See accompanying Notes to Financial Statements.
| 2021 Annual Report | 23 |
Statement of Investments (continued)
October 31, 2021
Aberdeen Global Absolute Return Strategies Fund
| Currency | Notional Amount | Expiration Date | Receive(Pay) Floating Rate | Floating Rate Index | Fixed Rate | Frequency of Payments Made | Premiums Paid (Received) | Value | Unrealized Appreciation/ (Depreciation) | |||||||||||||
| GBP | 127,970 | 11/15/2029 | Receive | 12-month UK RPI | 3.47% | Annually | $ 7,387 | $ 13,809 | $ 6,422 | |||||||||||||
| GBP | 516,000 | 11/15/2029 | Receive | 12-month UK RPI | 3.47% | Annually | (16,912 | ) | 55,681 | 72,593 | ||||||||||||
| GBP | 355,000 | 11/15/2029 | Receive | 12-month UK RPI | 3.47% | Annually | (15,053 | ) | 38,307 | 53,360 | ||||||||||||
| USD | 35,500 | 09/02/2050 | Receive | 12-month CPI | 2.06% | Annually | — | 6,882 | 6,882 | |||||||||||||
| USD | 35,500 | 09/02/2050 | Receive | 12-month CPI | 2.06% | Annually | — | 6,850 | 6,850 | |||||||||||||
| EUR | 685,000 | 06/25/2051 | Receive | 6-month EURIBOR | 0.46% | Semiannually | — | (39,710 | ) | (39,710 | ) | |||||||||||
| EUR | 685,000 | 06/25/2051 | Receive | 6-month EURIBOR | 0.46% | Semiannually | — | (38,900 | ) | (38,900 | ) | |||||||||||
| EUR | 5,480,000 | 10/14/2051 | Receive | 6-month EURIBOR | 0.62% | Semiannually | — | (610,550 | ) | (610,550 | ) | |||||||||||
| $221,272 | $ 71,300 | $ (149,972 | ) | |||||||||||||||||||
| GBP | 1,865,000 | 01/15/2026 | Pay | 12-month UK RPI | 3.35% | Annually | $ — | $ (220,271 | ) | $ (220,271 | ) | |||||||||||
| GBP | 1,865,000 | 01/15/2026 | Pay | 12-month UK RPI | 3.35% | Annually | — | (219,053 | ) | (219,053 | ) | |||||||||||
| EUR | 23,370 | 03/15/2026 | Pay | 12-month Euro CPI | 1.43% | Annually | (298 | ) | (1,290 | ) | (992 | ) | ||||||||||
| EUR | 15,580 | 03/15/2026 | Pay | 12-month Euro CPI | 1.43% | Annually | (198 | ) | (860 | ) | (662 | ) | ||||||||||
| EUR | 38,950 | 03/15/2026 | Pay | 12-month Euro CPI | 1.43% | Annually | (506 | ) | (2,150 | ) | (1,644 | ) | ||||||||||
| MXN | 8,821,913 | 07/29/2026 | Pay | 28 Day TIIE | 6.35% | Monthly | — | (20,631 | ) | (20,631 | ) | |||||||||||
| MXN | 4,389,523 | 07/30/2026 | Pay | 28 Day TIIE | 6.32% | Monthly | — | (10,523 | ) | (10,523 | ) | |||||||||||
| MXN | 4,389,523 | 07/30/2026 | Pay | 28 Day TIIE | 6.33% | Monthly | — | (10,436 | ) | (10,436 | ) | |||||||||||
| MXN | 8,753,327 | 07/30/2026 | Pay | 28 Day TIIE | 6.31% | Monthly | — | (21,203 | ) | (21,203 | ) | |||||||||||
| MXN | 26,345,714 | 07/31/2026 | Pay | 28 Day TIIE | 6.38% | Monthly | — | (58,423 | ) | (58,423 | ) | |||||||||||
| MXN | 217,000,000 | 10/07/2026 | Pay | 28 Day TIIE | 7.18% | Monthly | — | (149,883 | ) | (149,883 | ) | |||||||||||
| GBP | 7,240,000 | 10/15/2026 | Pay | 12-month UK RPI | 4.38% | Annually | — | (146,550 | ) | (146,550 | ) | |||||||||||
| GBP | 2,790,000 | 11/15/2029 | Pay | 12-month UK RPI | 3.47% | Annually | — | (301,063 | ) | (301,063 | ) | |||||||||||
| EUR | 2,025,000 | 06/25/2031 | Pay | 6-month EURIBOR | 0.10% | Semiannually | — | (36,015 | ) | (36,015 | ) | |||||||||||
| EUR | 2,025,000 | 06/25/2031 | Pay | 6-month EURIBOR | 0.10% | Semiannually | — | (37,308 | ) | (37,308 | ) | |||||||||||
| EUR | 15,600,000 | 10/14/2031 | Pay | 6-month EURIBOR | 0.29% | Semiannually | — | 17,357 | 17,357 | |||||||||||||
| GBP | 2,930,000 | 10/15/2031 | Pay | 12-month UK RPI | 4.13% | Annually | — | (32,697 | ) | (32,697 | ) | |||||||||||
| USD | 35,500 | 09/02/2050 | Pay | 12-month CPI | 2.06% | Annually | 955 | (6,882 | ) | (7,837 | ) | |||||||||||
| USD | 35,500 | 09/02/2050 | Pay | 12-month CPI | 2.06% | Annually | 991 | (6,850 | ) | (7,841 | ) | |||||||||||
| EUR | 59,900 | 06/25/2051 | Pay | 6-month EURIBOR | 0.46% | Semiannually | 2,404 | 3,599 | 1,195 | |||||||||||||
| $ 3,348 | $(1,261,132 | ) | $(1,264,480 | ) | ||||||||||||||||||
| $224,620 | $(1,189,832 | ) | $(1,414,452 | ) | ||||||||||||||||||
At October 31, 2021, the Fund held the following over-the-counter total return swaps:
| Currency | Notional Amount | Expiration Date | Receive (Pay) Total Return of Equity Index | Equity Security | Floating Rate Index | Frequency of Payments Made | Value | Unrealized Appreciation/ (Depreciation) | ||||||||||
| USD | 360,239 | 12/17/2021 | Receive | MSCI China A Index | 1-month LIBOR | Monthly | $ 4,849 | $ 4,849 | ||||||||||
| USD | 2,628,965 | 01/25/2022 | Receive | MSCI China A Index | 1-month LIBOR | Monthly | (36,511 | ) | (36,511 | ) | ||||||||
| $(31,662 | ) |
See accompanying Notes to Financial Statements.
| 24 | 2021 Annual Report |
Statement of Investments (continued)
October 31, 2021
Aberdeen Global Absolute Return Strategies Fund
At October 31, 2021, the Fund held the following purchased options:
| Description | Expiration Date | Exercise Price | Contracts | Notional Amount | Cost | Value | Unrealized Value | |||||||||||||||||||
| CALL OPTIONS PURCHASED (0.0%) | ||||||||||||||||||||||||||
| Index Options (0.0%) | ||||||||||||||||||||||||||
| CBOE Volatility Index | 11/17/2021 | 22 | 28 | 61,600 | $13,356 | $ 3,024 | $ (10,332 | ) | ||||||||||||||||||
| CBOE Volatility Index | 11/17/2021 | 26 | 3 | 7,800 | 1,034 | 210 | (824 | ) | ||||||||||||||||||
| CBOE Volatility Index | 12/22/2021 | 20 | 23 | 46,000 | 11,442 | 7,820 | (3,622 | ) | ||||||||||||||||||
| CBOE Volatility Index | 12/22/2021 | 25 | 2 | 5,000 | 713 | 440 | (273 | ) | ||||||||||||||||||
| CBOE Volatility Index | 01/19/2022 | 27 | 39 | 105,300 | 15,463 | 10,530 | (4,933 | ) | ||||||||||||||||||
| CBOE Volatility Index | 01/19/2022 | 33 | 5 | 16,500 | 1,473 | 1,000 | (473 | ) | ||||||||||||||||||
| CBOE Volatility Index | 02/16/2022 | 26 | 25 | 65,000 | 8,913 | 8,750 | (163 | ) | ||||||||||||||||||
| $31,774 | $(20,620 | ) | ||||||||||||||||||||||||
| PUT OPTIONS PURCHASED (0.0%) | ||||||||||||||||||||||||||
| Index Options (0.0%) | ||||||||||||||||||||||||||
| CAC 40 Index | 11/19/2021 | 6,000 | 2 | 120,000 | $ 206 | $ 206 | $ – | |||||||||||||||||||
| DAX Index | 11/19/2021 | 14,150 | 1 | 70,750 | 135 | 135 | – | |||||||||||||||||||
| FTSE 100 Index | 11/19/2021 | 6,575 | 1 | 65,750 | 104 | 104 | – | |||||||||||||||||||
| Nikkei 225 Future | 11/12/2021 | 27,375 | 1 | 27,375,000 | 910 | 910 | – | |||||||||||||||||||
| S&P 500 Index | 11/19/2021 | 4,050 | 1 | 405,000 | 452 | 452 | – | |||||||||||||||||||
| S&PASX 200 Index | 11/18/2021 | 6,650 | 4 | 266,000 | 169 | 169 | – | |||||||||||||||||||
| $ 1,976 | $ – | |||||||||||||||||||||||||
At October 31, 2021, the Fund held the following written options:
| Description | Notional Amount | Cost | Value | Unrealized Value | ||||||||
| CALL OPTIONS WRITTEN (0.1%) | ||||||||||||
| Swaptions (0.1%) | ||||||||||||
| 10 year Interest Rate Swap Call, expiring 11/5/2021, Pay 0.45%, Receive 3-month LIBOR | (1,235,000 | ) | $ (5,557 | ) | $ – | $ 5,557 | ||||||
| 10 year Interest Rate Swap Call, expiring 3/28/2022, Pay 0.45%, Receive 3-month LIBOR | (1,200,000 | ) | (5,500 | ) | (4,837 | ) | 663 | |||||
| 10 year Interest Rate Swap Call, expiring 4/12/2022, Pay 0.45%, Receive 3-month LIBOR | (18,150,000 | ) | (80,084 | ) | (99,993 | ) | (19,909 | ) | ||||
| $(104,830 | ) | $(13,689 | ) |
| Description | Expiration Date | Exercise Price | Contracts | Notional Amount | Cost | Value | Unrealized Value | |||||||||||||
| PUT OPTIONS WRITTEN (0.2%) | ||||||||||||||||||||
| Index Options (0.1%) | ||||||||||||||||||||
| CAC 40 Index | 11/19/2021 | 6,000 | (2 | ) | (120,000 | ) | $ (1,462 | ) | $ (145 | ) | $ 1,317 | |||||||||
| CAC 40 Index | 12/17/2021 | 6,300 | (13 | ) | (819,000 | ) | (7,690 | ) | (6,234 | ) | 1,456 | |||||||||
| DAX Index | 11/19/2021 | 14,150 | (1 | ) | (70,750 | ) | (1,026 | ) | (112 | ) | 914 | |||||||||
| DAX Index | 12/17/2021 | 14,500 | (12 | ) | (870,000 | ) | (7,573 | ) | (7,573 | ) | – | |||||||||
| FTSE 100 Index | 11/19/2021 | 6,575 | (1 | ) | (65,750 | ) | (746 | ) | (82 | ) | 664 | |||||||||
| FTSE 100 Index | 12/17/2021 | 6,700 | (11 | ) | (737,000 | ) | (5,252 | ) | (4,591 | ) | 661 | |||||||||
| Nikkei 225 Future | 11/12/2021 | 27,375 | (1 | ) | (27,375,000 | ) | (2,287 | ) | (869 | ) | 1,418 | |||||||||
| Nikkei 225 Future | 12/10/2021 | 26,625 | (6 | ) | (159,750,000 | ) | (10,139 | ) | (11,581 | ) | (1,442 | ) | ||||||||
| S&P 500 Index | 11/19/2021 | 4,050 | (1 | ) | (405,000 | ) | (4,840 | ) | (410 | ) | 4,430 | |||||||||
| S&P 500 Index | 11/30/2021 | 4,080 | (3 | ) | (1,224,000 | ) | (13,766 | ) | (2,340 | ) | 11,426 | |||||||||
| S&P 500 Index | 12/17/2021 | 4,250 | (7 | ) | (2,795,000 | ) | (22,760 | ) | (22,760 | ) | – | |||||||||
| S&P 500 Index | 12/31/2021 | 3,885 | (3 | ) | (1,165,500 | ) | (16,436 | ) | (4,755 | ) | 11,681 |
See accompanying Notes to Financial Statements.
| 2021 Annual Report | 25 |
Statement of Investments (concluded)
October 31, 2021
Aberdeen Global Absolute Return Strategies Fund
| Description | Expiration Date | Exercise Price | Contracts | Notional Amount | Cost | Value | Unrealized Value | |||||||||||||
| S&PASX 200 Index | 11/18/2021 | 6,650 | (4 | ) | (266,000 | ) | $ (1,356 | ) | $ (328 | ) | $ 1,028 | |||||||||
| S&PASX 200 Index | 12/16/2021 | 6,875 | (29 | ) | (1,993,750 | ) | (6,083 | ) | (11,824 | ) | (5,741 | ) | ||||||||
| $(73,604 | ) | $27,812 |
| Description | Notional Amount | Cost | Value | Unrealized Value | ||||||||
| Swaptions (0.1%) | ||||||||||||
| 10 year Interest Rate Swap Put, expiring 11/5/2021, Pay 3-month LIBOR, Receive 0.67% | (1,235,000 | ) | $ (8,213 | ) | $ – | $ 8,213 | ||||||
| 10 year Interest Rate Swap Put, expiring 3/28/2022, Pay 3-month LIBOR, Receive 0.54% | (1,200,000 | ) | (6,500 | ) | (5,838 | ) | 662 | |||||
| 10 year Interest Rate Swap Put, expiring 4/12/2022, Pay 3-month LIBOR, Receive 0.57% | (18,150,000 | ) | (103,231 | ) | (85,942 | ) | 17,289 | |||||
| $ (91,780 | ) | $26,164 | ||||||||||
| $(165,384 | ) | $53,976 |
See accompanying Notes to Financial Statements.
| 26 | 2021 Annual Report |
Aberdeen Intermediate Municipal Income Fund (Unaudited)
Aberdeen Intermediate Municipal Income Fund returned 3.90% (institutional class shares net of fees) for the 12-month reporting period ended October 31, 2021, versus the 2.33% return of its benchmark, the ICE Bank of America (BofA) 1-22 Year U.S. Municipal Securities Index, during the same period.
Market/economic review
The overall U.S. municipal (muni) bond market generated a positive return during the reporting period, with the Bloomberg Municipal Bond Index,1 a broad municipal bond market benchmark, gaining 2.64%, while the corporate taxable bond market, as measured by the Bloomberg U.S. Aggregate Bond Index,2 returned –0.48%.
Both the muni and taxable bond markets faced headwinds from rising interest rates. They moved higher as the economy rebounded from its pandemic-induced downturn, inflation increased and the U.S. Federal Reserve (Fed) indicated that it would soon begin tapering back its accommodative monetary policy. While the muni market generated positive returns during eight of the 12 months of the reporting period, a portion of its gains were given back during several periods of weakness.
Fund performance
The Fund outperformed its benchmark, the ICE BofA 1-22 Year Municipal Securities Index, over the 12-month period ended October 31, 2021. The Fund's relatively lower credit-quality positioning was a tailwind for results, as certain medium-grade (BBB-), high-grade (A-) and not-rated3 securities outperformed. We continue to focus on adding what we believe is prudent yield to the Fund without taking on significant duration4 risk, while we are targeting overall strong credit quality. Fund performance also was enhanced by allocations to the hospitals, mass/rapid transit, charter schools and senior housing bond sectors. On the downside, the Fund's positions in state general obligation, toll roads, income tax financing and airport bond sectors detracted from performance.
Market outlook
Following the recent passage of the Infrastructure Investment and Jobs Act, which includes more than $500 billion in new infrastructure spending, we have become slightly more optimistic on municipal credit fundamentals and overall performance. The bill did not contain some key measures that would have resulted in possible headwinds to municipal performance in 2022, such as reintroduction of advanced
refunding, which could have resulted in a substantial uptick in supply. Additionally, we believe the increase in federal spending on infrastructure should lighten the load for both state and local municipalities as they pay for infrastructure needs. However, despite our near-term optimism, we believe that prudent investors should still exercise caution with a broad-based approach to the space, as the potential passage of the Build Back Better bill, which focuses more on social infrastructure spending, could yet result in headwinds to municipal performance as we get into the next year. Additionally, the threat of more persistent inflation and a change to Fed policy remains a risk to fixed income further out on the yield curve.
We maintain our expectation for a slight supply pickup in the fourth quarter of 2021, which could continue into 2022, although not to the degree it could have if issuers had been able to make use of tax-exempt advanced refunding. The recent passage of a $1.2 trillion infrastructure agreement should only modestly increase muni supply over the medium term, in our opinion. While this uptick in supply could create a slight headwind for the space, we expect municipal demand to remain positive through much of the first quarter of 2022.
Despite strong municipal fundamentals and near-term technicals that seem rather sanguine, we expect the Treasury yield curve to continue to steepen and shift upward as the Fed rolls back quantitative easing and looks to start tightening rates. This could continue to put pressure on the municipal curve to shift, thus hampering total returns. Nonetheless, we believe short-term muni rates will remain anchored at the front end of the yield curve, with a steepening curve into 2022 until the Fed signals an interest-rate hike. However, it is worth noting that, as of the end of the reporting period, nine of the 18 Federal Open Market Committee (FOMC) participants expect an interest-rate hike in 2022, and the markets have priced in a rate increase in June/July 2022.
For these reasons, while we expect the fundamental backdrop for municipalities to remain largely favorable and near-term technicals to remain slightly bullish, we believe overall muni market performance could be pressured should inflation persist. We still see opportunities in select issuers that we believe will benefit as the economy continues to rebound, particularly in sectors such as higher education, transportation, and senior living. In terms of yield-curve positioning, we still believe that retaining the Fund's conservative weighting maintains a more stable net asset value (NAV) headed into what could be a higher interest-rate environment. With a relatively shorter duration to the benchmark, we believe that the Fund should be insulated from sharp movements in its NAV.
| 1 | The Bloomberg Municipal Bond Index tracks the performance of investment-grade, tax-exempt bonds with a maturity of at least one year. Indexes are unmanaged and have been provided for comparison purposes only. No fees or expenses are reflected. You cannot invest directly in an index. | |
| 2 | The Bloomberg U.S. Aggregate Bond Index is a broad-based flagship benchmark that measures the investment-grade, U.S. dollar-denominated, fixed-rate taxable bond market. | |
| 3 | S&P Global Ratings' credit ratings express the agency's opinion about the ability and willingness of an issuer, such as a corporation or state or city government, to meet its financial obligations in full and on time. Typically, ratings are expressed as letter grades that range, for example, from AAA to D to communicate the agency's opinion of relative level of credit risk. Ratings from AA to CCC may be modified by the addition of a plus (+) or minus (-) sign to show relative standing within the major rating categories. | |
| 4 | Duration is an estimate of bond price sensitivity to changes in interest rates. The higher the duration, the greater the change (i.e., higher risk) in relation to interest-rate movements. |
| 2021 Annual Report | 27 |
Aberdeen Intermediate Municipal Income Fund (Unaudited) (concluded)
Against this backdrop, we expect to maintain the Fund's credit mix in an effort to maintain a high distribution yield5 and hedge some risks to the various outcomes that we see on the horizon. Additionally, we do not expect to extend the Fund's duration significantly over the medium term. However, given the market's short-term dynamics, the Fund's duration may increase somewhat, reflecting the impact of the additions of positions in credits that we believe will provide opportunistic investments.
Portfolio Management:
U.S. Municipal Team
PAST PERFORMANCE DOES NOT GUARANTEE FUTURE RESULTS.
The performance data quoted represents past performance and current returns may be lower or higher. Class A Shares have up to a 2.50% front-end sales charge and a 0.25% 12b-1 fee. The investment return and principal value will fluctuate so that an investor's shares, when redeemed, may be worth more or less than the original cost. To obtain performance information current to the most recent month-end, which may be higher or lower than the performance shown above, please call 866-667-9231 or go to https://www.abrdn.com/en-us/us/investor/fund-centre.
Investing in mutual funds involves risk, including the possible loss of principal.
Indexes are unmanaged and have been provided for comparison purposes only. No fees or expenses are reflected. You cannot invest directly in an index.
Risk Considerations
Deteriorating market conditions might cause a general weakness in the market that reduces the prices, or yield, of securities in those markets in which the Fund invests.
Fixed income securities are subject to, among other risks, credit risk, extension risk, issuer risk, interest rate risk, market risk and prepayment risk.
The Fund is subject to the risk that the Adviser or Subadviser may make poor security selections.
Municipal bonds can be significantly affected by political and economic changes, including inflation, as well as uncertainties in the municipal market related to taxation, legislative changes, or the rights of municipal security holders.
Please read the prospectus for more detailed information regarding these and other risks.
| 5 | The distribution yield reflects the amounts that may be expected to be distributed over the next 12 months as a percentage of the fund's share price on a particular date. |
| 28 | 2021 Annual Report |
Aberdeen Intermediate Municipal Income Fund (Unaudited)
| Average Annual Total Return1 (For periods ended October 31, 2021) | 1 Yr. | 5 Yr. | 10 Yr. | ||||||
| Class A | w/o SC | 3.62% | 2.28% | 2.77% | |||||
| w/SC2 | 1.03% | 1.76% | 2.52% | ||||||
| Class C | w/o SC | 2.87% | 1.53% | 2.01% | |||||
| w/SC3 | 1.87% | 1.53% | 2.01% | ||||||
| Institutional Service Class4 | w/o SC | 3.90% | 2.52% | 3.03% | |||||
| Institutional Class4,5 | w/o SC | 3.90% | 2.55% | 3.04% |
All figures showing the effect of a sales charge (SC) reflect the maximum charge possible because it has the most significant effect on performance data. The total returns shown above do not include the impact of financial statement rounding of the net asset value (NAV) per share and/or financial statement adjustments.
| 1 | The Fund changed its investment strategy effective February 28, 2019. Performance information for periods prior to February 28, 2019 does not reflect such investment policy. An unaffiliated party served as the subadviser for the Fund from June 23, 2008 to February 27, 2011. Please consult the Fund's prospectus for more detail. |
| 2 | A 2.50% front-end sales charge was deducted. Prior to February 28, 2019 the front-end sales charge was 4.25%. |
| 3 | A 1.00% contingent deferred sales charge (CDSC) was deducted from the one year return because it is charged when Class C shares are sold within the first year after purchase. |
| 4 | Not subject to any sales charge. Returns before the first offering of the Institutional Class and Institutional Service Class shares (February 25, 2013) are based on the previous performance of Class D shares. Returns of each class have not been adjusted to reflect the expenses applicable to the respective classes. Excluding the effect of any fee waivers or reimbursements, this performance is substantially similar to what the Institutional Service Class, and Institutional Class shares would have produced because all classes invest in the same portfolio of securities. Returns for the Institutional Service Class, and Institutional Class shares would only differ to the extent of the differences in expenses of the classes. |
| 5 | Effective February 25, 2013, all Class D shares of the Fund were converted into Institutional Class shares of the Fund. |
Performance of a $10,000 Investment (as of October 31, 2021)

Comparative performance of $10,000 invested in Class A shares of the Aberdeen Intermediate Municipal Income Fund, the ICE BofA 1-22 Year U.S. Municipal Securities Index and the Consumer Price Index (CPI) over a 10-year period ended October 31, 2021. Unlike the Fund, the returns for these unmanaged indexes do not reflect any fees, expenses, or sales charges. Investors cannot invest directly in market indexes.
The ICE BofA 1-22 Year U.S. Municipal Securities Index is a subset of the ICE BofA Merrill Lynch U.S. Municipal Securities Index including all securities with a remaining term to final maturity less than 22 years, calculated on a total return basis. The ICE BofA U.S. Municipal Securities Index tracks the performance of U.S. dollar-denominated investment grade tax-exempt debt publicly issued by U.S. states and territories, and their political subdivisions, in the U.S. domestic market.
The CPI is a measure of the average change over time in the prices paid by urban consumers for a market basket of consumer goods and services.
Investment return and principal value will fluctuate, and when redeemed, shares may be worth more or less than original cost. Past performance is no guarantee of future results. The Average Annual Total Return table and Performance graph do not reflect the deduction of taxes that a shareholder would pay on fund distributions or the redemption of fund shares. Investing in mutual funds involves market risk, including loss of principal. Performance returns assume the reinvestment of all distributions. Total returns reflect waivers and reimbursements in effect, without which returns would have been lower.
| 2021 Annual Report | 29 |
Aberdeen Intermediate Municipal Income Fund (Unaudited)
Portfolio Summary (as a percentage of net assets)
October 31, 2021 (Unaudited)
| Asset Allocation | ||||
| Municipal Bonds | 98.8 | % | ||
| Short-Term Investment | 0.1 | % | ||
| Other Assets in Excess of Liabilities | 1.1 | % | ||
| 100.0 | % | |||
| Top Holdings* | ||||
| Harris County Health Facilities Development Corp. Revenue Bonds (SCH Health Care System), Prerefunded/Escrowed to Maturity, Series B 07/01/2027 | 9.1 | % | ||
| New Jersey Transportation Trust Fund Authority Revenue Bonds, Series A 12/15/2034 | 4.0 | % | ||
| Maryland Industrial Development Financing Authority Revenue Bonds (Occidental Petroleum Corp.) 03/01/2030 | 3.3 | % | ||
| Metropolitan Government Nashville & Davidson Health & Educational Facilities Revenue Bonds (Trevecca Nazarene University Project) 10/01/2041 | 2.4 | % | ||
| Metropolitan Transportation Authority Revenue Bonds, Series C-1 11/15/2027 | 2.2 | % | ||
| Texas Municipal Gas Acquisition & Supply Corp. I Revenue Bonds, Series D 12/15/2026 | 2.2 | % | ||
| State Health & Educational Facilities Authority Revenue Bonds, Series F 07/01/2027 | 2.1 | % | ||
| Ohio Higher Educational Facility Commission Revenue Bonds 07/01/2030 | 2.1 | % | ||
| New York State Dormitory Authority Revenue Bonds (State University Educational Facilities 3rd Generation), Series A 05/15/2023 | 2.1 | % | ||
| Hudson Yards Infrastructure Corp. Revenue Bonds, Series A 02/15/2042 | 1.9 | % | ||
| Other | 68.6 | % | ||
| 100.0 | % | |||
| * | For the purpose of listing top holdings, Short-Term Investments are included as part of Other. |
| Top States | ||||
| Texas | 18.3 | % | ||
| New York | 14.8 | % | ||
| Florida | 9.7 | % | ||
| New Jersey | 5.1 | % | ||
| Tennessee | 4.9 | % | ||
| Wisconsin | 4.5 | % | ||
| Pennsylvania | 4.0 | % | ||
| Michigan | 3.8 | % | ||
| California | 3.6 | % | ||
| Maryland | 3.3 | % | ||
| Other | 28.0 | % | ||
| 100.0 | % | |||
| 30 | 2021 Annual Report |
Statement of Investments
October 31, 2021
Aberdeen Intermediate Municipal Income Fund
| Shares or Principal Amount | Value (US$) | |||
| MUNICIPAL BONDS (98.8%) | ||||
| Alabama (1.7%) | ||||
| Black Belt Energy Gas District Revenue Bonds, Series A, 4.00%, 08/01/2047 (a) | $1,000,000 | $ 1,020,200 | ||
| California (3.6%) | ||||
| Bay Area Toll Authority Revenue Bonds, Series A, 2.95%, 04/01/2047 (a) | 350,000 | 378,245 | ||
| Los Angeles Community College District General Obligation Unlimited Bonds, Series I, 4.00%, 08/01/2029 | 400,000 | 461,704 | ||
| M-S-R Energy Authority Gas Revenue Bonds Series B, 6.13%, 11/01/2029 | 490,000 | 604,105 | ||
| Series A, 6.50%, 11/01/2039 | 500,000 | 780,737 | ||
| 2,224,791 | ||||
| Colorado (0.3%) | ||||
| Colorado Educational & Cultural Facilities Authority Revenue Bonds (Aspen View Academy), 4.00%, 05/01/2041 | 170,000 | 186,905 | ||
| Connecticut (2.1%) | ||||
| State Health & Educational Facilities Authority Revenue Bonds, Series F, 5.00%, 07/01/2027 | 1,135,000 | 1,309,396 | ||
| District of Columbia (1.0%) | ||||
| Washington Convention & Sports Authority Revenue Bonds, Series A, 5.00%, 10/01/2030 | 500,000 | 602,445 | ||
| Florida (9.7%) | ||||
| City of Lakeland Revenue Bonds, Series B, AMT, 5.00%, 10/01/2028 | 565,000 | 691,050 | ||
| City of Tampa Revenue Bonds (Baycare Health Care System), Series A, 4.00%, 11/15/2033 | 1,000,000 | 1,016,025 | ||
| Florida Development Finance Corp. Revenue Bonds (Glenridge On Palmer Ranch), 5.00%, 06/01/2035 | 225,000 | 258,996 | ||
| Florida Development Finance Corp. Revenue Bonds (Global Outreach Charter AC), Series A, 4.00%, 06/30/2041 (b) | 765,000 | 821,372 | ||
| Florida Development Finance Corp. Revenue Bonds (Imagine School at Broward), 5.00%, 12/15/2039 (b) | 500,000 | 578,190 | ||
| Palm Beach County Educational Facilities Authority Revenue Bonds (Palm Beach Atlantic University, Inc.) 4.00%, 10/01/2027 | 260,000 | 294,554 | ||
| 4.00%, 10/01/2028 | 270,000 | 308,814 | ||
| Palm Beach County Revenue Bonds (Provident Group – LU Properties LLC – LYNN University Housing Project), Series A, 5.00%, 06/01/2057 (b) | 600,000 | 699,808 | ||
| Polk County Industrial Development Authority Revenue Bonds (Carpenter's Home Estates, Inc. Project), 5.00%, 01/01/2039 | 160,000 | 176,760 | ||
| St Johns County Industrial Development Authority Revenue Bonds (Vicar's Landing Project), 4.00%, 12/15/2041 | 750,000 | 815,690 | ||
| Shares or Principal Amount | Value (US$) | |||
| Volusia County Educational Facility Authority Revenue Bonds, Series B, 5.00%, 10/15/2023 | $ 250,000 | $ 272,339 | ||
| 5,933,598 | ||||
| Georgia (1.4%) | ||||
| Development Authority of Monroe County Revenue Bonds (Georgia Power Co.), VRDN, 0.10%, 11/01/2048 (a) | 500,000 | 500,000 | ||
| Main Street Natural Gas, Inc. Revenue Bonds, Series A, 5.00%, 05/15/2035 | 250,000 | 336,700 | ||
| 836,700 | ||||
| Hawaii (1.1%) | ||||
| City & County Honolulu HI Wastewater System Revenue Bonds, Series A, 5.00%, 07/01/2047 | 560,000 | 669,227 | ||
| Illinois (1.7%) | ||||
| Illinois Finance Authority Revenue Bonds (Plymouth Place Obligated Group), 5.00%, 05/15/2041 | 200,000 | 234,012 | ||
| State of Illinois General Obligation Unlimited Bonds, Series D, 5.00%, 11/01/2021 | 815,000 | 815,000 | ||
| 1,049,012 | ||||
| Indiana (1.3%) | ||||
| Indiana Finance Authority Revenue Bonds (Earlham College, Inc.), 5.00%, 10/01/2032 | 750,000 | 791,538 | ||
| Kentucky (0.9%) | ||||
| Kentucky Public Energy Authority Revenue Bonds, Series A, 4.00%, 04/01/2048 (a) | 500,000 | 537,736 | ||
| Louisiana (2.1%) | ||||
| Louisiana Local Government Environmental Facilities & Community Development Authority Revenue Bonds (Glen Retirement System), Series A 5.00%, 01/01/2022 | 160,000 | 160,267 | ||
| 5.00%, 01/01/2023 | 170,000 | 171,963 | ||
| Louisiana Public Facilities Authority Revenue Bonds, (Pre-refunded @ $100, 05/15/2026), 3.00%, 05/15/2031 | 10,000 | 10,946 | ||
| New Orleans Aviation Board Revenue Bonds (Louis Armstrong International Airport), 5.00%, 01/01/2028 | 500,000 | 616,393 | ||
| New Orleans Aviation Board Revenue Bonds (Parking Facilities Corp.), 5.00%, 10/01/2027 | 250,000 | 305,785 | ||
| 1,265,354 | ||||
| Maryland (3.3%) | ||||
| Maryland Industrial Development Financing Authority Revenue Bonds (Occidental Petroleum Corp.), 1.00%, 03/01/2030 (a) | 2,000,000 | 2,000,000 | ||
| Massachusetts (1.0%) | ||||
| Massachusetts Development Finance Agency Revenue Bonds, Series A, 5.00%, 07/01/2036 | 500,000 | 608,050 | ||
See accompanying Notes to Financial Statements.
| 2021 Annual Report | 31 |
Statement of Investments (continued)
October 31, 2021
Aberdeen Intermediate Municipal Income Fund
| Shares or Principal Amount | Value (US$) | |||
| MUNICIPAL BONDS (continued) | ||||
| Michigan (3.8%) | ||||
| Flint Hospital Building Authority Revenue Bonds 4.00%, 07/01/2035 | $ 1,000,000 | $ 1,143,398 | ||
| 4.00%, 07/01/2038 | 750,000 | 850,940 | ||
| Michigan Finance Authority Revenue Bonds (Cesar Chavez Academy), 3.25%, 02/01/2024 | 295,000 | 300,967 | ||
| 2,295,305 | ||||
| Mississippi (1.5%) | ||||
| Mississippi Business Finance Corp. Revenue Bonds (Mississippi Power Co.), AMT, 0.08%, 07/01/2025 (a) | 900,000 | 900,000 | ||
| Missouri (0.4%) | ||||
| Plaza at Noah's Ark Community Improvement District Revenue Bonds, 3.00%, 05/01/2022 | 60,000 | 60,301 | ||
| State Health & Educational Facilities Authority Revenue Bond (Bethesda Health Group, Inc.), 4.00%, 08/01/2036 | 165,000 | 192,816 | ||
| 253,117 | ||||
| New Hampshire (1.0%) | ||||
| New Hampshire Health & Education Facilities Authority Revenue Bonds (Dartmouth College) 5.00%, 08/01/2035 | 250,000 | 304,214 | ||
| 5.00%, 08/01/2036 | 245,000 | 297,840 | ||
| 602,054 | ||||
| New Jersey (5.1%) | ||||
| New Jersey Educational Facilities Authority Revenue Bonds (The College of New Jersey) Series F (Pre-refunded @ $100, 07/01/2026), 4.00%, 07/01/2033 | 70,000 | 80,591 | ||
| Series F, 4.00%, 07/01/2033 | 30,000 | 33,417 | ||
| New Jersey Transportation Trust Fund Authority Revenue Bonds, Series A, 5.00%, 12/15/2034 | 2,000,000 | 2,440,573 | ||
| Newark Housing Authority Revenue Bonds (Newark Redevelopment Project), 4.00%, 01/01/2037 | 500,000 | 552,442 | ||
| 3,107,023 | ||||
| New York (14.8%) | ||||
| City of Elmira General Obligation Limited Bonds 5.00%, 07/01/2025 (b) | 85,000 | 97,437 | ||
| 5.00%, 07/01/2033 (b) | 625,000 | 737,964 | ||
| City of Poughkeepsie General Obligation Limited Bonds, 5.00%, 06/01/2031 | 145,000 | 164,704 | ||
| Hudson Yards Infrastructure Corp. Revenue Bonds, Series A, 5.00%, 02/15/2042 | 1,000,000 | 1,176,305 | ||
| Metropolitan Transportation Authority Revenue Bonds Series C-1, 5.00%, 11/15/2027 | 1,150,000 | 1,333,953 | ||
| Series A-1, 5.00%, 11/15/2027 | 695,000 | 813,158 | ||
| Series A-2, VRN, 5.00%, 11/15/2045 (a) | 400,000 | 505,061 | ||
| Nassau County Local Economic Assistance Corp. Revenue Bonds (Catholic Health Services), 5.00%, 07/01/2030 | 1,000,000 | 1,111,078 | ||
| Shares or Principal Amount | Value (US$) | |||
| New York City Water & Sewer System Revenue Bonds, Series EE, 5.00%, 06/15/2037 | $ 295,000 | $ 355,739 | ||
| New York State Dormitory Authority Revenue Bonds (State University Educational Facilities 3rd Generation), Series A, 5.50%, 05/15/2023 | 1,160,000 | 1,253,855 | ||
| New York Transportation Development Corp. Revenue Bonds, AMT, 4.00%, 10/31/2034 | 250,000 | 291,095 | ||
| Port Authority of New York & New Jersey Revenue Bonds, AMT, 5.00%, 07/15/2033 | 400,000 | 506,151 | ||
| Port Authority of New York & New Jersey Revenue Bonds, 5.00%, 10/15/2042 | 560,000 | 668,849 | ||
| 9,015,349 | ||||
| Ohio (2.6%) | ||||
| Buckeye Tobacco Settlement Financing Authority Tobacco Settlement Assets-Backed Revenue Bonds, 5.00%, 06/01/2055 | 110,000 | 123,435 | ||
| Ohio Air Quality Development Authority Revenue Bonds (Ohio Valley Electric Corp. Project), Series A, 3.25%, 09/01/2029 | 135,000 | 143,928 | ||
| Ohio Higher Educational Facility Commission Revenue Bonds, 4.00%, 07/01/2030 | 1,095,000 | 1,306,237 | ||
| 1,573,600 | ||||
| Pennsylvania (4.0%) | ||||
| Montgomery County Industrial Development Authority Revenue Bonds (Imagine School at Broward), 4.00%, 12/01/2037 | 300,000 | 333,964 | ||
| Pennsylvania Turnpike Commission Revenue Bonds, Series A, 5.25%, 07/15/2029 | 850,000 | 1,106,476 | ||
| School Dist. of the City of Erie, General Obligation Limited Bonds, Series A, (AGM State Aid Withholding), 5.00%, 04/01/2034 | 825,000 | 1,024,930 | ||
| 2,465,370 | ||||
| Puerto Rico (2.1%) | ||||
| Commonwealth of Puerto Rico General Obligation Unlimited Bonds, Series A, (AGM), 5.25%, 07/01/2024 | 615,000 | 620,710 | ||
| Commonwealth of Puerto Rico Public Improvement General Obligation Unlimited Bonds, (AGC-ICC), 5.50%, 07/01/2022 | 250,000 | 252,711 | ||
| Electric Power Authority Revenue Bonds, Series V, 5.25%, 07/01/2026 | 100,000 | 107,070 | ||
| Highway & Transportation Authority Revenue Bonds, (AGC), 5.50%, 07/01/2031 | 300,000 | 337,098 | ||
| 1,317,589 | ||||
| Rhode Island (1.3%) | ||||
| Tobacco Settlement Financing Corp. Revenue Bonds, Series B, 4.50%, 06/01/2045 | 750,000 | 805,318 | ||
| South Carolina (1.9%) | ||||
| City of Rock Hill SC Combined Utility System Revenue Bonds 5.00%, 01/01/2025 | 500,000 | 568,377 | ||
| 5.00%, 01/01/2026 | 500,000 | 586,165 | ||
| 1,154,542 | ||||
See accompanying Notes to Financial Statements.
| 32 | 2021 Annual Report |
Statement of Investments (concluded)
October 31, 2021
Aberdeen Intermediate Municipal Income Fund
| Shares or Principal Amount | Value (US$) | |||
| MUNICIPAL BONDS (continued) | ||||
| Tennessee (4.9%) | ||||
| Knox County Health Educational & Housing Facilities Board Revenue Bonds (University Health System, Inc.), 5.00%, 09/01/2036 | $ 500,000 | $ 567,394 | ||
| Metropolitan Government Nashville & Davidson Health & Educational Facilities Revenue Bonds (Trevecca Nazarene University Project) 5.00%, 10/01/2034 | 360,000 | 433,434 | ||
| 4.00%, 10/01/2041 | 1,355,000 | 1,481,453 | ||
| Tennessee Energy Acquisition Corp. Revenue Bonds, Series A, 5.25%, 09/01/2023 | 500,000 | 543,293 | ||
| 3,025,574 | ||||
| Texas (18.3%) | ||||
| Arlington Higher Education Finance Corp. Revenue Bonds (Wayside Schools), 4.00%, 08/15/2036 | 100,000 | 107,907 | ||
| Harris County Health Facilities Development Corp. Revenue Bonds (SCH Health Care System), Prerefunded/Escrowed to Maturity, Series B, 5.75%, 07/01/2027 | 4,675,000 | 5,584,992 | ||
| Matagorda County Navigation District No. 1 Revenue Bonds, Series B-1, 4.00%, 06/01/2030 | 1,000,000 | 1,049,229 | ||
| Port of Beaumont Navigation District of Jefferson County Dock & Wharf Facilities Revenue Bonds (Jefferson Railport Terminal II LLC), 4.00%, 01/01/2050 (b) | 1,000,000 | 1,029,022 | ||
| Tarrant County Cultural Education Facilities Finance Corp. Revenue Bonds (Baylor Scott & White Obligated Group), Series A, 5.00%, 11/15/2029 | 800,000 | 948,793 | ||
| Tarrant County Cultural Education Facilities Finance Corp. Revenue Bonds (Texas Health Resources Obligated Group), Series A, 4.00%, 02/15/2036 | 1,000,000 | 1,120,726 | ||
| Texas Municipal Gas Acquisition & Supply Corp. I Revenue Bonds, Series D, 6.25%, 12/15/2026 | 1,140,000 | 1,318,450 | ||
| 11,159,119 | ||||
| Utah (1.1%) | ||||
| Salt Lake City Corp. Airport Revenue Bonds, Series B, 5.00%, 07/01/2042 | 100,000 | 119,437 | ||
| Utah Charter School Finance Authority Revenue Bonds (Scholar Academy), Series A, 4.50%, 04/15/2048 (a)(b) | 570,000 | 578,935 | ||
| 698,372 | ||||
| Washington (0.3%) | ||||
| State Housing Finance Commission Revenue Bonds (Transforming Age Project), Series A, 5.00%, 01/01/2024 (b) | 180,000 | 192,404 | ||
| Wisconsin (4.5%) | ||||
| Public Finance Authority Revenue Bonds 5.00%, 06/15/2029 | 530,000 | 646,195 | ||
| 5.00%, 06/15/2034 | 425,000 | 508,445 | ||
| Shares or Principal Amount | Value (US$) | |||
| Public Finance Authority Revenue Bonds, Series A, 5.00%, 07/01/2038 | $ 1,000,000 | $ 1,159,935 | ||
| Wisconsin Health & Educational Facilities Authority Revenue Bonds (Froedtert Health, Inc. Obligated Group), Series 2017 A, 5.00%, 04/01/2035 | 250,000 | 296,903 | ||
| Wisconsin Health & Educational Facilities Authority Revenue Bonds (St. Camillus Health System), 5.00%, 11/01/2021 | 120,000 | 120,000 | ||
| 2,731,478 | ||||
| Total Municipal Bonds | 60,331,166 | |||
| SHORT-TERM INVESTMENT (0.1%) | ||||
| UNITED STATES (0.1%) | ||||
| BlackRock Liquidity Funds MuniCash Portfolio, Institutional Shares | 57,413 | 57,419 | ||
| Total Short-Term Investment | 57,419 | |||
| Total Investments (Cost $56,222,604) (c)—98.9% | 60,388,585 | |||
| Other Assets in Excess of Liabilities—1.1% | 680,915 | |||
| Net Assets—100.0% | $61,069,500 | |||
| (a) | Variable Rate Instrument. The rate shown is based on the latest available information as of October 31, 2021. Certain variable rate securities are not based on a published reference rate and spread but are determined by the issuer or agent and are based on current market conditions. These securities do not indicate a reference rate and spread in their description. | |
| (b) | Denotes a security issued under Regulation S or Rule 144A. | |
| (c) | See accompanying Notes to Financial Statements for tax unrealized appreciation/(depreciation) of securities. |
See accompanying Notes to Financial Statements.
| 2021 Annual Report | 33 |
Aberdeen Short Duration High Yield Municipal Fund (Unaudited)
Aberdeen Short Duration High Yield Municipal Fund returned 5.18% (Institutional class shares net of fees) for the 12-month reporting period ended October 31, 2021, versus the 0.98% return of its benchmark, the S&P Municipal Bond Short Intermediate Index, and the 6.45% return of its blended secondary benchmark, comprising 30% Bloomberg 1-10 Year Municipal Index/70% Bloomberg 1-10 Year Municipal High Yield Index.
Market/economic review
The overall U.S. municipal (muni) bond market generated a positive return during the reporting period, with the Bloomberg Municipal Bond Index,1 a broad municipal bond market benchmark, gaining 2.64%, while the corporate taxable bond market, as measured by the Bloomberg U.S. Aggregate Bond Index,2 returned –0.48%.
Both the muni and taxable bond markets faced headwinds from rising interest rates. They moved higher as the economy rebounded from its pandemic-induced downturn, inflation increased and the U.S. Federal Reserve (Fed) indicated that it would soon begin tapering back its accommodative monetary policy. While the muni market generated positive returns during eight of the 12 months of the reporting period, a portion of its gains were given back during several periods of weakness.
Fund performance
During the reporting period, the Fund's average weighted maturity and effective duration3 were shorter than that of its blended secondary benchmark, which comprises 30% Bloomberg 1-10 Year Municipal Index/70% Bloomberg 1-10 Year Municipal High Yield Index. This hindered the Fund's relative performance over the period. Although the Fund was slightly overweight investment-grade4 securities, there was a significant underweight to high-quality (AA-rated)5 securities relative to the secondary benchmark. This detracted from performance, as AA securities rallied over the period. In addition, the Fund was underweight to high-yield (B/BB rated) securities, which also rallied throughout the reporting period relative to the secondary benchmark.
Contributors to Fund performance for the reporting period included exposures to higher education, continuing care retirement centers (CCRCs), charter schools and student housing. This was partially offset by positions in economic and industrial development, farebox (mass and rapid transit), school district and sales-tax securities.
During the reporting period, the Fund maintained a roughly 55%/45% allocation mix in high-yield and investment-grade bonds. We believe that this positioning served investors well due to the relatively conservative nature of the strategy, despite high-yield bonds outperforming their investment-grade counterparts, as potential for headwinds persisted throughout much of the year due to COVID concerns.
Market outlook
Following the recent passage of the Infrastructure Investment and Jobs Act, which includes more than $500 billion in new infrastructure spending, we've become slightly more optimistic on municipal credit fundamentals and overall performance. The bill did not contain some key measures that would have resulted in possible headwinds to municipal performance in 2022, such as reintroduction of advanced refunding, which could have resulted in a substantial uptick in supply. Additionally, we believe the increase in federal spending on infrastructure should lighten the load for both state and local municipalities as they pay for infrastructure needs. However, despite our near-term optimism, we believe that prudent investors should still exercise caution with a broad-based approach to the space, as the potential passage of the Build Back Better bill, which focuses more on social infrastructure spending, could yet result in headwinds to municipal performance as we move into 2022. Additionally, the threat of more persistent inflation and a change to Fed policy remains a risk to fixed income as you extend out the yield curve.
We maintain our expectation for a slight supply pickup in the fourth quarter of 2021 that could continue into 2022, although not to the degree it would have if issuers had been able to make use of tax-exempt advanced refunding. The recent passage of a $1.2 trillion infrastructure agreement should only modestly increase muni supply over the medium term, in our opinion. While this uptick in supply could create a slight headwind for the space, we expect municipal demand to remain positive through much of the first quarter of 2022.
Despite strong municipal fundamentals and near-term technicals that seem rather sanguine, we expect the Treasury yield curve to continue to steepen and shift upward as the Fed rolls back quantitative easing and looks to start tightening interest rates. This could continue to put pressure on the municipal curve to shift, thus hampering total returns. This being said, we believe short-term muni rates will remain anchored at the front end of the yield curve, with a steepening curve into 2022 until the Fed signals an interest-rate hike. However, it is
| 1 | The Bloomberg Municipal Bond Index tracks the performance of investment-grade, tax-exempt bonds with a maturity of at least one year. Indexes are unmanaged and have been provided for comparison purposes only. No fees or expenses are reflected. You cannot invest directly in an index. |
| 2 | The Bloomberg U.S. Aggregate Bond Index is a broad-based benchmark that measures the performance of the investment -grade, U.S. dollar-denominated, fixed-rate taxable bond market. |
| 3 | Duration is an estimate of bond price sensitivity to changes in interest rates. The higher the duration, the greater the change (i.e., higher risk) in relation to interest-rate movements. |
| 4 | Companies whose bonds are rated as "investment-grade" have a lower chance of defaulting on their debt than those rated as "non-investment-grade." Generally, these bonds are issued by long-established companies with strong balance sheets. Bonds rated BBB or above are known as investment-grade bonds. |
| 5 | S&P Global Ratings' credit ratings express the agency's opinion about the ability and willingness of an issuer, such as a corporation or state or city government, to meet its financial obligations in full and on time. Typically, ratings are expressed as letter grades that range, for example, from AAA to D to communicate the agency's opinion of relative level of credit risk. Ratings from AA to CCC may be modified by the addition of a plus (+) or minus (-) sign to show relative standing within the major rating categories. |
| 34 | 2021 Annual Report |
Aberdeen Short Duration High Yield Municipal Fund (Unaudited) (concluded)
worth noting that, as of the end of the reporting period, nine of the 18 Federal Open Market Committee (FOMC) participants expect an interest-rate hike in 2022, and the markets have priced in a rate increase in June/July 2022.
For these reasons, while we expect the fundamental backdrop for municipalities to remain largely favorable and near-term technicals to remain slightly bullish, we believe overall muni market performance could be pressured should inflation persist. We still see opportunities in select issuers that we believe will benefit as the economy continues to rebound, particularly in sectors such as higher education, transportation and senior living. In terms of yield-curve positioning, we still believe that retaining the Fund's conservative weighting maintains a more stable net asset value (NAV) headed into what could be a higher interest-rate environment. With a relatively shorter duration than the benchmark, we feel the Fund should be insulated from sharp movements in its NAV.
Against this backdrop, we think that shorter-duration and lower-quality credits have the potential to outperform, with yields ticking up in the belly of the yield curve7 as investors try to get ahead of any expected Fed taper. In terms of yield-curve positioning, as we get closer to mid-2022 and have more clarity around an interest-rate hike, we would expect to be paring back duration. Despite the recent increase to the Fund's duration, we believe retaining its conservative positioning relative to benchmark and shortening duration as an interest-rate hike approaches helps to maintain a more stable NAV while also maximizing the yield.
Portfolio Management:
U.S. Municipal Team
PAST PERFORMANCE DOES NOT GUARANTEE FUTURE RESULTS.
The performance data quoted represents past performance and current returns may be lower or higher. Class A Shares have up to a 2.50% front-end
sales charge and a 0.25% 12b-1 fee. The investment return and principal value will fluctuate so that an investor's shares, when redeemed, may be worth more or less than the original cost. To obtain performance information current to the most recent month-end, which may be higher or lower than the performance shown above, please call 866-667-9231 or go to https://www.abrdn.com/en-us/us/investor/fund-centre.
Investing in mutual funds involves risk, including the possible loss of principal.
Indexes are unmanaged and have been provided for comparison purposes only. No fees or expenses are reflected. You cannot invest directly in an index.
Risk Considerations
Deteriorating market conditions might cause a general weakness in the market that reduces the prices, or yield, of securities in those markets in which the Fund invests.
Fixed income securities are subject to, among other risks, credit risk, extension risk, issuer risk, interest rate risk, market risk and prepayment risk.
The Fund is subject to the risk that the Adviser or Subadviser may make poor security selections.
Municipal bonds can be significantly affected by political and economic changes, including inflation, as well as uncertainties in the municipal market related to taxation, legislative changes, or the rights of municipal security holders.
The Fund's investments in high-yield bonds (commonly referred to as "junk bonds") and other lower-rated securities will subject the Fund to substantial risk of loss.
Please read the prospectus for more detailed information regarding these and other risks.
| 7 | The "belly" comprises the three- to seven-year segment of the yield curve. |
| 2021 Annual Report | 35 |
Aberdeen Short Duration High Yield Municipal Fund (Unaudited)
| Average Annual Total Return1 (For periods ended October 31, 2021) | 1 Yr. | 5 Yr. | Inception2 | |||||||||
| Class A | w/o SC | 4.92% | 2.62 | % | 3.22% | |||||||
| w/SC3 | 2.26% | 2.10 | % | 2.90% | ||||||||
| Class C4 | w/o SC | 5.64% | 2.76 | % | 3.30% | |||||||
| w/SC5 | 4.64% | 2.76 | % | 3.30% | ||||||||
| Institutional Class6 | w/o SC | 5.18% | 2.88 | % | 3.47% | |||||||
All figures showing the effect of a sales charge (SC) reflect the maximum charge possible because it has the most significant effect on performance data. The total returns shown above do not include the impact of financial statement rounding of the net asset value (NAV) per share and/or financial statement adjustments.
| 1 | The Fund changed its investment strategy effective February 28, 2019. Performance information for periods prior to February 28, 2019 does not reflect the Fund's current investment strategy. Returns prior to May 7, 2018 reflect the performance of a predecessor fund (the "Predecessor Fund"). Returns of the Predecessor Fund have not been adjusted to reflect the expenses applicable to the respective classes. The Fund and the Predecessor Fund had substantially similar investment objectives and strategies prior to the Fund's adoption of its current investment strategies on February 28, 2019. Please consult the Fund's prospectus for more detail. |
| 2 | Predecessor Fund commenced operations on May 31, 2013. |
| 3 | A 2.50% front-end sales charge was deducted. Prior to February 28, 2019 the front-end sales charge was 4.25%. |
| 4 | Class C returns prior to the commencement of operations of Class C (inception date: 12/18/2020) are based on the previous performance of the Fund's Class A shares (inception date 5/31/2013). Excluding the effect of any fee waivers or reimbursements, this performance is substantially similar to what each individual class would have produced because all classes invest in the same portfolio of securities. Returns would only differ to the extent of the differences in expenses between the two classes. |
| 5 | A 1.00% contingent deferred sales charge (CDSC) was deducted from the one year return because it is charged when Class C shares are sold within the first year after purchase. |
| 6 | Not subject to any sales charges. |
Performance of a $1,000,000 Investment* (as of October 31, 2021)

* Minimum Initial Investment
Comparative performance of $1,000,000 invested in Institutional Class shares of the Aberdeen Short Duration High Yield Municipal Fund, The S&P Municipal Bond Short Intermediate Index, a blended benchmark of 30% Bloomberg Barclays 1-10 Year Municipal Bond
Index/70% Bloomberg Barclays 1-10 Year Municipal High Yield Index (the "Blended Index") and the Consumer Price Index (CPI) since inception. Unlike the Fund, the returns for these unmanaged indexes do not reflect any fees, expenses, or sales charges. Investors cannot invest directly in market indexes.
The S&P Municipal Bond Short Intermediate Index consists of bonds in the S&P Municipal Bond Index with a minimum maturity of one year and a maximum maturity of up to, but not including, eight years as measured from the Rebalancing Date.
The Bloomberg Barclays 1-10 Year Municipal Bond Index is an unmanaged index composed of investment-grade municipal bonds with maturity dates of more than one year and less than 10 years.
The Bloomberg Barclays 1-10 Year Municipal High Yield Index is a sub-index of the Bloomberg Barclays Municipal High Yield Bond Index composed of issues with effective maturity dates of 1-10 years and excludes purpose class of Other. The Bloomberg Barclays Municipal High Yield Bond Index is a flagship measure of the non-investment grade and non-rated USD-denominated tax exempt bond market.
The CPI is a measure of the average change over time in the prices paid by urban consumers for a market basket of consumer goods and services.
Investment return and principal value will fluctuate, and when redeemed, shares may be worth more or less than original cost. Past performance is no guarantee of future results. The Average Annual Total Return table and Performance graph do not reflect the deduction of taxes that a shareholder would pay on fund distributions or the redemption of fund shares. Investing in mutual funds involves market risk, including loss of principal. Performance returns assume the reinvestment of all distributions. Total returns reflect waivers and reimbursements in effect, without which returns would have been lower.
| 36 | 2021 Annual Report |
Aberdeen Short Duration High Yield Municipal Fund (Unaudited)
Portfolio Summary (as a percentage of net assets)
October 31, 2021 (Unaudited)
| Asset Allocation | |||
| Municipal Bonds | 102.3 | % | |
| Short-Term Investment | 0.1 | % | |
| Liabilities in Excess of Other Assets | (2.4) | % | |
| 100.0 | % | ||
| Top Holdings* | |||
| Maryland Industrial Development Financing Authority Revenue Bonds (Occidental Petroleum Corp.) 03/01/2030 | 2.8 | % | |
| Buckeye Tobacco Settlement Financing Authority Tobacco Settlement Assets-Backed Revenue Bonds 06/01/2055 | 1.9 | % | |
| Arizona Industrial Development Authority Revenue Bonds (Legacy Cares, Inc.), Series A 07/01/2030 | 1.5 | % | |
| Madison Country Capital Resource Corp. Revenue Bonds (Cazenovia College Project), Series A 09/01/2022 | 1.5 | % | |
| New York State Energy Research & Development Authority Revenue Bonds, Series A, AMT, VRDN 12/01/2027 | 1.4 | % | |
| Iowa Finance Authority Revenue Bonds, Series B, FRN 05/15/2056 | 1.2 | % | |
| Washington State Housing Finance Commission Revenue Bonds (Eliseo Project), Series A 01/01/2031 | 1.2 | % | |
| State of New Jersey General Obligation Emergency Bonds, Series A 06/01/2032 | 1.2 | % | |
| Indiana Finance Authority Environmental Improvement Revenue Bonds (ArcelorMittal USA, Inc.), VRDN 08/01/2030 | 1.1 | % | |
| Mississippi Business Finance Corp. Revenue Bonds (PSL-North America), Series A 11/01/2032 | 1.1 | % | |
| Port of Port Arthur Navigation District Revenue Bonds, VRDN 11/01/2040 | 1.1 | % | |
| Other | 84.0 | % | |
| 100.0 | % | ||
| * | For the purpose of listing top holdings, Short-Term Investments are included as part of Other. |
| Top States | |||
| New York | 14.8 | % | |
| Florida | 9.1 | % | |
| Texas | 6.6 | % | |
| Illinois | 5.8 | % | |
| Georgia | 4.7 | % | |
| Ohio | 4.6 | % | |
| Arizona | 4.6 | % | |
| Mississippi | 4.4 | % | |
| Wisconsin | 4.3 | % | |
| Pennsylvania | 4.0 | % | |
| Other | 37.1 | % | |
| 100.0 | % | ||
| 2021 Annual Report | 37 |
Statement of Investments
October 31, 2021
Aberdeen Short Duration High Yield Municipal Fund
| Shares or Principal Amount | Value (US$) | ||||
| MUNICIPAL BONDS (102.3%) | |||||
| Alabama (0.6%) | |||||
| Alabama Industrial Development Solid Waste Disposal Revenue Bonds (OfficeMax, Inc.), 6.45%, 12/01/2023 | $ 750,000 | $ 750,931 | |||
| Health Care Authority for Baptist Health Revenue Bonds, Series D, 5.00%, 11/15/2021 | 850,000 | 851,318 | |||
| Jemison Water & Sewer Revenue Bonds, Series A, 3.50%, 03/01/2026 | 290,000 | 302,222 | |||
| Walker County Economic & Industrial Development Authority Revenue Bonds (Alabama Power Co.), 0.08%, 12/01/2036 (a) | 600,000 | 600,000 | |||
| 2,504,471 | |||||
| Arizona (4.6%) | |||||
| Arizona Industrial Development Authority Revenue Bonds (Great Lakes Senior Living Communities LLC Project Third Tier), Series C 5.13%, 01/01/2034 (b) | 775,000 | 691,073 | |||
| 5.13%, 01/01/2035 (b) | 815,000 | 721,378 | |||
| Arizona Industrial Development Authority Revenue Bonds (Kaizen Education Foundation) 5.00%, 07/01/2022 (b) | 385,000 | 394,847 | |||
| 5.00%, 07/01/2023 (b) | 405,000 | 430,133 | |||
| Arizona Industrial Development Authority Revenue Bonds (KIPP New York City Public Charter Schools – JEROME Facility Project), Series B 5.00%, 07/01/2027 | 160,000 | 183,163 | |||
| 5.00%, 07/01/2028 | 170,000 | 193,556 | |||
| 5.00%, 07/01/2029 | 155,000 | 175,597 | |||
| 5.00%, 07/01/2030 | 185,000 | 208,661 | |||
| 5.00%, 07/01/2031 | 195,000 | 218,948 | |||
| 5.00%, 07/01/2032 | 205,000 | 229,484 | |||
| 5.00%, 07/01/2033 | 210,000 | 234,692 | |||
| 4.00%, 07/01/2034 | 225,000 | 241,101 | |||
| 4.00%, 07/01/2035 | 235,000 | 251,547 | |||
| 4.00%, 07/01/2036 | 210,000 | 224,411 | |||
| Arizona Industrial Development Authority Revenue Bonds (KIPP New York City Public Charter Schools – MACOMBS Facility Project), Series A 5.00%, 07/01/2027 | 55,000 | 64,286 | |||
| 5.00%, 07/01/2028 | 60,000 | 71,151 | |||
| 5.00%, 07/01/2029 | 60,000 | 72,089 | |||
| 5.00%, 07/01/2030 | 65,000 | 78,935 | |||
| 5.00%, 07/01/2031 | 65,000 | 80,008 | |||
| 5.00%, 07/01/2032 | 315,000 | 386,138 | |||
| 5.00%, 07/01/2033 | 315,000 | 384,925 | |||
| 4.00%, 07/01/2034 | 325,000 | 364,939 | |||
| 4.00%, 07/01/2035 | 305,000 | 341,776 | |||
| 4.00%, 07/01/2036 | 310,000 | 346,548 | |||
| Arizona Industrial Development Authority Revenue Bonds (Legacy Cares, Inc.), Series A 6.75%, 07/01/2030 (b) | 6,000,000 | 6,846,831 | |||
| 5.50%, 07/01/2031 (b) | 100,000 | 107,548 | |||
| 6.00%, 07/01/2051 (b) | 800,000 | 872,097 | |||
| Arizona Industrial Development Authority Revenue Bonds (Somerset Academy of Las Vegas), 3.00%, 12/15/2031 (b) | 655,000 | 678,920 |
| Shares or Principal Amount | Value (US$) | ||||
| Arizona Industrial Development Authority Revenue Refunding Bonds (Doral Academy of Northern Nevada Project) 4.00%, 07/15/2026 (b) | $ 125,000 | $ 137,463 | |||
| 4.00%, 07/15/2027 (b) | 125,000 | 139,050 | |||
| 4.00%, 07/15/2028 (b) | 185,000 | 207,358 | |||
| 4.00%, 07/15/2029 (b) | 200,000 | 225,677 | |||
| 4.00%, 07/15/2030 (b) | 215,000 | 240,660 | |||
| 4.00%, 07/15/2031 (b) | 215,000 | 238,417 | |||
| 4.00%, 07/15/2032 (b) | 225,000 | 248,673 | |||
| 4.00%, 07/15/2033 (b) | 185,000 | 203,919 | |||
| 4.00%, 07/15/2034 (b) | 185,000 | 203,239 | |||
| 4.00%, 07/15/2035 (b) | 255,000 | 279,581 | |||
| 4.00%, 07/15/2036 (b) | 250,000 | 273,550 | |||
| 4.00%, 07/15/2037 (b) | 275,000 | 300,304 | |||
| La Paz County Industrial Development Authority Revenue Bonds (Charter School Solutions), Series A, 5.00%, 02/15/2026 (b) | 500,000 | 546,211 | |||
| Maricopa County Industrial Development Authority Revenue Bonds (Ottawa University), 5.00%, 10/01/2026 (b) | 300,000 | 317,684 | |||
| 5.13%, 10/01/2030 (b) | 425,000 | 475,631 | |||
| Maricopa County Industrial Development Authority Revenue Bonds (Paragon Management, Inc.), 4.00%, 07/01/2026 (b) | 1,250,000 | 1,333,740 | |||
| 20,465,939 | |||||
| Arkansas (1.0%) | |||||
| Arkansas Development Finance Authority Revenue Bonds (Central Arkansas Radiation Therapy Institute, Inc.) 4.00%, 07/01/2023 | 105,000 | 109,225 | |||
| 4.00%, 07/01/2024 | 100,000 | 105,887 | |||
| 4.00%, 07/01/2025 | 140,000 | 150,259 | |||
| 4.00%, 07/01/2026 | 185,000 | 200,860 | |||
| 4.00%, 07/01/2027 | 220,000 | 240,812 | |||
| 4.00%, 07/01/2028 | 230,000 | 253,393 | |||
| 3.00%, 07/01/2032 | 350,000 | 350,518 | |||
| 3.13%, 07/01/2036 | 360,000 | 360,442 | |||
| County of Baxter Hospital Revenue Bonds (Baxter Regional Medical Center), Series A 5.00%, 09/01/2025 | 1,000,000 | 1,138,381 | |||
| 5.00%, 09/01/2026 | 1,490,000 | 1,737,061 | |||
| 4,646,838 | |||||
| California (3.0%) | |||||
| California Municipal Finance Authority Revenue Bonds (Highlands Community Charter and Technical Schools), 4.00%, 11/15/2021 (b) | 1,650,000 | 1,650,598 | |||
| California Municipal Finance Authority Revenue Bonds (Simpson University), Series A 5.00%, 10/01/2026 | 40,000 | 42,312 | |||
| 5.13%, 10/01/2030 | 1,020,000 | 1,125,752 | |||
| California Municipal Finance Authority Revenue Bonds (United Airlines, Inc.), 4.00%, 07/15/2029 | 3,000,000 | 3,375,066 |
See accompanying Notes to Financial Statements.
| 38 | 2021 Annual Report |
Statement of Investments (continued)
October 31, 2021
Aberdeen Short Duration High Yield Municipal Fund
| Shares or Principal Amount | Value (US$) | ||||
| MUNICIPAL BONDS (continued) | |||||
| California (continued) | |||||
| California Public Finance Authority Revenue Bonds (Kendal at Sonoma Obligated Group) 2.38%, 11/15/2028 (b) | $ 1,565,000 | $ 1,577,856 | |||
| 3.13%, 05/15/2029 (b) | 3,075,000 | 3,105,574 | |||
| 5.00%, 11/15/2036 (b) | 410,000 | 475,900 | |||
| California Statewide Communities Development Authority Revenue Bonds (Provident Group-Ponoma Properties LLC), Series A, 5.60%, 01/15/2036 (b) | 1,900,000 | 1,977,575 | |||
| 13,330,633 | |||||
| Colorado (0.5%) | |||||
| Colorado Educational & Cultural Facilities Authority Revenue Bonds (Aspen View Academy, Inc.) 4.00%, 05/01/2024 | 150,000 | 160,122 | |||
| 4.00%, 05/01/2027 | 65,000 | 72,292 | |||
| 4.00%, 05/01/2029 | 145,000 | 162,945 | |||
| 4.00%, 05/01/2030 | 120,000 | 134,961 | |||
| 4.00%, 05/01/2036 | 175,000 | 194,485 | |||
| Colorado Health Facilities Authority Revenue Bonds, Series B 5.00%, 05/15/2028 | 400,000 | 427,650 | |||
| 5.00%, 05/15/2028 | 100,000 | 104,438 | |||
| Colorado Health Facilities Authority Revenue Bonds (Frasier Meadows Manor, Inc.) 5.00%, 05/15/2025 | 320,000 | 342,120 | |||
| Series B, 5.00%, 05/15/2029 | 585,000 | 625,438 | |||
| 2,224,451 | |||||
| Connecticut (1.4%) | |||||
| City of West Haven General Obligation Unlimited Bonds Series A, 5.00%, 11/01/2025 | 325,000 | 377,722 | |||
| Series B, 5.00%, 11/01/2025 | 240,000 | 278,933 | |||
| Series A, 5.00%, 11/01/2026 | 325,000 | 387,043 | |||
| Series B, 5.00%, 11/01/2026 | 200,000 | 238,180 | |||
| Series A, 5.00%, 11/01/2027 | 635,000 | 770,695 | |||
| Series B, 5.00%, 11/01/2027 | 200,000 | 242,739 | |||
| State Health & Educational Facilities Authority Revenue Bond (McLean Affiliates Obligated Group) Series B-2, 2.75%, 01/01/2026 (b) | 650,000 | 654,478 | |||
| Series B-1, 3.25%, 01/01/2027 (b) | 750,000 | 761,849 | |||
| Series A, 5.00%, 01/01/2030 (b) | 500,000 | 565,171 | |||
| State Health & Educational Facilities Authority Revenue Bond (University of Hartford) 5.00%, 07/01/2025 | 400,000 | 453,723 | |||
| 5.00%, 07/01/2026 | 575,000 | 667,792 | |||
| 5.00%, 07/01/2027 | 430,000 | 509,283 | |||
| 5.00%, 07/01/2029 | 300,000 | 367,443 | |||
| 6,275,051 | |||||
| Delaware (0.2%) | |||||
| Delaware State Economic Development Authority Revenue Bonds (Delmarva Power & Light Co.), 0.08%, 10/01/2029 (a) | 900,000 | 900,000 |
| Shares or Principal Amount | Value (US$) | ||||
| Florida (9.1%) | |||||
| Alachua County Health Facilities Authority Revenue Bonds (Oak Hammock at The University Of Florida, Inc.) 4.00%, 10/01/2022 | $ 85,000 | $ 87,133 | |||
| 4.00%, 10/01/2023 | 85,000 | 89,360 | |||
| 4.00%, 10/01/2024 | 110,000 | 118,216 | |||
| 4.00%, 10/01/2025 | 100,000 | 109,290 | |||
| 4.00%, 10/01/2026 | 105,000 | 116,193 | |||
| 4.00%, 10/01/2027 | 145,000 | 161,841 | |||
| 4.00%, 10/01/2028 | 155,000 | 173,963 | |||
| 4.00%, 10/01/2029 | 265,000 | 297,499 | |||
| 4.00%, 10/01/2030 | 100,000 | 111,614 | |||
| 4.00%, 10/01/2031 | 140,000 | 155,439 | |||
| Capital Trust Agency, Inc., Zero Coupon%, 01/01/2024 | 248,056 | — | |||
| Capital Trust Agency, Inc. Revenue Bonds (Educational Growth Fund LLC), Series A-1, 3.38%, 07/01/2031 (b) | 1,745,000 | 1,848,486 | |||
| Capital Trust Agency, Inc. Revenue Bonds (Wonderful Foundations Charter School Holdings LLC), 4.50%, 01/01/2035 (b) | 300,000 | 321,315 | |||
| Celebration Pointe Community Development District No.1 Special Assessment Revenue Bonds, 4.75%, 05/01/2024 | 40,000 | 42,311 | |||
| City of Atlantic Beach Health Care Facilities Revenue Bonds (Naval Continuing Care Retirement Foundation, Inc.), Series A, 5.00%, 11/15/2021 | 200,000 | 200,290 | |||
| City of Lakeland Revenue Bonds, Series B 4.00%, 10/01/2033 | 1,095,000 | 1,317,118 | |||
| 4.00%, 10/01/2034 | 1,140,000 | 1,365,681 | |||
| County of Bay Revenue Bonds (Florida Power & Light Co.), 0.07%, 06/01/2050 (a) | 2,000,000 | 2,000,000 | |||
| County Of Lake Florida Retirement Facility Revenue Bonds (Waterman Communities, Inc.) Series B-3, 3.38%, 08/15/2026 | 1,000,000 | 1,004,561 | |||
| Series B-2, 3.75%, 08/15/2027 | 1,500,000 | 1,506,794 | |||
| Florida Development Finance Corp. Educational Facilities Revenue Bonds (Imagine School At Broward Project), Series A 4.00%, 12/15/2029 (b) | 530,000 | 581,625 | |||
| 5.00%, 12/15/2034 (b) | 530,000 | 616,862 | |||
| Florida Development Finance Corp. Educational Facilities Revenue Bonds (Miami Arts Charter School Project), Series A, 5.00%, 06/15/2024 (b) | 100,000 | 98,933 | |||
| Florida Development Finance Corp. Revenue Bonds (Brightline Trains Florida LLC), Series B, 7.38%, 01/01/2049 (b) | 2,000,000 | 2,155,620 | |||
| Florida Development Finance Corp. Revenue Bonds (Glenridge on Palmer Ranch Obligated Group) 3.00%, 06/01/2022 | 115,000 | 116,026 | |||
| 3.00%, 06/01/2023 | 115,000 | 117,647 | |||
| 4.00%, 06/01/2024 | 105,000 | 111,153 | |||
| 4.00%, 06/01/2025 | 110,000 | 118,195 | |||
| 4.00%, 06/01/2026 | 110,000 | 119,532 | |||
| 5.00%, 06/01/2031 | 300,000 | 348,288 |
See accompanying Notes to Financial Statements.
| 2021 Annual Report | 39 |
Statement of Investments (continued)
October 31, 2021
Aberdeen Short Duration High Yield Municipal Fund
| Shares or Principal Amount | Value (US$) | ||||
| MUNICIPAL BONDS (continued) | |||||
| Florida (continued) | |||||
| Florida Development Finance Corp. Revenue Bonds (Global Outreach Charter Academy Obligated Group), Series A 4.00%, 06/30/2027 (b) | $ 150,000 | $ 167,255 | |||
| 4.00%, 06/30/2028 (b) | 195,000 | 219,205 | |||
| 4.00%, 06/30/2029 (b) | 205,000 | 228,415 | |||
| 4.00%, 06/30/2030 (b) | 215,000 | 237,728 | |||
| 4.00%, 06/30/2031 (b) | 225,000 | 247,762 | |||
| 4.00%, 06/30/2036 (b) | 625,000 | 681,779 | |||
| Florida Development Finance Corp. Revenue Bonds (Mayflower Retirement Center, Inc. Obligated Group) Series A, 4.00%, 06/01/2022 (b) | 220,000 | 223,539 | |||
| Series A, 4.00%, 06/01/2023 (b) | 225,000 | 234,544 | |||
| Series A, 4.00%, 06/01/2024 (b) | 475,000 | 506,814 | |||
| Series A, 4.00%, 06/01/2025 (b) | 495,000 | 539,064 | |||
| 1.75%, 06/01/2026 (b) | 1,020,000 | 1,010,654 | |||
| 2.38%, 06/01/2027 (b) | 835,000 | 821,872 | |||
| Florida Development Finance Corp. Solid Waste Revenue Bonds (Waste Pro USA, Inc.) 5.00%, 05/01/2029 (b) | 2,000,000 | 2,134,227 | |||
| 5.00%, 08/01/2029 (a)(b) | 2,000,000 | 2,052,380 | |||
| 3.00%, 06/01/2032 | 3,000,000 | 3,136,354 | |||
| Lee County Industrial Development Authority Refunding Revenue Bonds (Shell Point Obligated Group) 4.00%, 11/15/2022 | 155,000 | 160,189 | |||
| 4.00%, 11/15/2023 | 170,000 | 181,000 | |||
| 4.00%, 11/15/2024 | 190,000 | 207,661 | |||
| 4.00%, 11/15/2025 | 210,000 | 234,594 | |||
| 4.00%, 11/15/2026 | 185,000 | 210,046 | |||
| 4.00%, 11/15/2027 | 245,000 | 282,206 | |||
| 4.00%, 11/15/2028 | 300,000 | 349,903 | |||
| 4.00%, 11/15/2029 | 365,000 | 422,546 | |||
| 4.00%, 11/15/2030 | 465,000 | 534,642 | |||
| 4.00%, 11/15/2031 | 555,000 | 634,562 | |||
| 4.00%, 11/15/2032 | 375,000 | 426,899 | |||
| Palm Beach County Educational Facilities Authority Revenue Bonds (Palm Beach Atlantic University, Inc.) 4.00%, 10/01/2022 | 205,000 | 210,852 | |||
| 4.00%, 10/01/2023 | 220,000 | 232,788 | |||
| 4.00%, 10/01/2024 | 230,000 | 249,335 | |||
| 4.00%, 10/01/2025 | 240,000 | 265,333 | |||
| 4.00%, 10/01/2026 | 245,000 | 275,075 | |||
| Palm Beach County Revenue Bonds (Provident Group – LU Properties LLC – LYNN University Housing Project), Series A 4.25%, 06/01/2031 (b) | 1,200,000 | 1,315,928 | |||
| 5.00%, 06/01/2057 (b) | 400,000 | 466,539 | |||
| Palm Beach County Revenue Bonds (Provident Group – PBAU Properties LLC – Palm Beach Atlantic University Housing Project), Series A, 5.00%, 04/01/2029 (b) | 1,440,000 | 1,628,613 |
| Shares or Principal Amount | Value (US$) | ||||
| Polk County Industrial Development Authority Revenue Bonds (Carpenter's Home Estates, Inc. Project) Series A, 5.00%, 01/01/2029 | $ 400,000 | $ 450,763 | |||
| 5.00%, 01/01/2039 | 240,000 | 265,140 | |||
| Saint Johns County Industrial Development Authority Revenue Bonds (Life Care Ponte Vedra Obligated Group) 4.00%, 12/15/2021 | 85,000 | 85,273 | |||
| 4.00%, 12/15/2022 | 110,000 | 113,239 | |||
| 4.00%, 12/15/2023 | 115,000 | 121,048 | |||
| 4.00%, 12/15/2024 | 140,000 | 150,050 | |||
| 4.00%, 12/15/2025 | 180,000 | 195,802 | |||
| 4.00%, 12/15/2026 | 190,000 | 208,984 | |||
| 4.00%, 12/15/2027 | 215,000 | 238,731 | |||
| 4.00%, 12/15/2028 | 205,000 | 229,190 | |||
| 4.00%, 12/15/2029 | 225,000 | 252,306 | |||
| 4.00%, 12/15/2030 | 200,000 | 222,926 | |||
| 4.00%, 12/15/2031 | 210,000 | 233,051 | |||
| Seminole County Industrial Development Authority Revenue Bonds (Galileo School Foundation, Inc.), Series A 4.00%, 06/15/2024 (b) | 130,000 | 138,489 | |||
| 4.00%, 06/15/2025 (b) | 105,000 | 113,749 | |||
| 4.00%, 06/15/2026 (b) | 155,000 | 170,192 | |||
| 4.00%, 06/15/2027 (b) | 235,000 | 261,049 | |||
| 4.00%, 06/15/2028 (b) | 250,000 | 280,192 | |||
| 4.00%, 06/15/2029 (b) | 255,000 | 286,842 | |||
| 4.00%, 06/15/2031 (b) | 275,000 | 311,578 | |||
| 4.00%, 06/15/2036 (b) | 315,000 | 352,882 | |||
| 40,822,764 | |||||
| Georgia (4.7%) | |||||
| Dekalb Country Housing Authority Revenue Bonds (Highlands At East Atlanta Apartments Project), 1.81%, 09/01/2036 (a)(b) | 5,000,000 | 4,999,809 | |||
| Development Authority of Burke County Revenue Bonds (Georgia Power A Southern Company), Series 1ST, VRDN, 0.08%, 07/01/2049 (a) | 600,000 | 600,000 | |||
| Development Authority of Burke County Revenue Bonds (Georgia Power Co. Plant Voglte Project), VRDN, 0.09%, 11/01/2052 (a) | 4,900,000 | 4,900,000 | |||
| Development Authority of Burke County Revenue Bonds (Georgia Power Co.), 0.09%, 11/01/2052 (a) | 4,000,000 | 4,000,000 | |||
| Development Authority of Heard County Revenue Bonds (Georgia Power Co.), 0.08%, 12/01/2037 (a) | 700,000 | 700,000 | |||
| Development Authority of Monroe County Revenue Bonds (Georgia Power Co.), VRDN, 0.12%, 11/01/2048 (a) | 2,800,000 | 2,800,000 | |||
| Main Street Natural Gas, Inc. Revenue Bonds, Series A 5.00%, 05/15/2030 | 200,000 | 248,679 | |||
| 5.00%, 05/15/2036 | 1,970,000 | 2,678,304 | |||
| 20,926,792 |
See accompanying Notes to Financial Statements.
| 40 | 2021 Annual Report |
Statement of Investments (continued)
October 31, 2021
Aberdeen Short Duration High Yield Municipal Fund
| Shares or Principal Amount | Value (US$) | ||||||||
| MUNICIPAL BONDS (continued) | |||||||||
| Idaho (0.2%) | |||||||||
| Idaho Housing & Finance Association Revenue Bonds (Idaho Arts Charter School, Inc.), Series A, 4.00%, 12/01/2026 | $ 800,000 | $ 851,509 | |||||||
| Idaho Housing & Finance Association Revenue Bonds (Victory Charter School), Series A, 4.00%, 07/01/2026 | 80,000 | 85,347 | |||||||
| 936,856 | |||||||||
| Illinois (5.8%) | |||||||||
| Chicago Board of Education General Obligation Unlimited Bonds Series C, 5.00%, 12/01/2022 | 600,000 | 629,016 | |||||||
| Series A, 5.00%, 12/01/2028 | 200,000 | 249,435 | |||||||
| Cook County School District No. 144 Prairie Hills General Obligation Unlimited Bonds, Series A, 4.00%, 12/01/2033 | 600,000 | 673,042 | |||||||
| Governors State University Certificates of Participation (Capital Improvement Project), 5.00%, 07/01/2026 | 400,000 | 470,686 | |||||||
| Illinois Finance Authority Educational Facility Revenue Bonds (Rogers Park Montessori School), 5.00%, 02/01/2024 | 160,000 | 164,953 | |||||||
| Illinois Finance Authority Revenue Bonds (Acero Charter Schools, Inc. Obligated Group) 4.00%, 10/01/2027 (b) | 405,000 | 449,722 | |||||||
| 4.00%, 10/01/2028 (b) | 580,000 | 649,377 | |||||||
| 4.00%, 10/01/2029 (b) | 910,000 | 1,024,139 | |||||||
| 4.00%, 10/01/2030 (b) | 630,000 | 711,527 | |||||||
| 4.00%, 10/01/2032 (b) | 685,000 | 769,597 | |||||||
| 4.00%, 10/01/2033 (b) | 1,060,000 | 1,185,987 | |||||||
| 4.00%, 10/01/2034 (b) | 445,000 | 495,835 | |||||||
| Illinois Finance Authority Revenue Bonds (Benedictine University) 5.00%, 10/01/2025 | 1,035,000 | 1,171,799 | |||||||
| 5.00%, 10/01/2028 | 120,000 | 143,472 | |||||||
| 5.00%, 10/01/2029 | 200,000 | 242,387 | |||||||
| 5.00%, 10/01/2030 | 100,000 | 122,550 | |||||||
| Illinois Finance Authority Revenue Bonds (CHF-Chicago LLC), Series A 5.00%, 02/15/2027 | 420,000 | 489,314 | |||||||
| 5.00%, 02/15/2028 | 400,000 | 468,826 | |||||||
| 5.00%, 02/15/2029 | 520,000 | 605,748 | |||||||
| 5.00%, 02/15/2030 | 335,000 | 388,057 | |||||||
| 5.00%, 02/15/2031 | 370,000 | 427,508 | |||||||
| 5.00%, 02/15/2032 | 225,000 | 259,441 | |||||||
| Illinois Finance Authority Revenue Bonds (Chicago Charter School Foundation) 5.00%, 12/01/2028 | 250,000 | 297,299 | |||||||
| 5.00%, 12/01/2029 | 315,000 | 372,422 | |||||||
| Illinois Finance Authority Revenue Bonds (Plymouth Place Obligated Group) 5.00%, 05/15/2032 | 275,000 | 332,364 | |||||||
| 5.00%, 05/15/2033 | 290,000 | 348,899 | |||||||
| 5.00%, 05/15/2034 | 300,000 | 358,881 | |||||||
| 5.00%, 05/15/2035 | 315,000 | 375,114 | |||||||
| 5.00%, 05/15/2036 | 330,000 | 391,194 | |||||||
| Shares or Principal Amount | Value (US$) | ||||||||
| Metropolitan Pier & Exposition Authority Revenue Bonds 5.00%, 12/15/2025 | $ 295,000 | $ 342,779 | |||||||
| 5.00%, 12/15/2027 | 100,000 | 121,704 | |||||||
| State of Illinois General Obligation Unlimited Bonds 5.00%, 08/01/2024 | 2,000,000 | 2,068,082 | |||||||
| Series D, 5.00%, 11/01/2026 | 2,780,000 | 3,279,036 | |||||||
| 5.00%, 11/01/2029 | 2,000,000 | 2,369,104 | |||||||
| 4.00%, 02/01/2030 | 745,000 | 845,246 | |||||||
| Village of Matteson Revenue Bonds 5.00%, 12/01/2026 | 150,000 | 178,744 | |||||||
| 5.00%, 12/01/2027 | 150,000 | 182,682 | |||||||
| 5.00%, 12/01/2028 | 350,000 | 429,428 | |||||||
| Village of Matteson Tax Allocation Bonds, 6.50%, 12/01/2035 | 1,220,000 | 1,351,610 | |||||||
| Village of Willow Springs General Obligation Unlimited Bonds, Series C, 4.45%, 12/15/2021 | 285,000 | 285,846 | |||||||
| 25,722,852 | |||||||||
| Indiana (1.9%) | |||||||||
| City of Valparaiso Exempt Facilities Revenue Bonds (Pratt Paper LLC), 5.88%, 01/01/2024 | 100,000 | 106,280 | |||||||
| Hammond Local Public Improvement Bond Bank Revenue Bonds, Series B, 4.63%, 07/15/2023 (b) | 870,000 | 902,033 | |||||||
| Indiana Finance Authority Environmental Improvement Revenue Bonds (ArcelorMittal USA, Inc.), VRDN, 0.17%, 08/01/2030 (a) | 5,000,000 | 5,000,000 | |||||||
| Indiana Finance Authority Revenue Bonds (Earlham College, Inc.), 5.00%, 10/01/2032 | 2,250,000 | 2,374,616 | |||||||
| 8,382,929 | |||||||||
| Iowa (2.2%) | |||||||||
| Iowa Finance Authority Revenue Bonds Series A, 4.00%, 05/15/2029 | 2,490,000 | 2,825,577 | |||||||
| Series A, 4.00%, 05/15/2030 | 1,260,000 | 1,429,296 | |||||||
| Series B, FRN, 0.59%, 05/15/2056 (a) | 5,500,000 | 5,500,000 | |||||||
| 9,754,873 | |||||||||
| Kansas (0.9%) | |||||||||
| City of Manhattan Revenue Bonds (Meadowlark Hills Retirement Community Obligated Group), Series A 4.00%, 06/01/2025 | 205,000 | 220,052 | |||||||
| 4.00%, 06/01/2026 | 315,000 | 342,440 | |||||||
| 4.00%, 06/01/2027 | 330,000 | 361,393 | |||||||
| 4.00%, 06/01/2028 | 300,000 | 330,590 | |||||||
| 4.00%, 06/01/2036 | 1,640,000 | 1,794,291 | |||||||
| 4.00%, 06/01/2046 | 1,000,000 | 1,071,514 | |||||||
| 4,120,280 | |||||||||
| Kentucky (1.7%) | |||||||||
| County of Meade, Kentucky (Nucor Steel Brandenburg Project) Series 2021A-1 Industrial Building Revenue Bonds, Series A-1, AMT, VRDN, 0.06%, 08/01/2061 (a) | 800,000 | 800,000 | |||||||
See accompanying Notes to Financial Statements.
| 2021 Annual Report | 41 |
Statement of Investments (continued)
October 31, 2021
Aberdeen Short Duration High Yield Municipal Fund
| Shares or Principal Amount | Value (US$) | ||||||||
| MUNICIPAL BONDS (continued) | |||||||||
| Kentucky (continued) | |||||||||
| Kentucky Economic Development Finance Authority Revenue Bonds (Christian Care Communities Obligated Group), 4.25%, 07/01/2031 | $ 1,315,000 | $ 1,360,649 | |||||||
| Kentucky Economic Development Finance Authority Revenue Bonds (Masonic Homes of Kentucky, Inc.), Series C, 0.09%, 05/01/2034 (a) | 1,000,000 | 1,000,000 | |||||||
| Louisville Regional Airport Authority Revenue Bonds (BT-OH LLC), Series A, AMT, VRDN, 0.06%, 11/01/2036 (a) | 800,000 | 800,000 | |||||||
| Louisville Regional Airport Authority Revenue Bonds (United Parcel Service, Inc.), Series C, 0.09%, 01/01/2029 (a) | 3,600,000 | 3,600,000 | |||||||
| 7,560,649 | |||||||||
| Louisiana (1.2%) | |||||||||
| Louisiana Local Government Environmental Facilities & Community Development Authority Revenue Bonds (Provident Group – ULM Properties LLC – University Of Louisiana At Manroe Project), Series A, 5.00%, 07/01/2029 (b) | 1,000,000 | 1,069,228 | |||||||
| Louisiana Local Government Environmental Facilities & Community Development Authority Revenue Bonds (St. James Place of Baton Rouge), Series A, 5.50%, 11/15/2025 | 250,000 | 266,271 | |||||||
| Louisiana Local Government Environmental Facilities & Community Development Authority Revenue Bonds (The Glen System Retirement Project), Series A 5.00%, 01/01/2024 | 180,000 | 183,499 | |||||||
| 5.00%, 01/01/2025 | 370,000 | 379,546 | |||||||
| 5.00%, 01/01/2026 | 390,000 | 401,033 | |||||||
| 5.00%, 01/01/2027 | 410,000 | 421,801 | |||||||
| 5.00%, 01/01/2028 | 430,000 | 442,835 | |||||||
| 5.00%, 01/01/2029 | 450,000 | 462,788 | |||||||
| Louisiana Local Government Environmental Facilities & Community Development Authority Student Housing Revenue Bonds (Provident Group – ULM Properties LLC – University Of Louisiana At Manroe Project), Series A, 5.00%, 07/01/2039 (b) | 1,000,000 | 1,053,244 | |||||||
| Louisiana Public Facilities Authority Revenue Bonds (Young Audiences Charter School Project), Series A, 5.00%, 04/01/2030 (b) | 400,000 | 428,735 | |||||||
| Parish of St. Charles Gulf Opportunity Zone Revenue Bonds (Valero Project), 4.00%, 12/01/2040 (a) | 315,000 | 321,503 | |||||||
| 5,430,483 | |||||||||
| Maryland (4.0%) | |||||||||
| Anne Arundel County Consolidated Special Taxing District Bonds (Villages at Two Rivers Project), 4.20%, 07/01/2024 | 70,000 | 73,993 | |||||||
| Shares or Principal Amount | Value (US$) | ||||||||
| Frederick County Educational Facilities Revenue Bonds (Mount St. Marys University), Series A 5.00%, 09/01/2027 (b) | $ 1,495,000 | $ 1,647,027 | |||||||
| 5.00%, 09/01/2032 (b) | 740,000 | 830,800 | |||||||
| Maryland Economic Development Corp. Revenue Bonds (CONSOL Marine Terminal, Inc.), 5.75%, 09/01/2025 | 1,445,000 | 1,459,890 | |||||||
| Maryland Industrial Development Financing Authority Revenue Bonds (Occidental Petroleum Corp.), 1.00%, 03/01/2030 (a) | 12,510,000 | 12,510,000 | |||||||
| The Mayor and Council of Rockville Economic Development Revenue Bonds (King Farm Presbyterian Retirement Community, Inc.) Series A-2, 5.00%, 11/01/2025 | 705,000 | 780,995 | |||||||
| 5.00%, 11/01/2027 | 600,000 | 660,318 | |||||||
| 17,963,023 | |||||||||
| Massachusetts (1.1%) | |||||||||
| Lynn Housing Authority & Neighborhood Development Revenue Bonds, 4.00%, 10/01/2022 | 225,000 | 228,415 | |||||||
| Massachusetts Development Finance Agency Revenue Bonds (Linden Ponds, Inc.), 4.00%, 11/15/2023 (b) | 635,000 | 649,612 | |||||||
| Massachusetts Development Finance Agency Revenue Bonds (NewBridge on The Charles, Inc.) 4.00%, 10/01/2025 (b) | 500,000 | 539,892 | |||||||
| 4.00%, 10/01/2026 (b) | 500,000 | 539,307 | |||||||
| 4.00%, 10/01/2027 (b) | 450,000 | 485,025 | |||||||
| Massachusetts Development Finance Agency Revenue Bonds (Provident Commonwealth Education Resource, Inc.), 5.00%, 10/01/2024 | 1,500,000 | 1,655,451 | |||||||
| Massachusetts Development Finance Agency Revenue Bonds (Wellforce Issue), Series A 5.00%, 07/01/2033 | 500,000 | 611,802 | |||||||
| 5.00%, 07/01/2034 | 300,000 | 366,283 | |||||||
| 5,075,787 | |||||||||
| Michigan (1.1%) | |||||||||
| Calhoun County Hospital Finance Authority Revenue Bonds (Ella E.M. Brown Charitable Circle), 5.00%, 02/15/2024 | 500,000 | 542,797 | |||||||
| Charyl Stockwell Academy Revenue Bonds, 4.88%, 10/01/2023 | 40,000 | 41,023 | |||||||
| Kalamazoo Economic Development Corp. Revenue Bonds (Heritage Community of Kalamazoo Obligated Group) 2.63%, 05/15/2025 | 1,130,000 | 1,130,664 | |||||||
| 5.00%, 05/15/2032 | 1,795,000 | 2,023,601 | |||||||
| Michigan Finance Authority Public School Academy Limited Revenue Bond (Cesar Chavez Academy Project), 4.00%, 02/01/2029 | 700,000 | 752,803 | |||||||
| Michigan Strategic Fund Revenue Bonds (Graphic Packaging International, LLC Coated Recycled Board Machine), AMT, VRN, 4.00%, 10/01/2061 (a) | 500,000 | 555,230 | |||||||
| 5,046,118 | |||||||||
See accompanying Notes to Financial Statements.
| 42 | 2021 Annual Report |
Statement of Investments (continued)
October 31, 2021
Aberdeen Short Duration High Yield Municipal Fund
| Shares or Principal Amount | Value (US$) | ||||||||
| MUNICIPAL BONDS (continued) | |||||||||
| Minnesota (1.3%) | |||||||||
| Rice County Educational Facility Revenue Bonds (Shattuck-St Mary's School), Series A, 5.00%, 08/01/2022 (b) | $ 950,000 | $ 983,652 | |||||||
| Shakopee Minnesota Senior Housing Revenue Bonds (Benedictine Living Community of Shakopee LLC Project), 5.85%, 11/01/2058 (a)(b) | 4,500,000 | 4,814,655 | |||||||
| 5,798,307 | |||||||||
| Mississippi (4.4%) | |||||||||
| Mississippi Business Finance Corp. Revenue Bonds (Huntington Ingalls Industries, Inc.), 4.55%, 12/01/2028 | 980,000 | 979,980 | |||||||
| Mississippi Business Finance Corp. Revenue Bonds (Mississippi Power Co.), 0.09%, 12/01/2027 (a) | 3,100,000 | 3,100,000 | |||||||
| Mississippi Business Finance Corp. Revenue Bonds (Mississippi Power Co.), AMT, 0.08%, 07/01/2025 (a) | 3,900,000 | 3,900,000 | |||||||
| Mississippi Business Finance Corp. Revenue Bonds (PSL-North America), Series A, 1.55%, 11/01/2032 (a) | 5,000,000 | 5,000,000 | |||||||
| Mississippi Business Finance Corp. Revenue Bonds (Waste Pro USA, Inc.), AMT, VRN, 5.00%, 02/01/2036 (a)(b) | 1,500,000 | 1,539,285 | |||||||
| Mississippi Development Bank Obligation Bonds (Mangolia Regional Health Centre) 5.00%, 10/01/2022 (b) | 400,000 | 413,111 | |||||||
| 5.00%, 10/01/2023 (b) | 415,000 | 441,498 | |||||||
| 5.00%, 10/01/2024 (b) | 440,000 | 480,154 | |||||||
| 5.00%, 10/01/2025 (b) | 660,000 | 734,720 | |||||||
| Mississippi Development Bank Revenue Bonds (Hancock County Gomesa Project), 4.55%, 11/01/2039 (b) | 2,000,000 | 2,223,692 | |||||||
| Mississippi Pearl General Obligation Unlimited Bonds, 3.00%, 07/15/2022 | 630,000 | 629,289 | |||||||
| 19,441,729 | |||||||||
| Missouri (0.9%) | |||||||||
| Platte County Industrial Development Authority Transportation Revenue Bonds, 5.00%, 12/01/2025 | 675,000 | 324,000 | |||||||
| Plaza at Noah's Ark Community Improvement District Revenue Bonds 3.00%, 05/01/2022 | 65,000 | 65,327 | |||||||
| 3.00%, 05/01/2023 | 100,000 | 101,364 | |||||||
| 3.00%, 05/01/2024 | 100,000 | 101,860 | |||||||
| 3.00%, 05/01/2025 | 100,000 | 102,136 | |||||||
| 3.00%, 05/01/2026 | 100,000 | 102,200 | |||||||
| Saint Louis County Missouri Industrial Development Authority Revenue Bonds (Ranken-Jordan Pediatric Specialty Hospital) 4.00%, 11/15/2021 | 555,000 | 555,493 | |||||||
| 5.00%, 11/15/2022 | 625,000 | 647,008 | |||||||
| Shares or Principal Amount | Value (US$) | ||||||||
| State Health & Educational Facilities Authority Revenue Bond (Bethesda Health Group, Inc.) 3.00%, 08/01/2023 | $ 140,000 | $ 145,731 | |||||||
| 4.00%, 08/01/2025 | 150,000 | 166,625 | |||||||
| 4.00%, 08/01/2027 | 440,000 | 506,103 | |||||||
| 4.00%, 08/01/2029 | 385,000 | 452,066 | |||||||
| 4.00%, 08/01/2031 | 310,000 | 369,188 | |||||||
| 4.00%, 08/01/2036 | 275,000 | 321,360 | |||||||
| 3,960,461 | |||||||||
| Nebraska (0.1%) | |||||||||
| Scotts Bluff County Hospital Authority Revenue Bonds (Regional West Medical Center), Series A, 5.00%, 02/01/2022 | 615,000 | 620,077 | |||||||
| Nevada (0.4%) | |||||||||
| City of Carson Hospital Revenue Bonds (Carson Tahoe Regional Healthcare) 5.00%, 09/01/2027 | 605,000 | 732,567 | |||||||
| 5.00%, 09/01/2029 | 620,000 | 744,492 | |||||||
| Nevada Department of Business & Industry Revenue Bonds (Doral Academy of Nevada), Series A, 3.13%, 07/15/2022 (b)(c) | 145,000 | 146,527 | |||||||
| 1,623,586 | |||||||||
| New Jersey (2.3%) | |||||||||
| New Jersey Economic Development Authority Revenue Bonds (Greater Brunswick Charter School Project), Series A, 4.75%, 08/01/2024 (b) | 70,000 | 73,639 | |||||||
| New Jersey Economic Development Authority Revenue Bonds (United Airlines, Inc.) 5.50%, 04/01/2028 | 55,000 | 55,185 | |||||||
| Series B, AMT, 5.63%, 11/15/2030 | 455,000 | 499,468 | |||||||
| New Jersey Transportation Trust Fund Authority Revenue Bonds, Series A, 4.00%, 06/15/2035 | 3,250,000 | 3,792,285 | |||||||
| South Jersey Port Corp. Revenue Bonds, Series B 5.00%, 01/01/2026 | 300,000 | 346,624 | |||||||
| 5.00%, 01/01/2027 | 250,000 | 295,799 | |||||||
| 5.00%, 01/01/2028 | 255,000 | 308,223 | |||||||
| State of New Jersey General Obligation Emergency Bonds, Series A, 3.00%, 06/01/2032 | 4,600,000 | 5,119,294 | |||||||
| 10,490,517 | |||||||||
| New York (14.8%) | |||||||||
| Albany Capital Resource Corp. Revenue Bonds (The College Of Saint Rose) 4.00%, 07/01/2025 | 1,025,000 | 1,107,768 | |||||||
| 4.00%, 07/01/2026 | 1,065,000 | 1,164,774 | |||||||
| 4.00%, 07/01/2027 | 1,105,000 | 1,219,118 | |||||||
| 4.00%, 07/01/2028 | 1,150,000 | 1,275,638 | |||||||
| 4.00%, 07/01/2029 | 1,195,000 | 1,329,416 | |||||||
| 4.00%, 07/01/2030 | 1,245,000 | 1,388,196 | |||||||
| 4.00%, 07/01/2031 | 1,295,000 | 1,443,949 | |||||||
See accompanying Notes to Financial Statements.
| 2021 Annual Report | 43 |
Statement of Investments (continued)
October 31, 2021
Aberdeen Short Duration High Yield Municipal Fund
| Shares or Principal Amount | Value (US$) | ||||||||
| MUNICIPAL BONDS (continued) | |||||||||
| New York (continued) | |||||||||
| Amherst Development Corp. Revenue Bonds (Daemen College) 5.00%, 10/01/2025 | $ 600,000 | $ 668,627 | |||||||
| 5.00%, 10/01/2026 | 630,000 | 715,497 | |||||||
| 4.00%, 10/01/2037 | 500,000 | 523,043 | |||||||
| Brookhaven Local Development Corp. Revenue Bonds (Active Retirement Community, Inc.) 5.00%, 11/01/2021 | 300,000 | 300,000 | |||||||
| 5.00%, 11/01/2022 | 250,000 | 260,536 | |||||||
| Buffalo & Erie County Industrial Land Development Corp. Revenue Bonds (Charter School for Applied Technologies Project), 4.00%, 06/01/2022 | 455,000 | 459,152 | |||||||
| Build NYC Resource Corp. Revenue Bonds (Metropolitan Lighthouse Charter School Project), Series A 4.00%, 06/01/2022 (b) | 190,000 | 193,368 | |||||||
| 5.00%, 06/01/2023 (b) | 370,000 | 392,907 | |||||||
| 5.00%, 06/01/2024 (b) | 390,000 | 427,438 | |||||||
| 5.00%, 06/01/2025 (b) | 410,000 | 462,439 | |||||||
| 5.00%, 06/01/2026 (b) | 430,000 | 491,563 | |||||||
| 5.00%, 06/01/2027 (b) | 450,000 | 512,721 | |||||||
| 5.00%, 06/01/2032 (b) | 500,000 | 561,257 | |||||||
| Build NYC Resource Corp. Revenue Bonds (Richmond Preparatory Charter School Project), Series A, 4.00%, 06/01/2031 (b) | 650,000 | 697,874 | |||||||
| City of Elmira General Obligation Limited Bonds 5.00%, 07/01/2025 (b) | 1,125,000 | 1,289,604 | |||||||
| 5.00%, 07/01/2033 (b) | 2,635,000 | 3,111,258 | |||||||
| City of Ogdensburg General Obligation Limited Notes, 3.25%, 03/11/2022 | 415,849 | 416,263 | |||||||
| City of Poughkeepsie General Obligation Limited Bonds, 5.00%, 06/01/2031 | 455,000 | 516,828 | |||||||
| Madison Country Capital Resource Corp. Revenue Bonds (Cazenovia College Project), Series A, 5.50%, 09/01/2022 | 6,500,000 | 6,516,596 | |||||||
| Metropolitan Transportation Authority Revenue Bonds Series D, 5.00%, 11/15/2021 | 1,000,000 | 1,001,706 | |||||||
| 5.00%, 09/01/2022 | 2,000,000 | 2,077,582 | |||||||
| Series F, 5.00%, 11/15/2022 | 1,050,000 | 1,100,563 | |||||||
| Series C-1, 4.00%, 11/15/2032 | 3,000,000 | 3,352,236 | |||||||
| 5.00%, 11/15/2035 | 4,000,000 | 4,651,292 | |||||||
| Series D (Pre-refunded @ $100.000000, 11/15/2021), 5.00%, 11/15/2036 | 2,200,000 | 2,203,858 | |||||||
| Nassau County Tobacco Settlement Corp. Revenue Bonds, Series A-2, 5.25%, 06/01/2026 (c) | 1,150,000 | 1,178,841 | |||||||
| New York City Industrial Development Agency Revenue Bonds (Yankee Stadium LLC), (AGM), 2.50%, 03/01/2037 | 3,000,000 | 3,040,466 | |||||||
| New York State Dormitory Authority Revenue Bonds (Touro College And University System Obligated Group), Series A, 4.00%, 01/01/2023 | 445,000 | 461,249 | |||||||
| Shares or Principal Amount | Value (US$) | ||||||||
| New York State Dormitory Authority Revenue Bonds (Yeshiva University) 5.00%, 09/01/2022 | $1,640,000 | $ 1,643,720 | |||||||
| 5.00%, 09/01/2038 | 730,000 | 730,739 | |||||||
| New York State Energy Research & Development Authority Revenue Bonds, Series A, AMT, VRDN, 0.10%, 12/01/2027 (a) | 6,000,000 | 6,000,000 | |||||||
| New York State Environmental Facilities Corp. Revenue Bonds (Casella Waste Systems, Inc.), 2.75%, 09/01/2050 (a) | 1,000,000 | 1,034,630 | |||||||
| New York Transportation Development Corp. Revenue Bonds (American Airlines, Inc.), 2.25%, 08/01/2026 | 670,000 | 687,677 | |||||||
| 3.00%, 08/01/2031 | 530,000 | 565,085 | |||||||
| Suffolk County Economic Development Corp. Revenue Bonds (St Johnland Assisted Living, Inc.), 4.63%, 11/01/2031 (b) | 1,020,000 | 1,038,550 | |||||||
| Village of Johnson City General Obligation Limited Bonds, 5.00%, 10/01/2022 | 115,000 | 117,719 | |||||||
| Westchester County Local Development Corp. 2.88%, 07/01/2026 (b) | 1,000,000 | 1,000,107 | |||||||
| 3.20%, 07/01/2028 (b) | 1,675,000 | 1,675,445 | |||||||
| 3.60%, 07/01/2029 | 2,000,000 | 2,000,647 | |||||||
| Western Regional Off-Track Betting Corp. Revenue Bonds 3.00%, 12/01/2026 (b) | 1,340,000 | 1,328,124 | |||||||
| 4.13%, 12/01/2041 (b) | 1,900,000 | 1,855,501 | |||||||
| 66,191,567 | |||||||||
| North Carolina (0.2%) | |||||||||
| North Carolina Capital Facilities Finance Agency Revenue Bonds (Johnson & Wales University), Series A, 5.00%, 04/01/2028 | 795,000 | 838,214 | |||||||
| Ohio (4.6%) | |||||||||
| Buckeye Tobacco Settlement Financing Authority Tobacco Settlement Assets-Backed Revenue Bonds, 5.00%, 06/01/2055 | 7,615,000 | 8,545,090 | |||||||
| Cleveland-Cuyahoga County Port Authority Revenue Bonds, 5.00%, 12/01/2028 | 225,000 | 249,940 | |||||||
| Ohio Air Quality Development Authority Revenue Bonds (AK Steel Corp.), 6.75%, 06/01/2024 | 200,000 | 201,962 | |||||||
| Ohio Air Quality Development Authority Revenue Bonds (Ohio Valley Electric Corp. Project) Series B, VRN, 1.38%, 02/01/2026 (a) | 1,000,000 | 995,880 | |||||||
| Series C, VRN, 1.50%, 02/01/2026 (a) | 1,000,000 | 993,589 | |||||||
| Series A, 2.88%, 02/01/2026 | 1,000,000 | 1,045,167 | |||||||
| Series A, 3.25%, 09/01/2029 | 140,000 | 149,259 | |||||||
| Ohio Higher Educational Facility Commission Revenue Bonds 4.00%, 07/01/2022 | 845,000 | 865,042 | |||||||
| 4.00%, 07/01/2023 | 835,000 | 883,214 | |||||||
| 4.00%, 07/01/2024 | 865,000 | 942,641 | |||||||
| 4.00%, 07/01/2025 | 900,000 | 1,005,554 | |||||||
| 4.00%, 07/01/2026 | 935,000 | 1,065,153 | |||||||
See accompanying Notes to Financial Statements.
| 44 | 2021 Annual Report |
Statement of Investments (continued)
October 31, 2021
Aberdeen Short Duration High Yield Municipal Fund
| Shares or Principal Amount | Value (US$) | ||||||||
| MUNICIPAL BONDS (continued) | |||||||||
| Ohio (continued) | |||||||||
| 4.00%, 07/01/2027 | $ 975,000 | $ 1,125,010 | |||||||
| 4.00%, 07/01/2028 | 1,015,000 | 1,183,583 | |||||||
| 4.00%, 07/01/2029 | 1,055,000 | 1,245,176 | |||||||
| 20,496,260 | |||||||||
| Oregon (1.8%) | |||||||||
| Hospital Facilities Authority of Multnomah County Oregon Revenue Bonds Series B-2, 0.95%, 06/01/2027 | 1,000,000 | 979,095 | |||||||
| Series B, 1.20%, 06/01/2028 | 1,800,000 | 1,757,404 | |||||||
| 4.00%, 12/01/2036 | 1,235,000 | 1,376,994 | |||||||
| Port of Portland Revenue Bonds (Horizon Air Industries, Inc.), 0.07%, 06/15/2027 (a) | 1,900,000 | 1,900,000 | |||||||
| Yamhill County Hospital Authority Revenue Bonds (Friendsview Manor Obligated Group) 2.13%, 11/15/2027 | 500,000 | 497,889 | |||||||
| 2.50%, 11/15/2028 | 500,000 | 500,447 | |||||||
| 5.00%, 11/15/2036 | 875,000 | 1,035,487 | |||||||
| 8,047,316 | |||||||||
| Pennsylvania (4.0%) | |||||||||
| Allentown Neighborhood Improvement Zone Development Authority Tax Revenue Bonds, 5.00%, 05/01/2022 (b) | 345,000 | 351,384 | |||||||
| Coatesville School District General Obligation Limited Notes, 2.00%, 11/15/2021 | 3,000,000 | 3,000,942 | |||||||
| Dauphin County General Authority Revenue Bonds (Harrisburg University of Science and Technology Project) 4.00%, 10/15/2022 (b) | 240,000 | 245,125 | |||||||
| 4.25%, 10/15/2026 (b) | 1,250,000 | 1,352,110 | |||||||
| 5.00%, 10/15/2027 (b) | 1,650,000 | 1,828,592 | |||||||
| 5.00%, 10/15/2030 (b) | 3,000,000 | 3,484,205 | |||||||
| Delaware County Industrial Development Authority Revenue Bonds (CCSA Foundation), Series A, 4.38%, 06/01/2026 (b) | 2,185,000 | 2,345,130 | |||||||
| Indiana County Hospital Authority Revenue Bonds (Indiana Regional Medical Center), Series A, 5.00%, 06/01/2023 | 100,000 | 105,407 | |||||||
| Lehigh County Industrial Development Authority Revenue Bonds (Seven Generations Charter School), 4.00%, 05/01/2031 | 680,000 | 742,836 | |||||||
| Montgomery County Industrial Development Authority Revenue Bonds (Waverly Heights, Ltd. Project) 4.00%, 12/01/2027 | 180,000 | 205,109 | |||||||
| 4.00%, 12/01/2028 | 200,000 | 226,993 | |||||||
| 4.00%, 12/01/2029 | 100,000 | 113,070 | |||||||
| 4.00%, 12/01/2035 | 300,000 | 334,931 | |||||||
| 4.00%, 12/01/2036 | 100,000 | 111,473 | |||||||
| 4.00%, 12/01/2038 | 300,000 | 333,595 | |||||||
| Philadelphia Authority for Industrial Development Revenue Bonds (Discovery Charter School Project), 5.00%, 04/01/2022 | 150,000 | 152,174 | |||||||
| Philadelphia School District General Obligation Limited Bonds, Series F, 5.00%, 09/01/2024 | 2,000,000 | 2,254,787 | |||||||
| Shares or Principal Amount | Value (US$) | ||||||||
| Pottsville Hospital Facilities Authority Health Center Revenue Bonds (Lehigh Valley Health Network Obligated Group), 5.75%, 07/01/2022 (b) | $ 55,000 | $ 57,023 | |||||||
| Scranton School District General Obligation Limited Bonds Series B, 5.00%, 06/01/2023 | 100,000 | 107,200 | |||||||
| Series B, 5.00%, 06/01/2024 | 100,000 | 111,085 | |||||||
| Series B, 5.00%, 06/01/2025 | 100,000 | 114,814 | |||||||
| Series D, 5.00%, 06/01/2027 | 345,000 | 397,827 | |||||||
| 17,975,812 | |||||||||
| Puerto Rico (2.6%) | |||||||||
| Commonwealth of Puerto Rico Public Improvement General Obligation Unlimited Bonds (AGC-ICC), 5.50%, 07/01/2022 | 1,580,000 | 1,597,135 | |||||||
| Series A, 5.00%, 07/01/2027 | 110,000 | 110,765 | |||||||
| Electric Power Authority Revenue Bonds, Series V, 5.25%, 07/01/2026 | 1,290,000 | 1,381,206 | |||||||
| Puerto Rico Electric Power Authority Revenue Bonds Series SS, 5.00%, 07/01/2022 | 260,000 | 263,595 | |||||||
| Series PP, 5.00%, 07/01/2023 | 205,000 | 207,834 | |||||||
| Series SS, 5.25%, 07/01/2023 (c) | 2,340,000 | 2,428,563 | |||||||
| Series PP, 5.00%, 07/01/2024 | 835,000 | 846,545 | |||||||
| Series UU, 5.00%, 07/01/2024 | 300,000 | 302,088 | |||||||
| Puerto Rico Highway & Transportation Authority Revenue Bonds Series BB, 5.25%, 07/01/2022 | 100,000 | 101,084 | |||||||
| Series L, 5.25%, 07/01/2023 | 520,000 | 541,155 | |||||||
| Series E, 5.50%, 07/01/2023 | 200,000 | 211,543 | |||||||
| Series D, 5.00%, 07/01/2027 | 145,000 | 146,009 | |||||||
| (AGM-CR), 5.50%, 07/01/2030 | 1,000,000 | 1,122,251 | |||||||
| Puerto Rico Public Buildings Authority Revenue Bonds 6.00%, 07/01/2023 | 1,000,000 | 1,048,081 | |||||||
| (NATL COMWLTH GTD), 6.00%, 07/01/2025 | 1,095,000 | 1,200,349 | |||||||
| 11,508,203 | |||||||||
| Rhode Island (0.3%) | |||||||||
| Rhode Island Health & Educational Building Corp. Revenue Bonds (Care New England Health System Obligated Group), Series B 5.00%, 09/01/2022 | 680,000 | 701,194 | |||||||
| 5.00%, 09/01/2023 | 500,000 | 533,421 | |||||||
| 1,234,615 | |||||||||
| South Carolina (1.4%) | |||||||||
| South Carolina Jobs-Economic Development Authority Revenue Bonds (Last Step Recycling LLC), 6.00%, 06/01/2031 (b) | 2,915,000 | 2,973,409 | |||||||
| 6.25%, 06/01/2040 (b) | 2,000,000 | 2,052,612 | |||||||
| South Carolina Jobs-Economic Development Authority Revenue Bonds (Prisma Health Obligated Group), Series C, VRDN, 0.15%, 05/01/2048 (a) | 600,000 | 600,000 | |||||||
See accompanying Notes to Financial Statements.
| 2021 Annual Report | 45 |
Statement of Investments (continued)
October 31, 2021
Aberdeen Short Duration High Yield Municipal Fund
| Shares or Principal Amount | Value (US$) | ||||||||
| MUNICIPAL BONDS (continued) | |||||||||
| South Carolina (continued) | |||||||||
| South Carolina Jobs-Economic Development Authority Revenue Bonds (RePower South Berkeley LLC), 5.25%, 02/01/2027 (b)(d) | $1,060,000 | $ 424,000 | |||||||
| 6,050,021 | |||||||||
| Tennessee (0.7%) | |||||||||
| Metropolitan Government Nashville & Davidson Health & Educational Facilities Revenue Bonds (Trevecca Nazarene University Project) 4.00%, 10/01/2023 | 135,000 | 142,529 | |||||||
| 4.00%, 10/01/2024 | 170,000 | 182,868 | |||||||
| 4.00%, 10/01/2025 | 175,000 | 191,574 | |||||||
| 4.00%, 10/01/2026 | 150,000 | 166,679 | |||||||
| 4.00%, 10/01/2027 | 195,000 | 219,159 | |||||||
| 4.00%, 10/01/2028 | 200,000 | 227,079 | |||||||
| 4.00%, 10/01/2029 | 200,000 | 225,413 | |||||||
| 5.00%, 10/01/2029 | 300,000 | 353,128 | |||||||
| 4.00%, 10/01/2030 | 210,000 | 235,263 | |||||||
| 4.00%, 10/01/2031 | 215,000 | 240,034 | |||||||
| 5.00%, 10/01/2034 | 90,000 | 108,358 | |||||||
| 4.00%, 10/01/2041 | 905,000 | 989,458 | |||||||
| 3,281,542 | |||||||||
| Texas (6.6%) | |||||||||
| Arlington Higher Education Finance Corp. Revenue Bonds (Wayside Schools), 5.00%, 08/15/2022 | 55,000 | 56,572 | |||||||
| 5.00%, 08/15/2023 | 155,000 | 164,692 | |||||||
| 5.00%, 08/15/2024 | 195,000 | 212,991 | |||||||
| 5.00%, 08/15/2025 | 205,000 | 229,219 | |||||||
| 5.00%, 08/15/2026 | 190,000 | 216,913 | |||||||
| 5.00%, 08/15/2027 | 200,000 | 231,475 | |||||||
| 5.00%, 08/15/2028 | 80,000 | 92,081 | |||||||
| 4.00%, 08/15/2029 | 75,000 | 82,040 | |||||||
| 4.00%, 08/15/2030 | 80,000 | 87,124 | |||||||
| 4.00%, 08/15/2031 | 90,000 | 97,819 | |||||||
| 4.00%, 08/15/2036 | 230,000 | 248,187 | |||||||
| Bexar County Health Facilities Development Corp. Revenue Bonds (Army Retirement Residence Obligation Group) 5.00%, 07/15/2023 | 300,000 | 318,261 | |||||||
| 5.00%, 07/15/2024 | 150,000 | 164,186 | |||||||
| Board of Managers Joint Guadalupe County-City of Seguin Hospital Revenue Bonds, 5.00%, 12/01/2021 | 500,000 | 501,461 | |||||||
| Calhoun County Navigation Industrial Development Authority Revenue Bonds (Max Midstream Texas LLC), Series A, 3.63%, 07/01/2026 (b) | 4,000,000 | 4,102,747 | |||||||
| Decatur Hospital Authority Revenue Bonds, Series A, 5.00%, 09/01/2022 | 150,000 | 155,235 | |||||||
| Decatur Hospital Authority Revenue Bonds (Wise Regional Health System), Series A, 5.00%, 09/01/2023 | 275,000 | 295,670 | |||||||
| Shares or Principal Amount | Value (US$) | ||||||||
| Harris County Cultural Education Facilities Finance Corp. Revenue Bonds (Brazos Presbyterian Homes, Inc.), 5.00%, 01/01/2027 | $ 895,000 | $ 988,210 | |||||||
| New Hope Cultural Education Facilities Finance Corp. Revenue Bonds (Cardinal Bay, Inc.) Series C, 5.00%, 07/01/2023 | 300,000 | 294,365 | |||||||
| Series D, 6.00%, 07/01/2026 | 95,000 | 91,555 | |||||||
| New Hope Cultural Education Facilities Finance Corp. Revenue Bonds (Sanctuary LTC Project), Series A-1, 5.00%, 01/01/2032 | 4,000,000 | 3,962,052 | |||||||
| Port Beaumont Navigation District Revenue Bonds (Jefferson Railport Terminal II LLC), Series A, 3.63%, 01/01/2035 (b) | 1,500,000 | 1,542,015 | |||||||
| Port of Beaumont Navigation District of Jefferson County Dock & Wharf Facilities Revenue Bonds (Jefferson Gulf Coast Energy Project), AMT 1.88%, 01/01/2026 (b) | 500,000 | 498,304 | |||||||
| 2.00%, 01/01/2027 (b) | 200,000 | 199,121 | |||||||
| 2.13%, 01/01/2028 (b) | 200,000 | 199,023 | |||||||
| 2.25%, 01/01/2029 (b) | 500,000 | 497,041 | |||||||
| 2.50%, 01/01/2030 (b) | 350,000 | 347,689 | |||||||
| 2.63%, 01/01/2031 (b) | 400,000 | 397,250 | |||||||
| 2.75%, 01/01/2036 (b) | 750,000 | 738,709 | |||||||
| Port of Port Arthur Navigation District Revenue Bonds, VRDN, 0.15%, 11/01/2040 (a) | 5,000,000 | 5,000,000 | |||||||
| Port of Port Arthur Navigation District Revenue Bonds (Motiva Enterprises LLC), 0.08%, 04/01/2040 (a) | 900,000 | 900,000 | |||||||
| SA Energy Acquisition Public Facility Corp. Revenue Bonds 5.50%, 08/01/2022 | 80,000 | 83,064 | |||||||
| 5.50%, 08/01/2023 | 50,000 | 54,347 | |||||||
| Tarrant County Cultural Education Facilities Finance Corp. Revenue Bonds (Buckingham Senior Living Community, Inc.) Series A, 4.50%, 11/15/2021 (d)(e) | 695,000 | 396,150 | |||||||
| Series B-1, 5.63%, 11/15/2024 | 1,100,000 | 1,101,975 | |||||||
| Texas Municipal Gas Acquisition & Supply Corp. I Revenue Bonds Series C, 1.53%, 12/15/2026 (a)(c) | 1,500,000 | 1,500,179 | |||||||
| Series D, 6.25%, 12/15/2026 | 2,050,000 | 2,370,897 | |||||||
| Texas Municipal Gas Acquisition & Supply Corp. III Revenue Bonds 5.00%, 12/15/2029 | 250,000 | 313,540 | |||||||
| 5.00%, 12/15/2030 | 375,000 | 476,787 | |||||||
| Texas Public Finance Authority Revenue Bonds (Texas Southern University), 5.00%, 11/01/2021 | 100,000 | 100,000 | |||||||
| 29,308,946 | |||||||||
| U. S. Virgin Islands (0.3%) | |||||||||
| Virgin Islands Public Finance Authority Revenue Bonds, Series A, 5.00%, 10/01/2032 | 1,210,000 | 1,248,124 | |||||||
See accompanying Notes to Financial Statements.
| 46 | 2021 Annual Report |
Statement of Investments (continued)
October 31, 2021
Aberdeen Short Duration High Yield Municipal Fund
| Shares or Principal Amount | Value (US$) | ||||||||
| MUNICIPAL BONDS (continued) | |||||||||
| Utah (2.1%) | |||||||||
| Utah Charter School Finance Authority Revenue Bonds (Esperanza Elementary School), Series A 4.50%, 10/15/2028 (b) | $ 500,000 | $ 514,979 | |||||||
| 4.63%, 10/15/2048 (a)(b) | 1,000,000 | 1,022,896 | |||||||
| Utah Charter School Finance Authority Revenue Bonds (Freedom Academy Foundation), 3.25%, 06/15/2031 (b) | 535,000 | 546,992 | |||||||
| Utah Charter School Finance Authority Revenue Bonds (Scholar Academy), Series A, 4.50%, 04/15/2048 (a)(b) | 3,000,000 | 3,047,026 | |||||||
| Utah Charter School Finance Authority Revenue Bonds (Wasatch Waldorf Charter School, Inc.), Series A, 4.75%, 05/15/2048 (a)(b) | 4,310,000 | 4,371,762 | |||||||
| 9,503,655 | |||||||||
| Washington (3.7%) | |||||||||
| State Housing Finance Commission Revenue Bonds (Transforming Age Project), Series A 5.00%, 01/01/2024 (b) | 180,000 | 192,404 | |||||||
| 5.00%, 01/01/2028 (b) | 440,000 | 509,658 | |||||||
| 5.00%, 01/01/2029 (b) | 465,000 | 537,029 | |||||||
| 5.00%, 01/01/2034 (b) | 745,000 | 846,392 | |||||||
| Washington State Housing Finance Commission Revenue Bonds (Mirabella), 6.00%, 10/01/2022 (b) | 260,000 | 273,719 | |||||||
| Washington State Housing Finance Commission Revenue Bonds (Presbyterian Retirement Communities Northwest Obligated Group), 5.00%, 01/01/2023 (b) | 35,000 | 35,813 | |||||||
| Washington State Housing Finance Commission Revenue Bonds (Spokane International Academy), Series A 4.00%, 07/01/2025 (b) | 355,000 | 382,565 | |||||||
| 4.00%, 07/01/2026 (b) | 285,000 | 311,053 | |||||||
| 4.00%, 07/01/2027 (b) | 295,000 | 324,446 | |||||||
| 4.00%, 07/01/2028 (b) | 305,000 | 336,858 | |||||||
| 4.00%, 07/01/2029 (b) | 320,000 | 354,457 | |||||||
| Washington State Housing Finance Commission Revenue Bonds(Eliseo Project) Series B-2, 2.13%, 07/01/2027 (b) | 2,750,000 | 2,727,435 | |||||||
| Series B-1, 2.50%, 07/01/2028 (b) | 4,375,000 | 4,358,935 | |||||||
| Series A, 4.00%, 01/01/2031 (b) | 5,035,000 | 5,410,562 | |||||||
| 16,601,326 | |||||||||
| West Virginia (0.3%) | |||||||||
| Glenville State College Board of Governors Revenue Bonds 3.25%, 06/01/2022 | 170,000 | 170,191 | |||||||
| 4.00%, 06/01/2027 | 250,000 | 254,592 | |||||||
| Ohio County Development Authority Revenue Bonds (Ohio County Sport Complex Project), 4.00%, 09/01/2023 | 840,000 | 846,183 | |||||||
| 1,270,966 | |||||||||
| Shares or Principal Amount | Value (US$) | ||||||||
| Wisconsin (4.3%) | |||||||||
| Public Finance Authority Revenue Bonds Series A, 5.00%, 10/01/2024 (b) | $ 2,100,000 | $ 2,318,267 | |||||||
| 6.00%, 01/01/2027 | 4,100,000 | 4,218,638 | |||||||
| Series A, 5.00%, 10/01/2029 (b) | 500,000 | 608,461 | |||||||
| Public Finance Authority Revenue Bonds (Masonic & Eastern Star Home of NC, Inc.) Series B-2, 3.00%, 03/01/2026 (b) | 790,000 | 790,606 | |||||||
| 3.50%, 03/01/2027 (b) | 4,000,000 | 4,003,370 | |||||||
| Public Finance Authority Revenue Bonds (Washoe Barton Medical Clinic), Series A 3.00%, 12/01/2026 | 250,000 | 266,450 | |||||||
| 4.00%, 12/01/2031 | 700,000 | 824,154 | |||||||
| Public Finance Authority Revenue Bonds (Wonderful Foundations Charter School Holdings LLC), Series A-1, 4.50%, 01/01/2035 (b) | 1,000,000 | 1,071,049 | |||||||
| Wisconsin Health & Educational Facilities Authority Revenue Bond 5.00%, 11/01/2022 | 120,000 | 123,549 | |||||||
| 5.00%, 11/01/2023 | 360,000 | 380,606 | |||||||
| Wisconsin Public Finance Authority Educational Facilities Revenue Bonds (Barton College), Series A 5.00%, 03/01/2023 | 850,000 | 863,752 | |||||||
| 5.00%, 03/01/2028 | 1,190,000 | 1,281,370 | |||||||
| Wisconsin Public Finance Authority Educational Facilities Revenue Bonds (Guilford College) 5.00%, 01/01/2026 | 685,000 | 758,592 | |||||||
| 5.00%, 01/01/2027 | 830,000 | 925,043 | |||||||
| Wisconsin Public Finance Authority Educational Facilities Revenue Bonds (Piedmont Community Charter School) 5.00%, 06/15/2022 | 185,000 | 189,479 | |||||||
| 5.00%, 06/15/2024 | 210,000 | 230,547 | |||||||
| 5.00%, 06/15/2026 | 230,000 | 265,834 | |||||||
| 5.00%, 06/15/2027 | 160,000 | 188,682 | |||||||
| Wisconsin Public Finance Authority Revenue Bonds (Roseman University of Health Sciences), 5.00%, 04/01/2022 | 100,000 | 101,571 | |||||||
| 19,410,020 | |||||||||
| Total Municipal Bonds | 456,992,053 | ||||||||
| SHORT-TERM INVESTMENT (0.1%) | |||||||||
| UNITED STATES (0.1%) | |||||||||
| BlackRock Liquidity Funds MuniCash Portfolio, Institutional Shares | 180,734 | 180,752 | |||||||
| Total Short-Term Investment | 180,752 | ||||||||
| Total Investments (Cost $450,916,957) (f)—102.4% | 457,172,805 | ||||||||
| Liabilities in Excess of Other Assets—(2.4)% | (10,549,993 | ) | |||||||
| Net Assets—100.0% | $446,622,812 | ||||||||
See accompanying Notes to Financial Statements.
| 2021 Annual Report | 47 |
Statement of Investments (concluded)
October 31, 2021
Aberdeen Short Duration High Yield Municipal Fund
| (a) | Variable Rate Instrument. The rate shown is based on the latest available information as of October 31, 2021. Certain variable rate securities are not based on a published reference rate and spread but are determined by the issuer or agent and are based on current market conditions. These securities do not indicate a reference rate and spread in their description. |
| (b) | Denotes a security issued under Regulation S or Rule 144A. |
| (c) | All or a portion of the security has been designated as collateral for when issued trading. When-issued trading is trading in securities that have been authorized but not yet been issued. |
| (d) | Security is in default. |
| (e) | Illiquid security. |
| (f) | See accompanying Notes to Financial Statements for tax unrealized appreciation/(depreciation) of securities. |
FRN Floating Rate Note
See accompanying Notes to Financial Statements.
| 48 | 2021 Annual Report |
Aberdeen Ultra Short Municipal Income Fund (Unaudited)
Aberdeen Ultra Short Municipal Income Fund returned 0.21% (Institutional Class shares net of fees) for the 12-month reporting period ended October 31, 2021, versus the 0.50% return of its benchmark, the Bloomberg Municipal Bond: 1 Year (1-2) Index, during the same period.
Market/economic review
The overall U.S. municipal (muni) bond market generated a positive return during the reporting period, with the Bloomberg Municipal Bond Index,1 a broad municipal bond market benchmark, gaining 2.64%, while the corporate taxable bond market, as measured by the Bloomberg U.S. Aggregate Bond Index,2 returned –0.48%.
Both the muni and taxable bond markets faced headwinds from rising interest rates. They moved higher as the economy rebounded from its pandemic-induced downturn, inflation increased and the U.S. Federal Reserve (Fed) indicated that it would soon begin tapering back its accommodative monetary policy. While the muni market generated positive returns during eight of the 12 months of the reporting period, a portion of its gains were given back during several periods of weakness.
Fund performance
Over the reporting period, the Fund's effective average duration3 increased incrementally but remained at a low level of 106 days, compared to an average maturity of more than one year for its benchmark, the Bloomberg Municipal Bond: 1 Year (1-2) Index. This enabled the Fund to maintain a relatively stable net asset value (NAV).
The short end of the municipal bond curve saw yields increase slightly during the reporting period, as the Fed kept monetary policy loose, but began to signal an end to its accommodative stance. The Fund experienced relatively low movement in NAV versus fluctuations in the benchmark index. Major contributors to the stability of the Fund's NAV were positions in floating-rate securities and variable rate demand notes (VRDNs), which comprised more than 70% of its net assets as of the end of the reporting period. VRDNs trade at par value and do not fluctuate during periods of interest-rate volatility, although their rates reset daily or weekly, which allows the Fund to
capture increased yields when interest rates move up. The Fund's performance relative to the benchmark was mainly hampered by underweight exposures to fixed-coupon AAA-rated and AA-rated4 securities, as well as underweight duration in these credits, as their spreads compressed5 over the period. Both portfolio weighting and security selection in BBB and non-rated securities helped to counterbalance underweighting high-grade securities, as the Fund's holdings in these securities outperformed those represented in the benchmark.
Contributors to the Fund's performance included positions in economic development, mass transit, housing and prepaid gas bonds. Conversely, the Fund's performance was hampered by underweight positions in appropriation-backed bonds,6 state general obligation bonds, as well as toll roads and airports.
Market outlook
Following the recent passage of the Infrastructure Investment and Jobs Act, which includes more than $500 billion in new infrastructure spending, we've become slightly more optimistic on municipal credit fundamentals and overall performance. The bill did not contain some key measures that would have resulted in possible headwinds to municipal performance in 2022, such as reintroduction of advanced refunding, which could have resulted in a substantial uptick in supply. Additionally, we believe the increase in federal spending on infrastructure should lighten the load for both state and local municipalities as they pay for infrastructure needs. However, despite our near-term optimism, we believe that prudent investors should still exercise caution with a broad-based approach to the space, as the potential passage of the Build Back Better bill, which focuses more on social infrastructure spending, could yet result in headwinds to municipal performance as we get into the next year. Additionally, the threat of more persistent inflation and a change to Fed policy remains a risk to fixed income as you extend out the yield curve.
We maintain our expectation for a slight supply pickup in the fourth quarter of 2021, which could continue into 2022, although not to the degree it could have if issuers had been able to make use of tax-exempt advanced refunding. The recent passage of a $1.2 trillion infrastructure agreement should only modestly increase muni supply over the medium term, in our opinion. While this uptick in supply
| 1 | The Bloomberg Municipal Bond Index tracks the performance of investment-grade, tax-exempt bonds with a maturity of at least one year. Indexes are unmanaged and have been provided for comparison purposes only. No fees or expenses are reflected. You cannot invest directly in an index. |
| 2 | The Bloomberg U.S. Aggregate Bond Index is a broad-based flagship benchmark that measures the investment-grade, U.S. dollar-denominated, fixed-rate taxable bond market. |
| 3 | Duration is an estimate of bond price sensitivity to changes in interest rates. The higher the duration, the greater the change (i.e., higher risk) in relation to interest-rate movements. |
| 4 | The credit ratings of S&P Global Ratings, Moody's Investors Services, Inc., and Fitch Ratings express the respective agencies' opinion about the ability and willingness of an issuer, such as a corporation or state or city government, to meet its financial obligations in full and on time. Typically, ratings are expressed as letter grades that range, for example, from AAA to D (Aaa to C for Moody's) to communicate the agency's opinion of relative level of credit risk. Ratings from AA to CCC may be modified by the addition of a plus (+) or minus (-) sign to show relative standing within the major rating categories. |
| 5 | When a bond price rises, its yield declines. The spread on bonds is usually expressed as the difference between bonds of the same maturity but different credit quality. Spread compression occurs when the yield on a previously higher-yielding bond comes down due to strong demand. |
| 6 | Appropriation bonds are backed by appropriations of a state or local government and are often structured as leases under state law. They are not legal debts of the government. |
| 2021 Annual Report | 49 |
Aberdeen Ultra Short Municipal Income Fund (Unaudited) (concluded)
could create a slight headwind for the space, we expect municipal demand to remain positive through the fourth quarter and much of the first quarter of 2022.
Despite strong municipal fundamentals and near-term technicals that seem rather sanguine, we expect the Treasury yield curve to continue to steepen and shift upward as the Fed rolls back quantitative easing and looks to start tightening rates. This could continue to put pressure on the municipal curve to shift, thus hampering total returns. Nonetheless, we believe short-term muni rates will remain anchored at the front end of the yield curve, with a steepening curve into 2022 until the Fed signals an interest-rate hike However, it is worth noting that, as of the end of the reporting period, nine of the 18 Federal Open Market Committee (FOMC) participants expect an interest-rate hike in 2022, and the markets have priced in a rate increase in June/July 2022.
For these reasons, while we expect the fundamental backdrop for municipalities to remain largely favorable and near-term technicals to remain slightly bullish, we believe overall muni market performance could be pressured should inflation persist. We still see opportunities in select issuers that we believe will benefit as the economy continues to rebound, particularly in sectors such as higher education, transportation and senior living. In terms of yield-curve positioning, we still believe that retaining the Fund's conservative weighting maintains a more stable NAV headed into what could be a higher interest-rate environment. With a relatively shorter duration than that of the benchmark, we feel the Fund should be insulated from sharp movements in its NAV.
Against this backdrop, we think that shorter-duration and lower-quality credits have the potential to outperform at the front end of the curve, with yields ticking up in the belly of the curve as investors try to get ahead of any expected Fed taper. In terms of yield-curve positioning, as we get closer to mid-2022 and have more clarity around a Fed interest-rate hike, we would expect to be paring back in duration. Despite the recent increase to the Fund's duration, we believe retaining its conservative positioning relative to benchmark and shortening duration as an interest-rate hike approaches helps to maintain a more stable NAV, while also maximizing the Fund's yield. With a relatively shorter duration, we feel that the Fund should be insulated from sharp movements in its NAV.
Portfolio Management:
U.S. Municipal Team
PAST PERFORMANCE DOES NOT GUARANTEE FUTURE RESULTS.
The performance data quoted represents past performance and current returns may be lower or higher. Class A Shares are not subject to a front-end sales charge and are subject to a 0.25% 12b-1 fee. Class A1 Shares have up to a 0.50% sales charge and have a 0.25% 12b-1fee. The performance data quoted represents past performance and current returns may be lower or higher. The investment return and principal value will fluctuate so that an investor's shares, when redeemed, may be worth more or less than the original cost. To obtain performance information current to the most recent month-end, which may be higher or lower than the performance shown above, please call 866-667-9231 or go to https://www.abrdn.com/en-us/us/investor/fund-centre.
Investing in mutual funds involves risk, including the possible loss of principal.
Indexes are unmanaged and have been provided for comparison purposes only. No fees or expenses are reflected. You cannot invest directly in an index.
Risk Considerations
Deteriorating market conditions might cause a general weakness in the market that reduces the prices, or yield, of securities in those markets in which the Fund invests.
Fixed income securities are subject to, among other risks, credit risk, extension risk, issuer risk, interest rate risk, market risk and prepayment risk.
The Fund is subject to the risk that the Adviser or Subadviser may make poor security selections.
Municipal bonds can be significantly affected by political and economic changes, including inflation, as well as uncertainties in the municipal market related to taxation, legislative changes, or the rights of municipal security holders.
The amount of income received by the Fund will go up or down depending on day-to-day variations in short-term interest rates, and when interest rates are very low the Fund's expenses could absorb all or a significant portion of the Fund's income.
Please read the prospectus for more detailed information regarding these and other risks.
| 50 | 2021 Annual Report |
Aberdeen Ultra Short Municipal Income Fund (Unaudited)
| Average Annual Total Return1 (For periods ended October 31, 2021) | 1 Yr. | 5 Yr. | 10 Yr. | |||||||||||
| Class A | w/o SC | 0.02% | 0.75% | 0.56% | ||||||||||
| Class A12 | w/o SC | 0.02% | 0.78% | 0.57% | ||||||||||
| w/SC3 | -0.47% | 0.68% | 0.52% | |||||||||||
| Institutional Class4 | w/o SC | 0.21% | 0.97% | 0.80% | ||||||||||
All figures showing the effect of a sales charge (SC) reflect the maximum charge possible because it has the most significant effect on performance data. The total returns shown above do not include the impact of financial statement rounding of the net asset value (NAV) per share and/or financial statement adjustments.
| 1 | Returns prior to May 7, 2018 reflect the performance of a predecessor fund (the "Predecessor Fund"). Returns of the Predecessor Fund have not been adjusted to reflect the expenses applicable to the respective classes. The Fund and the Predecessor Fund have substantially similar investment objectives and strategies. Please consult the Fund's prospectus for more detail. |
| 2 | Returns before the first offering of Class A1 (February 28, 2019) are based on the previous performance of Class A. Returns of the class have not been adjusted to reflect the expenses applicable to the respective classes. Excluding the effect of any fee waivers or reimbursements, this performance is substantially similar to what Class A would have produced because all classes invest in the same portfolio of securities. Returns for Class A shares would only differ to the extent of the difference in expenses of the classes. |
| 3 | A 0.50% front-end sales charge was deducted. |
| 4 | Not subject to any sales charges. |
Performance of a $1,000,000 Investment* (as of October 31, 2021)
| Comparative performance of $1,000,000 invested in Institutional Class shares of the Aberdeen Ultra Short Municipal Income Fund, Bloomberg Barclays Municipal Bond: 1 Year (1-2) Index and the Consumer Price Index (CPI) over a 10-year period ended October 31, 2021. Unlike the Fund, the returns for these unmanaged indexes do not reflect any fees, expenses, or sales charges. Investors cannot invest directly in market indexes.
The Bloomberg Barclays Municipal Bond: 1 Year (1-2) Index is a total return benchmark of BAA3 ratings or better designed to measure returns for tax exempt assets.
The CPI is a measure of the average change over time in the prices paid by urban consumers for a market basket of consumer goods and services. |
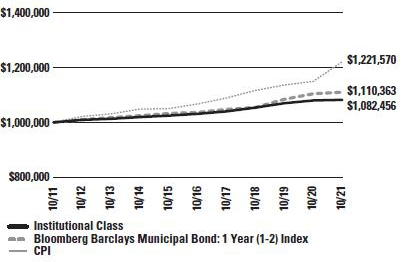
* Minimum Initial Investment
Investment return and principal value will fluctuate, and when redeemed, shares may be worth more or less than original cost. Past performance is no guarantee of future results. The Average Annual Total Return table and Performance graph do not reflect the deduction of taxes that a shareholder would pay on fund distributions or the redemption of fund shares. Investing in mutual funds involves market risk, including loss of principal. Performance returns assume the reinvestment of all distributions. Total returns reflect waivers and reimbursements in effect, without which returns would have been lower.
| 2021 Annual Report | 51 |
Aberdeen Ultra Short Municipal Income Fund (Unaudited)
Portfolio Summary (as a percentage of net assets)
October 31, 2021 (Unaudited)
| Asset Allocation | ||
| Municipal Bonds | 100.1% | |
| Certificates of Deposit | 4.1% | |
| Money Market Fund | –% | |
| Liabilities in Excess of Other Assets | (4.2%) | |
| 100.0% |
Amounts listed as "–" are 0% or round to 0%.
| Top Holdings* | ||
| Mississippi Business Finance Corp. Revenue Bonds (PSL-North America), Series A 11/01/2032 | 6.5% | |
| Maryland Industrial Development Financing Authority Revenue Bonds (Occidental Petroleum Corp.) 03/01/2030 | 4.4% | |
| California Pollution Control Financing Authority Revenue Bonds (Republic Services, Inc.), Series A 08/01/2023 | 2.7% | |
| Pennsylvania Economic Development Financing Authority Revenue Bonds (Republic Services, Inc.), Series B 04/01/2049 | 2.6% | |
| Wisconsin Health & Educational Facilities Authority Revenue Bonds 02/15/2053 | 2.5% | |
| Rondout Valley Central School District Accord Ulster County, NJ General Obligation Anticipation Notes, (State Aid Withholding) 06/29/2022 | 2.4% | |
| Black Belt Energy Gas District Revenue Bonds, FRN 12/01/2048 | 2.1% | |
| Mississippi Hospital Equipment & Facilities Authority Revenue Refunding Bonds (Baptist Memorial Health Care Corp.), Series A-2, VRN 09/01/2036 | 2.1% | |
| Oklahoma Development Finance Authority Revenue Bonds (INTEGRIS Health Obligated Group), VRDN 08/15/2031 | 2.0% | |
| Health Care Authority for Baptist Health Revenue Bonds, Series B 11/01/2042 | 2.0% | |
| Other | 70.7% | |
| 100.0% |
| * | For the purpose of listing top holdings, Short-Term Investments are included as part of Other. |
| Top States | ||
| New York | 21.9% | |
| Mississippi | 10.8% | |
| California | 9.6% | |
| New Jersey | 7.6% | |
| Alabama | 6.2% | |
| Pennsylvania | 6.1% | |
| Texas | 5.3% | |
| Maryland | 5.1% | |
| Wisconsin | 4.1% | |
| Georgia | 2.9% | |
| Other | 20.4% | |
| 100.0% |
| 52 | 2021 Annual Report |
Statement of Investments
October 31, 2021
Aberdeen Ultra Short Municipal Income Fund
| Shares or Principal Amount | Value (US$) | |||||||
| MUNICIPAL BONDS (100.1%) | ||||||||
| Alabama (6.2%) | ||||||||
| Black Belt Energy Gas District Revenue Bonds, FRN, 0.96%, 12/01/2048 (a) | $ | 20,000,000 | $ | 20,100,558 | ||||
| Health Care Authority for Baptist Health Revenue Bonds, Series B 0.19%, 11/15/2037 (a) | 13,125,000 | 13,125,000 | ||||||
| 0.20%, 11/01/2042 (a) | 19,100,000 | 19,100,000 | ||||||
| Lower Alabama Gas District Revenue Bonds, VRN, 4.00%, 12/01/2050 (a) | 5,895,000 | 6,611,690 | ||||||
| 58,937,248 | ||||||||
| Arizona (0.6%) | ||||||||
| Cochise County Pollution Control Corp. Revenue Bonds (Arizona Electric Power Cooperative, Inc.), 0.30%, 09/01/2024 (a) | 6,100,000 | 6,099,369 | ||||||
| California (9.6%) | ||||||||
| California Infrastructure & Economic Development Bank Revenue Bonds (DesertXpress Enterprises LLC), AMT, FRN, 0.20%, 01/01/2050 (a)(b) | 13,135,000 | 13,133,148 | ||||||
| California Municipal Finance Authority Solid Waste Disposal Revenue Bonds (Waste Management, Inc.), AMT, FRN, 0.15%, 10/01/2045 (a) | 6,000,000 | 6,000,476 | ||||||
| California Pollution Control Financing Authority Revenue Bonds (Republic Services, Inc.) Series A, 0.18%, 08/01/2023 (a)(b) | 26,000,000 | 26,000,000 | ||||||
| AMT, FRN, 0.18%, 11/01/2042 (a)(b) | 7,000,000 | 6,999,478 | ||||||
| California Statewide Communities Development Authority Revenue Bonds (Catholic Healthcare West), Series E, 0.20%, 07/01/2040 (a) | 4,100,000 | 4,100,000 | ||||||
| California Statewide Communities Development Authority Revenue Bonds (CommonSpirit Health Obligated Group), Series F, 0.01%, 07/01/2040 (a) | 1,850,000 | 1,850,000 | ||||||
| California Statewide Communities Development Authority Revenue Bonds (Dignity Health Obligated Group), Series D, 0.01%, 07/01/2041 (a) | 500,000 | 500,000 | ||||||
| California Statewide Communities Development Authority Revenue Bonds (Westgate Pasadena Apartments Project), Series B, 0.23%, 04/01/2042 (a) | 8,935,000 | 8,935,000 | ||||||
| Contra Costa Country California School Tax and Revenue Anticipation Notes, 2.00%, 12/01/2021 | 4,500,000 | 4,505,979 | ||||||
| Palomar Pomerado Health Care Certificates of Participation Series B, 0.40%, 11/01/2036 (a) | 675,000 | 675,000 | ||||||
| Series C, 0.76%, 11/01/2036 (a) | 13,400,000 | 13,400,000 | ||||||
| Series A, 0.78%, 11/01/2036 (a) | 5,225,000 | 5,225,000 | ||||||
| Tender Option Bond Trust Receipts Revenue Bonds, VRDN, 0.21%, 02/01/2036 (a)(b) | 740,000 | 740,000 | ||||||
| 92,064,081 | ||||||||
| Shares or Principal Amount | Value (US$) | |||||||
| Colorado (0.2%) | ||||||||
| E-470 Public Highway Authority Revenue Bonds, Series B, FRN, 0.38%, 09/01/2039 (a) | $ | 1,500,000 | $ | 1,503,200 | ||||
| Connecticut (0.9%) | ||||||||
| City of Bridgeport General Obligation Unlimited Notes, 1.50%, 12/09/2021 | 4,200,000 | 4,203,854 | ||||||
| City of West Haven General Obligation Unlimited Bonds 4.00%, 09/15/2022 | 200,000 | 206,249 | ||||||
| 2.00%, 09/29/2022 | 1,750,000 | 1,776,756 | ||||||
| East Hartford Conn Housing Authority Multi Family Housing Revenue Bonds (Veterans Terrace Project), 0.25%, 06/01/2023 (a) | 2,100,000 | 2,098,521 | ||||||
| 8,285,380 | ||||||||
| Delaware (0.5%) | ||||||||
| Delaware State Economic Development Authority Revenue Bonds (Delmarva Power & Light Co.), 0.08%, 10/01/2029 (a) | 4,400,000 | 4,400,000 | ||||||
| Florida (2.7%) | ||||||||
| County of Bay Revenue Bonds (Florida Power & Light Co.), 0.07%, 06/01/2050 (a) | 800,000 | 800,000 | ||||||
| County of Broward FL Revenue Bonds (Florida Power & Light Co.), Series B, 0.08%, 12/01/2048 (a) | 1,230,000 | 1,230,000 | ||||||
| Florida Development Finance Corp. Revenue Bonds (Shands Jacksonville Medical Center Obligated Group), Series B, 0.30%, 02/01/2029 (a) | 16,002,000 | 16,002,000 | ||||||
| Miami-Dade County Industrial Development Authority Revenue Bonds (Waste Management, Inc.), AMT, FRN 0.43%, 11/01/2033 (a) | 3,000,000 | 2,999,073 | ||||||
| 0.43%, 11/01/2048 (a) | 2,000,000 | 1,999,382 | ||||||
| Miami-Dade County Industrial Development Authority Solid Waste Disposal Revenue Bonds (Waste Management, Inc.), 0.40%, 11/01/2041 (a) | 2,750,000 | 2,750,000 | ||||||
| 25,780,455 | ||||||||
| Georgia (2.9%) | ||||||||
| Appling County Georgia Development Authority Pollution Control Revenue Bonds (Georgia Power Company Plant Hatch Project), VRDN, 0.12%, 09/01/2041 (a) | 2,900,000 | 2,900,000 | ||||||
| Development Authority of Burke County Revenue Bonds (Georgia Power Co. Plant Voglte Project), VRDN 0.12%, 11/01/2048 (a) | 9,000,000 | 9,000,000 | ||||||
| 0.09%, 11/01/2052 (a) | 2,400,000 | 2,400,000 | ||||||
| Development Authority of Monroe County Revenue Bonds (Georgia Power Co.), VRDN, 0.12%, 11/01/2048 (a) | 13,900,000 | 13,900,000 | ||||||
| 28,200,000 | ||||||||
See accompanying Notes to Financial Statements.
| 2021 Annual Report | 53 |
Statement of Investments (continued)
October 31, 2021
Aberdeen Ultra Short Municipal Income Fund
| Shares or Principal Amount | Value (US$) | |||||||
| MUNICIPAL BONDS (continued) | ||||||||
| Illinois (2.8%) | ||||||||
| Illinois Finance Authority Solid Waste Disposal Revenue Bonds (Waste Management, Inc.), 0.55%, 11/01/2044 (a) | $ | 6,000,000 | $ | 6,000,000 | ||||
| State of Illinois General Obligation Bonds, Series C, 4.00%, 03/01/2022 | 5,000,000 | 5,062,048 | ||||||
| State of Illinois General Obligation Unlimited Bonds, Series D, 5.00%, 11/01/2021 | 14,155,000 | 14,155,000 | ||||||
| State of Illinois General Obligation Unlimited Bonds, Series A, 5.00%, 10/01/2023 | 1,030,000 | 1,117,240 | ||||||
| 26,334,288 | ||||||||
| Indiana (1.7%) | ||||||||
| Hammond Local Public Improvement Bond Bank Revenue Bonds, 2.00%, 12/31/2021 | 1,170,000 | 1,172,311 | ||||||
| Indiana Finance Authority Environmental Improvement Revenue Bonds (Republic Services, Inc.), Series A, 0.15%, 05/01/2034 (a) | 15,000,000 | 14,999,277 | ||||||
| 16,171,588 | ||||||||
| Kansas (1.2%) | ||||||||
| City of Bel Aire KS General Obligation Unlimited Bonds, Series B, 0.38%, 12/01/2024 | 9,610,000 | 9,560,438 | ||||||
| City of Dodge City Industrial Development Revenue Bonds (National Beef Packing Co. LLC), 0.32%, 03/01/2027 (a) | 1,000,000 | 1,000,000 | ||||||
| City of Liberal Industrial Development Revenue Bonds (National Beef Packing Co. LLC), 0.32%, 02/01/2029 (a) | 1,000,000 | 1,000,000 | ||||||
| 11,560,438 | ||||||||
| Kentucky (1.2%) | ||||||||
| County of Meade, Kentucky (Nucor Steel Brandenburg Project) Series 2020B-1 Industrial Building Revenue Bonds, AMT, VRDN, 0.06%, 07/01/2060 (a) | 7,400,000 | 7,400,000 | ||||||
| County of Meade, Kentucky (Nucor Steel Brandenburg Project) Series 2021A-1 Industrial Building Revenue Bonds, Series A-1, AMT, VRDN, 0.06%, 08/01/2061 (a) | 1,500,000 | 1,500,000 | ||||||
| Louisville Regional Airport Authority Revenue Bonds (United Parcel Service, Inc.), 0.08%, 01/01/2029 (a) | 1,300,000 | 1,300,000 | ||||||
| Pulaski County Solid Waste Disposal Revenue Bonds (East Kentucky Power Cooperative, Inc.), Series B, 0.30%, 08/15/2023 (a) | 1,400,000 | 1,399,602 | ||||||
| 11,599,602 | ||||||||
| Louisiana (0.8%) | ||||||||
| Louisiana Public Facilities Authority Revenue Bonds (St Mary's Dominican High School Corp.), Series B, 0.15%, 07/01/2033 (a) | 135,000 | 135,000 | ||||||
| Plaquemines Port Harbor & Terminal District Revenue Bonds (International Marine Terminal Partnership Project), Series A, 0.35%, 03/15/2025 (a) | 7,500,000 | 7,497,692 | ||||||
| 7,632,692 | ||||||||
| Shares or Principal Amount | Value (US$) | |||||||
| Maryland (5.1%) | ||||||||
| Maryland Economic Development Corp. Revenue Bonds (Linemark Printing/501 Prince George's Boulevard Obligated Group), 0.29%, 12/01/2033 (a) | $ | 5,470,000 | $ | 5,470,000 | ||||
| Maryland Industrial Development Financing Authority Revenue Bonds (Occidental Petroleum Corp.), 1.00%, 03/01/2030 (a) | 42,405,000 | 42,405,000 | ||||||
| Washington County Revenue Bonds (Conservit, Inc.), 0.29%, 02/01/2023 (a) | 830,000 | 830,000 | ||||||
| 48,705,000 | ||||||||
| Michigan (0.1%) | ||||||||
| Michigan Strategic Fund Tax-Exempt Adjustable Mode Exempt Facilities Revenue Bonds (Waste Management, Inc.), AMT, VRN, 0.58%, 08/01/2027 (a) | 500,000 | 497,828 | ||||||
| Mississippi (10.8%) | ||||||||
| Mississippi Business Finance Corp. Gulf Opportunity Zone Revenue Bonds, Series C, 0.25%, 05/01/2037 (a) | 15,980,000 | 15,980,000 | ||||||
| Mississippi Business Finance Corp. Revenue Bonds (Mississippi Power Co.), 0.08%, 05/01/2028 (a) | 3,100,000 | 3,100,000 | ||||||
| Mississippi Business Finance Corp. Revenue Bonds (PSL-North America), Series A, 1.55%, 11/01/2032 (a) | 62,000,000 | 62,000,000 | ||||||
| Mississippi Business Finance Corp. Revenue Bonds (Tri-State Truck Center, Inc.), 0.15%, 03/01/2033 (a) | 2,200,000 | 2,200,000 | ||||||
| Mississippi Hospital Equipment & Facilities Authority Revenue Refunding Bonds (Baptist Memorial Health Care Corp.), Series A-2, VRN, 0.20%, 09/01/2036 (a) | 19,760,000 | 19,744,441 | ||||||
| 103,024,441 | ||||||||
| Montana (0.6%) | ||||||||
| Mizuho Floater/Residual Trust Revenue Bonds, VRDN 0.30%, 06/01/2034 (a)(b) | 4,510,000 | 4,510,000 | ||||||
| 0.30%, 06/01/2034 (a)(b) | 1,110,000 | 1,110,000 | ||||||
| 5,620,000 | ||||||||
| Nevada (0.5%) | ||||||||
| State of Nevada Department of Business & Industry Revenue Bonds (Republic Services, Inc.), 0.25%, 12/01/2026 (a)(b) | 4,700,000 | 4,700,147 | ||||||
| New Hampshire (0.3%) | ||||||||
| New Hampshire Business Finance Authority Revenue Bonds (Waste Management, Inc. Project), Series A-3, AMT,FRN, 0.15%, 04/01/2024 (a) | 3,000,000 | 3,000,238 | ||||||
| New Jersey (7.6%) | ||||||||
| Bordentown Sewage Authority Revenue Bonds, Series J, (BAM), 5.00%, 12/01/2021 | 500,000 | 501,791 | ||||||
| Borough of Bloomingdale NJ General Obligation Unlimited Notes, 1.50%, 02/24/2022 | 7,592,200 | 7,623,195 | ||||||
See accompanying Notes to Financial Statements.
| 54 | 2021 Annual Report |
Statement of Investments (continued)
October 31, 2021
Aberdeen Ultra Short Municipal Income Fund
| Shares or Principal Amount | Value (US$) | ||||||
| MUNICIPAL BONDS (continued) | |||||||
| New Jersey (continued) | |||||||
| Borough of East Rutherford NJ General Obligation Unlimited Notes, 2.00%, 04/07/2022 | $ | 5,895,075 | $ | 5,936,943 | |||
| Borough of Seaside Heights NJ General Obligation Unlimited Notes, Series B, 1.00%, 03/31/2022 | 7,354,325 | 7,375,802 | |||||
| Borough of Westville NJ General Obligation Unlimited Notes, Series A, 2.00%, 04/28/2022 | 5,090,000 | 5,133,286 | |||||
| City of East Orange NJ General Obligation Anticipation Notes, 1.00%, 10/25/2022 | 14,549,572 | 14,642,611 | |||||
| City of Newark NJ General Obligation Notes, Series E, 1.25%, 10/03/2022 | 7,044,550 | 7,109,528 | |||||
| City of Newark NJ General Obligation Unlimited Notes, Series C, 1.25%, 07/25/2022 | 4,582,031 | 4,614,293 | |||||
| City of Orange Township NJ General Obligation Unlimited Notes, Series A, 1.00%, 03/31/2022 | 5,000,000 | 5,010,845 | |||||
| Tender Option Bond Trust Receipts Revenue Bonds, VRDN, 0.17%, 12/15/2028 (a)(b) | 4,835,000 | 4,835,000 | |||||
| Township of Irvington NJ General Obligation Unlimited Notes, 2.00%, 05/19/2022 | 9,720,952 | 9,801,036 | |||||
| 72,584,330 | |||||||
| New York (21.9%) | |||||||
| City of Cortland General Obligation Unlimited Notes, 1.25%, 11/12/2021 | 7,045,000 | 7,046,929 | |||||
| City of Dunkirk School District New York Revenue Anticipation Notes, 1.00%, 06/29/2022 | 2,400,000 | 2,411,754 | |||||
| City of Elmira General Obligation Limited Bonds 4.00%, 05/01/2022 | 845,000 | 860,052 | |||||
| 2.00%, 05/01/2023 | 455,000 | 464,563 | |||||
| 4.00%, 05/01/2024 | 675,000 | 729,479 | |||||
| City of Long Beach General Obligation Limited Notes, 1.50%, 02/22/2022 | 4,250,000 | 4,262,302 | |||||
| City of New York General Obligation Limited Bonds, VRDN, 0.11%, 04/01/2042 (a) | 5,000,000 | 5,000,000 | |||||
| City of Newburgh General Obligation limited Notes, Series A, 1.00%, 07/29/2022 | 4,670,000 | 4,689,479 | |||||
| City of Schenectady General Obligation Limited Notes, 1.00%, 05/06/2022 | 7,447,551 | 7,474,376 | |||||
| County of Lawrence Norwood-Norfolk central School District New York Revenue Anticipation Notes, 1.00%, 07/27/2022 | 6,962,040 | 6,998,594 | |||||
| County of Monroe Henriette Fire District New York Revenue Anticipation Notes, 1.00%, 08/10/2022 | 4,800,000 | 4,826,433 | |||||
| County of Ulster central School District New York Revenue Anticipation Notes, 1.00%, 06/28/2022 | 5,000,000 | 5,024,384 | |||||
| East Ramapo central School District New York Revenue Anticipation Notes Series B, (State Aid Withholding), 1.00%, 05/05/2022 | 5,500,000 | 5,515,200 | |||||
| 1.25%, 05/05/2022 | 2,000,000 | 2,008,077 | |||||
| East Ramapo central School District New York Revenue Budget Notes, 1.25%, 05/05/2022 | 1,100,000 | 1,104,442 | |||||
| Shares or Principal Amount | Value (US$) | ||||||
| Hempstead Union Free School District General Obligation Unlimited Notes, Series B, 1.00%, 07/13/2022 | $ | 4,000,000 | $ | 4,017,933 | |||
| Jasper-Troupsberg Central School District, New York Revenue Anticipation Notes, (State Aid Withholding), 1.00%, 09/23/2022 | 6,390,000 | 6,431,756 | |||||
| Metropolitan Transportation Authority Revenue Bonds 5.00%, 11/15/2021 | 1,000,000 | 1,001,706 | |||||
| Series B, 5.00%, 11/15/2021 | 700,000 | 701,195 | |||||
| Series D, 5.00%, 11/15/2021 | 700,000 | 701,195 | |||||
| Series F, 5.00%, 11/15/2021 | 1,000,000 | 1,001,706 | |||||
| 4.00%, 02/01/2022 | 15,140,000 | 15,277,892 | |||||
| Series B-1, 5.00%, 05/15/2022 | 10,000,000 | 10,250,691 | |||||
| 5.00%, 09/01/2022 | 11,010,000 | 11,437,091 | |||||
| Series F, 5.00%, 11/15/2022 | 1,125,000 | 1,179,174 | |||||
| Series F, 5.00%, 11/15/2022 | 1,530,000 | 1,602,968 | |||||
| FRN, 0.36%, 11/01/2035 (a) | 5,000,000 | 4,986,483 | |||||
| New York City General Obligation Unlimited Bonds Series A-4, 0.20%, 08/01/2026 (a) | 1,000,000 | 1,000,000 | |||||
| Series C-4, 0.20%, 10/01/2027 (a) | 14,300,000 | 14,300,000 | |||||
| Series J-3, 0.20%, 06/01/2036 (a) | 18,475,000 | 18,475,000 | |||||
| Series J-2, 0.22%, 06/01/2036 (a) | 1,925,000 | 1,925,000 | |||||
| New York City Housing Development Corp. Multifamily Housing Revenue Bonds, Series H, VRN, 0.12%, 11/01/2051 (a) | 3,000,000 | 2,999,078 | |||||
| New York City Industrial Development Agency Revenue Bonds (Novelty Crystal Corp.), 0.50%, 12/01/2034 (a) | 1,200,000 | 1,200,000 | |||||
| New York Transportation Development Corp. Revenue Bonds (Delta Air Lines, Inc.), AMT, 5.00%, 01/01/2024 | 1,500,000 | 1,634,656 | |||||
| Oneida County Industrial Development Agency Revenue Bonds (Champion Home Builders Co. Facility), 0.26%, 06/01/2029 (a) | 6,820,000 | 6,820,000 | |||||
| Rondout Valley Central School District Accord Ulster County, NJ General Obligation Anticipation Notes, (State Aid Withholding), 1.25%, 06/29/2022 | 22,340,000 | 22,498,147 | |||||
| Sidney Central School District General Obligation Limited Bonds, (State Aid Withholding), 1.00%, 08/05/2022 | 4,126,600 | 4,148,918 | |||||
| Triborough Bridge & Tunnel Authority Revenue Bonds, Series B4A, 0.41%, 01/01/2032 (a) | 4,000,000 | 4,004,518 | |||||
| Village of Johnson City General Obligation Limited Bonds, Series B, 2.00%, 09/30/2022 | 13,263,294 | 13,463,027 | |||||
| 209,474,198 | |||||||
| North Carolina (0.2%) | |||||||
| Fayetteville State University Revenue Bonds, (AGM) 5.00%, 04/01/2022 (b) | 525,000 | 535,185 | |||||
| 5.00%, 04/01/2023 (b) | 405,000 | 431,227 | |||||
| 5.00%, 04/01/2024 (b) | 425,000 | 469,697 | |||||
| 5.00%, 04/01/2026 (b) | 470,000 | 551,898 | |||||
| 1,988,007 | |||||||
See accompanying Notes to Financial Statements.
| 2021 Annual Report | 55 |
Statement of Investments (continued)
October 31, 2021
Aberdeen Ultra Short Municipal Income Fund
| Shares or Principal Amount | Value (US$) | ||||||
| MUNICIPAL BONDS (continued) | |||||||
| Ohio (0.7%) | |||||||
| State of Ohio Hospital Revenue Bonds (University Hospitals Health System, Inc.), Series C, VRDN, 0.12%, 01/15/2051 (a) | $ | 3,000,000 | $ | 3,000,000 | |||
| Toledo-Lucas County Port Authority Revenue Bonds (CSX Transportation, Inc.), 6.45%, 12/15/2021 | 3,950,000 | 3,978,279 | |||||
| 6,978,279 | |||||||
| Oklahoma (2.2%) | |||||||
| Oklahoma Development Finance Authority Revenue Bonds (Gilcrease Developers LLC), AMT, 1.63%, 07/06/2023 | 2,000,000 | 2,013,615 | |||||
| Oklahoma Development Finance Authority Revenue Bonds (INTEGRIS Health Obligated Group), VRDN, 0.14%, 08/15/2031 (a) | 19,415,000 | 19,415,000 | |||||
| 21,428,615 | |||||||
| Pennsylvania (6.1%) | |||||||
| Franklin County Industrial Development Authority Revenue Bonds (Precast System LLC), Series A, 0.38%, 11/01/2021 (a) | 50,000 | 50,000 | |||||
| Montgomery County Higher Education and Health Authority Thomas Jefferson University Variable Rate Revenue Bonds, VRDN, 0.14%, 09/01/2050 (a)(c) | 18,030,000 | 18,030,000 | |||||
| Pennsylvania Economic Development Financing Authority Revenue Bonds (Republic Services, Inc.), Series B, 0.18%, 04/01/2049 (a) | 24,750,000 | 24,748,154 | |||||
| Pennsylvania Economic Development Financing Authority Solid Waste Disposal Revenue Bonds (Waste Management PA Obligated Group), 0.20%, 08/01/2045 (a) | 14,250,000 | 14,250,000 | |||||
| Pennsylvania Economic Development Financing Authority Solid Waste Disposal Revenue Bonds (Waste Management, Inc. Project), Series A, AMT, 2.63%, 11/01/2021 | 1,250,000 | 1,250,000 | |||||
| 58,328,154 | |||||||
| South Carolina (1.0%) | |||||||
| South Carolina Jobs-Economic Development Authority Revenue Bonds (Prisma Health Obligated Group), Series C, VRDN, 0.15%, 05/01/2048 (a) | 9,525,000 | 9,525,000 | |||||
| Tennessee (0.7%) | |||||||
| Lewisburg Industrial Development Board Revenue Bonds (Waste Management Inc of Tennessee), 0.20%, 07/02/2035 (a) | 5,750,000 | 5,750,000 | |||||
| Nashville & Davidson Industrial Development Board Revenue Bonds (Waste Management Inc of Tennessee), 0.58%, 08/01/2031 (a) | 350,000 | 348,479 | |||||
| Wilson County Industrial Development Board Revenue Bonds (Kenwal Steel Tennessee LLC), 0.38%, 06/01/2037 (a) | 830,000 | 830,000 | |||||
| 6,928,479 | |||||||
| Shares or Principal Amount | Value (US$) | ||||||
| Texas (5.3%) | |||||||
| Angelina & Neches River Authority Revenue Bonds (Jefferson Enterprise Energy LLC), AMT, VRN 0.35%, 12/01/2045 (a)(b) | $ | 7,500,000 | $ | 7,497,628 | |||
| 0.45%, 12/01/2045 (a) | 8,000,000 | 7,994,195 | |||||
| City of Houston TX Hotel Occupancy Tax & Revenue Bonds 4.00%, 09/01/2022 | 180,000 | 185,466 | |||||
| 4.00%, 09/01/2023 | 180,000 | 191,798 | |||||
| 4.00%, 09/01/2025 | 425,000 | 477,646 | |||||
| Mission Economic Development Corp. Revenue Bonds (Waste Management, Inc.) Series B, 0.15%, 07/01/2040 (a) | 3,000,000 | 3,000,238 | |||||
| 0.15%, 05/01/2046 (a) | 2,500,000 | 2,500,198 | |||||
| Mission Economic Development Corp. Solid Waste Disposal Revenue Bonds (Republic Services, Inc.), AMT, FRN, 0.20%, 05/01/2050 (a) | 2,000,000 | 2,000,000 | |||||
| Port of Corpus Christi Authority of Nueces County Solid Waste Disposal Revenue Bonds (Flint Hills Resources LP) | |||||||
| 0.17%, 04/01/2028 (a) | 7,000,000 | 7,000,000 | |||||
| 0.17%, 01/01/2030 (a) | 11,800,000 | 11,800,000 | |||||
| Texas Municipal Gas Acquisition & Supply Corp III Revenue Bonds 5.00%, 12/15/2021 | 1,150,000 | 1,156,387 | |||||
| 5.00%, 12/15/2022 | 1,150,000 | 1,208,218 | |||||
| 5.00%, 12/15/2025 | 4,600,000 | 5,353,032 | |||||
| 50,364,806 | |||||||
| West Virginia (1.6%) | |||||||
| West Virginia Hospital Finance Authority Revenue Bonds (West Virginia United Health System Obligated Group), Series E, 0.13%, 06/01/2033 (a) | 14,955,000 | 14,955,000 | |||||
| Wisconsin (4.1%) | |||||||
| City of Racine Wisconsin Note Anticipation Notes, 2.00%, 04/01/2022 | 1,150,000 | 1,152,690 | |||||
| County of Wood (WI) Revenue Bonds Anticipation Notes, 0.75%, 03/07/2022 | 4,000,000 | 4,002,017 | |||||
| Public Finance Authority Revenue Bonds (Waste Management, Inc.) | |||||||
| 0.20%, 10/01/2025 (a) | 1,800,000 | 1,800,000 | |||||
| 0.20%, 09/01/2027 (a) | 6,000,000 | 6,000,000 | |||||
| Tender Option Bond Trust Receipts Revenue Bonds, VRDN, 0.21%, 12/15/2040 (a)(b) | 2,230,000 | 2,230,000 | |||||
| Wisconsin Health & Educational Facilities Authority Revenue Bonds, 0.15%, 02/15/2053 (a) | 24,095,000 | 24,095,000 | |||||
| 39,279,707 | |||||||
| Total Municipal Bonds | 955,950,570 | ||||||
See accompanying Notes to Financial Statements.
| 56 | 2021 Annual Report |
Statement of Investments (concluded)
October 31, 2021
Aberdeen Ultra Short Municipal Income Fund
| Shares or Principal Amount | Value (US$) | ||||||
| SHORT-TERM INVESTMENT (4.1%) | |||||||
| UNITED STATES (4.1%) | |||||||
| BlackRock Liquidity Funds MuniCash Portfolio, Institutional Shares, Zero Coupon%, | $ | 201,201 | $ | 201,221 | |||
| Mercer County Pollution Control Revenue Commercial Paper Notes, 0.15%, 11/09/2021 | 39,135,000 | 39,135,000 | |||||
| Total Short-Term Investment | 39,336,221 | ||||||
| Total Investments (Cost $995,130,495) (d)—104.2% | 995,286,791 | ||||||
| Liabilities in Excess of Other Assets—(4.2)% | (40,150,824 | ) | |||||
| Net Assets—100.0% | $ | 955,135,967 | |||||
| (a) | Variable Rate Instrument. The rate shown is based on the latest available information as of October 31, 2021. Certain variable rate securities are not based on a published reference rate and spread but are determined by the issuer or agent and are based on current market conditions. These securities do not indicate a reference rate and spread in their description. | |
| (b) | Denotes a security issued under Regulation S or Rule 144A. | |
| (c) | Illiquid security. | |
| (d) | See accompanying Notes to Financial Statements for tax unrealized appreciation/(depreciation) of securities. | |
| FRN | Floating Rate Note |
See accompanying Notes to Financial Statements.
| 2021 Annual Report | 57 |
Statements of Assets and Liabilities
October 31, 2021
| Aberdeen Emerging Markets Debt Fund | Aberdeen Global Absolute Return Strategies Fund | Aberdeen Intermediate Municipal Income Fund | Aberdeen Short Duration High Yield Municipal Fund | Aberdeen Ultra Short Municipal Income Fund | ||||||||||||
| Assets: | ||||||||||||||||
| Investments, at value | $ 38,596,429 | $ 19,285,133 | $ 60,331,166 | $ 456,992,053 | $ 955,950,570 | |||||||||||
| Short-term investments, at value | 2,090,253 | 71,731,217 | 57,419 | 180,752 | 39,336,221 | |||||||||||
| Cash collateral pledged for swaps contracts | – | 1,483,804 | – | – | – | |||||||||||
| Cash collateral pledged for futures | – | 1,000,486 | – | – | – | |||||||||||
| Foreign currency, at value | 83,701 | 238,190 | – | – | – | |||||||||||
| Cash | – | 46,195 | – | – | 150,000 | |||||||||||
| Cash at broker for forward foreign currency contracts | 60,000 | – | – | – | – | |||||||||||
| Cash at broker for options | – | 573,999 | – | – | – | |||||||||||
| Interest and dividends receivable | 608,835 | 180,482 | 760,769 | 4,475,778 | 2,938,634 | |||||||||||
| Receivable for capital shares issued | 3 | 291 | – | 2,715,113 | 1,138,713 | |||||||||||
| Receivable for investments sold | 42,459 | 59,498 | – | 1,312,428 | – | |||||||||||
| Variation margin receivable for futures contracts | – | 35,197 | – | – | – | |||||||||||
| Unrealized appreciation on forward foreign currency exchange contracts | 176,246 | 731,411 | – | – | – | |||||||||||
| Receivable from Adviser | 24,116 | 153,438 | 20,808 | 81,863 | 217,826 | |||||||||||
| Unrealized appreciation on swap contracts | – | 4,849 | – | – | – | |||||||||||
| Tax reclaim receivable | – | 543 | – | – | – | |||||||||||
| Prepaid expenses | 35,962 | 26,385 | 18,419 | 34,314 | 59,750 | |||||||||||
| Total assets | 41,718,004 | 95,551,118 | 61,188,581 | 465,792,301 | 999,791,714 | |||||||||||
| Liabilities: | ||||||||||||||||
| Payable for investments purchased | 723,287 | 10,888 | – | 18,198,108 | 37,150,000 | |||||||||||
| Unrealized depreciation on forward foreign currency exchange contracts | 64,535 | 596,020 | – | – | – | |||||||||||
| Unrealized depreciation on swap contracts | – | 36,511 | – | – | – | |||||||||||
| Distributions payable | – | – | 12,442 | 70,726 | 1,593 | |||||||||||
| Payable for capital shares redeemed | 6,131 | 1,924,195 | 12,515 | 515,522 | 6,887,568 | |||||||||||
| Cash due to broker for forward foreign currency contracts | 130,000 | – | – | – | – | |||||||||||
| Variation margin payable for centrally cleared swaps | – | 216,179 | – | – | – | |||||||||||
| Written options outstanding, at value | – | 270,214 | – | – | – | |||||||||||
| Accrued expenses and other payables: | ||||||||||||||||
| Investment advisory fees | 20,710 | 80,652 | 22,164 | 236,563 | 285,220 | |||||||||||
| Custodian fees | 38,717 | 356,311 | 15,494 | 19,506 | 42,565 | |||||||||||
| Administration fees | 2,761 | 5,336 | 4,172 | 34,175 | 63,505 | |||||||||||
| Sub-transfer agent and administrative services fees | 1,207 | 9,289 | 533 | 18,535 | 63,753 | |||||||||||
| Fund accounting fees | 2,511 | 1,384 | 3,459 | 17,808 | 59,323 | |||||||||||
| Audit fees | 8,230 | 8,230 | 8,231 | 8,620 | 8,370 | |||||||||||
| Transfer agent fees | 3,486 | 6,117 | 9,035 | 4,416 | 7,903 | |||||||||||
| Distribution fees | 1,686 | 5,449 | 1,546 | 7,043 | 12,837 | |||||||||||
| Legal fees | 207 | 18,878 | 277 | 2,090 | 4,231 | |||||||||||
| Printing fees | 746 | 208 | 324 | – | – | |||||||||||
| Other accrued expenses | 30,203 | 68,235 | 28,889 | 36,377 | 68,879 | |||||||||||
| Total liabilities | 1,034,417 | 3,614,096 | 119,081 | 19,169,489 | 44,655,747 | |||||||||||
| Net Assets | $ 40,683,587 | $ 91,937,022 | $ 61,069,500 | $ 446,622,812 | $ 955,135,967 | |||||||||||
| Cost: | ||||||||||||||||
| Investments | $ 41,452,983 | $ 19,564,153 | $ 56,165,185 | $ 450,736,205 | $ 955,794,274 | |||||||||||
| Short-term investment | 2,090,253 | 71,731,480 | 57,419 | 180,752 | 39,336,221 | |||||||||||
| Foreign currency | 87,262 | 241,944 | – | – | – | |||||||||||
| Premiums on written options: | – | 310,501 | – | – | – | |||||||||||
| Represented by: | ||||||||||||||||
| Capital | $ 46,596,359 | $ 90,936,381 | $ 57,207,481 | $ 448,857,592 | $ 955,532,880 | |||||||||||
| Distributable earnings (accumulated loss) | (5,912,772 | ) | 1,000,641 | 3,862,019 | (2,234,780 | ) | (396,913 | ) | ||||||||
| Net Assets | $ 40,683,587 | $ 91,937,022 | $ 61,069,500 | $ 446,622,812 | $ 955,135,967 | |||||||||||
Amounts listed as "–" are $0 or round to $0.
See accompanying Notes to Financial Statements.
| 58 | 2021 Annual Report |
Statements of Assets and Liabilities (concluded)
October 31, 2021
| Aberdeen Emerging Markets Debt Fund | Aberdeen Global Absolute Return Strategies Fund | Aberdeen Intermediate Municipal Income Fund | Aberdeen Short Duration High Yield Municipal Fund | Aberdeen Ultra Short Municipal Income Fund | ||||||||||||
| Net Assets: | ||||||||||||||||
| Class A Shares | $ 226,587 | $ 22,522,016 | $ 6,028,090 | $ 21,906,590 | $ 161,361,906 | |||||||||||
| Class A1 Shares | – | – | – | – | 510,401 | |||||||||||
| Class C Shares | 26,884 | 478,298 | 313,664 | 27,200 | – | |||||||||||
| Class R Shares | 3,662,399 | – | – | – | – | |||||||||||
| Institutional Service Class Shares | 82,767 | 6,929,209 | 20,264 | – | – | |||||||||||
| Institutional Class Shares | 36,684,950 | 62,007,499 | 54,707,482 | 424,689,022 | 793,263,660 | |||||||||||
| Total | $ 40,683,587 | $ 91,937,022 | $ 61,069,500 | $ 446,622,812 | $ 955,135,967 | |||||||||||
| Shares Outstanding (unlimited number of shares authorized): | ||||||||||||||||
| Class A Shares | 24,529 | 2,189,354 | 613,148 | 2,135,314 | 15,986,929 | |||||||||||
| Class A1 Shares | – | – | – | – | 50,535 | |||||||||||
| Class C Shares | 2,906 | 47,648 | 31,961 | 2,649 | – | |||||||||||
| Class R Shares | 398,660 | – | – | – | – | |||||||||||
| Institutional Service Class Shares | 8,946 | 669,113 | 2,059 | – | – | |||||||||||
| Institutional Class Shares | 3,960,897 | 5,938,384 | 5,560,090 | 41,391,609 | 79,043,089 | |||||||||||
| Total | 4,395,938 | 8,844,499 | 6,207,258 | 43,529,572 | 95,080,553 | |||||||||||
| Net Asset Value and Redemption Price Per Share (Net assets by class divided by shares outstanding by class, respectively): | ||||||||||||||||
| Class A Shares | $ 9.24 | $ 10.29 | $ 9.83 | $ 10.26 | $ 10.09 | |||||||||||
| Class A1 Shares (a) | $ – | $ – | $ – | $ – | $ 10.10 | |||||||||||
| Class C Shares (b) | $ 9.25 | $ 10.04 | $ 9.81 | $ 10.27 | $ – | |||||||||||
| Class R Shares | $ 9.19 | $ – | $ – | $ – | $ – | |||||||||||
| Institutional Service Class Shares | $ 9.25 | $ 10.36 | $ 9.84 | $ – | $ – | |||||||||||
| Institutional Class Shares | $ 9.26 | $ 10.44 | $ 9.84 | $ 10.26 | $ 10.04 | |||||||||||
| Maximum Offering Price Per Share (100%/(100% – maximum sales charge) of net asset value adjusted to the nearest cent): | ||||||||||||||||
| Class A Shares | $ 9.53 | $ 10.61 | $ 10.08 | $ 10.52 | $ – | |||||||||||
| Class A1 Shares | $ – | $ – | $ – | $ – | $ 10.15 | |||||||||||
| Maximum Sales Charge: | ||||||||||||||||
| Class A Shares | 3.00 | (c)% | 3.00 | (c)% | 2.50 | (d)% | 2.50 | (d)% | – | % | ||||||
| Class A1 Shares | – | % | – | % | – | % | – | % | 0.50 | % | ||||||
| (a) | Unless you are otherwise eligible to purchase Class A1 shares without a sales charge, a contingent deferred sales charge (CDSC) of up to 0.25% will be charged on Class A1 shares redeemed within 12 months of purchase if you paid no sales charge on the original purchase and a finder's fee was paid. |
| (b) | For Class C Shares, the redemption price per share is reduced by 1.00% for shares held less than one year due to contingent deferred sales charge. |
| (c) | Unless you are otherwise eligible to purchase Class A shares without a sales charge, a contingent deferred sales charge (CDSC) of up to 1.00% will be charged on Class A shares redeemed within 18 months of purchase if you paid no sales charge on the original purchase and a finder's fee was paid. |
| (d) | Unless you are otherwise eligible to purchase Class A shares without a sales charge, a contingent deferred sales charge (CDSC) of up to 0.75% will be charged on Class A shares redeemed within 12 months of purchase if you paid no sales charge on the original purchase and a finder's fee was paid. |
Amounts listed as "–" are $0 or round to $0.
See accompanying Notes to Financial Statements.
| 2021 Annual Report | 59 |
Statements of Operations
For the Year Ended October 31, 2021
| Aberdeen Emerging Markets Debt Fund | Aberdeen Global Absolute Return Strategies Fund | Aberdeen Intermediate Municipal Income Fund | Aberdeen Short Duration High Yield Municipal Fund | Aberdeen Ultra Short Municipal Income Fund | |||||||||||||||||
| INVESTMENT INCOME: | |||||||||||||||||||||
| Dividend income | $ – | $ 66,219 | $ 16 | $ 58 | $ 103 | ||||||||||||||||
| Interest income | 2,929,844 | 101,941 | 2,006,576 | 10,671,409 | 6,140,901 | ||||||||||||||||
| Foreign tax withholding | (2,249 | ) | (4,147 | ) | – | – | – | ||||||||||||||
| Total Income | 2,927,595 | 164,013 | 2,006,592 | 10,671,467 | 6,141,004 | ||||||||||||||||
| EXPENSES: | |||||||||||||||||||||
| Investment advisory fees | 273,353 | 163,090 | 271,702 | 2,247,203 | 5,541,935 | ||||||||||||||||
| Trustee fees | 3,230 | 1,556 | 4,454 | 23,808 | 77,512 | ||||||||||||||||
| Administration fees | 36,447 | 21,745 | 51,144 | 282,960 | 886,710 | ||||||||||||||||
| Legal fees | 2,872 | 1,489 | 4,268 | 72,078 | 73,667 | ||||||||||||||||
| Audit fees | 45,068 | 71,119 | 41,514 | 50,000 | 50,960 | ||||||||||||||||
| Printing fees | 7,360 | 10,884 | 10,289 | 30,360 | 50,486 | ||||||||||||||||
| Custodian fees | 35,348 | 326,669 | 18,399 | 24,413 | 80,474 | ||||||||||||||||
| Transfer agent fees | 15,175 | 18,920 | 60,013 | 40,391 | 56,008 | ||||||||||||||||
| Distribution fees Class A | 622 | 7,030 | 16,305 | 54,372 | 531,575 | ||||||||||||||||
| Distribution fees Class A1 | – | – | – | – | 1,380 | ||||||||||||||||
| Distribution fees Class C | 585 | 5,849 | 2,697 | 96 | – | ||||||||||||||||
| Distribution fees Class R | 19,444 | – | – | – | – | ||||||||||||||||
| Sub-transfer agent and administrative service fees Institutional Class | 11,724 | 4,396 | 4,046 | 189,171 | 637,533 | ||||||||||||||||
| Sub-transfer agent and administrative service fees Class A | 302 | 1,567 | 818 | 12,972 | 138,451 | ||||||||||||||||
| Sub-transfer agent and administrative service fees Class C | 64 | 653 | 64 | 3 | – | ||||||||||||||||
| Sub-transfer agent and administrative service fees Class R | 5,886 | – | – | – | – | ||||||||||||||||
| Sub-transfer agent and administrative service fees Institutional Service Class | 103 | 9,874 | – | – | – | ||||||||||||||||
| Fund accounting fees | 1,822 | 1,087 | 2,557 | 14,148 | 44,336 | ||||||||||||||||
| Registration and filing fees | 64,386 | 54,956 | 55,088 | 67,032 | 140,932 | ||||||||||||||||
| Other | 32,834 | 40,937 | 29,267 | 57,120 | 129,619 | ||||||||||||||||
| Total expenses before reimbursed/waived expenses | 556,625 | 741,821 | 572,625 | 3,166,127 | 8,441,578 | ||||||||||||||||
| Interest Expense (a) | 673 | – | – | – | 27 | ||||||||||||||||
| Total operating expenses before reimbursed/waived expenses | 557,298 | 741,821 | 572,625 | 3,166,127 | 8,441,605 | ||||||||||||||||
| Expenses reimbursed | (233,540 | ) | (540,814 | ) | (233,143 | ) | (812,551 | ) | (3,286,759 | ) | |||||||||||
| Net expenses | 323,758 | 201,007 | 339,482 | 2,353,576 | 5,154,846 | ||||||||||||||||
| Net Investment Income/(Loss) | 2,603,837 | (36,994 | ) | 1,667,110 | 8,317,891 | 986,158 | |||||||||||||||
| REALIZED/UNREALIZED GAIN/(LOSS) FROM INVESTMENTS: | |||||||||||||||||||||
| Realized gain/(loss) on investment transactions | 927,545 | 2,451,298 | (298,789 | ) | (1,101,812 | ) | (195,697 | ) | |||||||||||||
| Realized gain/(loss) on futures contracts | – | (96,771 | ) | – | – | – | |||||||||||||||
| Realized gain/(loss) on written options | – | 92,976 | – | – | – | ||||||||||||||||
| Realized gain/(loss) on swap contracts | – | (36,825 | ) | – | – | – | |||||||||||||||
| Realized gain/(loss) on forward foreign currency exchange contracts | (406,942 | ) | (376,124 | ) | – | – | – | ||||||||||||||
| Realized gain/(loss) on foreign currency transactions | 9,008 | 120,991 | – | – | – | ||||||||||||||||
| Net realized gain/(loss) from investments, futures contracts, swap contracts, forward foreign currency contracts and foreign currency transactions | 529,611 | 2,155,545 | (298,789 | ) | (1,101,812 | ) | (195,697 | ) | |||||||||||||
| Net change in unrealized appreciation/(depreciation) on investment transactions | (724,681 | ) | (1,695,643 | ) | 1,114,396 | 8,143,949 | 700,888 | ||||||||||||||
| Net change in unrealized appreciation/(depreciation) on swap contracts | – | (1,353,208 | ) | – | – | – | |||||||||||||||
| Net change in unrealized appreciation/(depreciation) on futures contracts | – | 587,653 | – | – | – | ||||||||||||||||
| Net change in unrealized appreciation/(depreciation) on written options | – | 129,052 | – | – | – | ||||||||||||||||
| Net change in unrealized appreciation/(depreciation) on forward foreign currency exchange rate contracts | 13,435 | 34,545 | – | – | – | ||||||||||||||||
| Net change in unrealized appreciation/(depreciation) on translation of assets and liabilities denominated in foreign currencies | 454 | (15,737 | ) | – | – | – | |||||||||||||||
| Net change in unrealized appreciation/(depreciation) from investments, written options, futures contracts, swap contracts, forward foreign currency contracts and translation of assets and liabilities denominated in foreign currencies | (710,792 | ) | (2,313,338 | ) | 1,114,396 | 8,143,949 | 700,888 | ||||||||||||||
| Net realized/unrealized gain/(loss) from investments, written options, futures contracts, swaps and foreign currency transactions | (181,181 | ) | (157,793 | ) | 815,607 | 7,042,137 | 505,191 | ||||||||||||||
| CHANGE IN NET ASSETS RESULTING FROM OPERATIONS | $ 2,422,656 | $ (194,787 | ) | $ 2,482,717 | $ 15,360,028 | $ 1,491,349 | |||||||||||||||
(a) See Note 9 for additional information.
Amounts listed as "–" are $0 or round to $0.
See accompanying Notes to Financial Statements.
| 60 | 2021 Annual Report |
Statements of Changes in Net Assets
| Aberdeen Emerging Markets Debt Fund | Aberdeen Global Absolute Return Strategies Fund | Aberdeen Intermediate Municipal Income Fund | |||||||||||||||||||||||||
| Year Ended October 31, 2021 | Year Ended October 31, 2020 | Year Ended October 31, 2021 | Year Ended October 31, 2020 | Year Ended October 31, 2021 | Year Ended October 31, 2020 | ||||||||||||||||||||||
| FROM INVESTMENT ACTIVITIES: | |||||||||||||||||||||||||||
| Operations: | |||||||||||||||||||||||||||
| Net investment income/(loss) | $ 2,603,837 | $ 2,518,037 | $ (36,994 | ) | $ 145,516 | $ 1,667,110 | $ 1,965,910 | ||||||||||||||||||||
| Net realized gain/(loss) from investments, written options, futures contracts, swap contracts, forward foreign currency contracts and foreign currency transactions | 529,611 | (1,044,552 | ) | 2,155,545 | 164,840 | (298,789 | ) | 106,838 | |||||||||||||||||||
| Net change in unrealized appreciation/ (depreciation) on investments, written options, futures contracts, swap contracts, forward foreign currency contracts and translation of assets and liabilities denominated in foreign currencies | (710,792 | ) | (2,428,644 | ) | (2,313,338 | ) | 468,325 | 1,114,396 | (1,362,746 | ) | |||||||||||||||||
| Changes in net assets resulting from operations | 2,422,656 | (955,159 | ) | (194,787 | ) | 778,681 | 2,482,717 | 710,002 | |||||||||||||||||||
| Distributions to Shareholders From: | |||||||||||||||||||||||||||
| Distributable earnings: | |||||||||||||||||||||||||||
| Class A | (11,387 | ) | (18,526 | ) | (2,060 | ) | (11,744 | ) | (165,909 | ) | (194,812 | ) | |||||||||||||||
| Class C | (3,466 | ) | (4,497 | ) | (401 | ) | (287 | ) | (4,873 | ) | (5,382 | ) | |||||||||||||||
| Class R | (139,135 | ) | (135,904 | ) | – | – | – | (102 | ) | ||||||||||||||||||
| Institutional Service Class | (3,507 | ) | (1,479 | ) | (17,552 | ) | (172,288 | ) | (564 | ) | (613 | ) | |||||||||||||||
| Institutional Class | (1,744,572 | ) | (1,863,463 | ) | (47,938 | ) | (260,575 | ) | (1,602,524 | ) | (1,863,887 | ) | |||||||||||||||
| Change in net assets from shareholder distributions | (1,902,067 | ) | (2,023,869 | ) | (67,951 | ) | (444,894 | ) | (1,773,870 | ) | (2,064,796 | ) | |||||||||||||||
| Change in net assets from capital transactions | (12,242,793 | ) | 3,508,099 | 70,424,619 | 8,688,209 | (4,613,579 | ) | (4,736,370 | ) | ||||||||||||||||||
| Change in net assets | (11,722,204 | ) | 529,071 | 70,161,881 | 9,021,996 | (3,904,732 | ) | (6,091,164 | ) | ||||||||||||||||||
| Net Assets: | |||||||||||||||||||||||||||
| Beginning of year | 52,405,791 | 51,876,720 | 21,775,141 | 12,753,145 | 64,974,232 | 71,065,396 | |||||||||||||||||||||
| End of year | $ 40,683,587 | $ 52,405,791 | $ 91,937,022 | $ 21,775,141 | $ 61,069,500 | $ 64,974,232 | |||||||||||||||||||||
| (a) | Effective February 28, 2020, Class R had zero assets. On February 28, 2020, the Aberdeen Intermediate Municipal Income Fund ceased offering Class R Shares. | |
| (b) | Includes redemption fees, if any. |
Amounts listed as "–" are $0 or round to $0.
See accompanying Notes to Financial Statements.
| 2021 Annual Report | 61 |
Statements of Changes in Net Assets (continued)
| Aberdeen Emerging Markets Debt Fund | Aberdeen Global Absolute Return Strategies Fund | Aberdeen Intermediate Municipal Income Fund (a) | ||||||||||||||||||||||
| Year Ended October 31, 2021 | Year Ended October 31, 2020 | Year Ended October 31, 2021 | Year Ended October 31, 2020 | Year Ended October 31, 2021 | Year Ended October 31, 2020 | |||||||||||||||||||
| CAPITAL TRANSACTIONS: | ||||||||||||||||||||||||
| Class A Shares | ||||||||||||||||||||||||
| Proceeds from shares issued | $ | 102,231 | $ | 352,813 | $ | 1,202,597 | $ | 479,659 | $ | 110,423 | $ | 168,732 | ||||||||||||
| Proceeds of shares issued in connection with fund merger | – | – | 22,272,666 | – | – | – | ||||||||||||||||||
| Dividends reinvested | 8,606 | 17,316 | 1,986 | 11,491 | 118,556 | 136,429 | ||||||||||||||||||
| Cost of shares redeemed | (188,170 | ) | (898,944 | ) | (1,936,020 | ) | (230,065 | ) | (946,959 | ) | (1,018,550 | ) | ||||||||||||
| Total Class A | (77,333 | ) | (528,815 | ) | 21,541,229 | 261,085 | (717,980 | ) | (713,389 | ) | ||||||||||||||
| Class C Shares | ||||||||||||||||||||||||
| Proceeds from shares issued | 10,000 | 159,820 | 150,000 | 591,129 | 67,854 | 38,410 | ||||||||||||||||||
| Dividends reinvested | 3,466 | 4,497 | 401 | 287 | 4,858 | 5,363 | ||||||||||||||||||
| Cost of shares redeemed | (128,689 | ) | (122,537 | ) | (338,551 | ) | (70,992 | ) | (31,260 | ) | (21,015 | ) | ||||||||||||
| Total Class C | (115,223 | ) | 41,780 | (188,150 | ) | 520,424 | 41,452 | 22,758 | ||||||||||||||||
| Class R Shares | ||||||||||||||||||||||||
| Proceeds from shares issued | 925,269 | 463,579 | – | – | – | – | ||||||||||||||||||
| Dividends reinvested | 139,135 | 135,904 | – | – | – | 81 | ||||||||||||||||||
| Cost of shares redeemed (b) | (963,082 | ) | (1,102,856 | ) | – | – | – | (11,652 | ) | |||||||||||||||
| Total Class R | 101,322 | (503,373 | ) | – | – | – | (11,571 | ) | ||||||||||||||||
| Institutional Service Class Shares | ||||||||||||||||||||||||
| Proceeds from shares issued | 417 | 63,322 | 437,987 | 630,476 | – | 20,956 | ||||||||||||||||||
| Dividends reinvested | 3,507 | 1,479 | 17,235 | 169,159 | 563 | 582 | ||||||||||||||||||
| Cost of shares redeemed | (179 | ) | (5,359 | ) | (1,699,571 | ) | (1,691,964 | ) | (15 | ) | (19,111 | ) | ||||||||||||
| Total Institutional Service Class | 3,745 | 59,442 | (1,244,349 | ) | (892,329 | ) | 548 | 2,427 | ||||||||||||||||
| Institutional Class Shares | ||||||||||||||||||||||||
| Proceeds from shares issued | 5,782,692 | 9,083,124 | 1,954,089 | 11,383,780 | 884,579 | 1,689,260 | ||||||||||||||||||
| Proceeds of shares issued in connection with fund merger | – | – | 56,538,906 | – | – | – | ||||||||||||||||||
| Dividends reinvested | 1,728,471 | 1,832,746 | 47,855 | 260,091 | 1,288,406 | 1,499,054 | ||||||||||||||||||
| Cost of shares redeemed | (19,666,467 | ) | (6,476,805 | ) | (8,224,961 | ) | (2,844,842 | ) | (6,110,584 | ) | (7,224,909 | ) | ||||||||||||
| Total Institutional Class | (12,155,304 | ) | 4,439,065 | 50,315,889 | 8,799,029 | (3,937,599 | ) | (4,036,595 | ) | |||||||||||||||
| Change in net assets from capital transactions: | $ | (12,242,793 | ) | $ | 3,508,099 | $ | 70,424,619 | $ | 8,688,209 | $ | (4,613,579 | ) | $ | (4,736,370 | ) | |||||||||
(a) Effective February 28, 2020, Class R had zero assets. On February 28, 2020, the Aberdeen Intermediate Municipal Income Fund ceased offering Class R Shares.
(b) Includes redemption fees, if any.
Amounts listed as "–" are $0 or round to $0.
See accompanying Notes to Financial Statements.
| 62 | 2021 Annual Report |
Statements of Changes in Net Assets (concluded)
| Aberdeen Emerging Markets Debt Fund | Aberdeen Global Absolute Return Strategies Fund | Aberdeen Intermediate Municipal Income Fund (a) | ||||||||||||||||||||||
| Year Ended October 31, 2021 | Year Ended October 31, 2020 | Year Ended October 31, 2021 | Year Ended October 31, 2020 | Year Ended October 31, 2021 | Year Ended October 31, 2020 | |||||||||||||||||||
| SHARE TRANSACTIONS: | ||||||||||||||||||||||||
| Class A Shares | ||||||||||||||||||||||||
| Issued | 10,842 | 37,203 | 114,890 | 47,338 | 11,090 | 17,181 | ||||||||||||||||||
| Issued in connection with fund merger | – | – | 2,156,386 | – | – | – | ||||||||||||||||||
| Reinvested | 895 | 1,819 | 188 | 1,142 | 11,975 | 13,932 | ||||||||||||||||||
| Redeemed | (19,884 | ) | (93,968 | ) | (186,840 | ) | (22,856 | ) | (95,424 | ) | (103,981 | ) | ||||||||||||
| Total Class A Shares | (8,147 | ) | (54,946 | ) | 2,084,624 | 25,624 | (72,359 | ) | (72,868 | ) | ||||||||||||||
| Class C Shares | ||||||||||||||||||||||||
| Issued | 1,072 | 16,467 | 14,515 | 58,660 | 6,862 | 3,885 | ||||||||||||||||||
| Reinvested | 361 | 478 | 39 | 29 | 492 | 549 | ||||||||||||||||||
| Redeemed | (13,912 | ) | (12,960 | ) | (32,701 | ) | (7,137 | ) | (3,155 | ) | (2,133 | ) | ||||||||||||
| Total Class C Shares | (12,479 | ) | 3,985 | (18,147 | ) | 51,552 | 4,199 | 2,301 | ||||||||||||||||
| Class R Shares | ||||||||||||||||||||||||
| Issued | 98,091 | 49,525 | – | – | – | – | ||||||||||||||||||
| Reinvested | 14,545 | 14,469 | – | – | – | 9 | ||||||||||||||||||
| Redeemed | (102,497 | ) | (121,144 | ) | – | – | – | (1,150 | ) | |||||||||||||||
| Total Class R Shares | 10,139 | (57,150 | ) | – | – | – | (1,141 | ) | ||||||||||||||||
| Institutional Service Class Shares | ||||||||||||||||||||||||
| Issued | 44 | 6,558 | 40,843 | 62,094 | – | 2,067 | ||||||||||||||||||
| Reinvested | 364 | 157 | 1,623 | 16,748 | 57 | 59 | ||||||||||||||||||
| Redeemed | (19 | ) | (590 | ) | (160,987 | ) | (166,979 | ) | (2 | ) | (2,068 | ) | ||||||||||||
| Total Institutional Service Class Shares | 389 | 6,125 | (118,521 | ) | (88,137 | ) | 55 | 58 | ||||||||||||||||
| Institutional Class Shares | ||||||||||||||||||||||||
| Issued | 599,695 | 967,952 | 183,879 | 1,110,411 | 89,355 | 172,791 | ||||||||||||||||||
| Issued in connection with fund merger | – | – | 5,393,904 | – | – | – | ||||||||||||||||||
| Reinvested | 179,454 | 194,571 | 4,472 | 25,574 | 130,040 | 152,982 | ||||||||||||||||||
| Redeemed | (2,035,218 | ) | (719,093 | ) | (783,300 | ) | (275,955 | ) | (616,659 | ) | (737,200 | ) | ||||||||||||
| Total Institutional Class Shares | (1,256,069 | ) | 443,430 | 4,798,955 | 860,030 | (397,264 | ) | (411,427 | ) | |||||||||||||||
| Total change in shares: | (1,266,167 | ) | 341,444 | 6,746,911 | 849,069 | (465,369 | ) | (483,077 | ) | |||||||||||||||
(a) Effective February 28, 2020, Class R had zero assets. On February 28, 2020, the Aberdeen Intermediate Municipal Income Fund ceased offering Class R Shares.
(b) Includes redemption fees, if any.
Amounts listed as "–" are $0 or round to $0.
See accompanying Notes to Financial Statements.
| 2021 Annual Report | 63 |
Statements of Changes in Net Assets
| Aberdeen Short Duration High Yield Municipal Fund | Aberdeen Ultra Short Municipal Income Fund | |||||||||||||||
| Year Ended October 31, 2021 | Year Ended October 31, 2020 | Year Ended October 31, 2021 | Year Ended October 31, 2020 | |||||||||||||
| FROM INVESTMENT ACTIVITIES: | ||||||||||||||||
| Operations: | ||||||||||||||||
| Net investment income | $ | 8,317,891 | $ | 8,038,965 | $ | 986,158 | $ | 9,180,811 | ||||||||
| Net realized gain/(loss) from investments, futures contracts, swap contracts, forward foreign currency contracts and foreign currency transactions | (1,101,812 | ) | (1,967,350 | ) | (195,697 | ) | 7,091 | |||||||||
| Net change in unrealized appreciation/(depreciation) on investments, futures contracts, swap contracts, forward foreign currency contracts and translation of assets and liabilities denominated in foreign currencies | 8,143,949 | (5,731,312 | ) | 700,888 | (628,850 | ) | ||||||||||
| Changes in net assets resulting from operations | 15,360,028 | 340,303 | 1,491,349 | 8,559,052 | ||||||||||||
| Distributions to Shareholders From: | ||||||||||||||||
| Distributable earnings: | ||||||||||||||||
| Class A | (464,084 | ) | (713,836 | ) | (47,583 | ) | (1,509,615 | ) | ||||||||
| Class A1 | – | – | (123 | ) | (437 | ) | ||||||||||
| Class C | (118 | ) | – | – | – | |||||||||||
| Institutional Class | (7,826,608 | ) | (7,291,360 | ) | (945,195 | ) | (7,684,814 | ) | ||||||||
| Change in net assets from shareholder distributions | (8,290,810 | ) | (8,005,196 | ) | (992,901 | ) | (9,194,866 | ) | ||||||||
| Change in net assets from capital transactions | 146,984,308 | 42,940,733 | (237,411,963 | ) | 307,268,709 | |||||||||||
| Change in net assets | 154,053,526 | 35,275,840 | (236,913,515 | ) | 306,632,895 | |||||||||||
| Net Assets: | ||||||||||||||||
| Beginning of year | 292,569,286 | �� | 257,293,446 | 1,192,049,482 | 885,416,587 | |||||||||||
| End of year | $ | 446,622,812 | $ | 292,569,286 | $ | 955,135,967 | $ | 1,192,049,482 | ||||||||
Amounts listed as "–" are $0 or round to $0.
See accompanying Notes to Financial Statements.
| 64 | 2021 Annual Report |
Statements of Changes in Net Assets (concluded)
| Aberdeen Short Duration High Yield Municipal Fund | Aberdeen Ultra Short Municipal Income Fund | |||||||||||||||
| Year Ended October 31, 2021 | Year Ended October 31, 2020 | Year Ended October 31, 2021 | Year Ended October 31, 2020 | |||||||||||||
| CAPITAL TRANSACTIONS: | ||||||||||||||||
| Class A Shares | ||||||||||||||||
| Proceeds from shares issued | $ | 7,657,773 | $ | 6,852,944 | $ | 50,785,379 | $ | 248,534,228 | ||||||||
| Dividends reinvested | 447,869 | 698,600 | 47,225 | 1,489,406 | ||||||||||||
| Cost of shares redeemed | (9,184,933 | ) | (11,919,000 | ) | (152,699,342 | ) | (191,270,157 | ) | ||||||||
| Total Class A | (1,079,291 | ) | (4,367,456 | ) | (101,866,738 | ) | 58,753,477 | |||||||||
| Class A1 Shares | ||||||||||||||||
| Proceeds from shares issued | – | – | – | 522,320 | ||||||||||||
| Dividends reinvested | – | – | 124 | 436 | ||||||||||||
| Cost of shares redeemed | – | – | (47,641 | ) | – | |||||||||||
| Total Class A1 | – | – | (47,517 | ) | 522,756 | |||||||||||
| Class C Shares | ||||||||||||||||
| Proceeds from shares issued | 26,994 | – | – | – | ||||||||||||
| Dividends reinvested | 109 | – | – | – | ||||||||||||
| Total Class C | 27,103 | – | – | – | ||||||||||||
| Institutional Class Shares | ||||||||||||||||
| Proceeds from shares issued | 268,144,226 | 156,905,352 | 657,065,229 | 951,189,708 | ||||||||||||
| Dividends reinvested | 5,859,757 | 5,941,741 | 811,146 | 6,439,517 | ||||||||||||
| Cost of shares redeemed | (125,967,487 | ) | (115,538,904 | ) | (793,374,083 | ) | (709,636,749 | ) | ||||||||
| Total Institutional Class | 148,036,496 | 47,308,189 | (135,497,708 | ) | 247,992,476 | |||||||||||
| Change in net assets from capital transactions: | $ | 146,984,308 | $ | 42,940,733 | $ | (237,411,963 | ) | $ | 307,268,709 | |||||||
| SHARE TRANSACTIONS: | ||||||||||||||||
| Class A Shares | ||||||||||||||||
| Issued | 747,277 | 673,668 | 5,029,554 | 24,628,361 | ||||||||||||
| Reinvested | 43,706 | 69,375 | 4,677 | 147,584 | ||||||||||||
| Redeemed | (898,694 | ) | (1,190,504 | ) | (15,121,758 | ) | (18,956,286 | ) | ||||||||
| Total Class A Shares | (107,711 | ) | (447,461 | ) | (10,087,527 | ) | 5,819,659 | |||||||||
| Class A1 Shares | ||||||||||||||||
| Issued | – | – | – | 51,715 | ||||||||||||
| Reinvested | – | – | 12 | 43 | ||||||||||||
| Redeemed | – | – | (4,717 | ) | – | |||||||||||
| Total Class A1 Shares | – | – | (4,705 | ) | 51,758 | |||||||||||
| Class C Shares | ||||||||||||||||
| Issued | 2,638 | – | – | – | ||||||||||||
| Reinvested | 11 | – | – | – | ||||||||||||
| Total Class C Shares | 2,649 | – | – | – | ||||||||||||
| Institutional Class Shares | ||||||||||||||||
| Issued | 26,088,301 | 15,559,801 | 65,442,952 | 94,804,201 | ||||||||||||
| Reinvested | 571,244 | 590,112 | 80,792 | 641,628 | ||||||||||||
| Redeemed | (12,297,198 | ) | (11,531,243 | ) | (79,028,435 | ) | (70,726,848 | ) | ||||||||
| Total Institutional Class Shares | 14,362,347 | 4,618,670 | (13,504,691 | ) | 24,718,981 | |||||||||||
| Total change in shares: | 14,257,285 | 4,171,209 | (23,596,923 | ) | 30,590,398 | |||||||||||
Amounts listed as "–" are $0 or round to $0.
See accompanying Notes to Financial Statements.
| 2021 Annual Report | 65 |
Financial Highlights
Selected Data for Each Share of Capital Outstanding Throughout the Periods Indicated
Aberdeen Emerging Markets Debt Fund
| Investment Activities | Distributions | ||||||||||||||||||||
| Net Asset Value, Beginning of Period | Net Investment Income (a) | Net Realized and Unrealized Gains (Losses) on Investments | Total from Investment Activities | Net Investment Income | Total Distributions | Net Asset Value, End of Period | |||||||||||||||
| Class A Shares | |||||||||||||||||||||
| Year Ended October 31, 2021 | $ 9.24 | $0.51 | $(0.13 | ) | $ 0.38 | $(0.38 | ) | $(0.38 | ) | $ 9.24 | |||||||||||
| Year Ended October 31, 2020 | 9.72 | 0.43 | (0.58 | ) | (0.15 | ) | (0.33 | ) | (0.33 | ) | 9.24 | ||||||||||
| Year Ended October 31, 2019 | 8.97 | 0.50 | 0.62 | 1.12 | (0.37 | ) | (0.37 | ) | 9.72 | ||||||||||||
| Year Ended October 31, 2018 | 10.27 | 0.47 | (1.26 | ) | (0.79 | ) | (0.51 | ) | (0.51 | ) | 8.97 | ||||||||||
| Year Ended October 31, 2017 | 9.73 | 0.49 | 0.30 | 0.79 | (0.25 | ) | (0.25 | ) | 10.27 | ||||||||||||
| Class C Shares | |||||||||||||||||||||
| Year Ended October 31, 2021 | 9.19 | 0.42 | (0.08 | ) | 0.34 | (0.28 | ) | (0.28 | ) | 9.25 | |||||||||||
| Year Ended October 31, 2020 | 9.69 | 0.36 | (0.58 | ) | (0.22 | ) | (0.28 | ) | (0.28 | ) | 9.19 | ||||||||||
| Year Ended October 31, 2019 | 8.90 | 0.44 | 0.64 | 1.08 | (0.29 | ) | (0.29 | ) | 9.69 | ||||||||||||
| Year Ended October 31, 2018 | 10.22 | 0.43 | (1.28 | ) | (0.85 | ) | (0.47 | ) | (0.47 | ) | 8.90 | ||||||||||
| Year Ended October 31, 2017 | 9.68 | 0.44 | 0.29 | 0.73 | (0.19 | ) | (0.19 | ) | 10.22 | ||||||||||||
| Class R Shares | |||||||||||||||||||||
| Year Ended October 31, 2021 | 9.19 | 0.49 | (0.13 | ) | 0.36 | (0.36 | ) | (0.36 | ) | 9.19 | |||||||||||
| Year Ended October 31, 2020 | 9.69 | 0.39 | (0.57 | ) | (0.18 | ) | (0.32 | ) | (0.32 | ) | 9.19 | ||||||||||
| Year Ended October 31, 2019 | 8.93 | 0.47 | 0.64 | 1.11 | (0.35 | ) | (0.35 | ) | 9.69 | ||||||||||||
| Year Ended October 31, 2018 | 10.25 | 0.46 | (1.28 | ) | (0.82 | ) | (0.50 | ) | (0.50 | ) | 8.93 | ||||||||||
| Year Ended October 31, 2017 | 9.72 | 0.47 | 0.30 | 0.77 | (0.24 | ) | (0.24 | ) | 10.25 | ||||||||||||
| Institutional Service Class Shares | |||||||||||||||||||||
| Year Ended October 31, 2021 | 9.25 | 0.55 | (0.14 | ) | 0.41 | (0.41 | ) | (0.41 | ) | 9.25 | |||||||||||
| Year Ended October 31, 2020 | 9.76 | 0.46 | (0.59 | ) | (0.13 | ) | (0.38 | ) | (0.38 | ) | 9.25 | ||||||||||
| Year Ended October 31, 2019 | 8.99 | 0.53 | 0.65 | 1.18 | (0.41 | ) | (0.41 | ) | 9.76 | ||||||||||||
| Year Ended October 31, 2018 | 10.30 | 0.52 | (1.28 | ) | (0.76 | ) | (0.55 | ) | (0.55 | ) | 8.99 | ||||||||||
| Year Ended October 31, 2017 | 9.75 | 0.54 | 0.30 | 0.84 | (0.29 | ) | (0.29 | ) | 10.30 | ||||||||||||
| Institutional Class Shares | |||||||||||||||||||||
| Year Ended October 31, 2021 | 9.26 | 0.55 | (0.14 | ) | 0.41 | (0.41 | ) | (0.41 | ) | 9.26 | |||||||||||
| Year Ended October 31, 2020 | 9.76 | 0.46 | (0.58 | ) | (0.12 | ) | (0.38 | ) | (0.38 | ) | 9.26 | ||||||||||
| Year Ended October 31, 2019 | 8.99 | 0.51 | 0.67 | 1.18 | (0.41 | ) | (0.41 | ) | 9.76 | ||||||||||||
| Year Ended October 31, 2018 | 10.29 | 0.52 | (1.28 | ) | (0.76 | ) | (0.54 | ) | (0.54 | ) | 8.99 | ||||||||||
| Year Ended October 31, 2017 | 9.74 | 0.54 | 0.29 | 0.83 | (0.28 | ) | (0.28 | ) | 10.29 | ||||||||||||
(a) Net investment income/(loss) is based on average shares outstanding during the period.
(b) Excludes sales charge.
(c) During the period, certain fees were waived and/or reimbursed. If such waivers/reimbursements had not occurred, the ratios would have been as indicated.
Amounts listed as "–" are $0 or round to $0.
See accompanying Notes to Financial Statements.
| 66 | 2021 Annual Report |
Financial Highlights (continued)
Selected Data for Each Share of Capital Outstanding Throughout the Periods Indicated
Aberdeen Emerging Markets Debt Fund (concluded)
| Ratios/Supplemental Data | |||||||||||||||||||||
| Total Return (b) | Net Assets at End of Period (000's) | Ratio of Expenses (Net of Reimbursements/ Waivers) to Average Net Assets | Ratio of Expenses (Prior to Reimbursements) to Average Net Assets (c) | Ratio Net of Investment Income to Average Net Assets | Portfolio Turnover (d) | ||||||||||||||||
| 3.96 | % | $ 227 | 1.02 | %(e) | 1.51 | %(e) | 5.34 | % | 71.56 | % | |||||||||||
| (1.53 | %) | 302 | 1.02 | %(e) | 1.44 | %(e) | 4.57 | % | 63.45 | % | |||||||||||
| 12.81 | % | 852 | 1.07 | % | 1.61 | % | 5.37 | % | 71.06 | % | |||||||||||
| (7.91 | %) | 1,050 | 1.31 | % | 1.93 | % | 4.78 | % | 56.02 | % | |||||||||||
| 8.21 | % | 1,987 | 1.37 | % | 2.15 | % | 4.85 | % | 64.37 | % | |||||||||||
| 3.54 | % | 27 | 1.65 | %(e) | 2.25 | %(e) | 4.39 | % | 71.56 | % | |||||||||||
| (2.34 | %) | 141 | 1.65 | %(e) | 2.16 | %(e) | 3.90 | % | 63.45 | % | |||||||||||
| 12.36 | % | 110 | 1.70 | % | 2.31 | % | 4.75 | % | 71.06 | % | |||||||||||
| (8.58 | %) | 304 | 1.90 | % | 2.58 | % | 4.52 | % | 56.02 | % | |||||||||||
| 7.57 | % | 261 | 1.90 | % | 2.75 | % | 4.46 | % | 64.37 | % | |||||||||||
| 3.74 | % | 3,662 | 1.30 | %(e) | 1.79 | %(e) | 5.22 | % | 71.56 | % | |||||||||||
| (1.94 | %) | 3,572 | 1.30 | %(e) | 1.72 | %(e) | 4.28 | % | 63.45 | % | |||||||||||
| 12.69 | % | 4,318 | 1.31 | % | 1.85 | % | 5.05 | % | 71.06 | % | |||||||||||
| (8.25 | %) | 3,826 | 1.55 | % | 2.17 | % | 4.79 | % | 56.02 | % | |||||||||||
| 7.96 | % | 2,934 | 1.56 | % | 2.34 | % | 4.72 | % | 64.37 | % | |||||||||||
| 4.25 | % | 83 | 0.77 | %(e) | 1.26 | %(e) | 5.75 | % | 71.56 | % | |||||||||||
| (1.36 | %) | 79 | 0.65 | % | 1.07 | % | 4.96 | % | 63.45 | % | |||||||||||
| 13.43 | % | 24 | 0.68 | % | 1.22 | % | 5.66 | % | 71.06 | % | |||||||||||
| (7.63 | %) | 20 | 0.89 | % | 1.52 | % | 5.38 | % | 56.02 | % | |||||||||||
| 8.67 | % | 22 | 0.90 | % | 1.68 | % | 5.43 | % | 64.37 | % | |||||||||||
| 4.32 | % | 36,685 | 0.65 | %(e) | 1.17 | %(e) | 5.77 | % | 71.56 | % | |||||||||||
| (1.29 | %) | 48,312 | 0.65 | %(e) | 1.10 | %(e) | 4.95 | % | 63.45 | % | |||||||||||
| 13.40 | % | 46,573 | 0.67 | % | 1.25 | % | 5.43 | % | 71.06 | % | |||||||||||
| (7.58 | %) | 18,720 | 0.90 | % | 1.58 | % | 5.41 | % | 56.02 | % | |||||||||||
| 8.62 | % | 18,365 | 0.90 | % | 1.76 | % | 5.42 | % | 64.37 | % | |||||||||||
(d) Portfolio turnover is calculated on the basis of the Fund as a whole without distinguishing among the classes of shares.
(e) Includes interest expense that amounts to less than 0.01%.
| 2021 Annual Report | 67 |
Financial Highlights (continued)
Selected Data for Each Share of Capital Outstanding Throughout the Periods Indicated
Aberdeen Global Absolute Return Strategies Fund
| Investment Activities | Distributions | |||||||||||||||||||||||
| Net Asset Value, Beginning of Period | Net Investment Income (Loss) (a) | Net Realized and Unrealized Gains on Investments | Total from Investment Activities | Net Investment Income | Net Realized Gains | Total Distributions | Net Asset Value, End of Period | |||||||||||||||||
| Class A Shares | ||||||||||||||||||||||||
| Year Ended October 31, 2021 | $10.29 | $(0.03 | ) | $0.05 | $ 0.02 | $(0.02 | ) | $ – | $(0.02 | ) | $10.29 | |||||||||||||
| Year Ended October 31, 2020 | 10.13 | 0.04 | 0.29 | 0.33 | (0.17 | ) | – | (0.17 | ) | 10.29 | ||||||||||||||
| Year Ended October 31, 2019 | 10.41 | 0.17 | 0.25 | 0.42 | (0.60 | ) | (0.10 | ) | (0.70 | ) | 10.13 | |||||||||||||
| Year Ended October 31, 2018 | 10.22 | 0.17 | 0.05 | 0.22 | – | (0.03 | ) | (0.03 | ) | 10.41 | ||||||||||||||
| Year Ended October 31, 2017 | 10.18 | 0.13 | 0.02 | 0.15 | – | (0.11 | ) | (0.11 | ) | 10.22 | ||||||||||||||
| Class C Shares | ||||||||||||||||||||||||
| Year Ended October 31, 2021 | 10.10 | (0.11 | ) | 0.06 | (0.05 | ) | (0.01 | ) | – | (0.01 | ) | 10.04 | ||||||||||||
| Year Ended October 31, 2020 | 9.87 | (0.07 | ) | 0.32 | 0.25 | (0.02 | ) | – | (0.02 | ) | 10.10 | |||||||||||||
| Year Ended October 31, 2019 | 10.09 | 0.10 | 0.24 | 0.34 | (0.46 | ) | (0.10 | ) | (0.56 | ) | 9.87 | |||||||||||||
| Year Ended October 31, 2018 | 9.97 | 0.09 | 0.06 | 0.15 | – | (0.03 | ) | (0.03 | ) | 10.09 | ||||||||||||||
| Year Ended October 31, 2017 | 10.01 | 0.06 | 0.01 | 0.07 | – | (0.11 | ) | (0.11 | ) | 9.97 | ||||||||||||||
| Institutional Service Class Shares | ||||||||||||||||||||||||
| Year Ended October 31, 2021 | 10.35 | (0.02 | ) | 0.06 | 0.04 | (0.03 | ) | – | (0.03 | ) | 10.36 | |||||||||||||
| Year Ended October 31, 2020 | 10.20 | 0.06 | 0.29 | 0.35 | (0.20 | ) | – | (0.20 | ) | 10.35 | ||||||||||||||
| Year Ended October 31, 2019 | 10.47 | 0.19 | 0.27 | 0.46 | (0.63 | ) | (0.10 | ) | (0.73 | ) | 10.20 | |||||||||||||
| Year Ended October 31, 2018 | 10.26 | 0.18 | 0.06 | 0.24 | – | (0.03 | ) | (0.03 | ) | 10.47 | ||||||||||||||
| Year Ended October 31, 2017 | 10.21 | 0.15 | 0.01 | 0.16 | – | (0.11 | ) | (0.11 | ) | 10.26 | ||||||||||||||
| Institutional Class Shares | ||||||||||||||||||||||||
| Year Ended October 31, 2021 | 10.43 | – | (g) | 0.05 | 0.05 | (0.04 | ) | – | (0.04 | ) | 10.44 | |||||||||||||
| Year Ended October 31, 2020 | 10.30 | 0.08 | 0.26 | 0.34 | (0.21 | ) | – | (0.21 | ) | 10.43 | ||||||||||||||
| Year Ended October 31, 2019 | 10.55 | 0.20 | 0.27 | 0.47 | (0.62 | ) | (0.10 | ) | (0.72 | ) | 10.30 | |||||||||||||
| Year Ended October 31, 2018 | 10.33 | 0.20 | 0.05 | 0.25 | – | (0.03 | ) | (0.03 | ) | 10.55 | ||||||||||||||
| Year Ended October 31, 2017 | 10.26 | 0.16 | 0.02 | 0.18 | – | (0.11 | ) | (0.11 | ) | 10.33 | ||||||||||||||
(a) Net investment income/(loss) is based on average shares outstanding during the period.
(b) Excludes sales charge.
(c) During the period, certain fees were waived and/or reimbursed. If such waivers/reimbursements had not occurred, the ratios would have been as indicated.
(d) Portfolio turnover is calculated on the basis of the Fund as a whole without distinguishing among the classes of shares.
Amounts listed as "–" are $0 or round to $0.
See accompanying Notes to Financial Statements.
| 68 | 2021 Annual Report |
Financial Highlights (continued)
Selected Data for Each Share of Capital Outstanding Throughout the Periods Indicated
Aberdeen Global Absolute Return Strategies Fund (concluded)
| Ratios/Supplemental Data | |||||||||||||||||||||
| Total Return (b) | Net Assets at End of Period (000's) | Ratio of Expenses (Net of Reimbursements/ Waivers) to Average Net Assets | Ratio of Expenses (Prior to Reimbursements) to Average Net Assets (c) | Ratio of Net Investment Income (Loss) to Average Net Assets | Portfolio Turnover (d) | ||||||||||||||||
| 0.18 | % | $22,522 | 0.96 | % | 2.93 | % | (0.31 | %) | 424.59 | % | |||||||||||
| 3.26 | % | 1,078 | 0.97 | %(e) | 2.52 | %(e) | 0.35 | % | 238.35 | % | |||||||||||
| 4.41 | % | 802 | 1.18 | %(e) | 3.04 | %(e) | 1.69 | % | 53.05 | % | |||||||||||
| 2.10 | % | 1,119 | 1.12 | %(e) | 2.79 | %(e) | 1.60 | % | 62.39 | % | |||||||||||
| 1.53 | % | 806 | 1.17 | %(e) | 2.74 | %(e) | 1.29 | % | 91.26 | % | |||||||||||
| (0.54 | %) | 478 | 1.65 | % | 3.73 | % | (1.07 | %) | 424.59 | % | |||||||||||
| 2.54 | % | 664 | 1.66 | %(e) | 3.30 | %(e) | (0.69 | %) | 238.35 | % | |||||||||||
| 3.68 | % | 141 | 1.86 | %(e) | 3.83 | %(e) | 1.02 | % | 53.05 | % | |||||||||||
| 1.45 | % | 277 | 1.85 | %(e) | 3.65 | %(e) | 0.86 | % | 62.39 | % | |||||||||||
| 0.75 | %(f) | 247 | 1.85 | %(e) | 3.53 | %(e) | 0.62 | % | 91.26 | % | |||||||||||
| 0.33 | %(f) | 6,929 | 0.78 | % | 2.75 | % | (0.20 | %) | 424.59 | % | |||||||||||
| 3.45 | %(f) | 8,148 | 0.80 | %(e) | 2.35 | %(e) | 0.62 | % | 238.35 | % | |||||||||||
| 4.72 | % | 8,934 | 1.00 | %(e) | 2.86 | %(e) | 1.86 | % | 53.05 | % | |||||||||||
| 2.29 | % | 9,768 | 0.96 | %(e) | 2.63 | %(e) | 1.75 | % | 62.39 | % | |||||||||||
| 1.62 | % | 10,553 | 1.02 | %(e) | 2.59 | %(e) | 1.47 | % | 91.26 | % | |||||||||||
| 0.46 | % | 62,007 | 0.65 | % | 2.65 | % | (0.04 | %) | 424.59 | % | |||||||||||
| 3.34 | %(f) | 11,885 | 0.66 | %(e) | 2.24 | %(e) | 0.74 | % | 238.35 | % | |||||||||||
| 4.82 | %(f) | 2,876 | 0.86 | %(e) | 2.84 | %(e) | 1.98 | % | 53.05 | % | |||||||||||
| 2.47 | % | 5,521 | 0.85 | %(e) | 2.70 | %(e) | 1.94 | % | 62.39 | % | |||||||||||
| 1.81 | % | 1,685 | 0.85 | %(e) | 2.56 | %(e) | 1.60 | % | 91.26 | % | |||||||||||
(e) Interest expense is less than 0.001%.
(f) The total return shown above includes the impact of financial statement rounding of the NAV per share and/or financial statement adjustments.
(g) Less than $0.005 per share.
| 2021 Annual Report | 69 |
Financial Highlights (continued)
Selected Data for Each Share of Capital Outstanding Throughout the Periods Indicated
Aberdeen Intermediate Municipal Income Fund
| Investment Activities | Distributions | |||||||||||||||||||||||
| Net Asset Value, Beginning of Period | Net Investment Income (a) | Net Realized and Unrealized Gains (Losses) on Investments | Total from Investment Activities | Net Investment Income | Net Realized Gains | Total Distributions | Net Asset Value, End of Period | |||||||||||||||||
| Class A Shares | ||||||||||||||||||||||||
| Year Ended October 31, 2021 | $ 9.73 | $0.24 | $ 0.12 | $0.36 | $(0.24 | ) | $(0.02 | ) | $(0.26 | ) | $9.83 | |||||||||||||
| Year Ended October 31, 2020 | 9.92 | 0.26 | (0.18 | ) | 0.08 | (0.26 | ) | (0.01 | ) | (0.27 | ) | 9.73 | ||||||||||||
| Year Ended October 31, 2019 | 9.54 | 0.28 | 0.38 | 0.66 | (0.28 | ) | – | (f) | (0.28 | ) | 9.92 | |||||||||||||
| Year Ended October 31, 2018 | 9.89 | 0.29 | (0.35 | ) | (0.06 | ) | (0.29 | ) | – | (0.29 | ) | 9.54 | ||||||||||||
| Year Ended October 31, 2017 | 10.11 | 0.29 | (0.22 | ) | 0.07 | (0.29 | ) | – | (0.29 | ) | 9.89 | |||||||||||||
| Class C Shares | ||||||||||||||||||||||||
| Year Ended October 31, 2021 | 9.71 | 0.16 | 0.12 | 0.28 | (0.16 | ) | (0.02 | ) | (0.18 | ) | 9.81 | |||||||||||||
| Year Ended October 31, 2020 | 9.91 | 0.18 | (0.19 | ) | (0.01 | ) | (0.18 | ) | (0.01 | ) | (0.19 | ) | 9.71 | |||||||||||
| Year Ended October 31, 2019 | 9.52 | 0.21 | 0.39 | 0.60 | (0.21 | ) | – | (f) | (0.21 | ) | 9.91 | |||||||||||||
| Year Ended October 31, 2018 | 9.87 | 0.21 | (0.35 | ) | (0.14 | ) | (0.21 | ) | – | (0.21 | ) | 9.52 | ||||||||||||
| Year Ended October 31, 2017 | 10.09 | 0.22 | (0.22 | ) | – | (0.22 | ) | – | (0.22 | ) | 9.87 | |||||||||||||
| Institutional Service Class Shares | ||||||||||||||||||||||||
| Year Ended October 31, 2021 | 9.74 | 0.26 | 0.12 | 0.38 | (0.26 | ) | (0.02 | ) | (0.28 | ) | 9.84 | |||||||||||||
| Year Ended October 31, 2020 | 9.93 | 0.28 | (0.18 | ) | 0.10 | (0.28 | ) | (0.01 | ) | (0.29 | ) | 9.74 | ||||||||||||
| Year Ended October 31, 2019 | 9.54 | 0.30 | 0.40 | 0.70 | (0.31 | ) | – | (f) | (0.31 | ) | 9.93 | |||||||||||||
| Year Ended October 31, 2018 | 9.89 | 0.31 | (0.35 | ) | (0.04 | ) | (0.31 | ) | – | (0.31 | ) | 9.54 | ||||||||||||
| Year Ended October 31, 2017 | 10.12 | 0.31 | (0.23 | ) | 0.08 | (0.31 | ) | – | (0.31 | ) | 9.89 | |||||||||||||
| Institutional Class Shares | ||||||||||||||||||||||||
| Year Ended October 31, 2021 | 9.74 | 0.26 | 0.12 | 0.38 | (0.26 | ) | (0.02 | ) | (0.28 | ) | 9.84 | |||||||||||||
| Year Ended October 31, 2020 | 9.93 | 0.28 | (0.18 | ) | 0.10 | (0.28 | ) | (0.01 | ) | (0.29 | ) | 9.74 | ||||||||||||
| Year Ended October 31, 2019 | 9.55 | 0.30 | 0.39 | 0.69 | (0.31 | ) | – | (f) | (0.31 | ) | 9.93 | |||||||||||||
| Year Ended October 31, 2018 | 9.90 | 0.31 | (0.35 | ) | (0.04 | ) | (0.31 | ) | – | (0.31 | ) | 9.55 | ||||||||||||
| Year Ended October 31, 2017 | 10.12 | 0.32 | (0.23 | ) | 0.09 | (0.31 | ) | – | (0.31 | ) | 9.90 | |||||||||||||
| (a) | Net investment income/(loss) is based on average shares outstanding during the period. |
| (b) | Excludes sales charge. |
| (c) | During the period, certain fees were waived and/or reimbursed. If such waivers/reimbursements had not occurred, the ratios would have been as indicated. |
Amounts listed as "–" are $0 or round to $0.
See accompanying Notes to Financial Statements.
| 70 | 2021 Annual Report |
Financial Highlights (continued)
Selected Data for Each Share of Capital Outstanding Throughout the Periods Indicated
Aberdeen Intermediate Municipal Income Fund (concluded)
| Ratios/Supplemental Data | |||||||||||||||||||||
| Total Return (b) | Net Assets at End of Period (000's) | Ratio of Expenses (Net of Reimbursements/ Waivers) to Average Net Assets | Ratio of Expenses (Prior to Reimbursements) to Average Net Assets (c) | Ratio of Net Investment Income to Average Net Assets | Portfolio Turnover (d) | ||||||||||||||||
| 3.62 | % | $ 6,028 | 0.76 | % | 1.12 | % | 2.38 | % | 53.74 | % | |||||||||||
| 0.83 | % | 6,670 | 0.76 | %(e) | 1.09 | %(e) | 2.63 | % | 55.63 | % | |||||||||||
| 7.05 | % | 7,526 | 0.76 | %(e) | 1.16 | %(e) | 2.84 | % | 58.33 | % | |||||||||||
| (0.65 | %) | 7,141 | 0.80 | % | 1.08 | % | 2.95 | % | 14.38 | % | |||||||||||
| 0.72 | % | 9,084 | 0.88 | %(e) | 1.05 | %(e) | 2.92 | % | 16.25 | % | |||||||||||
| 2.87 | % | 314 | 1.50 | % | 1.88 | % | 1.64 | % | 53.74 | % | |||||||||||
| (0.01 | %) | 270 | 1.50 | %(e) | 1.87 | %(e) | 1.89 | % | 55.63 | % | |||||||||||
| 6.39 | % | 252 | 1.50 | %(e) | 1.93 | %(e) | 2.12 | % | 58.33 | % | |||||||||||
| (1.39 | %) | 279 | 1.55 | % | 1.87 | % | 2.20 | % | 14.38 | % | |||||||||||
| (0.02 | %) | 542 | 1.62 | %(e) | 1.83 | %(e) | 2.21 | % | 16.25 | % | |||||||||||
| 3.90 | % | 20 | 0.50 | % | 0.86 | % | 2.64 | % | 53.74 | % | |||||||||||
| 1.09 | % | 20 | 0.50 | %(e) | 0.83 | %(e) | 2.87 | % | 55.63 | % | |||||||||||
| 7.43 | % | 19 | 0.50 | %(e) | 0.90 | %(e) | 3.10 | % | 58.33 | % | |||||||||||
| (0.40 | %) | 18 | 0.54 | % | 0.82 | % | 3.21 | % | 14.38 | % | |||||||||||
| 0.79 | % | 18 | 0.69 | %(e) | 0.86 | %(e) | 3.10 | % | 16.25 | % | |||||||||||
| 3.90 | % | 54,707 | 0.50 | % | 0.87 | % | 2.64 | % | 53.74 | % | |||||||||||
| 1.10 | % | 58,015 | 0.50 | %(e) | 0.84 | %(e) | 2.89 | % | 55.63 | % | |||||||||||
| 7.32 | % | 63,256 | 0.50 | %(e) | 0.90 | %(e) | 3.11 | % | 58.33 | % | |||||||||||
| (0.39 | %) | 65,428 | 0.54 | % | 0.83 | % | 3.21 | % | 14.38 | % | |||||||||||
| 0.98 | % | 71,362 | 0.62 | %(e) | 0.79 | %(e) | 3.18 | % | 16.25 | % | |||||||||||
| (d) | Portfolio turnover is calculated on the basis of the Fund as a whole without distinguishing among the classes of shares. |
| (e) | Interest expense is less than 0.001%. |
| (f) | Less than $0.005 per share. |
| 2021 Annual Report | 71 |
Financial Highlights (continued)
Selected Data for Each Share of Capital Outstanding Throughout the Periods Indicated
Aberdeen Short Duration High Yield Municipal Fund
| Investment Activities | Distributions | ||||||||||||||||||||||||||
| Net Asset Value, Beginning of Period | Net Investment Income | Net Realized and Unrealized Gains (Losses) on Investments | Total from Investment Activities | Net Investment Income | Tax Return of Capital | Total Distributions | Redemption Fees | Net Asset Value, End of Period | |||||||||||||||||||
| Class A Shares | |||||||||||||||||||||||||||
| Year Ended October 31, 2021 | $ 9.99 | $ 0.22 | (d) | $ 0.27 | $0.49 | $(0.22 | ) | $ – | $(0.22 | ) | $ – | $10.26 | |||||||||||||||
| Year Ended October 31, 2020 | 10.25 | 0.29 | (d) | (0.27 | ) | 0.02 | (0.28 | ) | – | (0.28 | ) | – | 9.99 | ||||||||||||||
| Year Ended October 31, 2019 | 10.07 | 0.30 | (d) | 0.18 | 0.48 | (0.30 | ) | – | (0.30 | ) | – | 10.25 | |||||||||||||||
| Year Ended October 31, 2018(f) | 10.24 | 0.31 | (d) | (0.17 | ) | 0.14 | (0.31 | ) | 0.00 | (g) | (0.31 | ) | 0.00 | (g) | 10.07 | ||||||||||||
| Year Ended October 31, 2017 | 10.34 | 0.28 | (0.10 | ) | 0.18 | (0.28 | ) | – | (0.28 | ) | 0.00 | (g) | 10.24 | ||||||||||||||
| Class C Shares(h) | |||||||||||||||||||||||||||
| Period Ended October 31, 2021 | 10.13 | 0.12 | (d) | 0.14 | 0.26 | (0.12 | ) | – | (0.12 | ) | – | 10.27 | |||||||||||||||
| Institutional Class Shares | |||||||||||||||||||||||||||
| Year Ended October 31, 2021 | 9.99 | 0.24 | (d) | 0.27 | 0.51 | (0.24 | ) | – | (0.24 | ) | – | 10.26 | |||||||||||||||
| Year Ended October 31, 2020 | 10.25 | 0.31 | (d) | (0.26 | ) | 0.05 | (0.31 | ) | – | (0.31 | ) | – | 9.99 | ||||||||||||||
| Year Ended October 31, 2019 | 10.07 | 0.32 | (d) | 0.18 | 0.50 | (0.32 | ) | – | (0.32 | ) | – | 10.25 | |||||||||||||||
| Year Ended October 31, 2018(f) | 10.24 | 0.33 | (d) | (0.16 | ) | 0.17 | (0.34 | ) | 0.00 | (g) | (0.34 | ) | 0.00 | (g) | 10.07 | ||||||||||||
| Year Ended October 31, 2017 | 10.34 | 0.31 | (0.10 | ) | 0.21 | (0.31 | ) | – | (0.31 | ) | 0.00 | (g) | 10.24 | ||||||||||||||
| (a) | Excludes sales charge. |
| (b) | During the period, certain fees were waived and/or reimbursed. If such waivers/reimbursements had not occurred, the ratios would have been as indicated. |
| (c) | Portfolio turnover is calculated on the basis of the Fund as a whole without distinguishing among the classes of shares. |
| (d) | Net investment income/(loss) is based on average shares outstanding during the period. |
Amounts listed as "–" are $0 or round to $0.
See accompanying Notes to Financial Statements.
| 72 | 2021 Annual Report |
Financial Highlights (continued)
Selected Data for Each Share of Capital Outstanding Throughout the Periods Indicated
Aberdeen Short Duration High Yield Municipal Fund (concluded)
| Ratios/Supplemental Data | |||||||||||||||||||||
| Total Return (a) | Net Assets at End of Period (000's) | Ratio of Expenses (Net of Reimbursements/ Waivers) to Average Net Assets | Ratio of Expenses (Prior to Reimbursements) to Average Net Assets (b) | Ratio of Net Investment Income to Average Net Assets | Portfolio Turnover (c) | ||||||||||||||||
| 4.92 | % | $ 21,907 | 0.90 | % | 1.14 | % | 2.14 | % | 95.56 | % | |||||||||||
| 0.25 | % | 22,417 | 0.90 | %(e) | 1.12 | %(e) | 2.84 | % | 149.01 | % | |||||||||||
| 4.78 | % | 27,577 | 0.90 | % | 1.13 | % | 2.96 | % | 104.52 | % | |||||||||||
| 1.42 | % | 29,433 | 0.91 | %(e) | 1.11 | %(e) | 3.03 | % | 86.19 | % | |||||||||||
| 1.82 | % | 50,906 | 0.90 | %(e) | 1.09 | %(e) | 2.78 | % | 151.00 | % | |||||||||||
| 2.52 | % | 27 | 1.65 | % | 1.86 | % | 1.33 | % | 95.56 | % | |||||||||||
| 5.18 | % | 424,689 | 0.65 | % | 0.88 | % | 2.37 | % | 95.56 | % | |||||||||||
| 0.51 | % | 270,153 | 0.65 | %(e) | 0.87 | %(e) | 3.07 | % | 149.01 | % | |||||||||||
| 5.05 | % | 229,716 | 0.65 | %(e) | 0.90 | %(e) | 3.19 | % | 104.52 | % | |||||||||||
| 1.67 | % | 177,810 | 0.66 | %(e) | 0.87 | %(e) | 3.27 | % | 86.19 | % | |||||||||||
| 2.08 | % | 207,427 | 0.65 | %(e) | 0.84 | %(e) | 3.04 | % | 151.00 | % | |||||||||||
| (e) | Includes interest expense that amounts to less than 0.01% for the years ended October 31, 2020 and October 31, 2017. Includes interest expense that amounts to 0.01% for the years ended October 31, 2018. |
| (f) | Beginning with the year ended October 31, 2018, the Fund was audited by KPMG LLP. Previous years were audited by a different independent registered public accounting firm. |
| (g) | Less than $0.005 per share. |
| (h) | For the period from December 21, 2020 (commencement of operations) through October 31, 2021. |
| 2021 Annual Report | 73 |
Financial Highlights (continued)
Selected Data for Each Share of Capital Outstanding Throughout the Periods Indicated
Aberdeen Ultra Short Municipal Income Fund
| Investment Activities | Distributions | |||||||||||||||||||||||
| Net Asset Value, Beginning of Period | Net Investment Income | Net Realized and Unrealized Gains (Losses) on Investments | Total from Investment Activities | Net Investment Income | Total Distributions | Redemption Fees | Net Asset Value, End of Period | |||||||||||||||||
| Class A Shares | ||||||||||||||||||||||||
| Year Ended October 31, 2021 | $10.09 | $ – | (d)(e) | $ – | (e) | $ – | (e) | $ – | (e) | $ – | (e) | $ – | $10.09 | |||||||||||
| Year Ended October 31, 2020 | 10.10 | 0.07 | (d) | – | (e) | 0.07 | (0.08 | ) | (0.08 | ) | – | 10.09 | ||||||||||||
| Year Ended October 31, 2019 | 10.09 | 0.13 | (d) | 0.01 | 0.14 | (0.13 | ) | (0.13 | ) | – | 10.10 | |||||||||||||
| Year Ended October 31, 2018(g) | 10.09 | 0.11 | (d) | 0.00 | 0.11 | (0.11 | ) | (0.11 | ) | 0.00 | (e) | 10.09 | ||||||||||||
| Year Ended October 31, 2017 | 10.09 | 0.06 | (0.00 | )(e) | 0.06 | (0.06 | ) | (0.06 | ) | 0.00 | (e) | 10.09 | ||||||||||||
| Class A1 Shares | ||||||||||||||||||||||||
| Year Ended October 31, 2021 | 10.10 | – | (d)(e) | – | (e) | – | (e) | – | (e) | – | (e) | – | 10.10 | |||||||||||
| Year Ended October 31, 2020 | 10.10 | 0.03 | (d) | 0.05 | 0.08 | (0.08 | ) | (0.08 | ) | – | 10.10 | |||||||||||||
| Year Ended October 31, 2019(h) | 10.10 | 0.08 | – | (e) | 0.08 | (0.08 | ) | (0.08 | ) | – | 10.10 | |||||||||||||
| Institutional Class Shares | ||||||||||||||||||||||||
| Year Ended October 31, 2021 | 10.03 | 0.01 | (d) | 0.01 | 0.02 | (0.01 | ) | (0.01 | ) | – | 10.04 | |||||||||||||
| Year Ended October 31, 2020 | 10.04 | 0.10 | (d) | (0.01 | ) | 0.09 | (0.10 | ) | (0.10 | ) | – | 10.03 | ||||||||||||
| Year Ended October 31, 2019 | 10.04 | 0.15 | (d) | – | 0.15 | (0.15 | ) | (0.15 | ) | – | 10.04 | |||||||||||||
| Year Ended October 31, 2018(g) | 10.04 | 0.13 | (d) | 0.00 | 0.13 | (0.13 | ) | (0.13 | ) | 0.00 | (e) | 10.04 | ||||||||||||
| Year Ended October 31, 2017 | 10.04 | 0.09 | (0.00 | )(e) | 0.09 | (0.09 | ) | (0.09 | ) | 0.00 | (e) | 10.04 | ||||||||||||
| (a) | Excludes sales charge. |
| (b) | During the period, certain fees were waived and/or reimbursed. If such waivers/reimbursements had not occurred, the ratios would have been as indicated. |
| (c) | Portfolio turnover is calculated on the basis of the Fund as a whole without distinguishing among the classes of shares. |
| (d) | Net investment income/(loss) is based on average shares outstanding during the period. |
Amounts listed as "–" are $0 or round to $0.
See accompanying Notes to Financial Statements.
| 74 | 2021 Annual Report |
Financial Highlights (concluded)
Selected Data for Each Share of Capital Outstanding Throughout the Periods Indicated
Aberdeen Ultra Short Municipal Income Fund (concluded)
| Ratios/Supplemental Data | |||||||||||||||||||||
| Total Return (a) | Net Assets at End of Period (000's) | Ratio of Expenses (Net of Reimbursements/ Waivers) to Average Net Assets | Ratio of Expenses (Prior to Reimbursements) to Average Net Assets (b) | Ratio of Net Investment Income to Average Net Assets | Portfolio Turnover (c) | ||||||||||||||||
| 0.02 | % | $ 161,362 | 0.54 | %(f) | 0.96 | %(f) | 0.02 | % | 261.23 | % | |||||||||||
| 0.69 | % | 263,068 | 0.70 | %(f) | 0.94 | %(f) | 0.72 | % | 299.40 | % | |||||||||||
| 1.36 | % | 204,501 | 0.70 | % | 0.95 | % | 1.25 | % | 231.49 | % | |||||||||||
| 1.09 | % | 223,255 | 0.70 | % | 0.92 | % | 1.08 | % | 177.63 | % | |||||||||||
| 0.62 | % | 211,265 | 0.69 | % | 0.90 | % | 0.62 | % | 214.00 | % | |||||||||||
| 0.02 | % | 510 | 0.54 | %(f) | 0.89 | %(f) | 0.02 | % | 261.23 | % | |||||||||||
| 0.79 | % | 558 | 0.70 | %(f) | 0.90 | %(f) | 0.34 | % | 299.40 | % | |||||||||||
| 0.81 | % | 35 | 0.70 | % | 0.94 | % | 1.13 | % | 231.49 | % | |||||||||||
| 0.21 | % | 793,264 | 0.45 | %(f) | 0.71 | %(f) | 0.11 | % | 261.23 | % | |||||||||||
| 0.94 | % | 928,424 | 0.45 | %(f) | 0.71 | %(f) | 0.98 | % | 299.40 | % | |||||||||||
| 1.51 | % | 680,881 | 0.45 | % | 0.72 | % | 1.50 | % | 231.49 | % | |||||||||||
| 1.34 | % | 802,312 | 0.45 | % | 0.67 | % | 1.32 | % | 177.63 | % | |||||||||||
| 0.87 | % | 896,624 | 0.44 | % | 0.65 | % | 0.86 | % | 214.00 | % | |||||||||||
| (e) | Less than $0.005 per share. |
| (f) | Includes interest expense that amounts to less than 0.01%. |
| (g) | Beginning with the year ended October 31, 2018, the Fund was audited by KPMG LLP. Previous years were audited by a different independent registered public accounting firm. |
| (h) | For the period from February 28, 2019 (commencement of operations) through October 31, 2019. |
| 2021 Annual Report | 75 |
Notes to Financial Statements
October 31, 2021
1. Organization
Aberdeen Funds (the "Trust") was organized as a statutory trust under the laws of the state of Delaware by a Certificate of Trust filed on September 27, 2007 and is registered under the Investment Company Act of 1940, as amended (the "1940 Act"), as an open-end management investment company. As of October 31, 2021, the Trust had authorized an unlimited number of shares of beneficial interest ("shares") without par value. As of October 31, 2021, the Trust operated seventeen (17) separate series, or mutual funds, each with its own investment objective(s) and strategies. This report contains the financial statements and financial highlights of the five (5) funds listed below (each a "Fund", collectively, the "Funds"):
– Aberdeen Emerging Markets Debt Fund ("Emerging Markets Debt Fund")
– Aberdeen Global Absolute Return Strategies Fund ("Global Absolute Return Strategies Fund")
– Aberdeen Intermediate Municipal Income Fund ("Intermediate Municipal Income Fund")
– Aberdeen Short Duration High Yield Municipal Fund ("Short Duration High Yield Municipal Fund")
– Aberdeen Ultra Short Municipal Income Fund ("Ultra Short Municipal Income Fund")
2. Summary of Significant Accounting Policies
The Trust is an investment company and accordingly follows the investment company accounting and reporting guidance of the Financial Accounting Standards Board ("FASB") Accounting Standard Codification Topic 946 Financial Services-Investment Companies. The following is a summary of significant accounting policies followed by the Funds in the preparation of their financial statements. The policies conform to generally accepted accounting principles in the United States of America ("GAAP"). The preparation of financial statements requires management to make estimates and assumptions that affect the reported amounts of assets and liabilities, disclosure of contingent assets and liabilities at the date of the financial statements, and the reported amounts of income and expenses for the period. Actual results could differ from those estimates. The accounting records of the Funds are maintained in U.S. Dollars.
a. Security Valuation
The Funds value their securities at current market value or fair value, consistent with regulatory requirements. "Fair value" is defined in the Funds' Valuation and Liquidity Procedures as the price that could be received to sell an asset or paid to transfer a liability in an orderly transaction between willing market participants without a compulsion to transact at the measurement date.
Equity securities that are traded on an exchange are valued at the last quoted sale price on the principal exchange on which the security is traded at the "Valuation Time" subject to application, when appropriate, of the valuation factors described in the paragraph below. Under normal circumstances, the Valuation Time is as of the close of regular trading on the New York Stock Exchange (usually 4:00 p.m. Eastern Time). In the absence of a sale price, the security is valued at the mean of the bid/ask price quoted at the close on the principal exchange on which the security is traded. Securities traded on NASDAQ are valued at the NASDAQ official closing price.
In accordance with the authoritative guidance on fair value measurements and disclosures under U.S. GAAP, the Funds disclose the fair value of their investments using a three-level hierarchy that classifies the inputs to valuation techniques used to measure the fair value. The hierarchy assigns Level 1, the highest level, measurements to valuations based upon unadjusted quoted prices in active markets for identical assets, Level 2 measurements to valuations based upon other significant observable inputs, including adjusted quoted prices in active markets for similar assets, and Level 3, the lowest level, measurements to valuations based upon unobservable inputs that are significant to the valuation. Inputs refer broadly to the assumptions that market participants would use in pricing the asset or liability, including assumptions about risk, for example, the risk inherent in a particular valuation technique used to measure fair value including a pricing model and/or the risk inherent in the inputs to the valuation technique. Inputs may be observable or unobservable. Observable inputs are inputs that reflect the assumptions market participants would use in pricing the asset or liability, which are based on market data obtained from sources independent of the reporting entity. Unobservable inputs are inputs that reflect the reporting entity's own assumptions about the assumptions market participants would use in pricing the asset or liability developed based on the best information available in the circumstances. A financial instrument's level within the fair value hierarchy is based upon the lowest level of any input that is significant to the fair value measurement.
Foreign equity securities that are traded on foreign exchanges that close prior to the Valuation Time are valued by applying valuation factors to the last sale price or the mean price as noted above. Valuation factors are provided by an independent pricing service provider approved by the Board. These valuation factors are used when pricing a Fund's portfolio holdings to estimate market movements between the time foreign markets close and the time a Fund values such foreign securities. These valuation factors are based on inputs such as depositary receipts, indices, futures, sector indices/ETFs, exchange rates, and local exchange opening and closing prices of each security. When prices with the application of valuation factors are utilized, the value assigned to the foreign securities may not be the same as quoted or published prices of the securities on their primary markets. A security that applies a valuation factor is determined to be a Level 2 investment because the
| 76 | 2021 Annual Report |
Notes to Financial Statements (continued)
October 31, 2021
exchange-traded price has been adjusted. Valuation factors are not utilized if the independent pricing service provider is unable to provide a valuation factor or if the valuation factor falls below a predetermined threshold; in such case, the security is determined to be a Level 1 investment.
Long-term debt and other fixed income securities are valued at the last quoted or evaluated bid price on the valuation date provided by an independent pricing service provider approved by the Board of Trustees of the Trust (the "Board"). If there are no current day bids, the security is valued at the previously applied bid. Pricing services generally price debt securities assuming orderly transactions of an institutional "round lot" size, and the strategies employed by Aberdeen Standard Investments Inc. ("Aberdeen," the "Adviser" or "ASII") (to be known as abrdn Inc. effective January 1, 2022) generally trade in round lot sizes. In certain circumstances, fixed income securities may be held or transactions may be conducted in smaller, "odd lot" sizes. Odd lots may trade at lower or occasionally higher prices than institutional round lot trades. Short-term debt securities (such as commercial paper and U.S. treasury bills) having a remaining maturity of 60 days or less are valued at the last quoted or evaluated bid price on the valuation date provided by an independent pricing service, or on the basis of amortized cost if it represents the best approximation for fair value. Debt and other fixed-income securities are generally determined to be Level 2 investments.
Short-term investments are comprised of cash and cash equivalents invested in short-term investment funds which are redeemable daily. Each Fund sweeps available cash into the State Street Institutional U.S. Government Money Market Fund, which has elected to qualify as a "government money market fund" pursuant to Rule 2a-7 under the 1940 Act, and has an objective, which is not guaranteed, to maintain a $1.00 per share net asset value ("NAV"). Generally, these investment types are categorized as Level 1 investments.
Derivative instruments are generally valued according to the following procedures. Exchange traded derivatives are generally Level 1 investments and over-the-counter and centrally cleared derivatives are generally Level 2 investments. Forward currency exchange contracts are generally valued based on the current spot exchange rates and the forward exchange rate points (ex. 1-month, 3-month) that are obtained from an approved pricing agent. Based on the actual settlement dates of the forward contracts held, an interpolated value of the forward points is combined with the spot exchange rate to derive the valuation. Futures contracts are generally valued at the most recent settlement price as of NAV determination. Swap agreements are generally valued by an approved pricing agent based on the terms of the swap agreement (including future cash flows). Exchange-traded options are valued at the last quoted sales price. In the absence of a sales price, options are valued at the mean of the bid/ask price quoted at the close on the exchange on which the options trade. When market quotations or exchange rates are not readily available, or if the Adviser concludes that such market quotations do not accurately reflect fair value, the fair value of a Fund's assets are determined in good faith in accordance with the Valuation Procedures.
In the event that a security's market quotations are not readily available or are deemed unreliable (for reasons other than because the foreign exchange on which it trades closed before the Valuation Time), the security is valued at fair value as determined by the Funds' Pricing Committee (the "Pricing Committee"), taking into account the relevant factors and surrounding circumstances using Valuation and Liquidity Procedures approved by the Board. A security that has been fair valued by the Pricing Committee may be classified as Level 2 or Level 3 depending on the nature of the inputs.
The three-level hierarchy of inputs is summarized below:
• Level 1 – quoted prices in active markets for identical investments;
• Level 2 – other significant observable inputs (including quoted prices for similar securities, interest rates, prepayment speeds, and credit risk); or
• Level 3 – significant unobservable inputs (including a Fund's own assumptions in determining the fair value of investments).
A summary of standard inputs is listed below:
| Security Type | Standard Inputs | |
| Debt and other fixed-income | Reported trade data, broker-dealer price quotations, benchmark yields, issuer spreads on comparable | |
| securities | securities, credit quality, yield, and maturity. | |
| Foreign equities utilizing | Depositary receipts, indices, futures, sector indices/ETFs, exchange rates, and local exchange opening and | |
| a fair value factor | closing prices of each security. | |
| Forward foreign currency | Forward exchange rate quotations. | |
| contracts | ||
| Swap agreements | Market information pertaining to the underlying reference assets, i.e., credit spreads, credit event | |
| probabilities, fair values, forward rates, and volatility measures. | ||
| 2021 Annual Report | 77 |
Notes to Financial Statements (continued)
October 31, 2021
The following is a summary of the inputs used as of October 31, 2021 in valuing the Funds' investments at fair value. The inputs or methodologies used for valuing securities are not necessarily an indication of the risk associated with investing in those securities.
Please refer to the Statements of Investments for a detailed breakout of the security types:
| Investments, at Value | Level 1 | Level 2 | Level 3 | Total | ||||||||||||
| Emerging Markets Debt Fund | ||||||||||||||||
| Investments in Securities | ||||||||||||||||
| Corporate Bonds | $ – | $ 8,617,342 | $– | $ 8,617,342 | ||||||||||||
| Government Bonds | – | 29,979,087 | – | 29,979,087 | ||||||||||||
| Warrants | – | – | 0 | – | ||||||||||||
| Short-Term Investment | 2,090,253 | – | – | 2,090,253 | ||||||||||||
| Other Financial Instruments | ||||||||||||||||
| Assets | ||||||||||||||||
| Forward Foreign Currency Exchange Contracts | – | 176,246 | – | 176,246 | ||||||||||||
| Liabilities | ||||||||||||||||
| Forward Foreign Currency Exchange Contracts | – | (64,535 | ) | – | (64,535 | ) | ||||||||||
| $ 2,090,253 | $ 38,708,140 | $– | $ 40,798,393 | |||||||||||||
| Global Absolute Return Strategies Fund | ||||||||||||||||
| Investments in Securities | ||||||||||||||||
| Government Bonds | $ – | $ 19,251,383 | $– | $ 19,251,383 | ||||||||||||
| Certificates of Deposit | – | 23,783,343 | – | 23,783,343 | ||||||||||||
| Money Market Funds | 39,448,913 | – | – | 39,448,913 | ||||||||||||
| U.S. Treasuries | – | 8,498,961 | – | 8,498,961 | ||||||||||||
| Purchased options | 33,750 | – | – | 33,750 | ||||||||||||
| Other Financial Instruments | ||||||||||||||||
| Assets | ||||||||||||||||
| Futures Contracts | 621,672 | – | – | 621,672 | ||||||||||||
| Forward Foreign Currency Exchange Contracts | – | 731,411 | – | 731,411 | ||||||||||||
| Credit Default Swap Contracts | – | 181,675 | – | 181,675 | ||||||||||||
| Centrally Cleared Interest Rate Swap Agreements | – | 557,740 | – | 557,740 | ||||||||||||
| Total Return Swaps | – | 4,849 | – | 4,849 | ||||||||||||
| Written Options | 67,379 | – | – | 67,379 | ||||||||||||
| Liabilities | ||||||||||||||||
| Futures Contracts | (18,263 | ) | – | – | (18,263 | ) | ||||||||||
| Forward Foreign Currency Exchange Contracts | – | (596,020 | ) | – | (596,020 | ) | ||||||||||
| Credit Default Swap Contracts | – | (45,813 | ) | – | (45,813 | ) | ||||||||||
| Centrally Cleared Interest Rate Swap Agreements | – | (1,972,192 | ) | – | (1,972,192 | ) | ||||||||||
| Total Return Swaps | – | (36,511 | ) | – | (36,511 | ) | ||||||||||
| Written Options | (27,092 | ) | – | – | (27,092 | ) | ||||||||||
| $ 40,126,359 | $ 50,358,826 | $– | $ 90,485,185 | |||||||||||||
| Intermediate Municipal Income Fund | ||||||||||||||||
| Investments in Securities | ||||||||||||||||
| Municipal Bonds | $ – | $ 60,331,166 | $– | $ 60,331,166 | ||||||||||||
| Short-Term Investment | 57,419 | – | – | 57,419 | ||||||||||||
| $ 57,419 | $ 60,331,166 | $– | $ 60,388,585 | |||||||||||||
| 78 | 2021 Annual Report |
Notes to Financial Statements (continued)
October 31, 2021
| Investments, at Value | Level 1 | Level 2 | Level 3 | Total | ||||||||||||
| Short Duration High Yield Municipal Fund | ||||||||||||||||
| Investments in Securities | ||||||||||||||||
| Municipal Bonds | $ – | $ 456,992,053 | $– | $ 456,992,053 | ||||||||||||
| Short-Term Investment | 180,752 | – | – | 180,752 | ||||||||||||
| $ 180,752 | $ 456,992,053 | $– | $ 457,172,805 | |||||||||||||
| Ultra Short Municipal Income Fund | ||||||||||||||||
| Investments in Securities | ||||||||||||||||
| Municipal Bonds | $ – | $ 955,950,570 | $– | $ 955,950,570 | ||||||||||||
| Short-Term Investments | 201,221 | 39,135,000 | – | 39,336,221 | ||||||||||||
| $ 201,221 | $ 995,085,570 | $– | $ 995,286,791 | |||||||||||||
For the fiscal year ended October 31, 2021, there were no significant changes to the fair valuation methodologies. Level 3 investments held by the Emerging Markets Debt Fund, at the beginning, during and at the end of the fiscal year in relation to net assets were not significant (0.00% of total net assets) and accordingly, a reconciliation of Level 3 assets for the fiscal year ended October 31, 2021 is not presented.
b. Restricted Securities
Restricted securities are privately-placed securities whose resale is restricted under U.S. securities laws. The Funds may invest in restricted securities, including unregistered securities eligible for resale without registration pursuant to Rule 144A and privately-placed securities of U.S. and non-U.S. issuers offered outside the U.S. without registration pursuant to Regulation S under the Securities Act of 1933, as amended. Rule 144A securities may be freely traded among certain qualified institutional investors, such as the Funds, but resale of such securities in the U.S. is permitted only in limited circumstances.
c. Foreign Currency Translation
Foreign securities, currencies, and other assets and liabilities denominated in foreign currencies are translated into U.S. Dollars at the exchange rate of said currencies against the U.S. Dollar, as of the Valuation Time, as provided by an independent pricing service. Purchases and sales of securities, and income and expenses are translated at the prevailing rate of exchange on the respective date of these transactions. The Funds do not isolate that portion of the results of operations resulting from changes in foreign exchange rates on investments from fluctuations arising from changes in market prices of securities held. These fluctuations are included with the net realized and unrealized gain or loss from investments within the Statements of Operations.
d. Derivative Financial Instruments
Certain Funds are authorized to use derivatives to manage currency risk, credit risk, and interest rate risk and to replicate, or use as a substitute for, physical securities. Losses may arise due to changes in the value of the contract or if the counterparty does not perform under the contract. The use of derivative instruments involves, to varying degrees, elements of market risk in excess of the amount recognized in the Statements of Assets and Liabilities. See Note 10, which discusses Rule 18f-4 and its impact on derivatives.
Forward Foreign Currency Exchange Contracts
A forward foreign currency exchange contract ("forward contract") involves an obligation to purchase and sell a specific currency at a future date, which may be any fixed number of days from the date of the contract agreed upon by the parties, at a price set at the time of the contract. Forward contracts are used to manage a Fund's currency exposure in an efficient manner. They are used to sell unwanted currency exposure that comes with holding securities in a market, or to buy currency exposure where the exposure from holding securities is insufficient to give the desired currency exposure either in absolute terms or relative to the benchmark. The use of forward contracts allows the separation of decision-making between markets and their currencies. The forward contract is marked-to market daily and the change in market value is recorded by a Fund as unrealized appreciation/(depreciation). Forward contracts' prices are received daily from an independent pricing provider. When the forward contract is closed, a Fund records a realized gain or loss equal to the difference between the value at the time it was opened and the value at the time it was closed. These realized and unrealized gains and losses are reported on the Statements of Operations. During the year, the Funds used forward contracts for the purposes of efficient portfolio management and managing active currency risk relative to the benchmark, the latter of which involves both hedging currency risk and adding currency risk in excess of underlying bond positions.
| 2021 Annual Report | 79 |
Notes to Financial Statements (continued)
October 31, 2021
While a Fund may enter into forward contracts to seek to reduce currency exchange rate risks, transactions in such contracts involve certain risks. A Fund could be exposed to risks if the counterparties to the contracts are unable to meet the terms of their contracts and from unanticipated movements in exchange rates. Thus, while a Fund may benefit from such transactions, unanticipated changes in currency prices may result in a poorer overall performance for a Fund than if it had not engaged in any such transactions. Moreover, there may be an imperfect correlation between a Fund's portfolio holdings or securities quoted or denominated in a particular currency and forward contracts entered into by the Fund. Such imperfect correlation may prevent a Fund from achieving a complete hedge, which will expose the Fund to the risk of foreign exchange loss.
Forward contracts are subject to the risk that the counterparties to such contracts may default on their obligations. Since a forward foreign currency exchange contract is not guaranteed by an exchange or clearing house, a default on the contract would deprive a Fund of unrealized profits, transaction costs or the benefits of a currency hedge or force a Fund to cover its purchase or sale commitments, if any, at the market price at the time of the default.
Futures Contracts
Certain Funds may invest in financial futures contracts ("futures contracts") for the purpose of hedging their existing portfolio securities, or securities that a Fund intends to purchase, against fluctuations in value caused by changes in prevailing market interest rates or prices. Futures contracts may also be entered into for non-hedging purposes; however, in those instances, the aggregate initial margin and premiums required to establish a Fund's positions may not exceed 5% of a Fund's NAV after taking into account unrealized profits and unrealized losses on any such contract into which it has entered.
Upon entering into a futures contract, a Fund is required to pledge to the broker an amount of cash and/or other assets equal to a certain percentage of the contract amount. This payment is known as "initial margin". Subsequent payments, known as "variation margin," are calculated each day, depending on the daily fluctuations in the fair value/market value of the underlying assets. An unrealized gain/(loss) equal to the variation margin is recognized on a daily basis. When the contract expires or is closed, the gain/(loss) is realized and is presented in the Statements of Operations as a net realized gain/(loss) on futures contracts. Futures contracts are valued daily at their last quoted sale price on the exchange on which they are traded.
A "sale" of a futures contract means a contractual obligation to deliver the securities or foreign currency called for by the contract at a fixed price at a specified time in the future. A "purchase" of a futures contract means a contractual obligation to acquire the securities or foreign currency at a fixed price at a specified time in the future.
There are significant risks associated with a Fund's use of futures contracts, including the following: (1) the success of a hedging strategy may depend on the ability of a Fund's investment adviser and/or sub-adviser to predict movements in the prices of individual securities, fluctuations in markets and movements in interest rates; (2) there may be an imperfect or no correlation between the movement in the price of futures contracts, interest rates and the value/market value of the securities held by a Fund; (3) there may not be a liquid secondary market for a futures contract; (4) trading restrictions or limitations may be imposed by an exchange; and (5) government regulations may restrict trading in futures contracts. In addition, should market conditions change unexpectedly, a Fund may not achieve the anticipated benefits of the futures contracts and may realize a loss.
For the fiscal year ended October 31, 2021, the Global Absolute Return Strategies Fund invested in futures for both investment and hedging purposes.
Swaps
A swap is an agreement that obligates two parties to exchange a series of cash flows and/or meet certain obligations at specified intervals based upon or calculated by reference to changes in specified prices or rates (interest rates in the case of interest rate swaps, currency exchange rates in the case of currency swaps) or the occurrence of a credit event with respect to an underlying reference obligation (in the case of a credit default swap) for a specified amount of an underlying asset or notional principal amount. A Fund will enter into swaps only on a net basis, which means that the two payment streams are netted out, with a Fund receiving or paying, as the case may be, only the amount of the difference between the two payments. Except for currency swaps and credit default swaps, the notional principal amount is used solely to calculate the payment streams but is not exchanged. With respect to currency swaps, actual principal amounts of currencies may be exchanged by the counterparties at the initiation, and again upon the termination of the transaction.
Traditionally, swaps were customized, privately negotiated agreements executed between two parties ("OTC Swaps") but since 2013, certain swaps are required to be cleared pursuant to rules and regulations related to the Dodd – Frank Wall Street Reform and Consumer Protection Act ("Dodd Frank") and/or Regulation (EU) No 648/2012 on OTC Derivatives, Central Counterparties and Trade Repositories ("EMIR") ("Cleared Swaps"). Like OTC Swaps, Cleared Swaps are negotiated bilaterally. Unlike OTC Swaps, the act of clearing results in two swaps executed between each of the parties and a central counterparty ("CCP"), and thus the counterparty credit exposure of the parties is to the CCP rather than to one another. Upon entering into a Cleared Swap, a Fund is required to pledge an amount of cash and/or other assets equal
| 80 | 2021 Annual Report |
Notes to Financial Statements (continued)
October 31, 2021
to a certain percentage of the contract amount. This payment is known as "initial margin". Subsequent payments, known as "variation margin," are calculated each day, depending on the daily fluctuations in the fair value/market value of the underlying assets. An unrealized gain/(loss) equal to the variation margin is recognized on a daily basis. When the contract matures or is terminated, the gain or loss is realized and is presented in the Statements of Operations as a net realized gain or loss on swap contracts. As of March 2017, a Fund may be required to provide variation and/or initial margin for OTC Swaps pursuant to further rules and regulations related to Dodd Frank and EMIR. The margin requirements associated with OTC Swaps and Cleared Swaps may not be the same.
Entering into swap agreements involves, to varying degrees, elements of credit, market and interest rate risk in excess of the amounts reported on the Statement of Assets and Liabilities. Such risks involve the possibility that there will be no liquid market for these agreements, that the counterparty to the agreements may default on its obligation to perform and that there may be unfavorable changes in the value of the index or securities underlying the agreement. The Funds' maximum risk of loss from counterparty risk related to swaps is the fair value of the contract. This risk is mitigated by the posting of collateral by the counterparties to the Funds to cover the Funds' exposure to the counterparty.
Credit Default Swaps
A credit default swap is an agreement whereby one party, the buyer, is obligated to pay the other party, the seller, a periodic stream of payments over the term of the contract in return for a contingent payment upon the occurrence of a credit event with respect to an underlying reference obligation. A Fund might use credit default swap contracts to limit or to reduce risk exposure of the Fund to defaults of corporate and sovereign issues (i.e., to reduce risk when the Fund owns or has exposure to such issuers). A Fund also might use credit default swap contracts to create direct or synthetic short or long exposure to domestic or foreign corporate debt securities or certain sovereign debt securities to which the Fund is not otherwise exposed.
During the fiscal year ended October 31, 2021, the Aberdeen Global Absolute Return Strategies Fund held credit default swaps to implement investment views and hedge the Fund's exposure to the credit market.
Interest Rate Swaps
A Fund uses interest rate swap contracts to manage its exposure to interest rates. Interest rate swap contracts typically represent the exchange between a Fund and a counterparty of respective commitments to make variable rate and fixed rate payments with respect to a notional amount of principal. Interest rate swap contracts may have a term that is greater than one year, but typically require periodic interim settlement in cash, at which time the specified value of the variable interest rate is reset for the next settlement period. Net payments of interest are recorded as realized gains or losses. During the period that the swap contract is open, the contract is marked-to-market as the net amount due to or from a Fund and changes in the value of swap contracts are recorded as unrealized gains or losses.
During the fiscal year ended October 31, 2021, the Aberdeen Global Absolute Return Strategies Fund held interest rate swaps to implement investment views and hedge interest rate risk.
Summary of Derivative Instruments
Certain Funds may use derivatives for various purposes as noted above. The following is a summary of the location of fair value amounts of derivatives, not accounted for as hedging instruments, as of October 31, 2021:
| Location on the Statement of Assets and Liabilities | ||||
| Derivative Instrument Risk Type | Asset Derivatives | Liability Derivatives | ||
| Equity Risk | Investments, at value Unrealized appreciation on swap | Written options, outstanding at value Unrealized depreciation on swap | ||
| contracts | contracts | |||
| Interest Rate Risk | Variation margin receivable for centrally cleared swap contracts | Variation margin payable for centrally cleared swap contracts | ||
| Variation margin receivable for futures contracts | Variation margin payable for futures contracts | |||
| Credit Risk | Variation margin receivable for centrally cleared swap contracts | Variation margin payable for centrally cleared swap contracts | ||
| Foreign Exchange Risk | Unrealized appreciation on forward foreign currency exchange contracts | Unrealized depreciation on forward foreign currency exchange contracts | ||
| 2021 Annual Report | 81 |
Notes to Financial Statements (continued)
October 31, 2021
The following is a summary of the fair value of derivative instruments, not accounted for as hedging instruments, as of October 31, 2021:
| Asset Derivatives | |||||||||||||||||||||||||
| Funds | Total Value at October 31, 2021 | Investments at value (Equity Risk)* | Written Options, at value (Equity Risk) | Over-the Counter Total Return Swaps (Equity Risk)** | Centrally Cleared Credit Default Swaps (Credit Risk)** | Centrally Cleared Interest Rate Swaps (Interest Rate Risk)** | Forward Foreign Exchange Contracts (Foreign Exchange Risk) | Futures Contracts (Interest Rate Risk)** | |||||||||||||||||
| Emerging Markets Debt Fund | $ 176,246 | $ – | $– | $ – | $ – | $ – | $ 176,246 | $ – | |||||||||||||||||
| Global Absolute Return | |||||||||||||||||||||||||
| Strategies Fund | 2,092,498 | 33,750 | – | 4,849 | 181,675 | 557,740 | 731,411 | 621,672 | |||||||||||||||||
| Liabilities Derivatives | |||||||||||||||||||||||||
| Funds | Total Value at October 31, 2021 | Investments at value (Equity Risk)* | Written Options, at value (Equity Risk) | Over-the Counter Total Return Swaps (Equity Risk)** | Centrally Cleared Credit Default Swaps (Credit Risk)** | Centrally Cleared Interest Rate Swaps (Interest Rate Risk)** | Forward Foreign Exchange Contracts (Foreign Exchange Risk) | Futures Contracts (Interest Rate Risk)** | |||||||||||||||||
| Emerging Markets Debt Fund | $ 64,535 | $– | $ – | $ – | $ – | $ – | $ 64,535 | $ – | |||||||||||||||||
| Global Absolute Return | |||||||||||||||||||||||||
| Strategies Fund | 2,902,502 | – | 270,214 | 36,511 | 45,813 | 1,972,192 | 596,020 | 18,263 | |||||||||||||||||
* Represents purchased options, at value
** The values shown reflect unrealized appreciation/(depreciation) and the values shown in the Statement of Assets and Liabilities reflects variation margin.
Certain funds have transactions that may be subject to enforceable master netting arrangements. A reconciliation of the gross amounts on the Statements of Assets and Liabilities as of October 31, 2021 to the net amounts by broker and derivative type, including any collateral received or pledged, is included in the following tables:
| Gross Amounts Not Offset in Statement of Assets and Liabilities | Gross Amounts Not Offset in Statement of Assets and Liabilities | ||||||||||||||||||||||||
| Gross Amounts of Assets Presented in Statement of Assets and Liabilities | Financial Instruments | Collateral Received(1) | Net Amount(3) | Gross Amounts of Liabilities Presented in Statement of Assets and Liabilities | Financial Instruments | Collateral Pledged(1) | Net Amount(3) | ||||||||||||||||||
| Description | Assets | Liabilities | |||||||||||||||||||||||
| Emerging Markets Debt Fund | |||||||||||||||||||||||||
| Forward foreign currency(2) | |||||||||||||||||||||||||
| Barclays Bank plc | $ 24,091 | $ (182 | ) | $ (23,909 | ) | $ – | $ 182 | $ (182 | ) | $ – | $– | ||||||||||||||
| Citibank N.A. | 9,472 | – | – | 9,472 | – | – | – | – | |||||||||||||||||
| Deutsche Bank AG | 24,325 | (10,431 | ) | – | 13,894 | 10,431 | (10,431 | ) | – | – | |||||||||||||||
| Royal Bank of Canada | 115,085 | – | (100,000 | ) | 15,085 | – | – | – | – | ||||||||||||||||
| UBS AG | 3,273 | (3,273 | ) | – | – | 53,922 | (3,273 | ) | (50,649 | ) | – | ||||||||||||||
| 1. | In some instances, the actual collateral received and/or pledged may be more than the amount shown here due to overcollateralization. |
| 2. | Includes financial instrument which are not subject to a master netting arrangement across funds, or another similar arrangement. |
| 3. | Net amounts represent the net receivables/(payable) that would be due from/to the counterparty in the event of default. Exposure from financial derivative instruments can only be netted across transactions governed under the same master netting agreement with the same legal entity. |
| 82 | 2021 Annual Report |
Notes to Financial Statements (continued)
October 31, 2021
| Gross Amounts Not Offset in Statement of Assets and Liabilities | Gross Amounts Not Offset in Statement of Assets and Liabilities | |||||||||||||||
| Gross Amounts of Assets Presented in Statement of Assets and Liabilities | Financial Instruments | Collateral Received(1) | Net Amount(3) | Gross Amounts of Liabilities Presented in Statement of Assets and Liabilities | Financial Instruments | Collateral Pledged(1) | Net Amount(3) | |||||||||
| Description | Assets | Liabilities | ||||||||||||||
| Global Absolute Return Strategies Fund | ||||||||||||||||
| Forward foreign currency(2) Barclays Bank plc | $ 155,065 | $ (90,773 | ) | $– | $ 64,292 | $ 90,773 | $ (90,773 | ) | $– | $ – | ||||||
| Citibank N.A. | 80,511 | (80,511 | ) | – | – | 88,814 | (80,511 | ) | – | 8,303 | ||||||
| Citigroup Global Markets Limited | 4,675 | – | – | 4,675 | – | – | – | – | ||||||||
| Goldman Sachs & Co. | 213,632 | (200,310 | ) | – | 13,322 | 200,310 | (200,310 | ) | – | – | ||||||
| HSBC Bank plc | 127,793 | (55,124 | ) | – | 72,669 | 55,124 | (55,124 | ) | – | – | ||||||
| JPMorgan Chase Bank N.A. | 71,599 | (31,273 | ) | – | 40,326 | 31,273 | (31,273 | ) | – | – | ||||||
| Royal Bank of Canada | 78,136 | (78,136 | ) | – | – | 129,726 | (78,136 | ) | – | 51,590 | ||||||
| Global Absolute Return Strategies Fund | ||||||||||||||||
| Total return swaps(2) Goldman Sachs & Co. | $ 4,849 | $ (4,849 | ) | $– | $ – | $ 36,511 | $ (4,849 | ) | $– | $31,662 | ||||||
| 1. | In some instances, the actual collateral received and/or pledged may be more than the amount shown here due to overcollateralization. |
| 2. | Includes financial instrument which are not subject to a master netting arrangement across funds, or another similar arrangement. |
| 3. | Net amounts represent the net receivables/(payable) that would be due from/to the counterparty in the event of default. Exposure from financial derivative instruments can only be netted across transactions governed under the same master netting agreement with the same legal entity. |
The following is a summary of the location of realized gain/(loss) and net change in unrealized appreciation/(depreciation) on derivatives in the Statement of Operations for the fiscal year ended October 31, 2021:
| Derivative Instrument Risk Type | Location on the Statement of Operations |
| Equity Risk | Realized gain/(loss) on investment transactions Realized gain/(loss) on written options Realized gain/(loss) on swap contracts |
| Credit Risk | Realized gain/(loss) on swap contracts Net change in unrealized appreciation/(depreciation) on swap contracts |
| Interest Rate Risk | Realized gain/(loss) on future contracts transactions Net change in unrealized appreciation/(depreciation) on futures contracts Realized gain/(loss) on swap contracts Net change in unrealized appreciation/(depreciation) on swap contracts |
| Foreign Exchange Risk | Realized gain/(loss) on forward foreign currency exchange contracts Net change in unrealized appreciation/(depreciation) on forward foreign currency exchange contracts |
The following is a summary of the effect of derivative instruments on the Statement of Operations for the fiscal year ended October 31, 2021:
| Realized Gain or (Loss) on Derivatives Recognized in the Statement of Operations | |||||||||||||||||||||||||
| Funds | Total | Investments transactions (Equity Risk)* | Written Options, at value (Equity Risk) | Total Return Equity Swaps (Equity Risk) | Credit Default Swaps (Credit Risk) | Interest Rate Swaps (Interest Rate Risk) | Forward Foreign Exchange Contracts (Foreign Exchange Risk) | Futures Contracts (Interest Rate Risk) | |||||||||||||||||
| Emerging Markets Debt Fund | $ (406,942 | ) | $ – | $ – | $ – | $ – | $ – | $ (406,942 | ) | $ – | |||||||||||||||
| Global Absolute Return Strategies Fund | (273,454 | ) | 143,290 | 92,976 | 16,719 | 200,193 | (253,737 | ) | (376,124 | ) | (96,771 | ) | |||||||||||||
| 2021 Annual Report | 83 |
Notes to Financial Statements (continued)
October 31, 2021
| Change in Unrealized Appreciation/(Depreciation) on Derivatives Recognized in the Statement of Operations | |||||||||||||||||||||||||
| Funds | Total | Investments transactions (Equity Risk)* | Written Options, at value (Equity Risk) | Total Return Equity Swaps (Equity Risk) | Credit Default Swaps (Credit Risk) | Interest Rate Swaps (Interest Rate Risk) | Forward Foreign Exchange Contracts (Foreign Exchange Risk) | Futures Contracts (Interest Rate Risk) | |||||||||||||||||
| Emerging Markets Debt Fund | $ 13,435 | $ – | $ – | $ – | $ – | $ – | $ 13,435 | $ – | |||||||||||||||||
| Global Absolute Return Strategies Fund | $ (713,168 | ) | (111,210 | ) | 129,052 | (23,913 | ) | 202,189 | (1,531,484 | ) | 34,545 | 587,653 | |||||||||||||
| • | Represents realized gain and change in unrealized appreciation for purchased options during the period. |
Information about derivatives reflected as of the date of this report is generally indicative of the type of activity for the fiscal year ended October 31, 2021. The table below summarizes the weighted average values of derivatives holdings by the Funds during the fiscal year ended October 31, 2021.
| Fund | Purchase Forward Foreign Currency Contracts (Average Notional Value) | Sale Forward Foreign Currency Contracts (Average Notional Value) | Forward Foreign Cross Currency Contracts (Average Notional Value) | Long Future Contracts (Average Notional Value) | Short Future Contracts (Average Notional Value) | Buy Protection Credit Default Swap (Average Notional Value) | |||||||||||||
| Emerging Markets Debt Fund | $ 4,826,002 | $ 11,557,622 | $ – | $ – | $ – | $ – | |||||||||||||
| Global Absolute Return Strategies Fund | 16,317,254 | 21,173,018 | 3,820,303 | 4,837,751 | 4,876,601 | 11,508,221 | |||||||||||||
| Fund | Sell Protection Credit Default Swap (Average Notional Value) | Interest Rate Swap Contracts (Average Notional Value) | Total Return Equity Swaps (Average Notional Value) | Call Purchased Options (Average Notional Value) | Put Purchased Options (Average Notional Value) | Call Written Options (Average Notional Value) | |||||||||||||
| Emerging Markets Debt Fund | $ – | $ – | $ – | $ – | $ – | $ – | |||||||||||||
| Global Absolute Return Strategies Fund | 11,037,470 | 45,811,321 | 1,065,694 | 27,555 | 7,658 | 7,437 | |||||||||||||
| Fund | Put Written Options (Average Notional Value) | Call Purchased Swaptions (Average Notional Value) | Put Purchased Swaptions (Average Notional Value) | Call Written Swaptions (Average Notional Value) | Put Written Swaptions (Average Notional Value) | |||||||||||
| Emerging Markets Debt Fund | $ – | $– | $ – | $ – | $ – | |||||||||||
| Global Absolute Return Strategies Fund | 49,771 | – | 506,594 | 29,194 | 132,440 | |||||||||||
| e. | Security Transactions, Investment Income and Expenses |
Security transactions are recorded on the trade date. Realized and unrealized gains/(losses) from security and currency transactions are calculated on the identified cost basis. Dividend income and corporate actions are recorded generally on the ex-date, except for certain dividends and corporate actions which may be recorded after the ex-date, as soon as a Fund acquires information regarding such dividends or corporate actions.
Interest income and expenses are recorded on an accrual basis. Expenses directly attributable to a Fund are charged to that Fund. Expenses not directly attributable to a Fund are allocated proportionately among the relevant Funds based on net assets of each Fund as of the month
| 84 | 2021 Annual Report |
Notes to Financial Statements (continued)
October 31, 2021
end. For each of the Funds, the method for allocating income, fund level expenses, and realized and unrealized gains or losses to a class is based on the total net asset value of that class's shares in proportion to the total net assets of the relevant Fund. Expenses specific to a class (such as Rule 12b-1 and administrative services fees) are charged to that class.
| f. | Distributions |
Distributions from net investment income, if any, are declared and paid quarterly for the Emerging Markets Debt Fund. Distributions from net investment income, if any, are declared daily and paid monthly for the Short Duration High Yield Municipal Fund, the Intermediate Municipal Income Fund and the Ultra Short Municipal Income Fund. Distributions from net investment income, if any, are declared and paid annually for the Global Absolute Return Strategies Fund. The Funds will also declare and pay distributions at least annually from net realized gains on investment transactions and net realized foreign exchange gains, if any. Dividends and distributions to shareholders are recorded on the ex-dividend date.
Dividends and distributions to shareholders are determined in accordance with federal income tax regulations, which may differ from GAAP. These differences are primarily due to differing treatments for foreign currencies and loss deferrals.
| g. | Federal Income Taxes |
Each Fund intends to continue to qualify as a "regulated investment company" by complying with the provisions available to certain investment companies, as defined in Subchapter M of the Internal Revenue Code of 1986, as amended, and to make distributions of net investment income and net realized capital gains sufficient to relieve the Funds from all federal income taxes. Therefore, no federal income tax provision is required. Management of the Funds has concluded that there are no significant uncertain tax positions that would require recognition in the financial statements.
Since tax authorities can examine previously filed tax returns, the Funds' U.S. federal and state tax returns for each of the most recent four fiscal years up to the most recent fiscal year ended October 31, 2021 are subject to such review.
| h. | Foreign Withholding Tax |
Interest income from non-U.S. sources received by the Funds are generally subject to non-U.S. withholding taxes and are recorded on the Statement of Operations. The Funds file for tax reclaims for the refund of such withholdings taxes according to tax treaties. Tax reclaims that are deemed collectible are booked as tax reclaim receivable on the Statement of Assets and Liabilities. Foreign tax authorities can examine previously filed withholding tax reclaims for various periods of time, depending on the statute of limitations in each foreign jurisdiction. In some cases, amounts that have been refunded by foreign tax authorities and received by the Funds are still subject to such review.
In addition, the Funds may be subject to capital gains tax in certain countries in which it invests. The above taxes may be reduced or eliminated under the terms of applicable U.S. income tax treaties with some of these countries. The Funds accrue such taxes when the related income is earned.
In addition, when the Funds sell securities within certain countries in which it invests, the capital gains realized may be subject to tax. Based on these market requirements and as required under GAAP, the Funds accrue deferred capital gains tax on securities currently held that have unrealized appreciation within these countries. The amount of deferred capital gains tax accrued is reported on the Statement of Operations as part of the Net Change in Unrealized Appreciation/Depreciation on Investments.
| i. | Securities Lending |
Through an agreement with BNP Paribas as the Lending Agent and State Street Bank and Trust Company (the Funds' custodian), the Funds may lend their portfolio securities to brokers, dealers and other financial institutions that pay a negotiated fee in order to generate additional income. The Funds receive non-cash collateral in the form of U.S. Government Securities, with respect to each loan of U.S. securities, typically equal to at least 102% of the value of the portfolio securities loaned, and, with respect to each loan of non-U.S. securities, typically equal to at least 105% of the value of the portfolio securities loaned, and at all times thereafter require the borrower to mark to market such collateral on a daily basis so that the market value of such collateral does not fall below 100% of the market value of the portfolio securities so loaned.
Income generated from securities lending includes the difference between (i) the sum of income received from the investment of collateral received from the borrowers that are counterparties to loans, loan fees received from loans, and fees paid by borrower on loans collateralized with collateral other than cash collateral; and ii) any rebate paid to a borrower, and any other allocable fees and expenses in connection with loans of securities. All income is accrued daily and is apportioned 90% to the Funds and 10% to the Lending Agent.
The Funds continue to own the loaned securities and continue to recognize unrealized gains and losses on the securities on loan. However, securities lending involves certain risks, including the event of default or insolvency of the borrower, which could delay or restrict a Fund's ability to recover the loaned securities or dispose of the collateral for the loan. Securities on loan are noted within the Statement of Investments. Non-cash securities lending collateral held by the Lending Agent on behalf of the Funds cannot be sold or repledged by the Funds and therefore, this amount is not presented on the Funds' Statements of Investments.
| 2021 Annual Report | 85 |
Notes to Financial Statements (continued)
October 31, 2021
At October 31, 2021, the Funds did not have any securities on loan.
3. Agreements and Transactions with Affiliates
| a. | Investment Adviser |
Under the Investment Advisory Agreement with the Trust, the Adviser manages the Funds in accordance with the policies and procedures established by the Board.
For services provided under the terms of the current Investment Advisory Agreement, each Fund pays the Adviser an annual management fee (as a percentage of its average daily net assets) paid monthly according to the following schedule:
| Fund | Fee Schedule | ||||
| Emerging Markets Debt Fund | Up to $500 million | 0.600 | % | ||
| On $500 million and more | 0.550 | % | |||
| Global Absolute Return Strategies Fund | Up to $500 million | 0.600 | % | ||
| $500 million up to $1 billion | 0.550 | % | |||
| On $1 billion and more | 0.500 | % | |||
| Intermediate Municipal Income Fund | Up to $250 million | 0.425 | % | ||
| $250 million up to $1 billion | 0.375 | % | |||
| On $1 billion and more | 0.355 | % | |||
| Short Duration High Yield Municipal Fund | Up to $250 million | 0.650 | % | ||
| On $250 million and more | 0.600 | % | |||
| Ultra Short Municipal Income Fund | Up to $2.5 billion | 0.500 | % | ||
| On $2.5 billion and more | 0.450 | % | |||
The Adviser has engaged the services of affiliate Aberdeen Asset Managers Limited (on behalf of Emerging Markets Debt Fund and Global Absolute Return Strategies Fund) as subadviser (the "Subadviser") pursuant to subadvisory agreements. The Subadviser manages a portion of the applicable Fund's investments and have the responsibility for making all investment decisions for the portion of such Fund's assets they manage. Pursuant to the subadvisory agreement, the Adviser pays fees to the Subadviser, if any.
The Trust and Aberdeen have entered into written contracts ("Expense Limitation Agreements") limiting operating expenses for all classes of the Funds from exceeding the amounts listed in the tables below. For each Fund this contractual limitation may not be terminated before February 28, 2022 without the approval of the Trustees who are not "interested persons" of the Trust, as such term is defined by the 1940 Act (the "Independent Trustees"). For each Fund except the Short Duration High Yield Municipal Fund and Ultra Short Municipal Income Fund, this limit excludes certain expenses, including any taxes, interest, brokerage fees, short-sale dividend expenses, acquired fund fees and expenses, Rule 12b-1 fees, administrative services fees, transfer agent out-of-pocket expenses for Class A shares, Class R shares and Institutional Service Class shares and extraordinary expenses. The Expense Limitation Agreements with respect to the Short Duration High Yield Municipal Fund and Ultra Short Municipal Income Fund excludes certain expenses, including any interest, brokerage commissions, acquired fund fees and expenses, and extraordinary expenses.
| Fund | Limit | |||
| Emerging Markets Debt Fund | 0.65 | % | ||
| Global Absolute Return Strategies Fund | 0.65 | % | ||
| Intermediate Municipal Income Fund | 0.50 | % | ||
| Fund | Class A Limit | Class A1 Limit | Class C Limit | Institutional Class Limit | ||||
| Short Duration High Yield Municipal Fund | 0.90% | – | 1.65 | % | 0.65% | |||
| Ultra Short Municipal Income Fund | 0.70% | 0.70% | – | 0.45% |
Aberdeen may request and receive reimbursement from a Fund of the advisory fees waived and other expenses reimbursed pursuant to the Expense Limitation Agreements as of a date not more than three years after the date when the Adviser limited the fees or reimbursed the expenses; provided that the following requirements are met: the reimbursements do not cause a class to exceed the lesser of the applicable expense limitation in the contract at the time the fees were limited or expenses are paid or the applicable expense limitation in effect at the time the expenses are being recouped by the Adviser, and the payment of such reimbursement is approved by the Board on a quarterly basis (the "Reimbursement Requirements"). Except as provided for in the Expense Limitation Agreements, reimbursement of amounts previously waived or assumed by Aberdeen is not permitted.
| 86 | 2021 Annual Report |
Notes to Financial Statements (continued)
October 31, 2021
As of October 31, 2021, to the extent the Reimbursement Requirements are met, the cumulative potential reimbursements for each Fund, based on expenses reimbursed by Aberdeen would be:
| Fund | Amount Fiscal Year 2019 (Expires 10/31/22) | Amount Fiscal Year 2020 (Expires 10/31/23) | Amount Fiscal Year 2021 (Expires 10/31/24) | Total* | ||||
| Emerging Markets Debt Fund | $ 206,464 | $ 229,330 | $ 233,540 | $ 669,334 | ||||
| Global Absolute Return Strategies Fund | 260,488 | 347,710 | 540,814 | 1,149,012 | ||||
| Intermediate Municipal Income Fund | 288,577 | 233,940 | 233,143 | 755,660 | ||||
| Short Duration High Yield Municipal Fund | 557,878 | 582,868 | 812,551 | 1,953,297 | ||||
| Ultra Short Municipal Income Fund | 2,481,831 | 2,517,221 | 2,920,672 | 7,919,724 |
* Amounts reported are due to expire throughout the respective 3-year expiration period presented above.
In accordance with the Funds' Expense Limitation Agreements and criteria, as described above, the Adviser did not recapture any expenses for which it previously reimbursed the Funds. Accordingly, at October 31, 2021, the Funds did not have liabilities payable to the Adviser for recapture of previously reimbursed expenses.
In addition, the Trust and Aberdeen have entered into a Voluntary Expense Limitation and Reimbursement Agreement ("Voluntary Expense Limitation") pursuant to which Aberdeen has agreed to pay, waive or absorb the ordinary operating expenses of any class of the Ultra Short Municipal Income Fund (including 12b-1 fees, administrative services fees and other class-specific expenses, but excluding advisory fees, custody fees, interest, brokerage commissions, acquired fund fees and expenses, extraordinary expenses and all other fund-level expenses), on each day for which a distribution is to be declared to the extent possible and necessary to ensure that the amount declared and ultimately distributed is not less than an annualized rate of 2 basis points, calculated on a daily basis for that class on that day. This Voluntary Expense Limitation may be terminated at any time upon notice by Aberdeen. The Voluntary Expense Limitation is not subject to recoupment and the Ultra Short Municipal Income Fund shall not reimburse any fees waived under the Voluntary Expense Limitation.
| b. | Fund Administration |
Under the terms of the Fund Administration Agreement, Aberdeen provides various administrative and accounting services, including daily valuation of the Funds' shares, preparation of financial statements, tax returns, regulatory reports, and presentation of quarterly reports to the Board. For services provided pursuant to the Fund Administration Agreement, the Trust pays Aberdeen an annual fee of 0.08% based on the Trust's average daily net assets. The fee is then allocated proportionately among all funds within the Trust (including the Funds) in relation to the average daily net assets of each fund. This asset-based fee is subject to an annual minimum fee based on the number of funds served. Pursuant to a sub-administration agreement with Aberdeen, State Street Bank and Trust Company ("State Street") provides sub-administration services with respect to the Funds. Aberdeen pays State Street for providing such services.
| c. | Distributor and Shareholder Servicing |
The Trust and Aberdeen Fund Distributors, LLC (the "Distributor") are parties to the current Underwriting Agreement (the "Underwriting Agreement") whereby the Distributor acts as principal underwriter for the Trust's shares.
The Trust has adopted a Distribution Plan (the "Plan") pursuant to Rule 12b-1 under the 1940 Act with respect to certain classes of shares. The Plan permits the Funds to compensate the Distributor, for expenses associated with the distribution-related and/or shareholder services provided by such entities. These fees are paid to the Distributor and are either kept or paid to shareholders' financial advisors or other intermediaries for distribution and shareholder services. Although actual distribution expenses may be more or less, under the Plan, the Funds pay the Distributor an annual fee of the following amounts, based on the total net assets of each, respective class:
| Fund | Class A Shares | Class A1 Shares | Class C Shares (a) | Class R Shares (a) | ||||||
| Emerging Markets Debt Fund | 0.25% | – | 1.00% | 0.50% | ||||||
| Global Absolute Return Strategies Fund | 0.25% | – | 1.00% | – | ||||||
| Intermediate Municipal Income Fund | 0.25% | – | 1.00% | – | ||||||
| Short Duration High Yield Municipal Fund | 0.25% | – | 1.00% | – | ||||||
| Ultra Short Municipal Income Fund | 0.25% | 0.25% | – | – | ||||||
(a) 0.25% of which is service fees.
| 2021 Annual Report | 87 |
Notes to Financial Statements (continued)
October 31, 2021
The Adviser or an affiliate of the Adviser may pay additional amounts from its own resources to dealers or other financial intermediaries, for aid in distribution or for aid in providing administrative services to shareholders.
Pursuant to the current Underwriting Agreement, the Distributor will also receive the proceeds of contingent deferred sales charges ("CDSCs") of 1.00% imposed on certain redemptions of Class C (and up to 1.00% for certain Class A) shares.
The Distributor re-allows to dealer 2.50% of sales charges on Class A shares of the Emerging Markets Debt Fund and Global Absolute Return Strategies Fund; 2.00% of sales charges on Class A shares of the Intermediate Municipal Income Fund and Short Duration High Yield Municipal Fund; 0.50% of sales charges on Class A1 of the Ultra Short Municipal Income Fund. In addition, the Distributor or Adviser may compensate broker dealers or financial intermediaries for sales of Class C shares from its own resources at the rate of 1.00% on sales of Class C shares, which have a maximum CDSC of 1.00% (the CDSC assessed on sales within one year of purchase). The amount the Distributor retained for commissions from front-end sales charges and CDSC fees for the fiscal year ended October 31, 2021 was as follows:
| Fund | Commissions Retained from Front-End Sales Charges of Class A and Class A1 Shares | Commissions Retained from CDSC Fees of Class C (Certain Class A and Class A1) Shares | ||
| Emerging Markets Debt Fund | $ – | $ – | ||
| Global Absolute Return Strategies Fund | 81 | – | ||
| Intermediate Municipal Income Fund | 234 | – | ||
| Short Duration High Yield Municipal Fund | 3,000 | 4,110 | ||
| Ultra Short Municipal Income Fund | – | – | ||
| Total Retained | $ 3,315 | $ 4,110 |
| d. | Administrative Services Fees/Transfer Agent Out-of-Pocket Expenses |
The Funds may pay and/or reimburse administrative services fees/sub-transfer agent expenses to certain broker-dealers and financial intermediaries who provide administrative support services to beneficial shareholders on behalf of the Funds (sometimes referred to as "sub-transfer agency fees"), subject to certain limitations approved by the Board. These fees may be in addition to Rule 12b-1 fees. Sub-transfer agency fees generally include, but are not limited to, costs associated with recordkeeping, networking, sub-transfer agency or other administrative or shareholder services.
Class A, Class A1, Class R and Institutional Service Class shares of the Funds pay for such services pursuant to an Administrative Services Plan adopted by the Board. Under the Administrative Services Plan, a Fund may pay a broker-dealer or other intermediary a maximum annual sub-transfer agent and administrative services fee of 0.25% for Class A, Class A1, Class R and Institutional Service Class shares. Under an amendment to the Administrative Services Plan that is in effect until at least February 28, 2022, the administrative service fee is limited to a maximum of 0.15% for contracts with fees that are calculated as a percentage of Fund assets and a maximum of $16 per account for contracts with fees that are calculated on a dollar per account basis; however, many intermediaries do not charge the maximum permitted fee or even a portion thereof. Class C and Institutional Class shares may also pay for the services described above directly and not pursuant to an Administrative Services Plan.
The aggregate amount of sub-transfer agent and administrative service fees paid during the fiscal year ended October 31, 2021 was as follows:
| Fund | Class A | Class A1 | Class C | Class R | Institutional Service | Institutional | ||||||
| Emerging Markets Debt Fund | $ 302 | $– | $ 64 | $ 5,886 | $ 103 | $ 11,724 | ||||||
| Global Absolute Return Strategies Fund | 1,567 | – | 653 | – | 9,874 | 4,396 | ||||||
| Intermediate Municipal Income Fund | 818 | – | 64 | – | – | 4,046 | ||||||
| Short Duration High Yield Municipal fund | 12,972 | – | 3 | – | – | 189,171 | ||||||
| Ultra Short Municipal Income Fund | 138,451 | – | – | – | – | 637,533 |
Amounts listed as "–" are $0 or round to $0.
| e. | Purchase/Sale Transactions Between Affiliates |
The Funds are permitted to buy or sell securities with funds that have a common investment adviser (or investment advisers which are affiliates) under specific procedures which have been approved by the Board. The procedures are designed to satisfy the requirements of Rule 17a-7 of the Investment Company Act of 1940 ("Rule 17a-7"). During the fiscal year ended October 31, 2021, the Funds did not engage in any of these trades.
| 88 | 2021 Annual Report |
Notes to Financial Statements (continued)
October 31, 2021
| 4. | Investment Transactions |
Purchases and sales of securities (excluding short-term securities) for the fiscal year ended October 31, 2021, were as follows:
| Fund | Purchases | Sales | |
| Emerging Markets Debt Fund | $ 31,054,592 | $ 43,462,175 | |
| Global Absolute Return Strategies Fund | 21,862,205 | 100,741,389 | |
| Intermediate Municipal Income Fund | 33,606,998 | 37,924,394 | |
| Short Duration High Yield Municipal Fund | 498,068,230 | 332,465,128 | |
| Ultra Short Municipal Income Fund | 2,582,829,114 | 2,957,217,904 |
5. Portfolio Investment Risks
| a. | Absolute Return Strategy Risk |
The Global Absolute Return Strategies Fund is subject to risks related to its absolute return strategy. Absolute return funds employ certain techniques that are intended to reduce risk and volatility in the portfolio and provide protection against a decline in the fund's assets. They are not designed to outperform stocks and bonds in strong markets and there is no guarantee of positive returns or that the Fund's objective will be achieved.
| b. | Credit Default Swap Risk |
The Global Absolute Return Strategies Fund may buy or sell credit default swaps. Credit default swap contracts, a type of derivative instrument, particularly selling credit default swaps, involve special risks and may result in losses to the Fund.
| c. | Cybersecurity Risk |
Cybersecurity incidents may allow an unauthorized party to gain access to Fund assets, customer data (including private shareholder information), or proprietary information, or cause each Fund, the Adviser and/or their service providers (including, but not limited to, Fund accountants, custodians, sub-custodians, transfer agents and financial intermediaries) to suffer data breaches, data corruption or lose operational functionality.
| d. | Derivatives Risk (including Options, Futures and Swaps) |
Certain Funds are subject to Derivatives Risk. Derivatives are speculative and may hurt the Fund's performance. The potential benefits to be derived from the Fund's options, futures and derivatives strategy are dependent upon the portfolio managers' ability to discern pricing inefficiencies and predict trends in these markets, which decisions could prove to be inaccurate.
Speculative Exposure Risk. To the extent that a derivative or practice is not used as a hedge, the Fund is directly exposed to its risks. Gains or losses from speculative positions in a derivative may be much greater than the derivative's original cost. For example, potential losses from writing uncovered call options and from speculative short sales are unlimited.
Hedged Exposure Risk. Losses generated by a derivative or practice used by the Fund for hedging purposes should be substantially offset by gains on the hedged investment. However, while hedging can reduce or eliminate losses, it can also reduce or eliminate gains.
Correlation Risk. The Fund is exposed to the risk that changes in the value of a hedging instrument will not match those of the investment being hedged.
Counterparty Risk. Derivative transactions depend on the creditworthiness of the counterparty and the counterparty's ability to fulfill its contractual obligations.
Other Derivatives Risks. Fixed income derivatives are subject to interest rate risk. In addition, certain derivatives may be subject to illiquid securities risk, mispricing or valuation complexity, market risk and management risk. The Fund may need to sell portfolio securities at inopportune times to satisfy margin or payment obligations under derivatives investments. Changes in regulation relating to the Fund's use of derivatives and related instruments could potentially limit or impact the Fund's ability to invest in derivatives, limit the Fund's ability to employ certain strategies that use derivatives and/or adversely affect the value of derivatives and the Fund's performance.
| 2021 Annual Report | 89 |
Notes to Financial Statements (continued)
October 31, 2021
| e. | Emerging Markets Risk |
The risks of investing in emerging market countries are a magnification of the risks that apply to foreign investments. These risks are greater for securities of companies in emerging markets countries because the countries may have less stable governments, more volatile currencies and less established markets (see "Foreign Securities Risk" below).
| f. | Equity Securities Risk |
The Global Absolute Return Strategies Fund may invest in equity securities. The stock or other security of a company may not perform as well as expected, and may decrease in value, because of factors related to the company (such as poorer than expected earnings or certain management decisions), to the industry in which the company is engaged (such as a reduction in the demand for products or services in a particular industry), or to the market as a whole (such as periods of market volatility or instability, or general and prolonged periods of economic decline).
| g. | Fixed Income Securities Risk |
Fixed income securities are subject to, among other risks, credit risk, extension risk, issuer risk, interest rate risk, market risk and prepayment risk.
| h. | Foreign Currency Exposure Risk |
The value of foreign currencies relative to the U.S. Dollar fluctuates in response to market, economic, political, regulatory, geopolitical or other conditions. A decline in the value of a foreign currency versus the U.S. Dollar reduces the value in U.S. Dollars of investments denominated in that foreign currency. This risk may impact a Fund more greatly to the extent the Fund does not hedge its currency risk, or hedging techniques used by the Adviser are unsuccessful.
| i. | Foreign Securities Risk |
Foreign countries in which a Fund may invest may have markets that are less liquid, less regulated and more volatile than U.S. markets. The value of a Fund's investments may decline because of factors such as unfavorable or unsuccessful government actions, reduction of government or central bank support and political or financial instability. To the extent the Fund focuses its investments in a single country or only a few countries in a particular geographic region, economic, political, regulatory or other conditions affecting such country or region may have a greater impact on Fund performance relative to a more geographically diversified fund.
| j. | High-Yield Bonds and Other Lower-Rated Securities Risk |
A Fund's investments in high-yield bonds (commonly referred to as "junk bonds") and other lower-rated securities will subject the Fund to substantial risk of loss. Investments in high-yield bonds are speculative and issuers of these securities are generally considered to be less financially secure and less able to repay interest and principal than issuers of investment-grade securities. Prices of high-yield bonds tend to be very volatile. These securities are less liquid than investment-grade debt securities and may be difficult to price or sell, particularly in times of negative sentiment toward high-yield securities.
| k. | Illiquid Securities Risk |
Illiquid securities are assets that a Fund reasonably expects cannot be sold or disposed of in current market conditions in seven calendar days or less without the sale or disposition significantly changing the market value of the asset. An inability to sell a portfolio position can adversely affect a Fund's value or prevent the Fund from being able to take advantage of other investment opportunities. Illiquid securities and relatively less liquid securities may also be difficult to value.
The Adviser employs procedures and tests using third-party and internal data inputs that seek to assess and manage the liquidity of a Fund's portfolio holdings. These procedures and tests take into account a Fund's investment strategy and liquidity of portfolio investments during both normal and foreseeable stressed conditions, cash-flow projections during both normal and reasonably foreseeable stressed conditions, relevant market, trading and other factors, and monitor whether liquidity should be adjusted based on changed market conditions. These procedures and tests are designed to assist a Fund in determining its ability to meet redemption requests in various market conditions. In light of the dynamic nature of markets, there can be no assurance that these procedures and tests will enable a Fund to ensure that it has sufficient liquidity to meet redemption requests.
| l. | Impact of Large Redemptions and Purchases of Fund Shares |
Occasionally, shareholders may make large redemptions or purchases of Fund shares, which may cause a Fund to have to sell securities or invest additional cash. These transactions may adversely affect the Fund's performance and increase transaction costs. In addition, large redemption requests may exceed the cash balance of the Fund and result in credit line borrowing fees and/or overdraft charges to a Fund until the sales of portfolio securities necessary to cover the redemption request settle.
| 90 | 2021 Annual Report |
Notes to Financial Statements (continued)
October 31, 2021
| m. | Interest Rate Risk |
Each Fund's fixed income investments are subject to interest rate risk, which generally causes the value of a fixed income portfolio to decrease when interest rates rise resulting in a decrease in each Fund's net assets. Each Fund may be subject to a greater risk of rising interest rates due to the recent period of historically low rates and the effect of potential government fiscal policy initiatives and resulting market reaction to those initiatives. Interest rate fluctuations tend to have a greater impact on fixed income-securities with a greater time to maturity and/or lower coupon. A fund with a longer average portfolio duration will be more sensitive to changes in interest rates than a fund with a shorter average portfolio duration. In periods of market volatility, the market values of fixed income securities may be more sensitive to changes in interest rates.
| n. | Issuer Risk |
The value of a security may decline for reasons directly related to the issuer, such as management performance, financial leverage and reduced demand for the issuer's goods or services.
| o. | LIBOR Risk |
A Fund may invest in certain debt securities, derivatives or other financial instruments that utilize the London Interbank Offered Rate ("LIBOR") as a "benchmark" or "reference rate" for various interest rate calculations. In July 2017, the United Kingdom Financial Conduct Authority ("FCA"), which regulates LIBOR, announced a desire to phase out the use of LIBOR by the end of 2021. However, subsequent announcements by the FCA, the LIBOR administrator and other regulators indicate that it is possible that the most widely used LIBOR rates may continue until mid-2023. It is anticipated that LIBOR ultimately will be discontinued or the regulator will announce that it is no longer sufficiently robust to be representative of its underlying market around that time. Although financial regulators and industry working groups have suggested alternative reference rates, such as European Interbank Offered Rate ("EURIBOR"), Sterling Overnight Interbank Average Rate ("SONIA") and Secured Overnight Financing Rate ("SOFR"), global consensus on alternative rates is lacking and the process for amending existing contracts or instruments to transition away from LIBOR remains unclear. The elimination of LIBOR or changes to other reference rates or any other changes or reforms to the determination or supervision of reference rates could have an adverse impact on the market for, or value of, any securities or payments linked to those reference rates, which may adversely affect a Fund's performance and/or net asset value. Uncertainty and risk also remain regarding the willingness and ability of issuers and lenders to include revised provisions in new and existing contracts or instruments. Consequently, the transition away from LIBOR to other reference rates may lead to increased volatility and illiquidity in markets that are tied to LIBOR, fluctuations in values of LIBOR-related investments or investments in issuers that utilize LIBOR, increased difficulty in borrowing or refinancing and diminished effectiveness of hedging strategies, adversely affecting a Fund's performance. Furthermore, the risks associated with the expected discontinuation of LIBOR and transition may be exacerbated if the work necessary to effect an orderly transition to an alternative reference rate is not completed in a timely manner. Because the usefulness of LIBOR as a benchmark could deteriorate during the transition period, these effects could occur prior to the end of 2021.
| p. | Management Risk |
Each Fund is subject to the risk that the Adviser or Subadviser (as applicable) may make poor security selections. The Adviser, Subadviser and their portfolio managers apply their own investment techniques and risk analyses in making investment decisions for the Fund and there can be no guarantee that these decisions will achieve the desired results for a Fund. In addition, the Adviser or Subadviser may select securities that underperform the relevant market or other funds with similar investment objectives and strategies.
| q. | Market Risk |
Markets are affected by numerous factors, including interest rates, the outlook for corporate profits, the health of the national and world economies, the fluctuation of other stock markets around the world, and financial, economic and other global market developments and disruptions, such as those arising from war, terrorism, market manipulation, government interventions, defaults and shutdowns, political changes or diplomatic developments, public health emergencies and natural/environmental disasters. Such events can negatively impact the securities markets and cause the Fund to lose value.
One such event is the COVID-19 pandemic, which has caused major disruptions to economies and markets around the world, including the markets in which the Fund invests, and which has and may continue to negatively impact the value of certain of the Fund's investments . Although vaccines for COVID-19 and variants thereof are becoming more widely available, the COVID-19 pandemic and impacts thereof may continue for an extended period of time and may vary from market to market. To the extent the impacts of COVID-19 continue, the Fund may experience negative impacts to its business that could exacerbate other risks to which the Fund is subject. Policy and legislative changes in countries around the world are affecting many aspects of financial regulation, and governmental and quasi-governmental authorities and regulators throughout the world have previously responded to serious economic disruptions with a variety of significant fiscal and monetary policy changes.
| 2021 Annual Report | 91 |
Notes to Financial Statements (continued)
October 31, 2021
In addition, economies and financial markets throughout the world are becoming increasingly interconnected. As a result, whether or not a Fund invests in securities of issuers located in or with significant exposure to countries experiencing economic and financial difficulties, the value and liquidity of the Fund's investments may be negatively affected by such events.
For example, whether or not the Fund invests in securities of issuers located in Europe (whether the EU, Eurozone or UK) or with significant exposure to European, EU, Eurozone or UK issuers or countries, the unavoidable uncertainties and events related to the UK's departure from the EU ("Brexit") could negatively affect the value and liquidity of a Fund's investments, increase taxes and costs of business and cause volatility in currency exchange rates and interest rates. Brexit could adversely affect the performance of contracts in existence at the date of Brexit and European, UK or worldwide political, regulatory, economic or market conditions and could contribute to instability in political institutions, regulatory agencies and financial markets. Brexit could also lead to legal uncertainty and politically divergent national laws and regulations as a new relationship between the UK and EU is defined and as the UK determines which EU laws to replace or replicate. Any of these effects of Brexit, and others that cannot be anticipated, could adversely affect the Fund's business, results of operations and financial condition.
The impact of these changes on the markets, and the practical implications for market participants, may not be fully known for some time.
| r. | Municipal Securities Risk |
The Intermediate Municipal Income Fund, Short Duration High Yield Municipal Fund and Ultra Short Municipal Income Fund (the "Municipal Funds") are subject to municipal securities risk. Municipal bonds can be significantly affected by political and economic changes, including inflation, as well as uncertainties in the municipal market related to taxation, legislative changes, or the rights of municipal security holders. Municipal bonds have varying levels of sensitivity to changes in interest rates. Interest rate risk is generally lower for shorter-term municipal bonds and higher for long term municipal bonds.
Municipal Bond Tax Risk. A municipal bond that is issued as tax-exempt may later be declared to be taxable. In addition, if the federal income tax rate is reduced, the value of the tax exemption may be less valuable, causing the value of a municipal bond to decline.
Municipal Market Volatility and Illiquidity Risk. The municipal bond market can be susceptible to unusual volatility, particularly for lower-rated and unrated securities. Liquidity can be reduced unpredictably in response to overall economic conditions or credit tightening. During times of reduced market liquidity, a Fund may not be able to readily sell bonds without the sale significantly changing the market value of the bond. If the Fund needed to sell large blocks of bonds to meet shareholder redemption requests or to raise cash, those sales could further reduce the bonds' prices.
Municipal Sector Risk. From time to time a Fund may invest a substantial amount of its assets in municipal securities whose interest is paid solely from revenues of similar projects. If the Fund concentrates its investments in this manner, it assumes the economic risks relating to such projects and this may have a significant impact on the Fund's investment performance.
| s. | Non-Diversified Fund Risk |
The Emerging Market Debt Fund's performance may be more volatile than a diversified fund because it may invest a greater percentage of its total assets in the securities of a single issuer.
| t. | Non-Hedging Foreign Currency Trading Risk |
Foreign exchange rates can be extremely volatile and a variance in the degree of volatility of the market or in the direction of the market from the Adviser's expectations may produce significant losses to certain Funds.
| u. | Portfolio Turnover Risk |
Certain Funds may engage in active and frequent trading of portfolio securities to achieve its investment objective. High portfolio turnover may result in greater transaction costs which may reduce Fund performance. The sale of Fund portfolio securities may also result in greater realization and/or distribution to shareholders of gains or losses as compared to a fund with less active trading, which may include short-term gains taxable at ordinary income tax rates.
| v. | Private Placements and Other Restricted Securities Risk |
The Emerging Markets Debt Fund and Short Duration High Yield Municipal Fund are subject to Private Placements Risk. Investments in private placements and other restricted securities, including Regulation S Securities and Rule 144A Securities, could have the effect of increasing the Fund's level of illiquidity. Private placements and restricted securities may be less liquid than other investments because such securities may not always be readily sold in broad public markets and the Fund might be unable to dispose of such securities promptly or at prices reflecting their true value.
| 92 | 2021 Annual Report |
Notes to Financial Statements (continued)
October 31, 2021
| w. | Puerto Rico and U.S. Territories Risk |
The Aberdeen Short Duration High Yield Municipal Fund is subject to Puerto Rico and U.S. territories risk to the extent that it invests in municipal obligations of such territories. Certain municipal issuers in Puerto Rico have experienced financial difficulties over recent years. These financial difficulties have been exacerbated by the impact of severe weather events, including Hurricane Maria in 2017. Additionally, all three ratings agencies have maintained a negative outlook on Puerto Rico's credit rating, which means that additional downgrades of securities issued by Puerto Rico are possible in the future. Puerto Rican financial difficulties could potentially lead to less liquidity for its bonds, wider spreads, and greater risk of default for Puerto Rican municipal securities, and consequently may affect the Fund's performance to the extent it invests in Puerto Rican municipal securities. As with Puerto Rican municipal securities, events in any of the other territories where the Fund is invested may affect the Fund's investments and its performance.
| x. | Sector Risk |
To the extent that a Fund has a significant portion of its assets invested in securities of companies conducting business in a broadly related group of industries within an economic sector, the Fund may be more vulnerable to unfavorable developments in that economic sector than funds that invest more broadly.
Financials Sector Risk. To the extent that the financials sector represents a significant portion of a Fund's portfolio, the Fund will be sensitive to changes in, and its performance may depend to a greater extent on, factors impacting this sector. Performance of companies in the financials sector may be adversely impacted by many factors, including, among others, government regulations, economic conditions, credit rating downgrades, changes in interest rates, and decreased liquidity in credit markets as well as cyber-attacks.
| y. | Sovereign Debt Risk |
The Emerging Markets Debt Fund and Global Absolute Return Strategies Fund are subject to Sovereign Debt Risk. Periods of economic and political uncertainty may result in the illiquidity and increased price volatility of a foreign government's debt securities held by the Fund and impact an issuer's ability and willingness to pay interest or repay principal when due. The Fund may have limited recourse to compel payment in the event of a default. A foreign government's default on its debt securities may cause the value of securities held by the Fund to decline significantly.
| z. | Tender Option Bonds Risk |
The Municipal Funds are subject to Tender Option Bonds Risk. Tender option bonds are synthetic floating-rate or variable-rate securities issued when long-term bonds are purchased in the primary or secondary market and then deposited into a trust. Tender option bonds may be considered derivatives, and may expose the Fund to the same risks as investments in derivatives, as well as risks associated with leverage, especially the risk of increased volatility.
| aa. | Tobacco Related Bonds Risk |
The Aberdeen Short Duration High Yield Municipal Fund is subject to Tobacco Related Bonds Risk. In 1998, the largest U.S. tobacco manufacturers reached an out of court agreement, the MSA, to settle claims against them by 46 states and six other U.S. jurisdictions. The tobacco manufacturers agreed to make annual payments to the government entities in exchange for the release of all litigation claims. A number of the states have sold bonds that are backed by those future payments. The Funds may invest in two types of those bonds: (i) bonds that make payments only from a state's interest in the MSA and (ii) bonds that make payments from both the MSA revenue and from an "appropriation pledge" by the state. An "appropriation pledge" requires the state to pass a specific periodic appropriation to make the payments and is generally not an unconditional guarantee of payment by a state. The settlement payments are based on factors, including, but not limited to, annual domestic cigarette shipments, cigarette consumption, inflation and the financial capability of participating tobacco companies. Payments could be reduced if consumption decreases, if market share is lost to non-MSA manufacturers, or if there is a negative outcome in litigation regarding the MSA.
| bb. | U.S. Government Securities Risk |
Securities issued by U.S. Government agencies or government sponsored entities may not be guaranteed by the U.S. Treasury. The U.S. Government does not guarantee the net asset value of a Fund's shares.
| cc. | Valuation Risk |
The price that a Fund could receive upon the sale of any particular portfolio investment may differ from the Fund's valuation of the investment, particularly for securities that trade in thin or volatile markets or that are valued using a fair valuation methodology or a price provided by an independent pricing service. As a result, the price received upon the sale of an investment may be less than the value ascribed by a Fund, and the Fund could realize a greater than expected loss or lesser than expected gain upon the sale of the investment. A Fund's
| 2021 Annual Report | 93 |
Notes to Financial Statements (continued)
October 31, 2021
ability to value its investments may also be impacted by technological issues and/or errors by pricing services or other third-party service providers.
| dd. | Variable and Floating Rate Securities Risk |
Certain Funds are subject to Variable and Floating Rate Securities Risk. For floating and variable rate obligations, there may be a lag between an actual change in the underlying interest rate benchmark and the reset time for an interest payment of such an obligation, which could harm or benefit the Fund, depending on the interest rate environment or other circumstances. Variable rate demand obligations ("VRDOs") are floating rate securities that combine an interest in a long term municipal bond with a right to demand payment before maturity from a bank or other financial institution. If the bank or financial institution is unable to pay, the Fund may lose money.
| ee. | Yield Risk |
The Ultra Short Municipal Income Fund is subject to Yield Risk. The amount of income received by the Fund will go up or down depending on day-to-day variations in short-term interest rates, and when interest rates are very low the Fund's expenses could absorb all or a significant portion of the Fund's income. If interest rates increase, the Fund's yield may not increase proportionately. For example, the Adviser may discontinue any temporary voluntary fee limitation or recoup amounts previously waived and/or reimbursed.
Please read the Funds' prospectus for more detailed information regarding these and other risks.
6. Contingencies
In the normal course of business, the Funds may provide general indemnifications pursuant to certain contracts and organizational documents. The Funds' maximum exposure under these arrangements is dependent on future claims that may be made against the Funds, and therefore, cannot be estimated; however, the Funds expect the risk of loss from such claims to be remote.
7. Tax Information
As of October 31, 2021, the tax cost of securities and the breakdown of unrealized appreciation/(depreciation) for each Fund were as follows:
| Tax Cost of Securities | Unrealized Appreciation | Unrealized Depreciation | Net Unrealized Appreciation/ (Depreciation) | |||||||||||||
| Emerging Markets Debt Fund | $ 44,255,689 | $ 735,557 | $ (4,204,141 | ) | $ (3,468,584 | ) | ||||||||||
| Global Absolute Return Strategies Fund | 92,688,298 | 1,510,969 | (3,182,917 | ) | (1,671,948 | ) | ||||||||||
| Intermediate Municipal Income Fund | 56,222,643 | 4,303,748 | (137,806 | ) | 4,165,942 | |||||||||||
| Short Duration High Yield Municipal Fund | 451,003,152 | 9,880,722 | (3,711,069 | ) | 6,169,653 | |||||||||||
| Ultra Short Municipal Income Fund | 995,140,946 | 436,127 | (290,282 | ) | 145,845 | |||||||||||
The tax character of distributions paid during the fiscal year ended October 31, 2021 was as follows (total distributions paid may differ from the Statements of Changes in Net Assets because for tax purposes dividends are recognized when actually paid):
| Distributions Paid From | ||||||||||||||||||||||||
| Fund | Ordinary Income* | Net Long Term Capital Gains* | Total Taxable Distributions | Tax Exempt Distributions | Return of Capital | Total Distributions Paid | ||||||||||||||||||
| Emerging Markets Debt Fund | $1,902,067 | $ – | $ 1,902,067 | $ – | $– | $ 1,902,067 | ||||||||||||||||||
| Global Absolute Return Strategies Fund | 67,951 | – | 67,951 | – | – | 67,951 | ||||||||||||||||||
| Intermediate Municipal Income Fund | 5,646 | 111,156 | 116,802 | 1,657,068 | – | 1,773,870 | ||||||||||||||||||
| Short Duration High Yield Municipal Fund | 45,798 | – | 45,798 | 8,245,012 | – | 8,290,810 | ||||||||||||||||||
| Ultra Short Municipal Income Fund | 3,774 | – | 3,774 | 989,127 | – | 992,901 | ||||||||||||||||||
| 94 | 2021 Annual Report |
Notes to Financial Statements (continued)
October 31, 2021
The tax character of distributions paid during the fiscal year ended October 31, 2020 was as follows (total distributions paid may differ from the Statements of Changes in Net Assets because for tax purposes dividends are recognized when actually paid):
| Distributions paid from | ||||||||||||||||||||||||
| Fund | Ordinary Income | Net Long Term Capital Gains | Total Taxable Distributions | Tax Exempt Distributions | Return of Capital | Total Distributions Paid | ||||||||||||||||||
| Emerging Markets Debt Fund | $2,023,869 | $ – | $ 2,023,869 | $ – | $– | $2,023,869 | ||||||||||||||||||
| Global Absolute Return Strategies Fund | 444,894 | – | 444,894 | – | – | 444,894 | ||||||||||||||||||
| Intermediate Municipal Income Fund | 5,378 | 98,884 | 104,262 | 1,960,534 | – | 2,064,796 | ||||||||||||||||||
| Short Duration High Yield Municipal Fund | 94,431 | – | 94,431 | 7,910,765 | – | 8,005,196 | ||||||||||||||||||
| Ultra Short Municipal Income Fund | 9,380 | – | 9,380 | 9,185,486 | – | 9,194,866 | ||||||||||||||||||
As of October 31, 2021, the components of accumulated earnings/(deficit) on a tax basis were as follows:
| Fund | Undistributed Tax Exempt Income | Undistributed Ordinary Income | Undistributed Long-Term Capital Gains | Accumulated Earnings | Distributions Payable | Late Year Ordinary and Post-October Capital Loss Deferrals | Other Temporary Differences | Unrealized Appreciation/ (Depreciation)* | Accumulated Capital and Other Losses** | Total Accumulated Earnings/ (Deficit) | |||||||||||||||||||||
| Emerging Markets Debt Fund | $ – | $1,745,878 | $ – | $– | $– | $– | $ – | $ (3,467,562 | ) | $ (4,191,088 | ) | $ (5,912,772 | ) | ||||||||||||||||||
| Global Absolute Return Strategies Fund | – | 2,028,305 | 690,096 | – | – | – | – | (1,717,760 | ) | – | 1,000,641 | ||||||||||||||||||||
| Intermediate Municipal Income Fund | 7,325 | – | – | – | – | – | (12,442 | ) | 4,165,942 | (298,806 | ) | 3,862,019 | |||||||||||||||||||
| Short Duration High Yield Municipal Fund | 272,950 | – | – | – | – | – | (70,726 | ) | 6,169,652 | (8,606,656 | ) | (2,234,780 | ) | ||||||||||||||||||
| Ultra Short Municipal Income Fund | – | – | – | – | – | – | (1,593 | ) | 145,845 | (541,165 | ) | (396,913 | ) |
| * | The difference between the book-basis and tax-basis unrealized appreciation/(depreciation) is attributable primarily to tax deferral of losses on wash sales. |
| ** | As of October 31, 2021, for Federal income tax purposes, these Funds have capital loss carryforwards available to offset capital gains, if any, to the extent provided by the Treasury regulations, with no expiration. |
Amounts listed as "–" are $0 or round to $0.
As of October 31, 2021, for federal income tax purposes, the following Funds have capital loss carryforwards available to offset capital gains, if any, to the extent provided by the Treasury regulations.
| Fund | Amount | Expires | ||
| Emerging Markets Debt Fund | $1,073,585 | Unlimited (Short-Term) | ||
| Emerging Markets Debt Fund | 3,117,503 | Unlimited (Long-Term) | ||
| Intermediate Municipal Income Fund | 2,841 | Unlimited (Short-Term) | ||
| Intermediate Municipal Income Fund | 295,965 | Unlimited (Long-Term) | ||
| Short Duration High Yield Municipal Fund | 3,485,952 | Unlimited (Short-Term) | ||
| Short Duration High Yield Municipal Fund | 5,120,704 | Unlimited (Long-Term) | ||
| Ultra Short Municipal Income Fund | 539,995 | Unlimited (Short-Term) | ||
| Ultra Short Municipal Income Fund | 1,170 | Unlimited (Long-Term) |
GAAP requires that certain components of net assets be adjusted to reflect permanent differences between financial and tax reporting. Accordingly, the table below details the necessary reclassifications, which are a result of permanent differences primarily attributable to distributions in excess of current earnings. These reclassifications have no effect on net assets or NAVs per share.
| Fund | Paid-in Capital | Distributable Earnings/ (Accumulated Loss) | ||||||
| Short Duration High Yield Municipal Fund | $ (2 | ) | $ 2 | |||||
| Ultra Short Municipal Income Fund | (14,925 | ) | 14,925 | |||||
| 2021 Annual Report | 95 |
Notes to Financial Statements (continued)
October 31, 2021
8. Significant Shareholders
As of October 31, 2021, the Funds had shareholders with the percentage ownership indicated, which are considered significant shareholders (holdings greater than 5.0%) for financial reporting purposes:
| Fund | Record Ownership % | Number of Account Owners | ||||||
| Emerging Markets Debt Fund | 89.3 | % | 4 | |||||
| Global Absolute Return Strategies Fund | 46.9 | 6 | ||||||
| Intermediate Municipal Income Fund | – | – | ||||||
| Short Duration High Yield Municipal Fund | 62.0 | 5 | ||||||
| Ultra Short Municipal Income Fund | 80.5 | 7 | ||||||
Amounts listed as "–" are $0 or round to $0.
9. Line of Credit
The Trust, on behalf of each of the funds of the Trust (including the Funds) (the "Borrowers"), has entered into an agreement (the "Agreement") with State Street Bank and Trust Company (the "Bank"), subject to annual renewal. The Agreement provides for a revolving credit facility (the "Credit Facility") in the amount of $150,000,000 to be utilized for temporary or emergency purposes to fund shareholder redemptions or other short-term liquidity purposes.
Principal on each outstanding loan made under the Agreement bears interest at a variable rate per annum equal to the higher of (a) the Federal Funds Rate as in effect on such day or (b) the Overnight Bank Funding Rate on such date, plus, in each case, 10 basis points, plus one and one quarter of one percent (1.25%). In addition, the Borrowers shall pay to the Bank a commitment fee at the rate of 0.25% per annum on the daily unused portion of the Credit Facility, as applicable, which is allocated among the Borrowers in such manner as is determined by the Board to be reasonable. For each Fund that borrowed under the Credit Facility during the fiscal year ended October 31, 2021, the following table shows the average outstanding daily balance of the days the Fund utilized the Credit Facility and the average weighted interest rate paid by the Fund during the fiscal year ended October 31, 2021.
| Average Outstanding Daily Balance | Average Weighted Interest Rate | Days Utilized | ||||||||||
| Emerging Markets Debt Fund | $1,616,108 | 1.40% | 10 | |||||||||
| Ultra Short Municipal Income Fund | 243,096 | 1.41% | 6 | |||||||||
10. Recent Rulemaking
In October 2020, the SEC adopted new regulations governing the use of derivatives by registered investment companies. Rule 18f-4 will impose limits on the amount of derivatives a fund could enter into, eliminate the asset segregation framework currently used by funds to comply with Section 18 of the 1940 Act, and require funds whose use of derivatives is more than a limited specified exposure to establish and maintain a derivatives risk management program and appoint a derivatives risk manager. While the new rule became effective February 19, 2021, funds will not be required to fully comply with the new rule until August 19, 2022. It is not currently clear what impact, if any, the new rule will have on the availability, liquidity or performance of derivatives. Management is assessing the impact of Rule 18f-4 on the Funds.
In December 2020, the Securities and Exchange Commission ("SEC") adopted Rule 2a-5 under the 1940 Act, which establishes requirements for determining fair value in good faith for purposes of the 1940 Act, including related oversight and reporting requirements. The rule also defines when market quotations are "readily available" for purposes of the 1940 Act, the threshold for determining whether a fund must fair value a security. The SEC also adopted new Rule 31a-4 under the 1940 Act, which sets forth the recordkeeping requirements associated with fair value determinations. Finally, the SEC is rescinding previously issued guidance on related issues, including the role of a board in determining fair value and the accounting and auditing of fund investments. Rule 2a-5 and Rule 31a-4 became effective on March 8, 2021, with a compliance date of September 8, 2022. Management is currently evaluating this guidance.
| 96 | 2021 Annual Report |
Notes to Financial Statements (continued)
October 31, 2021
11. Fund Reorganizations
Effective October 8, 2021, the Aberdeen Global Absolute Return Strategies Fund (the "Acquiring Fund") acquired all of the assets and assumed all of the liabilities of the Aberdeen Total Return Bond Fund (the "Acquired Fund") pursuant to plans of reorganization approved by the Board of Trustees on May 3, 2021.
The acquisition was accomplished by a tax-free exchange as follows:
5,974,423 shares of the Acquired Fund, fair valued at $78,811,572 for 7,550,290 shares of the Acquiring Fund.
The investment portfolio and cash of the Acquired Fund, with a fair value of $77,958,971 and identified cost of $76,965,798 were the principal assets acquired by the Acquiring Fund. For financial reporting purposes, assets received and shares issued by the Acquiring Fund were recorded at value; however, the cost basis of the investments received from the Acquired Fund was carried forward to align ongoing reporting of the Acquiring Fund realized and unrealized gains and losses with amounts distributable to shareholders for tax purposes. Immediately prior to the merger, the investment portfolio and cash of the Acquiring Fund was $22,122,823.
Assuming that the reorganizations had been completed on November 1, 2020, the Acquiring Fund's pro forma results of operations for the year ended October 31, 2021 are as follows (unaudited):
Net investment income $2,691,312
Net realized and unrealized loss from investments (2,838,765)
Net decrease in net assets from operations (147,453)
Because the combined investment portfolios have been managed as a single integrated portfolio since the acquisition was completed, it is not practicable to separate the amounts of revenue and earnings of the Acquired Fund that have been included in the Statement of Operations since October 8, 2021.
The chart below shows a summary of net assets and shares outstanding, before and after the reorganization.
| Before Reorganization | After Reorganization | |||||||||||
| Aberdeen Total Return Bond Fund | Aberdeen Global Absolute Return Strategies Fund | Aberdeen Global Absolute Return Strategies Fund | ||||||||||
| Net Assets: | ||||||||||||
| Class A Shares | $22,272,666 | $ 1,853,275 | $ 24,125,941 | |||||||||
| Class C Shares | – | 480,448 | 480,448 | |||||||||
| Institutional Service Class Shares | – | 7,025,546 | 7,025,546 | |||||||||
| Institutional Class Shares | 56,538,906 | 12,299,453 | 68,838,359 | |||||||||
| Shares Outstanding: | ||||||||||||
| Class A Shares | 1,664,419 | 179,428 | 2,335,814 | |||||||||
| Class C Shares | – | 47,649 | 47,649 | |||||||||
| Institutional Service Class Shares | – | 675,741 | 675,741 | |||||||||
| Institutional Class Shares | 4,310,004 | 1,173,388 | 6,567,292 | |||||||||
| Net Asset Value per Share: | ||||||||||||
| Class A Shares | $ 13.38 | $ 10.33 | $ 10.33 | |||||||||
| Class C Shares | – | 10.08 | 10.08 | |||||||||
| Institutional Service Class Shares | – | 10.40 | 10.40 | |||||||||
| Institutional Class Shares | 13.12 | 10.48 | 10.48 | |||||||||
| Net unrealized appreciation/(depreciation) | 993,173 | (263,877 | ) | 729,295 | ||||||||
| Accumulated net realized gain/(loss) | 1,108,939 | 433,080 | 1,542,019 | |||||||||
| 2021 Annual Report | 97 |
Notes to Financial Statements (concluded)
October 31, 2021
12. Subsequent Events
Management has evaluated the need for disclosures and/or adjustments resulting from subsequent events through the date the financial statements were issued. Based on this evaluation, no disclosures and/or adjustments were required to the financial statements as of October 31, 2021.
On June 21, 2021, at a meeting of the Board of Trustees (the "Board") of Aberdeen Investment Funds (the "AIF Trust"), the Board considered and unanimously approved an agreement and plan of reorganization with respect to each Fund within the AIF Trust ("AIF Predecessor Fund") whereby each AIF Predecessor Fund would participate in a reorganization that would allow it to continue to operate as a corresponding new series of Aberdeen Funds, a Delaware statutory trust (the "Acquiring Funds"). Aberdeen Standard Investments Inc. would serve as the investment adviser and Aberdeen Asset Managers Limited would serve as the subadviser to the Global Equity Impact Fund and International Sustainable Leaders Fund, but not Global High Income Fund. Following approval by shareholders, each Predecessor Fund transferred all of its assets and liabilities to the corresponding Acquiring Fund, as listed in the table below, as of the close of business December 3, 2021. The Acquiring Funds and corresponding Predecessor Funds are shown in the chart below.
| Fund | Corresponding AIF Predecessor Fund | |
| Aberdeen Global Equity Impact Fund | Aberdeen Global Equity Impact Fund, a series of Aberdeen Investment Funds | |
| Aberdeen Global High Income Fund | Aberdeen Global High Income Fund, a series of Aberdeen Investment Funds | |
| Aberdeen International Sustainable Leaders Fund | Aberdeen International Sustainable Leaders Fund, a series of Aberdeen Investment Funds |
| 98 | 2021 Annual Report |
Report of Independent Registered Public Accounting Firm
To the Shareholders and Board of Trustees
Aberdeen Funds:
Opinion on the Financial Statements
We have audited the accompanying statements of assets and liabilities of Aberdeen Emerging Markets Debt Fund, Aberdeen Global Absolute Return Strategies Fund, Aberdeen Intermediate Municipal Income Fund, Aberdeen Short Duration High Yield Municipal Fund, and Aberdeen Ultra Short Municipal Income Fund, five of the funds comprising Aberdeen Funds (each, a Fund and collectively, the Funds), including the statements of investments, as of October 31, 2021, the related statements of operations for the year then ended, the statements of changes in net assets for each of the years in the two-year period then ended, and the related notes (collectively, the financial statements) and the financial highlights for each of the periods in the five-year period then ended except for Aberdeen Short Duration High Yield Municipal Fund and Aberdeen Ultra Short Municipal Income Fund, for which the period is the four-year period then ended. In our opinion, the financial statements and financial highlights present fairly, in all material respects, the financial position of the Funds as of October 31, 2021, the results of their operations for the year then ended, the changes in their net assets for each of the years in the two-year period then ended, and the financial highlights for each of the years or periods in the five-year period then ended except for Aberdeen Short Duration High Yield Municipal Fund and Aberdeen Ultra Short Municipal Income Fund, for which the period is the four-year period then ended, in conformity with U.S. generally accepted accounting principles. The financial highlights for the year ended October 31, 2017 for Aberdeen Short Duration High Yield Municipal Fund and Aberdeen Ultra Short Municipal Income Fund were audited by other independent registered public accountants whose report, dated December 22, 2017, expressed an unqualified opinion on those financial highlights.
Basis for Opinion
These financial statements and financial highlights are the responsibility of the Funds' management. Our responsibility is to express an opinion on these financial statements and financial highlights based on our audits. We are a public accounting firm registered with the Public Company Accounting Oversight Board (United States) (PCAOB) and are required to be independent with respect to the Funds in accordance with the U.S. federal securities laws and the applicable rules and regulations of the Securities and Exchange Commission and the PCAOB.
We conducted our audits in accordance with the standards of the PCAOB. Those standards require that we plan and perform the audit to obtain reasonable assurance about whether the financial statements and financial highlights are free of material misstatement, whether due to error or fraud. Our audits included performing procedures to assess the risks of material misstatement of the financial statements and financial highlights, whether due to error or fraud, and performing procedures that respond to those risks. Such procedures included examining, on a test basis, evidence regarding the amounts and disclosures in the financial statements and financial highlights. Such procedures also included confirmation of securities owned as of October 31, 2021, by correspondence with the custodian, brokers, or by other appropriate auditing procedures when replies from brokers were not received. Our audits also included evaluating the accounting principles used and significant estimates made by management, as well as evaluating the overall presentation of the financial statements and financial highlights. We believe that our audits provide a reasonable basis for our opinion.

We have served as the auditor of one or more Aberdeen investment companies since 2009.
Philadelphia, Pennsylvania
December 28, 2021
| 2021 Annual Report | 99 |
Other Tax Information (Unaudited)
During the year ended October 31, 2021, the following Funds designated dividends as long-term capital gains:
| Fund | Amount | ||
| Intermediate Municipal Income Fund | $111,156 |
For the year ended October 31, 2021, certain dividends paid by the Funds may be subject to a maximum tax rate of 15% or 20% (depending upon income levels) as qualified dividend income. The Funds intend to designate the maximum amount allowable as taxed at a maximum rate of 15%. Complete information will be reported in conjunction with your 2021 Form 1099-DIV.
| Fund | Qualified Dividend Income | ||
| Global Absolute Return Strategies Fund | 95.36% |
For the taxable year ended October 31, 2021, the following percentage of income dividends paid by the Funds qualify for the dividends received deduction available to corporate shareholders:
| Fund | Dividends Received Deduction | ||
| Global Absolute Return Strategies Fund | 44.12% |
| 100 | 2021 Annual Report |
Shareholder Expense Examples (Unaudited)
As a shareholder of the Aberdeen Funds, you incur two types of costs: (1) transaction costs, including sales charges (loads) paid on purchase payments and (2) ongoing costs, including investment advisory fees, administration fees, transfer agent out-of-pocket expenses, distribution fees and other Fund expenses. The examples below are intended to help you understand your ongoing costs (in dollars) of investing in the Aberdeen Funds and to compare these costs with the ongoing costs of investing in other mutual funds.
The examples assume that you had a $1,000 investment in the Class at the beginning of the reporting period, May 1, 2021 and continued to hold your shares at the end of the reporting period, October 31, 2021.
Actual Expenses
The table below provides information about actual account values and actual expenses. You may use the information together with the amount you invested, to estimate the expenses that you paid over the period. Simply divide your account value by $1,000 (for example, an $8,600 account value divided by $1,000 = 8.6), then multiply the result by the number under the heading entitled "Actual Expenses Paid During Period" for the class of a Fund that you own to estimate the expenses you paid on your account during the period.
Hypothetical Example for Comparison Purposes
The table below provides information about hypothetical account values and hypothetical expenses based on the Class' actual expense ratio and an assumed rate of return of 5% per year before expenses, which is not the Class' actual return. The hypothetical account values and expenses may not be used to estimate the actual ending account balance or expenses you paid for the period. You may use this information to compare the ongoing costs of investing in the Class of a Fund and other funds. To do so, compare the 5% hypothetical example with the 5% hypothetical examples that appear in the shareholder reports of the other funds.
Please note that the expenses shown in the table are meant to highlight your ongoing costs only and do not reflect any transaction costs, such as sales charges (loads). Therefore, the information for each Class in the table is useful in comparing ongoing costs only, and will not help you determine the relative total costs of owning different funds. In addition, if these transaction costs were included, your costs would have been higher. The examples also assume all dividends and distributions have been reinvested.
| Beginning Account Value, May 1, 2021 | Actual Ending Account Value, October 31, 2021 | Hypothetical Ending Account Value | Actual Expenses Paid During Period1 | Hypothetical Expenses Paid During Period12 | Annualized Expense Ratio** | |||||||||||||||
| Emerging Markets Debt Fund | Class A | $1,000.00 | $ 985.90 | $1,020.01 | $5.16 | $5.24 | 1.03% | |||||||||||||
| Class C | $1,000.00 | $ 983.00 | $1,016.84 | $8.30 | $8.44 | 1.66% | ||||||||||||||
| Class R | $1,000.00 | $ 984.40 | $1,018.65 | $6.50 | $6.61 | 1.30% | ||||||||||||||
| Institutional Service Class | $1,000.00 | $ 987.00 | $1,020.97 | $4.21 | $4.28 | 0.84% | ||||||||||||||
| Institutional Class | $1,000.00 | $ 987.70 | $1,021.93 | $3.26 | $3.31 | 0.65% | ||||||||||||||
| Global Absolute Return Strategies Fund | Class A | $1,000.00 | $ 977.20 | $1,020.52 | $4.63 | $4.74 | 0.93% | |||||||||||||
| Class C | $1,000.00 | $ 973.80 | $1,016.84 | $8.26 | $8.44 | 1.66% | ||||||||||||||
| Institutional Service Class | $1,000.00 | $ 978.30 | $1,021.22 | $3.94 | $4.02 | 0.79% | ||||||||||||||
| Institutional Class | $1,000.00 | $ 978.40 | $1,021.98 | $3.19 | $3.26 | 0.64% | ||||||||||||||
| Intermediate Municipal Income Fund | Class A | $1,000.00 | $1,004.30 | $1,021.37 | $3.84 | $3.87 | 0.76% | |||||||||||||
| Class C | $1,000.00 | $1,000.60 | $1,017.64 | $7.56 | $7.63 | 1.50% | ||||||||||||||
| Institutional Service Class | $1,000.00 | $1,005.70 | $1,022.69 | $2.53 | $2.55 | 0.50% | ||||||||||||||
| Institutional Class | $1,000.00 | $1,005.70 | $1,022.69 | $2.53 | $2.55 | 0.50% | ||||||||||||||
| Short Duration High Yield Municipal Fund | Class A | $1,000.00 | $1,011.70 | $1,020.67 | $4.56 | $4.58 | 0.90% | |||||||||||||
| Class C | $1,000.00 | $1,008.70 | $1,016.99 | $8.25 | $8.29 | 1.63% | ||||||||||||||
| Institutional Class | $1,000.00 | $1,013.00 | $1,021.93 | $3.30 | $3.31 | 0.65% | ||||||||||||||
| Ultra Short Municipal Income Fund | Class A | $1,000.00 | $ 999.10 | $1,022.89 | $2.32 | $2.35 | 0.46% | |||||||||||||
| Class A1 | $1,000.00 | $ 999.10 | $1,022.89 | $2.32 | $2.35 | 0.46% | ||||||||||||||
| Institutional Class | $1,000.00 | $1,000.20 | $1,022.99 | $2.22 | $2.24 | 0.44% | ||||||||||||||
| ** | The expense ratio presented represents a six-month, annualized ratio. |
| 1 | Expenses are equal to the Fund's annualized expense ratio multiplied by the average account value over the period multiplied by 184/365 (to reflect the one-half year period). |
| 2 | Represents the hypothetical 5% return before expenses. |
| 2021 Annual Report | 101 |
Supplemental Information (Unaudited)
Board of Trustees' Consideration of Advisory and Sub-Advisory Agreements
At a regularly scheduled quarterly meeting (the "Quarterly Meeting") of the Board of Trustees (the "Board" or the "Trustees") of the Aberdeen Funds (the "Trust") held on June 16, 2021, the Board, including a majority of the Trustees who are not considered to be "interested persons" of the Trust (the "Independent Trustees") under the Investment Company Act of 1940, as amended (the "1940 Act"), approved for an annual period the continuation of the Trust's advisory agreement (the "Advisory Agreement") with Aberdeen Standard Investments Inc. ("ASII") and the applicable sub-advisory agreements (each a "Sub-Advisory Agreement," and collectively with the Advisory Agreement, the "Agreements") between: ASII and Aberdeen Asset Managers Limited ("AAML") (the "Sub-Adviser") for each of the following series of the Trust: Aberdeen Emerging Markets Debt Fund, Aberdeen Global Absolute Return Strategies Fund, Aberdeen Intermediate Municipal Income Fund, Aberdeen Short Duration High Yield Municipal Fund, and Aberdeen Ultra Short Municipal Income Fund (each a "Fund," and collectively the "Funds"). Pursuant to relief granted by the U.S. Securities and Exchange Commission (the "SEC") in light of the COVID-19 pandemic (the "Order") and a determination by the Board that reliance on the Order was appropriate due to circumstances related to the current or potential effects of COVID-19, the Quarterly Meeting was held via videoconference. In addition, the Independent Trustees held a separate telephonic meeting on June 9, 2021 (together with the Quarterly Meeting held on June 16, 2021, the "Meetings") to review the materials provided and the relevant legal considerations. AAML is an affiliate of ASII. ASII and the Sub-Adviser are sometimes referred to collectively as the "Advisers."
In connection with their consideration of whether to approve the continuation of the Agreements, the Board members received and reviewed a variety of information provided by the Advisers relating to the Funds, the Agreements and the Advisers, including comparative performance, fee and expense information and other information regarding the nature, extent and quality of services provided by the Advisers under their respective Agreements. The materials provided to the Board generally included, among other items: (i) information on the Funds' advisory fees and other expenses, including information comparing each Fund's expenses to those of a peer group of funds and information about any applicable expense limitations and fee "breakpoints"; (ii) a report prepared by the Advisers in response to a request submitted by the Independent Trustees' independent legal counsel on behalf of such Trustees; (iii) information on the investment performance of the Funds and the performance of peer groups of funds and the Funds' performance benchmarks; (iv) information about the profitability of the Agreements to the Advisers; and (v) a memorandum from the Independent Trustees' independent legal counsel on the responsibilities of the Board in considering for approval the investment advisory and investment sub-advisory arrangements under the 1940 Act and Delaware law.
The Board, including the Independent Trustees, also considered other matters such as: (i) each Fund's investment objective and strategies; (ii) the procedures employed to determine the value of the Funds' assets; (iii) the Advisers' investment personnel and operations; (iv) the Advisers' financial results and financial condition; (v) arrangements relating to the distribution of the Funds' shares and the related costs; (v) the resources devoted to, and the record of compliance with, the Funds' investment policies and restrictions, policies on personal securities transactions and other compliance policies; (vii) the allocation of the Funds' brokerage, if any, including, if applicable, allocations to brokers affiliated with the Advisers and the use, if any, of "soft" commission dollars to pay Fund expenses and to pay for research and other similar services; and (viii) possible conflicts of interest. The Board also considered the nature, extent and quality of the services provided to the Funds by ASII's affiliates. Throughout the process, the Trustees were afforded the opportunity to ask questions of and request additional information from ASII and the Sub-Adviser.
In addition to the materials requested by the Trustees in connection with their annual consideration of the continuation of the Agreements, the Trustees received and reviewed materials in advance of each regular quarterly meeting of the Board that contained information relating to the services provided by the Advisers, including detailed information about each Fund's investment performance. This information generally included, among other things, third-party performance rankings for various periods (including, as applicable, periods prior to the Advisers' management of the Funds) comparing each Fund against its respective peer group, total return information for the Funds for various periods, and details of sales and redemptions of Fund shares for the period. The Board also received periodic presentations from the portfolio management teams in connection with the performance of the Funds.
The Independent Trustees were advised by separate independent legal counsel throughout the process. The Independent Trustees also consulted in executive sessions with their independent legal counsel regarding consideration of the continuation of the Agreements. In considering whether to approve the continuation of the Agreements, the Board of Trustees, including the Independent Trustees, did not identify any single factor as determinative. Individual Trustees may have evaluated the information presented differently from one another, giving different weights to various factors. Matters considered by the Trustees, including the Independent Trustees, in connection with their approval of the continuation of the Agreements included the factors listed below.
The nature, extent and quality of the services provided to the Funds under the Agreements. The Trustees considered the nature, extent and quality of the services provided by ASII and the Sub-Advisers, as applicable, to the Funds and the resources dedicated to the Funds by ASII and its affiliates. The Board considered the Advisers' risk management processes. The Board also considered the background and experience of the Advisers' senior management personnel and the qualifications, background and responsibilities of the portfolio managers that are primarily responsible for the day-to-day portfolio management services for the Funds. ASII's role in coordinating the activities of the Trust's other service providers was also considered. The Board also considered the allocation of responsibilities among the Advisers. The Trustees considered not only the advisory services provided by ASII to the Funds, but also the administrative services provided by ASII to the Funds under a separate administration agreement. The
| 102 | 2021 Annual Report |
Supplemental Information (Unaudited) (continued)
Trustees also took into account the Advisers' investment experience. The Board also considered that it receives information on a regular basis from the Trust's Chief Compliance Officer regarding the Advisers' compliance policies and procedures. The Board was also mindful of the Advisers' focus on the monitoring of the performance of the Funds and in addressing performance matters. The Trustees also considered the benefits to shareholders of investing in a mutual fund that is part of a family of funds that offers shareholders the right to exchange shares of one type of fund for shares of another type of fund, and provides a variety of fund and shareholder services. The Board also took into account its knowledge of management and the quality of the performance of management's duties through Board meetings, discussion and reports during the preceding year.
After reviewing these and related factors, the Board concluded that the nature, extent and quality of the services provided supported the continuation of the Agreements.
Investment performance of the Funds and the Advisers. The Trustees received and reviewed with management, among other performance data, information about the performance of the Funds over various time periods, including information that compared the performance of the Funds to the performance of peer groups of funds and each Fund's performance benchmark. The Trustees also considered the performance of the Funds compared to the performance of comparable funds or accounts managed by ASII and its affiliates to the extent available. The Trustees reviewed and considered the Funds that had changed their investment strategies during the year and that certain of the Funds had changed their respective performance benchmarks to better reflect the respective Fund's investment strategy. In addition, the Trustees also reviewed data prepared by an independent third party that analyzed the performance of the Funds using a variety of performance metrics.
The Trustees also considered ASII's and the Sub-Adviser's performance and reputation generally, the performance of the fund family generally, the historical responsiveness of ASII to Trustee concerns about performance, and the willingness of ASII and the Sub-Adviser to take steps intended to improve performance. The Trustees also considered, as applicable, the performance of the Advisers since they commenced management of the Funds.
Based on these factors, the Board determined that the Advisers are appropriate investment advisers for the Funds.
The Board noted that it would continue to monitor the Funds' performance and any actions taken by ASII and its affiliates relating to performance.
The costs of the services provided and profits realized by the Advisers and their affiliates from their relationships with the Funds. The Trustees considered the fees charged to the Funds for advisory services as well as the total expense levels of the Funds. This information included comparisons (provided by an independent third party) of each Fund's net management fee and total expense level to those of its expense peer group and information about the advisory fees charged by ASII to any separately managed accounts with a similar strategy. In reviewing the comparison of each Fund's net management fee to that of comparable funds, the Board noted that the fee for the Funds includes both advisory and administrative fees. In evaluating the Funds' advisory fees, the Trustees considered the demands, complexity and quality of the investment management of the Funds. In considering the fees charged by ASII to any comparable accounts, the Trustees also considered, among other things, management's discussion of the different investment restrictions, objectives or policies that may be involved in managing accounts of different types.
The Trustees also noted that the sub-advisory fees, as applicable, for the Funds would not be paid by the Funds, but would be paid by ASII out of its advisory fee. The Board also considered that ASII had entered into or renewed expense limitation agreements with each of the Funds, pursuant to which ASII agreed to waive a portion of its advisory fee and/or reimburse certain expenses as a means of limiting each Fund's total annual operating expenses for a period of time. The Trustees also noted that ASII had agreed to reduce the advisory fees payable by certain Funds during the year.
The Trustees also considered the compensation ASII and its affiliates received, directly and indirectly, from their relationships with the Funds. The Trustees reviewed information provided by management as to the profitability of ASII and its affiliates' relationships with the Funds, including the engagement of affiliates of ASII to provide administrative and distribution services to the Funds. The Trustees also considered information about the allocation of expenses used to calculate profitability. When reviewing profitability, the Trustees also considered information about the expense levels of the Funds, the performance of the Funds, court cases regarding adviser profitability, and whether ASII had implemented breakpoints and expense limitations with respect to the Funds. The Trustees also examined the profitability of ASII and its affiliates on a Fund-by-Fund basis.
After reviewing these and related factors, including taking into account management's discussion regarding Fund expenses, the Board concluded that the advisory fees, and as applicable, the sub-advisory fees, were fair and reasonable, and that the costs of these services generally and the related profitability of ASII and its affiliates from their relationships with the Funds were reasonable and supported the continuation of the Agreements.
Economies of Scale. The Trustees considered the existence of any economies of scale in the provision of services by ASII and the Sub-Adviser and whether those economies would be shared with the Funds through breakpoints in the investment advisory fees or other means, such as expense waivers or limitations. The Trustees noted that each of the Funds was subject to a contractual expense limitation agreement and considered that certain Funds were subject to breakpoints in their investment advisory fees. The Board noted management's discussion of the Funds' advisory fee
| 2021 Annual Report | 103 |
Supplemental Information (Unaudited) (concluded)
structure. The Board also considered how the Funds' potential future growth and increased size would have an effect on fees, noting that if a Fund's assets increase over time, the Fund may realize other economies of scale if assets increase at a proportionally higher rate than the increase in certain expenses. The Trustees also took note of the costs of the services provided and the profitability to ASII and its affiliates from their relationships with the Funds, as discussed above.
After reviewing these and related factors, the Board concluded that the advisory fees, and as applicable, sub-advisory fees were reasonable and supported the continuation of the Agreements.
The Trustees also considered other factors, which included but were not limited to the following:
| • | whether the Funds have operated in accordance with their investment objectives as well as the Funds' record of compliance with their investment restrictions, and the compliance programs of the Trust and ASII. The Trustees also considered the compliance-related resources ASII and its affiliates were providing to the Funds. |
| • | so-called "fallout benefits" to ASII, such as the benefits of research made available to ASII by reason of brokerage commissions generated by the Funds' securities transactions or reputational and other indirect benefits. The Trustees considered any possible conflicts of interest associated with these fallout and other benefits, and the reporting, disclosure and other processes in place to disclose and monitor such possible conflicts of interest. |
| • | the nature, quality, cost and extent of administrative services performed by ASII under the Advisory Agreement and under a separate agreement covering administrative services. |
| • | the effect of any market and economic volatility on the performance, asset levels and expense ratios of the Funds. |
* * *
Based on their evaluation of all factors that they deemed to be material, including those factors described above, and assisted by the advice of independent counsel, the Trustees, including the Independent Trustees, concluded that renewal of the Agreements would be in the best interest of each of the Funds and its shareholders. Accordingly, the Board, and the Independent Trustees voting separately, approved the Agreements for an additional one-year period. Pursuant to the SEC Order, the Board determined that the Trustees, including the Independent Trustees, voting separately, would ratify their approval at the next in-person Board meeting.
| 104 | 2021 Annual Report |
Liquidity Risk Management Program (Unaudited)
The Funds have adopted and implemented a liquidity risk management program (the "Liquidity Program") consistent with the requirements of Rule 22e-4 under the 1940 Act (the "Liquidity Rule"). "Liquidity Risk" is defined as the risk that a fund could not meet redemption requests "without significant dilution of remaining investors' interests in the fund." Aberdeen Standard Investments Inc., the investment adviser and administrator to the Funds, has been approved and designated by the Board of Trustees (the "Board") as the administrator of the Liquidity Program (the "Administrator") and has retained a third party to perform certain functions, including liquidity analytics and providing market data. The Administrator has formed a Liquidity Risk Management Committee (the "Committee") to help implement and carry out the day-to-day operations of the Liquidity Program.
As required by the Liquidity Rule, at a meeting on March 17, 2021, the Board received a written annual report on the operation and effectiveness of the Liquidity Program for the period from February 1, 2020 to January 31, 2021 (the "Reporting Period"). The annual report provided, among other items, an overview of the Liquidity Program including:
| • | information regarding the Committee and the monthly discussions by the Committee of various items including, but not limited to, the following: |
| º | Review and analysis of appropriate liquidity categories for portfolio investments |
| º | Review of highly liquid investment minimum ("HLIM") and reasonably anticipated trading sizes ("RATS") |
| º | Review of current and upcoming market events, such as market closures, that may impact liquidity |
| º | Review of large shareholder concentrations that may impact liquidity in the event of redemption monthly liquidity reports being provided to portfolio managers |
| • | the monitoring and classification of portfolio holdings in four liquidity categories (including the operation of the HLIM and any breaches); and |
| • | enhancements to the Liquidity Program during the Reporting Period, which included: |
| º | evaluation and change in the HLIM of Aberdeen Emerging Market Debt fund and the Global High Income Fund due to the nature of the portfolios strategy |
The annual report concluded that the Liquidity Program was reasonably designed to assess and manage the Funds' Liquidity Risk pursuant to the Liquidity Rule.
There can be no assurance that the Liquidity Program will achieve its objectives under all circumstances in the future. Please refer to your Fund's Prospectus and Statement of Additional Information for more information regarding the risks of investing in a Fund, including a Fund's exposure to liquidity risk and other risks to which the Funds may be subject.
| 2021 Annual Report | 105 |
Management of the Funds (Unaudited)
As of October 31, 2021
The names, years of birth and business addresses of the trustees and officers of the Funds as of October 31, 2021, their principal occupations during the past five years, the number of portfolios each Trustee oversees and other directorships they hold are provided in the tables below. Trustees that are deemed "interested persons" (as that term is defined in Section 2(a)(19) of the Investment Company Act of 1940, as amended) of the Funds or the Funds' investment advisers are included in the table below under the heading "Interested Trustees." Trustees who are not interested persons, as described above, are referred to in the table below under the heading "Independent Trustees." Aberdeen Standard Investments, Inc. ("ASII"), its parent company abrdn plc, and its advisory affiliates are collectively referred to as "abrdn" in the tables below.
| Name, Address, and Year of Birth | Position(s) Held, Length of Time Served and Term of Office* | Principal Occupation During Past 5 Years | Number of Portfolios in Fund Complex Overseen by Trustee** | Other Directorships Held by Trustee During Past 5 Years*** | |||||||||
| Independent Trustees | |||||||||||||
| Radhika Ajmera**** Year of Birth: 1964 | Trustee since 2020 | Ms. Ajmera was appointed Chair of Aberdeen Japan Equity Fund Inc in 2017, having served as a director since 2014. She has been an independent non-executive director of Aberdeen Asia-Pacific Income Investment Co Ltd since 2015. She is also an independent non-executive director of Aberdeen Funds since 2020 and Aberdeen Global Income Fund Inc, Aberdeen Asia-Pacific Income Fund Inc and Aberdeen Australia Equity Fund Inc since 2021. She has over 20 years' experience in fund management, predominantly in emerging markets. She has also held a number of UK closed end fund non-executive directorships. Ms Ajmera is a graduate of the London School of Economics. | 21 | None. | |||||||||
| P. Gerald Malone**** Year of Birth: 1950 | Trustee since 2007 Chairman of the Board | Mr. Malone is, by profession, a lawyer of over 40 years. Currently, he is a non-executive director of a number of U.S. companies, including Medality Medical (medical technology company) and Bionik Laboratories Corp. (US healthcare company) since 2018. He is also Chairman of many of the open and closed end funds in the Fund Complex. He previously served as Independent Chairman of UK companies Crescent OTC Ltd (pharmaceutical services) until February 2018; and fluidOil Ltd. (oil services) until June 2018; U.S. company Rejuvenan llc (wellbeing services) until September 2017 and as chairman of UK company Ultrasis plc (healthcare software services company) until October 2014. Mr. Malone was previously a Member of Parliament in the U.K. from 1983 to 1997 and served as Minister of State for Health in the U.K. government from 1994 to 1997 | 26 | Director of Bionik Laboratories Corporation (U.S. healthcare company) since 2018. | |||||||||
| Neville J. Miles**** Year of Birth: 1946 | Trustee since 2011 | Mr. Miles is a non-executive director of a number of Australian and overseas companies and serves as Chairman of Ballyshaw Pty. Ltd. (share trading, real estate development and investment). | 20 | None. | |||||||||
| 106 | 2021 Annual Report |
Management of the Funds (Unaudited) (continued)
As of October 31, 2021
| Name, Address, and Year of Birth | Position(s) Held, Length of Time Served and Term of Office* | Principal Occupation During Past 5 Years | Number of Portfolios in Fund Complex Overseen by Trustee** | Other Directorships Held by Trustee During Past 5 Years*** | |||||||||
| Rahn K. Porter**** Year of Birth: 1954 | Trustee since 2016 | Mr. Porter is the Principal at RPSS Enterprises (consulting) since 2019. He was the Chief Financial and Administrative Officer of The Colorado Health Foundation from 2013 to 2019. | 19 | Director of CenturyLink Investment Management Company since 2006, Director of BlackRidge Financial Inc. from 2004 to 2019. | |||||||||
| Steven N. Rappaport**** Year of Birth: 1948 | Trustee since 2016 | Mr. Rappaport has been a Partner of Lehigh Court, LLC (private investment firm) and RZ Capital LLC (private investment firm) since 2004. | 18 | Director of iCAD, Inc. (a surgical and Medical instruments and apparatus company) from 2006 to 2018; Director of Credit Suisse Funds (9) since 1999; Director of Credit Suisse Asset Management Income Fund, Inc. since 2005; and Director of Credit Suisse NEXT Fund since 2013; and Director of Credit Suisse Park View Fund until 2016. | |||||||||
| Warren C. Smith**** Year of Birth: 1955 | Trustee since 2007 | Mr. Smith has been a founding partner of MRB Partners Inc. (independent investment research and consultancy firm) since 2010. He has been a Director of Aberdeen Asia-Pacific Income Investment Company Limited (Canadian investment fund) since 1993 | 17 | None. | |||||||||
| 2021 Annual Report | 107 |
Management of the Funds (Unaudited) (continued)
As of October 31, 2021
| Name, Address, and Year of Birth | Position(s) Held, Length of Time Served and Term of Office* | Principal Occupation During Past 5 Years | Number of Portfolios in Fund Complex Overseen by Trustee** | Other Directorships Held by Trustee During Past 5 Years*** | |||||||||
| Interested Trustees | |||||||||||||
| Stephen Bird Year of Birth: 1967 | Trustee since 2021 | Mr. Bird joined the Board of SLA plc in July 2020 as Chief Executive-Designate, and was formally appointed Chief Executive Officer in September 2020. Previously, Mr. Bird served as chief executive officer of global consumer banking at Citigroup from 2015, retiring from the role in November 2019. His responsibilities encompassed all consumer and commercial banking businesses in 19 countries, including retail banking and wealth management, credit cards, mortgages, and operations and technology supporting these businesses. Prior to this, Mr. Bird was chief executive for all of Citigroup's Asia Pacific business lines across 17 markets in the region, including India and China. Mr. Bird joined Citigroup in 1998, and during his 21 years with the company he held a number of leadership roles in banking, operations and technology across its Asian and Latin American businesses. Before this, he held management positions in the UK at GE Capital – where he was director of UK operations from 1996 to 1998 – and at British Steel | 26 | 10 | |||||||||
| * | Each Trustee holds office for an indefinite term until his successor is elected and qualified. |
| ** | As of October 31, 2021, the Fund Complex consists of: Aberdeen Income Credit Strategies Fund, Aberdeen Asia-Pacific Income Fund, Inc., Aberdeen Global Income Fund, Inc., Aberdeen Australia Equity Fund, Inc., Aberdeen Emerging Markets Equity Income Fund, Inc., Aberdeen Japan Equity Fund, Inc., The India Fund, Inc., Aberdeen Global Dynamic Dividend Fund, Aberdeen Total Dynamic Dividend Fund, Aberdeen Global Premier Properties Fund, Aberdeen Standard Global Infrastructure Income Fund, Aberdeen Investment Funds (which consists of 3 portfolios), Aberdeen Funds (which consists of 17 portfolios) and abdrn ETFs (which consists of 3 portfolios). |
| *** | Directorships (excluding Fund Complex) held in (1) any other investment companies registered under the 1940 Act, (2) any company with a class of securities registered pursuant to Section 12 of the Securities Exchange Act of 1934, as amended (the "Exchange Act") or (3) any company subject to the requirements of Section 15(d) of the Exchange Act. |
| **** | Each Trustee may be contacted by writing to the Trustee c/o Aberdeen Standard Investments Inc., 1900 Market Street, Suite 200, Philadelphia, Pennsylvania 19103, Attn: Alan Goodson. |
| † | Mr. Bird is considered to be an "interested person" of the Trust as defined in the 1940 Act because of his affiliation with the Adviser. |
| 108 | 2021 Annual Report |
Management of the Funds (Unaudited) (continued)
As of October 31, 2021
Officers of the Trust
| Name, Address, and Year of Birth | Position(s) Held, Length of Time Served and Term of Office* | Principal Occupation During Past 5 Years | |||
| Bev Hendry** Aberdeen Standard Investments Inc. 1900 Market Street Suite 200 Philadelphia, PA 19103 Year of Birth: 1953 | President and Chief Executive Officer (Since September 2014) | Currently, Chairman – Americas for abrdn (2018-present), Mr. Hendry was Chief Executive Officer – Americas for Aberdeen Asset Management PLC (2014-2018). | |||
| Joseph Andolina** Aberdeen Standard Investments Inc. 1900 Market Street Suite 200 Philadelphia, PA 19103 Year of Birth: 1978 | Vice President and Chief Compliance Officer (Since March 2017) | Currently, Chief Risk Officer – Americas and serves as the Chief Compliance Officer for ASII. Prior to joining the Risk and Compliance Department, he was a member of ASII's Legal Department, where he served as U.S. Counsel since 2012. | |||
| Andrea Melia** Aberdeen Standard Investments Inc. 1900 Market Street Suite 200 Philadelphia, PA 19103 Year of Birth: 1969 | Treasurer, Chief Financial Officer, and Principal Accounting Officer (Since September 2009) | Currently, Vice President and Director, Product Management for ASII. Ms. Melia joined ASII in September 2009. | |||
| Megan Kennedy** Aberdeen Standard Investments Inc. 1900 Market Street Suite 200 Philadelphia, PA 19103 Year of Birth: 1974 | Secretary and Vice President (Since September 2009) | Currently, Director, Product Governance for ASII. Ms. Kennedy joined ASII in 2005. | |||
| Lucia Sitar** Aberdeen Standard Investments Inc. 1900 Market Street Suite 200 Philadelphia, PA 19103 Year of Birth: 1971 | Vice President (Since December 2008) | Currently, Vice President and Head of Product Management and Governance for ASII since 2020. Previously, Ms. Sitar was Managing U.S. Counsel for ASII. She joined ASII as U.S. Counsel in July 2007. | |||
| Alan Goodson** Aberdeen Standard Investments Inc. 1900 Market Street Suite 200 Philadelphia, PA 19103 Year of Birth: 1974 | Vice President (Since March 2009) | Currently, Director, Vice President and Head of Product & Client Solutions – Americas for ASII, overseeing Product Management & Governance , Product Development and Client Solutions for registered and unregistered investment companies in the U.S., Brazil and Canada. Mr. Goodson is Director and Vice President of ASII and joined ASI in 2000. | |||
| Hugh Young** abrdn Asia Limited 21 Church Street #01-01 Capital Square Two Singapore 049480 Year of Birth: 1958 | Vice President (Since June 2011) | Currently, Chairman of abrdn Asia Limited (since 1991). Mr. Young joined abrdn in 1991. |
| 2021 Annual Report | 109 |
Management of the Funds (Unaudited) (continued)
As of October 31, 2021
| Name, Address, and Year of Birth | Position(s) Held, Length of Time Served and Term of Office* | Principal Occupation During Past 5 Years | |||
| Devan Kaloo** Aberdeen Asset Managers Limited Bow Bells House 1 Bread Street London EC4M 9HH Year of Birth: 1972 | Vice President (Since March 2019) | Currently, Global Head of Public Markets, Equities for abrdn. Mr. Kaloo joined abrdn in 2000 as part of the Asian equities team in Singapore. | |||
| Joanne Irvine** Aberdeen Asset Managers Limited Bow Bells House 1 Bread Street London EC4M 9HH Year of Birth: 1968 | Vice President (Since March 2019) | Currently, Deputy Head of Global Emerging Markets Equity Team at abrdn. Ms. Irvine joined the company in 1996 in a group development role. | |||
| Josh Duitz** Aberdeen Standard Investments Inc. 1900 Market Street Suite 200 Philadelphia, PA 19103 Year of Birth: 1970 | Vice President (Since March 2019) | Currently, Deputy Head of the Global Equities Team, Mr. Duitz is responsible for managing Aberdeen Global Infrastructure Fund, Aberdeen Standard Global Infrastructure Income Fund, Aberdeen Total Dynamic Dividend Fund, Aberdeen Global Dynamic Dividend Fund and the Aberdeen Dynamic Dividend Fund (AIFRX, ASGI, AOD,AGD and ADVDX). He joined ASII in 2018 from Alpine Woods Capital Investors LLC where he was a Portfolio Manager. Previously, Mr. Duitz worked for Bear Stearns where he was a Managing Director, Principal and traded international equities. Prior to that, he worked for Arthur Andersen where he was a senior auditor. | |||
| Svitlana Gubriy** abrdn 6 St Andrew Square Edinburgh EH2 2BD Year of Birth: 1972 | Vice President (Since March 2019) | Currently, Head of Listed Funds – Real Estate Global Investment Strategy at abrdn. Ms. Gubriy joined abrdn in 2005. | |||
| Ben Moser** Aberdeen Standard Investments Inc. 1900 Market Street Suite 200 Philadelphia, PA 19103 Year of Birth: 1979 | Vice President (Since September 2018) | Currently, Head of Investor Services – US. Mr. Moser joined ASII in July 2008. | |||
| Chris Demetriou** Aberdeen Standard Investments Inc. 1900 Market Street Suite 200 Philadelphia, PA 19103 Year of Birth: 1983 | Vice President (Since December 2020) | Currently, Chief Executive Officer – UK, EMEA and Americas, Mr. Demetriou joined ASII in 2013, as a result of the acquisition of SVG, a FTSE 250 private equity investor based in London. |
| 110 | 2021 Annual Report |
Management of the Funds (Unaudited) (concluded)
As of October 31, 2021
| Name, Address, and Year of Birth | Position(s) Held, Length of Time Served and Term of Office* | Principal Occupation During Past 5 Years | |||
| Jim O'Connor** Aberdeen Standard Investments Inc. 1900 Market Street Suite 200 Philadelphia, PA 19103 Year of Birth: 1976 | Vice President (Since December 2020) | Currently, Chief Operating Officer – Americas for ASII. Mr. O'Connor joined ASII as US Counsel in 2010 as U.S. Counsel | |||
| Andrew Kim** Aberdeen Standard Investments Inc. 1900 Market Street Suite 200 Philadelphia, PA 19103 Year of Birth: 1983 | Assistant Secretary (Since March 2017) | Currently, Senior Product Manager. Mr. Kim joined ASII in August 2013. |
| * | Each officer holds office for an indefinite term at the pleasure of the Board of Trustees and until his or her successor is elected and qualified. |
| ** | As of October 31, 2021, Mr. Hendry, Ms. Melia, Ms. Kennedy, Mr. Goodson, Mr. Young, Ms. Sitar, Mr. Andolina, Mr. Kaloo, Ms. Irvine, Mr. Duitz, Ms. Gubriy, Mr. Moser, Mr. Demetriou, Mr. O'Connor and Mr. Kim hold officer position(s) in one or more funds which are part of the Fund Complex. |
During the year the Independent Trustees of the Trust engaged Mr. Martin Gilbert as an advisory consultant to provide ongoing insight into the asset management industry given his long standing experience in both this sector and the closed end funds arena. The position was not remunerated, although travel and expenses were reimbursed across all the funds related to the consultancy. Effective December 15, 2021 the consultant agreement was terminated by mutual agreement of the parties.
Further information about the Fund's Trustees and Officers is available in the Trust's Statement of Additional Information, which can be obtained without charge by calling (800) 522-5465.
| 2021 Annual Report | 111 |
Management Information
Trustees
Radhika Ajmera
Stephen Bird
P. Gerald Malone, Chairman
Neville J. Miles
Rahn K. Porter
Steven N. Rappaport
Warren C. Smith
Investment Adviser
Aberdeen Standard Investments Inc.
1900 Market Street, Suite 200
Philadelphia, PA 19103
Fund Administrator
Aberdeen Standard Investments Inc.
1900 Market Street, Suite 200
Philadelphia, PA 19103
Transfer Agent
DST Asset Manager Solutions, Inc.
430 W. 7th Street, Ste. 219534
Kansas City, MO 64105-1407
Distributor
Aberdeen Fund Distributors LLC
1900 Market Street, Suite 200
Philadelphia, PA 19103
Sub-Administrator, Custodian & Fund Accountant
State Street Bank and Trust Company
1 Lincoln Street
Boston, MA 02111
Independent Registered Public Accounting Firm
KPMG LLP
1601 Market Street
Philadelphia, PA 19103
Fund Counsel
Dechert LLP
1900 K Street N.W.
Washington, DC 20006
| Aberdeen Standard Investments Inc. 1900 Market Street, Suite 200 Philadelphia, PA 19103 aberdeenstandard.com/us AOE-0143-AR |  |
Item 2. Code of Ethics.
(a) As of October 31, 2021, the Registrant had adopted a code of ethics that applies to the Registrant’s principal executive officer, principal financial officer, principal accounting officer or controller, or persons performing similar functions, regardless of whether these individuals are employed by the Registrant or a third party (the “Code of Ethics”).
(c) There have been no amendments during the period covered by this report to a provision of the Code of Ethics.
(d) During the period covered by the report, the Registrant did not grant any waivers to the provisions of the Code of Ethics.
(f) The Code of Ethics is included with this Form N-CSR as Exhibit 13(a)(1).
Item 3. Audit Committee Financial Expert.
The Registrant’s Board of Trustees has determined that there is at least one member who qualifies as an “audit committee financial expert” serving on its Audit Committee. Mr. Rahn K. Porter is the “audit committee financial expert” and is considered to be an “Independent Trustee” as each term is defined in Item 3 of Form N-CSR.
Item 4. Principal Accountant Fees and Services.
| Fiscal Year Ended | (a) | (b) | (c)1 | (d) | ||||||||||||
| October 31, 2021 | $ | 580,015 | $ | 0 | $ | 101,130 | $ | 13,745 | ||||||||
| October 31, 2020 | $ | 610,658 | $ | 10,000 | $ | 154,460 | $ | 0 | ||||||||
| 1 The Tax Fees are for the completion of the Registrant’s federal and state tax returns. | ||||
(e)(1) Pre-Approval Policies and Procedures. Except as permitted by Rule 2-01(c)(7)(i)(C) of Regulation S-X, the Registrant’s (hereinafter, the “Trust”) Audit Committee Charter authorizes the Audit Committee (“Committee”) to annually select, retain or terminate the Trust’s independent auditor and, in connection therewith, to evaluate the terms of the engagement and the qualifications and independence of the independent auditor, including whether the independent auditor provides any consulting, auditing or tax services to the investment adviser (hereinafter, the “Adviser”) or a sub-adviser, and to receive the independent auditor’s specific representations as to their independence, delineating all relationships between the independent auditor and the Trust, consistent with PCAOB 3526 or any other applicable auditing standard. PCAOB Rule 3526 requires that, at least annually, the auditor: (1) disclose to the Committee in writing all relationships between the auditor and its related entities and the Trust and its related entities that in the auditor’s professional judgment may reasonably be thought to bear on independence; (2) confirm in its letter that, in its professional judgment, it is independent of the Trust within the meaning of the Securities Acts administered by the SEC; and (3) discuss the auditor’s independence with the Committee. The Committee is responsible for actively engaging in a dialogue with the independent auditor with respect to any disclosed relationships or services that may impact the objectivity and independence of the independent auditor and for taking, or recommending that the full Board take, appropriate action to oversee the independence of the independent auditor. The Committee is also authorized to review in advance, and consider approval of, any and all proposals by management or the Adviser that the Trust, Adviser or their affiliated persons, employ the independent auditor to render “permissible non-audit services” to the Trust and to consider whether such services are consistent with the independent auditor’s independence. The Committee may delegate to one or more of its members (“Delegates”) authority to pre-approve permissible non-audit services to be provided to the Trust. Any pre-approval determination of a Delegate shall be presented to the full Committee at its next meeting. The Committee shall communicate any pre-approval made by it or a Delegate to the Adviser, who will ensure that the appropriate disclosure is made in the Trust’s periodic reports required by Section 30 of the Investment Company Act of 1940, as amended, and other documents as required under the federal securities laws.
(e)(2) None of the services described in each of paragraphs (b) through (d) of this Item involved a waiver of the pre-approval requirement by the Audit Committee pursuant to Rule 2-01 (c)(7)(i)(C) of Regulation S-X.
(f) Not applicable.
(g) The aggregate non-audit fees billed by the Registrant’s accountant for services to the Registrant and to the Registrant’s investment adviser and all entities controlling, controlled by, or under common control with the Adviser that provide services to the Registrant for the Registrant’s fiscal years ended October 31, 2021 and October 31, 2020 and were $502,875 and $511,685, respectively.
(h) The Registrant’s Audit Committee of the Board of Trustees has considered whether the provision of non-audit services that were rendered to the Registrant’s investment adviser (not including any sub-adviser whose role is primarily portfolio management and is subcontracted with or overseen by another investment adviser), and any entity controlling, controlled by, or under common control with the investment adviser that provides ongoing services to the Registrant that were not pre-approved pursuant to paragraph (c)(7)(ii) or Rule 2-01 of Regulation S-X is compatible with maintaining the principal accountant’s independence and has concluded that it is.
Item 5. Audit Committee of Listed Registrants.
Not applicable.
Item 6. Investments.
(a) Included as part of the Reports to Shareholders filed under Item 1 of this Form N-CSR.
(b) Not applicable.
Item 7. Disclosure of Proxy Voting Policies and Procedures for Closed-End Management Investment Companies.
Not applicable.
Item 8. Portfolio Managers of Closed-End Management Investment Companies.
Not applicable.
Item 9. Purchases of Equity Securities by Closed-End Management Investment Company and Affiliated Purchasers.
Not applicable.
Item 10. Submission of Matters to a Vote of Security Holders.
During the period ended October 31, 2021, there were no material changes to the procedures by which shareholders may recommend nominees to the Registrant’s Board of Trustees.
Item 11. Controls and Procedures.
(a) The Registrant’s principal executive and principal financial officers, or persons performing similar functions, have concluded that the Registrant’s disclosure controls and procedures (as defined in Rule 30a-3(c) under the Investment Company Act of 1940 (the “Act”) (17 CFR 270.30a-3(c))) are effective, as of a date within 90 days of the filing date of the report that includes the disclosure required by this paragraph, based on the evaluation of these controls and procedures required by Rule 30a-3(b) under the Act (17 CFR 270.30a3(b)) and Rule 13a-15(b) or 15d-15(b) under the Securities Exchange Act of 1934 (17 CFR 240.13a-15(b) or 240.15d15(b)).
(b) There were no changes in the Registrant’s internal control over financial reporting (as defined in Rule 30a-3(d) under the Act (17 CFR 270.30a-3(d))) that occurred during the second fiscal quarter of the period covered by this report that have materially affected, or are reasonably likely to materially affect, the Registrant’s internal control over financial reporting.
Item 12. Disclosure of Securities Lending Activities for Closed-End Management Investment Companies.
Not applicable.
Item 13. Exhibits.
(a)(3) Not applicable.
(a)(4) Not applicable.
SIGNATURES
Pursuant to the requirements of the Securities Exchange Act of 1934 and the Investment Company Act of 1940, the registrant has duly caused this report to be signed on its behalf by the undersigned, thereunto duly authorized.
Aberdeen Funds
| By: | /s/ Bev Hendry | |
| Bev Hendry | ||
| Principal Executive Officer | ||
| Aberdeen Funds | ||
Date: January 7, 2022
Pursuant to the requirements of the Securities Exchange Act of 1934 and the Investment Company Act of 1940, this report has been signed below by the following persons on behalf of the registrant and in the capacities and on the dates indicated.
| By: | /s/ Bev Hendry | |
| Bev Hendry | ||
| Principal Executive Officer | ||
| Aberdeen Funds | ||
| Date: January 7, 2022 | ||
| By: | /s/ Andrea Melia | |
| Andrea Melia | ||
| Principal Financial Officer | ||
| Aberdeen Funds | ||
Date: January 7, 2022